UNITED STATES
SECURITIES AND EXCHANGE COMMISSION
Washington, D.C. 20549
FORM N-CSR
CERTIFIED SHAREHOLDER REPORT OF REGISTERED
MANAGEMENT INVESTMENT COMPANIES
Investment Company Act file number: 811-06241
Loomis Sayles Funds II
(Exact name of Registrant as specified in charter)
888 Boylston Street, Suite 800 Boston, Massachusetts 02199-8197
(Address of principal executive offices) (Zip code)
Natalie Wagner, Esq.
Natixis Distribution, LLC
888 Boylston Street, Suite 800
Boston, Massachusetts 02199-8197
(Name and address of agent for service)
Registrant’s telephone number, including area code: (617) 449-2810
Date of fiscal year end: September 30
Date of reporting period: September 30, 2022
Item 1. Reports to Stockholders.
(a) The Registrant’s annual report transmitted to shareholders pursuant to Rule 30e-1 under the Investment Company Act of 1940 is as follows:


Annual Report
September 30, 2022
Loomis Sayles Core Plus Bond Fund
Loomis Sayles Credit Income Fund
Loomis Sayles Global Allocation Fund
Loomis Sayles Growth Fund
Loomis Sayles Intermediate Duration Bond Fund
Loomis Sayles Limited Term Government and Agency Fund
Table of Contents

LOOMIS SAYLES CORE PLUS BOND FUND
| | |
| |
| Managers | | Symbols |
| |
| Peter W. Palfrey, CFA® | | Class A NEFRX |
| |
| Richard G. Raczkowski | | Class C NECRX |
| |
| Ian Anderson | | Class N NERNX |
| |
| Barath W. Sankaran, CFA® | | Class Y NERYX |
| |
| Loomis, Sayles & Company, L.P. | | |
Investment Goal
The Fund seeks high total investment return through a combination of current income and capital appreciation.
Market Conditions
The fixed-income markets experienced significant, broad-based weakness in the 12-month period that ended on September 30, 2022. Inflation, which had already been increasing throughout 2021, took another leg higher in February 2022 after Russia’s invasion of Ukraine created additional supply-chain pressures and led to a spike in commodity prices. Consumer price inflation remained elevated long after the conflict began. Inflation has seemingly peaked at 9.1% in June, though has yet to meaningfully decline.
The US Federal Reserve (Fed) responded with an aggressive series of interest-rate increases, bringing its benchmark fed funds rate to a range of 3.0% to 3.25% from 0% to 0.25% at the start of 2022. This marked the largest move in such a short interval since 1980. Perhaps even more important for the markets, investors continued to ratchet up their expectations for the “terminal rate” in 2023; or in other words, the level at which the Fed was likely to stop raising rates.
Tighter Fed policy not only led to a rise in prevailing yields, but also fueled an increase in investors’ aversion to risk more generally. As a result, more volatile asset categories that trade based on their yield advantage (or “spread”) over Treasuries faced an additional headwind.
US Treasuries endured one of their worst stretches of performance in over 40 years. The two-year note, which is more sensitive to Fed policy shifts than other portions of the yield curve, soared from 0.28% to 4.22% over the course of the 12-month period (as its price fell). Longer-term bonds also lost ground, but to a lesser extent: the yield on the 10-year issue climbed from 1.52% at the start of the period to 3.83% on September 30, 2022.
One result of these moves was that the yield curve inverted significantly (meaning that short-term yields traded above those on longer-term debt). In late September, in fact, the yield curve moved to its largest inversion since 1982.
Investment-grade corporate bonds lagged considerably due to both the increase in prevailing yields and rising yield spreads (particularly for lower-quality issues in the category). Notably, major corporate bond indexes fell to levels last seen in 2009 during the immediate aftermath of the Global Financial Crisis. The yield on the ICE BofA US Corporate Index reached 5.75% in the final week of September — another level not seen since 2009.1
Amidst rising inflation, geopolitical instability, and a broad selloff in rates and risk markets, securitized credit markets have generally produced negative total and excess returns over the past 12 months. Down in credit collateralized loan obligations (CLOs) have suffered the most as prices on underlying bank loans have dropped significantly. Sectors like consumer asset-backed securities (ABS) with lower interest rate sensitivity and less direct impact from geopolitical instability have performed somewhat better. Sectors like commercial ABS, namely aircraft, have been negatively impacted. Pockets of the commercial mortgage-backed securities (CMBS) market have held up relatively well amidst a longer-term recovery from Covid-19 related shocks. Senior tranches of residential mortgage-backed securities (RMBS) have provided positive excess returns while subordinates have sold off. Agency mortgage-backed securities (MBS) produced significantly negative excess returns versus US treasuries. Agency MBS has experienced massive interest rate volatility and the impact of concerns related to quantitative tightening.
High-yield corporate bonds posted double-digit losses due to a sizable increase in yield spreads. High-yield issuers are particularly vulnerable to slower economic growth due to their smaller average size and generally weaker balance sheets. The category outperformed investment grade corporate issues, however, which is unusual for a time of heightened investor risk aversion. This outperformance is due to High Yield’s generally shorter duration profile compared to Investment Grade debt. Also, energy issuers tend to be heavily represented in the high-yield space, which supported relative performance on the strength of rising oil prices.
Emerging market bonds, which tend to have a higher correlation to global growth trends than the broader fixed income market, underperformed in relation to the United States. The asset class was pressured not just by slowing growth and investors’ increased aversion to risk, but also the effects of the Russia-Ukraine war and pronounced weakness in emerging-market currencies relative to the US dollar.
1 |
Performance Results
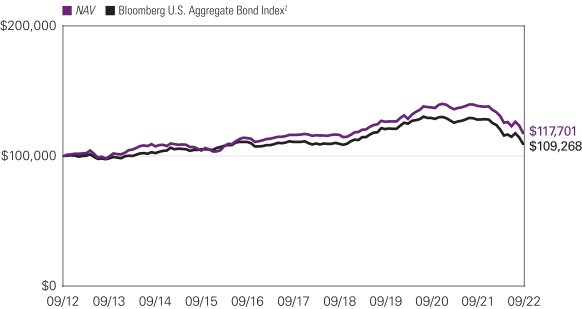
For the 12 months ended September 30, 2022, Class Y shares of Loomis Sayles Core Plus Bond Fund returned -15.03%. The Fund underperformed its benchmark, the Bloomberg U.S. Aggregate Bond Index, which returned -14.60%.
Explanation of Fund Performance
Security selection was the main driver of the Fund’s underperformance for the one-year period. Exposure to more credit-sensitive emerging market bonds detracted from excess returns within both investment grade corporate and government-related sectors. Additionally, security selection within agency mortgage-backed securities (MBS) pass-throughs weighed on relative returns. In sector allocation terms, the Fund’s underweight to US Treasuries detracted from relative performance. In addition, the Fund’s approximately 10% average allocation to fixed rate high yield corporate bonds weighed on excess returns as the out-of-benchmark sector struggled during the period.
Floating rate bank loans fared better than their equally credit-sensitive high yield corporate counterparts, so the Fund’s modest roughly 5% out-of-benchmark weight to that segment was a partial offset. Our approximately 4% out-of-benchmark non-US dollar positions in Mexico and Uruguay also added significant value, offering diversification and attractive carry. The Fund’s positioning along the yield curve (which depicts the relationship among bond yields across the maturity spectrum) and stance with respect to duration and corresponding interest rate sensitivity were strong positive contributors for the period, as our below-benchmark duration stance and bias to a flatter yield curve both proved additive. Finally, the Fund’s slightly elevated allocation to cash and equivalents helped buoy performance over the period.
Outlook
The Federal Reserve continued to show resolve in the face of persistent inflation pressures and tight labor markets, hiking its benchmark overnight lending rate by another 75 basis points both in July and September. The Fed has tightened by 300 basis points year-to-date, with another 100 basis points currently priced in by year-end. Despite a brief rally in bond prices in July, rates rose once again in response to decidedly hawkish Fed forward guidance and a September inflation report that surprised to the upside. The September dot plot displaying Fed Open Market Committee members’ expectations for the fed funds rate projects a median peak rate of 4.675% by early 2023, exceeding prior peak pricing by about 25 basis points. We ended the quarter with an inverted yield curve and 10-Year Treasuries briefly hitting 4.0%.
We observe that the Fed has been successful in tightening financial conditions to slow the economy down and cool inflation. While we wait for better news on inflation, we acknowledge a growing risk that the Fed overshoots and misses the elusive “soft landing”. Global growth is threatened by the energy crisis in Europe, and by central banks who are now also tightening policy in response to growing inflationary pressures. Additionally, the Russia-Ukraine conflict continues to escalate and contribute to market volatility and uncertainty.
We believe we are in the later phases of the credit cycle2, as indicated by the significant spread widening that has occurred over the past three quarters, as well as the significant retracement of equity market indices. Government, corporate and consumer balance sheets entered this part of the cycle in a strong position, but are showing some strains from higher inflation, tightening credit conditions and greater economic uncertainty.
The current Core Plus positioning displays a more defensive bias versus that of last year, but still has a moderate pro-cyclical stance. This reflects our view that risk valuations now more accurately reflect a balanced forward outlook of slower growth, coupled with a less punishing inflation outlook. We are closely watching forward-looking indicators on shelter and autos, which have been the largest contributors to core inflation. We also anticipate some goods price deflation given the strong dollar, lower shipping and transportation costs, and bloated domestic inventories, coupled with waning consumer and business demand.
We have incrementally increased our Treasury allocation to add quality, liquidity and duration to the portfolio, but maintain significant excess carry versus the benchmark, with a yield advantage of approximately 75 basis points. Average credit quality remains high at A1.
Nominal duration and corresponding interest rate sensitivity is now approximately 0.30 years longer than the benchmark, while empirical duration is more defensively positioned at approximately 0.3 years shorter than the benchmark. Most recently we have moved closer to neutralizing our overall curve positioning by adding more US Treasury exposure in the 5–10-year part of the curve, while maintaining a modest duration overweight to the 20- to 30-year part of the curve for some protection against the risk of Fed overtightening.
We maintain an underweight to agency MBS but have repositioned our exposures within the sector for a regime where the Fed is neither purchasing nor imminently selling agency MBS.
| 2
LOOMIS SAYLES CORE PLUS BOND FUND
Within investment grade corporate credit, we remain underweight. While we continue to have a bias towards BBB-rated securities, we have selectively reduced the overall credit sensitivity of our allocation, and favor industries that are more likely to retain pricing power and/or benefit from higher rates, such as banks.
We have a moderate overweight to investment grade securitized credit, primarily in the front end of the yield curve, for more defensive, non-corporate carry. We continue to favor asset-backed securities backed by consumer auto loans and restaurant franchises.
Within the Plus sectors, we have continued to reduce our overall allocation to high yield corporates, currently at 10%, down from approximately 16% in the first quarter. This exposure is split between 6.5% in fixed rate high yield corporates, including a modest 2% in emerging market high yield corporates, and approximately 3.5% in floating rate bank loans. We have been incrementally reducing high yield exposure in response to a more aggressive Fed tightening path, as well as growing signs of economic slowdown from the more robust pace seen in 2021. Where permitted, we added some investment grade, higher quality collateralized loan obligations for additional floating rate carry in the portfolio.
We continue to hold an approximately 3.5% allocation to non-US dollar emerging market bonds. Two-thirds of the exposure is to Mexico and the remainder to Uruguay. Notably this has proven to be an important source of diversification and significant carry year to date.
| 1 | Source: Federal Reserve Bank of St. Louis Economic Database |
| 2 | A credit cycle is a cyclical pattern that follows credit availability and corporate health |
Hypothetical Growth of $100,000 Investment in Class Y Shares3
September 30, 2012 to September 30, 2022
3 |
Average Annual Total Returns — September 30, 20223
| | | | | | | | | | | | | | | | | | | | | | | | |
| | | | | | |
| | | | | | | | | | | | Life of Class N | | | Expense Ratios4 | |
| | | 1 Year | | | 5 Years | | | 10 Years | | | Gross | | | Net | |
| | | |
| Class Y | | | | | | | | | |
| NAV | | | -15.03 | % | | | 0.26 | % | | | 1.64 | % | | | — | | | | 0.46 | % | | | 0.46 | % |
| | | | | | | |
| Class A | | | | | | | | | | | | | | | | | | | | | | | | |
| NAV | | | -15.24 | | | | 0.01 | | | | 1.39 | | | | — | | | | 0.71 | | | | 0.71 | |
| With 4.25% Maximum Sales Charge | | | -18.82 | | | | -0.87 | | | | 0.95 | | | | — | | | | | | | | | |
| | | | | | | |
| Class C | | | | | | | | | | | | | | | | | | | | | | | | |
| NAV | | | -15.88 | | | | -0.74 | | | | 0.78 | | | | — | | | | 1.46 | | | | 1.46 | |
| With CDSC1 | | | -16.71 | | | | -0.74 | | | | 0.78 | | | | — | | | | | | | | | |
| | | | | | |
| Class N (Inception 2/1/13) | | | | | | | | | | | | | | | | | | | | | |
| NAV | | | -14.94 | | | | 0.36 | | | | — | | | | 1.61 | | | | 0.38 | | | | 0.38 | |
| | | |
| Comparative Performance | | | | | | | | | |
| Bloomberg U.S. Aggregate Bond Index2 | | | -14.60 | | | | -0.27 | | | | 0.89 | | | | 0.98 | | | | | | | | | |
Performance data shown represents past performance and is no guarantee of, and not necessarily indicative of, future results. Total return and value will vary, and you may have a gain or loss when shares are sold. Current performance may be lower or higher than quoted. For most recent month-end performance, visit im.natixis.com. Performance for other share classes will be greater or less than shown based on differences and sales charges. You may not invest directly in an index. Performance for periods less than one year is cumulative, not annualized. Returns reflect changes in share price and reinvestment of dividends and capital gains, if any. The table(s) do not reflect taxes shareholders might owe on any fund distributions or when they redeem their shares.
| 1 | Class C shares performance assumes a 1% CDSC applied when you sell shares within one year of purchase. |
| 2 | Bloomberg U.S. Aggregate Bond Index is a broad-based index that covers the U.S. dollar-denominated, investment-grade, fixed-rate, taxable bond market of SEC-registered securities. The Index includes bonds from the Treasury, government-related, corporate, mortgage-backed securities, asset-backed securities, and collateralized mortgage-backed securities sectors. |
| 3 | Fund performance has been increased by fee waivers and/or expense reimbursements, if any, without which performance would have been lower. |
| 4 | Expense ratios are as shown in the Fund’s prospectus in effect as of the date of this report. The expense ratios for the current reporting period can be found in the Financial Highlights section of this report under Ratios to Average Net Assets. Net expenses reflect contractual expense limitations set to expire on 1/31/23. When a Fund’s expenses are below the limitation, gross and net expense ratios will be the same. See Note 6 of the Notes to Financial Statements for more information about the Fund’s expense limitations. |
| 4
LOOMIS SAYLES CREDIT INCOME FUND
| | |
| |
| Managers | | Symbols |
| |
| Matthew J. Eagan, CFA® | | Class A LOCAX |
| |
| Brian P. Kennedy | | Class C LOCCX |
| |
| Elaine M. Stokes | | Class N LOCNX |
| |
| | Class Y LOCYX |
|
| Loomis, Sayles & Company, L.P. |
Investment Goal
The Fund seeks high current income with a secondary objective of capital growth.
Market Conditions
Fixed income markets experienced significant, broad-based weakness in the 12-month period that ended on September 30, 2022. Inflation, which had already been increasing throughout 2021, increased in February 2022 after Russia’s invasion of Ukraine created additional supply-chain pressures and led to a spike in commodity prices. Consumer price inflation remained elevated long after the conflict began. Inflation has seemingly peaked at 9.1% in June, though still has yet to meaningfully recover.
The US Federal Reserve (Fed) responded with an aggressive series of interest rate increases, bringing its benchmark Fed funds rate to a range of 3.0% to 3.25% from 0% to 0.25% at the start of 2022. This marked the largest move in such a short interval since 1980. Perhaps even more important for the markets, investors continued to ratchet up their expectations for the “terminal rate” (the level at which the Fed was likely to stop raising rates) in 2023.
Tighter Fed policy not only led to a rise in prevailing yields, but also fueled an increase in investors’ aversion to risk more generally. As a result, more volatile asset categories that trade based on their yield advantage (spread) over Treasuries faced an additional headwind.
US Treasuries endured one of their worst stretches of performance in over 40 years. The two-year note, which is more sensitive to Fed policy shifts than other portions of the yield curve, soared from 0.28% to 4.22% over the course of the 12-month period (as its price fell, given the inverse relationship between yield and price). Longer-term bonds also lost ground, : the yield on the 10-year issue climbed from 1.52% at the start of the period to 3.83% on September 30, 2022. One result of these moves was that the yield curve inverted significantly (meaning that short-term yields traded above those on longer-term debt). In late September, in fact, the yield curve moved to its largest inversion since 1982.
Investment grade corporate bonds lagged considerably due to both the increase in prevailing yields and rising yield spreads (particularly for lower-quality issues in the category). Notably, major corporate bond indexes fell to levels last seen in 2009 during the immediate aftermath of the global financial crisis. The yield on the ICE BofA US Corporate Index reached 5.75% in the final week of September – another level not seen since 2009.*
High yield corporate bonds posted double-digit losses due to a sizable increase in yield spreads. High yield issuers are particularly vulnerable to slower economic growth due to their smaller average size and generally weaker balance sheets. The category outperformed investment grade corporate issues, however, which is unusual for a time of heightened investor risk aversion. This outperformance is due to high yield’s generally shorter duration profile compared to investment grade debt. Also, energy issuers tend to be heavily represented in the high yield space, which supported relative performance on the strength of rising oil prices.
Amidst rising inflation, geopolitical instability, and a broad selloff in rates and risk markets, securitized credit markets have generally produced negative total and excess returns over the past 12 months. Lower-rated CLOs (collateralized loan obligations) have suffered the most as prices on underlying bank loans have dropped significantly. Sectors like consumer ABS (asset-backed securities) with lower interest rate sensitivity and less direct impact from geopolitical instability have underperformed less. Sectors like commercial ABS, namely aircraft, have been negatively impacted. Pockets of the CMBS (commercial mortgage-backed securities) market have held in relatively well amidst a longer-term recovery from Covid-19 related shocks. Senior tranches of RMBS (residential mortgage-backed securities) have provided positive excess returns while subordinates have sold off.
Emerging market bonds, which tend to have a higher correlation to global growth trends than the broader fixed income market, underperformed in relation to the US. The asset class was pressured not just by slowing growth and investors’ increased aversion to risk, but also the effects of the Russia-Ukraine war and pronounced weakness in emerging market currencies relative to the US dollar.
| * | Source: Federal Reserve Bank of St. Louis Economic Database |
5 |
Performance Results
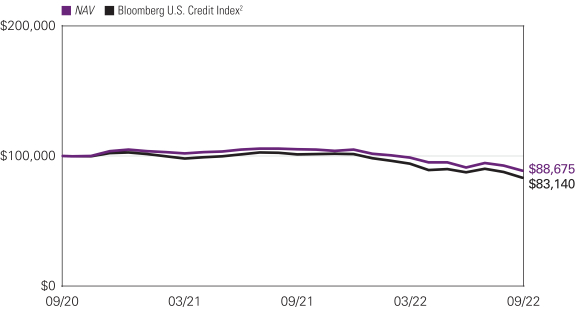
For the 12 months ended September 30, 2022, Class Y shares of Loomis Sayles Credit Income Fund returned -15.59% at net asset value. The Fund outperformed its benchmark, the Bloomberg U.S. Credit Index, which returned -17.89%.
Explanation of Fund Performance
Despite a challenging year for fixed income markets, the Fund posted positive relative returns versus its benchmark. Yield curve positioning was the primary source of outperformance. The Fund is targeting an overall duration shorter than that of the benchmark. To help achieve this we used Treasury futures, and these positions have been a positive contributor given the sharp upward movement in interest rates during the period. Securitized credit was also beneficial given the asset class’s shorter duration profile. Here, holdings in collateralized loan obligations aided returns. Finally, an allocation to defensive, reserve-like positions contributed to relative performance as risk-off sentiment prevailed.
Security selection within investment grade corporate credit was the biggest detractor as several longer- dated issues weighed on performance. An allocation to emerging market credit also lagged, with selected holdings in Israel (consumer non-cyclical), Mexico (basic industry) and Chinese property developers as the main sources of underperformance. Extended Covid-related lockdowns in China have exacerbated already-declining housing sales and government measures taken thus far to alleviate stresses on this sector have been limited, resulting in further bond price erosion.
Outlook
After a strong rally in risk assets early in the third quarter, volatility returned to markets as the Federal Reserve (Fed) retained its hawkish stance amid stubborn inflation prints. The macroeconomic environment and outlook remains challenging. Global growth forecasts have been challenged by geopolitics, war, shutdowns in China, and a looming energy crisis in Europe. Domestically, market participants have adjusted their interest rate expectations to incorporate repeated affirmations by the Fed of a clear path to higher policy rates. Stubborn inflation and a determined Fed continue to put pressure on risk assets.
In our view, the credit cycle has slid deeper into the late expansion cycle. We expect slowing growth and stubborn inflation. Fed actions have elevated the risks of a downturn and should that evolve we expect inflation to recede slowly. US hiring remains resilient, putting pressure on wages, but ultimately we believe higher rates may temper those pressures. Oil prices have slid on global growth concerns alleviating the pressure on US gas prices. However, natural gas supplies to Europe this winter are a significant risk and supply chain effects from that remain unknown. In summary, we do expect inflation to moderate but at a very slow pace.
We expect the Fed to stay on a tightening course through the end of this year and into early 2023, likely elevating the policy rate to the 4.50-4.75% range. In our view the Fed will largely be driven by the extent to which there is firm evidence of inflation moderating. We also believe the Fed may be increasingly sensitive to its impact on global financial markets, although a policy pivot seems unlikely. We expect the US 10-year bond yield to move only modestly higher from here and eventually be below the short-term policy rate. Our portfolios remain positioned defensively on rate risk while edging closer to levels where rate sensitivity becomes less of a concern.
While the Fed path seems firm at this point, a critical question is how the growth outlook for 2023 evolves and what impact that could have on corporate earnings and balance sheets. We expect slowing growth with an elevated risk of recession. Corporate fundamentals have remained reasonably strong, with solid second quarter earnings. Nonetheless, we anticipate slowing growth to be a drag on corporate earnings going forward. That said, given the strong starting point for corporate fundamentals we expect credit losses to move closer to historical averages.
Regionally, we are largely focused on US fixed income markets. An aggressive Fed and safe haven inflows have created strong momentum in the US dollar. Given global growth concerns, a committed Fed, and policies abroad that have weakened domestic currencies, we remain cautious in non-dollar-denominated assets. We have largely been avoiding Europe and anticipate a deep recession there. Should that unfold, however, opportunities may present themselves.
We believe that value is returning to US fixed income markets. Bond structures (price, yield and spread) appear relatively attractive. Dollar prices on bonds are currently at post-global financial crisis lows. Corporate bond spreads in both investment grade and high yield are currently above long-term averages, and overall yields could offer favorable levels with high yield approaching 10% and BBB-rated bonds around 6%. We believe the combination of discount-to-par, wider spreads and overall yield is increasing the potential value opportunity in bonds.
We believe the corporate bond spreads could edge wider from here with some modest further elevation in yields. However, future interest rate and spread risk is being mitigated by generally higher yields and wider spreads. We have been holding larger than average liquid reserves and maintaining an up-in-quality bias. As opportunities develop, we will consider redeploying reserves, a process that has already begun. At the same time, short-term yields have risen meaningfully, and we are comfortable with how we are being paid.
| 1 | A credit cycle is a cyclical pattern that follows credit availability and corporate health. |
| 6
LOOMIS SAYLES CREDIT INCOME FUND
Hypothetical Growth of $100,000 Investment in Class Y Shares3
September 29, 2020 (inception) through September 30, 2022
Average Annual Total Returns — September 30, 20223
| | | | | | | | | | | | | | | | |
| | | | |
| | | | | | | | | Expense Ratios4 | |
| | | | | |
| | | 1 Year | | | Life of Fund | | | Gross | | | Net | |
| | | | | |
| Class Y (Inception 9/29/20) | | | | | | | | | | | | | | | | |
| NAV | | | -15.59 | % | | | -5.82 | % | | | 4.54 | % | | | 0.57 | % |
| | | | | |
| Class A (Inception 9//29/20) | | | | | | | | | | | | | | | | |
| NAV | | | -15.88 | | | | -6.04 | | | | 4.79 | | | | 0.82 | |
| With 4.25% Maximum Sales Charge | | | -19.43 | | | | -8.04 | | | | | | | | | |
| | | | | |
| Class C (Inception 9/29/20) | | | | | | | | | | | | | | | | |
| NAV | | | -16.53 | | | | -6.81 | | | | 5.60 | | | | 1.57 | |
| With CDSC1 | | | -17.35 | | | | -6.81 | | | | | | | | | |
| | | | | |
| Class N (Inception 9/29/20) | | | | | | | | | | | | | | | | |
| NAV | | | -15.63 | | | | -5.77 | | | | 1.16 | | | | 0.52 | |
| | | | | |
| Comparative Performance | | | | | | | | | | | | | | | | |
| Bloomberg U.S. Credit Index2 | | | -17.89 | | | | -8.81 | | | | | | | | | |
Performance data shown represents past performance and is no guarantee of, and not necessarily indicative of, future results. Total return and value will vary, and you may have a gain or loss when shares are sold. Current performance may be lower or higher than quoted. For most recent month-end performance, visit im.natixis.com. Performance for other share classes will be greater or less than shown based on differences in fees and sales charges. You may not invest directly in an index. Performance for periods less than one year is cumulative, not annualized. Returns reflect changes in share price and reinvestment of dividends and capital gains, if any. The table(s) do not reflect taxes shareholders might owe on any fund distributions or when they redeem their shares.
| 1 | Class C shares performance assumes a 1% CDSC applied when you sell shares within one year of purchase. |
| 2 | Bloomberg U.S. Credit Index measures the investment grade, U.S. dollar-denominated, fixed-rate, taxable corporate and government-related bond markets. It is composed of the U.S. Corporate Index and a non-corporate component that includes non-U.S. agencies, sovereigns, supranationals and local authorities. The Index was called the U.S. Corporate Index until July 2000, when it was renamed to reflect its inclusion of both corporate and non-corporate issuers. The Index is a subset of the U.S. Government/Credit Index and U.S. Aggregate Index. |
| 3 | Fund performance has been increased by fee waivers and/or expense reimbursements, if any, without which performance would have been lower. |
| 4 | Expense ratios are as shown in the Fund’s prospectus in effect as of the date of this report. The expense ratios for the current reporting period can be found in the Financial Highlights section of this report under Ratios to Average Net Assets. Net expenses reflect contractual expense limitations set to expire on 1/31/23. When a Fund’s expenses are below the limitation, gross and net expense ratios will be the same. See Note 6 of the Notes to Financial Statements for more information about the Fund’s expense limitations. |
7 |
LOOMIS SAYLES GLOBAL ALLOCATION FUND
| | |
| |
| Managers | | Symbols |
| |
| Matthew J. Eagan, CFA® | | Class A LGMAX |
| |
| Eileen N. Riley, CFA® | | Class C LGMCX |
| |
| David W. Rolley, CFA® | | Class N LGMNX |
| |
| Lee M. Rosenbaum | | Class Y LSWWX |
| |
| Loomis, Sayles & Company, L.P. | | |
Investment Goal
The Fund seeks high total investment return through a combination of capital appreciation and current income.
Market Conditions
Global markets suffered declines in the 12-month period ended September 30, 2022, reflecting a broad assortment of unfavorable headlines. A sharp increase in inflation prompted the US Federal Reserve (Fed) and other central banks to raise interest rates aggressively; rates were boosted in the US by a total of three percentage points in the first nine months of 2022. Rising rates, in turn, fueled concerns about the potential for a recession.
Russia’s invasion of Ukraine in February 2022 also contributed to the downturn. The event brought geopolitical issues back to the forefront, as well as further pressured commodity prices and global supply chains. It also led to concerns about the outlook for the European economy, potentially creating a headwind for US-based multinational companies.
Stocks responded unfavorably to these developments, with poor returns and elevated volatility. The MSCI All Country World Index declined over 20% for the period, with all sectors registering losses except for the energy sector. The communication services, consumer discretionary and information technology sectors posted the largest declines.
In fixed income, tighter Fed policy not only led to a rise in prevailing yields, but also fueled an increase in investors’ aversion to risk more generally. As a result, more volatile asset categories that trade based on their yield advantage (or “spread”) over Treasurys faced an added headwind.
Performance Results
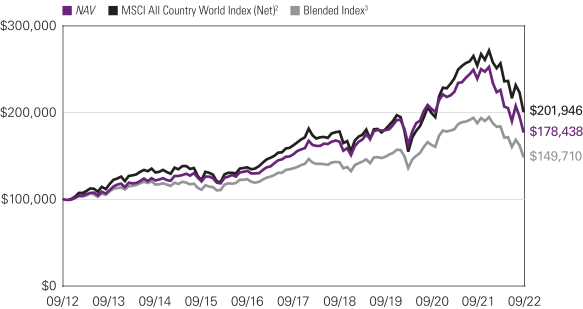
For the 12 months ended September 30, 2022, Class Y shares of Loomis Sayles Global Allocation Fund returned -25.41% at net asset value. The Fund underperformed its primary benchmark, the MSCI All Country World Index (Net) which returned-20.66%, and its secondary blended index (60% MSCI All Country World Index (Net)/40% Bloomberg Global Aggregate Bond Index) which returned -20.41%.
Explanation of Fund Performance
In equities, the three largest detractors from returns were ASML, Salesforce, and Airbnb.
ASML is a leader in photolithography, the process in which a light source is used to etch a pattern on a silicon wafer. The company is uniquely positioned in EUV (extreme ultraviolet), the next generation technology, which is needed for chipmakers to continue to make chips smaller while maintaining their power. The barriers to entry are high, given the required technical expertise (to illustrate, EUV was in development for ten years) and associated R&D spending. ASML partners with its customers, aligning its product roadmap with theirs, which we believe has led to a symbiotic relationship. ASML is moving toward a value-based service model under which the company will be paid per wafer output of the machines, which should be more profitable. Under this model, ASML must deliver a certain level of output and fill any shortfalls at no additional cost to the customer. Assuming their machines are delivering as promised, we believe the company should enjoy a solid revenue stream and margin boost based on chip output. Currently, the services business accounts for a little more than a quarter of revenues. We believe ASML has sound capital allocation policies, selectively doing bolt-on acquisitions (such as Berliner Glas) while growing its dividend and opportunistically buying back shares (the company is currently nearing completion of a €9B repurchase program).
Shares of ASML underperformed along with the broader semiconductor sector on geopolitical tensions and concerns over a fall in demand for chips (i.e., the cycle “peaking”). However, ASML reported solid orders and backlog; our view remains that there is a strong long-term environment with many secular demand drivers. The company has a solid balance sheet, currently in a net cash position with no debt due until 2023. We expect intrinsic value growth to be driven by revenues and margin expansion, as the company improves its efficiencies across its EUV and DUV (direct ultraviolet) production lines and ramps up its next product, high-NA (numerical aperture) EUV.
| 8
LOOMIS SAYLES GLOBAL ALLOCATION FUND
Salesforce is an enterprise software company with leadership in large and growing markets. Salesforce pioneered “software as a service” (SaaS), which allows customers to access its product via the internet. Since its founding in 1999, Salesforce has fine-tuned its original product as well as added more services, creating the “Salesforce economy”. It now operates four “clouds”: Sales Cloud, Service Cloud, Marketing and Commerce Cloud, and Salesforce Platform.
Shares were weak after announcing a mixed set of quarterly results in August. Company guidance for the third quarter was lower than expected, due to a combination of foreign currency headwinds and a challenging macroeconomic environment. Management indicated customers are becoming more cautious which is resulting in a longer sales cycle and some deal compression. On the positive side, the company maintained its full-year adjusted operating margin target and announced approval for a $10 billion share repurchase program. Later in the quarter, at its investor day, Salesforce reaffirmed its fiscal year 2026 targets of $50 billion in revenue and 25% or better adjusted operating margins.
Notwithstanding the current macro challenges, we expect Salesforce to remain both a key beneficiary and enabler of digital transformation for the foreseeable future, leveraging its scale, go-to-market expertise, ecosystem approach, and strategic growth strategies. Salesforce’s suite of applications support essential components of its customers’ businesses, reinforcing the recurring nature of Salesforce’s software subscription revenue.
Airbnb is an online marketplace for short-term stays and vacation rentals. Over the last decade, Airbnb has disrupted the lodging industry by creating a platform where homeowners can offer their properties for rent, introducing significantly more choice for consumers. Our investment thesis on Airbnb is driven by its leadership position within this large addressable market. Airbnb’s capital-lite platform, where it collects commissions for each rental, benefits from a powerful network effect. The more property owners who list their properties with Airbnb the more renters it attracts, and vice versa. Airbnb’s platform offers a superior consumer experience for both the host and the guest driven by trust; hosts can access guest profiles and provide feedback on guests, while guests can also supply reviews and ratings on hosts. We believe this experience has created a brand synonymous with seamless private rentals, evidenced by the high percentage (over 90%) of direct traffic to Airbnb.com.
Shares outperformed following the company’s second quarter results; the company reported growth in room nights, solid margins and strong free cash flow generation. Management also announced a $2 billion share buyback and highlighted a positive trajectory for the travel recovery.
Going forward, we expect intrinsic value growth for Airbnb to be driven by revenue growth and margin expansion. The company has a number of opportunities to grow its top line through increasing its share, offering its users ancillary travel services, and entering new verticals, such as the hotel market. We expect margins to grow as the company continues to leverage its technology.
In fixed income, the Fund’s positioning along the yield curve (which depicts the relationship among bond yields across the maturity spectrum) and stance with respect to duration and corresponding interest rate sensitivity detracted from performance. Notably, positioning in the US dollar and Canadian dollar-pay markets weighed on performance. In the US dollar-pay market, allocations to the five- and ten-year segments of the yield curve held back performance as the Fed embarked on an aggressive monetary tightening path to tame persistently high inflation, hiking rates 300 basis points so far in 2022.
Corporate credit allocation to the communications, consumer non-cyclical, and consumer cyclical sectors detracted from performance. Within communications, holdings of Dish Network Corp. weighed on return as the company significantly underperformed the broader investment grade telemedia space, reflecting the secular decline of its challenged satellite video business. Holdings of pharmaceuticals in the consumer non-cyclical sector particularly detracted from performance due to political headwinds within the industry as well as headwinds related to the Covid-19 pandemic such as reduced clinical capacity. Within consumer cyclical, surging fuel costs and continued uncertainty surrounding the Omicron variant caused holdings of Norwegian Cruise Line to underperform.
In equities, the three largest contributors to returns were UnitedHealth Group, Northrop Grumman, and Alibaba.
UnitedHealth Group (UNH) is the largest managed care operator (MCO) in the US. The company’s businesses include OptumCare (primary and urgent care centers), OptumInsight which offers back office technology to healthcare providers, and OptumRx, the company’s Pharmaceutical Benefit Manager business. As the largest MCO, it benefits from scale advantages, specifically greater underwriting experience and the ability to leverage non-medical costs. Via its Optum businesses, the company has accumulated valuable medical trend data over decades, providing best-in-class insights which it leverages for its own MCO as well as external clients. UNH rates highly across our quality dimensions; the company has consistently returned cash to shareholders via its growing dividend and share buybacks. It has a strong track record of acquisitions, including Surgical Care Affiliates, Advisory Board, and DaVita Medical Group. We expect intrinsic value growth to be driven by organic top-line growth and modest margin expansion, as well as by continued share repurchases. Valuation is attractive based on our discounted cash flow methodology.
9 |
UNH shares outperformed over the period. The company’s traditional health insurance business continued to demonstrate strong execution, highlighted by continued positive enrollment trends in both the Medicare Advantage and Commercial segments, as well as better-than-expected medical costs. There has also been progress at OptumCare, as the number of patients under full value-based care agreements rose significantly.
We eliminated our positions in Northrop Grumman, an aerospace and defense company, and Alibaba, an e-commerce company, in October and November of 2021, respectively. Shares were strong relative to other holdings in the portfolio as the stocks were sold prior to the market downturn.
In fixed income, security selection within the technology, consumer cyclical, banking, and consumer non-cyclical sectors contributed to performance. Within technology, holdings of CommScope contributed; 2022 growth has been strong, led by its Connectivity and Cable Solutions division. Within the consumer cyclical sector, Uber reported strong earnings heading into the second half of 2022. In the banking sector, holdings of Ally Financial, a leading digital consumer bank, contributed to performance. The company acquired Fair Square Financial, adding credit cards to its diverse product base. Within consumer non-cyclical, holdings of BioMarin contributed to performance, as the biotech company significantly outperformed the industry.
Holdings of inflation-linked securities contributed positively to performance over the period as inflation reached historically high levels. In particular, allocations to US Treasury-inflation-protected securities and Japan government inflation-linked bonds added to performance.
The Loomis Sayles Global Allocation Fund entered into forward currency contracts for hedging purposes and to mitigate exposure where investment allocation decisions caused the Fund to be either overweight or underweight in certain currencies versus the benchmark when measured in combination with bond exposures to each currency. For most of the year, the Fund held long forward positions of the Euro and Japanese Yen to bring it in line with the benchmark, while being short on the Canadian Dollar for hedging purposes. For the Euro and Yen, a combination of higher US yields relative to these regions, and less vulnerability in the trade balances from accelerating oil prices, led to general US dollar appreciation against these currencies. Given strongly negative returns of rolling long Euro and Yen currency forwards against the dollar, there was a material cost to performance from having used FX forwards. As for the Canadian Dollar (CAD), hedging of our CAD exposure was beneficial, as it reduced our overall exposure to CAD-denominated securities, which depreciated against the US dollar over the year. The use of FX forwards in total detracted from performance.
Outlook
Tighter global monetary policies have increased the odds of a recession. Decelerating, but positive global growth in 2022 remains the base case; however recession risks continue to rise as central bank tightening and demand destruction from higher inflation slow the global economy. Consensus expectations for corporate profit growth have held up well as underlying fundamentals are currently favorable, but they will likely start to decline as we head into 2023.
Inflation is expected to remain sticky, given the volatile geopolitical backdrop, tight labor markets, and only partially resolved supply chain issues. Wage pressure, service sector prices, and home price impacts on core inflation are expected to decelerate, yet remain elevated. Gas prices have come down which has helped ease the pain for US consumers, but core inflation is likely to remain stubbornly high. In the US, we see headline and core inflation nearing 3.25-3.5% in twelve months’ time. Near-term consensus inflation forecasts indicate that the Fed and other central banks will not be able to bring inflation down to their target levels until 2024 and we expect the Fed to continue its hawkish path. The near-term squeeze in European energy markets and depth of the economic downturn are key inputs into the path of prices but are difficult to predict with any precision, leaving fixed income markets volatile.
The US dollar could continue to strengthen over the short term, led by a hawkish Fed, rising US Treasury yields, and the volatile geopolitical backdrop. The US economy is benefiting from being relatively less exposed to energy prices. Other factors contributing to dollar strength include China’s zero-Covid policy and property market issues, and Europe’s acute energy supply shortage. We expect the dollar to remain strong until global growth begins to improve.
Europe remains a source of potential risk if the region’s energy crisis leads to an accelerating decline in industrial production. The potential escalation of the crisis in Ukraine also remains an important risk. We are keeping a close eye on these developments, as well as policy responses from the region’s governments and central banks.
We believe China’s GDP growth target of 5.5% for 2022 is now beyond reach; we forecast 3.5% growth. China continues to respond to Covid-19 outbreaks with strict lockdowns, at the expense of economic growth. The Chinese property market is no longer making front-page news, but it remains a risk. China has a hefty weight in the global economy, and a crisis in China could have spillover effects to the rest of the world.
| 10
LOOMIS SAYLES GLOBAL ALLOCATION FUND
In equities, we currently hold a diverse group of technology names spanning semiconductor manufacturing and equipment, software, and consulting companies. We have select exposure to consumer names that we believe are uniquely positioned, including companies capturing e-commerce demand, physical retailers with a differentiated value offering, and companies with valuable brands. We have focused our healthcare exposure toward higher growth areas in the industry, and away from areas exposed to reimbursement risk. In financials, our holdings have leading market positions in retail banking, asset management and investment banking. We believe our holdings have sustainable competitive advantages and strong balance sheets, evidenced by the portfolio’s return on equity, which is meaningfully higher than the MSCI ACWI benchmark, and financial leverage which is less than the benchmark by key measures (on a net/debt to EBITDA basis). We believe these characteristics allow our companies the flexibility to weather uncertain environments, and quite possibly emerge stronger.
Top Ten Holdings as of September 30, 2022
| | | | | | | | |
| | |
| Security Name | | % of
Net Assets | |
| | 1 | | | Amazon.com, Inc. | | | 3.13 | % |
| | 2 | | | Danaher Corp. | | | 3.05 | |
| | 3 | | | Alphabet, Inc., Class A | | | 2.92 | |
| | 4 | | | S&P Global, Inc. | | | 2.89 | |
| | 5 | | | Linde PLC | | | 2.79 | |
| | 6 | | | Cummins, Inc. | | | 2.75 | |
| | 7 | | | Salesforce, Inc. | | | 2.72 | |
| | 8 | | | Accenture PLC, Class A | | | 2.72 | |
| | 9 | | | Airbnb, Inc., Class A | | | 2.70 | |
| | 10 | | | UnitedHealth Group, Inc. | | | 2.67 | |
The portfolio is actively managed and holdings are subject to change. There is no guarantee the Fund continues to invest in the securities referenced. The holdings listed exclude any temporary cash investments, are presented on an individual security basis and do not represent holdings of the issuer.
Hypothetical Growth of $100,000 Investment in Class Y Shares4
September 30, 2012 to September 30, 2022
11 |
Average Annual Total Returns — September 30, 20224
| | | | | | | | | | | | | | | | | | | | | | | | |
| | | | | | |
| | | | | | | | | | | | Life of
Class N | | | Expense Ratios5 | |
| | | 1 Year | | | 5 Years | | | 10 Years | | | Gross | | | Net | |
| | | | | | | |
| Class Y | | | | | | | | | | | | | | | | | | | | | | | | |
| NAV | | | -25.41 | % | | | 3.24 | % | | | 5.97 | % | | | — | | | | 0.87 | % | | | 0.87 | % |
| | | | | | | |
| Class A | | | | | | | | | | | | | | | | | | | | | | | | |
| NAV | | | -25.59 | | | | 2.99 | | | | 5.70 | | | | — | | | | 1.12 | | | | 1.12 | |
| With 5.75% Maximum Sales Charge | | | -29.86 | | | | 1.78 | | | | 5.08 | | | | — | | | | | | | | | |
| | | | | | | |
| Class C | | | | | | | | | | | | | | | | | | | | | | | | |
| NAV | | | -26.16 | | | | 2.22 | | | | 5.07 | | | | — | | | | 1.87 | | | | 1.87 | |
| With CDSC1 | | | -26.85 | | | | 2.22 | | | | 5.07 | | | | — | | | | | | | | | |
| | | | | | | |
| Class N (Inception 2/1/17) | | | | | | | | | | | | | | | | | | | | | | | | |
| NAV | | | -25.36 | | | | 3.32 | | | | — | | | | 5.21 | | | | 0.80 | | | | 0.80 | |
| | | | | | | |
| Comparative Performance | | | | | | | | | | | | | | | | | | | | | | | | |
| MSCI All Country World Index (Net)2 | | | -20.66 | | | | 4.44 | | | | 7.28 | | | | 6.33 | | | | | | | | | |
| Blended Index3 | | | -20.41 | | | | 1.96 | | | | 4.12 | | | | 3.53 | | | | | | | | | |
Performance data shown represents past performance and is no guarantee of, and not necessarily indicative of, future results. Total return and value will vary, and you may have a gain or loss when shares are sold. Current performance may be lower or higher than quoted. For most recent month-end performance, visit im.natixis.com. Performance for other share classes will be greater or less than shown based on differences in fees and sales charges. You may not invest directly in an index. Performance for periods less than one year is cumulative, not annualized. Returns reflect changes in share price and reinvestment of dividends and capital gains, if any. The table(s) do not reflect taxes shareholders might owe on any fund distributions or when they redeem their shares.
| 1 | Performance for Class C shares assumes a 1% contingent deferred sales charge (“CDSC”) applied when you sell shares within one year of purchase. |
| 2 | MSCI All Country World Index (Net) is a free float-adjusted market capitalization weighted index that is designed to measure the equity market performance of developed and emerging markets. |
| 3 | Blended Index is an unmanaged, blended index composed of the following weights: 60% MSCI All Country World Index (Net) and 40% Bloomberg Global Aggregate Bond Index. The Bloomberg Global Aggregate Bond Index provides a broad-based measure of the global investment-grade fixed income markets. The four major components of this index are the U.S. Aggregate, the Pan-European Aggregate, the Asian-Pacific Aggregate, and the Canadian Aggregate Indices. The Index also includes Eurodollar and Euro-Yen corporate bonds, Canadian government, agency and corporate securities, and USD investment grade 144A securities. |
| 4 | Fund performance has been increased by fee waivers and/or expense reimbursements, if any, without which performance would have been lower. |
| 5 | Expense ratios are as shown in the Fund’s prospectus in effect as of the date of this report. The expense ratios for the current reporting period can be found in the Financial Highlights section of this report under Ratios to Average Net Assets. Net expenses reflect contractual expense limitations set to expire on 1/31/23. When a Fund’s expenses are below the limitation, gross and net expense ratios will be the same. See Note 6 of the Notes to Financial Statements for more information about the Fund’s expense limitations. |
| 12
LOOMIS SAYLES GROWTH FUND
| | |
| |
| Manager | | Symbols |
| |
| Aziz V. Hamzaogullari, CFA® | | Class A LGRRX |
| |
| Loomis, Sayles & Company, L.P. | | Class C LGRCX |
| |
| | Class N LGRNX |
| |
| | Class Y LSGRX |
Investment Goal
The Fund seeks long-term growth of capital.
Market Conditions
The US equity markets suffered a pronounced decline in the 12-month period ended September 30, 2022, reflecting a broad assortment of unfavorable headlines. A sharp increase in inflation, which prompted the US Federal Reserve (Fed) and other central banks to raise interest rates aggressively, was a likely factor weighing on performance. The Fed boosted rates by a total of three percentage points in the first nine months of 2022, and at the close of the period investors were expecting several more increases before year-end. Rising rates, in turn, may have fueled concerns about the potential for a meaningful slowdown in economic growth and corporate earnings in 2023.
Russia’s invasion of Ukraine in February 2022 was another potential catalyst for the downturn in equities. The event not only brought geopolitical issues back to the forefront, but it also contributed to an increase in commodity prices and added further stress to global supply chains. It also led to concerns about the outlook for the European economy, potentially creating a headwind for US-based multinational companies.
Stocks responded unfavorably to these developments, with poor returns and elevated volatility. Growth stocks, which had led the market higher in the rally of 2020-2021, underperformed as rising interest rates may have prompted investors to gravitate away from companies whose cash flows are weighted further in the future. Small-cap equities, which are seen as being vulnerable to the effects of slowing growth, trailed large caps. On the positive side, the energy sector finished with a gain thanks to strength in the related commodities.
Performance Results
For the 12 months ended September 30, 2022, Class Y shares of Loomis Sayles Growth Fund returned -27.29% at net asset value. The Fund underperformed its benchmark, the Russell 1000® Growth Index, which returned -22.59%.
Explanation of Fund Performance
We are an active manager with a long-term, private equity approach to investing. Through our proprietary bottom-up research framework, we look to invest in those few high-quality businesses with sustainable competitive advantages and profitable growth when they trade at a significant discount to intrinsic value. Given the rare confluence of quality, growth, and valuation, we may study dozens of companies but may only invest in a select few businesses each year. We believe identifying those few businesses with these characteristics is an art, not a science. As a result of this rigorous approach, ours is a selective, high-conviction portfolio of typically 30-40 names.
The Fund’s positions in Vertex Pharmaceuticals, Schlumberger, and Regeneron Pharmaceuticals contributed the most to performance. Stock selection in the healthcare, communication services, and financials sectors, along with our allocations in the healthcare, industrials, consumer discretionary, and energy sectors, contributed positively to relative performance.
Vertex Pharmaceuticals is the leader in creating therapies for patients suffering from cystic fibrosis (CF), with four currently approved treatments, and the company is building out its capabilities to address related diseases that lever its core expertise in biology and medicinal chemistry. A strategy holding since June 2021, Vertex reported financial results during the period that reflected the continued penetration of Trikafta, its latest and most efficacious CF therapy. The company continues to penetrate the global market, both through new patients that did not previously have a therapy available and patients switching from older generations of therapies to the new standard of care. Vertex has now reached reimbursement agreements with more than 25 countries since Trikafta’s approval in late-2019. While most of the company’s pipeline assets outside of CF are still very early stage, the company also continues to make progress across a range of disease areas and expects to make regulatory filings for its CTX001 therapy for blood disorders, co-developed with CRISPR Therapeutics, by year-end 2022. We believe Vertex’s strong and sustainable competitive advantages include its unparalleled understanding of CF, for which it is recognized as setting the standard of care, its partnerships with the CF Foundation and other entities that enhance its solutions capabilities, and its broader understanding of biology and serial approach to
13 |
drug development. We believe expectations embedded in Vertex’s share price underestimate the defensibility of its dominant CF franchise, the life-changing benefit of its therapies for its growing base of 40,000 patients, and the strength of its science and innovation ability that is contributing to a growing pipeline of potentially transformative therapies outside of CF. We trimmed the position during the period following strong price performance but continue to believe the shares embed expectations for revenue and free cash flow that are below our long-term expectations. As a result, we believe the shares are trading at a discount to our estimate of intrinsic value and offer an attractive reward-to-risk opportunity.
Schlumberger is the world’s leading supplier of technology, equipment, integrated project management, and information solutions to the global oil and gas exploration and production industry. Over its 95-year history, Schlumberger has built a brand and reputation for delivering consistent service and product excellence across the spectrum of exploration, drilling, and production. Only a few companies can compete with the scope of Schlumberger’s integrated suite of products and services, and even fewer can compete with the scale and depth of its technology and service execution. We have owned our position in Schlumberger since the third quarter of 2008, prior to assuming management of the Fund in 2010. At the time, we believed a bubble in commodity pricing was leading to extremely high embedded expectations that resulted in very few energy companies looking attractive through our bottom-up assessment of reward to risk. However, following a significant oil price correction that began in September 2008, we initiated our position in Schlumberger and added to it in 2009 as the substantial decline in oil prices increased the attractiveness of Schlumberger’s reward to risk. We believed Schlumberger’s strong and sustainable competitive advantages included its brand and reputation, scale, history of and commitment to developing innovative technology, the breadth of its integrated product suite, and its institutional knowledge. Further, we believed that secular growth in the long-term global demand for oil, arising primarily from the need to replace naturally depleting reserves, is driving the need to extract hydrocarbons from harsher environments that are increasingly difficult to reach or extract from. We believe services like those Schlumberger provides are essential to profitably meeting long-term ongoing demand for hydrocarbon production. Over our holding period the oil price environment has endured significant challenges. Prompted by the rapid proliferation of shale oil and gas, over a two-year period which began in 2014 oil prices fell by over 70% and industry spending fell by over 50%. Despite this, Schlumberger gained share and maintained leading margins, while several competitors posted losses or very thin margins. Schlumberger was one of the few companies to generate positive free cash flow during the downturn and continued to invest to strengthen its ability to offer integrated solutions to clients. More recently, oil experienced a record price decline in the first quarter of 2020 due to Covid-19-related demand weakness in China and a price war between OPEC and Russia, and demand remained depressed throughout much of 2021 as a result of the global lockdown and continued travel restrictions. In spite of these challenges, we believe Schlumberger continued to execute well and further strengthened its competitive differentiation versus peers. With our assessment of Schlumberger’s quality and long-term secular growth opportunity remaining intact, we took advantage of declines in the company’s share price, with our last addition coming in November 2020. From that point, the company was among our highest returning securities until we exited the position in March 2022. Despite the strong recent performance, we consider Schlumberger to be among our investment mistakes. We believe that in the long term, the price of oil should be driven by supply and demand and be equal to or above the marginal cost of producing oil. Even taking into account our most dire demand projections, we believed the natural decline in reserves of around 7% per year would drive the continued need to extract oil. However, excess supply as a result of the shale boom coincided with a once-in-a-century decline in demand and sharply lowered demand for Schlumberger’s products and services. Our initial value range analysis should have captured this range of outcomes but did not. Ideally, we like to recognize our mistakes as early as possible. Regardless of when we recognize a mistake, at that point we always make a forward-looking assessment as we did with Schlumberger in fall of 2020 when we concluded that the market was overly penalizing the company’s shares and increased our investment at very attractive prices. Upon exiting the position in March of 2022, we allocated the proceeds to new positions in Block, Netflix, PayPal, and Shopify.
Regeneron Pharmaceuticals, Inc. is a fully integrated biopharmaceutical company created with the vision to empower scientists to shape the path of the business. Regeneron has created enabling technologies, platforms, and methods that materially speed target discovery and development timelines, allowing the company to develop viable candidates for clinical trial faster than its competitors. As a result of these technologies, Regeneron was able to negotiate risk-mitigating collaborations with larger biopharmaceutical company partners that fund early-stage research and development in exchange for a share of potential profits, enabling Regeneron to access scale and distribution strength. A holding since the third quarter of 2016, shares responded positively following the company’s September 2022 announcement that trials for a higher dose (8mg) of Aflibercept, the same drug behind the company’s leading Eylea therapy, showed comparable efficacy and safety when dosed at 12 to 16 weeks as 2mg Eylea, which is dosed every 8 weeks. The results, which are accompanied by an established safety profile after Eylea’s decade on the market, are superior to any existing or clinical therapy, and should firmly maintain the company’s leadership in treating diseases of the back of the eye. Further, because the higher dose required a new formulation and some modifications to the underlying molecule, Regeneron will file for a new patent, which if successful, would provide another decade of protection versus biosimilar competition, which is expected to emerge for Eylea sometime over the next two-to-four years. Financial results were volatile during the period due to the company’s success with REGN-Cov, an antibody therapy for Covid-19 that contributed substantially in the first half of the period. We expected demand for REGN-Cov to provide only a short-term boost to results and instead viewed the therapy as further evidence of Regeneron’s ability to
| 14
LOOMIS SAYLES GROWTH FUND
rapidly respond with novel innovation at a speed that we believe exceeds competitors — capabilities we consider to be at the core of its competitive advantage. Core operating results during the period reflected market share gains for Eylea, a treatment for eye diseases and the company’s largest revenue generator, continued traction for Dupixent, the company’s innovative treatment for atopic dermatitis and allergic asthma, an expanding number of indications for Libtayo, the company’s first approval in the field of immuno-oncology, and meaningful progress in its pipeline. With the continued investments in the company’s broad range of pipeline programs laying the groundwork for sustainable long-term revenue generation, we believe Regeneron is among the highest quality businesses in healthcare, with both broad-based established therapies and meaningful pipeline assets, which include approximately 30 product candidates in clinical development that were generated using the company’s proprietary technology. We trimmed the position during the period on strong price performance but continue to believe that Regeneron’s market price embeds a lack of appreciation for the company’s multiple short-term and longer-term growth opportunities and the uniqueness of its financial model. As a result, we believe the shares trade at a discount to our estimate of intrinsic value and offer an attractive reward-to-risk opportunity.
The Fund’s positions in Meta Platforms, Boeing, and Alphabet detracted the most from performance. Stock selection in the information technology, industrials, consumer discretionary, and consumer staples sectors, along with our allocations in the communication services, consumer staples, and information technology sectors, detracted from relative performance.
Meta Platforms operates online social networking platforms that allow people to connect, share, and interact with friends and communities. With over 3.6 billion monthly users and 200 million businesses worldwide using its family of apps — Facebook, Messenger, WhatsApp, and Instagram — the scale and reach of Meta’s network is unrivaled. A strategy holding since its IPO in the second quarter of 2012, Meta reported financial results during the period that were generally mixed with respect to consensus expectations. However, shares declined substantially following the company’s fourth quarter financial report in early February. Operating expenses were greater than expectations and the company issued guidance for the first quarter of 2022 that was well below expectations, which it attributed to headwinds arising from recent privacy restrictions by Apple, the continuing impact of macro weakness such as supply chain disruptions on advertising spending, and the company’s transition to a new product format — short term video — where monetization is currently lower. Management previously addressed the changes by Apple, which it believes decreased the accuracy of Facebook’s ad targeting, increased the difficulty of measuring outcomes, and contributed to underreporting of successful conversions such as sales and app installs by approximately 15% in the third quarter of 2021. The company has already been investing in a number of solutions, including commerce tools to help businesses reach more customers and privacy-enhancing technologies, and believes it has closed a substantial portion of the measurement gap. The company expects to further reduce the amount of underreporting in 2022 but expects the changes will remain a headwind. Apple’s changes impact not just Meta, but the broader mobile advertising ecosystem. As a function of its competitive advantages, we believe Meta remains well positioned relative to its peers, and there are no changes to our assessment of the company’s quality or secular growth opportunities. Another near-term headwind is the company’s capital investments in and transition to a new product format — the short-form video. During our ownership of Meta, Facebook has gone through several product transitions including from desktop to mobile platforms, from newsfeed to stories, and now to short-form videos. Each such transition first requires capital expenditures followed by a gradual revenue ramp-up, creating pressures on topline, margins, and earnings. Over time, the required investment decreases and revenues increase. Of note, the Instagram “Reels” product, launched in August 2020, is now Meta’s fastest growing content format and largest contributor to engagement. The company previously reported that Reels was consuming more than 20% of users’ time spent on Instagram, and video, including FB Reels, accounted for 50% of time spent on Facebook. In the most recent quarter, the company reported a further 30% increase in time people spent on Reels across FB and Instagram. We believe this is a necessary cycle for maintaining sustainable competitive advantages and long-term growth. Despite the near-term pressure on financial results, Meta continues to have significant advantages arising from its network of almost 3 billion daily users of its family of apps, 200 million businesses that use its platforms and tools every month, and 10 million advertisers who have consistently paid more per user for access to its rare network. We expect that corporations will continue to allocate an increasing proportion of their advertising spending online, and Meta remains one of very few platforms where advertisers can reach consumers at such scale in such a targeted and effective fashion. We believe Meta’s brands, network, and targeting advantage position the company to take increasing share of the industry’s profit pool and grow its market share from 6% currently to approximately 10% of the total global advertising market over our investment time horizon. We also believe that the expectations embedded in Meta’s current share price show a lack of appreciation for the company’s growth opportunities and the sustainability of its business model. We believe the consensus expectations and current market price reflect assumptions for free cash flow growth that are well below our long-term expectations of high-teens cash flow growth. As a result, we believe the shares trade at a significant discount to our estimate of intrinsic value, creating a compelling reward-to-risk opportunity. We took advantage of near-term market weakness to add to our position in February, April, and July.
Founded in 1916, Boeing is a global leader in the commercial and defense aerospace industries. The company manufactures commercial aircraft for passenger and cargo traffic as well as manned and unmanned military aircraft, missile and defense systems, satellites and launch systems, and other space and security systems. Along with Airbus, Boeing is part of a global duopoly that accounts for almost all commercial planes sold with greater than 125 seats — the largest market segment. A holding since March 2020, Boeing’s financial
15 |
results during the period were mixed and largely below expectations, but the company posted positive quarterly earnings for the first time since 2019, and positive quarterly free cash flow for the first time in almost three years. Boeing also expects free cash flow to be positive for the full year in 2022. Boeing has made significant progress with the 737 MAX, which is now cleared to fly in almost all countries with the major exception of China. The company had originally anticipated the MAX would be approved in China in the first quarter of 2022, but a combination of ongoing Covid flare-ups, an accident in March involving a predecessor to the MAX, and ongoing geopolitical tensions have left timing uncertain. While the company didn’t provide significant new details, Boeing is now assuming it will make no deliveries in China this year, despite a number of Chinese airlines that were already testing the MAX in preparation for its return to service. Boeing has also faced challenges with its 787 model. After deliveries were halted for almost two years to address manufacturing flaws in the body of the aircraft and other faults, in August, the FAA approved a resumption of deliveries. We believed the issues were temporary, not structural, and despite the halt the 787 was the most used widebody aircraft during the pandemic. We estimate that Boeing has approximately $43 billion of aircraft currently in inventory, including 120 787s, which will generate substantial revenue and cash flow as they are likely delivered over the next 12-to-24 months. As of June quarter-end, the company’s backlog of $372 billion, or approximately 4,239 aircraft, was up 2% year over year. Despite the recent weakness, air traffic recovery is underway, and absent further issues with the MAX and 787 we believe the company’s long-term earnings power remains intact. Boeing’s financial results remain significantly impacted by the decline in global air travel due to Covid-19. At its low point in 2020, travel demand, as measured by revenue passenger kilometer (RPK), which represents distance flown by paying passengers, had declined 94% from April 2019. And while demand has gradually improved, as an indicator, in May 2022 RPK still remained 31% below May 2019. We believe the impact of Covid-19, along with the grounding of the MAX, the fourth generation of its most profitable airplane model, represent temporary, not structural, issues that created the opportunity to initiate our position. We believe Boeing’s strong and sustainable competitive advantages include its significant cumulative knowledge and experience in aeronautical development, scale, and a client base that faces switching costs due to plane-specific operational and maintenance issues. Global growth in air travel is the primary secular growth driver for Boeing. Over our long-term investment horizon, we believe demand for global air travel will continue to grow at a mid-single-digit rate, as it has for the past four decades. We believe Boeing is one of only two companies globally which possess the requisite expertise and scale to profitably serve the global demand for commercial aircraft. We believe the current market price embeds overly pessimistic expectations concerning both aircraft deliveries and the degree to which margins are structurally impaired. As a result, we believe the company is selling at a significant discount to our estimate of intrinsic value and offers a compelling reward-to-risk opportunity. We took advantage of near-term price weakness to add to our position on several occasions during the year.
Alphabet is a holding company that owns a collection of businesses — the largest and most important of which by far is Google. Google is the global leader in online search and advertising, and also offers online cloud solutions to businesses and consumers globally. We believe Alphabet’s competitive advantages include its scale, brand strength, the power of its network and business ecosystem, and innovative culture that is reinforced by its massive investments in research and development (R&D). A long-term Fund holding, Alphabet reported financial results during the period that were generally strong and in-line with or better than consensus expectations for revenues and operating profits. After a strong first-half recovery in advertising spending, which had been depressed due to Covid-19 in the prior-year period, still solid double-digit growth in advertising revenue decelerated over the past six months due to challenging prior-year comparisons. The company also observed a slowdown from some advertisers in its YouTube and network advertising businesses. For comparison, YouTube growth of 5% in the most recent quarter came on top of 84% growth in the prior-year period. Despite some cyclical softening in advertising, YouTube continues to benefit from strong demand from brand advertisers due to its reach and engagement with over 2 billion monthly users who recently spent over 1 billion hours daily on the platform. As with other platforms, the company is transitioning to short-form videos, where monetization is currently lower. However, the company reported that YouTube Shorts were being watched each month by over 1.5 billion signed-in users, and that they were receiving over 30 billion daily views. Google Cloud revenue represented approximately 8% of total revenue, and ended the period with a $25 billion run rate, up almost 40% year over year. We believe Google’s key revenue drivers of mobile search, YouTube, programmatic advertising, and an emerging cloud business that is Google’s fastest growing business, each continue to benefit from secular drivers including increased mobility, video advertising, better use of advertising technology to drive performance, and increased penetration of public cloud services. Google’s attractive financial model generates strong free cash flow and earns high returns on invested capital, enabling it to reinvest significantly in its business. Over the past five years, Google has invested over $120 billion in R&D, an amount very few companies could replicate. We believe the global secular shift from traditional advertising to online advertising is the biggest long-term growth driver for Google. Online advertising accounts for approximately $450 billion, or around 25% of the $1.7 trillion annual spending on global advertising and marketing. Over our investment horizon, we believe this penetration will increase to over 40%. We believe investors underestimate Alphabet’s growth opportunities and the intrinsic value of the business given its unique and difficult-to-replicate attributes and business model. As a result, we believe the company’s shares trade at a significant discount to our estimate of intrinsic value and offer a compelling reward-to-risk opportunity.
All aspects of our quality-growth-valuation investment thesis must be present simultaneously for us to make an investment. Often our research is completed well in advance of the opportunity to invest. We are patient investors and maintain coverage of high-quality businesses in order to take advantage of meaningful price dislocations if and when they occur. During the period we initiated new
| 16
LOOMIS SAYLES GROWTH FUND
positions in Block, Netflix, PayPal, Shopify, and Tesla. We added to our existing holdings in Boeing, Disney, Illumina, Intuitive Surgical, Meta Platforms, Salesforce, and Visa. We trimmed our existing positions in Alibaba, Deere, Expeditors International, Oracle, Regeneron Pharmaceuticals, Roche, Vertex Pharmaceuticals, and Yum China. We also trimmed our positions in Alphabet and Nvidia as they approached our maximum allowable position size. We sold our positions in Automatic Data Processing, Cerner, Cisco, Colgate Palmolive, and Schlumberger. We sold ADP, Cerner, and Colgate as they approached our estimate of intrinsic value, and Cisco due to better reward-to-risk opportunities. We sold Schlumberger due to a mistaken investment thesis as outlined above.
Outlook
Our investment process is characterized by bottom-up, fundamental research and a long-term investment time horizon. The nature of the process leads to a lower-turnover portfolio in which sector positioning is the result of stock selection. The Fund ended the year with overweight positions in the communication services, healthcare, industrials, and financials sectors and underweight positions in the information technology, consumer staples, and consumer discretionary sectors. We did not own positions in the real estate, energy, materials, or utilities sectors.
Top Ten Holdings as of September 31, 2022
| | | | | | | | |
| | |
| Security Name | | % of
Net Assets | |
| | 1 | | | Amazon.com, Inc. | | | 6.14 | % |
| | 2 | | | Visa, Inc., Class A | | | 6.11 | |
| | 3 | | | Microsoft Corp. | | | 5.16 | |
| | 4 | | | Boeing Co. (The) | | | 4.41 | |
| | 5 | | | Meta Platforms, Inc., Class A | | | 4.24 | |
| | 6 | | | NVIDIA Corp. | | | 4.11 | |
| | 7 | | | Monster Beverage Corp. | | | 3.94 | |
| | 8 | | | Autodesk, Inc. | | | 3.75 | |
| | 9 | | | Alphabet, Inc., Class A | | | 3.70 | |
| | 10 | | | Oracle Corp. | | | 3.67 | |
The portfolio is actively managed and holdings are subject to change. There is no guarantee the Fund continues to invest in the securities referenced. The holdings listed exclude any temporary cash investments, are presented on an individual security basis and do not represent holdings of the issuer.
Hypothetical Growth of $100,000 Investment in Class Y Shares3
September 30, 2012 through September 30, 2022
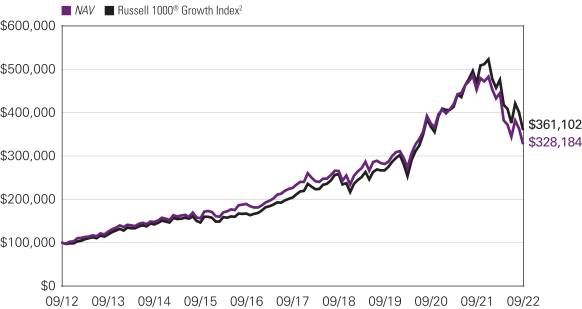
17 |
Average Annual Total Returns — September 30, 20223
| | | | | | | | | | | | | | | | | | | | | | | | |
| | | | | | |
| | | | | | | | | | | | Life of
Class N | | | Expense Ratios4 | |
| | | 1 Year | | | 5 Years | | | 10 Years | | | Gross | | | Net | |
| | | | | | | |
| Class Y | | | | | | | | | | | | | | | | | | | | | | | | |
| NAV | | | -27.29 | % | | | 7.77 | % | | | 12.62 | % | | | — | | | | 0.64 | % | | | 0.64 | % |
| | | | | | | |
| Class A | | | | | | | | | | | | | | | | | | | | | | | | |
| NAV | | | -27.48 | | | | 7.50 | | | | 12.35 | | | | — | | | | 0.89 | | | | 0.89 | |
| With 5.75% Maximum Sales Charge | | | -31.66 | | | | 6.23 | | | | 11.68 | | | | — | | | | | | | | | |
| | | | | | | |
| Class C | | | | | | | | | | | | | | | | | | | | | | | | |
| NAV | | | -28.05 | | | | 6.69 | | | | 11.67 | | | | — | | | | 1.63 | | | | 1.63 | |
| With CDSC1 | | | -28.73 | | | | 6.69 | | | | 11.67 | | | | — | | | | | | | | | |
| | | | | | | |
| Class N (Inception 2/1/13) | | | | | | | | | | | | | | | | | | | | | | | | |
| NAV | | | -27.25 | | | | 7.85 | | | | — | | | | 11.91 | | | | 0.56 | | | | 0.56 | |
| | | | | | | |
| Comparative Performance | | | | | | | | | | | | | | | | | | | | | | | | |
| Russell 1000® Growth Index2 | | | -22.59 | | | | 12.17 | | | | 13.70 | | | | 13.71 | | | | | | | | | |
Performance data shown represents past performance and is no guarantee of, and not necessarily indicative of, future results. Total return and value will vary, and you may have a gain or loss when shares are sold. Current performance may be lower or higher than quoted. For most recent month-end performance, visit im.natixis.com. Performance for other share classes will be greater or less than shown based on differences in fees and sales charges. You may not invest directly in an index. Performance for periods less than one year is cumulative, not annualized. Returns reflect changes in share price and reinvestment of dividends and capital gains, if any. The table(s) do not reflect taxes shareholders might owe on any fund distributions or when they redeem their shares.
| 1 | Performance for Class C shares assumes a 1% contingent deferred sales charge (“CDSC”) applied when you sell shares within one year of purchase. |
| 2 | Russell 1000® Growth Index is an unmanaged index that measures the performance of the large-cap growth segment of the U.S. equity universe. It includes those Russell 1000® Index companies with higher price-to-book ratios and higher forecasted growth values. |
| 3 | Fund performance has been increased by fee waivers and/or expense reimbursements, if any, without which performance would have been lower. |
| 4 | Expense ratios are as shown in the Fund’s prospectus in effect as of the date of this report. The expense ratios for the current reporting period can be found in the Financial Highlights section of this report under Ratios to Average Net Assets. Net expenses reflect contractual expense limitations set to expire on 1/31/23. When a Fund’s expenses are below the limitation, gross and net expense ratios will be the same. See Note 6 of the Notes to Financial Statements for more information about the Fund’s expense limitations. |
| 18
LOOMIS SAYLES INTERMEDIATE DURATION BOND FUND
| | |
| |
| Managers | | Symbols |
| |
| Daniel Conklin, CFA® | | Class A LSDRX |
| |
| Christopher T. Harms | | Class C LSCDX |
| |
| Clifton V. Rowe, CFA® | | Class N LSDNX |
| |
| | Class Y LSDIX |
| |
| Loomis, Sayles & Company, L.P. | | |
Investment Goal
The Fund seeks above-average total return through a combination of current income and capital appreciation.
Market Conditions
The fixed-income markets experienced significant, broad-based weakness in the 12-month period that ended on September 30, 2022. Inflation, which had already been increasing throughout 2021, took another leg higher in February 2022 after Russia’s invasion of Ukraine created additional supply-chain pressures and led to a spike in commodity prices. Consumer price inflation remained elevated long after the conflict began. Inflation has seemingly peaked at 9.1% in June, though has yet to meaningfully recover.
The U.S. Federal Reserve (Fed) responded with an aggressive series of interest-rate increases, bringing its benchmark fed funds rate to a range of 3.0% to 3.25% from 0% to 0.25% at the start of 2022. This marked the largest move in such a short interval since 1980. Perhaps even more important for the markets, investors continued to ratchet up their expectations for the “terminal rate” in 2023; or in other words, the level at which the Fed was likely to stop raising rates.
Tighter Fed policy not only led to a rise in prevailing yields, but also fueled an increase in investors’ aversion to risk more generally. As a result, more volatile asset categories that trade based on their yield advantage (or “spread”) over Treasuries faced an added headwind.
US Treasuries endured one of their worst stretches of performance in over 40 years. The two-year note, which is more sensitive to Fed policy shifts than other portions of the yield curve, soared from 0.28% to 4.22% over the course of the 12-month period (as its price fell). Longer-term bonds also lost ground, but to a lesser extent: the yield on the 10-year issue climbed from 1.52% at the start of the period to 3.83% on September 30, 2022.
One result of these moves was that the yield curve inverted significantly (meaning that short-term yields traded above those on longer-term debt). In late September, in fact, the yield curve moved to its largest inversion since 1982.
Investment-grade corporate bonds lagged considerably due to both the increase in prevailing yields and rising yield spreads (particularly for lower-quality issues in the category). Notably, major corporate bond indexes fell to levels last seen in 2009 during the immediate aftermath of the Global Financial Crisis. The yield on the ICE BofA US Corporate Index reached 5.75% in the final week of September — another level not seen since 2009.1
Amidst rising inflation, geopolitical instability, and a broad selloff in rates and risk markets, securitized credit markets have generally produced negative total and excess returns over the past 12 months. Down in credit collateralized loan obligations (CLOs) have suffered the most as prices on underlying bank loans have dropped significantly. Sectors like consumer asset-backed securities (ABS) with lower interest rate sensitivity and less direct impact from geopolitical instability have underperformed less. Sectors like commercial ABS, namely aircraft, have been negatively impacted. Pockets of the commercial mortgage-backed securities (CMBS) market have held in relatively well amidst a longer-term recovery from Covid-19 related shocks. Senior tranches of residential mortgage-backed securities (RMBS) have provided positive excess returns while subordinates have sold off. Agency mortgage-backed securities (MBS) produced significantly negative excess returns versus US Treasurys. Agency MBS has experienced massive interest rate volatility and the impact of concerns related to quantitative tightening.
Performance Results
For the 12 months ended September 30, 2022, Class Y shares of Loomis Sayles Intermediate Duration Bond Fund returned-10.76% at net asset value. The Fund underperformed its benchmark, the Bloomberg U.S. Intermediate Government/Credit Bond Index, which returned -10.14%.
Explanation of Fund Performance
The Fund’s positioning along the yield curve (which depicts the relationship among bond yields across the maturity spectrum) and stance with respect to duration and corresponding interest rate sensitivity led positive contributions to relative performance during the period. Specifically, the Fund was underweight the short end of the curve as the Fed raised its benchmark overnight lending rate.
19 |
Within corporate bonds, holdings within the electric, transportation and technology industries contributed positively to performance. The Fund’s holdings of cash and cash equivalents also contributed to results given the weakness in bond markets.
On the downside, the Fund favored credit-oriented sectors such as corporate bonds and securitized assets which trade at a yield spread relative to US Treasuries. As credit spreads widened over the period, these allocations weighed on results. The Fund’s underweight to and security selection within government- related securities also hindered results.
Outlook
The Fed continued to show resolve in the face of persistent inflation pressures and tight labor markets, hiking its benchmark overnight lending rate by another 75 basis points both in July and September. The Fed has tightened by 300 basis points year-to-date, with another 100 basis points currently priced in by year-end. Despite a brief rally in bond prices in July, rates rose once again in response to decidedly hawkish Fed forward guidance and a September inflation report that surprised to the upside. The September dot plot displaying Fed Open Market Committee members’ expectations for fed funds projects a median peak rate of 4.675% by early 2023, exceeding prior peak pricing by about 25 basis points. We ended the quarter with an inverted yield curve and 10-Year Treasuries briefly hitting 4.0%.
We see that the Fed has been successful in tightening financial conditions to slow the economy down and cool inflation. While we wait for better news on inflation, we acknowledge a growing risk that the Fed overshoots and misses the elusive “soft landing”. Global growth is threatened by the energy crisis in Europe, and by central banks who are now also tightening policy in response to growing inflationary pressures. Additionally, the Russia-Ukraine conflict continues to escalate and contribute to market volatility and uncertainty.
We believe we are in the later phases of the credit cycle2, as shown by the significant spread widening that has occurred over the past three quarters, as well as the significant retracement of equity market indices. Government, corporate and consumer balance sheets entered this part of the cycle in a strong position, but are showing some strains from higher inflation, tightening credit conditions and greater economic uncertainty.
We continue to favor spread sectors, such as corporate bonds and securitized assets. We have increased risk exposure primarily through corporate bonds as we continue to find attractively priced new issues with favorable concessions.
We are still overweight both agency and non-agency commercial mortgage-backed securities, particularly senior parts of the capital stack.
Intermediate and short duration strategies are still focused on opportunities with limited prepayment risk.
We continue to favor asset-backed securities in the front end of the yield curve, particularly those backed by consumer-related collateral such as autos and credit card receivables.
We continue to follow our process of building diversified exposures by asset class, industry and issuers.
| 1 | Source: Federal Reserve Bank of St. Louis Economic Database |
| 2 | A credit cycle is a cyclical pattern that follows credit availability and corporate health |
| 20
LOOMIS SAYLES INTERMEDIATE DURATION BOND FUND
Hypothetical Growth of $100,000 Investment in Class Y Shares1,4
September 30, 2012 through September 30, 2022
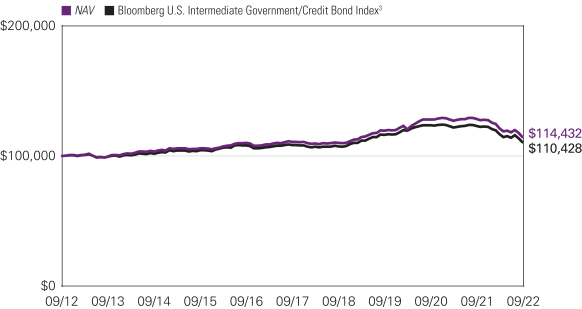
21 |
Average Annual Total Returns — September 30, 20224
| | | | | | | | | | | | | | | | | | | | | | | | |
| | | | | | |
| | | | | | | | | | | | Life of Class N | | | Expense Ratios5 | |
| | | 1 Year | | | 5 Years | | | 10 Years | | | Gross | | | Net | |
| | | |
| Class Y1 | | | | | | | | | |
| NAV | | | -10.76 | % | | | 0.67 | % | | | 1.36 | % | | | — | | | | 0.45 | % | | | 0.40 | % |
| | | | | | | |
| Class A1 | | | | | | | | | | | | | | | | | | | | | | | | |
| NAV | | | -10.98 | | | | 0.41 | | | | 1.10 | | | | — | | | | 0.70 | | | | 0.65 | |
| With 4.25% Maximum Sales Charge | | | -14.77 | | | | -0.46 | | | | 0.66 | | | | — | | | | | | | | | |
| | | | | | | |
| Class C (Inception 8/31/16)1 | | | | | | | | | | | | | | | | | | | | | | | | |
| NAV | | | -11.65 | | | | -0.35 | | | | 0.47 | | | | — | | | | 1.45 | | | | 1.40 | |
| With CDSC2 | | | -12.52 | | | | -0.35 | | | | 0.47 | | | | — | | | | | | | | | |
| | | | | | | |
| Class N (Inception 2/01/19) | | -10.73 | | | — | | | — | | | 0.56 | | | 0.38 | | | 0.35 | |
| | | |
| Comparative Performance | | | | | | | | | |
| Bloomberg U.S. Intermediate Government/Credit Bond Index3 | | | -10.14 | | | | 0.38 | | | | 1.00 | | | | 0.16 | | | | | | | | | |
Performance data shown represents past performance and is no guarantee of, and not necessarily indicative of, future results. Total return and value will vary, and you may have a gain or loss when shares are sold. Current performance may be lower or higher than quoted. For most recent month-end performance, visit im.natixis.com. Performance for other share classes will be greater or less than shown based on differences in fees and sales charges. You may not invest directly in an index. Performance for periods less than one year is cumulative, not annualized. Returns reflect changes in share price and reinvestment of dividends and capital gains, if any. The table(s) do not reflect taxes shareholders might owe on any fund distributions or when they redeem their shares.
| 1 | As of August 31, 2016, the Fund’s Retail Class shares and Institutional Class shares were redesignated as Class A shares and Class Y shares, respectively. Accordingly, the returns shown in the table for Class A shares prior to August 31, 2016 are those of Retail Class shares, restated to reflect the sales loads of Class A shares, and the returns in the table for Class Y shares prior to August 31, 2016 are those of Institutional Class shares. Prior to the inception of Class C shares (August 31, 2016), performance is that of Retail Class shares, restated to reflect the higher net expenses and sales loads of Class C shares. |
| 2 | Class C shares performance assumes a 1% CDSC applied when you sell shares within one year of purchase. |
| 3 | Bloomberg U.S. Intermediate Government/Credit Bond Index includes securities in the intermediate maturity range within the Government and Credit Indices. The Government Index includes treasuries (i.e., public obligations of the U.S. Treasury that have remaining maturities of more than one year) and agencies (i.e., publicly issued debt of U.S. Government agencies, quasi-federal corporations, and corporate or foreign debt guaranteed by the U.S. Government). The Credit Index includes publicly issued U.S. corporate and foreign debentures and secured notes that meet specified maturity, liquidity, and quality requirements. |
| 4 | Fund performance has been increased by fee waivers and/or expense reimbursements, if any, without which performance would have been lower. |
| 5 | Expense ratios are as shown in the Fund’s prospectus in effect as of the date of this report. The expense ratios for the current reporting period can be found in the Financial Highlights section of this report under Ratios to Average Net Assets. Net expenses reflect contractual expense limitations set to expire on 1/31/23. When a Fund’s expenses are below the limitation, gross and net expense ratios will be the same. See Note 6 of the Notes to Financial Statements for more information about the Fund’s expense limitations. |
| 22
LOOMIS SAYLES LIMITED TERM GOVERNMENT AND AGENCY FUND
| | |
| |
| Managers | | Symbols |
| |
| Daniel Conklin, CFA® | | Class A NEFLX |
| |
| Christopher T. Harms | | Class C NECLX |
| |
| Clifton V. Rowe, CFA® | | Class N LGANX |
| |
| | Class Y NELYX |
| |
| Loomis, Sayles & Company, L.P. | | |
Investment Goal
The Fund seeks high current return consistent with preservation of capital.
Market Conditions
The fixed-income markets experienced significant, broad-based weakness in the 12-month period that ended on September 30, 2022. Inflation, which had already been increasing throughout 2021, took another leg higher in February 2022 after Russia’s invasion of Ukraine created additional supply-chain pressures and led to a spike in commodity prices. Consumer price inflation remained elevated long after the conflict began. Inflation has seemingly peaked at 9.1% in June, though still has yet to meaningfully recover.
The U.S. Federal Reserve (Fed) responded with an aggressive series of interest-rate increases, bringing its benchmark fed funds rate to a range of 3.0% to 3.25% from 0% to 0.25% at the start of 2022. This marked the largest move in such a short interval since 1980. Perhaps even more important for the markets, investors continued to ratchet up their expectations for the “terminal rate” in 2023; or in other words, the level at which the Fed was likely to stop raising rates.
Tighter Fed policy not only led to a rise in prevailing yields, but also fueled an increase in investors’ aversion to risk more generally. As a result, more volatile asset categories that trade based on their yield advantage (or “spread”) over Treasuries faced an additional headwind.
US Treasuries endured one of their worst stretches of performance in over 40 years. The two-year note, which is more sensitive to Fed policy shifts than other portions of the yield curve, soared from 0.28% to 4.22% over the course of the 12-month period (as its price fell). Longer-term bonds also lost ground, but to a lesser extent: the yield on the 10-year issue climbed from 1.52% at the start of the period to 3.83% on September 30, 2022.
One result of these moves was that the yield curve inverted significantly (meaning that short-term yields traded above those on longer-term debt). In late September, in fact, the yield curve moved to its largest inversion since 1982.
Amidst rising inflation, geopolitical instability, and a broad selloff in rates and risk markets, securitized credit markets have generally produced negative total and excess returns over the past 12 months. Down in credit collateralized loan obligations (CLOs) have suffered the most as prices on underlying bank loans have dropped significantly. Sectors like consumer asset-backed securities (ABS) with lower interest rate sensitivity and less direct impact from geopolitical instability have underperformed less. Sectors like commercial ABS, namely aircraft, have been negatively impacted. Pockets of the commercial mortgage-backed securities (CMBS) market have held in relatively well amidst a longer-term recovery from Covid-19 related shocks. Senior tranches of residential mortgage-backed securities (RMBS) have provided positive excess returns while subordinates have sold off. Agency mortgage-backed securities (MBS) produced significantly negative excess returns versus US Treasurys. Agency MBS has experienced massive interest rate volatility and the impact of concerns related to quantitative tightening.
Performance Results
For the 12 months ended September 30, 2022, Class Y shares of Loomis Sayles Limited Term Government and Agency Fund returned -5.42%. The Fund outperformed its benchmark, the Bloomberg U.S. 1-5 Year Government Bond Index, which returned -7.03%.
Explanation of Fund Performance
The Fund’s positioning along the yield curve (which depicts the relationship among bond yields across the maturity spectrum) and stance with respect to duration and corresponding interest rate sensitivity led positive contributions to relative performance, as the Fund was underweight duration as interest rates rose over the period. Security selection within non-agency commercial mortgage-backed securities (CMBS) also contributed to performance. Finally, issue selection within agency pass-through mortgage-backed securities (MBS) and auto-backed receivables within asset-backed securities (ABS) was positive during the period.
23 |
Positioning with respect to US Treasuries detracted from results due to an underweight allocation relative to the benchmark as well as adverse issue selection. Issue selection in student loans within ABS hindered performance as well during the period. Finally, holdings within agency CMBS detracted from results.
Outlook
Agency mortgage-backed security (MBS) spreads (the difference in yield between agency MBS and Treasuries of similar maturity) are trending higher than their longer-term averages. We continue to favor MBS sectors less likely to face refinancing and extension risk, such as low loan balance mortgages and home equity conversion mortgages. Within the commercial real estate sector, we have focused on agency commercial mortgage-backed security (CMBS) opportunities. Our non-agency securitized exposures remain steady, favoring asset-backed securities (ABS) over CMBS.
Hypothetical Growth of $100,000 Investment in Class Y Shares3
September 30, 2012 through September 30, 2022
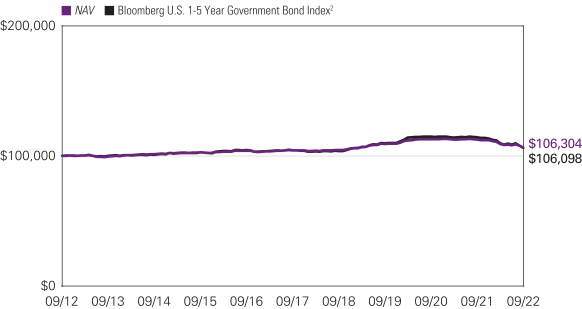
See notes to charts on page 25.
| 24
LOOMIS SAYLES LIMITED TERM GOVERNMENT AND AGENCY FUND
Average Annual Total Returns — September 30, 20223
| | | | | | | | | | | | | | | | | | | | | | | | |
| | | | | | |
| | | | | | | | | | | | Life of Class N | | | Expense Ratios4 | |
| | | 1 Year | | | 5 Years | | | 10 Years | | | Gross | | | Net | |
| | | |
| Class Y | | | | | | | | | |
| NAV | | | -5.42 | % | | | 0.41 | % | | | 0.61 | % | | | — | | | | 0.49 | % | | | 0.45 | % |
| | | | | | | |
| Class A | | | | | | | | | | | | | | | | | | | | | | | | |
| NAV | | | -5.75 | | | | 0.16 | | | | 0.35 | | | | — | | | | 0.73 | | | | 0.70 | |
| With 2.25% Maximum Sales Charge | | | -7.86 | | | | -0.30 | | | | 0.12 | | | | — | | | | | | | | | |
| | | | | | | |
| Class C | | | | | | | | | | | | | | | | | | | | | | | | |
| NAV | | | -6.43 | | | | -0.60 | | | | -0.25 | | | | — | | | | 1.49 | | | | 1.45 | |
| With CDSC1 | | | -7.36 | | | | -0.60 | | | | -0.25 | | | | — | | | | | | | | | |
| | | | | | |
| Class N (Inception 2/1/17) | | | | | | | | | | | | | | | | | | | | | |
| NAV | | | -5.45 | | | | 0.47 | | | | — | | | | 0.61 | | | | 0.41 | | | | 0.40 | |
| | | |
| Comparative Performance | | | | | | | | | |
| Bloomberg U.S. 1-5 Year Government Bond Index2 | | | -7.03 | | | | 0.36 | | | | 0.59 | | | | 0.48 | | | | | | | | | |
Performance data shown represents past performance and is no guarantee of, and not necessarily indicative of, future results. Total return and value will vary, and you may have a gain or loss when shares are sold. Current performance may be lower or higher than quoted. For most recent month-end performance, visit im.natixis.com. Performance for other share classes will be greater or less than shown based on differences in fees and sales charges. You may not invest directly in an index. Performance for periods less than one year is cumulative, not annualized. Returns reflect changes in share price and reinvestment of dividends and capital gains, if any. The table(s) do not reflect taxes shareholders might owe on any fund distributions or when they redeem their shares.
| 1 | Class C shares performance assumes a 1% CDSC applied when you sell shares within one year of purchase. |
| 2 | Bloomberg U.S. 1-5 Year Government Bond Index is a subindex of the Bloomberg U.S. Government Index, which is comprised of the Bloomberg U.S. Treasury and U.S. Agency Indices. The Bloomberg U.S. Government Index includes Treasuries (public obligations of the U.S. Treasury that have remaining maturities of more than one year) and U.S. agency debentures (publicly issued debt of U.S. government agencies, quasi-federal corporations, and corporate or foreign debt guaranteed by the U.S. government). The Bloomberg U.S. Government Index is a component of the Bloomberg U.S. Government/Credit Index and the Bloomberg U.S. Aggregate Bond Index. |
| 3 | Fund performance has been increased by fee waivers and/or expense reimbursements, if any, without which performance would have been lower. |
| 4 | Expense ratios are as shown in the Fund’s prospectus in effect as of the date of this report. The expense ratios for the current reporting period can be found in the Financial Highlights section of this report under Ratios to Average Net Assets. Net expenses reflect contractual expense limitations set to expire on 1/31/23. When a Fund’s expenses are below the limitation, gross and net expense ratios will be the same. See Note 6 of the Notes to Financial Statements for more information about the Fund’s expense limitations. |
25 |
ADDITIONAL INFORMATION
The views expressed in this report reflect those of the portfolio managers as of the dates indicated. The managers’ views are subject to change at any time without notice based on changes in market or other conditions. References to specific securities or industries should not be regarded as investment advice. Because the Funds are actively managed, there is no assurance that they will continue to invest in the securities or industries mentioned.
All investing involves risk, including the risk of loss. There is no assurance that any investment will meet its performance objectives or that losses will be avoided.
ADDITIONAL INDEX INFORMATION
This document may contain references to third party copyrights, indexes, and trademarks, each of which is the property of its respective owner. Such owner is not affiliated with Natixis Investment Managers or any of its related or affiliated companies (collectively “Natixis Affiliates”) and does not sponsor, endorse or participate in the provision of any Natixis Affiliates services, funds or other financial products.
The index information contained herein is derived from third parties and is provided on an “as is” basis. The user of this information assumes the entire risk of use of this information. Each of the third party entities involved in compiling, computing or creating index information disclaims all warranties (including, without limitation, any warranties of originality, accuracy, completeness, timeliness, non-infringement, merchantability and fitness for a particular purpose) with respect to such information.
PROXY VOTING INFORMATION
A description of the Natixis Funds’ proxy voting policies and procedures is available without charge, upon request, by calling Natixis Funds at 800-225-5478; on the Fund’s website at im.natixis.com; and on the Securities and Exchange Commission’s (“SEC’s”) website at www.sec.gov. Information regarding how the Fund voted proxies relating to portfolio securities during the most recent 12-month period ended June 30 is available through the Fund’s website and the SEC’s website.
QUARTERLY PORTFOLIO SCHEDULES
The Natixis Funds file a complete schedule of portfolio holdings with the SEC for the first and third quarters of each fiscal year as an exhibit to its reports on Form N-PORT. The Funds’ Form N-PORT reports are available on the SEC’s website at www.sec.gov. First and third quarter schedules of portfolio holdings are also available at im.natixis.com/funddocuments. A hard copy may be requested from the Fund at no charge by calling 800-225-5478.
CFA® and Chartered Financial Analyst® are registered trademarks owned by the CFA Institute.
| 26
UNDERSTANDING FUND EXPENSES
As a mutual fund shareholder, you incur different costs: transaction costs, including sales charges (loads) on purchases and contingent deferred sales charges on redemptions; and ongoing costs, including management fees, distribution and/or service fees (12b-1 fees), and other fund expenses. Certain exemptions may apply. These costs are described in more detail in the Fund’s prospectuses. The following examples are intended to help you understand the ongoing costs of investing in the Fund and help you compare these with the ongoing costs of investing in other mutual funds.
The first line in the table of each class of Fund shares shows the actual account values and actual fund expenses you would have paid on a $1,000 investment in the Fund from April 1, 2022 through September 30, 2022. To estimate the expenses you paid over the period, simply divide your account value by $1,000 (for example $8,600 account value divided by $1,000 = 8.6) and multiply the result by the number in the Expenses Paid During Period column as shown below for your class.
The second line in the table of each class of Fund shares provides information about hypothetical account values and hypothetical expenses based on the Fund’s actual expense ratios and an assumed rate of return of 5% per year before expenses, which is not the Fund’s actual return. The hypothetical account values and expenses may not be used to estimate the actual ending account balance or expenses you paid on your investment for the period. You may use this information to compare the ongoing costs of investing in the Fund to other funds. To do so, compare this 5% hypothetical example with the 5% hypothetical examples that appear in the shareholder reports of the other funds.
Please note that the expenses shown reflect ongoing costs only, and do not include any transaction costs, such as sales charges. Therefore, the second line in the table of the fund is useful in comparing ongoing costs only, and will not help you determine the relative costs of owning different funds. If transaction costs were included, total costs would be higher.
| | | | | | | | | | | | |
| LOOMIS SAYLES CORE PLUS BOND FUND | | BEGINNING
ACCOUNT VALUE
4/1/2022 | | | ENDING
ACCOUNT VALUE
9/30/2022 | | | EXPENSES PAID
DURING PERIOD*
4/1/2022 – 9/30/2022 | |
| Class A | | | | | | | | | | | | |
| Actual | | | $1,000.00 | | | | $899.30 | | | | $3.52 | |
| Hypothetical (5% return before expenses) | | | $1,000.00 | | | | $1,021.36 | | | | $3.75 | |
| Class C | | | | | | | | | | | | |
| Actual | | | $1,000.00 | | | | $896.60 | | | | $7.08 | |
| Hypothetical (5% return before expenses) | | | $1,000.00 | | | | $1,017.60 | | | | $7.54 | |
| Class N | | | | | | | | | | | | |
| Actual | | | $1,000.00 | | | | $901.10 | | | | $1.86 | |
| Hypothetical (5% return before expenses) | | | $1,000.00 | | | | $1,023.11 | | | | $1.98 | |
| Class Y | | | | | | | | | | | | |
| Actual | | | $1,000.00 | | | | $900.60 | | | | $2.33 | |
| Hypothetical (5% return before expenses) | | | $1,000.00 | | | | $1,022.61 | | | | $2.48 | |
| * | Expenses are equal to the Fund’s annualized expense ratio (after waiver/reimbursement): 0.74%, 1.49%, 0.39% and 0.49% for Class A, C, N and Y, respectively, multiplied by the average account value over the period, multiplied by the number of days in the most recent fiscal half-year (183), divided by 365 (to reflect the half-year period). |
27 |
| | | | | | | | | | | | |
| LOOMIS SAYLES CREDIT INCOME FUND | | BEGINNING
ACCOUNT VALUE
4/1/2022 | | | ENDING
ACCOUNT VALUE
9/30/2022 | | | EXPENSES PAID
DURING PERIOD*
4/1/2022 – 9/30/2022 | |
| Class A | | | | | | | | | | | | |
| Actual | | | $1,000.00 | | | | $897.20 | | | | $3.90 | |
| Hypothetical (5% return before expenses) | | | $1,000.00 | | | | $1,020.96 | | | | $4.15 | |
| Class C | | | | | | | | | | | | |
| Actual | | | $1,000.00 | | | | $893.60 | | | | $7.45 | |
| Hypothetical (5% return before expenses) | | | $1,000.00 | | | | $1,017.20 | | | | $7.94 | |
| Class N | | | | | | | | | | | | |
| Actual | | | $1,000.00 | | | | $898.50 | | | | $2.47 | |
| Hypothetical (5% return before expenses) | | | $1,000.00 | | | | $1,022.46 | | | | $2.64 | |
| Class Y | | | | | | | | | | | | |
| Actual | | | $1,000.00 | | | | $898.20 | | | | $2.71 | |
| Hypothetical (5% return before expenses) | | | $1,000.00 | | | | $1,022.21 | | | | $2.89 | |
| * | Expenses are equal to the Fund’s annualized expense ratio (after waiver/reimbursement): 0.82%, 1.57%, 0.52% and 0.57% for Class A, C, N and Y, respectively, multiplied by the average account value over the period, multiplied by the number of days in the most recent fiscal half-year (183), divided by 365 (to reflect the half-year period). |
| | | | | | | | | | | | |
| LOOMIS SAYLES GLOBAL ALLOCATION FUND | | BEGINNING
ACCOUNT VALUE
4/1/2022 | | | ENDING
ACCOUNT VALUE
9/30/2022 | | | EXPENSES PAID
DURING PERIOD*
4/1/2022 – 9/30/2022 | |
| Class A | | | | | | | | | | | | |
| Actual | | | $1,000.00 | | | | $788.10 | | | | $5.15 | |
| Hypothetical (5% return before expenses) | | | $1,000.00 | | | | $1,019.30 | | | | $5.82 | |
| Class C | | | | | | | | | | | | |
| Actual | | | $1,000.00 | | | | $784.90 | | | | $8.50 | |
| Hypothetical (5% return before expenses) | | | $1,000.00 | | | | $1,015.54 | | | | $9.60 | |
| Class N | | | | | | | | | | | | |
| Actual | | | $1,000.00 | | | | $789.20 | | | | $3.63 | |
| Hypothetical (5% return before expenses) | | | $1,000.00 | | | | $1,021.01 | | | | $4.10 | |
| Class Y | | | | | | | | | | | | |
| Actual | | | $1,000.00 | | | | $789.20 | | | | $4.04 | |
| Hypothetical (5% return before expenses) | | | $1,000.00 | | | | $1,020.56 | | | | $4.56 | |
| * | Expenses are equal to the Fund’s annualized expense ratio: 1.15%, 1.90%, 0.81% and 0.90% for Class A, C, N and Y, respectively, multiplied by the average account value over the period, multiplied by the number of days in the most recent fiscal half-year (183), divided by 365 (to reflect the half-year period). |
| 28
| | | | | | | | | | | | |
| LOOMIS SAYLES GROWTH FUND | | BEGINNING
ACCOUNT VALUE
4/1/2022 | | | ENDING
ACCOUNT VALUE
9/30/2022 | | | EXPENSES PAID
DURING PERIOD*
4/1/2022 – 9/30/2022 | |
| Class A | | | | | | | | | | | | |
| Actual | | | $1,000.00 | | | | $738.00 | | | | $3.96 | |
| Hypothetical (5% return before expenses) | | | $1,000.00 | | | | $1,020.51 | | | | $4.61 | |
| Class C | | | | | | | | | | | | |
| Actual | | | $1,000.00 | | | | $735.00 | | | | $7.22 | |
| Hypothetical (5% return before expenses) | | | $1,000.00 | | | | $1,016.75 | | | | $8.39 | |
| Class N | | | | | | | | | | | | |
| Actual | | | $1,000.00 | | | | $739.00 | | | | $2.48 | |
| Hypothetical (5% return before expenses) | | | $1,000.00 | | | | $1,022.21 | | | | $2.89 | |
| Class Y | | | | | | | | | | | | |
| Actual | | | $1,000.00 | | | | $738.90 | | | | $2.88 | |
| Hypothetical (5% return before expenses) | | | $1,000.00 | | | | $1,021.76 | | | | $3.35 | |
| * | Expenses are equal to the Fund’s annualized expense ratio: 0.91%, 1.66%, 0.57% and 0.66% for Class A, C, N and Y, respectively, multiplied by the average account value over the period, multiplied by the number of days in the most recent fiscal half-year (183), divided by 365 (to reflect the half-year period). |
| | | | | | | | | | | | |
| LOOMIS SAYLES INTERMEDIATE DURATION BOND FUND | | BEGINNING
ACCOUNT VALUE
4/1/2022 | | | ENDING
ACCOUNT VALUE
9/30/2022 | | | EXPENSES PAID
DURING PERIOD*
4/1/2022 – 9/30/2022 | |
| Class A | | | | | | | | | | | | |
| Actual | | | $1,000.00 | | | | $942.80 | | | | $3.17 | |
| Hypothetical (5% return before expenses) | | | $1,000.00 | | | | $1,021.81 | | | | $3.29 | |
| Class C | | | | | | | | | | | | |
| Actual | | | $1,000.00 | | | | $940.10 | | | | $6.81 | |
| Hypothetical (5% return before expenses) | | | $1,000.00 | | | | $1,018.05 | | | | $7.08 | |
| Class N | | | | | | | | | | | | |
| Actual | | | $1,000.00 | | | | $944.20 | | | | $1.71 | |
| Hypothetical (5% return before expenses) | | | $1,000.00 | | | | $1,023.31 | | | | $1.78 | |
| Class Y | | | | | | | | | | | | |
| Actual | | | $1,000.00 | | | | $945.00 | | | | $1.95 | |
| Hypothetical (5% return before expenses) | | | $1,000.00 | | | | $1,023.06 | | | | $2.03 | |
| * | Expenses are equal to the Fund’s annualized expense ratio (after waiver/reimbursement): 0.65%, 1.40%, 0.35% and 0.40% for Class A, C, N and Y, respectively, multiplied by the average account value over the period, multiplied by the number of days in the most recent fiscal half-year (183), divided by 365 (to reflect the half-year period). |
29 |
| | | | | | | | | | | | |
| LOOMIS SAYLES LIMITED TERM GOVERNMENT AND AGENCY FUND | | BEGINNING
ACCOUNT VALUE
4/1/2022 | | | ENDING
ACCOUNT VALUE
9/30/2022 | | | EXPENSES PAID
DURING PERIOD*
4/1/2022 – 9/30/2022 | |
| Class A | | | | | | | | | | | | |
| Actual | | | $1,000.00 | | | | $972.00 | | | | $3.46 | |
| Hypothetical (5% return before expenses) | | | $1,000.00 | | | | $1,021.56 | | | | $3.55 | |
| Class C | | | | | | | | | | | | |
| Actual | | | $1,000.00 | | | | $968.40 | | | | $7.15 | |
| Hypothetical (5% return before expenses) | | | $1,000.00 | | | | $1,017.80 | | | | $7.33 | |
| Class N | | | | | | | | | | | | |
| Actual | | | $1,000.00 | | | | $973.60 | | | | $1.98 | |
| Hypothetical (5% return before expenses) | | | $1,000.00 | | | | $1,023.06 | | | | $2.03 | |
| Class Y | | | | | | | | | | | | |
| Actual | | | $1,000.00 | | | | $974.20 | | | | $2.23 | |
| Hypothetical (5% return before expenses) | | | $1,000.00 | | | | $1,022.81 | | | | $2.28 | |
| * | Expenses are equal to the Fund’s annualized expense ratio (after waiver/reimbursement): 0.70%, 1.45%, 0.40% and 0.45% for Class A, C, N and Y, respectively, multiplied by the average account value over the period, multiplied by the number of days in the most recent fiscal half-year (183), divided by 365 (to reflect the half-year period). |
| 30
LOOMIS SAYLES CORE PLUS BOND FUND, LOOMIS SAYLES GLOBAL ALLOCATION FUND, LOOMIS SAYLES CREDIT INCOME FUND, LOOMIS SAYLES GROWTH FUND, LOOMIS SAYLES INTERMEDIATE DURATION BOND FUND AND LOOMIS SAYLES LIMITED TERM GOVERNMENT AND AGENCY FUND
BOARD APPROVAL OF THE EXISTING ADVISORY AGREEMENTS
The Board of Trustees of the Trusts (the “Board”), including the Independent Trustees, considers matters bearing on each Fund’s advisory agreement (collectively, the “Agreements”) at most of its meetings throughout the year. Each year, usually in the spring, the Contract Review Committee of the Board meets to review the Agreements to determine whether to recommend that the full Board approve the continuation of the Agreements, typically for an additional one-year period. This meeting typically includes all the Independent Trustees, including the Trustees who do not serve on the Contract Review Committee. After the Contract Review Committee has made its recommendation, the full Board, including the Independent Trustees, determines whether to approve the continuation of the Agreements at its June board meeting.
In connection with these meetings, the Trustees receive materials that the Funds’ investment adviser and Loomis Sayles Core Plus Bond Fund’s advisory administrator (the “Advisers”) believe to be reasonably necessary for the Trustees to evaluate the Agreements. These materials generally include, among other items, (i) information on the investment performance of the Funds and the performance of peer groups of funds and the Funds’ performance benchmarks, (ii) information on the Funds’ advisory fees and other expenses, including information comparing the Funds’ advisory fees to the fees charged to institutional accounts with similar strategies managed by the Advisers, if any, and to those of peer groups of funds and information about any applicable expense limitations and/or fee “breakpoints,” (iii) sales and redemption data in respect of the Funds, (iv) information about the profitability of the Agreements to the Advisers, including how profitability is determined by the Fund, and (v) information obtained through the completion by the Advisers of a questionnaire distributed on behalf of the Trustees. The Board, including the Independent Trustees, also considers other matters such as (i) each Fund’s investment objective and strategies and the size, education and experience of the Advisers’ investment staffs and their use of technology, external research and trading cost measurement tools, (ii) arrangements in respect of the distribution of the Funds’ shares and the related costs, (iii) the allocation of the Funds’ brokerage, if any, including, to the extent applicable, allocations to brokers affiliated with the Advisers and the use of “soft” commission dollars to pay for research and other similar services, (iv) the Advisers’ policies and procedures relating to, among other things, compliance, trading and best execution, proxy voting, liquidity and valuation, (v) information about amounts invested by the Funds’ portfolio managers in the Funds or in similar accounts that they manage and (vi) the general economic outlook with particular emphasis on the mutual fund industry. Throughout the process, the Trustees are afforded the opportunity to ask questions of and request additional materials from the Advisers.
In addition to the materials requested by the Trustees in connection with their annual consideration of the continuation of the Agreements, the Trustees receive materials in advance of each regular quarterly meeting of the Board that provide detailed information about the Funds’ investment performance and the fees charged to the Funds for advisory and other services. This information generally includes, where available, among other things, an internal performance rating for each Fund based on agreed-upon criteria, graphs showing each Fund’s performance and expense differentials against each Fund’s peer group/category of funds, total return information for various periods, third-party performance rankings for various periods comparing a Fund against similarly categorized funds, and performance ratings provided by a different third-party rating organization. The portfolio management team for each Fund or other representatives of the Advisers make periodic presentations to the Contract Review Committee and/or the full Board, and Funds identified as presenting possible performance concerns may be subject to more frequent Board or Committee presentations and reviews. In addition, the Trustees are periodically provided with detailed statistical information about each Fund’s portfolio. The Trustees also receive periodic updates between meetings, both at the Board and at the Committee level.
The Board most recently approved the continuation of the Agreements for a one-year period at its meeting held in June 2022. In considering whether to approve the continuation of the Agreements, the Board, including the Independent Trustees, did not identify any single factor as determinative. Individual Trustees may have evaluated the information presented differently from one another, giving different weights to various factors. Matters considered by the Trustees, including the Independent Trustees, in connection with their approval of the Agreements included, but were not limited to, the factors listed below.
The nature, extent and quality of the services provided to the Funds under the Agreements. The Trustees considered the nature, extent and quality of the services provided by the Advisers and their affiliates to the Funds and the resources dedicated to the Funds by the Advisers and their affiliates. The Trustees also considered their experience with other funds advised or sub-advised by the Advisers, as well as the affiliation between the Advisers and Natixis Investment Managers, LLC, whose affiliates provide investment advisory services to other funds in the Natixis family of funds.
The Trustees considered not only the advisory services provided by the Advisers to the Funds, but also the benefits to the Funds from the monitoring and oversight services provided by Natixis Advisors, LLC (“Natixis Advisors”). They also considered the
31 |
administrative and shareholder services provided by Natixis Advisors and its affiliates to the Funds. They also took into consideration increases in the services provided resulting from new regulatory requirements, such as new rules relating to the fair valuation of investments and the use of derivatives.
For each Fund, the Trustees also considered the benefits to shareholders of investing in a mutual fund that is part of a family of funds that offers shareholders the right to exchange shares of one type of fund for shares of another type of fund, and provides a variety of fund and shareholder services.
After reviewing these and related factors, the Trustees concluded, within the context of their overall conclusions regarding each of the Agreements, that the nature, extent and quality of services provided supported the renewal of the Agreements.
Investment performance of the Funds and the Advisers. As noted above, the Trustees received information about the performance of the Funds over various time periods, including information that compared the performance of the Funds to the performance of peer groups and categories of funds and the Funds’ respective performance benchmarks. The Trustees also received information about how comparative peer groups are constructed. In addition, the Trustees reviewed data prepared by an independent third party that analyzed the performance of the Funds using a variety of performance metrics, including metrics that measured the performance of the Funds on a risk adjusted basis.
The Board noted that, through December 31, 2021, each Fund’s one-, three- and five-year performance, stated as percentile rankings within categories selected by the independent third-party data provider, was as follows (where the best performance would be in the first percentile of its category):
| | | | | | | | | | | | |
| | | One-Year | | | Three-Year | | | Five-Year | |
| Loomis Sayles Core Plus Bond Fund | | | 89 | % | | | 48 | % | | | 38 | % |
| Loomis Sayles Credit Income Fund | | | 24 | % | | | N/A | | | | N/A | |
| Loomis Sayles Global Allocation Fund | | | 34 | % | | | 3 | % | | | 2 | % |
| Loomis Sayles Growth Fund | | | 68 | % | | | 78 | % | | | 70 | % |
| Loomis Sayles Intermediate Duration Bond Fund | | | 53 | % | | | 74 | % | | | 84 | % |
| Loomis Sayles Limited Term Government and Agency Fund | | | 48 | % | | | 53 | % | | | 44 | % |
In the case of a Fund that had performance that lagged that of a relevant category median as determined by the independent third party for certain (although not necessarily all) periods, the Board concluded that other factors relevant to performance supported renewal of the Agreements. These factors included one or more of the following: (1) that the underperformance was attributable, to a significant extent, to investment decisions (such as security selection or sector allocation) by the Advisers that were reasonable and consistent with the Fund’s investment objective and policies; (2) that the Fund’s more recent relative performance (i.e., for periods ending March 31, 2022) had improved; (3) that the Fund had outperformed its relevant performance benchmark for the one-year period ended December 31, 2021; and (4) that effective August 31, 2021, the Fund had been assigned to a different category by the independent third-party data provider, which has resulted in significantly improved relative performance and is expected to result in more relevant performance comparisons. The Board also considered information about the Funds’ more recent performance, including how that performance had been impacted by the Covid-19 crisis.
The Trustees also considered the Advisers’ performance and reputation generally, the performance of the fund family generally, and the historical responsiveness of the Advisers to Trustee concerns about performance and the willingness of the Advisers to take steps intended to improve performance.
After reviewing these and related factors, the Trustees concluded, within the context of their overall conclusions regarding each of the Agreements, that the performance of the Funds and the Advisers and/or other relevant factors supported the renewal of the Agreements.
The costs of the services to be provided and profits to be realized by the Advisers and their affiliates from their respective relationships with the Funds. The Trustees considered the fees charged to the Funds for advisory and administrative services as well as the total expense levels of the Funds. This information included comparisons (provided both by management and by an independent third party) of the Funds’ advisory fees and total expense levels to those of their peer groups and information about the advisory fees charged by the Advisers to comparable accounts (such as institutional separate accounts), as well as information about differences in such fees and the reasons for any such differences. In considering the fees charged to comparable accounts, the Trustees considered, among other things, management’s representations about the differences between managing mutual funds as compared to other types of accounts, including the additional resources required to effectively manage mutual fund assets, the greater regulatory costs associated with the management of such assets, and the entrepreneurial, regulatory and other risks associated with sponsoring and managing mutual funds. In evaluating each Fund’s advisory fee, the Trustees also took into account the demands, complexity and quality of the investment management of such Fund, as well as the need for the Advisers to offer competitive compensation and the potential need
| 32
to expend additional resources to the extent the Fund grows in size. The Trustees considered that over the past several years, management had demonstrated its intention to have competitive fee levels by making recommendations regarding reductions in advisory fee rates, implementation of advisory fee breakpoints and the institution of advisory fee waivers and expense limitations for various funds in the fund family. They noted that the Funds have expense limitations in place, and they considered the amounts waived or reimbursed by the Advisers for Loomis Sayles Credit Income Fund, Loomis Sayles Intermediate Duration Bond Fund, and Loomis Sayles Limited Term Government and Agency Fund under their respective expense limitation agreements. The Trustees also considered that the current expenses for Loomis Sayles Core Plus Bond Fund, Loomis Sayles Global Allocation Fund, and Loomis Sayles Growth Fund were below each Fund’s limitation. The Trustees also noted that the total advisory fee rate for each Fund was at or below the median of its peer group of funds.
The Trustees also considered the compensation directly or indirectly received by the Advisers and their affiliates from their relationships with the Funds. The Trustees reviewed information provided by management as to the profitability of the Advisers’ and their affiliates’ relationships with the Funds, and information about how expenses are determined and allocated for purposes of profitability calculations. They also reviewed information provided by management about the effect of distribution costs and changes in asset levels on Adviser profitability, including information regarding resources spent on distribution activities. When reviewing profitability, the Trustees also considered information about court cases in which adviser compensation or profitability were issues, the performance of the Funds, the expense levels of the Funds, whether the Advisers had implemented breakpoints and/or expense limitations with respect to such Funds and the overall profit margin of Natixis Investment Managers, LLC compared to that of certain other investment managers for which such data was available.
After reviewing these and related factors, the Trustees concluded, within the context of their overall conclusions regarding each of the Agreements, that the advisory fee charged to each of the Funds was fair and reasonable, and that the costs of these services generally and the related profitability of the Advisers and their affiliates in respect of their relationships with the Funds supported the renewal of the Agreements.
Economies of Scale. The Trustees considered the existence of any economies of scale in the provision of services by the Advisers and whether those economies are shared with the Funds through breakpoints in their investment advisory fees or other means, such as expense limitations. The Trustees also considered management’s explanation of the factors that are taken into account with respect to the implementation of breakpoints in investment advisory fees or expense limitations. With respect to economies of scale, the Trustees noted that each of Loomis Sayles Core Plus Bond Fund, Loomis Sayles Global Allocation Fund and Loomis Sayles Limited Term Government and Agency Fund had breakpoints in its advisory fee and that each of the Funds was subject to an expense limitation. In considering these issues, the Trustees also took note of the costs of the services provided (both on an absolute and on a relative basis) and the profitability to the Advisers and their affiliates of their relationships with the Funds, as discussed above. The Trustees also considered that the Funds have benefitted from the substantial reinvestment each Adviser has made into its business.
After reviewing these and related factors, the Trustees concluded, within the context of their overall conclusions regarding the Agreements, that the extent to which economies of scale were shared with the Funds supported the renewal of the Agreements.
The Trustees also considered other factors, which included but were not limited to the following:
| • | | The effect of recent market and economic events, including but not limited to the Covid-19 crisis and its significant disruptions to the economy and business operations, as well as more recent market volatility, on the performance, asset levels and expense ratios of each Fund. |
| • | | Whether each Fund has operated in accordance with its investment objective and the Fund’s record of compliance with its investment restrictions, and the compliance programs of the Funds and the Advisers. They also considered the compliance-related resources the Advisers and their affiliates were providing to the Funds. |
| • | | So-called “fallout benefits” to the Advisers, such as the engagement of affiliates of the Advisers to provide distribution and administrative services to the Funds, and the benefits of research made available to the Advisers by reason of brokerage commissions (if any) generated by the Funds’ securities transactions. The Trustees also considered the benefits to the parent company of Natixis Advisors from the retention of the Advisers. The Trustees considered the possible conflicts of interest associated with these fallout and other benefits, and the reporting, disclosure and other processes in place to disclose and monitor such possible conflicts of interest. |
| • | | The Trustees’ review and discussion of the Funds’ advisory arrangements in prior years, and management’s record of responding to Trustee concerns raised during the year and in prior years. |
Based on their evaluation of all factors that they deemed to be material, including those factors described above, and assisted by the advice of independent counsel, the Trustees, including the Independent Trustees, concluded that the existing Agreements should be continued through June 30, 2023.
33 |
LIQUIDITY RISK MANAGEMENT PROGRAM
Annual Report for the Period Commencing on January 1, 2021 and ending December 31, 2021 (including updates through September 30, 2022)
Effective December 1, 2018 (September 29, 2020 for Loomis Sayles Credit Income Fund), the Funds adopted a liquidity risk management program (the “Program”) pursuant to the requirements of Rule 22e-4 under the Investment Company Act of 1940, as amended (the “Rule”). The Rule requires registered open-end funds, including mutual funds and exchange-traded funds, to establish liquidity risk management programs in order to effectively manage fund liquidity and mitigate the risk that a fund could not meet redemption requests without significantly diluting the interests of remaining investors.
The rule requires the Funds to assess, manage and review their liquidity risk considering applicable factors during normal and foreseeable stressed conditions. In fulfilling this requirement, each Fund assesses and reviews (where applicable and amongst other matters) its investment strategy, portfolio holdings, possible investment concentrations, use of derivatives, short-term and long-term cash flow projections, use of cash and cash equivalents, as well as borrowing arrangements and other funding sources. Each Program has established a Program Administrator, which is the adviser of the Funds.
In accordance with the Program, each of the Fund’s portfolio investments is classified into one of four liquidity categories based on a determination of a reasonable expectation for how long it would take to convert the investment to cash (or sell or dispose of the investment) without significantly changing its market value.
Each Fund is prohibited from acquiring an investment if, after the acquisition, its holdings of illiquid assets will exceed 15% of its net assets. If a Fund does not hold a majority of highly liquid investments in its portfolio, then the Fund is required to establish a highly liquid investment minimum (“HLIM”). Loomis Sayles Core Plus Bond Fund, Loomis Sayles Credit Income Fund and Loomis Sayles Intermediate Duration Bond Fund have established an HLIM.
During the period from January 1, 2021 to December 31, 2021, there were no material changes to the Program and no material events that impacted the operation of the Funds’ Programs. During the period, the Funds held sufficient liquid assets to meet redemptions on a timely basis and did not have any HLIM or illiquid security violations.
During the period January 1, 2022 through September 30, 2022, the Funds held sufficient liquid assets to meet redemptions on a timely basis and did not have any HLIM or illiquid security violations.
Annual Program Assessment and Conclusion
In the opinion of the Program Administrators, the Program of each Fund approved by the Funds’ Board is operating effectively. The Program Administrators have also monitored, assessed and managed each Fund’s liquidity risk regularly throughout the period.
Pursuant to the Rule’s requirements, the Board has received and reviewed a written report prepared by each Fund’s Program Administrator that addressed the operation of the Programs, assessed their adequacy and effectiveness and described any material changes made to the Programs.
| 34
Portfolio of Investments – as of September 30, 2022
Loomis Sayles Core Plus Bond Fund
| | | | | | | | |
Principal
Amount (‡) | | | Description | | Value (†) | |
| | Bonds and Notes — 90.3% of Net Assets | |
| | Non-Convertible Bonds — 90.2% | |
| | | | ABS Car Loan — 1.3% | |
| $ | 2,396,000 | | | Avis Budget Rental Car Funding AESOP LLC, Series 2018-2A, Class A, 4.000%, 3/20/2025, 144A | | $ | 2,354,044 | |
| | 6,444,000 | | | Avis Budget Rental Car Funding AESOP LLC, Series 2019-2A, Class A, 3.350%, 9/22/2025, 144A | | | 6,191,545 | |
| | 7,064,000 | | | Avis Budget Rental Car Funding AESOP LLC, Series 2020-2A, Class A, 2.020%, 2/20/2027, 144A | | | 6,295,779 | |
| | 8,160,000 | | | Avis Budget Rental Car Funding AESOP LLC, Series 2022-1A, Class A, 3.830%, 8/21/2028, 144A | | | 7,721,318 | |
| | 2,024,783 | | | Exeter Automobile Receivables Trust, Series 2021-2A, Class B, 0.570%, 9/15/2025 | | | 2,007,344 | |
| | 3,525,000 | | | Exeter Automobile Receivables Trust, Series 2021-2A, Class C, 0.980%, 6/15/2026 | | | 3,395,364 | |
| | 8,181,000 | | | Santander Drive Auto Receivables Trust, Series 2021-1, Class C, 0.750%, 2/17/2026 | | | 8,048,086 | |
| | 8,315,000 | | | Santander Drive Auto Receivables Trust, Series 2021-2, Class C, 0.900%, 6/15/2026 | | | 8,101,392 | |
| | 9,095,000 | | | Santander Drive Auto Receivables Trust, Series 2021-3, Class C, 0.950%, 9/15/2027 | | | 8,785,526 | |
| | 19,695,000 | | | Santander Drive Auto Receivables Trust, Series 2022-2, Class B, 3.440%, 9/15/2027 | | | 19,213,201 | |
| | 6,865,000 | | | Westlake Automobile Receivables Trust, Series 2022-2 2A, Class C, 4.850%, 9/15/2027, 144A | | | 6,712,851 | |
| | | | | | | | |
| | | | | | | 78,826,450 | |
| | | | | | | | |
| | | | ABS Home Equity — 0.4% | |
| | 2,397,234 | | | Bayview Opportunity Master Fund IVa Trust, Series 2017-RT5, Class A, 3.500%, 5/28/2069, 144A(a) | | | 2,316,883 | |
| | 2,886,922 | | | CoreVest American Finance Trust, Series 2019-3, Class A, 2.705%, 10/15/2052, 144A | | | 2,722,345 | |
| | 12,465 | | | Countrywide Asset-Backed Certificates, Series 2004-S1, Class A3, 5.115%, 2/25/2035(a) | | | 12,345 | |
| | 1,117,115 | | | Onslow Bay Financial LLC, Series 2018-EXP1, Class 1A3, 4.000%, 4/25/2048, 144A(a) | | | 1,027,540 | |
| | 123,837 | | | Sequoia Mortgage Trust, Series 2017-CH1, Class A1, 4.000%, 8/25/2047, 144A(a) | | | 117,643 | |
| | 514,562 | | | Sequoia Mortgage Trust, Series 2018-CH1, Class A1, 4.000%, 3/25/2048, 144A(a) | | | 479,624 | |
| | 368,208 | | | Sequoia Mortgage Trust, Series 2018-CH3, Class A2, 4.000%, 8/25/2048, 144A(a) | | | 362,129 | |
| | 1,298,545 | | | Towd Point Mortgage Trust, Series 2015-1, Class A5, 3.407%, 10/25/2053, 144A(a) | | | 1,252,635 | |
| | 4,254,377 | | | Towd Point Mortgage Trust, Series 2015-4, Class M2, 3.750%, 4/25/2055, 144A(a) | | | 4,191,392 | |
| | 5,101,352 | | | Towd Point Mortgage Trust, Series 2016-2, Class M2, 3.000%, 8/25/2055, 144A(a) | | | 4,670,505 | |
| | 4,984,640 | | | Towd Point Mortgage Trust, Series 2018-3, Class A1, 3.750%, 5/25/2058, 144A(a) | | | 4,781,731 | |
| | | | | | | | |
| | | | | | | 21,934,772 | |
| | | | | | | | |
| | | | ABS Other — 1.6% | |
| | 9,814,868 | | | CLI Funding VIII LLC, Series 2021-1A, Class A, 1.640%, 2/18/2046, 144A | | | 8,402,470 | |
| | 14,689,000 | | | DB Master Finance LLC, Series 2021-1A, Class A2II, 2.493%, 11/20/2051, 144A | | | 12,014,060 | |
| | | | ABS Other — continued | |
| 7,493,025 | | | Donlen Fleet Lease Funding 2 LLC, Series 2021-2, Class A2, 0.560%, 12/11/2034, 144A | | | 7,237,001 | |
| | 8,157,600 | | | Jack in the Box Funding LLC, Series 2022-1A, Class A2I, 3.445%, 2/26/2052, 144A | | | 7,066,390 | |
| | 13,726,350 | | | Jack in the Box Funding LLC, Series 2022-1A, Class A2II, 4.136%, 2/26/2052, 144A | | | 11,134,239 | |
| | 6,910,455 | | | Lunar Structured Aircraft Portfolio Notes, Series 2021-1, Class A, 2.636%, 10/15/2046, 144A | | | 6,060,745 | |
| | 9,561,890 | | | Navigator Aircraft ABS Ltd., Series 2021-1, Class A, 2.771%, 11/15/2046, 144A(a) | | | 8,125,496 | |
| | 4,971,368 | | | OneMain Financial Issuance Trust, Series 2020-1A, Class A, 3.840%, 5/14/2032, 144A | | | 4,943,190 | |
| | 13,500,000 | | | OneMain Financial Issuance Trust, Series 2021-1A, Class A2, 30-day Average SOFR + 0.760%, 3.045%, 6/16/2036, 144A(b) | | | 12,536,842 | |
| | 19,919,800 | | | Textainer Marine Containers Ltd., Series 2021-3A, Class A, 1.940%, 8/20/2046, 144A | | | 16,493,913 | |
| | 3,409,172 | | | Textainer Marine Containers VIII Ltd., Series 2020-2A, Class A, 2.100%, 9/20/2045, 144A | | | 3,025,828 | |
| | | | | | | | |
| | | | | | | 97,040,174 | |
| | | | | | | | |
| | | | ABS Student Loan — 0.3% | |
| | 4,231,255 | | | Navient Private Education Refi Loan Trust, Series 2020-HA, Class A, 1.310%, 1/15/2069, 144A | | | 3,843,530 | |
| | 9,938,699 | | | Navient Private Education Refi Loan Trust, Series 2021-CA, Class A, 1.060%, 10/15/2069, 144A | | | 8,509,981 | |
| | 3,968,022 | | | SMB Private Education Loan Trust, Series 2021-A, Class APT2, 1.070%, 1/15/2053, 144A | | | 3,378,020 | |
| | 2,766,830 | | | SoFi Professional Loan Program Trust, Series 2020-A, Class A2FX, 2.540%, 5/15/2046, 144A | | | 2,579,699 | |
| | | | | | | | |
| | | | | | | 18,311,230 | |
| | | | | | | | |
| | | | ABS Whole Business — 0.3% | |
| | 5,450,013 | | | Domino’s Pizza Master Issuer LLC, Series 2021-1A, Class A2I, 2.662%, 4/25/2051, 144A | | | 4,487,998 | |
| | 4,761,075 | | | Planet Fitness Master Issuer LLC, Series 2022-1A, Class A2I, 3.251%, 12/05/2051, 144A | | | 4,171,421 | |
| | 12,049,450 | | | Planet Fitness Master Issuer LLC, Series 2022-1A, Class A2II, 4.008%, 12/05/2051, 144A | | | 9,718,628 | |
| | | | | | | | |
| | | | | | | 18,378,047 | |
| | | | | | | | |
| | | | Aerospace & Defense — 1.0% | |
| | 18,336,000 | | | Boeing Co. (The), 1.433%, 2/04/2024 | | | 17,418,417 | |
| | 13,774,000 | | | Boeing Co. (The), 5.705%, 5/01/2040 | | | 12,031,074 | |
| | 17,264,000 | | | Boeing Co. (The), 5.805%, 5/01/2050 | | | 15,002,275 | |
| | 12,659,000 | | | Embraer Netherlands Finance BV, 5.050%, 6/15/2025 | | | 12,041,874 | |
| | 1,329,000 | | | Textron, Inc., 3.000%, 6/01/2030 | | | 1,094,264 | |
| | | | | | | | |
| | | | | | | 57,587,904 | |
| | | | | | | | |
| | | | Agency Commercial Mortgage-Backed Securities — 0.5% | |
| | 1,598,000 | | | FHLMC, 3.100%, 6/01/2037 | | | 1,330,351 | |
| | 2,103,000 | | | FHLMC, 3.100%, 6/01/2037 | | | 1,750,768 | |
See accompanying notes to financial statements.
35 |
Portfolio of Investments – as of September 30, 2022
Loomis Sayles Core Plus Bond Fund – (continued)
| | | | | | | | |
Principal
Amount (‡) | | | Description | | Value (†) | |
| | | | Agency Commercial Mortgage-Backed Securities — continued | |
| $ | 1,725,000 | | | FHLMC, 3.100%, 6/01/2037 | | $ | 1,436,080 | |
| | 3,681,713 | | | FHLMC, 3.450%, 5/01/2037 | | | 3,272,033 | |
| | 1,267,907 | | | FHLMC, 3.700%, 5/01/2037 | | | 1,154,095 | |
| | 8,725,905 | | | FHLMC, 3.750%, 5/01/2037 | | | 7,850,616 | |
| | 7,013,000 | | | FNMA, 3.850%, 9/01/2037 | | | 6,366,305 | |
| | 6,645,429 | | | FNMA, 4.240%, 7/01/2038 | | | 6,250,286 | |
| | | | | | | | |
| | | | | | | 29,410,534 | |
| | | | | | | | |
| | | | Airlines — 0.7% | |
| | 5,874,112 | | | American Airlines, Inc./AAdvantage Loyalty IP Ltd., 5.500%, 4/20/2026, 144A | | | 5,516,790 | |
| | 5,620,467 | | | American Airlines, Inc./AAdvantage Loyalty IP Ltd., 5.750%, 4/20/2029, 144A | | | 4,903,857 | |
| | 1,549,026 | | | Continental Airlines Pass Through Trust, Series 2012-2, Class A, 4.000%, 4/29/2026 | | | 1,453,219 | |
| | 14,151,433 | | | Delta Air Lines, Inc./SkyMiles IP Ltd., 4.750%, 10/20/2028, 144A | | | 13,180,017 | |
| | 9,537,000 | | | Southwest Airlines Co., 5.125%, 6/15/2027 | | | 9,336,873 | |
| | 3,913,136 | | | United Airlines Pass Through Trust, Series 2020-1, Class B, 4.875%, 7/15/2027 | | | 3,601,181 | |
| | 2,266,000 | | | United Airlines, Inc., 4.375%, 4/15/2026, 144A | | | 2,022,405 | |
| | 2,333,000 | | | United Airlines, Inc., 4.625%, 4/15/2029, 144A | | | 1,930,418 | |
| | | | | | | | |
| | | | | | | 41,944,760 | |
| | | | | | | | |
| | | | Automotive — 1.3% | |
| | 2,945,000 | | | Dana, Inc., 4.250%, 9/01/2030 | | | 2,157,069 | |
| | 16,142,000 | | | General Motors Co., 5.000%, 4/01/2035 | | | 13,242,084 | |
| | 6,067,000 | | | General Motors Financial Co., Inc., 2.900%, 2/26/2025 | | | 5,668,444 | |
| | 10,719,000 | | | Goodyear Tire & Rubber Co. (The), 5.625%, 4/30/2033 | | | 8,588,599 | |
| | 5,091,000 | | | Hyundai Capital America, 2.375%, 10/15/2027, 144A | | | 4,250,091 | |
| | 10,356,000 | | | Hyundai Capital America, 2.650%, 2/10/2025, 144A | | | 9,650,075 | |
| | 7,453,000 | | | Hyundai Capital America, 3.000%, 2/10/2027, 144A | | | 6,618,502 | |
| | 13,381,000 | | | Lear Corp., 5.250%, 5/15/2049 | | | 10,597,130 | |
| | 7,676,000 | | | Nissan Motor Co. Ltd., 3.043%, 9/15/2023, 144A | | | 7,462,300 | |
| | 6,096,000 | | | Volkswagen Group of America Finance LLC, 3.200%, 9/26/2026, 144A | | | 5,587,632 | |
| | | | | | | | |
| | | | | | | 73,821,926 | |
| | | | | | | | |
| | | | Banking — 7.9% | |
| | 22,501,000 | | | Ally Financial, Inc., 3.050%, 6/05/2023 | | | 22,263,433 | |
| | 10,051,000 | | | Banco Santander Chile, 2.700%, 1/10/2025, 144A | | | 9,384,920 | |
| | 12,000,000 | | | Banco Santander S.A., 1.849%, 3/25/2026 | | | 10,361,753 | |
| | 3,200,000 | | | Banco Santander S.A., 2.958%, 3/25/2031 | | | 2,426,571 | |
| | 28,476,000 | | | Bangkok Bank PCL, 4.050%, 3/19/2024, 144A | | | 28,124,892 | |
| | 26,146,000 | | | Bank of America Corp., (fixed rate to 4/22/2024, variable rate thereafter), 0.976%, 4/22/2025 | | | 24,301,948 | |
| | 25,210,000 | | | Bank of America Corp., (fixed rate to 4/23/2026, variable rate thereafter), MTN, 3.559%, 4/23/2027 | | | 23,273,248 | |
| | 15,740,000 | | | Bank of America Corp., (fixed rate to 7/22/2032, variable rate thereafter), 5.015%, 7/22/2033 | | | 14,601,250 | |
| | 19,564,000 | | | Barclays PLC, (fixed rate to 3/10/2041, variable rate thereafter), 3.811%, 3/10/2042 | | | 12,207,825 | |
| | 7,864,000 | | | BBVA Bancomer S.A., 1.875%, 9/18/2025, 144A | | | 7,044,110 | |
| | 14,513,000 | | | BNP Paribas S.A., (fixed rate to 1/13/2026, variable rate thereafter), 1.323%, 1/13/2027, 144A | | | 12,369,048 | |
| | | | Banking — continued | |
| 26,613,000 | | | BNP Paribas S.A., (fixed rate to 11/19/2024, variable rate thereafter), 2.819%, 11/19/2025, 144A | | | 24,804,145 | |
| | 5,935,000 | | | Citigroup, Inc., 4.000%, 8/05/2024 | | | 5,804,317 | |
| | 1,154,000 | | | Citigroup, Inc., (fixed rate to 5/01/2024, variable rate thereafter), 0.981%, 5/01/2025 | | | 1,069,229 | |
| | 9,780,000 | | | Deutsche Bank AG, 0.898%, 5/28/2024 | | | 9,033,164 | |
| | 10,038,000 | | | Deutsche Bank AG, 1.686%, 3/19/2026 | | | 8,735,997 | |
| | 9,585,000 | | | Deutsche Bank AG, (fixed rate to 10/07/2031, variable rate thereafter), 3.742%, 1/07/2033 | | | 6,213,225 | |
| | 6,737,000 | | | Deutsche Bank AG, (fixed rate to 10/14/2030, variable rate thereafter), 3.729%, 1/14/2032 | | | 4,537,015 | |
| | 9,985,000 | | | Deutsche Bank AG, (fixed rate to 11/24/2025, variable rate thereafter), 2.129%, 11/24/2026 | | | 8,478,071 | |
| | 6,768,000 | | | Goldman Sachs Group, Inc. (The), 3.625%, 1/22/2023 | | | 6,754,321 | |
| | 12,486,000 | | | Goldman Sachs Group, Inc. (The), 6.750%, 10/01/2037 | | | 12,444,590 | |
| | 1,326,000 | | | HSBC Holdings PLC, 4.950%, 3/31/2030 | | | 1,218,323 | |
| | 13,610,000 | | | HSBC Holdings PLC, (fixed rate to 5/24/2024, variable rate thereafter), 0.976%, 5/24/2025 | | | 12,504,217 | |
| | 4,740,000 | | | Intesa Sanpaolo SpA, (fixed rate to 6/01/2031, variable rate thereafter), 4.198%, 6/01/2032, 144A | | | 3,205,235 | |
| | 23,355,000 | | | JPMorgan Chase & Co., (fixed rate to 10/15/2029, variable rate thereafter), 2.739%, 10/15/2030 | | | 18,989,716 | |
| | 11,576,000 | | | JPMorgan Chase & Co., (fixed rate to 5/13/2030, variable rate thereafter), 2.956%, 5/13/2031 | | | 9,169,304 | |
| | 8,120,000 | | | JPMorgan Chase & Co., (fixed rate to 7/25/2032, variable rate thereafter), 4.912%, 7/25/2033 | | | 7,487,903 | |
| | 13,895,000 | | | Macquarie Bank Ltd., 3.231%, 3/21/2025, 144A | | | 13,246,446 | |
| | 16,028,000 | | | Morgan Stanley, (fixed rate to 4/05/2023, variable rate thereafter), 0.731%, 4/05/2024 | | | 15,641,092 | |
| | 4,500,000 | | | Morgan Stanley, (fixed rate to 7/20/2032, variable rate thereafter), 4.889%, 7/20/2033 | | | 4,169,532 | |
| | 7,931,000 | | | Morgan Stanley, (fixed rate to 7/22/2027, variable rate thereafter), 3.591%, 7/22/2028 | | | 7,134,648 | |
| | 8,220,000 | | | Santander Holdings USA, Inc., (fixed rate to 1/06/2027, variable rate thereafter), 2.490%, 1/06/2028 | | | 6,854,826 | |
| | 9,050,000 | | | Santander UK Group Holdings PLC, 5.625%, 9/15/2045, 144A | | | 7,145,457 | |
| | 24,503,000 | | | Societe Generale S.A., 2.625%, 1/22/2025, 144A | | | 22,674,508 | |
| | 19,840,000 | | | Standard Chartered PLC, (fixed rate to 1/12/2032, variable rate thereafter), 3.603%, 1/12/2033, 144A | | | 14,820,877 | |
| | 23,346,000 | | | Standard Chartered PLC, (fixed rate to 1/30/2025, variable rate thereafter), 2.819%, 1/30/2026, 144A | | | 21,463,435 | |
| | 11,566,000 | | | Sumitomo Mitsui Financial Group, Inc., 1.474%, 7/08/2025 | | | 10,405,451 | |
| | 14,720,000 | | | Sumitomo Mitsui Financial Group, Inc., 2.696%, 7/16/2024 | | | 14,066,333 | |
| | 9,213,000 | | | Sumitomo Mitsui Financial Group, Inc., 3.040%, 7/16/2029 | | | 7,735,152 | |
| | 14,630,000 | | | UniCredit SpA, (fixed rate to 6/03/2026, variable rate thereafter), 1.982%, 6/03/2027, 144A | | | 11,939,847 | |
| | | | | | | | |
| | | | | | | 464,105,374 | |
| | | �� | | | | | |
See accompanying notes to financial statements.
| 36
Portfolio of Investments – as of September 30, 2022
Loomis Sayles Core Plus Bond Fund – (continued)
| | | | | | | | |
Principal
Amount (‡) | | | Description | | Value (†) | |
| | | | Building Materials — 0.5% | |
| $ | 14,390,000 | | | American Builders & Contractors Supply Co., Inc., 3.875%, 11/15/2029, 144A | | $ | 11,303,057 | |
| | 9,762,000 | | | Cemex SAB de CV, 3.875%, 7/11/2031, 144A | | | 7,692,246 | |
| | 12,838,000 | | | Mohawk Industries, Inc., 3.625%, 5/15/2030 | | | 10,693,669 | |
| | 17,000 | | | Summit Materials LLC/Summit Materials Finance Corp., 5.250%, 1/15/2029, 144A | | | 14,960 | |
| | | | | | | | |
| | | | | | | 29,703,932 | |
| | | | | | | | |
| | | | Cable Satellite — 0.7% | |
| | 14,940,000 | | | CCO Holdings LLC/CCO Holdings Capital Corp., 4.250%, 1/15/2034, 144A | | | 10,693,753 | |
| | 20,290,000 | | | Charter Communications Operating LLC/Charter Communications Operating Capital, 5.500%, 4/01/2063 | | | 15,329,257 | |
| | 2,885,000 | | | Time Warner Cable LLC, 4.500%, 9/15/2042 | | | 1,991,822 | |
| | 783,000 | | | Time Warner Cable LLC, 5.500%, 9/01/2041 | | | 614,588 | |
| | 2,245,000 | | | Time Warner Cable LLC, 5.875%, 11/15/2040 | | | 1,848,115 | |
| | 7,162,000 | | | Time Warner Cable LLC, 6.550%, 5/01/2037 | | | 6,462,203 | |
| | 1,707,000 | | | Time Warner Cable LLC, 6.750%, 6/15/2039 | | | 1,525,880 | |
| | | | | | | | |
| | | | | | | 38,465,618 | |
| | | | | | | | |
| | | | Chemicals — 1.4% | |
| | 1,610,000 | | | Alpek SAB de CV, 3.250%, 2/25/2031, 144A | | | 1,190,097 | |
| | 8,370,000 | | | Ashland LLC, 3.375%, 9/01/2031, 144A | | | 6,469,299 | |
| | 20,853,000 | | | Braskem America Finance Co., 7.125%, 7/22/2041, 144A | | | 18,219,601 | |
| | 6,925,000 | | | Celanese U.S. Holdings LLC, 6.050%, 3/15/2025 | | | 6,764,660 | |
| | 2,795,000 | | | Celanese U.S. Holdings LLC, 6.330%, 7/15/2029 | | | 2,605,010 | |
| | 6,020,000 | | | Celanese U.S. Holdings LLC, 6.379%, 7/15/2032 | | | 5,594,205 | |
| | 6,317,000 | | | Koppers, Inc., 6.000%, 2/15/2025, 144A | | | 5,653,715 | |
| | 9,071,000 | | | Orbia Advance Corp. SAB de CV, 5.875%, 9/17/2044, 144A | | | 7,054,517 | |
| | 9,466,000 | | | Orbia Advance Corp. SAB de CV, 6.750%, 9/19/2042, 144A | | | 8,435,359 | |
| | 3,732,000 | | | RPM International, Inc., 3.450%, 11/15/2022 | | | 3,727,158 | |
| | 3,630,000 | | | Sociedad Quimica y Minera de Chile S.A., 3.500%, 9/10/2051, 144A | | | 2,418,161 | |
| | 11,424,000 | | | Sociedad Quimica y Minera de Chile S.A., 4.250%, 1/22/2050, 144A | | | 9,036,384 | |
| | 3,309,000 | | | Univar Solutions USA, Inc., 5.125%, 12/01/2027, 144A | | | 2,945,010 | |
| | | | | | | | |
| | | | | | | 80,113,176 | |
| | | | | | | | |
| | | | Collateralized Mortgage Obligations — 0.1% | |
| | 228,190 | | | Government National Mortgage Association, Series 2010-H24, Class FA, 1-month LIBOR + 0.350%, 2.707%, 10/20/2060(b) | | | 225,871 | |
| | 162,225 | | | Government National Mortgage Association, Series 2012-H18, Class NA, 1-month LIBOR + 0.520%, 2.877%, 8/20/2062(b) | | | 161,314 | |
| | 3,505 | | | Government National Mortgage Association, Series 2013-H01, Class FA, 1.650%, 1/20/2063(c) | | | 3,299 | |
| | 12,519 | | | Government National Mortgage Association, Series 2013-H03, Class HA, 1.750%, 12/20/2062(c) | | | 10,941 | |
| | 24,383 | | | Government National Mortgage Association, Series 2013-H04, Class BA, 1.650%, 2/20/2063(c) | | | 22,882 | |
| | 83,626 | | | Government National Mortgage Association, Series 2013-H10, Class PA, 2.500%, 4/20/2063(c) | | | 75,003 | |
| | 7,258,551 | | | Government National Mortgage Association, Series 2015-H10, Class JA, 2.250%, 4/20/2065 | | | 7,017,636 | |
| | | | Collateralized Mortgage Obligations — continued | |
| 10,987 | | | Government National Mortgage Association, Series 2015-H13, Class FL, 1-month LIBOR + 0.280%, 2.637%, 5/20/2063(b)(c) | | | 10,734 | |
| | | | | | | | |
| | | | | | | 7,527,680 | |
| | | | | | | | |
| | | | Construction Machinery — 0.1% | |
| | 5,805,000 | | | CNH Industrial Capital LLC, 1.950%, 7/02/2023 | | | 5,681,760 | |
| | | | | | | | |
| | | | Consumer Cyclical Services — 0.0% | |
| | 1,791,000 | | | Expedia Group, Inc., 6.250%, 5/01/2025, 144A | | | 1,802,686 | |
| | | | | | | | |
| | | | Consumer Products — 0.3% | |
| | 2,157,000 | | | Kimberly-Clark de Mexico SAB de CV, 2.431%, 7/01/2031, 144A | | | 1,723,098 | |
| | 6,250,000 | | | Natura &Co Luxembourg Holdings S.a.r.l., 6.000%, 4/19/2029, 144A | | | 5,150,812 | |
| | 11,615,000 | | | Natura Cosmeticos S.A., 4.125%, 5/03/2028, 144A | | | 9,175,850 | |
| | 5,155,000 | | | Valvoline, Inc., 3.625%, 6/15/2031, 144A | | | 3,796,602 | |
| | | | | | | | |
| | | | | | | 19,846,362 | |
| | | | | | | | |
| | | | Electric — 1.9% | |
| | 3,587,000 | | | AES Corp. (The), 3.300%, 7/15/2025, 144A | | | 3,307,680 | |
| | 1,609,000 | | | AES Corp. (The), 3.950%, 7/15/2030, 144A | | | 1,377,787 | |
| | 4,863,000 | | | Calpine Corp., 3.750%, 3/01/2031, 144A | | | 3,805,297 | |
| | 12,404,000 | | | Calpine Corp., 5.000%, 2/01/2031, 144A | | | 9,855,687 | |
| | 12,220,000 | | | CenterPoint Energy, Inc., SOFR Index + 0.650%, 3.303%, 5/13/2024(b) | | | 12,050,436 | |
| | 12,579,000 | | | Clearway Energy Operating LLC, 3.750%, 2/15/2031, 144A | | | 9,991,217 | |
| | 24,347,544 | | | Cometa Energia S.A. de CV, 6.375%, 4/24/2035, 144A | | | 21,960,069 | |
| | 2,415,000 | | | DPL, Inc., 4.350%, 4/15/2029 | | | 2,016,525 | |
| | 852,000 | | | Edison International, 4.950%, 4/15/2025 | | | 834,718 | |
| | 2,811,000 | | | Enel Americas S.A., 4.000%, 10/25/2026 | | | 2,652,179 | |
| | 2,853,000 | | | Enel Generacion Chile S.A., 4.250%, 4/15/2024 | | | 2,760,278 | |
| | 5,316,000 | | | Entergy Corp., 2.800%, 6/15/2030 | | | 4,306,064 | |
| | 14,622,000 | | | National Rural Utilities Cooperative Finance Corp., (fixed rate to 4/30/2023, variable rate thereafter), 4.750%, 4/30/2043 | | | 13,303,954 | |
| | 3,800,000 | | | NRG Energy, Inc., 3.875%, 2/15/2032, 144A | | | 2,964,171 | |
| | 5,584,000 | | | Pattern Energy Operations LP/Pattern Energy Operations, Inc., 4.500%, 8/15/2028, 144A | | | 4,841,049 | |
| | 3,499,000 | | | PG&E Corp., 5.000%, 7/01/2028 | | | 3,008,987 | |
| | 7,133,000 | | | Transelec S.A., 4.250%, 1/14/2025, 144A | | | 6,919,010 | |
| | 3,713,000 | | | Transelec S.A., 4.625%, 7/26/2023, 144A | | | 3,661,946 | |
| | | | | | | | |
| | | | | | | 109,617,054 | |
| | | | | | | | |
| | | | Finance Companies — 2.3% | |
| | 6,365,000 | | | AerCap Ireland Capital DAC/AerCap Global Aviation Trust, 3.000%, 10/29/2028 | | | 5,104,511 | |
| | 1,370,000 | | | AerCap Ireland Capital DAC/AerCap Global Aviation Trust, 3.300%, 1/23/2023 | | | 1,362,328 | |
| | 16,050,000 | | | Air Lease Corp., GMTN, 3.750%, 6/01/2026 | | | 14,671,449 | |
| | 21,287,000 | | | Aircastle Ltd., 2.850%, 1/26/2028, 144A | | | 16,525,326 | |
| | 23,047,000 | | | Ares Capital Corp., 2.150%, 7/15/2026 | | | 19,315,070 | |
| | 15,425,000 | | | Avolon Holdings Funding Ltd., 2.750%, 2/21/2028, 144A | | | 12,112,550 | |
| | 17,929,000 | | | FS KKR Capital Corp., 3.400%, 1/15/2026 | | | 15,819,336 | |
| | 6,000,000 | | | Navient Corp., 5.000%, 3/15/2027 | | | 4,907,471 | |
| | 7,547,000 | | | Navient Corp., MTN, 6.125%, 3/25/2024 | | | 7,348,891 | |
| | 2,850,000 | | | OneMain Finance Corp., 3.500%, 1/15/2027 | | | 2,220,072 | |
| | 9,915,000 | | | OneMain Finance Corp., 3.875%, 9/15/2028 | | | 7,300,018 | |
| | 4,537,000 | | | Owl Rock Capital Corp., 2.625%, 1/15/2027 | | | 3,665,830 | |
| | 14,397,000 | | | Owl Rock Capital Corp., 3.400%, 7/15/2026 | | | 12,352,650 | |
See accompanying notes to financial statements.
37 |
Portfolio of Investments – as of September 30, 2022
Loomis Sayles Core Plus Bond Fund – (continued)
| | | | | | | | |
Principal
Amount (‡) | | | Description | | Value (†) | |
| | | | Finance Companies — continued | |
| $ | 11,958,000 | | | Owl Rock Technology Finance Corp., 3.750%, 6/17/2026, 144A | | $ | 10,346,404 | |
| | 6,769,000 | | | Rocket Mortgage LLC/Rocket Mortgage Co-Issuer, Inc., 3.875%, 3/01/2031, 144A | | | 4,906,536 | |
| | 1,155,000 | | | Rocket Mortgage LLC/Rocket Mortgage Co-Issuer, Inc., 4.000%, 10/15/2033, 144A | | | 794,078 | |
| | | | | | | | |
| | | | | | | 138,752,520 | |
| | | | | | | | |
| | | | Financial Other — 0.1% | |
| | 4,763,000 | | | Icahn Enterprises LP/Icahn Enterprises Finance Corp., 4.375%, 2/01/2029 | | | 3,833,643 | |
| | | | | | | | |
| | | | Food & Beverage — 1.0% | |
| | 5,573,000 | | | Anheuser-Busch Cos. LLC/Anheuser-Busch InBev Worldwide, Inc., 4.900%, 2/01/2046 | | | 4,843,383 | |
| | 12,823,000 | | | Anheuser-Busch InBev Worldwide, Inc., 4.350%, 6/01/2040 | | | 10,860,449 | |
| | 6,243,000 | | | Anheuser-Busch InBev Worldwide, Inc., 4.600%, 6/01/2060 | | | 4,921,490 | |
| | 15,008,000 | | | BRF S.A., 5.750%, 9/21/2050, 144A | | | 10,350,117 | |
| | 3,117,000 | | | Gruma SAB de CV, 4.875%, 12/01/2024, 144A | | | 3,065,601 | |
| | 10,765,000 | | | Minerva Luxembourg S.A., 4.375%, 3/18/2031, 144A | | | 8,154,487 | |
| | 9,784,000 | | | Post Holdings, Inc., 4.500%, 9/15/2031, 144A | | | 7,876,120 | |
| | 12,674,000 | | | Post Holdings, Inc., 4.625%, 4/15/2030, 144A | | | 10,408,522 | |
| | 1,599,000 | | | Smithfield Foods, Inc., 3.000%, 10/15/2030, 144A | | | 1,234,653 | |
| | | | | | | | |
| | | | | | | 61,714,822 | |
| | | | | | | | |
| | | | Government Owned – No Guarantee — 2.1% | |
| | 6,872,000 | | | Antares Holdings LP, 3.950%, 7/15/2026, 144A | | | 5,875,584 | |
| | 17,141,000 | | | BOC Aviation USA Corp., 1.625%, 4/29/2024, 144A | | | 16,183,352 | |
| | 3,903,000 | | | Empresa de los Ferrocarriles del Estado, 3.068%, 8/18/2050, 144A | | | 2,191,262 | |
| | 8,165,000 | | | Freeport Indonesia PT, 5.315%, 4/14/2032, 144A | | | 6,735,227 | |
| | 18,956,000 | | | NBN Co. Ltd., 1.450%, 5/05/2026, 144A | | | 16,539,254 | |
| | 6,985,000 | | | OCP S.A., 3.750%, 6/23/2031, 144A | | | 5,290,551 | |
| | 19,460,000 | | | OCP S.A., 5.625%, 4/25/2024, 144A | | | 19,335,106 | |
| | 6,236,000 | | | Ooredoo International Finance Ltd., 3.250%, 2/21/2023, 144A | | | 6,191,662 | |
| | 8,035,000 | | | SA Global Sukuk Ltd., 0.946%, 6/17/2024, 144A | | | 7,494,245 | |
| | 10,588,000 | | | Saudi Arabian Oil Co., 3.500%, 11/24/2070, 144A | | | 6,829,260 | |
| | 11,825,000 | | | Tennessee Valley Authority, 4.250%, 9/15/2065 | | | 10,546,044 | |
| | 7,669,000 | | | Tennessee Valley Authority, 4.625%, 9/15/2060 | | | 7,498,883 | |
| | 5,427,000 | | | Tennessee Valley Authority, 4.875%, 1/15/2048 | | | 5,395,729 | |
| | 9,290,000 | | | Tennessee Valley Authority, 5.250%, 9/15/2039 | | | 9,884,463 | |
| | | | | | | | |
| | | | | | | 125,990,622 | |
| | | | | | | | |
| | | | Health Insurance — 0.2% | |
| | 1,886,000 | | | Centene Corp., 2.500%, 3/01/2031 | | | 1,421,632 | |
| | 2,495,000 | | | Centene Corp., 2.625%, 8/01/2031 | | | 1,880,415 | |
| | 7,364,000 | | | Centene Corp., 3.375%, 2/15/2030 | | | 6,020,070 | |
| | | | | | | | |
| | | | | | | 9,322,117 | |
| | | | | | | | |
| | | | Healthcare — 0.2% | |
| | 11,660,000 | | | HCA, Inc., 4.625%, 3/15/2052, 144A | | | 8,757,859 | |
| | | | | | | | |
| | | | Home Construction — 0.2% | |
| | 4,091,000 | | | Forestar Group, Inc., 3.850%, 5/15/2026, 144A | | | 3,364,893 | |
| | 246,000 | | | Lennar Corp., 4.500%, 4/30/2024 | | | 241,428 | |
| | 9,190,000 | | | NVR, Inc., 3.000%, 5/15/2030 | | | 7,502,900 | |
| | | | | | | | |
| | | | | | | 11,109,221 | |
| | | | | | | | |
| | | | Independent Energy — 0.7% | |
| 2,626,000 | | | Aker BP ASA, 3.000%, 1/15/2025, 144A | | | 2,459,787 | |
| | 8,277,000 | | | Devon Energy Corp., 4.500%, 1/15/2030 | | | 7,533,811 | |
| | 11,391,292 | | | Energean Israel Finance Ltd., 4.500%, 3/30/2024, 144A | | | 10,679,336 | |
| | 1,765,000 | | | EQT Corp., 3.125%, 5/15/2026, 144A | | | 1,607,405 | |
| | 4,696,000 | | | EQT Corp., 3.900%, 10/01/2027 | | | 4,273,347 | |
| | 601,000 | | | EQT Corp., 5.000%, 1/15/2029 | | | 560,755 | |
| | 9,078,204 | | | Leviathan Bond Ltd., 6.125%, 6/30/2025, 144A | | | 8,562,108 | |
| | 7,181,000 | | | Pan American Energy LLC, 9.125%, 4/30/2027, 144A | | | 7,904,414 | |
| | | | | | | | |
| | | | | | | 43,580,963 | |
| | | | | | | | |
| | | | Industrial Other — 0.1% | |
| | 3,408,000 | | | Georgetown University (The), Class A, 5.215%, 10/01/2118 | | | 2,879,249 | |
| | | | | | | | |
| | | | Life Insurance — 0.2% | |
| | 12,491,000 | | | Brighthouse Financial, Inc., 5.625%, 5/15/2030 | | | 11,708,216 | |
| | 2,327,000 | | | OneAmerica Financial Partners, Inc., 4.250%, 10/15/2050, 144A | | | 1,689,495 | |
| | | | | | | | |
| | | | | | | 13,397,711 | |
| | | | | | | | |
| | | | Lodging — 0.1% | |
| | 5,147,000 | | | Hilton Domestic Operating Co., Inc., 3.625%, 2/15/2032, 144A | | | 3,942,081 | |
| | | | | | | | |
| | | | Media Entertainment — 1.0% | |
| | 9,549,000 | | | AMC Networks, Inc., 4.250%, 2/15/2029 | | | 7,060,153 | |
| | 54,020,000 | | | Grupo Televisa SAB, EMTN, 7.250%, 5/14/2043, (MXN) | | | 1,644,620 | |
| | 5,808,000 | | | Outfront Media Capital LLC/Outfront Media Capital Corp., 4.250%, 1/15/2029, 144A | | | 4,562,184 | |
| | 11,303,000 | | | Prosus NV, 3.680%, 1/21/2030, 144A | | | 8,468,899 | |
| | 14,750,000 | | | Prosus NV, 3.832%, 2/08/2051, 144A | | | 8,185,100 | |
| | 15,925,000 | | | Warnermedia Holdings, Inc., 3.528%, 3/15/2024, 144A | | | 15,370,014 | |
| | 18,750,000 | | | Warnermedia Holdings, Inc., 5.391%, 3/15/2062, 144A | | | 13,591,500 | |
| | | | | | | | |
| | | | | | | 58,882,470 | |
| | | | | | | | |
| | | | Metals & Mining — 0.9% | |
| | 1,835,000 | | | Anglo American Capital PLC, 2.250%, 3/17/2028, 144A | | | 1,507,151 | |
| | 2,245,000 | | | Anglo American Capital PLC, 3.875%, 3/16/2029, 144A | | | 1,929,161 | |
| | 3,322,000 | | | Anglo American Capital PLC, 3.950%, 9/10/2050, 144A | | | 2,261,242 | |
| | 7,696,000 | | | Anglo American Capital PLC, 5.625%, 4/01/2030, 144A | | | 7,281,153 | |
| | 10,977,000 | | | FMG Resources August 2006 Pty Ltd., 4.375%, 4/01/2031, 144A | | | 8,426,582 | |
| | 14,183,000 | | | Fresnillo PLC, 4.250%, 10/02/2050, 144A | | | 9,762,584 | |
| | 24,397,000 | | | Glencore Funding LLC, 2.500%, 9/01/2030, 144A | | | 18,668,096 | |
| | 3,555,000 | | | SunCoke Energy, Inc., 4.875%, 6/30/2029, 144A | | | 2,740,941 | |
| | | | | | | | |
| | | | | | | 52,576,910 | |
| | | | | | | | |
| | | | Midstream — 1.3% | |
| | 568,000 | | | Energy Transfer LP, 5.150%, 2/01/2043 | | | 448,454 | |
| | 125,000 | | | Energy Transfer LP, 5.400%, 10/01/2047 | | | 101,209 | |
| | 4,900,000 | | | Energy Transfer LP, 5.950%, 10/01/2043 | | | 4,245,209 | |
| | 8,548,000 | | | Energy Transfer LP, 6.500%, 2/01/2042 | | | 7,954,947 | |
| | 1,338,000 | | | Energy Transfer LP, 6.625%, 10/15/2036 | | | 1,270,348 | |
| | 2,445,000 | | | EQM Midstream Partners LP, 6.500%, 7/01/2027, 144A | | | 2,259,396 | |
See accompanying notes to financial statements.
| 38
Portfolio of Investments – as of September 30, 2022
Loomis Sayles Core Plus Bond Fund – (continued)
| | | | | | | | |
Principal
Amount (‡) | | | Description | | Value (†) | |
| | | | Midstream — continued | |
| $ | 2,014,000 | | | Gray Oak Pipeline LLC, 2.600%, 10/15/2025, 144A | | $ | 1,805,415 | |
| | 982,000 | | | Gray Oak Pipeline LLC, 3.450%, 10/15/2027, 144A | | | 868,294 | |
| | 3,060,000 | | | Kinder Morgan Energy Partners LP, 4.150%, 2/01/2024 | | | 3,018,308 | |
| | 9,503,000 | | | Kinder Morgan Energy Partners LP, 4.300%, 5/01/2024 | | | 9,372,135 | |
| | 15,243,000 | | | Kinder Morgan, Inc., 5.625%, 11/15/2023, 144A | | | 15,248,649 | |
| | 5,694,000 | | | Rattler Midstream LP, 5.625%, 7/15/2025, 144A | | | 5,765,175 | |
| | 12,205,000 | | | Sempra Global, 3.250%, 1/15/2032, 144A | | | 9,714,361 | |
| | 6,783,000 | | | Southern Natural Gas Co. LLC, 0.625%, 4/28/2023, 144A | | | 6,596,952 | |
| | 930,000 | | | Targa Resources Partners LP/Targa Resources Partners Finance Corp., 6.500%, 7/15/2027 | | | 919,154 | |
| | 10,936,000 | | | Williams Cos., Inc. (The), 3.500%, 11/15/2030 | | | 9,284,489 | |
| | | | | | | | |
| | | | | | | 78,872,495 | |
| | | | | | | | |
| | | | Mortgage Related — 26.8% | |
| | 62,968,845 | | | FHLMC, 1.500%, with various maturities from 2050 to 2051(d) | | | 46,749,430 | |
| | 177,619,453 | | | FHLMC, 2.000%, with various maturities from 2050 to 2052(d) | | | 144,054,117 | |
| | 237,282,200 | | | FHLMC, 2.500%, with various maturities from 2050 to 2052(d) | | | 199,604,662 | |
| | 56,860,573 | | | FHLMC, 3.000%, with various maturities from 2042 to 2052(d) | | | 49,827,711 | |
| | 17,303,124 | | | FHLMC, 3.500%, with various maturities from 2043 to 2052(d) | | | 15,743,012 | |
| | 25,220,962 | | | FHLMC, 4.000%, with various maturities from 2044 to 2052(d) | | | 23,463,877 | |
| | 93,632,862 | | | FHLMC, 4.500%, with various maturities from 2041 to 2052(d) | | | 89,492,656 | |
| | 15,149,380 | | | FHLMC, 5.000%, with various maturities from 2048 to 2052(d) | | | 14,973,000 | |
| | 4,358 | | | FHLMC, 6.000%, 6/01/2035 | | | 4,584 | |
| | 44,693,605 | | | FNMA, 1.500%, with various maturities from 2050 to 2051(d) | | | 34,141,525 | |
| | 394,203,005 | | | FNMA, 2.000%, with various maturities from 2037 to 2052(d) | | | 324,813,072 | |
| | 164,162,130 | | | FNMA, 2.500%, with various maturities from 2045 to 2052(d) | | | 138,311,361 | |
| | 67,682,958 | | | FNMA, 3.000%, with various maturities from 2045 to 2052(d) | | | 59,549,056 | |
| | 116,916,224 | | | FNMA, 3.500%, with various maturities from 2043 to 2052(d) | | | 105,615,029 | |
| | 126,382,584 | | | FNMA, 4.000%, with various maturities from 2041 to 2052(d) | | | 119,234,100 | |
| | 32,888,345 | | | FNMA, 4.500%, with various maturities from 2043 to 2052(d) | | | 31,601,488 | |
| | 123,581,921 | | | FNMA, 5.000%, with various maturities from 2048 to 2052(d) | | | 120,640,721 | |
| | 3,328,224 | | | FNMA, 5.500%, 4/01/2050 | | | 3,317,341 | |
| | 2,135,505 | | | FNMA, 6.000%, with various maturities from 2034 to 2049(d) | | | 2,199,160 | |
| | 5,272 | | | FNMA, 6.500%, with various maturities from 2029 to 2031(d) | | | 5,434 | |
| | 17,562 | | | FNMA, 7.000%, with various maturities in 2030(d) | | | 17,708 | |
| | 10,296 | | | FNMA, 7.500%, with various maturities from 2024 to 2032(d) | | | 10,620 | |
| | 1,320 | | | GNMA, 3.890%, 12/20/2062(a) | | | 1,228 | |
| | 6,514 | | | GNMA, 3.980%, 7/20/2063(a) | | | 6,340 | |
| | | | Mortgage Related — continued | |
| 5,115 | | | GNMA, 4.317%, 8/20/2061(a) | | | 5,008 | |
| | 19,397 | | | GNMA, 4.390%, with various maturities in 2062(a)(d) | | | 18,263 | |
| | 5,394,383 | | | GNMA, 4.392%, 12/20/2066(a) | | | 5,305,869 | |
| | 2,411,038 | | | GNMA, 4.421%, 2/20/2066(a) | | | 2,378,083 | |
| | 2,202 | | | GNMA, 4.422%, 5/20/2063(a) | | | 2,149 | |
| | 4,072,836 | | | GNMA, 4.426%, 11/20/2066(a) | | | 4,030,482 | |
| | 1,521,956 | | | GNMA, 4.438%, 10/20/2066(a) | | | 1,499,239 | |
| | 1,179,340 | | | GNMA, 4.447%, 2/20/2066(a) | | | 1,162,525 | |
| | 1,445,350 | | | GNMA, 4.450%, 6/20/2066(a) | | | 1,428,437 | |
| | 2,706,764 | | | GNMA, 4.496%, 12/20/2064(a) | | | 2,686,652 | |
| | 3,638,953 | | | GNMA, 4.497%, with various maturities from 2063 to 2066(a)(d) | | | 3,606,801 | |
| | 2,995,378 | | | GNMA, 4.542%, 6/20/2066(a) | | | 2,962,751 | |
| | 2,506,957 | | | GNMA, 4.547%, 2/20/2065(a) | | | 2,488,921 | |
| | 3,271,716 | | | GNMA, 4.565%, 12/20/2064(a) | | | 3,246,663 | |
| | 2,032,636 | | | GNMA, 4.569%, 6/20/2064(a) | | | 2,022,188 | |
| | 3,781,444 | | | GNMA, 4.604%, 10/20/2064(a) | | | 3,756,299 | |
| | 360,792 | | | GNMA, 4.611%, 1/20/2064(a) | | | 359,646 | |
| | 1,042,659 | | | GNMA, 4.622%, 1/20/2065(a) | | | 1,034,994 | |
| | 1,444,123 | | | GNMA, 4.624%, 4/20/2066(a) | | | 1,433,483 | |
| | 3,325,063 | | | GNMA, 4.628%, 2/20/2065(a) | | | 3,297,466 | |
| | 1,431,824 | | | GNMA, 4.632%, 3/20/2065(a) | | | 1,421,389 | |
| | 2,789,266 | | | GNMA, 4.634%, 3/20/2066(a) | | | 2,761,495 | |
| | 1,703,760 | | | GNMA, 4.657%, with various maturities from 2063 to 2064(a)(d) | | | 1,698,436 | |
| | 7,192,084 | | | GNMA, 4.659%, with various maturities from 2064 to 2066(a)(d) | | | 7,133,921 | |
| | 2,833,564 | | | GNMA, 4.665%, 1/20/2065(a) | | | 2,816,184 | |
| | 1,243,012 | | | GNMA, 4.700%, with various maturities from 2062 to 2066(a)(d) | | | 1,229,573 | |
| | 2,640,876 | | | GNMA, 4.714%, 1/20/2064(a) | | | 2,632,550 | |
| | 87,018 | | | GNMA, 5.500%, 4/15/2038 | | | 91,514 | |
| | 17,762 | | | GNMA, 6.000%, with various maturities from 2029 to 2038(d) | | | 18,468 | |
| | 21,012 | | | GNMA, 6.500%, with various maturities from 2029 to 2032(d) | | | 21,712 | |
| | 19,763 | | | GNMA, 7.000%, 9/15/2025 | | | 19,837 | |
| | 2,312 | | | GNMA, 7.500%, with various maturities from 2025 to 2030(d) | | | 2,341 | |
| | | | | | | | |
| | | | | | | 1,585,950,571 | |
| | | | | | | | |
| | | | Natural Gas — 0.0% | |
| | 2,701,000 | | | Boston Gas Co., 3.001%, 8/01/2029, 144A | | | 2,270,090 | |
| | | | | | | | |
| | | | Non-Agency Commercial Mortgage-Backed Securities — 2.2% | |
| | 22,085,000 | | | AOA Mortgage Trust, Series 2021-1177, Class��A, 1-month LIBOR + 0.874%, 3.692%, 10/15/2038, 144A(b) | | | 20,981,435 | |
| | 1,531,640 | | | BANK, Series 2019-BN16, Class A4, 4.005%, 2/15/2052 | | | 1,422,153 | |
| | 3,409,380 | | | BANK, Series 2019-BN20, Class A3, 3.011%, 9/15/2062 | | | 2,954,405 | |
| | 12,696,152 | | | BANK, Series 2019-BN22, Class A4, 2.978%, 11/15/2062 | | | 10,955,644 | |
| | 6,138,240 | | | BANK, Series 2019-BN24, Class A3, 2.960%, 11/15/2062 | | | 5,275,909 | |
| | 7,135,000 | | | BPR Trust, Series 2021-NRD, Class A, 1-month SOFR + 1.525%, 4.447%, 12/15/2023, 144A(b) | | | 6,828,766 | |
| | 14,179,842 | | | Citigroup Commercial Mortgage Trust, Series 2019-C7, Class A4, 3.102%, 12/15/2072 | | | 12,308,486 | |
| | 7,070,071 | | | Citigroup Commercial Mortgage Trust, Series 2019-GC43, Class A4, 3.038%, 11/10/2052 | | | 6,134,353 | |
See accompanying notes to financial statements.
39 |
Portfolio of Investments – as of September 30, 2022
Loomis Sayles Core Plus Bond Fund – (continued)
| | | | | | | | |
Principal
Amount (‡) | | | Description | | Value (†) | |
| | | | Non-Agency Commercial Mortgage-Backed Securities — continued | |
| $ | 8,877,514 | | | Citigroup Commercial Mortgage Trust, Series 2020-GC46, Class A5, 2.717%, 2/15/2053 | | $ | 7,471,280 | |
| | 860,863 | | | Commercial Mortgage Trust, Series 2010-C1, Class D, 5.985%, 7/10/2046, 144A(a) | | | 840,410 | |
| | 2,112,208 | | | Credit Suisse Mortgage Trust, Series 2014-USA, Class A1,3.304%, 9/15/2037, 144A | | | 1,925,485 | |
| | 11,367,000 | | | Credit Suisse Mortgage Trust, Series 2014-USA, Class A2, 3.953%, 9/15/2037, 144A | | | 10,317,915 | |
| | 6,360,852 | | | Extended Stay America Trust, Series 2021-ESH, Class A, 1-month LIBOR + 1.080%, 3.898%, 7/15/2038, 144A(b) | | | 6,160,985 | |
| | 1,475,916 | | | Extended Stay America Trust, Series 2021-ESH, Class D, 1-month LIBOR + 2.250%, 5.068%, 7/15/2038, 144A(b) | | | 1,413,045 | |
| | 5,627,003 | | | GS Mortgage Securities Trust, Series 2011-GC5, Class C, 5.302%, 8/10/2044, 144A(a) | | | 4,657,686 | |
| | 2,317,554 | | | GS Mortgage Securities Trust, Series 2014-GC18, Class B, 4.885%, 1/10/2047(a) | | | 2,124,234 | |
| | 6,596,065 | | | GS Mortgage Securities Trust, Series 2020-GC45, Class A5, 2.911%, 2/13/2053 | | | 5,653,553 | |
| | 8,370,000 | | | MedTrust, Series 2021-MDLN, Class A, 1-month LIBOR + 0.950%, 3.768%, 11/15/2038, 144A(b) | | | 8,034,504 | |
| | 3,825,000 | | | Morgan Stanley Bank of America Merrill Lynch Trust, Series 2013-C11, Class A4, 4.295%, 8/15/2046(a) | | | 3,776,680 | |
| | 4,178,362 | | | UBS-Barclays Commercial Mortgage Trust, Series 2013-C5, Class A4, 3.185%, 3/10/2046 | | | 4,162,568 | |
| | 4,982,141 | | | WFRBS Commercial Mortgage Trust, Series 2011-C4, Class D,4.987%, 6/15/2044, 144A(a) | | | 4,413,122 | |
| | 5,245,978 | | | WFRBS Commercial Mortgage Trust, Series 2014-C20, Class AS, 4.176%, 5/15/2047 | | | 5,072,252 | |
| | | | | | | | |
| | | | | | | 132,884,870 | |
| | | | | | | | |
| | | | Paper — 0.2% | |
| | 11,675,000 | | | Klabin Austria GmbH, 7.000%, 4/03/2049, 144A | | | 9,831,885 | |
| | | | | | | | |
| | | | Pharmaceuticals — 0.3% | |
| | 10,284,000 | | | Teva Pharmaceutical Finance Netherlands III BV, 3.150%, 10/01/2026 | | | 8,438,022 | |
| | 7,588,000 | | | Teva Pharmaceutical Finance Netherlands III BV, 7.125%, 1/31/2025 | | | 7,386,197 | |
| | 2,903,000 | | | Viatris, Inc., 4.000%, 6/22/2050 | | | 1,737,712 | |
| | | | | | | | |
| | | | | | | 17,561,931 | |
| | | | | | | | |
| | | | Property & Casualty Insurance — 0.1% | |
| | 2,585,000 | | | Ascot Group Ltd., 4.250%, 12/15/2030, 144A | | | 2,154,341 | |
| | 5,865,000 | | | Liberty Mutual Group, Inc., 3.950%, 5/15/2060, 144A | | | 3,704,533 | |
| | | | | | | | |
| | | | | | | 5,858,874 | |
| | | | | | | | |
| | | | Refining — 0.3% | |
| | 21,664,000 | | | Thaioil Treasury Center Co. Ltd., 4.875%, 1/23/2043, 144A | | | 16,963,995 | |
| | | | | | | | |
| | | | REITs – Apartments — 0.0% | |
| | 1,715,000 | | | American Homes 4 Rent, 3.375%, 7/15/2051 | | | 1,056,043 | |
| | | | | | | | |
| | | | REITs – Diversified — 0.3% | |
| | 3,790,000 | | | EPR Properties, 3.600%, 11/15/2031 | | | 2,707,800 | |
| | 13,668,000 | | | iStar, Inc., 4.250%, 8/01/2025 | | | 13,258,611 | |
| | | | | | | | |
| | | | | | | 15,966,411 | |
| | | | | | | | |
| | | | Retailers — 0.8% | |
| 3,081,000 | | | Alibaba Group Holding Ltd., 3.250%, 2/09/2061 | | | 1,737,645 | |
| | 12,000 | | | Asbury Automotive Group, Inc., 4.500%, 3/01/2028 | | | 10,140 | |
| | 242,000 | | | Asbury Automotive Group, Inc., 4.750%, 3/01/2030 | | | 188,998 | |
| | 10,405,000 | | | Dick’s Sporting Goods, Inc., 4.100%, 1/15/2052 | | | 6,429,983 | |
| | 22,769,000 | | | El Puerto de Liverpool SAB de CV, 3.875%, 10/06/2026, 144A | | | 21,562,243 | |
| | 8,985,000 | | | Falabella S.A., 3.375%, 1/15/2032, 144A | | | 6,708,740 | |
| | 20,000 | | | Group 1 Automotive, Inc., 4.000%, 8/15/2028, 144A | | | 16,104 | |
| | 856,000 | | | Hanesbrands, Inc., 4.625%, 5/15/2024, 144A | | | 816,196 | |
| | 2,037,000 | | | Hanesbrands, Inc., 4.875%, 5/15/2026, 144A | | | 1,831,161 | |
| | 6,632,000 | | | Lithia Motors, Inc., 4.375%, 1/15/2031, 144A | | | 5,430,149 | |
| | 4,582,000 | | | MercadoLibre, Inc., 3.125%, 1/14/2031 | | | 3,321,950 | |
| | | | | | | | |
| | | | | | | 48,053,309 | |
| | | | | | | | |
| | | | Sovereigns — 0.7% | |
| | 12,229,000 | | | Dominican Republic, 4.875%, 9/23/2032, 144A | | | 9,193,900 | |
| | 10,070,000 | | | Dominican Republic, 5.300%, 1/21/2041, 144A | | | 6,804,172 | |
| | 15,265,000 | | | Egypt Government International Bond, 7.625%, 5/29/2032, 144A | | | 9,184,828 | |
| | 17,772,000 | | | Republic of Ghana, 7.750%, 4/07/2029, 144A | | | 6,708,930 | |
| | 14,320,000 | | | Republic of South Africa Government International Bond, 7.300%, 4/20/2052 | | | 10,838,808 | |
| | | | | | | | |
| | | | | | | 42,730,638 | |
| | | | | | | | |
| | | | Supermarkets — 0.1% | |
| | 8,705,000 | | | Albertsons Cos., Inc./Safeway, Inc./New Albertsons LP/Albertsons LLC, 3.250%, 3/15/2026, 144A | | | 7,645,924 | |
| | | | | | | | |
| | | | Technology — 2.2% | |
| | 2,425,000 | | | Baidu, Inc., 2.375%, 10/09/2030 | | | 1,914,925 | |
| | 4,515,000 | | | Baidu, Inc., 3.075%, 4/07/2025 | | | 4,269,790 | |
| | 3,890,000 | | | Broadcom, Inc., 3.137%, 11/15/2035, 144A | | | 2,725,720 | |
| | 10,254,000 | | | Corning, Inc., 5.450%, 11/15/2079 | | | 8,384,614 | |
| | 2,133,000 | | | Equifax, Inc., 2.600%, 12/15/2025 | | | 1,950,583 | |
| | 2,544,000 | | | Equifax, Inc., 3.300%, 12/15/2022 | | | 2,543,037 | |
| | 4,324,000 | | | Equifax, Inc., 7.000%, 7/01/2037 | | | 4,549,613 | |
| | 11,320,000 | | | HCL America, Inc., 1.375%, 3/10/2026, 144A | | | 9,938,847 | |
| | 6,756,000 | | | Hewlett Packard Enterprise Co., 4.450%, 10/02/2023 | | | 6,726,605 | |
| | 14,421,000 | | | Hewlett Packard Enterprise Co., 6.200%, 10/15/2035 | | | 14,107,621 | |
| | 12,214,000 | | | Iron Mountain, Inc., 4.500%, 2/15/2031, 144A | | | 9,443,620 | |
| | 5,460,000 | | | Jabil, Inc., 3.000%, 1/15/2031 | | | 4,307,780 | |
| | 11,294,000 | | | Microchip Technology, Inc., 2.670%, 9/01/2023 | | | 11,006,455 | |
| | 6,371,000 | | | Microchip Technology, Inc., 4.333%, 6/01/2023 | | | 6,340,106 | |
| | 6,151,000 | | | Molex Electronic Technologies LLC, 3.900%, 4/15/2025, 144A | | | 5,826,794 | |
| | 13,801,000 | | | Oracle Corp., 4.100%, 3/25/2061 | | | 8,688,692 | |
| | 4,505,000 | | | Qorvo, Inc., 1.750%, 12/15/2024, 144A | | | 4,152,765 | |
| | 3,513,000 | | | Sabre GLBL, Inc., 7.375%, 9/01/2025, 144A | | | 3,146,351 | |
| | 39,000 | | | Science Applications International Corp., 4.875%, 4/01/2028, 144A | | | 34,697 | |
| | 4,204,000 | | | Sensata Technologies, Inc., 3.750%, 2/15/2031, 144A | | | 3,311,512 | |
| | 14,793,000 | | | Tencent Holdings Ltd., 3.290%, 6/03/2060, 144A | | | 8,426,242 | |
| | 11,682,000 | | | Ziff Davis, Inc., 4.625%, 10/15/2030, 144A | | | 9,579,240 | |
| | | | | | | | |
| | | | | | | 131,375,609 | |
| | | | | | | | |
| | | | Tobacco — 0.5% | |
| | 31,751,000 | | | BAT Capital Corp., 2.789%, 9/06/2024 | | | 30,185,412 | |
| | | | | | | | |
See accompanying notes to financial statements.
| 40
Portfolio of Investments – as of September 30, 2022
Loomis Sayles Core Plus Bond Fund – (continued)
| | | | | | | | |
Principal
Amount (‡) | | | Description | | Value (†) | |
| | | | Transportation Services — 0.1% | |
| $ | 5,293,000 | | | Ryder System, Inc., MTN, 2.500%, 9/01/2024 | | $ | 5,051,897 | |
| | | | | | | | |
| | | | Treasuries — 23.0% | |
| | 8,220,100(††) | | | Mexican Fixed Rate Bonds, Series M, 5.750%, 3/05/2026, (MXN) | | | 35,816,281 | |
| | 25,562,431(††) | | | Mexican Fixed Rate Bonds, Series M 20, 8.500%, 5/31/2029, (MXN) | | | 119,789,744 | |
| | 468,727,000 | | | Republic of Uruguay, 8.500%, 3/15/2028, 144A, (UYU) | | | 9,945,928 | |
| | 49,100,000 | | | U.S. Treasury Bond, 1.125%, 8/15/2040 | | | 30,415,148 | |
| | 154,795,000 | | | U.S. Treasury Bond, 1.750%, 8/15/2041 | | | 105,835,035 | |
| | 234,700,000 | | | U.S. Treasury Bond, 2.000%, 11/15/2041 | | | 167,975,522 | |
| | 73,240,000 | | | U.S. Treasury Bond, 2.250%, 2/15/2052 | | | 53,213,438 | |
| | 71,990,000 | | | U.S. Treasury Bond, 2.375%, 2/15/2042 | | | 55,162,337 | |
| | 102,735,000 | | | U.S. Treasury Bond, 2.875%, 5/15/2052 | | | 86,152,929 | |
| | 30,540,000 | | | U.S. Treasury Bond, 3.000%, 8/15/2052 | | | 26,354,358 | |
| | 46,925,000 | | | U.S. Treasury Bond, 3.250%, 5/15/2042 | | | 41,645,938 | |
| | 105,150,000 | | | U.S. Treasury Note, 2.750%, 7/31/2027 | | | 99,013,511 | |
| | 169,775,000 | | | U.S. Treasury Note, 2.750%, 8/15/2032 | | | 155,238,016 | |
| | 1,135,000 | | | U.S. Treasury Note, 2.875%, 5/15/2032 | | | 1,049,343 | |
| | 2,250,000 | | | U.S. Treasury Note, 3.125%, 8/31/2027 | | | 2,158,242 | |
| | 206,885,000 | | | U.S. Treasury Note, 3.125%, 8/31/2029 | | | 196,346,795 | |
| | 5,300,000 | | | U.S. Treasury Note, 3.250%, 8/31/2024 | | | 5,204,352 | |
| | 80,895,000 | | | U.S. Treasury Note, 4.125%, 9/30/2027 | | | 81,160,437 | |
| | 4,253,157,000 | | | Uruguay Government International Bond, 8.250%, 5/21/2031, (UYU) | | | 84,182,683 | |
| | 93,095,000 | | | Uruguay Government International Bond, 8.500%, 3/15/2028, (UYU) | | | 1,975,385 | |
| | | | | | | | |
| | | | | | | 1,358,635,422 | |
| | | | | | | | |
| | | | Utility Other — 0.3% | |
| | 22,525,858 | | | Acwa Power Management & Investments One Ltd., 5.950%, 12/15/2039, 144A | | | 20,136,856 | |
| | | | | | | | |
| | | | Wireless — 1.0% | |
| | 5,400,000 | | | America Movil SAB de CV, 2.875%, 5/07/2030 | | | 4,535,027 | |
| | 14,780,000 | | | America Movil SAB de CV, 5.375%, 4/04/2032, 144A | | | 12,736,813 | |
| | 18,567,000 | | | Bharti Airtel Ltd., 4.375%, 6/10/2025, 144A | | | 17,905,866 | |
| | 983,000 | | | Crown Castle, Inc., 4.150%, 7/01/2050 | | | 728,767 | |
| | 5,305,000 | | | Empresa Nacional de Telecomunicaciones S.A., 3.050%, 9/14/2032, 144A | | | 3,899,175 | |
| | 7,180,000 | | | Kenbourne Invest S.A., 4.700%, 1/22/2028, 144A | | | 5,498,085 | |
| | 5,452,000 | | | Millicom International Cellular S.A., 4.500%, 4/27/2031, 144A | | | 3,886,949 | |
| | 11,510,000 | | | SBA Communications Corp., 3.125%, 2/01/2029 | | | 9,257,147 | |
| | | | | | | | |
| | | | | | | 58,447,829 | |
| | | | | | | | |
| | | | Wirelines — 0.6% | |
| | 17,028,000 | | | AT&T, Inc., 1.700%, 3/25/2026 | | | 15,142,815 | |
| | 7,956,000 | | | AT&T, Inc., 3.500%, 9/15/2053 | | | 5,301,406 | |
| | 1,863,000 | | | AT&T, Inc., 3.650%, 6/01/2051 | | | 1,258,562 | |
| | 11,391,000 | | | AT&T, Inc., 3.650%, 9/15/2059 | | | 7,380,234 | |
| | 7,539,000 | | | AT&T, Inc., 3.800%, 12/01/2057 | | | 5,092,931 | |
| | | | | | | | |
| | | | | | | 34,175,948 | |
| | | | | | | | |
| | | | Total Non-Convertible Bonds
(Identified Cost $6,223,128,302) | | | 5,332,515,636 | |
| | | | | | | | |
| | | | | | | | |
| | Municipals — 0.1% | |
| | | | Virginia — 0.1% | |
| 12,785,000 | | | University of Virginia, Revenue Bond, Series A, 3.227%, 9/01/2119 | | | 7,718,386 | |
| | | | | | | | |
| | | | Total Municipals
(Identified Cost $12,785,000) | | | 7,718,386 | |
| | | | | | | | |
| | | | | | | | |
| | | | Total Bonds and Notes
(Identified Cost $6,235,913,302) | | | 5,340,234,022 | |
| | | | | | | | |
| | | | | | | | |
| | Senior Loans — 2.9% | |
| | | | Brokerage — 0.2% | |
| | 5,479,198 | | | AllSpring Buyer LLC, Term Loan B, 3-month LIBOR + 3.000%, 6.688%, 11/01/2028(b)(e) | | | 5,309,343 | |
| | 3,609,725 | | | Citadel Securities LP, 2021 Term Loan B, 1-month SOFR + 2.500%, 5.649%, 2/02/2028(b)(f) | | | 3,500,531 | |
| | | | | | | | |
| | | | | | | 8,809,874 | |
| | | | | | | | |
| | | | Building Materials — 0.4% | |
| | 7,498,870 | | | American Builders & Contractors Supply Co., Inc., 2019 Term Loan, 1-month LIBOR + 2.000%, 5.115%, 1/15/2027(b)(f) | | | 7,250,507 | |
| | 8,249,737 | | | Beacon Roofing Supply, Inc., 2021 Term Loan B, 1-month LIBOR + 2.250%, 5.365%, 5/19/2028(b)(f) | | | 7,940,372 | |
| | 5,190,738 | | | Quikrete Holdings, Inc., 2016 1st Lien Term Loan, 1-month LIBOR + 2.625%, 5.740%, 2/01/2027(b)(f) | | | 4,974,440 | |
| | 4,017,819 | | | Quikrete Holdings, Inc., 2021 Term Loan B1, 1-month LIBOR + 3.000%, 6.115%, 6/11/2028(b)(f) | | | 3,858,794 | |
| | | | | | | | |
| | | | | | | 24,024,113 | |
| | | | | | | | |
| | | | Cable Satellite — 0.3% | |
| | 6,779,501 | | | CSC Holdings LLC, 2017 Term Loan B1, 1-month LIBOR + 2.250%, 5.068%, 7/17/2025(b)(f) | | | 6,444,797 | |
| | 6,942,629 | | | UPC Broadband Holding BV, 2020 USD Term Loan AT, 1-month LIBOR + 2.250%, 5.068%, 4/30/2028(b)(f) | | | 6,595,497 | |
| | 3,715,845 | | | Virgin Media Bristol LLC, USD Term Loan N, 1-month LIBOR + 2.500%, 5.318%, 1/31/2028(b)(f) | | | 3,540,383 | |
| | | | | | | | |
| | | | | | | 16,580,677 | |
| | | | | | | | |
| | | | Consumer Cyclical Services — 0.3% | |
| | 8,123,723 | | | AEA International Holdings (Lux) S.a.r.l., Term Loan B, 3-month LIBOR + 3.750%, 7.438%, 9/07/2028(b)(e) | | | 7,900,320 | |
| | 4,300,563 | | | RE/MAX International, Inc., 2021 Term Loan B, 1-month LIBOR + 2.500%, 5.625%, 7/21/2028(b)(e) | | | 4,028,208 | |
| | 5,634,401 | | | Uber Technologies, Inc., 2021 Term Loan B, 3-month LIBOR + 3.500%, 6.570%, 2/25/2027(b)(f) | | | 5,481,484 | |
| | | | | | | | |
| | | | | | | 17,410,012 | |
| | | | | | | | |
| | | | Consumer Products — 0.1% | |
| | 4,199,032 | | | Coty, Inc., 2018 USD Term Loan B, 1-month LIBOR + 2.250%, 4.935%, 4/07/2025(b)(f) | | | 4,073,817 | |
| | 2,764,814 | | | SRAM LLC, 2021 Term Loan B, LIBOR + 2.750%, 5.824%, 5/18/2028(e)(g) | | | 2,605,837 | |
| | | | | | | | |
| | | | | | | 6,679,654 | |
| | | | | | | | |
See accompanying notes to financial statements.
41 |
Portfolio of Investments – as of September 30, 2022
Loomis Sayles Core Plus Bond Fund – (continued)
| | | | | | | | |
Principal
Amount (‡) | | | Description | | Value (†) | |
| | | | Diversified Manufacturing — 0.0% | |
| $ | 857,552 | | | Griffon Corp., Term Loan B, 1-month SOFR + 2.500%, 5.564%, 1/24/2029(b)(e) | | $ | 822,538 | |
| | | | | | | | |
| | | | Electric — 0.3% | |
| | 5,712,754 | | | Calpine Corp., 2019 Term Loan B10, 1-month LIBOR + 2.000%, 5.115%, 8/12/2026(b)(f) | | | 5,469,962 | |
| | 2,093,497 | | | Calpine Corp., Term Loan B9, 1-month LIBOR + 2.000%, 5.120%, 4/05/2026(b)(f) | | | 2,008,878 | |
| | 7,609,776 | | | Pacific Gas & Electric Co., 2020 Term Loan, 1-month LIBOR + 3.000%, 6.125%, 6/23/2025(b)(e) | | | 7,263,531 | |
| | | | | | | | |
| | | | | | | 14,742,371 | |
| | | | | | | | |
| | | | Financial Other — 0.1% | |
| | 3,626,437 | | | Trans Union LLC, 2019 Term Loan B5, 1-month LIBOR + 1.750%, 4.865%, 11/16/2026(b)(f) | | | 3,492,259 | |
| | | | | | | | |
| | | | Food & Beverage — 0.1% | |
| | 6,976,941 | | | Aramark Services, Inc., 2021 Term Loan B, 1-month LIBOR + 2.500%, 5.615%, 4/06/2028(b)(f) | | | 6,813,401 | |
| | | | | | | | |
| | | | Gaming — 0.1% | |
| | 4,413,275 | | | Churchill Downs, Inc., 2021 Incremental Term Loan B1, 1-month LIBOR + 2.000%, 5.120%, 3/17/2028(b)(f) | | | 4,266,180 | |
| | | | | | | | |
| | | | Healthcare — 0.1% | |
| | 6,233,458 | | | Change Healthcare Holdings LLC, 2017 Term Loan B, 3-month Prime + 1.500%, 7.750%, 3/01/2024(b)(f) | | | 6,209,210 | |
| | | | | | | | |
| | | | Media Entertainment — 0.2% | |
| | 4,587,150 | | | E.W. Scripps Co. (The), 2020 Term Loan B3, 1-month LIBOR + 2.750%, 5.865%, 1/07/2028(b)(h) | | | 4,428,251 | |
| | 2,685,459 | | | Sinclair Television Group, Inc., Term Loan B2B, 1-month LIBOR + 2.500%, 5.620%, 9/30/2026(b)(f) | | | 2,537,758 | |
| | 5,882,533 | | | WMG Acquisition Corp., 2021 Term Loan G, 1-month LIBOR + 2.125%, 5.240%, 1/20/2028(b)(f) | | | 5,691,351 | |
| | | | | | | | |
| | | | | | | 12,657,360 | |
| | | | | | | | |
| | | | Pharmaceuticals — 0.1% | |
| | 8,849,865 | | | Elanco Animal Health, Inc., Term Loan B, 1-month LIBOR + 1.750%, 4.314%, 8/01/2027(b)(f) | | | 8,401,884 | |
| | | | | | | | |
| | | | Property & Casualty Insurance — 0.1% | |
| | 5,498,087 | | | Asurion LLC, 2020 Term Loan B8, 1-month LIBOR + 3.250%, 6.365%, 12/23/2026(b)(f) | | | 4,649,348 | |
| | 2,066,623 | | | USI, Inc., 2019 Incremental Term Loan B, 3-month LIBOR + 3.250%, 6.924%, 12/02/2026(b)(f) | | | 1,985,673 | |
| | | | | | | | |
| | | | | | | 6,635,021 | |
| | | | | | | | |
| | | | Restaurants — 0.1% | |
| | 4,899,700 | | | 1011778 B.C. Unlimited Liability Co., Term Loan B4, 1-month LIBOR + 1.750%, 4.871%, 11/19/2026(b)(f) | | | 4,674,853 | |
| | | | | | | | |
| | | | Retailers — 0.1% | |
| | 6,596,531 | | | Restoration Hardware, Inc., Term Loan B, 1-month LIBOR + 2.500%, 5.615%, 10/20/2028(b)(e) | | | 5,829,684 | |
| | | | | | | | |
| | | | Technology — 0.3% | |
| 7,456,975 | | | Iron Mountain, Inc., 2018 Term Loan B, 1-month LIBOR + 1.750%, 4.865%, 1/02/2026(b)(f) | | | 7,226,256 | |
| | 2,976,840 | | | Sabre GLBL, Inc., 2021 Term Loan B1, 1-month LIBOR + 3.500%, 6.615%, 12/17/2027(b)(e) | | | 2,658,080 | |
| | 4,745,260 | | | Sabre GLBL, Inc., 2021 Term Loan B2, 1-month LIBOR + 3.500%, 6.615%, 12/17/2027(b)(e) | | | 4,237,138 | |
| | 6,621,516 | | | SS&C Technologies, Inc., 2018 Term Loan B5, 1-month LIBOR + 1.750%, 4.865%, 4/16/2025(b)(f) | | | 6,414,593 | |
| | | | | | | | |
| | | | | | | 20,536,067 | |
| | | | | | | | |
| | | | Total Senior Loans
(Identified Cost $176,199,229) | | | 168,585,158 | |
| | | | | | | | |
| | | | | | | | |
| | Collateralized Loan Obligations — 1.7% | |
| | 1,585,000 | | | AMMC CLO Ltd., Series 2018-22A, Class D, 3-month LIBOR + 2.700%, 5.483%, 4/25/2031, 144A(b) | | | 1,365,051 | |
| | 400,000 | | | Ares XXXVII CLO Ltd., Series 2015-4A, Class A3R, 3-month LIBOR + 1.500%, 4.012%, 10/15/2030, 144A(b) | | | 378,571 | |
| | 1,000,000 | | | Atrium XIII, Series 13A, Class A1, 3-month LIBOR + 1.180%, 3.963%, 11/21/2030, 144A(b) | | | 984,725 | |
| | 1,165,000 | | | Bain Capital Credit CLO, Series 2019-1A, Class CR, 3-month LIBOR + 2.150%, 4.888%, 4/19/2034, 144A(b) | | | 1,048,095 | |
| | 420,000 | | | Bain Capital Credit CLO Ltd., Series 2021-4A, Class D, 3-month LIBOR + 3.100%, 5.810%, 10/20/2034, 144A(b) | | | 359,210 | |
| | 1,400,000 | | | Ballyrock CLO Ltd., Series 2019-1A, Class A2R, 3-month LIBOR + 1.550%, 4.062%, 7/15/2032, 144A(b) | | | 1,305,212 | |
| | 400,000 | | | Battalion CLO XIX Ltd., Series 2021-19A, Class D, 3-month LIBOR + 3.250%, 5.762%, 4/15/2034, 144A(b) | | | 345,954 | |
| | 1,675,000 | | | Betony CLO Ltd., Series 18-1A, Class A2, 3-month LIBOR + 1.600%, 4.382%, 4/30/2031, 144A(b) | | | 1,572,889 | |
| | 1,575,000 | | | BlueMountain CLO XXIX Ltd., Series 2020-29A, Class BR, 3-month LIBOR + 1.750%, 4.533%, 7/25/2034, 144A(b) | | | 1,472,003 | |
| | 2,035,000 | | | Carbone CLO Ltd., Series 2017-1A, Class A1, 3-month LIBOR + 1.140%, 3.850%, 1/20/2031, 144A(b) | | | 1,981,459 | |
| | 400,000 | | | CarVal CLO II Ltd., Series 2019-1A, Class DR, 3-month LIBOR + 3.200%, 5.910%, 4/20/2032, 144A(b) | | | 352,989 | |
| | 3,515,000 | | | CarVal CLO III Ltd., Series 2019-2A, Class DR, 3-month LIBOR + 2.950%, 5.660%, 7/20/2032, 144A(b) | | | 3,056,809 | |
| | 525,000 | | | Cayuga Park CLO Ltd., Series 2020-1A, Class B1R, 3-month LIBOR + 1.650%, 4.390%, 7/17/2034, 144A(b) | | | 491,366 | |
| | 2,165,000 | | | CIFC Funding Ltd., Series 18-2RA, Class A2, 3-month LIBOR + 1.250%, 3.960%, 1/20/2028, 144A(b) | | | 2,092,516 | |
| | 540,000 | | | CIFC Funding Ltd., Series 2019-3A, Class CR, 3-month LIBOR + 3.050%, 5.790%, 10/16/2034, 144A(b) | | | 481,478 | |
| | 2,500,000 | | | CIFC Funding Ltd., Series 2019-5A, Class CR, 3-month LIBOR + 3.150%, 5.662%, 1/15/2035, 144A(b) | | | 2,227,782 | |
See accompanying notes to financial statements.
| 42
Portfolio of Investments – as of September 30, 2022
Loomis Sayles Core Plus Bond Fund – (continued)
| | | | | | | | |
Principal
Amount (‡) | | | Description | | Value (†) | |
| $ | 1,935,000 | | | CIFC Funding Ltd., Series 2020-1A, Class BR, 3-month LIBOR + 1.650%, 4.162%, 7/15/2036, 144A(b) | | $ | 1,814,115 | |
| | 4,500,000 | | | CIFC Funding Ltd., Series 2020-3A, Class DR, 3-month LIBOR + 3.100%, 5.810%, 10/20/2034, 144A(b) | | | 4,000,293 | |
| | 7,190,000 | | | CIFC Funding Ltd., Series 2021-7A, Class D, 3-month LIBOR + 3.000%, 5.783%, 1/23/2035, 144A(b) | | | 6,301,596 | |
| | 7,655,000 | | | Crown City CLO III, Series 2021-1A, Class A1A, 3-month LIBOR + 1.170%, 3.880%, 7/20/2034, 144A(b) | | | 7,290,821 | |
| | 5,450,000 | | | Dryden CLO Ltd., Series 2020-78A, Class A, 3-month LIBOR + 1.180%, 3.920%, 4/17/2033, 144A(b) | | | 5,294,664 | |
| | 2,520,000 | | | Elmwood CLO III Ltd., Series 2019-3A, Class AR, 3-month LIBOR + 1.160%, 3.870%, 10/20/2034, 144A(b) | | | 2,412,212 | |
| | 2,700,000 | | | Elmwood CLO IV Ltd., Series 2020-1A, Class A, 3-month LIBOR + 1.240%, 3.752%, 4/15/2033, 144A(b) | | | 2,610,795 | |
| | 1,750,000 | | | Fortress Credit BSL XII Ltd., Series 2021-4A, Class D, 3-month LIBOR + 3.650%, 6.162%, 10/15/2034, 144A(b) | | | 1,504,942 | |
| | 1,650,000 | | | Gilbert Park CLO Ltd., Series 2017-1A, Class D, 3-month LIBOR + 2.950%, 5.462%, 10/15/2030, 144A(b) | | | 1,479,723 | |
| | 2,000,000 | | | LCM XX LP, Series 20A, Class BR, 3-month LIBOR + 1.550%, 4.260%, 10/20/2027, 144A(b) | | | 1,946,748 | |
| | 1,190,000 | | | Long Point Park CLO Ltd., Series 2017-1A, Class A2, 3-month LIBOR + 1.375%, 4.115%, 1/17/2030, 144A(b) | | | 1,126,354 | |
| | 1,650,000 | | | Madison Park Funding XLVI Ltd., Series 2020-46A, Class DR, 3-month LIBOR + 3.150%, 5.662%, 10/15/2034, 144A(b) | | | 1,476,399 | |
| | 475,000 | | | Madison Park Funding XXXV Ltd., Series 2019-35A, Class CR, 3-month LIBOR + 1.900%, 4.610%, 4/20/2032, 144A(b) | | | 437,139 | |
| | 1,250,000 | | | Magnetite XXI Ltd., Series 2019-21A, Class BR, 3-month LIBOR + 1.350%, 4.060%, 4/20/2034, 144A(b) | | | 1,156,145 | |
| | 4,320,000 | | | Magnetite XXIII Ltd., Series 2019-23A, Class DR, 3-month LIBOR + 3.050%, 5.833%, 1/25/2035, 144A(b) | | | 3,825,779 | |
| | 1,900,000 | | | Magnetite XXX Ltd., Series 2021-30A, Class D, 3-month LIBOR + 2.950%, 5.733%, 10/25/2034, 144A(b) | | | 1,678,069 | |
| | 465,000 | | | MP CLO VIII Ltd., Class ARR, Series 2015-2A, 3-month LIBOR + 1.200%, 3.993%, 4/28/2034, 144A(b) | | | 440,119 | |
| | 3,410,000 | | | Neuberger Berman Loan Advisers CLO Ltd., Series 2021-40A, Class B, 3-month LIBOR + 1.400%, 4.140%, 4/16/2033, 144A(b) | | | 3,201,461 | |
| | 2,745,000 | | | NYACK Park CLO Ltd., Series 2021-1A, Class D, 3-month LIBOR + 2.800%, 5.510%, 10/20/2034, 144A(b) | | | 2,375,463 | |
| | 1,150,000 | | | OCP CLO Ltd., Series 2021-21A, Class D, 3-month LIBOR + 2.950%, 5.660%, 7/20/2034, 144A(b) | | | 975,760 | |
| | 7,630,000 | | | OHA Credit Funding Ltd., Series 2021-8A, Class B1, 3-month LIBOR + 1.500%, 4.240%, 1/18/2034, 144A(b) | | | 7,141,962 | |
| | 720,000 | | | OHA Credit Partners VII Ltd., Series 2012-7A, Class D1R3, 3-month LIBOR + 2.900%, 5.884%, 2/20/2034, 144A(b) | | | 637,139 | |
| 3,895,000 | | | OHA Credit Partners XIII Ltd., Series 2016-13A, Class DR, 3-month LIBOR + 3.200%, 5.932%, 10/25/2034, 144A(b) | | | 3,436,742 | |
| | 415,000 | | | Palmer Square Loan Funding Ltd., Series 2020-1A, Class A2, 3-month LIBOR + 1.350%, 4.334%, 2/20/2028, 144A(b) | | | 415,000 | |
| | 2,120,000 | | | Palmer Square Loan Funding Ltd., Series 2020-4A, Class C, 3-month LIBOR + 3.600%, 6.597%, 11/25/2028, 144A(b) | | | 2,060,700 | |
| | 5,670,000 | | | Post CLO Ltd., Series 2021-1A, Class B, 3-month LIBOR + 1.750%, 4.262%, 10/15/2034, 144A(b) | | | 5,296,789 | |
| | 1,245,000 | | | Post CLO Ltd., Series 2022-1A, Class B, 3-month SOFR + 1.900%, 2.613%, 4/20/2035, 144A(b) | | | 1,174,262 | |
| | 3,730,000 | | | PPM CLO Ltd., Series 2021-5A, Class B, 3-month LIBOR + 1.700%, 4.440%, 10/18/2034, 144A(b) | | | 3,488,998 | |
| | 3,250,000 | | | Riserva CLO Ltd., Series 2016-3A, Class DRR, 3-month LIBOR + 3.250%, 5.990%, 1/18/2034, 144A(b) | | | 2,802,517 | |
| | 1,495,000 | | | Rockford Tower CLO Ltd., Series 2017-1A, Class BR2A, 3-month LIBOR + 1.650%, 4.360%, 4/20/2034, 144A(b) | | | 1,385,274 | |
| | 1,000,000 | | | Signal Peak CLO Ltd., Series 2022-12A, Class B1, 3-month SOFR + 2.600%, 4.717%, 7/18/2034, 144A(b) | | | 973,016 | |
| | 1,000,000 | | | Silver Creek CLO Ltd., Series 2014-1A, Class DR, 3-month LIBOR + 3.350%, 6.060%, 7/20/2030, 144A(b) | | | 907,494 | |
| | 400,000 | | | Symphony CLO XIV Ltd., Series 2014-14A, Class CR, 3-month LIBOR + 2.100%, 4.583%, 7/14/2026, 144A(b) | | | 395,124 | |
| | 1,000,000 | | | Trinitas CLO XVI Ltd., Series 2021-16A, Class A1, 3-month LIBOR + 1.180%, 3.890%, 7/20/2034, 144A(b) | | | 956,597 | |
| | 351,594 | | | WhiteHorse IX Ltd., Series 2014-9A, Class C, 3-month LIBOR + 2.700%, 5.440%, 7/17/2026, 144A(b) | | | 351,281 | |
| | | | | | | | |
| | | | Total Collateralized Loan Obligations
(Identified Cost $109,571,729) | | | 102,287,601 | |
| | | | | | | | |
| | | | | | | | |
| | Short-Term Investments — 3.9% | |
| | 39,910,642 | | | Tri-Party Repurchase Agreement with Fixed Income Clearing Corporation, dated 9/30/2022 at 1.100% to be repurchased at $39,914,301 on 10/03/2022 collateralized by $41,509,900 U.S. Treasury Note, 3.500% due 9/15/2025 valued at $40,708,883 including accrued interest (Note 2 of Notes to Financial Statements) | | | 39,910,642 | |
| | 61,520,000 | | | U.S. Treasury Bills, 2.301%-2.358%, 10/13/2022(i)(j) | | | 61,475,526 | |
| | 10,720,000 | | | U.S. Treasury Bills, 2.330%, 10/06/2022(i) | | | 10,717,809 | |
| | 119,885,000 | | | U.S. Treasury Bills, 2.400%-2.450%, 10/11/2022(i)(j) | | | 119,819,730 | |
| | | | | | | | |
| | | | Total Short-Term Investments
(Identified Cost $231,929,076) | | | 231,923,707 | |
| | | | | | | | |
| | | | | | | | |
| | | | Total Investments — 98.8%
(Identified Cost $6,753,613,336) | | | 5,843,030,488 | |
| | | | Other assets less liabilities — 1.2% | | | 68,362,990 | |
| | | | | | | | |
| | | | Net Assets — 100.0% | | $ | 5,911,393,478 | |
| | | | | | | | |
| | | | | | | | |
See accompanying notes to financial statements.
43 |
Portfolio of Investments – as of September 30, 2022
Loomis Sayles Core Plus Bond Fund – (continued)
| | | | | | | | |
| | | | | | | | |
| | (‡) | | | Principal Amount stated in U.S. dollars unless otherwise noted. | |
| | (†) | | | See Note 2 of Notes to Financial Statements. | |
| | (††) | | | Amount shown represents units. One unit represents a principal amount of 100. | |
| | (a) | | | Variable rate security. The interest rate adjusts periodically based on; (i) changes in current interest rates and/or prepayments on underlying pools of assets, if applicable, (ii) reference to a base lending rate plus or minus a margin, and/or (iii) reference to a base lending rate adjusted by a multiplier and/or subject to certain floors or caps. Rate as of September 30, 2022 is disclosed. | |
| | (b) | | | Variable rate security. Rate as of September 30, 2022 is disclosed. | |
| | (c) | | | Level 3 security. Value has been determined using significant unobservable inputs. See Note 3 of Notes to Financial Statements. | |
| | (d) | | | The Fund’s investment in mortgage related securities of Federal Home Loan Mortgage Corporation, Federal National Mortgage Association and Government National Mortgage Association are interests in separate pools of mortgages. All separate investments in securities of each issuer which have the same coupon rate have been aggregated for the purpose of presentation in the Portfolio of Investments. | |
| | (e) | | | Stated interest rate has been determined in accordance with the provisions of the loan agreement and is subject to a minimum benchmark floor rate of 0.50%, to which the spread is added. | |
| | (f) | | | Stated interest rate has been determined in accordance with the provisions of the loan agreement and is subject to a minimum benchmark floor rate of 0.00%, to which the spread is added. | |
| | (g) | | | Variable rate security. Rate shown represents the weighted average rate of underlying contracts at September 30, 2022. Interest rates on contracts are primarily redetermined either weekly, monthly or quarterly by reference to the indicated base lending rate and spread and the reset period. | |
| | | | | | | | |
| | (h) | | | Stated interest rate has been determined in accordance with the provisions of the loan agreement and is subject to a minimum benchmark floor rate of 0.75%, to which the spread is added. | |
| | (i) | | | Interest rate represents discount rate at time of purchase; not a coupon rate. | |
| | (j) | | | The Fund’s investment in U.S. Government/Agency securities is comprised of various lots with differing discount rates. These separate investments, which have the same maturity date, have been aggregated for the purpose of presentation in the Portfolio of Investments. | |
| | 144A | | | All or a portion of these securities are exempt from registration under Rule 144A of the Securities Act of 1933. These securities may be resold in transactions exempt from registration, normally to qualified institutional buyers. At September 30, 2022, the value of Rule 144A holdings amounted to $1,385,435,271 or 23.4% of net assets. | |
| | ABS | | | Asset-Backed Securities | |
| | EMTN | | | Euro Medium Term Note | |
| | FHLMC | | | Federal Home Loan Mortgage Corp. | |
| | FNMA | | | Federal National Mortgage Association | |
| | GMTN | | | Global Medium Term Note | |
| | GNMA | | | Government National Mortgage Association | |
| | LIBOR | | | London Interbank Offered Rate | |
| | MTN | | | Medium Term Note | |
| | REITs | | | Real Estate Investment Trusts | |
| | SOFR | | | Secured Overnight Financing Rate | |
| | MXN | | | Mexican Peso | |
| | UYU | | | Uruguayan Peso | |
At September 30, 2022, open long futures contracts were as follows:
| | | | | | | | | | | | | | | | | | | | |
| Financial Futures | | Expiration
Date | | | Contracts | | | Notional
Amount | | | Value | | | Unrealized
Appreciation
(Depreciation) | |
10 Year U.S. Treasury Note | | | 12/20/2022 | | | | 1,404 | | | $ | 161,822,366 | | | $ | 157,335,750 | | | $ | (4,486,616 | ) |
2 Year U.S. Treasury Note | | | 12/30/2022 | | | | 773 | | | | 161,330,970 | | | | 158,766,954 | | | | (2,564,016 | ) |
Ultra Long U.S. Treasury Bond | | | 12/20/2022 | | | | 602 | | | | 89,986,609 | | | | 82,474,000 | | | | (7,512,609 | ) |
| | | | | | | | | | | | | | | | | | | | |
Total | | | | | | | | | | | | | | | | | | $ | (14,563,241 | ) |
| | | | | | | | | | | | | | | | | | | | |
Industry Summary at September 30, 2022
| | | | |
Mortgage Related | | | 26.8 | % |
Treasuries | | | 23.0 | |
Banking | | | 7.9 | |
Technology | | | 2.5 | |
Finance Companies | | | 2.3 | |
Non-Agency Commercial Mortgage-Backed Securities | | | 2.2 | |
Electric | | | 2.2 | |
Government Owned – No Guarantee | | | 2.1 | |
Other Investments, less than 2% each | | | 24.2 | |
Short-Term Investments | | | 3.9 | |
Collateralized Loan Obligations | | | 1.7 | |
| | | | |
Total Investments | | | 98.8 | |
Other assets less liabilities (including futures contracts) | | | 1.2 | |
| | | | |
Net Assets | | | 100.0 | % |
| | | | |
See accompanying notes to financial statements.
| 44
Portfolio of Investments – as of September 30, 2022
Loomis Sayles Credit Income Fund
| | | | | | | | |
Principal
Amount | | | Description | | Value (†) | |
| | Bonds and Notes — 91.3% of Net Assets | |
| | Non-Convertible Bonds — 86.1% | |
| | | | Aerospace & Defense — 3.0% | |
| $ | 125,000 | | | Boeing Co. (The), 2.196%, 2/04/2026 | | $ | 110,930 | |
| | 20,000 | | | Boeing Co. (The), 2.250%, 6/15/2026 | | | 17,577 | |
| | 20,000 | | | Boeing Co. (The), 2.950%, 2/01/2030 | | | 16,079 | |
| | 5,000 | | | Boeing Co. (The), 3.100%, 5/01/2026 | | | 4,564 | |
| | 10,000 | | | Boeing Co. (The), 3.200%, 3/01/2029 | | | 8,349 | |
| | 5,000 | | | Boeing Co. (The), 3.250%, 2/01/2035 | | | 3,531 | |
| | 5,000 | | | Boeing Co. (The), 3.375%, 6/15/2046 | | | 3,021 | |
| | 5,000 | | | Boeing Co. (The), 3.500%, 3/01/2039 | | | 3,338 | |
| | 15,000 | | | Boeing Co. (The), 3.550%, 3/01/2038 | | | 10,275 | |
| | 220,000 | | | Boeing Co. (The), 3.625%, 2/01/2031 | | | 182,611 | |
| | 5,000 | | | Boeing Co. (The), 3.625%, 3/01/2048 | | | 3,110 | |
| | 35,000 | | | Boeing Co. (The), 3.750%, 2/01/2050 | | | 22,606 | |
| | 15,000 | | | Boeing Co. (The), 3.825%, 3/01/2059 | | | 9,036 | |
| | 10,000 | | | Boeing Co. (The), 3.850%, 11/01/2048 | | | 6,473 | |
| | 15,000 | | | Boeing Co. (The), 3.900%, 5/01/2049 | | | 9,797 | |
| | 45,000 | | | Boeing Co. (The), 5.150%, 5/01/2030 | | | 41,627 | |
| | 30,000 | | | Huntington Ingalls Industries, Inc., 3.844%, 5/01/2025 | | | 28,749 | |
| | 20,000 | | | Huntington Ingalls Industries, Inc., 4.200%, 5/01/2030 | | | 17,647 | |
| | 125,000 | | | Textron, Inc., 3.000%, 6/01/2030 | | | 102,922 | |
| | 20,000 | | | TransDigm, Inc., 6.250%, 3/15/2026, 144A | | | 19,400 | |
| | | | | | | | |
| | | | | | | 621,642 | |
| | | | | | | | |
| | | | Airlines — 0.3% | |
| | 70,949 | | | American Airlines Pass Through Trust, Series 2016-3, Class A, 3.250%, 4/15/2030 | | | 55,118 | |
| | 11,940 | | | United Airlines Pass Through Trust, Series 2020-1, Class B, 4.875%, 7/15/2027 | | | 10,988 | |
| | | | | | | | |
| | | | | | | 66,106 | |
| | | | | | | | |
| | | | Automotive — 1.1% | |
| | 60,000 | | | Allison Transmission, Inc., 3.750%, 1/30/2031, 144A | | | 45,995 | |
| | 15,000 | | | Ford Motor Co., 3.250%, 2/12/2032 | | | 10,805 | |
| | 170,000 | | | General Motors Co., 5.200%, 4/01/2045 | | | 129,442 | |
| | 40,000 | | | General Motors Co., 6.250%, 10/02/2043 | | | 34,745 | |
| | 5,000 | | | General Motors Financial Co., Inc., Series C, (fixed rate to 9/30/2030, variable rate thereafter), 5.700%(a) | | | 4,286 | |
| | | | | | | | |
| | | | | | | 225,273 | |
| | | | | | | | |
| | | | Banking — 10.7% | |
| | 40,000 | | | Ally Financial, Inc., 2.200%, 11/02/2028 | | | 30,903 | |
| | 65,000 | | | Ally Financial, Inc., Series B, (fixed rate to 5/15/2026, variable rate thereafter), 4.700%(a) | | | 50,668 | |
| | 50,000 | | | Ally Financial, Inc., Series C, (fixed rate to 5/15/2028, variable rate thereafter), 4.700%(a) | | | 35,625 | |
| | 270,000 | | | Bank of America Corp., MTN, 4.250%, 10/22/2026 | | | 256,507 | |
| | 200,000 | | | Barclays PLC, (fixed rate to 9/23/2030, variable rate thereafter), 3.564%, 9/23/2035 | | | 146,964 | |
| | 215,000 | | | Citigroup, Inc., 4.450%, 9/29/2027 | | | 199,020 | |
| | 250,000 | | | Credit Agricole S.A., (fixed rate to 1/10/2028, variable rate thereafter), 4.000%, 1/10/2033, 144A | | | 214,640 | |
| | 150,000 | | | Deutsche Bank AG, (fixed rate to 9/18/2030, variable rate thereafter), 3.547%, 9/18/2031 | | | 114,368 | |
| | 120,000 | | | Goldman Sachs Group, Inc. (The), (fixed rate to 1/24/2024, variable rate thereafter), 1.757%, 1/24/2025 | | | 114,017 | |
| | 390,000 | | | Morgan Stanley, 3.625%, 1/20/2027 | | | 362,787 | |
| | 80,000 | | | Morgan Stanley, (fixed rate to 1/21/2027, variable rate thereafter), 2.475%, 1/21/2028 | | | 69,920 | |
| | 200,000 | | | NatWest Group PLC, (fixed rate to 6/14/2026, variable rate thereafter), 1.642%, 6/14/2027 | | | 167,911 | |
| | 115,000 | | | Santander Holdings USA, Inc., 3.244%, 10/05/2026 | | | 102,906 | |
| | 200,000 | | | Societe Generale S.A., (fixed rate to 7/08/2030, variable rate thereafter), 3.653%, 7/08/2035, 144A | | | 151,224 | |
| | | | Banking — continued | |
| 200,000 | | | Standard Chartered PLC, (fixed rate to 4/01/2030, variable rate thereafter), 4.644%, 4/01/2031, 144A | | | 174,703 | |
| | | | | | | | |
| | | | | | | 2,192,163 | |
| | | | | | | | |
| | | | Brokerage — 0.9% | |
| | 15,000 | | | Jefferies Group LLC, 6.250%, 1/15/2036 | | | 14,010 | |
| | 180,000 | | | Jefferies Group LLC, 6.500%, 1/20/2043 | | | 168,874 | |
| | | | | | | | |
| | | | | | | 182,884 | |
| | | | | | | | |
| | | | Cable Satellite — 5.3% | |
| | 125,000 | | | CCO Holdings LLC/CCO Holdings Capital Corp., 4.250%, 2/01/2031, 144A | | | 96,703 | |
| | 120,000 | | | CCO Holdings LLC/CCO Holdings Capital Corp., 4.500%, 8/15/2030, 144A | | | 94,901 | |
| | 35,000 | | | CCO Holdings LLC/CCO Holdings Capital Corp., 4.750%, 2/01/2032, 144A | | | 27,257 | |
| | 25,000 | | | CCO Holdings LLC/CCO Holdings Capital Corp., 5.125%, 5/01/2027, 144A | | | 22,563 | |
| | 10,000 | | | CCO Holdings LLC/CCO Holdings Capital Corp., 5.500%, 5/01/2026, 144A | | | 9,475 | |
| | 5,000 | | | Charter Communications Operating LLC/Charter Communications Operating Capital, 2.300%, 2/01/2032 | | | 3,570 | |
| | 20,000 | | | Charter Communications Operating LLC/Charter Communications Operating Capital, 2.800%, 4/01/2031 | | | 15,119 | |
| | 5,000 | | | Charter Communications Operating LLC/Charter Communications Operating Capital, 4.400%, 4/01/2033 | | | 4,140 | |
| | 90,000 | | | Charter Communications Operating LLC/Charter Communications Operating Capital Corp., 3.950%, 6/30/2062 | | | 53,369 | |
| | 150,000 | | | Charter Communications Operating LLC/Charter Communications Operating Capital Corp., 4.800%, 3/01/2050 | | | 108,208 | |
| | 200,000 | | | CSC Holdings LLC, 4.625%, 12/01/2030, 144A | | | 136,000 | |
| | 200,000 | | | CSC Holdings LLC, 5.000%, 11/15/2031, 144A | | | 132,108 | |
| | 15,000 | | | DIRECTV Financing LLC/DIRECTV Financing Co-Obligor, Inc., 5.875%, 8/15/2027, 144A | | | 12,932 | |
| | 155,000 | | | DISH DBS Corp., 5.125%, 6/01/2029 | | | 91,063 | |
| | 175,000 | | | DISH DBS Corp., 5.250%, 12/01/2026, 144A | | | 143,368 | |
| | 200,000 | | | Time Warner Cable LLC, 4.500%, 9/15/2042 | | | 138,081 | |
| | | | | | | | |
| | | | | | | 1,088,857 | |
| | | | | | | | |
| | | | Chemicals — 1.5% | |
| | 15,000 | | | Celanese U.S. Holdings LLC, 6.330%, 7/15/2029 | | | 13,980 | |
| | 10,000 | | | Celanese U.S. Holdings LLC, 6.379%, 7/15/2032 | | | 9,293 | |
| | 70,000 | | | CF Industries, Inc., 4.500%, 12/01/2026, 144A | | | 67,105 | |
| | 15,000 | | | FMC Corp., 3.450%, 10/01/2029 | | | 12,880 | |
| | 60,000 | | | Hercules LLC, 6.500%, 6/30/2029 | | | 57,840 | |
| | 200,000 | | | Orbia Advance Corp. SAB de CV, 2.875%, 5/11/2031, 144A | | | 146,118 | |
| | | | | | | | |
| | | | | | | 307,216 | |
| | | | | | | | |
| | | | Construction Machinery — 0.7% | |
| | 90,000 | | | Caterpillar Financial Services Corp., MTN, 0.950%, 1/10/2024 | | | 86,195 | |
| | 20,000 | | | John Deere Capital Corp., MTN, 0.900%, 1/10/2024 | | | 19,102 | |
| | 35,000 | | | John Deere Capital Corp., MTN, 1.250%, 1/10/2025 | | | 32,480 | |
| | | | | | | | |
| | | | | | | 137,777 | |
| | | | | | | | |
| | | | Consumer Cyclical Services — 2.5% | |
| | 10,000 | | | Expedia Group, Inc., 2.950%, 3/15/2031 | | | 7,758 | |
| | 195,000 | | | Expedia Group, Inc., 3.250%, 2/15/2030 | | | 158,147 | |
| | 50,000 | | | Go Daddy Operating Co. LLC/GD Finance Co., Inc., 3.500%, 3/01/2029, 144A | | | 40,894 | |
| | 325,000 | | | Uber Technologies, Inc., 4.500%, 8/15/2029, 144A | | | 273,203 | |
| | 25,000 | | | Uber Technologies, Inc., 7.500%, 9/15/2027, 144A | | | 24,500 | |
| | | | | | | | |
| | | | | | | 504,502 | |
| | | | | | | | |
See accompanying notes to financial statements.
45 |
Portfolio of Investments – as of September 30, 2022
Loomis Sayles Credit Income Fund – (continued)
| | | | | | | | |
Principal
Amount | | | Description | | Value (†) | |
| | | | Electric — 0.9% | |
| $ | 15,000 | | | AES Corp. (The), 2.450%, 1/15/2031 | | $ | 11,475 | |
| | 5,000 | | | AES Corp. (The), 3.950%, 7/15/2030, 144A | | | 4,281 | |
| | 60,000 | | | Calpine Corp., 3.750%, 3/01/2031, 144A | | | 46,950 | |
| | 20,000 | | | IPALCO Enterprises, Inc., 4.250%, 5/01/2030 | | | 17,352 | |
| | 35,000 | | | NRG Energy, Inc., 4.450%, 6/15/2029, 144A | | | 30,359 | |
| | 35,000 | | | NRG Energy, Inc., 5.250%, 6/15/2029, 144A | | | 30,625 | |
| | 35,000 | | | Pacific Gas & Electric Co., 3.500%, 8/01/2050 | | | 21,300 | |
| | 15,000 | | | Pacific Gas & Electric Co., 5.450%, 6/15/2027 | | | 14,130 | |
| | 20,000 | | | Vistra Operations Co. LLC, 3.700%, 1/30/2027, 144A | | | 17,713 | |
| | | | | | | | |
| | | | | | | 194,185 | |
| | | | | | | | |
| | | | Finance Companies — 7.0% | |
| | 150,000 | | | AerCap Ireland Capital DAC/AerCap Global Aviation Trust, 3.875%, 1/23/2028 | | | 129,465 | |
| | 105,000 | | | Air Lease Corp., 3.125%, 12/01/2030 | | | 82,674 | |
| | 205,000 | | | Air Lease Corp., MTN, 3.000%, 2/01/2030 | | | 162,343 | |
| | 40,000 | | | Air Lease Corp., Series B, (fixed rate to 6/15/2026, variable rate thereafter), 4.650%(a) | | | 33,395 | |
| | 125,000 | | | Aircastle Ltd., 4.125%, 5/01/2024 | | | 120,115 | |
| | 15,000 | | | Aircastle Ltd., (fixed rate to 6/15/2026, variable rate thereafter), 5.250%, 144A(a) | | | 11,251 | |
| | 40,000 | | | Ares Capital Corp., 2.875%, 6/15/2028 | | | 31,483 | |
| | 60,000 | | | Ares Capital Corp., 3.200%, 11/15/2031 | | | 42,767 | |
| | 35,000 | | | Aviation Capital Group LLC, 1.950%, 1/30/2026, 144A | | | 29,379 | |
| | 30,000 | | | Barings BDC, Inc., 3.300%, 11/23/2026, 144A | | | 24,883 | |
| | 115,000 | | | Blackstone Secured Lending Fund, 2.125%, 2/15/2027 | | | 92,758 | |
| | 40,000 | | | FS KKR Capital Corp., 3.125%, 10/12/2028 | | | 31,062 | |
| | 35,000 | | | FS KKR Capital Corp., 3.400%, 1/15/2026 | | | 30,882 | |
| | 75,000 | | | Hercules Capital, Inc., 3.375%, 1/20/2027 | | | 62,195 | |
| | 60,000 | | | Navient Corp., 5.000%, 3/15/2027 | | | 49,075 | |
| | 30,000 | | | Oaktree Specialty Lending Corp., 2.700%, 1/15/2027 | | | 25,261 | |
| | 10,000 | | | OneMain Finance Corp., 7.125%, 3/15/2026 | | | 9,014 | |
| | 50,000 | | | Owl Rock Capital Corp., 2.625%, 1/15/2027 | | | 40,399 | |
| | 50,000 | | | Owl Rock Capital Corp., 2.875%, 6/11/2028 | | | 38,077 | |
| | 60,000 | | | Owl Rock Technology Finance Corp., 2.500%, 1/15/2027 | | | 48,139 | |
| | 140,000 | | | Rocket Mortgage LLC/Rocket Mortgage Co-Issuer, Inc., 2.875%, 10/15/2026, 144A | | | 114,800 | |
| | 75,000 | | | Rocket Mortgage LLC/Rocket Mortgage Co-Issuer, Inc., 3.625%, 3/01/2029, 144A | | | 57,724 | |
| | 160,000 | | | Rocket Mortgage LLC/Rocket Mortgage Co-Issuer, Inc., 3.875%, 3/01/2031, 144A | | | 115,977 | |
| | 60,000 | | | Rocket Mortgage LLC/Rocket Mortgage Co-Issuer, Inc., 4.000%, 10/15/2033, 144A | | | 41,251 | |
| | | | | | | | |
| | | | | | | 1,424,369 | |
| | | | | | | | |
| | | | Financial Other — 0.8% | |
| | 30,000 | | | Icahn Enterprises LP/Icahn Enterprises Finance Corp., 4.375%, 2/01/2029 | | | 24,146 | |
| | 115,000 | | | Icahn Enterprises LP/Icahn Enterprises Finance Corp., 5.250%, 5/15/2027 | | | 100,684 | |
| | 35,000 | | | Nationstar Mortgage Holdings, Inc., 5.750%, 11/15/2031, 144A | | | 25,668 | |
| | 200,000 | | | Times China Holdings Ltd., 6.200%, 3/22/2026 | | | 22,144 | |
| | | | | | | | |
| | | | | | | 172,642 | |
| | | | | | | | |
| | | | Food & Beverage — 1.5% | |
| | 30,000 | | | Central American Bottling Corp./CBC Bottling Holdco SL/Beliv Holdco SL, 5.250%, 4/27/2029, 144A | | | 26,025 | |
| | 5,000 | | | Darling Ingredients, Inc., 6.000%, 6/15/2030, 144A | | | 4,758 | |
| | 20,000 | | | JBS USA LUX S.A./JBS USA Food Co./JBS USA Finance, Inc., 3.000%, 2/02/2029, 144A | | | 16,363 | |
| | 10,000 | | | Pilgrim’s Pride Corp., 3.500%, 3/01/2032, 144A | | | 7,542 | |
| | 10,000 | | | Pilgrim’s Pride Corp., 4.250%, 4/15/2031, 144A | | | 7,983 | |
| | | | Food & Beverage — continued | |
| 50,000 | | | Pilgrim’s Pride Corp., 5.875%, 9/30/2027, 144A | | | 48,625 | |
| | 60,000 | | | Post Holdings, Inc., 4.625%, 4/15/2030, 144A | | | 49,275 | |
| | 190,000 | | | Smithfield Foods, Inc., 3.000%, 10/15/2030, 144A | | | 146,707 | |
| | | | | | | | |
| | | | | | | 307,278 | |
| | | | | | | | |
| | | | Gaming — 0.9% | |
| | 20,000 | | | GLP Capital LP/GLP Financing II, Inc., 3.250%, 1/15/2032 | | | 15,034 | |
| | 55,000 | | | Scientific Games International, Inc., 7.000%, 5/15/2028, 144A | | | 51,857 | |
| | 5,000 | | | Scientific Games International, Inc., 7.250%, 11/15/2029, 144A | | | 4,654 | |
| | 85,000 | | | VICI Properties LP/VICI Note Co., Inc., 3.875%, 2/15/2029, 144A | | | 71,307 | |
| | 20,000 | | | VICI Properties LP/VICI Note Co., Inc., 4.250%, 12/01/2026, 144A | | | 18,052 | |
| | 5,000 | | | VICI Properties LP/VICI Note Co., Inc., 4.500%, 9/01/2026, 144A | | | 4,566 | |
| | 5,000 | | | VICI Properties LP/VICI Note Co., Inc., 4.625%, 6/15/2025, 144A | | | 4,705 | |
| | 10,000 | | | VICI Properties LP/VICI Note Co., Inc., 5.625%, 5/01/2024, 144A | | | 9,827 | |
| | | | | | | | |
| | | | | | | 180,002 | |
| | | | | | | | |
| | | | Government Owned – No Guarantee — 0.1% | |
| | 25,000 | | | EcoPetrol S.A., 4.625%, 11/02/2031 | | | 17,500 | |
| | | | | | | | |
| | | | Health Insurance — 0.7% | |
| | 90,000 | | | Centene Corp., 2.500%, 3/01/2031 | | | 67,840 | |
| | 35,000 | | | Centene Corp., 2.625%, 8/01/2031 | | | 26,379 | |
| | 20,000 | | | Centene Corp., 3.000%, 10/15/2030 | | | 15,839 | |
| | 5,000 | | | Centene Corp., 4.625%, 12/15/2029 | | | 4,493 | |
| | 25,000 | | | Molina Healthcare, Inc., 3.875%, 5/15/2032, 144A | | | 20,478 | |
| | | | | | | | |
| | | | | | | 135,029 | |
| | | | | | | | |
| | | | Healthcare — 1.6% | |
| | 15,000 | | | Catalent Pharma Solutions, Inc., 3.125%, 2/15/2029, 144A | | | 11,569 | |
| | 75,000 | | | Cigna Corp., 4.375%, 10/15/2028 | | | 70,819 | |
| | 87,954 | | | CVS Pass-Through Trust, Series 2014, 4.163%, 8/11/2036, 144A | | | 75,483 | |
| | 5,000 | | | Encompass Health Corp., 4.750%, 2/01/2030 | | | 4,113 | |
| | 165,000 | | | HCA, Inc., 4.125%, 6/15/2029 | | | 144,703 | |
| | 25,000 | | | Tenet Healthcare Corp., 4.625%, 6/15/2028, 144A | | | 21,849 | |
| | 10,000 | | | Tenet Healthcare Corp., 6.125%, 10/01/2028, 144A | | | 8,761 | |
| | | | | | | | |
| | | | | | | 337,297 | |
| | | | | | | | |
| | | | Home Construction — 0.5% | |
| | 75,000 | | | MDC Holdings, Inc., 3.966%, 8/06/2061 | | | 39,584 | |
| | 70,000 | | | PulteGroup, Inc., 6.000%, 2/15/2035 | | | 62,958 | |
| | | | | | | | |
| | | | | | | 102,542 | |
| | | | | | | | |
| | | | Independent Energy — 3.1% | |
| | 150,000 | | | Aker BP ASA, 4.000%, 1/15/2031, 144A | | | 127,290 | |
| | 80,000 | | | Continental Resources, Inc., 2.875%, 4/01/2032, 144A | | | 58,584 | |
| | 100,000 | | | Continental Resources, Inc., 5.750%, 1/15/2031, 144A | | | 90,386 | |
| | 20,000 | | | Diamondback Energy, Inc., 3.125%, 3/24/2031 | | | 16,223 | |
| | 25,000 | | | Energean Israel Finance Ltd., 5.375%, 3/30/2028, 144A | | | 21,187 | |
| | 40,000 | | | Energean Israel Finance Ltd., 5.875%, 3/30/2031, 144A | | | 32,700 | |
| | 10,000 | | | EQT Corp., 3.125%, 5/15/2026, 144A | | | 9,107 | |
| | 30,000 | | | EQT Corp., 3.625%, 5/15/2031, 144A | | | 25,010 | |
| | 40,000 | | | EQT Corp., 3.900%, 10/01/2027 | | | 36,400 | |
| | 10,000 | | | EQT Corp., 5.000%, 1/15/2029 | | | 9,330 | |
| | 10,000 | | | EQT Corp., 5.678%, 10/01/2025 | | | 9,938 | |
| | 10,000 | | | EQT Corp., 5.700%, 4/01/2028 | | | 9,803 | |
| | 55,000 | | | Hess Corp., 4.300%, 4/01/2027 | | | 51,740 | |
See accompanying notes to financial statements.
| 46
Portfolio of Investments – as of September 30, 2022
Loomis Sayles Credit Income Fund – (continued)
| | | | | | | | |
Principal
Amount | | | Description | | Value (†) | |
| | | | Independent Energy — continued | |
| $ | 30,000 | | | Occidental Petroleum Corp., 5.550%, 3/15/2026 | | $ | 30,034 | |
| | 5,000 | | | Occidental Petroleum Corp., 8.875%, 7/15/2030 | | | 5,567 | |
| | 45,000 | | | Ovintiv Exploration, Inc., 5.375%, 1/01/2026 | | | 44,507 | |
| | 50,000 | | | Ovintiv, Inc., 6.500%, 8/15/2034 | | | 48,709 | |
| | 5,000 | | | Southwestern Energy Co., 4.750%, 2/01/2032 | | | 4,191 | |
| | | | | | | | |
| | | | | | | 630,706 | |
| | | | | | | | |
| | | | Industrial Other — 0.1% | |
| | 20,000 | | | TopBuild Corp., 4.125%, 2/15/2032, 144A | | | 15,230 | |
| | | | | | | | |
| | | | Leisure — 0.7% | |
| | 40,000 | | | Carnival Corp., 5.750%, 3/01/2027, 144A | | | 28,022 | |
| | 30,000 | | | Carnival Corp., 6.000%, 5/01/2029, 144A | | | 19,697 | |
| | 30,000 | | | NCL Corp. Ltd., 5.875%, 3/15/2026, 144A | | | 22,822 | |
| | 25,000 | | | NCL Corp. Ltd., 5.875%, 2/15/2027, 144A | | | 20,816 | |
| | 10,000 | | | NCL Finance Ltd., 6.125%, 3/15/2028, 144A | | | 7,375 | |
| | 60,000 | | | Royal Caribbean Cruises Ltd., 5.500%, 4/01/2028, 144A | | | 42,038 | |
| | | | | | | | |
| | | | | | | 140,770 | |
| | | | | | | | |
| | | | Life Insurance — 1.1% | |
| | 50,000 | | | Athene Global Funding, 1.608%, 6/29/2026, 144A | | | 42,520 | |
| | 55,000 | | | Athene Global Funding, 1.716%, 1/07/2025, 144A | | | 50,275 | |
| | 95,000 | | | Athene Global Funding, 2.550%, 11/19/2030, 144A | | | 72,478 | |
| | 30,000 | | | Athene Holding Ltd., 3.500%, 1/15/2031 | | | 24,026 | |
| | 30,000 | | | CNO Financial Group, Inc., 5.250%, 5/30/2029 | | | 27,890 | |
| | | | | | | | |
| | | | | | | 217,189 | |
| | | | | | | | |
| | | | Lodging — 1.3% | |
| | 60,000 | | | Hilton Domestic Operating Co., Inc., 3.625%, 2/15/2032, 144A | | | 45,954 | |
| | 40,000 | | | Hilton Domestic Operating Co., Inc., 4.000%, 5/01/2031, 144A | | | 32,359 | |
| | 10,000 | | | Hilton Grand Vacations Borrower Escrow LLC/Hilton Grand Vacations Borrower Escrow, 4.875%, 7/01/2031, 144A | | | 7,636 | |
| | 25,000 | | | Hilton Grand Vacations Borrower Escrow LLC/Hilton Grand Vacations Borrower Escrow, 5.000%, 6/01/2029, 144A | | | 20,177 | |
| | 5,000 | | | Hyatt Hotels Corp., 5.625%, 4/23/2025 | | | 4,944 | |
| | 3,000 | | | Marriott International, Inc., Series EE, 5.750%, 5/01/2025 | | | 3,030 | |
| | 25,000 | | | Marriott International, Inc., Series FF, 4.625%, 6/15/2030 | | | 22,592 | |
| | 20,000 | | | Marriott International, Inc., Series HH, 2.850%, 4/15/2031 | | | 15,703 | |
| | 20,000 | | | Marriott Ownership Resorts, Inc., 4.500%, 6/15/2029, 144A | | | 15,806 | |
| | 45,000 | | | Travel & Leisure Co., 4.500%, 12/01/2029, 144A | | | 34,893 | |
| | 75,000 | | | Travel & Leisure Co., 4.625%, 3/01/2030, 144A | | | 59,283 | |
| | | | | | | | |
| | | | | | | 262,377 | |
| | | | | | | | |
| | | | Media Entertainment — 1.7% | |
| | 85,000 | | | iHeartCommunications, Inc., 4.750%, 1/15/2028, 144A | | | 70,847 | |
| | 75,000 | | | iHeartCommunications, Inc., 5.250%, 8/15/2027, 144A | | | 64,069 | |
| | 20,000 | | | iHeartCommunications, Inc., 8.375%, 5/01/2027 | | | 16,818 | |
| | 10,000 | | | Netflix, Inc., 4.875%, 4/15/2028 | | | 9,359 | |
| | 135,000 | | | Netflix, Inc., 4.875%, 6/15/2030, 144A | | | 123,368 | |
| | 5,000 | | | Netflix, Inc., 5.375%, 11/15/2029, 144A | | | 4,700 | |
| | 5,000 | | | Netflix, Inc., 5.875%, 11/15/2028 | | | 4,879 | |
| | 15,000 | | | Netflix, Inc., 6.375%, 5/15/2029 | | | 14,892 | |
| | 15,000 | | | Warnermedia Holdings, Inc., 4.054%, 3/15/2029, 144A | | | 12,974 | |
| | 25,000 | | | Warnermedia Holdings, Inc., 4.279%, 3/15/2032, 144A | | | 20,584 | |
| | | | | | | | |
| | | | | | | 342,490 | |
| | | | | | | | |
| | | | Metals & Mining — 3.5% | |
| | 200,000 | | | Anglo American Capital PLC, 4.500%, 3/15/2028, 144A | | | 182,994 | |
| | | | Metals & Mining — continued | |
| 35,000 | | | ArcelorMittal S.A., 7.000%, 10/15/2039 | | | 32,902 | |
| | 25,000 | | | ATI, Inc., 5.875%, 12/01/2027 | | | 22,759 | |
| | 200,000 | | | First Quantum Minerals Ltd., 6.875%, 10/15/2027, 144A | | | 180,000 | |
| | 45,000 | | | FMG Resources August 2006 Pty Ltd., 4.375%, 4/01/2031, 144A | | | 34,545 | |
| | 15,000 | | | Freeport-McMoRan, Inc., 4.250%, 3/01/2030 | | | 12,827 | |
| | 50,000 | | | Freeport-McMoRan, Inc., 4.625%, 8/01/2030 | | | 43,811 | |
| | 40,000 | | | Freeport-McMoRan, Inc., 5.400%, 11/14/2034 | | | 35,552 | |
| | 135,000 | | | Glencore Funding LLC, 3.875%, 10/27/2027, 144A | | | 122,220 | |
| | 20,000 | | | Glencore Funding LLC, 4.000%, 3/27/2027, 144A | | | 18,630 | |
| | 35,000 | | | Novelis Corp., 4.750%, 1/30/2030, 144A | | | 28,700 | |
| | 10,000 | | | Volcan Cia Minera SAA, 4.375%, 2/11/2026, 144A | | | 8,250 | |
| | | | | | | | |
| | | | | | | 723,190 | |
| | | | | | | | |
| | | | Midstream — 2.5% | |
| | 115,000 | | | Cheniere Corpus Christi Holdings LLC, 5.125%, 6/30/2027 | | | 111,345 | |
| | 55,000 | | | DCP Midstream Operating LP, 3.250%, 2/15/2032 | | | 43,478 | |
| | 10,000 | | | DCP Midstream Operating LP, 5.125%, 5/15/2029 | | | 9,370 | |
| | 55,000 | | | Energy Transfer LP, 4.000%, 10/01/2027 | | | 49,880 | |
| | 30,000 | | | EnLink Midstream Partners LP, 5.450%, 6/01/2047 | | | 21,914 | |
| | 35,000 | | | EQM Midstream Partners LP, Series 10Y, 5.500%, 7/15/2028 | | | 29,916 | |
| | 15,000 | | | Hess Midstream Operations LP, 4.250%, 2/15/2030, 144A | | | 12,112 | |
| | 15,000 | | | Hess Midstream Operations LP, 5.625%, 2/15/2026, 144A | | | 14,239 | |
| | 80,000 | | | NGPL PipeCo LLC, 4.875%, 8/15/2027, 144A | | | 74,487 | |
| | 15,000 | | | Plains All American Pipeline LP/PAA Finance Corp., 3.800%, 9/15/2030 | | | 12,578 | |
| | 35,000 | | | Plains All American Pipeline LP/PAA Finance Corp., 4.300%, 1/31/2043 | | | 23,540 | |
| | 15,000 | | | Targa Resources Partners LP/Targa Resources Partners Finance Corp., 4.000%, 1/15/2032 | | | 12,398 | |
| | 5,000 | | | Targa Resources Partners LP/Targa Resources Partners Finance Corp., 4.875%, 2/01/2031 | | | 4,300 | |
| | 60,000 | | | Valero Energy Partners LP, 4.500%, 3/15/2028 | | | 56,924 | |
| | 10,000 | | | Western Midstream Operating LP, 4.300%, 2/01/2030 | | | 8,553 | |
| | 20,000 | | | Western Midstream Operating LP, 5.300%, 3/01/2048 | | | 16,450 | |
| | 5,000 | | | Western Midstream Operating LP, 5.450%, 4/01/2044 | | | 4,102 | |
| | 10,000 | | | Western Midstream Operating LP, 5.500%, 2/01/2050 | | | 8,075 | |
| | | | | | | | |
| | | | | | | 513,661 | |
| | | | | | | | |
| | | | Paper — 0.2% | |
| | 45,000 | | | Suzano Austria GmbH, 3.750%, 1/15/2031 | | | 35,255 | |
| | | | | | | | |
| | | | Pharmaceuticals — 1.6% | |
| | 10,000 | | | Bausch Health Cos., Inc., 4.875%, 6/01/2028, 144A | | | 6,447 | |
| | 65,000 | | | Bausch Health Cos., Inc., 5.000%, 1/30/2028, 144A | | | 23,934 | |
| | 10,000 | | | Bausch Health Cos., Inc., 5.250%, 1/30/2030, 144A | | | 3,735 | |
| | 50,000 | | | Bausch Health Cos., Inc., 5.250%, 2/15/2031, 144A | | | 18,802 | |
| | 5,000 | | | Bausch Health Cos., Inc., 6.250%, 2/15/2029, 144A | | | 1,866 | |
| | 5,000 | | | Bausch Health Cos., Inc., 7.000%, 1/15/2028, 144A | | | 1,905 | |
| | 50,000 | | | Teva Pharmaceutical Finance Co. LLC, 6.150%, 2/01/2036 | | | 41,179 | |
| | 85,000 | | | Teva Pharmaceutical Finance Netherlands III BV, 3.150%, 10/01/2026 | | | 69,742 | |
| | 250,000 | | | Teva Pharmaceutical Finance Netherlands III BV, 4.100%, 10/01/2046 | | | 149,395 | |
| | | | | | | | |
| | | | | | | 317,005 | |
| | | | | | | | |
| | | | Property & Casualty Insurance — 1.1% | |
| | 175,000 | | | Fidelity National Financial, Inc., 2.450%, 3/15/2031 | | | 129,768 | |
| | 65,000 | | | Sirius International Group Ltd., 4.600%, 11/01/2026, 144A | | | 55,900 | |
See accompanying notes to financial statements.
47 |
Portfolio of Investments – as of September 30, 2022
Loomis Sayles Credit Income Fund – (continued)
| | | | | | | | |
Principal
Amount | | | Description | | Value (†) | |
| | | | Property & Casualty Insurance — continued | |
| $ | 55,000 | | | Stewart Information Services Corp., 3.600%, 11/15/2031 | | $ | 42,393 | |
| | | | | | | | |
| | | | | | | 228,061 | |
| | | | | | | | |
| | | | REITs – Apartments — 0.0% | |
| | 10,000 | | | American Homes 4 Rent, 2.375%, 7/15/2031 | | | 7,540 | |
| | | | | | | | |
| | | | REITs – Diversified — 0.1% | |
| | 15,000 | | | EPR Properties, 3.600%, 11/15/2031 | | | 10,717 | |
| | | | | | | | |
| | | | REITs – Mortgage — 0.1% | |
| | 15,000 | | | Ladder Capital Finance Holdings LLLP/Ladder Capital Finance Corp., 4.250%, 2/01/2027, 144A | | | 12,078 | |
| | | | | | | | |
| | | | REITs – Office Property — 0.0% | |
| | 10,000 | | | Corporate Office Properties LP, 2.750%, 4/15/2031 | | | 7,352 | |
| | | | | | | | |
| | | | REITs – Shopping Centers — 0.8% | |
| | 115,000 | | | Brixmor Operating Partnership LP, 4.050%, 7/01/2030 | | | 96,881 | |
| | 75,000 | | | SITE Centers Corp., 3.625%, 2/01/2025 | | | 70,894 | |
| | | | | | | | |
| | | | | | | 167,775 | |
| | | | | | | | |
| | | | Restaurants — 0.7% | |
| | 125,000 | | | 1011778 B.C. ULC/New Red Finance, Inc., 4.375%, 1/15/2028, 144A | | | 108,313 | |
| | 45,000 | | | Yum! Brands, Inc., 4.625%, 1/31/2032 | | | 37,718 | |
| | | | | | | | |
| | | | | | | 146,031 | |
| | | | | | | | |
| | | | Retailers — 0.1% | |
| | 20,000 | | | Lithia Motors, Inc., 3.875%, 6/01/2029, 144A | | | 16,050 | |
| | 10,000 | | | Tapestry, Inc., 3.050%, 3/15/2032 | | | 7,461 | |
| | | | | | | | |
| | | | | | | 23,511 | |
| | | | | | | | |
| | | | Technology — 6.0% | |
| | 60,000 | | | Avnet, Inc., 4.625%, 4/15/2026 | | | 57,744 | |
| | 10,000 | | | Broadcom, Inc., 3.137%, 11/15/2035, 144A | | | 7,007 | |
| | 30,000 | | | Broadcom, Inc., 4.150%, 11/15/2030 | | | 25,966 | |
| | 55,000 | | | Broadcom, Inc., 4.300%, 11/15/2032 | | | 46,180 | |
| | 10,000 | | | CDW LLC/CDW Finance Corp., 2.670%, 12/01/2026 | | | 8,674 | |
| | 10,000 | | | CDW LLC/CDW Finance Corp., 3.250%, 2/15/2029 | | | 8,121 | |
| | 90,000 | | | CDW LLC/CDW Finance Corp., 3.569%, 12/01/2031 | | | 70,072 | |
| | 130,000 | | | CommScope Technologies LLC, 5.000%, 3/15/2027, 144A | | | 98,150 | |
| | 60,000 | | | CommScope, Inc., 4.750%, 9/01/2029, 144A | | | 48,940 | |
| | 65,000 | | | Entegris Escrow Corp., 4.750%, 4/15/2029, 144A | | | 57,254 | |
| | 5,000 | | | Everi Holdings, Inc., 5.000%, 7/15/2029, 144A | | | 4,100 | |
| | 25,000 | | | Fidelity National Information Services, Inc., 5.100%, 7/15/2032 | | | 23,492 | |
| | 5,000 | | | Gartner, Inc., 3.625%, 6/15/2029, 144A | | | 4,162 | |
| | 5,000 | | | Global Payments, Inc., 2.900%, 11/15/2031 | | | 3,823 | |
| | 15,000 | | | Global Payments, Inc., 5.300%, 8/15/2029 | | | 14,107 | |
| | 25,000 | | | Global Payments, Inc., 5.400%, 8/15/2032 | | | 23,199 | |
| | 60,000 | | | Iron Mountain, Inc., 5.250%, 7/15/2030, 144A | | | 49,648 | |
| | 35,000 | | | Jabil, Inc., 1.700%, 4/15/2026 | | | 30,406 | |
| | 30,000 | | | Marvell Technology, Inc., 2.450%, 4/15/2028 | | | 24,781 | |
| | 25,000 | | | Marvell Technology, Inc., 2.950%, 4/15/2031 | | | 19,394 | |
| | 265,000 | | | Micron Technology, Inc., 4.663%, 2/15/2030 | | | 235,112 | |
| | 25,000 | | | MSCI, Inc., 3.250%, 8/15/2033, 144A | | | 19,306 | |
| | 5,000 | | | NXP BV/NXP Funding LLC/NXP USA, Inc., 4.400%, 6/01/2027 | | | 4,716 | |
| | 60,000 | | | Open Text Holdings, Inc., 4.125%, 2/15/2030, 144A | | | 47,917 | |
| | 60,000 | | | Oracle Corp., 3.950%, 3/25/2051 | | | 39,792 | |
| | 60,000 | | | Qorvo, Inc., 3.375%, 4/01/2031, 144A | | | 44,949 | |
| | 55,000 | | | S&P Global, Inc., 4.250%, 5/01/2029, 144A | | | 51,716 | |
| | 5,000 | | | Seagate HDD Cayman, 4.091%, 6/01/2029 | | | 3,994 | |
| | 60,000 | | | TD SYNNEX Corp., 1.750%, 8/09/2026 | | | 50,995 | |
| | 35,000 | | | Verisk Analytics, Inc., 4.125%, 3/15/2029 | | | 31,927 | |
| | 45,000 | | | Western Digital Corp., 2.850%, 2/01/2029 | | | 34,971 | |
| | | | Technology — continued | |
| 5,000 | | | Western Digital Corp., 3.100%, 2/01/2032 | | | 3,399 | |
| | 30,000 | | | Western Digital Corp., 4.750%, 2/15/2026 | | | 27,779 | |
| | | | | | | | |
| | | | | | | 1,221,793 | |
| | | | | | | | |
| | | | Treasuries — 18.9% | |
| | 135,000 | | | U.S. Treasury Bond, 1.125%, 8/15/2040 | | | 83,626 | |
| | 255,000 | | | U.S. Treasury Bond, 1.875%, 2/15/2051 | | | 168,818 | |
| | 155,000 | | | U.S. Treasury Bond, 2.250%, 2/15/2052 | | | 112,617 | |
| | 415,000 | | | U.S. Treasury Bond, 3.250%, 5/15/2042 | | | 368,313 | |
| | 1,400,000 | | | U.S. Treasury Note, 0.125%, 1/31/2023 | | | 1,383,790 | |
| | 780,000 | | | U.S. Treasury Note, 0.125%, 4/30/2023 | | | 762,542 | |
| | 805,000 | | | U.S. Treasury Note, 0.250%, 9/30/2023 | | | 773,177 | |
| | 230,000 | | | U.S. Treasury Note, 1.500%, 2/29/2024(b) | | | 221,177 | |
| | | | | | | | |
| | | | | | | 3,874,060 | |
| | | | | | | | |
| | | | Wireless — 2.5% | |
| | 80,000 | | | Crown Castle, Inc., 2.500%, 7/15/2031 | | | 61,647 | |
| | 70,000 | | | SBA Communications Corp., 3.125%, 2/01/2029 | | | 56,299 | |
| | 130,000 | | | T-Mobile USA, Inc., 3.375%, 4/15/2029 | | | 112,318 | |
| | 65,000 | | | T-Mobile USA, Inc., 3.500%, 4/15/2031 | | | 54,620 | |
| | 265,000 | | | T-Mobile USA, Inc., 3.875%, 4/15/2030 | | | 235,059 | |
| | | | | | | | |
| | | | | | | 519,943 | |
| | | | | | | | |
| | | | Total Non-Convertible Bonds
(Identified Cost $21,251,716) | | | 17,613,998 | |
| | | | | | | | |
| | | | | | | | |
| | Convertible Bonds — 5.2% | |
| | | | Airlines — 0.5% | |
| | 20,000 | | | JetBlue Airways Corp., 0.500%, 4/01/2026 | | | 14,200 | |
| | 85,000 | | | Southwest Airlines Co., 1.250%, 5/01/2025 | | | 97,027 | |
| | | | | | | | |
| | | | | | | 111,227 | |
| | | | | | | | |
| | | | Cable Satellite — 1.3% | |
| | 40,000 | | | DISH Network Corp., Zero Coupon, 0.000%-8.380%, 12/15/2025(c) | | | 26,326 | |
| | 350,000 | | | DISH Network Corp., 3.375%, 8/15/2026 | | | 240,800 | |
| | | | | | | | |
| | | | | | | 267,126 | |
| | | | | | | | |
| | | | Consumer Cyclical Services — 0.3% | |
| | 5,000 | | | Peloton Interactive, Inc., Zero Coupon, 0.798%, 2/15/2026(d) | | | 3,349 | |
| | 65,000 | | | Uber Technologies, Inc., Zero Coupon, 0.000%-5.152%, 12/15/2025(c) | | | 53,870 | |
| | | | | | | | |
| | | | | | | 57,219 | |
| | | | | | | | |
| | | | Gaming — 0.1% | |
| | 10,000 | | | Penn Entertainment, Inc., 2.750%, 5/15/2026 | | | 13,995 | |
| | | | | | | | |
| | | | Healthcare — 0.5% | |
| | 140,000 | | | Teladoc Health, Inc., 1.250%, 6/01/2027 | | | 102,382 | |
| | | | | | | | |
| | | | Leisure — 0.2% | |
| | 60,000 | | | NCL Corp. Ltd., 1.125%, 2/15/2027, 144A | | | 37,174 | |
| | | | | | | | |
| | | | Media Entertainment — 0.3% | |
| | 30,000 | | | Bilibili, Inc., 0.500%, 12/01/2026, 144A | | | 19,050 | |
| | 30,000 | | | Snap, Inc., Zero Coupon, 6.709%-6.954%, 5/01/2027(c) | | | 20,685 | |
| | 25,000 | | | Spotify USA, Inc., Zero Coupon, 5.189%-5.777%, 3/15/2026(c) | | | 19,625 | |
| | 10,000 | | | Twitter, Inc., Zero Coupon, 0.000%, 3/15/2026(d) | | | 9,154 | |
| | | | | | | | |
| | | | | | | 68,514 | |
| | | | | | | | |
| | | | Pharmaceuticals — 1.5% | |
| | 240,000 | | | BioMarin Pharmaceutical, Inc., 1.250%, 5/15/2027 | | | 238,344 | |
| | 15,000 | | | Guardant Health, Inc., Zero Coupon, 0.000%, 11/15/2027(d) | | | 10,916 | |
| | 25,000 | | | Ionis Pharmaceuticals, Inc., Zero Coupon, 0.000%, 4/01/2026(d) | | | 24,703 | |
See accompanying notes to financial statements.
| 48
Portfolio of Investments – as of September 30, 2022
Loomis Sayles Credit Income Fund – (continued)
| | | | | | | | |
Principal
Amount | | | Description | | Value (†) | |
| | | | Pharmaceuticals — continued | |
| $ | 40,000 | | | Livongo Health, Inc., 0.875%, 6/01/2025 | | $ | 33,581 | |
| | | | | | | | |
| | | | | | | 307,544 | |
| | | | | | | | |
| | | | Technology — 0.5% | |
| | 25,000 | | | Nutanix, Inc., 0.250%, 10/01/2027, 144A | | | 18,800 | |
| | 20,000 | | | RingCentral, Inc., Zero Coupon, 7.630%-7.929%, 3/15/2026(c) | | | 15,380 | |
| | 60,000 | | | Splunk, Inc., 1.125%, 6/15/2027 | | | 47,207 | |
| | 25,000 | | | Unity Software, Inc., Zero Coupon, 7.085%-7.253%, 11/15/2026, 144A(c) | | | 18,125 | |
| | | | | | | | |
| | | | | | | 99,512 | |
| | | | | | | | |
| | | | Total Convertible Bonds
(Identified Cost $1,351,346) | | | 1,064,693 | |
| | | | | | | | |
| | | | | | | | |
| | | | Total Bonds and Notes
(Identified Cost $22,603,062) | | | 18,678,691 | |
| | | | | | | | |
| | | | | | | | |
| | Collateralized Loan Obligations — 3.2% | |
| | 250,000 | | | AIMCO CLO Ltd., Series 2021-14A, Class D, 3-month LIBOR + 2.900%, 5.610%, 4/20/2034, 144A(e) | | | 218,471 | |
| | 250,000 | | | Fillmore Park CLO Ltd., Series 2018-1A, Class D, 3-month LIBOR + 2.900%, 5.412%, 7/15/2030, 144A(e) | | | 221,869 | |
| | 250,000 | | | Recette CLO Ltd., Series 2015-1A, Class DRR, 3-month LIBOR + 3.250%, 5.960%, 4/20/2034, 144A(e) | | | 214,369 | |
| | | | | | | | |
| | | | Total Collateralized Loan Obligations
(Identified Cost $750,000) | | | 654,709 | |
| | | | | | | | |
| | | | | | | | |
| Shares | | | Description | | Value (†) | |
| | Preferred Stocks — 2.5% | |
| | Convertible Preferred Stocks — 2.5% | |
| | | | Banking — 1.0% | |
| | 97 | | | Bank of America Corp., Series L, 7.250% | | | 113,781 | |
| | 83 | | | Wells Fargo & Co., Class A, Series L, 7.500% | | | 99,932 | |
| | | | | | | | |
| | | | | | | 213,713 | |
| | | | | | | | |
| | | | Technology — 0.1% | |
| | 273 | | | Clarivate PLC, Series A, 5.250% | | | 11,641 | |
| | | | | | | | |
| | | | Wireless — 1.4% | |
| | 250 | | | 2020 Cash Mandatory Exchangeable Trust, 5.250%, 144A | | | 281,225 | |
| | | | | | | | |
| | | | Total Convertible Preferred Stocks
(Identified Cost $591,279) | | | 506,579 | |
| | | | | | | | |
| | | | | | | | |
| | | | Total Preferred Stocks
(Identified Cost $591,279) | | | 506,579 | |
| | | | | | | | |
Principal
Amount | | | Description | | Value (†) | |
| | Short-Term Investments — 2.4% | |
| $ | 494,084 | | | Tri-Party Repurchase Agreement with Fixed Income Clearing Corporation, dated 9/30/2022 at 1.100% to be repurchased at $494,130 on 10/03/2022 collateralized by $520,900 U.S. Treasury Note, 3.000% due 7/15/2025 valued at $503,971 including accrued interest (Note 2 of Notes to Financial Statements)
(Identified Cost $494,084) | | | 494,084 | |
| | | | | | | | |
| | | | | | | | |
| | | | Total Investments — 99.4%
(Identified Cost $24,438,425) | | | 20,334,063 | |
| | | | Other assets less liabilities — 0.6% | | | 117,338 | |
| | | | | | | | |
| | | | Net Assets — 100.0% | | $ | 20,451,401 | |
| | | | | | | | |
| | | | | | |
| | (†) | | | See Note 2 of Notes to Financial Statements. |
| | (a) | | | Perpetual bond with no specified maturity date. |
| | (b) | | | Security (or a portion thereof) has been pledged as collateral for open derivative contracts. |
| | (c) | | | Interest rate represents annualized yield at time of purchase; not a coupon rate. The Fund’s investment in this security is comprised of various lots with differing annualized yields. |
| | (d) | | | Interest rate represents annualized yield at time of purchase; not a coupon rate. |
| | (e) | | | Variable rate security. Rate as of September 30, 2022 is disclosed. |
| | | | |
| | 144A | | | All or a portion of these securities are exempt from registration under Rule 144A of the Securities Act of 1933. These securities may be resold in transactions exempt from registration, normally to qualified institutional buyers. At September 30, 2022, the value of Rule 144A holdings amounted to $6,579,962 or 32.2% of net assets. |
| | LIBOR | | | London Interbank Offered Rate |
| | MTN | | | Medium Term Note |
| | REITs | | | Real Estate Investment Trusts |
At September 30, 2022, open long futures contracts were as follows:
| | | | | | | | | | | | | | | | | | | | |
| Financial Futures | | Expiration
Date | | | Contracts | | | Notional
Amount | | | Value | | | Unrealized
Appreciation
(Depreciation) | |
Ultra Long U.S. Treasury Bond | | | 12/20/2022 | | | | 4 | | | $ | 597,579 | | | $ | 548,000 | | | $ | (49,579 | ) |
| | | | | | | | | | | | | | | | | | | | |
At September 30, 2022, open short futures contracts were as follows:
| | | | | | | | | | | | | | | | | | | | |
| Financial Futures | | Expiration
Date | | | Contracts | | | Notional
Amount | | | Value | | | Unrealized
Appreciation
(Depreciation) | |
Ultra 10 Year U.S. Treasury Note | | | 12/20/2022 | | | | 4 | | | $ | 501,867 | | | $ | 473,938 | | | $ | 27,929 | |
| | | | | | | | | | | | | | | | | | | | |
See accompanying notes to financial statements.
49 |
Portfolio of Investments – as of September 30, 2022
Loomis Sayles Credit Income Fund – (continued)
Industry Summary at September 30, 2022
| | | | |
Treasuries | | | 18.9 | % |
Banking | | | 11.7 | |
Finance Companies | | | 7.0 | |
Cable Satellite | | | 6.6 | |
Technology | | | 6.6 | |
Wireless | | | 3.9 | |
Metals & Mining | | | 3.5 | |
Independent Energy | | | 3.1 | |
Pharmaceuticals | | | 3.1 | |
Aerospace & Defense | | | 3.0 | |
Consumer Cyclical Services | | | 2.8 | |
Midstream | | | 2.5 | |
Healthcare | | | 2.1 | |
Media Entertainment | | | 2.0 | |
Other Investments, less than 2% each | | | 17.0 | |
Collateralized Loan Obligations | | | 3.2 | |
Short-Term Investments | | | 2.4 | |
| | | | |
Total Investments | | | 99.4 | |
Other assets less liabilities (including futures contracts) | | | 0.6 | |
| | | | |
Net Assets | | | 100.0 | % |
| | | | |
See accompanying notes to financial statements.
| 50
Portfolio of Investments – as of September 30, 2022
Loomis Sayles Global Allocation Fund
| | | | | | | | |
Shares | | | Description | | Value (†) | |
| | Common Stocks — 66.3% of Net Assets | |
| | | | France — 4.3% | | | | |
| | 532,281 | | | Dassault Systemes SE | | $ | 18,377,031 | |
| | 115,002 | | | LVMH Moet Hennessy Louis Vuitton SE | | | 67,802,267 | |
| | 494,321 | | | Vinci S.A. | | | 39,971,151 | |
| | | | | | | | |
| | | | | | | 126,150,449 | |
| | | | | | | | |
| | | | Hong Kong — 0.6% | |
| | 2,056,000 | | | AIA Group Ltd. | | | 17,118,056 | |
| | | | | | | | |
| | | | Japan — 1.9% | |
| | 2,341,961 | | | Nomura Research Institute Ltd. | | | 57,198,252 | |
| | | | | | | | |
| | | | Netherlands — 2.6% | |
| | 187,791 | | | ASML Holding NV | | | 77,797,832 | |
| | | | | | | | |
| | | | Sweden — 2.0% | |
| | 6,233,713 | | | Atlas Copco AB, Class A | | | 57,938,355 | |
| | | | | | | | |
| | | | Taiwan — 1.6% | |
| | 3,629,000 | | | Taiwan Semiconductor Manufacturing Co. Ltd. | | | 48,103,814 | |
| | | | | | | | |
| | | | United Kingdom — 3.3% | |
| | 702,473 | | | Halma PLC | | | 15,800,275 | |
| | 306,888 | | | Linde PLC | | | 82,733,936 | |
| | | | | | | | |
| | | | | | | 98,534,211 | |
| | | | | | | | |
| | | | United States — 50.0% | |
| | 312,680 | | | Accenture PLC, Class A | | | 80,452,564 | |
| | 103,120 | | | Adobe, Inc.(a) | | | 28,378,624 | |
| | 761,682 | | | Airbnb, Inc., Class A(a) | | | 80,007,077 | |
| | 903,258 | | | Alphabet, Inc., Class A(a) | | | 86,396,628 | |
| | 819,011 | | | Amazon.com, Inc.(a) | | | 92,548,243 | |
| | 69,231 | | | BlackRock, Inc. | | | 38,096,435 | |
| | 142,577 | | | Costco Wholesale Corp. | | | 67,334,840 | |
| | 400,130 | | | Cummins, Inc. | | | 81,430,456 | |
| | 349,214 | | | Danaher Corp. | | | 90,198,484 | |
| | 197,931 | | | Estee Lauder Cos., Inc. (The), Class A | | | 42,733,303 | |
| | 238,592 | | | Goldman Sachs Group, Inc. (The) | | | 69,919,386 | |
| | 262,913 | | | Home Depot, Inc. (The) | | | 72,548,213 | |
| | 353,833 | | | IQVIA Holdings, Inc.(a) | | | 64,093,310 | |
| | 410,800 | | | JPMorgan Chase & Co. | | | 42,928,600 | |
| | 270,013 | | | Mastercard, Inc., Class A | | | 76,775,496 | |
| | 42,027 | | | Mettler-Toledo International, Inc.(a) | | | 45,562,311 | |
| | 387,486 | | | NVIDIA Corp. | | | 47,036,926 | |
| | 141,807 | | | Roper Technologies, Inc. | | | 50,999,469 | |
| | 279,853 | | | S&P Global, Inc. | | | 85,453,114 | |
| | 559,679 | | | Salesforce, Inc.(a) | | | 80,504,227 | |
| | 219,541 | | | Sherwin-Williams Co. (The) | | | 44,951,020 | |
| | 205,084 | | | Texas Instruments, Inc. | | | 31,742,901 | |
| | 156,680 | | | UnitedHealth Group, Inc. | | | 79,129,667 | |
| | | | | | | | |
| | | | | | | 1,479,221,294 | |
| | | | | | | | |
| | | | Total Common Stocks
(Identified Cost $2,033,832,951) | | | 1,962,062,263 | |
| | | | | | | | |
| | | | | | | | |
Principal
Amount (‡) | | | Description | | Value (†) | |
| | Bonds and Notes — 32.3% | |
| | Non-Convertible Bonds — 29.6% | |
| | | | Australia — 0.9% | |
| $ | 3,010,000 | | | Australia Government Bond, Series 133, 5.500%, 4/21/2023, (AUD) | | | 1,949,294 | |
| | 10,700,000 | | | Australia Government Bond, Series 164, 0.500%, 9/21/2026, (AUD) | | | 6,052,830 | |
| | 800,000 | | | FMG Resources August 2006 Pty Ltd., 4.375%, 4/01/2031, 144A | | | 614,126 | |
| | | | Australia — continued | |
| 670,000 | | | GAIF Bond Issuer Pty Ltd., 3.400%, 9/30/2026, 144A | | | 621,650 | |
| | 3,560,000 | | | Glencore Funding LLC, 1.625%, 9/01/2025, 144A | | | 3,194,103 | |
| | 5,000,000 | | | Macquarie Group Ltd., (fixed rate to 1/14/2032, variable rate thereafter), 2.871%, 1/14/2033, 144A | | | 3,757,204 | |
| | 4,000,000 | | | Macquarie Group Ltd., (fixed rate to 9/23/2026, variable rate thereafter), 1.629%, 9/23/2027, 144A | | | 3,347,807 | |
| | 11,610,000 | | | New South Wales Treasury Corp., 2.000%, 3/08/2033, (AUD) | | | 5,836,720 | |
| | 95,000 | | | Sydney Airport Finance Co. Pty Ltd., 3.375%, 4/30/2025, 144A | | | 89,102 | |
| | 1,370,000 | | | Westpac Banking Corp., 1.953%, 11/20/2028 | | | 1,138,841 | |
| | | | | | | | |
| | | | | | | 26,601,677 | |
| | | | | | | | |
| | | | Belgium — 0.1% | |
| | 2,745,000 | | | Anheuser-Busch InBev S.A., EMTN, 2.000%, 1/23/2035, (EUR) | | | 2,092,833 | |
| | | | | | | | |
| | | | Brazil — 0.8% | |
| | 1,035,000 | | | Braskem Netherlands Finance BV, 4.500%, 1/10/2028 | | | 876,635 | |
| | 1,785,000 | | | Braskem Netherlands Finance BV, 4.500%, 1/31/2030 | | | 1,442,637 | |
| | 53,329(††) | | | Brazil Notas do Tesouro Nacional, Series F, 10.000%, 1/01/2031, (BRL) | | | 8,924,555 | |
| | 2,685,000 | | | Brazilian Government International Bond, 4.500%, 5/30/2029 | | | 2,386,054 | |
| | 1,085,000 | | | Brazilian Government International Bond, 4.625%, 1/13/2028 | | | 1,006,858 | |
| | 2,980,000 | | | BRF S.A., 4.875%, 1/24/2030 | | | 2,343,659 | |
| | 650,000 | | | Centrais Eletricas Brasileiras S.A., 4.625%, 2/04/2030, 144A | | | 542,594 | |
| | 1,100,000 | | | Embraer Netherlands Finance BV, 5.050%, 6/15/2025 | | | 1,046,375 | |
| | 575,000 | | | Raizen Fuels Finance S.A., 5.300%, 1/20/2027, 144A | | | 546,250 | |
| | 2,515,000 | | | Suzano Austria GmbH, 2.500%, 9/15/2028 | | | 1,967,082 | |
| | 1,185,000 | | | Suzano Austria GmbH, 3.125%, 1/15/2032 | | | 852,844 | |
| | 550,000 | | | Suzano Austria GmbH, 3.750%, 1/15/2031 | | | 430,897 | |
| | | | | | | | |
| | | | | | | 22,366,440 | |
| | | | | | | | |
| | | | Canada — 1.5% | |
| | 790,000 | | | 1011778 BC ULC/New Red Finance, Inc., 4.000%, 10/15/2030, 144A | | | 622,188 | |
| | 351,782 | | | Air Canada Pass Through Trust, Series 2015-2, Class A, 4.125%, 6/15/2029, 144A | | | 286,273 | |
| | 711,704 | | | Air Canada Pass Through Trust, Series 2017-1, Class AA, 3.300%, 7/15/2031, 144A | | | 609,261 | |
| | 505,000 | | | Antares Holdings LP, 3.750%, 7/15/2027, 144A | | | 407,679 | |
| | 1,210,000 | | | Antares Holdings LP, 3.950%, 7/15/2026, 144A | | | 1,034,554 | |
| | 1,010,000 | | | Antares Holdings LP, 6.000%, 8/15/2023, 144A | | | 999,591 | |
| | 2,835,000 | | | Bell Telephone Co. of Canada/Bell Canada (The), MTN, 3.600%, 9/29/2027, (CAD) | | | 1,921,401 | |
| | 1,735,000 | | | Brookfield Finance I UK PLC, 2.340%, 1/30/2032 | | | 1,297,547 | |
| | 1,015,000 | | | Brookfield Finance, Inc., 3.900%, 1/25/2028 | | | 913,892 | |
See accompanying notes to financial statements.
51 |
Portfolio of Investments – as of September 30, 2022
Loomis Sayles Global Allocation Fund – (continued)
| | | | | | | | |
Principal
Amount (‡) | | | Description | | Value (†) | |
| | | | Canada — continued | |
| | 2,715,000 | | | Brookfield Renewable Partners ULC, MTN, 4.250%, 1/15/2029, (CAD) | | $ | 1,878,143 | |
| | 1,220,000 | | | Canada Housing Trust No. 1, 1.550%, 12/15/2026, 144A, (CAD) | | | 811,373 | |
| | 1,920,000 | | | Canadian Government Bond, 2.000%, 9/01/2023, (CAD) | | | 1,365,621 | |
| | 2,465,000 | | | Canadian Pacific Railway Co., 1.750%, 12/02/2026 | | | 2,158,419 | |
| | 800,000 | | | CPPIB Capital, Inc., 0.375%, 6/20/2024, 144A, (EUR) | | | 753,643 | |
| | 4,695,000 | | | Enbridge Gas, Inc., MTN, 2.900%, 4/01/2030, (CAD) | | | 3,019,095 | |
| | 4,770,000 | | | Enbridge, Inc., MTN, 2.990%, 10/03/2029, (CAD) | | | 2,987,763 | |
| | 2,965,000 | | | Federation des Caisses Desjardins du Quebec, (fixed rate to 5/26/2025, variable rate thereafter), 2.856%, 5/26/2030, (CAD) | | | 1,999,462 | |
| | 169,807 | | | Institutional Mortgage Securities Canada, Inc., Series 2014-5A, Class A2, 2.616%, 7/12/2047, 144A, (CAD) | | | 120,486 | |
| | 4,670,000 | | | Ontario Power Generation, Inc., MTN, 2.977%, 9/13/2029, (CAD) | | | 3,025,772 | |
| | 5,000,000 | | | Province of British Columbia Canada, Series 10, 1.750%, 9/27/2024 | | | 4,748,698 | |
| | 2,355,000 | | | Province of Quebec Canada, 2.300%, 9/01/2029, (CAD) | | | 1,546,251 | |
| | 2,960,000 | | | Shaw Communications, Inc., 3.300%, 12/10/2029, (CAD) | | | 1,870,049 | |
| | 7,170,000 | | | Toronto-Dominion Bank (The), 1.950%, 1/12/2027 | | | 6,238,049 | |
| | 1,675,000 | | | Toronto-Dominion Bank (The), MTN, 1.150%, 6/12/2025 | | | 1,505,358 | |
| | 1,580,000 | | | Videotron Ltd., 5.125%, 4/15/2027, 144A | | | 1,450,195 | |
| | | | | | | | |
| | | | | | | 43,570,763 | |
| | | | | | | | |
| | | | Chile — 0.6% | |
| | 575,000 | | | Antofagasta PLC, 2.375%, 10/14/2030 | | | 429,755 | |
| | 975,000 | | | Antofagasta PLC, 5.625%, 5/13/2032 | | | 900,656 | |
| | 715,000 | | | Banco de Chile, 2.990%, 12/09/2031, 144A | | | 557,521 | |
| | 2,525,000 | | | Banco Santander Chile, 3.177%, 10/26/2031, 144A | | | 2,026,338 | |
| | 950,000 | | | Celulosa Arauco y Constitucion S.A., 4.500%, 8/01/2024 | | | 925,547 | |
| | 1,500,000 | | | Chile Government International Bond, 2.450%, 1/31/2031 | | | 1,199,883 | |
| | 1,005,000 | | | Chile Government International Bond, 2.550%, 1/27/2032 | | | 788,301 | |
| | 2,580,000 | | | Colbun S.A., 3.150%, 3/06/2030 | | | 2,034,699 | |
| | 1,960,000 | | | Corp. Nacional del Cobre de Chile, 3.000%, 9/30/2029, 144A | | | 1,641,029 | |
| | 2,075,000 | | | Corp. Nacional del Cobre de Chile, 3.750%, 1/15/2031 | | | 1,766,178 | |
| | 570,000 | | | Corp. Nacional del Cobre de Chile, 3.750%, 1/15/2031, 144A | | | 485,167 | |
| | 595,000 | | | Empresa Nacional de Telecomunicaciones S.A., 3.050%, 9/14/2032, 144A | | | 437,325 | |
| | 1,980,000 | | | Empresa Nacional del Petroleo, 3.450%, 9/16/2031, 144A | | | 1,552,736 | |
| | 525,000 | | | Enel Chile S.A., 4.875%, 6/12/2028 | | | 485,868 | |
| | 2,690,000 | | | Engie Energia Chile S.A., 3.400%, 1/28/2030 | | | 2,025,790 | |
| | 800,000 | | | Inversiones CMPC S.A., 4.375%, 5/15/2023, 144A | | | 794,170 | |
| | | | Chile — continued | |
| 1,120,000 | | | Transelec S.A., 4.250%, 1/14/2025, 144A | | | 1,086,400 | |
| | | | | | | | |
| | | | | | | 19,137,363 | |
| | | | | | | | |
| | | | China — 0.3% | |
| | 920,000 | | | Alibaba Group Holding Ltd., 3.400%, 12/06/2027 | | | 827,848 | |
| | 795,000 | | | Baidu, Inc., 3.875%, 9/29/2023 | | | 785,762 | |
| | 2,600,000 | | | Country Garden Holdings Co. Ltd., 2.700%, 7/12/2026 | | | 824,512 | |
| | 2,800,000 | | | Country Garden Holdings Co. Ltd., 3.300%, 1/12/2031 | | | 785,848 | |
| | 2,435,000 | | | Country Garden Holdings Co. Ltd., 8.000%, 1/27/2024 | | | 1,075,101 | |
| | 905,000 | | | Industrial & Commercial Bank of China Ltd., 2.957%, 11/08/2022 | | | 903,697 | |
| | 2,750,000 | | | Shimao Group Holdings Ltd., 3.450%, 1/11/2031(b) | | | 311,850 | |
| | 2,750,000 | | | Sunac China Holdings Ltd., 5.950%, 4/26/2024(b) | | | 387,887 | |
| | 625,000 | | | Tencent Holdings Ltd., 2.880%, 4/22/2031, 144A | | | 505,150 | |
| | 500,000 | | | Tencent Holdings Ltd., 2.985%, 1/19/2023, 144A | | | 498,329 | |
| | 1,175,000 | | | Tencent Holdings Ltd., 3.280%, 4/11/2024, 144A | | | 1,145,180 | |
| | 1,270,000 | | | Weibo Corp., 3.500%, 7/05/2024 | | | 1,214,246 | |
| | | | | | | | |
| | | | | | | 9,265,410 | |
| | | | | | | | |
| | | | Colombia — 0.4% | |
| | 1,395,000 | | | Colombia Government International Bond, 3.125%, 4/15/2031 | | | 967,312 | |
| | 2,536,000 | | | Ecopetrol S.A., 5.875%, 5/28/2045 | | | 1,535,320 | |
| | 1,300,000 | | | Empresas Publicas de Medellin ESP, 4.250%, 7/18/2029, 144A | | | 942,916 | |
| | 1,026,000 | | | Millicom International Cellular S.A., 6.250%, 3/25/2029, 144A | | | 870,315 | |
| | 1,035,000 | | | Millicom International Cellular S.A., 6.625%, 10/15/2026 | | | 947,025 | |
| | 575,000 | | | Republic of Colombia, 3.875%, 4/25/2027 | | | 487,536 | |
| | 7,073,300,000 | | | Republic of Colombia, Series B, 6.250%, 11/26/2025, (COP) | | | 1,305,642 | |
| | 29,559,900,000 | | | Titulos De Tesoreria, Series B, 7.500%, 8/26/2026, (COP) | | | 5,479,577 | |
| | 870,000 | | | Transportadora de Gas Internacional S.A. E.S.P., 5.550%, 11/01/2028, 144A | | | 777,354 | |
| | | | | | | | |
| | | | | | | 13,312,997 | |
| | | | | | | | |
| | | | Czech — 0.1% | |
| | 1,525,000 | | | CEZ A/S, EMTN, 0.875%, 12/02/2026, (EUR) | | | 1,284,570 | |
| | 1,120,000 | | | CEZ A/S, EMTN, 3.000%, 6/05/2028, (EUR) | | | 980,866 | |
| | | | | | | | |
| | | | | | | 2,265,436 | |
| | | | | | | | |
| | | | Denmark — 0.1% | |
| | 2,055,000 | | | Orsted A/S, EMTN, 2.125%, 5/17/2027, (GBP) | | | 1,924,869 | |
| | | | | | | | |
| | | | Dominican Republic — 0.1% | |
| | 2,160,000 | | | Dominican Republic, 4.500%, 1/30/2030, 144A | | | 1,697,472 | |
| | 1,155,000 | | | Dominican Republic, 4.875%, 9/23/2032, 144A | | | 868,342 | |
| | 590,000 | | | Dominican Republic, 5.950%, 1/25/2027, 144A | | | 551,833 | |
| | 995,000 | | | Dominican Republic, 6.000%, 7/19/2028, 144A | | | 904,962 | |
See accompanying notes to financial statements.
| 52
Portfolio of Investments – as of September 30, 2022
Loomis Sayles Global Allocation Fund – (continued)
| | | | | | | | |
Principal
Amount (‡) | | | Description | | Value (†) | |
| | | | Dominican Republic — continued | |
| $ | 425,000 | | | Dominican Republic, 8.625%, 4/20/2027, 144A | | $ | 429,194 | |
| | | | | | | | |
| | | | | | | 4,451,803 | |
| | | | | | | | |
| | | | Ecuador — 0.1% | |
| | 4,275,000 | | | Ecuador Government International Bond, 5.500%, 7/31/2030 | | | 2,012,740 | |
| | | | | | | | |
| | | | Finland — 0.2% | |
| | 3,575,000 | | | Nordea Bank Abp, 0.750%, 8/28/2025, 144A | | | 3,154,231 | |
| | 1,925,000 | | | Nordea Bank Abp, 3.600%, 6/06/2025, 144A | | | 1,845,016 | |
| | | | | | | | |
| | | | | | | 4,999,247 | |
| | | | | | | | |
| | | | France — 0.3% | |
| | 205,000 | | | BNP Paribas S.A., 4.375%, 5/12/2026, 144A | | | 193,276 | |
| | 890,000 | | | BNP Paribas S.A., (fixed rate to 6/09/2025, variable rate thereafter), 2.219%, 6/09/2026, 144A | | | 800,238 | |
| | 250,000 | | | Credit Agricole S.A., 3.250%, 10/04/2024, 144A | | | 238,608 | |
| | 4,500,000 | | | Credit Agricole S.A., (fixed rate to 1/26/2026, variable rate thereafter), 1.247%, 1/26/2027, 144A | | | 3,831,068 | |
| | 1,300,000 | | | Edenred, 1.875%, 3/06/2026, (EUR) | | | 1,217,896 | |
| | 1,400,000 | | | Engie S.A., 1.250%, 10/24/2041, (EUR) | | | 774,306 | |
| | 1,015,000 | | | Societe Generale S.A., 4.750%, 11/24/2025, 144A | | | 959,584 | |
| | | | | | | | |
| | | | | | | 8,014,976 | |
| | | | | | | | |
| | | | Germany — 0.3% | |
| | 1,635,000 | | | Deutsche Bank AG, (fixed rate to 1/07/2027, variable rate thereafter), 2.552%, 1/07/2028 | | | 1,327,359 | |
| | 305,000 | | | Deutsche Bank AG, (fixed rate to 10/07/2031, variable rate thereafter), 3.742%, 1/07/2033 | | | 197,708 | |
| | 2,255,000 | | | Deutsche Bank AG, (fixed rate to 10/14/2030, variable rate thereafter), 3.729%, 1/14/2032 | | | 1,518,624 | |
| | 3,220,000 | | | Fraport AG Frankfurt Airport Services Worldwide, 1.875%, 3/31/2028, (EUR) | | | 2,651,313 | |
| | 3,790,000 | | | Kreditanstalt fuer Wiederaufbau, EMTN, 1.250%, 8/28/2023, (NOK) | | | 341,632 | |
| | 1,450,000 | | | Siemens Financieringsmaatschappij NV, 2.350%, 10/15/2026, 144A | | | 1,301,604 | |
| | 490,000 | | | Volkswagen Group of America Finance LLC, 1.625%, 11/24/2027, 144A | | | 398,312 | |
| | 730,000 | | | Volkswagen Group of America Finance LLC, 4.350%, 6/08/2027, 144A | | | 685,657 | |
| | | | | | | | |
| | | | | | | 8,422,209 | |
| | | | | | | | |
| | | | Guatemala — 0.0% | |
| | 1,050,000 | | | CT Trust, 5.125%, 2/03/2032, 144A | | | 790,388 | |
| | | | | | | | |
| | | | Hong Kong — 0.1% | |
| | 355,000 | | | AIA Group Ltd., 3.200%, 3/11/2025, 144A | | | 341,186 | |
| | 1,405,000 | | | AIA Group Ltd., 3.600%, 4/09/2029 | | | 1,283,540 | |
| | 1,135,000 | | | AIA Group Ltd., 3.900%, 4/06/2028, 144A | | | 1,063,472 | |
| | | | | | | | |
| | | | | | | 2,688,198 | |
| | | | | | | | |
| | | | India — 0.4% | |
| | 1,195,000 | | | Adani Ports & Special Economic Zone Ltd., 3.100%, 2/02/2031, 144A | | | 862,886 | |
| | | | India — continued | |
| 2,480,000 | | | Adani Ports & Special Economic Zone Ltd., 4.200%, 8/04/2027 | | | 2,170,708 | |
| | 2,940,000 | | | Bharti Airtel Ltd., 3.250%, 6/03/2031 | | | 2,365,112 | |
| | 2,790,000 | | | Export-Import Bank of India, 2.250%, 1/13/2031, 144A | | | 2,092,049 | |
| | 1,250,000 | | | Power Finance Corp. Ltd., 3.950%, 4/23/2030, 144A | | | 1,050,212 | |
| | 2,400,000 | | | Shriram Transport Finance Co. Ltd., 4.150%, 7/18/2025, 144A | | | 2,130,269 | |
| | 2,420,000 | | | Shriram Transport Finance Co. Ltd., 4.400%, 3/13/2024 | | | 2,250,600 | |
| | | | | | | | |
| | | | | | | 12,921,836 | |
| | | | | | | | |
| | | | Indonesia — 0.3% | |
| | 300,000 | | | Indonesia Government International Bond, 4.125%, 1/15/2025, 144A | | | 293,977 | |
| | 50,092,000,000 | | | Indonesia Treasury Bond, Series FR75, 7.500%, 5/15/2038, (IDR) | | | 3,299,838 | |
| | 43,840,000,000 | | | Indonesia Treasury Bond, Series FR82, 7.000%, 9/15/2030, (IDR) | | | 2,821,364 | |
| | 1,475,000 | | | Republic of Indonesia, 2.850%, 2/14/2030 | | | 1,257,452 | |
| | | | | | | | |
| | | | | | | 7,672,631 | |
| | | | | | | | |
| | | | Ireland — 0.3% | |
| | 645,000 | | | AerCap Ireland Capital DAC/AerCap Global Aviation Trust, 3.000%, 10/29/2028 | | | 517,268 | |
| | 3,245,000 | | | AerCap Ireland Capital DAC/AerCap Global Aviation Trust, 3.300%, 1/30/2032 | | | 2,440,461 | |
| | 1,250,000 | | | Bank of Ireland Group PLC, 4.500%, 11/25/2023, 144A | | | 1,227,450 | |
| | 375,000 | | | Ireland Government Bond, 3.400%, 3/18/2024, (EUR) | | | 375,464 | |
| | 3,710,000 | | | Ireland Government Bond, Zero Coupon, 0.029%, 10/18/2031, (EUR)(c) | | | 2,878,174 | |
| | | | | | | | |
| | | | | | | 7,438,817 | |
| | | | | | | | |
| | | | Israel — 0.9% | |
| | 10,950,000 | | | State of Israel, 1.000%, 3/31/2030, (ILS) | | | 2,593,569 | |
| | 2,750,000 | | | Teva Pharmaceutical Finance Co. LLC, 6.150%, 2/01/2036 | | | 2,264,857 | |
| | 4,570,000 | | | Teva Pharmaceutical Finance Netherlands III BV, 3.150%, 10/01/2026 | | | 3,749,685 | |
| | 20,421,000 | | | Teva Pharmaceutical Finance Netherlands III BV, 4.100%, 10/01/2046 | | | 12,203,201 | |
| | 4,675,000 | | | Teva Pharmaceutical Finance Netherlands III BV, 4.750%, 5/09/2027 | | | 3,970,524 | |
| | 510,000 | | | Teva Pharmaceutical Finance Netherlands III BV, 5.125%, 5/09/2029 | | | 420,730 | |
| | | | | | | | |
| | | | | | | 25,202,566 | |
| | | | | | | | |
| | | | Italy — 0.6% | |
| | 200,000 | | | Intesa Sanpaolo SpA, 5.710%, 1/15/2026, 144A | | | 181,903 | |
| | 530,000 | | | Intesa Sanpaolo SpA, EMTN, 3.928%, 9/15/2026, (EUR) | | | 494,295 | |
| | 6,965,000 | | | Italy Buoni Poliennali Del Tesoro, 1.350%, 4/01/2030, (EUR) | | | 5,628,760 | |
| | 3,305,000 | | | Italy Buoni Poliennali Del Tesoro, 2.000%, 2/01/2028, (EUR) | | | 2,963,483 | |
| | 1,975,000 | | | Italy Government International Bond, 2.375%, 10/17/2024 | | | 1,850,306 | |
| | 3,335,000 | | | Republic of Italy, 2.500%, 11/15/2025, (EUR) | | | 3,188,899 | |
See accompanying notes to financial statements.
53 |
Portfolio of Investments – as of September 30, 2022
Loomis Sayles Global Allocation Fund – (continued)
| | | | | | | | |
Principal
Amount (‡) | | | Description | | Value (†) | |
| | | | Italy — continued | |
| $ | 830,000 | | | UniCredit SpA, (fixed rate to 4/02/2029, variable rate thereafter), 7.296%, 4/02/2034, 144A | | $ | 704,409 | |
| | 1,460,000 | | | UniCredit SpA, (fixed rate to 6/19/2027, variable rate thereafter), 5.861%, 6/19/2032, 144A | | | 1,210,428 | |
| | 200,000 | | | UniCredit SpA, (fixed rate to 6/30/2030, variable rate thereafter), 5.459%, 6/30/2035, 144A | | | 148,708 | |
| | | | | | | | |
| | | | | | | 16,371,191 | |
| | | | | | | | |
| | | | Japan — 0.8% | |
| | 1,014,927,200(†††) | | | Japan Government CPI Linked Bond, Series 23, 0.100%, 3/10/2028, (JPY) | | | 7,358,412 | |
| | 2,375,000 | | | Mitsubishi UFJ Financial Group, Inc., (fixed rate to 1/19/2027, variable rate thereafter), 2.341%, 1/19/2028 | | | 2,051,802 | |
| | 3,000,000 | | | Mitsubishi UFJ Financial Group, Inc., (fixed rate to 10/13/2026, variable rate thereafter), 1.640%, 10/13/2027 | | | 2,542,472 | |
| | 2,020,000 | | | Mizuho Financial Group, Inc., 2.564%, 9/13/2031 | | | 1,483,417 | |
| | 2,000,000 | | | Mizuho Financial Group, Inc., (fixed rate to 7/10/2023, variable rate thereafter), 1.241%, 7/10/2024 | | | 1,934,769 | |
| | 2,000,000 | | | Nomura Holdings, Inc., 1.851%, 7/16/2025 | | | 1,804,478 | |
| | 2,385,000 | | | Nomura Holdings, Inc., 2.710%, 1/22/2029 | | | 1,941,197 | |
| | 3,050,000 | | | Sumitomo Mitsui Financial Group, Inc., 1.402%, 9/17/2026 | | | 2,601,829 | |
| | 1,445,000 | | | Sumitomo Mitsui Financial Group, Inc., 3.040%, 7/16/2029 | | | 1,213,209 | |
| | | | | | | | |
| | | | | | | 22,931,585 | |
| | | | | | | | |
| | | | Korea — 0.8% | |
| | 765,000 | | | Export-Import Bank of Korea, 3.000%, 11/01/2022 | | | 764,205 | |
| | 1,650,000 | | | Kia Corp., 1.750%, 10/16/2026, 144A | | | 1,424,478 | |
| | 1,060,000 | | | Kia Corp., 2.750%, 2/14/2027, 144A | | | 940,464 | |
| | 1,515,000 | | | Korea East-West Power Co. Ltd., 1.750%, 5/06/2025, 144A | | | 1,391,982 | |
| | 2,400,000 | | | Korea National Oil Corp., 2.125%, 4/18/2027, 144A | | | 2,096,208 | |
| | 670,000 | | | KT Corp., 2.500%, 7/18/2026, 144A | | | 609,493 | |
| | 1,180,000 | | | LG Chem Ltd., 3.250%, 10/15/2024, 144A | | | 1,135,408 | |
| | 4,500,000,000 | | | Republic of Korea, 0.875%, 12/10/2023, (KRW) | | | 3,040,213 | |
| | 4,500,000,000 | | | Republic of Korea, 1.125%, 9/10/2025, (KRW) | | | 2,876,809 | |
| | 13,130,550,000 | | | Republic of Korea, 1.500%, 12/10/2030, (KRW) | | | 7,539,464 | |
| | 770,000 | | | Shinhan Bank Co. Ltd., 3.875%, 3/24/2026, 144A | | | 727,334 | |
| | 2,765,000 | | | SK Hynix, Inc., 2.375%, 1/19/2031, 144A | | | 2,044,472 | |
| | 140,000 | | | SK Telecom Co. Ltd., 6.625%, 7/20/2027, 144A | | | 148,283 | |
| | | | | | | | |
| | | | | | | 24,738,813 | |
| | | | | | | | |
| | | | Luxembourg — 0.0% | |
| | 920,000 | | | ArcelorMittal S.A., 6.750%, 3/01/2041 | | | 842,200 | |
| | | | | | | | |
| | | | Malaysia — 0.2% | |
| | 28,570,000 | | | Malaysia Government Bond, 3.480%, 3/15/2023, (MYR) | | | 6,179,745 | |
| | | | | | | | |
| | | | Mexico — 1.4% | |
| | 620,000 | | | Alfa SAB de CV, 6.875%, 3/25/2044 | | | 539,383 | |
| | | | Mexico — continued | |
| | 770,000 | | | America Movil SAB de CV, 2.125%, 3/10/2028, (EUR) | | | 691,807 | |
| | 860,000 | | | America Movil SAB de CV, 2.875%, 5/07/2030 | | | 722,245 | |
| | 10,000,000 | | | America Movil SAB de CV, 6.450%, 12/05/2022, (MXN) | | | 492,068 | |
| | 730,000 | | | Banco Santander Mexico S.A. Institucion de Banca Multiple Grupo Financiero Santander, 5.375%, 4/17/2025, 144A | | | 709,750 | |
| | 1,905,000 | | | Cemex SAB de CV, 3.875%, 7/11/2031, 144A | | | 1,501,099 | |
| | 855,000 | | | Cemex SAB de CV, 5.450%, 11/19/2029 | | | 764,156 | |
| | 400,000 | | | Cemex SAB de CV, 7.375%, 6/05/2027, 144A | | | 396,000 | |
| | 1,775,000 | | | Coca-Cola Femsa SAB de CV, 2.750%, 1/22/2030 | | | 1,530,547 | |
| | 800,000 | | | Gruma SAB de CV, 4.875%, 12/01/2024 | | | 786,808 | |
| | 10,000,000 | | | Grupo Televisa SAB, EMTN, 7.250%, 5/14/2043, (MXN) | | | 304,446 | |
| | 1,515,000 | | | Kimberly-Clark de Mexico SAB de CV, 2.431%, 7/01/2031 | | | 1,210,243 | |
| | 840,000 | | | Kimberly-Clark de Mexico SAB de CV, 2.431%, 7/01/2031, 144A | | | 671,026 | |
| | 1,707,184(††††) | | | Mexican Fixed Rate Bonds, Series M, 5.750%, 3/05/2026, (MXN) | | | 7,438,472 | |
| | 1,294,043(††††) | | | Mexican Fixed Rate Bonds, Series M 20, 8.500%, 5/31/2029, (MXN) | | | 6,064,098 | |
| | 637,836(††††) | | | Mexican Fixed Rate Bonds, Series M 30, 8.500%, 11/18/2038, (MXN) | | | 2,856,208 | |
| | 724,558(††††) | | | Mexican Fixed Rate Bonds, Series M-20, 7.500%, 6/03/2027, (MXN) | | | 3,293,907 | |
| | 2,665,000 | | | Mexico Government International Bond, 3.250%, 4/16/2030 | | | 2,221,967 | |
| | 1,880,000 | | | Mexico Government International Bond, 3.500%, 2/12/2034 | | | 1,428,543 | |
| | 196,000 | | | Mexico Government International Bond, 4.000%, 3/15/2115, (EUR) | | | 127,413 | |
| | 810,000 | | | Mexico Government International Bond, 4.875%, 5/19/2033 | | | 711,978 | |
| | 1,850,000 | | | Orbia Advance Corp. SAB de CV, 1.875%, 5/11/2026, 144A | | | 1,555,184 | |
| | 1,240,000 | | | Orbia Advance Corp. SAB de CV, 4.000%, 10/04/2027 | | | 1,077,882 | |
| | 3,505,000 | | | Petroleos Mexicanos, 5.950%, 1/28/2031 | | | 2,367,277 | |
| | 100,000 | | | Sigma Alimentos S.A. de CV, 2.625%, 2/07/2024, 144A, (EUR) | | | 94,724 | |
| | 835,000 | | | Sigma Alimentos S.A. de CV, 4.125%, 5/02/2026 | | | 751,082 | |
| | 2,090,000 | | | Sigma Finance Netherlands BV, 4.875%, 3/27/2028 | | | 1,871,031 | |
| | 1,010,000 | | | Unifin Financiera SAB de CV, 7.250%, 9/27/2023(a) | | | 149,318 | |
| | 2,195,000 | | | Unifin Financiera SAB de CV, 9.875%, 1/28/2029(a) | | | 274,375 | |
| | | | | | | | |
| | | | | | | 42,603,037 | |
| | | | | | | | |
| | | | Netherlands — 0.1% | |
| | 870,000 | | | Cooperatieve Rabobank U.A., 4.375%, 8/04/2025 | | | 831,798 | |
| | 1,725,000 | | | ING Groep NV, (fixed rate to 7/01/2025, variable rate thereafter), 1.400%, 7/01/2026, 144A | | | 1,523,149 | |
| | | | | | | | |
| | | | | | | 2,354,947 | |
| | | | | | | | |
See accompanying notes to financial statements.
| 54
Portfolio of Investments – as of September 30, 2022
Loomis Sayles Global Allocation Fund – (continued)
| | | | | | | | |
Principal
Amount (‡) | | | Description | | Value (†) | |
| | | | New Zealand — 0.6% | |
| $ | 3,495,000 | | | ANZ New Zealand International Ltd., 1.250%, 6/22/2026, 144A | | $ | 3,032,564 | |
| | 5,000,000 | | | Fonterra Co-operative Group Ltd., MTN, 5.500%, 2/26/2024, (AUD) | | | 3,233,035 | |
| | 10,700,000 | | | New Zealand Government Bond, 0.500%, 5/15/2024, (NZD) | | | 5,641,415 | |
| | 6,310,000 | | | New Zealand Government Bond, 1.500%, 5/15/2031, (NZD) | | | 2,832,176 | |
| | 3,575,000 | | | New Zealand Government Bond, 3.000%, 4/20/2029, (NZD) | | | 1,858,596 | |
| | | | | | | | |
| | | | | | | 16,597,786 | |
| | | | | | | | |
| | | | Nigeria — 0.0% | |
| | 1,975,000 | | | Nigeria Government International Bond, 6.125%, 9/28/2028, 144A | | | 1,306,146 | |
| | | | | | | | |
| | | | Norway — 0.6% | |
| | 3,660,000 | | | DNB Bank ASA, (fixed rate to 5/25/2026, variable rate thereafter), 1.535%, 5/25/2027, 144A | | | 3,147,915 | |
| | 2,790,000 | | | Equinor ASA, 3.625%, 4/06/2040 | | | 2,231,932 | |
| | 41,750,000 | | | Norway Government Bond, 1.750%, 2/17/2027, 144A, (NOK) | | | 3,608,257 | |
| | 16,500,000 | | | Norway Government Bond, Series 478, 1.500%, 2/19/2026, 144A, (NOK) | | | 1,433,312 | |
| | 36,610,000 | | | Norway Government Bond, Series 480, 2.000%, 4/26/2028, 144A, (NOK) | | | 3,156,022 | |
| | 46,500,000 | | | Norway Government Bond, Series 482, 1.375%, 8/19/2030, 144A, (NOK) | | | 3,712,381 | |
| | | | | | | | |
| | | | | | | 17,289,819 | |
| | | | | | | | |
| | | | Panama — 0.0% | |
| | 1,485,000 | | | Cable Onda S.A., 4.500%, 1/30/2030, 144A | | | 1,169,054 | |
| | | | | | | | |
| | | | Paraguay — 0.1% | |
| | 1,420,000 | | | Paraguay Government International Bond, 4.950%, 4/28/2031, 144A | | | 1,263,365 | |
| | 800,000 | | | Republic of Paraguay, 5.000%, 4/15/2026, 144A | | | 769,664 | |
| | | | | | | | |
| | | | | | | 2,033,029 | |
| | | | | | | | |
| | | | Peru — 0.2% | |
| | 3,220,000 | | | Corp. Financiera de Desarrollo S.A., 2.400%, 9/28/2027, 144A | | | 2,651,960 | |
| | 2,005,000 | | | Peruvian Government International Bond, 2.392%, 1/23/2026 | | | 1,818,187 | |
| | 2,455,000 | | | Peruvian Government International Bond, 3.000%, 1/15/2034 | | | 1,843,353 | |
| | 1,050,000 | | | Transportadora de Gas del Peru S.A., 4.250%, 4/30/2028, 144A | | | 985,845 | |
| | | | | | | | |
| | | | | | | 7,299,345 | |
| | | | | | | | |
| | | | Philippines — 0.0% | |
| | 1,060,000 | | | Philippine Government International Bond, 2.457%, 5/05/2030 | | | 887,559 | |
| | | | | | | | |
| | | | Poland — 0.2% | |
| | 26,400,000 | | | Republic of Poland Government Bond, 1.250%, 10/25/2030, (PLN) | | | 3,387,278 | |
| | 12,970,000 | | | Republic of Poland Government Bond, 3.250%, 7/25/2025, (PLN) | | | 2,343,910 | |
| | | | | | | | |
| | | | | | | 5,731,188 | |
| | | | | | | | |
| | | | Portugal — 0.1% | |
| | 3,590,000 | | | EDP Finance BV, 1.710%, 1/24/2028, 144A | | | 2,919,891 | |
| | | | | | | | |
| | | | Qatar — 0.1% | |
| 1,770,000 | | | Ooredoo International Finance Ltd., 2.625%, 4/08/2031, 144A | | | 1,462,020 | |
| | 1,600,000 | | | Qatar Energy, 2.250%, 7/12/2031, 144A | | | 1,288,893 | |
| | | | | | | | |
| | | | | | | 2,750,913 | |
| | | | | | | | |
| | | | Romania — 0.0% | |
| | 1,100,000 | | | Romania Government International Bond, 2.000%, 4/14/2033, 144A, (EUR) | | | 636,674 | |
| | | | | | | | |
| | | | Singapore — 0.4% | |
| | 1,450,000 | | | BOC Aviation Ltd., 3.250%, 4/29/2025, 144A | | | 1,366,455 | |
| | 860,000 | | | BOC Aviation USA Corp., 1.625%, 4/29/2024, 144A | | | 811,953 | |
| | 4,510,000 | | | Republic of Singapore, 2.750%, 7/01/2023, (SGD) | | | 3,124,913 | |
| | 10,055,000 | | | Singapore Government Bond, 2.125%, 6/01/2026, (SGD) | | | 6,657,828 | |
| | | | | | | | |
| | | | | | | 11,961,149 | |
| | | | | | | | |
| | | | South Africa — 0.6% | |
| | 1,400,000 | | | Anglo American Capital PLC, 2.625%, 9/10/2030, 144A | | | 1,077,631 | |
| | 1,400,000 | | | Anglo American Capital PLC, 5.625%, 4/01/2030, 144A | | | 1,324,534 | |
| | 2,990,000 | | | AngloGold Ashanti Holdings PLC, 3.375%, 11/01/2028 | | | 2,424,528 | |
| | 1,420,000 | | | MTN (Mauritius) Investments Ltd., 4.755%, 11/11/2024 | | | 1,359,162 | |
| | 930,000 | | | MTN (Mauritius) Investments Ltd., 4.755%, 11/11/2024, 144A | | | 890,155 | |
| | 116,835,000 | | | Republic of South Africa, Series 2035, 8.875%, 2/28/2035, (ZAR) | | | 5,274,358 | |
| | 39,185,000 | | | Republic of South Africa, Series R213, 7.000%, 2/28/2031, (ZAR) | | | 1,673,264 | |
| | 7,585,000 | | | South Africa Government International Bond, 5.750%, 9/30/2049 | | | 4,865,778 | |
| | | | | | | | |
| | | | | | | 18,889,410 | |
| | | | | | | | |
| | | | Spain — 0.4% | |
| | 2,000,000 | | | Banco Santander S.A., (fixed rate to 9/14/2026, variable rate thereafter), 1.722%, 9/14/2027 | | | 1,654,549 | |
| | 600,000 | | | CaixaBank S.A., (fixed rate to 4/17/2025, variable rate thereafter), EMTN, 2.250%, 4/17/2030, (EUR) | | | 525,038 | |
| | 500,000 | | | CaixaBank S.A., (fixed rate to 7/14/2023, variable rate thereafter), EMTN, 2.750%, 7/14/2028, (EUR) | | | 477,353 | |
| | 3,700,000 | | | Cellnex Telecom S.A., EMTN, 1.750%, 10/23/2030, (EUR) | | | 2,551,007 | |
| | 700,000 | | | Naturgy Finance BV, EMTN, 1.500%, 1/29/2028, (EUR) | | | 602,377 | |
| | 430,000 | | | Spain Government Bond, 1.600%, 4/30/2025, 144A, (EUR) | | | 414,483 | |
| | 2,525,000 | | | Spain Government Bond, 1.950%, 7/30/2030, 144A, (EUR) | | | 2,297,523 | |
| | 2,565,000 | | | Spain Government Bond, 4.400%, 10/31/2023, 144A, (EUR) | | | 2,576,513 | |
| | | | | | | | |
| | | | | | | 11,098,843 | |
| | | | | | | | |
| | | | Supranationals — 0.4% | |
| | 1,495,000 | | | Corporacion Andina de Fomento, 2.375%, 5/12/2023 | | | 1,475,565 | |
| | 3,360,000 | | | European Investment Bank, 1.750%, 7/30/2024, 144A, (CAD) | | | 2,338,269 | |
See accompanying notes to financial statements.
55 |
Portfolio of Investments – as of September 30, 2022
Loomis Sayles Global Allocation Fund – (continued)
| | | | | | | | |
Principal
Amount (‡) | | | Description | | Value (†) | |
| | | | Supranationals — continued | |
| | 2,560,000 | | | International Bank for Reconstruction & Development, 0.250%, 12/23/2022, (SEK) | | $ | 229,934 | |
| | 10,030,000 | | | International Bank for Reconstruction & Development, 1.200%, 7/22/2026, (CAD) | | | 6,589,296 | |
| | 16,750,000 | | | Nordic Investment Bank, EMTN, 1.500%, 3/13/2025, (NOK) | | | 1,466,481 | |
| | | | | | | | |
| | | | | | | 12,099,545 | |
| | | | | | | | |
| | | | Sweden — 0.1% | |
| | 1,900,000 | | | Heimstaden Bostad Treasury BV, EMTN, 1.375%, 7/24/2028, (EUR) | | | 1,432,696 | |
| | 38,000,000 | | | Sweden Government Bond, 0.125%, 5/12/2031, 144A, (SEK) | | | 2,868,042 | |
| | | | | | | | |
| | | | | | | 4,300,738 | |
| | | | | | | | |
| | | | Switzerland — 0.2% | |
| | 930,000 | | | Credit Suisse AG, 2.950%, 4/09/2025 | | | 855,331 | |
| | 3,855,000 | | | Credit Suisse Group AG, (fixed rate to 5/14/2031, variable rate thereafter), 3.091%, 5/14/2032, 144A | | | 2,706,355 | |
| | 1,375,000 | | | Novartis Capital Corp., 2.000%, 2/14/2027 | | | 1,233,403 | |
| | 340,000 | | | Willow No. 2 (Ireland) PLC for Zurich Insurance Co. Ltd., EMTN, (fixed rate to 10/01/2025, variable rate thereafter), 4.250%, 10/01/2045 | | | 297,585 | |
| | | | | | | | |
| | | | | | | 5,092,674 | |
| | | | | | | | |
| | | | Taiwan — 0.2% | |
| | 1,925,000 | | | TSMC Arizona Corp., 2.500%, 10/25/2031 | | | 1,530,685 | |
| | 3,180,000 | | �� | TSMC Arizona Corp., 4.125%, 4/22/2029 | | | 2,996,009 | |
| | | | | | | | |
| | | | | | | 4,526,694 | |
| | | | | | | | |
| | | | Tanzania — 0.0% | |
| | 985,000 | | | HTA Group Ltd., 7.000%, 12/18/2025, 144A | | | 854,488 | |
| | | | | | | | |
| | | | Thailand — 0.0% | |
| | 950,000 | | | Thaioil Treasury Center Co. Ltd., 3.625%, 1/23/2023, 144A | | | 945,316 | |
| | | | | | | | |
| | | | Trinidad And Tobago — 0.0% | |
| | 415,000 | | | Trinidad Generation Unlimited, 5.250%, 11/04/2027, 144A | | | 399,438 | |
| | | | | | | | |
| | | | Turkey — 0.5% | |
| | 2,045,000 | | | Aydem Yenilenebilir Enerji A/S, 7.750%, 2/02/2027, 144A | | | 1,492,850 | |
| | 2,250,000 | | | TC Ziraat Bankasi A/S, 5.375%, 3/02/2026, 144A | | | 1,878,750 | |
| | 2,830,000 | | | Turk Telekomunikasyon AS, 6.875%, 2/28/2025 | | | 2,479,476 | |
| | 525,000 | | | Turk Telekomunikasyon AS, 6.875%, 2/28/2025, 144A | | | 459,974 | |
| | 2,875,000 | | | Turkcell Iletisim Hizmetleri AS, 5.800%, 4/11/2028 | | | 2,271,480 | |
| | 6,970,000 | | | Turkey Government International Bond, 5.250%, 3/13/2030 | | | 4,979,368 | |
| | 1,345,000 | | | Turkey Government International Bond, 7.625%, 4/26/2029 | | | 1,143,250 | |
| | | | | | | | |
| | | | | | | 14,705,148 | |
| | | | | | | | |
| | | | United Arab Emirates — 0.1% | |
| | 1,610,000 | | | Abu Dhabi Crude Oil Pipeline LLC, 3.650%, 11/02/2029 | | | 1,491,263 | |
| | 1,295,000 | | | Abu Dhabi Government International Bond, 3.125%, 4/16/2030, 144A | | | 1,170,356 | |
| | | | | | | | |
| | | | | | | 2,661,619 | |
| | | | | | | | |
| | | | United Kingdom — 0.4% | |
| 200,000 | | | Ashtead Capital, Inc., 5.500%, 8/11/2032, 144A | | | 185,623 | |
| | 95,000 | | | Avon Products, Inc., 8.450%, 3/15/2043 | | | 91,700 | |
| | 1,350,000 | | | CK Hutchison International 19 Ltd., 3.625%, 4/11/2029, 144A | | | 1,240,906 | |
| | 1,420,000 | | | Diageo Capital PLC, 2.125%, 4/29/2032 | | | 1,098,941 | |
| | 1,125,000 | | | Lloyds Banking Group PLC, (fixed rate to 7/09/2024, variable rate thereafter), 3.870%, 7/09/2025 | | | 1,084,738 | |
| | 1,395,000 | | | Nationwide Building Society, (fixed rate to 7/18/2029, variable rate thereafter), 3.960%, 7/18/2030, 144A | | | 1,202,288 | |
| | 1,190,000 | | | NatWest Markets PLC, 0.800%, 8/12/2024, 144A | | | 1,092,942 | |
| | 235,000 | | | Network Rail Infrastructure Finance PLC, EMTN, 4.750%, 1/22/2024, (GBP) | | | 261,718 | |
| | 955,000 | | | Santander U.K. Group Holdings PLC, (fixed rate to 1/11/2027, variable rate thereafter), 2.469%, 1/11/2028 | | | 794,824 | |
| | 1,455,000 | | | Standard Chartered PLC, (fixed rate to 11/18/2030, variable rate thereafter), 3.265%, 2/18/2036, 144A | | | 1,068,185 | |
| | 2,200,000 | | | Standard Chartered PLC, (fixed rate to 3/30/2025, variable rate thereafter), 3.971%, 3/30/2026, 144A | | | 2,068,521 | |
| | 250,000 | | | Standard Chartered PLC, EMTN, 3.125%, 11/19/2024, (EUR) | | | 237,424 | |
| | 1,035,000 | | | United Kingdom Gilt, 2.750%, 9/07/2024, (GBP) | | | 1,123,719 | |
| | 1,660,000 | | | Vodafone Group PLC, 4.375%, 5/30/2028 | | | 1,561,503 | |
| | | | | | | | |
| | | | | | | 13,113,032 | |
| | | | | | | | |
| | | | United States — 12.6% | |
| | 165,000 | | | AES Corp. (The), 3.950%, 7/15/2030, 144A | | | 141,290 | |
| | 315,000 | | | Aircastle Ltd., (fixed rate to 6/15/2026, variable rate thereafter), 5.250%, 144A(d) | | | 236,280 | |
| | 1,915,000 | | | Albemarle Corp., 5.050%, 6/01/2032 | | | 1,774,529 | |
| | 480,000 | | | Allison Transmission, Inc., 4.750%, 10/01/2027, 144A | | | 422,723 | |
| | 1,145,000 | | | Ally Financial, Inc., Series B, (fixed rate to 5/15/2026, variable rate thereafter), 4.700%(d) | | | 892,538 | |
| | 965,000 | | | Ally Financial, Inc., Series C, (fixed rate to 5/15/2028, variable rate thereafter), 4.700%(d) | | | 687,562 | |
| | 1,313,306 | | | American Airlines Pass Through Trust, Series 2016-1, Class B, 5.250%, 7/15/2025 | | | 1,244,226 | |
| | 1,053,980 | | | American Airlines Pass Through Trust, Series 2016-3, Class B, 3.750%, 4/15/2027 | | | 912,483 | |
| | 286,103 | | | American Airlines Pass Through Trust, Series 2017-1B, Class B, 4.950%, 8/15/2026 | | | 260,139 | |
| | 375,212 | | | American Airlines Pass Through Trust, Series 2017-2, Class B, 3.700%, 4/15/2027 | | | 327,665 | |
| | 3,975,000 | | | Apple, Inc., Series MPLE, 2.513%, 8/19/2024, (CAD) | | | 2,780,270 | |
| | 260,000 | | | Aptiv PLC, 1.600%, 9/15/2028, (EUR) | | | 210,524 | |
| | 2,330,000 | | | Ares Capital Corp., 3.200%, 11/15/2031 | | | 1,660,800 | |
| | 1,300,000 | | | Ashland LLC, 3.375%, 9/01/2031, 144A | | | 1,004,789 | |
| | 945,000 | | | Athene Global Funding, 1.608%, 6/29/2026, 144A | | | 803,637 | |
| | 2,410,000 | | | Athene Global Funding, 1.716%, 1/07/2025, 144A | | | 2,202,957 | |
See accompanying notes to financial statements.
| 56
Portfolio of Investments – as of September 30, 2022
Loomis Sayles Global Allocation Fund – (continued)
| | | | | | | | |
Principal
Amount (‡) | | | Description | | Value (†) | |
| | | | United States — continued | |
| | 2,865,000 | | | Bank of America Corp., (fixed rate to 9/15/2026, variable rate thereafter), 1.978%, 9/15/2027, (CAD) | | $ | 1,825,171 | |
| | 730,000 | | | Bank of America Corp., (fixed rate to 9/21/2031, variable rate thereafter), 2.482%, 9/21/2036 | | | 527,271 | |
| | 665,000 | | | Barings BDC, Inc., 3.300%, 11/23/2026, 144A | | | 551,576 | |
| | 950,000 | | | Bausch Health Cos., Inc., 4.875%, 6/01/2028, 144A | | | 612,465 | |
| | 7,660,000 | | | Bausch Health Cos., Inc., 5.000%, 1/30/2028, 144A | | | 2,820,489 | |
| | 205,000 | | | Bausch Health Cos., Inc., 5.000%, 2/15/2029, 144A | | | 79,489 | |
| | 1,215,000 | | | Bausch Health Cos., Inc., 5.250%, 1/30/2030, 144A | | | 453,779 | |
| | 4,007,000 | | | Bausch Health Cos., Inc., 5.250%, 2/15/2031, 144A | | | 1,506,833 | |
| | 228,000 | | | Bausch Health Cos., Inc., 6.250%, 2/15/2029, 144A | | | 85,073 | |
| | 370,000 | | | Bausch Health Cos., Inc., 7.000%, 1/15/2028, 144A | | | 140,955 | |
| | 1,140,000 | | | Beazer Homes USA, Inc., 7.250%, 10/15/2029 | | | 900,600 | |
| | 500,000 | | | Block, Inc., 3.500%, 6/01/2031 | | | 387,657 | |
| | 140,000 | | | Boeing Co. (The), 3.100%, 5/01/2026 | | | 127,806 | |
| | 25,000 | | | Boeing Co. (The), 3.250%, 2/01/2035 | | | 17,656 | |
| | 165,000 | | | Boeing Co. (The), 3.550%, 3/01/2038 | | | 113,022 | |
| | 25,000 | | | Boeing Co. (The), 3.625%, 3/01/2048 | | | 15,548 | |
| | 80,000 | | | Boeing Co. (The), 3.750%, 2/01/2050 | | | 51,672 | |
| | 635,000 | | | Boeing Co. (The), 3.850%, 11/01/2048 | | | 411,008 | |
| | 640,000 | | | Boeing Co. (The), 3.950%, 8/01/2059 | | | 397,601 | |
| | 30,000 | | | Boeing Co. (The), 5.150%, 5/01/2030 | | | 27,751 | |
| | 875,000 | | | BPR Trust, Series 2021-NRD, Class F, 1-month SOFR + 6.870%, 9.792%, 12/15/2023, 144A(e) | | | 813,571 | |
| | 690,000 | | | Broadcom, Inc., 3.187%, 11/15/2036, 144A | | | 471,923 | |
| | 545,000 | | | Carnival Corp., 5.750%, 3/01/2027, 144A | | | 381,800 | |
| | 490,000 | | | Catalent Pharma Solutions, Inc., 3.125%, 2/15/2029, 144A | | | 377,913 | |
| | 12,500,000 | | | CCO Holdings LLC/CCO Holdings Capital Corp., 4.250%, 2/01/2031, 144A | | | 9,670,250 | |
| | 3,810,000 | | | CCO Holdings LLC/CCO Holdings Capital Corp., 4.250%, 1/15/2034, 144A | | | 2,727,122 | |
| | 1,575,000 | | | CCO Holdings LLC/CCO Holdings Capital Corp., 4.750%, 2/01/2032, 144A | | | 1,226,578 | |
| | 595,000 | | | CCO Holdings LLC/CCO Holdings Capital Corp., 5.125%, 5/01/2027, 144A | | | 536,987 | |
| | 240,000 | | | CCO Holdings LLC/CCO Holdings Capital Corp., 5.500%, 5/01/2026, 144A | | | 227,400 | |
| | 370,000 | | | Celanese U.S. Holdings LLC, 6.330%, 7/15/2029 | | | 344,849 | |
| | 270,000 | | | Celanese U.S. Holdings LLC, 6.379%, 7/15/2032 | | | 250,903 | |
| | 2,510,000 | | | Centene Corp., 2.500%, 3/01/2031 | | | 1,891,992 | |
| | 160,000 | | | Centene Corp., 2.625%, 8/01/2031 | | | 120,588 | |
| | 975,000 | | | Centene Corp., 3.000%, 10/15/2030 | | | 772,141 | |
| | 165,000 | | | Charles River Laboratories International, Inc., 3.750%, 3/15/2029, 144A | | | 137,249 | |
| | 175,000 | | | Charles River Laboratories International, Inc., 4.000%, 3/15/2031, 144A | | | 141,124 | |
| | 150,000 | | | Charter Communications Operating LLC/Charter Communications Operating Capital, 2.300%, 2/01/2032 | | | 107,113 | |
| | | | United States — continued | |
| 360,000 | | | Charter Communications Operating LLC/Charter Communications Operating Capital, 2.800%, 4/01/2031 | | | 272,141 | |
| | 180,000 | | | Charter Communications Operating LLC/Charter Communications Operating Capital, 4.400%, 4/01/2033 | | | 149,052 | |
| | 1,075,000 | | | Charter Communications Operating LLC/Charter Communications Operating Capital Corp., 3.950%, 6/30/2062 | | | 637,467 | |
| | 6,405,000 | | | Charter Communications Operating LLC/Charter Communications Operating Capital Corp., 4.400%, 12/01/2061 | | | 4,080,450 | |
| | 5,315,000 | | | CommScope Technologies LLC, 5.000%, 3/15/2027, 144A | | | 4,012,825 | |
| | 7,265,000 | | | CommScope, Inc., 4.750%, 9/01/2029, 144A | | | 5,925,770 | |
| | 1,565,000 | | | CommScope, Inc., 7.125%, 7/01/2028, 144A | | | 1,208,040 | |
| | 905,000 | | | Continental Resources, Inc., 2.875%, 4/01/2032, 144A | | | 662,727 | |
| | 3,950,000 | | | Continental Resources, Inc., 5.750%, 1/15/2031, 144A | | | 3,570,241 | |
| | 2,125,000 | | | Covanta Holding Corp., 4.875%, 12/01/2029, 144A | | | 1,717,552 | |
| | 22,445,000 | | | CSC Holdings LLC, 4.625%, 12/01/2030, 144A | | | 15,262,600 | |
| | 2,060,000 | | | CSC Holdings LLC, 5.000%, 11/15/2031, 144A | | | 1,360,714 | |
| | 595,000 | | | CSC Holdings LLC, 5.375%, 2/01/2028, 144A | | | 519,137 | |
| | 495,000 | | | CSC Holdings LLC, 5.750%, 1/15/2030, 144A | | | 351,829 | |
| | 1,115,000 | | | CSC Holdings LLC, 6.500%, 2/01/2029, 144A | | | 983,987 | |
| | 490,000 | | | Dana, Inc., 5.375%, 11/15/2027 | | | 415,275 | |
| | 80,000 | | | Darling Ingredients, Inc., 6.000%, 6/15/2030, 144A | | | 76,135 | |
| | 2,235,000 | | | DCP Midstream Operating LP, 3.250%, 2/15/2032 | | | 1,766,808 | |
| | 380,000 | | | DCP Midstream Operating LP, 5.125%, 5/15/2029 | | | 356,071 | |
| | 940,000 | | | DH Europe Finance II S.a.r.l., 0.750%, 9/18/2031, (EUR) | | | 707,531 | |
| | 50,000 | | | Dillard’s, Inc., 7.000%, 12/01/2028 | | | 50,953 | |
| | 8,000 | | | Dillard’s, Inc., 7.750%, 7/15/2026 | | | 8,298 | |
| | 355,000 | | | DIRECTV Financing LLC/DIRECTV Financing Co-Obligor, Inc., 5.875%, 8/15/2027, 144A | | | 306,049 | |
| | 2,475,000 | | | DISH DBS Corp., 5.125%, 6/01/2029 | | | 1,454,062 | |
| | 4,115,000 | | | DISH DBS Corp., 5.250%, 12/01/2026, 144A | | | 3,371,201 | |
| | 1,960,000 | | | DISH DBS Corp., 7.750%, 7/01/2026 | | | 1,503,457 | |
| | 160,000 | | | Edison International, 4.950%, 4/15/2025 | | | 156,755 | |
| | 575,000 | | | EnLink Midstream Partners LP, 5.450%, 6/01/2047 | | | 420,020 | |
| | 280,000 | | | EPR Properties, 3.600%, 11/15/2031 | | | 200,049 | |
| | 70,000 | | | EQT Corp., 3.125%, 5/15/2026, 144A | | | 63,750 | |
| | 1,555,000 | | | EQT Corp., 3.625%, 5/15/2031, 144A | | | 1,296,351 | |
| | 515,000 | | | EQT Corp., 3.900%, 10/01/2027 | | | 468,649 | |
| | 360,000 | | | EQT Corp., 5.000%, 1/15/2029 | | | 335,893 | |
| | 275,000 | | | EQT Corp., 5.678%, 10/01/2025 | | | 273,307 | |
| | 190,000 | | | EQT Corp., 5.700%, 4/01/2028 | | | 186,267 | |
| | 115,000 | | | Everi Holdings, Inc., 5.000%, 7/15/2029, 144A | | | 94,291 | |
See accompanying notes to financial statements.
57 |
Portfolio of Investments – as of September 30, 2022
Loomis Sayles Global Allocation Fund – (continued)
| | | | | | | | |
Principal
Amount (‡) | | | Description | | Value (†) | |
| | | | United States — continued | |
| $ | 3,780,000 | | | Expedia Group, Inc., 2.950%, 3/15/2031 | | $ | 2,932,442 | |
| | 170,000 | | | Ford Motor Co., 3.250%, 2/12/2032 | | | 122,456 | |
| | 2,105,000 | | | Ford Motor Co., 6.625%, 10/01/2028 | | | 2,047,112 | |
| | 2,710,000 | | | Freeport-McMoRan, Inc., 4.375%, 8/01/2028 | | | 2,440,245 | |
| | 6,640,000 | | | Freeport-McMoRan, Inc., 5.400%, 11/14/2034 | | | 5,901,698 | |
| | 2,710,000 | | | General Motors Co., 5.200%, 4/01/2045 | | | 2,063,451 | |
| | 405,000 | | | General Motors Co., 6.250%, 10/02/2043 | | | 351,795 | |
| | 315,000 | | | Georgia-Pacific LLC, 8.875%, 5/15/2031 | | | 383,475 | |
| | 460,000 | | | GLP Capital LP/GLP Financing II, Inc., 3.250%, 1/15/2032 | | | 345,792 | |
| | 855,000 | | | Go Daddy Operating Co. LLC/GD Finance Co., Inc., 3.500%, 3/01/2029, 144A | | | 699,287 | |
| | 975,000 | | | Goodyear Tire & Rubber Co. (The), 7.000%, 3/15/2028 | | | 982,722 | |
| | 830,000 | | | HCA, Inc., 3.500%, 9/01/2030 | | | 685,348 | |
| | 610,000 | | | Hess Midstream Operations LP, 4.250%, 2/15/2030, 144A | | | 492,575 | |
| | 350,000 | | | Hess Midstream Operations LP, 5.625%, 2/15/2026, 144A | | | 332,239 | |
| | 660,000 | | | Hilton Grand Vacations Borrower Escrow LLC/Hilton Grand Vacations Borrower Escrow, 4.875%, 7/01/2031, 144A | | | 503,950 | |
| | 470,000 | | | Hilton Grand Vacations Borrower Escrow LLC/Hilton Grand Vacations Borrower Escrow, 5.000%, 6/01/2029, 144A | | | 379,337 | |
| | 1,000,000 | | | Hyundai Capital America, 2.650%, 2/10/2025 | | | 931,834 | |
| | 835,000 | | | Hyundai Capital America, 2.650%, 2/10/2025, 144A | | | 778,082 | |
| | 1,585,000 | | | Hyundai Capital America, 2.750%, 9/27/2026, 144A | | | 1,398,147 | |
| | 1,395,000 | | | Hyundai Capital America, 6.375%, 4/08/2030, 144A | | | 1,397,983 | |
| | 11,250,000 | | | Icahn Enterprises LP/Icahn Enterprises Finance Corp., 4.375%, 2/01/2029 | | | 9,054,900 | |
| | 1,180,000 | | | Icahn Enterprises LP/Icahn Enterprises Finance Corp., 5.250%, 5/15/2027 | | | 1,033,102 | |
| | 1,210,000 | | | iHeartCommunications, Inc., 4.750%, 1/15/2028, 144A | | | 1,008,535 | |
| | 665,000 | | | iHeartCommunications, Inc., 5.250%, 8/15/2027, 144A | | | 568,076 | |
| | 1,980,000 | | | iHeartCommunications, Inc., 8.375%, 5/01/2027 | | | 1,665,012 | |
| | 1,135,000 | | | Iron Mountain, Inc., 4.875%, 9/15/2029, 144A | | | 932,391 | |
| | 795,000 | | | JBS USA LUX S.A./JBS USA Food Co./JBS USA Finance, Inc., 3.750%, 12/01/2031, 144A | | | 636,429 | |
| | 730,000 | | | JELD-WEN, Inc., 4.875%, 12/15/2027, 144A | | | 521,950 | |
| | 1,135,000 | | | John Deere Capital Corp., MTN, 0.450%, 6/07/2024 | | | 1,058,628 | |
| | 3,185,000 | | | John Deere Financial, Inc., 1.340%, 9/08/2027, (CAD) | | | 1,961,149 | |
| | 345,000 | | | Lithia Motors, Inc., 3.875%, 6/01/2029, 144A | | | 276,863 | |
| | 870,000 | | | Marriott Ownership Resorts, Inc., 4.500%, 6/15/2029, 144A | | | 687,566 | |
| | 44,000 | | | Masco Corp., 6.500%, 8/15/2032 | | | 44,151 | |
| | 615,000 | | | Medtronic Global Holdings SCA, 1.125%, 3/07/2027, (EUR) | | | 547,599 | |
| | | | United States — continued | |
| 2,237,250 | | | Mileage Plus Holdings LLC/Mileage Plus Intellectual Property Assets Ltd., 6.500%, 6/20/2027, 144A | | | 2,189,776 | |
| | 1,025,000 | | | Minerals Technologies, Inc., 5.000%, 7/01/2028, 144A | | | 894,097 | |
| | 435,000 | | | Molina Healthcare, Inc., 3.875%, 5/15/2032, 144A | | | 356,320 | |
| | 490,000 | | | MSCI, Inc., 3.250%, 8/15/2033, 144A | | | 378,393 | |
| | 2,135,000 | | | Nationstar Mortgage Holdings, Inc., 5.500%, 8/15/2028, 144A | | | 1,676,497 | |
| | 1,365,000 | | | Navient Corp., 5.000%, 3/15/2027 | | | 1,116,450 | |
| | 421,000 | | | Navient Corp., MTN, 5.625%, 8/01/2033 | | | 282,988 | |
| | 4,600,000 | | | NCL Corp. Ltd., 5.875%, 3/15/2026, 144A | | | 3,499,404 | |
| | 615,000 | | | NCL Corp. Ltd., 5.875%, 2/15/2027, 144A | | | 512,061 | |
| | 790,000 | | | NCL Finance Ltd., 6.125%, 3/15/2028, 144A | | | 582,605 | |
| | 835,000 | | | Netflix, Inc., 4.875%, 4/15/2028 | | | 781,489 | |
| | 2,620,000 | | | Netflix, Inc., 4.875%, 6/15/2030, 144A | | | 2,394,254 | |
| | 310,000 | | | Netflix, Inc., 5.375%, 11/15/2029, 144A | | | 291,400 | |
| | 280,000 | | | Netflix, Inc., 5.875%, 11/15/2028 | | | 273,218 | |
| | 530,000 | | | Netflix, Inc., 6.375%, 5/15/2029 | | | 526,168 | |
| | 20,000 | | | NGPL PipeCo LLC, 7.768%, 12/15/2037, 144A | | | 20,214 | |
| | 475,000 | | | Novelis Corp., 4.750%, 1/30/2030, 144A | | | 389,500 | |
| | 1,865,000 | | | NRG Energy, Inc., 3.625%, 2/15/2031, 144A | | | 1,454,700 | |
| | 455,000 | | | NRG Energy, Inc., 3.875%, 2/15/2032, 144A | | | 354,920 | |
| | 30,000 | | | Occidental Petroleum Corp., 6.125%, 1/01/2031 | | | 29,550 | |
| | 2,355,000 | | | Occidental Petroleum Corp., 6.625%, 9/01/2030 | | | 2,390,325 | |
| | 50,000 | | | Occidental Petroleum Corp., 7.875%, 9/15/2031 | | | 53,375 | |
| | 1,845,000 | | | Occidental Petroleum Corp., 8.875%, 7/15/2030 | | | 2,054,038 | |
| | 1,170,000 | | | OneMain Finance Corp., 5.625%, 3/15/2023 | | | 1,164,168 | |
| | 860,000 | | | OneMain Finance Corp., 6.875%, 3/15/2025 | | | 808,271 | |
| | 2,310,000 | | | OneMain Finance Corp., 7.125%, 3/15/2026 | | | 2,082,238 | |
| | 130,000 | | | OneMain Finance Corp., 8.250%, 10/01/2023 | | | 131,452 | |
| | 1,490,000 | | | Oracle Corp., 3.950%, 3/25/2051 | | | 988,176 | |
| | 1,000,000 | | | Ovintiv, Inc., 6.500%, 8/15/2034 | | | 974,173 | |
| | 45,000 | | | Ovintiv, Inc., 6.500%, 2/01/2038 | | | 43,695 | |
| | 230,000 | | | Ovintiv, Inc., 6.625%, 8/15/2037 | | | 225,102 | |
| | 30,000 | | | Ovintiv, Inc., 7.200%, 11/01/2031 | | | 30,589 | |
| | 115,000 | | | Ovintiv, Inc., 7.375%, 11/01/2031 | | | 119,799 | |
| | 130,000 | | | Ovintiv, Inc., 8.125%, 9/15/2030 | | | 140,326 | |
| | 8,630,000 | | | Owl Rock Capital Corp., 4.250%, 1/15/2026 | | | 7,892,498 | |
| | 1,550,000 | | | Owl Rock Technology Finance Corp., 2.500%, 1/15/2027 | | | 1,243,600 | |
| | 2,120,000 | | | Owl Rock Technology Finance Corp., 4.750%, 12/15/2025, 144A | | | 1,908,277 | |
| | 325,000 | | | Pacific Gas & Electric Co., 3.500%, 8/01/2050 | | | 197,782 | |
| | 320,000 | | | Pacific Gas & Electric Co., 5.450%, 6/15/2027 | | | 301,443 | |
| | 1,265,000 | | | Pilgrim’s Pride Corp., 3.500%, 3/01/2032, 144A | | | 954,088 | |
| | 315,000 | | | Pilgrim’s Pride Corp., 4.250%, 4/15/2031, 144A | | | 251,455 | |
| | 1,060,000 | | | Post Holdings, Inc., 4.500%, 9/15/2031, 144A | | | 853,300 | |
See accompanying notes to financial statements.
| 58
Portfolio of Investments – as of September 30, 2022
Loomis Sayles Global Allocation Fund – (continued)
| | | | | | | | |
Principal
Amount (‡) | | | Description | | Value (†) | |
| | | | United States — continued | |
| | 2,165,000 | | | Prologis Euro Finance LLC, 0.250%, 9/10/2027, (EUR) | | $ | 1,768,642 | |
| | 1,530,000 | | | Prologis Euro Finance LLC, 0.375%, 2/06/2028, (EUR) | | | 1,243,651 | |
| | 365,000 | | | Prologis LP, 2.250%, 6/30/2029, (GBP) | | | 320,910 | |
| | 1,100,000 | | | Realty Income Corp., EMTN, 1.625%, 12/15/2030, (GBP) | | | 867,665 | |
| | 5,850,000 | | | Rocket Mortgage LLC/Rocket Mortgage Co-Issuer, Inc., 2.875%, 10/15/2026, 144A | | | 4,797,000 | |
| | 6,794,000 | | | Rocket Mortgage LLC/Rocket Mortgage Co-Issuer, Inc., 3.625%, 3/01/2029 | | | 5,229,002 | |
| | 130,000 | | | Rocket Mortgage LLC/Rocket Mortgage Co-Issuer, Inc., 3.625%, 3/01/2029, 144A | | | 100,055 | |
| | 12,416,000 | | | Rocket Mortgage LLC/Rocket Mortgage Co-Issuer, Inc., 3.875%, 3/01/2031, 144A | | | 8,999,787 | |
| | 4,510,000 | | | Rocket Mortgage LLC/Rocket Mortgage Co-Issuer, Inc., 4.000%, 10/15/2033, 144A | | | 3,100,687 | |
| | 2,175,000 | | | Royal Caribbean Cruises Ltd., 4.250%, 7/01/2026, 144A | | | 1,598,810 | |
| | 4,130,000 | | | Royal Caribbean Cruises Ltd., 5.500%, 4/01/2028, 144A | | | 2,893,643 | |
| | 810,000 | | | Santander Holdings USA, Inc., 3.450%, 6/02/2025 | | | 758,221 | |
| | 1,605,000 | | | SBA Communications Corp., 3.125%, 2/01/2029 | | | 1,290,853 | |
| | 1,020,000 | | | Scientific Games International, Inc., 7.000%, 5/15/2028, 144A | | | 961,707 | |
| | 525,000 | | | Scientific Games International, Inc., 7.250%, 11/15/2029, 144A | | | 488,623 | |
| | 435,000 | | | Sensata Technologies BV, 4.000%, 4/15/2029, 144A | | | 359,958 | |
| | 140,000 | | | Silgan Holdings, Inc., 3.250%, 3/15/2025, (EUR) | | | 128,852 | |
| | 315,000 | | | Southwestern Energy Co., 4.750%, 2/01/2032 | | | 264,002 | |
| | 2,785,000 | | | Summit Materials LLC/Summit Materials Finance Corp., 5.250%, 1/15/2029, 144A | | | 2,450,800 | |
| | 380,000 | | | Synchrony Bank, 5.400%, 8/22/2025 | | | 370,496 | |
| | 765,000 | | | Synchrony Bank, 5.625%, 8/23/2027 | | | 731,042 | |
| | 410,000 | | | T-Mobile USA, Inc., 2.400%, 3/15/2029 | | | 334,631 | |
| | 735,000 | | | T-Mobile USA, Inc., 2.700%, 3/15/2032 | | | 573,643 | |
| | 6,900,000 | | | T-Mobile USA, Inc., 3.375%, 4/15/2029 | | | 5,961,462 | |
| | 5,840,000 | | | T-Mobile USA, Inc., 3.500%, 4/15/2031 | | | 4,907,410 | |
| | 2,805,000 | | | T-Mobile USA, Inc., 3.875%, 4/15/2030 | | | 2,488,079 | |
| | 255,000 | | | Tapestry, Inc., 3.050%, 3/15/2032 | | | 190,249 | |
| | 165,000 | | | Targa Resources Partners LP/Targa Resources Partners Finance Corp., 4.875%, 2/01/2031 | | | 141,900 | |
| | 165,000 | | | Targa Resources Partners LP/Targa Resources Partners Finance Corp., 5.500%, 3/01/2030 | | | 148,089 | |
| | 420,000 | | | Terminix Co. LLC (The), 7.450%, 8/15/2027 | | | 473,550 | |
| | 100,000 | | | Thermo Fisher Scientific, Inc., EMTN, 1.500%, 10/01/2039, (EUR) | | | 65,818 | |
| | 245,000 | | | Thermo Fisher Scientific, Inc., EMTN, 1.875%, 10/01/2049, (EUR) | | | 149,990 | |
| | 90,000 | | | Time Warner Cable LLC, 4.500%, 9/15/2042 | | | 62,137 | |
| | 85,000 | | | Time Warner Cable LLC, 5.500%, 9/01/2041 | | | 66,718 | |
| | 400,000 | | | TopBuild Corp., 4.125%, 2/15/2032, 144A | | | 304,597 | |
| | 11,330,000 | | | Travel & Leisure Co., 4.500%, 12/01/2029, 144A | | | 8,785,225 | |
| | 615,000 | | | Travel & Leisure Co., 4.625%, 3/01/2030, 144A | | | 486,119 | |
| | | | United States — continued | | | | |
| 75,000 | | | Travel & Leisure Co., 6.000%, 4/01/2027 | | | 67,585 | |
| | 90,000 | | | Travel & Leisure Co., 6.625%, 7/31/2026, 144A | | | 84,307 | |
| | 5,000 | | | TRI Pointe Group, Inc./TRI Pointe Homes, Inc., 5.875%, 6/15/2024 | | | 4,901 | |
| | 775,000 | | | TriNet Group, Inc., 3.500%, 3/01/2029, 144A | | | 631,237 | |
| | 59,537 | | | U.S. Airways Pass Through Trust, Series 2012-1A, Class A, 5.900%, 4/01/2026 | | | 57,655 | |
| | 238,969 | | | U.S. Airways Pass Through Trust, Series 2012-2A, Class A, 4.625%, 12/03/2026 | | | 215,924 | |
| | 5,320,000 | | | U.S. Treasury Bond, 2.250%, 2/15/2052 | | | 3,865,312 | |
| | 4,784,161 | | | U.S. Treasury Inflation Indexed Note, 0.375%, 7/15/2027(f) | | | 4,463,519 | |
| | 7,273,220 | | | U.S. Treasury Inflation Indexed Note, 0.625%, 4/15/2023(f) | | | 7,164,122 | |
| | 28,520,000 | | | U.S. Treasury Note, 0.125%, 1/31/2023(g) | | | 28,189,779 | |
| | 7,860,000 | | | U.S. Treasury Note, 0.125%, 4/30/2023 | | | 7,684,071 | |
| | 14,775,000 | | | U.S. Treasury Note, 0.500%, 11/30/2023 | | | 14,140,714 | |
| | 2,910,000 | | | U.S. Treasury Note, 0.875%, 1/31/2024 | | | 2,780,073 | |
| | 17,750,000 | | | U.S. Treasury Note, 2.250%, 3/31/2024 | | | 17,217,500 | |
| | 13,115,000 | | | Uber Technologies, Inc., 4.500%, 8/15/2029, 144A | | | 11,024,797 | |
| | 10,745,000 | | | Uber Technologies, Inc., 6.250%, 1/15/2028, 144A | | | 9,992,850 | |
| | 1,555,000 | | | Uber Technologies, Inc., 7.500%, 9/15/2027, 144A | | | 1,523,900 | |
| | 140,000 | | | Uber Technologies, Inc., 8.000%, 11/01/2026, 144A | | | 139,779 | |
| | 313,438 | | | United Airlines Pass Through Trust, Series 2016-2, Class B, 3.650%, 4/07/2027 | | | 272,816 | |
| | 2,062,904 | | | United Airlines Pass Through Trust, Series 2020-1, Class A, 5.875%, 4/15/2029 | | | 1,978,098 | |
| | 3,095,000 | | | Verizon Communications, Inc., Series MPLE, 2.500%, 5/16/2030, (CAD) | | | 1,864,618 | |
| | 895,000 | | | VICI Properties LP/VICI Note Co., Inc., 4.250%, 12/01/2026, 144A | | | 807,822 | |
| | 740,000 | | | VICI Properties LP/VICI Note Co., Inc., 4.500%, 9/01/2026, 144A | | | 675,787 | |
| | 640,000 | | | VICI Properties LP/VICI Note Co., Inc., 4.625%, 6/15/2025, 144A | | | 602,258 | |
| | 525,000 | | | VICI Properties LP/VICI Note Co., Inc., 5.625%, 5/01/2024, 144A | | | 515,944 | |
| | 130,000 | | | Western Digital Corp., 2.850%, 2/01/2029 | | | 101,028 | |
| | 90,000 | | | Western Digital Corp., 3.100%, 2/01/2032 | | | 61,190 | |
| | 360,000 | | | Western Midstream Operating LP, 4.300%, 2/01/2030 | | | 307,894 | |
| | 820,000 | | | Western Midstream Operating LP, 5.300%, 3/01/2048 | | | 674,450 | |
| | 150,000 | | | Western Midstream Operating LP, 5.450%, 4/01/2044 | | | 123,051 | |
| | 115,000 | | | Western Midstream Operating LP, 5.500%, 8/15/2048 | | | 93,006 | |
| | 475,000 | | | Western Midstream Operating LP, 5.500%, 2/01/2050 | | | 383,563 | |
| | 60,000 | | | Weyerhaeuser Co., 6.950%, 10/01/2027 | | | 63,651 | |
| | 89,000 | | | Weyerhaeuser Co., 7.375%, 3/15/2032 | | | 96,019 | |
| | 1,595,000 | | | Yum! Brands, Inc., 4.625%, 1/31/2032 | | | 1,336,897 | |
| | | | | | | | |
| | | | | | | 372,089,676 | |
| | | | | | | | |
See accompanying notes to financial statements.
59 |
Portfolio of Investments – as of September 30, 2022
Loomis Sayles Global Allocation Fund – (continued)
| | | | | | | | |
Principal
Amount (‡) | | | Description | | Value (†) | |
| | | | Uruguay — 0.1% | |
| $ | 1,415,000 | | | Uruguay Government International Bond, 4.375%, 1/23/2031 | | $ | 1,353,522 | |
| | 86,955,000 | | | Uruguay Government International Bond, 8.250%, 5/21/2031, (UYU) | | | 1,721,099 | |
| | | | | | | | |
| | | | | | | 3,074,621 | |
| | | | | | | | |
| | | | Total Non-Convertible Bonds
(Identified Cost $1,074,551,129) | | | 875,608,512 | |
| | | | | | | | |
| | | | | | | | |
| | Convertible Bonds — 2.7% | |
| | | | United States — 2.7% | |
| | 40,000 | | | Bentley Systems, Inc., 0.375%, 7/01/2027 | | | 30,140 | |
| | 14,785,000 | | | BioMarin Pharmaceutical, Inc., 1.250%, 5/15/2027 | | | 14,682,983 | |
| | 140,000 | | | DISH Network Corp., 2.375%, 3/15/2024 | | | 124,880 | |
| | 26,970,000 | | | DISH Network Corp., 3.375%, 8/15/2026 | | | 18,555,360 | |
| | 8,470,000 | | | DISH Network Corp., Zero Coupon, 0.000%-9.514%, 12/15/2025(h) | | | 5,574,446 | |
| | 805,000 | | | Ionis Pharmaceuticals, Inc., Zero Coupon, 0.000%-0.979%, 4/01/2026(h) | | | 795,441 | |
| | 305,000 | | | JetBlue Airways Corp., 0.500%, 4/01/2026 | | | 216,550 | |
| | 5,340,000 | | | Livongo Health, Inc., 0.875%, 6/01/2025 | | | 4,483,144 | |
| | 6,630,000 | | | NCL Corp. Ltd., 1.125%, 2/15/2027, 144A | | | 4,107,683 | |
| | 550,000 | | | Nutanix, Inc., 0.250%, 10/01/2027, 144A | | | 413,600 | |
| | 135,000 | | | Peloton Interactive, Inc., Zero Coupon, 1.146%, 2/15/2026(c) | | | 90,428 | |
| | 230,000 | | | Penn Entertainment, Inc., 2.750%, 5/15/2026 | | | 321,885 | |
| | 565,000 | | | RingCentral, Inc., Zero Coupon, 7.146%-8.016%, 3/15/2026(h) | | | 434,485 | |
| | 725,000 | | | Snap, Inc., Zero Coupon, 6.697%-7.641%, 5/01/2027(h) | | | 499,887 | |
| | 8,160,000 | | | Southwest Airlines Co., 1.250%, 5/01/2025 | | | 9,314,640 | |
| | 1,340,000 | | | Splunk, Inc., 1.125%, 6/15/2027 | | | 1,054,280 | |
| | 655,000 | | | Spotify USA, Inc., Zero Coupon, 5.189%-5.873%, 3/15/2026(h) | | | 514,175 | |
| | 17,320,000 | | | Teladoc Health, Inc., 1.250%, 6/01/2027 | | | 12,666,116 | |
| | 200,000 | | | Twitter, Inc., Zero Coupon, 1.483%, 3/15/2026(c) | | | 183,085 | |
| | 8,113,000 | | | Uber Technologies, Inc., Zero Coupon, 0.000%-5.582%, 12/15/2025(h) | | | 6,723,811 | |
| | 120,000 | | | Zillow Group, Inc., 1.375%, 9/01/2026 | | | 115,980 | |
| | | | | | | | |
| | | | Total Convertible Bonds
(Identified Cost $105,000,587) | | | 80,902,999 | |
| | | | | | | | |
| | | | | | | | |
| | Municipals — 0.0% | |
| | | | United States — 0.0% | |
| | 120,000 | | | Tobacco Settlement Financing Corp., Series A-1, 6.706%, 6/01/2046
(Identified Cost $119,990) | | | 104,588 | |
| | | | | | | | |
| | | | Total Bonds and Notes
(Identified Cost $1,179,671,706) | | | 956,616,099 | |
| | | | | | | | |
| | | | | | | | |
| Shares | | | | | | |
| | Preferred Stocks — 0.2% | |
| | | | United States — 0.2% | |
| | 4,292 | | | 2020 Cash Mandatory Exchangeable Trust, 5.250%, 144A | | | 4,828,071 | |
| | 38,952 | | | El Paso Energy Capital Trust I, 4.750% | | | 1,786,728 | |
| | | | | | | | |
| | | | | | | 6,614,799 | |
| | | | | | | | |
| | | | Total Preferred Stocks
(Identified Cost $6,184,693) | | | 6,614,799 | |
| | | | | | | | |
| | Short-Term Investments — 0.7% | |
| $ | 20,415,194 | | | Tri-Party Repurchase Agreement with Fixed Income Clearing Corporation, dated 9/30/2022 at 1.100% to be repurchased at $20,417,065 on 10/03/2022 collateralized by $21,570,900 U.S. Treasury Note, 2.875% due 6/15/2025 valued at $20,823,512 including accrued interest (Note 2 of Notes to Financial Statements) (Identified Cost $20,415,194) | | | 20,415,194 | |
| | | | | | | | |
| | | | | | | | |
| | | | Total Investments — 99.5%
(Identified Cost $3,240,104,544) | | | 2,945,708,355 | |
| | | | Other assets less liabilities — 0.5% | | | 15,597,932 | |
| | | | | | | | |
| | | | Net Assets — 100.0% | | $ | 2,961,306,287 | |
| | | | | | | | |
| | | | | | | | |
| | (‡) | | | Principal Amount stated in U.S. dollars unless otherwise noted. | |
| | (†) | | | See Note 2 of Notes to Financial Statements. | |
| | (††) | | | Amount shown represents units. One unit represents a principal amount of 1,000. | |
| | (†††) | | | Amount shown represents principal amount including inflation adjustments. | |
| | (††††) | | | Amount shown represents units. One unit represents a principal amount of 100. | |
| | (a) | | | Non-income producing security. | |
| | (b) | | | The issuer is in default with respect to interest and/or principal payments. Income is not being accrued. | |
| | (c) | | | Interest rate represents annualized yield at time of purchase; not a coupon rate. | |
| | (d) | | | Perpetual bond with no specified maturity date. | |
| | (e) | | | Variable rate security. Rate as of September 30, 2022 is disclosed. | |
| | (f) | | | Treasury Inflation Protected Security (TIPS). | |
| | (g) | | | Security (or a portion thereof) has been pledged as collateral for open derivative contracts. | |
| | (h) | | | Interest rate represents annualized yield at time of purchase; not a coupon rate. The Fund’s investment in this security is comprised of various lots with differing annualized yields. | |
| | | | | | | | |
| | 144A | | | All or a portion of these securities are exempt from registration under Rule 144A of the Securities Act of 1933. These securities may be resold in transactions exempt from registration, normally to qualified institutional buyers. At September 30, 2022, the value of Rule 144A holdings amounted to $314,136,478 or 10.6% of net assets. | |
| | CPI | | | Consumer Price Index | |
| | EMTN | | | Euro Medium Term Note | |
| | MTN | | | Medium Term Note | |
| | SOFR | | | Secured Overnight Financing Rate | |
| | | | | | | | |
| | AUD | | | Australian Dollar | |
| | BRL | | | Brazilian Real | |
| | CAD | | | Canadian Dollar | |
| | COP | | | Colombian Peso | |
| | EUR | | | Euro | |
| | GBP | | | British Pound | |
| | IDR | | | Indonesian Rupiah | |
| | ILS | | | Israeli Shekel | |
| | JPY | | | Japanese Yen | |
| | KRW | | | South Korean Won | |
| | MXN | | | Mexican Peso | |
See accompanying notes to financial statements.
| 60
Portfolio of Investments – as of September 30, 2022
Loomis Sayles Global Allocation Fund – (continued)
| | | | | | | | |
| | | | | | | | |
| | MYR | | | Malaysian Ringgit | |
| | NOK | | | Norwegian Krone | |
| | NZD | | | New Zealand Dollar | |
| | PLN | | | Polish Zloty | |
| | | | | | | | |
| | SEK | | | Swedish Krona | |
| | SGD | | | Singapore Dollar | |
| | UYU | | | Uruguayan Peso | |
| | ZAR | | | South African Rand | |
At September 30, 2022, the Fund had the following open forward foreign currency contracts:
| | | | | | | | | | | | | | | | | | | | | | | | | | | | |
| Counterparty | | Delivery
Date | | | Currency
Bought/
Sold (B/S) | | | Units
of
Currency | | | In Exchange
for | | | Notional
Value | | | Unrealized
Appreciation
(Depreciation) | |
Bank of America, N.A. | | | 12/21/2022 | | | | KRW | | | | B | | | | 5,850,000,000 | | | $ | 4,198,966 | | | $ | 4,101,044 | | | $ | (97,922 | ) |
Bank of America, N.A. | | | 12/22/2022 | | | | KRW | | | | S | | | | 19,047,379,000 | | | | 13,375,029 | | | | 13,353,946 | | | | 21,083 | |
Bank of America, N.A. | | | 12/21/2022 | | | | KRW | | | | S | | | | 5,850,000,000 | | | | 4,107,569 | | | | 4,101,044 | | | | 6,525 | |
Bank of America, N.A. | | | 12/21/2022 | | | | MXN | | | | S | | | | 256,059,000 | | | | 12,566,634 | | | | 12,536,724 | | | | 29,910 | |
Credit Suisse International | | | 12/21/2022 | | | | CAD | | | | S | | | | 28,930,000 | | | | 21,975,852 | | | | 20,950,750 | | | | 1,025,102 | |
Credit Suisse International | | | 12/21/2022 | | | | COP | | | | S | | | | 34,000,000,000 | | | | 7,601,587 | | | | 7,269,565 | | | | 332,022 | |
Credit Suisse International | | | 12/21/2022 | | | | GBP | | | | B | | | | 12,371,000 | | | | 14,318,319 | | | | 13,829,070 | | | | (489,249 | ) |
Credit Suisse International | | | 12/21/2022 | | | | JPY | | | | B | | | | 9,496,840,000 | | | | 66,819,864 | | | | 66,200,737 | | | | (619,127 | ) |
HSBC Bank USA | | | 12/21/2022 | | | | AUD | | | | B | | | | 18,075,000 | | | | 12,179,477 | | | | 11,577,258 | | | | (602,219 | ) |
HSBC Bank USA | | | 12/21/2022 | | | | AUD | | | | S | | | | 18,075,000 | | | | 11,751,942 | | | | 11,577,258 | | | | 174,684 | |
HSBC Bank USA | | | 12/22/2022 | | | | AUD | | | | S | | | | 3,040,000 | | | | 1,976,673 | | | | 1,947,214 | | | | 29,459 | |
Morgan Stanley Capital Services, Inc. | | | 12/21/2022 | | | | EUR | | | | B | | | | 109,215,000 | | | | 111,454,781 | | | | 107,689,992 | | | | (3,764,789 | ) |
Morgan Stanley Capital Services, Inc. | | | 12/21/2022 | | | | NZD | | | | S | | | | 6,003,000 | | | | 3,610,937 | | | | 3,361,074 | | | | 249,863 | |
UBS AG | | | 12/21/2022 | | | | IDR | | | | S | | | | 100,000,000,000 | | | | 6,690,932 | | | | 6,550,419 | | | | 140,513 | |
UBS AG | | | 12/21/2022 | | | | SEK | | | | B | | | | 7,350,000 | | �� | | 689,560 | | | | 665,575 | | | | (23,985 | ) |
| | | | | | | | | | | | | | | | | | | | | | | | | | | | |
Total | | | $ | (3,588,130 | ) |
| | | | | | | | | | | | | | | | | | | | | | | | | | | | |
At September 30, 2022, the Fund had the following open forward cross currency contracts:
| | | | | | | | | | | | | | | | | | | | | | | | | | | | |
| Counterparty | | Settlement
Date | | | Deliver/Units
of Currency | | | Receive/Units
of Currency | | | Notional
Value | | | Unrealized
Appreciation
(Depreciation) | |
Morgan Stanley Capital Services, Inc. | | | 12/21/2022 | | | | NOK | | | | 30,959,000 | | | | EUR | | | | 3,091,684 | | | $ | 3,048,514 | | | $ | 199,890 | |
| | | | | | | | | | | | | | | | | | | | | | | | | | | | |
At September 30, 2022, open long futures contracts were as follows:
| | | | | | | | | | | | | | | | | | |
| Financial Futures | | Expiration
Date | | | Contracts | | Notional
Amount | | | Value | | | Unrealized
Appreciation
(Depreciation) | |
Ultra 10 Year U.S. Treasury Note | | | 12/20/2022 | | | 89 | | $ | 11,166,922 | | | $ | 10,545,109 | | | $ | (621,813 | ) |
Ultra Long U.S. Treasury Bond | | | 12/20/2022 | | | 130 | | | 19,421,329 | | | | 17,810,000 | | | | (1,611,329 | ) |
| | | | | | | | | | | | | | | | | | |
Total | | | $ | (2,233,142 | ) |
| | | | | | | | | | | | | | | | | | |
See accompanying notes to financial statements.
61 |
Portfolio of Investments – as of September 30, 2022
Loomis Sayles Global Allocation Fund – (continued)
Industry Summary at September 30, 2022
| | | | |
Treasuries | | | 8.3 | % |
IT Services | | | 7.2 | |
Semiconductors & Semiconductor Equipment | | | 6.9 | |
Life Sciences Tools & Services | | | 6.7 | |
Capital Markets | | | 6.6 | |
Software | | | 6.0 | |
Machinery | | | 4.8 | |
Chemicals | | | 4.6 | |
Internet & Direct Marketing Retail | | | 3.1 | |
Interactive Media & Services | | | 2.9 | |
Banking | | | 2.9 | |
Hotels, Restaurants & Leisure | | | 2.7 | |
Health Care Providers & Services | | | 2.7 | |
Cable Satellite | | | 2.6 | |
Specialty Retail | | | 2.5 | |
Textiles, Apparel & Luxury Goods | | | 2.3 | |
Food & Staples Retailing | | | 2.3 | |
Finance Companies | | | 2.0 | |
Other Investments, less than 2% each | | | 21.7 | |
Short-Term Investments | | | 0.7 | |
| | | | |
Total Investments | | | 99.5 | |
Other assets less liabilities (including forward foreign currency and futures contracts) | | | 0.5 | |
| | | | |
Net Assets | | | 100.0 | % |
| | | | |
Currency Exposure Summary at September 30, 2022
| | | | |
United States Dollar | | | 78.2 | % |
Euro | | | 8.3 | |
Swedish Krona | | | 2.1 | |
Japanese Yen | | | 2.0 | |
Other, less than 2% each | | | 8.9 | |
| | | | |
Total Investments | | | 99.5 | |
Other assets less liabilities (including forward foreign currency and futures contracts) | | | 0.5 | |
| | | | |
Net Assets | | | 100.0 | % |
| | | | |
See accompanying notes to financial statements.
| 62
Portfolio of Investments – as of September 30, 2022
Loomis Sayles Growth Fund
| | | | | | | | |
| Shares | | | Description | | Value (†) | |
| | Common Stocks — 99.2% of Net Assets | |
| | | | Aerospace & Defense — 4.4% | |
| | 3,454,923 | | | Boeing Co. (The)(a) | | $ | 418,322,077 | |
| | | | | | | | |
| | | | Air Freight & Logistics — 1.7% | |
| | 1,866,750 | | | Expeditors International of Washington, Inc. | | | 164,852,693 | |
| | | | | | | | |
| | | | Automobiles — 3.5% | |
| | 1,255,036 | | | Tesla, Inc.(a) | | | 332,898,299 | |
| | | | | | | | |
| | | | Beverages — 3.9% | |
| | 4,303,273 | | | Monster Beverage Corp.(a) | | | 374,212,620 | |
| | | | | | | | |
| | | | Biotechnology — 6.7% | |
| | 445,904 | | | Regeneron Pharmaceuticals, Inc.(a) | | | 307,169,889 | |
| | 1,138,052 | | | Vertex Pharmaceuticals, Inc.(a) | | | 329,511,576 | |
| | | | | | | | |
| | | | | | | 636,681,465 | |
| | | | | | | | |
| | | | Capital Markets — 3.6% | |
| | 501,008 | | | FactSet Research Systems, Inc. | | | 200,458,311 | |
| | 2,874,926 | | | SEI Investments Co. | | | 141,015,120 | |
| | | | | | | | |
| | | | | | | 341,473,431 | |
| | | | | | | | |
| | | | Entertainment — 6.5% | |
| | 1,421,277 | | | Netflix, Inc.(a) | | | 334,625,457 | |
| | 3,029,846 | | | Walt Disney Co. (The)(a) | | | 285,805,373 | |
| | | | | | | | |
| | | | | | | 620,430,830 | |
| | | | | | | | |
| | | | Health Care Equipment & Supplies — 1.2% | |
| | 598,193 | | | Intuitive Surgical, Inc.(a) | | | 112,125,296 | |
| | | | | | | | |
| | | | Hotels, Restaurants & Leisure — 4.7% | |
| | 2,758,885 | | | Starbucks Corp. | | | 232,463,650 | |
| | 1,602,964 | | | Yum China Holdings, Inc. | | | 75,868,286 | |
| | 1,329,540 | | | Yum! Brands, Inc. | | | 141,383,284 | |
| | | | | | | | |
| | | | | | | 449,715,220 | |
| | | | | | | | |
| | | | Interactive Media & Services — 11.2% | |
| | 3,665,655 | | | Alphabet, Inc., Class A(a) | | | 350,619,900 | |
| | 3,190,659 | | | Alphabet, Inc., Class C(a) | | | 306,781,863 | |
| | 2,963,788 | | | Meta Platforms, Inc., Class A(a) | | | 402,126,756 | |
| | | | | | | | |
| | | | | | | 1,059,528,519 | |
| | | | | | | | |
| | | | Internet & Direct Marketing Retail — 7.5% | |
| | 1,578,398 | | | Alibaba Group Holding Ltd., Sponsored ADR(a) | | | 126,256,056 | |
| | 5,152,050 | | | Amazon.com, Inc.(a) | | | 582,181,650 | |
| | | | | | | | |
| | | | | | | 708,437,706 | |
| | | | | | | | |
| | | | IT Services — 10.0% | |
| | 1,799,138 | | | Block, Inc.(a) | | | 98,934,599 | |
| | 1,825,180 | | | PayPal Holdings, Inc.(a) | | | 157,093,242 | |
| | 4,245,104 | | | Shopify, Inc., Class A(a) | | | 114,363,102 | |
| | 3,262,849 | | | Visa, Inc., Class A | | | 579,645,125 | |
| | | | | | | | |
| | | | | | | 950,036,068 | |
| | | | | | | | |
| | | | Life Sciences Tools & Services — 2.0% | |
| | 1,000,799 | | | Illumina, Inc.(a) | | | 190,942,441 | |
| | | | | | | | |
| | | | Machinery — 1.9% | |
| | 524,969 | | | Deere & Co. | | | 175,281,899 | |
| | | | | | | | |
| | | | Pharmaceuticals — 7.3% | |
| | 4,075,984 | | | Novartis AG, Sponsored ADR | | | 309,815,544 | |
| | 1,374,978 | | | Novo Nordisk A/S, Sponsored ADR | | | 136,989,058 | |
| | 5,986,990 | | | Roche Holding AG, Sponsored ADR | | | 243,191,534 | |
| | | | | | | | |
| | | | | | | 689,996,136 | |
| | | | | | | | |
| | | | Semiconductors & Semiconductor Equipment — 6.3% | |
| | 3,209,263 | | | NVIDIA Corp. | | | 389,572,436 | |
| | 1,806,829 | | | QUALCOMM, Inc. | | | 204,135,540 | |
| | | | | | | | |
| | | | | | | 593,707,976 | |
| | | | | | | | |
| | | | Software — 16.8% | |
| | 1,905,053 | | | Autodesk, Inc.(a) | | $ | 355,863,900 | |
| | 2,101,099 | | | Microsoft Corp. | | | 489,345,957 | |
| | 5,695,873 | | | Oracle Corp. | | | 347,846,964 | |
| | 2,026,049 | | | Salesforce, Inc.(a) | | | 291,426,888 | |
| | 688,171 | | | Workday, Inc., Class A(a) | | | 104,753,390 | |
| | | | | | | | |
| | | | | | | 1,589,237,099 | |
| | | | | | | | |
| | | | Total Common Stocks
(Identified Cost $7,628,225,854) | | | 9,407,879,775 | |
| | | | | | | | |
| | | | | | | | |
Principal
Amount | | | | | | |
| | Short-Term Investments — 1.0% | |
| $ | 96,001,789 | | | Tri-Party Repurchase Agreement with Fixed Income Clearing Corporation, dated 9/30/2022 at 1.100% to be repurchased at $96,010,590 on 10/03/2022 collateralized by $81,779,600 U.S. Treasury Inflation Indexed Note, 0.375% due 7/15/2025 valued at $97,921,906 including accrued interest (Note 2 of Notes to Financial Statements)
(Identified Cost $96,001,789) | | | 96,001,789 | |
| | | | | | | | |
| | | | | | | | |
| | | | Total Investments — 100.2%
(Identified Cost $7,724,227,643) | | | 9,503,881,564 | |
| | | | Other assets less liabilities — (0.2)% | | | (16,185,840 | ) |
| | | | | | | | |
| | | | Net Assets — 100.0% | | $ | 9,487,695,724 | |
| | | | | | | | |
| | | | | | | | |
| | (†) | | | See Note 2 of Notes to Financial Statements. | |
| | (a) | | | Non-income producing security. | |
| | | | | |
| | ADR | | | An American Depositary Receipt is a certificate issued by a custodian bank representing the right to receive securities of the foreign issuer described. The values of ADRs may be significantly influenced by trading on exchanges not located in the United States. | |
Industry Summary at September 30, 2022
| | | | |
Software | | | 16.8 | % |
Interactive Media & Services | | | 11.2 | |
IT Services | | | 10.0 | |
Internet & Direct Marketing Retail | | | 7.5 | |
Pharmaceuticals | | | 7.3 | |
Biotechnology | | | 6.7 | |
Entertainment | | | 6.5 | |
Semiconductors & Semiconductor Equipment | | | 6.3 | |
Hotels, Restaurants & Leisure | | | 4.7 | |
Aerospace & Defense | | | 4.4 | |
Beverages | | | 3.9 | |
Capital Markets | | | 3.6 | |
Automobiles | | | 3.5 | |
Life Sciences Tools & Services | | | 2.0 | |
Other Investments, less than 2% each | | | 4.8 | |
Short-Term Investments | | | 1.0 | |
| | | | |
Total Investments | | | 100.2 | |
Other assets less liabilities | | | (0.2 | ) |
| | | | |
Net Assets | | | 100.0 | % |
| | | | |
See accompanying notes to financial statements.
63 |
Portfolio of Investments – as of September 30, 2022
Loomis Sayles Intermediate Duration Bond Fund
| | | | | | | | |
Principal Amount | | | Description | | Value (†) | |
| | Bonds and Notes — 97.8% of Net Assets | | | | |
| | | | ABS Car Loan — 8.2% | |
| $ | 194,603 | | | American Credit Acceptance Receivables Trust, Series 2020-4, Class C, 1.310%, 12/14/2026, 144A | | $ | 191,762 | |
| | 385,000 | | | American Credit Acceptance Receivables Trust, Series 2021-3, Class B, 0.660%, 2/13/2026, 144A | | | 382,331 | |
| | 180,000 | | | American Credit Acceptance Receivables Trust, Series 2022-1, Class B, 1.680%, 9/14/2026, 144A | | | 172,462 | |
| | 70,335 | | | AmeriCredit Automobile Receivables Trust, Series 2019-2, Class B, 2.540%, 7/18/2024 | | | 70,294 | |
| | 10,645 | | | AmeriCredit Automobile Receivables Trust, Series 2020-1, Class A3, 1.110%, 8/19/2024 | | | 10,636 | |
| | 38,403 | | | AmeriCredit Automobile Receivables Trust, Series 2020-2, Class A3, 0.660%, 12/18/2024 | | | 38,164 | |
| | 265,000 | | | AmeriCredit Automobile Receivables Trust, Series 2020-2, Class B, 0.970%, 2/18/2026 | | | 259,443 | |
| | 215,000 | | | AmeriCredit Automobile Receivables Trust, Series 2021-2, Class B, 0.690%, 1/19/2027 | | | 201,847 | |
| | 520,000 | | | AmeriCredit Automobile Receivables Trust, Series 2021-3, Class C, 1.410%, 8/18/2027 | | | 474,765 | |
| | 335,000 | | | AmeriCredit Automobile Receivables Trust, Series 2022-2, Class A3, 4.380%, 4/18/2028 | | | 332,051 | |
| | 140,000 | | | Avis Budget Rental Car Funding AESOP LLC, Series 2019-2A, Class A, 3.350%, 9/22/2025, 144A | | | 134,515 | |
| | 86,303 | | | Capital One Prime Auto Receivables Trust, Series 2019-2, Class A3, 1.920%, 5/15/2024 | | | 86,036 | |
| | 157,040 | | | CarMax Auto Owner Trust, Series 2020-2, Class A3, 1.700%, 11/15/2024 | | | 156,139 | |
| | 252,000 | | | CarMax Auto Owner Trust, Series 2020-3, Class A3, 0.620%, 3/17/2025 | | | 247,873 | |
| | 91,162 | | | Carvana Auto Receivables Trust, Series 2021-N2, Class B, 0.750%, 3/10/2028 | | | 84,756 | |
| | 305,000 | | | Carvana Auto Receivables Trust, Series 2021-N4, Class C, 1.720%, 9/11/2028 | | | 291,583 | |
| | 1,075,000 | | | Carvana Auto Receivables Trust, Series 2021-P4, Class A3, 1.310%, 1/11/2027 | | | 1,012,044 | |
| | 165,000 | | | Carvana Auto Receivables Trust, Series 2022-P3, Class A3, 4.610%, 11/10/2027 | | | 161,904 | |
| | 70,062 | | | Credit Acceptance Auto Loan Trust, Series 2020-1A, Class A, 2.010%, 2/15/2029, 144A | | | 70,012 | |
| | 585,000 | | | Credit Acceptance Auto Loan Trust, Series 2020-1A, Class B, 2.390%, 4/16/2029, 144A | | | 579,058 | |
| | 241,650 | | | Credit Acceptance Auto Loan Trust, Series 2020-2A, Class A, 1.370%, 7/16/2029, 144A | | | 238,626 | |
| | 265,000 | | | Credit Acceptance Auto Loan Trust, Series 2021-3A, Class A, 1.000%, 5/15/2030, 144A | | | 252,437 | |
| | 191,402 | | | Drive Auto Receivables Trust, Series 2021-1, Class B, 0.650%, 7/15/2025 | | | 190,787 | |
| | 585,000 | | | Drive Auto Receivables Trust, Series 2021-2, Class B, 0.580%, 12/15/2025 | | | 576,286 | |
| | 465,000 | | | Drive Auto Receivables Trust, Series 2021-3, Class B, 1.110%, 5/15/2026 | | | 449,503 | |
| | 320,000 | | | DT Auto Owner Trust, Series 2020-2A, Class C, 3.280%, 3/16/2026, 144A | | | 316,435 | |
| | 30,000 | | | DT Auto Owner Trust, Series 2021-1A, Class B, 0.620%, 9/15/2025, 144A | | | 29,642 | |
| | 300,000 | | | DT Auto Owner Trust, Series 2021-2A, Class B, 0.810%, 1/15/2027, 144A | | | 292,526 | |
| | 410,000 | | | DT Auto Owner Trust, Series 2021-4A, Class C, 1.500%, 9/15/2027, 144A | | | 378,593 | |
| | 248,038 | | | Exeter Automobile Receivables Trust, Series 2020-2A, Class C, 3.280%, 5/15/2025, 144A | | | 247,149 | |
| | 24,037 | | | Exeter Automobile Receivables Trust, Series 2021-1A, Class B, 0.500%, 2/18/2025 | | | 24,011 | |
| | | | ABS Car Loan — continued | |
| $ | 271,617 | | | Exeter Automobile Receivables Trust, Series 2021-2A, Class B, 0.570%, 9/15/2025 | | $ | 269,278 | |
| | 715,000 | | | Exeter Automobile Receivables Trust, Series 2021-4A, Class B, 1.050%, 5/15/2026 | | | 692,952 | |
| | 605,000 | | | Exeter Automobile Receivables Trust, Series 2022-3A, Class B, 4.860%, 12/15/2026 | | | 600,470 | |
| | 436,761 | | | Flagship Credit Auto Trust, Series 2020-1, Class B, 2.050%, 2/17/2025, 144A | | | 435,392 | |
| | 290,000 | | | Flagship Credit Auto Trust, Series 2021-2, Class B, 0.930%, 6/15/2027, 144A | | | 274,310 | |
| | 1,217,616 | | | Flagship Credit Auto Trust, Series 2022-1, Class A, 1.790%, 10/15/2026, 144A | | | 1,174,629 | |
| | 595,000 | | | Ford Credit Auto Owner Trust, Series 2018-1, Class A, 3.190%, 7/15/2031, 144A | | | 572,000 | |
| | 58,429 | | | Ford Credit Auto Owner Trust, Series 2020-A, Class A3, 1.040%, 8/15/2024 | | | 57,795 | |
| | 328,960 | | | Ford Credit Auto Owner Trust, Series 2020-B, Class A3, 0.560%, 10/15/2024 | | | 324,766 | |
| | 570,000 | | | Ford Credit Auto Owner Trust, Series 2021-1, Class A, 1.370%, 10/17/2033, 144A | | | 502,371 | |
| | 410,000 | | | Foursight Capital Automobile Receivables Trust, Series 2022-1, Class A3, 1.830%, 12/15/2026, 144A | | | 391,977 | |
| | 340,000 | | | Foursight Capital Automobile Receivables Trust, Series 2022-2, Class A3,, 4.590%, 6/15/2027, 144A | | | 332,562 | |
| | 45,710 | | | GLS Auto Receivables Issuer Trust, Series 2019-4A, Class B, 2.780%, 9/16/2024, 144A | | | 45,666 | |
| | 265,000 | | | GLS Auto Receivables Issuer Trust, Series 2020-4A, Class C, 1.140%, 11/17/2025, 144A | | | 259,546 | |
| | 340,000 | | | GLS Auto Receivables Issuer Trust, Series 2021-2A, Class B, 0.770%, 9/15/2025, 144A | | | 334,096 | |
| | 995,000 | | | GLS Auto Receivables Issuer Trust, Series 2021-4A, Class B, 1.530%, 4/15/2026, 144A | | | 947,022 | |
| | 31,588 | | | GM Financial Consumer Automobile Receivables Trust, Series 2019-3, Class A3, 2.180%, 4/16/2024 | | | 31,556 | |
| | 57,417 | | | GM Financial Consumer Automobile Receivables Trust, Series 2020-2, Class A3, 1.490%, 12/16/2024 | | | 56,841 | |
| | 180,000 | | | GMF Floorplan Owner Revolving Trust, Series 2020-1, Class A, 0.680%, 8/15/2025, 144A | | | 174,023 | |
| | 201,481 | | | Honda Auto Receivables Owner Trust, Series 2020-2, Class A3, 0.820%, 7/15/2024 | | | 198,853 | |
| | 34,220 | | | Hyundai Auto Receivables Trust, Series 2019-B, Class A3, 1.940%, 2/15/2024 | | | 34,182 | |
| | 89,225 | | | Hyundai Auto Receivables Trust, Series 2020-A, Class A3, 1.410%, 11/15/2024 | | | 88,165 | |
| | 135,509 | | | Mercedes-Benz Auto Receivables Trust, Series 2020-1, Class A3, 0.550%, 2/18/2025 | | | 133,575 | |
| | 865,000 | | | NextGear Floorplan Master Owner Trust, Series 2020-1A, Class A2, 1.550%, 2/15/2025, 144A | | | 856,096 | |
| | 645,377 | | | Prestige Auto Receivables Trust, Series 2020-1A, Class C, 1.310%, 11/16/2026, 144A | | | 641,391 | |
| | 430,000 | | | Prestige Auto Receivables Trust, Series 2021-1A, Class C, 1.530%, 2/15/2028, 144A | | | 400,583 | |
| | 210,000 | | | Santander Consumer Auto Receivables Trust, Series 2020-AA, Class C, 3.710%, 2/17/2026, 144A | | | 208,723 | |
| | 12,026 | | | Santander Consumer Auto Receivables Trust, Series 2020-BA, Class A3, 0.460%, 8/15/2024, 144A | | | 12,010 | |
| | 206,900 | | | Santander Drive Auto Receivables Trust, Series 2020-3, Class C, 1.120%, 1/15/2026 | | | 205,319 | |
| | 157,689 | | | Santander Drive Auto Receivables Trust, Series 2020-4, Class C, 1.010%, 1/15/2026 | | | 155,861 | |
| | 835,000 | | | Santander Drive Auto Receivables Trust, Series 2022-3, Class B, 4.130%, 8/16/2027 | | | 812,945 | |
| | 560,000 | | | Santander Drive Auto Receivables Trust, Series 2022-4, Class B, 4.420%, 11/15/2027 | | | 553,808 | |
See accompanying notes to financial statements.
| 64
Portfolio of Investments – as of September 30, 2022
Loomis Sayles Intermediate Duration Bond Fund – (continued)
| | | | | | | | |
Principal Amount | | | Description | | Value (†) | |
| | | | ABS Car Loan — continued | |
| $ | 285,000 | | | Santander Drive Auto Receivables Trust, Series 2022-5, Class B, 4.430%, 3/15/2027 | | $ | 278,811 | |
| | 440,000 | | | Toyota Auto Loan Extended Note Trust, Series 2020-1A, Class A, 1.350%, 5/25/2033, 144A | | | 400,145 | |
| | 84,811 | | | Toyota Auto Receivables Owner Trust, Series 2020-B, Class A3, 1.360%, 8/15/2024 | | | 83,978 | |
| | 185,000 | | | United Auto Credit Securitization Trust, Series 2022-1, Class B, 2.100%, 3/10/2025, 144A | | | 180,442 | |
| | 320,000 | | | United Auto Credit Securitization Trust, Series 2022-2, Class C, 5.810%, 5/10/2027, 144A | | | 316,160 | |
| | 400,000 | | | Westlake Automobile Receivables Trust, Series 2020-2A, Class C, 2.010%, 7/15/2025, 144A | | | 396,390 | |
| | 590,000 | | | Westlake Automobile Receivables Trust, Series 2021-1A, Class B, 0.640%, 3/16/2026, 144A | | | 576,121 | |
| | 270,000 | | | Westlake Automobile Receivables Trust, Series 2021-2A, Class B, 0.620%, 7/15/2026, 144A | | | 260,750 | |
| | 1,050,000 | | | Westlake Automobile Receivables Trust, Series 2021-3A, Class C, 1.580%, 1/15/2027, 144A | | | 983,924 | |
| | 359,283 | | | World Omni Auto Receivables Trust, Series 2020-B, Class A3, 0.630%, 5/15/2025 | | | 352,445 | |
| | 151,699 | | | World Omni Select Auto Trust, Series 2020-A, Class A3, 0.550%, 7/15/2025 | | | 150,356 | |
| | 360,000 | | | World Omni Select Auto Trust, Series 2021-A, Class B, 0.850%, 8/16/2027 | | | 336,715 | |
| | | | | | | | |
| | | | | | | 24,048,670 | |
| | | | | | | | |
| | | | ABS Credit Card — 0.3% | |
| | 960,000 | | | Mercury Financial Credit Card Master Trust, Series 2022-1A, Class A, 2.500%, 9/21/2026, 144A | | | 888,318 | |
| | | | | | | | |
| | | | ABS Home Equity — 0.0% | |
| | 1,878 | | | Countrywide Asset-Backed Certificates, Series 2004-S1, Class A3, 5.115%, 2/25/2035(a) | | | 1,860 | |
| | | | | | | | |
| | | | ABS Other — 1.5% | |
| | 395,000 | | | Affirm Asset Securitization Trust, Series 2021-B, Class A, 1.030%, 8/17/2026, 144A | | | 372,588 | |
| | 125,000 | | | Affirm Asset Securitization Trust, Series 2022-A, Class A, 4.300%, 5/17/2027, 144A | | | 119,251 | |
| | 391,885 | | | Aqua Finance Trust, Series 2021-A, Class A, 1.540%, 7/17/2046, 144A | | | 354,833 | |
| | 140,000 | | | BHG Securitization Trust, Series 2022-C, Class A, 5.320%, 10/17/2035, 144A | | | 140,022 | |
| | 143,035 | | | Chesapeake Funding II LLC, Series 2020-1A, Class A1, 0.870%, 8/15/2032, 144A | | | 141,433 | |
| | 120,886 | | | CNH Equipment Trust, Series 2020-A, Class A3, 1.160%, 6/16/2025 | | | 118,894 | |
| | 53,454 | | | Diamond Resorts Owner Trust, Series 2018-1, Class A, 3.700%, 1/21/2031, 144A | | | 52,051 | |
| | 512,294 | | | Donlen Fleet Lease Funding 2 LLC, Series 2021-2, Class A2, 0.560%, 12/11/2034, 144A | | | 494,790 | |
| | 180,000 | | | Enterprise Fleet Financing LLC, Series 2022-3, Class A2, 4.380%, 7/20/2029, 144A | | | 177,478 | |
| | 106,338 | | | Hilton Grand Vacations Trust, Series 2022-2A, Class C, 5.570%, 1/25/2037, 144A | | | 103,230 | |
| | 110,260 | | | Kubota Credit Owner Trust, Series 2020-1A, Class A3, 1.960%, 3/15/2024, 144A | | | 109,505 | |
| | 234,435 | | | Marlette Funding Trust, Series 2021-3A, Class A, 0.650%, 12/15/2031, 144A | | | 230,713 | |
| | 170,000 | | | Marlette Funding Trust, Series 2022-3A, Class A, 5.180%, 11/15/2032, 144A | | | 169,264 | |
| | 73,805 | | | MVW LLC, Series 2020-1A, Class A, 1.740%, 10/20/2037, 144A | | | 66,917 | |
| | 1,135,000 | | | OneMain Financial Issuance Trust, Series 2022-S1, Class A, 4.130%, 5/14/2035, 144A | | | 1,078,061 | |
| | | | ABS Other — continued | |
| 216,274 | | | S-Jets Ltd., Series 2017-1, Class A, 3.967%, 8/15/2042, 144A | | | 173,882 | |
| | 370,000 | | | SCF Equipment Leasing LLC, Series 2022-1A, Class A3, 2.920%, 7/20/2029, 144A | | | 346,620 | |
| | 99,712 | | | Sierra Timeshare Receivables Funding LLC, Series 2020-2A, Class A, 1.330%, 7/20/2037, 144A | | | 93,792 | |
| | 15,260 | | | Verizon Owner Trust, Series 2019-B, Class A1A, 2.330%, 12/20/2023 | | | 15,248 | |
| | | | | | | | |
| | | | | | | 4,358,572 | |
| | | | | | | | |
| | | | ABS Student Loan — 0.1% | |
| | 110,524 | | | Massachusetts Educational Financing Authority, Series 2018-A, Class A, 3.850%, 5/25/2033 | | | 102,780 | |
| | 62,100 | | | Navient Private Education Refi Loan Trust, Series 2020-GA, Class A, 1.170%, 9/16/2069, 144A | | | 54,515 | |
| | 84,419 | | | Navient Private Education Refi Loan Trust, Series 2020-HA, Class A, 1.310%, 1/15/2069, 144A | | | 76,683 | |
| | 5,565 | | | SoFi Professional Loan Program LLC, Series 2016-B, Class A2B, 2.740%, 10/25/2032, 144A | | | 5,556 | |
| | 17,454 | | | SoFi Professional Loan Program LLC, Series 2017-E, Class A2B, 2.720%, 11/26/2040, 144A | | | 17,273 | |
| | | | | | | | |
| | | | | | | 256,807 | |
| | | | | | | | |
| | | | ABS Whole Business — 0.2% | |
| | 513,600 | | | Planet Fitness Master Issuer LLC, Series 2018-1A, Class A2II, 4.666%, 9/05/2048, 144A | | | 483,498 | |
| | | | | | | | |
| | | | Aerospace & Defense — 0.0% | |
| | 29,000 | | | Raytheon Technologies Corp., 3.650%, 8/16/2023 | | | 28,718 | |
| | | | | | | | |
| | | | Agency Commercial Mortgage-Backed Securities — 0.7% | |
| | 474,357 | | | FHLMC Multifamily Structured Pass Through Certificates, Series K029, Class A2, 3.320%, 2/25/2023(a) | | | 472,629 | |
| | 701,647 | | | FHLMC Multifamily Structured Pass Through Certificates, Series K042, Class A2, 2.670%, 12/25/2024 | | | 673,844 | |
| | 1,087,794 | | | FHLMC Multifamily Structured Pass Through Certificates, Series KJ26, Class A2, 2.606%, 7/25/2027 | | | 1,024,385 | |
| | 28,491 | | | FHLMC Multifamily Structured Pass Through Certificates, Series KJ28, Class A1, 1.766%, 2/25/2025 | | | 28,064 | |
| | | | | | | | |
| | | | | | | 2,198,922 | |
| | | | | | | | |
| | | | Automotive — 3.4% | |
| | 600,000 | | | American Honda Finance Corp., MTN, 2.250%, 1/12/2029 | | | 504,197 | |
| | 145,000 | | | American Honda Finance Corp., MTN, 3.625%, 10/10/2023 | | | 143,735 | |
| | 665,000 | | | Denso Corp., 1.239%, 9/16/2026, 144A | | | 573,393 | |
| | 675,000 | | | General Motors Co., 5.400%, 10/15/2029 | | | 622,381 | |
| | 390,000 | | | General Motors Financial Co., Inc., 3.800%, 4/07/2025 | | | 371,481 | |
| | 370,000 | | | General Motors Financial Co., Inc., 5.000%, 4/09/2027 | | | 350,726 | |
| | 295,000 | | | Harley-Davidson Financial Services, Inc., 3.350%, 6/08/2025, 144A | | | 276,396 | |
| | 645,000 | | | Hyundai Capital America, 2.100%, 9/15/2028, 144A | | | 506,550 | |
| | 195,000 | | | Hyundai Capital America, 2.375%, 2/10/2023, 144A | | | 193,284 | |
| | 240,000 | | | Kia Corp., 1.000%, 4/16/2024, 144A | | | 224,982 | |
| | 160,000 | | | Mercedes-Benz Finance North America LLC, 3.350%, 2/22/2023, 144A | | | 159,251 | |
| | 275,000 | | | Nissan Motor Acceptance Co. LLC, 3.450%, 3/15/2023, 144A | | | 273,184 | |
| | 205,000 | | | PACCAR Financial Corp., 2.000%, 2/04/2027 | | | 183,816 | |
See accompanying notes to financial statements.
65 |
Portfolio of Investments – as of September 30, 2022
Loomis Sayles Intermediate Duration Bond Fund – (continued)
| | | | | | | | |
Principal Amount | | | Description | | Value (†) | |
| | | | Automotive — continued | |
| $ | 555,000 | | | PACCAR Financial Corp., MTN, 4.950%, 10/03/2025 | | $ | 556,825 | |
| | 105,000 | | | PACCAR Financial Corp., MTN, 0.800%, 6/08/2023 | | | 102,526 | |
| | 160,000 | | | PACCAR Financial Corp., MTN, 1.800%, 2/06/2025 | | | 149,798 | |
| | 955,000 | | | PACCAR Financial Corp., MTN, 1.900%, 2/07/2023 | | | 947,821 | |
| | 1,105,000 | | | Stellantis Finance U.S., Inc., 6.375%, 9/12/2032, 144A | | | 1,022,240 | |
| | 235,000 | | | Toyota Motor Credit Corp., 4.450%, 6/29/2029 | | | 226,728 | |
| | 1,495,000 | | | Toyota Motor Credit Corp., MTN, 4.550%, 9/20/2027 | | | 1,460,021 | |
| | 275,000 | | | Volkswagen Group of America Finance LLC, 3.350%, 5/13/2025, 144A | | | 260,844 | |
| | 290,000 | | | Volkswagen Group of America Finance LLC, 4.250%, 11/13/2023, 144A | | | 286,949 | |
| | 590,000 | | | Volkswagen Group of America Finance LLC, 4.350%, 6/08/2027, 144A | | | 554,161 | |
| | | | | | | | |
| | | | | | | 9,951,289 | |
| | | | | | | | |
| | | | Banking — 23.1% | |
| | 500,000 | | | ABN AMRO Bank NV, (fixed rate to 12/13/2028, variable rate thereafter), 2.470%, 12/13/2029, 144A | | | 396,335 | |
| | 1,130,000 | | | Ally Financial, Inc., 4.750%, 6/09/2027 | | | 1,042,513 | |
| | 180,000 | | | American Express Co., 2.550%, 3/04/2027 | | | 160,328 | |
| | 820,000 | | | American Express Co., (fixed rate to 8/03/2032, variable rate thereafter), 4.420%, 8/03/2033 | | | 745,769 | |
| | 525,000 | | | ANZ New Zealand International Ltd., 2.166%, 2/18/2025, 144A | | | 490,425 | |
| | 565,000 | | | ASB Bank Ltd., (fixed rate to 6/17/2027, variable rate thereafter), 5.284%, 6/17/2032, 144A | | | 530,733 | |
| | 800,000 | | | Banco Bilbao Vizcaya Argentaria S.A., 0.875%, 9/18/2023 | | | 768,680 | |
| | 1,000,000 | | | Banco Santander S.A, 5.294%, 8/18/2027 | | | 941,953 | |
| | 1,600,000 | | | Banco Santander S.A., 3.892%, 5/24/2024 | | | 1,557,424 | |
| | 840,000 | | | Bank of America Corp., (fixed rate to 4/02/2025, variable rate thereafter), MTN, 3.384%, 4/02/2026 | | | 793,478 | |
| | 395,000 | | | Bank of Ireland Group PLC, 4.500%, 11/25/2023, 144A | | | 387,874 | |
| | 1,070,000 | | | Bank of Ireland Group PLC, (fixed rate to 9/16/2025, variable rate thereafter), 6.253%, 9/16/2026, 144A | | | 1,047,075 | |
| | 910,000 | | | Bank of Ireland Group PLC, (fixed rate to 9/30/2026, variable rate thereafter), 2.029%, 9/30/2027, 144A | | | 752,103 | |
| | 330,000 | | | Bank of Montreal, MTN, 1.500%, 1/10/2025 | | | 303,530 | |
| | 1,580,000 | | | Bank of Montreal, Series H, MTN, 4.700%, 9/14/2027 | | | 1,524,666 | |
| | 425,000 | | | Bank of New York Mellon Corp. (The), 2.050%, 1/26/2027 | | | 377,019 | |
| | 655,000 | | | Bank of New York Mellon Corp. (The), MTN, 1.600%, 4/24/2025 | | | 604,980 | |
| | 295,000 | | | Bank of New York Mellon Corp. (The), MTN, 1.800%, 7/28/2031 | | | 225,208 | |
| | 635,000 | | | Bank of New Zealand, 2.000%, 2/21/2025, 144A | | | 590,820 | |
| | 690,000 | | | Bank of New Zealand, 2.285%, 1/27/2027, 144A | | | 610,118 | |
| | 825,000 | | | Bank of Nova Scotia (The), 3.450%, 4/11/2025 | | | 790,187 | |
| | 200,000 | | | Banque Federative du Credit Mutuel S.A., 2.375%, 11/21/2024, 144A | | | 187,807 | |
| | 840,000 | | | Banque Federative du Credit Mutuel S.A., 4.753%, 7/13/2027, 144A | | | 802,806 | |
| | 1,080,000 | | | Barclays PLC, (fixed rate to 08/09/2027, variable rate thereafter), 5.501%, 8/09/2028 | | | 1,012,432 | |
| | 485,000 | | | Barclays PLC, (fixed rate to 5/16/2023, variable rate thereafter), 4.338%, 5/16/2024 | | | 479,433 | |
| | 865,000 | | | Canadian Imperial Bank of Commerce, 3.945%, 8/04/2025 | | | 835,503 | |
| | 170,000 | | | Capital One Financial Corp., (fixed rate to 11/02/2031, variable rate thereafter), 2.618%, 11/02/2032 | | | 127,221 | |
| | | | Banking — continued | |
| 1,015,000 | | | Capital One Financial Corp., (fixed rate to 12/06/2023, variable rate thereafter), 1.343%, 12/06/2024 | | | 964,074 | |
| | 335,000 | | | Capital One Financial Corp., (fixed rate to 5/10/2027, variable rate thereafter), 4.927%, 5/10/2028 | | | 319,167 | |
| | 255,000 | | | Capital One Financial Corp., (fixed rate to 7/29/2031, variable rate thereafter), 2.359%, 7/29/2032 | | | 180,608 | |
| | 510,000 | | | Citigroup, Inc., (fixed rate to 4/08/2025, variable rate thereafter), 3.106%, 4/08/2026 | | | 478,007 | |
| | 230,000 | | | Citigroup, Inc., (fixed rate to 5/01/2024, variable rate thereafter), 0.981%, 5/01/2025 | | | 213,105 | |
| | 3,065,000 | | | Citigroup, Inc., (fixed rate to 9/29/2025, variable rate thereafter), 5.610%, 9/29/2026 | | | 3,048,090 | |
| | 290,000 | | | Citizens Bank NA, (fixed rate to 08/09/2027, variable rate thereafter), 4.575%, 8/09/2028 | | | 276,152 | |
| | 815,000 | | | Citizens Financial Group, Inc., (fixed rate to 5/21/2032, variable rate thereafter), 5.641%, 5/21/2037 | | | 751,552 | |
| | 225,000 | | | Comerica, Inc., 3.700%, 7/31/2023 | | | 223,061 | |
| | 295,000 | | | Commonwealth Bank of Australia, 2.552%, 3/14/2027, 144A | | | 266,487 | |
| | 535,000 | | | Cooperatieve Rabobank U.A., (fixed rate to 12/15/2026, variable rate thereafter), 1.980%, 12/15/2027, 144A | | | 455,717 | |
| | 750,000 | | | Credit Agricole S.A., (fixed rate to 6/16/2025, variable rate thereafter), 1.907%, 6/16/2026, 144A | | | 670,549 | |
| | 1,605,000 | | | Credit Suisse AG, 5.000%, 7/09/2027 | | | 1,480,000 | |
| | 1,210,000 | | | Credit Suisse Group AG, (fixed rate to 8/11/2027, variable rate thereafter), 6.442%, 8/11/2028, 144A | | | 1,125,482 | |
| | 500,000 | | | Danske Bank A/S, 3.875%, 9/12/2023, 144A | | | 491,985 | |
| | 390,000 | | | Danske Bank A/S, (fixed rate to 3/28/2024, variable rate thereafter), 3.773%, 3/28/2025, 144A | | | 375,053 | |
| | 800,000 | | | Danske Bank A/S, (fixed rate to 9/10/2024, variable rate thereafter), 0.976%, 9/10/2025, 144A | | | 724,410 | |
| | 1,105,000 | | | Deutsche Bank AG, 5.371%, 9/09/2027 | | | 1,066,481 | |
| | 1,260,000 | | | Deutsche Bank AG, (fixed rate to 7/14/2025, variable rate thereafter), 6.119%, 7/14/2026 | | | 1,223,685 | |
| | 935,000 | | | DNB Bank ASA, (fixed rate to 3/28/2024, variable rate thereafter), 2.968%, 3/28/2025, 144A | | | 901,848 | |
| | 590,000 | | | DNB Bank ASA, (fixed rate to 9/16/2025, variable rate thereafter), 1.127%, 9/16/2026, 144A | | | 514,950 | |
| | 850,000 | | | Fifth Third Bancorp, (fixed rate to 7/28/2029, variable rate thereafter), 4.772%, 7/28/2030 | | | 793,841 | |
| | 485,000 | | | Goldman Sachs Group, Inc. (The), (fixed rate to 10/21/2026, variable rate thereafter), 1.948%, 10/21/2027 | | | 414,418 | |
| | 1,125,000 | | | HSBC Holdings PLC, (fixed rate to 08/11/2027, variable rate thereafter), 5.210%, 8/11/2028 | | | 1,051,731 | |
| | 1,405,000 | | | HSBC USA, Inc., 3.750%, 5/24/2024 | | | 1,377,066 | |
| | 555,000 | | | Huntington Bancshares, Inc., (fixed rate to 8/04/2027, variable rate thereafter), 4.443%, 8/04/2028 | | | 524,039 | |
| | 315,000 | | | Huntington National Bank (The), (fixed rate to 5/16/2024, variable rate thereafter), 4.008%, 5/16/2025 | | | 308,505 | |
| | 465,000 | | | JPMorgan Chase & Co., (fixed rate to 4/26/2025, variable rate thereafter), 4.080%, 4/26/2026 | | | 447,708 | |
| | 550,000 | | | JPMorgan Chase & Co., (fixed rate to 6/01/2028, variable rate thereafter), 2.069%, 6/01/2029 | | | 445,890 | |
| | 570,000 | | | JPMorgan Chase & Co., (fixed rate to 9/14/2032, variable rate thereafter), 5.717%, 9/14/2033 | | | 539,017 | |
| | 430,000 | | | KeyBank NA, 4.150%, 8/08/2025 | | | 416,796 | |
See accompanying notes to financial statements.
| 66
Portfolio of Investments – as of September 30, 2022
Loomis Sayles Intermediate Duration Bond Fund – (continued)
| | | | | | | | |
Principal Amount | | | Description | | Value (†) | |
| | | | Banking — continued | |
| $ | 280,000 | | | Lloyds Banking Group PLC, (fixed rate to 3/18/2025, variable rate thereafter), 3.511%, 3/18/2026 | | $ | 262,125 | |
| | 375,000 | | | Lloyds Banking Group PLC, (fixed rate to 7/09/2024, variable rate thereafter), 3.870%, 7/09/2025 | | | 361,579 | |
| | 65,000 | | | Macquarie Bank Ltd., 2.300%, 1/22/2025, 144A | | | 61,146 | |
| | 1,170,000 | | | Macquarie Group Ltd., (fixed rate to 11/09/2032, variable rate thereafter), 5.491%, 11/09/2033, 144A | | | 1,062,096 | |
| | 1,650,000 | | | Mitsubishi UFJ Financial Group, Inc., (fixed rate to 4/17/2025, variable rate thereafter), 3.837%, 4/17/2026 | | | 1,579,256 | |
| | 785,000 | | | Mitsubishi UFJ Financial Group, Inc., (fixed rate to 9/13/2027, variable rate thereafter), 5.354%, 9/13/2028 | | | 765,417 | |
| | 910,000 | | | Mizuho Financial Group, Inc., (fixed rate to 9/13/2032, variable rate thereafter), 5.669%, 9/13/2033 | | | 875,167 | |
| | 1,130,000 | | | National Bank of Canada, (fixed rate to 6/09/2024, variable rate thereafter), 3.750%, 6/09/2025 | | | 1,095,117 | |
| | 1,625,000 | | | Nationwide Building Society, 4.850%, 7/27/2027, 144A | | | 1,543,014 | |
| | 620,000 | | | Nationwide Building Society, (fixed rate to 3/08/2023, variable rate thereafter), 3.766%, 3/08/2024, 144A | | | 613,044 | |
| | 1,215,000 | | | NatWest Markets PLC, 1.600%, 9/29/2026, 144A | | | 1,025,974 | |
| | 1,305,000 | | | Nordea Bank Abp, 1.500%, 9/30/2026, 144A | | | 1,112,237 | |
| | 915,000 | | | Nordea Bank Abp, 3.600%, 6/06/2025, 144A | | | 876,982 | |
| | 575,000 | | | Nordea Bank Abp, 5.375%, 9/22/2027, 144A | | | 560,414 | |
| | 1,110,000 | | | Norinchukin Bank (The), 4.867%, 9/14/2027, 144A | | | 1,086,772 | |
| | 210,000 | | | Northern Trust Corp., (fixed rate to 5/08/2027, variable rate thereafter), 3.375%, 5/08/2032 | | | 188,429 | |
| | 690,000 | | | Santander Holdings USA, Inc., 3.450%, 6/02/2025 | | | 645,892 | |
| | 375,000 | | | Santander Holdings USA, Inc., (fixed rate to 9/09/2025, variable rate thereafter), 5.807%, 9/09/2026 | | | 366,520 | |
| | 470,000 | | | Societe Generale S.A., 4.677%, 6/15/2027, 144A | | | 447,901 | |
| | 390,000 | | | Standard Chartered PLC, (fixed rate to 1/12/2027, variable rate thereafter), 2.608%, 1/12/2028, 144A | | | 328,493 | |
| | 375,000 | | | Standard Chartered PLC, (fixed rate to 6/29/2031, variable rate thereafter), 2.678%, 6/29/2032, 144A | | | 273,964 | |
| | 335,000 | | | State Street Corp., (fixed rate to 11/18/2026, variable rate thereafter), 1.684%, 11/18/2027 | | | 292,320 | |
| | 1,015,000 | | | Sumitomo Mitsui Financial Group, Inc., 1.902%, 9/17/2028 | | | 817,404 | |
| | 840,000 | | | Sumitomo Mitsui Trust Bank Ltd., 0.850%, 3/25/2024, 144A | | | 787,961 | |
| | 200,000 | | | Sumitomo Mitsui Trust Bank Ltd., 2.550%, 3/10/2025, 144A | | | 187,190 | |
| | 235,000 | | | Swedbank AB, 3.356%, 4/04/2025, 144A | | | 224,668 | |
| | 945,000 | | | Swedbank AB, 5.337%, 9/20/2027, 144A | | | 915,604 | |
| | 560,000 | | | Synchrony Bank, 5.400%, 8/22/2025 | | | 545,994 | |
| | 1,020,000 | | | Synchrony Financial, 4.875%, 6/13/2025 | | | 983,997 | |
| | 270,000 | | | Toronto-Dominion Bank, 4.108%, 6/08/2027 | | | 254,572 | |
| | 1,580,000 | | | Toronto-Dominion Bank (The), MTN, 4.693%, 9/15/2027 | | | 1,527,372 | |
| | 820,000 | | | Truist Financial Corp., (fixed rate to 7/28/2032, variable rate thereafter), 4.916%, 7/28/2033 | | | 741,210 | |
| | 260,000 | | | Truist Financial Corp., MTN, (fixed rate to 6/07/2028, variable rate thereafter), 1.887%, 6/07/2029 | | | 212,704 | |
| | 1,175,000 | | | UBS Group AG, (fixed rate to 08/05/2026, variable rate thereafter), 4.703%, 8/05/2027, 144A | | | 1,112,290 | |
| | 585,000 | | | UniCredit SpA, (fixed rate to 9/22/2025, variable rate thereafter), 2.569%, 9/22/2026, 144A | | | 501,243 | |
| | | | Banking — continued | |
| 1,055,000 | | | Wells Fargo & Co., (fixed rate to 08/15/2025, variable rate thereafter), 4.540%, 8/15/2026 | | | 1,021,578 | |
| | 1,470,000 | | | Wells Fargo & Co., (fixed rate to 4/25/2025, variable rate thereafter), MTN, 3.908%, 4/25/2026 | | | 1,405,272 | |
| | 805,000 | | | Westpac Banking Corp., (fixed rate to 08/10/2032, variable rate thereafter), 5.405%, 8/10/2033 | | | 721,908 | |
| | | | | | | | |
| | | | | | | 67,540,720 | |
| | | | | | | | |
| | | | Brokerage — 0.7% | |
| | 595,000 | | | Ares Finance Co. IV LLC, 3.650%, 2/01/2052, 144A | | | 364,597 | |
| | 705,000 | | | Blue Owl Finance LLC, 4.375%, 2/15/2032, 144A | | | 552,482 | |
| | 195,000 | | | KKR Group Finance Co. XII LLC, 4.850%, 5/17/2032, 144A | | | 179,414 | |
| | 1,205,000 | | | Nomura Holdings, Inc., 2.329%, 1/22/2027 | | | 1,035,755 | |
| | | | | | | | |
| | | | | | | 2,132,248 | |
| | | | | | | | |
| | | | Building Materials — 0.3% | |
| | 440,000 | | | Ferguson Finance PLC, 4.650%, 4/20/2032, 144A | | | 387,332 | |
| | 640,000 | | | Fortune Brands Home & Security, Inc., 4.000%, 3/25/2032 | | | 531,080 | |
| | | | | | | | |
| | | | | | | 918,412 | |
| | | | | | | | |
| | | | Chemicals — 0.6% | |
| | 360,000 | | | Cabot Corp., 4.000%, 7/01/2029 | | | 313,732 | |
| | 310,000 | | | Cabot Corp., 5.000%, 6/30/2032 | | | 278,279 | |
| | 175,000 | | | Celanese U.S. Holdings LLC, 6.330%, 7/15/2029 | | | 163,104 | |
| | 960,000 | | | Nutrien Ltd., 1.900%, 5/13/2023 | | | 942,409 | |
| | | | | | | | |
| | | | | | | 1,697,524 | |
| | | | | | | | |
| | | | Collateralized Mortgage Obligations — 1.2% | |
| | 266,456 | | | Government National Mortgage Association, Series 2010-H02, Class FA, 1-month LIBOR + 0.680%, 3.173%, 2/20/2060(b) | | | 265,337 | |
| | 165,053 | | | Government National Mortgage Association, Series 2010-H03, Class FA, 1-month LIBOR + 0.550%, 3.043%, 3/20/2060(b) | | | 164,074 | |
| | 105,169 | | | Government National Mortgage Association, Series 2014-H14, Class FA, 1-month LIBOR + 0.500%, 2.298%, 7/20/2064(b) | | | 104,162 | |
| | 87,348 | | | Government National Mortgage Association, Series 2014-H15, Class FA, 1-month LIBOR + 0.500%, 2.857%, 7/20/2064(b) | | | 86,438 | |
| | 224 | | | Government National Mortgage Association, Series 2015-H09, Class HA, 1.750%, 3/20/2065(c) | | | 201 | |
| | 214,619 | | | Government National Mortgage Association, Series 2015-H10, Class JA, 2.250%, 4/20/2065 | | | 207,496 | |
| | 315,437 | | | Government National Mortgage Association, Series 2016-H06, Class FC, 1-month LIBOR + 0.920%, 3.277%, 2/20/2066(b) | | | 312,807 | |
| | 880,512 | | | Government National Mortgage Association, Series 2018-H17, Class JA, 3.750%, 9/20/2068(a) | | | 837,890 | |
| | 219,875 | | | Government National Mortgage Association, Series 2019-H01, Class FL, 1-month LIBOR + 0.450%, 2.807%, 12/20/2068(b) | | | 217,785 | |
| | 678,483 | | | Government National Mortgage Association, Series 2019-H01, Class FT, 1-month LIBOR + 0.400%, 2.757%, 10/20/2068(b) | | | 674,170 | |
| | 675,292 | | | Government National Mortgage Association, Series 2019-H10, Class FM, 1-month LIBOR + 0.400%, 2.757%, 5/20/2069(b) | | | 667,320 | |
| | | | | | | | |
| | | | | | | 3,537,680 | |
| | | | | | | | |
See accompanying notes to financial statements.
67 |
Portfolio of Investments – as of September 30, 2022
Loomis Sayles Intermediate Duration Bond Fund – (continued)
| | | | | | | | |
Principal Amount | | | Description | | Value (†) | |
| | | | Construction Machinery — 1.4% | |
| $ | 1,340,000 | | | Caterpillar Financial Services Corp., 3.600%, 8/12/2027 | | $ | 1,265,158 | |
| | 300,000 | | | CNH Industrial Capital LLC, 1.950%, 7/02/2023 | | | 293,631 | |
| | 945,000 | | | CNH Industrial Capital LLC, 3.950%, 5/23/2025 | | | 911,350 | |
| | 845,000 | | | John Deere Capital Corp., 4.150%, 9/15/2027 | | | 820,010 | |
| | 895,000 | | | Komatsu Finance America, Inc., 5.499%, 10/06/2027, 144A | | | 895,235 | |
| | | | | | | | |
| | | | | | | 4,185,384 | |
| | | | | | | | |
| | | | Consumer Cyclical Services — 0.3% | |
| | 710,000 | | | eBay, Inc., 1.400%, 5/10/2026 | | | 621,163 | |
| | 165,000 | | | Expedia Group, Inc., 6.250%, 5/01/2025, 144A | | | 166,077 | |
| | | | | | | | |
| | | | | | | 787,240 | |
| | | | | | | | |
| | | | Consumer Products — 0.2% | |
| | 385,000 | | | Brunswick Corp., 4.400%, 9/15/2032 | | | 310,505 | |
| | 495,000 | | | JAB Holdings BV, 4.500%, 4/08/2052, 144A | | | 318,383 | |
| | | | | | | | |
| | | | | | | 628,888 | |
| | | | | | | | |
| | | | Diversified Manufacturing — 0.5% | |
| | 135,000 | | | Amphenol Corp., 2.050%, 3/01/2025 | | | 126,321 | |
| | 895,000 | | | Eaton Corp., 4.150%, 3/15/2033 | | | 808,630 | |
| | 225,000 | | | Kennametal, Inc., 4.625%, 6/15/2028 | | | 208,951 | |
| | 135,000 | | | Timken Co. (The), 4.500%, 12/15/2028 | | | 123,280 | |
| | 275,000 | | | WW Grainger, Inc., 1.850%, 2/15/2025 | | | 257,756 | |
| | | | | | | | |
| | | | | | | 1,524,938 | |
| | | | | | | | |
| | | | Electric — 5.5% | |
| | 240,000 | | | AEP Texas, Inc., 4.700%, 5/15/2032 | | | 220,973 | |
| | 435,000 | | | AES Corp. (The), 3.300%, 7/15/2025, 144A | | | 401,127 | |
| | 560,000 | | | Alabama Power Co., 3.940%, 9/01/2032 | | | 505,642 | |
| | 360,000 | | | Alliant Energy Finance LLC, 4.250%, 6/15/2028, 144A | | | 331,676 | |
| | 550,000 | | | American Electric Power Co., Inc., 2.031%, 3/15/2024 | | | 526,385 | |
| | 245,000 | | | Appalachian Power Co., Series BB, 4.500%, 8/01/2032 | | | 220,551 | |
| | 120,000 | | | Consolidated Edison Co. of New York, Inc., Series B, 2.900%, 12/01/2026 | | | 108,895 | |
| | 225,000 | | | Dominion Energy, Inc., 3.071%, 8/15/2024 | | | 215,771 | |
| | 270,000 | | | DTE Energy Co., 2.250%, 11/01/2022 | | | 269,555 | |
| | 980,000 | | | DTE Energy Co., 4.220%, 11/01/2024 | | | 960,821 | |
| | 1,135,000 | | | Duke Energy Carolinas LLC, 3.050%, 3/15/2023 | | | 1,128,881 | |
| | 1,110,000 | | | Edison International, 4.700%, 8/15/2025 | | | 1,075,385 | |
| | 820,000 | | | Enel Finance International NV, 5.000%, 6/15/2032, 144A | | | 699,093 | |
| | 605,000 | | | Entergy Corp., 0.900%, 9/15/2025 | | | 532,286 | |
| | 350,000 | | | Eversource Energy, 4.600%, 7/01/2027 | | | 337,799 | |
| | 355,000 | | | ITC Holdings Corp., 4.950%, 9/22/2027, 144A | | | 346,331 | |
| | 188,000 | | | National Rural Utilities Cooperative Finance Corp., (fixed rate to 4/30/2023, variable rate thereafter), 4.750%, 4/30/2043 | | | 171,053 | |
| | 900,000 | | | NextEra Energy Capital Holdings, Inc., 0.650%, 3/01/2023 | | | 886,201 | |
| | 905,000 | | | NextEra Energy Capital Holdings, Inc., 4.255%, 9/01/2024 | | | 891,990 | |
| | 825,000 | | | Oncor Electric Delivery Co. LLC, 2.750%, 5/15/2030 | | | 707,529 | |
| | 325,000 | | | Oncor Electric Delivery Co. LLC, 4.550%, 9/15/2032, 144A | | | 312,615 | |
| | 115,000 | | | Pacific Gas & Electric Co., SOFR Index + 1.150%, 3.803%, 11/14/2022(b) | | | 114,749 | |
| | 525,000 | | | Pacific Gas & Electric Co., 4.950%, 6/08/2025 | | | 509,628 | |
| | 235,000 | | | Public Service Enterprise Group, Inc., 2.875%, 6/15/2024 | | | 226,035 | |
| | 275,000 | | | Puget Energy, Inc., 4.224%, 3/15/2032 | | | 237,368 | |
| | | | Electric — continued | |
| 845,000 | | | Southern California Edison Co., SOFR + 0.470%, 3.277%, 12/02/2022(b) | | | 844,314 | |
| | 825,000 | | | Southern California Edison Co., Series D, 4.700%, 6/01/2027 | | | 800,728 | |
| | 1,040,000 | | | Vistra Operations Co. LLC, 5.125%, 5/13/2025, 144A | | | 1,007,687 | |
| | 1,540,000 | | | WEC Energy Group, Inc., 0.550%, 9/15/2023 | | | 1,475,539 | |
| | | | | | | | |
| | | | | | | 16,066,607 | |
| | | | | | | | |
| | | | Finance Companies — 3.4% | |
| | 510,000 | | | AerCap Ireland Capital DAC/AerCap Global Aviation Trust, 3.150%, 2/15/2024 | | | 489,807 | |
| | 360,000 | | | Air Lease Corp., 1.875%, 8/15/2026 | | | 305,093 | |
| | 555,000 | | | Aircastle Ltd., 2.850%, 1/26/2028, 144A | | | 430,852 | |
| | 500,000 | | | Ares Capital Corp., 2.875%, 6/15/2028 | | | 393,531 | |
| | 50,000 | | | Ares Capital Corp., 4.250%, 3/01/2025 | | | 47,234 | |
| | 305,000 | | | Aviation Capital Group LLC, 3.875%, 5/01/2023, 144A | | | 299,443 | |
| | 225,000 | | | Aviation Capital Group LLC, 4.375%, 1/30/2024, 144A | | | 217,600 | |
| | 545,000 | | | Bain Capital Specialty Finance, Inc., 2.550%, 10/13/2026 | | | 446,298 | |
| | 200,000 | | | Barings BDC, Inc., 3.300%, 11/23/2026, 144A | | | 165,887 | |
| | 1,115,000 | | | Blackstone Private Credit Fund, 2.625%, 12/15/2026 | | | 915,316 | |
| | 615,000 | | | Blackstone Secured Lending Fund, 2.850%, 9/30/2028 | | | 466,474 | |
| | 650,000 | | | FS KKR Capital Corp., 3.125%, 10/12/2028 | | | 504,749 | |
| | 250,000 | | | GATX Corp., 4.900%, 3/15/2033 | | | 224,773 | |
| | 810,000 | | | Golub Capital BDC, Inc., 2.500%, 8/24/2026 | | | 678,983 | |
| | 695,000 | | | Hercules Capital, Inc., 3.375%, 1/20/2027 | | | 576,337 | |
| | 785,000 | | | Main Street Capital Corp., 3.000%, 7/14/2026 | | | 660,899 | |
| | 600,000 | | | Morgan Stanley Direct Lending Fund, 4.500%, 2/11/2027 | | | 532,336 | |
| | 110,000 | | | Oaktree Specialty Lending Corp., 3.500%, 2/25/2025 | | | 104,495 | |
| | 260,000 | | | Owl Rock Capital Corp., 3.750%, 7/22/2025 | | | 238,738 | |
| | 90,000 | | | Owl Rock Capital Corp., 4.250%, 1/15/2026 | | | 82,309 | |
| | 500,000 | | | Owl Rock Core Income Corp., 5.500%, 3/21/2025 | | | 470,402 | |
| | 280,000 | | | OWL Rock Core Income Corp., 7.750%, 9/16/2027, 144A | | | 275,748 | |
| | 1,110,000 | | | Owl Rock Technology Finance Corp., 4.750%, 12/15/2025, 144A | | | 999,145 | |
| | 520,000 | | | USAA Capital Corp., 3.375%, 5/01/2025, 144A | | | 500,949 | |
| | | | | | | | |
| | | | | | | 10,027,398 | |
| | | | | | | | |
| | | | Financial Other — 0.4% | |
| | 470,000 | | | LeasePlan Corp. NV, 2.875%, 10/24/2024, 144A | | | 440,970 | |
| | 185,000 | | | ORIX Corp., 3.250%, 12/04/2024 | | | 177,693 | |
| | 555,000 | | | ORIX Corp., 5.200%, 9/13/2032 | | | 527,845 | |
| | | | | | | | |
| | | | | | | 1,146,508 | |
| | | | | | | | |
| | | | Food & Beverage — 1.7% | |
| | 120,000 | | | Brown-Forman Corp., 3.500%, 4/15/2025 | | | 116,280 | |
| | 1,095,000 | | | General Mills, Inc., 2.600%, 10/12/2022 | | | 1,094,667 | |
| | 1,925,000 | | | JBS USA LUX SA/JBS USA Food Co./JBS USA Finance, Inc., 5.750%, 4/01/2033, 144A | | | 1,738,544 | |
| | 1,110,000 | | | Nestle Holdings, Inc., 4.300%, 10/01/2032, 144A | | | 1,056,023 | |
| | 915,000 | | | Pernod Ricard International Finance LLC, 1.250%, 4/01/2028, 144A | | | 749,348 | |
| | 340,000 | | | Viterra Finance BV, 2.000%, 4/21/2026, 144A | | | 288,806 | |
| | | | | | | | |
| | | | | | | 5,043,668 | |
| | | | | | | | |
| | | | Government Owned – No Guarantee — 0.4% | |
| | 800,000 | | | Antares Holdings LP, 3.750%, 7/15/2027, 144A | | | 645,828 | |
| | 350,000 | | | BOC Aviation USA Corp., 1.625%, 4/29/2024, 144A | | | 330,446 | |
| | 325,000 | | | DAE Funding LLC, 1.550%, 8/01/2024, 144A | | | 296,928 | |
| | | | | | | | |
| | | | | | | 1,273,202 | |
| | | | | | | | |
See accompanying notes to financial statements.
| 68
Portfolio of Investments – as of September 30, 2022
Loomis Sayles Intermediate Duration Bond Fund – (continued)
| | | | | | | | |
Principal Amount | | | Description | | Value (†) | |
| | | | Healthcare — 0.5% | |
| $ | 650,000 | | | Baxter International, Inc., 2.272%, 12/01/2028 | | $ | 536,748 | |
| | 227,000 | | | Cigna Corp., 3.750%, 7/15/2023 | | | 225,328 | |
| | 92,000 | | | CVS Health Corp., 4.300%, 3/25/2028 | | | 86,771 | |
| | 510,000 | | | DH Europe Finance II S.a.r.l., 2.200%, 11/15/2024 | | | 482,234 | |
| | | | | | | | |
| | | | | | | 1,331,081 | |
| | | | | | | | |
| | | | Hybrid ARMs — 0.0% | |
| | 17,980 | | | FHLMC, 1-year CMT + 2.225%, 3.201%, 1/01/2035(b) | | | 18,372 | |
| | 34,559 | | | FHLMC, 1-year CMT + 2.500%, 3.238%, 5/01/2036(b) | | | 35,407 | |
| | | | | | | | |
| | | | | | | 53,779 | |
| | | | | | | | |
| | | | Independent Energy — 0.2% | |
| | 530,000 | | | Pioneer Natural Resources Co., 0.550%, 5/15/2023 | | | 517,153 | |
| | | | | | | | |
| | | | Life Insurance — 6.2% | |
| | 535,000 | | | AIG Global Funding, 0.900%, 9/22/2025, 144A | | | 471,356 | |
| | 635,000 | | | Athene Global Funding, 2.500%, 3/24/2028, 144A | | | 528,585 | |
| | 410,000 | | | Brighthouse Financial Global Funding, 1.200%, 12/15/2023, 144A | | | 391,046 | |
| | 780,000 | | | Brighthouse Financial Global Funding, 1.750%, 1/13/2025, 144A | | | 711,377 | |
| | 985,000 | | | CNO Global Funding, 2.650%, 1/06/2029, 144A | | | 818,391 | |
| | 830,000 | | | Corebridge Financial, Inc., 3.650%, 4/05/2027, 144A | | | 758,002 | |
| | 575,000 | | | Equitable Financial Life Global Funding, 1.800%, 3/08/2028, 144A | | | 480,322 | |
| | 615,000 | | | F&G Global Funding, 2.000%, 9/20/2028, 144A | | | 497,324 | |
| | 1,170,000 | | | F&G Global Funding, 5.150%, 7/07/2025, 144A | | | 1,146,251 | |
| | 230,000 | | | GA Global Funding Trust, 1.250%, 12/08/2023, 144A | | | 218,921 | |
| | 995,000 | | | GA Global Funding Trust, 2.250%, 1/06/2027, 144A | | | 861,729 | |
| | 665,000 | | | Great-West Lifeco U.S. Finance LP, 0.904%, 8/12/2025, 144A | | | 584,497 | |
| | 1,370,000 | | | Guardian Life Global Funding, 1.100%, 6/23/2025, 144A | | | 1,230,539 | |
| | 955,000 | | | Jackson National Life Global Funding, 1.750%, 1/12/2025, 144A | | | 877,604 | |
| | 155,000 | | | Jackson National Life Global Funding, 3.875%, 6/11/2025, 144A | | | 148,521 | |
| | 340,000 | | | Lincoln National Corp., 3.400%, 3/01/2032 | | | 278,459 | |
| | 380,000 | | | MassMutual Global Funding II, 4.150%, 8/26/2025, 144A | | | 370,310 | |
| | 795,000 | | | Metropolitan Life Global Funding I, 0.900%, 6/08/2023, 144A | | | 775,045 | |
| | 700,000 | | | Metropolitan Life Global Funding I, 0.950%, 7/02/2025, 144A | | | 628,187 | |
| | 1,070,000 | | | New York Life Global Funding, 2.875%, 4/10/2024, 144A | | | 1,039,816 | |
| | 775,000 | | | Northwestern Mutual Global Funding, 4.350%, 9/15/2027, 144A | | | 748,290 | |
| | 550,000 | | | Pacific LifeCorp, 5.400%, 9/15/2052, 144A | | | 515,411 | |
| | 745,000 | | | Protective Life Global Funding, 1.646%, 1/13/2025, 144A | | | 683,090 | |
| | 1,175,000 | | | Protective Life Global Funding, 4.714%, 7/06/2027, 144A | | | 1,135,327 | |
| | 655,000 | | | Reliance Standard Life Global Funding II, 2.750%, 5/07/2025, 144A | | | 611,165 | |
| | 175,000 | | | Reliance Standard Life Global Funding II, 3.850%, 9/19/2023, 144A | | | 172,503 | |
| | 770,000 | | | RGA Global Funding, 2.700%, 1/18/2029, 144A | | | 644,595 | |
| | 755,000 | | | Security Benefit Global Funding, 1.250%, 5/17/2024, 144A | | | 703,964 | |
| | | | | | | | |
| | | | | | | 18,030,627 | |
| | | | | | | | |
| | | | Lodging — 0.3% | |
| | 540,000 | | | Marriott International, Inc., 5.000%, 10/15/2027 | | | 521,497 | |
| | | | Lodging — continued | |
| 350,000 | | | Marriott International, Inc., Series Z, 4.150%, 12/01/2023 | | | 346,053 | |
| | | | | | | | |
| | | | | | | 867,550 | |
| | | | | | | | |
| | | | Media Entertainment — 0.1% | |
| | 550,000 | | | Prosus NV, 4.193%, 1/19/2032, 144A | | | 403,579 | |
| | | | | | | | |
| | | | Metals & Mining — 0.2% | |
| | 200,000 | | | Anglo American Capital PLC, 3.875%, 3/16/2029, 144A | | | 171,863 | |
| | 155,000 | | | Glencore Funding LLC, 4.125%, 3/12/2024, 144A | | | 152,308 | |
| | 395,000 | | | Nucor Corp., 3.950%, 5/23/2025 | | | 382,809 | |
| | | | | | | | |
| | | | | | | 706,980 | |
| | | | | | | | |
| | | | Midstream — 0.5% | |
| | 300,000 | | | Boardwalk Pipelines LP, 3.600%, 9/01/2032 | | | 237,220 | |
| | 25,000 | | | Energy Transfer LP, 4.250%, 3/15/2023 | | | 24,933 | |
| | 255,000 | | | MPLX LP, 4.950%, 3/14/2052 | | | 199,556 | |
| | 950,000 | | | Targa Resources Corp., 5.200%, 7/01/2027 | | | 913,878 | |
| | | | | | | | |
| | | | | | | 1,375,587 | |
| | | | | | | | |
| | | | Mortgage Related — 0.7% | |
| | 814 | | | FHLMC, 3.000%, 10/01/2026 | | | 793 | |
| | 35 | | | FHLMC, 6.500%, 1/01/2024 | | | 37 | |
| | 17 | | | FHLMC, 8.000%, 7/01/2025 | | | 17 | |
| | 4,865 | | | GNMA, 3.890%, 10/20/2062(a) | | | 4,583 | |
| | 5,894 | | | GNMA, 3.992%, 5/20/2062(a) | | | 5,655 | |
| | 13,427 | | | GNMA, 4.015%, 4/20/2063(a) | | | 12,946 | |
| | 43,763 | | | GNMA, 4.255%, 11/20/2066(a) | | | 42,977 | |
| | 19,326 | | | GNMA, 4.303%, 6/20/2066(a) | | | 18,883 | |
| | 39,854 | | | GNMA, 4.388%, 9/20/2066(a) | | | 39,099 | |
| | 52,816 | | | GNMA, 4.427%, 10/20/2066(a) | | | 51,919 | |
| | 140,619 | | | GNMA, 4.438%, 10/20/2066(a) | | | 138,520 | |
| | 35,732 | | | GNMA, 4.471%, 8/20/2066(a) | | | 35,242 | |
| | 122,923 | | | GNMA, 4.497%, 9/20/2066(a) | | | 121,448 | |
| | 61,937 | | | GNMA, 4.504%, 11/20/2066(a) | | | 61,042 | |
| | 5,048 | | | GNMA, 4.541%, 11/20/2064(a) | | | 4,992 | |
| | 50,356 | | | GNMA, 4.586%, 10/20/2066(a) | | | 49,807 | |
| | 274,067 | | | GNMA, 4.600%, 7/20/2067(a) | | | 270,493 | |
| | 706,065 | | | GNMA, 4.644%, 4/20/2067(a) | | | 698,908 | |
| | 444,802 | | | GNMA, 4.673%, 1/20/2067(a) | | | 440,841 | |
| | 157,828 | | | GNMA, 4.700%, with various maturities from 2061 to 2064(a)(d) | | | 157,386 | |
| | 101 | | | GNMA, 6.500%, 12/15/2023 | | | 104 | |
| | | | | | | | |
| | | | | | | 2,155,692 | |
| | | | | | | | |
| | | | Natural Gas — 0.1% | |
| | 290,000 | | | Sempra Energy, 3.700%, 4/01/2029 | | | 259,003 | |
| | | | | | | | |
| | | | Non-Agency Commercial Mortgage-Backed Securities — 6.0% | |
| | 230,000 | | | BANK, Series 2019-BN24, Class A3, 2.960%, 11/15/2062 | | | 197,688 | |
| | 270,000 | | | BANK, Series 2020-BN25, Class A5, 2.649%, 1/15/2063 | | | 226,859 | |
| | 870,000 | | | BANK, Series 2021-BN37, Class A5, 2.618%, 11/15/2064(a) | | | 706,843 | |
| | 281,186 | | | Barclays Commercial Mortgage Securities Trust, Series 2017-C1, Class A2, 3.189%, 2/15/2050 | | | 280,776 | |
| | 660,000 | | | Barclays Commercial Mortgage Securities Trust, Series 2020-BID, Class A, 1-month LIBOR + 2.140%, 4.958%, 10/15/2037, 144A(b) | | | 650,049 | |
| | 865,000 | | | BBCMS Mortgage Trust, Series 2021-C12, Class A5, 2.689%, 11/15/2054 | | | 707,325 | |
| | 285,000 | | | Benchmark Mortgage Trust, Series 2020-B16, Class A5, 2.732%, 2/15/2053 | | | 241,338 | |
See accompanying notes to financial statements.
69 |
Portfolio of Investments – as of September 30, 2022
Loomis Sayles Intermediate Duration Bond Fund – (continued)
| | | | | | | | |
Principal Amount | | | Description | | Value (†) | |
| | | | Non-Agency Commercial Mortgage-Backed Securities — continued | |
| $ | 755,000 | | | Benchmark Mortgage Trust, Series 2021-B31, Class A5, 2.669%, 12/15/2054 | | $ | 614,048 | |
| | 520,000 | | | BPR Trust, Series 2021-NRD, Class A, 1-month SOFR + 1.525%, 4.447%, 12/15/2023, 144A(b) | | | 497,682 | |
| | 360,000 | | | BPR Trust, Series 2022-OANA, Class A, 1-month SOFR + 1.898%, 4.743%, 4/15/2037, 144A(b) | | | 354,604 | |
| | 491,600 | | | CFCRE Commercial Mortgage Trust, Series 2016-C3, Class A3, 3.865%, 1/10/2048 | | | 467,253 | |
| | 361,996 | | | CFCRE Commercial Mortgage Trust, Series 2016-C4, Class A4, 3.283%, 5/10/2058 | | | 336,997 | |
| | 992,138 | | | Citigroup Commercial Mortgage Trust, Series 2016-GC37, Class A4, 3.314%, 4/10/2049 | | | 928,022 | |
| | 540,000 | | | Citigroup Commercial Mortgage Trust, Series 2019-C7, Class A4, 3.102%, 12/15/2072 | �� | | 468,735 | |
| | 535,000 | | | Commercial Mortgage Pass Through Certificates, Series 2012-LTRT, Class A2, 3.400%, 10/05/2030, 144A | | | 502,898 | |
| | 263,676 | | | Commercial Mortgage Pass Through Certificates, Series 2013-CR8, Class A5, 3.612%, 6/10/2046(a) | | | 261,702 | |
| | 21,808 | | | Commercial Mortgage Pass Through Certificates, Series 2014-CR14, Class A2, 3.147%, 2/10/2047 | | | 21,569 | |
| | 50,231 | | | Commercial Mortgage Pass Through Certificates, Series 2014-CR16, Class ASB, 3.653%, 4/10/2047 | | | 49,800 | |
| | 280,000 | | | Commercial Mortgage Pass Through Certificates, Series 2014-UBS3, Class A4, 3.819%, 6/10/2047 | | | 273,713 | |
| | 280,000 | | | Commercial Mortgage Pass Through Certificates, Series 2015-DC1, Class A5, 3.350%, 2/10/2048 | | | 267,320 | |
| | 520,299 | | | Commercial Mortgage Pass Through Certificates, Series 2016-DC2, Class A5, 3.765%, 2/10/2049 | | | 493,919 | |
| | 795,000 | | | Credit Suisse Mortgage Trust, Series 2014-USA, Class A2, 3.953%, 9/15/2037, 144A | | | 721,628 | |
| | 51,733 | | | CSAIL Commercial Mortgage Trust, Series 2015-C4, Class ASB, 3.617%, 11/15/2048 | | | 50,469 | |
| | 470,000 | | | CSAIL Commercial Mortgage Trust, Series 2019-C18, Class A4, 2.968%, 12/15/2052 | | | 405,369 | |
| | 605,000 | | | GS Mortgage Securities Corp. II, Series 2012-BWTR, Class A, 2.954%, 11/05/2034, 144A | | | 574,774 | |
| | 440,000 | | | GS Mortgage Securities Corp. Trust, Series 2013-PEMB, Class A, 3.668%, 3/05/2033, 144A(a) | | | 401,256 | |
| | 330,000 | | | GS Mortgage Securities Trust, Series 2014-GC18, Class A4, 4.074%, 1/10/2047 | | | 324,822 | |
| | 245,000 | | | GS Mortgage Securities Trust, Series 2020-GC45, Class A5, 2.911%, 2/13/2053 | | | 209,992 | |
| | 180,000 | | | Hudsons Bay Simon JV Trust, Series 2015-HB10, Class A10, 4.155%, 8/05/2034, 144A | | | 156,957 | |
| | 355,000 | | | Hudsons Bay Simon JV Trust, Series 2015-HB7, Class A7, 3.914%, 8/05/2034, 144A | | | 314,834 | |
| | 31,504 | | | JPMorgan Chase Commercial Mortgage Securities Trust, Series 2014-C19, Class ASB, 3.584%, 4/15/2047 | | | 31,137 | |
| | 575,000 | | | JPMorgan Chase Commercial Mortgage Securities Trust, Series 2019-COR5, Class A4, 3.386%, 6/13/2052 | | | 512,290 | |
| | 470,000 | | | MedTrust, Series 2021-MDLN, Class A, 1-month LIBOR + 0.950%, 3.768%, 11/15/2038, 144A(b) | | | 451,161 | |
| | 240,000 | | | Morgan Stanley Bank of America Merrill Lynch Trust, Series 2013-C10, Class A4, 4.206%, 7/15/2046(a) | | | 237,940 | |
| | 129,604 | | | Morgan Stanley Bank of America Merrill Lynch Trust, Series 2015-C22, Class A4, 3.306%, 4/15/2048 | | | 123,246 | |
| | 550,000 | | | Morgan Stanley Capital I Trust, Series 2020-L4, Class A3, 2.698%, 2/15/2053 | | | 464,879 | |
| | | | Non-Agency Commercial Mortgage-Backed Securities — continued | |
| 845,000 | | | New Economy Assets Phase 1 Sponsor LLC, Series 2021-1, Class A1, 1.910%, 10/20/2061, 144A | | | 715,015 | |
| | 980,000 | | | SPGN Mortgage Trust, Series 2022-TFLM. Class A, 1-month SOFR + 1.550%, 4.395%, 2/15/2039, 144A(b) | | | 934,416 | |
| | 201,215 | | | UBS-Barclays Commercial Mortgage Trust, Series 2012-TFT, Class A, 2.892%, 6/05/2030, 144A | | | 193,731 | |
| | 565,000 | | | UBS-Barclays Commercial Mortgage Trust, Series 2013-C6, Class A4, 3.244%, 4/10/2046 | | | 560,369 | |
| | 201,109 | | | Wells Fargo Commercial Mortgage Trust, Series 2016-C33, Class A4, 3.426%, 3/15/2059 | | | 188,389 | |
| | 490,000 | | | Wells Fargo Commercial Mortgage Trust, Series 2020-C58, Class A4, 2.092%, 7/15/2053 | | | 386,987 | |
| | 825,000 | | | Wells Fargo Commercial Mortgage Trust, Series 2022-C62, Class A4, 4.000%, 4/15/2055(a) | | | 744,592 | |
| | 325,000 | | | WFRBS Commercial Mortgage Trust, Series 2014-C19, Class A5, 4.101%, 3/15/2047 | | | 319,775 | |
| | 102,746 | | | WFRBS Commercial Mortgage Trust, Series 2014-C20, Class ASB, 3.638%, 5/15/2047 | | | 101,398 | |
| | | | | | | | |
| | | | | | | 17,674,566 | |
| | | | | | | | |
| | | | Packaging — 0.1% | |
| | 335,000 | | | Amcor Flexibles North America, Inc., 4.000%, 5/17/2025 | | | 323,393 | |
| | | | | | | | |
| | | | Pharmaceuticals — 0.2% | |
| | 440,000 | | | Amgen, Inc., 4.200%, 3/01/2033 | | | 398,483 | |
| | 235,000 | | | Bayer U.S. Finance II LLC, 3.375%, 7/15/2024, 144A | | | 226,676 | |
| | | | | | | | |
| | | | | | | 625,159 | |
| | | | | | | | |
| | | | Property & Casualty Insurance — 0.2% | |
| | 135,000 | | | Assurant, Inc., 4.200%, 9/27/2023 | | | 134,250 | |
| | 400,000 | | | Fairfax Financial Holdings Ltd., 5.625%, 8/16/2032, 144A | | | 368,812 | |
| | 240,000 | | | Trustage Financial Group, Inc., 4.625%, 4/15/2032, 144A | | | 207,201 | |
| | | | | | | | |
| | | | | | | 710,263 | |
| | | | | | | | |
| | | | Railroads — 0.1% | |
| | 215,000 | | | Union Pacific Corp., 3.646%, 2/15/2024 | | | 211,819 | |
| | | | | | | | |
| | | | REITs – Apartments — 0.1% | |
| | 225,000 | | | Invitation Homes Operating Partnership LP, 2.000%, 8/15/2031 | | | 161,410 | |
| | | | | | | | |
| | | | REITs – Diversified — 0.3% | |
| | 810,000 | | | Digital Realty Trust LP, 5.550%, 1/15/2028 | | | 803,240 | |
| | | | | | | | |
| | | | REITs – Health Care — 0.1% | |
| | 235,000 | | | Omega Healthcare Investors, Inc., 4.500%, 1/15/2025 | | | 229,006 | |
| | | | | | | | |
| | | | REITs – Office Property — 0.5% | |
| | 890,000 | | | Hudson Pacific Properties LP, 5.950%, 2/15/2028 | | | 852,368 | |
| | 190,000 | | | Office Properties Income Trust, 2.400%, 2/01/2027 | | | 136,858 | |
| | 560,000 | | | Office Properties Income Trust, 3.450%, 10/15/2031 | | | 338,351 | |
| | 205,000 | | | Office Properties Income Trust, 4.500%, 2/01/2025 | | | 182,233 | |
| | | | | | | | |
| | | | | | | 1,509,810 | |
| | | | | | | | |
| | | | REITs – Storage — 0.1% | |
| | 215,000 | | | Extra Space Storage LP, 3.900%, 4/01/2029 | | | 191,424 | |
| | | | | | | | |
| | | | Restaurants — 0.1% | |
| | 420,000 | | | McDonald’s Corp., MTN, 3.350%, 4/01/2023 | | | 417,409 | |
| | | | | | | | |
| | | | Retailers — 0.9% | |
| | 345,000 | | | AutoNation, Inc., 3.500%, 11/15/2024 | | | 331,787 | |
| | 290,000 | | | AutoNation, Inc., 4.500%, 10/01/2025 | | | 280,705 | |
| | 580,000 | | | Home Depot, Inc. (The), 4.500%, 9/15/2032 | | | 554,379 | |
| | 190,000 | | | Tapestry, Inc., 3.050%, 3/15/2032 | | | 141,754 | |
See accompanying notes to financial statements.
| 70
Portfolio of Investments – as of September 30, 2022
Loomis Sayles Intermediate Duration Bond Fund – (continued)
| | | | | | | | |
Principal Amount | | | Description | | Value (†) | |
| | | | Retailers — continued | |
| $ | 1,245,000 | | | Walgreens Boots Alliance, Inc., 0.950%, 11/17/2023 | | $ | 1,191,833 | |
| | | | | | | | |
| | | | | | | 2,500,458 | |
| | | | | | | | |
| | | | Sovereigns — 0.2% | |
| | 585,000 | | | Mexico Government International Bond, 4.875%, 5/19/2033 | | | 514,206 | |
| | | | | | | | |
| | | | Technology — 2.6% | |
| | 485,000 | | | Avnet, Inc., 5.500%, 6/01/2032 | | | 440,378 | |
| | 440,000 | | | Broadcom, Inc., 4.000%, 4/15/2029, 144A | | | 387,832 | |
| | 870,000 | | | CDW LLC/CDW Finance Corp., 3.276%, 12/01/2028 | | | 723,953 | |
| | 505,000 | | | Equifax, Inc., 5.100%, 12/15/2027 | | | 488,584 | |
| | 630,000 | | | Fidelity National Information Services, Inc., 4.700%, 7/15/2027 | | | 606,379 | |
| | 165,000 | | | Flex Ltd., 4.875%, 6/15/2029 | | | 149,127 | |
| | 525,000 | | | Global Payments, Inc., 1.500%, 11/15/2024 | | | 482,354 | |
| | 280,000 | | | Global Payments, Inc., 4.950%, 8/15/2027 | | | 266,767 | |
| | 805,000 | | | HP, Inc., 4.750%, 1/15/2028 | | | 755,430 | |
| | 315,000 | | | Infor, Inc., 1.450%, 7/15/2023, 144A | | | 303,925 | |
| | 560,000 | | | Intel Corp., 4.150%, 8/05/2032 | | | 509,959 | |
| | 215,000 | | | Jabil, Inc., 4.250%, 5/15/2027 | | | 200,409 | |
| | 515,000 | | | KLA Corp., 4.650%, 7/15/2032 | | | 494,416 | |
| | 175,000 | | | Marvell Technology, Inc., 4.200%, 6/22/2023 | | | 174,470 | |
| | 285,000 | | | Microchip Technology, Inc., 0.972%, 2/15/2024 | | | 268,516 | |
| | 460,000 | | | Microchip Technology, Inc., 2.670%, 9/01/2023 | | | 448,288 | |
| | 500,000 | | | PayPal Holdings, Inc., 4.400%, 6/01/2032 | | | 466,018 | |
| | 200,000 | | | Qorvo, Inc., 1.750%, 12/15/2024, 144A | | | 184,362 | |
| | 170,000 | | | Western Digital Corp., 2.850%, 2/01/2029 | | | 132,114 | |
| | 165,000 | | | Western Union Co. (The), 4.250%, 6/09/2023 | | | 164,292 | |
| | | | | | | | |
| | | | | | | 7,647,573 | |
| | | | | | | | |
| | | | Tobacco — 0.6% | |
| | 585,000 | | | Altria Group, Inc., 2.450%, 2/04/2032 | | | 412,845 | |
| | 715,000 | | | BAT Capital Corp., 4.700%, 4/02/2027 | | | 667,143 | |
| | 65,000 | | | BAT Capital Corp., 4.742%, 3/16/2032 | | | 54,375 | |
| | 490,000 | | | Imperial Brands Finance PLC, 6.125%, 7/27/2027, 144A | | | 482,827 | |
| | | | | | | | |
| | | | | | | 1,617,190 | |
| | | | | | | | |
| | | | Transportation Services — 0.6% | |
| | 450,000 | | | Element Fleet Management Corp., 3.850%, 6/15/2025, 144A | | | 425,886 | |
| | 175,000 | | | Penske Truck Leasing Co. LP/PTL Finance Corp., 4.000%, 7/15/2025, 144A | | | 166,790 | |
| | 695,000 | | | Penske Truck Leasing Co. LP/PTL Finance Corp., 4.125%, 8/01/2023, 144A | | | 688,409 | |
| | 255,000 | | | Ryder System, Inc., MTN, 3.750%, 6/09/2023 | | | 253,310 | |
| | 370,000 | | | Ryder System, Inc., MTN, 4.625%, 6/01/2025 | | | 362,921 | |
| | | | | | | | |
| | | | | | | 1,897,316 | |
| | | | | | | | |
| | | | Treasuries — 22.0% | |
| | 8,465,000 | | | U.S. Treasury Note, 0.375%, 12/31/2025 | | | 7,485,242 | |
| | 1,605,000 | | | U.S. Treasury Note, 0.500%, 3/31/2025 | | | 1,464,249 | |
| | 11,800,000 | | | U.S. Treasury Note, 1.125%, 10/31/2026 | | | 10,461,898 | |
| | 6,825,000 | | | U.S. Treasury Note, 1.875%, 2/28/2027 | | | 6,215,549 | |
| | 9,405,000 | | | U.S. Treasury Note, 2.500%, 5/31/2024 | | | 9,133,137 | |
| | 4,865,000 | | | U.S. Treasury Note, 2.625%, 5/31/2027 | | | 4,567,019 | |
| | 3,240,000 | | | U.S. Treasury Note, 2.750%, 4/30/2027 | | | 3,057,624 | |
| | 8,045,000 | | | U.S. Treasury Note, 2.750%, 7/31/2027 | | | 7,575,499 | |
| | 3,985,000 | | | U.S. Treasury Note, 2.750%, 8/15/2032 | | | 3,643,784 | |
| | 1,485,000 | | | U.S. Treasury Note, 3.250%, 8/31/2024 | | | 1,458,200 | |
| | 9,900,000 | | | U.S. Treasury Note, 3.250%, 6/30/2027 | | | 9,541,125 | |
| | | | | | | | |
| | | | 64,603,326 | |
| | | | | | | | |
| | | | | | | | |
Principal Amount | | | Description | | Value (†) | |
| | | | Wireless — 0.2% | |
| $ | 455,000 | | | Crown Castle, Inc., 2.900%, 3/15/2027 | | $ | 403,872 | |
| | 200,000 | | | SK Telecom Co. Ltd., 3.750%, 4/16/2023, 144A | | | 198,379 | |
| | | | | | | | |
| | | | 602,251 | |
| | | | | | | | |
| | | | Total Bonds and Notes
(Identified Cost $308,919,622) | | | 286,667,921 | |
| | | | | | | | |
| | | | | | | | |
| | Short-Term Investments — 2.0% | | | | |
| | 2,651,372 | | | Tri-Party Repurchase Agreement with Fixed Income Clearing Corporation, dated 9/30/2022 at 1.100% to be repurchased at $2,651,615 on 10/03/2022 collateralized by $3,095,800 U.S. Treasury Bond, 3.000% due 8/15/2052 valued at $2,704,472 including accrued interest (Note 2 of Notes to Financial Statements) | | | 2,651,372 | |
| | 3,195,000 | | | U.S. Treasury Bills,(e) 2.747%, 11/25/2022 | | | 3,181,765 | |
| | | | | | | | |
| | | | Total Short-Term Investments
(Identified Cost $5,832,965) | | | 5,833,137 | |
| | | | | | | | |
| | | | | | | | |
| | | | Total Investments — 99.8%
(Identified Cost $314,752,587) | | | 292,501,058 | |
| | | | Other assets less liabilities — 0.2% | | | 462,605 | |
| | | | | | | | |
| | | | Net Assets — 100.0% | | $ | 292,963,663 | |
| | | | | | | | |
| | | | | | | | |
| | (†) | | | See Note 2 of Notes to Financial Statements. | |
| | (a) | | | Variable rate security. The interest rate adjusts periodically based on; (i) changes in current interest rates and/or prepayments on underlying pools of assets, if applicable, (ii) reference to a base lending rate plus or minus a margin, and/or (iii) reference to a base lending rate adjusted by a multiplier and/or subject to certain floors or caps. Rate as of September 30, 2022 is disclosed. | |
| | (b) | | | Variable rate security. Rate as of September 30, 2022 is disclosed. | |
| | (c) | | | Level 3 security. Value has been determined using significant unobservable inputs. See Note 3 of Notes to Financial Statements. | |
| | (d) | | | The Fund’s investment in mortgage related securities of Government National Mortgage Association are interests in separate pools of mortgages. All separate investments in securities of each issuer which have the same coupon rate have been aggregated for the purpose of presentation in the Portfolio of Investments. | |
| | (e) | | | Interest rate represents discount rate at time of purchase; not a coupon rate. | |
| | | | | | | | |
| | 144A | | | All or a portion of these securities are exempt from registration under Rule 144A of the Securities Act of 1933. These securities may be resold in transactions exempt from registration, normally to qualified institutional buyers. At September 30, 2022, the value of Rule 144A holdings amounted to $91,075,542 or 31.1% of net assets. | |
| | ABS | | | Asset-Backed Securities | |
| | ARMs | | | Adjustable Rate Mortgages | | | | |
| | CMT | | | Constant Maturity Treasury | | | | |
| | FHLMC | | | Federal Home Loan Mortgage Corp. | | | | |
| | GNMA | | | Government National Mortgage Association | | | | |
| | LIBOR | | | London Interbank Offered Rate | | | | |
| | MTN | | | Medium Term Note | | | | |
| | REITs | | | Real Estate Investment Trusts | | | | |
| | SOFR | | | Secured Overnight Financing Rate | | | | |
See accompanying notes to financial statements.
71 |
Portfolio of Investments – as of September 30, 2022
Loomis Sayles Intermediate Duration Bond Fund – (continued)
At September 30, 2022, open long futures contracts were as follows:
| | | | | | | | | | | | | | | | | | | | |
| Financial Futures | | Expiration Date | | | Contracts | | | Notional Amount | | | Value | | | Unrealized Appreciation (Depreciation) | |
5 Year U.S. Treasury Note | | | 12/30/2022 | | | | 374 | | | $ | 41,628,660 | | | $ | 40,207,922 | | | $ | (1,420,738 | ) |
| | | | | | | | | | | | | | | | | | | | |
At September 30, 2022, open short futures contracts were as follows:
| | | | | | | | | | | | | | | | | | | | |
| Financial Futures | | Expiration Date | | | Contracts | | | Notional Amount | | | Value | | | Unrealized Appreciation (Depreciation) | |
Ultra Long U.S. Treasury Bond | | | 12/20/2022 | | | | 12 | | | $ | 1,792,972 | | | $ | 1,644,000 | | | $ | 148,972 | |
| | | | | | | | | | | | | | | | | | | | |
Industry Summary at September 30, 2022
| | | | |
Banking | | | 23.1 | % |
Treasuries | | | 22.0 | |
ABS Car Loan | | | 8.2 | |
Life Insurance | | | 6.2 | |
Non-Agency Commercial Mortgage-Backed Securities | | | 6.0 | |
Electric | | | 5.5 | |
Finance Companies | | | 3.4 | |
Automotive | | | 3.4 | |
Technology | | | 2.6 | |
Other Investments, less than 2% each | | | 17.4 | |
Short-Term Investments | | | 2.0 | |
| | | | |
Total Investments | | | 99.8 | |
Other assets less liabilities (including futures contracts) | | | 0.2 | |
| | | | |
Net Assets | | | 100.0 | % |
| | | | |
See accompanying notes to financial statements.
| 72
Portfolio of Investments – as of September 30, 2022
Loomis Sayles Limited Term Government and Agency Fund
| | | | | | | | |
Principal Amount | | | Description | | Value (†) | |
| | Bonds and Notes — 95.8% of Net Assets | |
| | | | ABS Car Loan — 3.1% | |
| $ | 137,901 | | | AmeriCredit Automobile Receivables Trust, Series 2020-2, Class A3, 0.660%, 12/18/2024 | | $ | 137,044 | |
| | 3,220,000 | | | Avis Budget Rental Car Funding AESOP LLC, Series 2022-1A, Class A, 3.830%, 8/21/2028, 144A | | | 3,046,893 | |
| | 526,545 | | | CarMax Auto Owner Trust, Series 2020-2, Class A3, 1.700%, 11/15/2024 | | | 523,524 | |
| | 1,865,000 | | | Carvana Auto Receivables Trust, Series 2021-N2, Class A2, 0.970%, 3/10/2028 | | | 1,726,029 | |
| | 9,695,000 | | | Credit Acceptance Auto Loan Trust, Series 2020-3A, Class A, 1.240%, 10/15/2029, 144A | | | 9,415,886 | |
| | 65,124 | | | Flagship Credit Auto Trust, Series 2020-3, Class A, 0.700%, 4/15/2025, 144A | | | 64,954 | |
| | 198,658 | | | Ford Credit Auto Owner Trust, Series 2020-A, Class A3, 1.040%, 8/15/2024 | | | 196,502 | |
| | 103,538 | | | GM Financial Consumer Automobile Receivables Trust, Series 2019-3, Class A3, 2.180%, 4/16/2024 | | | 103,434 | |
| | 146,257 | | | GM Financial Consumer Automobile Receivables Trust, Series 2019-4, Class A3, 1.750%, 7/16/2024 | | | 145,773 | |
| | 289,055 | | | GM Financial Consumer Automobile Receivables Trust, Series 2020-1, Class A3, 1.840%, 9/16/2024 | | | 287,385 | |
| | 197,990 | | | GM Financial Consumer Automobile Receivables Trust, Series 2020-2, Class A3, 1.490%, 12/16/2024 | | | 196,004 | |
| | 655,000 | | | GM Financial Revolving Receivables Trust, Series 2021-1, Class A, 1.170%, 6/12/2034, 144A | | | 566,493 | |
| | 149,124 | | | Honda Auto Receivables Owner Trust, Series 2020-1, Class A3, 1.610%, 4/22/2024 | | | 147,868 | |
| | 307,038 | | | Hyundai Auto Receivables Trust, Series 2020-A, Class A3, 1.410%, 11/15/2024 | | | 303,392 | |
| | 823,599 | | | Nissan Auto Receivables Owner Trust, Series 2020-A, Class A3, 1.380%, 12/16/2024 | | | 814,191 | |
| | 620,000 | | | PenFed Auto Receivables Owner Trust, Series 2022-A, Class A4, 4.180%, 12/15/2028, 144A | | | 609,678 | |
| | 29,668 | | | Santander Consumer Auto Receivables Trust, Series 2020-AA, Class A, 1.370%, 10/15/2024, 144A | | | 29,659 | |
| | 765,000 | | | Toyota Auto Loan Extended Note Trust, Series 2020-1A, Class A, 1.350%, 5/25/2033, 144A | | | 695,706 | |
| | 4,365,000 | | | Toyota Auto Loan Extended Note Trust, Series 2022-1A, Class A, 3.820%, 4/25/2035, 144A | | | 4,184,047 | |
| | 147,776 | | | Toyota Auto Receivables Owner Trust, Series 2020-A, Class A3, 1.660%, 5/15/2024 | | | 146,815 | |
| | 284,115 | | | Toyota Auto Receivables Owner Trust, Series 2020-B, Class A3, 1.360%, 8/15/2024 | | | 281,326 | |
| | 33,561 | | | World Omni Auto Receivables Trust, Series 2019-B, Class A3, 2.590%, 7/15/2024 | | | 33,545 | |
| | | | | | | | |
| | | | | | | 23,656,148 | |
| | | | | | | | |
| | | | ABS Other — 0.7% | |
| | 491,294 | | | Chesapeake Funding II LLC, Series 2020-1A, Class A1, 0.870%, 8/15/2032, 144A | | | 485,791 | |
| | 207,924 | | | CNH Equipment Trust, Series 2020-A, Class A3, 1.160%, 6/16/2025 | | | 204,497 | |
| | 201,239 | | | Diamond Resorts Owner Trust, Series 2018-1, Class A, 3.700%, 1/21/2031, 144A | | | 195,958 | |
| | 1,449,889 | | | Donlen Fleet Lease Funding 2 LLC, Series 2021-2, Class A2, 0.560%, 12/11/2034, 144A | | | 1,400,349 | |
| | 675,000 | | | Enterprise Fleet Financing LLC, Series 2022-3, Class A2, 4.380%, 7/20/2029, 144A | | | 665,542 | |
| | 348,077 | | | Kubota Credit Owner Trust, Series 2020-1A, Class A3, 1.960%, 3/15/2024, 144A | | | 345,693 | |
| | 419,634 | | | MVW LLC, Series 2020-1A, Class A, 1.740%, 10/20/2037, 144A | | | 380,474 | |
| | | | ABS Other — continued | |
| $ | 689,236 | | | Sierra Timeshare Receivables Funding LLC, Series 2020-2A, Class A, 1.330%, 7/20/2037, 144A | | $ | 648,314 | |
| | 839,635 | | | Welk Resorts LLC, Series 2019-AA, Class A, 2.800%, 6/15/2038, 144A | | | 795,193 | |
| | | | | | | | |
| | | | | | | 5,121,811 | |
| | | | | | | | |
| | | | ABS Student Loan — 1.0% | |
| | 1,776,114 | | | Navient Private Education Refi Loan Trust, Series 2019-FA, Class A2, 2.600%, 8/15/2068, 144A | | | 1,644,788 | |
| | 554,194 | | | Navient Private Education Refi Loan Trust, Series 2020-DA, Class A, 1.690%, 5/15/2069, 144A | | | 501,213 | |
| | 1,768,380 | | | Navient Private Education Refi Loan Trust, Series 2021-CA, Class A, 1.060%, 10/15/2069, 144A | | | 1,514,170 | |
| | 4,085,970 | | | Navient Private Education Refi Loan Trust, Series 2021-EA, Class A, 0.970%, 12/16/2069, 144A | | | 3,430,899 | |
| | 1,051,548 | | | SMB Private Education Loan Trust, Series 2021-D, Class A1A, 1.340%, 3/17/2053, 144A | | | 924,099 | |
| | 18,064 | | | SoFi Professional Loan Program LLC, Series 2016-D, Class A1, 1-month LIBOR + 0.950%, 4.034%, 1/25/2039, 144A(a) | | | 18,009 | |
| | | | | | | | |
| | | | | | | 8,033,178 | |
| | | | | | | | |
| | | | Agency Commercial Mortgage-Backed Securities — 38.3% | |
| | 3,918,437 | | | Federal Home Loan Mortgage Corp., Series Q016, Class APT1, 1.242%, 5/25/2051(b) | | | 3,508,411 | |
| | 11,380,000 | | | Federal Home Loan Mortgage Corp. Multifamily Structured Pass-Through Certificates, Series K747, Class A2, 2.050%, 11/25/2028(b) | | | 9,830,715 | |
| | 7,165,000 | | | Federal Home Loan Mortgage Corp. Multifamily Structured Pass-Through Certificates, Series KJ37, Class A2, 2.333%, 11/25/2030 | | | 6,272,302 | |
| | 3,244,816 | | | Federal National Mortgage Association, Series 2014-M2, Class A2, 3.513%, 12/25/2023(b) | | | 3,203,355 | |
| | 17,606 | | | Federal National Mortgage Association, Series 2016-M3, Class ASQ2, 2.263%, 2/25/2023 | | | 17,540 | |
| | 2,754,033 | | | Federal National Mortgage Association, Series 2020-M5, Class FA, 1-month LIBOR + 0.460%, 3.024%, 1/25/2027(a) | | | 2,739,781 | |
| | 8,078,171 | | | FHLMC Multifamily Structured Pass Through Certificates, Series KJ20, Class A2, 3.799%, 12/25/2025 | | | 7,894,463 | |
| | 3,552,733 | | | FHLMC Multifamily Structured Pass Through Certificates, Series K-F100, Class AS, 30-day Average SOFR + 0.180%, 2.464%, 1/25/2028(a) | | | 3,487,436 | |
| | 7,900,000 | | | FHLMC Multifamily Structured Pass Through Certificates, Series K034, Class A2, 3.531%, 7/25/2023(b) | | | 7,838,087 | |
| | 7,770,210 | | | FHLMC Multifamily Structured Pass Through Certificates, Series K035, Class A2, 3.458%, 8/25/2023(b) | | | 7,703,152 | |
| | 7,500,000 | | | FHLMC Multifamily Structured Pass Through Certificates, Series K038, Class A2, 3.389%, 3/25/2024 | | | 7,389,389 | |
| | 2,580,000 | | | FHLMC Multifamily Structured Pass Through Certificates, Series K064, Class A2, 3.224%, 3/25/2027 | | | 2,444,085 | |
| | 19,138,779 | | | FHLMC Multifamily Structured Pass Through Certificates, Series K139, Class A1, 2.209%, 10/25/2031 | | | 16,752,244 | |
| | 8,000,000 | | | FHLMC Multifamily Structured Pass Through Certificates, Series KC06, Class A2, 2.541%, 8/25/2026 | | | 7,488,190 | |
See accompanying notes to financial statements.
73 |
Portfolio of Investments – as of September 30, 2022
Loomis Sayles Limited Term Government and Agency Fund – (continued)
| | | | | | | | |
Principal Amount | | | Description | | Value (†) | |
| | | | Agency Commercial Mortgage-Backed Securities — continued | |
| $ | 17,334,308 | | | FHLMC Multifamily Structured Pass Through Certificates, Series KF123, Class AS, 30-day Average SOFR + 0.200%, 2.484%, 9/25/2028(a) | | $ | 17,037,267 | |
| | 297,828 | | | FHLMC Multifamily Structured Pass Through Certificates, Series KF14, Class A, 1-month LIBOR + 0.650%, 3.203%, 1/25/2023(a) | | | 297,830 | |
| | 1,574,605 | | | FHLMC Multifamily Structured Pass Through Certificates, Series KF53, Class A, 1-month LIBOR + 0.390%, 2.943%, 10/25/2025(a) | | | 1,562,720 | |
| | 7,507,707 | | | FHLMC Multifamily Structured Pass Through Certificates, Series KF72, Class A, 1-month LIBOR + 0.500%, 3.053%, 10/25/2026(a) | | | 7,481,405 | |
| | 5,593,638 | | | FHLMC Multifamily Structured Pass Through Certificates, Series KF74, Class AS, 1-month Average Compounded SOFR + 0.530%, 2.815%, 1/25/2027(a) | | | 5,574,033 | |
| | 7,893,174 | | | FHLMC Multifamily Structured Pass Through Certificates, Series KF77, Class AL, 1-month LIBOR + 0.700%, 3.253%, 2/25/2027(a) | | | 7,862,004 | |
| | 10,381,546 | | | FHLMC Multifamily Structured Pass Through Certificates, Series KF77, Class AS, 30-day Average SOFR + 0.900%, 3.184%, 2/25/2027(a) | | | 10,410,490 | |
| | 25,949,920 | | | FHLMC Multifamily Structured Pass Through Certificates, Series KF78, Class AL, 1-month LIBOR + 0.800%, 3.353%, 3/25/2030(a) | | | 25,965,630 | |
| | 25,949,920 | | | FHLMC Multifamily Structured Pass Through Certificates, Series KF78, Class AS, 30-day Average SOFR + 1.000%, 3.284%, 3/25/2030(a) | | | 25,982,682 | |
| | 4,092,689 | | | FHLMC Multifamily Structured Pass Through Certificates, Series KF79, Class AL, 1-month LIBOR + 0.470%, 3.023%, 5/25/2030(a) | | | 4,084,747 | |
| | 3,776,570 | | | FHLMC Multifamily Structured Pass Through Certificates, Series KF79, Class AS, 30-day Average SOFR + 0.580%, 2.864%, 5/25/2030(a) | | | 3,722,244 | |
| | 5,840,698 | | | FHLMC Multifamily Structured Pass Through Certificates, Series KF80, Class AL, 1-month LIBOR + 0.440%, 2.993%, 6/25/2030(a) | | | 5,786,765 | |
| | 3,281,663 | | | FHLMC Multifamily Structured Pass Through Certificates, Series KF80, Class AS, 30-day Average SOFR + 0.510%, 2.794%, 6/25/2030(a) | | | 3,247,123 | |
| | 1,410,131 | | | FHLMC Multifamily Structured Pass Through Certificates, Series KF81, Class AL, 1-month LIBOR + 0.360%, 2.913%, 6/25/2027(a) | | | 1,399,815 | |
| | 1,057,598 | | | FHLMC Multifamily Structured Pass Through Certificates, Series KF81, Class AS, 30-day Average SOFR + 0.400%, 2.684%, 6/25/2027(a) | | | 1,050,698 | |
| | 821,448 | | | FHLMC Multifamily Structured Pass Through Certificates, Series KF84, Class AL, 1-month LIBOR + 0.300%, 2.853%, 7/25/2030(a) | | | 803,880 | |
| | 691,059 | | | FHLMC Multifamily Structured Pass Through Certificates, Series KF84, Class AS, 30-day Average SOFR + 0.320%, 2.604%, 7/25/2030(a) | | | 670,975 | |
| | 326,252 | | | FHLMC Multifamily Structured Pass Through Certificates, Series KF85, Class AL, 1-month LIBOR + 0.300%, 2.853%, 8/25/2030(a) | | | 322,081 | |
| | | | Agency Commercial Mortgage-Backed Securities — continued | |
| $ | 869,712 | | | FHLMC Multifamily Structured Pass Through Certificates, Series KF85, Class AS, 30-day Average SOFR + 0.330%, 2.614%, 8/25/2030(a) | | $ | 856,950 | |
| | 1,019,154 | | | FHLMC Multifamily Structured Pass Through Certificates, Series KF86, Class AL, 1-month LIBOR + 0.290%, 2.843%, 8/25/2027(a) | | | 1,008,439 | |
| | 910,075 | | | FHLMC Multifamily Structured Pass Through Certificates, Series KF86, Class AS, 30-day Average SOFR + 0.320%, 2.604%, 8/25/2027(a) | | | 900,181 | |
| | 9,008,896 | | | FHLMC Multifamily Structured Pass Through Certificates, Series KJ21, Class A2, 3.700%, 9/25/2026 | | | 8,731,030 | |
| | 7,147,037 | | | FHLMC Multifamily Structured Pass Through Certificates, Series KJ26, Class A2, 2.606%, 7/25/2027 | | | 6,730,430 | |
| | 317,894 | | | FHLMC Multifamily Structured Pass Through Certificates, Series KJ28, Class A1, 1.766%, 2/25/2025 | | | 313,132 | |
| | 16,300,000 | | | FHLMC Multifamily Structured Pass Through Certificates, Series KJ42, Class A2, 4.118%, 11/25/2032 | | | 15,647,511 | |
| | 8,515,000 | | | FHLMC Multifamily Structured Pass Through Certificates, Series KS12, Class A, 1-month LIBOR + 0.650%, 3.203%, 8/25/2029(a) | | | 8,484,453 | |
| | 2,855,000 | | | FHLMC Multifamily Structured Pass Through Certificates, Series KS14, Class AL, 1-month LIBOR + 0.340%, 2.893%, 4/25/2030(a) | | | 2,816,675 | |
| | 3,140,000 | | | FHLMC Multifamily Structured Pass Through Certificates, Series KS14, Class AS, 30-day Average SOFR + 0.370%, 2.654%, 4/25/2030(a) | | | 3,063,406 | |
| | 1,372,520 | | | FHLMC Multifamily Structured Pass Through Certificates, Series Q008, Class A, 1-month LIBOR + 0.390%, 2.943%, 10/25/2045(a) | | | 1,365,185 | |
| | 5,200,000 | | | FNMA, 3.580%, 1/01/2026 | | | 5,042,862 | |
| | 15,093,884 | | | Freddie Mac Multifamily Structured Pass Through Certificates, Series K-107, Class AS, 30-day Average SOFR + 0.250%, 2.534%, 3/25/2028(a) | | | 14,890,378 | |
| | 9,073,574 | | | Freddie Mac Multifamily Structured Pass Through Certificates, Series K-F121, Class AS, 30-day Average SOFR + 0.180%, 2.464%, 8/25/2028(a) | | | 8,920,338 | |
| | 675,911 | | | Freddie Mac Multifamily Structured Pass Through Certificates, Series KF93, Class AL, 1-month LIBOR + 0.280%, 2.833%, 10/25/2027(a) | | | 669,839 | |
| | 811,531 | | | Freddie Mac Multifamily Structured Pass Through Certificates, Series KF93, Class AS, 30-day Average SOFR + 0.310%, 2.594%, 10/25/2027(a) | | | 804,939 | |
| | 3,538,588 | | | Freddie Mac Multifamily Structured Pass Through Certificates, Series KF97, Class AS, 30-day Average SOFR + 0.250%, 2.534%, 12/25/2030(a) | | | 3,471,133 | |
| | 1,595,593 | | | Freddie Mac Multifamily Structured Pass Through Certificates, Series Q015, Class A, 30-day Average SOFR + 0.200%, 2.485%, 8/25/2024(a) | | | 1,592,173 | |
| | 94,325 | | | Government National Mortgage Association, Series 2003-72, Class Z, 5.332%, 11/16/2045(b) | | | 92,545 | |
| | | | | | | | |
| | | | | | | 295,233,138 | |
| | | | | | | | |
See accompanying notes to financial statements.
| 74
Portfolio of Investments – as of September 30, 2022
Loomis Sayles Limited Term Government and Agency Fund – (continued)
| | | | | | | | |
Principal Amount | | | Description | | Value (†) | |
| | | | Collateralized Mortgage Obligations — 14.0% | |
| $ | 2,272 | | | Federal Home Loan Mortgage Corp., REMIC, Series 1500, Class FD, 7-year CMT – 0.200%, 2.830%, 5/15/2023(a)(c) | | $ | 2,199 | |
| | 2,516 | | | Federal Home Loan Mortgage Corp., REMIC, Series 1552, Class I, 10-year CMT – 0.650%, 2.220%, 8/15/2023(a)(c) | | | 2,431 | |
| | 52,927 | | | Federal Home Loan Mortgage Corp., REMIC, Series 2131, Class ZB, 6.000%, 3/15/2029(c) | | | 51,619 | |
| | 432,699 | | | Federal Home Loan Mortgage Corp., REMIC, Series 2978, Class JG, 5.500%, 5/15/2035(c) | | | 433,093 | |
| | 628,666 | | | Federal Home Loan Mortgage Corp., REMIC, Series 3036, Class NE, 5.000%, 9/15/2035(c) | | | 626,995 | |
| | 211,140 | | | Federal Home Loan Mortgage Corp., REMIC, Series 3412, Class AY, 5.500%, 2/15/2038(c) | | | 203,288 | |
| | 647,802 | | | Federal Home Loan Mortgage Corp., REMIC, Series 3561, Class W, IO, 2.500%, 6/15/2048(b)(d) | | | 595,409 | |
| | 560,973 | | | Federal Home Loan Mortgage Corp., REMIC, Series 3620, Class AT, IO, 3.823%, 12/15/2036(b)(d) | | | 551,052 | |
| | 98,978 | | | Federal Home Loan Mortgage Corp., REMIC, Series 4212, Class FW, 4.918%, 6/15/2043(b)(c) | | | 86,776 | |
| | 4,602 | | | Federal National Mortgage Association, REMIC, Series 1994-42, Class FD, 10-year CMT – 0.500%, 2.550%, 4/25/2024(a)(c) | | | 4,436 | |
| | 5,773 | | | Federal National Mortgage Association, REMIC, Series 2002-W10, Class A7, 4.152%, 8/25/2042(b)(c) | | | 5,394 | |
| | 611,844 | | | Federal National Mortgage Association, REMIC, Series 2003-48, Class GH, 5.500%, 6/25/2033(c) | | | 618,964 | |
| | 48,969 | | | Federal National Mortgage Association, REMIC, Series 2005-100, Class BQ, 5.500%, 11/25/2025(c) | | | 47,377 | |
| | 308,383 | | | Federal National Mortgage Association, REMIC, Series 2007-73, Class A1, 1-month LIBOR + 0.060%, 2.426%, 7/25/2037(a)(c) | | | 300,080 | |
| | 593,414 | | | Federal National Mortgage Association, REMIC, Series 2008-86, Class LA, 3.442%, 8/25/2038(b) | | | 558,197 | |
| | 1,163,651 | | | Federal National Mortgage Association, REMIC, Series 2012-56, Class FK, 1-month LIBOR + 0.450%, 3.534%, 6/25/2042(a) | | | 1,152,245 | |
| | 1,385,249 | | | Federal National Mortgage Association, REMIC, Series 2012-58, Class KF, 1-month LIBOR + 0.550%, 3.634%, 6/25/2042(a) | | | 1,381,693 | |
| | 3,180,329 | | | Federal National Mortgage Association, REMIC, Series 2012-83, Class LF, 1-month LIBOR + 0.510%, 3.594%, 8/25/2042(a) | | | 3,156,315 | |
| | 1,840,298 | | | Federal National Mortgage Association, REMIC, Series 2013-67, Class NF, 1-month LIBOR + 1.000%, 4.084%, 7/25/2043(a) | | | 1,733,120 | |
| | 3,317,947 | | | Federal National Mortgage Association, REMIC, Series 2015-4, Class BF, 1-month LIBOR + 0.400%, 3.484%, 2/25/2045(a) | | | 3,269,585 | |
| | 5,502,050 | | | Federal National Mortgage Association, REMIC, Series 2020-35, Class FA, 1-month LIBOR + 0.500%, 2.873%, 6/25/2050(a) | | | 5,392,366 | |
| | 5,289 | | | FHLMC Structured Pass Through Securities, Series T-60, Class 2A1, 3.568%, 3/25/2044(b)(c) | | | 4,336 | |
| | 275,715 | | | FHLMC Structured Pass Through Securities, Series T-62, Class 1A1, 12-month MTA + 1.200%, 2.304%, 10/25/2044(a)(c) | | | 286,045 | |
| | 1,011,301 | | | Government National Mortgage Association, Series 2005-18, Class F, 1-month LIBOR + 0.200%, 3.214%, 2/20/2035(a) | | | 1,005,532 | |
| | 758,317 | | | Government National Mortgage Association, Series 2007-59, Class FM, 1-month LIBOR + 0.520%, 3.534%, 10/20/2037(a)(c) | | | 755,767 | |
| | | | Collateralized Mortgage Obligations — continued | |
| 240,919 | | | Government National Mortgage Association, Series 2009-H01, Class FA, 1-month LIBOR + 1.150%, 4.164%, 11/20/2059(a)(c) | | | 240,462 | |
| | 686,969 | | | Government National Mortgage Association, Series 2010-H20, Class AF, 1-month LIBOR + 0.330%, 2.687%, 10/20/2060(a) | | | 680,412 | |
| | 544,509 | | | Government National Mortgage Association, Series 2010-H24, Class FA, 1-month LIBOR + 0.350%, 2.707%, 10/20/2060(a) | | | 538,974 | |
| | 352,251 | | | Government National Mortgage Association, Series 2010-H27, Class FA, 1-month LIBOR + 0.380%, 2.737%, 12/20/2060(a) | | | 348,793 | |
| | 35,185 | | | Government National Mortgage Association, Series 2011- H20, Class FA, 1-month LIBOR + 0.550%, 2.907%, 9/20/2061(a) | | | 34,954 | |
| | 443,766 | | | Government National Mortgage Association, Series 2011-H06, Class FA, 1-month LIBOR + 0.450%, 2.807%, 2/20/2061(a) | | | 440,083 | |
| | 27,013 | | | Government National Mortgage Association, Series 2011-H08, Class FA, 1-month LIBOR + 0.600%, 2.957%, 2/20/2061(a) | | | 26,871 | |
| | 28,890 | | | Government National Mortgage Association, Series 2011-H23, Class HA, 3.000%, 12/20/2061(c) | | | 26,447 | |
| | 26,481 | | | Government National Mortgage Association, Series 2012-124, Class HT, 6.500%, 7/20/2032(b)(c) | | | 25,648 | |
| | 2,317,625 | | | Government National Mortgage Association, Series 2012-18, Class FM, 1-month LIBOR + 0.250%, 3.264%, 9/20/2038(a) | | | 2,309,215 | |
| | 89 | | | Government National Mortgage Association, Series 2012-H15, Class FA, 1-month LIBOR + 0.450%, 2.807%, 5/20/2062(a)(c) | | | 85 | |
| | 325,963 | | | Government National Mortgage Association, Series 2012-H18, Class NA, 1-month LIBOR + 0.520%, 2.877%, 8/20/2062(a) | | | 324,132 | |
| | 1,196,920 | | | Government National Mortgage Association, Series 2012-H20, Class PT, 3.664%, 7/20/2062(b) | | | 1,193,174 | |
| | 16,382 | | | Government National Mortgage Association, Series 2012-H29, Class HF, 1-month LIBOR + 0.500%, 2.857%, 10/20/2062(a)(c) | | | 15,691 | |
| | 27,460 | | | Government National Mortgage Association, Series 2013-H02, Class GF, 1-month LIBOR + 0.500%, 2.857%, 12/20/2062(a)(c) | | | 26,373 | |
| | 1,041,779 | | | Government National Mortgage Association, Series 2013-H08, Class FA, 1-month LIBOR + 0.350%, 2.707%, 3/20/2063(a) | | | 1,033,591 | |
| | 1,056,319 | | | Government National Mortgage Association, Series 2013-H10, Class FA, 1-month LIBOR + 0.400%, 2.757%, 3/20/2063(a) | | | 1,047,144 | |
| | 145,025 | | | Government National Mortgage Association, Series 2013-H14, Class FG, 1-month LIBOR + 0.470%, 2.827%, 5/20/2063(a) | | | 143,862 | |
| | 4,026,948 | | | Government National Mortgage Association, Series 2013-H22, Class FT, 1-year CMT + 0.650%, 3.660%, 4/20/2063(a) | | | 4,016,657 | |
| | 3,166,018 | | | Government National Mortgage Association, Series 2014-H14, Class FA, 1-month LIBOR + 0.500%, 2.298%, 7/20/2064(a) | | | 3,135,720 | |
| | 2,595,824 | | | Government National Mortgage Association, Series 2014-H15, Class FA, 1-month LIBOR + 0.500%, 2.857%, 7/20/2064(a) | | | 2,568,784 | |
| | 1,821,559 | | | Government National Mortgage Association, Series 2015-H04, Class FL, 1-month LIBOR + 0.470%, 2.827%, 2/20/2065(a) | | | 1,803,891 | |
See accompanying notes to financial statements.
75 |
Portfolio of Investments – as of September 30, 2022
Loomis Sayles Limited Term Government and Agency Fund – (continued)
| | | | | | | | |
Principal Amount | | | Description | | Value (†) | |
| | | | Collateralized Mortgage Obligations — continued | |
| $ | 3,428 | | | Government National Mortgage Association, Series 2015-H05, Class FA, 1-month LIBOR + 0.300%, 2.657%, 4/20/2061(a)(c) | | $ | 3,297 | |
| | 5,990 | | | Government National Mortgage Association, Series 2015-H09, Class HA, 1.750%, 3/20/2065(c) | | | 5,383 | |
| | 236,268 | | | Government National Mortgage Association, Series 2015-H10, Class FC, 1-month LIBOR + 0.480%, 2.837%, 4/20/2065(a) | | | 233,848 | |
| | 3,627,332 | | | Government National Mortgage Association, Series 2015-H10, Class JA, 2.250%, 4/20/2065 | | | 3,506,939 | |
| | 2,785 | | | Government National Mortgage Association, Series 2015-H11, Class FA, 1-month LIBOR + 0.250%, 2.607%, 4/20/2065(a)(c) | | | 2,668 | |
| | 2,148,484 | | | Government National Mortgage Association, Series 2015-H12, Class FL, 1-month LIBOR + 0.230%, 2.587%, 5/20/2065(a) | | | 2,125,234 | |
| | 54,724 | | | Government National Mortgage Association, Series 2015-H19, Class FH, 1-month LIBOR + 0.300%, 2.657%, 7/20/2065(a)(c) | | | 53,856 | |
| | 2,792 | | | Government National Mortgage Association, Series 2015-H29, Class FA, 1-month LIBOR + 0.700%, 3.057%, 10/20/2065(a)(c) | | | 2,686 | |
| | 2,979 | | | Government National Mortgage Association, Series 2015-H30, Class FA, 1-month LIBOR + 0.680%, 3.037%, 8/20/2061(a)(c) | | | 2,857 | |
| | 3,455,886 | | | Government National Mortgage Association, Series 2016-H06, Class FC, 1-month LIBOR + 0.920%, 3.277%, 2/20/2066(a) | | | 3,427,076 | |
| | 982,559 | | | Government National Mortgage Association, Series 2016-H20, Class FB, 1-month LIBOR + 0.550%, 2.907%, 9/20/2066(a) | | | 974,666 | |
| | 2,318,859 | | | Government National Mortgage Association, Series 2017-H05, Class FC, 1-month LIBOR + 0.750%, 3.107%, 2/20/2067(a) | | | 2,300,065 | |
| | 33,912 | | | Government National Mortgage Association, Series 2018-H02, Class FJ, 1-month LIBOR + 0.200%, 2.557%, 10/20/2064(a)(c) | | | 33,547 | |
| | 4,743,525 | | | Government National Mortgage Association, Series 2018-H11, Class FJ, 12-month LIBOR + 0.080%, 2.855%, 6/20/2068(a) | | | 4,610,998 | |
| | 108,858 | | | Government National Mortgage Association, Series 2018-H14, Class FG, 1-month LIBOR + 0.350%, 2.707%, 9/20/2068(a) | | | 107,644 | |
| | 6,857,879 | | | Government National Mortgage Association, Series 2018-H16, Class FA, 1-month LIBOR + 0.420%, 2.777%, 9/20/2068(a) | | | 6,714,246 | |
| | 6,140,983 | | | Government National Mortgage Association, Series 2019-H04, Class NA, 3.500%, 9/20/2068 | | | 5,760,900 | |
| | 2,163,025 | | | Government National Mortgage Association, Series 2019-H13, Class FT, 1-year CMT + 0.450%, 3.460%, 8/20/2069(a) | | | 2,162,021 | |
| | 1,900,285 | | | Government National Mortgage Association, Series 2020-30, Class F, 1-month LIBOR + 0.400%, 2.166%, 4/20/2048(a) | | | 1,853,070 | |
| | 3,641,415 | | | Government National Mortgage Association, Series 2020-53, Class NF, 1-month LIBOR + 0.450%, 2.021%, 5/20/2046(a) | | | 3,474,715 | |
| | 3,697,548 | | | Government National Mortgage Association, Series 2020-H02, Class FG, 1-month LIBOR + 0.600%, 2.957%, 1/20/2070(a) | | | 3,652,906 | |
| | 4,227,922 | | | Government National Mortgage Association, Series 2020-H04, Class FP, 1-month LIBOR + 0.500%, 2.857%, 6/20/2069(a) | | | 4,168,861 | |
| | | | Collateralized Mortgage Obligations — continued | |
| 8,183,179 | | | Government National Mortgage Association, Series 2020-H07, Class FL, 1-month LIBOR + 0.650%, 3.007%, 4/20/2070(a) | | | 8,138,818 | |
| | 8,587,998 | | | Government National Mortgage Association, Series 2020-H10, Class FD, 1-month LIBOR + 0.400%, 2.757%, 5/20/2070(a) | | | 8,533,223 | |
| | 3,573,404 | | | Government National Mortgage Association, Series 2020-HO1, Class FT, 1-year CMT + 0.500%, 0.710%, 1/20/2070(a) | | | 3,559,868 | |
| | | | | | | | |
| | | | | | | 107,614,669 | |
| | | | | | | | |
| | | | Hybrid ARMs — 2.6% | |
| | 152,368 | | | FHLMC, 12-month LIBOR + 1.730%, 2.114%, 4/01/2037(a) | | | 153,766 | |
| | 42,859 | | | FHLMC, 12-month LIBOR + 1.741%, 2.220%, 12/01/2037(a) | | | 42,315 | |
| | 479,509 | | | FHLMC, 1-year CMT + 2.285%, 2.433%, 2/01/2036(a) | | | 489,903 | |
| | 150,439 | | | FHLMC, 12-month LIBOR + 1.903%, 2.453%, 4/01/2037(a) | | | 149,174 | |
| | 85,996 | | | FHLMC, 1-year CMT + 2.250%, 2.497%, 2/01/2035(a) | | | 87,115 | |
| | 281,271 | | | FHLMC, 1-year CMT + 2.245%, 2.573%, 3/01/2036(a) | | | 285,185 | |
| | 789,994 | | | FHLMC, 1-year CMT + 2.261%, 2.585%, 2/01/2036(a) | | | 802,797 | |
| | 65,666 | | | FHLMC, 1-year CMT + 2.470%, 2.595%, 9/01/2038(a) | | | 64,248 | |
| | 222,711 | | | FHLMC, 6-month LIBOR + 1.770%, 2.643%, 6/01/2037(a) | | | 218,034 | |
| | 87,347 | | | FHLMC, 1-year CMT + 2.208%, 2.660%, 9/01/2038(a) | | | 86,040 | |
| | 79,932 | | | FHLMC, 12-month LIBOR + 1.739%, 2.801%, 3/01/2038(a) | | | 79,278 | |
| | 1,437,164 | | | FHLMC, 12-month LIBOR + 1.840%, 2.844%, 1/01/2046(a) | | | 1,446,459 | |
| | 244,259 | | | FHLMC, 1-year CMT + 2.165%, 2.891%, 4/01/2036(a) | | | 240,528 | |
| | 81,885 | | | FHLMC, 12-month LIBOR + 1.790%, 3.057%, 11/01/2038(a) | | | 81,223 | |
| | 1,332,055 | | | FHLMC, 1-year CMT + 2.251%, 3.190%, 3/01/2037(a) | | | 1,359,655 | |
| | 157,815 | | | FHLMC, 12-month LIBOR + 1.935%, 3.245%, 12/01/2034(a) | | | 156,590 | |
| | 654,568 | | | FHLMC, 12-month LIBOR + 1.896%, 3.275%, 9/01/2041(a) | | | 666,823 | |
| | 439,282 | | | FHLMC, 12-month LIBOR + 1.765%, 3.746%, 9/01/2035(a) | | | 445,126 | |
| | 81,620 | | | FHLMC, 12-month LIBOR + 1.698%, 3.751%, 11/01/2038(a) | | | 80,571 | |
| | 293,238 | | | FHLMC, 1-year CMT + 2.247%, 3.917%, 9/01/2038(a) | | | 300,580 | |
| | 313,262 | | | FHLMC, 1-year CMT + 2.220%, 4.144%, 7/01/2033(a) | | | 309,751 | |
| | 818,930 | | | FNMA, 12-month LIBOR + 1.800%, 2.050%, 10/01/2041(a) | | | 832,059 | |
| | 114,557 | | | FNMA, 12-month LIBOR + 1.800%, 2.050%, 12/01/2041(a) | | | 112,931 | |
| | 41,707 | | | FNMA, 12-month LIBOR + 1.754%, 2.089%, 1/01/2037(a) | | | 41,329 | |
| | 181,007 | | | FNMA, 12-month LIBOR + 1.734%, 2.188%, 2/01/2037(a) | | | 179,772 | |
| | 308,509 | | | FNMA, 1-year CMT + 2.185%, 2.310%, 1/01/2036(a) | | | 310,443 | |
| | 30,271 | | | FNMA, 12-month LIBOR + 1.565%, 2.315%, 4/01/2037(a) | | | 29,964 | |
| | 141,017 | | | FNMA, 12-month LIBOR + 1.667%, 2.384%, 10/01/2033(a) | | | 141,645 | |
| | 470,620 | | | FNMA, 12-month LIBOR + 1.820%, 2.445%, 2/01/2047(a) | | | 476,304 | |
| | 88,267 | | | FNMA, 12-month LIBOR + 1.729%, 2.450%, 11/01/2035(a) | | | 90,115 | |
| | 453,762 | | | FNMA, 12-month LIBOR + 1.804%, 2.489%, 3/01/2037(a) | | | 456,146 | |
See accompanying notes to financial statements.
| 76
Portfolio of Investments – as of September 30, 2022
Loomis Sayles Limited Term Government and Agency Fund – (continued)
| | | | | | | | |
Principal Amount | | | Description | | Value (†) | |
| | | | Hybrid ARMs — continued | |
| $ | 97,674 | | | FNMA, 12-month LIBOR + 1.800%, 2.544%, 3/01/2034(a) | | $ | 98,839 | |
| | 139,870 | | | FNMA, 1-year CMT + 2.486%, 2.608%, 5/01/2035(a) | | | 143,991 | |
| | 962,404 | | | FNMA, 1-year CMT + 2.225%, 2.734%, 4/01/2034(a) | | | 974,296 | |
| | 107,460 | | | FNMA, 1-year CMT + 2.199%, 2.739%, 4/01/2034(a) | | | 105,311 | |
| | 472,671 | | | FNMA, 12-month LIBOR + 1.566%, 2.785%, 7/01/2035(a) | | | 478,316 | |
| | 666,820 | | | FNMA, 12-month LIBOR + 1.554%, 2.902%, 4/01/2037(a) | | | 674,797 | |
| | 510,662 | | | FNMA, 12-month LIBOR + 1.712%, 2.926%, 9/01/2037(a) | | | 520,352 | |
| | 251,730 | | | FNMA, 1-year CMT + 2.145%, 2.968%, 6/01/2036(a) | | | 252,989 | |
| | 143,953 | | | FNMA, 1-year CMT + 2.148%, 2.988%, 9/01/2034(a) | | | 147,499 | |
| | 264,728 | | | FNMA, 6-month LIBOR + 1.546%, 2.994%, 7/01/2035(a) | | | 269,747 | |
| | 131,304 | | | FNMA, 12-month LIBOR + 1.688%, 3.024%, 11/01/2036(a) | | | 133,622 | |
| | 278,708 | | | FNMA, 6-month LIBOR + 2.031%, 3.038%, 7/01/2037(a) | | | 282,221 | |
| | 100,142 | | | FNMA, 1-year CMT + 2.185%, 3.068%, 12/01/2034(a) | | | 98,568 | |
| | 47,033 | | | FNMA, 1-year CMT + 2.211%, 3.211%, 4/01/2033(a) | | | 46,431 | |
| | 20,518 | | | FNMA, 12-month LIBOR + 1.806%, 3.293%, 7/01/2041(a) | | | 20,325 | |
| | 844,117 | | | FNMA, 1-year CMT + 2.169%, 3.348%, 12/01/2040(a) | | | 860,744 | |
| | 1,442,931 | | | FNMA, 1-year CMT + 2.205%, 3.354%, 10/01/2034(a) | | | 1,473,476 | |
| | 115,269 | | | FNMA, 1-year CMT + 2.287%, 3.406%, 10/01/2033(a) | | | 114,040 | |
| | 124,960 | | | FNMA, 1-year CMT + 2.500%, 3.479%, 8/01/2036(a) | | | 129,051 | |
| | 888,326 | | | FNMA, 1-year CMT + 2.188%, 3.724%, 11/01/2033(a) | | | 911,260 | |
| | 20,745 | | | FNMA, 6-month LIBOR + 1.460%, 3.737%, 2/01/2037(a) | | | 20,956 | |
| | 393,310 | | | FNMA, 12-month LIBOR + 1.564%, 3.738%, 9/01/2037(a) | | | 395,950 | |
| | 87,812 | | | FNMA, 12-month LIBOR + 1.554%, 3.804%, 8/01/2035(a) | | | 86,745 | |
| | 218,660 | | | FNMA, 12-month LIBOR + 1.639%, 3.889%, 8/01/2038(a) | | | 216,651 | |
| | 195,490 | | | FNMA, 1-year CMT + 2.287%, 3.914%, 6/01/2033(a) | | | 193,680 | |
| | 308,633 | | | FNMA, 12-month LIBOR + 1.669%, 3.919%, 7/01/2038(a) | | | 306,635 | |
| | 295,549 | | | FNMA, 12-month LIBOR + 1.678%, 3.928%, 8/01/2034(a) | | | 292,510 | |
| | 52,446 | | | FNMA, 1-year CMT + 2.145%, 3.934%, 9/01/2036(a) | | | 52,353 | |
| | 366,784 | | | FNMA, 1-year CMT + 2.270%, 4.020%, 6/01/2037(a) | | | 381,932 | |
| | 62,096 | | | FNMA, 12-month LIBOR + 2.473%, 4.223%, 6/01/2035(a) | | | 61,736 | |
| | 135,384 | | | FNMA, 1-year CMT + 2.223%, 4.223%, 8/01/2035(a) | | | 133,342 | |
| | 53,358 | | | FNMA, 1-year CMT + 2.440%, 4.266%, 8/01/2033(a) | | | 52,843 | |
| | | | | | | | |
| | | | | | | 20,147,077 | |
| | | | | | | | |
| | | | Mortgage Related — 1.8% | |
| | 16,624 | | | FHLMC, 3.000%, 10/01/2026 | | | 16,196 | |
| | 127,717 | | | FHLMC, 4.000%, with various maturities from 2024 to 2042(e) | | | 122,224 | |
| | 37,714 | | | FHLMC, 4.500%, with various maturities from 2025 to 2034(e) | | | 36,827 | |
| | 2,644 | | | FHLMC, 5.500%, 10/01/2023 | | | 2,642 | |
| | 119,226 | | | FHLMC, 6.500%, 12/01/2034 | | | 123,845 | |
| | 38 | | | FHLMC, 7.500%, 6/01/2026 | | | 38 | |
| | 80,850 | | | FNMA, 3.000%, 3/01/2042 | | | 72,452 | |
| | | | Mortgage Related — continued | |
| 592,377 | | | FNMA, 5.000%, with various maturities from 2037 to 2038(e) | | | 596,128 | |
| | 195,562 | | | FNMA, 5.500%, with various maturities from 2023 to 2033(e) | | | 196,504 | |
| | 2,050 | | | FNMA, 6.000%, 12/01/2022 | | | 2,047 | |
| | 138,235 | | | FNMA, 6.500%, with various maturities from 2032 to 2037(e) | | | 143,148 | |
| | 30,135 | | | FNMA, 7.500%, with various maturities from 2030 to 2032(e) | | | 30,689 | |
| | 1,442,302 | | | GNMA, 1-month LIBOR + 1.747%, 3.374%, 2/20/2061(a) | | | 1,456,209 | |
| | 992,284 | | | GNMA, 1-month LIBOR + 1.890%, 3.523%, 2/20/2063(a) | | | 1,004,795 | |
| | 716,334 | | | GNMA, 1-month LIBOR + 2.122%, 3.790%, 3/20/2063(a) | | | 728,433 | |
| | 535,882 | | | GNMA, 1-month LIBOR + 2.209%, 3.842%, 5/20/2065(a) | | | 547,064 | |
| | 543,822 | | | GNMA, 1-month LIBOR + 2.248%, 3.881%, 6/20/2065(a) | | | 558,308 | |
| | 489,911 | | | GNMA, 1-month LIBOR + 2.337%, 3.969%, 2/20/2063(a) | | | 498,746 | |
| | 55,863 | | | GNMA, 4.007%, 12/20/2062(b) | | | 55,411 | |
| | 25,205 | | | GNMA, 4.140%, 12/20/2061(b) | | | 24,446 | |
| | 14,029 | | | GNMA, 4.317%, 8/20/2061(b) | | | 13,738 | |
| | 166,370 | | | GNMA, 4.434%, 7/20/2063(b) | | | 163,562 | |
| | 2,274,728 | | | GNMA, 4.457%, 10/20/2065(b) | | | 2,249,082 | |
| | 1,112,001 | | | GNMA, 4.594%, 2/20/2066(b) | | | 1,105,431 | |
| | 1,740,393 | | | GNMA, 4.604%, 3/20/2064(b) | | | 1,734,635 | |
| | 168,727 | | | GNMA, 4.609%, 1/20/2064(b) | | | 167,995 | |
| | 6,860 | | | GNMA, 4.619%, 2/20/2062(b) | | | 6,366 | |
| | 3,050 | | | GNMA, 4.622%, 8/20/2062(b) | | | 3,007 | |
| | 50,310 | | | GNMA, 4.630%, with various maturities from 2062 to 2063(b)(e) | | | 48,843 | |
| | 1,575,317 | | | GNMA, 4.677%, 11/20/2063(b) | | | 1,570,643 | |
| | 592,165 | | | GNMA, 4.700%, with various maturities from 2061 to 2064(b)(e) | | | 587,356 | |
| | 2,108 | | | GNMA, 4.878%, 4/20/2061(b) | | | 2,046 | |
| | 5,464 | | | GNMA, 6.000%, 12/15/2031 | | | 5,819 | |
| | 24,144 | | | GNMA, 6.500%, 5/15/2031 | | | 25,131 | |
| | 22,571 | | | GNMA, 7.000%, 10/15/2028 | | | 22,980 | |
| | | | | | | | |
| | | | | | | 13,922,786 | |
| | | | | | | | |
| | | | Non-Agency Commercial Mortgage-Backed Securities — 3.8% | |
| | 1,595,000 | | | BANK, Series 2020-BN25, Class A5, 2.649%, 1/15/2063 | | | 1,340,148 | |
| | 3,895,000 | | | Barclays Commercial Mortgage Securities Trust, Series 2020-BID, Class A, 1-month LIBOR + 2.140%, 4.958%, 10/15/2037, 144A(a) | | | 3,836,272 | |
| | 1,825,000 | | | BPR Trust, Series 2021-NRD, Class A, 1-month SOFR + 1.525%, 4.447%, 12/15/2023, 144A(a) | | | 1,746,671 | |
| | 4,650,000 | | | BPR Trust, Series 2022-SSP, Class A, 1-month SOFR + 3.000%, 5.845%, 5/15/2039, 144A(a) | | | 4,631,121 | |
| | 1,745,000 | | | CFCRE Commercial Mortgage Trust, Series 2016-C7, Class A3, 3.839%, 12/10/2054 | | | 1,643,510 | |
| | 1,310,000 | | | Commercial Mortgage Pass Through Certificates, Series 2012-LTRT, Class A2, 3.400%, 10/05/2030, 144A | | | 1,231,396 | |
| | 1,488,000 | | | Commercial Mortgage Pass Through Certificates, Series 2014-UBS2, Class A5, 3.961%, 3/10/2047 | | | 1,459,364 | |
| | 2,847,198 | | | Commercial Mortgage Pass Through Certificates, Series 2016-DC2, Class ASB, 3.550%, 2/10/2049 | | | 2,770,885 | |
See accompanying notes to financial statements.
77 |
Portfolio of Investments – as of September 30, 2022
Loomis Sayles Limited Term Government and Agency Fund – (continued)
| | | | | | | | |
Principal Amount | | | Description | | Value (†) | |
| | | | Non-Agency Commercial Mortgage-Backed Securities — continued | |
| $ | 2,570,000 | | | DROP Mortgage Trust, Series 2021-FILE, Class A, 1-month LIBOR + 1.150%, 3.970%, 10/15/2043, 144A(a) | | $ | 2,476,593 | |
| | 2,600,000 | | | Hudsons Bay Simon JV Trust, Series 2015-HB7, Class A7, 3.914%, 8/05/2034, 144A | | | 2,305,825 | |
| | 705,399 | | | Morgan Stanley Bank of America Merrill Lynch Trust, Series 2013-C8, Class A4, 3.134%, 12/15/2048 | | | 703,460 | |
| | 3,295,000 | | | SPGN Mortgage Trust, Series 2022-TFLM. Class A, 1-month SOFR + 1.550%, 4.395%, 2/15/2039, 144A(a) | | | 3,141,734 | |
| | 3,279,464 | | | Starwood Retail Property Trust, Series 2014-STAR, Class A, 1-month LIBOR + 1.470%, 4.288%, 11/15/2027, 144A(a) | | | 2,246,433 | |
| | | | | | | | |
| | | | | | | 29,533,412 | |
| | | | | | | | |
| | | | Treasuries — 30.5% | |
| | 7,425,000 | | | U.S. Treasury Note, 0.375%, 9/30/2027 | | | 6,194,364 | |
| | 41,725,000 | | | U.S. Treasury Note, 0.750%, 8/31/2026 | | | 36,592,499 | |
| | 25,460,000 | | | U.S. Treasury Note, 0.875%, 9/30/2026 | | | 22,397,838 | |
| | 21,410,000 | | | U.S. Treasury Note, 1.250%, 12/31/2026 | | | 19,017,265 | |
| | 8,920,000 | | | U.S. Treasury Note, 1.875%, 2/28/2027 | | | 8,123,472 | |
| | 17,930,000 | | | U.S. Treasury Note, 2.750%, 4/30/2027 | | | 16,920,737 | |
| | 71,120,000 | | | U.S. Treasury Note, 2.750%, 2/15/2028 | | | 66,599,991 | |
| | 11,365,000 | | | U.S. Treasury Note, 2.750%, 8/15/2032 | | | 10,391,872 | |
| | 3,955,000 | | | U.S. Treasury Note, 4.125%, 9/30/2027 | | | 3,967,977 | |
| | 45,290,000 | | | U.S. Treasury Note, 4.250%, 9/30/2024 | | | 45,311,230 | |
| | | | | | | | |
| | | | | | | 235,517,245 | |
| | | | | | | | |
| | | | Total Bonds and Notes
(Identified Cost $774,491,961) | | | 738,779,464 | |
| | | | | | | | |
| | | | | | | | |
| | Short-Term Investments — 4.1% | |
| | 2,293,099 | | | Tri-Party Repurchase Agreement with Fixed Income Clearing Corporation, dated 9/30/2022 at 1.100% to be repurchased at $2,293,309 on 10/03/2022 collateralized by $2,385,000 U.S. Treasury Note, 3.500% due 9/15/2025 valued at $2,338,977 including accrued interest (Note 2 of Notes to Financial Statements) | | | 2,293,099 | |
| | 29,775,000 | | | U.S. Treasury Bills, 2.315%-2.450%, 10/11/2022(f)(g) | | | 29,758,789 | |
| | | | | | | | |
| | | | Total Short-Term Investments
(Identified Cost $32,051,057) | | | 32,051,888 | |
| | | | | | | | |
| | | | | | | | |
| | | | Total Investments — 99.9%
(Identified Cost $806,543,018) | | | 770,831,352 | |
| | | | Other assets less liabilities — 0.1% | | | 663,791 | |
| | | | | | | | |
| | | | Net Assets — 100.0% | | $ | 771,495,143 | |
| | | | | | | | |
| | | | | | | | |
| | (†) | | | See Note 2 of Notes to Financial Statements. | |
| | (a) | | | Variable rate security. Rate as of September 30, 2022 is disclosed. | |
| | (b) | | | Variable rate security. The interest rate adjusts periodically based on; (i) changes in current interest rates and/or prepayments on underlying pools of assets, if applicable, (ii) reference to a base lending rate plus or minus a margin, and/or (iii) reference to a base lending rate adjusted by a multiplier and/or subject to certain floors or caps. Rate as of September 30, 2022 is disclosed. | |
| | (c) | | | Level 3 security. Value has been determined using significant unobservable inputs. See Note 3 of Notes to Financial Statements. | |
| | | | | | | | |
| |
| | (d) | | | Interest only security. Security represents right to receive monthly interest payments on an underlying pool of mortgages. Principal shown is the outstanding par amount of the pool held as of the end of the period. | |
| | (e) | | | The Fund’s investment in mortgage related securities of Federal Home Loan Mortgage Corporation, Federal National Mortgage Association and Government National Mortgage Association are interests in separate pools of mortgages. All separate investments in securities of each issuer which have the same coupon rate have been aggregated for the purpose of presentation in the Portfolio of Investments. | |
| | (f) | | | Interest rate represents discount rate at time of purchase; not a coupon rate. | |
| | (g) | | | The Fund’s investment in U.S. Government/Agency securities is comprised of various lots with differing discount rates. These separate investments, which have the same maturity date, have been aggregated for the purpose of presentation in the Portfolio of Investments. | |
| | | | | |
| | 144A | | | All or a portion of these securities are exempt from registration under Rule 144A of the Securities Act of 1933. These securities may be resold in transactions exempt from registration, normally to qualified institutional buyers. At September 30, 2022, the value of Rule 144A holdings amounted to $53,179,853 or 6.9% of net assets. | |
| | ABS | | | Asset-Backed Securities | |
| | ARMs | | | Adjustable Rate Mortgages | |
| | CMT | | | Constant Maturity Treasury | |
| | FHLMC | | | Federal Home Loan Mortgage Corp. | |
| | FNMA | | | Federal National Mortgage Association | |
| | GNMA | | | Government National Mortgage Association | |
| | LIBOR | | | London Interbank Offered Rate | |
| | MTA | | | Monthly Treasury Average Interest | |
| | REMIC | | | Real Estate Mortgage Investment Conduit | |
| | SOFR | | | Secured Overnight Financing Rate | |
Industry Summary at September 30, 2022
| | | | |
Agency Commercial Mortgage-Backed Securities | | | 38.3 | % |
Treasuries | | | 30.5 | |
Collateralized Mortgage Obligations | | | 14.0 | |
Non-Agency Commercial Mortgage-Backed Securities | | | 3.8 | |
ABS Car Loan | | | 3.1 | |
Hybrid ARMs | | | 2.6 | |
Other Investments, less than 2% each | | | 3.5 | |
Short-Term Investments | | | 4.1 | |
| | | | |
Total Investments | | | 99.9 | |
Other assets less liabilities | | | 0.1 | |
| | | | |
Net Assets | | | 100.0 | % |
| | | | |
See accompanying notes to financial statements.
| 78
Statements of Assets and Liabilities
September 30, 2022
| | | | | | | | | | | | |
| | | Core Plus Bond
Fund | | | Credit Income
Fund | | | Global
Allocation Fund | |
ASSETS | | | | | | | | | | | | |
Investments at cost | | $ | 6,753,613,336 | | | $ | 24,438,425 | | | $ | 3,240,104,544 | |
Net unrealized depreciation | | | (910,582,848 | ) | | | (4,104,362 | ) | | | (294,396,189 | ) |
| | | | | | | | | | | | |
Investments at value | | | 5,843,030,488 | | | | 20,334,063 | | | | 2,945,708,355 | |
Cash | | | 2,626,054 | | | | 1,240 | | | | 365 | |
Due from brokers (Note 2) | | | 8,300,000 | | | | 25,000 | | | | 4,766,726 | |
Foreign currency at value (identified cost $0, $0 and $4,022,662, respectively) | | | — | | | | — | | | | 3,894,539 | |
Receivable for Fund shares sold | | | 8,968,496 | | | | — | | | | 2,246,026 | |
Receivable from investment adviser (Note 6) | | | — | | | | 7,657 | | | | — | |
Receivable for securities sold | | | 222,797,920 | | | | — | | | | 13,828,151 | |
Collateral received for open forward foreign currency contracts (Notes 2 and 4) | | | — | | | | — | | | | 120,000 | |
Dividends and interest receivable | | | 44,918,335 | | | | 204,184 | | | | 10,223,879 | |
Unrealized appreciation on forward foreign currency contracts (Note 2) | | | — | | | | — | | | | 2,209,051 | |
Tax reclaims receivable | | | — | | | | — | | | | 421,934 | |
Prepaid expenses (Note 8) | | | 795 | | | | 3 | | | | 478 | |
| | | | | | | | | | | | |
TOTAL ASSETS | | | 6,130,642,088 | | | | 20,572,147 | | | | 2,983,419,504 | |
| | | | | | | | | | | | |
LIABILITIES | | | | | | | | | | | | |
Payable for securities purchased | | | 194,192,874 | | | | 39,399 | | | | 5,694,356 | |
Payable for Fund shares redeemed | | | 20,289,788 | | | | — | | | | 7,553,457 | |
Unrealized depreciation on forward foreign currency contracts (Note 2) | | | — | | | | — | | | | 5,597,291 | |
Foreign taxes payable (Note 2) | | | — | | | | — | | | | 42,238 | |
Due to brokers (Note 2) | | | — | | | | — | | | | 120,000 | |
Payable for variation margin on futures contracts (Note 2) | | | 1,641,428 | | | | 4,500 | | | | 255,704 | |
Management fees payable (Note 6) | | | 1,575,451 | | | | — | | | | 1,966,348 | |
Deferred Trustees’ fees (Note 6) | | | 791,783 | | | | 5,392 | | | | 357,843 | |
Administrative fees payable (Note 6) | | | 232,042 | | | | 797 | | | | 122,126 | |
Payable to distributor (Note 6d) | | | 59,307 | | | | 1 | | | | 53,123 | |
Audit and tax services fees payable | | | 60,912 | | | | 68,386 | | | | 62,918 | |
Other accounts payable and accrued expenses | | | 405,025 | | | | 2,271 | | | | 287,813 | |
| | | | | | | | | | | | |
TOTAL LIABILITIES | | | 219,248,610 | | | | 120,746 | | | | 22,113,217 | |
| | | | | | | | | | | | |
NET ASSETS | | $ | 5,911,393,478 | | | $ | 20,451,401 | | | $ | 2,961,306,287 | |
| | | | | | | | | | | | |
NET ASSETS CONSIST OF: | | | | | | | | | | | | |
Paid-in capital | | $ | 7,166,194,154 | | | $ | 24,573,182 | | | $ | 3,053,267,894 | |
Accumulated loss | | | (1,254,800,676 | ) | | | (4,121,781 | ) | | | (91,961,607 | ) |
| | | | | | | | | | | | |
NET ASSETS | | $ | 5,911,393,478 | | | $ | 20,451,401 | | | $ | 2,961,306,287 | |
| | | | | | | | | | | | |
COMPUTATION OF NET ASSET VALUE AND OFFERING PRICE: | | | | | | | | | | | | |
Class A shares: | | | | | | | | | | | | |
Net assets | | $ | 428,825,437 | | | $ | 175,280 | | | $ | 482,030,976 | |
| | | | | | | | | | | | |
Shares of beneficial interest | | | 38,295,691 | | | | 21,085 | | | | 24,178,882 | |
| | | | | | | | | | | | |
Net asset value and redemption price per share | | $ | 11.20 | | | $ | 8.31 | | | $ | 19.94 | |
| | | | | | | | | | | | |
Offering price per share (100/[100-maximum sales charge] of net asset value) (Note 1) | | $ | 11.70 | | | $ | 8.68 | | | $ | 21.16 | |
| | | | | | | | | | | | |
Class C shares: (redemption price per share is equal to net asset value less any applicable contingent deferred sales charge) (Note 1) | | | | | | | | | | | | |
Net assets | | $ | 48,678,503 | | | $ | 869 | | | $ | 302,501,011 | |
| | | | | | | | | | | | |
Shares of beneficial interest | | | 4,343,551 | | | | 105 | | | | 15,637,926 | |
| | | | | | | | | | | | |
Net asset value and offering price per share | | $ | 11.21 | | | $ | 8.30 | * | | $ | 19.34 | |
| | | | | | | | | | | | |
Class N shares: | | | | | | | | | | | | |
Net assets | | $ | 1,890,793,347 | | | $ | 20,228,810 | | | $ | 243,861,731 | |
| | | | | | | | | | | | |
Shares of beneficial interest | | | 167,246,947 | | | | 2,434,178 | | | | 12,105,708 | |
| | | | | | | | | | | | |
Net asset value, offering and redemption price per share | | $ | 11.31 | | | $ | 8.31 | | | $ | 20.14 | |
| | | | | | | | | | | | |
Class Y shares: | | | | | | | | | | | | |
Net assets | | $ | 3,543,096,191 | | | $ | 46,442 | | | $ | 1,932,912,569 | |
| | | | | | | | | | | | |
Shares of beneficial interest | | | 313,593,773 | | | | 5,589 | | | | 95,972,302 | |
| | | | | | | | | | | | |
Net asset value, offering and redemption price per share | | $ | 11.30 | | | $ | 8.31 | | | $ | 20.14 | |
| | | | | | | | | | | | |
| * | Net asset value calculations have been determined utilizing fractional share and penny amounts. |
See accompanying notes to financial statements.
79 |
Statements of Assets and Liabilities (continued)
September 30, 2022
| | | | | | | | | | | | |
| | | Growth Fund | | | Intermediate
Duration Bond
Fund | | | Limited Term
Government
and Agency
Fund | |
ASSETS | | | | | | | | | | | | |
Investments at cost | | $ | 7,724,227,643 | | | $ | 314,752,587 | | | $ | 806,543,018 | |
Net unrealized appreciation (depreciation) | | | 1,779,653,921 | | | | (22,251,529 | ) | | | (35,711,666 | ) |
| | | | | | | | | | | | |
Investments at value | | | 9,503,881,564 | | | | 292,501,058 | | | | 770,831,352 | |
Cash | | | — | | | | 69 | | | | 63 | |
Due from brokers (Note 2) | | | — | | | | 475,000 | | | | — | |
Receivable for Fund shares sold | | | 27,028,448 | | | | 356,283 | | | | 1,106,442 | |
Receivable for securities sold | | | — | | | | 1,353,374 | | | | 20,089,702 | |
Dividends and interest receivable | | | 596,148 | | | | 1,775,714 | | | | 1,579,815 | |
Tax reclaims receivable | | | 5,854,326 | | | | 2,965 | | | | — | |
Prepaid expenses (Note 8) | | | 1,386 | | | | 37 | | | | 101 | |
| | | | | | | | | | | | |
TOTAL ASSETS | | | 9,537,361,872 | | | | 296,464,500 | | | | 793,607,475 | |
| | | | | | | | | | | | |
LIABILITIES | | | | | | | | | | | | |
Payable for securities purchased | | | — | | | | 2,875,005 | | | | 20,319,032 | |
Payable for Fund shares redeemed | | | 43,473,022 | | | | 262,289 | | | | 742,343 | |
Payable for variation margin on futures contracts (Note 2) | | | — | | | | 79,822 | | | | — | |
Distributions payable | | | — | | | | — | | | | 260,189 | |
Management fees payable (Note 6) | | | 4,246,391 | | | | 42,914 | | | | 177,616 | |
Deferred Trustees’ fees (Note 6) | | | 743,523 | | | | 141,898 | | | | 405,421 | |
Administrative fees payable (Note 6) | | | 391,601 | | | | 11,548 | | | | 30,411 | |
Payable to distributor (Note 6d) | | | 89,583 | | | | 2,325 | | | | 13,252 | |
Audit and tax services fees payable | | | 48,471 | | | | 57,904 | | | | 62,456 | |
Other accounts payable and accrued expenses | | | 673,557 | | | | 27,132 | | | | 101,612 | |
| | | | | | | | | | | | |
TOTAL LIABILITIES | | | 49,666,148 | | | | 3,500,837 | | | | 22,112,332 | |
| | | | | | | | | | | | |
NET ASSETS | | $ | 9,487,695,724 | | | $ | 292,963,663 | | | $ | 771,495,143 | |
| | | | | | | | | | | | |
NET ASSETS CONSIST OF: | | | | | | | | | | | | |
Paid-in capital | | $ | 6,501,830,885 | | | $ | 336,485,275 | | | $ | 860,567,714 | |
Accumulated earnings (loss) | | | 2,985,864,839 | | | | (43,521,612 | ) | | | (89,072,571 | ) |
| | | | | | | | | | | | |
NET ASSETS | | $ | 9,487,695,724 | | | $ | 292,963,663 | | | $ | 771,495,143 | |
| | | | | | | | | | | | |
COMPUTATION OF NET ASSET VALUE AND OFFERING PRICE: | | | | | | | | | | | | |
Class A shares: | | | | | | | | | | | | |
Net assets | | $ | 1,164,115,560 | | | $ | 18,077,056 | | | $ | 246,532,128 | |
| | | | | | | | | | | | |
Shares of beneficial interest | | | 70,770,956 | | | | 1,958,702 | | | | 23,145,253 | |
| | | | | | | | | | | | |
Net asset value and redemption price per share | | $ | 16.45 | | | $ | 9.23 | | | $ | 10.65 | |
| | | | | | | | | | | | |
Offering price per share (100/[100-maximum sales charge] of net asset value) (Note 1) | | $ | 17.45 | | | $ | 9.64 | | | $ | 10.90 | |
| | | | | | | | | | | | |
Class C shares: (redemption price per share is equal to net asset value less any applicable contingent deferred sales charge) (Note 1) | | | | | | | | | | | | |
Net assets | | $ | 65,976,578 | | | $ | 174,030 | | | $ | 14,144,764 | |
| | | | | | | | | | | | |
Shares of beneficial interest | | | 4,573,999 | | | | 18,781 | | | | 1,331,286 | |
| | | | | | | | | | | | |
Net asset value and offering price per share | | $ | 14.42 | | | $ | 9.27 | | | $ | 10.62 | |
| | | | | | | | | | | | |
Class N shares: | | | | | | | | | | | | |
Net assets | | $ | 663,000,518 | | | $ | 19,294,301 | | | $ | 19,656,357 | |
| | | | | | | | | | | | |
Shares of beneficial interest | | | 37,095,812 | | | | 2,092,396 | | | | 1,840,520 | |
| | | | | | | | | | | | |
Net asset value, offering and redemption price per share | | $ | 17.87 | | | $ | 9.22 | | | $ | 10.68 | |
| | | | | | | | | | | | |
Class Y shares: | | | | | | | | | | | | |
Net assets | | $ | 7,594,603,068 | | | $ | 255,418,276 | | | $ | 491,161,894 | |
| | | | | | | | | | | | |
Shares of beneficial interest | | | 425,314,607 | | | | 27,686,594 | | | | 45,966,094 | |
| | | | | | | | | | | | |
Net asset value, offering and redemption price per share | | $ | 17.86 | | | $ | 9.23 | | | $ | 10.69 | |
| | | | | | | | | | | | |
See accompanying notes to financial statements.
| 80
Statements of Operations
For the Year Ended September 30, 2022
| | | | | | | | | | | | |
| | | Core Plus Bond
Fund | | | Credit Income
Fund | | | Global
Allocation Fund | |
INVESTMENT INCOME | | | | | | | | | | | | |
Interest | | $ | 210,277,484 | | | $ | 723,261 | | | $ | 45,510,780 | |
Dividends | | | — | | | | 28,259 | | | | 25,668,899 | |
Less net foreign taxes withheld | | | — | | | | — | | | | (1,076,779 | ) |
| | | | | | | | | | | | |
| | | 210,277,484 | | | | 751,520 | | | | 70,102,900 | |
| | | | | | | | | | | | |
Expenses | | | | | | | | | | | | |
Management fees (Note 6) | | | 23,767,446 | | | | 96,549 | | | | 31,131,971 | |
Service and distribution fees (Note 6) | | | 2,184,202 | | | | 272 | | | | 5,910,914 | |
Administrative fees (Note 6) | | | 3,265,761 | | | | 10,145 | | | | 1,860,255 | |
Trustees’ fees and expenses (Note 6) | | | 216,171 | | | | 12,490 | | | | 127,869 | |
Trustees’ fees deferred compensation (Note 6) | | | (111,172 | ) | | | 2,441 | | | | (42,781 | ) |
Transfer agent fees and expenses (Notes 6 and 7) | | | 5,478,136 | | | | 3,958 | | | | 3,157,302 | |
Audit and tax services fees | | | 57,614 | | | | 66,360 | | | | 63,458 | |
Custodian fees and expenses | | | 277,586 | | | | 8,074 | | | | 337,807 | |
Legal fees (Note 8) | | | 229,962 | | | | 699 | | | | 138,499 | |
Registration fees | | | 143,416 | | | | 67,032 | | | | 117,903 | |
Shareholder reporting expenses | | | 351,406 | | | | 5,825 | | | | 241,938 | |
Miscellaneous expenses | | | 238,053 | | | | 27,212 | | | | 172,402 | |
| | | | | | | | | | | | |
Total expenses | | | 36,098,581 | | | | 301,057 | | | | 43,217,537 | |
Less waiver and/or expense reimbursement (Note 6) | | | (206,650 | ) | | | (181,170 | ) | | | — | |
| | | | | | | | | | | | |
Net expenses | | | 35,891,931 | | | | 119,887 | | | | 43,217,537 | |
| | | | | | | | | | | | |
Net investment income | | | 174,385,553 | | | | 631,633 | | | | 26,885,363 | |
| | | | | | | | | | | | |
NET REALIZED AND UNREALIZED GAIN (LOSS) ON INVESTMENTS, FUTURES CONTRACTS, SHORT SALES, SWAP AGREEMENTS, FORWARD FOREIGN CURRENCY CONTRACTS AND FOREIGN CURRENCY TRANSACTIONS | | | | | | | | | | | | |
Net realized gain (loss) on: | | | | | | | | | | | | |
Investments | | | (272,059,962 | ) | | | (31,665 | ) | | | 259,590,341 | |
Futures contracts | | | (7,112,236 | ) | | | 293,058 | | | | (315,243 | ) |
Short sales | | | 1,888,412 | | | | — | | | | — | |
Swap agreements | | | — | | | | 5,371 | | | | 127,433 | |
Forward foreign currency contracts (Note 2e) | | | — | | | | — | | | | (52,272,395 | ) |
Foreign currency transactions (Note 2d) | | | 48,829 | | | | — | | | | (1,372,180 | ) |
Net change in unrealized appreciation (depreciation) on: | | | | | | | | | | | | |
Investments | | | (1,044,004,098 | ) | | | (4,664,434 | ) | | | (1,369,676,354 | ) |
Futures contracts | | | (14,563,241 | ) | | | (57,368 | ) | | | (2,901,289 | ) |
Forward foreign currency contracts (Note 2e) | | | — | | | | — | | | | 1,334,625 | |
Foreign currency translations (Note 2d) | | | (3,433 | ) | | | — | | | | 103,575 | |
| | | | | | | | | | | | |
Net realized and unrealized loss on investments, futures contracts, short sales, swap agreements, forward foreign currency contracts and foreign currency transactions | | | (1,335,805,729 | ) | | | (4,455,038 | ) | | | (1,165,381,487 | ) |
| | | | | | | | | | | | |
NET DECREASE IN NET ASSETS RESULTING FROM OPERATIONS | | $ | (1,161,420,176 | ) | | $ | (3,823,405 | ) | | $ | (1,138,496,124 | ) |
| | | | | | | | | | | | |
See accompanying notes to financial statements.
81 |
Statements of Operations (continued)
For the Year Ended September 30, 2022
| | | | | | | | | | | | |
| | | Growth Fund | | | Intermediate
Duration Bond
Fund | | | Limited Term
Government
and Agency
Fund | |
INVESTMENT INCOME | | | | | | | | | | | | |
Interest | | $ | 174,229 | | | $ | 7,370,382 | | | $ | 12,390,131 | |
Dividends | | | 76,324,181 | | | | — | | | | — | |
Less net foreign taxes withheld | | | (2,765,680 | ) | | | — | | | | — | |
| | | | | | | | | | | | |
| | | 73,732,730 | | | | 7,370,382 | | | | 12,390,131 | |
| | | | | | | | | | | | |
Expenses | | | | | | | | | | | | |
Management fees (Note 6) | | | 61,919,222 | | | | 874,113 | | | | 2,919,401 | |
Service and distribution fees (Note 6) | | | 4,835,421 | | | | 54,733 | | | | 846,386 | |
Administrative fees (Note 6) | | | 5,454,700 | | | | 154,230 | | | | 411,358 | |
Trustees’ fees and expenses (Note 6) | | | 352,527 | | | | 21,426 | | | | 37,842 | |
Trustees’ fees deferred compensation (Note 6) | | | (65,470 | ) | | | (24,584 | ) | | | (77,294 | ) |
Transfer agent fees and expenses (Notes 6 and 7) | | | 9,651,608 | | | | 233,862 | | | | 774,084 | |
Audit and tax services fees | | | 66,981 | | | | 55,832 | | | | 60,297 | |
Custodian fees and expenses | | | 558,555 | | | | 26,172 | | | | 42,302 | |
Legal fees (Note 8) | | | 399,159 | | | | 11,008 | | | | 29,186 | |
Registration fees | | | 304,857 | | | | 85,133 | | | | 110,948 | |
Shareholder reporting expenses | | | 667,685 | | | | 35,462 | | | | 70,554 | |
Miscellaneous expenses | | | 418,114 | | | | 35,781 | | | | 56,948 | |
| | | | | | | | | | | | |
Total expenses | | | 84,563,359 | | | | 1,563,168 | | | | 5,282,012 | |
Less waiver and/or expense reimbursement (Note 6) | | | — | | | | (119,658 | ) | | | (244,804 | ) |
| | | | | | | | | | | | |
Net expenses | | | 84,563,359 | | | | 1,443,510 | | | | 5,037,208 | |
| | | | | | | | | | | | |
Net investment income (loss) | | | (10,830,629 | ) | | | 5,926,872 | | | | 7,352,923 | |
| | | | | | | | | | | | |
NET REALIZED AND UNREALIZED GAIN (LOSS) ON INVESTMENTS, FUTURES CONTRACTS AND FOREIGN CURRENCY TRANSACTIONS | | | | | | | | | | | | |
Net realized gain (loss) on: | | | | | | | | | | | | |
Investments | | | 1,235,669,337 | | | | (18,098,631 | ) | | | (21,343,422 | ) |
Futures contracts | | | — | | | | (1,596,732 | ) | | | — | |
Net change in unrealized appreciation (depreciation) on: | | | | | | | | | | | | |
Investments | | | (4,804,674,396 | ) | | | (23,620,839 | ) | | | (38,167,377 | ) |
Futures contracts | | | — | | | | (1,274,989 | ) | | | — | |
Foreign currency translations (Note 2d) | | | (309,904 | ) | | | — | | | | — | |
| | | | | | | | | | | | |
Net realized and unrealized loss on investments, futures contracts and foreign currency transactions | | | (3,569,314,963 | ) | | | (44,591,191 | ) | | | (59,510,799 | ) |
| | | | | | | | | | | | |
NET DECREASE IN NET ASSETS RESULTING FROM OPERATIONS | | $ | (3,580,145,592 | ) | | $ | (38,664,319 | ) | | $ | (52,157,876 | ) |
| | | | | | | | | | | | |
See accompanying notes to financial statements.
| 82
Statements of Changes in Net Assets
| | | | | | | | | | | | | | | | |
| | | Core Plus Bond Fund | | | Credit Income Fund | |
| | | Year Ended
September 30,
2022 | | | Year Ended
September 30,
2021 | | | Year Ended
September 30,
2022 | | | Year Ended
September 30,
2021 | |
FROM OPERATIONS: | | | | | | | | | | | | | | | | |
Net investment income | | $ | 174,385,553 | | | $ | 163,972,599 | | | $ | 631,633 | | | $ | 616,673 | |
Net realized gain (loss) on investments, futures contracts, short sales, swap agreements and foreign currency transactions | | | (277,234,957 | ) | | | 116,923,272 | | | | 266,764 | | | | 91,677 | |
Net change in unrealized appreciation (depreciation) on investments, futures contracts and foreign currency translations | | | (1,058,570,772 | ) | | | (226,524,491 | ) | | | (4,721,802 | ) | | | 680,884 | |
| | | | | | | | | | | | | | | | |
Net increase (decrease) in net assets resulting from operations | | | (1,161,420,176 | ) | | | 54,371,380 | | | | (3,823,405 | ) | | | 1,389,234 | |
| | | | | | | | | | | | | | | | |
FROM DISTRIBUTIONS TO SHAREHOLDERS: | | | | | | | | | | | | | | | | |
Class A | | | (16,005,020 | ) | | | (26,989,208 | ) | | | (3,571 | ) | | | (2,194 | ) |
Class C | | | (1,420,755 | ) | | | (4,109,684 | ) | | | (25 | ) | | | (20 | ) |
Class N | | | (68,723,627 | ) | | | (114,300,522 | ) | | | (818,127 | ) | | | (776,415 | ) |
Class Y | | | (135,179,006 | ) | | | (253,871,577 | ) | | | (1,898 | ) | | | (642 | ) |
| | | | | | | | | | | | | | | | |
Total distributions | | | (221,328,408 | ) | | | (399,270,991 | ) | | | (823,621 | ) | | | (779,271 | ) |
| | | | | | | | | | | | | | | | |
NET INCREASE (DECREASE) IN NET ASSETS FROM
CAPITAL SHARE TRANSACTIONS (NOTE 11) | | | (1,555,408,285 | ) | | | (84,293,745 | ) | | | 142,887 | | | | (572,703 | ) |
| | | | | | | | | | | | | | | | |
Net increase (decrease) in net assets | | | (2,938,156,869 | ) | | | (429,193,356 | ) | | | (4,504,139 | ) | | | 37,260 | |
NET ASSETS | | | | | | | | | | | | | | | | |
Beginning of the year | | | 8,849,550,347 | | | | 9,278,743,703 | | | | 24,955,540 | | | | 24,918,280 | |
| | | | | | | | | | | | | | | | |
End of the year | | $ | 5,911,393,478 | | | $ | 8,849,550,347 | | | $ | 20,451,401 | | | $ | 24,955,540 | |
| | | | | | | | | | | | | | | | |
See accompanying notes to financial statements.
83 |
Statements of Changes in Net Assets (continued)
| | | | | | | | | | | | | | | | |
| | | Global Allocation Fund | | | Growth Fund | |
| | | Year Ended
September 30,
2022 | | | Year Ended
September 30,
2021 | | | Year Ended
September 30,
2022 | | | Year Ended
September 30,
2021 | |
FROM OPERATIONS: | |
Net investment income (loss) | | $ | 26,885,363 | | | $ | 15,287,268 | | | $ | (10,830,629 | ) | | $ | (1,879,895 | ) |
Net realized gain on investments, futures contracts, swap agreements, forward foreign currency contracts and foreign currency transactions | | | 205,757,956 | | | | 369,056,675 | | | | 1,235,669,337 | | | | 688,859,379 | |
Net change in unrealized appreciation (depreciation) on investments, futures contracts, forward foreign currency contracts and foreign currency translations | | | (1,371,139,443 | ) | | | 307,378,584 | | | | (4,804,984,300 | ) | | | 1,682,048,663 | |
| | | | | | | | | | | | | | | | |
Net increase (decrease) in net assets resulting from operations | | | (1,138,496,124 | ) | | | 691,722,527 | | | | (3,580,145,592 | ) | | | 2,369,028,147 | |
| | | | | | | | | | | | | | | | |
FROM DISTRIBUTIONS TO SHAREHOLDERS: | |
Class A | | | (54,983,218 | ) | | | (37,700,764 | ) | | | (87,877,160 | ) | | | (71,172,533 | ) |
Class C | | | (37,592,938 | ) | | | (27,793,335 | ) | | | (6,955,691 | ) | | | (6,613,461 | ) |
Class N | | | (26,402,455 | ) | | | (17,490,999 | ) | | | (39,935,698 | ) | | | (27,159,617 | ) |
Class Y | | | (248,208,914 | ) | | | (172,869,178 | ) | | | (530,904,861 | ) | | | (427,889,322 | ) |
| | | | | | | | | | | | | | | | |
Total distributions | | | (367,187,525 | ) | | | (255,854,276 | ) | | | (665,673,410 | ) | | | (532,834,933 | ) |
| | | | | | | | | | | | | | | | |
NET INCREASE (DECREASE) IN NET ASSETS FROM
CAPITAL SHARE TRANSACTIONS (NOTE 11) | | | (410,454,398 | ) | | | 400,018,429 | | | | (35,119,431 | ) | | | 432,416,142 | |
| | | | | | | | | | | | | | | | |
Net increase (decrease) in net assets | | | (1,916,138,047 | ) | | | 835,886,680 | | | | (4,280,938,433 | ) | | | 2,268,609,356 | |
NET ASSETS | |
Beginning of the year | | | 4,877,444,334 | | | | 4,041,557,654 | | | | 13,768,634,157 | | | | 11,500,024,801 | |
| | | | | | | | | | | | | | | | |
End of the year | | $ | 2,961,306,287 | | | $ | 4,877,444,334 | | | $ | 9,487,695,724 | | | $ | 13,768,634,157 | |
| | | | | | | | | | | | | | | | |
See accompanying notes to financial statements.
| 84
Statements of Changes in Net Assets (continued)
| | | | | | | | | | | | | | | | |
| | | Intermediate Duration Bond
Fund | | | Limited Term Government and
Agency Fund | |
| | | Year Ended
September 30,
2022 | | | Year Ended
September 30,
2021 | | | Year Ended
September 30,
2022 | | | Year Ended
September 30,
2021 | |
FROM OPERATIONS: | |
Net investment income | | $ | 5,926,872 | | | $ | 4,516,514 | | | $ | 7,352,923 | | | $ | 5,377,989 | |
Net realized gain (loss) on investments and futures contracts | | | (19,695,363 | ) | | | 2,618,566 | | | | (21,343,422 | ) | | | 4,014,542 | |
Net change in unrealized appreciation (depreciation) on investments and futures contracts | | | (24,895,828 | ) | | | (6,669,694 | ) | | | (38,167,377 | ) | | | (13,859,882 | ) |
| | | | | | | | | | | | | | | | |
Net increase (decrease) in net assets resulting from operations | | | (38,664,319 | ) | | | 465,386 | | | | (52,157,876 | ) | | | (4,467,351 | ) |
| | | | | | | | | | | | | | | | |
FROM DISTRIBUTIONS TO SHAREHOLDERS: | |
Class A | | | (418,231 | ) | | | (742,805 | ) | | | (2,294,331 | ) | | | (1,888,946 | ) |
Class C | | | (3,268 | ) | | | (18,045 | ) | | | (45,623 | ) | | | (6,855 | ) |
Class N | | | (457,509 | ) | | | (788,205 | ) | | | (191,170 | ) | | | (104,954 | ) |
Class Y | | | (6,995,943 | ) | | | (12,363,185 | ) | | | (6,809,271 | ) | | | (6,301,562 | ) |
| | | | | | | | | | | | | | | | |
Total distributions | | | (7,874,951 | ) | | | (13,912,240 | ) | | | (9,340,395 | ) | | | (8,302,317 | ) |
| | | | | | | | | | | | | | | | |
NET INCREASE (DECREASE) IN NET ASSETS FROM
CAPITAL SHARE TRANSACTIONS (NOTE 11) | | | (42,173,549 | ) | | | 77,608,974 | | | | (200,047,990 | ) | | | 27,315,308 | |
| | | | | | | | | | | | | | | | |
Net increase (decrease) in net assets | | | (88,712,819 | ) | | | 64,162,120 | | | | (261,546,261 | ) | | | 14,545,640 | |
NET ASSETS | |
Beginning of the year | | | 381,676,482 | | | | 317,514,362 | | | | 1,033,041,404 | | | | 1,018,495,764 | |
| | | | | | | | | | | | | | | | |
End of the year | | $ | 292,963,663 | | | $ | 381,676,482 | | | $ | 771,495,143 | | | $ | 1,033,041,404 | |
| | | | | | | | | | | | | | | | |
See accompanying notes to financial statements.
85 |
Financial Highlights
For a share outstanding throughout each period
| | | | | | | | | | | | | | | | | | | | |
| | | Core Plus Bond Fund—Class A | |
| | | Year Ended
September 30,
2022
| | | Year Ended
September 30,
2021
| | | Year Ended
September 30,
2020
| | | Year Ended
September 30,
2019
| | | Year Ended
September 30,
2018
| |
Net asset value, beginning of the period | | $ | 13.59 | | | $ | 14.08 | | | $ | 13.25 | | | $ | 12.53 | | | $ | 12.96 | |
| | | | | | | | | | | | | | | | | | | | |
INCOME (LOSS) FROM INVESTMENT OPERATIONS: | | | | | | | | | | | | | | | | | | | | |
Net investment income(a) | | | 0.26 | | | | 0.21 | | | | 0.26 | | | | 0.34 | | | | 0.35 | |
Net realized and unrealized gain (loss) | | | (2.30 | ) | | | (0.13 | ) | | | 0.86 | | | | 0.70 | | | | (0.38 | ) |
| | | | | | | | | | | | | | | | | | | | |
Total from Investment Operations | | | (2.04 | ) | | | 0.08 | | | | 1.12 | | | | 1.04 | | | | (0.03 | ) |
| | | | | | | | | | | | | | | | | | | | |
LESS DISTRIBUTIONS FROM: | |
Net investment income | | | (0.32 | ) | | | (0.29 | ) | | | (0.29 | ) | | | (0.32 | ) | | | (0.40 | ) |
Net realized capital gains | | | (0.03 | ) | | | (0.28 | ) | | | — | | | | — | | | | — | |
| | | | | | | | | | | | | | | | | | | | |
Total Distributions | | | (0.35 | ) | | | (0.57 | ) | | | (0.29 | ) | | | (0.32 | ) | | | (0.40 | ) |
| | | | | | | | | | | | | | | | | | | | |
Net asset value, end of the period | | $ | 11.20 | | | $ | 13.59 | | | $ | 14.08 | | | $ | 13.25 | | | $ | 12.53 | |
| | | | | | | | | | | | | | | | | | | | |
Total return(b) | | | (15.24 | )%(c) | | | 0.53 | % | | | 8.60 | % | | | 8.39 | % | | | (0.27 | )% |
RATIOS TO AVERAGE NET ASSETS: | |
Net assets, end of the period (000’s) | | $ | 428,825 | | | $ | 747,497 | | | $ | 617,609 | | | $ | 558,291 | | | $ | 600,762 | |
Net expenses | | | 0.73 | %(d)(e) | | | 0.71 | % | | | 0.72 | %(f) | | | 0.73 | % | | | 0.73 | % |
Gross expenses | | | 0.74 | % | | | 0.71 | % | | | 0.72 | % | | | 0.73 | % | | | 0.73 | % |
Net investment income | | | 2.08 | % | | | 1.51 | % | | | 1.88 | % | | | 2.63 | % | | | 2.71 | % |
Portfolio turnover rate | | | 280 | % | | | 266 | % | | | 359 | %(g) | | | 297 | %(h) | | | 181 | % |
| (a) | Per share net investment income has been calculated using the average shares outstanding during the period. |
| (b) | A sales charge for Class A shares is not reflected in total return calculations. |
| (c) | Had certain expenses not been waived/reimbursed during the period, total returns would have been lower. |
| (d) | The investment adviser agreed to waive its fees and/or reimburse a portion of the Fund’s expenses during the period. Without this waiver/reimbursement, expenses would have been higher. |
| (e) | Effective July 1, 2022, the expense limit decreased from 0.75% to 0.74%. See Note 6 of Notes to Financial Statements. |
| (f) | Effective July 1, 2020, the expense limit decreased from 0.80% to 0.75%. |
| (g) | The variation in the Fund’s turnover rate from 2019 to 2020 was primarily due to a significant repositioning of the portfolio. |
| (h) | The variation in the Fund’s turnover rate from 2018 to 2019 is due to an increase in the volume of U.S. Treasury securities related to certain trading strategies. |
See accompanying notes to financial statements.
| 86
Financial Highlights (continued)
For a share outstanding throughout each period
| | | | | | | | | | | | | | | | | | | | |
| | | Core Plus Bond Fund—Class C | |
| | | Year Ended
September 30,
2022
| | | Year Ended
September 30,
2021
| | | Year Ended
September 30,
2020
| | | Year Ended
September 30,
2019
| | | Year Ended
September 30,
2018
| |
Net asset value, beginning of the period | | $ | 13.60 | | | $ | 14.09 | | | $ | 13.25 | | | $ | 12.53 | | | $ | 12.96 | |
| | | | | | | | | | | | | | | | | | | | |
INCOME (LOSS) FROM INVESTMENT OPERATIONS: | | | | | | | | | | | | | | | | | | | | |
Net investment income(a) | | | 0.17 | | | | 0.10 | | | | 0.15 | | | | 0.24 | | | | 0.25 | |
Net realized and unrealized gain (loss) | | | (2.30 | ) | | | (0.13 | ) | | | 0.88 | | | | 0.70 | | | | (0.38 | ) |
| | | | | | | | | | | | | | | | | | | | |
Total from Investment Operations | | | (2.13 | ) | | | (0.03 | ) | | | 1.03 | | | | 0.94 | | | | (0.13 | ) |
| | | | | | | | | | | | | | | | | | | | |
LESS DISTRIBUTIONS FROM: | | | | | | | | | | | | | | | | | | | | |
Net investment income | | | (0.23 | ) | | | (0.18 | ) | | | (0.19 | ) | | | (0.22 | ) | | | (0.30 | ) |
Net realized capital gains | | | (0.03 | ) | | | (0.28 | ) | | | — | | | | — | | | | — | |
| | | | | | | | | | | | | | | | | | | | |
Total Distributions | | | (0.26 | ) | | | (0.46 | ) | | | (0.19 | ) | | | (0.22 | ) | | | (0.30 | ) |
| | | | | | | | | | | | | | | | | | | | |
Net asset value, end of the period | | $ | 11.21 | | | $ | 13.60 | | | $ | 14.09 | | | $ | 13.25 | | | $ | 12.53 | |
| | | | | | | | | | | | | | | | | | | | |
Total return(b) | | | (15.88 | )%(c) | | | (0.24 | )% | | | 7.83 | % | | | 7.57 | % | | | (1.03 | )% |
RATIOS TO AVERAGE NET ASSETS: | | | | | | | | | | | | | | | | | | | | |
Net assets, end of the period (000’s) | | $ | 48,679 | | | $ | 95,755 | | | $ | 132,590 | | | $ | 160,201 | | | $ | 185,758 | |
Net expenses | | | 1.48 | %(d)(e) | | | 1.46 | % | | | 1.47 | %(f) | | | 1.48 | % | | | 1.48 | % |
Gross expenses | | | 1.49 | % | | | 1.46 | % | | | 1.47 | % | | | 1.48 | % | | | 1.48 | % |
Net investment income | | | 1.33 | % | | | 0.75 | % | | | 1.13 | % | | | 1.88 | % | | | 1.96 | % |
Portfolio turnover rate | | | 280 | % | | | 266 | % | | | 359 | %(g) | | | 297 | %(h) | | | 181 | % |
| (a) | Per share net investment income has been calculated using the average shares outstanding during the period. |
| (b) | A contingent deferred sales charge for Class C shares is not reflected in total return calculations. |
| (c) | Had certain expenses not been waived/reimbursed during the period, total returns would have been lower. |
| (d) | The investment adviser agreed to waive its fees and/or reimburse a portion of the Fund’s expenses during the period. Without this waiver/reimbursement, expenses would have been higher. |
| (e) | Effective July 1, 2022, the expense limit decreased from 1.50% to 1.49%. See Note 6 of Notes to Financial Statements. |
| (f) | Effective July 1, 2020, the expense limit decreased from 1.55% to 1.50%. |
| (g) | The variation in the Fund’s turnover rate from 2019 to 2020 was primarily due to a significant repositioning of the portfolio. |
| (h) | The variation in the Fund’s turnover rate from 2018 to 2019 is due to an increase in the volume of U.S. Treasury securities related to certain trading strategies. |
See accompanying notes to financial statements.
87 |
Financial Highlights (continued)
For a share outstanding throughout each period
| | | | | | | | | | | | | | | | | | | | |
| | | Core Plus Bond Fund—Class N | |
| | | Year Ended
September 30,
2022
| | | Year Ended
September 30,
2021
| | | Year Ended
September 30,
2020
| | | Year Ended
September 30,
2019
| | | Year Ended
September 30,
2018
| |
Net asset value, beginning of the period | | $ | 13.72 | | | $ | 14.21 | | | $ | 13.37 | | | $ | 12.63 | | | $ | 13.06 | |
| | | | | | | | | | | | | | | | | | | | |
INCOME (LOSS) FROM INVESTMENT OPERATIONS: | | | | | | | | | | | | | | | | | | | | |
Net investment income(a) | | | 0.31 | | | | 0.26 | | | | 0.30 | | | | 0.38 | | | | 0.39 | |
Net realized and unrealized gain (loss) | | | (2.32 | ) | | | (0.14 | ) | | | 0.88 | | | | 0.72 | | | | (0.38 | ) |
| | | | | | | | | | | | | | | | | | | | |
Total from Investment Operations | | | (2.01 | ) | | | 0.12 | | | | 1.18 | | | | 1.10 | | | | 0.01 | |
| | | | | | | | | | | | | | | | | | | | |
LESS DISTRIBUTIONS FROM: | | | | | | | | | | | | | | | | | | | | |
Net investment income | | | (0.37 | ) | | | (0.33 | ) | | | (0.34 | ) | | | (0.36 | ) | | | (0.44 | ) |
Net realized capital gains | | | (0.03 | ) | | | (0.28 | ) | | | — | | | | — | | | | — | |
| | | | | | | | | | | | | | | | | | | | |
Total Distributions | | | (0.40 | ) | | | (0.61 | ) | | | (0.34 | ) | | | (0.36 | ) | | | (0.44 | ) |
| | | | | | | | | | | | | | | | | | | | |
Net asset value, end of the period | | $ | 11.31 | | | $ | 13.72 | | | $ | 14.21 | | | $ | 13.37 | | | $ | 12.63 | |
| | | | | | | | | | | | | | | | | | | | |
Total return | | | (14.94 | )% | | | 0.86 | % | | | 8.95 | % | | | 8.85 | % | | | 0.07 | % |
RATIOS TO AVERAGE NET ASSETS: | | | | | | | | | | | | | | | | | | | | |
Net assets, end of the period (000’s) | | $ | 1,890,793 | | | $ | 2,563,736 | | | $ | 2,682,487 | | | $ | 2,610,699 | | | $ | 1,899,190 | |
Net expenses | | | 0.38 | %(b) | | | 0.38 | % | | | 0.38 | %(c) | | | 0.39 | % | | | 0.39 | % |
Gross expenses | | | 0.38 | % | | | 0.38 | % | | | 0.38 | % | | | 0.39 | % | | | 0.39 | % |
Net investment income | | | 2.47 | % | | | 1.84 | % | | | 2.21 | % | | | 2.96 | % | | | 3.06 | % |
Portfolio turnover rate | | | 280 | % | | | 266 | % | | | 359 | %(d) | | | 297 | %(e) | | | 181 | % |
| (a) | Per share net investment income has been calculated using the average shares outstanding during the period. |
| (b) | Effective July 1, 2022, the expense limit decreased from 0.45% to 0.44%. See Note 6 of Notes to Financial Statements. |
| (c) | Effective July 1, 2020, the expense limit decreased from 0.50% to 0.45%. |
| (d) | The variation in the Fund’s turnover rate from 2019 to 2020 was primarily due to a significant repositioning of the portfolio. |
| (e) | The variation in the Fund’s turnover rate from 2018 to 2019 is due to an increase in the volume of U.S. Treasury securities related to certain trading strategies. |
See accompanying notes to financial statements.
| 88
Financial Highlights (continued)
For a share outstanding throughout each period
| | | | | | | | | | | | | | | | | | | | |
| | | Core Plus Bond Fund—Class Y | |
| | | Year Ended
September 30,
2022 | | | Year Ended
September 30,
2021 | | | Year Ended
September 30,
2020 | | | Year Ended
September 30,
2019 | | | Year Ended
September 30,
2018 | |
Net asset value, beginning of the period | | $ | 13.71 | | | $ | 14.20 | | | $ | 13.36 | | | $ | 12.63 | | | $ | 13.06 | |
| | | | | | | | | | | | | | | | | | | | |
INCOME (LOSS) FROM INVESTMENT OPERATIONS: | | | | | | | | | | | | | | | | | | | | |
Net investment income(a) | | | 0.30 | | | | 0.24 | | | | 0.29 | | | | 0.37 | | | | 0.38 | |
Net realized and unrealized gain (loss) | | | (2.32 | ) | | | (0.13 | ) | | | 0.88 | | | | 0.71 | | | | (0.38 | ) |
| | | | | | | | | | | | | | | | | | | | |
Total from Investment Operations | | | (2.02 | ) | | | 0.11 | | | | 1.17 | | | | 1.08 | | | | 0.00 | (b) |
| | | | | | | | | | | | | | | | | | | | |
LESS DISTRIBUTIONS FROM: | | | | | | | | | | | | | | | | | | | | |
Net investment income | | | (0.36 | ) | | | (0.32 | ) | | | (0.33 | ) | | | (0.35 | ) | | | (0.43 | ) |
Net realized capital gains | | | (0.03 | ) | | | (0.28 | ) | | | — | | | | — | | | | — | |
| | | | | | | | | | | | | | | | | | | | |
Total Distributions | | | (0.39 | ) | | | (0.60 | ) | | | (0.33 | ) | | | (0.35 | ) | | | (0.43 | ) |
| | | | | | | | | | | | | | | | | | | | |
Net asset value, end of the period | | $ | 11.30 | | | $ | 13.71 | | | $ | 14.20 | | | $ | 13.36 | | | $ | 12.63 | |
| | | | | | | | | | | | | | | | | | | | |
Total return | | | (15.03 | )%(c) | | | 0.78 | % | | | 8.87 | % | | | 8.67 | % | | | (0.02 | )% |
RATIOS TO AVERAGE NET ASSETS: | | | | | | | | | | | | | | | | | | | | |
Net assets, end of the period (000’s) | | $ | 3,543,096 | | | $ | 5,442,563 | | | $ | 5,846,057 | | | $ | 4,163,785 | | | $ | 3,733,751 | |
Net expenses | | | 0.48 | %(d)(e) | | | 0.46 | % | | | 0.47 | %(f) | | | 0.48 | % | | | 0.48 | % |
Gross expenses | | | 0.49 | % | | | 0.46 | % | | | 0.47 | % | | | 0.48 | % | | | 0.48 | % |
Net investment income | | | 2.35 | % | | | 1.76 | % | | | 2.11 | % | | | 2.87 | % | | | 2.97 | % |
Portfolio turnover rate | | | 280 | % | | | 266 | % | | | 359 | %(g) | | | 297 | %(h) | | | 181 | % |
| (a) | Per share net investment income has been calculated using the average shares outstanding during the period. |
| (b) | Amount rounds to less than $0.01 per share. |
| (c) | Had certain expenses not been waived/reimbursed during the period, total returns would have been lower. |
| (d) | The investment adviser agreed to waive its fees and/or reimburse a portion of the Fund’s expenses during the period. Without this waiver/reimbursement, expenses would have been higher. |
| (e) | Effective July 1, 2022, the expense limit decreased from 0.50% to 0.49%. See Note 6 of Notes to Financial Statements. |
| (f) | Effective July 1, 2020, the expense limit decreased from 0.55% to 0.50%. |
| (g) | The variation in the Fund’s turnover rate from 2019 to 2020 was primarily due to a significant repositioning of the portfolio. |
| (h) | The variation in the Fund’s turnover rate from 2018 to 2019 is due to an increase in the volume of U.S. Treasury securities related to certain trading strategies. |
See accompanying notes to financial statements.
89 |
Financial Highlights (continued)
For a share outstanding throughout each period
| | | | | | | | | | | | |
| | | Credit Income Fund—Class A | |
| | | Year Ended
September 30,
2022
| | | Year Ended
September 30,
2021
| | | Period Ended
September 30,
2020*
| |
Net asset value, beginning of the period | | $ | 10.21 | | | $ | 9.97 | | | $ | 10.00 | |
| | | | | | | | | | | | |
INCOME (LOSS) FROM INVESTMENT OPERATIONS: | |
Net investment income (loss)(a) | | | 0.23 | | | | 0.21 | | | | (0.00 | )(b) |
Net realized and unrealized gain (loss) | | | (1.82 | ) | | | 0.31 | | | | (0.03 | ) |
| | | | | | | | | | | | |
Total from Investment Operations | | | (1.59 | ) | | | 0.52 | | | | (0.03 | ) |
| | | | | | | | | | | | |
LESS DISTRIBUTIONS FROM: | |
Net investment income | | | (0.27 | ) | | | (0.28 | ) | | | — | |
Net realized capital gains | | | (0.04 | ) | | | (0.00 | )(b) | | | — | |
| | | | | | | | | | | | |
Total Distributions | | | (0.31 | ) | | | (0.28 | ) | | | — | |
| | | | | | | | | | | | |
Net asset value, end of the period | | $ | 8.31 | | | $ | 10.21 | | | $ | 9.97 | |
| | | | | | | | | | | | |
Total return(c)(d) | | | (15.88 | )% | | | 5.24 | % | | | (0.30 | )%(e) |
RATIOS TO AVERAGE NET ASSETS: | |
Net assets, end of the period (000’s) | | $ | 175 | | | $ | 91 | | | $ | 1 | |
Net expenses(f) | | | 0.82 | % | | | 0.82 | % | | | 0.82 | %(g) |
Gross expenses | | | 3.37 | % | | | 4.79 | % | | | 125.79 | %(g) |
Net investment income (loss) | | | 2.54 | % | | | 2.07 | % | | | (0.82 | )%(g) |
Portfolio turnover rate | | | 21 | % | | | 55 | % | | | 0 | % |
| * | From commencement of operations on September 29, 2020 through September 30, 2020. |
| (a) | Per share net investment income (loss) has been calculated using the average shares outstanding during the period. |
| (b) | Amount rounds to less than $0.01 per share. |
| (c) | A sales charge for Class A shares is not reflected in total return calculations. |
| (d) | Had certain expenses not been waived/reimbursed during the period, total returns would have been lower. |
| (e) | Periods less than one year are not annualized. |
| (f) | The investment adviser agreed to waive its fees and/or reimburse a portion of the Fund’s expenses during the period. Without this waiver/reimbursement, expenses would have been higher. |
| (g) | Computed on an annualized basis for periods less than one year. |
See accompanying notes to financial statements.
| 90
Financial Highlights (continued)
For a share outstanding throughout each period
| | | | | | | | | | | | |
| | | Credit Income Fund—Class C | |
| | | Year Ended
September 30,
2022
| | | Year Ended
September 30,
2021
| | | Period Ended
September 30,
2020*
| |
Net asset value, beginning of the period | | $ | 10.20 | | | $ | 9.97 | | | $ | 10.00 | |
| | | | | | | | | | | | |
INCOME (LOSS) FROM INVESTMENT OPERATIONS: | |
Net investment income (loss)(a) | | | 0.16 | | | | 0.13 | | | | (0.00 | )(b) |
Net realized and unrealized gain (loss) | | | (1.82 | ) | | | 0.30 | | | | (0.03 | ) |
| | | | | | | | | | | | |
Total from Investment Operations | | | (1.66 | ) | | | 0.43 | | | | (0.03 | ) |
| | | | | | | | | | | | |
LESS DISTRIBUTIONS FROM: | |
Net investment income | | | (0.20 | ) | | | (0.20 | ) | | | — | |
Net realized capital gains | | | (0.04 | ) | | | (0.00 | )(b) | | | — | |
| | | | | | | | | | | | |
Total Distributions | | | (0.24 | ) | | | (0.20 | ) | | | — | |
| | | | | | | | | | | | |
Net asset value, end of the period | | $ | 8.30 | | | $ | 10.20 | | | $ | 9.97 | |
| | | | | | | | | | | | |
Total return(c)(d) | | | (16.53 | )% | | | 4.34 | % | | | (0.30 | )%(e) |
RATIOS TO AVERAGE NET ASSETS: | |
Net assets, end of the period (000’s) | | $ | 1 | | | $ | 1 | | | $ | 1 | |
Net expenses(f) | | | 1.57 | % | | | 1.57 | % | | | 1.57 | %(g) |
Gross expenses | | | 4.18 | % | | | 5.60 | % | | | 126.54 | %(g) |
Net investment income (loss) | | | 1.67 | % | | | 1.29 | % | | | (1.57 | )%(g) |
Portfolio turnover rate | | | 21 | % | | | 55 | % | | | 0 | % |
| * | From commencement of operations on September 29, 2020 through September 30, 2020. |
| (a) | Per share net investment income (loss) has been calculated using the average shares outstanding during the period. |
| (b) | Amount rounds to less than $0.01 per share. |
| (c) | A contingent deferred sales charge for Class C shares is not reflected in total return calculations. |
| (d) | Had certain expenses not been waived/reimbursed during the period, total returns would have been lower. |
| (e) | Periods less than one year are not annualized. |
| (f) | The investment adviser agreed to waive its fees and/or reimburse a portion of the Fund’s expenses during the period. Without this waiver/reimbursement, expenses would have been higher. |
| (g) | Computed on an annualized basis for periods less than one year. |
See accompanying notes to financial statements.
91 |
Financial Highlights (continued)
For a share outstanding throughout each period
| | | | | | | | | | | | |
| | | Credit Income Fund—Class N | |
| | | Year Ended
September 30,
2022
| | | Year Ended
September 30,
2021
| | | Period Ended
September 30,
2020*
| |
Net asset value, beginning of the period | | $ | 10.21 | | | $ | 9.97 | | | $ | 10.00 | |
| | | | | | | | | | | | |
INCOME (LOSS) FROM INVESTMENT OPERATIONS: | |
Net investment income(a) | | | 0.26 | | | | 0.24 | | | | 0.00 | (b) |
Net realized and unrealized gain (loss) | | | (1.82 | ) | | | 0.31 | | | | (0.03 | ) |
| | | | | | | | | | | | |
Total from Investment Operations | | | (1.56 | ) | | | 0.55 | | | | (0.03 | ) |
| | | | | | | | | | | | |
LESS DISTRIBUTIONS FROM: | |
Net investment income | | | (0.30 | ) | | | (0.31 | ) | | | — | |
Net realized capital gains | | | (0.04 | ) | | | (0.00 | )(b) | | | — | |
| | | | | | | | | | | | |
Total Distributions | | | (0.34 | ) | | | (0.31 | ) | | | — | |
| | | | | | | | | | | | |
Net asset value, end of the period | | $ | 8.31 | | | $ | 10.21 | | | $ | 9.97 | |
| | | | | | | | | | | | |
Total return(c) | | | (15.63 | )% | | | 5.54 | % | | | (0.30 | )%(d) |
RATIOS TO AVERAGE NET ASSETS: | |
Net assets, end of the period (000’s) | | $ | 20,229 | | | $ | 24,842 | | | $ | 24,915 | |
Net expenses(e) | | | 0.52 | % | | | 0.52 | % | | | 0.52 | %(f) |
Gross expenses | | | 1.30 | % | | | 1.16 | % | | | 27.91 | %(f) |
Net investment income | | | 2.75 | % | | | 2.38 | % | | | 0.55 | %(f) |
Portfolio turnover rate | | | 21 | % | | | 55 | % | | | 0 | % |
| * | From commencement of operations on September 29, 2020 through September 30, 2020. |
| (a) | Per share net investment income has been calculated using the average shares outstanding during the period. |
| (b) | Amount rounds to less than $0.01 per share. |
| (c) | Had certain expenses not been waived/reimbursed during the period, total returns would have been lower. |
| (d) | Periods less than one year are not annualized. |
| (e) | The investment adviser agreed to waive its fees and/or reimburse a portion of the Fund’s expenses during the period. Without this waiver/reimbursement, expenses would have been higher. |
| (f) | Computed on an annualized basis for periods less than one year. |
See accompanying notes to financial statements.
| 92
Financial Highlights (continued)
For a share outstanding throughout each period
| | | | | | | | | | | | |
| | | Credit Income Fund—Class Y | |
| | | Year Ended
September 30,
2022
| | | Year Ended
September 30,
2021
| | | Period Ended
September 30,
2020*
| |
Net asset value, beginning of the period | | $ | 10.20 | | | $ | 9.97 | | | $ | 10.00 | |
| | | | | | | | | | | | |
INCOME (LOSS) FROM INVESTMENT OPERATIONS: | |
Net investment income (loss)(a) | | | 0.25 | | | | 0.24 | | | | (0.00 | )(b) |
Net realized and unrealized gain (loss) | | | (1.81 | ) | | | 0.29 | | | | (0.03 | ) |
| | | | | | | | | | | | |
Total from Investment Operations | | | (1.56 | ) | | | 0.53 | | | | (0.03 | ) |
| | | | | | | | | | | | |
LESS DISTRIBUTIONS FROM: | |
Net investment income | | | (0.29 | ) | | | (0.30 | ) | | | — | |
Net realized capital gains | | | (0.04 | ) | | | (0.00 | )(b) | | | — | |
| | | | | | | | | | | | |
Total Distributions | | | (0.33 | ) | | | (0.30 | ) | | | — | |
| | | | | | | | | | | | |
Net asset value, end of the period | | $ | 8.31 | | | $ | 10.20 | | | $ | 9.97 | |
| | | | | | | | | | | | |
Total return(c) | | | (15.59 | )% | | | 5.38 | % | | | (0.30 | )%(d) |
RATIOS TO AVERAGE NET ASSETS: | |
Net assets, end of the period (000’s) | | $ | 46 | | | $ | 22 | | | $ | 1 | |
Net expenses(e) | | | 0.57 | % | | | 0.57 | % | | | 0.57 | %(f) |
Gross expenses | | | 3.12 | % | | | 4.54 | % | | | 125.54 | %(f) |
Net investment income (loss) | | | 2.70 | % | | | 2.33 | % | | | (0.57 | )%(f) |
Portfolio turnover rate | | | 21 | % | | | 55 | % | | | 0 | % |
| * | From commencement of operations on September 29, 2020 through September 30, 2020. |
| (a) | Per share net investment income (loss) has been calculated using the average shares outstanding during the period. |
| (b) | Amount rounds to less than $0.01 per share. |
| (c) | Had certain expenses not been waived/reimbursed during the period, total returns would have been lower. |
| (d) | Periods less than one year are not annualized. |
| (e) | The investment adviser agreed to waive its fees and/or reimburse a portion of the Fund’s expenses during the period. Without this waiver/reimbursement, expenses would have been higher. |
| (f) | Computed on an annualized basis for periods less than one year. |
See accompanying notes to financial statements.
93 |
Financial Highlights (continued)
For a share outstanding throughout each period
| | | | | | | | | | | | | | | | | | | | |
| | | Global Allocation Fund—Class A | |
| | | Year Ended
September 30,
2022 | | | Year Ended
September 30,
2021 | | | Year Ended
September 30,
2020 | | | Year Ended
September 30,
2019 | | | Year Ended
September 30,
2018 | |
Net asset value, beginning of the period | | $ | 28.86 | | | $ | 26.23 | | | $ | 23.76 | | | $ | 23.10 | | | $ | 21.60 | |
| | | | | | | | | | | | | | | | | | | | |
INCOME (LOSS) FROM INVESTMENT OPERATIONS: | |
Net investment income(a) | | | 0.13 | | | | 0.06 | | | | 0.10 | | | | 0.19 | | | | 0.23 | |
Net realized and unrealized gain (loss) | | | (6.89 | ) | | | 4.18 | | | | 3.05 | | | | 1.38 | | | | 1.75 | |
| | | | | | | | | | | | | | | | | | | | |
Total from Investment Operations | | | (6.76 | ) | | | 4.24 | | | | 3.15 | | | | 1.57 | | | | 1.98 | |
| | | | | | | | | | | | | | | | | | | | |
LESS DISTRIBUTIONS FROM: | |
Net investment income | | | — | | | | (0.13 | ) | | | (0.12 | ) | | | (0.16 | ) | | | (0.19 | ) |
Net realized capital gains | | | (2.16 | ) | | | (1.48 | ) | | | (0.56 | ) | | | (0.75 | ) | | | (0.29 | ) |
| | | | | | | | | | | | | | | | | | | | |
Total Distributions | | | (2.16 | ) | | | (1.61 | ) | | | (0.68 | ) | | | (0.91 | ) | | | (0.48 | ) |
| | | | | | | | | | | | | | | | | | | | |
Net asset value, end of the period | | $ | 19.94 | | | $ | 28.86 | | | $ | 26.23 | | | $ | 23.76 | | | $ | 23.10 | |
| | | | | | | | | | | | | | | | | | | | |
Total return(b) | | | (25.59 | )% | | | 16.73 | % | | | 13.41 | % | | | 7.66 | % | | | 9.26 | % |
RATIOS TO AVERAGE NET ASSETS: | |
Net assets, end of the period (000’s) | | $ | 482,031 | | | $ | 737,469 | | | $ | 632,479 | | | $ | 453,009 | | | $ | 401,036 | |
Net expenses | | | 1.14 | % | | | 1.13 | % | | | 1.15 | % | | | 1.16 | % | | | 1.16 | % |
Gross expenses | | | 1.14 | % | | | 1.13 | % | | | 1.15 | % | | | 1.16 | % | | | 1.16 | % |
Net investment income | | | 0.52 | % | | | 0.23 | % | | | 0.42 | % | | | 0.83 | % | | | 1.03 | % |
Portfolio turnover rate | | | 35 | % | | | 45 | % | | | 37 | % | | | 27 | % | | | 22 | % |
| (a) | Per share net investment income has been calculated using the average shares outstanding during the period. |
| (b) | A sales charge for Class A shares is not reflected in total return calculations. |
See accompanying notes to financial statements.
| 94
Financial Highlights (continued)
For a share outstanding throughout each period
| | | | | | | | | | | | | | | | | | | | |
| | | Global Allocation Fund—Class C | |
| | | Year Ended
September 30,
2022
| | | Year Ended
September 30,
2021
| | | Year Ended
September 30,
2020
| | | Year Ended
September 30,
2019
| | | Year Ended
September 30,
2018
| |
Net asset value, beginning of the period | | $ | 28.26 | | | $ | 25.78 | | | $ | 23.43 | | | $ | 22.78 | | | $ | 21.29 | |
| | | | | | | | | | | | | | | | | | | | |
INCOME (LOSS) FROM INVESTMENT OPERATIONS: | |
Net investment income (loss)(a) | | | (0.06 | ) | | | (0.14 | ) | | | (0.08 | ) | | | 0.02 | | | | 0.06 | |
Net realized and unrealized gain (loss) | | | (6.70 | ) | | | 4.10 | | | | 2.99 | | | | 1.38 | | | | 1.73 | |
| | | | | | | | | | | | | | | | | | | | |
Total from Investment Operations | | | (6.76 | ) | | | 3.96 | | | | 2.91 | | | | 1.40 | | | | 1.79 | |
| | | | | | | | | | | | | | | | | | | | |
LESS DISTRIBUTIONS FROM: | |
Net investment income | | | — | | | | — | | | | — | | | | (0.00 | )(b) | | | (0.01 | ) |
Net realized capital gains | | | (2.16 | ) | | | (1.48 | ) | | | (0.56 | ) | | | (0.75 | ) | | | (0.29 | ) |
| | | | | | | | | | | | | | | | | | | | |
Total Distributions | | | (2.16 | ) | | | (1.48 | ) | | | (0.56 | ) | | | (0.75 | ) | | | (0.30 | ) |
| | | | | | | | | | | | | | | | | | | | |
Net asset value, end of the period | | $ | 19.34 | | | $ | 28.26 | | | $ | 25.78 | | | $ | 23.43 | | | $ | 22.78 | |
| | | | | | | | | | | | | | | | | | | | |
Total return(c) | | | (26.16 | )% | | | 15.85 | % | | | 12.55 | % | | | 6.85 | % | | | 8.46 | % |
RATIOS TO AVERAGE NET ASSETS: | |
Net assets, end of the period (000’s) | | $ | 302,501 | | | $ | 503,073 | | | $ | 483,814 | | | $ | 480,479 | | | $ | 412,610 | |
Net expenses | | | 1.89 | % | | | 1.88 | % | | | 1.90 | % | | | 1.91 | % | | | 1.91 | % |
Gross expenses | | | 1.89 | % | | | 1.88 | % | | | 1.90 | % | | | 1.91 | % | | | 1.91 | % |
Net investment income (loss) | | | (0.23 | )% | | | (0.52 | )% | | | (0.33 | )% | | | 0.08 | % | | | 0.29 | % |
Portfolio turnover rate | | | 35 | % | | | 45 | % | | | 37 | % | | | 27 | % | | | 22 | % |
| (a) | Per share net investment income (loss) has been calculated using the average shares outstanding during the period. |
| (b) | Amount rounds to less than $0.01 per share. |
| (c) | A contingent deferred sales charge for Class C shares is not reflected in total return calculations. |
See accompanying notes to financial statements.
95 |
Financial Highlights (continued)
For a share outstanding throughout each period
| | | | | | | | | | | | | | | | | | | | |
| | | Global Allocation Fund—Class N | |
| | | Year Ended
September 30,
2022 | | | Year Ended
September 30,
2021 | | | Year Ended
September 30,
2020 | | | Year Ended
September 30,
2019 | | | Year Ended
September 30,
2018 | |
Net asset value, beginning of the period | | $ | 29.09 | | | $ | 26.42 | | | $ | 23.92 | | | $ | 23.25 | | | $ | 21.73 | |
| | | | | | | | | | | | | | | | | | | | |
INCOME (LOSS) FROM INVESTMENT OPERATIONS: | |
Net investment income(a) | | | 0.22 | | | | 0.15 | | | | 0.18 | | | | 0.27 | | | | 0.31 | |
Net realized and unrealized gain (loss) | | | (6.96 | ) | | | 4.21 | | | | 3.07 | | | | 1.38 | | | | 1.75 | |
| | | | | | | | | | | | | | | | | | | | |
Total from Investment Operations | | | (6.74 | ) | | | 4.36 | | | | 3.25 | | | | 1.65 | | | | 2.06 | |
| | | | | | | | | | | | | | | | | | | | |
LESS DISTRIBUTIONS FROM: | |
Net investment income | | | (0.05 | ) | | | (0.21 | ) | | | (0.19 | ) | | | (0.23 | ) | | | (0.25 | ) |
Net realized capital gains | | | (2.16 | ) | | | (1.48 | ) | | | (0.56 | ) | | | (0.75 | ) | | | (0.29 | ) |
| | | | | | | | | | | | | | | | | | | | |
Total Distributions | | | (2.21 | ) | | | (1.69 | ) | | | (0.75 | ) | | | (0.98 | ) | | | (0.54 | ) |
| | | | | | | | | �� | | | | | | | | | | | |
Net asset value, end of the period | | $ | 20.14 | | | $ | 29.09 | | | $ | 26.42 | | | $ | 23.92 | | | $ | 23.25 | |
| | | | | | | | | | | | | | | | | | | | |
Total return | | | (25.36 | )% | | | 17.10 | % | | | 13.78 | % | | | 8.04 | % | | | 9.60 | % |
RATIOS TO AVERAGE NET ASSETS: | |
Net assets, end of the period (000’s) | | $ | 243,862 | | | $ | 350,222 | | | $ | 264,338 | | | $ | 202,692 | | | $ | 80,346 | |
Net expenses | | | 0.81 | % | | | 0.81 | % | | | 0.82 | % | | | 0.82 | % | | | 0.83 | % |
Gross expenses | | | 0.81 | % | | | 0.81 | % | | | 0.82 | % | | | 0.82 | % | | | 0.83 | % |
Net investment income | | | 0.87 | % | | | 0.55 | % | | | 0.76 | % | | | 1.20 | % | | | 1.36 | % |
Portfolio turnover rate | | | 35 | % | | | 45 | % | | | 37 | % | | | 27 | % | | | 22 | % |
| (a) | Per share net investment income has been calculated using the average shares outstanding during the period. |
See accompanying notes to financial statements.
| 96
Financial Highlights (continued)
For a share outstanding throughout each period
| | | | | | | | | | | | | | | | | | | | |
| | | Global Allocation Fund—Class Y | |
| | | Year Ended
September 30,
2022 | | | Year Ended
September 30,
2021 | | | Year Ended
September 30,
2020 | | | Year Ended
September 30,
2019 | | | Year Ended
September 30,
2018 | |
Net asset value, beginning of the period | | $ | 29.09 | | | $ | 26.42 | | | $ | 23.92 | | | $ | 23.25 | | | $ | 21.74 | |
| | | | | | | | | | | | | | | | | | | | |
INCOME (LOSS) FROM INVESTMENT OPERATIONS: | |
Net investment income(a) | | | 0.20 | | | | 0.13 | | | | 0.16 | | | | 0.24 | | | | 0.29 | |
Net realized and unrealized gain (loss) | | | (6.96 | ) | | | 4.21 | | | | 3.07 | | | | 1.40 | | | | 1.75 | |
| | | | | | | | | | | | | | | | | | | | |
Total from Investment Operations | | | (6.76 | ) | | | 4.34 | | | | 3.23 | | | | 1.64 | | | | 2.04 | |
| | | | | | | | | | | | | | | | | | | | |
LESS DISTRIBUTIONS FROM: | |
Net investment income | | | (0.03 | ) | | | (0.19 | ) | | | (0.17 | ) | | | (0.22 | ) | | | (0.24 | ) |
Net realized capital gains | | | (2.16 | ) | | | (1.48 | ) | | | (0.56 | ) | | | (0.75 | ) | | | (0.29 | ) |
| | | | | | | | | | | | | | | | | | | | |
Total Distributions | | | (2.19 | ) | | | (1.67 | ) | | | (0.73 | ) | | | (0.97 | ) | | | (0.53 | ) |
| | | | | | | | | | | | | | | | | | | | |
Net asset value, end of the period | | $ | 20.14 | | | $ | 29.09 | | | $ | 26.42 | | | $ | 23.92 | | | $ | 23.25 | |
| | | | | | | | | | | | | | | | | | | | |
Total return | | | (25.41 | )% | | | 17.02 | % | | | 13.70 | % | | | 7.95 | % | | | 9.49 | % |
RATIOS TO AVERAGE NET ASSETS: | |
Net assets, end of the period (000’s) | | $ | 1,932,913 | | | $ | 3,286,680 | | | $ | 2,660,927 | | | $ | 1,938,124 | | | $ | 1,549,689 | |
Net expenses | | | 0.89 | % | | | 0.88 | % | | | 0.90 | % | | | 0.91 | % | | | 0.91 | % |
Gross expenses | | | 0.89 | % | | | 0.88 | % | | | 0.90 | % | | | 0.91 | % | | | 0.91 | % |
Net investment income | | | 0.77 | % | | | 0.48 | % | | | 0.67 | % | | | 1.08 | % | | | 1.29 | % |
Portfolio turnover rate | | | 35 | % | | | 45 | % | | | 37 | % | | | 27 | % | | | 22 | % |
| (a) | Per share net investment income has been calculated using the average shares outstanding during the period. |
See accompanying notes to financial statements.
97 |
Financial Highlights (continued)
For a share outstanding throughout each period
| | | | | | | | | | | | | | | | | | | | |
| | | Growth Fund—Class A | |
| | | Year Ended
September 30,
2022
| | | Year Ended
September 30,
2021
| | | Year Ended
September 30,
2020
| | | Year Ended
September 30,
2019
| | | Year Ended
September 30,
2018
| |
Net asset value, beginning of the period | | $ | 23.85 | | | $ | 20.72 | | | $ | 16.02 | | | $ | 16.05 | | | $ | 14.04 | |
| | | | | | | | | | | | | | | | | | | | |
INCOME (LOSS) FROM INVESTMENT OPERATIONS: | |
Net investment income (loss)(a) | | | (0.06 | ) | | | (0.05 | ) | | | 0.01 | | | | 0.05 | | | | 0.06 | |
Net realized and unrealized gain (loss) | | | (6.10 | ) | | | 4.17 | | | | 5.14 | | | | 0.71 | | | | 2.29 | |
| | | | | | | | | | | | | | | | | | | | |
Total from Investment Operations | | | (6.16 | ) | | | 4.12 | | | | 5.15 | | | | 0.76 | | | | 2.35 | |
| | | | | | | | | | | | | | | | | | | | |
LESS DISTRIBUTIONS FROM: | |
Net investment income | | | — | | | | — | | | | (0.05 | ) | | | (0.05 | ) | | | (0.05 | ) |
Net realized capital gains | | | (1.24 | ) | | | (0.99 | ) | | | (0.40 | ) | | | (0.74 | ) | | | (0.29 | ) |
| | | | | | | | | | | | | | | | | | | | |
Total Distributions | | | (1.24 | ) | | | (0.99 | ) | | | (0.45 | ) | | | (0.79 | ) | | | (0.34 | ) |
| | | | | | | | | | | | | | | | | | | | |
Net asset value, end of the period | | $ | 16.45 | | | $ | 23.85 | | | $ | 20.72 | | | $ | 16.02 | | | $ | 16.05 | |
| | | | | | | | | | | | | | | | | | | | |
Total return(b) | | | (27.48 | )% | | | 20.43 | % | | | 32.80 | % | | | 5.81 | % | | | 16.98 | % |
RATIOS TO AVERAGE NET ASSETS: | |
Net assets, end of the period (000’s) | | $ | 1,164,116 | | | $ | 1,740,523 | | | $ | 1,477,915 | | | $ | 1,250,030 | | | $ | 1,083,362 | |
Net expenses | | | 0.90 | % | | | 0.89 | % | | | 0.90 | % | | | 0.91 | % | | | 0.90 | % |
Gross expenses | | | 0.90 | % | | | 0.89 | % | | | 0.90 | % | | | 0.91 | % | | | 0.90 | % |
Net investment income (loss) | | | (0.30 | )% | | | (0.22 | )% | | | 0.04 | % | | | 0.35 | % | | | 0.39 | % |
Portfolio turnover rate | | | 20 | % | | | 9 | % | | | 19 | % | | | 7 | % | | | 11 | % |
| (a) | Per share net investment income (loss) has been calculated using the average shares outstanding during the period. |
| (b) | A sales charge for Class A shares is not reflected in total return calculations. |
See accompanying notes to financial statements.
| 98
Financial Highlights (continued)
For a share outstanding throughout each period
| | | | | | | | | | | | | | | | | | | | |
| | | Growth Fund—Class C | |
| | | Year Ended
September 30,
2022
| | | Year Ended
September 30,
2021
| | | Year Ended
September 30,
2020
| | | Year Ended
September 30,
2019
| | | Year Ended
September 30,
2018
| |
Net asset value, beginning of the period | | $ | 21.21 | | | $ | 18.66 | | | $ | 14.53 | | | $ | 14.68 | | | $ | 12.92 | |
| | | | | | | | | | | | | | | | | | | | |
INCOME (LOSS) FROM INVESTMENT OPERATIONS: | |
Net investment loss(a) | | | (0.20 | ) | | | (0.20 | ) | | | (0.11 | ) | | | (0.06 | ) | | | (0.05 | ) |
Net realized and unrealized gain (loss) | | | (5.35 | ) | | | 3.74 | | | | 4.64 | | | | 0.65 | | | | 2.10 | |
| | | | | | | | | | | | | | | | | | | | |
Total from Investment Operations | | | (5.55 | ) | | | 3.54 | | | | 4.53 | | | | 0.59 | | | | 2.05 | |
| | | | | | | | | | | | | | | | | | | | |
LESS DISTRIBUTIONS FROM: | |
Net realized capital gains | | | (1.24 | ) | | | (0.99 | ) | | | (0.40 | ) | | | (0.74 | ) | | | (0.29 | ) |
| | | | | | | | | | | | | | | | | | | | |
Net asset value, end of the period | | $ | 14.42 | | | $ | 21.21 | | | $ | 18.66 | | | $ | 14.53 | | | $ | 14.68 | |
| | | | | | | | | | | | | | | | | | | | |
Total return(b) | | | (28.05 | )% | | | 19.55 | % | | | 31.76 | % | | | 5.05 | % | | | 16.09 | % |
RATIOS TO AVERAGE NET ASSETS: | |
Net assets, end of the period (000’s) | | $ | 65,977 | | | $ | 127,003 | | | $ | 128,764 | | | $ | 120,493 | | | $ | 130,133 | |
Net expenses | | | 1.65 | % | | | 1.63 | % | | | 1.65 | % | | | 1.66 | % | | | 1.65 | % |
Gross expenses | | | 1.65 | % | | | 1.63 | % | | | 1.65 | % | | | 1.66 | % | | | 1.65 | % |
Net investment loss | | | (1.05 | )% | | | (0.97 | )% | | | (0.71 | )% | | | (0.39 | )% | | | (0.36 | )% |
Portfolio turnover rate | | | 20 | % | | | 9 | % | | | 19 | % | | | 7 | % | | | 11 | % |
| (a) | Per share net investment loss has been calculated using the average shares outstanding during the period. |
| (b) | A contingent deferred sales charge for Class C shares is not reflected in total return calculations. |
See accompanying notes to financial statements.
99 |
Financial Highlights (continued)
For a share outstanding throughout each period
| | | | | | | | | | | | | | | | | | | | |
| | | Growth Fund—Class N | |
| | | Year Ended
September 30,
2022
| | | Year Ended
September 30,
2021
| | | Year Ended
September 30,
2020
| | | Year Ended
September 30,
2019
| | | Year Ended
September 30,
2018
| |
Net asset value, beginning of the period | | $ | 25.73 | | | $ | 22.26 | | | $ | 17.17 | | | $ | 17.15 | | | $ | 14.97 | |
| | | | | | | | | | | | | | | | | | | | |
INCOME (LOSS) FROM INVESTMENT OPERATIONS: | |
Net investment income(a) | | | 0.01 | | | | 0.02 | | | | 0.07 | | | | 0.11 | | | | 0.12 | |
Net realized and unrealized gain (loss) | | | (6.63 | ) | | | 4.49 | | | | 5.53 | | | | 0.76 | | | | 2.44 | |
| | | | | | | | | | | | | | | | | | | | |
Total from Investment Operations | | | (6.62 | ) | | | 4.51 | | | | 5.60 | | | | 0.87 | | | | 2.56 | |
| | | | | | | | | | | | | | | | | | | | |
LESS DISTRIBUTIONS FROM: | |
Net investment income | | | — | | | | (0.05 | ) | | | (0.11 | ) | | | (0.11 | ) | | | (0.09 | ) |
Net realized capital gains | | | (1.24 | ) | | | (0.99 | ) | | | (0.40 | ) | | | (0.74 | ) | | | (0.29 | ) |
| | | | | | | | | | | | | | | | | | | | |
Total Distributions | | | (1.24 | ) | | | (1.04 | ) | | | (0.51 | ) | | | (0.85 | ) | | | (0.38 | ) |
| | | | | | | | | | | | | | | | | | | | |
Net asset value, end of the period | | $ | 17.87 | | | $ | 25.73 | | | $ | 22.26 | | | $ | 17.17 | | | $ | 17.15 | |
| | | | | | | | | | | | | | | | | | | | |
Total return | | | (27.25 | )% | | | 20.80 | % | | | 33.26 | % | | | 6.14 | % | | | 17.40 | %(b) |
RATIOS TO AVERAGE NET ASSETS: | |
Net assets, end of the period (000’s) | | $ | 663,001 | | | $ | 806,186 | | | $ | 579,571 | | | $ | 442,787 | | | $ | 1,001,688 | |
Net expenses | | | 0.57 | % | | | 0.56 | % | | | 0.57 | % | | | 0.56 | % | | | 0.57 | %(c) |
Gross expenses | | | 0.57 | % | | | 0.56 | % | | | 0.57 | % | | | 0.56 | % | | | 0.58 | % |
Net investment income | | | 0.04 | % | | | 0.09 | % | | | 0.38 | % | | | 0.69 | % | | | 0.73 | % |
Portfolio turnover rate | | | 20 | % | | | 9 | % | | | 19 | % | | | 7 | % | | | 11 | % |
| (a) | Per share net investment income has been calculated using the average shares outstanding during the period. |
| (b) | Had certain expenses not been waived/reimbursed during the period, total returns would have been lower. |
| (c) | The investment adviser agreed to waive its fees and/or reimburse a portion of the Fund’s expenses during the period. Without this waiver/reimbursement, expenses would have been higher. |
See accompanying notes to financial statements.
| 100
Financial Highlights (continued)
For a share outstanding throughout each period
| | | | | | | | | | | | | | | | | | | | |
| | | Growth Fund—Class Y | |
| | | Year Ended
September 30,
2022 | | | Year Ended
September 30,
2021 | | | Year Ended
September 30,
2020 | | | Year Ended
September 30,
2019 | | | Year Ended
September 30,
2018 | |
Net asset value, beginning of the period | | $ | 25.73 | | | $ | 22.26 | | | $ | 17.17 | | | $ | 17.14 | | | $ | 14.97 | |
| | | | | | | | | | | | | | | | | | | | |
INCOME (LOSS) FROM INVESTMENT OPERATIONS: | |
Net investment income (loss)(a) | | | (0.01 | ) | | | 0.01 | | | | 0.05 | | | | 0.10 | | | | 0.10 | |
Net realized and unrealized gain (loss) | | | (6.62 | ) | | | 4.48 | | | | 5.53 | | | | 0.77 | | | | 2.44 | |
| | | | | | | | | | | | | | | | | | | | |
Total from Investment Operations | | | (6.63 | ) | | | 4.49 | | | | 5.58 | | | | 0.87 | | | | 2.54 | |
| | | | | | | | | | | | | | | | | | | | |
LESS DISTRIBUTIONS FROM: | |
Net investment income | | | — | | | | (0.03 | ) | | | (0.09 | ) | | | (0.10 | ) | | | (0.08 | ) |
Net realized capital gains | | | (1.24 | ) | | | (0.99 | ) | | | (0.40 | ) | | | (0.74 | ) | | | (0.29 | ) |
| | | | | | | | | | | | | | | | | | | | |
Total Distributions | | | (1.24 | ) | | | (1.02 | ) | | | (0.49 | ) | | | (0.84 | ) | | | (0.37 | ) |
| | | | | | | | | | | | | | | | | | | | |
Net asset value, end of the period | | $ | 17.86 | | | $ | 25.73 | | | $ | 22.26 | | | $ | 17.17 | | | $ | 17.14 | |
| | | | | | | | | | | | | | | | | | | | |
Total return | | | (27.29 | )% | | | 20.72 | % | | | 33.15 | % | | | 6.09 | % | | | 17.25 | % |
RATIOS TO AVERAGE NET ASSETS: | |
Net assets, end of the period (000’s) | | $ | 7,594,603 | | | $ | 11,094,922 | | | $ | 9,313,775 | | | $ | 7,017,707 | | | $ | 6,620,996 | |
Net expenses | | | 0.65 | % | | | 0.64 | % | | | 0.65 | % | | | 0.66 | % | | | 0.65 | % |
Gross expenses | | | 0.65 | % | | | 0.64 | % | | | 0.65 | % | | | 0.66 | % | | | 0.65 | % |
Net investment income (loss) | | | (0.05 | )% | | | 0.02 | % | | | 0.27 | % | | | 0.60 | % | | | 0.64 | % |
Portfolio turnover rate | | | 20 | % | | | 9 | % | | | 19 | % | | | 7 | % | | | 11 | % |
| (a) | Per share net investment income (loss) has been calculated using the average shares outstanding during the period. |
See accompanying notes to financial statements.
101 |
Financial Highlights (continued)
For a share outstanding throughout each period
| | | | | | | | | | | | | | | | | | | | |
| | | Intermediate Duration Bond Fund—Class A | |
| | | Year Ended
September 30,
2022
| | | Year Ended
September 30,
2021
| | | Year Ended
September 30,
2020
| | | Year Ended
September 30,
2019
| | | Year Ended
September 30,
2018
| |
Net asset value, beginning of the period | | $ | 10.58 | | | $ | 10.99 | | | $ | 10.51 | | | $ | 9.97 | | | $ | 10.29 | |
| | | | | | | | | | | | | | | | | | | | |
INCOME (LOSS) FROM INVESTMENT OPERATIONS: | |
Net investment income(a) | | | 0.15 | | | | 0.11 | | | | 0.19 | | | | 0.25 | | | | 0.22 | |
Net realized and unrealized gain (loss) | | | (1.30 | ) | | | (0.11 | ) | | | 0.54 | | | | 0.55 | | | | (0.31 | ) |
| | | | | | | | | | | | | | | | | | | | |
Total from Investment Operations | | | (1.15 | ) | | | (0.00 | )(b) | | | 0.73 | | | | 0.80 | | | | (0.09 | ) |
| | | | | | | | | | | | | | | | | | | | |
LESS DISTRIBUTIONS FROM: | |
Net investment income | | | (0.15 | ) | | | (0.12 | ) | | | (0.20 | ) | | | (0.26 | ) | | | (0.23 | ) |
Net realized capital gains | | | (0.05 | ) | | | (0.29 | ) | | | (0.05 | ) | | | — | | | | — | |
| | | | | | | | | | | | | | | | | | | | |
Total Distributions | | | (0.20 | ) | | | (0.41 | ) | | | (0.25 | ) | | | (0.26 | ) | | | (0.23 | ) |
| | | | | | | | | | | | | | | | | | | | |
Net asset value, end of the period | | $ | 9.23 | | | $ | 10.58 | | | $ | 10.99 | | | $ | 10.51 | | | $ | 9.97 | |
| | | | | | | | | | | | | | | | | | | | |
Total return(c)(d) | | | (10.98 | )% | | | (0.06 | )% | | | 7.06 | % | | | 8.11 | % | | | (0.85 | )% |
RATIOS TO AVERAGE NET ASSETS: | |
Net assets, end of the period (000’s) | | $ | 18,077 | | | $ | 20,942 | | | $ | 19,962 | | | $ | 21,415 | | | $ | 19,149 | |
Net expenses(e) | | | 0.65 | % | | | 0.65 | % | | | 0.65 | % | | | 0.65 | % | | | 0.65 | % |
Gross expenses | | | 0.68 | % | | | 0.70 | % | | | 0.72 | % | | | 0.72 | % | | | 0.70 | % |
Net investment income | | | 1.49 | % | | | 1.03 | % | | | 1.78 | % | | | 2.42 | % | | | 2.17 | % |
Portfolio turnover rate | | | 144 | % | | | 100 | % | | | 123 | % | | | 135 | % | | | 152 | % |
| (a) | Per share net investment income has been calculated using the average shares outstanding during the period. |
| (b) | Amount rounds to less than $0.01 per share. |
| (c) | A sales charge for Class A shares is not reflected in total return calculations. |
| (d) | Had certain expenses not been waived/reimbursed during the period, total returns would have been lower. |
| (e) | The investment adviser agreed to waive its fees and/or reimburse a portion of the Fund’s expenses during the period. Without this waiver/reimbursement, expenses would have been higher. |
See accompanying notes to financial statements.
| 102
Financial Highlights (continued)
For a share outstanding throughout each period
| | | | | | | | | | | | | | | | | | | | |
| | | Intermediate Duration Bond Fund—Class C | |
| | | Year Ended
September 30,
2022
| | | Year Ended
September 30,
2021
| | | Year Ended
September 30,
2020
| | | Year Ended
September 30,
2019
| | | Year Ended
September 30,
2018
| |
Net asset value, beginning of the period | | $ | 10.62 | | | $ | 11.02 | | | $ | 10.54 | | | $ | 10.00 | | | $ | 10.30 | |
| | | | | | | | | | | | | | | | | | | | |
INCOME (LOSS) FROM INVESTMENT OPERATIONS: | |
Net investment income(a) | | | 0.06 | | | | 0.03 | | | | 0.11 | | | | 0.17 | | | | 0.13 | |
Net realized and unrealized gain (loss) | | | (1.29 | ) | | | (0.11 | ) | | | 0.54 | | | | 0.55 | | | | (0.31 | ) |
| | | | | | | | | | | | | | | | | | | | |
Total from Investment Operations | | | (1.23 | ) | | | (0.08 | ) | | | 0.65 | | | | 0.72 | | | | (0.18 | ) |
| | | | | | | | | | | | | | | | | | | | |
LESS DISTRIBUTIONS FROM: | |
Net investment income | | | (0.07 | ) | | | (0.03 | ) | | | (0.12 | ) | | | (0.18 | ) | | | (0.12 | ) |
Net realized capital gains | | | (0.05 | ) | | | (0.29 | ) | | | (0.05 | ) | | | — | | | | — | |
| | | | | | | | | | | | | | | | | | | | |
Total Distributions | | | (0.12 | ) | | | (0.32 | ) | | | (0.17 | ) | | | (0.18 | ) | | | (0.12 | ) |
| | | | | | | | | | | | | | | | | | | | |
Net asset value, end of the period | | $ | 9.27 | | | $ | 10.62 | | | $ | 11.02 | | | $ | 10.54 | | | $ | 10.00 | |
| | | | | | | | | | | | | | | | | | | | |
Total return(b)(c) | | | (11.65 | )% | | | (0.76 | )% | | | 6.27 | % | | | 7.28 | % | | | (1.71 | )% |
RATIOS TO AVERAGE NET ASSETS: | |
Net assets, end of the period (000’s) | | $ | 174 | | | $ | 315 | | | $ | 668 | | | $ | 467 | | | $ | 2 | |
Net expenses(d) | | | 1.40 | % | | | 1.40 | % | | | 1.40 | % | | | 1.40 | % | | | 1.40 | % |
Gross expenses | | | 1.43 | % | | | 1.45 | % | | | 1.46 | % | | | 1.48 | % | | | 1.45 | % |
Net investment income | | | 0.60 | % | | | 0.30 | % | | | 1.00 | % | | | 1.64 | % | | | 1.31 | % |
Portfolio turnover rate | | | 144 | % | | | 100 | % | | | 123 | % | | | 135 | % | | | 152 | % |
| (a) | Per share net investment income has been calculated using the average shares outstanding during the period. |
| (b) | A contingent deferred sales charge for Class C shares is not reflected in total return calculations. |
| (c) | Had certain expenses not been waived/reimbursed during the period, total returns would have been lower. |
| (d) | The investment adviser agreed to waive its fees and/or reimburse a portion of the Fund’s expenses during the period. Without this waiver/reimbursement, expenses would have been higher. |
See accompanying notes to financial statements.
103 |
Financial Highlights (continued)
For a share outstanding throughout each period
| | | | | | | | | | | | | | | | |
| | | Intermediate Duration Bond Fund—Class N | |
| | | Year Ended
September 30,
2022
| | | Year Ended
September 30,
2021
| | | Year Ended
September 30,
2020
| | | Period Ended
September 30,
2019*
| |
Net asset value, beginning of the period | | $ | 10.57 | | | $ | 10.98 | | | $ | 10.50 | | | $ | 10.07 | |
| | | | | | | | | | | | | | | | |
INCOME (LOSS) FROM INVESTMENT OPERATIONS: | |
Net investment income(a) | | | 0.18 | | | | 0.14 | | | | 0.22 | | | | 0.17 | |
Net realized and unrealized gain (loss) | | | (1.30 | ) | | | (0.11 | ) | | | 0.54 | | | | 0.45 | |
| | | | | | | | | | | | | | | | |
Total from Investment Operations | | | (1.12 | ) | | | 0.03 | | | | 0.76 | | | | 0.62 | |
| | | | | | | | | | | | | | | | |
LESS DISTRIBUTIONS FROM: | |
Net investment income | | | (0.18 | ) | | | (0.15 | ) | | | (0.23 | ) | | | (0.19 | ) |
Net realized capital gains | | | (0.05 | ) | | | (0.29 | ) | | | (0.05 | ) | | | — | |
| | | | | | | | | | | | | | | | |
Total Distributions | | | (0.23 | ) | | | (0.44 | ) | | | (0.28 | ) | | | (0.19 | ) |
| | | | | | | | | | | | | | | | |
Net asset value, end of the period | | $ | 9.22 | | | $ | 10.57 | | | $ | 10.98 | | | $ | 10.50 | |
| | | | | | | | | | | | | | | | |
Total return(b) | | | (10.73 | )% | | | 0.25 | % | | | 7.39 | % | | | 6.19 | %(c) |
RATIOS TO AVERAGE NET ASSETS: | |
Net assets, end of the period (000’s) | | $ | 19,294 | | | $ | 20,094 | | | $ | 3,307 | | | $ | 3,546 | |
Net expenses(d) | | | 0.35 | % | | | 0.35 | % | | | 0.35 | % | | | 0.35 | %(e) |
Gross expenses | | | 0.37 | % | | | 0.38 | % | | | 0.43 | % | | | 0.42 | %(e) |
Net investment income | | | 1.80 | % | | | 1.32 | % | | | 2.09 | % | | | 2.54 | %(e) |
Portfolio turnover rate | | | 144 | % | | | 100 | % | | | 123 | % | | | 135 | %(f) |
| * | From commencement of Class operations on February 1, 2019 through September 30, 2019. |
| (a) | Per share net investment income has been calculated using the average shares outstanding during the period. |
| (b) | Had certain expenses not been waived/reimbursed during the period, total returns would have been lower. |
| (c) | Periods less than one year are not annualized. |
| (d) | The investment adviser agreed to waive its fees and/or reimburse a portion of the Fund’s expenses during the period. Without this waiver/reimbursement, expenses would have been higher. |
| (e) | Computed on an annualized basis for periods less than one year. |
| (f) | Represents the Fund’s portfolio turnover rate for year ended September 30, 2019. |
See accompanying notes to financial statements.
| 104
Financial Highlights (continued)
For a share outstanding throughout each period
| | | | | | | | | | | | | | | | | | | | |
| | | Intermediate Duration Bond Fund—Class Y | |
| | | Year Ended
September 30,
2022
| | | Year Ended
September 30,
2021
| | | Year Ended
September 30,
2020
| | | Year Ended
September 30,
2019
| | | Year Ended
September 30,
2018
| |
Net asset value, beginning of the period | | $ | 10.58 | | | $ | 10.99 | | | $ | 10.51 | | | $ | 9.97 | | | $ | 10.29 | |
| | | | | | | | | | | | | | | | | | | | |
INCOME (LOSS) FROM INVESTMENT OPERATIONS: | |
Net investment income(a) | | | 0.17 | | | | 0.14 | | | | 0.21 | | | | 0.27 | | | | 0.25 | |
Net realized and unrealized gain (loss) | | | (1.29 | ) | | | (0.11 | ) | | | 0.54 | | | | 0.55 | | | | (0.31 | ) |
| | | | | | | | | | | | | | | | | | | | |
Total from Investment Operations | | | (1.12 | ) | | | 0.03 | | | | 0.75 | | | | 0.82 | | | | (0.06 | ) |
| | | | | | | | | | | | | | | | | | | | |
LESS DISTRIBUTIONS FROM: | |
Net investment income | | | (0.18 | ) | | | (0.15 | ) | | | (0.22 | ) | | | (0.28 | ) | | | (0.26 | ) |
Net realized capital gains | | | (0.05 | ) | | | (0.29 | ) | | | (0.05 | ) | | | — | | | | — | |
| | | | | | | | | | | | | | | | | | | | |
Total Distributions | | | (0.23 | ) | | | (0.44 | ) | | | (0.27 | ) | | | (0.28 | ) | | | (0.26 | ) |
| | | | | | | | | | | | | | | | | | | | |
Net asset value, end of the period | | $ | 9.23 | | | $ | 10.58 | | | $ | 10.99 | | | $ | 10.51 | | | $ | 9.97 | |
| | | | | | | | | | | | | | | | | | | | |
Total return(b) | | | (10.76 | )% | | | 0.20 | % | | | 7.33 | % | | | 8.38 | % | | | (0.60 | )% |
RATIOS TO AVERAGE NET ASSETS: | |
Net assets, end of the period (000’s) | | $ | 255,418 | | | $ | 340,326 | | | $ | 293,577 | | | $ | 215,752 | | | $ | 148,119 | |
Net expenses(c) | | | 0.40 | % | | | 0.40 | % | | | 0.40 | % | | | 0.40 | % | | | 0.40 | % |
Gross expenses | | | 0.44 | % | | | 0.45 | % | | | 0.47 | % | | | 0.48 | % | | | 0.45 | % |
Net investment income | | | 1.70 | % | | | 1.28 | % | | | 2.01 | % | | | 2.67 | % | | | 2.43 | % |
Portfolio turnover rate | | | 144 | % | | | 100 | % | | | 123 | % | | | 135 | % | | | 152 | % |
| (a) | Per share net investment income has been calculated using the average shares outstanding during the period. |
| (b) | Had certain expenses not been waived/reimbursed during the period, total returns would have been lower. |
| (c) | The investment adviser agreed to waive its fees and/or reimburse a portion of the Fund’s expenses during the period. Without this waiver/reimbursement, expenses would have been higher. |
See accompanying notes to financial statements.
105 |
Financial Highlights (continued)
For a share outstanding throughout each period
| | | | | | | | | | | | | | | | | | | | |
| | | Limited Term Government and Agency Fund—Class A | |
| | | Year Ended
September 30,
2022
| | | Year Ended
September 30,
2021
| | | Year Ended
September 30,
2020
| | | Year Ended
September 30,
2019
| | | Year Ended
September 30,
2018
| |
Net asset value, beginning of the period | | $ | 11.40 | | | $ | 11.54 | | | $ | 11.34 | | | $ | 11.09 | | | $ | 11.32 | |
| | | | | | | | | | | | | | | | | | | | |
INCOME (LOSS) FROM INVESTMENT OPERATIONS: | |
Net investment income(a) | | | 0.07 | | | | 0.04 | | | | 0.11 | | | | 0.15 | | | | 0.11 | |
Net realized and unrealized gain (loss) | | | (0.72 | ) | | | (0.11 | ) | | | 0.25 | | | | 0.34 | | | | (0.13 | ) |
| | | | | | | | | | | | | | | | | | | | |
Total from Investment Operations | | | (0.65 | ) | | | (0.07 | ) | | | 0.36 | | | | 0.49 | | | | (0.02 | ) |
| | | | | | | | | | | | | | | | | | | | |
LESS DISTRIBUTIONS FROM: | |
Net investment income | | | (0.10 | ) | | | (0.07 | ) | | | (0.16 | ) | | | (0.24 | ) | | | (0.21 | ) |
| | | | | | | | | | | | | | | | | | | | |
Net asset value, end of the period | | $ | 10.65 | | | $ | 11.40 | | | $ | 11.54 | | | $ | 11.34 | | | $ | 11.09 | |
| | | | | | | | | | | | | | | | | | | | |
Total return(b) | | | (5.75 | )%(c) | | | (0.58 | )%(c) | | | 3.19 | % | | | 4.42 | % | | | (0.17 | )% |
RATIOS TO AVERAGE NET ASSETS: | |
Net assets, end of the period (000’s) | | $ | 246,532 | | | $ | 287,244 | | | $ | 296,217 | | | $ | 308,186 | | | $ | 328,475 | |
Net expenses | | | 0.69 | %(d)(e) | | | 0.73 | %(d)(f)(g) | | | 0.78 | %(h) | | | 0.80 | % | | | 0.80 | % |
Gross expenses | | | 0.72 | %(e) | | | 0.73 | %(f) | | | 0.78 | % | | | 0.80 | % | | | 0.80 | % |
Net investment income | | | 0.65 | % | | | 0.36 | % | | | 0.93 | % | | | 1.31 | % | | | 1.02 | % |
Portfolio turnover rate | | | 203 | % | | | 247 | % | | | 319 | %(i) | | | 527 | %(i) | | | 157 | % |
| (a) | Per share net investment income has been calculated using the average shares outstanding during the period. |
| (b) | A sales charge for Class A shares is not reflected in total return calculations. |
| (c) | Had certain expenses not been waived/reimbursed during the period, total returns would have been lower. |
| (d) | The investment adviser agreed to waive its fees and/or reimburse a portion of the Fund’s expenses during the period. Without this waiver/reimbursement, expenses would have been higher. |
| (e) | Includes refund of prior year service fee of 0.01%. See Note 6b of Notes to Financial Statements. |
| (f) | Includes refund of prior year service fee of 0.01%. |
| (g) | Effective July 1, 2021, the expense limit decreased from 0.75% to 0.70%. |
| (h) | Effective July 1, 2020, the expense limit decreased from 0.80% to 0.75%. |
| (i) | The variation in the Fund’s turnover rate from 2018 to 2020 is due to changes in volume of U.S. Treasury securities related to certain trading strategies. |
See accompanying notes to financial statements.
| 106
Financial Highlights (continued)
For a share outstanding throughout each period
| | | | | | | | | | | | | | | | | | | | |
| | | Limited Term Government and Agency Fund—Class C | |
| | | Year Ended
September 30,
2022
| | | Year Ended
September 30,
2021
| | | Year Ended
September 30,
2020
| | | Year Ended
September 30,
2019
| | | Year Ended
September 30,
2018
| |
Net asset value, beginning of the period | | $ | 11.38 | | | $ | 11.54 | | | $ | 11.35 | | | $ | 11.10 | | | $ | 11.33 | |
| | | | | | | | | | | | | | | | | | | | |
INCOME (LOSS) FROM INVESTMENT OPERATIONS: | |
Net investment income (loss)(a) | | | (0.02 | ) | | | (0.05 | ) | | | 0.02 | | | | 0.06 | | | | 0.03 | |
Net realized and unrealized gain (loss) | | | (0.71 | ) | | | (0.11 | ) | | | 0.24 | | | | 0.34 | | | | (0.13 | ) |
| | | | | | | | | | | | | | | | | | | | |
Total from Investment Operations | | | (0.73 | ) | | | (0.16 | ) | | | 0.26 | | | | 0.40 | | | | (0.10 | ) |
| | | | | | | | | | | | | | | | | | | | |
LESS DISTRIBUTIONS FROM: | |
Net investment income | | | (0.03 | ) | | | (0.00 | )(b) | | | (0.07 | ) | | | (0.15 | ) | | | (0.13 | ) |
| | | | | | | | | | | | | | | | | | | | |
Net asset value, end of the period | | $ | 10.62 | | | $ | 11.38 | | | $ | 11.54 | | | $ | 11.35 | | | $ | 11.10 | |
| | | | | | | | | | | | | | | | | | | | |
Total return(c) | | | (6.43 | )%(d) | | | (1.35 | )%(d) | | | 2.34 | % | | | 3.64 | % | | | (0.91 | )% |
RATIOS TO AVERAGE NET ASSETS: | |
Net assets, end of the period (000’s) | | $ | 14,145 | | | $ | 24,922 | | | $ | 19,628 | | | $ | 22,142 | | | $ | 23,341 | |
Net expenses | | | 1.45 | %(e) | | | 1.48 | %(e)(f) | | | 1.53 | %(g) | | | 1.55 | % | | | 1.55 | % |
Gross expenses | | | 1.48 | % | | | 1.49 | % | | | 1.53 | % | | | 1.55 | % | | | 1.55 | % |
Net investment income (loss) | | | (0.16 | )% | | | (0.40 | )% | | | 0.18 | % | | | 0.57 | % | | | 0.24 | % |
Portfolio turnover rate | | | 203 | % | | | 247 | % | | | 319 | %(h) | | | 527 | %(h) | | | 157 | % |
| (a) | Per share net investment income (loss) has been calculated using the average shares outstanding during the period. |
| (b) | Amount rounds to less than $0.01 per share. |
| (c) | A contingent deferred sales charge for Class C shares is not reflected in total return calculations. |
| (d) | Had certain expenses not been waived/reimbursed during the period, total returns would have been lower. |
| (e) | The investment adviser agreed to waive its fees and/or reimburse a portion of the Fund’s expenses during the period. Without this waiver/reimbursement, expenses would have been higher. |
| (f) | Effective July 1, 2021, the expense limit decreased from 1.50% to 1.45%. |
| (g) | Effective July 1, 2020, the expense limit decreased from 1.55% to 1.50%. |
| (h) | The variation in the Fund’s turnover rate from 2018 to 2020 is due to changes in volume of U.S. Treasury securities related to certain trading strategies. |
See accompanying notes to financial statements.
107 |
Financial Highlights (continued)
For a share outstanding throughout each period
| | | | | | | | | | | | | | | | | | | | |
| | | Limited Term Government and Agency Fund—Class N | |
| | | Year Ended
September 30,
2022
| | | Year Ended
September 30,
2021
| | | Year Ended
September 30,
2020
| | | Year Ended
September 30,
2019
| | | Year Ended
September 30,
2018
| |
Net asset value, beginning of the period | | $ | 11.43 | | | $ | 11.57 | | | $ | 11.37 | | | $ | 11.12 | | | $ | 11.36 | |
| | | | | | | | | | | | | | | | | | | | |
INCOME (LOSS) FROM INVESTMENT OPERATIONS: | |
Net investment income(a) | | | 0.11 | | | | 0.08 | | | | 0.14 | | | | 0.19 | | | | 0.15 | |
Net realized and unrealized gain (loss) | | | (0.73 | ) | | | (0.11 | ) | | | 0.26 | | | | 0.33 | | | | (0.14 | ) |
| | | | | | | | | | | | | | | | | | | | |
Total from Investment Operations | | | (0.62 | ) | | | (0.03 | ) | | | 0.40 | | | | 0.52 | | | | 0.01 | |
| | | | | | | | | | | | | | | | | | | | |
LESS DISTRIBUTIONS FROM: | |
Net investment income | | | (0.13 | ) | | | (0.11 | ) | | | (0.20 | ) | | | (0.27 | ) | | | (0.25 | ) |
| | | | | | | | | | | | | | | | | | | | |
Net asset value, end of the period | | $ | 10.68 | | | $ | 11.43 | | | $ | 11.57 | | | $ | 11.37 | | | $ | 11.12 | |
| | | | | | | | | | | | | | | | | | | | |
Total return(b) | | | (5.45 | )% | | | (0.25 | )% | | | 3.53 | % | | | 4.77 | % | | | 0.09 | % |
RATIOS TO AVERAGE NET ASSETS: | |
Net assets, end of the period (000’s) | | $ | 19,656 | | | $ | 12,972 | | | $ | 11,035 | | | $ | 5,272 | | | $ | 3,176 | |
Net expenses(c) | | | 0.39 | % | | | 0.40 | %(d) | | | 0.45 | %(e) | | | 0.46 | % | | | 0.46 | % |
Gross expenses | | | 0.40 | % | | | 0.41 | % | | | 0.46 | % | | | 0.48 | % | | | 0.48 | % |
Net investment income | | | 1.03 | % | | | 0.68 | % | | | 1.20 | % | | | 1.65 | % | | | 1.37 | % |
Portfolio turnover rate | | | 203 | % | | | 247 | % | | | 319 | %(f) | | | 527 | %(f) | | | 157 | % |
| (a) | Per share net investment income has been calculated using the average shares outstanding during the period. |
| (b) | Had certain expenses not been waived/reimbursed during the period, total returns would have been lower. |
| (c) | The investment adviser agreed to waive its fees and/or reimburse a portion of the Fund’s expenses during the period. Without this waiver/reimbursement, expenses would have been higher. |
| (d) | Effective July 1, 2021, the expense limit decreased from 0.45% to 0.40%. |
| (e) | Effective July 1, 2020, the expense limit decreased from 0.50% to 0.45%. |
| (f) | The variation in the Fund’s turnover rate from 2018 to 2020 is due to changes in volume of U.S. Treasury securities related to certain trading strategies. |
See accompanying notes to financial statements.
| 108
Financial Highlights (continued)
For a share outstanding throughout each period
| | | | | | | | | | | | | | | | | | | | |
| | | Limited Term Government and Agency Fund—Class Y | |
| | | Year Ended
September 30,
2022 | | | Year Ended
September 30,
2021 | | | Year Ended
September 30,
2020 | | | Year Ended
September 30,
2019 | | | Year Ended
September 30,
2018 | |
Net asset value, beginning of the period | | $ | 11.43 | | | $ | 11.57 | | | $ | 11.38 | | | $ | 11.13 | | | $ | 11.36 | |
| | | | | | | | | | | | | | | | | | | | |
INCOME (LOSS) FROM INVESTMENT OPERATIONS: | |
Net investment income(a) | | | 0.10 | | | | 0.07 | | | | 0.13 | | | | 0.17 | | | | 0.14 | |
Net realized and unrealized gain (loss) | | | (0.72 | ) | | | (0.11 | ) | | | 0.25 | | | | 0.34 | | | | (0.13 | ) |
| | | | | | | | | | | | | | | | | | | | |
Total from Investment Operations | | | (0.62 | ) | | | (0.04 | ) | | | 0.38 | | | | 0.51 | | | | 0.01 | |
| | | | | | | | | | | | | | | | | | | | |
LESS DISTRIBUTIONS FROM: | |
Net investment income | | | (0.12 | ) | | | (0.10 | ) | | | (0.19 | ) | | | (0.26 | ) | | | (0.24 | ) |
| | | | | | | | | | | | | | | | | | | | |
Net asset value, end of the period | | $ | 10.69 | | | $ | 11.43 | | | $ | 11.57 | | | $ | 11.38 | | | $ | 11.13 | |
| | | | | | | | | | | | | | | | | | | | |
Total return | | | (5.42 | )%(b) | | | (0.33 | )%(b) | | | 3.35 | % | | | 4.67 | % | | | 0.09 | % |
RATIOS TO AVERAGE NET ASSETS: | |
Net assets, end of the period (000’s) | | $ | 491,162 | | | $ | 707,904 | | | $ | 691,616 | | | $ | 457,248 | | | $ | 366,847 | |
Net expenses | | | 0.45 | %(c) | | | 0.48 | %(c)(d) | | | 0.53 | %(e) | | | 0.55 | % | | | 0.55 | % |
Gross expenses | | | 0.48 | % | | | 0.49 | % | | | 0.53 | % | | | 0.55 | % | | | 0.55 | % |
Net investment income | | | 0.87 | % | | | 0.61 | % | | | 1.11 | % | | | 1.55 | % | | | 1.26 | % |
Portfolio turnover rate | | | 203 | % | | | 247 | % | | | 319 | %(f) | | | 527 | %(f) | | | 157 | % |
| (a) | Per share net investment income has been calculated using the average shares outstanding during the period. |
| (b) | Had certain expenses not been waived/reimbursed during the period, total returns would have been lower. |
| (c) | The investment adviser agreed to waive its fees and/or reimburse a portion of the Fund’s expenses during the period. Without this waiver/reimbursement, expenses would have been higher. |
| (d) | Effective July 1, 2021, the expense limit decreased from 0.50% to 0.45%. |
| (e) | Effective July 1, 2020, the expense limit decreased from 0.55% to 0.50%. |
| (f) | The variation in the Fund’s turnover rate from 2018 to 2020 is due to changes in volume of U.S. Treasury securities related to certain trading strategies. |
See accompanying notes to financial statements.
109 |
Notes to Financial Statements
September 30, 2022
1. Organization. Natixis Funds Trust I, Loomis Sayles Funds I and Loomis Sayles Funds II (the “Trusts” and each a “Trust”) are each organized as a Massachusetts business trust. Each Trust is registered under the Investment Company Act of 1940, as amended (the “1940 Act”) as an open-end management investment company. Each Declaration of Trust permits the Board of Trustees to authorize the issuance of an unlimited number of shares of the Trust in multiple series. The financial statements for certain funds of the Trusts are presented in separate reports. The following funds (individually, a “Fund” and collectively, the “Funds”) are included in this report:
Natixis Funds Trust I:
Loomis Sayles Core Plus Bond Fund (the “Core Plus Bond Fund”)
Loomis Sayles Funds I:
Loomis Sayles Intermediate Duration Bond Fund (the “Intermediate Duration Bond Fund”)
Loomis Sayles Funds II:
Loomis Sayles Credit Income Fund (the “Credit Income Fund”)
Loomis Sayles Global Allocation Fund (the “Global Allocation Fund”)
Loomis Sayles Growth Fund (the “Growth Fund”)
Loomis Sayles Limited Term Government and Agency Fund (the “Limited Term Government and Agency Fund”)
Each Fund is a diversified investment company.
Each Fund, except Growth Fund, offers Class A, Class C, Class N and Class Y shares. Growth Fund was closed to new investors effective April 28, 2017. Growth Fund offers Class A, Class C, Class N, and Class Y shares to defined contribution and defined benefit plans, clients of registered investment advisers and registered representatives trading through intermediary programs/platforms on which the Fund is already available and existing shareholders.
Class A shares are sold with a maximum front-end sales charge of 4.25% for Core Plus Bond Fund, Credit Income Fund and Intermediate Duration Bond Fund, 5.75% for Global Allocation Fund and Growth Fund, and 2.25% for Limited Term Government and Agency Fund. Class C shares do not pay a front-end sales charge, pay higher Rule 12b-1 fees than Class A shares for eight years (at which point they automatically convert to Class A shares) (prior to May 1, 2021, Class C shares automatically converted to Class A shares after ten years) and may be subject to a contingent deferred sales charge (“CDSC”) of 1.00% if those shares are redeemed within one year of acquisition, except for reinvested distributions. Class N and Class Y shares do not pay a front-end sales charge, a CDSC or Rule 12b-1 fees. Class N shares are offered with an initial minimum investment of $1,000,000. Class Y shares are offered with an initial minimum investment of $100,000. Certain categories of investors are exempted from the minimum investment amounts for Class N and Class Y as outlined in the relevant Funds’ prospectus.
Most expenses can be directly attributed to a Fund. Expenses which cannot be directly attributed to a Fund are generally apportioned based on the relative net assets of each of the Funds in Natixis Funds Trust I, Natixis Funds Trust II, Natixis Funds Trust IV and Gateway Trust (“Natixis Funds Trusts”), Loomis Sayles Funds I and Loomis Sayles Funds II (“Loomis Sayles Funds Trusts”), and Natixis ETF Trust and Natixis ETF Trust II (“Natixis ETF Trusts”). Expenses of a Fund are borne pro rata by the holders of each class of shares, except that each class bears expenses unique to that class (such as the Rule 12b-1 fees applicable to Class A and Class C), and transfer agent fees are borne collectively for Class A, Class C and Class Y, and individually for Class N. In addition, each class votes as a class only with respect to its own Rule 12b-1 Plan. Shares of each class would receive their pro rata share of the net assets of the Fund if the Fund were liquidated. The Trustees approve separate distributions from net investment income on each class of shares.
2. Significant Accounting Policies. The following is a summary of significant accounting policies consistently followed by each Fund in the preparation of its financial statements. The Funds’ financial statements follow the accounting and reporting guidelines provided for investment companies and are prepared in accordance with accounting principles generally accepted in the United States of America which require the use of management estimates that affect the reported amounts and disclosures in the financial statements. Actual results could differ from those estimates. Management has evaluated the events and transactions subsequent to year-end through the date the financial statements were issued and has determined that there were no material events that would require disclosure in the Funds’ financial statements.
a. Valuation. Registered investment companies are required to value portfolio investments using an unadjusted, readily available market quotation. Each Fund obtains readily available market quotations from independent pricing services. Fund investments for which readily available market quotations are not available are priced at fair value pursuant to the Funds’ Valuation Procedures. The Board of Trustees has approved a valuation designee who is subject to the Board’s oversight.
Unadjusted readily available market quotations that are utilized for exchange traded equity securities (including shares of closed-end investment companies and exchange-traded funds) include the last sale price quoted on the exchange where the security is traded
| 110
Notes to Financial Statements (continued)
September 30, 2022
most extensively. Futures contracts are valued at the closing settlement price on the exchange on which the valuation designee believes that, over time, they are traded most extensively. Shares of open-end investment companies are valued at net asset value per share.
Exchange traded equity securities for which there is no reported sale during the day are fair valued at the closing bid quotation as reported by an independent pricing service. Unlisted equity securities (except unlisted preferred equity securities) are fair valued at the last sale price quoted in the market where they are traded most extensively or, if there is no reported sale during the day, the closing bid quotation as reported by an independent pricing service. If there is no last sale price or closing bid quotation available, unlisted equity securities will be fair valued using evaluated bids furnished by an independent pricing service, if available.
Debt securities and unlisted preferred equity securities are fair valued based on evaluated bids furnished to the Funds by an independent pricing service or bid prices obtained from broker-dealers. Short sales of debt investments are fair valued based on an evaluated ask price furnished to the Funds by an independent pricing service. Senior loans and collateralized loan obligations are fair valued at bid prices supplied by an independent pricing service, if available. Broker-dealer bid prices may be used to fair value debt, unlisted equities, senior loans and collateralized loan obligations where an independent pricing service is unable to price an investment or where an independent pricing service does not provide a reliable price for the investment. Forward foreign currency contracts are fair valued utilizing interpolated rates determined based on information provided by an independent pricing service. Bilateral credit default swaps are fair valued based on mid prices (between the bid price and the ask price) supplied by an independent pricing service. Bilateral interest rate swaps are fair valued based on prices supplied by an independent pricing source. Centrally cleared swap agreements are fair valued at settlement prices of the clearing house on which the contracts were traded or prices obtained from broker-dealers.
The Funds may also fair value investments in other circumstances such as when extraordinary events occur after the close of a foreign market, but prior to the close of the New York Stock Exchange. This may include situations relating to a single issuer (such as a declaration of bankruptcy or a delisting of the issuer’s security from the primary market on which it has traded) as well as events affecting the securities markets in general (such as market disruptions or closings and significant fluctuations in U.S. and/or foreign markets). When fair valuing a Fund’s investments, the valuation designee may, among other things, use modeling tools or other processes that may take into account factors such as issuer specific information, or other related market activity and/or information that occurred after the close of the foreign market but before the time the Fund’s net asset value (“NAV”) is calculated. Fair valuation by the Fund(s) valuation designee may require subjective determinations about the value of the investment, and fair values used to determine a Fund’s NAV may differ from quoted or published prices, or from prices that are used by others, for the same investments. In addition, the use of fair value pricing may not always result in adjustments to the prices of investments held by a Fund.
b. Investment Transactions and Related Investment Income. Investment transactions are accounted for on a trade date plus one day basis for daily NAV calculation. However, for financial reporting purposes, investment transactions are reported on trade date. Dividend income (including income reinvested) and foreign withholding tax, if applicable, is recorded on the ex-dividend date, or in the case of certain foreign securities, as soon as a Fund is notified, and interest income is recorded on an accrual basis. Loan consent fees, upfront origination fees and/or amendment fees are recorded when received and included in interest income on the Statements of Operations. Interest income is increased by the accretion of discount and decreased by the amortization of premium, if applicable. Periodic principal adjustments for inflation-protected securities are recorded to interest income. Negative principal adjustments (in the event of deflation) are recorded as reductions of interest income to the extent of interest income earned, not to exceed the amount of positive principal adjustments on a cumulative basis. For securities with paydown provisions, principal payments received are treated as a proportionate reduction to the cost basis of the securities, and excess or shortfall amounts are recorded as income. In determining net gain or loss on securities sold, the cost of securities has been determined on an identified cost basis. Investment income, non-class specific expenses and realized and unrealized gains and losses are allocated on a pro rata basis to each class based on the relative net assets of each class to the total net assets of the Fund.
c. Short Sales. A short sale is a transaction in which a Fund sells a security it does not own, usually in anticipation of a decline in the fair market value of the security. When closing out a short position, a Fund will have to purchase the security it originally sold short. The value of short sales is reflected as a liability in the Statements of Assets and Liabilities and is marked-to-market daily. A Fund will realize a profit from closing out a short position if the price of the security sold short has declined since the short position was opened; a Fund will realize a loss from closing out a short position if the value of the shorted security has risen since the short position was opened. Because there is no upper limit on the price to which a security can rise, short selling exposes a Fund to potentially unlimited losses. The Funds intend to cover their short sale transactions by segregating or earmarking liquid assets, such that the segregated/earmarked amount, equals the current market value of the securities underlying the short sale.
For the year ended September 30, 2022, Core Plus Bond Fund engaged in short sales.
111 |
Notes to Financial Statements (continued)
September 30, 2022
d. Foreign Currency Translation. The books and records of the Funds are maintained in U.S. dollars. The values of securities, currencies and other assets and liabilities denominated in currencies other than U.S. dollars, if any, are translated into U.S. dollars based upon foreign exchange rates prevailing at the end of the period. Purchases and sales of investment securities, income and expenses are translated into U.S. dollars on the respective dates of such transactions.
Net realized foreign exchange gains or losses arise from sales of foreign currency, changes in exchange rates between the trade and settlement dates on securities transactions and the difference between the amounts of dividends, interest and foreign withholding taxes recorded in the Funds’ books and records and the U.S. dollar equivalent of the amounts actually received or paid. Net unrealized foreign exchange gains or losses arise from changes in the value of assets and liabilities, other than investment securities, as of the end of the fiscal period, resulting from changes in exchange rates. Net realized foreign exchange gains or losses and the net change in unrealized foreign exchange gains or losses are disclosed in the Statements of Operations. For federal income tax purposes, net realized foreign exchange gains or losses are characterized as ordinary income and may, if the Funds have net losses, reduce the amount of income available to be distributed by the Funds.
The values of investment securities are presented at the foreign exchange rates prevailing at the end of the period for financial reporting purposes. Net realized and unrealized gains or losses on investments reported in the Statements of Operations reflect gains or losses resulting from changes in exchange rates and fluctuations which arise due to changes in market prices of investment securities. For federal income tax purposes, a portion of the net realized gain or loss on investments arising from changes in exchange rates, which is reflected in the Statements of Operations, may be characterized as ordinary income and may, if the Funds have net losses, reduce the amount of income available to be distributed by the Funds.
The Funds may use foreign currency exchange contracts to facilitate transactions in foreign-denominated investments. Losses may arise from changes in the value of the foreign currency or if the counterparties do not perform under the contracts’ terms.
e. Forward Foreign Currency Contracts. A Fund may enter into forward foreign currency contracts, including forward foreign cross currency contracts to acquire exposure to foreign currencies or to hedge the Funds’ investments against currency fluctuation. A contract can also be used to offset a previous contract. These contracts involve market risk in excess of the unrealized appreciation (depreciation) reflected in the Funds’ Statements of Assets and Liabilities. The U.S. dollar value of the currencies a Fund has committed to buy or sell represents the aggregate exposure to each currency the Fund has acquired or hedged through currency contracts outstanding at period end. Gains or losses are recorded for financial statement purposes as unrealized until settlement date. Contracts are traded over-the-counter directly with a counterparty. Risks may arise upon entering into these contracts from the potential inability of counterparties to meet the terms of their contracts and from unanticipated movements in the value of a foreign currency relative to the U.S. dollar. Certain contracts may require the movement of cash and/or securities as collateral for the Funds’ or counterparty’s net obligations under the contracts. Forward foreign currency contracts outstanding at the end of the period, if any, are listed in each applicable Fund’s Portfolio of Investments.
f. Futures Contracts. A Fund may enter into futures contracts. Futures contracts are agreements between two parties to buy and sell a particular instrument or index for a specified price on a specified future date.
When a Fund enters into a futures contract, it is required to deposit with (or for the benefit of) its broker an amount of cash or short-term high-quality securities as “initial margin.” As the value of the contract changes, the value of the futures contract position increases or declines. Subsequent payments, known as “variation margin,” are made or received by a Fund, depending on the price fluctuations in the fair value of the contract and the value of cash or securities on deposit with the broker. The aggregate principal amounts of the contracts are not recorded in the financial statements. Daily fluctuations in the value of the contracts are recorded in the Statements of Assets and Liabilities as a receivable (payable) and in the Statements of Operations as unrealized appreciation (depreciation) until the contracts are closed, when they are recorded as realized gains (losses). Realized gain or loss on a futures position is equal to the difference between the value of the contract at the time it was opened and the value at the time it was closed, minus brokerage commissions. When a Fund enters into a futures contract certain risks may arise, such as illiquidity in the futures market, which may limit a Fund’s ability to close out a futures contract prior to settlement date, and unanticipated movements in the value of securities or interest rates. Futures contracts outstanding at the end of the period, if any, are listed in each applicable Fund’s Portfolio of Investments.
Futures contracts are exchange-traded. Exchange-traded futures contracts are standardized and are settled through a clearing house with fulfillment supported by the credit of the exchange. Therefore, counterparty credit risks to the Funds are reduced; however, in the event that a counterparty enters into bankruptcy, a Fund’s claim against initial/variation margin on deposit with the counterparty may be subject to terms of a final settlement in bankruptcy court.
g. Swap Agreements. A Fund may enter into credit default swaps. A credit default swap is an agreement between two parties (the “protection buyer” and “protection seller”) to exchange the credit risk of an issuer (“reference obligation”) for a specified time period.
| 112
Notes to Financial Statements (continued)
September 30, 2022
The reference obligation may be one or more debt securities or an index of such securities. The Funds may be either the protection buyer or the protection seller. As a protection buyer, the Funds have the ability to hedge the downside risk of an issuer or group of issuers. As a protection seller, the Funds have the ability to gain exposure to an issuer or group of issuers whose bonds are unavailable or in short supply in the cash bond market, as well as realize additional income in the form of fees paid by the protection buyer. The protection buyer is obligated to pay the protection seller a stream of payments (“fees”) over the term of the contract, provided that no credit event, such as a default or a downgrade in credit rating, occurs on the reference obligation. The Funds may also pay or receive upfront premiums. If a credit event occurs, the protection seller must pay the protection buyer the difference between the agreed upon notional value and market value of the reference obligation. Market value in this case is determined by a facilitated auction whereby a minimum number of allowable broker bids, together with a specified valuation method, are used to calculate the value. The maximum potential amount of undiscounted future payments that a Fund as the protection seller could be required to make under a credit default swap agreement would be an amount equal to the notional amount of the agreement.
Implied credit spreads, represented in absolute terms, are disclosed in the Portfolio of Investments for those agreements for which the Fund is the protection seller. Implied credit spreads serve as an indicator of the current status of the payment/performance risk and represent the likelihood or risk of default for the credit derivative. The implied credit spread of a particular reference entity reflects the cost of buying/selling protection and may include upfront payments required to be made to enter into the agreement. Wider credit spreads represent a deterioration of the reference entity’s credit soundness and a greater likelihood or risk of default or other credit event occurring as defined under the terms of the agreement.
The notional amounts of swap agreements are not recorded in the financial statements. Swap agreements are valued daily and fluctuations in the value are recorded in the Statements of Operations as change in unrealized appreciation (depreciation) on swap agreements. Fees are accrued in accordance with the terms of the agreement and are recorded in the Statement of Assets and Liabilities as part of unrealized appreciation (depreciation) on swap agreements. When received or paid, fees are recorded in the Statement of Operations as realized gain or loss. Upfront premiums paid or received by the Funds are recorded on the Statements of Assets and Liabilities as an asset or liability, respectively, and are amortized or accreted over the term of the agreement and recorded as realized gain or loss. Payments made or received by the Funds as a result of a credit event or termination of the agreement are recorded as realized gain or loss.
Swap agreements are privately negotiated in the over-the-counter (“OTC”) market and may be entered into as a bilateral contract or centrally cleared (“centrally cleared swaps”). Bilateral swap agreements are traded between counterparties and, as such, are subject to the risk that a party to the agreement will not be able to meet its obligations. In a centrally cleared swap, immediately following execution of the swap agreement, the swap agreement is novated to a central counterparty (the “CCP”) and the Fund faces the CCP through a broker. Upon entering into a centrally cleared swap, the Fund is required to deposit initial margin with the broker in the form of cash or securities in an amount that varies depending on the size and risk profile of the particular swap. Subsequent payments, known as “variation margin,” are made or received by the Fund based on the daily change in the value of the centrally cleared swap agreement. For centrally cleared swaps, the Fund’s counterparty credit risk is reduced as the CCP stands between the Fund and the counterparty. The Funds cover their net obligations under outstanding swap agreements by segregating or earmarking cash or securities. Swap agreements outstanding at the end of the period, if any, are listed in each applicable Fund’s Portfolio of Investments.
h. When-Issued and Delayed Delivery Transactions. A Fund may enter into when-issued or delayed delivery transactions. When-issued refers to transactions made conditionally because a security, although authorized, has not been issued. Delayed delivery refers to transactions for which delivery or payment will occur at a later date, beyond the normal settlement period. The price of when-issued and delayed delivery securities and the date when the securities will be delivered and paid for are fixed at the time the transaction is negotiated. The security and the obligation to pay for it are recorded by the Funds at the time the commitment is entered into. The value of the security may vary with market fluctuations during the time before the Funds take delivery of the security. No interest accrues to the Funds until the transaction settles.
Delayed delivery transactions include those designated as To Be Announced (“TBAs”) in the Portfolios of Investments. For TBAs, the actual security that will be delivered to fulfill the transaction is not designated at the time of the trade. The security is “to be announced” 48 hours prior to the established trade settlement date. Certain transactions require the Funds or counterparty to post cash and/or securities as collateral for the net mark-to-market exposure to the other party. The Funds cover their net obligations under outstanding delayed delivery commitments by segregating or earmarking cash or securities.
Purchases of when-issued or delayed delivery securities may have a similar effect on the Funds’ NAV as if the Funds’ had created a degree of leverage in the portfolio. Risks may arise upon entering into such transactions from the potential inability of counterparties to meet their obligations under the transactions. Additionally, losses may arise due to changes in the value of the underlying securities.
i. Federal and Foreign Income Taxes. The Trusts treat each Fund as a separate entity for federal income tax purposes. Each Fund intends to meet the requirements of the Internal Revenue Code of 1986, as amended, applicable to regulated investment companies,
113 |
Notes to Financial Statements (continued)
September 30, 2022
and to distribute to its shareholders substantially all of its net investment income and any net realized capital gains at least annually. Management has performed an analysis of each Fund’s tax positions for the open tax years as of September 30, 2022 and has concluded that no provisions for income tax are required. The Funds’ federal tax returns for the prior three fiscal years, where applicable, remain subject to examination by the Internal Revenue Service. Management is not aware of any events that are reasonably possible to occur in the next twelve months that would result in the amounts of any unrecognized tax benefits significantly increasing or decreasing for the Funds. However, management’s conclusions regarding tax positions taken may be subject to review and adjustment at a later date based on factors including, but not limited to, new tax laws and accounting regulations and interpretations thereof.
A Fund may be subject to foreign withholding taxes on investment income and taxes on capital gains on investments that are accrued and paid based upon the Fund’s understanding of the tax rules and regulations that exist in the countries in which the Fund invests. Foreign withholding taxes on dividend and interest income are reflected on the Statements of Operations as a reduction of investment income, net of amounts that have been or are expected to be reclaimed and paid. Dividends and interest receivable on the Statements of Assets and Liabilities are net of foreign withholding taxes. Foreign withholding taxes where reclaims have been or are expected to be filed and paid are reflected on the Statements of Assets and Liabilities as tax reclaims receivable. Capital gains taxes paid are included in net realized gain (loss) on investments in the Statements of Operations. Accrued but unpaid capital gains taxes are reflected as foreign taxes payable on the Statements of Assets and Liabilities, if applicable, and reduce unrealized gains on investments. In the event that realized gains on investments are subsequently offset by realized losses, taxes paid on realized gains may be returned to a Fund. Such amounts, if applicable, are reflected as foreign tax rebates receivable on the Statements of Assets and Liabilities and are recorded as a realized gain when received.
Certain Funds have filed tax reclaims for previously withheld taxes on dividends earned in certain European Union countries (EU reclaims) and may continue to make such filings when it is determined to be in the best interest of the Funds and their shareholders. These filings are subject to various administrative proceedings by the local jurisdictions’ tax authorities within the European Union, as well as a number of related judicial proceedings. EU reclaims are recognized by a Fund when deemed more likely than not to be collected, and are reflected as a reduction of foreign taxes withheld in the Statements of Operations. Any related receivable is reflected as tax reclaims receivable in the Statements of Assets and Liabilities. Under certain circumstances, EU reclaims may be subject to closing agreements with the Internal Revenue Service (IRS), which may materially reduce the reclaim amounts realized by the Funds. Fees and expenses associated with closing agreements will be reflected in the Statements of Operations when it is determined that a closing agreement with the IRS is required.
j. Dividends and Distributions to Shareholders. Dividends and distributions are recorded on the ex-dividend date. The timing and characterization of certain income and capital gain distributions are determined in accordance with federal tax regulations, which may differ from accounting principles generally accepted in the United States of America. Permanent differences are primarily due to differing treatments for book and tax purposes of items such as foreign currency gains and losses, net operating losses, premium amortization and paydown gains and losses. Permanent book and tax basis differences relating to shareholder distributions will result in reclassifications to capital accounts reported on the Statements of Assets and Liabilities. Temporary differences between book and tax distributable earnings are primarily due to deferred Trustees’ fees, forward foreign currency contract mark-to-market, wash sales, premium amortization foreign currency gains and losses, futures contract mark-to-market and paydown gains and losses. Amounts of income and capital gain available to be distributed on a tax basis are determined annually, and at other times during the Funds’ fiscal year as may be necessary to avoid knowingly declaring and paying a return of capital distribution. Distributions from net investment income and net realized short-term capital gains are considered to be distributed from ordinary income for tax purposes.
The tax characterization of distributions is determined on an annual basis. The tax character of distributions paid to shareholders during the years ended September 30, 2022 and 2021 was as follows:
| | | | | | | | | | | | | | | | | | | | | | | | |
| | | 2022 Distributions | | | 2021 Distributions | |
Fund | | Ordinary
Income | | | Long-Term
Capital
Gains | | | Total | | | Ordinary
Income | | | Long-Term
Capital
Gains | | | Total | |
Core Plus Bond Fund | | $ | 203,923,706 | | | $ | 17,404,702 | | | $ | 221,328,408 | | | $ | 363,707,896 | | | $ | 35,563,095 | | | $ | 399,270,991 | |
Credit Income Fund | | | 778,535 | | | | 45,086 | | | | 823,621 | | | | 779,271 | | | | — | | | | 779,271 | |
Global Allocation Fund | | | 17,835,692 | | | | 349,351,833 | | | | 367,187,525 | | | | 26,444,526 | | | | 229,409,750 | | | | 255,854,276 | |
Growth Fund | | | 38,655,122 | | | | 627,018,288 | | | | 665,673,410 | | | | 24,536,652 | | | | 508,298,281 | | | | 532,834,933 | |
Intermediate Duration Bond Fund | | | 6,692,992 | | | | 1,181,959 | | | | 7,874,951 | | | | 12,774,431 | | | | 1,137,809 | | | | 13,912,240 | |
Limited Term Government and Agency Fund | | | 9,340,395 | | | | — | | | | 9,340,395 | | | | 8,302,317 | | | | — | | | | 8,302,317 | |
| 114
Notes to Financial Statements (continued)
September 30, 2022
Distributions paid to shareholders from net investment income and net realized capital gains, based on accounting principles generally accepted in the United States of America, are consolidated and reported on the Statements of Changes in Net Assets as Distributions to Shareholders. Distributions paid to shareholders from net investment income and net realized capital gains expressed in per-share amounts, based on accounting principles generally accepted in the United States of America, are separately stated and reported within the Financial Highlights.
As of September 30, 2022, the components of distributable earnings on a tax basis were as follows:
| | | | | | | | | | | | | | | | |
| | | Core Plus Bond
Fund | | | Credit Income
Fund | | | Global
Allocation
Fund | | | Growth Fund | |
Undistributed ordinary income | | $ | 2,398,474 | | | $ | 100,896 | | | $ | — | | | $ | 1,801,992 | |
Undistributed long-term capital gains | | | — | | | | 38,241 | | | | 254,473,665 | | | | 1,212,454,444 | |
| | | | | | | | | | | | | | | | |
Total undistributed earnings | | | 2,398,474 | | | | 139,137 | | | | 254,473,665 | | | | 1,214,256,436 | |
| | | | | | | | | | | | | | | | |
Capital loss carryforward: | | | | | | | | | | | | | | | | |
Short-term: | | | | | | | | | | | | | | | | |
No expiration date | | | (190,454,871 | ) | | | — | | | | — | | | | — | |
Long-term: | | | | | | | | | | | | | | | | |
No expiration date | | | (126,333,113 | ) | | | — | | | | — | | | | — | |
| | | | | | | | | | | | | | | | |
Total capital loss carryforward | | | (316,787,984 | ) | | | — | | | | — | | | | — | |
| | | | | | | | | | | | | | | | |
Late-year ordinary and post-October capital loss deferrals* | | | — | | | | — | | | | (32,949,657 | ) | | | — | |
| | | | | | | | | | | | | | | | |
Unrealized appreciation (depreciation) | | | (939,619,383 | ) | | | (4,254,087 | ) | | | (312,833,154 | ) | | | 1,772,351,926 | |
| | | | | | | | | | | | | | | | |
Total accumulated earnings (losses) | | $ | (1,254,008,893 | ) | | $ | (4,114,950 | ) | | $ | (91,309,146 | ) | | $ | 2,986,608,362 | |
| | | | | | | | | | | | | | | | |
| * | Under current tax law, net operating losses, capital losses, foreign currency losses, and losses on passive foreign investment companies and contingent payment debt instruments after October 31 or December 31, as applicable, may be deferred and treated as occurring on the first day of the following taxable year. Global Allocation Fund is deferring foreign currency losses. |
| | | | | | | | |
| | | Intermediate
Duration Bond
Fund | | | Limited Term
Government
and Agency
Fund | |
Undistributed ordinary income | | $ | 61,355 | | | $ | 382,029 | |
| | | | | | | | |
Capital loss carryforward: | | | | | | | | |
Short-term: | | | | | | | | |
No expiration date | | | (15,733,520 | ) | | | (6,200,137 | ) |
Long-term: | | | | | | | | |
No expiration date | | | (5,381,480 | ) | | | (46,724,620 | ) |
| | | | | | | | |
Total capital loss carryforward | | | (21,115,000 | ) | | | (52,924,757 | ) |
| | | | | | | | |
Unrealized depreciation | | | (22,326,069 | ) | | | (35,864,233 | ) |
| | | | | | | | |
Total accumulated losses | | $ | (43,379,714 | ) | | $ | (88,406,961 | ) |
| | | | | | | | |
115 |
Notes to Financial Statements (continued)
September 30, 2022
As of September 30, 2022, the tax cost of investments (including derivatives, if applicable) and unrealized appreciation (depreciation) on a federal tax basis were as follows:
| | | | | | | | | | | | | | | | | | | | | | | | |
| | | Core Plus Bond
Fund | | | Credit Income
Fund | | | Global
Allocation Fund | | | Growth Fund | | | Intermediate
Duration Bond Fund | | | Limited Term
Government
and Agency
Fund | |
Federal tax cost | | $ | 6,782,577,760 | | | $ | 24,588,150 | | | $ | 3,258,631,660 | | | $ | 7,731,211,345 | | | $ | 314,827,127 | | | $ | 806,695,585 | |
| | | | | | | | | | | | | | | | | | | | | | | | |
Gross tax appreciation | | $ | 13,522,679 | | | $ | 79,536 | | | $ | 172,525,710 | | | $ | 2,819,795,771 | | | $ | 8,776 | | | $ | 579,032 | |
Gross tax depreciation | | | (953,069,951 | ) | | | (4,333,623 | ) | | | (484,976,479 | ) | | | (1,047,125,552 | ) | | | (22,334,845 | ) | | | (36,443,265 | ) |
| | | | | | | | | | | | | | | | | | | | | | | | |
Net tax appreciation (depreciation) | | $ | (939,547,272 | ) | | $ | (4,254,087 | ) | | $ | (312,450,769 | ) | | $ | 1,772,670,219 | | | $ | (22,326,069 | ) | | $ | (35,864,233 | ) |
| | | | | | | | | | | | | | | | | | | | | | | | |
The difference between these amounts and those reported in the components of distributable earnings, if any, is primarily attributable to capital gains taxes and foreign exchange gains or losses.
k. Senior Loans. A Fund’s investment in senior loans may be to corporate, governmental or other borrowers. Senior loans, which include both secured and unsecured loans made by banks and other financial institutions to corporate customers, typically hold the most senior position in a borrower’s capital structure, may be secured by the borrower’s assets and have interest rates that reset frequently. Senior Loans can include term loans, revolving credit facility loans and second lien loans. A senior loan is often administered by a bank or other financial institution that acts as agent for all holders. The agent administers the terms of the senior loan, as specified in the loan agreement. Large loans may be shared or syndicated among several lenders. A Fund may enter into the primary syndicate for a loan or it may also purchase all or a portion of loans from other lenders (sometimes referred to as loan assignments), in either case becoming a direct lender. The settlement period for senior loans is uncertain as there is no standardized settlement schedule applicable to such investments. Senior loans outstanding at the end of the period, if any, are listed in each applicable Fund’s Portfolio of Investments.
l. Collateralized Loan Obligations. A Fund may invest in collateralized loan obligations (“CLOs”). A CLO is a type of asset-backed security designed to redirect the cash flows from a pool of leveraged loans to investors based on their risk preferences. Cash flows from a CLO are split into two or more portions, called tranches, varying in risk and yield. The risk of an investment in a CLO depends largely on the type of the collateralized securities and the class of the instrument in which the Fund invests. CLOs outstanding at the end of the period, if any, are listed in each applicable Fund’s Portfolio of Investments.
m. Repurchase Agreements. Each Fund may enter into repurchase agreements, under the terms of a Master Repurchase Agreement, under which each Fund acquires securities as collateral and agrees to resell the securities at an agreed upon time and at an agreed upon price. It is each Fund’s policy that the market value of the collateral for repurchase agreements be at least equal to 102% of the repurchase price, including interest. Certain repurchase agreements are tri-party arrangements whereby the collateral is held in a segregated account for the benefit of the Fund and on behalf of the counterparty. Repurchase agreements could involve certain risks in the event of default or insolvency of the counterparty, including possible delays or restrictions upon a Fund’s ability to dispose of the underlying securities. As of September 30, 2022, each Fund, as applicable, had investments in repurchase agreements for which the value of the related collateral exceeded the value of the repurchase agreement. The gross value of repurchase agreements is included in the Statements of Assets and Liabilities for financial reporting purposes.
n. Due to/from Brokers. Transactions and positions in certain futures, forward foreign currency contracts and swap agreements are maintained and cleared by registered U.S. broker/dealers pursuant to customer agreements between the Funds and the various broker/dealers. The due from brokers balance in the Statements of Assets and Liabilities for Core Plus Bond Fund represents cash pledged as initial margin for futures contracts. The due from brokers balance in the Statements of Assets and Liabilities for Credit Income Fund represents cash pledged as initial margin for closed centrally cleared swap agreements. The due from brokers balance in the Statements of Assets and Liabilities for Global Allocation Fund represents cash pledged as collateral for forward foreign currency contracts and as initial margin for futures contracts and closed centrally cleared swap agreements. The due from brokers balance in the Statements of Assets and Liabilities for Intermediate Duration Bond Fund represents cash pledged as initial margin for futures contracts. The due to brokers balance in the Statements of Assets and Liabilities for Global Allocation Fund represents cash received as collateral for forward foreign currency contracts. In certain circumstances a Fund’s use of cash held at brokers is restricted by regulation or broker mandated limits.
| 116
Notes to Financial Statements (continued)
September 30, 2022
o. Securities Lending. Each Fund, except Credit Income Fund, has entered into an agreement with State Street Bank and Trust Company (“State Street Bank”), as agent of the Funds, to lend securities to certain designated borrowers. The loans are collateralized with cash or securities in an amount equal to at least 105% or 102% of the market value (including accrued interest) of the loaned international or domestic securities, respectively, when the loan is initiated. Thereafter, the value of the collateral must remain at least 102% of the market value (including accrued interest) of loaned securities for U.S. equities and U.S. corporate debt; at least 105% of the market value (including accrued interest) of loaned securities for non-U.S. equities; and at least 100% of the market value (including accrued interest) of loaned securities for U.S. Government securities, sovereign debt issued by non-U.S. Governments and non-U.S. corporate debt. In the event that the market value of the collateral falls below the required percentages described above, the borrower will deliver additional collateral on the next business day. As with other extensions of credit, the Funds may bear the risk of loss with respect to the investment of the collateral. The Funds invest cash collateral in short-term investments, a portion of the income from which is remitted to the borrowers and the remainder allocated between the Funds and State Street Bank as lending agent.
For the year ended September 30, 2022, none of the Funds had loaned securities under this agreement.
p. Indemnifications. Under the Trusts’ organizational documents, their officers and Trustees are indemnified against certain liabilities arising out of the performance of their duties to the Funds. Additionally, in the normal course of business, the Funds enter into contracts with service providers that contain general indemnification clauses. The Funds’ maximum exposure under these arrangements is unknown as this would involve future claims that may be made against the Funds that have not yet occurred. However, based on experience, the Funds expect the risk of loss to be remote.
q. New Accounting Pronouncement. In June 2022, the Financial Accounting Standards Board issued Accounting Standards Update 2022-03, “Fair Value Measurement of Equity Securities Subject to Contractual Sale Restrictions” (“ASU 2022-03”). ASU 2022-03 clarifies the guidance in ASC 820 related to the measurement of fair value of an equity security subject to contractual sale restrictions, eliminating the ability to apply a discount to the fair value of such securities, and introducing related disclosure requirements. The guidance is effective for fiscal years, and interim periods within those fiscal years, beginning after December 15, 2023, and allows for early adoption. Management is currently evaluating the impact of applying this update.
In January 2021, the Financial Accounting Standards Board issued Accounting Standard Update 2021-01, Reference Rate Reform (Topic 848) (“ASU 2021-01”). ASU 2021-01 is an update of ASU 2020-04, which was issued in response to concerns about structural risks of interbank offered rates, and particularly the risk of cessation of the London Interbank Offered Rate (“LIBOR”), expected to occur no later than June 30, 2023. Regulators have undertaken reference rate reform initiatives to identify alternative reference rates that are more observable or transaction based and less susceptible to manipulation. ASU 2020-04 provides temporary guidance to ease the potential burden in accounting for (or recognizing the effects of) reference rate reform on financial reporting. ASU 2020-04 is elective and applies to all entities, subject to meeting certain criteria, that have contracts that reference LIBOR or another reference rate expected to be discontinued because of reference rate reform. ASU 2020-04 amendments offer optional expedients for contract modifications that would allow an entity to account for such modifications by prospectively adjusting the effective interest rate, instead of evaluating each contract, in accordance with existing accounting standards, as to whether reference rate modifications constitute the establishment of new contracts or the continuation of existing contracts. ASU 2021-01 clarifies that certain provisions in Topic 848, if elected by an entity, apply to derivative instruments that use an interest rate for margining, discounting, or contract price alignment that is modified as a result of reference rate reform. The amendments are currently effective and an entity may elect to apply its provisions as of any date from the beginning of an interim period that includes or is subsequent to March 12, 2020. Management expects to apply the optional expedients when appropriate.
3. Fair Value Measurements. In accordance with accounting standards related to fair value measurements and disclosures, the Funds have categorized the inputs utilized in determining the value of each Fund’s assets or liabilities. These inputs are summarized in the three broad levels listed below:
| | • | | Level 1 – quoted prices in active markets for identical assets or liabilities; |
| | • | | Level 2 – prices determined using other significant inputs that are observable either directly, or indirectly through corroboration with observable market data (which could include quoted prices for similar assets or liabilities, interest rates, credit risk, etc.); and |
| | • | | Level 3 – prices determined using significant unobservable inputs when quoted prices or observable inputs are unavailable such as when there is little or no market activity for an asset or liability (unobservable inputs reflect each Fund’s own assumptions in determining the fair value of assets or liabilities and would be based on the best information available). |
The inputs or methodology used for valuing securities are not necessarily an indication of the risk associated with investing in those securities.
117 |
Notes to Financial Statements (continued)
September 30, 2022
The Funds’ pricing policies have been approved by the Board of Trustees. Investments for which market quotations are readily available are categorized in Level 1. Other investments for which an independent pricing service is utilized are categorized in Level 2. Broker-dealer bid prices for which the Funds have knowledge of the inputs used by the broker-dealer are categorized in Level 2. All other investments, including broker-dealer bid prices for which the Funds do not have knowledge of the inputs used by the broker-dealer, as well as investments fair valued by the valuation designee, are categorized in Level 3. All Level 2 and 3 securities are defined as being fair valued.
Under certain conditions and based upon specific facts and circumstances, the Fund’s valuation designee may determine that a fair valuation should be made for portfolio investment(s). These valuation designee fair valuations will be based upon a significant amount of Level 3 inputs.
The following is a summary of the inputs used to value the Funds’ investments as of September 30, 2022, at value:
Core Plus Bond Fund
Asset Valuation Inputs
| | | | | | | | | | | | | | | | |
Description | | Level 1 | | | Level 2 | | | Level 3 | | | Total | |
Bonds and Notes | | | | | | | | | | | | | | | | |
Non-Convertible Bonds | | | | | | | | | | | | | | | | |
Collateralized Mortgage Obligations | | $ | — | | | $ | 7,404,821 | | | $ | 122,859 | | | $ | 7,527,680 | |
All Other Non-Convertible Bonds(a) | | | — | | | | 5,324,987,956 | | | | — | | | | 5,324,987,956 | |
| | | | | | | | | | | | | | | | |
Total Non-Convertible Bonds | | | — | | | | 5,332,392,777 | | | | 122,859 | | | | 5,332,515,636 | |
| | | | | | | | | | | | | | | | |
Municipals(a) | | | — | | | | 7,718,386 | | | | — | | | | 7,718,386 | |
| | | | | | | | | | | | | | | | |
Total Bonds and Notes | | | — | | | | 5,340,111,163 | | | | 122,859 | | | | 5,340,234,022 | |
| | | | | | | | | | | | | | | | |
Senior Loans(a) | | | — | | | | 168,585,158 | | | | — | | | | 168,585,158 | |
Collateralized Loan Obligations | | | — | | | | 102,287,601 | | | | — | | | | 102,287,601 | |
Short-Term Investments | | | — | | | | 231,923,707 | | | | — | | | | 231,923,707 | |
| | | | | | | | | | | | | | | | |
Total | | $ | — | | | $ | 5,842,907,629 | | | $ | 122,859 | | | $ | 5,843,030,488 | |
| | | | | | | | | | | | | | | | |
Liability Valuation Inputs
| | | | | | | | | | | | | | | | |
Description | | Level 1 | | | Level 2 | | | Level 3 | | | Total | |
Futures Contracts (unrealized depreciation) | | $ | (14,563,241 | ) | | $ | — | | | $ | — | | | $ | (14,563,241 | ) |
| | | | | | | | | | | | | | | | |
| (a) | Details of the major categories of the Fund’s investments are reflected within the Portfolio of Investments. |
Credit Income Fund
Asset Valuation Inputs
| | | | | | | | | | | | | | | | |
Description | | Level 1 | | | Level 2 | | | Level 3 | | | Total | |
Bonds and Notes(a) | | $ | — | | | $ | 18,678,691 | | | $ | — | | | $ | 18,678,691 | |
Collateralized Loan Obligations | | | — | | | | 654,709 | | | | — | | | | 654,709 | |
Preferred Stocks | | | | | | | | | | | | | | | | |
Wireless | | | — | | | | 281,225 | | | | — | | | | 281,225 | |
All Other Preferred Stocks(a) | | | 225,354 | | | | — | | | | — | | | | 225,354 | |
| | | | | | | | | | | | | | | | |
Total Preferred Stocks | | | 225,354 | | | | 281,225 | | | | — | | | | 506,579 | |
| | | | | | | | | | | | | | | | |
Short-Term Investments | | | — | | | | 494,084 | | | | — | | | | 494,084 | |
| | | | | | | | | | | | | | | | |
Total Investments | | | 225,354 | | | | 20,108,709 | | | | — | | | | 20,334,063 | |
| | | | | | | | | | | | | | | | |
Futures Contracts (unrealized appreciation) | | | 27,929 | | | | — | | | | — | | | | 27,929 | |
| | | | | | | | | | | | | | | | |
Total | | $ | 253,283 | | | $ | 20,108,709 | | | $ | — | | | $ | 20,361,992 | |
| | | | | | | | | | | | | | | | |
Liability Valuation Inputs
| | | | | | | | | | | | | | | | |
Description | | Level 1 | | | Level 2 | | | Level 3 | | | Total | |
Futures Contracts (unrealized depreciation) | | $ | (49,579 | ) | | $ | — | | | $ | — | | | $ | (49,579 | ) |
| | | | | | | | | | | | | | | | |
| (a) | Details of the major categories of the Fund’s investments are reflected within the Portfolio of Investments. |
| 118
Notes to Financial Statements (continued)
September 30, 2022
Global Allocation Fund
Asset Valuation Inputs
| | | | | | | | | | | | | | | | |
Description | | Level 1 | | | Level 2 | | | Level 3 | | | Total | |
Common Stocks | | | | | | | | | | | | | | | | |
France | | $ | — | | | $ | 126,150,449 | | | $ | — | | | $ | 126,150,449 | |
Hong Kong | | | — | | | | 17,118,056 | | | | — | | | | 17,118,056 | |
Japan | | | — | | | | 57,198,252 | | | | — | | | | 57,198,252 | |
Netherlands | | | — | | | | 77,797,832 | | | | — | | | | 77,797,832 | |
Sweden | | | — | | | | 57,938,355 | | | | — | | | | 57,938,355 | |
Taiwan | | | — | | | | 48,103,814 | | | | — | | | | 48,103,814 | |
United Kingdom | | | 82,733,936 | | | | 15,800,275 | | | | — | | | | 98,534,211 | |
United States | | | 1,479,221,294 | | | | — | | | | — | | | | 1,479,221,294 | |
| | | | | | | | | | | | | | | | |
Total Common Stocks | | | 1,561,955,230 | | | | 400,107,033 | | | | — | | | | 1,962,062,263 | |
| | | | | | | | | | | | | | | | |
Bonds and Notes(a) | | | — | | | | 956,616,099 | | | | — | | | | 956,616,099 | |
Preferred Stocks(a) | | | 1,786,728 | | | | 4,828,071 | | | | — | | | | 6,614,799 | |
Short-Term Investments | | | — | | | | 20,415,194 | | | | — | | | | 20,415,194 | |
| | | | | | | | | | | | | | | | |
Total Investments | | | 1,563,741,958 | | | | 1,381,966,397 | | | | — | | | | 2,945,708,355 | |
| | | | | | | | | | | | | | | | |
Forward Foreign Currency Contracts (unrealized appreciation) | | | — | | | | 2,209,051 | | | | — | | | | 2,209,051 | |
| | | | | | | | | | | | | | | | |
Total | | $ | 1,563,741,958 | | | $ | 1,384,175,448 | | | $ | — | | | $ | 2,947,917,406 | |
| | | | | | | | | | | | | | | | |
Liability Valuation Inputs
| | | | | | | | | | | | | | | | |
Description | | Level 1 | | | Level 2 | | | Level 3 | | | Total | |
Forward Foreign Currency Contracts (unrealized depreciation) | | $ | — | | | $ | (5,597,291 | ) | | $ | — | | | $ | (5,597,291 | ) |
Futures Contracts (unrealized depreciation) | | | (2,233,142 | ) | | | — | | | | — | | | | (2,233,142 | ) |
| | | | | | | | | | | | | | | | |
Total | | $ | (2,233,142 | ) | | $ | (5,597,291 | ) | | $ | — | | | $ | (7,830,433 | ) |
| | | | | | | | | | | | | | | | |
| (a) | Details of the major categories of the Fund’s investments are reflected within the Portfolio of Investments. |
Growth Fund
Asset Valuation Inputs
| | | | | | | | | | | | | | | | |
Description | | Level 1 | | | Level 2 | | | Level 3 | | | Total | |
Common Stocks(a) | | $ | 9,407,879,775 | | | $ | — | | | $ | — | | | $ | 9,407,879,775 | |
Short-Term Investments | | | — | | | | 96,001,789 | | | | — | | | | 96,001,789 | |
| | | | | | | | | | | | | | | | |
Total | | $ | 9,407,879,775 | | | $ | 96,001,789 | | | $ | — | | | $ | 9,503,881,564 | |
| | | | | | | | | | | | | | | | |
| (a) | Details of the major categories of the Fund’s investments are reflected within the Portfolio of Investments. |
Intermediate Duration Bond Fund
Asset Valuation Inputs
| | | | | | | | | | | | | | | | |
Description | | Level 1 | | | Level 2 | | | Level 3 | | | Total | |
Bonds and Notes | | | | | | | | | | | | | | | | |
Collateralized Mortgage Obligations | | $ | — | | | $ | 3,537,479 | | | $ | 201 | | | $ | 3,537,680 | |
All Other Bonds and Notes(a) | | | — | | | | 283,130,241 | | | | — | | | | 283,130,241 | |
| | | | | | | | | | | | | | | | |
Total Bonds and Notes | | | — | | | | 286,667,720 | | | | 201 | | | | 286,667,921 | |
| | | | | | | | | | | | | | | | |
Short-Term Investments | | | — | | | | 5,833,137 | | | | — | | | | 5,833,137 | |
| | | | | | | | | | | | | | | | |
Total Investments | | $ | — | | | $ | 292,500,857 | | | $ | 201 | | | $ | 292,501,058 | |
| | | | | | | | | | | | | | | | |
Futures Contracts (unrealized appreciation) | | | 148,972 | | | | — | | | | — | | | | 148,972 | |
| | | | | | | | | | | | | | | | |
Total | | $ | 148,972 | | | $ | 292,500,857 | | | $ | 201 | | | $ | 292,650,030 | |
| | | | | | | | | | | | | | | | |
119 |
Notes to Financial Statements (continued)
September 30, 2022
Intermediate Duration Bond Fund (continued)
Liability Valuation Inputs
| | | | | | | | | | | | | | | | |
Description | | Level 1 | | | Level 2 | | | Level 3 | | | Total | |
Futures Contracts (unrealized depreciation) | | $ | (1,420,738 | ) | | $ | — | | | $ | — | | | $ | (1,420,738 | ) |
| | | | | | | | | | | | | | | | |
| (a) | Details of the major categories of the Fund’s investments are reflected within the Portfolio of Investments. |
Limited Term Government and Agency Fund
Asset Valuation Inputs
| | | | | | | | | | | | | | | | |
Description | | Level 1 | | | Level 2 | | | Level 3 | | | Total | |
Bonds and Notes | | | | | | | | | | | | | | | | |
Collateralized Mortgage Obligations | | $ | — | | | $ | 103,746,869 | | | $ | 3,867,800 | | | $ | 107,614,669 | |
All Other Bonds and Notes(a) | | | — | | | | 631,164,795 | | | | — | | | | 631,164,795 | |
| | | | | | | | | | | | | | | | |
Total Bonds and Notes | | | — | | | | 734,911,664 | | | | 3,867,800 | | | | 738,779,464 | |
| | | | | | | | | | | | | | | | |
Short-Term Investments | | | — | | | | 32,051,888 | | | | — | | | | 32,051,888 | |
| | | | | | | | | | | | | | | | |
Total | | $ | — | | | $ | 766,963,552 | | | $ | 3,867,800 | | | $ | 770,831,352 | |
| | | | | | | | | | | | | | | | |
| (a) | Details of the major categories of the Fund’s investments are reflected within the Portfolio of Investments. |
The following is a reconciliation of Level 3 investments for which significant unobservable inputs were used to determine fair value as of September 30, 2021 and/or September 30, 2022:
Core Plus Bond Fund
Asset Valuation Inputs
| | | | | | | | | | | | | | | | | | | | | | | | | | | | | | | | | | | | | | | | |
Investments in Securities | | Balance as of
September 30,
2021 | | | Accrued
Discounts
(Premiums) | | | Realized
Gain (Loss) | | | Change in
Unrealized
Appreciation
(Depreciation) | | | Purchases | | | Sales | | | Transfers
into Level 3 | | | Transfers
out of
Level 3 | | | Balance as of
September 30,
2022 | | | Change in
Unrealized
Appreciation
(Depreciation)
from
Investments
Still Held at
September 30,
2022 | |
Bonds and Notes | | | | | | | | | | | | | | | | | | | | | | | | | | | | | | | | | | | | | | | | |
Non-Convertible Bonds | | | | | | | | | | | | | | | | | | | | | | | | | | | | | | | | | | | | | | | | |
Collateralized Mortgage Obligations | | $ | 1,001,922 | | | $ | — | | | $ | (16,371 | ) | | $ | 4,286 | | | $ | 2,971 | | | $ | (869,949 | ) | | $ | — | | | $ | — | | | $ | 122,859 | | | $ | (12,112 | ) |
| | | | | | | | | | | | | | | | | | | | | | | | | | | | | | | | | | | | | | | | |
| 120
Notes to Financial Statements (continued)
September 30, 2022
Intermediate Duration Bond Fund
Asset Valuation Inputs
| | | | | | | | | | | | | | | | | | | | | | | | | | | | | | | | | | | | | | | | |
Investments in Securities | | Balance as of
September 30,
2021 | | | Accrued
Discounts
(Premiums) | | | Realized
Gain (Loss) | | | Change in
Unrealized
Appreciation
(Depreciation) | | | Purchases | | | Sales | | | Transfers
into Level 3 | | | Transfers
out of
Level 3 | | | Balance as of
September 30,
2022 | | | Change in
Unrealized
Appreciation
(Depreciation)
from
Investments
Still Held at
September 30,
2022 | |
Bonds and Notes | | | | | | | | | | | | | | | | | | | | | | | | | | | | | | | | | | | | | | | | |
ABS Other | | $ | 564,912 | | | $ | — | | | $ | — | | | $ | — | | | $ | — | | | $ | — | | | $ | — | | | $ | (564,912 | ) | | $ | — | | | $ | — | |
Collateralized Mortgage Obligations | | | 531 | | | | — | | | | (3 | ) | | | (22 | ) | | | — | | | | (305 | ) | | | — | | | | — | | | | 201 | | | | (24 | ) |
| | | | | | | | | | | | | | | | | | | | | | | | | | | | | | | | | | | | | | | | |
Total | | $ | 565,443 | | | $ | — | | | $ | (3 | ) | | $ | (22 | ) | | $ | — | | | $ | (305 | ) | | $ | — | | | $ | (564,912 | ) | | $ | 201 | | | $ | (24 | ) |
| | | | | | | | | | | | | | | | | | | | | | | | | | | | | | | | | | | | | | | | |
A debt security valued at $564,912 was transferred from Level 3 to Level 2 during the period ended September 30, 2022. At September 30, 2021, this security was valued using broker-dealer bid prices based on inputs unobservable to the Fund as an independent pricing service was unable to price the security. At September 30, 2022, this security was fair valued based on evaluated bids furnished to the Fund by an independent pricing service in accordance with the Fund’s valuation policies.
Limited Term Government and Agency Fund
Asset Valuation Inputs
| | | | | | | | | | | | | | | | | | | | | | | | | | | | | | | | | | | | | | | | |
Investments in Securities | | Balance as of
September 30,
2021 | | | Accrued
Discounts
(Premiums) | | | Realized
Gain (Loss) | | | Change in
Unrealized
Appreciation
(Depreciation) | | | Purchases | | | Sales | | | Transfers
into Level 3 | | | Transfers
out of
Level 3 | | | Balance as of
September 30,
2022 | | | Change in
Unrealized
Appreciation
(Depreciation)
from
Investments
Still Held at
September 30,
2022 | |
Bonds and Notes | | | | | | | | | | | | | | | | | | | | | | | | | | | | | | | | | | | | | | | | |
Collateralized Mortgage Obligations | | $ | 4,629,151 | | | $ | — | | | $ | (84,484 | ) | | $ | (260,229 | ) | | $ | 359 | | | $ | (1,400,056 | ) | | $ | 983,059 | | | $ | — | | | $ | 3,867,800 | | | $ | (271,447 | ) |
| | | | | | | | | | | | | | | | | | | | | | | | | | | | | | | | | | | | | | | | |
Debt securities valued at $983,059 were transferred from Level 2 to Level 3 during the period ended September 30, 2022. At September 30, 2021, these securities were valued based on evaluated bids furnished to the Fund by an independent pricing service in accordance with the Fund’s valuation policies. At September 30, 2022, these securities were fair valued as determined by the Fund’s valuation designee as an independent pricing service did not provide a reliable price for the securities.
4. Derivatives. Derivative instruments are defined as financial instruments whose value and performance are based on the value and performance of an underlying asset, reference rate or index. Derivative instruments that Core Plus Bond Fund, Credit Income Fund, Global Allocation Fund and Intermediate Duration Bond Fund used during the period include forward foreign currency contracts, futures contracts and swap agreements.
Credit Income Fund and Global Allocation Fund are subject to the risk that companies in which the Fund invests will fail financially or otherwise be unwilling or unable to meet their obligations to the Fund. The Funds may use credit default swaps, as a protection buyer, to hedge its credit exposure to issuers of bonds it holds without having to sell the bonds. The Funds may also use credit default swaps, as a protection seller, to gain investment exposure. During the year ended September 30, 2022, Credit Income Fund and Global Allocation Fund engaged in credit default swap agreements (as a protection seller) to gain investment exposure.
Core Plus Bond Fund, Credit Income Fund, Global Allocation Fund and Intermediate Duration Bond Fund are subject to the risk that changes in interest rates will affect the value of the Funds’ investments in fixed income securities. The Funds will be subject to increased interest rate risk to the extent that they invest in fixed income securities with longer maturities or durations, as compared to investing in fixed income securities with shorter maturities or durations. The Funds may use futures contracts to hedge against
121 |
Notes to Financial Statements (continued)
September 30, 2022
changes in interest rates and to manage duration without having to buy or sell portfolio securities. The Funds may also use futures contracts to gain investment exposure. During the year ended September 30, 2022, Core Plus Bond Fund, Credit Income Fund, Global Allocation Fund and Intermediate Duration Bond Fund each used futures contracts to manage duration.
Global Allocation Fund is subject to the risk that changes in foreign currency exchange rates will have an unfavorable effect on the value of Fund assets denominated in foreign currencies. The Fund may enter into forward foreign currency contracts for hedging purposes to protect the value of the Fund’s holdings of foreign securities. The Fund may also use forward foreign currency contracts to gain exposure to foreign currencies, regardless of whether securities denominated in such currencies are held in the Fund. During the year ended September 30, 2022, Global Allocation Fund engaged in forward foreign currency transactions for hedging purposes and to gain exposure to foreign currencies.
The following is a summary of derivative instruments for Core Plus Bond Fund as of September 30, 2022, as reflected within the Statements of Assets and Liabilities:
| | | | | | |
Liabilities | | Unrealized
depreciation
on futures
contracts1 | | | |
Exchange-traded liability derivatives
Interest rate contracts | | $ | (14,563,241 | ) |
| 1 | Represents cumulative unrealized appreciation (depreciation) on futures contracts. Only the current day’s variation margin on futures contracts is reported within the Statements of Assets and Liabilities as receivable or payable for variation margin, as applicable. |
Transactions in derivative instruments for Core Plus Bond Fund during the year ended September 30, 2022, as reflected within the Statements of Operations, were as follows:
| | | | | | |
Net Realized Gain (Loss) on: | | Futures
contracts | | | |
Interest rate contracts | | $ | (7,112,236 | ) |
| | | | | | |
| | |
Net Change in Unrealized
Appreciation (Depreciation) on: | | Futures
contracts | | | |
Interest rate contracts | | $ | (14,563,241 | ) |
The following is a summary of derivative instruments for Credit Income Fund as of September 30, 2022, as reflected within the Statements of Assets and Liabilities:
| | | | | | |
Assets | | Unrealized
appreciation
on futures
contracts1 | | | |
Exchange-traded asset derivatives
Interest rate contracts | | $ | 27,929 | |
| | | | | | |
Liabilities | | Unrealized
depreciation
on futures
contracts1 | | | |
Exchange-traded liability derivatives
Interest rate contracts | | $ | (49,579 | ) |
| 1 | Represents cumulative unrealized appreciation (depreciation) on futures contracts. Only the current day’s variation margin on futures contracts is reported within the Statements of Assets and Liabilities as receivable or payable for variation margin, as applicable. |
| 122
Notes to Financial Statements (continued)
September 30, 2022
Transactions in derivative instruments for Credit Income Fund during the year ended September 30, 2022, as reflected within the Statements of Operations, were as follows:
| | | | | | | | |
Net Realized Gain (Loss) on: | | Futures
contracts | | | Swap
agreements | |
Interest rate contracts | | $ | 293,058 | | | $ | — | |
Credit contracts | | | — | | | | 5,371 | |
| | | | | | | | |
Total | | $ | 293,058 | | | $ | 5,371 | |
| | | | | | | | |
| | | | | | |
Net Change in Unrealized
Appreciation (Depreciation) on: | | Futures
contracts | | | |
Interest rate contracts | | $ | (57,368 | ) |
The following is a summary of derivative instruments for Global Allocation Fund as of September 30, 2022, as reflected within the Statements of Assets and Liabilities:
| | | | | | |
Assets | | Unrealized
appreciation
on forward
foreign
currency
contracts | | | |
Over-the-counter asset derivatives
Foreign exchange contracts | | $ | 2,209,051 | |
| | | | | | | | |
Liabilities | | Unrealized
depreciation
on forward
foreign
currency
contracts | | | Unrealized
depreciation
on futures
contracts1 | |
Over-the-counter liability derivatives Foreign exchange contracts | | $ | (5,597,291 | ) | | $ | — | |
Exchange-traded liability derivatives Interest rate contracts | | | — | | | | (2,233,142 | ) |
| | | | | | | | |
Total liability derivatives | | $ | (5,597,291 | ) | | $ | (2,233,142 | ) |
| | | | | | | | |
| 1 | Represents cumulative unrealized appreciation (depreciation) on futures contracts. Only the current day’s variation margin on futures contracts is reported within the Statements of Assets and Liabilities as receivable or payable for variation margin, as applicable. |
Transactions in derivative instruments for Global Allocation Fund during the year ended September 30, 2022, as reflected within the Statements of Operations, were as follows:
| | | | | | | | | | | | |
Net Realized Gain (Loss) on: | | Forward
foreign
currency
contracts | | | Futures
contracts | | | Swap
agreements | |
Interest rate contracts | | $ | — | | | $ | (315,243 | ) | | $ | — | |
Foreign exchange contracts | | | (52,272,395 | ) | | | — | | | | — | |
Credit contracts | | | — | | | | — | | | | 127,433 | |
| | | | | | | | | | | | |
Total | | $ | (52,272,395 | ) | | $ | (315,243 | ) | | $ | 127,433 | |
| | | | | | | | | | | | |
| | | | | | | | | | |
Net Change in Unrealized
Appreciation (Depreciation) on: | | Forward foreign
currency
contracts | | | Futures
contracts | | | |
Interest rate contracts | | $ | — | | | $ | (2,901,289 | ) |
Foreign exchange contracts | | | 1,334,625 | | | | — | |
| | | | | | | | |
Total | | $ | 1,334,625 | | | $ | (2,901,289 | ) |
| | | | | | | | |
123 |
Notes to Financial Statements (continued)
September 30, 2022
The following is a summary of derivative instruments for Intermediate Duration Bond Fund as of September 30, 2022, as reflected within the Statements of Assets and Liabilities:
| | | | |
Assets | | Unrealized
appreciation
on futures
contracts1 | |
Exchange-traded asset derivatives
Interest rate contracts | | $ | 148,972 | |
| | | | |
Liabilities | | Unrealized
depreciation
on futures
contracts1 | |
Exchange-traded liability derivatives
Interest rate contracts | | $ | (1,420,738 | ) |
| 1 | Represents cumulative unrealized appreciation (depreciation) on futures contracts. Only the current day’s variation margin on futures contracts is reported within the Statements of Assets and Liabilities as receivable or payable for variation margin, as applicable. |
Transactions in derivative instruments for Intermediate Duration Bond Fund during the year ended September 30, 2022, as reflected within the Statements of Operations, were as follows:
| | | | |
Net Realized Gain (Loss) on: | | Futures
contracts | |
Interest rate contracts | | $ | (1,596,732 | ) |
| | | | |
Net Change in Unrealized
Appreciation (Depreciation) on: | | Futures
contracts | |
Interest rate contracts | | $ | (1,274,989 | ) |
As the Funds value their derivatives at fair value and recognize changes in fair value through the Statements of Operations, they do not qualify for hedge accounting under authoritative guidance for derivative instruments. The Funds’ investments in derivatives may represent an economic hedge; however, they are considered to be non-hedge transactions for the purpose of these disclosures.
The volume of forward foreign currency contract, futures contract and swap agreement activity, as a percentage of net assets for Core Plus Bond Fund, Credit Income Fund, Global Allocation Fund and Intermediate Duration Bond Fund, based on gross month-end notional amounts outstanding during the period, including long and short positions at absolute value, was as follows for the year ended September 30, 2022:
| | | | | | | | |
Core Plus Bond Fund | | Futures | | | | | |
Average Notional Amount Outstanding | | | 1.73 | % |
Highest Notional Amount Outstanding | | | 6.74 | % |
Lowest Notional Amount Outstanding | | | 0.00 | % |
Notional Amount Outstanding as of September 30, 2022 | | | 6.74 | % |
| | | | | | | | | | |
Credit Income Fund | | Futures | | | Credit Default Swaps | | | |
Average Notional Amount Outstanding | | | 7.70 | % | | | 0.07 | % |
Highest Notional Amount Outstanding | | | 9.34 | % | | | 1.00 | % |
Lowest Notional Amount Outstanding | | | 2.41 | % | | | 0.00 | % |
Notional Amount Outstanding as of September 30, 2022 | | | 5.00 | % | | | 0.00 | % |
| | | | | | | | | | | | |
Global Allocation Fund | | Forwards | | | Futures | | | Credit Default Swaps | |
Average Notional Amount Outstanding | | | 11.62 | % | | | 0.66 | % | | | 0.01 | % |
Highest Notional Amount Outstanding | | | 13.78 | % | | | 0.96 | % | | | 0.15 | % |
Lowest Notional Amount Outstanding | | | 9.52 | % | | | 0.13 | % | | | 0.00 | % |
| Notional Amount Outstanding as of September 30, 2022 | | | 9.85 | % | | | 0.96 | % | | | 0.00 | % |
| 124
Notes to Financial Statements (continued)
September 30, 2022
| | | | | | | | |
Intermediate Duration Bond Fund | | Futures | | | | | |
Average Notional Amount Outstanding | | | 11.34 | % |
Highest Notional Amount Outstanding | | | 17.03 | % |
Lowest Notional Amount Outstanding | | | 6.24 | % |
Notional Amount Outstanding as of September 30, 2022 | | | 14.29 | % |
Notional amounts outstanding at the end of the prior period are included in the average notional amount outstanding.
Unrealized gain and/or loss on open forwards, futures and swaps is recorded in the Statements of Assets and Liabilities. The aggregate notional values of forwards and futures contracts are not recorded in the Statements of Assets and Liabilities, and therefore are not included in the Funds’ net assets.
Over-the-counter derivatives, including forward foreign currency contracts, are entered into pursuant to International Swaps and Derivatives Association, Inc. (“ISDA”) agreements negotiated between the Funds and their counterparties. ISDA agreements typically contain, among other things, terms for the posting of collateral and master netting provisions in the event of a default or other termination event. Collateral is posted by a Fund or the counterparty to the extent of the net mark-to-market exposure to the other party of all open contracts under the agreement, subject to minimum transfer requirements. Master netting provisions allow the Funds and the counterparty, in the event of a default or other termination event, to offset amounts owed by each related to derivative contracts, including any posted collateral, to one net amount payable by either the Funds or the counterparty. The Funds’ ISDA agreements typically contain provisions that allow a counterparty to terminate open contracts early if the NAV of a Fund declines beyond a certain threshold. For financial reporting purposes, the Funds do not offset derivative assets and liabilities, and any related collateral received or pledged, on the Statements of Assets and Liabilities.
As of September 30, 2022, gross amounts of over-the-counter derivative assets and liabilities not offset in the Statements of Assets and Liabilities and the related net amounts after taking into account master netting arrangements, by counterparty, are as follows:
| | | | | | | | | | | | | | | | | | | | |
Global Allocation Fund | |
Counterparty | | Gross Amounts of
Assets | | | Offset
Amount | | | Net Asset
Balance | | | Collateral
(Received)/
Pledged | | | Net
Amount | |
Bank of America, N.A. | | $ | 57,518 | | | $ | (57,518 | ) | | $ | — | | | $ | — | | | $ | — | |
Credit Suisse International | | | 1,357,124 | | | | (1,108,376 | ) | | | 248,748 | | | | — | | | | 248,748 | |
HSBC Bank USA | | | 204,143 | | | | (204,143 | ) | | | — | | | | — | | | | — | |
Morgan Stanley Capital Services, Inc. | | | 449,753 | | | | (449,753 | ) | | | — | | | | — | | | | — | |
UBS AG | | | 140,513 | | | | (23,985 | ) | | | 116,528 | | | | (116,528 | ) | | | — | |
| | | | | | | | | | | | | | | | | | | | |
| | $ | 2,209,051 | | | $ | (1,843,775 | ) | | $ | 365,276 | | | $ | (116,528 | ) | | $ | 248,748 | |
| | | | | | | | | | | | | | | | | | | | |
| | | | | | | | | | | | | | | | | | | | |
Counterparty | | Gross Amounts of Liabilities | | | Offset
Amount | | | Net
Liability
Balance | | | Collateral
(Received)/
Pledged | | | Net
Amount | |
Bank of America, N.A. | | $ | (97,922 | ) | | $ | 57,518 | | | $ | (40,404 | ) | | $ | — | | | $ | (40,404 | ) |
Credit Suisse International | | | (1,108,376 | ) | | | 1,108,376 | | | | — | | | | — | | | | — | |
HSBC Bank USA | | | (602,219 | ) | | | 204,143 | | | | (398,076 | ) | | | 398,076 | | | | — | |
Morgan Stanley Capital Services, Inc. | | | (3,764,789 | ) | | | 449,753 | | | | (3,315,036 | ) | | | 3,315,036 | | | | — | |
UBS AG | | | (23,985 | ) | | | 23,985 | | | | — | | | | — | | | | — | |
| | | | | | | | | | | | | | | | | | | | |
| | $ | (5,597,291 | ) | | $ | 1,843,775 | | | $ | (3,753,516 | ) | | $ | 3,713,112 | | | $ | (40,404 | ) |
| | | | | | | | | | | | | | | | | | | | |
The actual collateral received or pledged, if any, may exceed the amounts shown in the table due to overcollateralization. Timing differences may exist between when contracts under the ISDA agreements are marked-to-market and when collateral moves. The ISDA agreements include tri-party control agreements under which collateral is held for the benefit of the secured party at a third party custodian, State Street Bank.
Counterparty risk is managed based on policies and procedures established by each Fund’s adviser. Such policies and procedures may include, but are not limited to, minimum counterparty credit rating requirements, monitoring of counterparty credit default swap spreads and posting of collateral. A Fund’s risk of loss from counterparty credit risk on over-the-counter derivatives is generally limited to the Fund’s aggregated unrealized gains and the amount of any collateral pledged to the counterparty, which may be offset by any collateral posted to the Fund by the counterparty. ISDA master agreements can help to manage counterparty risk by specifying
125 |
Notes to Financial Statements (continued)
September 30, 2022
collateral posting arrangements at pre-arranged exposure levels. Under these ISDA agreements, collateral is routinely transferred if the total net exposure in respect of certain transactions, net of existing collateral already in place, exceeds a specified amount (typically $250,000, depending on the counterparty). With exchange-traded derivatives, there is minimal counterparty credit risk to the Fund because the exchange’s clearing house, as counterparty to these instruments, stands between the buyer and the seller of the contract. Credit risk still exists in exchange-traded derivatives with respect to initial and variation margin that is held in a broker’s customer accounts. While brokers typically are required to segregate customer margin for exchange-traded derivatives from their own assets, in the event that a broker becomes insolvent or goes into bankruptcy and at that time there is a shortfall in the aggregate amount of margin held by the broker for all its customers, U.S. bankruptcy laws will typically allocate that shortfall on a pro rata basis across all of the broker’s customers, potentially resulting in losses to the Fund. Based on balances reflected on each Fund’s Statement of Assets and Liabilities, the following table shows (i) the maximum amount of loss due to credit risk that, based on the gross fair value of the financial instrument, the Fund would incur if parties (including OTC derivative counterparties and brokers holding margin for exchange-traded derivatives) to the relevant financial instruments failed completely to perform according to the terms of the contracts and the collateral or other security, if any, for the amount due proved to be of no value to the Fund, and (ii) the amount of loss that the Fund would incur after taking into account master netting provisions pursuant to ISDA agreements, as of September 30, 2022:
| | | | | | | | |
Fund | | Maximum Amount of Loss—Gross | | | Maximum Amount of Loss—Net | |
Core Plus Bond Fund | | $ | 8,300,000 | | | $ | 8,300,000 | |
Credit Income Fund | | | 73,082 | | | | 73,082 | |
Global Allocation Fund | | | 8,003,735 | | | | 2,330,320 | |
Intermediate Duration Bond Fund | | | 475,000 | | | | 475,000 | |
Net loss amount reflects cash received as collateral for Global Allocation Fund of $120,000, which is recorded on the Statements of Assets and Liabilities.
5. Purchases and Sales of Securities. For the year ended September 30, 2022, purchases and sales of securities (excluding short-term investments and including paydowns) were as follows:
| | | | | | | | | | | | | | | | |
| | | U.S. Government/Agency
Securities | | | Other Securities | |
Fund | | Purchases | | | Sales | | | Purchases | | | Sales | |
Core Plus Bond Fund | | $ | 18,940,257,397 | | | $ | 19,043,623,356 | | | $ | 580,893,017 | | | $ | 2,024,928,517 | |
Credit Income Fund | | | 771,481 | | | | 530,002 | | | | 3,895,551 | | | | 4,118,861 | |
Global Allocation Fund | | | 89,880,452 | | | | 193,390,648 | | | | 1,340,962,655 | | | | 2,013,245,929 | |
Growth Fund | | | — | | | | — | | | | 2,431,007,138 | | | | 3,082,477,291 | |
Intermediate Duration Bond Fund | | | 142,689,963 | | | | 196,004,731 | | | | 340,801,681 | | | | 324,190,344 | |
Limited Term Government and Agency Fund | | | 1,785,576,690 | | | | 1,976,318,575 | | | | 20,323,823 | | | | 21,178,448 | |
6. Management Fees and Other Transactions with Affiliates.
a. Management Fees. Loomis, Sayles & Company, L.P. (“Loomis Sayles”) serves as investment adviser to each Fund. Loomis Sayles is a limited partnership whose sole general partner, Loomis, Sayles & Company, Inc., is indirectly owned by Natixis Investment Managers, LLC, which is part of Natixis Investment Managers, an international asset management group based in Paris, France.
Under the terms of the management agreements, each Fund pays a management fee at the following annual rates, calculated daily and payable monthly, based on the Fund’s average daily net assets:
| | | | | | | | | | | | | | | | | | | | | | | | |
| | | Percentage of Average Daily Net Assets | |
Fund | | First $100 million | | | Next $400 million | | | Next $500 million | | | Next
$1 billion | | | Next
$2 billion | | | Over
$4 billion | |
Core Plus Bond Fund | | | 0.2000 | % | | | 0.1875 | % | | | 0.1875 | % | | | 0.1875 | % | | | 0.1500 | % | | | 0.1500 | % |
Credit Income Fund | | | 0.4200 | % | | | 0.4200 | % | | | 0.4200 | % | | | 0.4200 | % | | | 0.4200 | % | | | 0.4200 | % |
Global Allocation Fund | | | 0.7500 | % | | | 0.7500 | % | | | 0.7500 | % | | | 0.7500 | % | | | 0.7300 | % | | | 0.7000 | % |
Growth Fund | | | 0.5000 | % | | | 0.5000 | % | | | 0.5000 | % | | | 0.5000 | % | | | 0.5000 | % | | | 0.5000 | % |
Intermediate Duration Bond Fund | | | 0.2500 | % | | | 0.2500 | % | | | 0.2500 | % | | | 0.2500 | % | | | 0.2500 | % | | | 0.2500 | % |
Limited Term Government and Agency Fund | | | 0.3250 | % | | | 0.3250 | % | | | 0.3000 | % | | | 0.2500 | % | | | 0.2500 | % | | | 0.2500 | % |
| 126
Notes to Financial Statements (continued)
September 30, 2022
Natixis Advisors, LLC (“Natixis Advisors”) serves as the advisory administrator to Core Plus Bond Fund. Natixis Advisors is a wholly-owned subsidiary of Natixis Investment Managers, LLC. Under the terms of the advisory administration agreement, the Fund pays an advisory administration fee at the following annual rates, calculated daily and payable monthly, based on its average daily net assets:
| | | | | | | | | | | | |
| | | Percentage of
Average Daily Net Assets | |
Fund | | First $100 million | | | Next
$1.9 billion | | | Over
$2 billion | |
Core Plus Bond Fund | | | 0.2000 | % | | | 0.1875 | % | | | 0.1500 | % |
Management and advisory administration fees are presented in the Statements of Operations as management fees.
Loomis Sayles has given binding undertakings to the Funds to waive management fees and/or reimburse certain expenses to limit the Funds’ operating expenses, exclusive of acquired fund fees and expenses, brokerage expenses, interest expense, taxes, organizational and extraordinary expenses such as litigation and indemnification expenses. These undertakings are in effect until January 31, 2023, except for Core Plus Bond Fund which is in effect until January 31, 2024, may be terminated before then only with the consent of the Funds’ Board of Trustees and are reevaluated on an annual basis. Management fees payable, as reflected on the Statements of Assets and Liabilities, is net of waivers and/or expense reimbursements, if any, pursuant to these undertakings. Waivers/reimbursements that exceed management fees payable are reflected on the Statements of Assets and Liabilities as receivable from investment adviser.
For the year ended September 30, 2022 the expense limits as a percentage of average daily net assets under the expense limitation agreements were as follows:
| | | | | | | | | | | | | | | | |
| | | Expense Limit as a Percentage of
Average Daily Net Assets | |
Fund | | Class A | | | Class C | | | Class N | | | Class Y | |
Core Plus Bond Fund | | | 0.74 | % | | | 1.49 | % | | | 0.44 | % | | | 0.49 | % |
Credit Income Fund | | | 0.82 | % | | | 1.57 | % | | | 0.52 | % | | | 0.57 | % |
Global Allocation Fund | | | 1.25 | % | | | 2.00 | % | | | 0.95 | % | | | 1.00 | % |
Growth Fund | | | 1.25 | % | | | 2.00 | % | | | 0.95 | % | | | 1.00 | % |
Intermediate Duration Bond Fund | | | 0.65 | % | | | 1.40 | % | | | 0.35 | % | | | 0.40 | % |
Limited Term Government and Agency Fund | | | 0.70 | % | | | 1.45 | % | | | 0.40 | % | | | 0.45 | % |
Prior to July 1, 2022, the expense limits as a percentage of average daily net assets under the expense limitation agreement for Core Plus Bond Fund were as follows:
| | | | | | | | | | | | | | | | |
| | | Expense Limit as a Percentage of
Average Daily Net Assets | |
Fund | | Class A | | | Class C | | | Class N | | | Class Y | |
Core Plus Bond Fund | | | 0.75 | % | | | 1.50 | % | | | 0.45 | % | | | 0.50 | % |
Loomis Sayles and Natixis Advisors have agreed to equally bear the waivers and/or expense reimbursements for Core Plus Bond Fund.
Loomis Sayles (and Natixis Advisors for Core Plus Bond Fund) shall be permitted to recover expenses borne under the expense limitation agreements (whether through waiver of management fees or otherwise) on a class by class basis in later periods to the extent the annual operating expenses of a class fall below both (1) a class’ expense limitation ratio in place at the time such amounts were waived/reimbursed and (2) a class’ current applicable expense limitation ratio, provided, however, that a class is not obligated to pay such waived/reimbursed fees or expenses more than one year after the end of the fiscal year in which the fees or expenses were waived/reimbursed.
For the year ended September 30, 2022, the management fees and waivers of management fees for each Fund were as follows:
| | | | | | | | | | | | | | | | | | | | |
Fund | | Gross
Management
Fees | | | Contractual
Waivers of
Management
Fees1 | | | Net
Management
Fees | | | Percentage of
Average Daily
Net Assets
| |
| | Gross | | | Net | |
Core Plus Bond Fund | | $ | 11,883,723 | | | $ | 206,650 | | | $ | 11,677,073 | | | | 0.16 | % | | | 0.16 | % |
Credit Income Fund | | | 96,549 | | | | 96,549 | | | | — | | | | 0.42 | % | | | — | % |
Global Allocation Fund | | | 31,131,971 | | | | — | | | | 31,131,971 | | | | 0.74 | % | | | 0.74 | % |
Growth Fund | | | 61,919,222 | | | | — | | | | 61,919,222 | | | | 0.50 | % | | | 0.50 | % |
Intermediate Duration Bond Fund | | | 874,113 | | | | 118,557 | | | | 755,556 | | | | 0.25 | % | | | 0.22 | % |
Limited Term Government and Agency Fund | | | 2,919,401 | | | | — | | | | 2,919,401 | | | | 0.31 | % | | | 0.31 | % |
127 |
Notes to Financial Statements (continued)
September 30, 2022
For the year ended September 30, 2022, class-specific expenses have been reimbursed as follows:
| | | | | | | | | | | | | | | | | | | | |
| | | Reimbursement1 | |
Fund | | Class A | | | Class C | | | Class N | | | Class Y | | | Total | |
Limited Term Government and Agency Fund | | $ | 74,162 | | | $ | 5,238 | | | $ | — | | | $ | 164,012 | | | $ | 243,412 | |
| 1 | Waiver/expense reimbursements are subject to possible recovery until September 30, 2023. |
In addition, Loomis Sayles reimbursed non-class specific expenses of Credit Income Fund in the amount of $83,572. Expense reimbursements are subject to possible recovery until September 30, 2023.
For the year ended September 30, 2022, the advisory administration fees for Core Plus Bond Fund were $11,883,723 (effective rate of 0.16% of average daily net assets).
No expenses were recovered for any of the Funds during the year ended September 30, 2022 under the terms of the expense limitation agreements.
b. Service and Distribution Fees. Natixis Distribution, LLC (“Natixis Distribution”), which is a wholly-owned subsidiary of Natixis Investment Managers, LLC, has entered into a distribution agreement with the Trusts. Pursuant to this agreement, Natixis Distribution serves as principal underwriter of the Funds of the Trusts.
Pursuant to Rule 12b-1 under the 1940 Act, the Trusts have adopted a Service Plan relating to each Fund’s Class A shares (the “Class A Plans”), and a Distribution and Service Plan relating to each Fund’s Class C shares (the “Class C Plans”).
Under the Class A Plans, each Fund pays Natixis Distribution a monthly service fee at an annual rate not to exceed 0.25% of the average daily net assets attributable to the Fund’s Class A shares, as reimbursement for expenses incurred by Natixis Distribution in providing personal services to investors in Class A shares and/or the maintenance of shareholder accounts.
Under the Class C Plans, each Fund pays Natixis Distribution a monthly service fee at an annual rate not to exceed 0.25% of the average daily net assets attributable to the Fund’s Class C shares, as compensation for services provided by Natixis Distribution in providing personal services to investors in Class C shares and/or the maintenance of shareholder accounts.
Also under the Class C Plans, each Fund pays Natixis Distribution a monthly distribution fee at an annual rate of 0.75% of the average daily net assets attributable to the Fund’s Class C shares, as compensation for services provided by Natixis Distribution in connection with the marketing or sale of Class C shares.
For the year ended September 30, 2022, the service and distribution fees for each Fund were as follows:
| | | | | | | | | | | | |
| | | Service Fees | | | Distribution
Fees | |
Fund | | Class A | | | Class C | | | Class C | |
Core Plus Bond Fund | | $ | 1,459,487 | | | $ | 181,179 | | | $ | 543,536 | |
Credit Income Fund | | | 261 | | | | 3 | | | | 8 | |
Global Allocation Fund | | | 1,616,598 | | | | 1,073,579 | | | | 3,220,737 | |
Growth Fund | | | 3,834,414 | | | | 250,252 | | | | 750,755 | |
Intermediate Duration Bond Fund | | | 51,884 | | | | 712 | | | | 2,137 | |
Limited Term Government and Agency Fund | | | 647,161 | | | | 49,806 | | | | 149,419 | |
For the year ended September 30, 2022, Natixis Distribution refunded Limited Term Government and Agency Fund $20,054 of prior year Class A service fees paid to Natixis Distribution in excess of amounts subsequently paid to securities dealers or financial intermediaries. Service and distribution fees on the Statements of Operations have been reduced by these amounts.
c. Administrative Fees. Natixis Advisors provides certain administrative services for the Funds and contracts with State Street Bank to serve as sub-administrator. Pursuant to an agreement among Natixis Funds Trusts, Loomis Sayles Funds Trusts, Natixis ETF Trusts and Natixis Advisors, each Fund pays Natixis Advisors monthly its pro rata portion of fees equal to an annual rate of 0.0540% of the first $15 billion of the average daily net assets of the Natixis Funds Trusts, Loomis Sayles Funds Trusts and Natixis ETF Trusts, 0.0500% of the next $15 billion, 0.0400% of the next $30 billion, 0.0275% of the next $30 billion and 0.0225% of such assets in excess of $90 billion, subject to an annual aggregate minimum fee for the Natixis Funds Trusts, Loomis Sayles Funds Trusts and Natixis ETF Trusts of $10 million, which is reevaluated on an annual basis.
| 128
Notes to Financial Statements (continued)
September 30, 2022
For the year ended September 30, 2022, the administrative fees for each Fund were as follows:
| | | | |
Fund | | Administrative Fees | |
Core Plus Bond Fund | | $ | 3,265,761 | |
Credit Income Fund | | | 10,145 | |
Global Allocation Fund | | | 1,860,255 | |
Growth Fund | | | 5,454,700 | |
Intermediate Duration Bond Fund | | | 154,230 | |
Limited Term Government and Agency Fund | | | 411,358 | |
d. Sub-Transfer Agent Fees. Natixis Distribution has entered into agreements, which include servicing agreements, with financial intermediaries that provide recordkeeping, processing, shareholder communications and other services to customers of the intermediaries that hold positions in the Funds and has agreed to compensate the intermediaries for providing those services. Intermediaries transact with the Funds primarily through the use of omnibus accounts on behalf of their customers who hold positions in the Funds. These services would have been provided by the Funds’ transfer agent and other service providers if the shareholders’ accounts were maintained directly at the Funds’ transfer agent. Accordingly, the Funds have agreed to reimburse Natixis Distribution for all or a portion of the servicing fees paid to these intermediaries. The reimbursement amounts (sub-transfer agent fees) paid to Natixis Distribution are subject to a current per-account equivalent fee limit approved by the Funds’ Board of Trustees, which is based on fees for similar services paid to the Funds’ transfer agent and other service providers. Class N shares do not bear such expenses.
For the year ended September 30, 2022, the sub-transfer agent fees (which are reflected in transfer agent fees and expenses in the Statements of Operations) for each Fund were as follows:
| | | | |
Fund | | Sub-Transfer
Agent Fees | |
Core Plus Bond Fund | | $ | 5,153,096 | |
Credit Income Fund | | | 27 | |
Global Allocation Fund | | | 3,072,093 | |
Growth Fund | | | 8,616,664 | |
Intermediate Duration Bond Fund | | | 222,399 | |
Limited Term Government and Agency Fund | | | 501,102 | |
As of September 30, 2022, the Funds owe Natixis Distribution the following reimbursements for sub-transfer agent fees (which are reflected in the Statements of Assets and Liabilities as payable to distributor):
| | | | |
Fund | | Reimbursements
of Sub-Transfer
Agent Fees | |
Core Plus Bond Fund | | $ | 59,307 | |
Credit Income Fund | | | 1 | |
Global Allocation Fund | | | 53,123 | |
Growth Fund | | | 89,583 | |
Intermediate Duration Bond Fund | | | 2,325 | |
Limited Term Government and Agency Fund | | | 13,252 | |
Sub-transfer agent fees attributable to Class A, Class C and Class Y are allocated on a pro rata basis to each class based on the relative net assets of each class to the total net assets of those classes.
129 |
Notes to Financial Statements (continued)
September 30, 2022
e. Commissions. Commissions (including CDSCs) on Fund shares retained by Natixis Distribution during the year ended September 30, 2022, were as follows:
| | | | |
Fund | | Commissions | |
Core Plus Bond Fund | | $ | 43,434 | |
Global Allocation Fund | | | 179,606 | |
Growth Fund | | | 72,455 | |
Intermediate Duration Bond Fund | | | 737 | |
Limited Term Government and Agency Fund | | | 68,663 | |
f. Trustees Fees and Expenses. The Trusts do not pay any compensation directly to their officers or Trustees who are directors, officers or employees of Natixis Advisors, Natixis Distribution, Natixis Investment Managers, LLC or their affiliates. The Chairperson of the Board of Trustees receives a retainer fee at the annual rate of $369,000. The Chairperson does not receive any meeting attendance fees for Board of Trustees meetings or committee meetings that he attends. Each Independent Trustee (other than the Chairperson) receives, in the aggregate, a retainer fee at the annual rate of $210,000. Each Independent Trustee also receives a meeting attendance fee of $10,000 for each meeting of the Board of Trustees that he or she attends in person and $5,000 for each meeting of the Board of Trustees that he or she attends telephonically. In addition, the chairperson of the Contract Review Committee, the chairperson of the Audit Committee and the chairperson of the Governance Committee each receive an additional retainer fee at the annual rate of $20,000. Each Contract Review Committee member is compensated $6,000 for each Committee meeting that he or she attends in person and $3,000 for each meeting that he or she attends telephonically. Each Audit Committee member is compensated $6,000 for each Committee meeting that he or she attends in person and $3,000 for each meeting that he or she attends telephonically. These fees are allocated among the funds in the Natixis Funds Trusts, Loomis Sayles Funds Trusts and Natixis ETF Trusts based on a formula that takes into account, among other factors, the relative net assets of each fund. Trustees are reimbursed for travel expenses in connection with attendance at meetings.
Prior to January 1, 2022, each Independent Trustee (other than the Chairperson) received, in the aggregate, a retainer fee at the annual rate of $199,000. All other Trustees fees remained unchanged.
A deferred compensation plan (the “Plan”) is available to the Trustees on a voluntary basis. The value of a participating Trustee’s deferral account is based on theoretical investments of deferred amounts, on the normal payment dates, in certain funds of the Natixis Funds Trusts, Loomis Sayles Funds Trusts and Natixis ETF Trusts as designated by the participating Trustees. Changes in the value of participants’ deferral accounts are allocated pro rata among the funds in the Natixis Funds Trusts, Loomis Sayles Funds Trusts and Natixis ETF Trusts and are normally reflected as Trustees’ fees and expenses in the Statements of Operations. Deferred amounts remain in the funds until distributed in accordance with the provisions of the Plan. The portions of the accrued obligations allocated to the Funds under the Plan are reflected as Deferred Trustees’ fees in the Statements of Assets and Liabilities.
For the year ended September 30, 2022, net depreciation in the value of participants’ deferral accounts are reflected on the Statements of Operations as a reduction to expenses, as follows:
| | | | |
Fund | | Amount | |
Core Plus Bond Fund | | $ | (111,172 | ) |
Global Allocation Fund | | | (42,781 | ) |
Growth Fund | | | (65,470 | ) |
Intermediate Duration Bond Fund | | | (24,584 | ) |
Limited Term Government Agency Fund | | | (77,294 | ) |
Certain officers and employees of Natixis Advisors and Loomis Sayles are also officers and/or Trustees of the Trusts.
| 130
Notes to Financial Statements (continued)
September 30, 2022
g. Affiliated Ownership. As of September 30, 2022, the percentage of each Fund’s net assets owned by affiliates is as follows:
| | | | |
| | | Percentage of
Net Assets | |
Core Plus Bond Fund | | | |
Loomis Sayles Employees’ Profit Sharing Retirement Plan | | | 0.15 | % |
Credit Income Fund | | | |
Natixis and Affiliates | | | 98.95 | % |
Loomis Sayles Employees | | | 0.04 | % |
| | | | |
| | | 98.99 | % |
Global Allocation Fund | | | |
Loomis Sayles Employees’ Profit Sharing Retirement Plan | | | 0.63 | % |
Growth Fund | | | |
Loomis Sayles Employees’ Profit Sharing Retirement Plan | | | 0.68 | % |
Loomis Sayles Funded Pension Plan and Trust | | | 0.08 | % |
| | | | |
| | | 0.76 | % |
Intermediate Duration Bond Fund | | | |
Loomis Sayles Employees’ Profit Sharing Retirement Plan | | | 0.80 | % |
| | | | |
Limited Term Government and Agency Fund
| | | |
Loomis Sayles Employees’ Profit Sharing Retirement Plan | | | 0.28 | % |
Loomis Sayles Distribution and Trust | | | 0.71 | % |
Natixis Sustainable Future 2015 Fund | | | 0.07 | % |
Natixis Sustainable Future 2020 Fund | | | 0.05 | % |
Natixis Sustainable Future 2025 Fund | | | 0.07 | % |
Natixis Sustainable Future 2030 Fund | | | 0.10 | % |
Natixis Sustainable Future 2035 Fund | | | 0.08 | % |
Natixis Sustainable Future 2040 Fund | | | 0.04 | % |
Natixis Sustainable Future 2045 Fund | | | 0.03 | % |
| | | | |
| | | 1.43 | % |
Investment activities of affiliated shareholders could have material impacts on the Funds.
h. Reimbursement of Transfer Agent Fees and Expenses. Natixis Advisors has given a binding contractual undertaking to Credit Income Fund, Intermediate Duration Bond Fund and Limited Term Government and Agency Fund to reimburse any and all transfer agency expenses for the Funds’ Class N shares. This undertaking is in effect through January 31, 2023 and is not subject to recovery under the expense limitation agreement described above.
For the year ended September 30, 2022, Natixis Advisors reimbursed the Funds for transfer agency expenses as follows:
| | | | |
| | | Reimbursement of Transfer
Agency Expenses | |
Fund | | Class N | |
Credit Income Fund | | $ | 1,049 | |
Intermediate Duration Bond Fund | | | 1,101 | |
Limited Term Government and Agency Fund | | | 1,392 | |
7. Class-Specific Transfer Agent Fees and Expenses. Transfer agent fees and expenses attributable to Class A, Class C and Class Y are allocated on a pro rata basis to each class based on the relative net assets of each class to the total net assets of those classes. Transfer agent fees and expenses attributable to Class N are allocated to Class N.
131 |
Notes to Financial Statements (continued)
September 30, 2022
For the year ended September 30, 2022, the Funds incurred the following class-specific transfer agent fees and expenses (including sub-transfer agent fees, where applicable):
| | | | | | | | | | | | | | | | |
| | | Transfer Agent Fees and Expenses | |
Fund | | Class A | | | Class C | | | Class N | | | Class Y | |
Core Plus Bond Fund | | $ | 611,781 | | | $ | 76,044 | | | $ | 11,651 | | | $ | 4,778,660 | |
Credit Income Fund | | | 1,912 | | | | 18 | | | | 1,049 | | | | 979 | |
Global Allocation Fund | | | 522,856 | | | | 346,482 | | | | 3,935 | | | | 2,284,029 | |
Growth Fund | | | 1,281,660 | | | | 83,079 | | | | 4,672 | | | | 8,282,197 | |
Intermediate Duration Bond Fund | | | 14,557 | | | | 204 | | | | 1,101 | | | | 218,000 | |
Limited Term Government and Agency Fund | | | 225,559 | | | | 16,664 | | | | 1,392 | | | | 530,469 | |
8. Line of Credit. Each Fund, together with certain other funds of Natixis Funds Trusts, Loomis Sayles Funds Trusts and Natixis ETF Trusts, entered into a $500,000,000 committed unsecured line of credit provided by State Street Bank. Any one Fund may borrow up to $350,000,000 under the line of credit agreement (as long as all borrowings by all Funds in the aggregate do not exceed the $500,000,000 limit at any time), subject to each Fund’s investment restrictions and its contractual obligations under the line of credit. Interest is charged to the Funds based upon the terms set forth in the agreement. In addition, a commitment fee of 0.15% per annum, payable at the end of each calendar quarter, is accrued and apportioned among the participating funds based on their average daily unused portion of the line of credit. The Funds paid certain legal fees in connection with the line of credit agreement, which are being amortized over a period of 364 days and are reflected in legal fees on the Statements of Operations. The unamortized balance is reflected as prepaid expenses on the Statements of Assets and Liabilities.
For the year ended September 30, 2022, Intermediate Duration Bond Fund had an average daily balance on the line of credit (for those days on which there were borrowings) of $2,300,000 at a weighted average interest rate of 1.18%. Interest expense incurred on the line of credit was $75.
9. Risk. Global Allocation Fund’s investments in foreign securities may be subject to greater political, economic, environmental, credit/counterparty and information risks. The Fund’s investments in foreign securities also are subject to foreign currency fluctuations and other foreign currency-related risks. Foreign securities may be subject to higher volatility than U.S. securities, varying degrees of regulation and limited liquidity.
Core Plus Bond Fund and Limited Term Government and Agency Fund’s investments in mortgage-related and asset-backed securities are subject to certain risks not associated with investments in other securities. Mortgage-related and asset-backed securities are subject to the risk that unexpected changes in interest rates will have a direct effect on expected maturity. A shortened maturity may result in the reinvestment of prepaid amounts in securities with lower yields than the original obligations. An extended maturity may result in a reduction of a security’s value.
Russia launched a large-scale invasion of Ukraine on February 24, 2022. The extent and duration of the military action, resulting sanctions and resulting future market disruptions in the region and around the world are impossible to predict, but could be significant and have a severe adverse effect on the region and around the world, including significant negative impacts on the economy and the markets for certain securities and commodities, such as oil and natural gas, as well as other sectors.
10. Concentration of Ownership. From time to time, a Fund may have a concentration of one or more accounts constituting a significant percentage of shares outstanding. Investment activities by holders of such accounts could have material impacts on the Funds. As of September 30, 2022, based on management’s evaluation of the shareholder account base, the Funds had accounts representing controlling ownership of more than 5% of the Funds’ total outstanding shares. The number of such accounts, based on accounts that represent more than 5% of an individual class of shares, and the aggregate percentage of net assets represented by such holdings were as follows:
| | | | | | | | |
| | | Number of 5% Account Holders | | | Percentage of Ownership | |
Core Plus Bond Fund | | | 2 | | | | 11.78 | % |
Growth Fund | | | 2 | | | | 19.48 | % |
Intermediate Duration Bond Fund | | | 4 | | | | 67.93 | % |
Omnibus shareholder accounts for which Natixis Advisors understands that the intermediary has discretion over the underlying shareholder accounts or investment models where a shareholder account may be invested for a non-discretionary customer are included in the table above. For other omnibus accounts, the Funds do not have information on the individual shareholder accounts underlying the omnibus accounts; therefore, there could be other 5% shareholders in addition to those disclosed in the table above.
| 132
Notes to Financial Statements (continued)
September 30, 2022
11. Capital Shares. Each Fund may issue an unlimited number of shares of beneficial interest, without par value. Transactions in capital shares were as follows:
| | | | | | | | | | | | | | | | |
| | | Year Ended
September 30, 2022 | | | Year Ended
September 30, 2021 | |
| Core Plus Bond Fund | | Shares | | | Amount | | | Shares | | | Amount | |
Class A | |
Issued from the sale of shares | | | 10,474,485 | | | $ | 132,986,632 | | | | 29,816,749 | | | $ | 411,705,864 | |
Issued in connection with the reinvestment of distributions | | | 938,411 | | | | 11,828,548 | | | | 1,418,984 | | | | 19,617,302 | |
Redeemed | | | (28,114,978 | ) | | | (356,886,979 | ) | | | (20,094,174 | ) | | | (276,883,383 | ) |
| | | | | | | | | | | | | | | | |
Net change | | | (16,702,082 | ) | | $ | (212,071,799 | ) | | | 11,141,559 | | | $ | 154,439,783 | |
| | | | | | | | | | | | | | | | |
Class C | |
Issued from the sale of shares | | | 423,129 | | | $ | 5,278,465 | | | | 1,270,632 | | | $ | 17,680,906 | |
Issued in connection with the reinvestment of distributions | | | 100,207 | | | | 1,261,196 | | | | 267,935 | | | | 3,719,298 | |
Redeemed | | | (3,221,131 | ) | | | (40,470,551 | ) | | | (3,908,443 | ) | | | (53,805,611 | ) |
| | | | | | | | | | | | | | | | |
Net change | | | (2,697,795 | ) | | $ | (33,930,890 | ) | | | (2,369,876 | ) | | $ | (32,405,407 | ) |
| | | | | | | | | | | | | | | | |
Class N | |
Issued from the sale of shares | | | 38,179,814 | | | $ | 490,210,689 | | | | 74,310,781 | | | $ | 1,036,339,256 | |
Issued in connection with the reinvestment of distributions | | | 5,162,553 | | | | 65,205,642 | | | | 7,758,533 | | | | 108,261,976 | |
Redeemed | | | (62,977,876 | ) | | | (811,978,447 | ) | | | (83,980,462 | ) | | | (1,169,430,230 | ) |
| | | | | | | | | | | | | | | | |
Net change | | | (19,635,509 | ) | | $ | (256,562,116 | ) | | | (1,911,148 | ) | | $ | (24,828,998 | ) |
| | | | | | | | | | | | | | | | |
Class Y | |
Issued from the sale of shares | | | 102,729,590 | | | $ | 1,306,190,967 | | | | 165,904,514 | | | $ | 2,311,069,290 | |
Issued in connection with the reinvestment of distributions | | | 8,612,778 | | | | 108,982,625 | | | | 15,514,659 | | | | 216,562,574 | |
Redeemed | | | (194,725,398 | ) | | | (2,468,017,072 | ) | | | (118,855,676 | ) | | | (1,651,141,438 | ) |
Redeemed in-kind (Note 12) | | | — | | | | — | | | | (77,281,925 | ) | | | (1,057,989,549 | ) |
| | | | | | | | | | | | | | | | |
Net change | | | (83,383,030 | ) | | $ | (1,052,843,480 | ) | | | (14,718,428 | ) | | $ | (181,499,123 | ) |
| | | | | | | | | | | | | | | | |
Decrease from capital share transactions | | | (122,418,416 | ) | | $ | (1,555,408,285 | ) | | | (7,857,893 | ) | | $ | (84,293,745 | ) |
| | | | | | | | | | | | | | | | |
| | | | | | | | | | | | | | | | |
| | | Year Ended
September 30, 2022 | | | Year Ended
September 30, 2021 | |
| Credit Income Fund | | Shares | | | Amount | | | Shares | | | Amount | |
Class A | |
Issued from the sale of shares | | | 11,798 | | | $ | 103,473 | | | | 8,583 | | | $ | 87,178 | |
Issued in connection with the reinvestment of distributions | | | 389 | | | | 3,571 | | | | 215 | | | | 2,194 | |
| | | | | | | | | | | | | | | | |
Net change | | | 12,187 | | | $ | 107,044 | | | | 8,798 | | | $ | 89,372 | |
| | | | | | | | | | | | | | | | |
Class C | |
Issued in connection with the reinvestment of distributions | | | 3 | | | $ | 25 | | | | 2 | | | $ | 20 | |
| | | | | | | | | | | | | | | | |
Net change | | | 3 | | | $ | 25 | | | | 2 | | | $ | 20 | |
| | | | | | | | | | | | | | | | |
Class N | |
Issued in connection with the reinvestment of distributions | | | — | | | $ | — | | | | 70,365 | | | $ | 717,264 | |
Redeemed | | | — | | | | — | | | | (136,187 | ) | | | (1,400,000 | ) |
| | | | | | | | | | | | | | | | |
Net change | | | — | | | $ | — | | | | (65,822 | ) | | $ | (682,736 | ) |
| | | | | | | | | | | | | | | | |
Class Y | |
Issued from the sale of shares | | | 5,804 | | | $ | 57,920 | | | | 1,992 | | | $ | 20,000 | |
Issued in connection with the reinvestment of distributions | | | 202 | | | | 1,898 | | | | 63 | | | | 641 | |
Redeemed | | | (2,572 | ) | | | (24,000 | ) | | | — | | | | — | |
| | | | | | | | | | | | | | | | |
Net change | | | 3,434 | | | $ | 35,818 | | | | 2,055 | | | $ | 20,641 | |
| | | | | | | | | | | | | | | | |
Increase (decrease) from capital share transactions | | | 15,624 | | | $ | 142,887 | | | | (54,967 | ) | | $ | (572,703 | ) |
| | | | | | | | | | | | | | | | |
133 |
Notes to Financial Statements (continued)
September 30, 2022
11. Capital Shares (continued).
| | | | | | | | | | | | | | | | |
| | | Year Ended
September 30, 2022 | | | Year Ended
September 30, 2021 | |
| Global Allocation Fund | | Shares | | | Amount | | | Shares | | | Amount | |
Class A | |
Issued from the sale of shares | | | 4,486,306 | | | $ | 116,023,013 | | | | 6,524,893 | | | $ | 180,992,665 | |
Issued in connection with the reinvestment of distributions | | | 1,295,399 | | | | 36,335,959 | | | | 920,421 | | | | 24,308,308 | |
Redeemed | | | (7,156,453 | ) | | | (177,508,478 | ) | | | (6,008,771 | ) | | | (165,998,676 | ) |
| | | | | | | | | | | | | | | | |
Net change | | | (1,374,748 | ) | | $ | (25,149,506 | ) | | | 1,436,543 | | | $ | 39,302,297 | |
| | | | | | | | | | | | | | | | |
Class C | |
Issued from the sale of shares | | | 1,599,502 | | | $ | 41,324,930 | | | | 3,263,944 | | | $ | 88,556,205 | |
Issued in connection with the reinvestment of distributions | | | 1,119,198 | | | | 30,632,442 | | | | 874,791 | | | | 22,762,056 | |
Redeemed | | | (4,879,499 | ) | | | (116,412,070 | ) | | | (5,108,914 | ) | | | (139,833,825 | ) |
| | | | | | | | | | | | | | | | |
Net change | | | (2,160,799 | ) | | $ | (44,454,698 | ) | | | (970,179 | ) | | $ | (28,515,564 | ) |
| | | | | | | | | | | | | | | | |
Class N | |
Issued from the sale of shares | | | 1,767,033 | | | $ | 46,769,376 | | | | 2,841,756 | | | $ | 79,949,134 | |
Issued in connection with the reinvestment of distributions | | | 769,270 | | | | 21,747,266 | | | | 538,052 | | | | 14,290,673 | |
Redeemed | | | (2,468,746 | ) | | | (61,003,997 | ) | | | (1,348,272 | ) | | | (37,935,362 | ) |
| | | | | | | | | | | | | | | | |
Net change | | | 67,557 | | | $ | 7,512,645 | | | | 2,031,536 | | | $ | 56,304,445 | |
| | | | | | | | | | | | | | | | |
Class Y | |
Issued from the sale of shares | | | 17,815,028 | | | $ | 464,667,649 | | | | 28,068,845 | | | $ | 781,608,888 | |
Issued in connection with the reinvestment of distributions | | | 7,072,360 | | | | 200,006,364 | | | | 5,159,028 | | | | 137,075,378 | |
Redeemed | | | (41,896,295 | ) | | | (1,013,036,852 | ) | | | (20,980,436 | ) | | | (585,757,015 | ) |
| | | | | | | | | | | | | | | | |
Net change | | | (17,008,907 | ) | | $ | (348,362,839 | ) | | | 12,247,437 | | | $ | 332,927,251 | |
| | | | | | | | | | | | | | | | |
Increase (decrease) from capital share transactions | | | (20,476,897 | ) | | $ | (410,454,398 | ) | | | 14,745,337 | | | $ | 400,018,429 | |
| | | | | | | | | | | | | | | | |
| | | | | | | | | | | | | | | | |
| | | Year Ended
September 30, 2022 | | | Year Ended
September 30, 2021 | |
| Growth Fund | | Shares | | | Amount | | | Shares | | | Amount | |
Class A | |
Issued from the sale of shares | | | 39,717,368 | | | $ | 783,108,012 | | | | 14,830,602 | | | $ | 336,860,802 | |
Issued in connection with the reinvestment of distributions | | | 2,690,613 | | | | 64,816,875 | | | | 2,584,797 | | | | 55,159,560 | |
Redeemed | | | (44,619,514 | ) | | | (895,385,409 | ) | | | (15,759,091 | ) | | | (358,878,253 | ) |
| | | | | | | | | | | | | | | | |
Net change | | | (2,211,533 | ) | | $ | (47,460,522 | ) | | | 1,656,308 | | | $ | 33,142,109 | |
| | | | | | | | | | | | | | | | |
Class C | |
Issued from the sale of shares | | | 482,265 | | | $ | 9,254,099 | | | | 758,965 | | | $ | 15,406,250 | |
Issued in connection with the reinvestment of distributions | | | 212,100 | | | | 4,507,128 | | | | 217,137 | | | | 4,145,151 | |
Redeemed | | | (2,108,692 | ) | | | (39,692,654 | ) | | | (1,887,469 | ) | | | (38,343,784 | ) |
| | | | | | | | | | | | | | | | |
Net change | | | (1,414,327 | ) | | $ | (25,931,427 | ) | | | (911,367 | ) | | $ | (18,792,383 | ) |
| | | | | | | | | | | | | | | | |
Class N | |
Issued from the sale of shares | | | 16,076,988 | | | $ | 384,004,405 | | | | 9,306,755 | | | $ | 236,713,241 | |
Issued in connection with the reinvestment of distributions | | | 974,540 | | | | 25,445,235 | | | | 791,041 | | | | 18,170,220 | |
Redeemed | | | (11,291,066 | ) | | | (249,812,188 | ) | | | (4,802,896 | ) | | | (118,776,438 | ) |
| | | | | | | | | | | | | | | | |
Net change | | | 5,760,462 | | | $ | 159,637,452 | | | | 5,294,900 | | | $ | 136,107,023 | |
| | | | | | | | | | | | | | | | |
Class Y | |
Issued from the sale of shares | | | 106,157,081 | | | $ | 2,382,270,036 | | | | 103,087,646 | | | $ | 2,516,764,085 | |
Issued in connection with the reinvestment of distributions | | | 15,751,106 | | | | 411,103,854 | | | | 14,341,619 | | | | 329,570,400 | |
Redeemed | | | (127,856,705 | ) | | | (2,914,738,824 | ) | | | (104,651,246 | ) | | | (2,564,375,092 | ) |
| | | | | | | | | | | | | | | | |
Net change | | | (5,948,518 | ) | | $ | (121,364,934 | ) | | | 12,778,019 | | | $ | 281,959,393 | |
| | | | | | | | | | | | | | | | |
Increase (decrease) from capital share transactions | | | (3,813,916 | ) | | $ | (35,119,431 | ) | | | 18,817,860 | | | $ | 432,416,142 | |
| | | | | | | | | | | | | | | | |
| 134
Notes to Financial Statements (continued)
September 30, 2022
11. Capital Shares (continued).
| | | | | | | | | | | | | | | | |
| | | Year Ended
September 30, 2022 | | | Year Ended
September 30, 2021 | |
| Intermediate Duration Bond Fund | | Shares | | | Amount | | | Shares | | | Amount | |
Class A | |
Issued from the sale of shares | | | 620,754 | | | $ | 6,337,904 | | | | 391,289 | | | $ | 4,178,504 | |
Issued in connection with the reinvestment of distributions | | | 38,180 | | | | 379,158 | | | | 67,348 | | | | 722,081 | |
Redeemed | | | (679,509 | ) | | | (6,739,182 | ) | | | (295,471 | ) | | | (3,162,591 | ) |
| | | | | | | | | | | | | | | | |
Net change | | | (20,575 | ) | | $ | (22,120 | ) | | | 163,166 | | | $ | 1,737,994 | |
| | | | | | | | | | | | | | | | |
Class C | |
Issued from the sale of shares | | | 25,419 | | | $ | 268,078 | | | | 33,975 | | | $ | 362,538 | |
Issued in connection with the reinvestment of distributions | | | 318 | | | | 3,209 | | | | 1,594 | | | | 17,157 | |
Redeemed | | | (36,638 | ) | | | (374,076 | ) | | | (66,527 | ) | | | (713,206 | ) |
| | | | | | | | | | | | | | | | |
Net change | | | (10,901 | ) | | $ | (102,789 | ) | | | (30,958 | ) | | $ | (333,511 | ) |
| | | | | | | | | | | | | | | | |
Class N | |
Issued from the sale of shares | | | 223,571 | | | $ | 2,186,390 | | | | 1,919,981 | | | $ | 20,990,656 | |
Issued in connection with the reinvestment of distributions | | | 46,222 | | | | 457,509 | | | | 73,626 | | | | 788,205 | |
Redeemed | | | (78,242 | ) | | | (767,571 | ) | | | (393,996 | ) | | | (4,192,408 | ) |
| | | | | | | | | | | | | | | | |
Net change | | | 191,551 | | | $ | 1,876,328 | | | | 1,599,611 | | | $ | 17,586,453 | |
| | | | | | | | | | | | | | | | |
Class Y | |
Issued from the sale of shares | | | 10,432,771 | | | $ | 104,382,931 | | | | 10,808,587 | | | $ | 115,946,231 | |
Issued in connection with the reinvestment of distributions | | | 701,722 | | | | 6,984,487 | | | | 1,146,148 | | | | 12,285,740 | |
Redeemed | | | (15,625,439 | ) | | | (155,292,386 | ) | | | (6,495,177 | ) | | | (69,613,933 | ) |
| | | | | | | | | | | | | | | | |
Net change | | | (4,490,946 | ) | | $ | (43,924,968 | ) | | | 5,459,558 | | | $ | 58,618,038 | |
| | | | | | | | | | | | | | | | |
Increase (decrease) from capital share transactions | | | (4,330,871 | ) | | $ | (42,173,549 | ) | | | 7,191,377 | | | $ | 77,608,974 | |
| | | | | | | | | | | | | | | | |
| | | | | | | | | | | | | | | | |
| | | Year Ended
September 30, 2022 | | | Year Ended
September 30, 2021 | |
| Limited Term Government and Agency Fund | | Shares | | | Amount | | | Shares | | | Amount | |
Class A | |
Issued from the sale of shares | | | 3,443,653 | | | $ | 38,051,151 | | | | 4,147,975 | | | $ | 47,644,899 | |
Issued in connection with the reinvestment of distributions | | | 180,701 | | | | 1,981,779 | | | | 142,329 | | | | 1,632,849 | |
Redeemed | | | (5,686,327 | ) | | | (62,870,713 | ) | | | (4,760,500 | ) | | | (54,613,007 | ) |
| | | | | | | | | | | | | | | | |
Net change | | | (2,061,973 | ) | | $ | (22,837,783 | ) | | | (470,196 | ) | | $ | (5,335,259 | ) |
| | | | | | | | | | | | | | | | |
Class C | |
Issued from the sale of shares | | | 355,616 | | | $ | 3,946,921 | | | | 1,491,979 | | | $ | 17,130,682 | |
Issued in connection with the reinvestment of distributions | | | 3,777 | | | | 41,142 | | | | 565 | | | | 6,501 | |
Redeemed | | | (1,217,350 | ) | | | (13,438,953 | ) | | | (1,003,816 | ) | | | (11,516,279 | ) |
| | | | | | | | | | | | | | | | |
Net change | | | (857,957 | ) | | $ | (9,450,890 | ) | | | 488,728 | | | $ | 5,620,904 | |
| | | | | | | | | | | | | | | | |
Class N | |
Issued from the sale of shares | | | 1,015,581 | | | $ | 11,197,256 | | | | 647,112 | | | $ | 7,445,249 | |
Issued in connection with the reinvestment of distributions | | | 17,409 | | | | 191,162 | | | | 9,104 | | | | 104,691 | |
Redeemed | | | (327,674 | ) | | | (3,626,861 | ) | | | (474,940 | ) | | | (5,474,545 | ) |
| | | | | | | | | | | | | | | | |
Net change | | | 705,316 | | | $ | 7,761,557 | | | | 181,276 | | | $ | 2,075,395 | |
| | | | | | | | | | | | | | | | |
Class Y | |
Issued from the sale of shares | | | 29,040,597 | | | $ | 322,624,285 | | | | 31,129,058 | | | $ | 358,564,945 | |
Issued in connection with the reinvestment of distributions | | | 473,606 | | | | 5,223,069 | | | | 418,562 | | | | 4,816,720 | |
Redeemed | | | (45,475,068 | ) | | | (503,368,228 | ) | | | (29,381,773 | ) | | | (338,427,397 | ) |
| | | | | | | | | | | | | | | | |
Net change | | | (15,960,865 | ) | | $ | (175,520,874 | ) | | | 2,165,847 | | | $ | 24,954,268 | |
| | | | | | | | | | | | | | | | |
Increase (decrease) from capital share transactions | | | (18,175,479 | ) | | $ | (200,047,990 | ) | | | 2,365,655 | | | $ | 27,315,308 | |
| | | | | | | | | | | | | | | | |
135 |
Notes to Financial Statements (continued)
September 30, 2022
12. Redemption In-Kind. In certain circumstances, a Fund may distribute portfolio securities rather than cash as payment for redemption of Fund shares (redemption in-kind). For financial reporting purposes, the Fund will recognize a gain on in-kind redemptions to the extent the value of the distributed securities on the date of redemption exceeds the cost of those securities; the Fund will recognize a loss if the cost exceeds value. Gains and losses realized on redemptions in-kind are not recognized for tax purposes and are re-classified from realized gain (loss) to paid-in-capital. For the year ended September 30, 2021, Core Plus Bond Fund participated in a redemption in-kind transaction.
| 136
Report of Independent Registered Public Accounting Firm
To the Board of Trustees of Natixis Funds Trust I, Loomis Sayles Funds I and Loomis Sayles Funds II and Shareholders of Loomis Sayles Core Plus Bond Fund, Loomis Sayles Intermediate Duration Bond Fund, Loomis Sayles Credit Income Fund, Loomis Sayles Global Allocation Fund, Loomis Sayles Growth Fund and Loomis Sayles Limited Term Government and Agency Fund:
Opinions on the Financial Statements
We have audited the accompanying statements of assets and liabilities, including the portfolios of investments, of Loomis Sayles Core Plus Bond Fund (one of the funds constituting Natixis Funds Trust I), Loomis Sayles Intermediate Duration Bond Fund (one of the funds constituting Loomis Sayles Funds I), and Loomis Sayles Credit Income Fund, Loomis Sayles Global Allocation Fund, Loomis Sayles Growth Fund and Loomis Sayles Limited Term Government and Agency Fund (four of the funds constituting Loomis Sayles Funds II) (hereafter collectively referred to as the “Funds”) as of September 30, 2022, the related statements of operations for the year ended September 30, 2022, the statements of changes in net assets for each of the two years in the period ended September 30, 2022, including the related notes, and the financial highlights for each of the periods indicated therein (collectively referred to as the “financial statements”). In our opinion, the financial statements present fairly, in all material respects, the financial position of each of the Funds as of September 30, 2022, the results of each of their operations for the year then ended, the changes in each of their net assets for each of the two years in the period ended September 30, 2022 and each of the financial highlights for each of the periods indicated therein, in conformity with accounting principles generally accepted in the United States of America.
Basis for Opinions
These financial statements are the responsibility of the Funds’ management. Our responsibility is to express an opinion on the Funds’ financial statements based on our audits. We are a public accounting firm registered with the Public Company Accounting Oversight Board (United States) (PCAOB) and are required to be independent with respect to the Funds in accordance with the U.S. federal securities laws and the applicable rules and regulations of the Securities and Exchange Commission and the PCAOB.
We conducted our audits of these financial statements in accordance with the standards of the PCAOB. Those standards require that we plan and perform the audit to obtain reasonable assurance about whether the financial statements are free of material misstatement, whether due to error or fraud.
Our audits included performing procedures to assess the risks of material misstatement of the financial statements, whether due to error or fraud, and performing procedures that respond to those risks. Such procedures included examining, on a test basis, evidence regarding the amounts and disclosures in the financial statements. Our audits also included evaluating the accounting principles used and significant estimates made by management, as well as evaluating the overall presentation of the financial statements. Our procedures included confirmation of securities owned as of September 30, 2022 by correspondence with the custodian, transfer agent, agency banks and brokers; when replies were not received from brokers, we performed other auditing procedures. We believe that our audits provide a reasonable basis for our opinions.
/s/PricewaterhouseCoopers LLP
Boston, Massachusetts
November 21, 2022
We have served as the auditor of one or more investment companies in the Natixis Investment Company Complex since at least 1995. We have not determined the specific year we began serving as auditor.
137 |
2022 U.S. Tax Distribution Information to Shareholders (Unaudited)
Corporate Dividends Received Deduction. For the fiscal year ended September 30, 2022, a percentage of dividends distributed by the Funds listed below qualify for the dividends received deduction for corporate shareholders. These percentages are as follows:
| | | | |
Fund | | Qualifying
Percentage | |
Credit Income Fund | | | 3.39 | % |
Global Allocation Fund | | | 80.36 | % |
Growth Fund | | | 100.00 | % |
Capital Gains Distributions. Pursuant to Internal Revenue Section 852(b), the following Funds paid distributions, which have been designated as capital gains distributions for the fiscal year ended September 30, 2022, unless subsequently determined to be different.
| | | | |
Fund | | Amount | |
Core Plus Bond Fund | | $ | 17,404,702 | |
Credit Income Fund | | | 45,086 | |
Global Allocation Fund | | | 349,351,833 | |
Growth Fund | | | 627,018,288 | |
Intermediate Duration Bond Fund | | | 1,181,959 | |
Qualified Dividend Income. For the fiscal year ended September 30, 2022, the Funds below will designate up to the maximum amount allowable pursuant to the Internal Revenue Code as qualified dividend income eligible for reduced tax rates. These lower rates range from 0% to 20% depending on an individual’s tax bracket. If the Funds pay a distribution during calendar year 2022, complete information will be reported in conjunction with Form 1099-DIV.
| | | | |
Fund | | | |
Credit Income Fund | | | | |
Global Allocation Fund | | | | |
Growth Fund | | | | |
| 138
Trustee and Officer Information
The tables below provide certain information regarding the Trustees and officers of Natixis Funds Trust I, Loomis Sayles Funds I and Loomis Sayles Funds II (the “Trusts”). Unless otherwise indicated, the address of all persons below is 888 Boylston Street, Suite 800, Boston, MA 02199-8197. The Funds’ Statements of Additional Information includes additional information about the Trustees of the Trusts and is available by calling Natixis Funds/Loomis Sayles Funds at 800-225-5478/800-633-3330.
| | | | | | | | |
Name and Year of Birth | | Position(s) Held with
the Trusts, Length
of Time Served and Term of Office1 | | Principal
Occupation(s) During Past 5 Years | | Number of Portfolios
in Fund Complex
Overseen2 and Other
Directorships Held During Past 5 Years | | Experience,
Qualifications,
Attributes, Skills for Board Membership |
|
| INDEPENDENT TRUSTEES |
| | | | |
Edmond J. English (1953) | | Trustee since 2013 Chairperson of the Governance Committee and Contract Review Committee Member | | Executive Chairman of Bob’s Discount Furniture (retail) | | 54 Director, Burlington Stores, Inc. (retail) and Director, Rue Gilt Groupe, Inc. (e-commerce retail) | | Significant experience on the Board and on the boards of other business organizations (including retail companies and a bank); executive experience (including at a retail company) |
| | | | |
Richard A. Goglia (1951) | | Trustee since 2015 Contract Review Committee Member and Governance Committee Member | | Retired | | 54 Formerly, Director of Triumph Group (aerospace industry) | | Significant experience on the Board and executive experience (including his role as vice president and treasurer of a defense company and experience at a financial services company) |
| | | | |
Wendell J. Knox (1948) | | Trustee since 2009 Chairperson of the Contract Review Committee | | Retired | | 54 Director, Abt Associates Inc. (research and consulting); Director, The Hanover Insurance Group (property and casualty insurance); Formerly, Director, Eastern Bank (bank) | | Significant experience on the Board and on the boards of other business organizations (including at a bank and at a property and casualty insurance firm); executive experience (including roles as president and chief executive officer of a research and consulting company) |
139 |
Trustee and Officer Information
| | | | | | | | |
Name and Year of Birth | | Position(s) Held with
the Trusts, Length
of Time Served and Term of Office1 | | Principal
Occupation(s) During Past 5 Years | | Number of Portfolios
in Fund Complex
Overseen2 and Other
Directorships Held During Past 5 Years | | Experience,
Qualifications,
Attributes, Skills for Board Membership |
|
| INDEPENDENT TRUSTEES – continued |
| | | | |
Martin T. Meehan (1956) | | Trustee since 2012 Contract Review Committee Member and Governance Committee Member | | President, University of Massachusetts | | 54 None | | Significant experience on the Board and on the boards of other business organizations; experience as President of the University of Massachusetts; government experience (including as a member of the U.S. House of Representatives); academic experience |
| | | | |
Maureen B. Mitchell (1951) | | Trustee since 2017 Audit Committee Member and Governance Committee Member | | Retired | | 54 Director, Sterling Bancorp (bank) | | Significant experience on the Board; financial services industry and executive experience (including role as president of global sales and marketing at a financial services company) |
| | | | |
James P. Palermo (1955) | | Trustee since 2016 Audit Committee Member | | Founding Partner, Breton Capital Management, LLC (private equity); Partner, STEP Partners, LLC (private equity) | | 54 Director, FutureFuel.io (chemicals and biofuels) | | Significant experience on the Board; financial services industry and executive experience (including roles as chief executive officer of client management and asset servicing for a banking and financial services company) |
| | | | |
Erik R. Sirri (1958) | | Chairperson of the Board of Trustees since January 2021 Trustee since 2009 Ex Officio member of the Audit Committee, Contract Review Committee and Governance Committee | | Professor of Finance at Babson College | | 54 None | | Significant experience on the Board; experience as Director of the Division of Trading and Markets at the Securities and Exchange Commission; academic experience; training as an economist |
| 140
Trustee and Officer Information
| | | | | | | | |
Name and Year of Birth | | Position(s) Held with
the Trusts, Length
of Time Served and Term of Office1 | | Principal
Occupation(s) During Past 5 Years | | Number of Portfolios
in Fund Complex
Overseen2 and Other
Directorships Held During Past 5 Years | | Experience,
Qualifications,
Attributes, Skills for Board Membership |
|
| INDEPENDENT TRUSTEES – continued |
| | | | |
Peter J. Smail (1952) | | Trustee since 2009 Audit Committee Member | | Retired | | 54 None | | Significant experience on the Board; mutual fund industry and executive experience (including roles as president and chief executive officer for an investment adviser) |
| | | | |
Kirk A. Sykes (1958) | | Trustee since 2019 Audit Committee Member and Governance Committee Member | | Managing Director of Accordia Partners, LLC (real estate development); President of Primary Corporation (real estate development); Managing Principal of Merrick Capital Partners (infrastructure finance) | | 54 Advisor Eastern Bank (bank); Director, Apartment Investment and Management Company (real estate investment trust); formerly Director, Ares Commercial Real Estate Corporation (real estate investment trust) | | Experience on the Board and significant experience on the boards of other business organizations (including real estate companies and banks) |
| | | | |
Cynthia L. Walker (1956) | | Trustee since 2005 Chairperson of the Audit Committee | | Retired; Formerly, Deputy Dean for Finance and Administration, Yale University School of Medicine | | 54 None | | Significant experience on the Board; executive experience in a variety of academic organizations (including roles as dean for finance and administration) |
|
| INTERESTED TRUSTEES |
| | | | |
Kevin P. Charleston3 (1965) One Financial Center Boston, MA 02111 | | Trustee since 2015 President and Chief Executive Officer | | President, Chief Executive Officer and Chairman of the Board of Directors, Loomis, Sayles & Company, L.P. | | 54 None | | Significant experience on the Board; continuing service as President, Chief Executive Officer and Chairman of the Board of Directors of Loomis, Sayles & Company, L.P. |
141 |
Trustee and Officer Information
| | | | | | | | |
Name and Year of Birth | | Position(s) Held with
the Trusts, Length
of Time Served and Term of Office1 | | Principal
Occupation(s) During Past 5 Years | | Number of Portfolios
in Fund Complex
Overseen2 and Other
Directorships Held During Past 5 Years | | Experience,
Qualifications,
Attributes, Skills for Board Membership |
|
| INTERESTED TRUSTEES – continued |
| | | | |
David L. Giunta4
(1965) | | Trustee since 2011 President and Chief Executive Officer of Natixis Funds Trust I; and President of Loomis Sayles Funds II and Executive Vice President of Loomis Sayles Funds I since 2008; Chief Executive Officer of Loomis Sayles Funds II since 2015 | | President and Chief Executive Officer, Natixis Advisors, LLC and Natixis Distribution, LLC | | 54 None | | Significant experience on the Board; experience as President and Chief Executive Officer of Natixis Advisors, LLC and Natixis Distribution, LLC |
| 1 | Each Trustee serves until retirement, resignation or removal from the Board. The current retirement age is 75. The position of Chairperson of the Board is appointed for a three-year term. |
| 2 | The Trustees of the Trusts serve as Trustees of a fund complex that includes all series of the Natixis Funds Trust I, Natixis Funds Trust II, Natixis Funds Trust IV, Gateway Trust, Loomis Sayles Funds I, Loomis Sayles Funds II, Natixis ETF Trust and Natixis ETF Trust II (collectively, the “Fund Complex”). |
| 3 | Mr. Charleston is deemed an “interested person” of the Trusts because he holds the following positions with an affiliated person of the Trusts: President, Chief Executive Officer and Chairman of the Board of Directors of Loomis, Sayles & Company, L.P. |
| 4 | Mr. Giunta is deemed an “interested person” of the Trusts because he holds the following positions with an affiliated person of the Trusts: President and Chief Executive Officer, Natixis Advisors, LLC and Natixis Distribution, LLC. |
| | | | | | |
Name and Year of Birth | | Position(s) Held with the Trusts | | Term of Office1 and Length of Time Served | | Principal Occupation(s) During Past 5 Years2 |
|
| OFFICERS OF THE TRUSTS |
| | | |
Matthew Block (1981) | | Treasurer, Principal Financial and Accounting Officer | | Since 2022 | | Senior Vice President, Natixis Advisors, LLC and Natixis Distribution, LLC; formerly, Vice President, Natixis Advisors, LLC and Natixis Distribution, LLC; Assistant Treasurer of the Fund Complex; Managing Director, State Street Bank and Trust Company; Senior Manager, PricewaterhouseCoopers, LLC |
| 142
Trustee and Officer Information
| | | | | | |
Name and Year of Birth | | Position(s) Held with the Trusts | | Term of Office1 and Length of Time Served | | Principal Occupation(s) During Past 5 Years2 |
|
| OFFICERS OF THE TRUSTS – continued |
| | | |
Susan McWhan Tobin (1963) | | Secretary and Chief Legal Officer | | Since 2022 | | Executive Vice President, General Counsel and Secretary, Natixis Advisors, LLC and Natixis Distribution, LLC; formerly, Executive Vice President and Chief Compliance Officer of Natixis Investment Managers (March 2019– May 2022) and Senior Vice President and Head of Compliance, US for Natixis Investment Managers (July 2011–March 2019) |
| | | |
Natalie R. Wagner (1979) | | Chief Compliance Officer, Assistant Secretary and Anti-Money Laundering Officer | | Since 2021 | | Senior Vice President, Natixis Advisors, LLC and Natixis Distribution, LLC; formerly, Vice President, Head of Corporate Compliance, Global Atlantic Financial Group |
| 1 | Each officer of the Trusts serves for an indefinite term in accordance with the Trusts’ current by-laws until the date his or her successor is elected and qualified, or until he or she sooner dies, retires, is removed or becomes disqualified. |
| 2 | Each person listed above, except as noted, holds the same position(s) with the Fund Complex. Previous positions during the past five years with Natixis Distribution, LLC, Natixis Advisors, LLC or Loomis, Sayles & Company, L.P. are omitted, if not materially different from an officer’s current position with such entity. |
143 |

Loomis Sayles Small Cap Growth Fund
Loomis Sayles Small Cap Value Fund
Loomis Sayles Small/Mid Cap Growth Fund
Annual Report
September 30, 2022
LOOMIS SAYLES SMALL CAP GROWTH FUND
| | | | |
| Managers | | Symbols | | |
| | |
| Mark F. Burns, CFA® | | Institutional Class | | LSSIX |
| | |
| John J. Slavik, CFA® | | Retail Class | | LCGRX |
| | |
| | Class N | | LSSNX |
Investment Objective
The Fund’s investment objective is long-term capital growth from investments in common stocks or other equity securities.
Market Conditions
The bear market that started in 2021 continued through the end of the period, as the first nine months of 2022 marked the fourth worst start to a year for small and midcap stocks going back to 1926. The third quarter of 2022 was the third consecutive quarterly decline for US equities, as every domestic size and style box was down.
The Russell 2000® Growth Index had its second worst start to the year since 2002, falling nearly 30% year-to-date and 38% from its peak. During the first nine months of 2022, market volatility in both directions has been quite significant. Historically, some of the biggest rallies have occurred during bear markets, and this period was certainly no exception. The most recent quarter started with optimism that the Federal Reserve (Fed) might pivot away from its monetary policy tightening but ended with the reality that inflation is going to be harder to tame than most originally thought. Recession risks are also rising, and a recession may have already started in the second half of 2022, with business confidence, housing and manufacturing orders all in recession territory.
While we do expect earnings estimates to continue to trend downward, we believe the market has discounted a lot of this bad news to date. Although overall sentiment remains bearish and further volatility near-term is likely, we believe there are bullish indicators that may be starting to emerge, particularly for small cap equities (relative to large caps) as we look ahead longer-term.
Performance Results
For the 12 months ended September 30, 2022, Institutional Class shares of the Loomis Sayles Small Cap Growth Fund returned -24.77% at net asset value. The Fund outperformed its benchmark, the Russell 2000® Growth Index, which returned -29.27%.
Explanation of Fund Performance
Stock selection in the health care, information technology, and industrials sectors contributed most strongly to positive relative performance during the period. Conversely, stock selection within the energy sector and relative positioning in the energy and materials sectors detracted from relative performance.
The Fund’s top contributors to relative performance at the individual stock level were health care services and technology company Evolent Health Inc, healthcare services company Option Care Health Inc, and biotechnology company PTC Therapeutics Inc. Evolent Health helps providers and payers move towards a value-based payment system. Evolent has performed well, as it reported another strong quarter in August and provided an update that indicates its positive momentum should continue well into 2023. Option Care Health focuses on providing drug infusion services to patients at home or in specialty infusion clinics. Unlike many other healthcare service companies, Option Care Health made it through inflationary pressures with minimal impact on their income statement. In addition, the company continued to benefit from the transition to home health care services. PTC Therapeutics focuses on treating rare diseases. The company benefitted from positive results in a confirmatory European clinical trial for its Duchenne muscular dystrophy treatment. The result firmed up the company’s long-term revenue outlook and raised the possibility of bringing this product to the US market.
Conversely, the largest detractors of relative performance among individual stocks were digital on-demand printer manufacturer Kornit Digital Ltd., leading stock image and online video marketplace Shutterstock Inc., and leading cybersecurity provider Rapid7 Inc. Kornit Digital serves the growing e-commerce sector. The stock saw a sharp sell-off due to a rotation away from high-growth, high-valuation stocks during the period. Also, investors feared that Kornit’s massive growth during the Covid-19 pandemic period likely pulled forward demand, thus potentially slowing future growth. Shutterstock’s stock had been weak following a disappointing report in the first quarter of 2022 in which topline growth slowed, and there are emerging fears about how companies that depend on online marketing & advertising will fare in a recession. In addition, Shutterstock’s CEO announced an abrupt and unexpected departure just days after the earnings call, causing more concern about the near-term direction of the company. Rapid7 focuses on vulnerability management, incident detection and response, and cloud security. The stock had been weak due to valuation compression across the broader software space and a lackluster financial report in the first quarter of 2022, with results that were only in line with expectations, and Rapid7 didn’t raise its guidance on several key metrics.
Outlook
Excess volatility in our benchmarks was at highly elevated levels throughout the period, reflecting a market environment with low conviction among investors. Stock markets fluctuated from an oversold state to an overbought one, and vice versa during the course of the period. Below
1 |
the surface, new leadership groups gained momentum, while old leadership groups continued to gasp for air. Specifically, energy and certain areas within healthcare and industrials continued to garner support, while technology continued to struggle. While we certainly expect more “throwback” rallies in old leadership, we would expect this new leadership to maintain its relative performance edge.
We are also witnessing the early stages of small/mid cap stock outperformance relative to the broader market. While this seems counterintuitive given the economic struggles we are facing, this cohort of stocks seems to have much more harshly discounted the recession up to this point.
Investors are slowly coming to grips with investing in a rising rate environment, with no near-term safety net provided by the Fed. This will become even more challenging as companies report their third quarter earnings and provide an outlook for the remainder of the year and, hopefully, beyond. We clearly expect to see a broad downward revision in estimates across most sectors and industries and will quickly find out how much these lower prospective earnings have been discounted by the market. More durable growth businesses should weather the storm far better than their weaker peers, as will those business models with the most attractive return profiles.
We believe quality and (especially) growth become scarce and attractive attributes at this point in an economic cycle, and we expect will benefit our process going forward.
Top Ten Holdings as of September 30, 2022
| | | | | | |
| | | Security name | | % of
Net Assets | |
| 1 | | Casella Waste Systems, Inc., Class A | | | 2.07 | % |
| 2 | | Axonics, Inc. | | | 2.06 | |
| 3 | | Option Care Health, Inc. | | | 2.02 | |
| 4 | | Advanced Drainage Systems, Inc. | | | 1.98 | |
| 5 | | Evolent Health, Inc., Class A | | | 1.98 | |
| 6 | | WillScot Mobile Mini Holdings Corp. | | | 1.96 | |
| 7 | | WNS Holdings Ltd., ADR | | | 1.93 | |
| 8 | | Halozyme Therapeutics, Inc. | | | 1.63 | |
| 9 | | Pure Storage, Inc., Class A | | | 1.61 | |
| 10 | | KBR, Inc. | | | 1.60 | |
The portfolio is actively managed and holdings are subject to change. There is no guarantee the Fund continues to invest in the securities referenced. The holdings listed exclude any temporary cash investments, are presented on an individual security basis and do not represent holdings of the issuer.
Hypothetical Growth of $100,000 Investment in Institutional Class Shares
September 30, 2012 through September 30, 20222
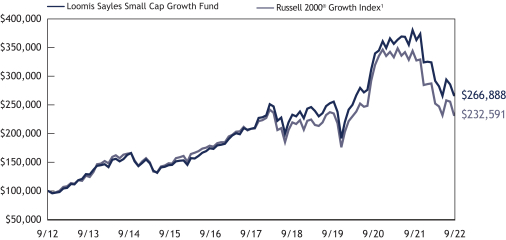
See notes to charts on page 3.
| 2
LOOMIS SAYLES SMALL CAP GROWTH FUND
Average Annual Total Returns — September 30, 20222
| | | | | | | | | | | | | | | | | | | | | | | | |
| | | | | | |
| | | | | | | | | | | | Life of | | | Expense Ratios3 | |
| | | 1 Year | | | 5 Years | | | 10 Years | | | Class N | | | Gross | | | Net | |
| | | | | | | |
| Institutional Class | | | -24.77 | % | | | 6.96 | % | | | 10.31 | % | | | — | % | | | 0.92 | % | | | 0.92 | % |
| | | | | | | |
| Retail Class | | | -24.94 | | | | 6.70 | | | | 10.03 | | | | — | | | | 1.17 | | | | 1.17 | |
| | | | | | | |
| Class N (Inception 2/1/13) | | | -24.69 | | | | 7.08 | | | | — | | | | 10.20 | | | | 0.82 | | | | 0.82 | |
| | | | | | | |
| Comparative Performance | | | | | | | | | | | | | | | | | | | | | | | | |
| Russell 2000® Growth Index1 | | | -29.27 | | | | 3.60 | | | | 8.81 | | | | 6.21 | | | | | | | | | |
Performance data shown represents past performance and is no guarantee of, and not necessarily indicative of, future results. Total return and value will vary, and you may have a gain or loss when shares are sold. Current performance may be lower or higher than quoted. For most recent month-end performance, visit loomissayles.com. Performance for other share classes will be greater or less than shown based on differences in fees and sales charges. You may not invest directly in an index. Performance for periods less than one year is cumulative, not annualized. Returns reflect changes in share price and reinvestment of dividends and capital gains, if any. The table(s) do not reflect taxes shareholders might owe on any fund distributions or when they redeem their shares.
| 1 | | Russell 2000® Growth Index is an unmanaged index that measures the performance of the small-cap growth segment of the U.S. equity universe. It includes those Russell 2000® companies with higher price-to-book ratios and higher forecasted growth values. |
| 2 | | Fund performance has been increased by fee waivers and/or expense reimbursements, if any, without which performance would have been lower. |
| 3 | | Expense ratios are as shown in the Fund’s prospectus in effect as of the date of this report. The expense ratios for the current reporting period can be found in the Financial Highlights section of this report under Ratios to Average Net Assets. Net expenses reflect contractual expense limitations set to expire on 1/31/23. When a Fund’s expenses are below the limitation, gross and net expense ratios will be the same. See Note 5 of the Notes to Financial Statements for more information about the Fund’s expense limitations. |
3 |
LOOMIS SAYLES SMALL CAP VALUE FUND
| | | | |
| Managers | | Symbols | | |
| | |
| Joseph R. Gatz, CFA® | | Institutional Class | | LSSCX |
| | |
| Jeffrey Schwartz, CFA® | | Retail Class | | LSCRX |
| | |
| | Admin Class | | LSVAX |
| | |
| | Class N | | LSCNX |
Investment Objective
The Fund’s investment objective is long-term capital growth from investments in common stocks or other equity securities.
Market Conditions
The period began on a positive note, with equity markets advancing in an environment of continued improvement in the global economy, robust corporate earnings in excess of expectations and an accommodative monetary policy. Many of these positive attributes began to fade in early 2022 as inflationary pressures mounted and investors began to focus their attention on a sharp increase in rates by the Federal Reserve. Adding to the concerns was the invasion of Ukraine, which created the potential to accelerate inflation, further disrupt supply chains and set the stage for tightening financial conditions on a global basis. Throughout the remainder of the fiscal year, persistent concerns regarding the pace of monetary tightening created a negative market environment centered on higher interest rates, a slowing economy and lower corporate earnings growth.
The net effect of these shifting conditions was a small cap market led by higher quality securities. For most of the fiscal year, smaller, more speculative companies with either minimal or no profits significantly lagged the market index. From a sector perspective, the rising price of oil resulted in the energy sector leading the market by a wide margin (up almost 25%) and was only one of two sectors in the broad based Russell 2000® Index to post a positive return. More defensive sectors such as utilities outperformed as well. Lagging sectors were those exposed to the consumer, as strong Covid-19 driven spending patterns weakened significantly. Healthcare, and more specifically biotech, were negatively impacted by investors’ avoidance of speculative companies and those without earnings, or even without sales.
Investors experienced a high level of market volatility during the period as they incorporated many evolving scenarios into their valuation models and outlooks. This has resulted in a downward equity market, with large cap stocks outperforming small cap and value stocks handily outperforming growth. In terms of returns, the Russell 1000® Index declined -17.2% while the broad based Russell 2000® Index declined -23.5%. Small cap value stocks, as measured by the Russell 2000® Value Index fell -17.7% while the Russell 2000® Growth Index returned -29.3%.
Performance Results
For the 12 months ended September 30, 2022, Institutional Class shares of the Loomis Sayles Small Cap Value Fund returned -16.18% at net asset value. The Fund outperformed its benchmark, the Russell 2000® Value Index, which returned -17.69%.
Explanation of Fund Performance
Strong security selection across a number of sectors drove positive relative return overall. Additionally, the Fund was positioned with a higher allocation to holdings with larger market capitalizations and higher quality than the index, both of which were positive factors in the prevailing market environment. The Fund maintained an underweight position to healthcare and real estate, which were two of the lower performing sectors of the small cap value market.
Stock selection was very favorable in the healthcare, information technology and communication services sectors. Among individual stocks, Lantheus Holdings Inc., Tower Semiconductor Ltd, and Houghton Mifflin Harcourt Company had the largest positive contributions to performance for the period.
Lantheus is a global leader in the development, manufacture and commercialization of diagnostic medical imaging agents and products for the diagnosis and treatment of cardiovascular and other diseases. The Fund acquired its position in July 2020 after a period of significant stock price weakness, primarily due to investor angst over initial dilution from an acquisition, masking the strong and steady profitability of the core imaging agent business. In May 2021, the company gained FDA approval for PYLARIFY, one of the previously acquired products and a first-of-its-kind imaging agent used to identify suspected metastasis or recurrence of prostate cancer. One year after approval, initial sales of PYLARIFY were well ahead of prior estimates, and the company has raised its estimates on the size of its addressable market on multiple occasions.
Tower Semiconductor is an independent foundry providing semiconductor manufacturing and related design services. The company is an integral part of the technology ecosystem and supply chain and is unique in having factories located in the United States, Europe and Japan. The semiconductor shortage has highlighted the strategic importance of Tower Semi and domestic manufacturing. During the first quarter of 2022, Intel Technologies validated our thesis by agreeing to acquire Tower Semiconductor at a generous premium. The Fund maintains a position in the stock, with the deal anticipated to close in the first quarter of 2023.
| 4
LOOMIS SAYLES SMALL CAP VALUE FUND
Houghton Mifflin is a leading education technology and book company in the K-12 market. Our thesis of a strong rebound in the company’s sales and margins coming out of Covid-19 played out through 2021, which resulted in share price appreciation. Then in early 2022, the company agreed to be taken private at a 16% premium. The Fund received cash in exchange for its shares in April 2022.
The Fund’s sector allocation detracted from return versus the index due mainly to its underweight to energy for most of the year and an overweight to the lagging information technology sector. Although the Fund significantly increased its weight to energy over the past few quarters based on strong industry fundamentals and more shareholder friendly capital allocation decisions by company management, the underweight in early 2022 had a meaningful negative impact to relative return versus the index. Weak stock selection within the consumer staples sector detracted from relative performance, while selection in the utilities sector more modestly trailed the index. Among individual stocks during the period, InMode Ltd., Herc Holdings, Inc. and Triumph Bancorp, Inc. detracted the most from performance.
InMode produces minimally-invasive medical aesthetic surgery instruments for fat reduction, skin tightening and tissue remodeling applications. The price decline during the period was unrelated to any company-specific fundamental news as the company continues to experience increasing demand from physicians, launched new products and delivered orders without delay. InMode stock reflected a retracement in valuation from previously elevated prices. The shares posted a 197% gain in calendar 2021, and we reduced the position size on price strength towards the end of 2021. Despite any changes in demand or fundamentals, as with other stocks with higher beta, the stock fell nearly 59% in the first nine months of 2022, negatively impacting the trailing 12-month return.
Herc Holdings is one of the leading equipment rental suppliers in North America, specializing in industrial products such as aerial platforms, earth moving equipment, and tele-handlers. The stock was one of our top performers during late 2020 and throughout calendar 2021 as the company deftly managed through Covid-19 related volatility and the subsequent economic recovery. In 2022, the stock has retraced some of its gains as investors have grown concerned about the economic outlook and the Federal Reserve’s actions to lower demand and fight inflation. Despite limited evidence of a material slowdown in the business and despite management’s proven skill in managing through the Covid-19 demand shock in early 2020, the stock has traded down to levels that imply a significant negative estimate revision lies ahead. We are maintaining our position in light of the company’s favorable intermediate and long term outlook and the stock’s attractive valuation.
Triumph Bancorp is a niche bank with a unique focus on transportation and freight payment factoring. As the company gradually transformed from a more traditional bank into a digital freight payments business, the stock was a top performer for the Fund in calendar 2021. This transition created significant future potential earnings as Triumph builds its freight payments network, but it also necessitated greater expenditures on programming talent to handle large freight broker onboarding, which negatively impacted earnings. Finally, the company is taking a “go slow” approach on pricing the network in order to foster early adoption. Ultimately Triumph expects its electronic process for paying freight invoices, to substantially lower transaction cost for brokers, shippers and factors.
Outlook
We remain committed to identifying inefficiencies in the small cap market that result in stock prices and valuations that do not accurately reflect our assessment of the underlying value of corporate enterprises. This approach is applied consistently over time, regardless of the current market environment.
While many forms of inefficiency may exist, we focus on companies that are misunderstood, underfollowed or in the midst of a “special situation” where we believe we can use our strengths consistent with our time horizon, resource deployment or a willingness to solve complex situations. We require fundamentally sound business models, capable management teams and financial stability. Key to our process is identifying distinct, company-specific catalysts on the horizon to sustain, enhance or highlight the fundamental outlook.
Our goal is to achieve an attractive total return for our investors, while managing to an appropriate level of risk over a market cycle.
5 |
Top Ten Holdings as of September 30, 2022
| | | | | | |
| Security name | | % of
Net Assets | |
| 1 | | Herc Holdings, Inc. | | | 1.86 | % |
| 2 | | Wintrust Financial Corp. | | | 1.56 | |
| 3 | | ChampionX Corp. | | | 1.52 | |
| 4 | | Rambus, Inc. | | | 1.50 | |
| 5 | | Popular, Inc. | | | 1.49 | |
| 6 | | Northern Oil & Gas, Inc. | | | 1.47 | |
| 7 | | Lantheus Holdings, Inc. | | | 1.45 | |
| 8 | | Antero Resources Corp. | | | 1.45 | |
| 9 | | AECOM | | | 1.35 | |
| 10 | | Kadant, Inc. | | | 1.33 | |
The portfolio is actively managed and holdings are subject to change. There is no guarantee the Fund continues to invest in the securities referenced. The holdings listed exclude any temporary cash investments, are presented on an individual security basis and do not represent holdings of the issuer.
Hypothetical Growth of $100,000 Investment in Institutional Class Shares
September 30, 2012 through September 30, 20223
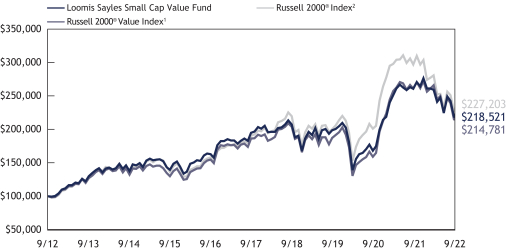
See notes to charts on page 7.
| 6
LOOMIS SAYLES SMALL CAP VALUE FUND
Average Annual Total Returns — September 30, 20223
| | | | | | | | | | | | | | | | | | | | | | | | |
| | | | | | |
| | | | | | | | | | | | Life of | | | Expense Ratios4 | |
| | | 1 Year | | | 5 Years | | | 10 Years | | | Class N | | | Gross | | | Net | |
| | | | | | | |
| Institutional Class | | | -16.18 | % | | | 2.31 | % | | | 8.13 | % | | | — | % | | | 0.94 | % | | | 0.90 | % |
| | | | | | | |
| Retail Class | | | -16.40 | | | | 2.05 | | | | 7.85 | | | | — | | | | 1.19 | | | | 1.15 | |
| | | | | | | |
| Admin Class | | | -16.63 | | | | 1.79 | | | | 7.59 | | | | — | | | | 1.43 | | | | 1.40 | |
| | | | | | | |
| Class N (Inception 2/1/13) | | | -16.16 | | | | 2.36 | | | | — | | | | 7.30 | | | | 0.85 | | | | 0.85 | |
| | | | | | | |
| Comparative Performance | | | | | | | | | | | | | | | | | | | | | | | | |
| Russell 2000® Value Index1 | | | -17.69 | | | | 2.87 | | | | 7.94 | | | | 7.10 | | | | | | | | | |
| Russell 2000® Index2 | | | -23.50 | | | | 3.55 | | | | 8.55 | | | | 7.84 | | | | | | | | | |
Performance data shown represents past performance and is no guarantee of, and not necessarily indicative of, future results. Total return and value will vary, and you may have a gain or loss when shares are sold. Current performance may be lower or higher than quoted. For most recent month-end performance, visit loomissayles.com. Performance for other share classes will be greater or less than shown based on differences in fees and sales charges. You may not invest directly in an index. Performance for periods less than one year is cumulative, not annualized. Returns reflect changes in share price and reinvestment of dividends and capital gains, if any. The table(s) do not reflect taxes shareholders might owe on any fund distributions or when they redeem their shares.
| 1 | | Russell 2000® Value Index is an unmanaged index that measures the performance of the small-cap value segment of the U.S. equity universe. It includes those Russell 2000® companies with lower price-to-book ratios and lower forecasted growth values. |
| 2 | | Russell 2000® Index is an unmanaged index that measures the performance of the small-cap segment of the U.S. equity universe. |
| 3 | | Fund performance has been increased by fee waivers and/or expense reimbursements, if any, without which performance would have been lower. |
| 4 | | Expense ratios are as shown in the Fund’s prospectus in effect as of the date of this report. The expense ratios for the current reporting period can be found in the Financial Highlights section of this report under Ratios to Average Net Assets. Net expenses reflect contractual expense limitations set to expire on 1/31/23. When a Fund’s expenses are below the limitation, gross and net expense ratios will be the same. See Note 5 of the Notes to Financial Statements for more information about the Fund’s expense limitations. |
7 |
LOOMIS SAYLES SMALL/MID CAP GROWTH FUND
| | | | |
| Managers | | Symbols | | |
| | |
| Mark F. Burns, CFA® | | Institutional Class | | LSMIX |
| | |
| John J. Slavik, CFA® | | Class N | | LSMNX |
Investment Objective
The Fund’s investment objective is long-term capital growth from investments in common stocks or other equity securities.
Market Conditions
The bear market that started in 2021 continued through the end of the period, as the first nine months of 2022 marked the fourth worst start to a year for small and mid cap stocks going back to 1926. The third quarter of 2022 was the third consecutive quarterly decline for US equities, as every domestic size and style box was down.
The Russell 2500™ Growth Index had its second-worst start to the year since 2002, falling nearly 30% year-to-date and 39% from its peak. During the first nine months of 2022, market volatility in both directions has been quite significant. Historically, some of the biggest rallies have occurred during bear markets, and this period was certainly no exception. The most recent quarter started with optimism that the Federal Reserve (Fed) might pivot away from its monetary policy tightening but ended with the reality that inflation is going to be harder to tame than most originally thought. Recession risks are also rising, and a recession may have already started in the second half of 2022, with business confidence, housing and manufacturing orders all in recession territory.
While we do expect earnings estimates to continue to move down, we believe the market has discounted a lot of this bad news to date. Although overall sentiment remains bearish and further volatility near-term is likely, we believe there are bullish indicators that may be starting to emerge — particularly for small cap equities (relative to large caps) as we look ahead longer-term.
Performance Results
For the 12 months ended September 30, 2022, Institutional Class shares of the Loomis Sayles Small/Mid Cap Growth Fund returned -25.43% at net asset value. The Fund outperformed its benchmark, the Russell 2500™ Growth Index, which returned -29.39%.
Explanation of Fund Performance
Among the top contributors to positive relative performance was stock selection in the healthcare, consumer discretionary, and consumer staples sectors. Conversely, relative positioning in energy and stock selection in the information technology and energy sectors detracted from relative performance.
The Fund’s top contributions to relative performance at the individual stock level were biotech company PTC Therapeutics Inc., behavioral health company Acadia Healthcare Co., and member-based warehouse club retailer BJ’s Wholesale Club Holdings Inc. PTC Therapeutics focuses on treating rare diseases. The company benefitted from positive results in a confirmatory European clinical trial for its Duchenne muscular dystrophy treatment. The result firmed up the company’s long-term revenue outlook and raised the possibility of bringing this product to the US market. Acadia Healthcare has a strong portfolio of inpatient facilities as well as outpatient addiction centers. Its earnings momentum continued to be strong despite concerns about labor costs, and its pipeline of new facilities and partnerships has also remained healthy, providing visibility into strong earnings in the coming years. BJ’s Wholesale Club operates membership warehouse clubs in the US, with an emphasis on selling groceries at prices roughly 25% lower than conventional grocers. The broad inflationary environment has driven consumers to seek value, and this trading-down effect led to robust membership gains and sales growth.
Conversely, the largest detractors of relative performance among individual stocks were semiconductor provider Semtech Corporation, consumer products producer Helen of Troy Ltd., and digital on-demand printer manufacturer Kornit Digital Ltd. Semtech provides semiconductors to various consumer, industrial, and communications end markets. Our original thesis was centered on the core business stabilizing at solid growth levels, while new products related to the Internet of Things accelerated growth. Unfortunately, the stock was caught up in the semiconductor downdraft given its exposure to the consumer-related areas of computing and smartphones. Additionally, Semtech’s proposed acquisition of Sierra Wireless was not ideally timed and involves integrating a lower gross margin business. Helen of Troy focuses on personal care and household products. Its retail customers got caught with too much inventory, as demand slowed leading to greater price promotions and lower earnings. Kornit Digital serves the growing e-commerce sector. The stock saw a sharp sell-off due to a rotation away from high-growth, high-valuation stocks during the period. Also, investors feared that Kornit’s massive growth during the Covid-19 pandemic period likely pulled forward demand, thus potentially slowing future growth.
Outlook
Excess volatility in our benchmarks was at highly elevated levels throughout the period, reflecting a market environment with low conviction among investors. Stock markets fluctuated from an oversold state to an overbought one, and vice versa during the course of the period. Below the surface, new leadership groups gained momentum, while old leadership groups continued to gasp for air. Specifically, energy and certain
| 8
LOOMIS SAYLES SMALL/MID CAP GROWTH FUND
areas within healthcare and industrials continued to garner support, while technology continued to struggle. While we certainly expect more “throwback” rallies in old leadership, we would expect this new leadership to maintain its relative performance edge.
We are also witnessing the early stages of small/mid cap stock outperformance relative to the broader market. While this seems counterintuitive given the economic struggles we are facing, this cohort of stocks seems to have much more harshly discounted the recession up to this point.
Investors are slowly coming to grips with investing in a rising rate environment, with no near term safety net provided by the Fed. This will become even more challenging as companies report their third-quarter earnings and provide an outlook for the remainder of the year and, hopefully, beyond. We clearly expect to see a broad downward revision in estimates across most sectors and industries and will quickly find out how much these lower prospective earnings have been discounted by the market. More durable growth businesses should weather the storm far better than their weaker peers, as will those business models with the most attractive return profiles.
We believe quality and (especially) growth become scarce and attractive attributes at this point in an economic cycle, and should benefit our process going forward.
Top Ten Holdings as of September 30, 2022
| | | | | | |
| Security name | | % of
Net Assets | |
| 1 | | Acadia Healthcare Co., Inc. | | | 2.53 | % |
| 2 | | BJ’s Wholesale Club Holdings, Inc. | | | 2.45 | |
| 3 | | HEICO Corp. | | | 2.19 | |
| 4 | | Pure Storage, Inc., Class A | | | 2.15 | |
| 5 | | Paylocity Holding Corp. | | | 2.09 | |
| 6 | | Advanced Drainage Systems, Inc. | | | 1.89 | |
| 7 | | Axonics, Inc. | | | 1.79 | |
| 8 | | WillScot Mobile Mini Holdings Corp. | | | 1.77 | |
| 9 | | FTI Consulting, Inc. | | | 1.76 | |
| 10 | | Texas Roadhouse, Inc. | | | 1.71 | |
The portfolio is actively managed and holdings are subject to change. There is no guarantee the Fund continues to invest in the securities referenced. The holdings listed exclude any temporary cash investments, are presented on an individual security basis and do not represent holdings of the issuer.
Hypothetical Growth of $100,000 Investment in Institutional Class Shares2
June 30, 2015 (inception) through September 30, 2022
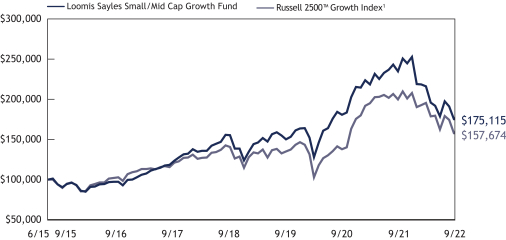
9 |
Average Annual Total Returns — September 30, 20222
| | | | | | | | | | | | | | | | | | | | | | | | |
| | | | | | |
| | | | | | | | | Life of | | | Life of | | | Expense Ratios3 | |
| | | 1 Year | | | 5 Years | | | Class I | | | Class N | | | Gross | | | Net | |
| | | | | | | |
| Institutional Class (Inception 6/30/15) | | | -25.43 | % | | | 7.27 | % | | | 8.04 | % | | | — | % | | | 0.99 | % | | | 0.85 | % |
| | | | | | | |
| Class N (Inception 10/1/19) | | | -25.41 | | | | — | | | | — | | | | 5.81 | | | | 1.00 | | | | 0.83 | |
| | | | | | | |
| Comparative Performance | | | | | | | | | | | | | | | | | | | | | | | | |
| Russell 2500TM Growth Index1 | | | -29.39 | | | | 6.30 | | | | 6.75 | | | | 5.31 | | | | | | | | | |
Performance data shown represents past performance and is no guarantee of, and not necessarily indicative of, future results. Total return and value will vary, and you may have a gain or loss when shares are sold. Current performance may be lower or higher than quoted. For most recent month-end performance, visit loomissayles.com. Performance for other share classes will be greater or less than shown based on differences in fees and sales charges. You may not invest directly in an index. Performance for periods less than one year is cumulative, not annualized. Returns reflect changes in share price and reinvestment of dividends and capital gains, if any. The table(s) do not reflect taxes shareholders might owe on any fund distributions or when they redeem their shares.
| 1 | | Russell 2500™ Growth Index measures the performance of the small-to-mid-cap growth segment of the U.S. equity universe. It includes those Russell 2500TM Index companies with higher price-to-book ratios and higher forecasted growth values. The Index is constructed to provide a comprehensive and unbiased barometer of the small-to-mid-cap growth market. The Index is completely reconstituted annually to ensure larger stocks do not distort the performance and characteristics of the true small-to-mid-cap opportunity set and that the represented companies continue to reflect growth characteristics. Indices are unmanaged. |
| 2 | | Fund performance has been increased by fee waivers and/or expense reimbursements, if any, without which performance would have been lower. |
| 3 | | Expense ratios are as shown in the Fund’s prospectus in effect as of the date of this report. The expense ratios for the current reporting period can be found in the Financial Highlights section of this report under Ratios to Average Net Assets. Net expenses reflect contractual expense limitations set to expire on 1/31/23. When a Fund’s expenses are below the limitation, gross and net expense ratios will be the same. See Note 5 of the Notes to Financial Statements for more information about the Fund’s expense limitations. |
| 10
ADDITIONAL INFORMATION
The views expressed in this report reflect those of the portfolio managers as of the dates indicated. The managers’ views are subject to change at any time without notice based on changes in market or other conditions. References to specific securities or industries should not be regarded as investment advice. Because the Funds are actively managed, there is no assurance that they will continue to invest in the securities or industries mentioned.
All investing involves risk, including the risk of loss. There is no assurance that any investment will meet its performance objectives or that losses will be avoided.
Additional Index Information
This document may contain references to third party copyrights, indexes, and trademarks, each of which is the property of its respective owner. Such owner is not affiliated with Natixis Investment Managers or any of its related or affiliated companies (collectively “Natixis Affiliates”) and does not sponsor, endorse or participate in the provision of any Natixis Affiliates services, funds or other financial products.
The index information contained herein is derived from third parties and is provided on an “as is” basis. The user of this information assumes the entire risk of use of this information. Each of the third party entities involved in compiling, computing or creating index information disclaims all warranties (including, without limitation, any warranties of originality, accuracy, completeness, timeliness, non-infringement, merchantability and fitness for a particular purpose) with respect to such information.
Proxy Voting Information
A description of the Funds’ proxy voting policies and procedures is available without charge upon request, by calling Loomis Sayles at 800-633-3330; on the Funds’ website, at www.loomissayles.com, and on the Securities and Exchange Commission’s (“SEC”) website at www.sec.gov. Information about how the Funds voted proxies relating to portfolio securities during the most recent 12-month period ended June 30 is available through the Funds’ website and the SEC’s website.
Quarterly Portfolio Schedules
The Loomis Sayles Funds file a complete schedule of portfolio holdings with the SEC for the first and third quarters of each fiscal year as an exhibit to its reports on Form N-PORT. The Funds’ Form N-PORT reports are available on the SEC’s website at www.sec.gov. First and third quarter schedules of portfolio holdings are also available at loomissayles.com. A hard copy may be requested from the Fund at no charge by calling 800-633-3330.
CFA® and Chartered Financial Analyst® are registered trademarks owned by the CFA Institute.
UNDERSTANDING YOUR FUND’S EXPENSES
As a mutual fund shareholder you incur two types of costs: (1) transaction costs and (2) ongoing costs, including management fees, distribution and/or service fees (12b-1 fees), and other fund expenses. Certain exemptions may apply. These costs are described in more detail in the Funds’ prospectus. The following examples are intended to help you understand the ongoing costs of investing in the Funds and help you compare these with the ongoing costs of investing in other mutual funds.
The first line in the table of each Fund shows the actual amount of Fund expenses you would have paid on a $1,000 investment in the Fund from April 1, 2022 through September 30, 2022. To estimate the expenses you paid over the period, simply divide your account value by $1,000 (for example $8,600 account value divided by $1,000 = 8.6) and multiply the result by the number in the Expenses Paid During Period column as shown below for your class.
The second line in the table of each Fund provides information about hypothetical account values and hypothetical expenses based on the Fund’s actual expense ratios and an assumed rate of return of 5% per year before expenses, which is not the Fund’s actual return. The hypothetical account values and expenses may not be used to estimate the actual ending account balance or expenses you paid on your investment for the period. You may use this information to compare the ongoing costs of investing in the Funds to other funds. To do so, compare this 5% hypothetical example with the 5% hypothetical examples that appear in the shareholder reports of other funds.
Please note that the expenses shown reflect ongoing costs only, and do not include any transaction costs. Therefore, the second line in the table is useful in comparing ongoing costs only, and will not help you determine the relative costs of owning different funds. If transaction costs were included, total costs would be higher.
11 |
Loomis Sayles Small Cap Growth Fund
| | | | | | | | | | | | |
Institutional Class | | Beginning
Account Value
4/1/2022 | | | Ending
Account Value
9/30/2022 | | | Expenses Paid
During Period*
4/1/2022 – 9/30/2022 | |
Actual | | | $1,000.00 | | | | $823.60 | | | | $4.25 | |
Hypothetical (5% return before expenses) | | | $1,000.00 | | | | $1,020.41 | | | | $4.71 | |
| | | |
Retail Class | | | | | | | | | |
Actual | | | $1,000.00 | | | | $822.60 | | | | $5.39 | |
Hypothetical (5% return before expenses) | | | $1,000.00 | | | | $1,019.15 | | | | $5.97 | |
| | | |
Class N | | | | | | | | | |
Actual | | | $1,000.00 | | | | $823.80 | | | | $3.75 | |
Hypothetical (5% return before expenses) | | | $1,000.00 | | | | $1,020.96 | | | | $4.15 | |
|
* Expenses are equal to the Fund’s annualized expense ratio: 0.93%, 1.18% and 0.82% for Institutional Class, Retail Class and Class N, respectively, multiplied by the average account value over the period, multiplied by the number of days in the most recent fiscal half-year (183), divided by 365 (to reflect the half-year period). | |
Loomis Sayles Small Cap Value Fund
| | | | | | | | | | | | |
Institutional Class | | Beginning
Account Value
4/1/2022 | | | Ending
Account Value
9/30/2022 | | | Expenses Paid
During Period*
4/1/2022 – 9/30/2022 | |
Actual | | | $1,000.00 | | | | $843.10 | | | | $4.16 | |
Hypothetical (5% return before expenses) | | | $1,000.00 | | | | $1,020.56 | | | | $4.56 | |
| | | |
Retail Class | | | | | | | | | |
Actual | | | $1,000.00 | | | | $842.00 | | | | $5.31 | |
Hypothetical (5% return before expenses) | | | $1,000.00 | | | | $1,019.30 | | | | $5.82 | |
| | | |
Admin Class | | | | | | | | | |
Actual | | | $1,000.00 | | | | $841.00 | | | | $6.46 | |
Hypothetical (5% return before expenses) | | | $1,000.00 | | | | $1,018.05 | | | | $7.08 | |
| | | |
Class N | | | | | | | | | |
Actual | | | $1,000.00 | | | | $843.20 | | | | $3.88 | |
Hypothetical (5% return before expenses) | | | $1,000.00 | | | | $1,020.86 | | | | $4.26 | |
|
* Expenses are equal to the Fund’s annualized expense ratio (after waiver/reimbursement): 0.90%, 1.15%, 1.40% and 0.84% for Institutional Class, Retail Class, Admin Class and Class N, respectively, multiplied by the average account value over the period, multiplied by the number of days in the most recent fiscal half-year (183), divided by 365 (to reflect the half-year period). | |
Loomis Sayles Small/Mid Cap Growth Fund
| | | | | | | | | | | | |
Institutional Class | | Beginning
Account Value
4/1/2022 | | | Ending
Account Value
9/30/2022 | | | Expenses Paid
During Period*
4/1/2022 – 9/30/2022 | |
Actual | | | $1,000.00 | | | | $811.00 | | | | $3.77 | |
Hypothetical (5% return before expenses) | | | $1,000.00 | | | | $1,020.91 | | | | $4.20 | |
| | | |
Class N | | | | | | | | | |
Actual | | | $1,000.00 | | | | $811.10 | | | | $3.77 | |
Hypothetical (5% return before expenses) | | | $1,000.00 | | | | $1,020.91 | | | | $4.20 | |
|
* Expenses are equal to the Fund’s annualized expense ratio (after waiver/reimbursement) 0.83% and 0.83% for Institutional Class and Class N, respectively, multiplied by the average account value over the period, multiplied by the number of days in the most recent fiscal half-year (183), divided by 365 (to reflect the half-year period). | |
| 12
BOARD APPROVAL OF THE EXISTING ADVISORY AGREEMENTS
The Board of Trustees of the Trusts (the “Board”), including the Independent Trustees, considers matters bearing on each Fund’s advisory agreement (collectively, the “Agreements”) at most of its meetings throughout the year. Each year, usually in the spring, the Contract Review Committee of the Board meets to review the Agreements to determine whether to recommend that the full Board approve the continuation of the Agreements, typically for an additional one-year period. This meeting typically includes all the Independent Trustees, including the Trustees who do not serve on the Contract Review Committee. After the Contract Review Committee has made its recommendation, the full Board, including the Independent Trustees, determines whether to approve the continuation of the Agreements at its June Board Meeting.
In connection with these meetings, the Trustees receive materials that the Funds’ investment adviser (the “Adviser”) believes to be reasonably necessary for the Trustees to evaluate the Agreements. These materials generally include, among other items, (i) information on the investment performance of the Funds and the performance of peer groups of funds and the Funds’ performance benchmarks, (ii) information on the Funds’ advisory fees and other expenses, including information comparing the Funds’ advisory fees to the fees charged to institutional accounts with similar strategies managed by the Adviser, if any, and to those of peer groups of funds and information about any applicable expense limitations and/or fee “breakpoints,” (iii) sales and redemption data in respect of the Funds, (iv) information about the profitability of the Agreements to the Adviser, including how profitability is determined for the Funds, and (v) information obtained through the completion by the Adviser of a questionnaire distributed on behalf of the Trustees. The Board, including the Independent Trustees, also considers other matters such as (i) each Fund’s investment objective and strategies and the size, education and experience of the Adviser’s investment staff and its use of technology, external research and trading cost measurement tools, (ii) arrangements in respect of the distribution of the Funds’ shares and the related costs, (iii) the allocation of the Funds’ brokerage, if any, including, to the extent applicable, allocations to brokers affiliated with the Adviser and the use of “soft” commission dollars to pay for research and other similar services, (iv) each Adviser’s policies and procedures relating to, among other things, compliance, trading and best execution, proxy voting, liquidity and valuation, (v) information about amounts invested by the Funds’ portfolio managers in the Funds or in similar accounts that they manage and (vi) the general economic outlook with particular emphasis on the mutual fund industry. Throughout the process, the Trustees are afforded the opportunity to ask questions of and request additional materials from the Adviser.
In addition to the materials requested by the Trustees in connection with their annual consideration of the continuation of the Agreements, the Trustees receive materials in advance of each regular quarterly meeting of the Board that provide detailed information about the Funds’ investment performance and the fees charged to the Funds for advisory and other services. This information generally includes, where available, among other things, an internal performance rating for each Fund based on agreed-upon criteria, graphs showing each Fund’s performance and expense differentials against each Fund’s peer group/category of funds, total return information for various periods, third-party performance rankings for various periods comparing a Fund against similarly categorized funds, and performance ratings provided by a different third-party rating organization. The portfolio management team for each Fund or other representatives of the Adviser make periodic presentations to the Contract Review Committee and/or the full Board, and Funds identified as presenting possible performance concerns may be subject to more frequent Board or Committee presentations and reviews. In addition, the Trustees are periodically provided with detailed statistical information about each Fund’s portfolio. The Trustees also receive periodic updates between meetings, both at the Board and at the Committee level.
The Board most recently approved the continuation of the Agreements for a one-year period at its meeting held in June 2022. In considering whether to approve the continuation of the Agreements, the Board, including the Independent Trustees, did not identify any single factor as determinative. Individual Trustees may have evaluated the information presented differently from one another, giving different weights to various factors. Matters considered by the Trustees, including the Independent Trustees, in connection with their approval of the Agreements included, but were not limited to, the factors listed below.
The nature, extent and quality of the services provided to the Funds under the Agreements. The Trustees considered the nature, extent and quality of the services provided by the Adviser and its affiliates to the Funds and the resources dedicated to the Funds by the Adviser and its affiliates. The Trustees also considered their experience with other funds advised or sub-advised by the Adviser as well as the affiliation between the Adviser and Natixis Investment Managers, LLC, whose affiliates provide investment advisory services to other funds in the Natixis family of funds.
The Trustees considered not only the advisory services provided by the Adviser to the Funds, but also the benefits to the Funds from the monitoring and oversight services provided by Natixis Advisors, LLC (“Natixis Advisors”). They also considered the administrative and shareholder services provided by Natixis Advisors and its affiliates to the Funds. They also took into consideration increases in the services provided resulting from new regulatory requirements, such as new rules relating to the fair valuation of investments and the use of derivatives.
For each Fund, the Trustees also considered the benefits to shareholders of investing in a mutual fund that is part of a family of funds that offers shareholders the right to exchange shares of one type of fund for shares of another type of fund, and provides a variety of fund and shareholder services.
After reviewing these and related factors, the Trustees concluded, within the context of their overall conclusions regarding each of the Agreements, that the nature, extent and quality of services provided supported the renewal of the Agreements.
13 |
Investment performance of the Funds and the Adviser. As noted above, the Trustees received information about the performance of the Funds over various time periods, including information that compared the performance of the Funds to the performance of peer groups and categories of funds and the Funds’ respective performance benchmarks. The Trustees also received information about how comparative peer groups are constructed. In addition, the Trustees reviewed data prepared by an independent third party that analyzed the performance of the Funds using a variety of performance metrics, including metrics that measured the performance of the Funds on a risk adjusted basis.
The Board noted that, through December 31, 2021, each Fund’s one-, three- and five-year performance, stated as percentile rankings within categories selected by the independent third-party data provider was as follows (where the best performance would be in the first percentile of its category):
| | | | | | | | | | | | |
| | | One-Year | | | Three-Year | | | Five-Year | |
Loomis Sayles Small Cap Growth Fund | | | 54% | | | | 67% | | | | 45% | |
Loomis Sayles Small Cap Value Fund | | | 22% | | | | 76% | | | | 90% | |
Loomis Sayles Small/Mid Cap Growth Fund | | | 26% | | | | 54% | | | | 40% | |
In the case of each Fund that had performance that lagged that of a relevant category median as determined by the independent third party for certain (although not necessarily all) periods, the Board concluded that other factors relevant to performance supported renewal of the Agreements. These factors included one or more of the following: (1) that the underperformance was attributable, to a significant extent, to investment decisions (such as security selection or sector allocation) by the Adviser that were reasonable and consistent with the Fund’s investment objective and policies; (2) that the Fund had outperformed its relevant performance benchmark for the one-year period ended December 31, 2021; and (3) that the Adviser’s investment strategy is expected to result in cyclical underperformance from time to time, but that this style of investing is showing improved performance generally, which is expected to help the Fund’s performance. The Board also considered information about the Funds’ more recent performance, including how that performance had been impacted by the Covid-19 crisis.
The Trustees also considered the Adviser’s performance and reputation generally, the performance of the fund family generally, and the historical responsiveness of the Adviser to Trustee concerns about performance and the willingness of the Adviser to take steps intended to improve performance.
After reviewing these and related factors, the Trustees concluded, within the context of their overall conclusions regarding each of the Agreements, that the performance of the Funds and the Adviser and/or other relevant factors supported the renewal of the Agreements.
The costs of the services to be provided and profits to be realized by the Adviser and its affiliates from their respective relationships with the Funds. The Trustees considered the fees charged to the Funds for advisory and administrative services as well as the total expense levels of the Funds. This information included comparisons (provided both by management and by an independent third party) of the Funds’ advisory fees and total expense levels to those of their peer groups and information about the advisory fees charged by the Adviser to comparable accounts (such as institutional separate accounts), as well as information about differences in such fees and the reasons for any such differences. In considering the fees charged to comparable accounts, the Trustees considered, among other things, management’s representations about the differences between managing mutual funds as compared to other types of accounts, including the additional resources required to effectively manage mutual fund assets, the greater regulatory costs associated with the management of such assets, and the entrepreneurial, regulatory and other risks associated with sponsoring and managing mutual funds. In evaluating each Fund’s advisory fee, the Trustees also took into account the demands, complexity and quality of the investment management of such Fund and the need for the Adviser to offer competitive compensation and the potential need to expend additional resources to the extent the Fund grows in size. The Trustees considered that over the past several years, management had demonstrated its intention to have competitive fee levels by making recommendations regarding reductions in advisory fee rates, implementation of advisory fee breakpoints and the institution of advisory fee waivers and expense limitations for various funds in the fund family. They noted that all of the Funds have expense limitations in place, and they considered the amounts waived or reimbursed by the Adviser for certain Funds under their respective expense limitation agreements. The Trustees also considered that Loomis Sayles Small Cap Growth Fund’s current expenses are below its expense limitation. The Trustees noted that the Funds had total advisory fee rates that were at or below the medians of their respective peer groups of funds.
The Trustees also considered the compensation directly or indirectly received by the Adviser and its affiliates from their relationships with the Funds. The Trustees reviewed information provided by management as to the profitability of the Adviser’s and its affiliates’ relationships with the Funds, and information about how expenses are determined and allocated for purposes of profitability calculations. They also reviewed information provided by management about the effect of distribution costs and changes in asset levels on Adviser profitability, including information regarding resources spent on distribution activities. When reviewing profitability, the Trustees also considered information about court cases in which adviser compensation or profitability were issues, the performance of the Funds, the expense levels of the Funds, whether the Adviser had implemented breakpoints and/or expense limitations with respect to such Funds and the overall profit margin of Natixis Investment Managers, LLC compared to that of certain other investment managers for which such data was available.
After reviewing these and related factors, the Trustees concluded, within the context of their overall conclusions regarding each of the Agreements, that the advisory fee charged to each of the Funds was fair and reasonable, and that the costs of these services generally and the related profitability of the Adviser and its affiliates in respect of their relationships with the Funds supported the renewal of the Agreements.
Economies of Scale. The Trustees considered the existence of any economies of scale in the provision of services by the Adviser and whether those economies are shared with the Funds through breakpoints in their investment advisory fees or other means, such as expense limitations.
| 14
The Trustees also considered management’s explanation of the factors that are taken into account with respect to the implementation of breakpoints in investment advisory fees or expense limitations. With respect to economies of scale, the Trustees noted that although none of the Funds’ management fees were subject to breakpoints, each of the Funds was subject to an expense limitation. In considering these issues, the Trustees also took note of the costs of the services provided (both on an absolute and on a relative basis) and the profitability to the Adviser and its affiliates of their relationships with the Funds, as discussed above. The Trustees also considered that the Funds have benefitted from the substantial reinvestment the Adviser has made into its business.
After reviewing these and related factors, the Trustees concluded, within the context of their overall conclusions regarding each of the Agreements, that the extent to which economies of scale were shared with the Funds supported the renewal of the Agreements.
The Trustees also considered other factors, which included but were not limited to the following:
| • | | The effect of recent market and economic events, including but not limited to the Covid-19 crisis and its significant disruptions to the economy and business operations, as well as more recent market volatility, on the performance, asset levels and expense ratios of each Fund. |
| • | | Whether each Fund has operated in accordance with its investment objective and the Fund’s record of compliance with its investment restrictions, and the compliance programs of the Funds and the Adviser. They also considered the compliance-related resources the Adviser and its affiliates were providing to the Funds. |
| • | | So-called “fallout benefits” to the Adviser, such as the engagement of affiliates of the Adviser to provide distribution and administrative services to the Funds, and the benefits of research made available to the Adviser by reason of brokerage commissions (if any) generated by the Funds’ securities transactions. The Trustees also considered the benefits to the parent company of Natixis Advisors from the retention of the Adviser. The Trustees considered the possible conflicts of interest associated with these fallout and other benefits, and the reporting, disclosure and other processes in place to disclose and monitor such possible conflicts of interest. |
| • | | The Trustees’ review and discussion of the Funds’ advisory arrangements in prior years, and management’s record of responding to Trustee concerns raised during the year and in prior years. |
Based on their evaluation of all factors that they deemed to be material, including those factors described above, and assisted by the advice of independent counsel, the Trustees, including the Independent Trustees, concluded that each of the existing Agreements should be continued through June 30, 2023.
15 |
LIQUIDITY RISK MANAGEMENT PROGRAM
Annual Report for the Period Commencing on January 1, 2021 and ending December 31, 2021 (including updates through September 30, 2022)
Effective December 1, 2018, the Funds adopted a liquidity risk management program (the “Program”) pursuant to the requirements of Rule 22e-4 under the Investment Company Act of 1940, as amended (the “Rule”). The Rule requires registered open-end funds, including mutual funds and exchange-traded funds, to establish liquidity risk management programs in order to effectively manage fund liquidity and mitigate the risk that a fund could not meet redemption requests without significantly diluting the interests of remaining investors.
The rule requires the Funds to assess, manage and review their liquidity risk considering applicable factors during normal and foreseeable stressed conditions. In fulfilling this requirement, each Fund assesses and reviews (where applicable and amongst other matters) its investment strategy, portfolio holdings, possible investment concentrations, use of derivatives, short-term and long-term cash flow projections, use of cash and cash equivalents, as well as borrowing arrangements and other funding sources. Each Program has established a Program Administrator, which is the adviser of the Funds.
In accordance with the Program, each of the Fund’s portfolio investments is classified into one of four liquidity categories based on a determination of a reasonable expectation for how long it would take to convert the investment to cash (or sell or dispose of the investment) without significantly changing its market value.
Each Fund is prohibited from acquiring an investment if, after the acquisition, its holdings of illiquid assets will exceed 15% of its net assets. If a Fund does not hold a majority of highly liquid investments in its portfolio, then the Fund is required to establish a highly liquid investment minimum (“HLIM”). None of the Funds has established an HLIM.
During the period from January 1, 2021 to December 31, 2021, there were no material changes to the Program and no material events that impacted the operation of the Funds’ Programs. During the period, the Funds held sufficient liquid assets to meet redemptions on a timely basis and did not have any illiquid security violations.
During the period January 1, 2022 through September 30, 2022, the Funds held sufficient liquid assets to meet redemptions on a timely basis and did not have any illiquid security violations.
Annual Program Assessment and Conclusion
In the opinion of the Program Administrators, the Program of each Fund approved by the Funds’ Board is operating effectively. The Program Administrators have also monitored, assessed and managed each Fund’s liquidity risk regularly throughout the period.
Pursuant to the Rule’s requirements, the Board has received and reviewed a written report prepared by each Fund’s Program Administrator that addressed the operation of the Programs, assessed their adequacy and effectiveness and described any material changes made to the Programs.
| 16
Portfolio of Investments – as of September 30, 2022
Loomis Sayles Small Cap Growth Fund
| | | | | | | | |
Shares | | | Description | | Value (†) | |
| |
| | Common Stocks – 97.7% of Net Assets | | | | |
| |
| | | | Aerospace & Defense – 0.7% | |
| | 273,827 | | | Hexcel Corp. | | $ | 14,162,332 | |
| | | | | | | | |
| |
| | | | Air Freight & Logistics – 0.6% | |
| | 170,410 | | | HUB Group, Inc., Class A(a) | | | 11,754,882 | |
| | | | | | | | |
| |
| | | | Auto Components – 2.6% | |
| | 275,945 | | | Dorman Products, Inc.(a) | | | 22,660,604 | |
| | 332,277 | | | Gentherm, Inc.(a) | | | 16,524,135 | |
| | 286,769 | | | Patrick Industries, Inc. | | | 12,571,953 | |
| | | | | | | | |
| | | | | | | 51,756,692 | |
| | | | | | | | |
| |
| | | | Banks – 3.1% | |
| | 432,101 | | | Ameris Bancorp | | | 19,319,236 | |
| | 889,778 | | | Bancorp, Inc. (The)(a) | | | 19,557,320 | |
| | 319,327 | | | Lakeland Financial Corp. | | | 23,250,199 | |
| | | | | | | | |
| | | | | | | 62,126,755 | |
| | | | | | | | |
| |
| | | | Beverages – 0.8% | |
| | 1,272,993 | | | Primo Water Corp. | | | 15,976,062 | |
| | | | | | | | |
| |
| | | | Biotechnology – 6.4% | |
| | 186,913 | | | Blueprint Medicines Corp.(a) | | | 12,315,698 | |
| | 813,265 | | | Halozyme Therapeutics, Inc.(a) | | | 32,156,498 | |
| | 587,825 | | | Inhibrx, Inc.(a) | | | 10,551,459 | |
| | 720,780 | | | Insmed, Inc.(a) | | | 15,525,601 | |
| | 544,120 | | | PTC Therapeutics, Inc.(a) | | | 27,314,824 | |
| | 577,379 | | | Vericel Corp.(a) | | | 13,395,193 | |
| | 618,043 | | | Xencor, Inc.(a) | | | 16,056,757 | |
| | | | | | | | |
| | | | | | | 127,316,030 | |
| | | | | | | | |
| |
| | | | Building Products – 2.5% | |
| | 315,347 | | | Advanced Drainage Systems, Inc. | | | 39,219,706 | |
| | 140,067 | | | UFP Industries, Inc. | | | 10,107,235 | |
| | | | | | | | |
| | | | | | | 49,326,941 | |
| | | | | | | | |
| |
| | | | Capital Markets – 3.3% | |
| | 497,284 | | | Focus Financial Partners, Inc., Class A(a) | | | 15,669,419 | |
| | 365,193 | | | Hamilton Lane, Inc., Class A | | | 21,769,155 | |
| | 418,319 | | | PJT Partners, Inc., Class A | | | 27,952,075 | |
| | | | | | | | |
| | | | | | | 65,390,649 | |
| | | | | | | | |
| |
| | | | Commercial Services & Supplies – 3.1% | |
| | 536,997 | | | Casella Waste Systems, Inc., Class A(a) | | | 41,021,201 | |
| | 706,776 | | | Driven Brands Holdings, Inc.(a) | | | 19,775,592 | |
| | | | | | | | |
| | | | | | | 60,796,793 | |
| | | | | | | | |
| |
| | | | Communications Equipment – 1.5% | |
| | 478,937 | | | Calix, Inc.(a) | | | 29,282,208 | |
| | | | | | | | |
| |
| | | | Construction & Engineering – 2.4% | |
| | 136,559 | | | Arcosa, Inc. | | | 7,808,444 | |
| | 963,055 | | | WillScot Mobile Mini Holdings Corp.(a) | | | 38,840,008 | |
| | | | | | | | |
| | | | | | | 46,648,452 | |
| | | | | | | | |
| |
| | | | Electronic Equipment, Instruments & Components – 2.5% | |
| | 230,511 | | | Advanced Energy Industries, Inc. | | | 17,843,857 | |
| | 203,955 | | | Itron, Inc.(a) | | | 8,588,545 | |
| | 204,611 | | | Novanta, Inc.(a) | | | 23,663,262 | |
| | | | | | | | |
| | | | | | | 50,095,664 | |
| | | | | | | | |
| |
| | | | Energy Equipment & Services – 3.2% | |
| | 667,577 | | | Cactus, Inc., Class A | | $ | 25,654,984 | |
| | 571,955 | | | Noble Corp. PLC(a) | | | 16,918,429 | |
| | 643,728 | | | Weatherford International PLC(a) | | | 20,785,977 | |
| | | | | | | | |
| | | | | | | 63,359,390 | |
| | | | | | | | |
| |
| | | | Food Products – 2.7% | |
| | 500,029 | | | Hostess Brands, Inc.(a) | | | 11,620,674 | |
| | 807,654 | | | Simply Good Foods Co. (The)(a) | | | 25,836,851 | |
| | 1,084,399 | | | Sovos Brands, Inc.(a) | | | 15,441,842 | |
| | | | | | | | |
| | | | | | | 52,899,367 | |
| | | | | | | | |
| |
| | | | Health Care Equipment & Supplies – 9.8% | |
| | 521,673 | | | AtriCure, Inc.(a) | | | 20,397,414 | |
| | 578,546 | | | Axonics, Inc.(a) | | | 40,752,780 | |
| | 233,102 | | | CONMED Corp. | | | 18,687,787 | |
| | 288,067 | | | Cutera, Inc.(a) | | | 13,135,855 | |
| | 167,056 | | | Inspire Medical Systems, Inc.(a) | | | 29,630,723 | |
| | 208,552 | | | LivaNova PLC(a) | | | 10,588,185 | |
| | 481,419 | | | Merit Medical Systems, Inc.(a) | | | 27,204,988 | |
| | 463,218 | | | NuVasive, Inc.(a) | | | 20,293,581 | |
| | 195,546 | | | STAAR Surgical Co.(a) | | | 13,795,770 | |
| | | | | | | | |
| | | | | | | 194,487,083 | |
| | | | | | | | |
| |
| | | | Health Care Providers & Services – 5.9% | |
| | 357,962 | | | Acadia Healthcare Co., Inc.(a) | | | 27,985,469 | |
| | 881,773 | | | Alignment Healthcare, Inc.(a) | | | 10,440,193 | |
| | 304,100 | | | Ensign Group, Inc. (The) | | | 24,175,950 | |
| | 143,790 | | | ModivCare, Inc.(a) | | | 14,332,987 | |
| | 1,269,108 | | | Option Care Health, Inc.(a) | | | 39,938,829 | |
| | | | | | | | |
| | | | | | | 116,873,428 | |
| | | | | | | | |
| |
| | | | Health Care Technology – 2.0% | |
| | 1,090,405 | | | Evolent Health, Inc., Class A(a) | | | 39,178,252 | |
| | | | | | | | |
| |
| | | | Hotels, Restaurants & Leisure – 2.2% | |
| | 908,124 | | | Life Time Group Holdings, Inc.(a) | | | 8,854,209 | |
| | 209,144 | | | Papa John’s International, Inc. | | | 14,642,172 | |
| | 227,166 | | | Texas Roadhouse, Inc. | | | 19,822,505 | |
| | | | | | | | |
| | | | | | | 43,318,886 | |
| | | | | | | | |
| |
| | | | Household Durables – 0.8% | |
| | 185,078 | | | Installed Building Products, Inc. | | | 14,989,467 | |
| | | | | | | | |
| |
| | | | Insurance – 2.0% | |
| | 783,261 | | | BRP Group, Inc., Class A(a) | | | 20,638,927 | |
| | 77,061 | | | Kinsale Capital Group, Inc. | | | 19,682,921 | |
| | | | | | | | |
| | | | | | | 40,321,848 | |
| | | | | | | | |
| |
| | | | Interactive Media & Services – 1.3% | |
| | 617,719 | | | CarGurus, Inc.(a) | | | 8,753,078 | |
| | 326,381 | | | Shutterstock, Inc. | | | 16,374,535 | |
| | | | | | | | |
| | | | | | | 25,127,613 | |
| | | | | | | | |
| |
| | | | IT Services – 3.6% | |
| | 729,407 | | | EVERTEC, Inc. | | | 22,866,910 | |
| | 543,444 | | | Grid Dynamics Holdings, Inc.(a) | | | 10,178,706 | |
| | 465,663 | | | WNS Holdings Ltd., ADR(a) | | | 38,109,860 | |
| | | | | | | | |
| | | | | | | 71,155,476 | |
| | | | | | | | |
| |
| | | | Leisure Products – 1.7% | |
| | 334,868 | | | Malibu Boats, Inc., Class A(a) | | | 16,070,315 | |
| | 960,204 | | | Topgolf Callaway Brands Corp.(a) | | | 18,493,529 | |
| | | | | | | | |
| | | | | | | 34,563,844 | |
| | | | | | | | |
See accompanying notes to financial statements.
17 |
Portfolio of Investments – as of September 30, 2022
Loomis Sayles Small Cap Growth Fund – continued
| | | | | | | | |
Shares | | | Description | | Value (†) | |
| |
| | Common Stocks – continued | | | | |
| |
| | | | Life Sciences Tools & Services – 1.1% | |
| | 137,464 | | | Medpace Holdings, Inc.(a) | | $ | 21,605,217 | |
| | | | | | | | |
| |
| | | | Machinery – 3.9% | |
| | 345,564 | | | Albany International Corp., Class A | | | 27,240,810 | |
| | 341,019 | | | Helios Technologies, Inc. | | | 17,255,561 | |
| | 152,148 | | | RBC Bearings, Inc.(a) | | | 31,617,876 | |
| | | | | | | | |
| | | | | | | 76,114,247 | |
| | | | | | | | |
| |
| | | | Media – 1.2% | |
| | 397,460 | | | TechTarget, Inc.(a) | | | 23,529,632 | |
| | | | | | | | |
| |
| | | | Oil, Gas & Consumable Fuels – 0.9% | |
| | 99,572 | | | Denbury, Inc.(a) | | | 8,589,081 | |
| | 471,081 | | | Magnolia Oil & Gas Corp., Class A | | | 9,332,114 | |
| | | | | | | | |
| | | | | | | 17,921,195 | |
| | | | | | | | |
| |
| | | | Personal Products – 2.6% | |
| | 658,229 | | | BellRing Brands, Inc.(a) | | | 13,566,100 | |
| | 719,053 | | | elf Beauty, Inc.(a) | | | 27,050,774 | |
| | 141,803 | | | Inter Parfums, Inc. | | | 10,700,454 | |
| | | | | | | | |
| | | | | | | 51,317,328 | |
| | | | | | | | |
| |
| | | | Pharmaceuticals – 2.4% | |
| | 452,281 | | | Pacira BioSciences, Inc.(a) | | | 24,056,826 | |
| | 688,513 | | | Supernus Pharmaceuticals, Inc.(a) | | | 23,306,165 | |
| | | | | | | | |
| | | | | | | 47,362,991 | |
| | | | | | | | |
| |
| | | | Professional Services – 4.2% | |
| | 139,385 | | | FTI Consulting, Inc.(a) | | | 23,097,489 | |
| | 256,225 | | | Huron Consulting Group, Inc.(a) | | | 16,974,906 | |
| | 105,367 | | | ICF International, Inc. | | | 11,487,110 | |
| | 732,555 | | | KBR, Inc. | | | 31,661,027 | |
| | | | | | | | |
| | | | | | | 83,220,532 | |
| | | | | | | | |
| |
| | | | Road & Rail – 0.6% | |
| | 584,733 | | | Marten Transport Ltd. | | | 11,203,484 | |
| | | | | | | | |
| |
| | | | Semiconductors & Semiconductor Equipment – 5.0% | |
| | 522,541 | | | MACOM Technology Solutions Holdings, Inc.(a) | | | 27,062,398 | |
| | 552,136 | | | MaxLinear, Inc.(a) | | | 18,010,676 | |
| | 1,145,616 | | | Rambus, Inc.(a) | | | 29,121,559 | |
| | 194,176 | | | Silicon Laboratories, Inc.(a) | | | 23,969,086 | |
| | | | | | | | |
| | | | | | | 98,163,719 | |
| | | | | | | | |
| |
| | | | Software – 4.2% | |
| | 749,144 | | | Box, Inc., Class A(a) | | | 18,271,622 | |
| | 370,588 | | | Envestnet, Inc.(a) | | | 16,454,107 | |
| | 335,192 | | | Q2 Holdings, Inc.(a) | | | 10,793,182 | |
| | 540,881 | | | Tenable Holdings, Inc.(a) | | | 18,822,659 | |
| | 735,565 | | | Varonis Systems, Inc.(a) | | | 19,507,184 | |
| | | | | | | | |
| | | | | | | 83,848,754 | |
| | | | | | | | |
| |
| | | | Specialty Retail – 0.7% | |
| | 220,907 | | | Boot Barn Holdings, Inc.(a) | | | 12,914,223 | |
| | | | | | | | |
| |
| | | | Technology Hardware, Storage & Peripherals – 1.6% | |
| | 1,164,537 | | | Pure Storage, Inc., Class A(a) | | | 31,873,378 | |
| | | | | | | | |
| |
| | | | Textiles, Apparel & Luxury Goods – 1.6% | |
| | 223,173 | | | Columbia Sportswear Co. | | | 15,019,543 | |
| | 191,832 | | | Oxford Industries, Inc. | | | 17,222,677 | |
| | | | | | | | |
| | | | | | | 32,242,220 | |
| | | | | | | | |
| |
| | | | Trading Companies & Distributors – 3.0% | |
| | 211,249 | | | Applied Industrial Technologies, Inc. | | $ | 21,712,172 | |
| | 246,375 | | | McGrath RentCorp | | | 20,661,008 | |
| | 163,171 | | | SiteOne Landscape Supply, Inc.(a) | | | 16,992,628 | |
| | | | | | | | |
| | | | | | | 59,365,808 | |
| | | | | | | | |
| | |
| | | | Total Common Stocks | | | | |
| | |
| | | | (Identified Cost $1,880,194,049) | | | 1,931,590,842 | |
| | | | | | | | |
Principal
Amount | |
| |
| | Short-Term Investments – 3.0% | | | | |
| | |
| $ | 59,693,865 | | | Tri-Party Repurchase Agreement with Fixed Income Clearing Corporation, dated 9/30/2022 at 1.100% to be repurchased at $59,699,337 on 10/03/2022 collateralized by $50,850,500 U.S. Treasury Inflation Indexed Note, 0.375% due 7/15/2025 valued at $60,887,775 including accrued interest (Note 2 of Notes to Financial Statements)
(Identified Cost $59,693,865) | | | 59,693,865 | |
| | | | | | | | |
| | |
| | | | Total Investments – 100.7% | | | | |
| | |
| | | | (Identified Cost $1,939,887,914) | | | 1,991,284,707 | |
| | |
| | | | Other assets less liabilities—(0.7)% | | | (14,190,031 | ) |
| | | | | | | | |
| | |
| | | | Net Assets – 100.0% | | $ | 1,977,094,676 | |
| | | | | | | | |
| |
| | (†) | | | See Note 2 of Notes to Financial Statements. | |
| | |
| | (a) | | | Non-income producing security. | | | | |
| |
| | ADR | | | An American Depositary Receipt is a certificate issued by a custodian bank representing the right to receive securities of the foreign issuer described. The values of ADRs may be significantly influenced by trading on exchanges not located in the United States. | |
See accompanying notes to financial statements.
| 18
Portfolio of Investments – as of September 30, 2022
Loomis Sayles Small Cap Growth Fund – continued
Industry Summary at September 30, 2022
| | | | |
Health Care Equipment & Supplies | | | 9.8 | % |
Biotechnology | | | 6.4 | |
Health Care Providers & Services | | | 5.9 | |
Semiconductors & Semiconductor Equipment | | | 5.0 | |
Software | | | 4.2 | |
Professional Services | | | 4.2 | |
Machinery | | | 3.9 | |
IT Services | | | 3.6 | |
Capital Markets | | | 3.3 | |
Energy Equipment & Services | | | 3.2 | |
Banks | | | 3.1 | |
Commercial Services & Supplies | | | 3.1 | |
Trading Companies & Distributors | | | 3.0 | |
Food Products | | | 2.7 | |
Auto Components | | | 2.6 | |
Personal Products | | | 2.6 | |
Electronic Equipment, Instruments & Components | | | 2.5 | |
Building Products | | | 2.5 | |
Pharmaceuticals | | | 2.4 | |
Construction & Engineering | | | 2.4 | |
Hotels, Restaurants & Leisure | | | 2.2 | |
Insurance | | | 2.0 | |
Health Care Technology | | | 2.0 | |
Other Investments, less than 2% each | | | 15.1 | |
Short-Term Investments | | | 3.0 | |
| | | | |
Total Investments | | | 100.7 | |
Other assets less liabilities | | | (0.7 | ) |
| | | | |
Net Assets | | | 100.0 | % |
| | | | |
See accompanying notes to financial statements.
19 |
Portfolio of Investments – as of September 30, 2022
Loomis Sayles Small Cap Value Fund
| | | | | | | | |
Shares | | | Description | | Value (†) | |
| |
| | Common Stocks – 97.9% of Net Assets | | | | |
| | |
| | | | Auto Components – 1.0% | | | | |
| | 209,897 | | | Dana, Inc. | | $ | 2,399,123 | |
| | 19,789 | | | LCI Industries | | | 2,007,792 | |
| | | | | | | | |
| | | | | | | 4,406,915 | |
| | | | | | | | |
| |
| | | | Banks – 14.1% | |
| | 120,373 | | | Ameris Bancorp | | | 5,381,877 | |
| | 131,546 | | | Atlantic Union Bankshares Corp. | | | 3,996,367 | |
| | 176,191 | | | Cadence Bank | | | 4,477,013 | |
| | 183,482 | | | CVB Financial Corp. | | | 4,645,764 | |
| | 236,839 | | | Home BancShares, Inc. | | | 5,331,246 | |
| | 269,865 | | | OceanFirst Financial Corp. | | | 5,030,284 | |
| | 68,791 | | | Pinnacle Financial Partners, Inc. | | | 5,578,950 | |
| | 87,484 | | | Popular, Inc. | | | 6,304,097 | |
| | 56,181 | | | Prosperity Bancshares, Inc. | | | 3,746,149 | |
| | 50,065 | | | SouthState Corp. | | | 3,961,143 | |
| | 79,870 | | | Triumph Bancorp, Inc.(a) | | | 4,340,935 | |
| | 80,878 | | | Wintrust Financial Corp. | | | 6,595,601 | |
| | | | | | | | |
| | | | | | | 59,389,426 | |
| | | | | | | | |
| |
| | | | Biotechnology – 1.1% | |
| | 23,126 | | | United Therapeutics Corp.(a) | | | 4,842,122 | |
| | | | | | | | |
| |
| | | | Building Products – 2.3% | |
| | 272,349 | | | Janus International Group, Inc.(a) | | | 2,429,353 | |
| | 166,607 | | | Quanex Building Products Corp. | | | 3,025,583 | |
| | 60,743 | | | UFP Industries, Inc. | | | 4,383,215 | |
| | | | | | | | |
| | | | | | | 9,838,151 | |
| | | | | | | | |
| |
| | | | Capital Markets – 0.8% | |
| | 64,429 | | | Stifel Financial Corp. | | | 3,344,509 | |
| | | | | | | | |
| |
| | | | Chemicals – 3.6% | |
| | 31,345 | | | Ashland, Inc. | | | 2,976,834 | |
| | 71,571 | | | Cabot Corp. | | | 4,572,671 | |
| | 245,435 | | | LSB Industries, Inc.(a) | | | 3,497,449 | |
| | 159,299 | | | Valvoline, Inc. | | | 4,036,637 | |
| | | | | | | | |
| | | | | | | 15,083,591 | |
| | | | | | | | |
| |
| | | | Commercial Services & Supplies – 2.3% | |
| | 49,036 | | | Clean Harbors, Inc.(a) | | | 5,392,979 | |
| | 83,923 | | | IAA, Inc.(a) | | | 2,672,948 | |
| | 41,538 | | | VSE Corp. | | | 1,470,445 | |
| | | | | | | | |
| | | | | | | 9,536,372 | |
| | | | | | | | |
| |
| | | | Communications Equipment – 1.0% | |
| | 329,070 | | | Viavi Solutions, Inc.(a) | | | 4,294,363 | |
| | | | | | | | |
| |
| | | | Construction & Engineering – 3.7% | |
| | 83,319 | | | AECOM | | | 5,696,520 | |
| | 81,859 | | | Arcosa, Inc. | | | 4,680,698 | |
| | 183,916 | | | MDU Resources Group, Inc. | | | 5,030,102 | |
| | | | | | | | |
| | | | | | | 15,407,320 | |
| | | | | | | | |
| |
| | | | Diversified Financial Services – 0.7% | |
| | 140,900 | | | Cannae Holdings, Inc.(a) | | | 2,910,994 | |
| | | | | | | | |
| |
| | | | Electric Utilities – 0.8% | |
| | 64,183 | | | ALLETE, Inc. | | | 3,212,359 | |
| | | | | | | | |
| |
| | | | Electrical Equipment – 0.5% | |
| | 27,568 | | | Atkore, Inc.(a) | | | 2,145,066 | |
| | | | | | | | |
| |
| | | | Electronic Equipment, Instruments & Components – 5.7% | |
| | 134,809 | | | Kimball Electronics, Inc.(a) | | $ | 2,311,974 | |
| | 11,989 | | | Littelfuse, Inc. | | | 2,382,095 | |
| | 97,169 | | | Methode Electronics, Inc. | | | 3,609,828 | |
| | 95,682 | | | National Instruments Corp. | | | 3,611,039 | |
| | 51,402 | | | TD SYNNEX Corp. | | | 4,173,328 | |
| | 299,157 | | | TTM Technologies, Inc.(a) | | | 3,942,889 | |
| | 245,995 | | | Vontier Corp. | | | 4,110,577 | |
| | | | | | | | |
| | | | | | | 24,141,730 | |
| | | | | | | | |
| |
| | | | Energy Equipment & Services – 2.6% | |
| | 328,115 | | | ChampionX Corp. | | | 6,421,211 | |
| | 140,177 | | | Weatherford International PLC(a) | | | 4,526,315 | |
| | | | | | | | |
| | | | | | | 10,947,526 | |
| | | | | | | | |
| |
| | | | Entertainment – 0.7% | |
| | 100,530 | | | Liberty Media Corp.-Liberty Braves, Class C(a) | | | 2,764,575 | |
| | | | | | | | |
| |
| | | | Food & Staples Retailing – 0.7% | |
| | 91,252 | | | Andersons, Inc. (The) | | | 2,831,550 | |
| | | | | | | | |
| |
| | | | Food Products – 1.3% | |
| | 15,756 | | | J&J Snack Foods Corp. | | | 2,039,929 | |
| | 127,617 | | | Nomad Foods Ltd.(a) | | | 1,812,162 | |
| | 399,751 | | | Whole Earth Brands, Inc.(a) | | | 1,535,044 | |
| | | | | | | | |
| | | | | | | 5,387,135 | |
| | | | | | | | |
| |
| | | | Health Care Equipment & Supplies – 3.9% | |
| | 29,129 | | | CONMED Corp. | | | 2,335,272 | |
| | 51,732 | | | Embecta Corp. | | | 1,489,364 | |
| | 112,554 | | | Inmode Ltd.(a) | | | 3,276,447 | |
| | 87,196 | | | Lantheus Holdings, Inc.(a) | | | 6,132,495 | |
| | 39,148 | | | UFP Technologies, Inc.(a) | | | 3,360,464 | |
| | | | | | | | |
| | | | | | | 16,594,042 | |
| | | | | | | | |
| |
| | | | Health Care Providers & Services – 2.8% | |
| | 29,900 | | | AMN Healthcare Services, Inc.(a) | | | 3,168,204 | |
| | 146,724 | | | Option Care Health, Inc.(a) | | | 4,617,404 | |
| | 78,330 | | | Tenet Healthcare Corp.(a) | | | 4,040,262 | |
| | | | | | | | |
| | | | | | | 11,825,870 | |
| | | | | | | | |
| |
| | | | Health Care Technology – 1.1% | |
| | 300,300 | | | Allscripts Healthcare Solutions, Inc.(a) | | | 4,573,569 | |
| | | | | | | | |
| |
| | | | Hotels, Restaurants & Leisure – 1.8% | |
| | 20,127 | | | Churchill Downs, Inc. | | | 3,706,387 | |
| | 33,422 | | | Marriott Vacations Worldwide Corp. | | | 4,072,805 | |
| | | | | | | | |
| | | | | | | 7,779,192 | |
| | | | | | | | |
| |
| | | | Household Durables – 1.8% | |
| | 114,582 | | | KB Home | | | 2,969,966 | |
| | 88,991 | | | Skyline Champion Corp.(a) | | | 4,704,954 | |
| | | | | | | | |
| | | | | | | 7,674,920 | |
| | | | | | | | |
| |
| | | | Household Products – 0.3% | |
| | 30,646 | | | Spectrum Brands Holdings, Inc. | | | 1,196,113 | |
| | | | | | | | |
| |
| | | | Independent Power & Renewable Electricity Producers – 0.8% | |
| | 49,418 | | | NextEra Energy Partners LP | | | 3,573,416 | |
| | | | | | | | |
| |
| | | | Insurance – 0.8% | |
| | 100,002 | | | Employers Holdings, Inc. | | | 3,449,069 | |
| | | | | | | | |
See accompanying notes to financial statements.
| 20
Portfolio of Investments – as of September 30, 2022
Loomis Sayles Small Cap Value Fund – continued
| | | | | | | | |
Shares | | | Description | | Value (†) | |
| |
| | Common Stocks – continued | | | | |
| |
| | | | Interactive Media & Services – 0.5% | |
| | 100,018 | | | TripAdvisor, Inc.(a) | | $ | 2,208,397 | |
| | | | | | | | |
| |
| | | | IT Services – 3.1% | |
| | 35,131 | | | Concentrix Corp. | | | 3,921,674 | |
| | 69,274 | | | CSG Systems International, Inc. | | | 3,663,209 | |
| | 26,645 | | | Euronet Worldwide, Inc.(a) | | | 2,018,625 | |
| | 155,777 | | | International Money Express, Inc.(a) | | | 3,550,158 | |
| | | | | | | | |
| | | | | | | 13,153,666 | |
| | | | | | | | |
| |
| | | | Leisure Products – 0.9% | |
| | 59,611 | | | Brunswick Corp. | | | 3,901,540 | |
| | | | | | | | |
| |
| | | | Life Sciences Tools & Services – 1.0% | |
| | 20,916 | | | Charles River Laboratories International, Inc.(a) | | | 4,116,269 | |
| | | | | | | | |
| |
| | | | Machinery – 4.3% | |
| | 46,020 | | | Albany International Corp., Class A | | | 3,627,757 | |
| | 104,615 | | | Altra Industrial Motion Corp. | | | 3,517,156 | |
| | 127,292 | | | Columbus McKinnon Corp. | | | 3,329,959 | |
| | 33,640 | | | Kadant, Inc. | | | 5,611,488 | |
| | 126,997 | | | Wabash National Corp. | | | 1,976,073 | |
| | | | | | | | |
| | | | | | | 18,062,433 | |
| | | | | | | | |
| |
| | | | Marine – 0.8% | |
| | 270,164 | | | Genco Shipping & Trading Ltd. | | | 3,385,155 | |
| | | | | | | | |
| |
| | | | Media – 2.1% | |
| | 173,155 | | | Gray Television, Inc. | | | 2,479,579 | |
| | 54,939 | | | John Wiley & Sons, Inc., Class A | | | 2,063,509 | |
| | 66,800 | | | Scholastic Corp. | | | 2,054,768 | |
| | 91,013 | | | Thryv Holdings, Inc.(a) | | | 2,077,827 | |
| | | | | | | | |
| | | | | | | 8,675,683 | |
| | | | | | | | |
| |
| | | | Metals & Mining – 0.4% | |
| | 107,640 | | | Arconic Corp.(a) | | | 1,834,186 | |
| | | | | | | | |
| |
| | | | Multi-Utilities – 0.8% | |
| | 49,109 | | | Black Hills Corp. | | | 3,326,153 | |
| | | | | | | | |
| |
| | | | Oil, Gas & Consumable Fuels – 5.4% | |
| | 200,840 | | | Antero Resources Corp.(a) | | | 6,131,645 | |
| | 103,304 | | | California Resources Corp. | | | 3,969,973 | |
| | 84,570 | | | EQT Corp. | | | 3,446,227 | |
| | 46,704 | | | Laredo Petroleum, Inc.(a) | | | 2,935,346 | |
| | 226,665 | | | Northern Oil & Gas, Inc. | | | 6,212,888 | |
| | | | | | | | |
| | | | | | | 22,696,079 | |
| | | | | | | | |
| |
| | | | Personal Products – 0.6% | |
| | 124,116 | | | BellRing Brands, Inc.(a) | | | 2,558,031 | |
| | | | | | | | |
| |
| | | | Pharmaceuticals – 2.4% | |
| | 14,563 | | | Jazz Pharmaceuticals PLC(a) | | | 1,941,102 | |
| | 58,786 | | | Pacira BioSciences, Inc.(a) | | | 3,126,827 | |
| | 143,616 | | | Supernus Pharmaceuticals, Inc.(a) | | | 4,861,402 | |
| | | | | | | | |
| | | | | | | 9,929,331 | |
| | | | | | | | |
| |
| | | | Professional Services – 3.2% | |
| | 46,263 | | | Insperity, Inc. | | | 4,722,990 | |
| | 82,283 | | | Korn Ferry | | | 3,863,187 | |
| | 55,596 | | | Science Applications International Corp. | | | 4,916,354 | |
| | | | | | | | |
| | | | | | | 13,502,531 | |
| | | | | | | | |
| |
| | | | REITs – Diversified – 0.9% | |
| | 119,404 | | | Postal Realty Trust, Inc., Class A | | $ | 1,751,656 | |
| | 131,305 | | | UMH Properties, Inc. | | | 2,120,576 | |
| | | | | | | | |
| | | | | | | 3,872,232 | |
| | | | | | | | |
| |
| | | | REITs – Single Tenant – 1.0% | |
| | 63,454 | | | Agree Realty Corp. | | | 4,288,221 | |
| | | | | | | | |
| |
| | | | REITs – Storage – 0.8% | |
| | 81,061 | | | CubeSmart | | | 3,247,304 | |
| | | | | | | | |
| |
| | | | REITs – Warehouse/Industrials – 1.0% | |
| | 142,390 | | | STAG Industrial, Inc. | | | 4,048,148 | |
| | | | | | | | |
| |
| | | | Semiconductors & Semiconductor Equipment – 2.2% | |
| | 248,220 | | | Rambus, Inc.(a) | | | 6,309,752 | |
| | 72,602 | | | Tower Semiconductor Ltd.(a) | | | 3,190,132 | |
| | | | | | | | |
| | | | | | | 9,499,884 | |
| | | | | | | | |
| |
| | | | Specialty Retail – 1.3% | |
| | 47,954 | | | Boot Barn Holdings, Inc.(a) | | | 2,803,391 | |
| | 142,153 | | | Urban Outfitters, Inc.(a) | | | 2,793,306 | |
| | | | | | | | |
| | | | | | | 5,596,697 | |
| | | | | | | | |
| |
| | | | Technology Hardware, Storage & Peripherals – 0.9% | |
| | 67,288 | | | Super Micro Computer, Inc.(a) | | | 3,705,550 | |
| | | | | | | | |
| |
| | | | Textiles, Apparel & Luxury Goods – 1.0% | |
| | 61,370 | | | Crocs, Inc.(a) | | | 4,213,664 | |
| | | | | | | | |
| |
| | | | Thrifts & Mortgage Finance – 1.9% | |
| | 37,297 | | | Federal Agricultural Mortgage Corp., Class C | | | 3,697,625 | |
| | 94,150 | | | WSFS Financial Corp. | | | 4,374,209 | |
| | | | | | | | |
| | | | | | | 8,071,834 | |
| | | | | | | | |
| |
| | | | Trading Companies & Distributors – 4.1% | |
| | 192,103 | | | Alta Equipment Group, Inc. | | | 2,115,054 | |
| | 193,506 | | | Custom Truck One Source, Inc.(a) | | | 1,128,140 | |
| | 75,361 | | | Herc Holdings, Inc. | | | 7,828,501 | |
| | 51,617 | | | McGrath RentCorp | | | 4,328,602 | |
| | 270,266 | | | MRC Global, Inc.(a) | | | 1,943,212 | |
| | | | | | | | |
| | | | | | | 17,343,509 | |
| | | | | | | | |
| |
| | | | Water Utilities – 0.4% | |
| | 187,333 | | | Pure Cycle Corp.(a) | | | 1,564,230 | |
| | | | | | | | |
| |
| | | | Wireless Telecommunication Services – 0.7% | |
| | 119,229 | | | United States Cellular Corp.(a) | | | 3,103,531 | |
| | | | | | | | |
| | |
| | | | Total Common Stocks | | | | |
| | | | (Identified Cost $347,480,250) | | | 413,054,153 | |
| | | | | | | | |
See accompanying notes to financial statements.
21 |
Portfolio of Investments – as of September 30, 2022
Loomis Sayles Small Cap Value Fund – continued
| | | | | | | | |
Principal
Amount | | | Description | | Value (†) | |
| |
| | Short-Term Investments – 1.8% | | | | |
| | |
| $ | 7,382,880 | | | Tri-Party Repurchase Agreement with Fixed Income Clearing Corporation, dated 9/30/2022 at 1.100% to be repurchased at $7,383,557 on 10/03/2022 collateralized by $8,620,200 U.S. Treasury Bond, 3.000% due 8/15/2052 valued at $7,530,555 including accrued interest (Note 2 of Notes to Financial Statements)
(Identified Cost $7,382,880) | | $ | 7,382,880 | |
| | | | | | | | |
| | |
| | | | Total Investments – 99.7% | | | | |
| | |
| | | | (Identified Cost $354,863,130) | | | 420,437,033 | |
| | |
| | | | Other assets less liabilities—0.3% | | | 1,264,941 | |
| | | | | | | | |
| | |
| | | | Net Assets – 100.0% | | $ | 421,701,974 | |
| | | | | | | | |
| |
| | (†) | | | See Note 2 of Notes to Financial Statements. | |
| | |
| | (a) | | | Non-income producing security. | | | | |
| |
| | REITs | | | Real Estate Investment Trusts | |
Industry Summary at September 30, 2022
| | | | |
Banks | | | 14.1 | % |
Electronic Equipment, Instruments & Components | | | 5.7 | |
Oil, Gas & Consumable Fuels | | | 5.4 | |
Machinery | | | 4.3 | |
Trading Companies & Distributors | | | 4.1 | |
Health Care Equipment & Supplies | | | 3.9 | |
Construction & Engineering | | | 3.7 | |
Chemicals | | | 3.6 | |
Professional Services | | | 3.2 | |
IT Services | | | 3.1 | |
Health Care Providers & Services | | | 2.8 | |
Energy Equipment & Services | | | 2.6 | |
Pharmaceuticals | | | 2.4 | |
Building Products | | | 2.3 | |
Commercial Services & Supplies | | | 2.3 | |
Semiconductors & Semiconductor Equipment | | | 2.2 | |
Media | | | 2.1 | |
Other Investments, less than 2% each | | | 30.1 | |
Short-Term Investments | | | 1.8 | |
| | | | |
Total Investments | | | 99.7 | |
Other assets less liabilities | | | 0.3 | |
| | | | |
Net Assets | | | 100.0 | % |
| | | | |
See accompanying notes to financial statements.
| 22
Portfolio of Investments – as of September 30, 2022
Loomis Sayles Small/Mid Cap Growth Fund
| | | | | | | | |
Shares | | | Description | | Value (†) | |
| |
| | Common Stocks – 96.9% of Net Assets | | | | |
| | |
| | | | Aerospace & Defense – 5.2% | | | | |
| | 20,152 | | | Axon Enterprise, Inc.(a) | | $ | 2,332,594 | |
| | 23,335 | | | HEICO Corp. | | | 3,359,773 | |
| | 45,577 | | | Hexcel Corp. | | | 2,357,243 | |
| | | | | | | | |
| | | | | | | 8,049,610 | |
| | | | | | | | |
| |
| | | | Banks – 2.2% | |
| | 37,422 | | | Glacier Bancorp, Inc. | | | 1,838,543 | |
| | 48,063 | | | Pacific Premier Bancorp, Inc. | | | 1,488,030 | |
| | | | | | | | |
| | | | | | | 3,326,573 | |
| | | | | | | | |
| |
| | | | Biotechnology – 6.4% | |
| | 3,560 | | | Argenx SE, ADR(a) | | | 1,256,858 | |
| | 56,669 | | | Halozyme Therapeutics, Inc.(a) | | | 2,240,692 | |
| | 51,999 | | | PTC Therapeutics, Inc.(a) | | | 2,610,350 | |
| | 10,679 | | | United Therapeutics Corp.(a) | | | 2,235,969 | |
| | 55,069 | | | Xencor, Inc.(a) | | | 1,430,693 | |
| | | | | | | | |
| | | | | | | 9,774,562 | |
| | | | | | | | |
| |
| | | | Building Products – 2.6% | |
| | 23,278 | | | Advanced Drainage Systems, Inc. | | | 2,895,085 | |
| | 46,518 | | | Zurn Elkay Water Solutions Corp. | | | 1,139,691 | |
| | | | | | | | |
| | | | | | | 4,034,776 | |
| | | | | | | | |
| |
| | | | Capital Markets – 3.2% | |
| | 25,727 | | | Hamilton Lane, Inc., Class A | | | 1,533,586 | |
| | 11,300 | | | Morningstar, Inc. | | | 2,399,216 | |
| | 42,639 | | | StepStone Group, Inc., Class A | | | 1,045,082 | |
| | | | | | | | |
| | | | | | | 4,977,884 | |
| | | | | | | | |
| |
| | | | Commercial Services & Supplies – 2.2% | |
| | 42,357 | | | Driven Brands Holdings, Inc.(a) | | | 1,185,149 | |
| | 16,893 | | | Tetra Tech, Inc. | | | 2,171,257 | |
| | | | | | | | |
| | | | | | | 3,356,406 | |
| | | | | | | | |
| |
| | | | Communications Equipment – 1.4% | |
| | 51,886 | | | Ciena Corp.(a) | | | 2,097,751 | |
| | | | | | | | |
| |
| | | | Construction & Engineering – 3.3% | |
| | 8,723 | | | Valmont Industries, Inc. | | | 2,343,172 | |
| | 67,367 | | | WillScot Mobile Mini Holdings Corp.(a) | | | 2,716,911 | |
| | | | | | | | |
| | | | | | | 5,060,083 | |
| | | | | | | | |
| |
| | | | Distributors – 1.1% | |
| | 5,461 | | | Pool Corp. | | | 1,737,745 | |
| | | | | | | | |
| |
| | | | Electronic Equipment, Instruments & Components – 2.9% | |
| | 24,784 | | | Advanced Energy Industries, Inc. | | | 1,918,530 | |
| | 20,641 | | | Coherent Corp.(a) | | | 719,339 | |
| | 33,034 | | | Trimble, Inc.(a) | | | 1,792,755 | |
| | | | | | | | |
| | | | | | | 4,430,624 | |
| | | | | | | | |
| |
| | | | Energy Equipment & Services – 1.4% | |
| | 109,629 | | | ChampionX Corp. | | | 2,145,440 | |
| | | | | | | | |
| |
| | | | Food & Staples Retailing – 4.9% | |
| | 51,697 | | | BJ’s Wholesale Club Holdings, Inc.(a) | | | 3,764,058 | |
| | 10,980 | | | Casey’s General Stores, Inc. | | | 2,223,670 | |
| | 34,277 | | | Performance Food Group Co.(a) | | | 1,472,197 | |
| | | | | | | | |
| | | | | | | 7,459,925 | |
| | | | | | | | |
| |
| | | | Food Products – 1.6% | |
| | 74,580 | | | Simply Good Foods Co. (The)(a) | | $ | 2,385,814 | |
| | | | | | | | |
| |
| | | | Health Care Equipment & Supplies – 9.0% | |
| | 107,614 | | | AngioDynamics, Inc.(a) | | | 2,201,782 | |
| | 39,079 | | | Axonics, Inc.(a) | | | 2,752,725 | |
| | 21,696 | | | CONMED Corp. | | | 1,739,368 | |
| | 51,811 | | | Envista Holdings Corp.(a) | | | 1,699,919 | |
| | 39,305 | | | Globus Medical, Inc., Class A(a) | | | 2,341,399 | |
| | 9,002 | | | Insulet Corp.(a) | | | 2,065,059 | |
| | 20,830 | | | LivaNova PLC(a) | | | 1,057,539 | |
| | | | | | | | |
| | | | | | | 13,857,791 | |
| | | | | | | | |
| |
| | | | Health Care Providers & Services – 4.0% | |
| | 49,663 | | | Acadia Healthcare Co., Inc.(a) | | | 3,882,654 | |
| | 118,876 | | | R1 RCM Holdco, Inc.(a) | | | 2,202,772 | |
| | | | | | | | |
| | | | | | | 6,085,426 | |
| | | | | | | | |
| |
| | | | Health Care Technology – 1.3% | |
| | 56,471 | | | Evolent Health, Inc., Class A(a) | | | 2,029,003 | |
| | | | | | | | |
| |
| | | | Hotels, Restaurants & Leisure – 4.2% | |
| | 11,281 | | | Churchill Downs, Inc. | | | 2,077,396 | |
| | 29,098 | | | Planet Fitness, Inc., Class A(a) | | | 1,677,791 | |
| | 30,021 | | | Texas Roadhouse, Inc. | | | 2,619,632 | |
| | | | | | | | |
| | | | | | | 6,374,819 | |
| | | | | | | | |
| |
| | | | Household Durables – 0.4% | |
| | 6,649 | | | Helen of Troy Ltd.(a) | | | 641,230 | |
| | | | | | | | |
| |
| | | | Insurance – 2.3% | |
| | 8,569 | | | Kinsale Capital Group, Inc. | | | 2,188,694 | |
| | 15,848 | | | Palomar Holdings, Inc.(a) | | | 1,326,795 | |
| | | | | | | | |
| | | | | | | 3,515,489 | |
| | | | | | | | |
| |
| | | | IT Services – 5.2% | |
| | 13,277 | | | Broadridge Financial Solutions, Inc. | | | 1,916,137 | |
| | 9,021 | | | Concentrix Corp. | | | 1,007,014 | |
| | 17,553 | | | Endava PLC, Sponsored ADR(a) | | | 1,415,299 | |
| | 15,481 | | | ExlService Holdings, Inc.(a) | | | 2,281,280 | |
| | 10,716 | | | WEX, Inc.(a) | | | 1,360,289 | |
| | | | | | | | |
| | | | | | | 7,980,019 | |
| | | | | | | | |
| |
| | | | Machinery – 5.2% | |
| | 8,541 | | | Chart Industries, Inc.(a) | | | 1,574,533 | |
| | 38,665 | | | Ingersoll Rand, Inc. | | | 1,672,648 | |
| | 14,973 | | | John Bean Technologies Corp. | | | 1,287,678 | |
| | 9,981 | | | Middleby Corp. (The)(a) | | | 1,279,265 | |
| | 10,358 | | | RBC Bearings, Inc.(a) | | | 2,152,496 | |
| | | | | | | | |
| | | | | | | 7,966,620 | |
| | | | | | | | |
| |
| | | | Oil, Gas & Consumable Fuels – 1.9% | |
| | 95,315 | | | Magnolia Oil & Gas Corp., Class A | | | 1,888,190 | |
| | 21,684 | | | Matador Resources Co. | | | 1,060,781 | |
| | | | | | | | |
| | | | | | | 2,948,971 | |
| | | | | | | | |
| |
| | | | Pharmaceuticals – 1.3% | |
| | 37,478 | | | Pacira BioSciences, Inc.(a) | | | 1,993,455 | |
| | | | | | | | |
| |
| | | | Professional Services – 3.4% | |
| | 16,329 | | | FTI Consulting, Inc.(a) | | | 2,705,879 | |
| | 58,929 | | | KBR, Inc. | | | 2,546,911 | |
| | | | | | | | |
| | | | | | | 5,252,790 | |
| | | | | | | | |
See accompanying notes to financial statements.
23 |
Portfolio of Investments – as of September 30, 2022
Loomis Sayles Small/Mid Cap Growth Fund – continued
| | | | | | | | |
Shares | | | Description | | Value (†) | |
| |
| | Common Stocks – continued | | | | |
| |
| | | | Semiconductors & Semiconductor Equipment – 5.0% | |
| | 16,366 | | | MKS Instruments, Inc. | | $ | 1,352,486 | |
| | 3,390 | | | Monolithic Power Systems, Inc. | | | 1,231,926 | |
| | 18,645 | | | Nova Ltd.(a) | | | 1,590,419 | |
| | 15,763 | | | Power Integrations, Inc. | | | 1,013,876 | |
| | 30,962 | | | Semtech Corp.(a) | | | 910,592 | |
| | 12,920 | | | Silicon Laboratories, Inc.(a) | | | 1,594,845 | |
| | | | | | | | |
| | | | | | | 7,694,144 | |
| | | | | | | | |
| |
| | | | Software – 6.0% | |
| | 88,046 | | | Box, Inc., Class A(a) | | | 2,147,442 | |
| | 13,259 | | | Paylocity Holding Corp.(a) | | | 3,203,109 | |
| | 30,830 | | | Q2 Holdings, Inc.(a) | | | 992,726 | |
| | 5,349 | | | Tyler Technologies, Inc.(a) | | | 1,858,777 | |
| | 29,982 | | | Verint Systems, Inc.(a) | | | 1,006,796 | |
| | | | | | | | |
| | | | | | | 9,208,850 | |
| | | | | | | | |
| |
| | | | Specialty Retail – 1.1% | |
| | 11,996 | | | Five Below, Inc.(a) | | | 1,651,489 | |
| | | | | | | | |
| |
| | | | Technology Hardware, Storage & Peripherals – 2.8% | |
| | 45,614 | | | Avid Technology, Inc.(a) | | | 1,060,982 | |
| | 120,269 | | | Pure Storage, Inc., Class A(a) | | | 3,291,762 | |
| | | | | | | | |
| | | | | | | 4,352,744 | |
| | | | | | | | |
| |
| | | | Textiles, Apparel & Luxury Goods – 3.4% | |
| | 20,208 | | | Columbia Sportswear Co. | | | 1,359,999 | |
| | 7,176 | | | Deckers Outdoor Corp.(a) | | | 2,243,289 | |
| | 50,756 | | | Skechers U.S.A., Inc., Class A(a) | | | 1,609,980 | |
| | | | | | | | |
| | | | | | | 5,213,268 | |
| | | | | | | | |
| |
| | | | Thrifts & Mortgage Finance – 1.0% | |
| | 45,237 | | | Axos Financial, Inc.(a) | | | 1,548,463 | |
| | | | | | | | |
| |
| | | | Trading Companies & Distributors – 1.0% | |
| | 15,067 | | | SiteOne Landscape Supply, Inc.(a) | | | 1,569,077 | |
| | | | | | | | |
| | |
| | | | Total Common Stocks | | | | |
| | | | (Identified Cost $171,670,663) | | | 148,720,841 | |
| | | | | | | | |
Principal
Amount | |
| |
| | Short-Term Investments – 3.2% | | | | |
| | |
| $ | 4,882,775 | | | Tri-Party Repurchase Agreement with Fixed Income Clearing Corporation, dated 9/30/2022 at 1.100% to be repurchased at $4,883,223 on 10/03/2022 collateralized by $5,078,500 U.S. Treasury Note, 3.500% due 9/15/2025 valued at $4,980,500 including accrued interest (Note 2 of Notes to Financial Statements)
(Identified Cost $4,882,775) | | | 4,882,775 | |
| | | | | | | | |
| | |
| | | | Total Investments – 100.1% | | | | |
| | |
| | | | (Identified Cost $176,553,438) | | | 153,603,616 | |
| | |
| | | | Other assets less liabilities—(0.1)% | | | (223,408 | ) |
| | | | | | | | |
| | |
| | | | Net Assets – 100.0% | | $ | 153,380,208 | |
| | | | | | | | |
| |
| | (†) | | | See Note 2 of Notes to Financial Statements. | |
| | |
| | (a) | | | Non-income producing security. | | | | |
| |
| | ADR | | | An American Depositary Receipt is a certificate issued by a custodian bank representing the right to receive securities of the foreign issuer described. The values of ADRs may be significantly influenced by trading on exchanges not located in the United States. | |
Industry Summary at September 30, 2022
| | | | |
Health Care Equipment & Supplies | | | 9.0 | % |
Biotechnology | | | 6.4 | |
Software | | | 6.0 | |
Aerospace & Defense | | | 5.2 | |
IT Services | | | 5.2 | |
Machinery | | | 5.2 | |
Semiconductors & Semiconductor Equipment | | | 5.0 | |
Food & Staples Retailing | | | 4.9 | |
Hotels, Restaurants & Leisure | | | 4.2 | |
Health Care Providers & Services | | | 4.0 | |
Professional Services | | | 3.4 | |
Textiles, Apparel & Luxury Goods | | | 3.4 | |
Construction & Engineering | | | 3.3 | |
Capital Markets | | | 3.2 | |
Electronic Equipment, Instruments & Components | | | 2.9 | |
Technology Hardware, Storage & Peripherals | | | 2.8 | |
Building Products | | | 2.6 | |
Insurance | | | 2.3 | |
Commercial Services & Supplies | | | 2.2 | |
Banks | | | 2.2 | |
Other Investments, less than 2% each | | | 13.5 | |
Short-Term Investments | | | 3.2 | |
| | | | |
Total Investments | | | 100.1 | |
Other assets less liabilities | | | (0.1 | ) |
| | | | |
Net Assets | | | 100.0 | % |
| | | | |
See accompanying notes to financial statements.
| 24
Statements of Assets and Liabilities
September 30, 2022
| | | | | | | | | | | | |
| | | Small Cap
Growth Fund | | | Small Cap
Value Fund | | | Small/Mid Cap
Growth Fund | |
ASSETS | |
Investments at cost | | $ | 1,939,887,914 | | | $ | 354,863,130 | | | $ | 176,553,438 | |
Net unrealized appreciation (depreciation) | | | 51,396,793 | | | | 65,573,903 | | | | (22,949,822 | ) |
| | | | | | | | | | | | |
Investments at value | | | 1,991,284,707 | | | | 420,437,033 | | | | 153,603,616 | |
Cash | | | — | | | | 278,061 | | | | — | |
Receivable for Fund shares sold | | | 2,244,948 | | | | 615,994 | | | | 10,014 | |
Receivable for securities sold | | | — | | | | 1,920,098 | | | | — | |
Dividends and interest receivable | | | 438,436 | | | | 381,170 | | | | 38,434 | |
Prepaid expenses (Note 7) | | | 265 | | | | 58 | | | | 16 | |
| | | | | | | | | | | | |
TOTAL ASSETS | | | 1,993,968,356 | | | | 423,632,414 | | | | 153,652,080 | |
| | | | | | | | | | | | |
|
| LIABILITIES | |
Payable for securities purchased | | | 14,351,905 | | | | 953,881 | | | | 62,629 | |
Payable for Fund shares redeemed | | | 700,230 | | | | 296,223 | | | | 21,901 | |
Management fees payable (Note 5) | | | 1,289,906 | | | | 271,764 | | | | 89,816 | |
Deferred Trustees’ fees (Note 5) | | | 277,701 | | | | 284,529 | | | | 37,150 | |
Administrative fees payable (Note 5) | | | 79,303 | | | | 17,436 | | | | 6,235 | |
Payable to distributor (Note 5d) | | | 12,125 | | | | 3,350 | | | | 27 | |
Audit and tax services fees payable | | | 45,425 | | | | 45,915 | | | | 45,071 | |
Other accounts payable and accrued expenses | | | 117,085 | | | | 57,342 | | | | 9,043 | |
| | | | | | | | | | | | |
TOTAL LIABILITIES | | | 16,873,680 | | | | 1,930,440 | | | | 271,872 | |
| | | | | | | | | | | | |
NET ASSETS | | $ | 1,977,094,676 | | | $ | 421,701,974 | | | $ | 153,380,208 | |
| | | | | | | | | | | | |
NET ASSETS CONSIST OF: | |
Paid-in capital | | $ | 1,881,479,062 | | | $ | 306,948,010 | | | $ | 182,975,262 | |
Accumulated earnings (loss) | | | 95,615,614 | | | | 114,753,964 | | | | (29,595,054 | ) |
| | | | | | | | | | | | |
NET ASSETS | | $ | 1,977,094,676 | | | $ | 421,701,974 | | | $ | 153,380,208 | |
| | | | | | | | | | | | |
|
| COMPUTATION OF NET ASSET VALUE AND OFFERING PRICE: | |
| | | |
Institutional Class: | | | | | | | | | | | | |
Net assets | | $ | 883,457,798 | | | $ | 276,019,643 | | | $ | 106,566,379 | |
| | | | | | | | | | | | |
Shares of beneficial interest | | | 38,614,974 | | | | 12,231,891 | | | | 10,301,830 | |
| | | | | | | | | | | | |
Net asset value, offering and redemption price per share | | $ | 22.88 | | | $ | 22.57 | | | $ | 10.34 | |
| | | | | | | | | | | | |
| | | |
Retail Class: | | | | | | | | | | | | |
Net assets | | $ | 62,909,145 | | | $ | 63,738,219 | | | $ | — | |
| | | | | | | | | | | | |
Shares of beneficial interest | | | 3,149,117 | | | | 2,903,727 | | | | — | |
| | | | | | | | | | | | |
Net asset value, offering and redemption price per share | | $ | 19.98 | | | $ | 21.95 | | | $ | — | |
| | | | | | | | | | | | |
| | | |
Admin Class shares: | | | | | | | | | | | | |
Net assets | | $ | — | | | $ | 6,775,952 | | | $ | — | |
| | | | | | | | | | | | |
Shares of beneficial interest | | | — | | | | 333,598 | | | | — | |
| | | | | | | | | | | | |
Net asset value, offering and redemption price per share | | $ | — | | | $ | 20.31 | | | $ | — | |
| | | | | | | | | | | | |
|
Class N shares: | |
Net assets | | $ | 1,030,727,733 | | | $ | 75,168,160 | | | $ | 46,813,829 | |
| | | | | | | | | | | | |
Shares of beneficial interest | | | 44,362,032 | | | | 3,328,601 | | | | 4,521,472 | |
| | | | | | | | | | | | |
Net asset value, offering and redemption price per share | | $ | 23.23 | | | $ | 22.58 | | | $ | 10.35 | |
| | | | | | | | | | | | |
See accompanying notes to financial statements.
25 |
Statements of Operations
For the Year Ended September 30, 2022
| | | | | | | | | | | | |
| | | Small Cap
Growth Fund | | | Small Cap
Value Fund | | | Small/Mid Cap
Growth Fund | |
INVESTMENT INCOME | |
Dividends | | $ | 10,396,028 | (a) | | $ | 7,411,939 | | | $ | 510,496 | |
Interest | | | 125,672 | | | | 16,800 | | | | 9,953 | |
Less net foreign taxes withheld | | | (52,906 | ) | | | (21,902 | ) | | | — | |
| | | | | | | | | | | | |
| | | 10,468,794 | | | | 7,406,837 | | | | 520,449 | |
| | | | | | | | | | | | |
Expenses | |
Management fees (Note 5) | | | 18,479,365 | | | | 4,039,249 | | | | 1,004,898 | |
Service and distribution fees (Note 5) | | | 211,376 | | | | 243,852 | | | | — | |
Administrative fees (Note 5) | | | 1,084,767 | | | | 237,337 | | | | 59,585 | |
Trustees’ fees and expenses (Note 5) | | | 79,886 | | | | 27,037 | | | | 15,767 | |
Trustees’ fees deferred compensation (Note 5) | | | (38,332 | ) | | | (53,840 | ) | | | (3,526 | ) |
Transfer agent fees and expenses (Notes 5 and 6) | | | 1,384,697 | | | | 370,715 | | | | 5,655 | |
Audit and tax services fees | | | 43,465 | | | | 44,035 | | | | 43,384 | |
Custodian fees and expenses | | | 89,404 | | | | 18,355 | | | | 9,911 | |
Legal fees (Note 7) | | | 77,331 | | | | 16,909 | | | | 4,237 | |
Registration fees | | | 82,576 | | | | 79,620 | | | | 48,125 | |
Shareholder reporting expenses | | | 137,432 | | | | 93,453 | | | | 5,323 | |
Miscellaneous expenses | | | 93,635 | | | | 41,069 | | | | 27,388 | |
| | | | | | | | | | | | |
Total expenses | | | 21,725,602 | | | | 5,157,791 | | | | 1,220,747 | |
Less waiver and/or expense reimbursement (Note 5) | | | — | | | | (122,879 | ) | | | (103,974 | ) |
| | | | | | | | | | | | |
Net expenses | | | 21,725,602 | | | | 5,034,912 | | | | 1,116,773 | |
| | | | | | | | | | | | |
Net investment income (loss) | | | (11,256,808 | ) | | | 2,371,925 | | | | (596,324 | ) |
| | | | | | | | | | | | |
|
| NET REALIZED AND UNREALIZED GAIN (LOSS) ON INVESTMENTS | |
Net realized gain (loss) on: | |
Investments | | | 55,541,403 | | | | 53,239,567 | | | | (6,038,711 | ) |
| | | | | | | | | | | | |
Net change in unrealized appreciation (depreciation) on: | |
Investments | | | (710,299,435 | ) | | | (140,778,533 | ) | | | (41,617,706 | ) |
| | | | | | | | | | | | |
Net realized and unrealized loss on investments | | | (654,758,032 | ) | | | (87,538,966 | ) | | | (47,656,417 | ) |
| | | | | | | | | | | | |
| | | |
| NET DECREASE IN NET ASSETS RESULTING FROM OPERATIONS | | $ | (666,014,840 | ) | | $ | (85,167,041 | ) | | $ | (48,252,741 | ) |
| | | | | | | | | | | | |
| (a) | Includes a non-recurring dividend of $1,235,166. |
See accompanying notes to financial statements.
| 26
Statements of Changes in Net Assets
| | | | | | | | | | | | | | | | |
| | | Small Cap Growth Fund | | | Small Cap Value Fund | |
| | | Year Ended
September 30, 2022 | | | Year Ended
September 30, 2021 | | | Year Ended
September 30, 2022 | | | Year Ended
September 30, 2021 | |
| FROM OPERATIONS: | | | | | | | | | | | | | | | | |
Net investment income (loss) | | $ | (11,256,808 | ) | | $ | (19,450,861 | ) | | $ | 2,371,925 | | | $ | 507,378 | |
Net realized gain on investments | | | 55,541,403 | | | | 533,253,178 | | | | 53,239,567 | | | | 100,227,931 | |
Net change in unrealized appreciation (depreciation) on investments | | | (710,299,435 | ) | | | 177,322,872 | | | | (140,778,533 | ) | | | 147,963,359 | |
| | | | | | | | | | | | | | | | |
Net increase (decrease) in net assets resulting from operations | | | (666,014,840 | ) | | | 691,125,189 | | | | (85,167,041 | ) | | | 248,698,668 | |
| | | | | | | | | | | | | | | | |
| FROM DISTRIBUTIONS TO SHAREHOLDERS: | | | | | | | | | | | | | | | | |
Institutional Class | | | (225,523,167 | ) | | | (22,559,287 | ) | | | (63,922,055 | ) | | | (26,695,330 | ) |
Retail Class | | | (19,793,925 | ) | | | (2,296,488 | ) | | | (14,932,854 | ) | | | (7,238,030 | ) |
Admin Class | | | — | | | | — | | | | (1,673,437 | ) | | | (668,585 | ) |
Class N | | | (252,701,386 | ) | | | (24,308,305 | ) | | | (19,629,374 | ) | | | (8,552,785 | ) |
| | | | | | | | | | | | | | | | |
Total distributions | | | (498,018,478 | ) | | | (49,164,080 | ) | | | (100,157,720 | ) | | | (43,154,730 | ) |
| | | | | | | | | | | | | | | | |
| | | | |
| NET INCREASE (DECREASE) IN NET ASSETS FROM CAPITAL SHARE TRANSACTIONS (NOTE 10) | | | 261,184,927 | | | | 36,085,434 | | | | 14,383,874 | | | | (91,550,412 | ) |
| | | | | | | | | | | | | | | | |
Net increase (decrease) in net assets | | | (902,848,391 | ) | | | 678,046,543 | | | | (170,940,887 | ) | | | 113,993,526 | |
| NET ASSETS | | | | | | | | | | | | | | | | |
Beginning of the year | | | 2,879,943,067 | | | | 2,201,896,524 | | | | 592,642,861 | | | | 478,649,335 | |
| | | | | | | | | | | | | | | | |
End of the year | | $ | 1,977,094,676 | | | $ | 2,879,943,067 | | | $ | 421,701,974 | | | $ | 592,642,861 | |
| | | | | | | | | | | | | | | | |
See accompanying notes to financial statements.
27 |
Statements of Changes in Net Assets – continued
| | | | | | | | |
| | | Small/Mid Cap Growth Fund | |
| | | Year Ended
September 30, 2022 | | | Year Ended
September 30, 2021 | |
| FROM OPERATIONS: | | | | | | | | |
Net investment loss | | $ | (596,324 | ) | | $ | (105,005 | ) |
Net realized gain (loss) on investments | | | (6,038,711 | ) | | | 9,142,738 | |
Net change in unrealized appreciation (depreciation) on investments | | | (41,617,706 | ) | | | 8,684,917 | |
| | | | | | | | |
Net increase (decrease) in net assets resulting from operations | | | (48,252,741 | ) | | | 17,722,650 | |
| | | | | | | | |
| FROM DISTRIBUTIONS TO SHAREHOLDERS: | | | | | | | | |
Institutional Class | | | (7,348,311 | ) | | | (450,185 | ) |
Class N | | | (901,138 | ) | | | (58,589 | ) |
| | | | | | | | |
Total distributions | | | (8,249,449 | ) | | | (508,774 | ) |
| | | | | | | | |
| | |
| NET INCREASE IN NET ASSETS FROM CAPITAL SHARE TRANSACTIONS (NOTE 10) | | | 130,096,993 | | | | 10,400,054 | |
| | | | | | | | |
Net increase in net assets | | | 73,594,803 | | | | 27,613,930 | |
| NET ASSETS | | | | | | | | |
Beginning of the year | | | 79,785,405 | | | | 52,171,475 | |
| | | | | | | | |
End of the year | | $ | 153,380,208 | | | $ | 79,785,405 | |
| | | | | | | | |
See accompanying notes to financial statements.
| 28
Financial Highlights
For a share outstanding throughout each period.
| | | | | | | | | | | | | | | | | | | | |
| | | Small Cap Growth Fund – Institutional Class | |
| | | Year Ended
September 30,
2022
| | | Year Ended
September 30,
2021
| | | Year Ended
September 30,
2020
| | | Year Ended
September 30,
2019
| | | Year Ended
September 30,
2018
| |
Net asset value, beginning of the period | | $ | 36.57 | | | $ | 28.51 | | | $ | 26.30 | | | $ | 31.55 | | | $ | 27.37 | |
| | | | |
INCOME (LOSS) FROM INVESTMENT OPERATIONS: | | | | | | | | | | | | | | | | | | | | |
Net investment loss(a) | | | (0.15 | )(b) | | | (0.26 | ) | | | (0.17 | ) | | | (0.16 | ) | | | (0.16 | ) |
Net realized and unrealized gain (loss) | | | (7.06 | ) | | | 8.94 | | | | 4.73 | | | | (2.51 | ) | | | 7.54 | |
| | | | |
Total from Investment Operations | | | (7.21 | ) | | | 8.68 | | | | 4.56 | | | | (2.67 | ) | | | 7.38 | |
| | | | |
LESS DISTRIBUTIONS FROM: | | | | | | | | | | | | | | | | | | | | |
Net realized capital gains | | | (6.48 | ) | | | (0.62 | ) | | | (2.35 | ) | | | (2.58 | ) | | | (3.20 | ) |
| | | | |
Net asset value, end of the period | | $ | 22.88 | | | $ | 36.57 | | | $ | 28.51 | | | $ | 26.30 | | | $ | 31.55 | |
| | | | |
Total return | | | (24.77 | )%(b) | | | 30.53 | % | | | 17.98 | % | | | (6.88 | )% | | | 29.77 | % |
RATIOS TO AVERAGE NET ASSETS: | | | | | | | | | | | | | | | | | | | | |
Net assets, end of the period (000’s) | | $ | 883,458 | | | $ | 1,299,777 | | | $ | 1,037,625 | | | $ | 908,616 | | | $ | 926,914 | |
Net expenses | | | 0.93 | % | | | 0.92 | % | | | 0.94 | % | | | 0.95 | % | | | 0.94 | % |
Gross expenses | | | 0.93 | % | | | 0.92 | % | | | 0.94 | % | | | 0.95 | % | | | 0.94 | % |
Net investment loss | | | (0.51 | )%(b) | | | (0.72 | )% | | | (0.66 | )% | | | (0.62 | )% | | | (0.58 | )% |
Portfolio turnover rate | | | 34 | % | | | 52 | % | | | 52 | % | | | 67 | % | | | 41 | % |
| (a) | | Per share net investment loss has been calculated using the average shares outstanding during the period. | |
| (b) | | Includes a non-recurring dividend. Without this dividend, net investment loss per share would have been $(0.16), total return would have been (24.83%) and the ratio of net investment loss to average net assets would have been (0.56%). | |
| | | | | | | | | | | | | | | | | | | | |
| | | Small Cap Growth Fund – Retail Class | |
| | | Year Ended
September 30,
2022
| | | Year Ended
September 30,
2021
| | | Year Ended
September 30,
2020
| | | Year Ended
September 30,
2019
| | | Year Ended
September 30,
2018
| |
Net asset value, beginning of the period | | $ | 32.79 | | | $ | 25.67 | | | $ | 23.95 | | | $ | 29.09 | | | $ | 25.53 | |
| | | | |
INCOME (LOSS) FROM INVESTMENT OPERATIONS: | | | | | | | | | | | | | | | | | | | | |
Net investment loss(a) | | | (0.19 | )(b) | | | (0.30 | ) | | | (0.21 | ) | | | (0.21 | ) | | | (0.22 | ) |
Net realized and unrealized gain (loss) | | | (6.14 | ) | | | 8.04 | | | | 4.28 | | | | (2.35 | ) | | | 6.98 | |
| | | | |
Total from Investment Operations | | | (6.33 | ) | | | 7.74 | | | | 4.07 | | | | (2.56 | ) | | | 6.76 | |
| | | | |
LESS DISTRIBUTIONS FROM: | | | | | | | | | | | | | | | | | | | | |
Net realized capital gains | | | (6.48 | ) | | | (0.62 | ) | | | (2.35 | ) | | | (2.58 | ) | | | (3.20 | ) |
| | | | |
Net asset value, end of the period | | $ | 19.98 | | | $ | 32.79 | | | $ | 25.67 | | | $ | 23.95 | | | $ | 29.09 | |
| | | | |
Total return | | | (24.94 | )%(b) | | | 30.20 | % | | | 17.67 | % | | | (7.11 | )%(c) | | | 29.45 | % |
RATIOS TO AVERAGE NET ASSETS: | | | | | | | | | | | | | | | | | | | | |
Net assets, end of the period (000’s) | | $ | 62,909 | | | $ | 105,027 | | | $ | 98,205 | | | $ | 95,635 | | | $ | 136,415 | |
Net expenses | | | 1.18 | % | | | 1.17 | % | | | 1.19 | % | | | 1.19 | %(d) | | | 1.19 | % |
Gross expenses | | | 1.18 | % | | | 1.17 | % | | | 1.19 | % | | | 1.20 | % | | | 1.19 | % |
Net investment loss | | | (0.76 | )%(b) | | | (0.92 | )% | | | (0.91 | )% | | | (0.86 | )% | | | (0.82 | )% |
Portfolio turnover rate | | | 34 | % | | | 52 | % | | | 52 | % | | | 67 | % | | | 41 | % |
| (a) | | Per share net investment loss has been calculated using the average shares outstanding during the period. | |
| (b) | | Includes a non-recurring dividend. Without this dividend, net investment loss per share would have been $(0.21), total return would have been (25.01%) and the ratio of net investment loss to average net assets would have been (0.81%). | |
| (c) | | Had certain expenses not been waived/reimbursed during the period, total returns would have been lower. | |
| (d) | | The administrator agreed to waive its fees and/or reimburse a portion of the Fund’s expenses during the period. Without this waiver/reimbursement, expenses would have been higher. | |
See accompanying notes to financial statements.
29 |
Financial Highlights – continued
For a share outstanding throughout each period.
| | | | | | | | | | | | | | | | | | | | |
| | | Small Cap Growth Fund – Class N | |
| | | Year Ended
September 30,
2022
| | | Year Ended
September 30,
2021
| | | Year Ended
September 30,
2020
| | | Year Ended
September 30,
2019
| | | Year Ended
September 30,
2018
| |
Net asset value, beginning of the period | | $ | 37.01 | | | $ | 28.81 | | | $ | 26.53 | | | $ | 31.76 | | | $ | 27.50 | |
| | | | |
INCOME (LOSS) FROM INVESTMENT OPERATIONS: | | | | | | | | | | | | | | | | | | | | |
Net investment loss(a) | | | (0.11 | )(b) | | | (0.22 | ) | | | (0.14 | ) | | | (0.13 | ) | | | (0.12 | ) |
Net realized and unrealized gain (loss) | | | (7.19 | ) | | | 9.04 | | | | 4.77 | | | | (2.52 | ) | | | 7.58 | |
| | | | |
Total from Investment Operations | | | (7.30 | ) | | | 8.82 | | | | 4.63 | | | | (2.65 | ) | | | 7.46 | |
| | | | |
LESS DISTRIBUTIONS FROM: | | | | | | | | | | | | | | | | | | | | |
Net realized capital gains | | | (6.48 | ) | | | (0.62 | ) | | | (2.35 | ) | | | (2.58 | ) | | | (3.20 | ) |
| | | | |
Net asset value, end of the period | | $ | 23.23 | | | $ | 37.01 | | | $ | 28.81 | | | $ | 26.53 | | | $ | 31.76 | |
| | | | |
Total return | | | (24.69 | )%(b) | | | 30.66 | % | | | 18.09 | % | | | (6.76 | )% | | | 29.93 | % |
RATIOS TO AVERAGE NET ASSETS: | | | | | | | | | | | | | | | | | | | | |
Net assets, end of the period (000’s) | | $ | 1,030,728 | | | $ | 1,475,139 | | | $ | 1,066,067 | | | $ | 629,914 | | | $ | 517,734 | |
Net expenses | | | 0.82 | % | | | 0.82 | % | | | 0.82 | % | | | 0.82 | % | | | 0.82 | % |
Gross expenses | | | 0.82 | % | | | 0.82 | % | | | 0.82 | % | | | 0.82 | % | | | 0.82 | % |
Net investment loss | | | (0.39 | )%(b) | | | (0.62 | )% | | | (0.54 | )% | | | (0.49 | )% | | | (0.43 | )% |
Portfolio turnover rate | | | 34 | % | | | 52 | % | | | 52 | % | | | 67 | % | | | 41 | % |
| (a) | | Per share net investment loss has been calculated using the average shares outstanding during the period. | |
| (b) | | Includes a non-recurring dividend. Without this dividend, net investment loss per share would have been $(0.13), total return would have been (24.71%) and the ratio of net investment loss to average net assets would have been (0.44%). | |
| | | | | | | | | | | | | | | | | | | | |
| | | Small Cap Value Fund – Institutional Class | |
| | | Year Ended
September 30,
2022
| | | Year Ended
September 30,
2021
| | | Year Ended
September 30,
2020
| | | Year Ended
September 30,
2019
| | | Year Ended
September 30,
2018
| |
Net asset value, beginning of the period | | $ | 32.05 | | | $ | 22.34 | | | $ | 28.66 | | | $ | 35.27 | | | $ | 37.37 | |
| | | | |
INCOME (LOSS) FROM INVESTMENT OPERATIONS: | | | | | | | | | | | | | | | | | | | | |
Net investment income(a) | | | 0.13 | | | | 0.04 | | | | 0.12 | | | | 0.10 | | | | 0.09 | |
Net realized and unrealized gain (loss) | | | (4.18 | ) | | | 11.79 | | | | (4.03 | ) | | | (2.49 | ) | | | 2.11 | |
| | | | |
Total from Investment Operations | | | (4.05 | ) | | | 11.83 | | | | (3.91 | ) | | | (2.39 | ) | | | 2.20 | |
| | | | |
LESS DISTRIBUTIONS FROM: | | | | | | | | | | | | | | | | | | | | |
Net investment income | | | (0.05 | ) | | | (0.13 | ) | | | (0.12 | ) | | | (0.08 | ) | | | (0.05 | ) |
Net realized capital gains | | | (5.38 | ) | | | (1.99 | ) | | | (2.29 | ) | | | (4.14 | ) | | | (4.25 | ) |
| | | | |
Total Distributions | | | (5.43 | ) | | | (2.12 | ) | | | (2.41 | ) | | | (4.22 | ) | | | (4.30 | ) |
| | | | |
Net asset value, end of the period | | $ | 22.57 | | | $ | 32.05 | | | $ | 22.34 | | | $ | 28.66 | | | $ | 35.27 | |
| | | | |
Total return(b) | | | (16.18 | )% | | | 55.05 | % | | | (15.31 | )% | | | (4.11 | )% | | | 6.21 | % |
RATIOS TO AVERAGE NET ASSETS: | | | | | | | | | | | | | | | | | | | | |
Net assets, end of the period (000’s) | | $ | 276,020 | | | $ | 378,856 | | | $ | 295,006 | | | $ | 433,360 | | | $ | 587,198 | |
Net expenses(c) | | | 0.90 | % | | | 0.90 | % | | | 0.90 | % | | | 0.90 | % | | | 0.90 | % |
Gross expenses | | | 0.93 | % | | | 0.94 | % | | | 0.95 | % | | | 0.93 | % | | | 0.92 | % |
Net investment income | | | 0.48 | % | | | 0.12 | % | | | 0.48 | % | | | 0.36 | % | | | 0.26 | % |
Portfolio turnover rate | | | 28 | % | | | 23 | % | | | 23 | % | | | 24 | % | | | 19 | % |
| (a) | | Per share net investment income has been calculated using the average shares outstanding during the period. | |
| (b) | | Had certain expenses not been waived/reimbursed during the period, total returns would have been lower. | |
| (c) | | The investment adviser agreed to waive its fees and/or reimburse a portion of the Fund’s expenses during the period. Without this waiver/reimbursement, expenses would have been higher. | |
See accompanying notes to financial statements.
| 30
Financial Highlights – continued
For a share outstanding throughout each period.
| | | | | | | | | | | | | | | | | | | | |
| | | Small Cap Value Fund – Retail Class | |
| | | Year Ended
September 30,
2022 | | | Year Ended
September 30,
2021 | | | Year Ended
September 30,
2020 | | | Year Ended
September 30,
2019 | | | Year Ended
September 30,
2018 | |
Net asset value, beginning of the period | | $ | 31.33 | | | $ | 21.87 | | | $ | 28.11 | | | $ | 34.66 | | | $ | 36.83 | |
| | | | |
INCOME (LOSS) FROM INVESTMENT OPERATIONS: | | | | | | | | | | | | | | | | | | | | |
Net investment income (loss)(a) | | | 0.06 | | | | (0.04 | ) | | | 0.05 | | | | 0.03 | | | | 0.00 | (b) |
Net realized and unrealized gain (loss) | | | (4.06 | ) | | | 11.55 | | | | (3.96 | ) | | | (2.44 | ) | | | 2.08 | |
| | | | |
Total from Investment Operations | | | (4.00 | ) | | | 11.51 | | | | (3.91 | ) | | | (2.41 | ) | | | 2.08 | |
| | | | |
LESS DISTRIBUTIONS FROM: | | | | | | | | | | | | | | | | | | | | |
Net investment income | | | — | | | | (0.06 | ) | | | (0.04 | ) | | | — | | | | — | |
Net realized capital gains | | | (5.38 | ) | | | (1.99 | ) | | | (2.29 | ) | | | (4.14 | ) | | | (4.25 | ) |
| | | | |
Total Distributions | | | (5.38 | ) | | | (2.05 | ) | | | (2.33 | ) | | | (4.14 | ) | | | (4.25 | ) |
| | | | |
Net asset value, end of the period | | $ | 21.95 | | | $ | 31.33 | | | $ | 21.87 | | | $ | 28.11 | | | $ | 34.66 | |
| | | | |
Total return(c) | | | (16.40 | )% | | | 54.69 | % | | | (15.56 | )% | | | (4.33 | )% | | | 5.95 | % |
RATIOS TO AVERAGE NET ASSETS: | | | | | | | | | | | | | | | | | | | | |
Net assets, end of the period (000’s) | | $ | 63,738 | | | $ | 92,036 | | | $ | 83,163 | | | $ | 134,434 | | | $ | 208,310 | |
Net expenses(d) | | | 1.15 | % | | | 1.15 | % | | | 1.15 | % | | | 1.15 | % | | | 1.15 | % |
Gross expenses | | | 1.18 | % | | | 1.19 | % | | | 1.20 | % | | | 1.18 | % | | | 1.17 | % |
Net investment income (loss) | | | 0.23 | % | | | (0.12 | )% | | | 0.23 | % | | | 0.10 | % | | | 0.01 | % |
Portfolio turnover rate | | | 28 | % | | | 23 | % | | | 23 | % | | | 24 | % | | | 19 | % |
| (a) | | Per share net investment income (loss) has been calculated using the average shares outstanding during the period. | |
| (b) | | Amount rounds to less than $0.01 per share. | |
| (c) | | Had certain expenses not been waived/reimbursed during the period, total returns would have been lower. | |
| (d) | | The investment adviser agreed to waive its fees and/or reimburse a portion of the Fund’s expenses during the period. Without this waiver/reimbursement, expenses would have been higher. | |
| | | | | | | | | | | | | | | | | | | | |
| | | Small Cap Value Fund – Admin Class | |
| | | Year Ended
September 30,
2022 | | | Year Ended
September 30,
2021 | | | Year Ended
September 30,
2020 | | | Year Ended
September 30,
2019 | | | Year Ended
September 30,
2018 | |
Net asset value, beginning of the period | | $ | 29.44 | | | $ | 20.65 | | | $ | 26.68 | | | $ | 33.25 | | | $ | 35.58 | |
| | | | |
INCOME (LOSS) FROM INVESTMENT OPERATIONS: | | | | | | | | | | | | | | | | | | | | |
Net investment loss(a) | | | (0.01 | ) | | | (0.10 | ) | | | (0.01 | ) | | | (0.04 | ) | | | (0.08 | ) |
Net realized and unrealized gain (loss) | | | (3.74 | ) | | | 10.88 | | | | (3.73 | ) | | | (2.39 | ) | | | 2.00 | |
| | | | |
Total from Investment Operations | | | (3.75 | ) | | | 10.78 | | | | (3.74 | ) | | | (2.43 | ) | | | 1.92 | |
| | | | |
LESS DISTRIBUTIONS FROM: | | | | | | | | | | | | | | | | | | | | |
Net realized capital gains | | | (5.38 | ) | | | (1.99 | ) | | | (2.29 | ) | | | (4.14 | ) | | | (4.25 | ) |
| | | | |
Net asset value, end of the period | | $ | 20.31 | | | $ | 29.44 | | | $ | 20.65 | | | $ | 26.68 | | | $ | 33.25 | |
| | | | |
Total return(b) | | | (16.63 | )% | | | 54.29 | % | | | (15.74 | )% | | | (4.60 | )% | | | 5.68 | % |
RATIOS TO AVERAGE NET ASSETS: | | | | | | | | | | | | | | | | | | | | |
Net assets, end of the period (000’s) | | $ | 6,776 | | | $ | 9,440 | | | $ | 7,662 | | | $ | 13,357 | | | $ | 24,530 | |
Net expenses(c) | | | 1.40 | % | | | 1.40 | % | | | 1.40 | % | | | 1.40 | % | | | 1.40 | % |
Gross expenses | | | 1.43 | % | | | 1.43 | % | | | 1.45 | % | | | 1.43 | % | | | 1.42 | % |
Net investment loss | | | (0.02 | )% | | | (0.38 | )% | | | (0.03 | )% | | | (0.15 | )% | | | (0.24 | )% |
Portfolio turnover rate | | | 28 | % | | | 23 | % | | | 23 | % | | | 24 | % | | | 19 | % |
| (a) | | Per share net investment loss has been calculated using the average shares outstanding during the period. | |
| (b) | | Had certain expenses not been waived/reimbursed during the period, total returns would have been lower. | |
| (c) | | The investment adviser agreed to waive its fees and/or reimburse a portion of the Fund’s expenses during the period. Without this waiver/reimbursement, expenses would have been higher. | |
See accompanying notes to financial statements.
31 |
Financial Highlights – continued
For a share outstanding throughout each period.
| | | | | | | | | | | | | | | | | | | | |
| | | Small Cap Value Fund – Class N | |
| | | Year Ended
September 30,
2022
| | | Year Ended
September 30,
2021
| | | Year Ended
September 30,
2020
| | | Year Ended
September 30,
2019
| | | Year Ended
September 30,
2018
| |
Net asset value, beginning of the period | | $ | 32.07 | | | $ | 22.35 | | | $ | 28.68 | | | $ | 35.31 | | | $ | 37.41 | |
| | | | |
INCOME (LOSS) FROM INVESTMENT OPERATIONS: | | | | | | | | | | | | | | | | | | | | |
Net investment income(a) | | | 0.15 | | | | 0.05 | | | | 0.13 | | | | 0.12 | | | | 0.12 | |
Net realized and unrealized gain (loss) | | | (4.19 | ) | | | 11.80 | | | | (4.03 | ) | | | (2.50 | ) | | | 2.11 | |
| | | | |
Total from Investment Operations | | | (4.04 | ) | | | 11.85 | | | | (3.90 | ) | | | (2.38 | ) | | | 2.23 | |
| | | | |
LESS DISTRIBUTIONS FROM: | | | | | | | | | | | | | | | | | | | | |
Net investment income | | | (0.07 | ) | | | (0.14 | ) | | | (0.14 | ) | | | (0.11 | ) | | | (0.08 | ) |
Net realized capital gains | | | (5.38 | ) | | | (1.99 | ) | | | (2.29 | ) | | | (4.14 | ) | | | (4.25 | ) |
| | | | |
Total Distributions | | | (5.45 | ) | | | (2.13 | ) | | | (2.43 | ) | | | (4.25 | ) | | | (4.33 | ) |
| | | | |
Net asset value, end of the period | | $ | 22.58 | | | $ | 32.07 | | | $ | 22.35 | | | $ | 28.68 | | | $ | 35.31 | |
| | | | |
Total return | | | (16.16 | )% | | | 55.15 | % | | | (15.28 | )% | | | (4.07 | )% | | | 6.28 | % |
RATIOS TO AVERAGE NET ASSETS: | | | | | | | | | | | | | | | | | | | | |
Net assets, end of the period (000’s) | | $ | 75,168 | | | $ | 112,310 | | | $ | 92,818 | | | $ | 141,821 | | | $ | 153,646 | |
Net expenses | | | 0.84 | % | | | 0.85 | % | | | 0.85 | % | | | 0.83 | % | | | 0.83 | % |
Gross expenses | | | 0.84 | % | | | 0.85 | % | | | 0.85 | % | | | 0.83 | % | | | 0.83 | % |
Net investment income | | | 0.53 | % | | | 0.17 | % | | | 0.53 | % | | | 0.43 | % | | | 0.33 | % |
Portfolio turnover rate | | | 28 | % | | | 23 | % | | | 23 | % | | | 24 | % | | | 19 | % |
| (a) | | Per share net investment income has been calculated using the average shares outstanding during the period. | |
| | | | | | | | | | | | | | | | | | | | |
| | | Small/Mid Cap Growth Fund – Institutional Class | |
| | | Year Ended
September 30,
2022
| | | Year Ended
September 30,
2021
| | | Year Ended
September 30,
2020
| | | Year Ended
September 30,
2019
| | | Year Ended
September 30,
2018
| |
Net asset value, beginning of the period | | $ | 15.25 | | | $ | 11.81 | | | $ | 10.03 | | | $ | 15.49 | | | $ | 12.31 | |
| | | | |
INCOME (LOSS) FROM INVESTMENT OPERATIONS: | | | | | | | | | | | | | | | | | | | | |
Net investment loss(a) | | | (0.06 | ) | | | (0.02 | )(b) | | | (0.04 | ) | | | (0.04 | ) | | | (0.05 | ) |
Net realized and unrealized gain (loss) | | | (3.37 | ) | | | 3.56 | | | | 2.06 | | | | (1.55 | )(c) | | | 3.23 | |
| | | | |
Total from Investment Operations | | | (3.43 | ) | | | 3.54 | | | | 2.02 | | | | (1.59 | ) | | | 3.18 | |
| | | | |
LESS DISTRIBUTIONS FROM: | | | | | | | | | | | | | | | | | | | | |
Net realized capital gains | | | (1.48 | ) | | | (0.10 | ) | | | (0.24 | ) | | | (3.87 | ) | | | — | |
| | | | |
Net asset value, end of the period | | $ | 10.34 | | | $ | 15.25 | | | $ | 11.81 | | | $ | 10.03 | | | $ | 15.49 | |
| | | | |
Total return(d) | | | (25.43 | )% | | | 30.00 | %(b) | | | 20.38 | % | | | (3.27 | )% | | | 25.83 | % |
RATIOS TO AVERAGE NET ASSETS: | | | | | | | | | | | | | | | | | | | | |
Net assets, end of the period (000’s) | | $ | 106,566 | | | $ | 70,526 | | | $ | 52,170 | | | $ | 34,312 | | | $ | 17,500 | |
Net expenses(e) | | | 0.84 | %(f) | | | 0.84 | %(f) | | | 0.84 | % | | | 0.85 | % | | | 0.85 | % |
Gross expenses | | | 0.91 | % | | | 0.99 | % | | | 1.21 | % | | | 1.30 | % | | | 1.43 | % |
Net investment loss | | | (0.45 | )% | | | (0.14 | )%(b) | | | (0.34 | )% | | | (0.35 | )% | | | (0.35 | )% |
Portfolio turnover rate | | | 50 | % | | | 50 | % | | | 60 | % | | | 67 | % | | | 102 | % |
| (a) | | Per share net investment loss has been calculated using the average shares outstanding during the period. | |
| (b) | | Includes a non-recurring dividend. Without this dividend, net investment loss per share would have been $(0.08), total return would have been 29.49% and the ratio of net investment loss to average net assets would have been (0.52%). | |
| (c) | | The amount shown for a share outstanding does not correspond with the aggregate realized and unrealized gain (loss) on investments for the period due to the timing of sales and redemptions of fund shares in relation to fluctuating market values of investments of the Fund. | |
| (d) | | Had certain expenses not been waived/reimbursed during the period, total returns would have been lower. | |
| (e) | | The investment adviser agreed to waive its fees and/or reimburse a portion of the Fund’s expenses during the period. Without this waiver/reimbursement, expenses would have been higher. | |
| (f) | | Includes additional voluntary waiver of advisory fee of 0.01%. | |
See accompanying notes to financial statements.
| 32
Financial Highlights – continued
For a share outstanding throughout each period.
| | | | | | | | | | | | |
| | | Small/Mid Cap Growth Fund – Class N | |
| | | Year Ended
September 30,
2022
| | | Year Ended
September 30,
2021
| | | Period Ended
September 30,
2020*
| |
Net asset value, beginning of the period | | $ | 15.26 | | | $ | 11.81 | | | $ | 9.89 | |
| | | | |
INCOME (LOSS) FROM INVESTMENT OPERATIONS: | | | | | | | | | | | | |
Net investment loss(a) | | | (0.05 | ) | | | (0.01 | )(b) | | | (0.04 | ) |
Net realized and unrealized gain (loss) | | | (3.38 | ) | | | 3.56 | | | | 2.20 | |
| | | | |
Total from Investment Operations | | | (3.43 | ) | | | 3.55 | | | | 2.16 | |
| | | | |
LESS DISTRIBUTIONS FROM: | | | | | | | | | | | | |
Net realized capital gains | | | (1.48 | ) | | | (0.10 | ) | | | (0.24 | ) |
| | | | |
Net asset value, end of the period | | $ | 10.35 | | | $ | 15.26 | | | $ | 11.81 | |
| | | | |
Total return(c) | | | (25.41 | )% | | | 30.08 | %(b) | | | 22.08 | %(d) |
RATIOS TO AVERAGE NET ASSETS: | | | | | | | | | | | | |
Net assets, end of the period (000’s) | | $ | 46,814 | | | $ | 9,260 | | | $ | 1 | |
Net expenses(e) | | | 0.83 | % | | | 0.83 | % | | | 0.83 | %(f) |
Gross expenses | | | 0.91 | % | | | 1.00 | % | | | 107.49 | %(f) |
Net investment loss | | | (0.44 | )% | | | (0.08 | )%(b) | | | (0.34 | )%(f) |
Portfolio turnover rate | | | 50 | % | | | 50 | % | | | 60 | %(g) |
| * | | Class operations commenced on October 1, 2019. | |
| (a) | | Per share net investment loss has been calculated using the average shares outstanding during the period. | |
| (b) | | Includes a non-recurring dividend. Without this dividend, net investment loss per share would have been $(0.07), total return would have been 29.66% and the ratio of net investment loss to average net assets would have been (0.50%). | |
| (c) | | Had certain expenses not been waived/reimbursed during the period, total returns would have been lower. | |
| (d) | | Periods less than one year are not annualized. | |
| (e) | | The investment adviser agreed to waive its fees and/or reimburse a portion of the Fund’s expenses during the period. Without this waiver/reimbursement, expenses would have been higher. | |
| (f) | | Computed on an annualized basis for periods less than one year. | |
| (g) | | Represents the Fund’s portfolio turnover rate for the year ended September 30, 2020. | |
See accompanying notes to financial statements.
33 |
Notes to Financial Statements
September 30, 2022
1. Organization. Loomis Sayles Funds I and Loomis Sayles Funds II (the “Trusts” and each a “Trust”) are each organized as a Massachusetts business trust. Each Trust is registered under the Investment Company Act of 1940, as amended (the “1940 Act”), as an open-end management investment company. Each Declaration of Trust permits the Board of Trustees to authorize the issuance of an unlimited number of shares of the Trust in multiple series. The financial statements for certain funds of the Trusts are presented in separate reports. The following funds (individually, a “Fund” and collectively, the “Funds”) are included in this report:
Loomis Sayles Funds I:
Loomis Sayles Small Cap Value Fund (the “Small Cap Value Fund”)
Loomis Sayles Funds II:
Loomis Sayles Small Cap Growth Fund (the “Small Cap Growth Fund”)
Loomis Sayles Small/Mid Cap Growth Fund (the “Small/Mid Cap Growth Fund”)
Each Fund is a diversified investment company.
Small Cap Growth Fund offers Institutional Class, Retail Class and Class N shares. Small Cap Value Fund offers Institutional Class, Retail Class, Admin Class and Class N shares. Small/Mid Cap Growth Fund offers Institutional Class and Class N shares.
Each share class is sold without a sales charge. Retail Class and Admin Class shares pay a Rule 12b-1 fee. Class N shares are offered with an initial minimum investment of $1,000,000. Institutional Class shares are intended for institutional investors with a minimum initial investment of $100,000. Certain categories of investors are exempted from the minimum investment amount for Class N and Institutional Class as outlined in the relevant Fund’s prospectus. Admin Class shares are offered exclusively through intermediaries.
Most expenses can be directly attributed to a Fund. Expenses which cannot be directly attributed to a Fund are generally apportioned based on the relative net assets of each of the Funds in Natixis Funds Trust I, Natixis Funds Trust II, Natixis Funds Trust IV and Gateway Trust (“Natixis Funds Trusts”), Loomis Sayles Funds I and Loomis Sayles Funds II (“Loomis Sayles Funds Trusts”), and Natixis ETF Trust and Natixis ETF Trust II (“Natixis ETF Trusts”). Expenses of a Fund are borne pro rata by the holders of each class of shares, except that each class bears expenses unique to that class (such as the Rule 12b-1 fees applicable to Retail Class and Admin Class), and transfer agent fees are borne collectively for Institutional Class, Retail Class and Admin Class, and individually for Class N. In addition, each class votes as a class only with respect to its own Rule 12b-1 Plan. Shares of each class would receive their pro rata share of the net assets of a Fund if the Fund were liquidated. The Trustees approve separate distributions from net investment income on each class of shares.
2. Significant Accounting Policies. The following is a summary of significant accounting policies consistently followed by each Fund in the preparation of its financial statements. The Funds’ financial statements follow the accounting and reporting guidelines provided for investment companies and are prepared in accordance with accounting principles generally accepted in the United States of America which require the use of management estimates that affect the reported amounts and disclosures in the financial statements. Actual results could differ from those estimates. Management has evaluated the events and transactions subsequent to year-end through the date the financial statements were issued and has determined that there were no material events that would require disclosure in the Funds’ financial statements.
a. Valuation. Registered investment companies are required to value portfolio investments using an unadjusted, readily available market quotation. Each Fund obtains readily available market quotations from independent pricing services. Fund investments for which readily available market quotations are not available are priced at fair value pursuant to the Funds’ Valuation Procedures. The Board of Trustees has approved a valuation designee who is subject to the Board’s oversight.
Unadjusted readily available market quotations that are utilized for exchange traded equity securities (including shares of closed-end investment companies and exchange-traded funds) include the last sale price quoted on the exchange where the security is traded most extensively. Shares of open-end investment companies are valued at net asset value per share.
Exchange traded equity securities for which there is no reported sale during the day are fair valued at the closing bid quotation as reported by an independent pricing service. Unlisted equity securities (except unlisted preferred equity securities) are fair valued at the last sale price quoted in the market where they are traded most extensively or, if there is no reported sale during the day, the closing bid quotation as reported by an independent pricing service. If there is no last sale price or closing bid quotation available, unlisted equity securities will be fair valued using evaluated bids furnished by an independent pricing service, if available.
Debt securities and unlisted preferred equity securities are fair valued based on evaluated bids furnished to the Funds by an independent pricing service or bid prices obtained from broker-dealers. Broker-dealer bid prices may be used to fair value debt and unlisted equities where an independent pricing service is unable to price an investment or where an independent pricing service does not provide a reliable price for the investment.
| 34
Notes to Financial Statements – continued
September 30, 2022
The Funds may also fair value investments in other circumstances such as when extraordinary events occur after the close of a foreign market, but prior to the close of the New York Stock Exchange. This may include situations relating to a single issuer (such as a declaration of bankruptcy or a delisting of the issuer’s security from the primary market on which it has traded) as well as events affecting the securities markets in general (such as market disruptions or closings and significant fluctuations in U.S. and/or foreign markets). When fair valuing a Fund’s investments, the valuation designee may, among other things, use modeling tools or other processes that may take into account factors such as issuer specific information, or other related market activity and/or information that occurred after the close of the foreign market but before the time the Fund’s net asset value (“NAV”) is calculated. Fair valuation by the Fund(s) valuation designee may require subjective determinations about the value of the investment, and fair values used to determine a Fund’s NAV may differ from quoted or published prices, or from prices that are used by others, for the same investments. In addition, the use of fair value pricing may not always result in adjustments to the prices of investments held by a Fund.
b. Investment Transactions and Related Investment Income. Investment transactions are accounted for on a trade date plus one day basis for daily NAV calculation. However, for financial reporting purposes, investment transactions are reported on trade date. Dividend income (including income reinvested) and foreign withholding tax, if applicable, is recorded on the ex-dividend date, or in the case of certain foreign securities, as soon as a Fund is notified, and interest income is recorded on an accrual basis. Interest income is increased by the accretion of discount and decreased by the amortization of premium, if applicable. Distributions received from investments in securities that represent a return of capital or capital gain are recorded as a reduction of cost of investments or as a realized gain, respectively. The calendar year-end amounts of ordinary income, capital gains and return of capital included in distributions received from the Funds’ investments in real estate investment trusts (“REITs”) are reported to the Funds after the end of the fiscal year; accordingly, the Funds estimate these amounts for accounting purposes until the characterization of REIT distributions is reported to the Funds after the end of the fiscal year. Estimates are based on the most recent REIT distribution information available. In determining net gain or loss on securities sold, the cost of securities has been determined on an identified cost basis. Investment income, non-class specific expenses and realized and unrealized gains and losses are allocated on a pro rata basis to each class based on the relative net assets of each class to the total net assets of the Fund.
c. Foreign Currency Translation. The books and records of the Funds are maintained in U.S. dollars. The values of securities, currencies and other assets and liabilities denominated in currencies other than U.S. dollars, if any, are translated into U.S. dollars based upon foreign exchange rates prevailing at the end of the period. Purchases and sales of investment securities, income and expenses are translated into U.S. dollars on the respective dates of such transactions.
Net realized foreign exchange gains or losses arise from sales of foreign currency, changes in exchange rates between the trade and settlement dates on securities transactions and the difference between the amounts of dividends, interest and foreign withholding taxes recorded in the Funds’ books and records and the U.S. dollar equivalent of the amounts actually received or paid. Net unrealized foreign exchange gains or losses arise from changes in the value of assets and liabilities, other than investment securities, as of the end of the fiscal period, resulting from changes in exchange rates.
The values of investment securities are presented at the foreign exchange rates prevailing at the end of the period for financial reporting purposes. Net realized and unrealized gains or losses on investments reported in the Statements of Operations reflect gains or losses resulting from changes in exchange rates and fluctuations which arise due to changes in market prices of investment securities.
The Funds may use foreign currency exchange contracts to facilitate transactions in foreign-denominated investments. Losses may arise from changes in the value of the foreign currency or if the counterparties do not perform under the contracts’ terms.
d. Federal and Foreign Income Taxes. The Trusts treat each Fund as a separate entity for federal income tax purposes. Each Fund intends to meet the requirements of the Internal Revenue Code of 1986, as amended, applicable to regulated investment companies, and to distribute to its shareholders substantially all of its net investment income and any net realized capital gains at least annually. Management has performed an analysis of each Fund’s tax positions for the open tax years as of September 30, 2022 and has concluded that no provisions for income tax are required. The Funds’ federal tax returns for the prior three fiscal years remain subject to examination by the Internal Revenue Service. Management is not aware of any events that are reasonably possible to occur in the next twelve months that would result in the amounts of any unrecognized tax benefits significantly increasing or decreasing for the Funds. However, management’s conclusions regarding tax positions taken may be subject to review and adjustment at a later date based on factors including, but not limited to, new tax laws and accounting regulations and interpretations thereof.
A Fund may be subject to foreign withholding taxes on investment income and taxes on capital gains on investments that are accrued and paid based upon the Fund’s understanding of the tax rules and regulations that exist in the countries in which the Fund invests. Foreign withholding taxes on dividend and interest income are reflected on the Statements of Operations as a reduction of investment income, net of amounts that have been or are expected to be reclaimed and paid. Dividends and interest receivable on the Statements of Assets and Liabilities are net of foreign withholding taxes. Foreign withholding taxes where reclaims have been or are expected to be filed and paid are reflected on the Statements of Assets and Liabilities as tax reclaims receivable. Capital gains taxes paid are included in net realized gain (loss) on investments in the Statements of Operations. Accrued but unpaid capital gains taxes are reflected as foreign taxes payable on the Statements of
35 |
Notes to Financial Statements – continued
September 30, 2022
Assets and Liabilities, if applicable, and reduce unrealized gains on investments. In the event that realized gains on investments are subsequently offset by realized losses, taxes paid on realized gains may be returned to a Fund. Such amounts, if applicable, are reflected as foreign tax rebates receivable on the Statements of Assets and Liabilities and are recorded as a realized gain when received.
e. Dividends and Distributions to Shareholders. Dividends and distributions are recorded on the ex-dividend date. The timing and characterization of certain income and capital gain distributions are determined in accordance with federal tax regulations, which may differ from accounting principles generally accepted in the United States of America. Permanent differences are primarily due to differing treatments for book and tax purposes of items such as return of capital distributions received, distribution re-designations, capital gain distributions received and net operating losses. Permanent book and tax basis differences relating to shareholder distributions will result in reclassifications to capital accounts reported on the Statements of Assets and Liabilities. Temporary differences between book and tax distributable earnings are primarily due to deferred Trustees’ fees and wash sales. Amounts of income and capital gain available to be distributed on a tax basis are determined annually, and at other times during the Funds’ fiscal year as may be necessary to avoid knowingly declaring and paying a return of capital distribution. Distributions from net investment income and short-term capital gains are reported as distributed from ordinary income for tax purposes.
The tax characterization of distributions is determined on an annual basis. The tax character of distributions paid to shareholders during the years ended September 30, 2022 and 2021 was as follows:
| | | | | | | | | | | | | | | | | | | | | | | | |
| | | 2022 Distributions | | | 2021 Distributions | |
Fund | | Ordinary
Income | | | Long-Term
Capital Gains | | | Total | | | Ordinary
Income | | | Long-Term
Capital Gains | | | Total | |
Small Cap Growth Fund | | $ | 14,122,150 | | | $ | 483,896,328 | | | $ | 498,018,478 | | | $ | — | | | $ | 49,164,080 | | | $ | 49,164,080 | |
Small Cap Value Fund | | | 8,282,886 | | | | 91,874,834 | | | | 100,157,720 | | | | 2,422,269 | | | | 40,732,461 | | | | 43,154,730 | |
Small/Mid Cap Growth Fund | | | — | | | | 8,249,449 | | | | 8,249,449 | | | | — | | | | 508,774 | | | | 508,774 | |
Distributions paid to shareholders from net investment income and net realized capital gains, based on accounting principles generally accepted in the United States of America, are consolidated and reported on the Statements of Changes in Net Assets as Distributions to Shareholders. Distributions paid to shareholders from net investment income and net realized capital gains expressed in per-share amounts, based on accounting principles generally accepted in the United States of America, are separately stated and reported within the Financial Highlights.
As of September 30, 2022, the components of distributable earnings on a tax basis were as follows:
| | | | | | | | | | | | |
| | | Small Cap
Growth Fund | | | Small Cap
Value Fund | | | Small/Mid Cap
Growth Fund | |
Undistributed ordinary income | | $ | — | | | $ | 1,427,268 | | | $ | — | |
Undistributed long-term capital gains | | | 54,712,252 | | | | 48,588,938 | | | | — | |
| | | | | | | | | | | | |
Total undistributed earnings | | | 54,712,252 | | | | 50,016,206 | | | | — | |
| | | | | | | | | | | | |
Late-year ordinary and post-October capital loss deferrals* | | | (7,898,482 | ) | | | — | | | | (6,245,087 | ) |
| | | | | | | | | | | | |
Unrealized appreciation (depreciation) | | | 49,079,545 | | | | 65,022,288 | | | | (23,312,817 | ) |
| | | | | | | | | | | | |
Total accumulated earnings (losses) | | $ | 95,893,315 | | | $ | 115,038,494 | | | $ | (29,557,904 | ) |
| | | | | | | | | | | | |
* Under current tax law, net operating losses, capital losses, foreign currency losses, and losses on passive foreign investment companies and contingent payment debt instruments after October 31 or December 31, as applicable, may be deferred and treated as occurring on the first day of the following taxable year. Small Cap Growth Fund and Small/Mid Cap Growth Fund are deferring net operating losses and capital losses.
As of September 30, 2022, the tax cost of investments and unrealized appreciation (depreciation) on a federal tax basis were as follows:
| | | | | | | | | | | | |
| | | Small Cap
Growth Fund | | | Small Cap
Value Fund | | | Small/Mid Cap
Growth Fund | |
Federal tax cost | | $ | 1,942,205,162 | | | $ | 355,414,745 | | | $ | 176,916,433 | |
| | | | | | | | | | | | |
Gross tax appreciation | | $ | 265,284,889 | | | $ | 96,500,094 | | | $ | 5,091,042 | |
Gross tax depreciation | | | (216,205,344 | ) | | | (31,477,806 | ) | | | (28,403,859 | ) |
| | | | | | | | | | | | |
Net tax appreciation (depreciation) | | $ | 49,079,545 | | | $ | 65,022,288 | | | $ | (23,312,817 | ) |
| | | | | | | | | | | | |
f. Repurchase Agreements. Each Fund may enter into repurchase agreements, under the terms of a Master Repurchase Agreement, under which each Fund acquires securities as collateral and agrees to resell the securities at an agreed upon time and at an agreed upon price. It is each Fund’s policy that the market value of the collateral for repurchase agreements be at least equal to 102% of the repurchase price, including interest. Certain repurchase agreements are tri-party arrangements whereby the collateral is held in a segregated account for the
| 36
Notes to Financial Statements – continued
September 30, 2022
benefit of the Fund and on behalf of the counterparty. Repurchase agreements could involve certain risks in the event of default or insolvency of the counterparty, including possible delays or restrictions upon a Fund’s ability to dispose of the underlying securities. As of September 30, 2022, each Fund, as applicable, had investments in repurchase agreements for which the value of the related collateral exceeded the value of the repurchase agreement. The gross value of repurchase agreements is included in the Statements of Assets and Liabilities for financial reporting purposes.
g. Securities Lending. Small Cap Growth Fund and Small Cap Value Fund have entered into an agreement with State Street Bank and Trust Company (“State Street Bank”), as agent of the Funds, to lend securities to certain designated borrowers. The loans are collateralized with cash or securities in an amount equal to at least 105% or 102% of the market value (including accrued interest) of the loaned international or domestic securities, respectively, when the loan is initiated. Thereafter, the value of the collateral must remain at least 102% of the market value (including accrued interest) of loaned securities for U.S. equities and U.S. corporate debt; at least 105% of the market value (including accrued interest) of loaned securities for non-U.S. equities; and at least 100% of the market value (including accrued interest) of loaned securities for U.S. Government securities, sovereign debt issued by non-U.S. Governments and non-U.S. corporate debt. In the event that the market value of the collateral falls below the required percentages described above, the borrower will deliver additional collateral on the next business day. As with other extensions of credit, the Funds may bear the risk of loss with respect to the investment of the collateral. The Funds invest cash collateral in short-term investments, a portion of the income from which is remitted to the borrowers and the remainder allocated between the Funds and State Street Bank as lending agent.
For the year ended September 30, 2022, neither Fund had loaned securities under this agreement.
h. Indemnifications. Under the Trusts’ organizational documents, their officers and Trustees are indemnified against certain liabilities arising out of the performance of their duties to the Funds. Additionally, in the normal course of business, the Funds enter into contracts with service providers that contain general indemnification clauses. The Funds’ maximum exposure under these arrangements is unknown as this would involve future claims that may be made against the Funds that have not yet occurred. However, based on experience, the Funds expect the risk of loss to be remote.
i. New Accounting Pronouncement. In June 2022, the Financial Accounting Standards Board issued Accounting Standards Update 2022-03, “Fair Value Measurement of Equity Securities Subject to Contractual Sale Restrictions” (“ASU 2022-03”). ASU 2022-03 clarifies the guidance in ASC 820 related to the measurement of fair value of an equity security subject to contractual sale restrictions, eliminating the ability to apply a discount to the fair value of such securities, and introducing related disclosure requirements. The guidance is effective for fiscal years, and interim periods within those fiscal years, beginning after December 15, 2023, and allows for early adoption. Management is currently evaluating the impact of applying this update.
3. Fair Value Measurements. In accordance with accounting standards related to fair value measurements and disclosures, the Funds have categorized the inputs utilized in determining the value of each Fund’s assets or liabilities. These inputs are summarized in the three broad levels listed below:
| | • | | Level 1—quoted prices in active markets for identical assets or liabilities; |
| | • | | Level 2—prices determined using other significant inputs that are observable either directly, or indirectly through corroboration with observable market data (which could include quoted prices for similar assets or liabilities, interest rates, credit risk, etc.); and |
| | • | | Level 3—prices determined using significant unobservable inputs when quoted prices or observable inputs are unavailable such as when there is little or no market activity for an asset or liability (unobservable inputs reflect each Fund’s own assumptions in determining the fair value of assets or liabilities and would be based on the best information available). |
The inputs or methodology used for valuing securities are not necessarily an indication of the risk associated with investing in those securities.
The Funds’ pricing policies have been approved by the Board of Trustees. Investments for which market quotations are readily available are categorized in Level 1. Other investments for which an independent pricing service is utilized are categorized in Level 2. Broker-dealer bid prices for which the Funds have knowledge of the inputs used by the broker-dealer are categorized in Level 2. All other investments, including broker-dealer bid prices for which the Funds do not have knowledge of the inputs used by the broker-dealer, as well as investments fair valued by the valuation designee, are categorized in Level 3. All Level 2 and 3 securities are defined as being fair valued.
Under certain conditions and based upon specific facts and circumstances, the Fund’s valuation designee may determine that a fair valuation should be made for portfolio investment(s). These valuation designee fair valuations will be based upon a significant amount of Level 3 inputs.
37 |
Notes to Financial Statements – continued
September 30, 2022
The following is a summary of the inputs used to value the Funds’ investments as of September 30, 2022, at value:
Small Cap Growth Fund
Asset Valuation Inputs
| | | | | | | | | | | | | | | | |
Description | | Level 1 | | | Level 2 | | | Level 3 | | | Total | |
Common Stocks(a) | | $ | 1,931,590,842 | | | $ | — | | | $ | — | | | $ | 1,931,590,842 | |
Short-Term Investments | | | — | | | | 59,693,865 | | | | — | | | | 59,693,865 | |
| | | | | | | | | | | | | | | | |
Total | | $ | 1,931,590,842 | | | $ | 59,693,865 | | | $ | — | | | $ | 1,991,284,707 | |
| | | | | | | | | | | | | | | | |
(a) Details of the major categories of the Fund’s investments are reflected within the Portfolio of Investments.
Small Cap Value Fund
Asset Valuation Inputs
| | | | | | | | | | | | | | | | |
Description | | Level 1 | | | Level 2 | | | Level 3 | | | Total | |
Common Stocks(a) | | $ | 413,054,153 | | | $ | — | | | $ | — | | | $ | 413,054,153 | |
Short-Term Investments | | | — | | | | 7,382,880 | | | | — | | | | 7,382,880 | |
| | | | | | | | | | | | | | | | |
Total | | $ | 413,054,153 | | | $ | 7,382,880 | | | $ | — | | | $ | 420,437,033 | |
| | | | | | | | | | | | | | | | |
(a) Details of the major categories of the Fund’s investments are reflected within the Portfolio of Investments.
Small/Mid Cap Growth Fund
Asset Valuation Inputs
| | | | | | | | | | | | | | | | |
Description | | Level 1 | | | Level 2 | | | Level 3 | | | Total | |
Common Stocks(a) | | $ | 148,720,841 | | | $ | — | | | $ | — | | | $ | 148,720,841 | |
Short-Term Investments | | | — | | | | 4,882,775 | | | | — | | | | 4,882,775 | |
| | | | | | | | | | | | | | | | |
Total | | $ | 148,720,841 | | | $ | 4,882,775 | | | $ | — | | | $ | 153,603,616 | |
| | | | | | | | | | | | | | | | |
(a) Details of the major categories of the Fund’s investments are reflected within the Portfolio of Investments.
4. Purchases and Sales of Securities. For the year ended September 30, 2022, purchases and sales of securities (excluding short-term investments) were as follows:
| | | | | | | | |
Fund | | Purchases | | | Sales | |
Small Cap Growth Fund | | $ | 809,093,493 | | | $ | 1,011,103,221 | |
Small Cap Value Fund | | | 147,792,628 | | | | 227,940,431 | |
Small/Mid Cap Growth Fund | | | 182,539,304 | | | | 63,489,680 | |
5. Management Fees and Other Transactions with Affiliates.
a. Management Fees. Loomis, Sayles & Company, L.P. (“Loomis Sayles”) serves as investment adviser to each Fund. Loomis Sayles is a limited partnership whose sole general partner, Loomis, Sayles & Company, Inc., is indirectly owned by Natixis Investment Managers, LLC, which is part of Natixis Investment Managers, an international asset management group based in Paris, France.
Under the terms of the management agreements, each Fund pays a management fee at the following annual rates, calculated daily and payable monthly, based on each Fund’s average daily net assets:
| | | | |
Fund | | Percentage of
Average Daily Net Assets | |
Small Cap Growth Fund | | | 0.75% | |
Small Cap Value Fund | | | 0.75% | |
Small/Mid Cap Growth Fund | | | 0.75% | |
Loomis Sayles has given binding undertakings to the Funds to waive management fees and/or reimburse certain expenses to limit the Funds’ operating expenses, exclusive of acquired fund fees and expenses, brokerage expenses, interest expense, taxes, organizational and extraordinary expenses such as litigation and indemnification expenses. These undertakings are in effect until January 31, 2023, may be terminated before then only with the consent of the Funds’ Board of Trustees and are reevaluated on an annual basis. Management fees payable, as reflected on the Statements of Assets and Liabilities, is net of waivers and/or expense reimbursements, if any, pursuant to these undertakings. Waivers/ reimbursements that exceed management fees payable are reflected on the Statements of Assets and Liabilities as receivable from investment adviser.
| 38
Notes to Financial Statements – continued
September 30, 2022
For the year ended September 30, 2022, the expense limits as a percentage of average daily net assets under the expense limitation agreements were as follows:
| | | | | | | | |
| | | Expense Limit as a Percentage of
Average Daily Net Assets |
Fund | | Institutional
Class | | Retail
Class | | Admin
Class | | Class N |
Small Cap Growth Fund | | 1.00% | | 1.25% | | — | | 0.95% |
Small Cap Value Fund | | 0.90% | | 1.15% | | 1.40% | | 0.85% |
Small/Mid Cap Growth Fund | | 0.85% | | — | | — | | 0.83% |
Loomis Sayles shall be permitted to recover expenses borne under the expense limitation agreements (whether through waiver of management fees or otherwise) on a class by class basis in later periods to the extent the annual operating expenses of a class fall below both (1) a class’ expense limitation ratio in place at the time such amounts were waived/reimbursed and (2) a class’ current applicable expense limitation ratio, provided, however, that a class is not obligated to pay such waived/reimbursed fees or expenses more than one year after the end of the fiscal year in which the fees or expenses were waived/reimbursed.
For the year ended September 30, 2022, the management fees for each Fund were as follows:
| | | | | | | | | | | | | | | | | | | | | | | | |
Fund | | Gross
Management
Fees | | | Contractual
Waivers of
Management
Fees1 | | | Voluntary
Waivers of
Management
Fees2 | | | Net
Management
Fees | | | Percentage of
Average Daily
Net Assets | |
| | Gross | | | Net | |
Small Cap Growth Fund | | $ | 18,479,365 | | | $ | — | | | $ | — | | | $ | 18,479,365 | | | | 0.75% | | | | 0.75% | |
Small Cap Value Fund | | | 4,039,249 | | | | — | | | | — | | | | 4,039,249 | | | | 0.75% | | | | 0.75% | |
Small/Mid Cap Growth Fund | | | 1,004,898 | | | | 88,872 | | | | 13,965 | | | | 902,061 | | | | 0.75% | | | | 0.67% | |
For the year ended September 30, 2022, class-specific expenses have been reimbursed as follows:
| | | | | | | | | | |
| | | Reimbursement1 |
Fund | | Institutional
Class | | Retail
Class | | Admin
Class | | Class N | | Total |
Small Cap Value Fund | | $98,247 | | $22,229 | | $2,403 | | $— | | $122,879 |
1 Waiver/expense reimbursements are subject to possible recovery until September 30, 2023.
2 In order to ensure that the total annual fund operating expenses after fee waiver and/or expense reimbursement do not exceed limitations, the Adviser may voluntarily waive additional advisory fees for Small/Mid Cap Growth Fund. Voluntary management fee waivers are not subject to recovery under the expense limitation agreement described above.
b. Service and Distribution Fees. Natixis Distribution, LLC (“Natixis Distribution”), which is a wholly-owned subsidiary of Natixis Investment Managers, LLC, has entered into a distribution agreement with the Trusts. Pursuant to this agreement, Natixis Distribution serves as principal underwriter of the Funds of the Trusts.
Pursuant to Rule 12b-1 under the 1940 Act, Small Cap Growth Fund and Small Cap Value Fund have adopted a Distribution Plan relating to each Fund’s Retail Class shares (the “Retail Class Plans”) and Small Cap Value Fund has adopted a Distribution Plan relating to its Admin Class shares (the “Admin Class Plan”).
Under the Retail Class Plans, each Fund pays Natixis Distribution a monthly distribution fee at an annual rate not to exceed 0.25% of the average daily net assets attributable to the Fund’s Retail Class shares, as compensation for services provided by Natixis Distribution in connection with the marketing or sale of Retail Class shares or for payments made by Natixis Distribution to securities dealers or other financial intermediaries as commissions, asset-based sales charges or other compensation with respect to the sale of Retail Class shares, or for providing personal services to investors and/or the maintenance of shareholder accounts.
Under the Admin Class Plan, Small Cap Value Fund pays Natixis Distribution a monthly distribution fee at an annual rate not to exceed 0.25% of the average daily net assets attributable to the Fund’s Admin Class shares, as compensation for services provided by Natixis Distribution in connection with the marketing or sale of Admin Class shares or for payments made by Natixis Distribution to securities dealers or other financial intermediaries as commissions, asset-based sales charges or other compensation with respect to the sale of Admin Class shares, or for providing personal services to investors and/or the maintenance of shareholder accounts.
In addition, the Admin Class shares of Small Cap Value Fund may pay Natixis Distribution an administrative service fee, at an annual rate not to exceed 0.25% of the average daily net assets attributable to Admin Class shares. These fees are subsequently paid to securities dealers or financial intermediaries for providing personal services and/or account maintenance for their customers who hold such shares.
39 |
Notes to Financial Statements – continued
September 30, 2022
For the year ended September 30, 2022, the service and distribution fees for each Fund were as follows:
| | | | | | | | | | | | |
| | | Service Fees | | | Distribution Fees | |
Fund | | Admin Class | | | Retail Class | | | Admin Class | |
Small Cap Growth Fund | | $ | — | | | $ | 211,376 | | | $ | — | |
Small Cap Value Fund | | | 21,323 | | | | 201,206 | | | | 21,323 | |
c. Administrative Fees. Natixis Advisors, LLC (“Natixis Advisors”) provides certain administrative services for the Funds and contracts with State Street Bank to serve as sub-administrator. Natixis Advisors is a wholly-owned subsidiary of Natixis Investment Managers, LLC. Pursuant to an agreement among Natixis Funds Trusts, Loomis Sayles Funds Trusts, Natixis ETF Trusts and Natixis Advisors, each Fund pays Natixis Advisors monthly its pro rata portion of fees equal to an annual rate of 0.0540% of the first $15 billion of the average daily net assets of the Natixis Funds Trusts, Loomis Sayles Funds Trusts and Natixis ETF Trusts, 0.0500% of the next $15 billion, 0.0400% of the next $30 billion, 0.0275% of the next $30 billion and 0.0225% of such assets in excess of $90 billion, subject to an annual aggregate minimum fee for the Natixis Funds Trusts, Loomis Sayles Funds Trusts and Natixis ETF Trusts of $10 million, which is reevaluated on an annual basis.
For the year ended September 30, 2022, the administrative fees for each Fund were as follows:
| | | | |
Fund | | Administrative
Fees | |
Small Cap Growth Fund | | $ | 1,084,767 | |
Small Cap Value Fund | | | 237,337 | |
Small/Mid Cap Growth Fund | | | 59,585 | |
d. Sub-Transfer Agent Fees. Natixis Distribution has entered into agreements, which include servicing agreements, with financial intermediaries that provide recordkeeping, processing, shareholder communications and other services to customers of the intermediaries that hold positions in the Funds and has agreed to compensate the intermediaries for providing those services. Intermediaries transact with the Funds primarily through the use of omnibus accounts on behalf of their customers who hold positions in the Funds. These services would have been provided by the Funds’ transfer agent and other service providers if the shareholders’ accounts were maintained directly at the Funds’ transfer agent. Accordingly, the Funds have agreed to reimburse Natixis Distribution for all or a portion of the servicing fees paid to these intermediaries. The reimbursement amounts (sub-transfer agent fees) paid to Natixis Distribution are subject to a current per-account equivalent fee limit approved by the Funds’ Board of Trustees, which is based on fees for similar services paid to the Funds’ transfer agent and other service providers. Class N shares do not bear such expenses.
For the year ended September 30, 2022, the sub-transfer agent fees (which are reflected in transfer agent fees and expenses in the Statements of Operations) for each Fund were as follows:
| | | | |
Fund | | Sub-Transfer
Agent Fees | |
Small Cap Growth Fund | | $ | 1,349,327 | |
Small Cap Value Fund | | | 346,081 | |
Small/Mid Cap Growth Fund | | | 1,983 | |
As of September 30, 2022, the Funds owe Natixis Distribution the following reimbursements for sub-transfer agent fees (which are reflected in the Statements of Assets and Liabilities as payable to distributor):
| | | | |
Fund | | Reimbursements
of Sub-Transfer
Agent Fees | |
Small Cap Growth Fund | | $ | 12,125 | |
Small Cap Value Fund | | | 3,350 | |
Small/Mid Cap Growth Fund | | | 27 | |
Sub-transfer agent fees attributable to Institutional Class, Retail Class and Admin Class are allocated on a pro rata basis to each class based on the relative net assets of each class to the total net assets of those classes.
e. Trustees Fees and Expenses. The Trusts do not pay any compensation directly to their officers or Trustees who are directors, officers or employees of Natixis Advisors, Natixis Distribution, Natixis Investment Managers, LLC or their affiliates. The Chairperson of the Board of Trustees receives a retainer fee at the annual rate of $369,000. The Chairperson does not receive any meeting attendance fees for Board of Trustees meetings or committee meetings that he attends. Each Independent Trustee (other than the Chairperson) receives, in the aggregate, a retainer fee at the annual rate of $210,000. Each Independent Trustee also receives a meeting attendance fee of $10,000 for each meeting of the Board of Trustees that he or she attends in person and $5,000 for each meeting of the Board of Trustees that he or she attends
| 40
Notes to Financial Statements – continued
September 30, 2022
telephonically. In addition, the chairperson of the Contract Review Committee, the chairperson of the Audit Committee and the chairperson of the Governance Committee each receive an additional retainer fee at the annual rate of $20,000. Each Contract Review Committee member is compensated $6,000 for each Committee meeting that he or she attends in person and $3,000 for each meeting that he or she attends telephonically. Each Audit Committee member is compensated $6,000 for each Committee meeting that he or she attends in person and $3,000 for each meeting that he or she attends telephonically. These fees are allocated among the funds in the Natixis Funds Trusts, Loomis Sayles Funds Trusts and Natixis ETF Trusts based on a formula that takes into account, among other factors, the relative net assets of each fund. Trustees are reimbursed for travel expenses in connection with attendance at meetings.
Prior to January 1, 2022, each Independent Trustee (other than the Chairperson) received, in the aggregate, a retainer fee at the annual rate of $199,000. All other Trustees fees remained unchanged.
A deferred compensation plan (the “Plan”) is available to the Trustees on a voluntary basis. The value of a participating Trustee’s deferral account is based on theoretical investments of deferred amounts, on the normal payment dates, in certain funds of the Natixis Funds Trusts, Loomis Sayles Funds Trusts and Natixis ETF Trusts as designated by the participating Trustees. Changes in the value of participants’ deferral accounts are allocated pro rata among the funds in the Natixis Funds Trusts, Loomis Sayles Funds Trusts and Natixis ETF Trusts, and are normally reflected as Trustees’ fees and expenses in the Statements of Operations. Deferred amounts remain in the funds until distributed in accordance with the provisions of the Plan. The portions of the accrued obligations allocated to the Funds under the Plan are reflected as Deferred Trustees’ fees in the Statements of Assets and Liabilities.
For the year ended September 30, 2022, net depreciation in the value of participants’ deferral accounts are reflected on the Statements of Operations as a reduction to expenses, as follows:
| | | | |
Fund | | Amount | |
Small Cap Growth Fund | | $ | (38,332 | ) |
Small Cap Value Fund | | | (53,840 | ) |
Small/Mid Cap Growth Fund | | | (3,526 | ) |
Certain officers and employees of Natixis Advisors and Loomis Sayles are also officers and/or Trustees of the Trusts.
f. Affiliated Ownership. As of September 30, 2022, Loomis Sayles Funded Pension Plan and Trust (“Pension Plan”), Loomis Sayles Employees’ Profit Sharing Retirement Plan (“Retirement Plan”) and Loomis Sayles non-qualified retirement plans held shares of the Funds representing the following percentages of the Funds’ net assets:
| | | | | | | | | | | | | | | | |
Fund | | Pension Plan | | | Retirement Plan | | | Non-Qualified
Retirement Plans | | | Total Affiliated
Ownership | |
Small Cap Growth Fund | | | 0.07% | | | | 1.11% | | | | — | | | | 1.18% | |
Small Cap Value Fund | | | 0.31% | | | | 5.33% | | | | 6.19% | | | | 11.83% | |
Investment activities of affiliated shareholders could have material impacts on the Funds.
g. Reimbursement of Transfer Agent Fees and Expenses. Natixis Advisors has given a binding contractual undertaking to Small/Mid Cap Growth Fund to reimburse any and all transfer agency expenses for the Fund’s Class N shares. This undertaking is in effect through January 31, 2023 and is not subject to recovery under the expense limitation agreement described above.
For the year ended September 30, 2022, Natixis Advisors reimbursed Small/Mid Cap Growth Fund $1,137 for transfer agency expenses related to Class N shares.
6. Class-Specific Transfer Agent Fees and Expenses. Transfer agent fees and expenses attributable to Institutional Class, Retail Class and Admin Class are allocated on a pro rata basis to each class based on the relative net assets of each class to the total net assets of those classes. Transfer agent fees and expenses attributable to Class N are allocated to Class N.
For the year ended September 30, 2022, the Funds incurred the following class-specific transfer agent fees and expenses (including sub-transfer agent fees, where applicable):
| | | | | | | | | | | | | | | | |
| | | Transfer Agent Fees and Expenses | |
Fund | | Institutional
Class | | | Retail
Class | | | Admin
Class | | | Class N | |
Small Cap Growth Fund | | $ | 1,277,963 | | | $ | 98,196 | | | $ | — | | | $ | 8,538 | |
Small Cap Value Fund | | | 293,931 | | | | 68,022 | | | | 7,224 | | | | 1,538 | |
Small/Mid Cap Growth Fund | | | 4,518 | | | | — | | | | — | | | | 1,137 | |
41 |
Notes to Financial Statements – continued
September 30, 2022
7. Line of Credit. Each Fund, together with certain other funds of Natixis Funds Trusts, Loomis Sayles Funds Trusts and Natixis ETF Trusts, entered into a $500,000,000 committed unsecured line of credit provided by State Street Bank. Any one Fund may borrow up to $350,000,000 under the line of credit agreement (as long as all borrowings by all Funds in the aggregate do not exceed the $500,000,000 limit at any time), subject to each Fund’s investment restrictions and its contractual obligations under the line of credit. Interest is charged to the Funds based upon the terms set forth in the agreement. In addition, a commitment fee of 0.15% per annum, payable at the end of each calendar quarter, is accrued and apportioned among the participating funds based on their average daily unused portion of the line of credit. The Funds paid certain legal fees in connection with the line of credit agreement, which are being amortized over a period of 364 days and are reflected in legal fees on the Statements of Operations. The unamortized balance is reflected as prepaid expenses on the Statements of Assets and Liabilities.
For the year ended September 30, 2022, none of the Funds had borrowings under this agreement.
8. Concentration of Ownership. From time to time, a Fund may have a concentration of one or more accounts constituting a significant percentage of shares outstanding. Investment activities by holders of such accounts could have material impacts on the Funds. As of September 30, 2022, based on management’s evaluation of the shareholder account base, the Funds had accounts representing controlling ownership of more than 5% of the Funds’ total outstanding shares. The number of such accounts, based on accounts that represent more than 5% of an individual class of shares, and the aggregate percentage of net assets represented by such holdings were as follows:
| | | | | | | | | | | | | | |
Fund | | Number of 5%
Non-Affiliated
Account Holders | | Percentage of
Non-Affiliated
Ownership | | | Percentage of
Affiliated Ownership
Ownership (Note 5f) | | | Total
Percentage of
Ownership | |
Small Cap Value Fund | | 1 | | | 14.52% | | | | 11.83% | | | | 26.35% | |
Small/Mid Cap Growth Fund | | 4 | | | 71.21% | | | | — | | | | 71.21% | |
Omnibus shareholder accounts for which Natixis Advisors understands that the intermediary has discretion over the underlying shareholder accounts or investment models where a shareholder account may be invested for a non-discretionary customer are included in the table above. For other omnibus accounts, the Funds do not have information on the individual shareholder accounts underlying the omnibus accounts; therefore, there could be other 5% shareholders in addition to those disclosed in the table above.
9. Risk. Russia launched a large-scale invasion of Ukraine on February 24, 2022. The extent and duration of the military action, resulting sanctions and resulting future market disruptions in the region and around the world are impossible to predict, but could be significant and have a severe adverse effect on the region and around the world, including significant negative impacts on the economy and the markets for certain securities and commodities, such as oil and natural gas, as well as other sectors.
10. Capital Shares. Each Fund may issue an unlimited number of shares of beneficial interest, without par value. Transactions in capital shares were as follows:
| | | | | | | | | | | | | | | | |
| | | Small Cap Growth Fund | |
| | |
| | | Year Ended September 30, 2022 | | | Year Ended September 30, 2021 | |
| | | | |
| Institutional Class | | Shares | | | Amount | | | Shares | | | Amount | |
Issued from the sale of shares | | | 8,017,172 | | | $ | 223,956,965 | | | | 9,135,230 | | | $ | 323,499,208 | |
Issued in connection with the reinvestment of distributions | | | 6,623,931 | | | | 211,700,835 | | | | 603,506 | | | | 21,484,823 | |
Redeemed | | | (11,564,237 | ) | | | (328,676,465 | ) | | | (10,600,777 | ) | | | (379,032,001 | ) |
| | | | | | | | | | | | | | | | |
Net change | | | 3,076,866 | | | $ | 106,981,335 | | | | (862,041 | ) | | $ | (34,047,970 | ) |
| | | | | | | | | | | | | | | | |
| | | | |
| Retail Class | | | | | | | | | | | | |
Issued from the sale of shares | | | 320,387 | | | $ | 7,927,984 | | | | 559,662 | | | $ | 17,611,050 | |
Issued in connection with the reinvestment of distributions | | | 703,528 | | | | 19,670,652 | | | | 71,504 | | | | 2,286,695 | |
Redeemed | | | (1,078,080 | ) | | | (27,258,549 | ) | | | (1,253,848 | ) | | | (39,965,014 | ) |
| | | | | | | | | | | | | | | | |
Net change | | | (54,165 | ) | | $ | 340,087 | | | | (622,682 | ) | | $ | (20,067,269 | ) |
| | | | | | | | | | | | | | | | |
| | | | |
| Class N | | | | | | | | | | | | |
Issued from the sale of shares | | | 8,143,108 | | | $ | 239,198,836 | | | | 12,972,678 | | | $ | 459,829,686 | |
Issued in connection with the reinvestment of distributions | | | 7,685,869 | | | | 249,252,745 | | | | 666,169 | | | | 23,982,068 | |
Redeemed | | | (11,325,816 | ) | | | (334,588,076 | ) | | | (10,783,445 | ) | | | (393,611,081 | ) |
| | | | | | | | | | | | | | | | |
Net change | | | 4,503,161 | | | $ | 153,863,505 | | | | 2,855,402 | | | $ | 90,200,673 | |
| | | | | | | | | | | | | | | | |
Increase from capital share transactions | | | 7,525,862 | | | $ | 261,184,927 | | | | 1,370,679 | | | $ | 36,085,434 | |
| | | | | | | | | | | | | | | | |
| 42
Notes to Financial Statements – continued
September 30, 2022
10. Capital Shares – continued
| | | | | | | | | | | | | | | | |
| | | Small Cap Value Fund | |
| | |
| | | Year Ended September 30, 2022 | | | Year Ended September 30, 2021 | |
| | | | |
| Institutional Class | | Shares | | | Amount | | | Shares | | | Amount | |
Issued from the sale of shares | | | 1,638,952 | | | $ | 45,506,016 | | | | 2,185,029 | | | $ | 65,327,936 | |
Issued in connection with the reinvestment of distributions | | | 2,209,266 | | | | 63,052,444 | | | | 969,486 | | | | 25,449,017 | |
Redeemed | | | (3,438,164 | ) | | | (92,106,055 | ) | | | (4,539,392 | ) | | | (134,099,821 | ) |
| | | | | | | | | | | | | | | | |
Net change | | | 410,054 | | | $ | 16,452,405 | | | | (1,384,877 | ) | | $ | (43,322,868 | ) |
| | | | | | | | | | | | | | | | |
| | | | |
| Retail Class | | | | | | | | | | | | |
Issued from the sale of shares | | | 118,433 | | | $ | 3,328,950 | | | | 272,038 | | | $ | 7,899,117 | |
Issued in connection with the reinvestment of distributions | | | 535,511 | | | | 14,897,926 | | | | 280,859 | | | | 7,220,881 | |
Redeemed | | | (687,758 | ) | | | (19,095,126 | ) | | | (1,417,269 | ) | | | (40,836,991 | ) |
| | | | | | | | | | | | | | | | |
Net change | | | (33,814 | ) | | $ | (868,250 | ) | | | (864,372 | ) | | $ | (25,716,993 | ) |
| | | | | | | | | | | | | | | | |
| | | | |
| Admin Class | | | | | | | | | | | | |
Issued from the sale of shares | | | 41,072 | | | $ | 1,112,201 | | | | 23,426 | | | $ | 655,054 | |
Issued in connection with the reinvestment of distributions | | | 64,887 | | | | 1,673,437 | | | | 27,530 | | | | 666,234 | |
Redeemed | | | (93,082 | ) | | | (2,413,386 | ) | | | (101,301 | ) | | | (2,619,066 | ) |
| | | | | | | | | | | | | | | | |
Net change | | | 12,877 | | | $ | 372,252 | | | | (50,345 | ) | | $ | (1,297,778 | ) |
| | | | | | | | | | | | | | | | |
| | | | |
| Class N | | | | | | | | | | | | |
Issued from the sale of shares | | | 719,077 | | | $ | 21,151,505 | | | | 710,243 | | | $ | 21,428,894 | |
Issued in connection with the reinvestment of distributions | | | 687,544 | | | | 19,629,374 | | | | 325,820 | | | | 8,552,785 | |
Redeemed | | | (1,580,215 | ) | | | (42,353,412 | ) | | | (1,686,418 | ) | | | (51,194,452 | ) |
| | | | | | | | | | | | | | | | |
Net change | | | (173,594 | ) | | $ | (1,572,533 | ) | | | (650,355 | ) | | $ | (21,212,773 | ) |
| | | | | | | | | | | | | | | | |
Increase (decrease) from capital share transactions | | | 215,523 | | | $ | 14,383,874 | | | | (2,949,949 | ) | | $ | (91,550,412 | ) |
| | | | | | | | | | | | | | | | |
| |
| | | Small/Mid Cap Growth Fund | |
| | |
| | | Year Ended September 30, 2022 | | | Year Ended September 30, 2021 | |
| | | | |
| Institutional Class | | Shares | | | Amount | | | Shares | | | Amount | |
Issued from the sale of shares | | | 6,066,124 | | | $ | 75,764,451 | | | | 770,533 | | | $ | 10,719,355 | |
Issued in connection with the reinvestment of distributions | | | 493,838 | | | | 7,348,311 | | | | 31,883 | | | | 450,185 | |
Redeemed | | | (882,881 | ) | | | (10,629,212 | ) | | | (596,871 | ) | | | (8,728,075 | ) |
| | | | | | | | | | | | | | | | |
Net change | | | 5,677,081 | | | $ | 72,483,550 | | | | 205,545 | | | $ | 2,441,465 | |
| | | | | | | | | | | | | | | | |
| | | | |
| Class N | | | | | | | | | | | | |
Issued from the sale of shares | | | 4,203,057 | | | $ | 60,895,993 | | | | 673,195 | | | $ | 8,900,000 | |
Issued in connection with the reinvestment of distributions | | | 60,520 | | | | 901,138 | | | | 4,146 | | | | 58,589 | |
Redeemed | | | (348,878 | ) | | | (4,183,688 | ) | | | (70,671 | ) | | | (1,000,000 | ) |
| | | | | | | | | | | | | | | | |
Net change | | | 3,914,699 | | | $ | 57,613,443 | | | | 606,670 | | | $ | 7,958,589 | |
| | | | | | | | | | | | | | | | |
Increase from capital share transactions | | | 9,591,780 | | | $ | 130,096,993 | | | | 812,215 | | | $ | 10,400,054 | |
| | | | | | | | | | | | | | | | |
43 |
Report of Independent Registered Public Accounting Firm
To the Board of Trustees of Loomis Sayles Funds I and Loomis Sayles Funds II and Shareholders of Loomis Sayles Small Cap Value Fund, Loomis Sayles Small Cap Growth Fund and Loomis Sayles Small/Mid Cap Growth Fund:
Opinions on the Financial Statements
We have audited the accompanying statements of assets and liabilities, including the portfolios of investments, of Loomis Sayles Small Cap Value Fund (one of the funds constituting Loomis Sayles Funds I), and Loomis Sayles Small Cap Growth Fund and Loomis Sayles Small/Mid Cap Growth Fund (two of the funds constituting Loomis Sayles Funds II) (hereafter collectively referred to as the “Funds”) as of September 30, 2022, the related statements of operations for the year ended September 30, 2022, the statements of changes in net assets for each of the two years in the period ended September 30, 2022, including the related notes, and the financial highlights for each of the periods indicated therein (collectively referred to as the “financial statements”). In our opinion, the financial statements present fairly, in all material respects, the financial position of each of the Funds as of September 30, 2022, the results of each of their operations for the year then ended, the changes in each of their net assets for each of the two years in the period ended September 30, 2022 and each of the financial highlights for each of the periods indicated therein in conformity with accounting principles generally accepted in the United States of America.
Basis for Opinions
These financial statements are the responsibility of the Funds’ management. Our responsibility is to express an opinion on the Funds’ financial statements based on our audits. We are a public accounting firm registered with the Public Company Accounting Oversight Board (United States) (PCAOB) and are required to be independent with respect to the Funds in accordance with the U.S. federal securities laws and the applicable rules and regulations of the Securities and Exchange Commission and the PCAOB.
We conducted our audits of these financial statements in accordance with the standards of the PCAOB. Those standards require that we plan and perform the audit to obtain reasonable assurance about whether the financial statements are free of material misstatement, whether due to error or fraud.
Our audits included performing procedures to assess the risks of material misstatement of the financial statements, whether due to error or fraud, and performing procedures that respond to those risks. Such procedures included examining, on a test basis, evidence regarding the amounts and disclosures in the financial statements. Our audits also included evaluating the accounting principles used and significant estimates made by management, as well as evaluating the overall presentation of the financial statements. Our procedures included confirmation of securities owned as of September 30, 2022 by correspondence with the custodian, transfer agent and brokers; when replies were not received from brokers, we performed other auditing procedures. We believe that our audits provide a reasonable basis for our opinions.
/s/PricewaterhouseCoopers LLP
Boston, Massachusetts
November 21, 2022
We have served as the auditor of one or more investment companies in the Natixis Investment Company Complex since at least 1995. We have not determined the specific year we began serving as auditor.
| 44
2022 U.S. Tax Distribution Information to Shareholders (Unaudited)
Corporate Dividends Received Deduction. For the fiscal year ended September 30, 2022, a percentage of dividends distributed by the Fund listed below qualifies for the dividends received deduction for corporate shareholders. This percentage is as follows:
| | | | |
Fund | | Qualifying Percentage | |
Small Cap Value Fund | | | 74.14% | |
Capital Gains Distributions. Pursuant to Internal Revenue Section 852(b), the following Funds paid distributions, which have been designated as capital gains distributions for the fiscal year ended September 30, 2022, unless subsequently determined to be different.
| | | | |
Fund | | Amount | |
Small Cap Growth Fund | | $ | 483,896,328 | |
Small Cap Value Fund | | | 91,874,834 | |
Small/Mid Cap Growth Fund | | | 8,249,449 | |
Qualified Dividend Income. For the fiscal year ended September 30, 2022, the Funds below will designate up to the maximum amount allowable pursuant to the Internal Revenue Code as qualified dividend income eligible for reduced tax rates. These lower rates range from 0% to 20% depending on an individual’s tax bracket. If the Funds pay a distribution during calendar year 2022, complete information will be reported in conjunction with Form 1099-DIV.
| | | | |
Fund | | | |
Small Cap Value Fund | | | | |
45 |
Trustee and Officer Information
The tables below provide certain information regarding the Trustees and officers of Loomis Sayles Funds I and Loomis Sayles Funds II (the “Trusts”). Unless otherwise indicated, the address of all persons below is 888 Boylston Street, Suite 800, Boston, MA 02199-8197. The Funds’ Statements of Additional Information include additional information about the Trustees of the Trusts and is available by calling Loomis Sayles Funds at 800-633-3330.
| | | | | | | | |
| Name and Year of Birth | | Position(s)
Held with
the Trusts, Length
of Time Served and Term of Office1 | | Principal Occupation(s)
During Past 5 Years | | Number of Portfolios in
Fund Complex Overseen2
and Other Directorships
Held During
Past 5 Years | | Experience, Qualifications, Attributes, Skills for Board Membership |
|
Independent Trustees |
Edmond J. English
(1953) | | Trustee since 2013 Chairperson of the Governance Committee and Contract Review Committee Member | | Executive Chairman of Bob’s Discount Furniture (retail) | | 54
Director, Burlington Stores, Inc. (retail) and Director, Rue Gilt Groupe, Inc. (e-commerce retail) | | Significant experience on the Board and on the boards of other business organizations (including retail companies and a bank); executive experience (including at a retail company) |
| | | | |
Richard A. Goglia
(1951) | | Trustee since 2015 Contract Review Committee Member and Governance Committee Member | | Retired | | 54
Formerly, Director of Triumph Group (aerospace industry) | | Significant experience on the Board and executive experience (including his role as vice president and treasurer of a defense company and experience at a financial services company) |
| | | | |
Wendell J. Knox
(1948) | | Trustee since 2009 Chairperson of the Contract Review Committee | | Retired | | 54
Director, Abt Associates Inc. (research and consulting); Director, The Hanover Insurance Group (property and casualty insurance); Formerly, Director, Eastern Bank (bank) | | Significant experience on the Board and on the boards of other business organizations (including at a bank and at a property and casualty insurance firm); executive experience (including roles as president and chief executive officer of a research and consulting company) |
| | | | |
Martin T. Meehan
(1956) | | Trustee since 2012 Contract Review Committee Member and Governance Committee Member | | President, University of Massachusetts | | 54
None | | Significant experience on the Board and on the boards of other business organizations; experience as President of the University of Massachusetts; government experience (including as a member of the U.S. House of Representatives); academic experience |
| 46
| | | | | | | | |
| Name and Year of Birth | | Position(s)
Held with
the Trusts, Length
of Time Served and Term of Office1 | | Principal Occupation(s)
During Past 5 Years | | Number of Portfolios in
Fund Complex Overseen2
and Other Directorships
Held During
Past 5 Years | | Experience, Qualifications, Attributes, Skills for Board Membership |
Maureen B. Mitchell
(1951) | | Trustee since 2017 Audit Committee Member and Governance Committee Member | | Retired | | 54
Director, Sterling Bancorp (bank) | | Significant experience on the Board; financial services industry and executive experience (including role as president of global sales and marketing at a financial services company) |
| | | | |
James P. Palermo
(1955) | | Trustee since 2016 Audit Committee Member | | Founding Partner, Breton Capital Management, LLC (private equity); Partner, STEP Partners, LLC (private equity) | | 54
Director, FutureFuel.io (chemicals and biofuels) | | Significant experience on the Board; financial services industry and executive experience (including roles as chief executive officer of client management and asset servicing for a banking and financial services company) |
| | | | |
Erik R. Sirri
(1958) | | Chairperson of the Board of Trustees since January 2021 Trustee since 2009 Ex Officio member of the Audit Committee, Contract Review Committee and Governance Committee | | Professor of Finance at Babson College | | 54
None | | Significant experience on the Board; experience as Director of the Division of Trading and Markets at the Securities and Exchange Commission; academic experience; training as an economist |
| | | | |
Peter J. Smail
(1952) | | Trustee since 2009 Audit Committee Member | | Retired | | 54
None | | Significant experience on the Board; mutual fund industry and executive experience (including roles as president and chief executive officer for an investment adviser) |
| | | | |
Kirk A. Sykes
(1958) | | Trustee since 2019 Audit Committee Member and Governance Committee Member | | Managing Director of Accordia Partners, LLC (real estate development); President of Primary Corporation (real estate development); Managing Principal of Merrick Capital Partners (infrastructure finance) | | 54
Advisor Eastern Bank (bank); Director, Apartment Investment and Management Company (real estate investment trust); formerly Director, Ares Commercial Real Estate Corporation (real estate investment trust) | | Experience on the Board and significant experience on the boards of other business organizations (including real estate companies and banks) |
| | | | |
Cynthia L. Walker
(1956) | | Trustee since 2005 Chairperson of the Audit Committee | | Retired; Formerly, Deputy Dean for Finance and Administration, Yale University School of Medicine | | 54
None | | Significant experience on the Board; executive experience in a variety of academic organizations (including roles as dean for finance and administration) |
47 |
| | | | | | | | |
| Name and Year of Birth | | Position(s)
Held with
the Trusts, Length
of Time Served and Term of Office1 | | Principal Occupation(s)
During Past 5 Years | | Number of Portfolios in
Fund Complex Overseen2
and Other Directorships
Held During
Past 5 Years | | Experience, Qualifications, Attributes, Skills for Board Membership |
|
Interested Trustees |
Kevin P. Charleston3
(1965) One Financial Center Boston, MA 02111 | | Trustee since 2015 President and Chief Executive Officer of Loomis Sayles Funds I since 2015 | | President, Chief Executive Officer and Chairman of the Board of Directors, Loomis, Sayles & Company, L.P. | | 54
None | | Significant experience on the Board; continuing service as President, Chief Executive Officer and Chairman of the Board of Directors of Loomis, Sayles & Company, L.P. |
| | | | |
David L. Giunta4
(1965) | | Trustee since 2011 President of Loomis Sayles Funds II and Executive Vice President of Loomis Sayles Funds I since 2008; Chief Executive Officer of Loomis Sayles Funds II since 2015 | | President and Chief Executive Officer, Natixis Advisors, LLC and Natixis Distribution, LLC | | 54 None | | Significant experience on the Board; experience as President and Chief Executive Officer of Natixis Advisors, LLC and Natixis Distribution, LLC |
| 1 | Each Trustee serves until retirement, resignation or removal from the Board. The current retirement age is 75. The position of Chairperson of the Board is appointed for a three-year term. |
| 2 | The Trustees of the Trusts serve as Trustees of a fund complex that includes all series of the Natixis Funds Trust I, Natixis Funds Trust II, Natixis Funds Trust IV, Gateway Trust, Loomis Sayles Funds I, Loomis Sayles Funds II, Natixis ETF Trust and Natixis ETF Trust II (collectively, the “Fund Complex”). |
| 3 | Mr. Charleston is deemed an “interested person” of the Trusts because he holds the following positions with an affiliated person of the Trusts: President, Chief Executive Officer and Chairman of the Board of Directors of Loomis, Sayles & Company, L.P. |
| 4 | Mr. Giunta is deemed an “interested person” of the Trusts because he holds the following positions with an affiliated person of the Trusts: President and Chief Executive Officer, Natixis Advisors, LLC and Natixis Distribution, LLC. |
| | | | | | |
| Name and Year of Birth | | Position(s)
Held with
the Trusts | | Term of Office1
and Length of
Time Served | | Principal Occupation(s)
During Past 5 Years2 |
|
Officers of the Trusts |
Matthew Block (1981) | | Treasurer, Principal Financial and Accounting Officer | | Since 2022 | | Senior Vice President, Natixis Advisors, LLC and Natixis Distribution, LLC; formerly, Vice President, Natixis Advisors, LLC and Natixis Distribution, LLC; Assistant Treasurer of the Fund Complex; Managing Director, State Street Bank and Trust Company; Senior Manager, PricewaterhouseCoopers, LLC |
| | | |
Susan McWhan Tobin (1963) | | Secretary and Chief Legal Officer | | Since 2022 | | Executive Vice President, General Counsel and Secretary, Natixis Advisors, LLC and Natixis Distribution, LLC; formerly, Executive Vice President and Chief Compliance Officer of Natixis Investment Managers (March 2019– May 2022) and Senior Vice President and Head of Compliance, US for Natixis Investment Managers (July 2011–March 2019) |
| | | |
Natalie R. Wagner (1979) | | Chief Compliance Officer, Assistant Secretary and Anti-Money Laundering Officer | | Since 2021 | | Senior Vice President, Natixis Advisors, LLC and Natixis Distribution, LLC; formerly, Vice President, Head of Corporate Compliance, Global Atlantic Financial Group |
| 1 | Each officer of the Trusts serves for an indefinite term in accordance with the Trusts’ current by-laws until the date his or her successor is elected and qualified, or until he or she sooner dies, retires, is removed or becomes disqualified. |
| 2 | Each person listed above, except as noted, holds the same position(s) with the Fund Complex. Previous positions during the past five years with Natixis Distribution, LLC, Natixis Advisors, LLC or Loomis, Sayles & Company, L.P. are omitted, if not materially different from an officer’s current position with such entity. |
| 48
(b) Not Applicable.
Item 2. Code of Ethics.
The Registrant has adopted a code of ethics that applies to the Registrant’s principal executive officer, principal financial officer and persons performing similar functions. There have been no amendments or waivers of the Registrant’s code of ethics during the period.
Item 3. Audit Committee Financial Expert.
The Board of Trustees of the Registrant has established an audit committee. Ms. Maureen Mitchell, Mr. James Palermo, Mr. Peter Smail, Mr. Kirk A. Sykes and Ms. Cynthia L. Walker are members of the audit committee and have been designated as “audit committee financial experts” by the Board of Trustees. Each of these individuals is also an Independent Trustee of the Registrant.
Item 4. Principal Accountant Fees and Services.
Fees billed by the Principal Accountant for services rendered to the Registrant.
The table below sets forth fees billed by the principal accountant, PricewaterhouseCoopers LLP, for the past two fiscal years for professional services rendered in connection with a) the audit of the Registrant’s annual financial statements and services provided in connection with regulatory filings; b) audit-related services (including services that are reasonably related to the performance of the audit of the Registrant’s financial statements but not reported under “Audit Fees”); c) tax compliance, tax advice and tax planning and d) all other fees billed for professional services rendered by the principal accountant to the Registrant, other than the services reported as a part of (a) through (c) of this Item.
| | | | | | | | | | | | | | | | | | | | | | | | | | | | | | | | |
| | | Audit fees | | | Audit-related fees1 | | | Tax fees2 | | | All other fees | |
| | | 10/1/20-
9/30/21 | | | 10/1/21-
9/30/22 | | | 10/1/20-
9/30/21 | | | 10/1/21-
9/30/22 | | | 10/1/20-
9/30/21 | | | 10/1/21-
9/30/22 | | | 10/1/20-
9/30/21 | | | 10/1/21-
9/30/22 | |
Loomis Sayles Funds II | | $ | 253,570 | | | $ | 268,783 | | | $ | 3,828 | | | $ | 3,489 | | | $ | 81,725 | | | $ | 71,349 | | | $ | — | | | $ | — | |
| | 1. | Audit-related fees consist of: |
| | 2021 | & 2022 – performance of agreed-upon procedures related to the Registrant’s deferred compensation plan. |
2021 & 2022 – review of Registrant’s tax returns
2021 & 2022 - filings with the French tax authorities to reclaim taxes withheld on dividend income received from French resident companies
Aggregate fees billed to the Registrant for non-audit services during 2021 and 2022 were $85,553 and $74,838, respectively.
Fees billed by the Principal Accountant for services rendered to the Adviser and Control Affiliates.
The following table sets forth the fees billed by the Registrant’s principal accountant for non-audit services rendered to Loomis, Sayles & Company, L.P. and entities controlling, controlled by or under common control with Loomis, Sayles & Company, L.P. Registrant (“Control Affiliates”) that provide ongoing services to the Registrant, for engagements that related directly to the operations and financial reporting of the Registrant for the last two fiscal years.
| | | | | | | | | | | | | | | | | | | | | | | | |
| | | Audit-related fees | | | Tax fees | | | All other fees | |
| | | 10/1/20-
9/30/21 | | | 10/1/21-
9/30/22 | | | 10/1/20-
9/30/21 | | | 10/1/21-
9/30/22 | | | 10/1/20-
9/30/21 | | | 10/1/21-
9/30/22 | |
Control Affiliates | | $ | — | | | $ | — | | | $ | — | | | $ | — | | | $ | — | | | $ | 50,000 | |
The following table sets forth the aggregate fees billed by the Registrant’s principal accountant for non-audit services rendered to Loomis, Sayles & Company, L.P. and Control Affiliates that provide ongoing services to the Registrant, for the last two fiscal years, including the fees disclosed in the table above.
| | | | | | | | |
| | | Aggregate Non-Audit Fees | |
| | | 10/1/20-9/30/21 | | | 10/1/21-9/30/22 | |
Control Affiliates | | $ | 972 | | | $ | 50,000 | |
None of the services described above were approved pursuant to (c)(7)(i)(C) of Regulation S-X.
Audit Committee Pre Approval Policies.
Annually, the Registrant’s Audit Committee reviews the audit, audit-related, tax and other non-audit services together with the projected fees, for services proposed to be rendered to the Registrant and/or other entities for which pre-approval is required during the upcoming year. Any subsequent revisions to already pre-approved services or fees (including fee increases) and requests for pre-approval of new services would be presented for consideration quarterly as needed.
If, in the opinion of management, a proposed engagement by the Registrant’s independent accountants needs to commence before the next regularly scheduled Audit Committee meeting, any member of the Audit Committee who is an independent Board member is authorized to pre-approve the engagement, but only for engagements to provide audit, audit related and tax services. This approval is subject to review of the full Audit Committee at its next quarterly meeting. All other engagements require the approval of all the members of the Audit Committee.
Item 5. Audit Committee of Listed Registrants.
Not applicable.
Item 6. Schedule of Investments.
Included as part of the Report to Shareholders filed as Item 1 herewith.
Item 7. Disclosure of Proxy Voting Policies and Procedures for Closed-End Management Investment Companies.
Not applicable.
Item 8. Portfolio Managers of Closed-End Management Investment Companies
Not applicable.
Item 9. Purchases of Equity Securities by Closed-End Management Investment Companies and Affiliated Purchasers.
Not applicable.
Item 10. Submission of Matters to a Vote of Securities Holders.
There were no material changes to the procedures by which shareholders may recommend nominees to the Registrant’s Board of Trustees.
Item 11. Controls and Procedures.
The Registrant’s principal executive officer and principal financial officer have concluded that the Registrant’s disclosure controls and procedures are sufficient to ensure that information required to be disclosed by the Registrant in this Form N-CSR was recorded, processed, summarized and reported within the time periods specified in the Securities and Exchange Commission’s rules and forms, based upon such officers’ evaluation of these controls and procedures as of a date within 90 days of the filing date of the report.
There were no changes in the Registrant’s internal control over financial reporting that occurred during the period covered by the report that have materially affected, or is reasonably likely to materially affect, the Registrant’s internal control over financial reporting.
Item 12. Disclosure of Securities Lending Activities for Closed-End Management Investment Companies.
Not applicable.
Item 13. Exhibits.
SIGNATURES
Pursuant to the requirements of the Securities Exchange Act of 1934 and the Investment Company Act of 1940, the Registrant has duly caused this report to be signed on its behalf by the undersigned, thereunto duly authorized.
| | |
| Loomis Sayles Funds II |
| |
| By: | | /s/ David L. Giunta |
| |
| Name: | | David L. Giunta |
| Title: | | President and Chief Executive Officer |
| Date: | | November 21, 2022 |
Pursuant to the requirements of the Securities Exchange Act of 1934 and the Investment Company Act of 1940, this report has been signed by the following persons on behalf of the Registrant and in the capacities and on the dates indicated.
| | |
| By: | | /s/ David L. Giunta |
| |
| Name: | | David L. Giunta |
| Title: | | President and Chief Executive Officer |
| Date: | | November 21, 2022 |
| |
| By: | | /s/ Matthew Block |
| |
| Name: | | Matthew Block |
| Title: | | Treasurer and Principal Financial and Accounting Officer |
| Date: | | November 21, 2022 |