UNITED STATES
SECURITIES AND EXCHANGE COMMISSION
Washington, D.C. 20549
FORM N-CSR
CERTIFIED SHAREHOLDER REPORT OF REGISTERED
MANAGEMENT INVESTMENT COMPANIES
Investment Company Act file number: 811-06241
Loomis Sayles Funds II
(Exact name of Registrant as specified in charter)
888 Boylston Street, Suite 800 Boston, Massachusetts 02199-8197
(Address of principal executive offices) (Zip code)
Susan McWhan Tobin, Esq.
Natixis Distribution, LLC
888 Boylston Street, Suite 800
Boston, Massachusetts 02199-8197
(Name and address of agent for service)
Registrant’s telephone number, including area code: (617) 449-2139
Date of fiscal year end: December 31
Date of reporting period: December 31, 2023
Item 1. Reports to Stockholders.
(a) The Registrant’s annual report transmitted to shareholders pursuant to Rule 30e-1 under the Investment Company Act of 1940 is as follows:
Annual Report
December 31, 2023
Loomis Sayles International Growth Fund |
|
Natixis Oakmark International Fund |
Natixis U.S. Equity Opportunities Fund |
Vaughan Nelson Mid Cap Fund |
Vaughan Nelson Small Cap Value Fund |
IMPORTANT NOTICE TO SHAREHOLDERS
The Securities and Exchange Commission (SEC) has adopted new regulations that will result in changes to the design and delivery of annual and semiannual shareholder reports. Beginning in July 2024, Funds will be required by the SEC to send shareholders a paper copy of a new tailored shareholder report in place of the full shareholder report that is currently being provided. If you would like to receive shareholder reports and other communications from the Funds electronically, instead of by mail, you may make that request at www.icsdelivery.com/natixisfunds. If you have already elected to receive shareholder reports electronically, you will not be affected by this change, and you need not take any action.
Loomis Sayles International Growth Fund
|
Aziz V. Hamzaogullari, CFA® |
Loomis, Sayles & Company, L.P.
|
Investment GoalThe Fund's investment goal is long-term growth of capital.
Market Conditions
International equities delivered strong, double-digit total returns in 2023, with much of the gain occurring in November and December. The asset class generally performed well in the first half of the year, with stocks trending higher in choppy trade amid expectations that central banks’ interest-rate increases were largely nearing their conclusion. Sentiment shifted in the third quarter, however, as worries mounted that central banks would need to keep interest rates “higher for longer.” The international equity markets experienced a protracted decline in the August-October time frame as a result, bringing the major international indexes back near the levels where they began the year. The outlook changed yet again in November, when a series of weaker-than-expected inflation reports and comments from U.S. Federal Reserve officials indicated that not only were interest-rate increases largely concluded, but also that rate cuts were likely to begin as soon as the first half of 2024. Stocks rose in response, helping the key indexes finish December near their highs for the year.
The European markets were a key driver of performance for the broader asset class. Economic growth in the region exceeded the depressed expectations that existed coming into 2023, when concerns about the effects of the war in Ukraine remained at the forefront. Italy and Spain were top performers in Europe, as were the larger markets of Germany and France. The Asian markets, while posting gains, lagged somewhat due to the more proximate impact of China’s sub-par growth.
Performance Results
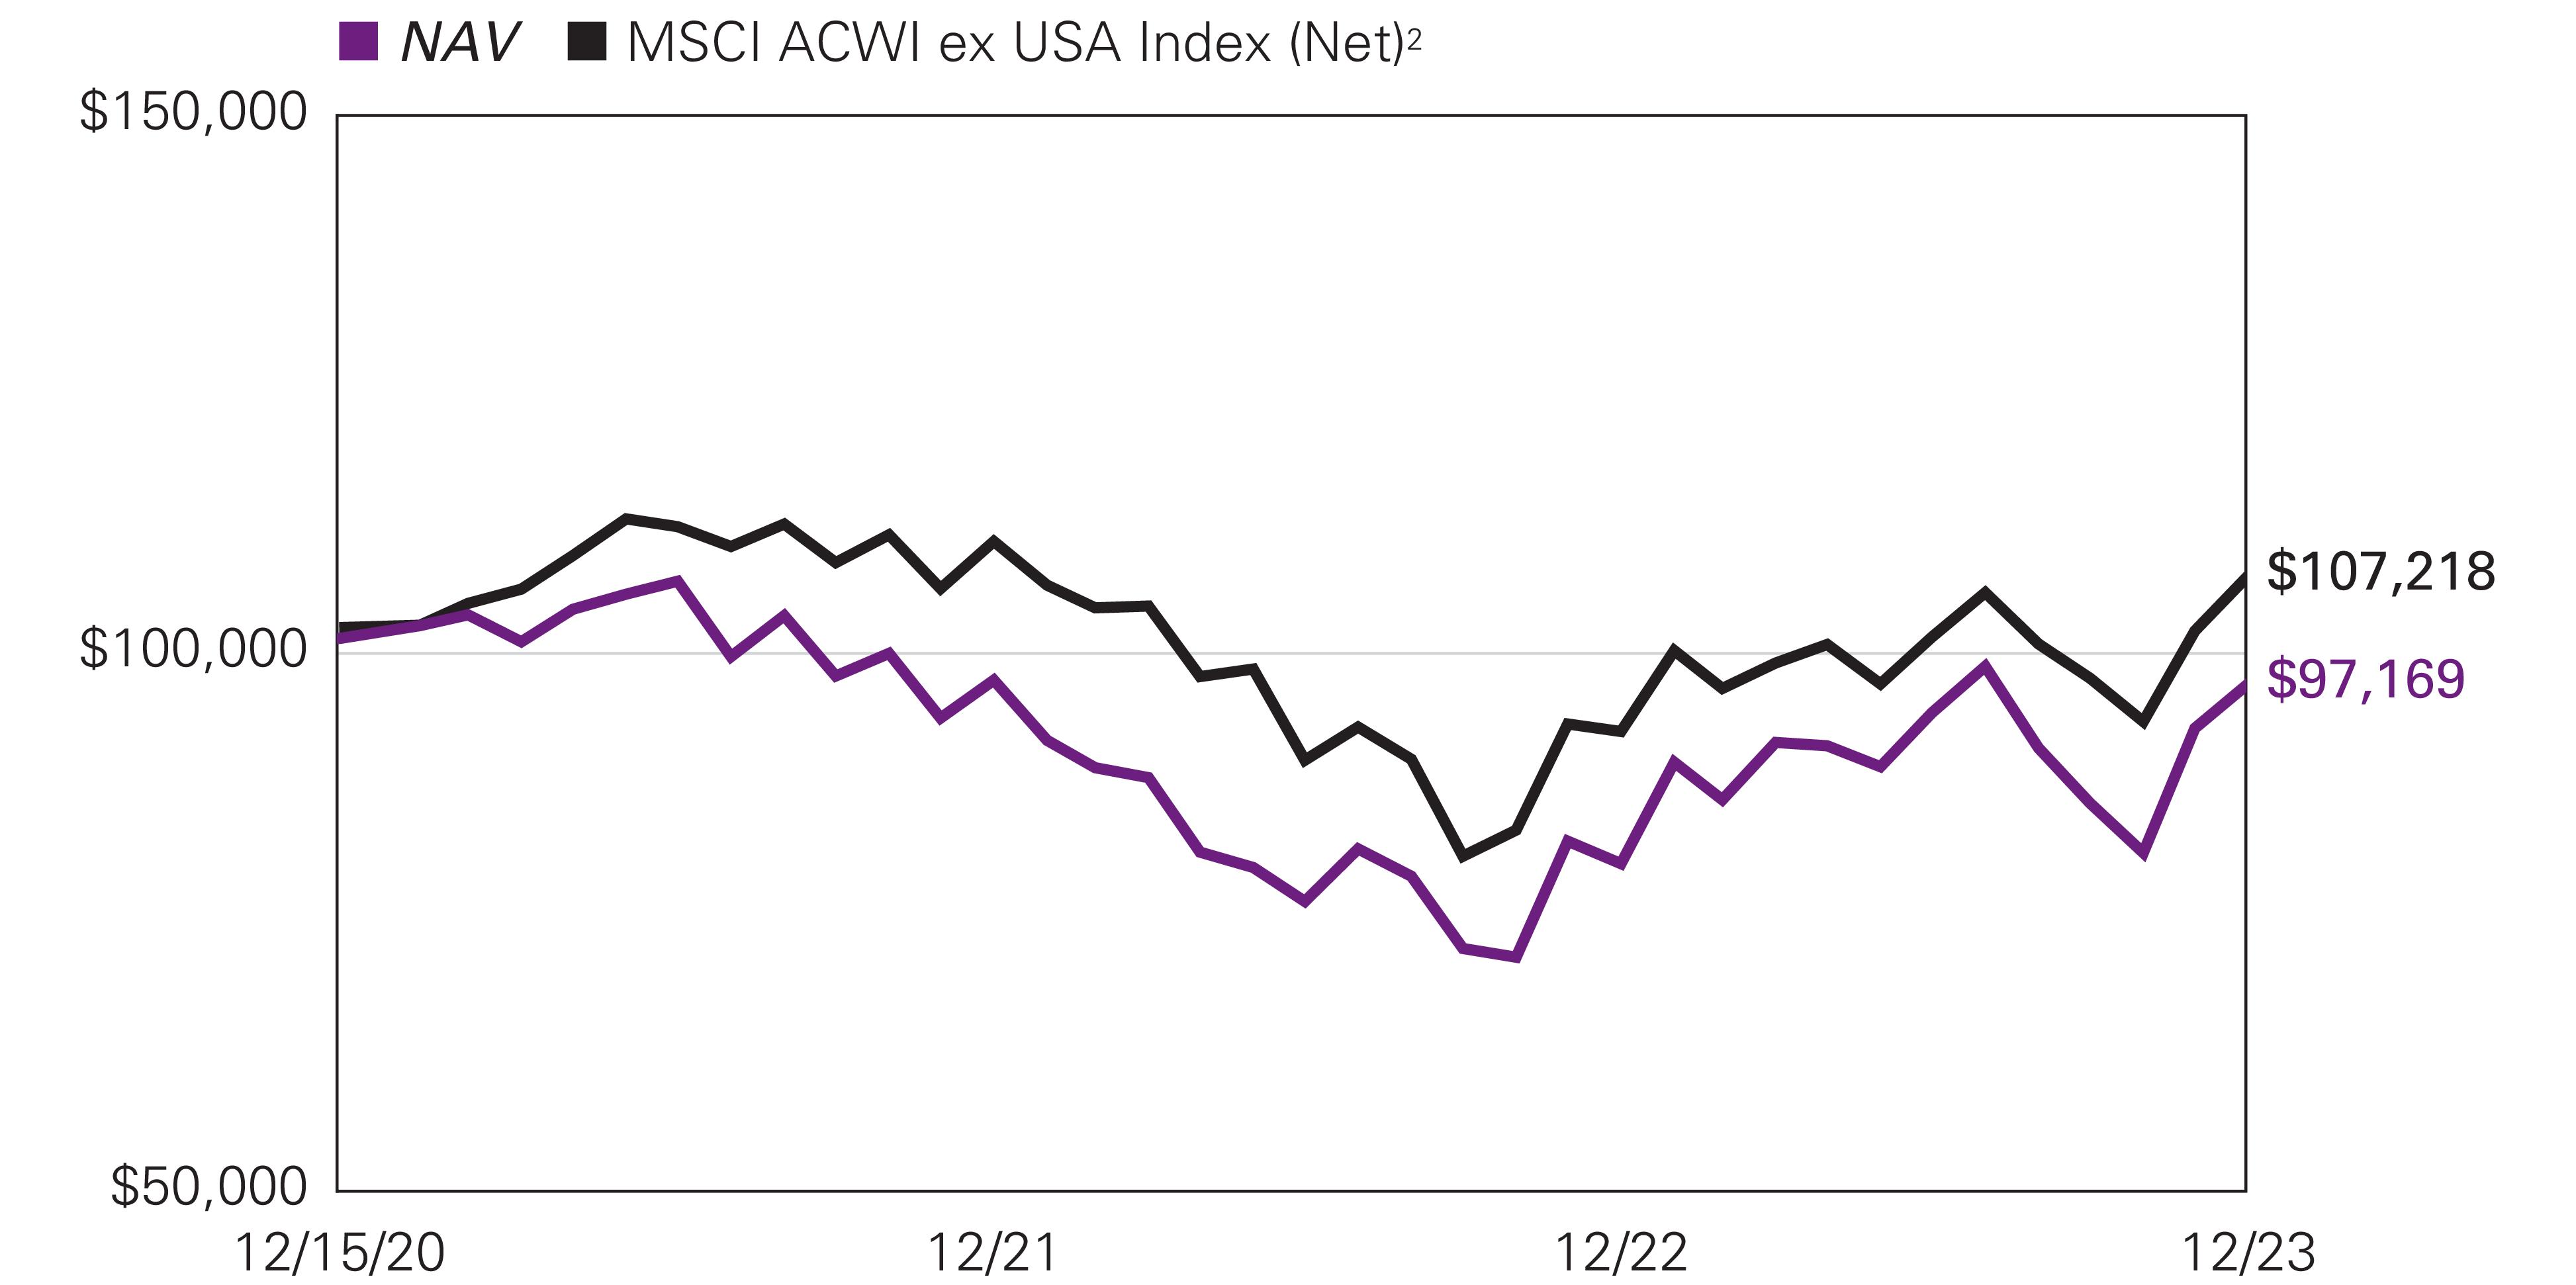
For the 12 months ended December 31, 2023, Class Y shares of the Loomis Sayles International Growth Fund returned 20.81% at net asset value. The Fund outperformed its benchmark, the MSCI All Country World Index ex USA Index (Net), which returned 15.62%.
Explanation of Fund Performance
We are an active manager with a long-term, private equity approach to investing. Through our proprietary bottom-up research framework, we look to invest in those few high-quality businesses with sustainable competitive advantages and profitable growth when they trade at a significant discount to intrinsic value. Given the rare confluence of quality, growth, and valuation, we may study dozens of companies but may only invest in a select few businesses each year. We believe identifying those few businesses with such characteristics is an art, not a science. As a result of this rigorous approach, ours is a selective, high-conviction portfolio of typically 30–45 names.
The Fund’s positions in MercadoLibre, Novo Nordisk, and WiseTech Global contributed the most to performance. Stock selection in the consumer discretionary, information technology, and healthcare sectors, along with our allocations in the information technology sector, contributed positively to relative performance.
MercadoLibre is the largest online commerce platform in Latin America. The company offers its users an ecosystem of six integrated e-commerce services that include its marketplace, payment and fintech solutions, shipping and logistics, advertising, classified listings, and merchant web services. The company operates in 18 countries representing the vast majority of Latin American GDP, and its 148 million active users in 2022 represented approximately 30% of the region’s estimated 480 million internet users. We believe MercadoLibre benefits from strong and sustainable competitive advantages that include its network and ecosystem, brand, and understanding of local markets that collectively contribute to its leadership position in each market it serves. A Fund holding since inception, the company delivered strong revenue growth that was consistently above consensus expectations, driven by growth in gross merchandise volume and payments, and continued market share gains in both e-commerce and payments. MercadoLibre remains in an elevated investment cycle to build out a more powerful ecosystem focused on greater product selection, easier payment options, wider credit availability, and lower cost and faster speed of delivery. The company also expects to increase its investments in several areas, including first-party sales, an improved loyalty program, and advertising technology. While these investments impact near-term profitability, operating margins still expanded substantially and exceeded expectations throughout the period, and we believe the investments have contributed to market share gains in e-commerce and payments and a stronger competitive position. We believe management remains focused on balancing the investments needed to further improve user experience and extend the company’s
Loomis Sayles International Growth Fund
leadership in e-commerce and payments, while maintaining a sustainable and profitable financial model. With continued growth in internet access, increasing availability of credit, and the company’s continuing investments to improve the ease and convenience of transacting online, we believe MercadoLibre remains well positioned for sustained growth over the next decade, driven by the secular growth of e-commerce across Latin America. Over our forecast period, we believe the penetration of e-commerce can more than double, which would bring the penetration rate into the mid-20% level. We believe the current market price embeds expectations for key revenue and cash flow growth drivers that are well below our long-term assumptions. As a result, we believe the shares trade at a significant discount to our estimate of intrinsic value and offer a compelling long-term reward-to-risk opportunity.
Headquartered in Denmark, Novo Nordisk is a global healthcare company with 100 years of innovation and leadership in diabetes care. Over this time, Novo has amassed unparalleled experience in the biology of diabetes, expertise in protein science, and developed significant competitive advantages as a result. Its diabetes products have captured approximately one-third of the global branded diabetes care market, which along with its first-mover position in related obesity therapies account for over 90% of the company’s annual revenues. We believe Novo’s strong and sustainable advantages include its deep experience in diabetes care and therapeutic proteins, strong infrastructure that took decades to build, efficient manufacturing techniques, robust pipeline, and economies of scale. A Fund holding since inception, shares have been up strongly since early August when the company released results from a five-year cardiovascular outcomes trial for Wegovy, the company’s newest GLP-1 treatment for obesity. Among non-type 2 diabetes obese patients with established cardiovascular (CV) disease, the therapy resulted in a 20% decrease in CV events such as CV death, heart attack, and stroke, versus the placebo. The 17,500-person trial represents the first study evaluating the longer-term benefits that GLP-1 therapies can provide to an obese population. The company’s financial results also reflected strong execution as year-to-date sales rose 33% year over year, driven by strong uptake in GLP-1 therapies across both its diabetes and obesity-care franchises, and operating profit grew 37%. The GLP-1 class of therapies are a quickly growing class of medications that while first documented in 1987, were first approved for type-2 diabetes in 2005 and later for obesity in 2014. The therapies are currently being tested in a range of comorbidities including heart failure, sleep apnea, NASH (nonalcoholic steatohepatitis), and kidney disease. In the diabetes indication, GLP-1 sales grew 49% year over year, contributing to the company’s nearly 55% total GLP-1 market share. In addition to targeting diabetes with its GLP-1s, in 2021, Novo received approval for semaglutide (the same molecule behind its leading diabetes therapies, Ozempic and Rybelsus) in the obesity setting under the brand name Wegovy. While operational challenges limited the initial production of Wegovy, the company is seeing robust early demand which contributed to 174% year-to-date sales growth in its nascent obesity care franchise. Diabetes is a global epidemic with an estimated population of 530 million. The market has been growing annually in the low double digits over the last ten years, driven by aging of the global population and increasing obesity. Further, there are estimated to be almost 500 million non-diabetic obese people globally who may benefit from Novo’s therapies. We believe Novo’s deep experience in diabetes care and leadership in the nascent obesity market, differentiated product suite, and leading innovation should enable the company to grow revenues and free cash flow in the low double digits over our long-term investment horizon. We believe the company’s shares continue to sell at a meaningful discount to our estimate of intrinsic value and offer an attractive reward-to-risk opportunity.
Wisetech Global is the leading software solutions provider to the global logistics industry. Founded in 1994 to provide freight-forwarding and customs software to the Australian logistics industry, Wisetech solutions are used in whole or in part by over 85% of the world’s 50 largest third-party logistics providers (3PLs) and almost all of the 25 largest freight forwarders, led by the company’s primary SAAS (software-as-a-service) platform, CargoWise One. From a single unified platform, the company offers function-specific and enterprise-wide modules that support the complex international movement of goods and create substantial efficiencies for its logistics clients. The company’s vision is to become the world’s operating system for global logistics. A holding since Fund inception, Wisetech reported financial results for its 2023 fiscal year ended June 2023 that reflected continued strong penetration of its end markets and organic revenue growth in excess of 20%. After having substantially slowed its pace of acquisition activity in recent quarters, the company announced two sizeable acquisitions in landside logistics earlier in the year, which continued to expand the company’s capabilities outside of forwarding to execute on its strategy of building a universal operating system for global logistics. However, shares pulled back midyear after the company disclosed that it expects the acquisitions to depress its operating margins for the next few years. We do not believe the decline in margins is structural, and in our view, the company continues to execute well on its long-term strategic vision. Outside of its acquisition activity, the company showed continued growth among its existing client base, with every calendar-year cohort of new clients going back to 2006 showing growth over the prior year, continuing a multi-year trend. We believe Wisetech benefits from strong and sustainable competitive advantages that include an installed client base with high switching costs, its freight-forwarding industry expertise, significant investments in research and development, its brand, and network. We believe Wisetech will benefit from secular growth in logistics software and services as companies increasingly move towards outsourcing and away from less effective in-house solutions. With virtually no comparable off-the-shelf competition to its unified global platform, Wisetech is the dominant market share leader in its legacy freight-forwarding market. We estimate the company now captures over 20% share of its addressable freight forwarding market, up from the mid-single digits five years ago, with gains coming at the expense of proprietary solutions or competitor offerings that addressed only limited industry functions or geographies. Through underlying industry growth, continued market share gains in its legacy freight-forwarding market, and ongoing penetration of other
Loomis Sayles International Growth Fund
parts of the logistics industry performed by 3PLs, including warehouse management, land transportation, and cargo handling, we believe the company can generate compounded annual revenue growth of approximately 20% over our long-term investment horizon, with faster growth in operating profits and free cash flow as the company benefits from scale and operating leverage. Prior to the share price drop that followed the company’s lowered margin guidance, we meaningfully trimmed our position in the company, which had been our largest position at the time. We continue to believe the expectations embedded in Wisetech’s share price underestimate the company’s superior positioning and the sustainability of its growth. As a result, we believe the shares trade at a discount to our estimate of intrinsic value and represent an attractive reward-to-risk opportunity.
The Fund’s positions in Yum China, Budweiser Brewing APAC, and Doximity detracted the most from performance. Stock selection in the consumer staples, industrials, and communication services sectors, as well as our allocations in the consumer staples, healthcare, industrials, consumer discretionary, financials, and communication services sectors, detracted from relative performance.
Yum China is the largest restaurant company in China, operating over 14,000 restaurants primarily under the KFC and Pizza Hut brands. A Fund holding since inception, Yum China reported financial and operating results throughout the period that we believe reflected the company’s success in navigating a challenging China consumer spending environment that was still impacted by Covid-19 and related restrictions in the early part of the year. Shares responded negatively to the company’s most recent quarterly financial results that were below consensus expectations, despite including record revenues, operating profits, and net new store openings. The company observed a noticeable slowdown in consumer traffic in September 2023 that continued into the fourth quarter as macroeconomic weakness persists and more local competitors have returned to the market as China continues to normalize post Covid. This near-term economic weakness does not affect our structural investment thesis for the company, which continues to expand into lower-tier cities while consistently innovating to sustain consumer purchases – especially among its over 460 million loyalty members. We also believe the company has the products and scale to offer increasingly value-conscious consumers attractive food options at all price points. We believe Yum China’s strong and sustainable competitive advantages include its exclusive license to operate and franchise two of the most prominent restaurant brands in China, the scale of its distribution and supply chain infrastructure, a first-mover advantage in real estate procurement, which allows the company to identify the best locations with respect to traffic flow and thereby offer the most convenient service, and decades of experience in restaurant operations. The Chinese economy is transitioning to a consumption-driven economy, following a path similar to that of other developing economies. We believe this will fuel future consumption spending, including expenditures in restaurants, as food options such as Pizza Hut and KFC become increasingly affordable to an emerging middle class with rising levels of disposable income. With its iconic brands, large and complex supply chain infrastructure, and real estate procurement expertise, we believe Yum China remains well positioned to benefit from the secular growth of consumer spending on restaurants in China. We believe the current market price embeds expectations for free cash flow growth that are well below our long-term estimates. As a result, we believe the company is selling at a significant discount to our estimate of intrinsic value, and offers a compelling reward-to-risk opportunity.
Budweiser Brewing Company APAC Ltd (Bud APAC) is the Asia-Pacific division of Anheuser-Busch InBev (AB InBev), the world’s largest beer brewer and distributor. The company became a publicly traded entity following its September 2019 initial public offering (IPO) and remains 87% owned by AB InBev. Bud APAC is the market share leader in its two largest markets, China and South Korea, which account for over 90% of revenues. The company sells over 50 brands across all segments of the beer market, but is focused on the premium segments where it is the regional leader. We believe Bud APAC’s strong and sustainable competitive advantages include its portfolio of leading local and global beer brands, difficult-to-replicate global and local scale in manufacturing, and strong distribution capabilities, which contribute to leading regional market share. On a standalone basis, Bud APAC is one of the largest brewers in the world and over our long-term investment horizon, we believe it is among the best-positioned companies in the entire value chain. A Fund holding since inception, over the past year, Bud APAC demonstrated continued recovery from the impact of the pandemic on alcohol consumption in on-premise consumption channels – particularly in its largest country, China. However, the market reacted negatively to the company’s performance in South Korea, its second largest country, which accounts for approximately 20% of its EBITDA (earnings before interest, taxes, depreciation and amortization), and where it is the leader in a duopoly structure. The South Korea beer industry is facing material near-term headwinds as consumer spending has softened. This has resulted in industry growth slowing to what we believe is below the long-term structural growth rate. Coupled with high cost inflation, which the company is slowly recovering through both pricing and premiumization, Bud APAC has also experienced a decrease in profit margins. Over the long-term, we believe the beer industry will benefit from structural drivers that include growth in per capita consumption and premiumization. Today, premium beer represents only 25% of total volume in South Korea. We believe premium beer can approach 40% as in other developed markets and that margins will improve as the company continues to recoup inflation costs through price increases. We believe the secular growth opportunity for Bud APAC is long-term growth in Asia-Pacific emerging market spending on beer, in particular, China and India. Today, the Asia-Pacific beer markets in which Bud APAC is primarily focused, namely China, South Korea and India, represent an estimated $120 billion in annual retail spending, which has grown at a mid-single-digit percentage over the past decade. As a function of its numerous competitive advantages, over our long-term investment horizon, we believe the company can generate mid-single-digit growth in revenue, driven by mid-to-high single-digit
Loomis Sayles International Growth Fund
growth in China and India, and low single-digit growth in South Korea. With respect to profitability, we believe Bud APAC will benefit in all of its markets from premiumization, which improves the gross margin, greater efficiency within its sales and marketing expenditures, which are high when compared with AB InBev’s other regions, and operating leverage. Combining these drivers, we believe operating margins will expand and operating profits will thereby grow faster than revenue. In addition, as revenue growth outpaces stable capital expenditures and working capital efficiency further improves, we expect free cash flow will grow faster than revenues and profits. Over our investment time horizon, we believe free cash flow will grow at a mid-to-high single-digit compounded annual rate. We believe the share price embeds expectations that underestimate the long-term secular growth drivers and the company’s superior competitive position. As a result, we believe the shares are selling at a significant discount to our estimate of intrinsic value, representing a compelling reward-to-risk opportunity.
Doximity is a leading cloud-based platform specifically built for US medical professionals (“MPs”). The company was founded in 2010 and has grown to over 2 million members, including approximately 800,000 physicians representing every medical specialty. Doximity provides a single place for MPs to access productivity tools that enable collaboration with colleagues, secure coordination of patient care, virtual patient visits, customized medical news and research, and career management. Doximity is free to healthcare providers and monetizes its platform primarily by providing targeted marketing access to customers that are largely pharmaceutical manufacturers and healthcare systems, which accounted for over 90% of revenue in its most recent fiscal year. A portfolio holding since the first quarter of 2022, shares responded negatively to the company’s fiscal first quarter financial report in August. The company reported quarterly financial results that were fundamentally solid and in line with consensus expectations. However, management significantly lowered its full-year revenue guidance, implying 10% year-over-year growth versus a previous estimate of 20%. Doximity typically enters its fiscal year with approximately 60%-65% of subscription-based revenue already under contract, with a further 30%-35% generated through renewing and upselling existing customers – typically in the summer months. In 2023, the company experienced substantially lower upsell rates, which it attributed to slowing industry spending and the company’s “white-glove” approach to client sales that is more time-intensive than the programmatic banner advertising that captured share during the summer. We believe Doximity’s strong and sustainable competitive advantages include the power of its network, its “physicians first” focus, and its trusted reputation and brand. The company has firmly established itself as the de facto digital network for healthcare professionals, including over 80% of US physicians (up from 25% in 2013) and over 90% of graduating US medical students. Members average over 50 connections with Doximity colleagues, which drives utility through referrals, care coordination, knowledge exchange, and career management. A powerful network effect occurs as the number and engagement of members has increased; Doximity has more data to create engaging and useful products that are specifically tailored to physician workflows, which in turn drives higher membership and greater stickiness among users. Shares partially rebounded following the most recent earnings release in November 2023, which exceeded management’s guidance for revenue and operating profit, leading the company to modestly raise its full-year outlook. The company also reported that active workflow users reached record levels, as did the number of quarterly, monthly, weekly, and daily active users – suggesting continued strong levels of engagement among its physician user base. Notably, daily users grew the most, underscoring the integral role Doximity now plays in day-to-day patient care. Further, net revenue retention among the company’s 20 largest customers was 119%, versus 114% overall – indicating that its most sophisticated and engaged clients continue to be the company’s fastest growing customer cohort. We believe Doximity’s primary growth driver is the secular shift from traditional marketing channels to digital channels, specifically in healthcare, where digital spending has lagged due in part to a historic reliance on pharmaceutical sales representatives. Today, market intelligence firm IDC estimates less than 30% of healthcare advertising spending is via digital channels, versus 46% on an industry-wide basis and greater than 80% in industries such as computing, appliances, and media and entertainment. Given the superior return on investment (ROI) for digital advertising as opposed to traditional advertising, coupled with growing restrictions on the ability to gain access to key healthcare decision makers through traditional, in-person methods, we estimate that digital marketing expenditures will grow substantially over our long-term investment horizon to approach 50% of total healthcare advertising spending. As a physicians-first company, Doximity has historically allocated approximately 90% of its R&D (research and development) spending towards physician-facing products. The company intends to allocate a higher level of R&D spending to build client-facing technologies that enable advertising clients to more-seamlessly direct incremental advertising dollars akin to other successful ad platforms and which likely benefited less-advantaged banner advertising during the quarter. The company is currently beta testing a new self-service client portal that it expects to be ready in advance of the 2024 upsell season. With its commanding penetration among healthcare decision makers and superior ROIs for advertisers, we believe Doximity can grow its capture of the digital opportunity from approximately 5% today to exceed 25%. Over our long-term investment horizon, we believe the company can generate approximately 20% compounded annual growth in overall revenues. As the company further penetrates its existing market and gains scale, we believe it will benefit from operating leverage, and that operating profits and free cash flow will grow faster than revenue. We believe Doximity’s share price embeds expectations for key revenue and cash flow growth drivers that are well below our long-term assumptions. As a result, we believe the company is selling at a significant discount to our estimate of its intrinsic value and offers a compelling reward-to-risk opportunity. We added to our holdings in the company during the year.
All aspects of our quality-growth-valuation investment thesis must be present simultaneously for us to make an investment. Often our research is completed well in advance of the opportunity to invest. We are patient investors and maintain coverage of high-quality
Loomis Sayles International Growth Fund
businesses in order to take advantage of meaningful price dislocations if and when they occur. During the period we initiated a new position in Arm Holdings plc. We added to our existing holdings in Adyen, Block, and Doximity. We trimmed our existing positions in Novartis and WiseTech Global.
Outlook
Our investment process is characterized by bottom-up fundamental research and a long-term investment time horizon. The nature of the process leads to a lower-turnover portfolio in which sector positioning is the result of stock selection. The Fund ended the year with overweight positions in the consumer discretionary, consumer staples, healthcare, information technology, and communication services sectors and was underweight in the financials and industrials sectors. We had no exposure to stocks in the materials, energy, utilities, or real estate sectors. From a geographic standpoint we were overweight in emerging markets and Europe and underweight in developed Asia and North America.
Top Ten Holdings as of December 31, 2023 |
| |
1 Novo Nordisk AS, Class B | |
| |
| |
| |
| |
| |
| |
| |
| |
10 Shopify, Inc., Class A | |
The portfolio is actively managed and holdings are subject to change. There is no guarantee the Fund continues to invest in the securities referenced. The holdings listed exclude any temporary cash investments, are presented on an individual security basis and do not represent holdings of the issuer. |
Hypothetical Growth of $100,000 Investment in Class Y Shares1 |
December 15, 2020 (inception) through December 31, 2023 |
Loomis Sayles International Growth Fund
Average Annual Total Returns —December 31, 20231 |
| | | |
| | |
Class Y (Inception 12/15/20) | | | | |
| | | | |
Class A (Inception 12/15/20) | | | | |
| | | | |
With 5.75% Maximum Sales Charge | | | | |
Class C (Inception 12/15/20) | | | | |
| | | | |
| | | | |
Class N (Inception 12/15/20) | | | | |
| | | | |
| | | | |
MSCI ACWI ex USA Index (Net)2 | | | | |
Performance data shown represents past performance and is no guarantee of, and not necessarily indicative of, future results. Total return and value will vary, and you may have a gain or loss when shares are sold. Current performance may be lower or higher than quoted. For most recent month-end performance, visit im.natixis.com/performance. Performance for other share classes will be greater or less than shown based on differences in fees and sales charges. You may not invest directly in an index. Performance for periods less than one year is cumulative, not annualized. Returns reflect changes in share price and reinvestment of dividends and capital gains, if any. The table(s) do not reflect taxes shareholders might owe on any fund distributions or when they redeem their shares.
| Fund performance has been increased by fee waivers and/or expense reimbursements, if any, without which performance would have been lower. |
| The MSCI ACWI ex USA Index captures large and mid cap representation across 22 of 23 Developed Markets (DM) countries (excluding the US) and 24 Emerging Markets (EM) countries. With 2,311 constituents, the index covers approximately 85% of the global equity opportunity set outside the US. |
| Expense ratios are as shown in the Fund’s prospectus in effect as of the date of this report. The expense ratios for the current reporting period can be found in the Financial Highlights section of this report under Ratios to Average Net Assets. Net expenses reflect contractual expense limitations set to expire on 4/30/24. When a Fund’s expenses are below the limitation, gross and net expense ratios will be the same. See Note 5 of the Notes to Financial Statements for more information about the Fund’s expense limitations. |
| Performance for Class C shares assumes a 1.00% contingent deferred sales charge (“CDSC”) applied when you sell shares within one year of purchase. |
Investment GoalThe Fund seeks long-term capital appreciation.
Market Conditions
U.S. equity markets showed strength in 2023 following a challenging 2022, aided by better-than-expected economic data. The calendar year included heightened volatility, highlighted by turmoil in the banking sector in March and pressure in October when Hamas, an Islamist political and military organization, orchestrated an attack against Israel, shaking the geopolitical landscape and markets. The U.S. 10-Year yield rose as high as 5% before declining and ending the period around 3.86% as investors continued to digest economic data and expectations on interest rates. In the fourth quarter, the U.S. reported its strongest gross domestic product growth in nearly two years at 4.3% annualized.
Markets were shaken in March as worry about the health of the banking system spread, ignited by the collapse of Silicon Valley Bank and Signature Bank and furthered by UBS’s purchase of Credit Suisse at a discounted valuation. Major banking institutions and government agencies around the globe stepped in to help assure depositors their money was safe, which helped avoid contagion across the system. Central banks throughout the world continued to tighten monetary policy to combat elevated inflation. The U.S. Federal Reserve increased its benchmark interest rate by a total of 100 basis points to reach 5.50%. Inflation in the U.S. decelerated throughout the year, and the Federal Reserve paused its interest rate increases toward the end of the year while assessing economic data.
Performance Results
For the 12 months ended December 31, 2023, Class Y shares of the Natixis Oakmark Fund returned 31.28% at net asset value. The Fund outperformed its benchmark, the S&P 500® Index, which returned 26.29%.
Explanation of Fund Performance
On an absolute-return basis, the financials sector contributed the most to the return of the Fund, while consumer staples was the largest detractor to total performance.
Meta was a top contributor for the year. The underlying health of the U.S. social media company’s platforms remained strong, in our view, as daily active users reached new all-time highs. CEO Mark Zuckerberg said since the launch of Reels, time spent on Instagram has increased 24% and monetization is improving rapidly. Furthermore, the company’s technical enhancements around targeting seem to be gaining steam with advertisers, and management remains bullish on the continued growth of messaging across their platforms. We appreciate Meta’s keen focus on operating efficiency and believe its major investments in AI infrastructure over the past couple years have positioned it well.
KKR was also a top contributor for the year. In August, the New York-headquartered investment company reported second-quarter results that were modestly ahead of consensus estimates, largely due to increased transactional activity as capital markets activity accelerated. Management has highlighted that more than 30 strategies will come to market in the next 12 to 18 months and noted this number is likely to increase during the third quarter. Separately, KKR launched its retail-oriented private equity and infrastructure funds mid-year. Management said initial fundraising performance was ahead of expectations and it remains bullish on the 5- to 10-year opportunity in this largely untapped market, citing KKR’s brand, track record, and significantly expanded marketing and distribution teams. Finally, in November, KKR announced its acquisition of the remaining 37% of Global Atlantic (GA) for $2.7 billion. GA has a strong retail distribution network for its annuity business, which KKR can leverage as it continues to establish its own retail funds.
APA Corp. was a top detractor for the year. Despite reporting solid business fundamentals, the oil and natural gas explorer traded lower alongside increased volatility in commodity markets. We continue to believe APA has a long runway of underappreciated inventory in the form of untapped energy assets in the ground, which results in less capital required to replace assets and grow the
business over time. We also appreciate that at our estimate of normalized oil prices, APA generates a double-digit free cash flow yield, and management is returning cash to shareholders via sustainable buybacks and dividends.
Liberty Broadband was also a top detractor for the year despite reporting solid results. The U.S. communication services company owns GCI, the primary cable provider in Alaska, and has a notable stake in Charter Communications. We believe Liberty Broadband is trading at a material discount to its net asset value and that our ownership provides access to Charter Communications at a discount. Liberty Broadband’s management team is taking advantage of this discount by repurchasing shares. We would not be surprised to see the price-value gap reduced or eliminated through a transaction with Charter Communications.
Outlook
We believe our intensive research process and focus on the long term help us find opportunities despite the pervasive themes of the time. When the market does not separate the macro from the micro, this creates an exploitable opportunity for long-term investors. We use times of uncertainty and volatility to strategically position our portfolios for long-term success and believe this approach best positions us for achieving the protection and appreciation of our investors’ capital over the long term.
Top Ten Holdings as of December 31, 2023 |
| |
1 Alphabet, Inc., Class A | |
2 Capital One Financial Corp. | |
3 Intercontinental Exchange, Inc. | |
| |
| |
| |
| |
| |
9 American International Group, Inc. | |
| |
The portfolio is actively managed and holdings are subject to change. There is no guarantee the Fund continues to invest in the securities referenced. The holdings listed exclude any temporary cash investments, are presented on an individual security basis and do not represent holdings of the issuer. |
Hypothetical Growth of $100,000 Investment in Class Y Shares1 |
December 31, 2013 through December 31, 2023 |
Average Annual Total Returns —December 31, 20231 |
| | | | | |
| | |
| | | | | | |
| | | | | | |
| | | | | | |
| | | | | | |
With 5.75% Maximum Sales Charge | | | | | | |
| | | | | | |
| | | | | | |
| | | | | | |
Class N (Inception 5/1/17) | | | | | | |
| | | | | | |
| | | | | | |
| | | | | | |
Performance data shown represents past performance and is no guarantee of, and not necessarily indicative of, future results. Total return and value will vary, and you may have a gain or loss when shares are sold. Current performance may be lower or higher than quoted. For most recent month-end performance, visit im.natixis.com/performance. Performance for other share classes will be greater or less than shown based on differences in fees and sales charges. You may not invest directly in an index. Performance for periods less than one year is cumulative, not annualized. Returns reflect changes in share price and reinvestment of dividends and capital gains, if any. The table(s) do not reflect taxes shareholders might owe on any fund distributions or when they redeem their shares.
| Fund performance has been increased by fee waivers and/or expense reimbursements, if any, without which performance would have been lower. |
| S&P 500® Index is a widely recognized measure of U.S. stock market performance. It is an unmanaged index of 500 common stocks chosen for market size, liquidity, and industry group representation, among other factors. It also measures the performance of the large cap segment of the U.S. equities market. |
| Expense ratios are as shown in the Fund’s prospectus in effect as of the date of this report. The expense ratios for the current reporting period can be found in the Financial Highlights section of this report under Ratios to Average Net Assets. Net expenses reflect contractual expense limitations set to expire on 4/30/24. When a Fund’s expenses are below the limitation, gross and net expense ratios will be the same. See Note 5 of the Notes to Financial Statements for more information about the Fund’s expense limitations. |
| Performance for Class C shares assumes a 1.00% contingent deferred sales charge (“CDSC”) applied when you sell shares within one year of purchase, and includes automatic conversion to Class A shares after eight years. |
Natixis Oakmark International Fund
| Effective August 31, 2023, Eric Liu serves as portfolio manager of the Fund. |
Investment GoalThe Fund seeks long-term capital appreciation.
Market Conditions
Major global markets generally showed strength in 2023 following a challenging 2022. The calendar year included heightened volatility, highlighted by turmoil in the banking sector in March and pressure in October when Hamas, an Islamist political and military organization, orchestrated an attack against Israel, shaking the geopolitical landscape and markets. While the U.S. and European equity markets showed strength on the back of better-than-expected economic data, Asian markets were mixed with Chinese equities experiencing pressure and Japanese equities reaching 30-year highs during the period. The U.S.10-Year yield rose as high as 5% before declining and ending the period around 4% as investors continued to digest economic data and expectations on interest rates.
Central banks throughout the world continued to tighten monetary policy to combat elevated inflation. The U.S. Federal Reserve increased its benchmark interest rate by a total of 100 basis points to reach 5.50%, the European Central Bank opted for 200 basis points to reach 4.50%, and the Bank of England chose 175 basis points to reach 5.25%. Inflation in the U.S. and eurozone decelerated throughout the year, with most central banks pausing their interest rate increases toward the end of the year while assessing economic data. The Bank of Japan continued its accommodative monetary policy stance although it took a step toward reversing the policy when it announced that the 1% cap on its 10-year government bonds would be considered a reference rate going forward. In the fourth quarter, the yen reversed its trend and gained value, ending the period at approximately 141 USD/JPY.
Performance Results
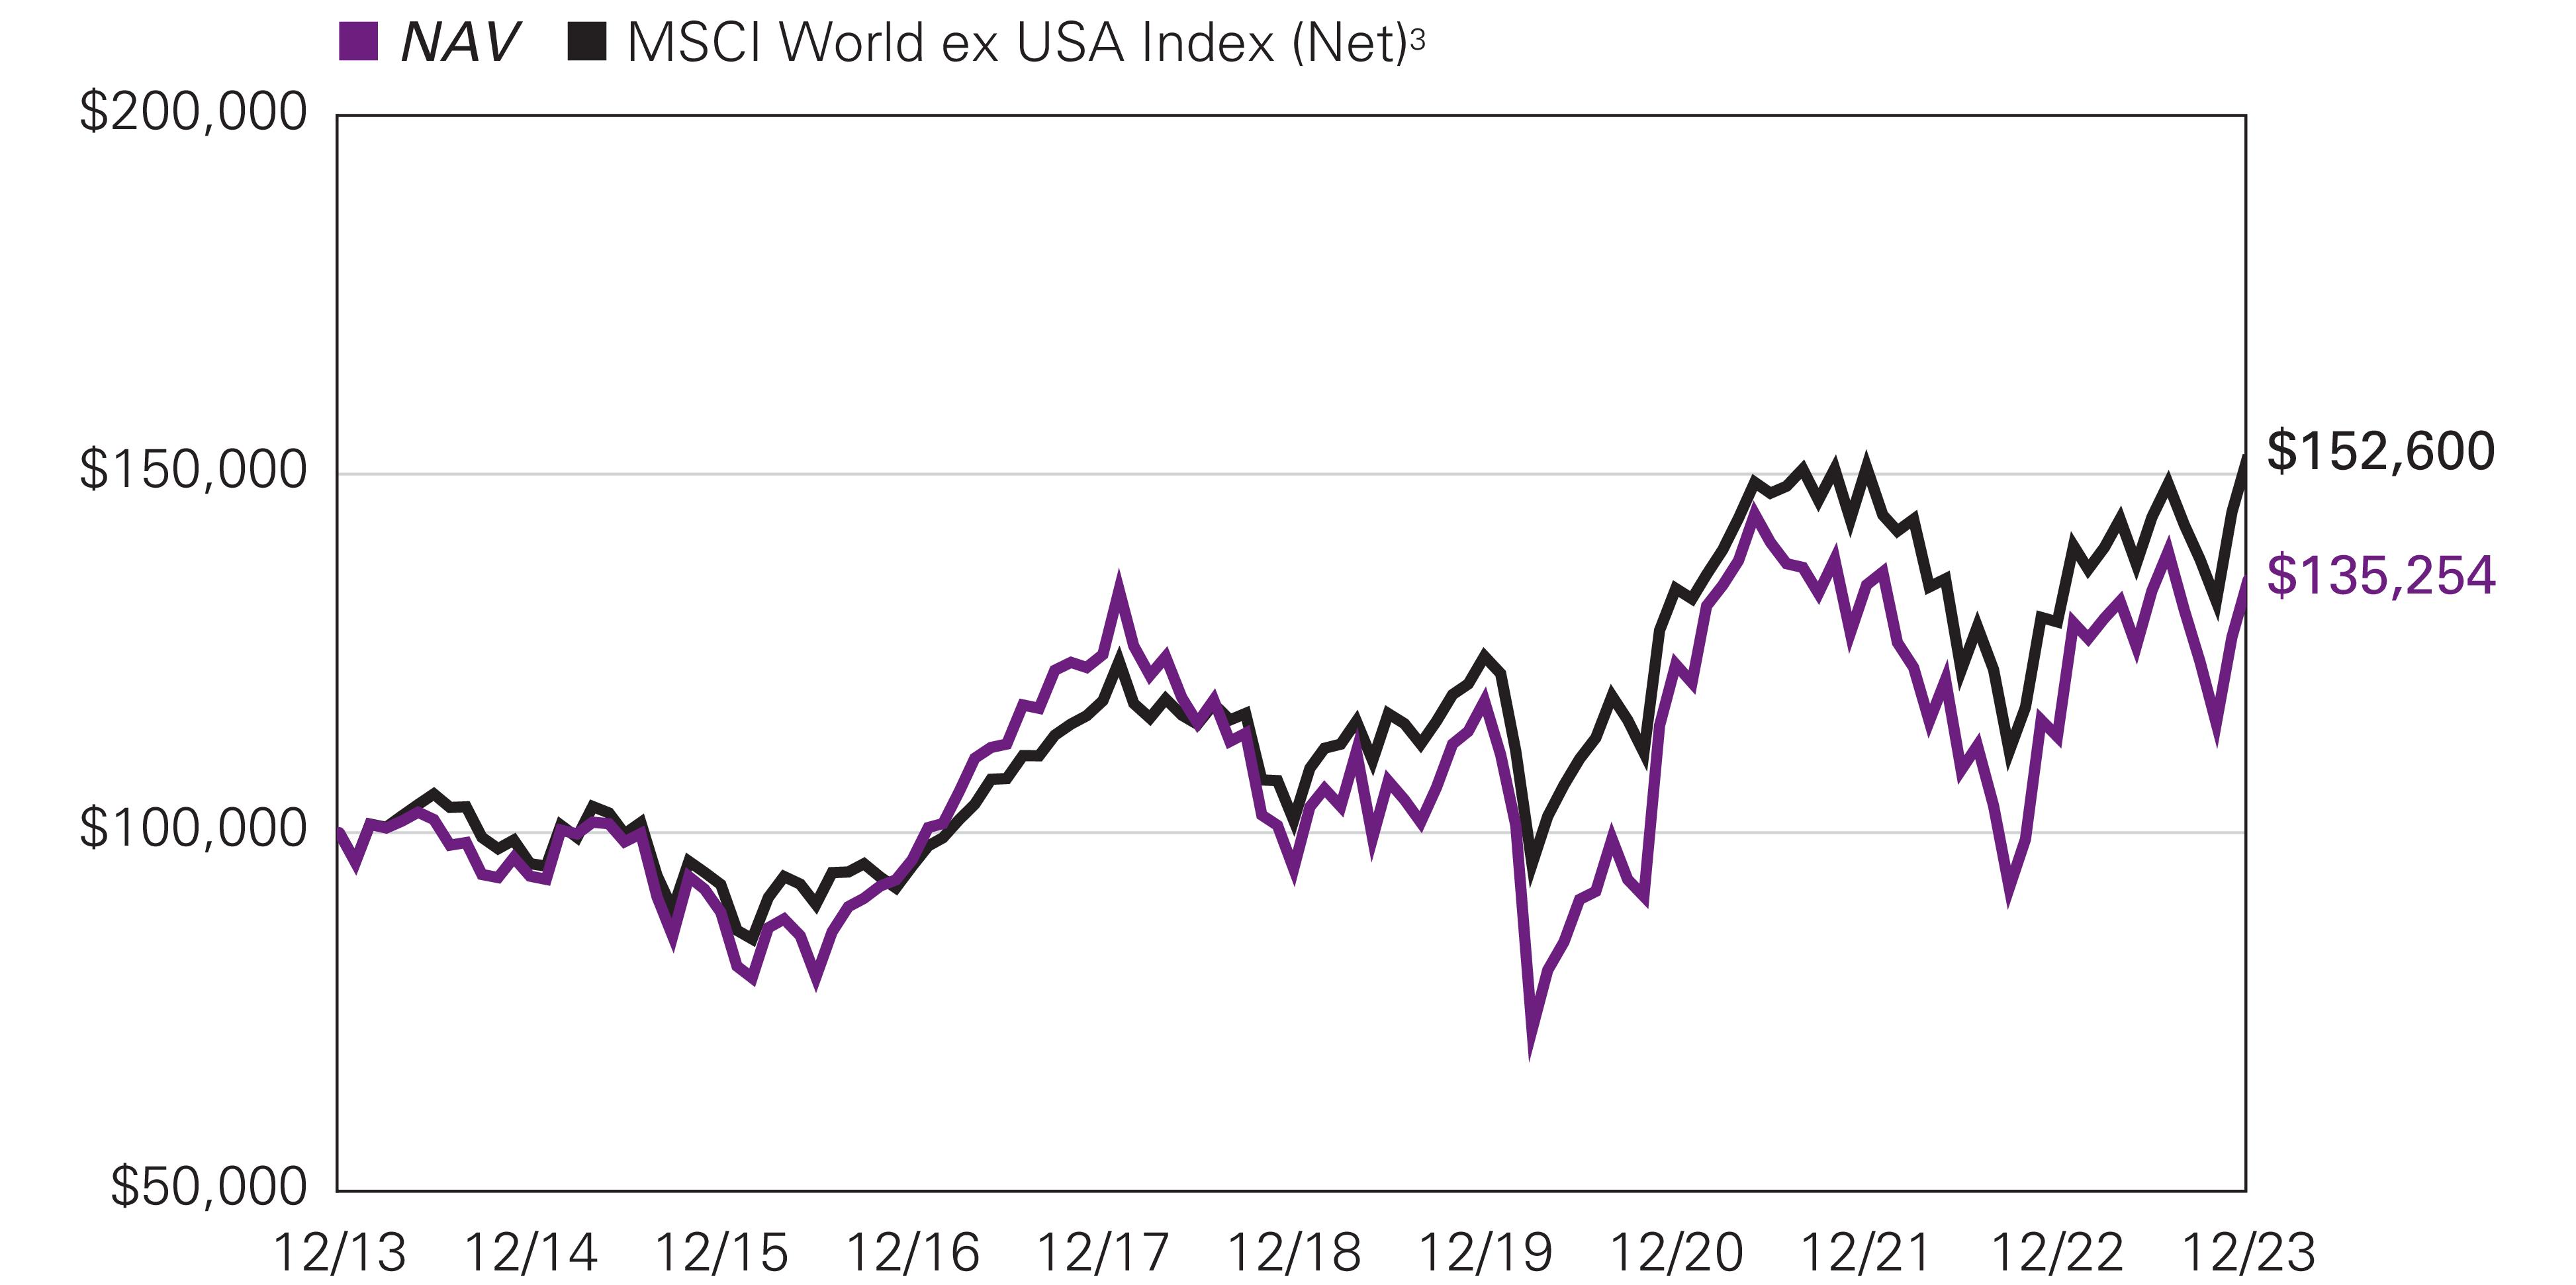
For the 12 months ended December 31, 2023, Class Y shares of the Natixis Oakmark International Fund returned 19.26% at net asset value. The Fund outperformed its benchmark, the MSCI World ex USA Index (Net), which returned 17.94%.
Explanation of Fund Performance
The industrials sector contributed most to the Fund’s return and no sectors impacted Fund performance negatively.
Ryanair was a top contributor for the year. The Irish airline benefitted from strong travel demand within Europe as well as a pickup in foreign visitors to the region. During our mid-year conversations with management, CEO Michael O’Leary was optimistic about Ryanair’s future due to increased bookings industry-wide, expectations for higher oil prices and elevated cost structures of peers driving higher pricing. We appreciate that Ryanair continues to reduce unit costs and widen the gap between itself and more capacity-constrained European competitors. In the fourth quarter, Ryanair reported additional revenue growth and strong free cash flow levels, which allowed the company to reinstate a EUR 400 million dividend and announce an incremental EUR 1.5 billion return to shareholders starting in 2025.
Intesa Sanpaolo, the largest bank in Italy, was a top contributor for the year. Intesa has generated substantial net profit increases in recent periods thanks to a significant rise in net interest income. This was consistent with our view that Intesa would dramatically benefit from rising rates. In addition, Intesa’s non-performing loan formation has continued to decline, reflecting its low-risk business model and strong underwriting practices. Management has also been able to keep operating costs well-controlled thanks to efficiency measures that have largely offset inflationary impacts. With one of the highest dividend payout ratios in Europe, Intesa has been returning capital to shareholders via buybacks while maintaining a robust balance sheet.
Worldline was a top detractor for the year. In October, the French multinational payment and transactional services company delivered a weaker than expected set of results and the stock fell significantly on the news. Management reduced growth estimates citing two factors: (1) a negative mix shift in Germany as German consumers shifted from discretionary to non-discretionary purchases and (2) merchant terminations, driven by Worldline voluntarily and proactively cutting ties with certain online merchants at risk of
Natixis Oakmark International Fund
violating new regulatory standards. We spoke with management after the results and confirmed both factors are transitory. We continue to believe the payments industry is a structurally attractive GDP+ growth market, and Worldline, as the European payments leader, has a very long growth runway given lower European cashless penetration and higher levels of bank payment in-sourcing versus the U.S.
Bayer was also a top detractor for the year. In November, shares of the German health care company fell after it announced negative news on two known unknowns: (1) Bayer stopped its phase III OCEANIC-AF trial for anti-clotting drug asundexian early due to lack of efficacy and (2) the company received an adverse RoundUp verdict for $1.5 billion over three plaintiffs. We spoke with CEO Bill Anderson after the announcement and he articulated a very strategic, thoughtful framework for managing the situation. Although we reduced our estimate of intrinsic value, we continue to view Bayer’s position across the crop sciences ecosystem as unrivaled and believe the company can take portfolio actions to unlock value.
Outlook
We believe our intensive research process and focus on the long term help us find opportunities despite the pervasive themes of the time. When the market does not separate the macro from the micro, this creates an exploitable opportunity for long-term investors. We use times of uncertainty and volatility to strategically position our portfolios for long-term success and believe this approach best positions us for achieving the protection and appreciation of our investors’ capital over the long term.
Top Ten Holdings as of December 31, 2023 |
| |
| |
2 Lloyds Banking Group PLC | |
| |
| |
| |
| |
| |
| |
9 Fresenius Medical Care AG | |
| |
The portfolio is actively managed and holdings are subject to change. There is no guarantee the Fund continues to invest in the securities referenced. The holdings listed exclude any temporary cash investments, are presented on an individual security basis and do not represent holdings of the issuer. |
Natixis Oakmark International Fund
Hypothetical Growth of $100,000 Investment in Class Y Shares1, 2 |
December 31, 2013 through December 31, 2023 |
Natixis Oakmark International Fund
Average Annual Total Returns —December 31, 20231 |
| | | | | |
| | |
Class Y (Inception 5/1/17) | | | | | | |
| | | | | | |
| | | | | | |
| | | | | | |
With 5.75% Maximum Sales Charge | | | | | | |
| | | | | | |
| | | | | | |
| | | | | | |
Class N (Inception 5/1/17) | | | | | | |
| | | | | | |
| | | | | | |
MSCI World ex USA Index (Net)3 | | | | | | |
Performance data shown represents past performance and is no guarantee of, and not necessarily indicative of, future results. Total return and value will vary, and you may have a gain or loss when shares are sold. Current performance may be lower or higher than quoted. For most recent month-end performance, visit im.natixis.com/performance. Performance for other share classes will be greater or less than shown based on differences in fees and sales charges. You may not invest directly in an index. Performance for periods less than one year is cumulative, not annualized. Returns reflect changes in share price and reinvestment of dividends and capital gains, if any. The table(s) do not reflect taxes shareholders might owe on any fund distributions or when they redeem their shares.
| Fund performance has been increased by fee waivers and/or expense reimbursements, if any, without which performance would have been lower. |
| Prior to the inception of Class Y shares (5/1/2017), performance is that of Class A shares and reflects the higher net expenses of that share class. |
| MSCI World ex USA Index (Net) is an unmanaged index that is designed to measure the equity market performance of developed markets, excluding the United States. |
| Expense ratios are as shown in the Fund’s prospectus in effect as of the date of this report. The expense ratios for the current reporting period can be found in the Financial Highlights section of this report under Ratios to Average Net Assets. Net expenses reflect contractual expense limitations set to expire on 4/30/24. When a Fund’s expenses are below the limitation, gross and net expense ratios will be the same. See Note 5 of the Notes to Financial Statements for more information about the Fund’s expense limitations. |
| Performance for Class C shares assumes a 1.00% contingent deferred sales charge (“CDSC”) applied when you sell shares within one year of purchase, and includes automatic conversion to Class A shares after eight years. |
Natixis U.S. Equity Opportunities Fund
|
|
Michael J. Mangan, CFA®, CPA |
|
|
|
Aziz V. Hamzaogullari, CFA® |
Loomis, Sayles & Company, L.P.
|
Investment GoalThe Fund seeks long-term growth of capital.
Market Conditions
The Natixis U.S. Equity Opportunities Fund is composed of two separate segments, combining the value expertise of Harris Associates with the growth expertise of Loomis Sayles. The two segments have common investment philosophies and a rigorous long-term, bottom-up research process focused on high-quality businesses trading at a significant discount to intrinsic value.
Despite the economic pessimism that prevailed at the beginning of 2023, the economy continued to turn in strong results while the S&P 500® posted a 26.4% return including dividends. This came in the wake of 2022, when the U.S. Federal Reserve (Fed) began an aggressive campaign to raise interest rates, the S&P 500® posted a 19.44% loss, and many economists predicted a recession. By the end of 2023, after seven Fed rate increases, inflation as measured by the Consumer Price Index fell by more than half from 6.4% in January to 3.1%. Late in the year, the Fed announced an end to its series of rate increases and is expected to cut rates three times in 2024 as inflation continues to moderate.
Despite declining inflation during 2023, mortgage rates remained high by recent standards, hitting a 20-year high of 8% in October. When the Fed reported that the rate hiking cycle had ended, mortgage rates began to fall, settling below 7% in December. Despite this fact, mortgage rates are still twice as high as they were in January 2021. Housing prices continued to increase, with median home prices rising above $400,000 in the third quarter as inventory fell to new lows, making it difficult for new buyers to enter the market. With many employees on hybrid schedules, commercial real estate took a beating that is expected to continue into 2024. This sector lost $590 billion in value in 2023 and is expected to hemorrhage a further $480 billion in 2024.
Contributing to the Fed’s anticipated rate cuts in 2024 were moderating job gains. While unemployment rates stayed low—below 4%—for all of 2023, job growth cooled. Wages rose robustly at 0.8% annually through November for all wages and 1.1% for non-supervisory and production workers, who make up 80% of the workforce. Consumers continued to prop up the economy in 2023, spending more than expected, even as savings from the Covid-19 pandemic dwindled.
On the technology front, generative artificial intelligence (AI) took the economy and markets by storm. Worldwide generative AI spending neared $20 billion in 2023, as organizations sought to monetize this productivity-enhancing technology. The seven largest technology stocks by market capitalization led the market in 2023, contributing nearly half the overall stock market gain. Overall, technology stocks turned in their best performance since 2009, rallying by 59.1%. The tech-heavy Nasdaq rose by 43%. Small-cap stocks, as captured by the Russell 2000® Index, notched a 15.1% gain, as the Dow Jones Industrial Average rose by 13%.
The bond market bounced back in 2023 following its worst year on record in 2022. The 10-Year Treasury Bond yield ended 2023 at 3.84%, while the 2-Year Treasury Bill yield was 4.26%. The effective Federal Funds rate was 5.33%. The Morningstar U.S. Core Bond index rose by 5.32%, buoyed by a strong fourth quarter. Savers benefitted from higher rates, as rates on CDs, high-yield savings and newly issued bonds increased. With Fed rate cuts on the horizon in 2024, these rates are expected to decline, although they are likely to remain higher than in the recent past.
Natixis U.S. Equity Opportunities Fund
While the economy continued to hum along, turbulence continued on the geopolitical front as war broke out between Israel and Hamas and the conflict between Russia and Ukraine dragged into the second year. Despite these conflicts, gas prices fell during 2023, contributing to the overall decline in inflation. Global stock markets overall tracked U.S. markets, with the MSCI Global Index notching a 22% gain in 2023.
Performance Results
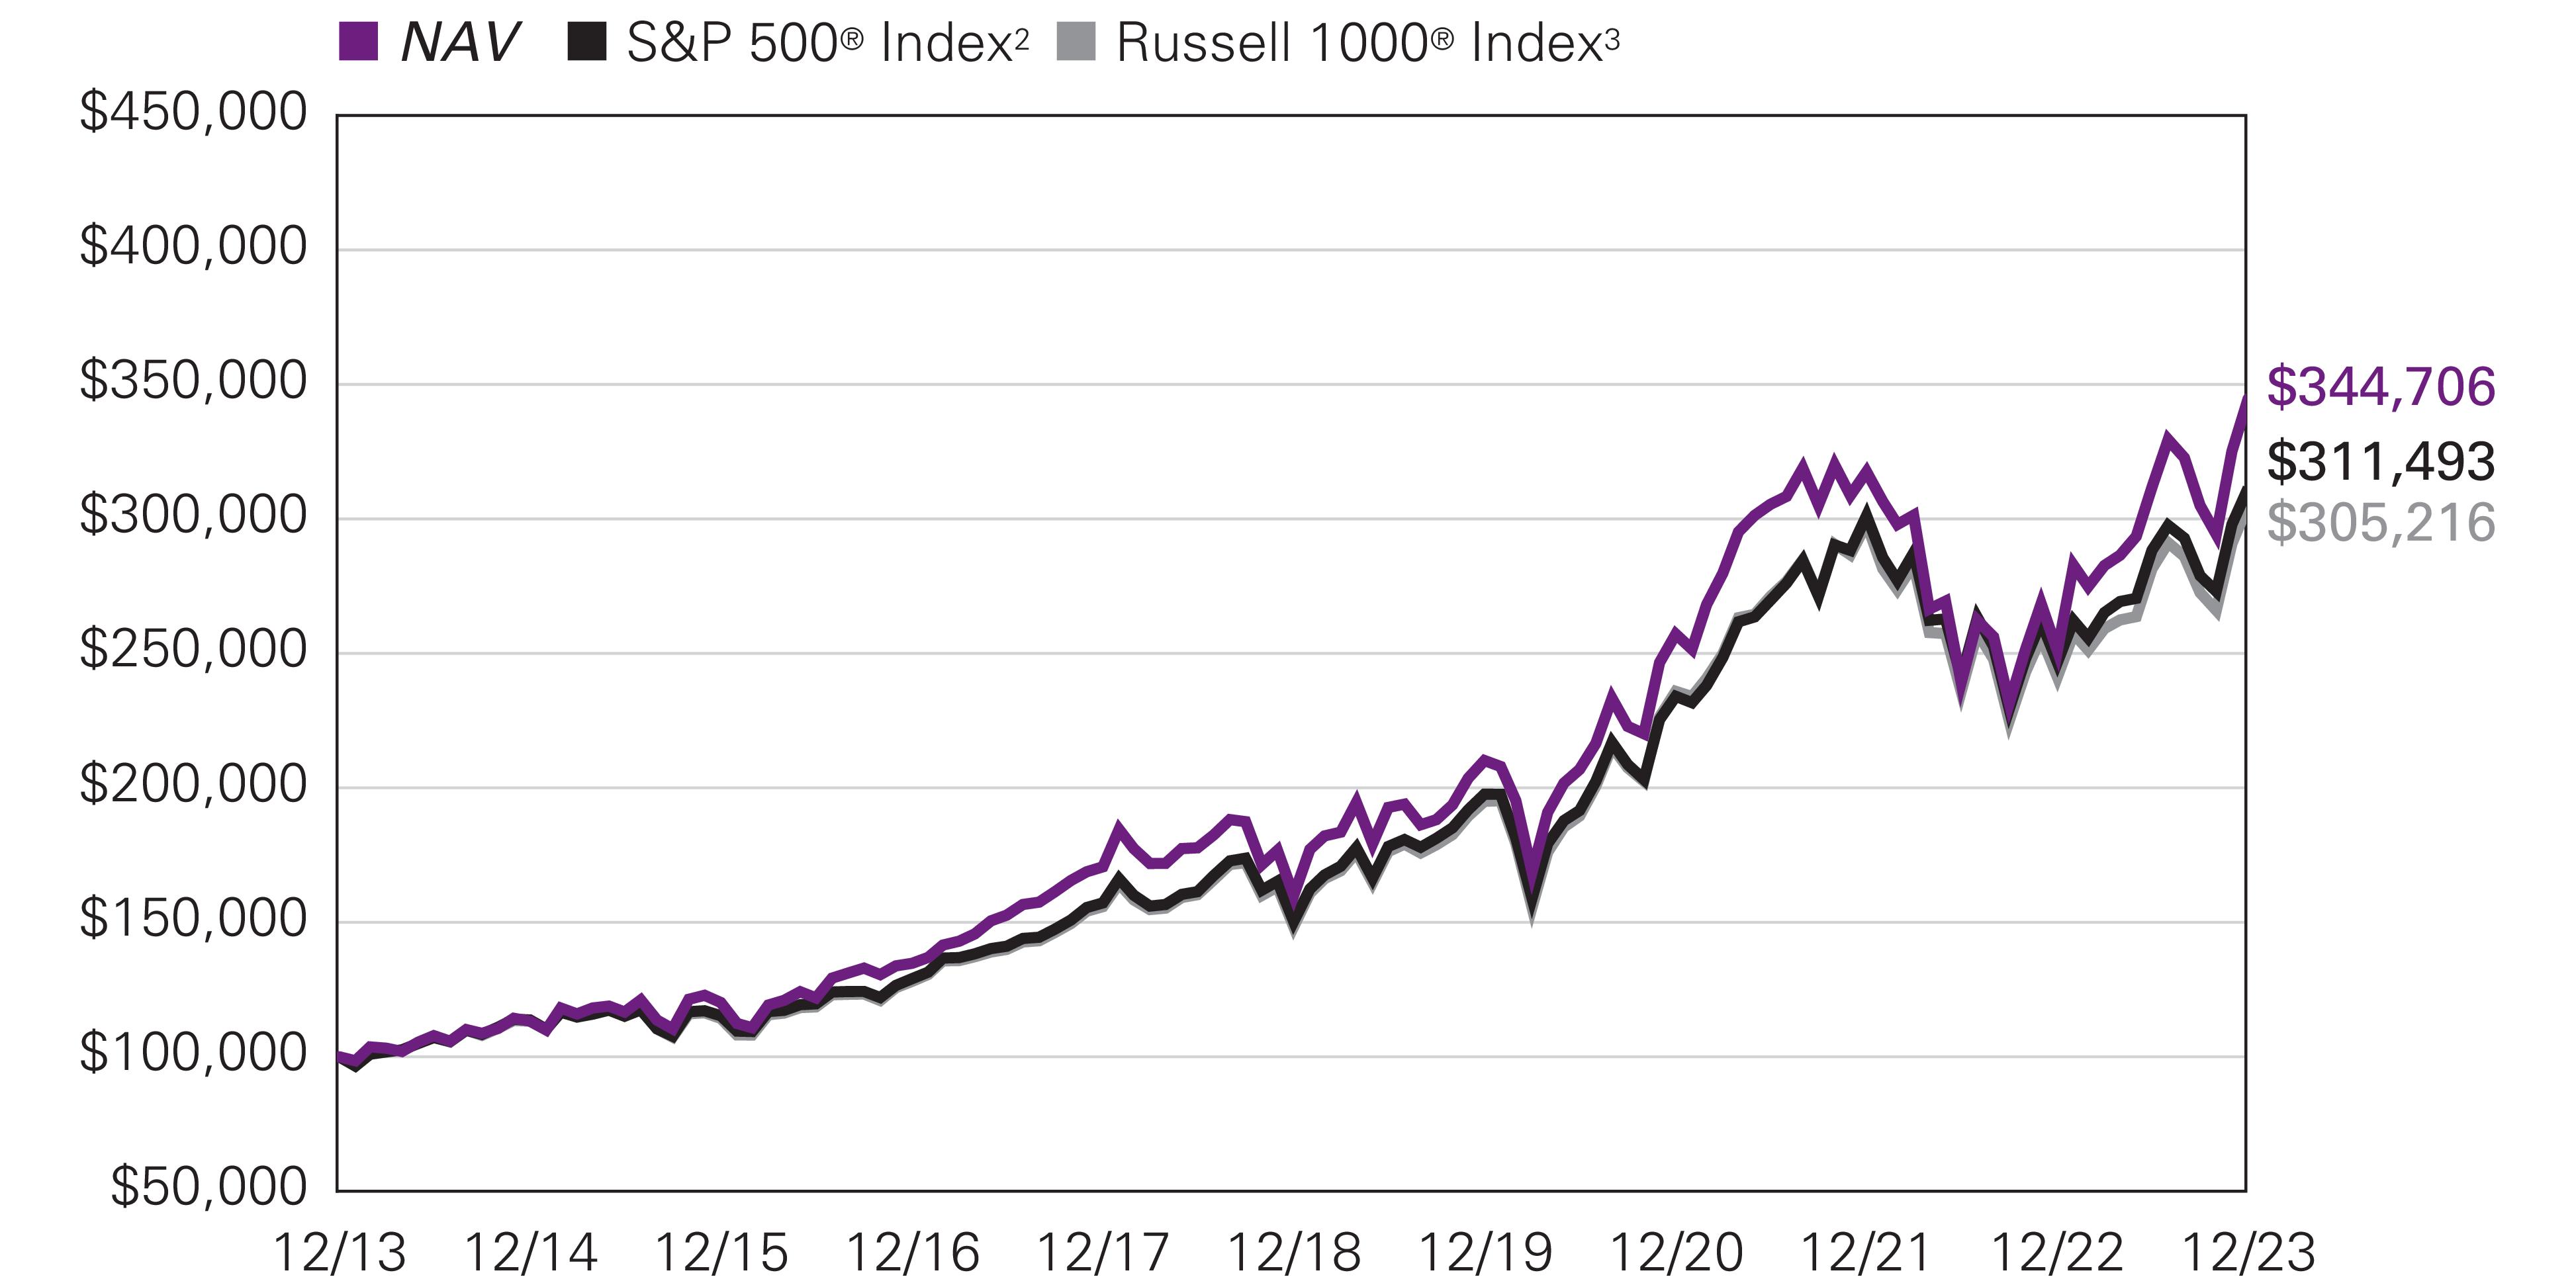
For the 12 months ended December 31, 2023, Class Y shares of the Natixis U.S. Equity Opportunities Fund returned 37.35% at net asset value. The Fund outperformed its primary benchmark, the S&P 500® Index, which returned 26.29%, and also outperformed its secondary benchmark, the Russell 1000® Index, which returned 26.53%.
Explanation of Fund Performance
Each of the portfolio’s segments uses a distinct investment style, providing shareholders with exposure to a variety of different stocks:
• The Harris Associates Large Cap Value segment invests primarily in the common stocks of larger-capitalization companies that Harris Associates L.P. (“Harris Associates”) believes are trading at a substantial discount to the company’s “true business value.”
• The Loomis Sayles All Cap Growth segment invests primarily in equity securities and may invest in companies of any size. The segment employs a growth style of equity management that emphasizes companies with sustainable competitive advantages versus others, long-term structural growth drivers that will lead to above-average future cash flow growth, attractive cash flow returns on invested capital, and management teams focused on creating long-term value for shareholders. The segment aims to invest in companies when they trade at a significant discount to the estimate of intrinsic value.
Both segments contributed positively to the Fund’s performance.
Harris Associates Large Cap Value Segment
On an absolute-return basis, the financials sector contributed the most to the return of the segment, while the consumer staples sector was the only sector with a negative contribution to the total return.
Meta was a top contributor for the year. The underlying health of the U.S. social media company’s platforms remained strong, in our view, as daily active users reached new all-time highs. CEO Mark Zuckerberg said since the launch of Reels, time spent on Instagram has increased 24% and monetization is improving rapidly. Furthermore, the company’s technical enhancements around targeting seem to be gaining steam with advertisers, and management remains bullish on the continued growth of messaging across their platforms. We appreciate Meta’s keen focus on operating efficiency and believe its major investments in AI infrastructure over the past couple years have positioned it well.
KKR was also a top contributor for the year. In August, the New York-headquartered investment company reported second-quarter results that were modestly ahead of consensus estimates, largely due to increased transactional activity as capital markets activity accelerated. Management has highlighted that more than 30 strategies will come to market in the next 12 to 18 months and noted this number is likely to increase during the third quarter. Separately, KKR launched its retail-oriented private equity and infrastructure funds mid-year. Management said initial fundraising performance was ahead of expectations and it remains bullish on the 5- to 10-year opportunity in this largely untapped market, citing KKR’s brand, track record, and significantly expanded marketing and distribution teams. Finally, in November, KKR announced its acquisition of the remaining 37% of Global Atlantic (GA) for $2.7 billion. GA has a strong retail distribution network for its annuity business, which KKR can leverage as it continues to establish its own retail funds.
APA Corp. was a top detractor for the year. Despite reporting solid business fundamentals, the oil and natural gas explorer traded lower alongside increased volatility in commodity markets. We continue to believe APA has a long runway of underappreciated inventory in the form of untapped energy assets in the ground, which results in less capital required to replace assets and grow the business over time. We also appreciate that at our estimate of normalized oil prices, APA generates a double-digit free cash flow yield, and management is returning cash to shareholders via sustainable buybacks and dividends.
General Motors (GM) was also a top detractor for the year. In April, the U.S. auto company reported a drop in profits and the discontinuation of its top-selling electric vehicle, the Chevrolet Volt. In August, shares fell again on news that production of GM’s electric vehicle lineup was being slowed by issues in assembling updated battery modules. Finally, members of the United Auto Workers union (UAW) went on strike following the expiration of its labor contract in September. The strike targeted the GM
Natixis U.S. Equity Opportunities Fund
Wentzville assembly plant, which accounts for around 7% of the company’s North American production. UAW was able to reach a deal with GM in mid-November, ending the six-week labor disruption.
Loomis Sayles All Cap Growth Segment
We are an active manager with a long-term, private equity approach to investing. Through our proprietary bottom-up research framework, we look to invest in those few high-quality businesses with sustainable competitive advantages and profitable growth when they trade at a significant discount to intrinsic value. For the period, the All Cap Growth segment posted a positive absolute return. Our holdings in each of the information technology, communication services, consumer discretionary, industrials, financials, consumer staples, and healthcare sectors contributed positively to the segment’s performance.
Nvidia and Meta Platforms were the largest contributors to performance during the period. Nvidia is the world leader in artificial intelligence (AI) computing, which enables computers to mimic human-like intelligence for problem solving and decision-making capabilities. We believe the company’s competitive advantages include its intellectual property, brands, and a large and growing ecosystem of developers and applications utilizing its GPU (graphic processing unit) technology. A portfolio holding since January 2019, after shares were under pressure throughout most of 2022 given a weak market backdrop, shares rebounded substantially over the past 12 months, with gains accelerating following the company’s first quarter earnings report in May. Nvidia reported record financial results that were well above consensus expectations, as AI applications, including generative AI, are driving strong demand for GPUs by companies looking to leverage these capabilities and drive competitive differentiation. The company also provided revenue guidance that was substantially higher than consensus expectations, resulting in a material increase in expectations for revenue, profits, and free cash flow for its full fiscal year. Revenue in the company’s gaming segment had been depressed, which we believe reflected global demand for PCs returning to pre-pandemic levels after a period of excess and the impact of Covid restrictions on China consumer spending. However, we believe the company has worked expeditiously in clearing existing inventory in its retail channels, which contributed to the gaming business returning to growth in the past two quarters. In the company’s data center business, we believe the company’s decades of focused investment, cumulative know-how, and robust software platform and architecture that has attracted millions of developers, position the company to benefit from several secular long-term growth drivers, including continued growth in use cases for artificial intelligence. To further drive adoption by enterprises, Nvidia is also partnering with cloud service providers including Oracle, Microsoft, and Google to offer AI services via the cloud. We believe Nvidia remains strongly positioned to benefit from secular growth in PC gaming and is still in the early stages of growth in its data center business, which has the potential to be much larger. We believe Nvidia’s strong growth prospects are not currently reflected in its share price. As a result, we believe the company’s shares are trading at a significant discount to our estimate of intrinsic value, offering a compelling reward-to-risk opportunity. We trimmed our position on multiple occasions during the year as the company reached our maximum allowable position size of eight percent due to market appreciation.
Meta Platforms operates online social networking platforms that allow people to connect, share, and interact with friends and communities. With 3.9 billion monthly users, 200 million businesses, and 10 million advertisers worldwide using its family of apps – Facebook, Messenger, WhatsApp, and Instagram – we believe the scale and reach of Meta’s network is unrivaled. A strategy holding since its initial public offering in 2012, Meta’s shares rebounded substantially in 2023 after being under pressure throughout most of 2022 due to a perceived lack of discipline in the company’s capital expenditures – especially with respect to the metaverse – that coincided with what we believed was temporary fundamental weakness arising from the company’s transition to a new advertising format and maneuvering around privacy changes imposed by Apple in 2021. Our analysis suggested that Meta was being priced as if a high-quality, high-returning, growth company – whose returns on capital were many times larger than its cost of capital – would become a low-quality business that both ceased to grow and would also see its margins and returns on invested capital deteriorate. We took advantage of price weakness in 2022 to add to our holdings on multiple occasions during that year, most recently in November 2022. Despite ongoing macroeconomic pressure on advertising spending, Meta has since posted four consecutive quarters of better-than-expected financial results, including accelerating revenue growth in the last three quarters as it made further progress in navigating Apple’s privacy changes and saw improved monetization of its newest Reels video format. Following this period of temporary weakness and elevated investment spending, Meta announced a set of efficiency measures that have already led to significant improvements in margins and lower capital expenditure plans, and shares responded positively to the company’s increased focus on productivity and cost management. We believe founder and CEO Mark Zuckerberg has always managed the company with a long-term focus and strong strategic vision. Over the past ten years, Meta has spent over $125 billion on research and development and $110 billion on capital expenditures – a level of investment that few firms can match, and which creates high barriers to entry for competitors that are further buttressed by the growth of cumulative knowledge over time. The successful development of a metaverse is not an explicit part of our investment thesis for Meta. However, given the potential size of the opportunity, which we estimate could impact over $1 trillion of spending over the long term, and Meta’s positioning with billions of users and hundreds of millions of businesses, we believe Meta’s current balanced approach to its forward-looking investments make sense. We expect that corporations will continue to allocate an increasing proportion of their advertising spending online, and Meta remains one of very few platforms where advertisers can reach consumers at such scale in such a targeted and effective fashion. We believe Meta’s brands, network, and
Natixis U.S. Equity Opportunities Fund
targeting advantage position the company to take increasing share of the industry’s profit pool and grow its market share from approximately 6% currently to approximately 10% of the total global advertising market over our investment time horizon. On the basis of its core business alone, we believe the company is substantially undervalued and trades at a significant discount to our estimate of intrinsic value. We trimmed our position on multiple occasions during the year because it reached our maximum allowable position size of eight percent due to market appreciation.
Alnylam Pharmaceuticals and Illumina were the largest detractors during the period. Alnylam Pharmaceuticals is a leader in gene therapies based on its pioneering small-interfering RNA (siRNA) approach to disease treatment. Founded in 2002, Alnylam was one of the first companies to develop and commercialize therapies based on RNA interference (RNAi), a breakthrough discovery in understanding how genes are naturally regulated within cells that was recognized with the 2006 Nobel Prize in Medicine. RNAi therapies exploit a naturally occurring biological pathway within cells that regulates the expression of specific genes. In particular, siRNA has proven to be one of the most effective approaches to RNAi therapy, and Alnylam remains the first and only company to successfully commercialize siRNA-based therapies. We believe Alnylam’s strong and sustainable competitive advantages include its deep, cumulative and compounding knowledge in the science of RNAi therapeutics, in particular its creation and advancement of unique siRNA-based therapies, and the multiple partnerships it has entered on the basis of its technology which provide both external funding and established commercialization avenues. Currently, the company’s technology is the basis for five approved therapies, ten therapies currently in clinical trials, and a robust pipeline of potential treatments that we expect to enter the clinic in the coming years, with a focus on genetic diseases, cardiometabolic diseases, infectious diseases, and central nervous system and ocular diseases. A strategy holding since the second quarter of 2021, shares responded negatively to the dimming prospects for patisiran, Alnylam’s approved therapy for hATTR amyloidosis, to receive regulatory approval in the larger, related indication of ATTR with cardiomyopathy (ATTR-CM). In October, the company decided to discontinue its bid to attain approval in favor of its more robust and longer trial for vutrisiran. Vutrisiran is also approved for hATTR amyloidosis, but the therapy is delivered via subcutaneous injection every three months, while patisiran requires intravenous administration every three weeks. While the outcomes for patisiran were positive and statistically significant, the FDA was likely to require further study, and the easier administration of vutrisiran, which was developed after patisiran, makes the therapy more commercially attractive. Vutrisiran is currently in Phase III clinical trials for ATTR-CM, with results expected in the first half of 2024. We believe the uniqueness of Alnylam’s pioneering scientific expertise and technology is evident from both its existing products, which provide meaningful value to previously underserved patient populations, as well as the numerous partnerships in which world-class global pharmaceutical companies and specialty competitors alike have sought to access its proprietary technology. With its approved therapies and substantial pipeline of significant late-stage clinical programs, we believe the company has now reached the point at which its existing therapies will continue to contribute positively and its subsequent innovations will shift its financial profile from that of an early-stage biotech company to a profitable business with normalized margins that is able to internally fund its ongoing growth needs. Over our long-term investment horizon, we believe the company can generate substantial revenue growth, while turning profitable and generating substantial cumulative free cash flow. We believe Alnylam’s market price continues to substantially undervalue the potential contribution from the company’s clinical-stage assets – which we believe is unsupported by the company’s established track record for producing genetically validated therapeutics. Further, while embedded expectations reflect some success for its currently marketed products, we believe the market is focused on short-term profitability while ignoring the platform the company has built, that we believe will serve as the basis for ongoing innovation over our long-term investment horizon and beyond. As a result, we believe the company is selling at a substantial discount to our estimate of its intrinsic value and offers a compelling reward to risk opportunity.
Founded in 1998, Illumina is the industry leader in the fast-growing field of sequencing for genetic and genomic analysis, supporting research, clinical, and consumer genetics applications. A strategy holding since March 2020, Illumina’s shares have been under pressure due to lower-than-expected results in its core business, uncertainty regarding its acquisition of GRAIL, and near-term management uncertainty following an activist investor campaign that succeeded in ousting the Chairman of the Board in May and later prompted the resignation of CEO Francis deSouza in June. While orders for its newest sequencing platform, NovaSeq X, had been solid, they slowed in the company’s most recently reported quarter as the company observed a lengthening sales cycle among customers facing macroeconomic pressure – which has similarly impacted peers as well. Still, the company’s recent results and guidance are below our long-term expectations as we believe the GRAIL acquisition has detracted from near-term focus and returns. Illumina acquired GRAIL in August 2021, but closed the transaction prior to receiving approval from the EU, which has since ordered that the business be divested. In December 2023, Illumina announced it will divest GRAIL and aims to have the terms finalized by the end of second quarter 2024. GRAIL is an early leader in asymptomatic cancer screening through liquid biopsies that use Illumina’s sequencing technology to detect tumor DNA in the bloodstream before it could otherwise be sampled via a traditional biopsy. While we believed that there was potential upside in GRAIL, our structural investment thesis for Illumina was not premised on a successful completion of the acquisition, and GRAIL will remain an important customer for the company. We believe the core Illumina business remains highly attractive on a reward-to-risk basis and remains substantially discounted relative to intrinsic value. Illumina is in the early stages of a major platform launch while simultaneously facing more competition than in recent years. Over the last two years, Illumina’s share of industry revenue has dropped from an estimated 80% to 77%. These share losses have been most pronounced in China and in the
Natixis U.S. Equity Opportunities Fund
lower-value, mid- and low- throughput portions of the sequencing market. We anticipate Illumina will retain its dominant share in the high-value, high-throughput ends of the market on the strength of its product ecosystem and continue to capture approximately 75% of the sequencing market. In September, the company named Jacob Thaysen, Ph.D. as its new CEO. Thaysen previously served as President of the Life Sciences and Applied Markets Group at Agilent, and brings a background in research and development (R&D) as well as experience operating in genetics and clinical end markets. We met with Thaysen and our interactions have been positive as we believe he has the requisite skills and vision to reinvigorate the core Illumina franchise. We are encouraged that new management seems committed to redoubling its focus on the significant opportunity in Illumina’s core markets and reinvigorating operational execution – which appeared to have diminished over the last several quarters under deSouza. In addition to the activist-sponsored candidate, Illumina also added two new board members with significant experience at innovative, market-expanding healthcare businesses that we believe should contribute positively to Illumina’s return to growth. Despite the near-term uncertainty, we believe Illumina remains advantageously positioned in a high-quality industry benefiting from long-term, secular growth. We believe Illumina is at the forefront of a multi-decade transformation that will see genetic analysis incorporated into multiple facets of our lives. While demand today is still predominantly from large life sciences research facilities, over the next decade we believe democratization of gene sequencing technology and greater practical application will result in the equipment becoming ubiquitous in clinical settings as well, with oncology offering the largest market opportunity. We believe Illumina is a dominant competitor whose sequencing technology represents the critical enabling technology that ideally positions it to capitalize on an approximately $100 billion market opportunity. We believe Illumina’s shares embed expectations for key revenue and cash flow growth drivers that are well below our long-term assumptions. As a result, we believe the company is selling at a significant discount to our estimate of its intrinsic value and offers a compelling reward-to-risk opportunity. We added to our position on multiple occasions this year, most recently in late September.
Top Ten Holdings as of December 31, 2023 |
| |
1 Alphabet, Inc., Class A | |
| |
3 Meta Platforms, Inc., Class A | |
| |
5 Capital One Financial Corp. | |
| |
| |
| |
| |
| |
The portfolio is actively managed and holdings are subject to change. There is no guarantee the Fund continues to invest in the securities referenced. The holdings listed exclude any temporary cash investments, are presented on an individual security basis and do not represent holdings of the issuer. |
Natixis U.S. Equity Opportunities Fund
Hypothetical Growth of $100,000 Investment in Class Y Shares1 |
December 31, 2013 through December 31, 2023 |
See notes to chart on page 21.
Natixis U.S. Equity Opportunities Fund
Average Annual Total Returns —December 31, 20231 |
| | | | | |
| | |
| | | | | | |
| | | | | | |
| | | | | | |
| | | | | | |
With 5.75% Maximum Sales Charge | | | | | | |
| | | | | | |
| | | | | | |
| | | | | | |
Class N (Inception 5/1/17) | | | | | | |
| | | | | | |
| | | | | | |
| | | | | | |
| | | | | | |
Performance data shown represents past performance and is no guarantee of, and not necessarily indicative of, future results. Total return and value will vary, and you may have a gain or loss when shares are sold. Current performance may be lower or higher than quoted. For most recent month-end performance, visit im.natixis.com/performance. Performance for other share classes will be greater or less than shown based on differences in fees and sales charges. You may not invest directly in an index. Performance for periods less than one year is cumulative, not annualized. Returns reflect changes in share price and reinvestment of dividends and capital gains, if any. The table(s) do not reflect taxes shareholders might owe on any fund distributions or when they redeem their shares.
| Fund performance has been increased by fee waivers and/or expense reimbursements, if any, without which performance would have been lower. |
| S&P 500® Index is a widely recognized measure of U.S. stock market performance. It is an unmanaged index of 500 common stocks chosen for market size, liquidity, and industry group representation, among other factors. It also measures the performance of the large cap segment of the U.S. equities market. |
| Russell 1000® Index measures the performance of the large-cap segment of the U.S. equity universe. It is a subset of the Russell 3000® Index and includes approximately 1000 of the largest securities based on a combination of their market cap and current index membership. The Russell 1000® Index represents approximately 92% of the U.S. market and is constructed to provide a comprehensive and unbiased barometer for the large-cap segment and is completely reconstituted annually to ensure new and growing equities are reflected. |
| Expense ratios are as shown in the Fund’s prospectus in effect as of the date of this report. The expense ratios for the current reporting period can be found in the Financial Highlights section of this report under Ratios to Average Net Assets. Net expenses reflect contractual expense limitations set to expire on 4/30/25. When a Fund’s expenses are below the limitation, gross and net expense ratios will be the same. See Note 5 of the Notes to Financial Statements for more information about the Fund’s expense limitations. |
| Performance for Class C shares assumes a 1.00% contingent deferred sales charge (“CDSC”) applied when you sell shares within one year of purchase, and includes automatic conversion to Class A shares after eight years. |
Vaughan Nelson Mid Cap Fund
|
|
|
|
Vaughan Nelson Investment Management, L.P.
|
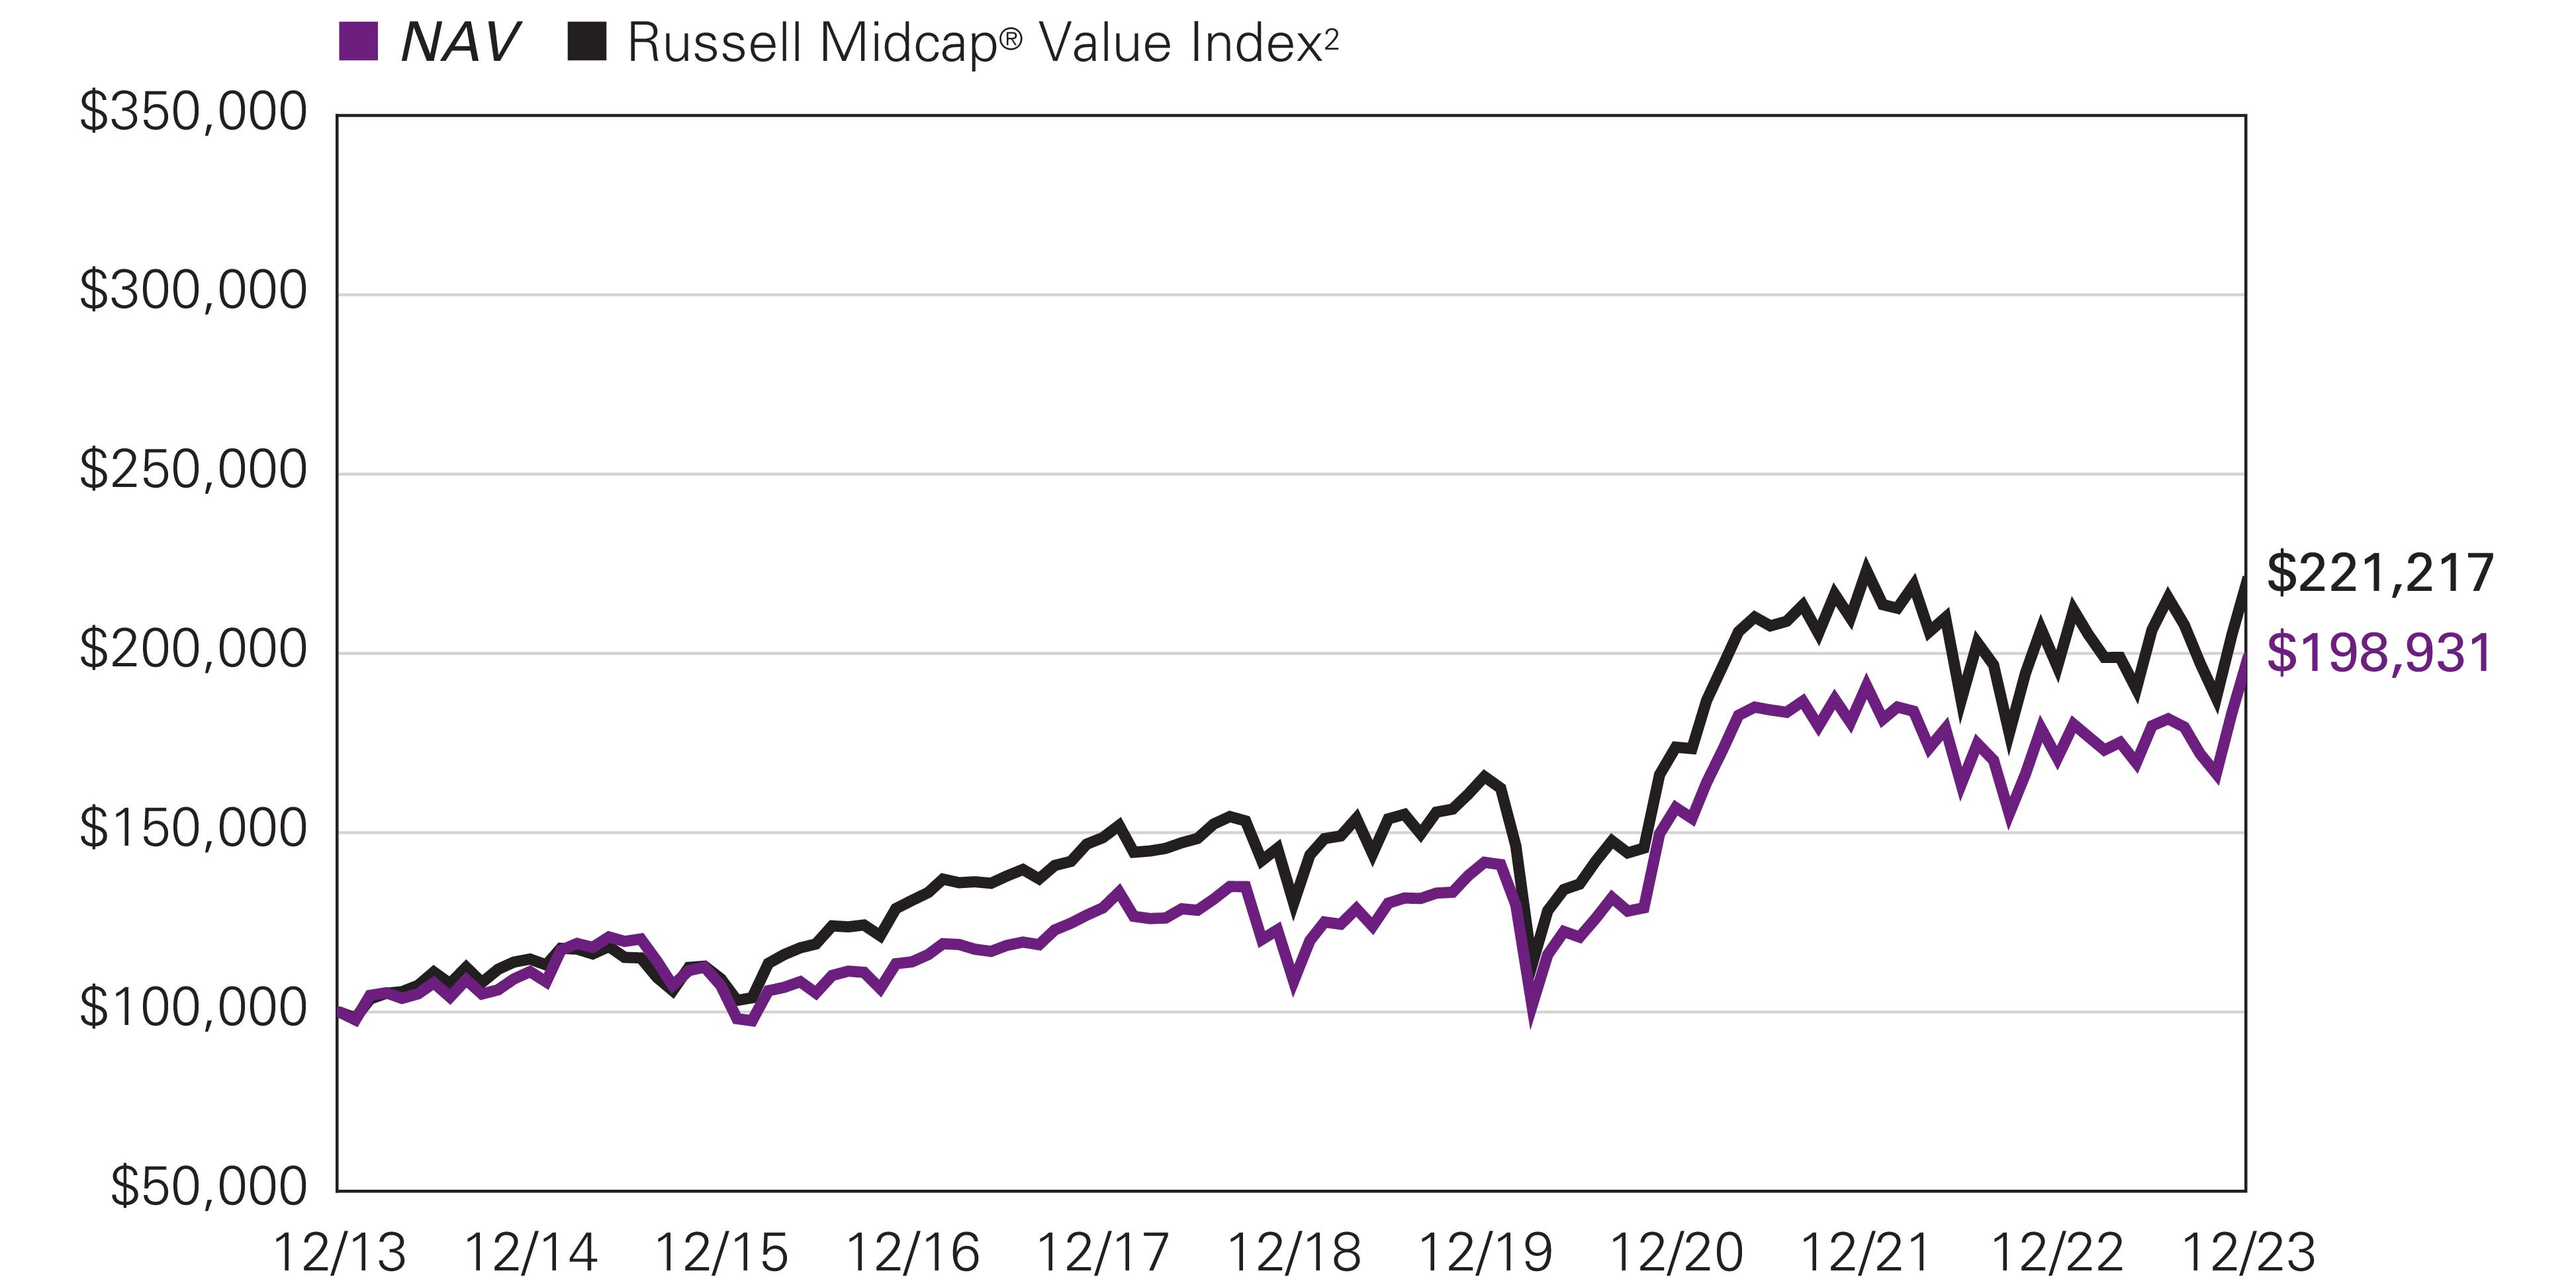
Investment GoalThe Fund seeks long-term capital appreciation.
Market Conditions
During the fiscal year ending December 31, 2023, the market began with sequential growth slowing in both the first and second quarters. Typically, banking stress develops once we are well into a recession as the ability for borrowers to service debt becomes impaired. Given the rapid increase in interest rates, regional banks fell under tremendous pressure.
As we moved through the summer months, global growth continued to deteriorate as the impact of aggressive rate increases affected economic fundamentals. In the U.S., the manufacturing and transportation sectors recessed, and the service sector slowed further. Offsetting the deteriorating economic environment were continued liquidity injections by the major non-U.S. central banks and the U.S. Federal Reserve’s (Fed) reverse repo facility, which became the primary source of liquidity for rebuilding the U.S. Treasury’s general account. This flood of liquidity boosted equity markets and dampened fixed income volatility, compressing fixed income spreads (the difference in yield between bonds with similar maturity but different credit quality).
Inflation peaked in the fourth quarter of 2022 and economic growth bottomed, which set the stage for the move higher in U.S. equity markets during the first seven months of 2023. The reacceleration in growth coupled with declining inflation allowed the market to begin pricing in a “soft landing” for the U.S. economy despite aggressive monetary policy tightening, the emergence of a banking crisis, and rising U.S. Treasury yields as the U.S. Treasury struggled to fund rising deficit spending. The Fed added fuel to the rally by aggressively pumping liquidity into the banking system to offset the material losses on bank balance sheets.
During the fourth quarter, improving supply chains, rising employment participation rates, and the lagging influence of stabilized home prices and rental inflation continued to promote disinflationary conditions. Declining inflationary pressures, combined with stable economic growth, produced a material improvement in financial conditions as the market discounted future Fed rate cuts without any corresponding decrease in earnings expectations or economic weakness. The resulting decline in interest rates led to a powerful fourth quarter rally in equity and fixed income markets.
Performance Results
For the 12 months ended December 31, 2023, Class Y shares of the Vaughan Nelson Mid Cap Fund returned 16.52% at net asset value. The Fund outperformed its benchmark, the Russell Mid Cap Value® Index, which returned 12.71%.
Explanation of Fund Performance
The Fund outperformed on a relative basis during the period.
Health care was the top performing sector with Cencora, Inc. leading the way. Cencora benefited from both multiple expansion and positive earnings revisions. The company’s consistent top-line and bottom-line growth combined with strong cash flow generation and return of capital were rewarded.
Materials outperformed, driven by stock selection. Constellium SE Class A outperformed on a cycle of positive earnings revisions, as demand remained robust, and the company spoke to the end of destocking in packaging.
Overweight and selection within information technology aided performance. The strongest name was Motorola Solutions, Inc. Motorola’s public end markets continued to prove strong and consistent, as the company was able to beat and raise earnings expectations throughout the year.
Financials outperformed via selection with Comerica Incorporated leading the way. Comerica benefited with the rest of the regional banks as valuations had gotten too punitive for what may turn out to be a shallow recession.
Consumer staples’ outperformance was led by Church & Dwight Co., Inc. After a year of disappointing investors in 2022, Church & Dwight regained its credibility in 2023 by putting an end to the downward revision cycle, while recent acquisitions performed better
Vaughan Nelson Mid Cap Fund
than expectations. Additionally, with GLP1 headlines hurting packaged food and beverage stocks, Church & Dwight benefited on a relative basis as it is not impacted by GLP1s.
Further assisting in outperformance was Extra Space Storage Inc. within real estate. REITs outperformed in the fourth quarter as interest rates peaked, and Extra Space Storage outperformed REITs on solid fundamentals.
Selection within utilities assisted performance with Vistra Corp. as the top name. Vistra continued to show a strong recovery in earnings power as the company benefited from pricing during a very hot summer in Texas. The company outperformed regulated utilities which were dealing with ROE (return on equity) pressures.
An underweight to energy, an underperforming sector, added to relative performance.
Selection within consumer discretionary positively impacted performance. Floor & Decor Holdings, Inc. Class A outperformed as strong numbers and a desirable long-term algorithm led to the stock rising with other highly shorted names in the fourth quarter.
Selection within communication services hurt performance on a relative basis. Nexstar Media Group, Inc. detracted the most as softness in advertising markets coupled with worries about distribution held down the stock.
The Fund also experienced negative attribution within industrials with WillScot Mobile Mini Holdings Corp. Class A being the largest drag. WillScot lagged due to slowing volumes coupled with an uncertain macro environment, especially in non-residential end markets.
Outlook
As we enter 2024, we expect modest economic weakness in the first half of the year followed by economic stability and an improvement in growth heading into the 2024 election cycle. Inflation will likely remain above the Fed’s 2% target, and with the recent dramatic easing in financial conditions, inflation may begin to increase in the fourth quarter of 2024. Should inflation expectations begin firming, we would expect some modest downward pressure on equity valuations.
Top Ten Holdings as of December 31, 2023 |
| |
1 Extra Space Storage, Inc. | |
2 EastGroup Properties, Inc. | |
3 Monolithic Power Systems, Inc. | |
| |
| |
6 Diamondback Energy, Inc. | |
| |
8 Marvell Technology, Inc. | |
9 Skechers USA, Inc., Class A | |
| |
The portfolio is actively managed and holdings are subject to change. There is no guarantee the Fund continues to invest in the securities referenced. The holdings listed exclude any temporary cash investments, are presented on an individual security basis and do not represent holdings of the issuer. |
Vaughan Nelson Mid Cap Fund
Hypothetical Growth of $100,000 Investment in Class Y Shares1 |
December 31, 2013 through December 31, 2023 |
See notes to chart on page 25.
Vaughan Nelson Mid Cap Fund
Average Annual Total Returns —December 31, 20231 |
| | | | |
| | |
| | | | | |
| | | | | |
| | | | | |
| | | | | |
With 5.75% Maximum Sales Charge | | | | | |
| | | | | |
| | | | | |
| | | | | |
| | | | | |
| | | | | |
| | | | | |
Russell Midcap® Value Index2 | | | | | |
Performance data shown represents past performance and is no guarantee of, and not necessarily indicative of, future results. Total return and value will vary, and you may have a gain or loss when shares are sold. Current performance may be lower or higher than quoted. For most recent month-end performance, visit im.natixis.com/performance. Performance for other share classes will be greater or less than shown based on differences in fees and sales charges. You may not invest directly in an index. Performance for periods less than one year is cumulative, not annualized. Returns reflect changes in share price and reinvestment of dividends and capital gains, if any. The table(s) do not reflect taxes shareholders might owe on any fund distributions or when they redeem their shares.
| Fund performance has been increased by fee waivers and/or expense reimbursements, if any, without which performance would have been lower. |
| Russell Midcap® Value Index is an unmanaged index that measures the performance of the mid-cap value segment of the U.S. equity universe. It includes those Russell Midcap® Index companies with lower price-to-book ratios and lower forecasted growth values. |
| Expense ratios are as shown in the Fund’s prospectus in effect as of the date of this report. The expense ratios for the current reporting period can be found in the Financial Highlights section of this report under Ratios to Average Net Assets. Net expenses reflect contractual expense limitations set to expire on 4/30/24. When a Fund’s expenses are below the limitation, gross and net expense ratios will be the same. See Note 5 of the Notes to Financial Statements for more information about the Fund’s expense limitations. |
| Performance for Class C shares assumes a 1.00% contingent deferred sales charge (“CDSC”) applied when you sell shares within one year of purchase, and includes automatic conversion to Class A shares after eight years. |
Vaughan Nelson Small Cap Value Fund
|
|
|
Vaughan Nelson Investment Management, L.P.
|
Investment GoalThe Fund seeks capital appreciation.
Market Conditions
During the fiscal year ending December 31, 2023, the market began with sequential growth slowing in both the first and second quarters. Typically, banking stress develops once we are well into a recession as the ability for borrowers to service debt becomes impaired. Given the rapid increase in interest rates, regional banks fell under tremendous pressure.
As we moved through the summer months, global growth continued to deteriorate as the impact of aggressive rate increases affected economic fundamentals. In the U.S., the manufacturing and transportation sectors recessed, and the service sector slowed further. Offsetting the deteriorating economic environment were continued liquidity injections by the major non-U.S. central banks and the U.S. Federal Reserve’s (Fed) reverse repo facility, which became the primary source of liquidity for rebuilding the U.S. Treasury’s general account. This flood of liquidity boosted equity markets and dampened fixed income volatility, compressing fixed income spreads (the difference in yield between bonds with similar maturity but different credit quality).
Inflation peaked in the fourth quarter of 2022 and economic growth bottomed, which set the stage for the move higher in U.S. equity markets during the first seven months of 2023. The reacceleration in growth coupled with declining inflation allowed the market to begin pricing in a “soft landing” for the U.S. economy despite aggressive monetary policy tightening, the emergence of a banking crisis, and rising U.S. Treasury yields as the U.S. Treasury struggled to fund rising deficit spending. The Fed added fuel to the rally by aggressively pumping liquidity into the banking system to offset the material losses on bank balance sheets.
During the fourth quarter, improving supply chains, rising employment participation rates, and the lagging influence of stabilized home prices and rental inflation continued to promote disinflationary conditions. Declining inflationary pressures, combined with stable economic growth, produced a material improvement in financial conditions as the market discounted future Fed rate cuts without any corresponding decrease in earnings expectations or economic weakness. The resulting decline in interest rates led to a powerful fourth quarter rally in equity and fixed income markets.
Performance Results
For the 12 months ended December 31, 2023, Class Y shares of the Vaughan Nelson Small Cap Value Fund returned 25.10% at net asset value. The Fund outperformed its benchmark, the Russell 2000 Value® Index, which returned 14.65%.
Explanation of Fund Performance
The Fund outperformed on a relative basis during the period.
An underweight to financials, an underperforming sector, and selection within it resulted in the top performing sector. Cboe Global Markets Inc. was the top name due to strength in zero-day option offerings to the market which experienced material growth combined with increased penetration of their data and analytics business.
The Fund experienced positive attribution within industrials, with Core & Main, Inc. Class A leading the way. Core & Main outperformed due to continued pricing power maintaining high gross margins, strong and accretive merger & acquisition activity and the exit a of private equity controlling shareholder increasing market liquidity.
Overweight and selection within information technology aided performance. The strongest name was Insight Enterprises, Inc. due to the continued positive margin mix shift into services business from hardware business generating a higher return on assets and a higher multiple for the company.
An underweight to health care, an underperforming sector, aided relative performance.
Selection within utilities assisted performance. Univar Solutions Inc. was the top name due to its acquisition by private equity.
Consumer staples’ outperformance was led by Coca-Cola Consolidated, Inc., which outperformed due to debt paydown and the announcement of a 500% increase in an annual special dividend signaling to the market future material capital returns to shareholders.
Vaughan Nelson Small Cap Value Fund
Materials outperformed, driven by selection. Element Solutions Inc demonstrated strong cost discipline due to variable cost structure and started taking chemicals market share from competitors.
Last, further assisting in outperformance was STAG Industrial, Inc., within real estate, due to strong re-lease rental growth of over 30% on new long-term contracts due to the value of their industrial properties to their tenants.
The largest detractor was in energy, driven by an underweight position and security selection. Patterson-UTI Energy, Inc. was the most challenged name. The stock underperformed due to concerns about softening activity levels (rigs/fracs) in light of weakening near-term oil and natural gas fundamentals.
Selection within consumer discretionary negatively impacted performance. Bally's Corporation was the largest laggard due to high leverage and continued increased capital commitments in non-core business activities.
Selection within communication services hurt on a relative basis. Gray Television, Inc. detracted the most due to high leverage and concerns over coming contract negotiations with major networks (mainly NBC).
Outlook
As we enter 2024, we expect modest economic weakness in the first half of the year followed by economic stability and an improvement in growth heading into the 2024 election cycle. Inflation will likely remain above the Federal Reserve’s 2% target, and with the recent dramatic easing in financial conditions, inflation may begin to increase in the fourth quarter of 2024. Should inflation expectations begin firming, we would expect some modest downward pressure on equity valuations.
Top Ten Holdings as of December 31, 2023 |
| |
1 Insight Enterprises, Inc. | |
2 Element Solutions, Inc. | |
3 First American Financial Corp. | |
4 Western Alliance Bancorp | |
5 Core & Main, Inc., Class A | |
6 Installed Building Products, Inc. | |
| |
| |
9 Beacon Roofing Supply, Inc. | |
| |
The portfolio is actively managed and holdings are subject to change. There is no guarantee the Fund continues to invest in the securities referenced. The holdings listed exclude any temporary cash investments, are presented on an individual security basis and do not represent holdings of the issuer. |
Vaughan Nelson Small Cap Value Fund
Hypothetical Growth of $100,000 Investment in Class Y Shares1 |
December 31, 2013 through December 31, 2023 |
See notes to chart on page 29.
Vaughan Nelson Small Cap Value Fund
Average Annual Total Returns —December 31, 20231 |
| | | | | |
| | |
| | | | | | |
| | | | | | |
| | | | | | |
| | | | | | |
With 5.75% Maximum Sales Charge | | | | | | |
| | | | | | |
| | | | | | |
| | | | | | |
Class N (Inception 5/1/17) | | | | | | |
| | | | | | |
| | | | | | |
Russell 2000® Value Index2 | | | | | | |
Performance data shown represents past performance and is no guarantee of, and not necessarily indicative of, future results. Total return and value will vary, and you may have a gain or loss when shares are sold. Current performance may be lower or higher than quoted. For most recent month-end performance, visit im.natixis.com/performance. Performance for other share classes will be greater or less than shown based on differences in fees and sales charges. You may not invest directly in an index. Performance for periods less than one year is cumulative, not annualized. Returns reflect changes in share price and reinvestment of dividends and capital gains, if any. The table(s) do not reflect taxes shareholders might owe on any fund distributions or when they redeem their shares.
| Fund performance has been increased by fee waivers and/or expense reimbursements, if any, without which performance would have been lower. |
| Russell 2000® Value Index is an unmanaged index that measures the performance of the small-cap value segment of the U.S. equity universe. It includes those Russell 2000® companies with lower price-to-book ratios and lower forecasted growth values. |
| Expense ratios are as shown in the Fund’s prospectus in effect as of the date of this report. The expense ratios for the current reporting period can be found in the Financial Highlights section of this report under Ratios to Average Net Assets. Net expenses reflect contractual expense limitations set to expire on 4/30/24. When a Fund’s expenses are below the limitation, gross and net expense ratios will be the same. See Note 5 of the Notes to Financial Statements for more information about the Fund’s expense limitations. |
| Performance for Class C shares assumes a 1.00% contingent deferred sales charge (“CDSC”) applied when you sell shares within one year of purchase, and includes automatic conversion to Class A shares after eight years. |
ADDITIONAL INFORMATION
The views expressed in this report reflect those of the portfolio managers as of the dates indicated. The managers’ views are subject to change at any time without notice based on changes in market or other conditions. References to specific securities or industries should not be regarded as investment advice. Because the Funds are actively managed, there is no assurance that they will continue to invest in the securities or industries mentioned.
All investing involves risk, including the risk of loss. There is no assurance that any investment will meet its performance objectives or that losses will be avoided.
ADDITIONAL INDEX INFORMATION
This document may contain references to third party copyrights, indexes, and trademarks, each of which is the property of its respective owner. Such owner is not affiliated with Natixis Investment Managers or any of its related or affiliated companies (collectively “Natixis Affiliates”) and does not sponsor, endorse or participate in the provision of any Natixis Affiliates services, funds or other financial products.
The index information contained herein is derived from third parties and is provided on an “as is” basis. The user of this information assumes the entire risk of use of this information. Each of the third party entities involved in compiling, computing or creating index information disclaims all warranties (including, without limitation, any warranties of originality, accuracy, completeness, timeliness, non-infringement, merchantability and fitness for a particular purpose) with respect to such information.
PROXY VOTING INFORMATION
A description of the Natixis Funds' proxy voting policies and procedures is available without charge, upon request, by calling Natixis Funds at 800-225-5478; on the Natixis Funds’ website at im.natixis.com, and on the Securities and Exchange Commission (“SEC”) website at www.sec.gov. Information about how the Natixis Funds voted proxies relating to portfolio securities during the most recent 12-month period ended June 30 is available through the Natixis Funds’ website and the SEC website.
QUARTERLY PORTFOLIO SCHEDULES
The Natixis Funds file a complete schedule of portfolio holdings with the SEC for the first and third quarters of each fiscal year as an exhibit to its reports on Form N-PORT. The Funds’ Form N-PORT reports are available on the SEC website at www.sec.gov. First and third quarter schedules of portfolio holdings are also available at im.natixis.com/funddocuments. A hard copy may be requested from the Fund at no charge by calling 800-225-5478.
TAILORED SHAREHOLDER REPORTS FOR MUTUAL FUNDS AND EXCHANGE-TRADED FUNDS
In October 2022, the SEC adopted rule and form amendments requiring mutual funds and exchange-traded funds to transmit concise and visually engaging streamlined annual and semiannual reports that highlight key information to shareholders. Other information, including financial statements, will no longer appear in the funds’ shareholder reports but will be available online, delivered free of charge upon request, and filed with the SEC on a semiannual basis on Form N-CSR. The rule and form amendments have a compliance date of July 24, 2024.
CFA® and Chartered Financial Analyst® are registered trademarks owned by the CFA Institute.
Understanding Fund Expenses
As a mutual fund shareholder, you incur different costs: transaction costs, including sales charges (loads) on purchases and contingent deferred sales charges on redemptions, and ongoing costs, including management fees, distribution and/or service fees ("12b-1 fees"), and other fund expenses. Certain exemptions may apply. These costs are described in more detail in the Funds’ prospectus. The following examples are intended to help you understand the ongoing costs of investing in the Funds and help you compare these with the ongoing costs of investing in other mutual funds.
The first line in the table of each class of Fund shares shows the actual account values and actual Fund expenses you would have paid on a $1,000 investment in the Fund from July 1, 2023 through December 31, 2023. To estimate the expenses you paid over the period, simply divide your account value by $1,000 (for example $8,600 account value divided by $1,000 = 8.60) and multiply the result by the number in the Expenses Paid During Period column as shown for your class.
The second line in the table for each class of fund shares provides information about hypothetical account values and hypothetical expenses based on the Fund’s actual expense ratios and an assumed rate of return of 5% per year before expenses, which is not the Fund’s actual return. The hypothetical account values and expenses may not be used to estimate the actual ending account balance or expenses you paid on your investment for the period. You may use this information to compare the ongoing costs of investing in the Fund and other funds. To do so, compare this 5% hypothetical example with the 5% hypothetical examples that appear in the shareholder reports of the other funds.
Please note that the expenses shown reflect ongoing costs only, and do not include any transaction costs, such as sales charges. Therefore, the second line in the table of each fund is useful in comparing ongoing costs only, and will not help you determine the relative costs of owning funds. If transaction costs were included, total costs would be higher.
Loomis Sayles International Growth Fund | Beginning
Account Value
7/1/2023 | Ending
Account Value
12/31/2023 | Expenses Paid
7/1/2023 – 12/31/2023 |
| | | |
| | | |
Hypothetical (5% return before expenses) | | | |
| | | |
| | | |
Hypothetical (5% return before expenses) | | | |
| | | |
| | | |
Hypothetical (5% return before expenses) | | | |
| | | |
| | | |
Hypothetical (5% return before expenses) | | | |
| Expenses are equal to the Fund’s annualized expense ratio (after waiver/reimbursement): 1.20%, 1.95%, 0.90% and 0.95% for Class A, C, N and Y, respectively, multiplied by the average account value over the period, multiplied by the number of days in the most recent fiscal half-year (184), divided by 365 (to reflect the half-year period). |
| Beginning
Account Value
7/1/2023 | Ending
Account Value
12/31/2023 | Expenses Paid
7/1/2023 – 12/31/2023 |
| | | |
| | | |
Hypothetical (5% return before expenses) | | | |
| | | |
| | | |
Hypothetical (5% return before expenses) | | | |
| | | |
| | | |
Hypothetical (5% return before expenses) | | | |
| | | |
| | | |
Hypothetical (5% return before expenses) | | | |
| Expenses are equal to the Fund’s annualized expense ratio (after waiver/reimbursement): 1.05%, 1.80%, 0.75% and 0.80% for Class A, C, N and Y, respectively, multiplied by the average account value over the period, multiplied by the number of days in the most recent fiscal half-year (184), divided by 365 (to reflect the half-year period). |
Natixis Oakmark International Fund | Beginning
Account Value
7/1/2023 | Ending
Account Value
12/31/2023 | Expenses Paid
7/1/2023 – 12/31/2023 |
| | | |
| | | |
Hypothetical (5% return before expenses) | | | |
| | | |
| | | |
Hypothetical (5% return before expenses) | | | |
| | | |
| | | |
Hypothetical (5% return before expenses) | | | |
| | | |
| | | |
Hypothetical (5% return before expenses) | | | |
| Expenses are equal to the Fund’s annualized expense ratio (after waiver/reimbursement): 1.15%, 1.90%, 0.85% and 0.90% for Class A, C, N and Y, respectively, multiplied by the average account value over the period, multiplied by the number of days in the most recent fiscal half-year (184), divided by 365 (to reflect the half-year period). |
Natixis U.S. Equity Opportunities Fund | Beginning
Account Value
7/1/2023 | Ending
Account Value
12/31/2023 | Expenses Paid
7/1/2023 – 12/31/2023 |
| | | |
| | | |
Hypothetical (5% return before expenses) | | | |
| | | |
| | | |
Hypothetical (5% return before expenses) | | | |
| | | |
| | | |
Hypothetical (5% return before expenses) | | | |
| | | |
| | | |
Hypothetical (5% return before expenses) | | | |
| Expenses are equal to the Fund’s annualized expense ratio (after waiver/reimbursement): 1.07%, 1.82%, 0.76% and 0.82% for Class A, C, N and Y, respectively, multiplied by the average account value over the period, multiplied by the number of days in the most recent fiscal half-year (184), divided by 365 (to reflect the half-year period). |
Vaughan Nelson Mid Cap Fund | Beginning
Account Value
7/1/2023 | Ending
Account Value
12/31/2023 | Expenses Paid
7/1/2023 – 12/31/2023 |
| | | |
| | | |
Hypothetical (5% return before expenses) | | | |
| | | |
| | | |
Hypothetical (5% return before expenses) | | | |
| | | |
| | | |
Hypothetical (5% return before expenses) | | | |
| | | |
| | | |
Hypothetical (5% return before expenses) | | | |
| Expenses are equal to the Fund’s annualized expense ratio (after waiver/reimbursement): 1.15%, 1.90%, 0.85% and 0.90% for Class A, C, N and Y, respectively, multiplied by the average account value over the period, multiplied by the number of days in the most recent fiscal half-year (184), divided by 365 (to reflect the half-year period). |
Vaughan Nelson Small Cap Value Fund | Beginning
Account Value
7/1/2023 | Ending
Account Value
12/31/2023 | Expenses Paid
7/1/2023 – 12/31/2023 |
| | | |
| | | |
Hypothetical (5% return before expenses) | | | |
| | | |
| | | |
Hypothetical (5% return before expenses) | | | |
| | | |
| | | |
Hypothetical (5% return before expenses) | | | |
| | | |
| | | |
Hypothetical (5% return before expenses) | | | |
| Expenses are equal to the Fund’s annualized expense ratio (after waiver/reimbursement): 1.25%, 2.00%, 0.95% and 1.00% for Class A, C, N and Y, respectively, multiplied by the average account value over the period, multiplied by the number of days in the most recent fiscal half-year (184), divided by 365 (to reflect the half-year period). |
Portfolio of Investments – as of December 31, 2023Loomis Sayles International Growth Fund
| | |
Common Stocks — 97.5% of Net Assets |
| |
| | |
| |
| | |
| |
| | |
| | |
| | |
| |
| Shopify, Inc., Class A(a) | |
| |
| Alibaba Group Holding Ltd., ADR(b) | |
| | |
| Budweiser Brewing Co. APAC Ltd. | |
| Kweichow Moutai Co. Ltd., Class A | |
| | |
| | |
| Trip.com Group Ltd., ADR(a)(b) | |
| Vipshop Holdings Ltd., ADR(a)(b) | |
| | |
| | |
| |
| | |
| |
| | |
| | |
| | |
| |
| | |
| |
| | |
| | |
| | |
| |
| Galaxy Entertainment Group Ltd. | |
| |
| | |
| |
| CRISPR Therapeutics AG(a) | |
| Novartis AG, (Registered) | |
| | |
| | |
| |
| | |
| Reckitt Benckiser Group PLC | |
| | |
| | |
| |
| | |
| | |
| Doximity, Inc., Class A(a) | |
| | |
| | |
| | |
| United States — continued |
| | |
| | |
| | |
| Total Common Stocks
(Identified Cost $30,378,194) | |
| | |
Short-Term Investments — 1.6% |
| Tri-Party Repurchase Agreement with Fixed Income Clearing Corporation, dated 12/29/2023 at 2.500% to be repurchased at $483,707 on 1/02/2024 collateralized by $512,200 U.S. Treasury Note, 2.500% due 3/31/2027 valued at $493,280 including accrued interest (Note 2 of Notes to Financial Statements)
(Identified Cost $483,572) | |
| Total Investments — 99.1%
(Identified Cost $30,861,766) | |
| Other assets less liabilities — 0.9% | |
| | |
| See Note 2 of Notes to Financial Statements. |
| Non-income producing security. |
| Security invests in variable interest entities based in China. See Note 8 of Notes to Financial Statements. |
| An American Depositary Receipt is a certificate issued by a custodian bank representing the right to receive securities of the foreign issuer described. The values of ADRs may be significantly influenced by trading on exchanges not located in the United States. |
Industry Summary at December 31, 2023
| |
| |
| |
Hotels, Restaurants & Leisure | |
| |
| |
Semiconductors & Semiconductor Equipment | |
Interactive Media & Services | |
| |
| |
| |
| |
| |
| |
Health Care Equipment & Supplies | |
Other Investments, less than 2% each | |
| |
| |
Other assets less liabilities | |
| |
See accompanying notes to financial statements.
Portfolio of Investments – as of December 31, 2023Loomis Sayles International Growth Fund (continued) Currency Exposure Summary at December 31, 2023
| |
| |
| |
| |
| |
| |
| |
| |
| |
| |
Other assets less liabilities | |
| |
See accompanying notes to financial statements.
Portfolio of Investments – as of December 31, 2023Natixis Oakmark Fund
| | |
Common Stocks — 94.7% of Net Assets |
| Automobile Components — 2.8% |
| | |
| Magna International, Inc. | |
| | |
| | |
| |
| | |
| |
| | |
| | |
| First Citizens BancShares, Inc., Class A | |
| | |
| | |
| | |
| |
| | |
| | |
| | |
| |
| Fortune Brands Innovations, Inc. | |
| | |
| | |
| |
| Bank of New York Mellon Corp. | |
| | |
| | |
| Goldman Sachs Group, Inc. | |
| Intercontinental Exchange, Inc. | |
| | |
| | |
| | |
| | |
| |
| | |
| | |
| | |
| Communications Equipment — 0.9% |
| | |
| |
| | |
| | |
| Capital One Financial Corp. | |
| | |
| Consumer Staples Distribution & Retail — 2.1% |
| | |
| Electronic Equipment, Instruments & Components — 0.9% |
| | |
| |
| | |
| Warner Bros Discovery, Inc.(a) | |
| | |
| Financial Services — 3.7% |
| | |
| | |
| | |
| | |
| Health Care Equipment & Supplies — 1.0% |
| Baxter International, Inc. | |
| Health Care Providers & Services — 4.0% |
| | |
| | |
| | |
| | |
| Hotels, Restaurants & Leisure — 0.9% |
| Hilton Worldwide Holdings, Inc. | |
| |
| American International Group, Inc. | |
| Reinsurance Group of America, Inc. | |
| | |
| | |
| Interactive Media & Services — 4.5% |
| Alphabet, Inc., Class A(a) | |
| Meta Platforms, Inc., Class A(a) | |
| | |
| Life Sciences Tools & Services — 3.3% |
| | |
| | |
| | |
| |
| Charter Communications, Inc., Class A(a) | |
| | |
| Liberty Broadband Corp., Class C(a) | |
| | |
| Oil, Gas & Consumable Fuels — 8.6% |
| | |
| | |
| | |
| | |
| | |
| Professional Services — 1.1% |
| | |
| Real Estate Management & Development — 2.3% |
| CBRE Group, Inc., Class A(a) | |
| |
| | |
| | |
| | |
| |
| | |
| Total Common Stocks
(Identified Cost $520,726,283) | |
See accompanying notes to financial statements.
Portfolio of Investments – as of December 31, 2023Natixis Oakmark Fund (continued)
| | |
Short-Term Investments — 5.0% |
| Tri-Party Repurchase Agreement with Fixed Income Clearing Corporation, dated 12/29/2023 at 2.500% to be repurchased at $32,125,528 on 1/02/2024 collateralized by $36,628,200 U.S. Treasury Note, 0.500% due 4/30/2027 valued at $32,758,985 including accrued interest (Note 2 of Notes to Financial Statements)
(Identified Cost $32,116,607) | |
| Total Investments — 99.7%
(Identified Cost $552,842,890) | |
| Other assets less liabilities — 0.3% | |
| | |
| See Note 2 of Notes to Financial Statements. |
| Non-income producing security. |
Industry Summary at December 31, 2023
| |
| |
Oil, Gas & Consumable Fuels | |
| |
| |
| |
Interactive Media & Services | |
Health Care Providers & Services | |
| |
Life Sciences Tools & Services | |
| |
| |
| |
| |
Real Estate Management & Development | |
| |
| |
| |
Consumer Staples Distribution & Retail | |
Other Investments, less than 2% each | |
| |
| |
Other assets less liabilities | |
| |
See accompanying notes to financial statements.
Portfolio of Investments – as of December 31, 2023Natixis Oakmark International Fund
| | |
Common Stocks — 94.5% of Net Assets |
| |
| | |
| |
| | |
| |
| Alibaba Group Holding Ltd. | |
| |
| | |
| |
| | |
| | |
| | |
| | |
| | |
| | |
| | |
| | |
| | |
| | |
| | |
| |
| | |
| | |
| | |
| Bayerische Motoren Werke AG | |
| | |
| | |
| | |
| Fresenius Medical Care AG | |
| | |
| | |
| Mercedes-Benz Group AG, (Registered) | |
| | |
| | |
| | |
| | |
| |
| | |
| |
| Bank Mandiri Persero Tbk. PT | |
| |
| Ryanair Holdings PLC, ADR(a) | |
| |
| | |
| |
| | |
| | |
| Recruit Holdings Co. Ltd. | |
| | |
| |
| | |
| |
| | |
| | |
| | |
| | |
| | |
| |
| | |
| |
| | |
| | |
| | |
| | |
| |
| Cie Financiere Richemont SA, Class A | |
| | |
| | |
| Novartis AG, (Registered) | |
| | |
| | |
| | |
| | |
| |
| | |
| | |
| | |
| | |
| | |
| Liberty Global Ltd., Class A(a) | |
| | |
| | |
| Reckitt Benckiser Group PLC | |
| | |
| | |
| | |
| | |
| Total Common Stocks
(Identified Cost $335,101,987) | |
|
|
|
| | |
| Samsung Electronics Co. Ltd., 2.319%, (KRW)
(Identified Cost $7,538,747) | |
| | |
Short-Term Investments — 2.5% |
| Tri-Party Repurchase Agreement with Fixed Income Clearing Corporation, dated 12/29/2023 at 2.500% to be repurchased at $9,627,025 on 1/02/2024 collateralized by $10,976,400 U.S. Treasury Note, 0.500% due 4/30/2027 valued at $9,816,909 including accrued interest (Note 2 of Notes to Financial Statements)
(Identified Cost $9,624,351) | |
| Total Investments — 98.7%
(Identified Cost $352,265,085) | |
| Other assets less liabilities — 1.3% | |
| | |
| See Note 2 of Notes to Financial Statements. |
| Non-income producing security. |
See accompanying notes to financial statements.
Portfolio of Investments – as of December 31, 2023Natixis Oakmark International Fund (continued) | An American Depositary Receipt is a certificate issued by a custodian bank representing the right to receive securities of the foreign issuer described. The values of ADRs may be significantly influenced by trading on exchanges not located in the United States. |
Industry Summary at December 31, 2023
| |
| |
Textiles, Apparel & Luxury Goods | |
| |
| |
Health Care Providers & Services | |
| |
| |
Hotels, Restaurants & Leisure | |
| |
| |
| |
| |
| |
Trading Companies & Distributors | |
| |
| |
| |
Other Investments, less than 2% each | |
| |
| |
Other assets less liabilities | |
| |
Currency Exposure Summary at December 31, 2023
| |
| |
| |
| |
| |
| |
| |
| |
| |
Other assets less liabilities | |
| |
See accompanying notes to financial statements.
Portfolio of Investments – as of December 31, 2023Natixis U.S. Equity Opportunities Fund
| | |
Common Stocks — 97.6% of Net Assets |
| Aerospace & Defense — 2.4% |
| | |
| Air Freight & Logistics — 0.6% |
| Expeditors International of Washington, Inc. | |
| Automobile Components — 1.9% |
| | |
| Mobileye Global, Inc., Class A(a) | |
| | |
| |
| | |
| | |
| | |
| |
| | |
| | |
| | |
| | |
| |
| Boston Beer Co., Inc., Class A(a) | |
| Monster Beverage Corp.(a) | |
| | |
| |
| Alnylam Pharmaceuticals, Inc.(a) | |
| CRISPR Therapeutics AG(a) | |
| Regeneron Pharmaceuticals, Inc.(a) | |
| | |
| |
| Alibaba Group Holding Ltd., ADR | |
| | |
| | |
| |
| | |
| |
| Bank of New York Mellon Corp. | |
| | |
| FactSet Research Systems, Inc. | |
| Goldman Sachs Group, Inc. | |
| Intercontinental Exchange, Inc. | |
| | |
| | |
| | |
| | |
| |
| | |
| | |
| Capital One Financial Corp. | |
| | |
| Consumer Staples Distribution & Retail — 1.6% |
| | |
| |
| | |
| | |
| Warner Bros Discovery, Inc.(a) | |
| | |
| | |
| Financial Services — 4.5% |
| | |
| | |
| | |
| | |
| | |
| Health Care Equipment & Supplies — 1.2% |
| Baxter International, Inc. | |
| Intuitive Surgical, Inc.(a) | |
| | |
| Health Care Providers & Services — 0.8% |
| | |
| Health Care Technology — 1.4% |
| Doximity, Inc., Class A(a) | |
| Veeva Systems, Inc., Class A(a) | |
| | |
| Hotels, Restaurants & Leisure — 1.6% |
| | |
| | |
| | |
| | |
| |
| | |
| Interactive Media & Services — 8.6% |
| Alphabet, Inc., Class A(a) | |
| Alphabet, Inc., Class C(a) | |
| Meta Platforms, Inc., Class A(a) | |
| | |
| |
| Shopify, Inc., Class A(a) | |
| Life Sciences Tools & Services — 2.5% |
| | |
| | |
| | |
| |
| | |
| |
| Charter Communications, Inc., Class A(a) | |
| | |
| | |
| Oil, Gas & Consumable Fuels — 5.0% |
| | |
| | |
| | |
| | |
| |
| | |
| | |
| | |
| | |
| | |
| Real Estate Management & Development — 1.9% |
| CBRE Group, Inc., Class A(a) | |
| Semiconductors & Semiconductor Equipment — 4.9% |
| | |
See accompanying notes to financial statements.
Portfolio of Investments – as of December 31, 2023Natixis U.S. Equity Opportunities Fund (continued) | | |
| Semiconductors & Semiconductor Equipment — continued |
| | |
| | |
| | |
| |
| | |
| | |
| | |
| | |
| Workday, Inc., Class A(a) | |
| | |
| Textiles, Apparel & Luxury Goods — 0.3% |
| Under Armour, Inc., Class A(a) | |
| |
| | |
| Total Common Stocks
(Identified Cost $627,240,002) | |
| | |
Short-Term Investments — 2.3% |
| Tri-Party Repurchase Agreement with Fixed Income Clearing Corporation, dated 12/29/2023 at 2.500% to be repurchased at $22,293,432 on 1/02/2024 collateralized by $19,483,300 U.S. Treasury Note, 0.500% due 4/30/2027 valued at $17,425,184; $5,213,500 U.S. Treasury Note, 4.125% due 9/30/2027 valued at $5,307,928 including accrued interest (Note 2 of Notes to Financial Statements)
(Identified Cost $22,287,241) | |
| Total Investments — 99.9%
(Identified Cost $649,527,243) | |
| Other assets less liabilities — 0.1% | |
| | |
| See Note 2 of Notes to Financial Statements. |
| Non-income producing security. |
| An American Depositary Receipt is a certificate issued by a custodian bank representing the right to receive securities of the foreign issuer described. The values of ADRs may be significantly influenced by trading on exchanges not located in the United States. |
Industry Summary at December 31, 2023
| |
| |
Interactive Media & Services | |
| |
Oil, Gas & Consumable Fuels | |
Semiconductors & Semiconductor Equipment | |
| |
| |
| |
| |
| |
Life Sciences Tools & Services | |
| |
| |
| |
Other Investments, less than 2% each | |
| |
| |
Other assets less liabilities | |
| |
See accompanying notes to financial statements.
Portfolio of Investments – as of December 31, 2023Vaughan Nelson Mid Cap Fund
| | |
Common Stocks — 98.7% of Net Assets |
| Aerospace & Defense — 1.4% |
| | |
| |
| Bank of NT Butterfield & Son Ltd. | |
| | |
| | |
| | |
| | |
| |
| | |
| | |
| | |
| |
| Ares Management Corp., Class A | |
| | |
| | |
| Raymond James Financial, Inc. | |
| | |
| |
| Axalta Coating Systems Ltd.(a) | |
| Commercial Services & Supplies — 0.5% |
| | |
| Communications Equipment — 0.9% |
| | |
| Construction & Engineering — 2.3% |
| WillScot Mobile Mini Holdings Corp.(a) | |
| Construction Materials — 2.4% |
| | |
| Consumer Staples Distribution & Retail — 1.0% |
| Performance Food Group Co.(a) | |
| Containers & Packaging — 2.2% |
| | |
| | |
| | |
| Electrical Equipment — 5.1% |
| | |
| | |
| | |
| | |
| | |
| Electronic Equipment, Instruments & Components — 2.4% |
| | |
| | |
| | |
| Energy Equipment & Services — 2.0% |
| | |
| Financial Services — 0.9% |
| Apollo Global Management, Inc. | |
| Ground Transportation — 1.0% |
| | |
| Health Care Providers & Services — 1.5% |
| | |
| Laboratory Corp. of America Holdings | |
| | |
| | |
| Independent Power & Renewable Electricity Producers — 1.9% |
| | |
| |
| EastGroup Properties, Inc. | |
| |
| | |
| | |
| First American Financial Corp. | |
| Reinsurance Group of America, Inc. | |
| | |
| |
| | |
| Life Sciences Tools & Services — 6.5% |
| Agilent Technologies, Inc. | |
| | |
| | |
| | |
| | |
| |
| | |
| | |
| | |
| |
| Nexstar Media Group, Inc. | |
| |
| | |
| Mortgage Real Estate Investment Trusts (REITs) — 1.7% |
| | |
| Oil, Gas & Consumable Fuels — 4.0% |
| | |
| | |
| | |
| Professional Services — 5.3% |
| CACI International, Inc., Class A(a) | |
| | |
| | |
| | |
| Semiconductors & Semiconductor Equipment — 7.9% |
| | |
| Monolithic Power Systems, Inc. | |
| ON Semiconductor Corp.(a) | |
| | |
| |
| Tyler Technologies, Inc.(a) | |
| |
| Extra Space Storage, Inc. | |
| |
| | |
| Floor & Decor Holdings, Inc., Class A(a) | |
| | |
| | |
| Textiles, Apparel & Luxury Goods — 2.4% |
| Skechers USA, Inc., Class A(a) | |
See accompanying notes to financial statements.
Portfolio of Investments – as of December 31, 2023Vaughan Nelson Mid Cap Fund (continued) | | |
| Trading Companies & Distributors — 2.2% |
| SiteOne Landscape Supply, Inc.(a) | |
| Total Common Stocks
(Identified Cost $194,166,623) | |
| | |
Short-Term Investments — 0.7% |
| Tri-Party Repurchase Agreement with Fixed Income Clearing Corporation, dated 12/29/2023 at 2.500% to be repurchased at $1,752,359 on 1/02/2024 collateralized by $1,998,000 U.S. Treasury Note, 0.500% due 4/30/2027 valued at $1,786,942 including accrued interest (Note 2 of Notes to Financial Statements)
(Identified Cost $1,751,872) | |
| Total Investments — 99.4%
(Identified Cost $195,918,495) | |
| Other assets less liabilities — 0.6% | |
| | |
| See Note 2 of Notes to Financial Statements. |
| Non-income producing security. |
| Real Estate Investment Trusts |
Industry Summary at December 31, 2023
Semiconductors & Semiconductor Equipment | |
| |
Life Sciences Tools & Services | |
| |
| |
| |
| |
| |
| |
Oil, Gas & Consumable Fuels | |
| |
| |
Textiles, Apparel & Luxury Goods | |
| |
| |
Electronic Equipment, Instruments & Components | |
| |
Construction & Engineering | |
| |
Trading Companies & Distributors | |
| |
Energy Equipment & Services | |
Other Investments, less than 2% each | |
| |
| |
Other assets less liabilities | |
| |
See accompanying notes to financial statements.
Portfolio of Investments – as of December 31, 2023Vaughan Nelson Small Cap Value Fund
| | |
Common Stocks — 96.1% of Net Assets |
| |
| | |
| | |
| | |
| Prosperity Bancshares, Inc. | |
| | |
| | |
| | |
| | |
| |
| Coca-Cola Consolidated, Inc. | |
| |
| | |
| Advanced Drainage Systems, Inc. | |
| Janus International Group, Inc.(a) | |
| | |
| |
| Artisan Partners Asset Management, Inc., Class A | |
| | |
| | |
| |
| Axalta Coating Systems Ltd.(a) | |
| | |
| | |
| | |
| | |
| Construction & Engineering — 0.7% |
| | |
| Electronic Equipment, Instruments & Components — 7.1% |
| Advanced Energy Industries, Inc. | |
| | |
| Insight Enterprises, Inc.(a) | |
| | |
| Energy Equipment & Services — 0.9% |
| Patterson-UTI Energy, Inc. | |
| |
| | |
| Ground Transportation — 3.1% |
| | |
| | |
| | |
| Health Care Equipment & Supplies — 1.3% |
| Globus Medical, Inc., Class A(a) | |
| Health Care Providers & Services — 1.7% |
| Acadia Healthcare Co., Inc.(a) | |
| | |
| | |
| Hotels, Restaurants & Leisure — 2.6% |
| International Game Technology PLC | |
| Red Rock Resorts, Inc., Class A | |
| | |
| Household Durables — 3.8% |
| Installed Building Products, Inc. | |
| Skyline Champion Corp.(a) | |
| | |
| | |
| |
| | |
| |
| First American Financial Corp. | |
| Selective Insurance Group, Inc. | |
| | |
| Life Sciences Tools & Services — 1.0% |
| | |
| |
| | |
| | |
| Franklin Electric Co., Inc. | |
| Watts Water Technologies, Inc., Class A | |
| | |
| Marine Transportation — 1.9% |
| | |
| |
| | |
| Mortgage Real Estate Investment Trusts (REITs) — 3.1% |
| | |
| | |
| PennyMac Mortgage Investment Trust | |
| | |
| |
| | |
| Oil, Gas & Consumable Fuels — 5.9% |
| Antero Resources Corp.(a) | |
| | |
| | |
| | |
| | |
| | |
| | |
| Personal Care Products — 0.7% |
| | |
| Professional Services — 2.9% |
| | |
| | |
| | |
| Real Estate Management & Development — 0.3% |
| Cushman & Wakefield PLC(a) | |
| |
| | |
| Semiconductors & Semiconductor Equipment — 2.4% |
| | |
| Ultra Clean Holdings, Inc.(a) | |
| | |
| |
| National Storage Affiliates Trust | |
| |
| Academy Sports & Outdoors, Inc. | |
| | |
| Restoration Hardware, Inc.(a) | |
| | |
| | |
| | |
See accompanying notes to financial statements.
Portfolio of Investments – as of December 31, 2023Vaughan Nelson Small Cap Value Fund (continued) | | |
| Textiles, Apparel & Luxury Goods — 1.1% |
| | |
| Trading Companies & Distributors — 7.9% |
| Beacon Roofing Supply, Inc.(a) | |
| Core & Main, Inc., Class A(a) | |
| | |
| | |
| Rush Enterprises, Inc., Class A | |
| | |
| Total Common Stocks
(Identified Cost $524,545,604) | |
| | |
Short-Term Investments — 3.4% |
| Tri-Party Repurchase Agreement with Fixed Income Clearing Corporation, dated 12/29/2023 at 2.500% to be repurchased at $22,599,905 on 1/02/2024 collateralized by $22,635,600 U.S. Treasury Note, 4.125% due 9/30/2027 valued at $23,045,580 including accrued interest (Note 2 of Notes to Financial Statements)
(Identified Cost $22,593,629) | |
| Total Investments — 99.5%
(Identified Cost $547,139,233) | |
| Other assets less liabilities — 0.5% | |
| | |
| See Note 2 of Notes to Financial Statements. |
| Non-income producing security. |
| Real Estate Investment Trusts |
Industry Summary at December 31, 2023
| |
Trading Companies & Distributors | |
Electronic Equipment, Instruments & Components | |
| |
Oil, Gas & Consumable Fuels | |
| |
| |
| |
| |
| |
| |
Mortgage Real Estate Investment Trusts (REITs) | |
| |
| |
Hotels, Restaurants & Leisure | |
Semiconductors & Semiconductor Equipment | |
Other Investments, less than 2% each | |
| |
| |
Other assets less liabilities | |
| |
See accompanying notes to financial statements.
Statements of Assets and Liabilities
| Loomis
Sayles
International
Growth Fund | | Natixis
Oakmark
International
Fund | Natixis
U.S.
Equity
Opportunities
Fund |
| | | | |
| | | | |
Net unrealized appreciation (depreciation) | | | | |
| | | | |
| | | | |
Foreign currency at value (identified cost $45,561, $0, $836,111 and $51,248, respectively) | | | | |
Receivable for Fund shares sold | | | | |
Receivable for securities sold | | | | |
Dividends and interest receivable | | | | |
| | | | |
Prepaid expenses (Note 7) | | | | |
| | | | |
| | | | |
Payable for securities purchased | | | | |
Payable for Fund shares redeemed | | | | |
Foreign taxes payable (Note 2) | | | | |
Management fees payable (Note 5) | | | | |
Deferred Trustees’ fees (Note 5) | | | | |
Administrative fees payable (Note 5) | | | | |
Payable to distributor (Note 5d) | | | | |
Audit and tax services fees payable | | | | |
Other accounts payable and accrued expenses | | | | |
| | | | |
COMMITMENTS AND CONTINGENCIES(a) | | | | |
| | | | |
| | | | |
| | | | |
Accumulated earnings (loss) | | | | |
| | | | |
See accompanying notes to financial statements.
Statements of Assets and Liabilities (continued)
| Loomis Sayles International Growth Fund | | Natixis Oakmark International Fund | Natixis U.S. Equity Opportunities Fund |
COMPUTATION OF NET ASSET VALUE AND OFFERING PRICE: | | | | |
| | | | |
| | | | |
Shares of beneficial interest | | | | |
Net asset value and redemption price per share | | | | |
Offering price per share (100/94.25 of net asset value) (Note 1) | | | | |
Class C shares: (redemption price per share is equal to net asset value less any applicable contingent deferred sales charge) (Note 1) | | | | |
| | | | |
Shares of beneficial interest | | | | |
Net asset value and offering price per share | | | | |
| | | | |
| | | | |
Shares of beneficial interest | | | | |
Net asset value, offering and redemption price per share | | | | |
| | | | |
| | | | |
Shares of beneficial interest | | | | |
Net asset value, offering and redemption price per share | | | | |
| Net asset value calculations have been determined utilizing fractional share and penny amounts. |
| As disclosed in the Notes to Financial Statements, if applicable. |
See accompanying notes to financial statements.
Statements of Assets and Liabilities (continued)
| | Vaughan
Nelson
Small Cap
Value Fund |
| | |
| | |
Net unrealized appreciation | | |
| | |
| | |
Receivable for Fund shares sold | | |
Receivable for securities sold | | |
Dividends and interest receivable | | |
Prepaid expenses (Note 7) | | |
| | |
| | |
Payable for securities purchased | | |
Payable for Fund shares redeemed | | |
Management fees payable (Note 5) | | |
Deferred Trustees’ fees (Note 5) | | |
Administrative fees payable (Note 5) | | |
Payable to distributor (Note 5d) | | |
Audit and tax services fees payable | | |
Other accounts payable and accrued expenses | | |
| | |
COMMITMENTS AND CONTINGENCIES(a) | | |
| | |
| | |
| | |
| | |
| | |
COMPUTATION OF NET ASSET VALUE AND OFFERING PRICE: | | |
| | |
| | |
Shares of beneficial interest | | |
Net asset value and redemption price per share | | |
Offering price per share (100/94.25 of net asset value) (Note 1) | | |
Class C shares: (redemption price per share is equal to net asset value less any applicable contingent deferred sales charge) (Note 1) | | |
| | |
Shares of beneficial interest | | |
Net asset value and offering price per share | | |
| | |
| | |
Shares of beneficial interest | | |
Net asset value, offering and redemption price per share | | |
| | |
| | |
Shares of beneficial interest | | |
Net asset value, offering and redemption price per share | | |
| As disclosed in the Notes to Financial Statements, if applicable. |
See accompanying notes to financial statements.
For the Year Ended December 31, 2023
| Loomis
Sayles
International
Growth Fund | | Natixis
Oakmark
International
Fund | Natixis
U.S.
Equity
Opportunities
Fund |
| | | | |
| | | | |
| | | | |
| | | | |
Less net foreign taxes withheld | | | | |
| | | | |
| | | | |
| | | | |
Service and distribution fees (Note 5) | | | | |
Administrative fees (Note 5) | | | | |
Trustees' fees and expenses (Note 5) | | | | |
Transfer agent fees and expenses (Notes 5 and 6) | | | | |
Audit and tax services fees | | | | |
Custodian fees and expenses | | | | |
| | | | |
| | | | |
Shareholder reporting expenses | | | | |
Tax reclaim professional fees (Note 2e) | | | | |
| | | | |
| | | | |
Less waiver and/or expense reimbursement (Note 5) | | | | |
| | | | |
| | | | |
Net realized and unrealized gain (loss) on Investments and Foreign currency transactions | | | | |
Net realized gain (loss) on: | | | | |
| | | | |
Foreign currency transactions (Note 2c) | | | | |
Net change in unrealized appreciation (depreciation) on: | | | | |
| | | | |
Foreign currency translations (Note 2c) | | | | |
Net realized and unrealized gain on Investments and Foreign currency transactions | | | | |
NET INCREASE IN NET ASSETS RESULTING FROM OPERATIONS | | | | |
See accompanying notes to financial statements.
Statements of Operations (continued)
For the Year Ended December 31, 2023
| | Vaughan
Nelson
Small Cap
Value Fund |
| | |
| | |
| | |
| | |
| | |
| | |
Service and distribution fees (Note 5) | | |
Administrative fees (Note 5) | | |
Trustees' fees and expenses (Note 5) | | |
Transfer agent fees and expenses (Notes 5 and 6) | | |
Audit and tax services fees | | |
Custodian fees and expenses | | |
| | |
| | |
Shareholder reporting expenses | | |
| | |
| | |
Less waiver and/or expense reimbursement (Note 5) | | |
| | |
| | |
Net realized and unrealized gain (loss) on Investments | | |
Net realized gain (loss) on: | | |
| | |
Net change in unrealized appreciation (depreciation) on: | | |
| | |
Net realized and unrealized gain on Investments | | |
NET INCREASE IN NET ASSETS RESULTING FROM OPERATIONS | | |
See accompanying notes to financial statements.
Statements of Changes in Net Assets
| Loomis Sayles
International Growth Fund | |
| Year Ended
December 31,2023 | Year Ended
December 31,2022 | Year Ended
December 31,2023 | Year Ended
December 31,2022 |
| | | | |
| | | | |
Net realized gain (loss) on investments and foreign currency transactions | | | | |
Net change in unrealized appreciation (depreciation) on investments and foreign currency translations | | | | |
Net increase (decrease) in net assets resulting from operations | | | | |
FROM DISTRIBUTIONS TO SHAREHOLDERS: | | | | |
| | | | |
| | | | |
| | | | |
| | | | |
| | | | |
NET INCREASE IN NET ASSETS FROM CAPITAL
SHARES TRANSACTIONS (Note 10) | | | | |
Net increase (decrease) in net assets | | | | |
| | | | |
| | | | |
| | | | |
See accompanying notes to financial statements.
Statements of Changes in Net Assets (continued)
| Natixis Oakmark International Fund | Natixis U.S. Equity Opportunities Fund |
| Year Ended
December 31,2023 | Year Ended
December 31,2022 | Year Ended
December 31,2023 | Year Ended
December 31,2022 |
| | | | |
| | | | |
Net realized gain (loss) on investments, forward foreign currency contracts and foreign currency transactions | | | | |
Net change in unrealized appreciation (depreciation) on investments, forward foreign currency contracts and foreign currency translations | | | | |
Net increase (decrease) in net assets resulting from operations | | | | |
FROM DISTRIBUTIONS TO SHAREHOLDERS: | | | | |
| | | | |
| | | | |
| | | | |
| | | | |
| | | | |
NET INCREASE (DECREASE) IN NET ASSETS FROM CAPITAL
SHARES TRANSACTIONS (Note 10) | | | | |
Net increase (decrease) in net assets | | | | |
| | | | |
| | | | |
| | | | |
See accompanying notes to financial statements.
Statements of Changes in Net Assets (continued)
| Vaughan Nelson Mid Cap Fund | Vaughan Nelson Small Cap Value Fund |
| Year Ended
December 31,2023 | Year Ended
December 31,2022 | Year Ended
December 31,2023 | Year Ended
December 31,2022 |
| | | | |
| | | | |
Net realized gain (loss) on investments | | | | |
Net change in unrealized appreciation (depreciation) on investments | | | | |
Net increase (decrease) in net assets resulting from operations | | | | |
FROM DISTRIBUTIONS TO SHAREHOLDERS: | | | | |
| | | | |
| | | | |
| | | | |
| | | | |
| | | | |
NET INCREASE (DECREASE) IN NET ASSETS FROM CAPITAL
SHARES TRANSACTIONS (Note 10) | | | | |
Net increase (decrease) in net assets | | | | |
| | | | |
| | | | |
| | | | |
See accompanying notes to financial statements.
For a share outstanding throughout each period.
| Loomis Sayles International Growth Fund—Class A |
| Year Ended
December 31,
2023 | Year Ended
December 31,
2022 | Year Ended
December 31,
2021 | |
Net asset value, beginning of the period | | | | |
INCOME (LOSS) FROM INVESTMENT OPERATIONS: | | | | |
Net investment income (loss)(a) | | | | |
Net realized and unrealized gain (loss) | | | | |
Total from Investment Operations | | | | |
| | | | |
| | | | |
Net realized capital gains | | | | |
| | | | |
Net asset value, end of the period | | | | |
| | | | |
RATIOS TO AVERAGE NET ASSETS: | | | | |
Net assets, end of the period (000's) | | | | |
| | | | |
| | | | |
Net investment income (loss) | | | | |
| | | | |
| From commencement of operations on December 15, 2020 through December 31, 2020. |
| Per share net investment income (loss) has been calculated using the average shares outstanding during the period. |
| A sales charge for Class A shares is not reflected in total return calculations. |
| Had certain expenses not been waived/reimbursed during the period, total returns would have been lower. |
| Periods less than one year are not annualized. |
| The investment adviser agreed to waive its fees and/or reimburse a portion of the Fund’s expenses during the period. Without this waiver/reimbursement, expenses would have been higher. |
| Computed on an annualized basis for periods less than one year. |
See accompanying notes to financial statements.
Financial Highlights (continued)
For a share outstanding throughout each period.
| Loomis Sayles International Growth Fund—Class C |
| Year Ended
December 31,
2023 | Year Ended
December 31,
2022 | Year Ended
December 31,
2021 | |
Net asset value, beginning of the period | | | | |
INCOME (LOSS) FROM INVESTMENT OPERATIONS: | | | | |
Net investment income (loss)(a) | | | | |
Net realized and unrealized gain (loss) | | | | |
Total from Investment Operations | | | | |
| | | | |
| | | | |
Net realized capital gains | | | | |
| | | | |
Net asset value, end of the period | | | | |
| | | | |
RATIOS TO AVERAGE NET ASSETS: | | | | |
Net assets, end of the period (000's) | | | | |
| | | | |
| | | | |
Net investment income (loss) | | | | |
| | | | |
| From commencement of operations on December 15, 2020 through December 31, 2020. |
| Per share net investment income (loss) has been calculated using the average shares outstanding during the period. |
| Amount rounds to less than $0.01 per share. |
| A contingent deferred sales charge for Class C shares is not reflected in total return calculations. |
| Had certain expenses not been waived/reimbursed during the period, total returns would have been lower. |
| Periods less than one year are not annualized. |
| The investment adviser agreed to waive its fees and/or reimburse a portion of the Fund’s expenses during the period. Without this waiver/reimbursement, expenses would have been higher. |
| Computed on an annualized basis for periods less than one year. |
See accompanying notes to financial statements.
Financial Highlights (continued)
For a share outstanding throughout each period.
| Loomis Sayles International Growth Fund—Class N |
| Year Ended
December 31,
2023 | Year Ended
December 31,
2022 | Year Ended
December 31,
2021 | |
Net asset value, beginning of the period | | | | |
INCOME (LOSS) FROM INVESTMENT OPERATIONS: | | | | |
| | | | |
Net realized and unrealized gain (loss) | | | | |
Total from Investment Operations | | | | |
| | | | |
| | | | |
Net realized capital gains | | | | |
| | | | |
Net asset value, end of the period | | | | |
| | | | |
RATIOS TO AVERAGE NET ASSETS: | | | | |
Net assets, end of the period (000's) | | | | |
| | | | |
| | | | |
| | | | |
| | | | |
| From commencement of operations on December 15, 2020 through December 31, 2020. |
| Per share net investment income has been calculated using the average shares outstanding during the period. |
| Had certain expenses not been waived/reimbursed during the period, total returns would have been lower. |
| Periods less than one year are not annualized. |
| The investment adviser agreed to waive its fees and/or reimburse a portion of the Fund’s expenses during the period. Without this waiver/reimbursement, expenses would have been higher. |
| Computed on an annualized basis for periods less than one year. |
See accompanying notes to financial statements.
Financial Highlights (continued)
For a share outstanding throughout each period.
| Loomis Sayles International Growth Fund—Class Y |
| Year Ended
December 31,
2023 | Year Ended
December 31,
2022 | Year Ended
December 31,
2021 | |
Net asset value, beginning of the period | | | | |
INCOME (LOSS) FROM INVESTMENT OPERATIONS: | | | | |
| | | | |
Net realized and unrealized gain (loss) | | | | |
Total from Investment Operations | | | | |
| | | | |
| | | | |
Net realized capital gains | | | | |
| | | | |
Net asset value, end of the period | | | | |
| | | | |
RATIOS TO AVERAGE NET ASSETS: | | | | |
Net assets, end of the period (000's) | | | | |
| | | | |
| | | | |
| | | | |
| | | | |
| From commencement of operations on December 15, 2020 through December 31, 2020. |
| Per share net investment income has been calculated using the average shares outstanding during the period. |
| Had certain expenses not been waived/reimbursed during the period, total returns would have been lower. |
| Periods less than one year are not annualized. |
| The investment adviser agreed to waive its fees and/or reimburse a portion of the Fund’s expenses during the period. Without this waiver/reimbursement, expenses would have been higher. |
| Computed on an annualized basis for periods less than one year. |
See accompanying notes to financial statements.
Financial Highlights (continued)
For a share outstanding throughout each period.
| Natixis Oakmark Fund—Class A |
| Year Ended
December 31,
2023 | Year Ended
December 31,
2022 | Year Ended
December 31,
2021 | Year Ended
December 31,
2020 | Year Ended
December 31,
2019 |
Net asset value, beginning of the period | | | | | |
INCOME (LOSS) FROM INVESTMENT OPERATIONS: | | | | | |
| | | | | |
Net realized and unrealized gain (loss) | | | | | |
Total from Investment Operations | | | | | |
| | | | | |
| | | | | |
Net realized capital gains | | | | | |
| | | | | |
Net asset value, end of the period | | | | | |
| | | | | |
RATIOS TO AVERAGE NET ASSETS: | | | | | |
Net assets, end of the period (000's) | | | | | |
| | | | | |
| | | | | |
| | | | | |
| | | | | |
| Per share net investment income has been calculated using the average shares outstanding during the period. |
| Includes a non-recurring dividend. Without this dividend, net investment income per share would have been $0.05, total return would have been 12.72% and the ratio of net investment income to average net assets would have been 0.27%. |
| Includes a non-recurring dividend. Without this dividend, net investment income per share would have been $0.13, total return would have been 26.50% and the ratio of net investment income to average net assets would have been 0.62%. |
| A sales charge for Class A shares is not reflected in total return calculations. |
| Had certain expenses not been waived/reimbursed during the period, total returns would have been lower. |
| The investment adviser agreed to waive its fees and/or reimburse a portion of the Fund’s expenses during the period. Without this waiver/reimbursement, expenses would have been higher. |
| Effective July 1, 2021, the expense limit decreased from 1.30% to 1.05%. |
| Includes refund of prior year service fee of 0.01%. |
See accompanying notes to financial statements.
Financial Highlights (continued)
For a share outstanding throughout each period.
| Natixis Oakmark Fund—Class C |
| Year Ended
December 31,
2023 | Year Ended
December 31,
2022 | Year Ended
December 31,
2021 | Year Ended
December 31,
2020 | Year Ended
December 31,
2019 |
Net asset value, beginning of the period | | | | | |
INCOME (LOSS) FROM INVESTMENT OPERATIONS: | | | | | |
Net investment income (loss)(a) | | | | | |
Net realized and unrealized gain (loss) | | | | | |
Total from Investment Operations | | | | | |
| | | | | |
| | | | | |
Net realized capital gains | | | | | |
| | | | | |
Net asset value, end of the period | | | | | |
| | | | | |
RATIOS TO AVERAGE NET ASSETS: | | | | | |
Net assets, end of the period (000's) | | | | | |
| | | | | |
| | | | | |
Net investment income (loss) | | | | | |
| | | | | |
| Per share net investment income (loss) has been calculated using the average shares outstanding during the period. |
| Includes a non-recurring dividend. Without this dividend, net investment loss per share would have been $(0.08), total return would have been 11.85% and the ratio of net investment loss to average net assets would have been (0.46)%. |
| Includes a non-recurring dividend. Without this dividend, net investment loss per share would have been $(0.02), total return would have been 25.50% and the ratio of net investment loss to average net assets would have been (0.12)%. |
| Amount rounds to less than $0.01 per share. |
| A contingent deferred sales charge for Class C shares is not reflected in total return calculations. |
| Had certain expenses not been waived/reimbursed during the period, total returns would have been lower. |
| The investment adviser agreed to waive its fees and/or reimburse a portion of the Fund’s expenses during the period. Without this waiver/reimbursement, expenses would have been higher. |
| Effective July 1, 2021, the expense limit decreased from 2.05% to 1.80%. |
See accompanying notes to financial statements.
Financial Highlights (continued)
For a share outstanding throughout each period.
| Natixis Oakmark Fund—Class N |
| Year Ended
December 31,
2023 | Year Ended
December 31,
2022 | Year Ended
December 31,
2021 | Year Ended
December 31,
2020 | Year Ended
December 31,
2019 |
Net asset value, beginning of the period | | | | | |
INCOME (LOSS) FROM INVESTMENT OPERATIONS: | | | | | |
| | | | | |
Net realized and unrealized gain (loss) | | | | | |
Total from Investment Operations | | | | | |
| | | | | |
| | | | | |
Net realized capital gains | | | | | |
| | | | | |
Net asset value, end of the period | | | | | |
| | | | | |
RATIOS TO AVERAGE NET ASSETS: | | | | | |
Net assets, end of the period (000's) | | | | | |
| | | | | |
| | | | | |
| | | | | |
| | | | | |
| Per share net investment income has been calculated using the average shares outstanding during the period. |
| Includes a non-recurring dividend. Without this dividend, net investment income per share would have been $0.14, total return would have been 13.13% and the ratio of net investment income to average net assets would have been 0.67%. |
| Includes a non-recurring dividend. Without this dividend, net investment income per share would have been $0.22, total return would have been 26.90% and the ratio of net investment income to average net assets would have been 0.92%. |
| Had certain expenses not been waived/reimbursed during the period, total returns would have been lower. |
| The investment adviser agreed to waive its fees and/or reimburse a portion of the Fund’s expenses during the period. Without this waiver/reimbursement, expenses would have been higher. |
| Effective July 1, 2021, the expense limit decreased from 1.00% to 0.75%. |
See accompanying notes to financial statements.
Financial Highlights (continued)
For a share outstanding throughout each period.
| Natixis Oakmark Fund—Class Y |
| Year Ended
December 31,
2023 | Year Ended
December 31,
2022 | Year Ended
December 31,
2021 | Year Ended
December 31,
2020 | Year Ended
December 31,
2019 |
Net asset value, beginning of the period | | | | | |
INCOME (LOSS) FROM INVESTMENT OPERATIONS: | | | | | |
| | | | | |
Net realized and unrealized gain (loss) | | | | | |
Total from Investment Operations | | | | | |
| | | | | |
| | | | | |
Net realized capital gains | | | | | |
| | | | | |
Net asset value, end of the period | | | | | |
| | | | | |
RATIOS TO AVERAGE NET ASSETS: | | | | | |
Net assets, end of the period (000's) | | | | | |
| | | | | |
| | | | | |
| | | | | |
| | | | | |
| Per share net investment income has been calculated using the average shares outstanding during the period. |
| Includes a non-recurring dividend. Without this dividend, net investment income per share would have been $0.12, total return would have been 13.00% and the ratio of net investment income to average net assets would have been 0.55%. |
| Includes a non-recurring dividend. Without this dividend, net investment income per share would have been $0.20, total return would have been 26.80% and the ratio of net investment income to average net assets would have been 0.90%. |
| Had certain expenses not been waived/reimbursed during the period, total returns would have been lower. |
| The investment adviser agreed to waive its fees and/or reimburse a portion of the Fund’s expenses during the period. Without this waiver/reimbursement, expenses would have been higher. |
| Effective July 1, 2021, the expense limit decreased from 1.05% to 0.80%. |
See accompanying notes to financial statements.
Financial Highlights (continued)
For a share outstanding throughout each period.
| Natixis Oakmark International Fund—Class A |
| Year Ended
December 31,
2023 | Year Ended
December 31,
2022 | Year Ended
December 31,
2021 | Year Ended
December 31,
2020 | Year Ended
December 31,
2019 |
Net asset value, beginning of the period | | | | | |
INCOME (LOSS) FROM INVESTMENT OPERATIONS: | | | | | |
Net investment income (loss)(a) | | | | | |
Net realized and unrealized gain (loss) | | | | | |
Total from Investment Operations | | | | | |
| | | | | |
| | | | | |
Net asset value, end of the period | | | | | |
| | | | | |
RATIOS TO AVERAGE NET ASSETS: | | | | | |
Net assets, end of the period (000's) | | | | | |
| | | | | |
| | | | | |
Net investment income (loss) | | | | | |
| | | | | |
| Per share net investment income (loss) has been calculated using the average shares outstanding during the period. |
| Includes tax reclaims. Without these, net investment income per share would have been $0.25, total return would have been 18.78% and the ratio of net investment income to average net assets would have been 1.74%. |
| Includes a non-recurring dividend and tax reclaims. Without these, net investment income per share would have been $0.13, total return would have been 7.74% and the ratio of net investment income to average net assets would have been 0.84%. |
| Amount rounds to less than $0.01 per share. |
| Includes non-recurring dividends. Without this dividend, net investment income per share would have been $0.29, total return would have been 23.55% and the ratio of net investment income to average net assets would have been 2.26%. |
| The amount shown for a share outstanding does not correspond with the aggregate realized and unrealized gain (loss) on investments for the period due to the timing of sales and redemptions of fund shares in relation to fluctuating market values of investments of the Fund. |
| A sales charge for Class A shares is not reflected in total return calculations. |
| Had certain expenses not been waived/reimbursed during the period, total returns would have been lower. |
| The investment adviser agreed to waive its fees and/or reimburse a portion of the Fund’s expenses during the period. Without this waiver/reimbursement, expenses would have been higher. |
| Effective July 1, 2021, the expense limit decreased from 1.20% to 1.15%. |
| Effective July 1, 2020, the expense limit decreased from 1.37% to 1.20%. |
See accompanying notes to financial statements.
Financial Highlights (continued)
For a share outstanding throughout each period.
| Natixis Oakmark International Fund—Class C |
| Year Ended
December 31,
2023 | Year Ended
December 31,
2022 | Year Ended
December 31,
2021 | Year Ended
December 31,
2020 | Year Ended
December 31,
2019 |
Net asset value, beginning of the period | | | | | |
INCOME (LOSS) FROM INVESTMENT OPERATIONS: | | | | | |
Net investment income (loss)(a) | | | | | |
Net realized and unrealized gain (loss) | | | | | |
Total from Investment Operations | | | | | |
| | | | | |
| | | | | |
Net asset value, end of the period | | | | | |
| | | | | |
RATIOS TO AVERAGE NET ASSETS: | | | | | |
Net assets, end of the period (000's) | | | | | |
| | | | | |
| | | | | |
Net investment income (loss) | | | | | |
| | | | | |
| Per share net investment income (loss) has been calculated using the average shares outstanding during the period. |
| Includes tax reclaims. Without these, net investment income per share would have been $0.15, total return would have been 17.85% and the ratio of net investment income to average net assets would have been 1.10%. |
| Includes a non-recurring dividend and tax reclaims. Without these, net investment income per share would have been $0.02, total return would have been 6.98% and the ratio of net investment income to average net assets would have been 0.13%. |
| Includes non-recurring dividends. Without this dividend, net investment income per share would have been $0.18, total return would have been 22.63% and the ratio of net investment income to average net assets would have been 1.43%. |
| The amount shown for a share outstanding does not correspond with the aggregate realized and unrealized gain (loss) on investments for the period due to the timing of sales and redemptions of fund shares in relation to fluctuating market values of investments of the Fund. |
| A contingent deferred sales charge for Class C shares is not reflected in total return calculations. |
| Had certain expenses not been waived/reimbursed during the period, total returns would have been lower. |
| The investment adviser agreed to waive its fees and/or reimburse a portion of the Fund’s expenses during the period. Without this waiver/reimbursement, expenses would have been higher. |
| Effective July 1, 2021, the expense limit decreased from 1.95% to 1.90%. |
| Effective July 1, 2020, the expense limit decreased from 2.12% to 1.95%. |
See accompanying notes to financial statements.
Financial Highlights (continued)
For a share outstanding throughout each period.
| Natixis Oakmark International Fund—Class N |
| Year Ended
December 31,
2023 | Year Ended
December 31,
2022 | Year Ended
December 31,
2021 | Year Ended
December 31,
2020 | Year Ended
December 31,
2019 |
Net asset value, beginning of the period | | | | | |
INCOME (LOSS) FROM INVESTMENT OPERATIONS: | | | | | |
| | | | | |
Net realized and unrealized gain (loss) | | | | | |
Total from Investment Operations | | | | | |
| | | | | |
| | | | | |
Net asset value, end of the period | | | | | |
| | | | | |
RATIOS TO AVERAGE NET ASSETS: | | | | | |
Net assets, end of the period (000's) | | | | | |
| | | | | |
| | | | | |
| | | | | |
| | | | | |
| Per share net investment income has been calculated using the average shares outstanding during the period. |
| Includes tax reclaims. Without these, net investment income per share would have been $0.27, total return would have been 19.14% and the ratio of net investment income to average net assets would have been 1.95%. |
| Includes a non-recurring dividend and tax reclaims. Without these, net investment income per share would have been $0.11, total return would have been 8.09% and the ratio of net investment income to average net assets would have been 0.70%. |
| Includes non-recurring dividends. Without this dividend, net investment income per share would have been $0.27, total return would have been 23.94% and the ratio of net investment income to average net assets would have been 2.15%. |
| The amount shown for a share outstanding does not correspond with the aggregate realized and unrealized gain (loss) on investments for the period due to the timing of sales and redemptions of fund shares in relation to fluctuating market values of investments of the Fund. |
| Had certain expenses not been waived/reimbursed during the period, total returns would have been lower. |
| The investment adviser agreed to waive its fees and/or reimburse a portion of the Fund’s expenses during the period. Without this waiver/reimbursement, expenses would have been higher. |
| Effective July 1, 2021, the expense limit decreased from 0.90% to 0.85%. |
| Effective July 1, 2020, the expense limit decreased from 1.07% to 0.90%. |
See accompanying notes to financial statements.
Financial Highlights (continued)
For a share outstanding throughout each period.
| Natixis Oakmark International Fund—Class Y |
| Year Ended
December 31,
2023 | Year Ended
December 31,
2022 | Year Ended
December 31,
2021 | Year Ended
December 31,
2020 | Year Ended
December 31,
2019 |
Net asset value, beginning of the period | | | | | |
INCOME (LOSS) FROM INVESTMENT OPERATIONS: | | | | | |
| | | | | |
Net realized and unrealized gain (loss) | | | | | |
Total from Investment Operations | | | | | |
| | | | | |
| | | | | |
Net asset value, end of the period | | | | | |
| | | | | |
RATIOS TO AVERAGE NET ASSETS: | | | | | |
Net assets, end of the period (000's) | | | | | |
| | | | | |
| | | | | |
| | | | | |
| | | | | |
| Per share net investment income has been calculated using the average shares outstanding during the period. |
| Includes tax reclaims. Without these, net investment income per share would have been $0.28, total return would have been 19.18% and the ratio of net investment income to average net assets would have been 1.98%. |
| Includes a non-recurring dividend and tax reclaims. Without these, net investment income per share would have been $0.17, total return would have been 8.04% and the ratio of net investment income to average net assets would have been 1.07%. |
| Includes non-recurring dividends. Without this dividend, net investment income per share would have been $0.29, total return would have been 23.84% and the ratio of net investment income to average net assets would have been 2.29%. |
| The amount shown for a share outstanding does not correspond with the aggregate realized and unrealized gain (loss) on investments for the period due to the timing of sales and redemptions of fund shares in relation to fluctuating market values of investments of the Fund. |
| Had certain expenses not been waived/reimbursed during the period, total returns would have been lower. |
| The investment adviser agreed to waive its fees and/or reimburse a portion of the Fund’s expenses during the period. Without this waiver/reimbursement, expenses would have been higher. |
| Effective July 1, 2021, the expense limit decreased from 0.95% to 0.90%. |
| Effective July 1, 2020, the expense limit decreased from 1.12% to 0.95%. |
See accompanying notes to financial statements.
Financial Highlights (continued)
For a share outstanding throughout each period.
| Natixis U.S. Equity Opportunities Fund—Class A |
| Year Ended
December 31,
2023 | Year Ended
December 31,
2022 | Year Ended
December 31,
2021 | Year Ended
December 31,
2020 | Year Ended
December 31,
2019 |
Net asset value, beginning of the period | | | | | |
INCOME (LOSS) FROM INVESTMENT OPERATIONS: | | | | | |
Net investment income (loss)(a) | | | | | |
Net realized and unrealized gain (loss) | | | | | |
Total from Investment Operations | | | | | |
| | | | | |
| | | | | |
Net realized capital gains | | | | | |
| | | | | |
Net asset value, end of the period | | | | | |
| | | | | |
RATIOS TO AVERAGE NET ASSETS: | | | | | |
Net assets, end of the period (000's) | | | | | |
| | | | | |
| | | | | |
Net investment income (loss) | | | | | |
| | | | | |
| Per share net investment income (loss) has been calculated using the average shares outstanding during the period. |
| Includes non-recurring dividends. Without this dividend, net investment income per share would have been $0.09, total return would have been 30.87% and the ratio of net investment income to average net assets would have been 0.26%. |
| A sales charge for Class A shares is not reflected in total return calculations. |
See accompanying notes to financial statements.
Financial Highlights (continued)
For a share outstanding throughout each period.
| Natixis U.S. Equity Opportunities Fund—Class C |
| Year Ended
December 31,
2023 | Year Ended
December 31,
2022 | Year Ended
December 31,
2021 | Year Ended
December 31,
2020 | Year Ended
December 31,
2019 |
Net asset value, beginning of the period | | | | | |
INCOME (LOSS) FROM INVESTMENT OPERATIONS: | | | | | |
| | | | | |
Net realized and unrealized gain (loss) | | | | | |
Total from Investment Operations | | | | | |
| | | | | |
| | | | | |
Net realized capital gains | | | | | |
| | | | | |
Net asset value, end of the period | | | | | |
| | | | | |
RATIOS TO AVERAGE NET ASSETS: | | | | | |
Net assets, end of the period (000's) | | | | | |
| | | | | |
| | | | | |
| | | | | |
| | | | | |
| Per share net investment loss has been calculated using the average shares outstanding during the period. |
| Includes non-recurring dividends. Without this dividend, net investment loss per share would have been $(0.11), total return would have been 29.85% and the ratio of net investment loss to average net assets would have been (0.48)%. |
| A contingent deferred sales charge for Class C shares is not reflected in total return calculations. |
See accompanying notes to financial statements.
Financial Highlights (continued)
For a share outstanding throughout each period.
| Natixis U.S. Equity Opportunities Fund—Class N |
| Year Ended
December 31,
2023 | Year Ended
December 31,
2022 | Year Ended
December 31,
2021 | Year Ended
December 31,
2020 | Year Ended
December 31,
2019 |
Net asset value, beginning of the period | | | | | |
INCOME (LOSS) FROM INVESTMENT OPERATIONS: | | | | | |
| | | | | |
Net realized and unrealized gain (loss) | | | | | |
Total from Investment Operations | | | | | |
| | | | | |
| | | | | |
Net realized capital gains | | | | | |
| | | | | |
Net asset value, end of the period | | | | | |
| | | | | |
RATIOS TO AVERAGE NET ASSETS: | | | | | |
Net assets, end of the period (000's) | | | | | |
| | | | | |
| | | | | |
| | | | | |
| | | | | |
| Per share net investment income has been calculated using the average shares outstanding during the period. |
| Includes non-recurring dividends. Without this dividend, net investment income per share would have been $0.19, total return would have been 31.27% and the ratio of net investment income to average net assets would have been 0.44%. |
| Had certain expenses not been waived/reimbursed during the period, total returns would have been lower. |
| The investment adviser agreed to waive its fees and/or reimburse a portion of the Fund’s expenses during the period. Without this waiver/reimbursement, expenses would have been higher. |
See accompanying notes to financial statements.
Financial Highlights (continued)
For a share outstanding throughout each period.
| Natixis U.S. Equity Opportunities Fund—Class Y |
| Year Ended
December 31,
2023 | Year Ended
December 31,
2022 | Year Ended
December 31,
2021 | Year Ended
December 31,
2020 | Year Ended
December 31,
2019 |
Net asset value, beginning of the period | | | | | |
INCOME (LOSS) FROM INVESTMENT OPERATIONS: | | | | | |
| | | | | |
Net realized and unrealized gain (loss) | | | | | |
Total from Investment Operations | | | | | |
| | | | | |
| | | | | |
Net realized capital gains | | | | | |
| | | | | |
Net asset value, end of the period | | | | | |
| | | | | |
RATIOS TO AVERAGE NET ASSETS: | | | | | |
Net assets, end of the period (000's) | | | | | |
| | | | | |
| | | | | |
| | | | | |
| | | | | |
| Per share net investment income has been calculated using the average shares outstanding during the period. |
| Amount rounds to less than $0.01 per share. |
| Includes non-recurring dividends. Without this dividend, net investment income per share would have been $0.22, total return would have been 31.16% and the ratio of net investment income to average net assets would have been 0.53%. |
| Had certain expenses not been waived/reimbursed during the period, total returns would have been lower. |
| The administrator agreed to waive its fees and/or reimburse a portion of the Fund’s expenses during the period. Without this waiver/reimbursement, expenses would have been higher. |
| Amount rounds to less than 0.01%. |
See accompanying notes to financial statements.
Financial Highlights (continued)
For a share outstanding throughout each period.
| Vaughan Nelson Mid Cap Fund—Class A |
| Year Ended
December 31,
2023 | Year Ended
December 31,
2022 | Year Ended
December 31,
2021 | Year Ended
December 31,
2020 | Year Ended
December 31,
2019 |
Net asset value, beginning of the period | | | | | |
INCOME (LOSS) FROM INVESTMENT OPERATIONS: | | | | | |
| | | | | |
Net realized and unrealized gain (loss) | | | | | |
Total from Investment Operations | | | | | |
| | | | | |
| | | | | |
Net realized capital gains | | | | | |
| | | | | |
Net asset value, end of the period | | | | | |
| | | | | |
RATIOS TO AVERAGE NET ASSETS: | | | | | |
Net assets, end of the period (000's) | | | | | |
| | | | | |
| | | | | |
| | | | | |
| | | | | |
| Per share net investment income has been calculated using the average shares outstanding during the period. |
| A sales charge for Class A shares is not reflected in total return calculations. |
| Had certain expenses not been waived/reimbursed during the period, total returns would have been lower. |
| The investment adviser agreed to waive its fees and/or reimburse a portion of the Fund’s expenses during the period. Without this waiver/reimbursement, expenses would have been higher. |
| Effective July 1, 2021, the expense limit decreased from 1.20% to 1.15%. |
| Effective July 1, 2019, the expense limit decreased from 1.40% to 1.20%. |
| Includes interest expense. Without this expense the ratio of net expenses would have been 1.23% and the ratio of gross expenses would have been 1.26%. |
See accompanying notes to financial statements.
Financial Highlights (continued)
For a share outstanding throughout each period.
| Vaughan Nelson Mid Cap Fund—Class C |
| Year Ended
December 31,
2023 | Year Ended
December 31,
2022 | Year Ended
December 31,
2021 | Year Ended
December 31,
2020 | Year Ended
December 31,
2019 |
Net asset value, beginning of the period | | | | | |
INCOME (LOSS) FROM INVESTMENT OPERATIONS: | | | | | |
| | | | | |
Net realized and unrealized gain (loss) | | | | | |
Total from Investment Operations | | | | | |
| | | | | |
| | | | | |
Net realized capital gains | | | | | |
| | | | | |
Net asset value, end of the period | | | | | |
| | | | | |
RATIOS TO AVERAGE NET ASSETS: | | | | | |
Net assets, end of the period (000's) | | | | | |
| | | | | |
| | | | | |
| | | | | |
| | | | | |
| Per share net investment loss has been calculated using the average shares outstanding during the period. |
| Amount rounds to less than $0.01 per share. |
| A contingent deferred sales charge for Class C shares is not reflected in total return calculations. |
| Had certain expenses not been waived/reimbursed during the period, total returns would have been lower. |
| The investment adviser agreed to waive its fees and/or reimburse a portion of the Fund’s expenses during the period. Without this waiver/reimbursement, expenses would have been higher. |
| Effective July 1, 2021, the expense limit decreased from 1.95% to 1.90%. |
| Effective July 1, 2019, the expense limit decreased from 2.15% to 1.95%. |
| Includes interest expense. Without this expense the ratio of net expenses would have been 1.98% and the ratio of gross expenses would have been 2.01%. |
See accompanying notes to financial statements.
Financial Highlights (continued)
For a share outstanding throughout each period.
| Vaughan Nelson Mid Cap Fund—Class N |
| Year Ended
December 31,
2023 | Year Ended
December 31,
2022 | Year Ended
December 31,
2021 | Year Ended
December 31,
2020 | Year Ended
December 31,
2019 |
Net asset value, beginning of the period | | | | | |
INCOME (LOSS) FROM INVESTMENT OPERATIONS: | | | | | |
| | | | | |
Net realized and unrealized gain (loss) | | | | | |
Total from Investment Operations | | | | | |
| | | | | |
| | | | | |
Net realized capital gains | | | | | |
| | | | | |
Net asset value, end of the period | | | | | |
| | | | | |
RATIOS TO AVERAGE NET ASSETS: | | | | | |
Net assets, end of the period (000's) | | | | | |
| | | | | |
| | | | | |
| | | | | |
| | | | | |
| Per share net investment income has been calculated using the average shares outstanding during the period. |
| Had certain expenses not been waived/reimbursed during the period, total returns would have been lower. |
| The investment adviser agreed to waive its fees and/or reimburse a portion of the Fund’s expenses during the period. Without this waiver/reimbursement, expenses would have been higher. |
| Effective July 1, 2021, the expense limit decreased from 0.90% to 0.85%. |
| Effective July 1, 2019, the expense limit decreased from 1.10% to 0.90%. |
| Includes interest expense. Without this expense the ratio of net expenses would have been 0.91% and the ratio of gross expenses would have been 0.91%. |
See accompanying notes to financial statements.
Financial Highlights (continued)
For a share outstanding throughout each period.
| Vaughan Nelson Mid Cap Fund—Class Y |
| Year Ended
December 31,
2023 | Year Ended
December 31,
2022 | Year Ended
December 31,
2021 | Year Ended
December 31,
2020 | Year Ended
December 31,
2019 |
Net asset value, beginning of the period | | | | | |
INCOME (LOSS) FROM INVESTMENT OPERATIONS: | | | | | |
| | | | | |
Net realized and unrealized gain (loss) | | | | | |
Total from Investment Operations | | | | | |
| | | | | |
| | | | | |
Net realized capital gains | | | | | |
| | | | | |
Net asset value, end of the period | | | | | |
| | | | | |
RATIOS TO AVERAGE NET ASSETS: | | | | | |
Net assets, end of the period (000's) | | | | | |
| | | | | |
| | | | | |
| | | | | |
| | | | | |
| Per share net investment income has been calculated using the average shares outstanding during the period. |
| Had certain expenses not been waived/reimbursed during the period, total returns would have been lower. |
| The investment adviser agreed to waive its fees and/or reimburse a portion of the Fund’s expenses during the period. Without this waiver/reimbursement, expenses would have been higher. |
| Effective July 1, 2021, the expense limit decreased from 0.95% to 0.90%. |
| Effective July 1, 2019, the expense limit decreased from 1.15% to 0.95%. |
| Includes interest expense. Without this expense the ratio of net expenses would have been 0.98% and the ratio of gross expenses would have been 1.01%. |
See accompanying notes to financial statements.
Financial Highlights (continued)
For a share outstanding throughout each period.
| Vaughan Nelson Small Cap Value Fund—Class A |
| Year Ended
December 31,
2023 | Year Ended
December 31,
2022 | Year Ended
December 31,
2021 | Year Ended
December 31,
2020 | Year Ended
December 31,
2019 |
Net asset value, beginning of the period | | | | | |
INCOME (LOSS) FROM INVESTMENT OPERATIONS: | | | | | |
Net investment income (loss)(a) | | | | | |
Net realized and unrealized gain (loss) | | | | | |
Total from Investment Operations | | | | | |
| | | | | |
| | | | | |
Net realized capital gains | | | | | |
| | | | | |
Net asset value, end of the period | | | | | |
| | | | | |
RATIOS TO AVERAGE NET ASSETS: | | | | | |
Net assets, end of the period (000's) | | | | | |
| | | | | |
| | | | | |
Net investment income (loss) | | | | | |
| | | | | |
| Per share net investment income (loss) has been calculated using the average shares outstanding during the period. |
| Amount rounds to less than $0.01 per share. |
| Includes a non-recurring dividend. Without this dividend, net investment loss per share would have been $(0.05), total return would have been 29.95% and the ratio of net investment loss to average net assets would have been (0.25)%. |
| A sales charge for Class A shares is not reflected in total return calculations. |
| Had certain expenses not been waived/reimbursed during the period, total returns would have been lower. |
| The investment adviser agreed to waive its fees and/or reimburse a portion of the Fund’s expenses during the period. Without this waiver/reimbursement, expenses would have been higher. |
| Effective July 1, 2021, the expense limit decreased from 1.30% to 1.25%. |
| Effective July 1, 2020, the expense limit decreased from 1.34% to 1.30%. |
| Effective July 1, 2019, the expense limit decreased from 1.45% to 1.34%. |
See accompanying notes to financial statements.
Financial Highlights (continued)
For a share outstanding throughout each period.
| Vaughan Nelson Small Cap Value Fund—Class C |
| Year Ended
December 31,
2023 | Year Ended
December 31,
2022 | Year Ended
December 31,
2021 | Year Ended
December 31,
2020 | Year Ended
December 31,
2019 |
Net asset value, beginning of the period | | | | | |
INCOME (LOSS) FROM INVESTMENT OPERATIONS: | | | | | |
| | | | | |
Net realized and unrealized gain (loss) | | | | | |
Total from Investment Operations | | | | | |
| | | | | |
| | | | | |
Net realized capital gains | | | | | |
| | | | | |
Net asset value, end of the period | | | | | |
| | | | | |
RATIOS TO AVERAGE NET ASSETS: | | | | | |
Net assets, end of the period (000's) | | | | | |
| | | | | |
| | | | | |
| | | | | |
| | | | | |
| Per share net investment loss has been calculated using the average shares outstanding during the period. |
| Includes a non-recurring dividend. Without this dividend, net investment loss per share would have been $(0.10), total return would have been 29.09% and the ratio of net investment loss to average net assets would have been (0.99)%. |
| Amount rounds to less than $0.01 per share. |
| A contingent deferred sales charge for Class C shares is not reflected in total return calculations. |
| Had certain expenses not been waived/reimbursed during the period, total returns would have been lower. |
| The investment adviser agreed to waive its fees and/or reimburse a portion of the Fund’s expenses during the period. Without this waiver/reimbursement, expenses would have been higher. |
| Effective July 1, 2021, the expense limit decreased from 2.05% to 2.00%. |
| Effective July 1, 2020, the expense limit decreased from 2.09% to 2.05%. |
| Effective July 1, 2019, the expense limit decreased from 2.20% to 2.09%. |
See accompanying notes to financial statements.
Financial Highlights (continued)
For a share outstanding throughout each period.
| Vaughan Nelson Small Cap Value Fund—Class N |
| Year Ended
December 31,
2023 | Year Ended
December 31,
2022 | Year Ended
December 31,
2021 | Year Ended
December 31,
2020 | Year Ended
December 31,
2019 |
Net asset value, beginning of the period | | | | | |
INCOME (LOSS) FROM INVESTMENT OPERATIONS: | | | | | |
| | | | | |
Net realized and unrealized gain (loss) | | | | | |
Total from Investment Operations | | | | | |
| | | | | |
| | | | | |
Net realized capital gains | | | | | |
| | | | | |
Net asset value, end of the period | | | | | |
| | | | | |
RATIOS TO AVERAGE NET ASSETS: | | | | | |
Net assets, end of the period (000's) | | | | | |
| | | | | |
| | | | | |
| | | | | |
| | | | | |
| Per share net investment income has been calculated using the average shares outstanding during the period. |
| Includes a non-recurring dividend. Without this dividend, net investment income per share would have been $0.01, total return would have been 30.37% and the ratio of net investment income to average net assets would have been 0.03%. |
| Had certain expenses not been waived/reimbursed during the period, total returns would have been lower. |
| The investment adviser agreed to waive its fees and/or reimburse a portion of the Fund’s expenses during the period. Without this waiver/reimbursement, expenses would have been higher. |
| Effective July 1, 2021, the expense limit decreased from 1.00% to 0.95%. |
| Effective July 1, 2020, the expense limit decreased from 1.04% to 1.00%. |
| Effective July 1, 2019, the expense limit decreased from 1.15% to 1.04%. |
See accompanying notes to financial statements.
Financial Highlights (continued)
For a share outstanding throughout each period.
| Vaughan Nelson Small Cap Value Fund—Class Y |
| Year Ended
December 31,
2023 | Year Ended
December 31,
2022 | Year Ended
December 31,
2021 | Year Ended
December 31,
2020 | Year Ended
December 31,
2019 |
Net asset value, beginning of the period | | | | | |
INCOME (LOSS) FROM INVESTMENT OPERATIONS: | | | | | |
| | | | | |
Net realized and unrealized gain (loss) | | | | | |
Total from Investment Operations | | | | | |
| | | | | |
| | | | | |
Net realized capital gains | | | | | |
| | | | | |
Net asset value, end of the period | | | | | |
| | | | | |
RATIOS TO AVERAGE NET ASSETS: | | | | | |
Net assets, end of the period (000's) | | | | | |
| | | | | |
| | | | | |
| | | | | |
| | | | | |
| Per share net investment income has been calculated using the average shares outstanding during the period. |
| Includes a non-recurring dividend. Without this dividend, net investment income per share would have been $0.00, total return would have been 30.26% and the ratio of net investment income to average net assets would have been 0.01%. |
| Had certain expenses not been waived/reimbursed during the period, total returns would have been lower. |
| The investment adviser agreed to waive its fees and/or reimburse a portion of the Fund’s expenses during the period. Without this waiver/reimbursement, expenses would have been higher. |
| Effective July 1, 2021, the expense limit decreased from 1.05% to 1.00%. |
| Effective July 1, 2020, the expense limit decreased from 1.09% to 1.05%. |
| Effective July 1, 2019, the expense limit decreased from 1.20% to 1.09%. |
See accompanying notes to financial statements.
Notes to Financial Statements
1.Organization. Loomis Sayles Funds II, Natixis Funds Trust I and Natixis Funds Trust II (the “Trusts” and each a “Trust”) are each organized as a Massachusetts business trust. Each Trust is registered under the Investment Company Act of 1940, as amended (the “1940 Act”), as an open-end management investment company. Each Declaration of Trust permits the Board of Trustees to authorize the issuance of an unlimited number of shares of the Trust in multiple series. The financial statements for certain funds of the Trusts are presented in separate reports. The following funds (individually, a “Fund” and collectively, the “Funds”) are included in this report:
Loomis Sayles Funds II:
Loomis Sayles International Growth Fund (“International Growth Fund”)
Natixis Funds Trust I:
Natixis Oakmark International Fund
Natixis U.S. Equity Opportunities Fund (“U.S. Equity Opportunities Fund”)
Vaughan Nelson Small Cap Value Fund (“Small Cap Value Fund”)
Natixis Funds Trust II:
Natixis Oakmark Fund
Vaughan Nelson Mid Cap Fund (“Mid Cap Fund”)
Each Fund is a diversified investment company, except for International Growth Fund, which is a non-diversified investment company.
Each Fund offers Class A, Class C, Class N and Class Y shares.
Class A shares are sold with a maximum front-end sales charge of 5.75%. Class C shares do not pay a front-end sales charge, pay higher Rule 12b-1 fees than Class A shares for eight years (at which point they automatically convert to Class A shares) (prior to May 1, 2021, Class C shares automatically converted to Class A shares after ten years) and may be subject to a contingent deferred sales charge (“CDSC”) of 1.00% if those shares are redeemed within one year of acquisition, except for reinvested distributions. Class N and Class Y shares do not pay a front-end sales charge, a CDSC or Rule 12b-1 fees. Class N shares are offered with an initial minimum investment of $1,000,000. Class Y shares are offered with an initial minimum investment of $100,000. Certain categories of investors are exempted from the minimum investment amounts for Class N and Class Y as outlined in the relevant Funds’ prospectus.
Most expenses can be directly attributed to a Fund. Expenses which cannot be directly attributed to a Fund are generally apportioned based on the relative net assets of each of the Funds in Natixis Funds Trust I, Natixis Funds Trust II, Natixis Funds Trust IV and Gateway Trust (“Natixis Funds Trusts”), Loomis Sayles Funds I and Loomis Sayles Funds II (“Loomis Sayles Funds Trusts”) and Natixis ETF Trust and Natixis ETF Trust II (“Natixis ETF Trusts”). Expenses of a Fund are borne pro rata by the holders of each class of shares, except that each class bears expenses unique to that class (such as the Rule 12b-1 fees applicable to Class A and Class C), and transfer agent fees are borne collectively for Class A, Class C and Class Y, and individually for Class N. In addition, each class votes as a class only with respect to its own Rule 12b-1 Plan. Shares of each class would receive their pro rata share of the net assets of the Fund if the Fund were liquidated. The Trustees approve separate distributions from net investment income on each class of shares.
2.Significant Accounting Policies. The following is a summary of significant accounting policies consistently followed by each Fund in the preparation of its financial statements. The Funds' financial statements follow the accounting and reporting guidelines provided for investment companies and are prepared in accordance with accounting principles generally accepted in the United States of America which require the use of management estimates that affect the reported amounts and disclosures in the financial statements. Actual results could differ from those estimates. Management has evaluated the events and transactions subsequent to year-end through the date the financial statements were issued and has determined that there were no material events that would require disclosure in the Funds' financial statements.
a. Valuation. Registered investment companies are required to value portfolio investments using an unadjusted, readily available market quotation. Each Fund obtains readily available market quotations from independent pricing services. Fund investments for which readily available market quotations are not available are priced at fair value pursuant to the Funds’ Valuation Procedures. The Board of Trustees has approved a valuation designee who is subject to the Board’s oversight.
Unadjusted readily available market quotations that are utilized for exchange traded equity securities (including shares of closed-end investment companies and exchange-traded funds) include the last sale price quoted on the exchange where the security is traded most extensively. Shares of open-end investment companies are valued at net asset value (“NAV”) per share.
Exchange traded equity securities for which there is no reported sale during the day are fair valued at the closing bid quotation as reported by an independent pricing service. Unlisted equity securities (except unlisted preferred equity securities) are fair valued at the last sale price quoted in the market where they are traded most extensively or, if there is no reported sale during the day, the closing
Notes to Financial Statements (continued)
bid quotation as reported by an independent pricing service. If there is no last sale price or closing bid quotation available, unlisted equity securities will be fair valued using evaluated bids furnished by an independent pricing service, if available.
Debt securities and unlisted preferred equity securities are fair valued based on evaluated bids furnished to the Funds by an independent pricing service or bid prices obtained from broker-dealers. Broker-dealer bid prices may be used to fair value debt and unlisted equities where an independent pricing service is unable to price an investment or where an independent pricing service does not provide a reliable price for the investment. Forward foreign currency contracts are fair valued utilizing interpolated rates determined based on information provided by an independent pricing service.
The Funds may also fair value investments in other circumstances such as when extraordinary events occur after the close of a foreign market, but prior to the close of the New York Stock Exchange. This may include situations relating to a single issuer (such as a declaration of bankruptcy or a delisting of the issuer’s security from the primary market on which it has traded) as well as events affecting the securities markets in general (such as market disruptions or closings and significant fluctuations in U.S. and/or foreign markets). When fair valuing a Fund’s investments, the valuation designee may, among other things, use modeling tools or other processes that may take into account factors such as issuer specific information, or other related market activity and/or information that occurred after the close of the foreign market but before the time the Fund’s NAV is calculated. Fair valuation by the Fund(s) valuation designee may require subjective determinations about the value of the investment, and fair values used to determine a Fund’s NAV may differ from quoted or published prices, or from prices that are used by others, for the same investments. In addition, the use of fair value pricing may not always result in adjustments to the prices of investments held by a Fund.
b. Investment Transactions and Related Investment Income. Investment transactions are accounted for on a trade date plus one day basis for daily NAV calculation. However, for financial reporting purposes, investment transactions are reported on trade date. Dividend income (including income reinvested) and foreign withholding tax, if applicable, is recorded on the ex-dividend date, or in the case of certain foreign securities, as soon as a Fund is notified, and interest income is recorded on an accrual basis. Dividends reinvested and stock dividends are reflected as non-cash dividends on the Statements of Operations. Interest income is increased by the accretion of discount and decreased by the amortization of premium, if applicable. Distributions received from investments in securities that represent a return of capital or capital gain are recorded as a reduction of cost of investments or as a realized gain, respectively. The calendar year-end amounts of ordinary income, capital gains and return of capital included in distributions received from the Funds’ investments in real estate investment trusts (“REITs”) are reported to the Funds after the end of the fiscal year; accordingly, the Funds estimate these amounts for accounting purposes until the characterization of REIT distributions is reported to the Funds after the end of the fiscal year. Estimates are based on the most recent REIT distribution information available. In determining net gain or loss on securities sold, the cost of securities has been determined on an identified cost basis. Investment income, non-class specific expenses and realized and unrealized gains and losses are allocated on a pro rata basis to each class based on the relative net assets of each class to the total net assets of the Fund.
c. Foreign Currency Translation. The books and records of the Funds are maintained in U.S. dollars. The values of securities, currencies and other assets and liabilities denominated in currencies other than U.S. dollars, if any, are translated into U.S. dollars based upon foreign exchange rates prevailing at the end of the period. Purchases and sales of investment securities, income and expenses are translated into U.S. dollars on the respective dates of such transactions.
Net realized foreign exchange gains or losses arise from sales of foreign currency, changes in exchange rates between the trade and settlement dates on securities transactions and the difference between the amounts of dividends, interest and foreign withholding taxes recorded in the Funds’ books and records and the U.S. dollar equivalent of the amounts actually received or paid. Net unrealized foreign exchange gains or losses arise from changes in the value of assets and liabilities, other than investment securities, as of the end of the fiscal period, resulting from changes in exchange rates. Net realized foreign exchange gains or losses and the net change in unrealized foreign exchange gains or losses are disclosed in the Statements of Operations. For federal income tax purposes, net realized foreign exchange gains or losses are characterized as ordinary income, and may, if the Funds have net losses, reduce the amount of income available to be distributed by the Funds.
The values of investment securities are presented at the foreign exchange rates prevailing at the end of the period for financial reporting purposes. Net realized and unrealized gains or losses on investments reported in the Statements of Operations reflect gains or losses resulting from changes in exchange rates and fluctuations which arise due to changes in market prices of investment securities. For federal income tax purposes, a portion of the net realized gain or loss on investments arising from changes in exchange rates, which is reflected in the Statements of Operations, may be characterized as ordinary income and may, if the Funds have net losses, reduce the amount of income available to be distributed by the Funds.
The Funds may use foreign currency exchange contracts to facilitate transactions in foreign-denominated investments. Losses may arise from changes in the value of the foreign currency or if the counterparties do not perform under the contracts’ terms.
Notes to Financial Statements (continued)
d. Forward Foreign Currency Contracts. A Fund may enter into forward foreign currency contracts, including forward foreign cross currency contracts, to acquire exposure to foreign currencies or to hedge the Funds’ investments against currency fluctuation. A contract can also be used to offset a previous contract. These contracts involve market risk in excess of the unrealized appreciation (depreciation) reflected in the Funds’ Statements of Assets and Liabilities. The U.S. dollar value of the currencies a Fund has committed to buy or sell represents the aggregate exposure to each currency a Fund has acquired or hedged through currency contracts outstanding at period end. Gains or losses are recorded for financial statement purposes as unrealized until settlement date. Contracts are traded over-the-counter directly with a counterparty. Risks may arise upon entering into these contracts from the potential inability of counterparties to meet the terms of their contracts and from unanticipated movements in the value of a foreign currency relative to the U.S. dollar. Certain contracts may require the movement of cash and/or securities as collateral for the Funds’ or counterparty’s net obligations under the contracts. Forward foreign currency contracts outstanding at the end of the period, if any, are listed in each applicable Fund's Portfolio of Investments.
e. Federal and Foreign Income Taxes. The Trusts treat each Fund as a separate entity for federal income tax purposes. Each Fund intends to meet the requirements of the Internal Revenue Code of 1986, as amended, applicable to regulated investment companies, and to distribute to its shareholders substantially all of its net investment income and any net realized capital gains at least annually. Management has performed an analysis of each Fund’s tax positions for the open tax years as of December 31, 2023 and has concluded that no provisions for income tax are required. The Funds’ federal tax returns for the prior three fiscal years remain subject to examination by the Internal Revenue Service. Management is not aware of any events that are reasonably possible to occur in the next twelve months that would result in the amounts of any unrecognized tax benefits significantly increasing or decreasing for the Funds. However, management’s conclusions regarding tax positions taken may be subject to review and adjustment at a later date based on factors including, but not limited to, new tax laws and accounting regulations and interpretations thereof.
A Fund may be subject to foreign withholding taxes on investment income and taxes on capital gains on investments that are accrued and paid based upon the Fund’s understanding of the tax rules and regulations that exist in the countries in which the Fund invests. Foreign withholding taxes on dividend and interest income are reflected on the Statements of Operations as a reduction of investment income, net of amounts that have been or are expected to be reclaimed and paid. Dividends and interest receivable on the Statements of Assets and Liabilities are net of foreign withholding taxes. Foreign withholding taxes where reclaims have been or are expected to be filed and paid are reflected on the Statements of Assets and Liabilities as tax reclaims receivable. Capital gains taxes paid are included in net realized gain (loss) on investments in the Statements of Operations. Accrued but unpaid capital gains taxes are reflected as foreign taxes payable on the Statements of Assets and Liabilities, if applicable, and reduce unrealized gains on investments. In the event that realized gains on investments are subsequently offset by realized losses, taxes paid on realized gains may be returned to a Fund. Such amounts, if applicable, are reflected as foreign tax rebates receivable on the Statements of Assets and Liabilities and are recorded as a realized gain when received.
Certain Funds have filed tax reclaims for previously withheld taxes on dividends earned in certain European Union countries (“EU reclaims”) and may continue to make such filings when it is determined to be in the best interest of the Funds and their shareholders. These filings are subject to various administrative proceedings by the local jurisdictions’ tax authorities within the European Union, as well as a number of related judicial proceedings. EU reclaims are recognized by a Fund when deemed more likely than not to be collected, and are reflected as a reduction of foreign taxes withheld in the Statements of Operations. Any related receivable is reflected as tax reclaims receivable in the Statements of Assets and Liabilities. Under certain circumstances, EU reclaims may be subject to closing agreements with the Internal Revenue Service ("IRS"), which may materially reduce the reclaim amounts realized by the Funds. Fees and expenses associated with closing agreements will be reflected in the Statements of Operations when it is determined that a closing agreement with the IRS is required.
f. Dividends and Distributions to Shareholders. Dividends and distributions are recorded on the ex-dividend date. The timing and characterization of certain income and capital gain distributions are determined in accordance with federal tax regulations, which may differ from accounting principles generally accepted in the United States of America. Permanent differences are primarily due to differing treatments for book and tax purposes of items such as capital gains taxes, deferred Trustees’ fees, forward foreign currency contract mark-to-market, tax equalization, distribution re-designations, foreign currency gains and losses, corporate actions, passive foreign investment company adjustments, return of capital distributions received and capital gain distribution received. Permanent book and tax basis differences relating to shareholder distributions, net investment income and net realized gains will result in reclassifications to capital accounts reported on the Statements of Assets and Liabilities. Temporary differences between book and tax distributable earnings are primarily due to capital gains taxes, wash sales, forward foreign currency contract mark-to-market, return of capital distributions received, corporate actions, deferred Trustees’ fees, deferral of EU reclaims, capital gain distribution received and passive foreign investment company adjustments. Amounts of income and capital gain available to be distributed on a tax basis are
Notes to Financial Statements (continued)
determined annually, and at other times during the Funds’ fiscal year as may be necessary to avoid knowingly declaring and paying a return of capital distribution. Distributions from net investment income and short-term capital gains are considered to be distributed from ordinary income for tax purposes.
The tax characterization of distributions is determined on an annual basis. The tax character of distributions paid to shareholders during the years ended December 31, 2023 and 2022 was as follows:
| | |
| | | | | | |
International Growth Fund | | | | | | |
| | | | | | |
Natixis Oakmark International Fund | | | | | | |
U.S. Equity Opportunities Fund | | | | | | |
| | | | | | |
| | | | | | |
Distributions paid to shareholders from net investment income and net realized capital gains, based on accounting principles generally accepted in the United States of America, are consolidated and reported on the Statements of Changes in Net Assets as Distributions to Shareholders. Distributions paid to shareholders from net investment income and net realized capital gains expressed in per-share amounts, based on accounting principles generally accepted in the United States of America, are separately stated and reported within the Financial Highlights.
As of December 31, 2023, the components of distributable earnings on a tax basis were as follows:
| | | Natixis
Oakmark
International
Fund | U.S.
Equity
Opportunities
Fund |
Undistributed ordinary income | | | | |
Undistributed long-term capital gains | | | | |
Total undistributed earnings | | | | |
Capital loss carryforward: | | | | |
| | | | |
| | | | |
| | | | |
| | | | |
Total capital loss carryforward | | | | |
Late-year ordinary and post-October
| | | | |
Unrealized appreciation (depreciation) | | | | |
Total accumulated earnings (losses) | | | | |
Notes to Financial Statements (continued)
| | |
Undistributed ordinary income | | |
Capital loss carryforward: | | |
| | |
| | |
| | |
| | |
Total capital loss carryforward | | |
| | |
Total accumulated earnings | | |
| Under current tax law, net operating losses, capital losses, foreign currency losses, and losses on passive foreign investment companies and contingent payment debt instruments after October 31 or December 31, as applicable, may be deferred and treated as occurring on the first day of the following taxable year. U.S. Equity Opportunities Fund is deferring capital losses. |
As of December 31, 2023, the tax cost of investments (including derivatives, if applicable) and unrealized appreciation (depreciation) on a federal tax basis were as follows:
| | | Natixis
Oakmark
International
Fund | U.S.
Equity
Opportunities
Fund | | |
| | | | | | |
| | | | | | |
| | | | | | |
Net tax appreciation (depreciation) | | | | | | |
The difference between these amounts and those reported in the components of distributable earnings, if any, are primarily attributable to foreign currency mark-to-market and foreign capital gains taxes.
g. Repurchase Agreements. Each Fund may enter into repurchase agreements, under the terms of a Master Repurchase Agreement, under which each Fund acquires securities as collateral and agrees to resell the securities at an agreed upon time and at an agreed upon price. It is each Fund’s policy that the market value of the collateral for repurchase agreements be at least equal to 102% of the repurchase price, including interest. Certain repurchase agreements are tri-party arrangements whereby the collateral is held in a segregated account for the benefit of the Fund and on behalf of the counterparty. Repurchase agreements could involve certain risks in the event of default or insolvency of the counterparty, including possible delays or restrictions upon a Fund’s ability to dispose of the underlying securities. As of December 31, 2023, each Fund, as applicable, had investments in repurchase agreements for which the value of the related collateral exceeded the value of the repurchase agreement. The gross value of repurchase agreements is included in the Statements of Assets and Liabilities for financial reporting purposes.
h. Indemnifications. Under the Trusts’ organizational documents, their officers and Trustees are indemnified against certain liabilities arising out of the performance of their duties to the Funds. Additionally, in the normal course of business, the Funds enter into contracts with service providers that contain general indemnification clauses. The Funds' maximum exposure under these arrangements is unknown as this would involve future claims that may be made against the Funds that have not yet occurred. However, based on experience, the Funds expect the risk of loss to be remote.
i. Regulatory Update. Effective January 24, 2023, the SEC adopted a release (the “Release”) containing rule and form amendments to require mutual funds and ETFs to transmit concise and visually engaging streamlined annual and semiannual reports to shareholders that highlight key information deemed important for retail investors to assess and monitor their fund investments. Other information, including financial statements, will no longer appear in the new tailored shareholder reports but will be available online, delivered free of charge upon request, and filed with the SEC on a semiannual basis on Form N-CSR. In addition to the removal of financial statements from the new tailored shareholder reports, the Release requires mandatory mailing of the reports, unless a shareholder specifically opts out and chooses electronic delivery. The Release also requires that the new tailored shareholder reports be no longer than 2-4 pages, include only a single share class of a single fund, and use a broad-based securities market index for performance comparison
Notes to Financial Statements (continued)
purposes. Management is evaluating the impact of the Release on the content of the current shareholder report and newly created tailored shareholder reports and expects to meet the required compliance date of July 24, 2024.
3.Fair Value Measurements. In accordance with accounting standards related to fair value measurements and disclosures, the Funds have categorized the inputs utilized in determining the value of each Fund’s assets or liabilities. These inputs are summarized in the three broad levels listed below:
• Level 1 — quoted prices in active markets for identical assets or liabilities;
• Level 2 — prices determined using other significant inputs that are observable either directly, or indirectly through corroboration with observable market data (which could include quoted prices for similar assets or liabilities, interest rates, credit risk, etc.); and
• Level 3 — prices determined using significant unobservable inputs when quoted prices or observable inputs are unavailable such as when there is little or no market activity for an asset or liability (unobservable inputs reflect each Fund’s own assumptions in determining the fair value of assets or liabilities and would be based on the best information available).
The inputs or methodology used for valuing securities are not necessarily an indication of the risk associated with investing in those securities.
The Funds' pricing policies have been approved by the Board of Trustees. Investments for which market quotations are readily available are categorized in Level 1. Other investments for which an independent pricing service is utilized are categorized in Level 2. Broker-dealer bid prices for which the Funds have knowledge of the inputs used by the broker-dealer are categorized in Level 2. All other investments, including broker-dealer bid prices for which the Funds do not have knowledge of the inputs used by the broker-dealer, as well as investments fair valued by the valuation designee, are categorized in Level 3. All Level 2 and 3 securities are defined as being fair valued.
Under certain conditions and based upon specific facts and circumstances, the Fund’s valuation designee may determine that a fair valuation should be made for portfolio investment(s). These valuation designee fair valuations will be based upon a significant amount of Level 3 inputs.
The following is a summary of the inputs used to value the Funds' investments as of December 31, 2023, at value:
International Growth Fund |
|
| | | | |
| | | | |
| | | | |
| | | | |
| | | | |
| | | | |
| | | | |
| | | | |
| | | | |
| | | | |
| | | | |
| | | | |
| | | | |
| | | | |
All Other Common Stocks(a) | | | | |
| | | | |
| | | | |
| | | | |
| Details of the major categories of the Fund’s investments are reflected within the Portfolio of Investments. |
Notes to Financial Statements (continued)
| Details of the major categories of the Fund’s investments are reflected within the Portfolio of Investments. |
Natixis Oakmark International Fund |
|
| | | | |
| | | | |
| | | | |
| | | | |
| | | | |
| | | | |
| | | | |
| | | | |
| | | | |
| | | | |
| | | | |
| | | | |
| | | | |
| | | | |
| | | | |
| | | | |
| | | | |
All Other Common Stocks(a) | | | | |
| | | | |
| | | | |
| | | | |
| | | | |
| Details of the major categories of the Fund’s investments are reflected within the Portfolio of Investments. |
U.S. Equity Opportunities Fund |
|
| | | | |
| | | | |
| | | | |
| | | | |
| Details of the major categories of the Fund’s investments are reflected within the Portfolio of Investments. |
Notes to Financial Statements (continued)
| Details of the major categories of the Fund’s investments are reflected within the Portfolio of Investments. |
| Details of the major categories of the Fund’s investments are reflected within the Portfolio of Investments. |
4.Purchases and Sales of Securities. For the year ended December 31, 2023, purchases and sales of securities (excluding short-term investments) were as follows:
| | |
International Growth Fund | | |
| | |
Natixis Oakmark International Fund | | |
U.S. Equity Opportunities Fund | | |
| | |
| | |
5.Management Fees and Other Transactions with Affiliates.
a. Management Fees. Loomis, Sayles & Company, L.P. (“Loomis Sayles”) serves as investment adviser to International Growth Fund. Loomis Sayles is a limited partnership whose sole general partner, Loomis, Sayles & Company, Inc., is indirectly owned by Natixis Investment Managers, LLC, which is part of Natixis Investment Managers, an international asset management group based in Paris, France.
Under the terms of the management agreement, International Growth Fund pays a management fee at the annual rate of 0.75%, calculated daily and payable monthly, based on the Fund’s average daily net assets.
Natixis Advisors, LLC (“Natixis Advisors”) serves as investment adviser to Natixis Oakmark Fund, Natixis Oakmark International Fund, U.S. Equity Opportunities Fund, Mid Cap Fund and Small Cap Value Fund. Under the terms of the management agreements, each Fund pays a management fee at the following annual rates, calculated daily and payable monthly, based on each Fund’s average daily net assets:
| Percentage of Average Daily Net Assets |
| | | | | | |
| | | | | | |
Natixis Oakmark International Fund | | | | | | |
U.S. Equity Opportunities Fund | | | | | | |
| | | | | | |
| | | | | | |
Notes to Financial Statements (continued)
Prior to July 1, 2023, U.S. Equity Opportunities Fund paid a management fee at the annual rate of 0.70% of the Fund’s average daily net assets, calculated daily and payable monthly.
Natixis Advisors has entered into subadvisory agreements for each Fund as listed below.
| |
| Harris Associates L.P. (“Harris”) |
Natixis Oakmark International Fund | |
U.S. Equity Opportunities Fund | |
| Vaughan Nelson Investment Management, L.P. (“Vaughan Nelson”) |
| |
Natixis Advisors, Harris and Vaughan Nelson are subsidiaries of Natixis Investment Managers, LLC.
Under the terms of the subadvisory agreements, each Fund has agreed to pay its respective subadviser a subadvisory fee at the following annual rates, calculated daily and payable monthly, based on each Fund’s average daily net assets:
| | Percentage of Average
Daily Net Assets |
| | | | | | |
| | | | | | |
Natixis Oakmark International Fund | | | | | | |
U.S. Equity Opportunities Fund | | | | | | |
| | | | | | |
| | | | | | |
| | | | | | |
| | | | | | |
Prior to July 1, 2023, U.S. Equity Opportunities Fund Large Cap Value Segment had paid its respective subadviser a subadvisory fee at the following annual rates, calculated daily and payable monthly, based on the Fund’s average daily net assets:
| | Percentage of Average
Daily Net Assets |
| | | | | | |
U.S. Equity Opportunities Fund | | | | | | |
| | | | | | |
Loomis Sayles and Natixis Advisors have given binding undertakings to the Funds to waive management fees and/or reimburse certain expenses to limit the Funds’ operating expenses, exclusive of acquired fund fees and expenses, brokerage expenses, interest expense, substitute dividend expenses on securities sold short, taxes, organizational and extraordinary expenses such as litigation and indemnification expenses. These undertakings are in effect until April 30, 2024, except for U.S. Equity Opportunities Fund which is in effect until April 30, 2025, may be terminated before then only with the consent of the Funds’ Board of Trustees, and are reevaluated on an annual basis. Management fees payable, as reflected on the Statements of Assets and Liabilities, is net of waivers and/or expense reimbursements, if any, pursuant to these undertakings. Waivers/reimbursements that exceed management fees payable are reflected on the Statements of Assets and Liabilities as receivable from investment adviser.
Notes to Financial Statements (continued)
For the year ended December 31, 2023, the expense limits as a percentage of average daily net assets under the expense limitation agreements were as follows:
| Expense Limit as a Percentage of
Average Daily Net Assets |
| | | | |
International Growth Fund | | | | |
| | | | |
Natixis Oakmark International Fund | | | | |
U.S. Equity Opportunities Fund | | | | |
| | | | |
| | | | |
Prior to July 1, 2023, the expense limits as a percentage of average daily net assets under the expense limitation agreements for U.S. Equity Opportunities Fund were as follows:
| Expense Limit as a Percentage of
Average Daily Net Assets |
| | | | |
U.S. Equity Opportunities Fund | | | | |
Loomis Sayles and Natixis Advisors shall be permitted to recover expenses borne under the expense limitation agreements (whether through waiver of management fee or otherwise) on a class by class basis in later periods to the extent the annual operating expenses of a class fall below both (1) a class’ expense limitation ratio in place at the time such amounts were waived/reimbursed and (2) a class’ current applicable expense limitation ratio, provided, however, that a class is not obligated to pay such waived/reimbursed fees or expenses more than one year after the end of the fiscal year in which the fees or expenses were waived/reimbursed.
For the year ended December 31, 2023, the management fees and waiver of management fees for each Fund were as follows:
| | Contractual
Waivers of
Management
| | Percentage of
Average
Daily Net Assets |
| | |
International Growth Fund | | | | | |
| | | | | |
Natixis Oakmark International Fund | | | | | |
U.S. Equity Opportunities Fund | | | | | |
| | | | | |
| | | | | |
| Management fee waivers are subject to possible recovery until December 31, 2024. |
No expenses were recovered for any of the Funds during the year ended December 31, 2023 under the terms of the expense limitation agreements.
b. Service and Distribution Fees. Natixis Distribution, LLC (“Natixis Distribution"), which is a wholly-owned subsidiary of Natixis Investment Managers, LLC, has entered into a distribution agreement with the Trusts. Pursuant to this agreement, Natixis Distribution serves as principal underwriter of the Funds of the Trusts.
Pursuant to Rule 12b-1 under the 1940 Act, the Trusts have adopted a Service Plan relating to each Fund’s Class A shares (the “Class A Plans”), a Distribution and Service Plan relating to each Fund’s Class C shares (the “Class C Plans”).
Under the Class A Plans, each Fund pays Natixis Distribution a monthly service fee at an annual rate not to exceed 0.25% of the average daily net assets attributable to the Funds’ Class A shares, as reimbursement for expenses incurred by Natixis Distribution in providing personal services to investors in Class A shares and/or the maintenance of shareholder accounts.
Under the Class C Plans, each Fund pays Natixis Distribution a monthly service fee at an annual rate not to exceed 0.25% of the average daily net assets attributable to the Funds’ Class C shares, as compensation for services provided by Natixis Distribution in providing personal services to investors in Class C shares and/or the maintenance of shareholder accounts.
Notes to Financial Statements (continued)
Also under the Class C Plans, each Fund pays Natixis Distribution a monthly distribution fee at an annual rate of 0.75% of the average daily net assets attributable to the Funds’ Class C shares, as compensation for services provided by Natixis Distribution in connection with the marketing or sale of Class C shares.
For the year ended December 31, 2023, the service and distribution fees for each Fund were as follows:
| | | |
| | | | |
International Growth Fund | | | | |
| | | | |
Natixis Oakmark International Fund | | | | |
U.S. Equity Opportunities Fund | | | | |
| | | | |
| | | | |
c. Administrative Fees. Natixis Advisors provides certain administrative services for the Funds and contracts with State Street Bank and Trust Company (“State Street Bank”) to serve as sub-administrator. Pursuant to an agreement among Natixis Funds Trusts, Loomis Sayles Funds Trusts, Natixis ETF Trusts and Natixis Advisors, each Fund pays Natixis Advisors monthly its pro rata portion of fees equal to an annual rate of 0.0540% of the first $15 billion of the average daily net assets of the Natixis Funds Trusts, Loomis Sayles Funds Trusts and Natixis ETF Trusts, 0.0500% of the next $15 billion, 0.0400% of the next $30 billion, 0.0275% of the next $30 billion and 0.0225% of such assets in excess of $90 billion, subject to an annual aggregate minimum fee for the Natixis Funds Trusts, Loomis Sayles Funds Trusts and Natixis ETF Trusts of $10 million, which is reevaluated on an annual basis.
For the year ended December 31, 2023, the administrative fees for each Fund were as follows:
| |
International Growth Fund | |
| |
Natixis Oakmark International Fund | |
U.S. Equity Opportunities Fund | |
| |
| |
d. Sub-Transfer Agent Fees. Natixis Distribution has entered into agreements, which include servicing agreements, with financial intermediaries that provide recordkeeping, processing, shareholder communications and other services to customers of the intermediaries that hold positions in the Funds and has agreed to compensate the intermediaries for providing those services. Intermediaries transact with the Funds primarily through the use of omnibus accounts on behalf of their customers who hold positions in the Funds. These services would have been provided by the Funds’ transfer agent and other service providers if the shareholders’ accounts were maintained directly at the Funds’ transfer agent. Accordingly, the Funds have agreed to reimburse Natixis Distribution for all or a portion of the servicing fees paid to these intermediaries. The reimbursement amounts (sub-transfer agent fees) paid to Natixis Distribution are subject to a current per-account equivalent fee limit approved by the Funds’ Board of Trustees, which is based on fees for similar services paid to the Funds’ transfer agent and other service providers. Class N shares do not bear such expenses.
For the year ended December 31, 2023, the sub-transfer agent fees (which are reflected in transfer agent fees and expenses in the Statements of Operations) for each Fund were as follows:
| |
International Growth Fund | |
| |
Natixis Oakmark International Fund | |
U.S. Equity Opportunities Fund | |
| |
| |
Notes to Financial Statements (continued)
As of December 31, 2023, the Funds owe Natixis Distribution the following reimbursements for sub-transfer agent fees (which are reflected in the Statements of Assets and Liabilities as payable to distributor):
| Reimbursements
of Sub-Transfer
Agent Fees |
International Growth Fund | |
| |
Natixis Oakmark International Fund | |
U.S. Equity Opportunities Fund | |
| |
| |
Sub-transfer agent fees attributable to Class A, Class C and Class Y are allocated on a pro rata basis to each class based on the relative net assets of each class to the total net assets of those classes.
e. Commissions. Commissions (including CDSCs) on Fund shares retained by Natixis Distribution during the year ended December 31, 2023 were as follows:
| |
| |
Natixis Oakmark International Fund | |
U.S. Equity Opportunities Fund | |
| |
| |
f. Trustees Fees and Expenses. The Trusts do not pay any compensation directly to their officers or Trustees who are directors, officers or employees of Natixis Advisors, Natixis Distribution, Natixis Investment Managers, LLC or their affiliates. The Chairperson of the Board of Trustees receives a retainer fee at the annual rate of $369,000. The Chairperson does not receive any meeting attendance fees for Board of Trustees meetings or committee meetings that he attends. Each Independent Trustee (other than the Chairperson) receives, in the aggregate, a retainer fee at the annual rate of $210,000. Each Independent Trustee also receives a meeting attendance fee of $10,000 for each meeting of the Board of Trustees that he or she attends in person and $5,000 for each meeting of the Board of Trustees that he or she attends telephonically. In addition, the chairperson of the Contract Review Committee, the chairperson of the Audit Committee and the chairperson of the Governance Committee each receive an additional retainer fee at the annual rate of $20,000. Each Contract Review Committee member is compensated $6,000 for each Committee meeting that he or she attends in person and $3,000 for each meeting that he or she attends telephonically. Each Audit Committee member is compensated $6,000 for each Committee meeting that he or she attends in person and $3,000 for each meeting that he or she attends telephonically. Each Governance Committee member is compensated $2,500 for each Committee meeting that he or she attends either in person or telephonically. These fees are allocated among the funds in the Natixis Funds Trusts, Loomis Sayles Funds Trusts and Natixis ETF Trusts based on a formula that takes into account, among other factors, the relative net assets of each fund. Trustees are reimbursed for travel expenses in connection with attendance at meetings.
Effective January 1, 2024, the Chairperson of the Board of Trustees will receive a retainer fee at the annual rate of $385,000 and each Independent Trustee (other than the Chairperson) will receive, in the aggregate, a retainer fee at the annual rate of $225,000. Each Independent Trustee will receive a meeting attendance fee of $10,000 for each meeting of the Board of Trustees that he or she attends in person. The chairperson of the Contract Review Committee and the chairperson of the Audit Committee each will receive an additional retainer fee at the annual rate of $25,000. All other Trustees fees will remain unchanged.
A deferred compensation plan (the “Plan”) is available to the Trustees on a voluntary basis. The value of a participating Trustee’s deferral account is based on theoretical investments of deferred amounts, on the normal payment dates, in certain funds of the Natixis Funds Trusts, Loomis Sayles Funds Trusts and Natixis ETF Trusts as designated by the participating Trustees. Changes in the value of participants’ deferral accounts are allocated pro rata among the funds in the Natixis Funds Trusts, Loomis Sayles Funds Trusts and Natixis ETF Trusts and are normally reflected as Trustees’ fees and expenses in the Statements of Operations. Deferred amounts remain in the funds until distributed in accordance with the provisions of the Plan. The portions of the accrued obligations allocated to the Funds under the Plan are reflected as Deferred Trustees’ fees in the Statements of Assets and Liabilities.
Certain officers and employees of Natixis Advisors, Loomis Sayles and affiliates are also officers and/or Trustees of the Trusts.
Notes to Financial Statements (continued)
g. Affiliated Ownership. As of December 31, 2023, Natixis and affiliates held shares of International Growth Fund representing 99.39% of the Fund's net assets.
Investment activities of affiliated shareholders could have material impacts on the Fund.
h. Reimbursement of Transfer Agent Fees and Expenses. Natixis Advisors has given a binding contractual undertaking to the Funds to reimburse any and all transfer agency expenses for the Funds’ Class N shares. This undertaking is in effect through April 30, 2024 and is not subject to recovery under the expense limitation agreement described above.
For the year ended December 31, 2023, Natixis Advisors reimbursed the Funds for transfer agency expenses as follows:
| Reimbursement of
Transfer Agency
Expenses |
| |
International Growth Fund | |
| |
Natixis Oakmark International Fund | |
U.S. Equity Opportunities Fund | |
| |
| |
6.Class-Specific Transfer Agent Fees and Expenses. Transfer agent fees and expenses attributable to Class A, Class C and Class Y are allocated on a pro rata basis to each class based on the relative net assets of each class to the total net assets of those classes. Transfer agent fees and expenses attributable to Class N are allocated to Class N.
For the year ended December 31, 2023, the Funds incurred the following class-specific transfer agent fees and expenses (including sub-transfer agent fees, where applicable):
| Transfer Agent Fees and Expenses |
| | | | |
International Growth Fund | | | | |
| | | | |
Natixis Oakmark International Fund | | | | |
U.S. Equity Opportunities Fund | | | | |
| | | | |
| | | | |
7.Line of Credit. Each Fund, together with certain other funds of Natixis Funds Trusts, Loomis Sayles Funds Trusts and Natixis ETF Trusts, entered into a syndicated, revolving, committed, unsecured line of credit with State Street Bank as administrative agent. The aggregate revolving commitment amount is $575,000,000. Any one Fund may borrow up to $402,500,000 under the line of credit agreement (as long as all borrowings by all Funds in the aggregate do not exceed the $575,000,000 limit at any time), subject to each Fund’s investment restrictions and its contractual obligations under the line of credit. Interest is charged to the Funds based upon the terms set forth in the agreement. In addition, a commitment fee of 0.15% per annum, payable at the end of each calendar quarter, is accrued and apportioned among the participating funds based on their average daily unused portion of the line of credit. The Funds paid certain legal fees in connection with the line of credit agreement, which are being amortized over a period of 364 days and are reflected in legal fees on the Statements of Operations. The unamortized balance is reflected as prepaid expenses on the Statements of Assets and Liabilities.
Prior to April 6, 2023, each Fund, together with certain other funds of Natixis Funds Trusts and Loomis Sayles Funds Trusts and Natixis ETF Trusts, entered into a $500,000,000 committed unsecured line of credit provided by State Street Bank. Any one Fund was able to borrow up to $350,000,000 under the line of credit agreement (as long as all borrowings by all Funds in the aggregate did not exceed the $500,000,000 limit at any time), subject to each Fund’s investment restrictions and its contractual obligations under the line of credit. Interest was charged to the Funds based upon the terms set forth in the agreement. In addition, a commitment fee of 0.15% per annum, payable at the end of each calendar quarter, was accrued and apportioned among the participating funds based on their average daily unused portion of the line of credit.
Notes to Financial Statements (continued)
For the year ended December 31, 2023, U.S. Equity Opportunities Fund had an average daily balance on the line of credit (for those days on which there were borrowings) of $2,850,000 at a weighted average interest rate of 5.43%. Interest expense incurred on the line of credit was $1,720.
8.Risk. The Funds’ investments in foreign securities may be subject to greater political, economic, environmental, credit/counterparty and information risks. The Fund's investments in foreign securities also are subject to foreign currency fluctuations and other foreign currency-related risks. Foreign securities may be subject to higher volatility than U.S. securities, varying degrees of regulation and limited liquidity.
International Growth Fund may invest to a significant extent in variable interest entity (“VIE”) structures. VIE structures can vary, but generally consist of a U.S.-listed company with contractual arrangements, through one or more wholly-owned special purpose vehicles, with a Chinese company that ultimately provides the U.S.-listed company with contractual rights to obtain economic benefits from the Chinese company. The VIE structure enables foreign investors, such as the Fund, to obtain investment exposure similar to that of an equity owner in a Chinese company in situations in which the Chinese government has restricted or prohibited the ownership of such company by foreign investors. The Fund’s exposure to VIE structures may pose additional risks because the VIE structure is not formally recognized under Chinese law. The Chinese government may cease to tolerate VIE structures at any time or impose new restrictions. In addition, Chinese companies using the VIE structure, and listed on stock exchanges in the U.S., could also face delisting or other ramifications for failure to meet the expectations and/or requirements of the U.S. Securities and Exchange Commission, the Public Company Accounting Oversight Board, or other U.S. regulators. Any of these risks could reduce the liquidity and value of these investments or render them valueless.
International Growth Fund is non-diversified, which means that it is not limited under the 1940 Act to a percentage of assets that it may invest in any one issuer. Because the Fund may invest in the securities of a limited number of issuers, an investment in the Fund may involve a higher degree of risk than would be present in a diversified portfolio.
Geopolitical events (such as trading halts, sanctions or wars) could increase volatility and uncertainty in the financial markets and adversely affect regional and global economies. These, and other related events, could significantly impact a Fund's performance and the value of an investment in the Fund, even if the Fund does not have direct exposure to issuers in the country or countries involved.
9.Concentration of Ownership. From time to time, a Fund may have a concentration of one or more accounts constituting a significant percentage of shares outstanding. Investment activities by holders of such accounts could have material impacts on the Funds. As of December 31, 2023, based on management’s evaluation of the shareholder account base, the Funds had accounts representing controlling ownership of more than 5% of the Funds’ total outstanding shares. The number of such accounts, based on accounts that represent more than 5% of an individual class of shares, and the aggregate percentage of net assets represented by such holdings were as follows:
| Number of 5%
Account Holders | |
| | |
Natixis Oakmark International Fund | | |
U.S. Equity Opportunities Fund | | |
| | |
Omnibus shareholder accounts for which Natixis Advisors understands that the intermediary has discretion over the underlying shareholder accounts or investment models where a shareholder account may be invested for a non-discretionary customer are included in the table above. For other omnibus accounts, the Funds do not have information on the individual shareholder accounts underlying the omnibus accounts; therefore, there could be other 5% shareholders in addition to those disclosed in the table above.
Notes to Financial Statements (continued)
10.Capital Shares. Each Fund may issue an unlimited number of shares of beneficial interest, without par value. Transactions in capital shares were as follows:
|
| Year Ended
December 31, 2023 | Year Ended
December 31, 2022 |
International Growth Fund | | | | |
| | | | |
Issued from the sale of shares | | | | |
Issued in connection with the reinvestment of distributions | | | | |
| | | | |
| | | | |
| | | | |
| | | | |
| | | | |
| | | | |
Issued from the sale of shares | | | | |
Issued in connection with the reinvestment of distributions | | | | |
| | | | |
| | | | |
Issued from the sale of shares | | | | |
Issued in connection with the reinvestment of distributions | | | | |
| | | | |
| | | | |
Increase from capital share transactions | | | | |
Notes to Financial Statements (continued)
10.Capital Shares (continued).
|
| Year Ended
December 31, 2023 | Year Ended
December 31, 2022 |
| | | | |
| | | | |
Issued from the sale of shares | | | | |
Issued in connection with the reinvestment of distributions | | | | |
| | | | |
| | | | |
| | | | |
Issued from the sale of shares | | | | |
Issued in connection with the reinvestment of distributions | | | | |
| | | | |
| | | | |
| | | | |
Issued from the sale of shares | | | | |
Issued in connection with the reinvestment of distributions | | | | |
| | | | |
| | | | |
| | | | |
Issued from the sale of shares | | | | |
Issued in connection with the reinvestment of distributions | | | | |
| | | | |
| | | | |
Increase from capital share transactions | | | | |
Notes to Financial Statements (continued)
10.Capital Shares (continued).
|
| Year Ended
December 31, 2023 | Year Ended
December 31, 2022 |
Natixis Oakmark International Fund | | | | |
| | | | |
Issued from the sale of shares | | | | |
Issued in connection with the reinvestment of distributions | | | | |
| | | | |
| | | | |
| | | | |
Issued from the sale of shares | | | | |
Issued in connection with the reinvestment of distributions | | | | |
| | | | |
| | | | |
| | | | |
Issued from the sale of shares | | | | |
Issued in connection with the reinvestment of distributions | | | | |
| | | | |
| | | | |
| | | | |
Issued from the sale of shares | | | | |
Issued in connection with the reinvestment of distributions | | | | |
| | | | |
| | | | |
Decrease from capital share transactions | | | | |
Notes to Financial Statements (continued)
10.Capital Shares (continued).
|
| Year Ended
December 31, 2023 | Year Ended
December 31, 2022 |
U.S. Equity Opportunities Fund | | | | |
| | | | |
Issued from the sale of shares | | | | |
Issued in connection with the reinvestment of distributions | | | | |
| | | | |
| | | | |
| | | | |
Issued from the sale of shares | | | | |
Issued in connection with the reinvestment of distributions | | | | |
| | | | |
| | | | |
| | | | |
Issued from the sale of shares | | | | |
Issued in connection with the reinvestment of distributions | | | | |
| | | | |
| | | | |
| | | | |
Issued from the sale of shares | | | | |
Issued in connection with the reinvestment of distributions | | | | |
| | | | |
| | | | |
Increase from capital share transactions | | | | |
Notes to Financial Statements (continued)
10.Capital Shares (continued).
|
| Year Ended
December 31, 2023 | Year Ended
December 31, 2022 |
| | | | |
| | | | |
Issued from the sale of shares | | | | |
Issued in connection with the reinvestment of distributions | | | | |
| | | | |
| | | | |
| | | | |
Issued from the sale of shares | | | | |
Issued in connection with the reinvestment of distributions | | | | |
| | | | |
| | | | |
| | | | |
Issued from the sale of shares | | | | |
Issued in connection with the reinvestment of distributions | | | | |
| | | | |
| | | | |
| | | | |
Issued from the sale of shares | | | | |
Issued in connection with the reinvestment of distributions | | | | |
| | | | |
| | | | |
Decrease from capital share transactions | | | | |
Notes to Financial Statements (continued)
10.Capital Shares (continued).
|
| Year Ended
December 31, 2023 | Year Ended
December 31, 2022 |
| | | | |
| | | | |
Issued from the sale of shares | | | | |
Issued in connection with the reinvestment of distributions | | | | |
| | | | |
| | | | |
| | | | |
Issued from the sale of shares | | | | |
Issued in connection with the reinvestment of distributions | | | | |
| | | | |
| | | | |
| | | | |
Issued from the sale of shares | | | | |
Issued in connection with the reinvestment of distributions | | | | |
| | | | |
| | | | |
| | | | |
Issued from the sale of shares | | | | |
Issued in connection with the reinvestment of distributions | | | | |
| | | | |
| | | | |
Increase from capital share transactions | | | | |
Report of Independent Registered Public Accounting Firm
To the Boards of Trustees of Loomis Sayles Funds II, Natixis Funds Trust I and Natixis Funds Trust II and Shareholders of Loomis Sayles International Growth Fund, Natixis Oakmark International Fund, Natixis U.S. Equity Opportunities Fund, Vaughan Nelson Small Cap Value Fund, Natixis Oakmark Fund and Vaughan Nelson Mid Cap Fund
Opinions on the Financial Statements
We have audited the accompanying statements of assets and liabilities, including the portfolios of investments, of Loomis Sayles International Growth Fund (one of the funds constituting Loomis Sayles Funds II), Natixis Oakmark International Fund, Natixis U.S. Equity Opportunities Fund and Vaughan Nelson Small Cap Value Fund (three of the funds constituting Natixis Funds Trust I), and Natixis Oakmark Fund and Vaughan Nelson Mid Cap Fund (two of the funds constituting Natixis Funds Trust II) (hereafter collectively referred to as the "Funds") as of December 31, 2023, the related statements of operations for the year ended December 31, 2023, the statements of changes in net assets for each of the two years in the period ended December 31, 2023, including the related notes, and the financial highlights for each of the periods indicated therein (collectively referred to as the “financial statements”). In our opinion, the financial statements present fairly, in all material respects, the financial position of each of the Funds as of December 31, 2023, the results of each of their operations for the year then ended, the changes in each of their net assets for each of the two years in the period ended December 31, 2023 and each of the financial highlights for each of the periods indicated therein, in conformity with accounting principles generally accepted in the United States of America.
Basis for Opinions
These financial statements are the responsibility of the Funds’ management. Our responsibility is to express an opinion on the Funds’ financial statements based on our audits. We are a public accounting firm registered with the Public Company Accounting Oversight Board (United States) (PCAOB) and are required to be independent with respect to the Funds in accordance with the U.S. federal securities laws and the applicable rules and regulations of the Securities and Exchange Commission and the PCAOB.
We conducted our audits of these financial statements in accordance with the standards of the PCAOB. Those standards require that we plan and perform the audit to obtain reasonable assurance about whether the financial statements are free of material misstatement, whether due to error or fraud.
Our audits included performing procedures to assess the risks of material misstatement of the financial statements, whether due to error or fraud, and performing procedures that respond to those risks. Such procedures included examining, on a test basis, evidence regarding the amounts and disclosures in the financial statements. Our audits also included evaluating the accounting principles used and significant estimates made by management, as well as evaluating the overall presentation of the financial statements. Our procedures included confirmation of securities owned as of December 31, 2023 by correspondence with the custodian and brokers; when replies were not received from brokers, we performed other auditing procedures. We believe that our audits provide a reasonable basis for our opinions.
/s/PricewaterhouseCoopers LLP
Boston, Massachusetts
February 22, 2024
We have served as the auditor of one or more investment companies in Natixis Investment Company Complex since at least 1995. We have not been able to determine the specific year we began serving as auditor.
2023 U.S. Tax Distribution Information to Shareholders (Unaudited)
Corporate Dividends Received Deduction. For the fiscal year ended December 31, 2023, a percentage of dividends distributed by the
Funds listed below qualify for the dividends received deduction for corporate shareholders. These percentages are as follows:
| |
International Growth Fund | |
| |
U.S. Equity Opportunities Fund | |
| |
| |
Qualified Dividend Income. For the fiscal year ended December 31, 2023, a percentage of the ordinary income dividends paid by the Funds are considered qualified dividend income eligible for reduced tax rates. These lower rates range from 0% to 20% depending on an individual’s tax bracket. If the Funds paid a distribution during calendar year 2023, complete information will be reported in conjunction with Form 1099-DIV. These percentages are noted below:
| |
International Growth Fund | |
| |
Natixis Oakmark International Fund | |
U.S. Equity Opportunities Fund | |
| |
| |
Capital Gains Distributions. Pursuant to Internal Revenue Section 852(b), the following Funds paid distributions, which have been designated as capital gains distributions for the fiscal year ended December 31, 2023.
| |
| |
U.S. Equity Opportunities Fund | |
Foreign Tax Credit. For the year ended December 31, 2023, the Fund intends to pass through foreign tax credits and have derived gross income from sources within foreign countries amounting to:
| Foreign-Tax
Credit Pass-Through | |
International Growth Fund | | |
Natixis Oakmark International Fund | | |
Trustee and Officer Information
The tables below provide certain information regarding the Trustees and officers of Natixis Funds Trust I, Natixis Funds Trust II, and Loomis Sayles Funds II (the “Trusts”). Unless otherwise indicated, the address of all persons below is 888 Boylston Street, Suite 800, Boston, MA 02199-8197. The Funds' Statements of Additional Information include additional information about the Trustees of the Trusts and are available by calling Natixis Funds at 800-225-5478.
| Position(s) Held with
the Trusts, Length
of Time Served and
| Principal
Occupation(s)
During Past 5 Years | Number of Portfolios
in Fund Complex
Overseen2and Other
Directorships Held
During Past 5 Years | Experience,
Qualifications,
Attributes, Skills for
Board Membership |
| | | | |
| Trustee since 2013
Contract Review
Committee Member | Executive Chairman of Bob’s Discount Furniture (retail) | 51
Director, Burlington Stores, Inc. (retail); Director, Rue La La
(e-commerce retail) | Significant experience on the Board and on the boards of other business organizations (including retail companies and a bank); executive experience (including at a retail company) |
| Trustee since 2015
Chairperson of the
Audit Committee | | 51
Formerly, Director of Triumph Group (aerospace industry) | Significant experience on the Board and executive experience (including his role as Vice President and treasurer of a defense company and experience at a financial services company) |
| Trustee since 2012
Chairperson of the
Governance Committee
and
Contract Review
Committee Member | President, University of Massachusetts | | Significant experience on the Board and on the boards of other business organizations; experience as President of the University of Massachusetts; government experience (including as a member of the U.S. House of Representatives); academic experience |
Maureen B. Mitchell
(1951) | Trustee since 2017
Chairperson of the
Contract Review
Committee | | 51
Director, Sterling Bancorp (bank) | Significant experience on the Board; financial services industry and executive experience (including role as President of global sales and marketing at a financial services company) |
Trustee and Officer Information
| Position(s) Held with the Trusts, Length of Time Served and Term of Office1 | Principal Occupation(s) During Past 5 Years | Number of Portfolios in Fund Complex Overseen2and Other Directorships Held During Past 5 Years | Experience, Qualifications, Attributes, Skills for Board Membership |
Independent Trustees − continued |
| Trustee since 2016
Audit Committee
Member and
Governance
Committee
Member | Founding Partner, Breton Capital Management, LLC (private equity); formerly, Partner, STEP Partners, LLC (private equity) | 51
Director, Candidly (chemicals and biofuels) | Significant experience on the Board; financial services industry and executive experience (including roles as Chief Executive Officer of client management and asset servicing for a banking and financial services company) |
| Chairperson of the Board
of Trustees since 2021
Trustee since 2009
Ex Officio Member of the
Audit Committee,
Contract Review
Committee and
Governance Committee | Retired; formerly, Professor of Finance at Babson College | | Significant experience on the Board; experience as Director of the Division of Trading and Markets at the Securities and Exchange Commission; academic experience; training as an economist |
| Trustee since 2009
Contract Review
Committee
Member | | | Significant experience on the Board; mutual fund industry and executive experience (including roles as President and Chief Executive Officer for an investment adviser) |
Trustee and Officer Information
| Position(s) Held with the Trusts, Length of Time Served and Term of Office1 | Principal Occupation(s) During Past 5 Years | Number of Portfolios in Fund Complex Overseen2and Other Directorships Held During Past 5 Years | Experience, Qualifications, Attributes, Skills for Board Membership |
Independent Trustees − continued |
| Trustee since 2019
Audit Committee
Member and Governance
Committee Member | Managing Director of Accordia Partners, LLC (real estate development); President of Primary Corporation (real estate development); Managing Principal of Merrick Capital Partners (infrastructure finance) | 51
Advisor/Risk Management Committee, Eastern Bank (bank); Director, Apartment Investment and Management Company (real estate investment trust); formerly, Director, Ares Commercial Real Estate Corporation (real estate investment trust) | Experience on the Board and significant experience on the boards of other business organizations (including real estate companies and banks) |
| Trustee since 2005
Audit Committee
and Governance
Committee Member | Retired; formerly, Deputy Dean for Finance and Administration, Yale University School of Medicine | | Significant experience on the Board; executive experience in a variety of academic organizations (including roles as dean for finance and administration) |
| | | | |
(1965)
One Financial Center
Boston, MA 02111 | | President, Chief Executive Officer and Chairman of the Board of Directors, Loomis, Sayles & Company, L.P. | | Significant experience on the Board; continuing service as President, Chief Executive Officer and Chairman of the Board of Directors of Loomis, Sayles & Company, L.P. |
Trustee and Officer Information
| Position(s) Held with the Trusts, Length of Time Served and Term of Office1 | Principal Occupation(s) During Past 5 Years | Number of Portfolios in Fund Complex Overseen2and Other Directorships Held During Past 5 Years | Experience, Qualifications, Attributes, Skills for Board Membership |
Interested Trustees − continued |
| Trustee since 2011
President and Chief
Executive Officer of
Natixis Funds Trust I and
Natixis Funds Trust II
since 2008; President of
Loomis Sayles Funds II
since 2008; Chief
Executive Officer of
Loomis Sayles Funds II
since 2015 | President and Chief Executive Officer, Natixis Advisors, LLC and Natixis Distribution, LLC | | Significant experience on the Board; experience as President and Chief Executive Officer of Natixis Advisors, LLC and Natixis Distribution, LLC |
| Each Trustee serves until retirement, resignation or removal from the Board. The current retirement age is 75. The position of Chairperson of the Board is appointed for a three-year term. |
| The Trustees of the Trusts serve as Trustees of a fund complex that includes all series of the Natixis Funds Trust I, Natixis Funds Trust II, Natixis Funds Trust IV, Gateway Trust, Loomis Sayles Funds I, Loomis Sayles Funds II, Natixis ETF Trust and Natixis ETF Trust II (collectively, the “Fund Complex”). |
| Mr. Charleston is deemed an “interested person” of the Trusts because he holds the following positions with an affiliated person of the Trusts: President, Chief Executive Officer and Chairman of the Board of Directors of Loomis, Sayles & Company, L.P. |
| Mr. Giunta is deemed an “interested person” of the Trusts because he holds the following positions with an affiliated person of the Trusts: President and Chief Executive Officer, Natixis Advisors, LLC and Natixis Distribution, LLC. |
Trustee and Officer Information
| Position(s) Held
with the Trusts | | |
| | | |
| Treasurer, Principal
Financial and
Accounting Officer | | Senior Vice President, Natixis Advisors, LLC and Natixis Distribution, LLC; formerly, Vice President, Natixis Advisors, LLC and Natixis Distribution, LLC; Assistant Treasurer of the Fund Complex |
| Secretary and Chief
Legal Officer | | Executive Vice President, General Counsel and Secretary, Natixis Advisors, LLC and Natixis Distribution, LLC; formerly, Executive Vice President and Chief Compliance Officer of Natixis Investment Managers (March 2019 – May 2022) and Senior Vice President and Head of Compliance, U.S. for Natixis Investment Managers (July 2011 – March 2019) |
| Chief Compliance
Officer, Assistant
Secretary and
Anti-Money
Laundering Officer | | Senior Vice President, Natixis Advisors, LLC and Natixis Distribution, LLC; formerly, Vice President, Head of Corporate Compliance, Global Atlantic Financial Group |
| Each officer of the Trusts serves for an indefinite term in accordance with the Trusts' current by-laws until the date his or her successor is elected and qualified, or until he or she sooner dies, retires, is removed or becomes disqualified. |
| Each person listed above, except as noted, holds the same position(s) with the Fund Complex. Previous positions during the past five years with Natixis Distribution, LLC, Natixis Advisors, LLC or Loomis, Sayles & Company, L.P. are omitted, if not materially different from an officer’s current position with such entity. |
This Page Intentionally Left Blank
˃To learn more about Natixis Funds products and services:
Visit: im.natixis.com Call: 800-225-5478
Before investing, consider the fund’s investment objectives, risks, charges, and expenses. Visit im.natixis.com or call 800-225-5478 for a prospectus or summary prospectus containing this and other information.
Contact us by mail:
If you wish to communicate with the funds’ Board of Trustees, you may do so by writing to:
Secretary of the Funds
Natixis Advisors, LLC
888 Boylston Street, Suite 800
Boston, MA 02199-8197
The correspondence must (a) be signed by the shareholder; (b) include the shareholder’s name and address; and (c) identify the fund(s), account number, share class, and number of shares held in that fund, as of a recent date.
Or by e-mail:
secretaryofthefunds@natixis.com (Communications regarding recommendations for Trustee candidates may not be submitted by e-mail.)
Please note: Unlike written correspondence, e-mail is not secure. Please do NOT include your account number, Social Security number, PIN, or any other non-public personal information in an e-mail communication because this information may be viewed by others.
 Exp. 3/1/20256255481.1.1EF58A-1223
This page not part of shareholder report
Annual Report
December 31, 2023
Loomis Sayles High Income Fund |
Loomis Sayles Investment Grade Bond Fund |
Loomis Sayles Strategic Alpha Fund |
Loomis Sayles Strategic Income Fund |
IMPORTANT NOTICE TO SHAREHOLDERS
The Securities and Exchange Commission (SEC) has adopted new regulations that will result in changes to the design and delivery of annual and semiannual shareholder reports. Beginning in July 2024, Funds will be required by the SEC to send shareholders a paper copy of a new tailored shareholder report in place of the full shareholder report that is currently being provided. If you would like to receive shareholder reports and other communications from the Funds electronically, instead of by mail, you may make that request at www.icsdelivery.com/natixisfunds. If you have already elected to receive shareholder reports electronically, you will not be affected by this change, and you need not take any action.
Loomis Sayles High Income Fund
|
|
|
|
|
|
Loomis, Sayles & Company, L.P. |
| Effective June 30, 2023, Peter S. Sheehan serves as portfolio manager of the Fund. |
| Effective December 31, 2023, Elaine M. Stokes no longer serves as portfolio manager of the Fund. |
Investment GoalThe Fund seeks high current income plus the opportunity for capital appreciation to produce a high total return.
Market Conditions
The bond market finished 2023 with positive total returns, but the favorable end result obscures the elevated volatility that occurred along the way. For most of the year, bonds were under pressure from concerns about persistent inflation and the US Federal Reserve’s (Feds) continued interest rate increases. As late as October, the headline US investment-grade bond indexes were in negative territory on a year-to-date basis amid worries that the Fed would have to keep interest rates “higher for longer.”
This backdrop changed considerably in November and December, as the concerns that had weighed on the market throughout 2023 dissipated rapidly. Inflation continued to decline unabated, despite concerns about rising oil prices in the third quarter. In November, the headline Consumer Price Index came in at inflation rates not seen since early 2021. With inflation receding, the markets grew comfortable with the idea that the Fed was finished raising rates. In December, Fed Chairman Jerome Powell added to the upbeat tone with comments suggesting that rate cuts could begin as early as the first half of 2024. Bond prices took another leg higher in response, erasing all previous losses and helping the fixed-income market close with solid gains for the full year. Income also made a meaningful contribution to total returns thanks to the increase in yields over the past two years.
US Treasuries registered gains for the year, albeit with unusually high volatility brought about by the shifting interest rate outlook. The yield on the two-year note, which came into 2023 at 4.41%, rose as high as 5.19% in mid-October before falling sharply to finish December at 4.23%. The ten-year issue took a similar path, moving from 3.88% at the end of 2022 to 4.99% in October and ultimately closing at the same 3.88% level where it began. The yield curve remained inverted for all of 2023, meaning that short-term debt offered higher yields than longer-term issues – an unusual condition that is often seen as a precursor to a recession. However, through the remainder of the year the extent of the inversion gradually receded from its July high.
Corporate bonds delivered a robust gain and outperformed US Treasuries. In addition to benefiting from the drop in Treasury yields in the fourth quarter, the asset class was boosted by the environment of positive economic growth, continued strength in corporate earnings, and investors’ hearty appetite for risk. Corporates’ above-average yield was an additional factor in their positive relative performance.
High-yield corporate bonds logged a double-digit gain in 2023 and strongly outpaced the investment grade market. A large contribution from yield helped results, as did a decline in yield spreads brought about by better-than-expected corporate earnings and investors’ elevated appetite for risk. Senior loans, which typically feature floating rates, benefited from the rising-rate environment in the first ten months of the year and finished as one of the top-performing segments of the bond market.
Securitized assets produced largely positive total returns in 2023. Collateralized loan obligations (CLOs) and commercial asset-backed securities (ABS) delivered particularly strong gains. Portions of the residential mortgage-backed securities (RMBS) market also outperformed. Headwinds facing the commercial real estate sector emerged in the first half of 2023, negatively impacting non-agency commercial mortgage-backed securities’ (CMBS) performance for the full year. Generally, the higher-yielding securitized credit sectors performed best. A challenging supply-and-demand backdrop negatively impacted agency mortgage-backed securities (MBS) as elevated levels of interest-rate volatility continued and historically large buyers of agency MBS (banks and the Fed) pulled back from the market. Still, agency MBS outperformed US Treasuries for the year.
Loomis Sayles High Income Fund
Developed market government bonds generated gains in 2023, although weakness in foreign currencies dampened returns somewhat for US dollar investors. Emerging markets debt outperformed US investment grade bonds thanks to investors’ hearty appetite for risk and the positive economic growth trends for many countries in the asset class.
Performance Results
For the 12 months ended December 31, 2023, Class Y shares of the Loomis Sayles High Income Fund returned 10.13% at net asset value. The Fund underperformed its benchmark, the Bloomberg U.S. Corporate High-Yield Bond Index, which returned 13.44%.
Explanation of Fund Performance
High yield corporate bonds delivered strong returns throughout the year, finishing ahead of many other fixed income sectors. While the Fund posted positive returns on an absolute basis, it underperformed the benchmark. Security selection was the primary source of underperformance for the period. Exposure to emerging market credit was a detractor and underperformance was derived primarily from holdings in Chinese property names as this sector has remained under continued pressure. The allocation to securitized assets was also a negative as holdings in non-agency CMBS hurt returns. An allocation to convertibles was also a detractor, led by select names in the communications and transportation space. Lastly, an allocation to defensive, reserve-like positions and US Treasuries was detrimental, as these did not keep pace with the riskier asset classes.
Security selection within high yield corporate credit was a contributor to relative returns. Our higher conviction names, specifically in the communications and consumer cyclical space, were strong performers for the year. Exposure to investment grade credit was also beneficial, with names in banking providing strong returns.
Outlook
US inflation — while still above the Fed’s 2% target — continued to decline from its mid-2022 peak and provided the Fed with enough flexibility in December 2023 to signal the tightening cycle is over. Fed Chair Jerome Powell sent a clear message to investors that he did not want to restrict the economy longer than necessary and stated that interest rate cuts would occur over the next year. This fueled a bond market rally in the second half of the fourth quarter, which saw the 10-year US Treasury yield fall to 3.88% at year-end after peaking at 4.99% on October 19, 2023. Optimism for Fed cuts and the potential for a soft landing also drove a rally in risk assets. We saw tighter investment grade and high yield spreads, coupled with declining interest rates, which helped to boost fixed income returns, resulting in positive calendar year returns in most fixed income sectors.
In our view, the credit cycle1 is firmly in the ‘late cycle’ stage. Monetary policy is in restrictive territory and lending standards have tightened. Up to this point, the US labor market has been resilient and underpinned consumer spending, while corporate fundamentals have remained stable and supportive of economic activity. Looking forward, we believe that economic growth is decelerating. Our base case calls for below-trend US growth in 2024, however, we do not anticipate a technical recession of back-to-back quarters with negative gross domestic product (GDP). We expect European economic growth to remain stagnant while economic growth in China is showing signs of bottoming, but continues to remain sluggish.
We believe that inflation has peaked and positive real rates should have the effect of slowing growth and continuing to lower inflation over time. The Fed appears to be satisfied with the progress it has made against inflation and now sees labor market/economic softening as an equal risk to inflation, thus the pivot. We believe the market may be too aggressive in pricing in rate cuts for 2024, as we believe it will take longer for core inflation to hit the Fed’s target and that Fed easing may ultimately come in some combination of rate cuts and a slowing of balance sheet normalization. Our view is that inflation will be ‘unstable’ over the long term as secular trends, such as deglobalization, decarbonization and the greenification of energy sources, aging demographics, and growing government deficits, have the potential to keep a floor under inflation but also have the potential to make it more volatile going forward. We expect to see dips in inflation as the cycles progress, but believe we're likely to experience higher lows than what we've experienced over the last 15 years. From an interest rate risk perspective, we believe the 10-year US Treasury range is currently 3.50% - 4.50% and have structured our portfolios for a steeper yield curve, likely driven by a fall in short-term rates as inflation moderates combined with secular trends that could potentially keep a floor under long-term yields.
Corporate fundamentals appear stable and while there has been some recent weakness in broader fundamentals, factors such as leverage and interest coverage ratios remain strong in a historical context, and specific to the high yield market, the maturity wall seems manageable in our opinion through 2025. Our Credit Health Index (CHIN) suggests defaults/losses will remain relatively low, while slowly increasing to more normal levels associated with a ‘late-cycle’ environment. Throughout 2023, we have been monitoring the pace of corporate earnings growth as an indicator of future economic activity. Positive earnings growth in the third quarter of 2023 confirmed our view that earnings would likely trough by the end of the year. The earnings recession experienced over the first half of 2023 was not deep enough to drive the credit cycle into downturn and improving earnings growth should alleviate some pressure for companies to aggressively cut costs through job cuts, in our opinion. Under this scenario, the economic downside is likely a mild or
Loomis Sayles High Income Fund
shallow recession, as we believe unemployment will remain low and a healthy consumer combined with stable corporate fundamentals should serve to minimize the potential for a hard landing by providing a floor to economic activity.
We believe that value has returned to fixed income markets and a combination of discount-to-par (positive convexity), favorable yields and an increase in issuer performance dispersion is helping to create opportunities in the bond markets. In our view, bond markets will likely be supported with strong demand as investors sit on record levels of cash that will be seeking yield as the Fed potentially cuts rates on the front end. We are mindful of the risks going forward, such as tighter financial conditions and their impact on the financial system, slower Chinese economic growth, geopolitical risk, the broader economic impact of a further decline in the commercial real estate market, and the upcoming US Presidential election. We believe that much of the turmoil leaves us with a wide range of potential outcomes for growth, inflation and central bank policy response. Based on the uncertain backdrop, we feel it is prudent to maintain a balanced risk profile between interest rate and spread risk. While our average position in liquid reserves was reduced in 2023, we continue to maintain liquidity as we patiently wait for opportunities to potentially develop. If volatility increases and we see what we view as more attractive yields and spreads, we would consider redeploying reserves.
1 A credit cycle is a cyclical pattern that follows credit availability and corporate health.
Hypothetical Growth of $100,000 Investment in Class Y Shares1 |
December 31, 2013 through December 31, 2023 |
Loomis Sayles High Income Fund
Average Annual Total Returns —December 31, 20231 |
| | | | | |
| | |
| | | | | | |
| | | | | | |
| | | | | | |
| | | | | | |
With 4.25% Maximum Sales Charge | | | | | | |
| | | | | | |
| | | | | | |
| | | | | | |
Class N (Inception 11/30/16) | | | | | | |
| | | | | | |
| | | | | | |
Bloomberg U.S. Corporate High-Yield Bond Index2 | | | | | | |
Performance data shown represents past performance and is no guarantee of, and not necessarily indicative of, future results. Total return and value will vary, and you may have a gain or loss when shares are sold. Current performance may be lower or higher than quoted. For most recent month-end performance, visit im.natixis.com/performance. Performance for other share classes will be greater or less than shown based on differences in fees and sales charges. You may not invest directly in an index. Performance for periods less than one year is cumulative, not annualized. Returns reflect changes in share price and reinvestment of dividends and capital gains, if any. The table(s) do not reflect taxes shareholders might owe on any fund distributions or when they redeem their shares.
| Fund performance has been increased by fee waivers and/or expense reimbursements, if any, without which performance would have been lower. |
| Bloomberg U.S. Corporate High-Yield Bond Index measures the market of USD-denominated, non-investment grade, fixed-rate, taxable corporate bonds. Securities are classified as high yield if the middle rating of Moody’s, Fitch, and S&P is Ba1/BB+/BB+ or below, excluding emerging market debt. Bloomberg U.S. Corporate High- Yield Bond Index was created in 1986, with history backfilled to July 1, 1983, and rolls up into the Bloomberg U.S. Universal and Global High-Yield Indices. |
| Expense ratios are as shown in the Fund’s prospectus in effect as of the date of this report. The expense ratios for the current reporting period can be found in the Financial Highlights section of this report under Ratios to Average Net Assets. Net expenses reflect contractual expense limitations set to expire on 4/30/25. When a Fund’s expenses are below the limitation, gross and net expense ratios will be the same. See Note 6 of the Notes to Financial Statements for more information about the Fund’s expense limitations. |
| Performance for Class C shares assumes a 1.00% contingent deferred sales charge (“CDSC”) applied when you sell shares within one year of purchase, and includes automatic conversion to Class A shares after eight years. |
Loomis Sayles Investment Grade Bond Fund
|
|
|
|
Loomis, Sayles & Company, L.P. |
| Effective December 31, 2023, Elaine M. Stokes no longer serves as portfolio manager of the Fund. |
Investment GoalThe Fund seeks high total investment return through a combination of current income and capital appreciation.
Market Conditions
The bond market finished 2023 with positive total returns, but the favorable end result obscures the elevated volatility that occurred along the way. For most of the year, bonds were under pressure from concerns about persistent inflation and the US Federal Reserve’s (Feds) continued interest rate increases. As late as October, the headline US investment-grade bond indexes were in negative territory on a year-to-date basis amid worries that the Fed would have to keep interest rates “higher for longer.”
This backdrop changed considerably in November and December, as the concerns that had weighed on the market throughout 2023 dissipated rapidly. Inflation continued to decline unabated, despite concerns about rising oil prices in the third quarter. In November, the headline Consumer Price Index came in at inflation rates not seen since early 2021. With inflation receding, the markets grew comfortable with the idea that the Fed was finished raising rates. In December, Fed Chairman Jerome Powell added to the upbeat tone with comments suggesting that rate cuts could begin as early as the first half of 2024. Bond prices took another leg higher in response, erasing all previous losses and helping the fixed-income market close with solid gains for the full year. Income also made a meaningful contribution to total returns thanks to the increase in yields over the past two years.
US Treasuries registered gains for the year, albeit with unusually high volatility brought about by the shifting interest rate outlook. The yield on the two-year note, which came into 2023 at 4.41%, rose as high as 5.19% in mid-October before falling sharply to finish December at 4.23%. The ten-year issue took a similar path, moving from 3.88% at the end of 2022 to 4.99% in October and ultimately closing at the same 3.88% level where it began. The yield curve remained inverted for all of 2023, meaning that short-term debt offered higher yields than longer-term issues – an unusual condition that is often seen as a precursor to a recession. However, through the remainder of the year the extent of the inversion gradually receded from its July high.
Corporate bonds delivered a robust gain and outperformed US Treasuries. In addition to benefiting from the drop in Treasury yields in the fourth quarter, the asset class was boosted by the environment of positive economic growth, continued strength in corporate earnings, and investors’ hearty appetite for risk. Corporates’ above-average yield was an additional factor in their positive relative performance.
High-yield corporate bonds logged a double-digit gain in 2023 and strongly outpaced the investment grade market. A large contribution from yield helped results, as did a decline in yield spreads brought about by better-than-expected corporate earnings and investors’ elevated appetite for risk. Senior loans, which typically feature floating rates, benefited from the rising-rate environment in the first ten months of the year and finished as one of the top-performing segments of the bond market.
Securitized assets produced largely positive total returns in 2023. Collateralized loan obligations (CLOs) and commercial asset-backed securities (ABS) delivered particularly strong gains. Portions of the residential mortgage-backed securities (RMBS) market also outperformed. Headwinds facing the commercial real estate sector emerged in the first half of 2023, negatively impacting non-agency commercial mortgage-backed securities’ (CMBS) performance for the full year. Generally, the higher-yielding securitized credit sectors performed best. A challenging supply-and-demand backdrop negatively impacted agency mortgage-backed securities (MBS) as elevated levels of interest-rate volatility continued and historically large buyers of agency MBS (banks and the Fed) pulled back from the market. Still, agency MBS outperformed US Treasuries for the year.
Loomis Sayles Investment Grade Bond Fund
Developed market government bonds generated gains in 2023, although weakness in foreign currencies dampened returns somewhat for US dollar investors. Emerging markets debt outperformed US investment grade bonds thanks to investors’ hearty appetite for risk and the positive economic growth trends for many countries in the asset class.
Performance Results
For the 12 months ended December 31, 2023, Class Y shares of the Loomis Sayles Investment Grade Bond Fund returned 7.50% at net asset value. The Fund outperformed its benchmark, the Bloomberg U.S. Government/Credit Bond Index, which returned 5.72%.
Explanation of Fund Performance
The overall fixed income markets posted strong returns in 2023 with the Fund outperforming its index, mostly due to positive security selection. Bond selection in investment grade corporate credit was a contributor to performance over the year, with select names in the basic industry, energy, and banking sectors providing positive returns. Securitized credit was also beneficial given the asset class's shorter duration profile, where holdings in ABS and CLOs aided returns. Within high yield credit, select names in the finance companies sector along with our higher conviction names in the communication space were positive.
Exposure to emerging market credit was negative during the year. Underperformance was derived primarily from holdings in Chinese property names as this sector has remained under continued pressure. An allocation to convertibles was also a detractor, led by select names in the communications and transportation space. The overall allocation to US Treasuries was positive as the Fund was underweight throughout the year. However, treasury futures were used to manage duration, and these positions were detractors.
Outlook
US inflation — while still above the Fed’s 2% target — continued to decline from its mid-2022 peak and provided the Fed with enough flexibility in December 2023 to signal the tightening cycle is over. Fed Chair Jerome Powell sent a clear message to investors that he did not want to restrict the economy longer than necessary and stated that interest rate cuts would occur over the next year. This fueled a bond market rally in the second half of the fourth quarter, which saw the 10-year US Treasury yield fall to 3.88% at year-end after peaking at 4.99% on October 19, 2023. Optimism for Fed cuts and the potential for a soft landing also drove a rally in risk assets. We saw tighter investment grade and high yield spreads, coupled with declining interest rates, which helped to boost fixed income returns, resulting in positive calendar year returns in most fixed income sectors.
In our view, the credit cycle1 is firmly in the ‘late cycle’ stage. Monetary policy is in restrictive territory and lending standards have tightened. Up to this point, the US labor market has been resilient and underpinned consumer spending, while corporate fundamentals have remained stable and supportive of economic activity. Looking forward, we believe that economic growth is decelerating. Our base case calls for below-trend US growth in 2024, however, we do not anticipate a technical recession of back-to-back quarters with negative gross domestic product (GDP). We expect European economic growth to remain stagnant while economic growth in China is showing signs of bottoming, but continues to remain sluggish.
We believe that inflation has peaked and positive real rates should have the effect of slowing growth and continuing to lower inflation over time. The Fed appears to be satisfied with the progress it has made against inflation and now sees labor market/economic softening as an equal risk to inflation, thus the pivot. We believe the market may be too aggressive in pricing in rate cuts for 2024, as we believe it will take longer for core inflation to hit the Fed’s target and that Fed easing may ultimately come in some combination of rate cuts and a slowing of balance sheet normalization. Our view is that inflation will be ‘unstable’ over the long term as secular trends, such as deglobalization, decarbonization and the greenification of energy sources, aging demographics, and growing government deficits, have the potential to keep a floor under inflation but also have the potential to make it more volatile going forward. We expect to see dips in inflation as the cycles progress, but believe we're likely to experience higher lows than what we've experienced over the last 15 years. From an interest rate risk perspective, we believe the 10-year US Treasury range is currently 3.50% - 4.50% and have structured our portfolios for a steeper yield curve, likely driven by a fall in short-term rates as inflation moderates combined with secular trends that could potentially keep a floor under long-term yields.
Corporate fundamentals appear stable and while there has been some recent weakness in broader fundamentals, factors such as leverage and interest coverage ratios remain strong in a historical context, and specific to the high yield market, the maturity wall seems manageable in our opinion through 2025. Our Credit Health Index (CHIN) suggests defaults/losses will remain relatively low, while slowly increasing to more normal levels associated with a ‘late-cycle’ environment. Throughout 2023, we have been monitoring the pace of corporate earnings growth as an indicator of future economic activity. Positive earnings growth in the third quarter of 2023 confirmed our view that earnings would likely trough by the end of the year. The earnings recession experienced over the first half of 2023 was not deep enough to drive the credit cycle into downturn and improving earnings growth should alleviate some pressure for companies to aggressively cut costs through job cuts, in our opinion. Under this scenario, the economic downside is likely a mild or
Loomis Sayles Investment Grade Bond Fund
shallow recession, as we believe unemployment will remain low and a healthy consumer combined with stable corporate fundamentals should serve to minimize the potential for a hard landing by providing a floor to economic activity.
We believe that value has returned to fixed income markets and a combination of discount-to-par (positive convexity), favorable yields and an increase in issuer performance dispersion is helping to create opportunities in the bond markets. In our view, bond markets will likely be supported with strong demand as investors sit on record levels of cash that will be seeking yield as the Fed potentially cuts rates on the front end. We are mindful of the risks going forward, such as tighter financial conditions and their impact on the financial system, slower Chinese economic growth, geopolitical risk, the broader economic impact of a further decline in the commercial real estate market, and the upcoming US Presidential election. We believe that much of the turmoil leaves us with a wide range of potential outcomes for growth, inflation and central bank policy response. Based on the uncertain backdrop, we feel it is prudent to maintain a balanced risk profile between interest rate and spread risk. While our average position in liquid reserves was reduced in 2023, we continue to maintain liquidity as we patiently wait for opportunities to potentially develop. If volatility increases and we see what we view as more attractive yields and spreads, we would consider redeploying reserves.
1 A credit cycle is a cyclical pattern that follows credit availability and corporate health.
Hypothetical Growth of $100,000 Investment in Class Y Shares1 |
December 31, 2013 through December 31, 2023 |
Loomis Sayles Investment Grade Bond Fund
Average Annual Total Returns —December 31, 20231 |
| | | | |
| | |
| | | | | |
| | | | | |
| | | | | |
| | | | | |
With 4.25% Maximum Sales Charge | | | | | |
| | | | | |
| | | | | |
| | | | | |
| | | | | |
| | | | | |
| | | | | |
| | | | | |
| | | | | |
Bloomberg U.S. Government/Credit Bond Index2 | | | | | |
Bloomberg U.S. Aggregate Bond Index3 | | | | | |
Performance data shown represents past performance and is no guarantee of, and not necessarily indicative of, future results. Total return and value will vary, and you may have a gain or loss when shares are sold. Current performance may be lower or higher than quoted. For most recent month-end performance, visit im.natixis.com/performance. Performance for other share classes will be greater or less than shown based on differences in fees and sales charges. You may not invest directly in an index. Performance for periods less than one year is cumulative, not annualized. Returns reflect changes in share price and reinvestment of dividends and capital gains, if any. The table(s) do not reflect taxes shareholders might owe on any fund distributions or when they redeem their shares.
| Fund performance has been increased by fee waivers and/or expense reimbursements, if any, without which performance would have been lower. |
| Bloomberg U.S. Government/Credit Bond Index is the non-securitized component of the U.S. Aggregate Index. The U.S. Government/Credit Bond Index includes investment grade, U.S. dollar-denominated, fixed rate Treasuries (i.e., public obligations of the U.S. Treasury that have remaining maturities of more than one year), government-related issues (i.e., agency, sovereign, supranational, and local authority debt), and corporate securities. The U.S. Government/Credit Index was launched on January 1, 1979, with index history backfilled to 1973, and is a subset of the U.S. Aggregate Index. |
| Bloomberg U.S. Aggregate Bond Index is a broad-based index that covers the U.S. dollar-denominated, investment-grade, fixed-rate, taxable bond market of SEC- registered securities. The index includes bonds from the Treasury, government-related, corporate, mortgage-backed securities, asset-backed securities, and collateralized mortgage-backed securities sectors. |
| Expense ratios are as shown in the Fund’s prospectus in effect as of the date of this report. The expense ratios for the current reporting period can be found in the Financial Highlights section of this report under Ratios to Average Net Assets. Net expenses reflect contractual expense limitations set to expire on 4/30/24. When a Fund’s expenses are below the limitation, gross and net expense ratios will be the same. See Note 6 of the Notes to Financial Statements for more information about the Fund’s expense limitations. |
| Performance for Class C shares assumes a 1.00% contingent deferred sales charge (“CDSC”) applied when you sell shares within one year of purchase, and includes automatic conversion to Class A shares after eight years. |
Loomis Sayles Strategic Alpha Fund
|
|
|
|
|
Loomis, Sayles & Company, L.P. |
| Effective December 31, 2023, Elaine M. Stokes no longer serves as portfolio manager of the Fund. |
Investment GoalThe Fund seeks to provide an attractive absolute total return, complemented by prudent investment management designed to manage risks and protect investor capital. The secondary goal of the Fund is to achieve these returns with relatively low volatility.
Market Conditions
The bond market finished 2023 with positive total returns, but the favorable end result obscures the elevated volatility that occurred along the way. For most of the year, bonds were under pressure from concerns about persistent inflation and the US Federal Reserve’s (Feds) continued interest rate increases. As late as October, the headline US investment-grade bond indexes were in negative territory on a year-to-date basis amid worries that the Fed would have to keep interest rates “higher for longer.”
This backdrop changed considerably in November and December, as the concerns that had weighed on the market throughout 2023 dissipated rapidly. Inflation continued to decline unabated, despite concerns about rising oil prices in the third quarter. In November, the headline Consumer Price Index came in at inflation rates not seen since early 2021. With inflation receding, the markets grew comfortable with the idea that the Fed was finished raising rates. In December, Fed Chairman Jerome Powell added to the upbeat tone with comments suggesting that rate cuts could begin as early as the first half of 2024. Bond prices took another leg higher in response, erasing all previous losses and helping the fixed-income market close with solid gains for the full year. Income also made a meaningful contribution to total returns thanks to the increase in yields over the past two years.
US Treasuries registered gains for the year, albeit with unusually high volatility brought about by the shifting interest rate outlook. The yield on the two-year note, which came into 2023 at 4.41%, rose as high as 5.19% in mid-October before falling sharply to finish December at 4.23%. The ten-year issue took a similar path, moving from 3.88% at the end of 2022 to 4.99% in October and ultimately closing at the same 3.88% level where it began. The yield curve remained inverted for all of 2023, meaning that short-term debt offered higher yields than longer-term issues – an unusual condition that is often seen as a precursor to a recession. However, through the remainder of the year the extent of the inversion gradually receded from its July high.
Corporate bonds delivered a robust gain and outperformed US Treasuries. In addition to benefiting from the drop in Treasury yields in the fourth quarter, the asset class was boosted by the environment of positive economic growth, continued strength in corporate earnings, and investors’ hearty appetite for risk. Corporates’ above-average yield was an additional factor in their positive relative performance.
High-yield corporate bonds logged a double-digit gain in 2023 and strongly outpaced the investment grade market. A large contribution from yield helped results, as did a decline in yield spreads brought about by better-than-expected corporate earnings and investors’ elevated appetite for risk. Senior loans, which typically feature floating rates, benefited from the rising-rate environment in the first ten months of the year and finished as one of the top-performing segments of the bond market.
Securitized assets produced largely positive total returns in 2023. Collateralized loan obligations (CLOs) and commercial asset-backed securities (ABS) delivered particularly strong gains. Portions of the residential mortgage-backed securities (RMBS) market also outperformed. Headwinds facing the commercial real estate sector emerged in the first half of 2023, negatively impacting non-agency commercial mortgage-backed securities’ (CMBS) performance for the full year. Generally, the higher-yielding securitized credit sectors performed best. A challenging supply-and-demand backdrop negatively impacted agency mortgage-backed securities (MBS) as elevated levels of interest-rate volatility continued and historically large buyers of agency MBS (banks and the Fed) pulled back from the market. Still, agency MBS outperformed US Treasuries for the year.
Loomis Sayles Strategic Alpha Fund
Developed market government bonds generated gains in 2023, although weakness in foreign currencies dampened returns somewhat for US dollar investors. Emerging markets debt outperformed US investment grade bonds thanks to investors’ hearty appetite for risk and the positive economic growth trends for many countries in the asset class.
Performance Results
For the 12 months ended December 31, 2023, Class Y shares of the Loomis Sayles Strategic Alpha Fund returned 7.90%. The Fund outperformed its benchmark, ICE BofA U.S. 3-Month Treasury Bill Index, which returned 5.01%. The Fund follows an absolute return strategy and is not managed to an index.
Explanation of Fund Performance
Exposure to securitized assets was the main contributor for the period, as allocation to the CLOs, ABS and non-agency RMBS sectors significantly contributed to performance. Within the ABS sector, car loan and housing exposure provided the largest contribution. Securitization deal sponsors sold $288.3 billion in asset-backed notes to investors in 2023, across auto, credit card, student loan, RMBS and commercial MBS.
The allocation to investment grade corporate bonds was also a contributor to performance for the year. Exposure to banking, basic industry and energy sectors significantly aided performance. The risk on rally of November continued through December, and while November’s rally was largely driven by supportive economic data, December’s rally was fueled by the Fed’s rhetoric again supporting the soft-landing thesis in addition to expectations of future rate cuts. Spreads tightened 5 bps to +99, which is nearly a 2-year low.
High yield corporates were also positive for the year. Consumer cyclical, communications and consumer non-cyclicals had the most significant impact.
The Fund’s positioning with respect to duration (and corresponding interest rate sensitivity) was additive to performance during the period. The team used treasury futures to manage duration over the period, and these positions contributed to performance.
The allocation to emerging market credit limited performance for the year, particularly within transportation and basic industry. Negative performance was derived primarily from holdings in Chinese property names as this sector has remained under continued pressure.
Outlook
US inflation — while still above the Fed’s 2% target — continued to decline from its mid-2022 peak and provided the Fed with enough flexibility in December 2023 to signal the tightening cycle is over. Fed Chair Jerome Powell sent a clear message to investors that he did not want to restrict the economy longer than necessary and stated that interest rate cuts would occur over the next year. This fueled a bond market rally in the second half of the fourth quarter, which saw the 10-year US Treasury yield fall to 3.88% at year-end after peaking at 4.99% on October 19, 2023. Optimism for Fed cuts and the potential for a soft landing also drove a rally in risk assets. We saw tighter investment grade and high yield spreads, coupled with declining interest rates, which helped to boost fixed income returns, resulting in positive calendar year returns in most fixed income sectors.
In our view, the credit cycle1 is firmly in the ‘late cycle’ stage. Monetary policy is in restrictive territory and lending standards have tightened. Up to this point, the US labor market has been resilient and underpinned consumer spending, while corporate fundamentals have remained stable and supportive of economic activity. Looking forward, we believe that economic growth is decelerating. Our base case calls for below-trend US growth in 2024, however, we do not anticipate a technical recession of back-to-back quarters with negative gross domestic product (GDP). We expect European economic growth to remain stagnant while economic growth in China is showing signs of bottoming, but continues to remain sluggish.
We believe that inflation has peaked and positive real rates should have the effect of slowing growth and continuing to lower inflation over time. The Fed appears to be satisfied with the progress it has made against inflation and now sees labor market/economic softening as an equal risk to inflation, thus the pivot. We believe the market may be too aggressive in pricing in rate cuts for 2024, as we believe it will take longer for core inflation to hit the Fed’s target and that Fed easing may ultimately come in some combination of rate cuts and a slowing of balance sheet normalization. Our view is that inflation will be ‘unstable’ over the long term as secular trends, such as deglobalization, decarbonization and the greenification of energy sources, aging demographics, and growing government deficits, have the potential to keep a floor under inflation but also have the potential to make it more volatile going forward. We expect to see dips in inflation as the cycles progress, but believe we're likely to experience higher lows than what we've experienced over the last 15 years. From an interest rate risk perspective, we believe the 10-year US Treasury range is currently 3.50% - 4.50% and have structured our portfolios for a steeper yield curve, likely driven by a fall in short-term rates as inflation moderates combined with secular trends that could potentially keep a floor under long-term yields.
Loomis Sayles Strategic Alpha Fund
Corporate fundamentals appear stable and while there has been some recent weakness in broader fundamentals, factors such as leverage and interest coverage ratios remain strong in a historical context, and specific to the high yield market, the maturity wall seems manageable in our opinion through 2025. Our Credit Health Index (CHIN) suggests defaults/losses will remain relatively low, while slowly increasing to more normal levels associated with a ‘late-cycle’ environment. Throughout 2023, we have been monitoring the pace of corporate earnings growth as an indicator of future economic activity. Positive earnings growth in the third quarter of 2023 confirmed our view that earnings would likely trough by the end of the year. The earnings recession experienced over the first half of 2023 was not deep enough to drive the credit cycle into downturn and improving earnings growth should alleviate some pressure for companies to aggressively cut costs through job cuts, in our opinion. Under this scenario, the economic downside is likely a mild or shallow recession, as we believe unemployment will remain low and a healthy consumer combined with stable corporate fundamentals should serve to minimize the potential for a hard landing by providing a floor to economic activity.
We believe that value has returned to fixed income markets and a combination of discount-to-par (positive convexity), favorable yields and an increase in issuer performance dispersion is helping to create opportunities in the bond markets. In our view, bond markets will likely be supported with strong demand as investors sit on record levels of cash that will be seeking yield as the Fed potentially cuts rates on the front end. We are mindful of the risks going forward, such as tighter financial conditions and their impact on the financial system, slower Chinese economic growth, geopolitical risk, the broader economic impact of a further decline in the commercial real estate market, and the upcoming US Presidential election. We believe that much of the turmoil leaves us with a wide range of potential outcomes for growth, inflation and central bank policy response. Based on the uncertain backdrop, we feel it is prudent to maintain a balanced risk profile between interest rate and spread risk. While our average position in liquid reserves was reduced in 2023, we continue to maintain liquidity as we patiently wait for opportunities to potentially develop. If volatility increases and we see what we view as more attractive yields and spreads, we would consider redeploying reserves.
1 A credit cycle is a cyclical pattern that follows credit availability and corporate health.
Hypothetical Growth of $100,000 Investment in Class Y Shares1 |
December 31, 2013 through December 31, 2023 |
Loomis Sayles Strategic Alpha Fund
Average Annual Total Returns —December 31, 20231 |
| | | | | |
| | |
| | | | | | |
| | | | | | |
| | | | | | |
| | | | | | |
With 4.25% Maximum Sales Charge | | | | | | |
| | | | | | |
| | | | | | |
| | | | | | |
Class N (Inception 5/1/17) | | | | | | |
| | | | | | |
| | | | | | |
ICE BofA U.S. 3-Month Treasury Bill Index2 | | | | | | |
ICE BofA U.S. 3-Month Treasury Bill Index +300 basis | | | | | | |
Performance data shown represents past performance and is no guarantee of, and not necessarily indicative of, future results. Total return and value will vary, and you may have a gain or loss when shares are sold. Current performance may be lower or higher than quoted. For most recent month-end performance, visit im.natixis.com/performance. Performance for other share classes will be greater or less than shown based on differences in fees and sales charges. You may not invest directly in an index. Performance for periods less than one year is cumulative, not annualized. Returns reflect changes in share price and reinvestment of dividends and capital gains, if any. The table(s) do not reflect taxes shareholders might owe on any fund distributions or when they redeem their shares.
| Fund performance has been increased by fee waivers and/or expense reimbursements, if any, without which performance would have been lower. |
| The ICE BofA U.S. 3-Month Treasury Bill Index is an unmanaged index that is comprised of a single U.S. Treasury issue with approximately three months to final maturity, purchased at the beginning of each month and held for one full month. ICE BofA U.S. 3-Month Treasury Bill Index +300 basis points is created by adding 3.00% to the annual return of the ICE BofA 3-Month Treasury Bill Index. |
| Expense ratios are as shown in the Fund’s prospectus in effect as of the date of this report. The expense ratios for the current reporting period can be found in the Financial Highlights section of this report under Ratios to Average Net Assets. Net expenses reflect contractual expense limitations set to expire on 4/30/24. When a Fund’s expenses are below the limitation, gross and net expense ratios will be the same. See Note 6 of the Notes to Financial Statements for more information about the Fund’s expense limitations. |
| Performance for Class C shares assumes a 1.00% contingent deferred sales charge (“CDSC”) applied when you sell shares within one year of purchase, and includes automatic conversion to Class A shares after eight years. |
Loomis Sayles Strategic Income Fund
|
|
|
|
Loomis, Sayles & Company, L.P. |
| Effective December 31, 2023, Elaine M. Stokes no longer serves as portfolio manager of the Fund. |
Investment GoalThe Fund seeks high current income with a secondary objective of capital growth.
Market Conditions
The bond market finished 2023 with positive total returns, but the favorable end result obscures the elevated volatility that occurred along the way. For most of the year, bonds were under pressure from concerns about persistent inflation and the US Federal Reserve’s (Feds) continued interest rate increases. As late as October, the headline US investment-grade bond indexes were in negative territory on a year-to-date basis amid worries that the Fed would have to keep interest rates “higher for longer.”
This backdrop changed considerably in November and December, as the concerns that had weighed on the market throughout 2023 dissipated rapidly. Inflation continued to decline unabated, despite concerns about rising oil prices in the third quarter. In November, the headline Consumer Price Index came in at inflation rates not seen since early 2021. With inflation receding, the markets grew comfortable with the idea that the Fed was finished raising rates. In December, Fed Chairman Jerome Powell added to the upbeat tone with comments suggesting that rate cuts could begin as early as the first half of 2024. Bond prices took another leg higher in response, erasing all previous losses and helping the fixed-income market close with solid gains for the full year. Income also made a meaningful contribution to total returns thanks to the increase in yields over the past two years.
US Treasuries registered gains for the year, albeit with unusually high volatility brought about by the shifting interest rate outlook. The yield on the two-year note, which came into 2023 at 4.41%, rose as high as 5.19% in mid-October before falling sharply to finish December at 4.23%. The ten-year issue took a similar path, moving from 3.88% at the end of 2022 to 4.99% in October and ultimately closing at the same 3.88% level where it began. The yield curve remained inverted for all of 2023, meaning that short-term debt offered higher yields than longer-term issues – an unusual condition that is often seen as a precursor to a recession. However, through the remainder of the year the extent of the inversion gradually receded from its July high.
Corporate bonds delivered a robust gain and outperformed US Treasuries. In addition to benefiting from the drop in Treasury yields in the fourth quarter, the asset class was boosted by the environment of positive economic growth, continued strength in corporate earnings, and investors’ hearty appetite for risk. Corporates’ above-average yield was an additional factor in their positive relative performance.
High-yield corporate bonds logged a double-digit gain in 2023 and strongly outpaced the investment grade market. A large contribution from yield helped results, as did a decline in yield spreads brought about by better-than-expected corporate earnings and investors’ elevated appetite for risk. Senior loans, which typically feature floating rates, benefited from the rising-rate environment in the first ten months of the year and finished as one of the top-performing segments of the bond market.
Securitized assets produced largely positive total returns in 2023. Collateralized loan obligations (CLOs) and commercial asset-backed securities (ABS) delivered particularly strong gains. Portions of the residential mortgage-backed securities (RMBS) market also outperformed. Headwinds facing the commercial real estate sector emerged in the first half of 2023, negatively impacting non-agency commercial mortgage-backed securities’ (CMBS) performance for the full year. Generally, the higher-yielding securitized credit sectors performed best. A challenging supply-and-demand backdrop negatively impacted agency mortgage-backed securities (MBS) as elevated levels of interest-rate volatility continued and historically large buyers of agency MBS (banks and the Fed) pulled back from the market. Still, agency MBS outperformed US Treasuries for the year.
Loomis Sayles Strategic Income Fund
Developed market government bonds generated gains in 2023, although weakness in foreign currencies dampened returns somewhat for US dollar investors. Emerging markets debt outperformed US investment grade bonds thanks to investors’ hearty appetite for risk and the positive economic growth trends for many countries in the asset class.
Performance Results
For the 12 months ended December 31, 2023, Class Y shares of the Loomis Sayles Strategic Income Fund returned 8.30% at net asset value. The Fund outperformed its benchmark, the Bloomberg U.S. Aggregate Bond Index, which returned 5.53%.
Explanation of Fund Performance
The overall fixed income markets posted strong returns in 2023 with the Fund outperforming its index, mostly due to positive security selection. Both high yield and investment grade credit were contributors to performance over the year. Within high yield credit, our higher conviction names in the communication and consumer cyclical space were positive along with select finance companies names. For investment grade credit, select names in energy, banking and basic industry were positive. Securitized credit was also beneficial given the asset class's shorter duration profile, where holdings in ABS and CLOs aided returns.
Exposure to emerging market credit was negative during the year. Underperformance was derived primarily from holdings in Chinese property names as this sector has remained under continued pressure. An allocation to convertibles was also a detractor, led by select names in the communications and transportation space.
Outlook
US inflation — while still above the Fed’s 2% target — continued to decline from its mid-2022 peak and provided the Fed with enough flexibility in December 2023 to signal the tightening cycle is over. Fed Chair Jerome Powell sent a clear message to investors that he did not want to restrict the economy longer than necessary and stated that interest rate cuts would occur over the next year. This fueled a bond market rally in the second half of the fourth quarter, which saw the 10-year US Treasury yield fall to 3.88% at year-end after peaking at 4.99% on October 19, 2023. Optimism for Fed cuts and the potential for a soft landing also drove a rally in risk assets. We saw tighter investment grade and high yield spreads, coupled with declining interest rates, which helped to boost fixed income returns, resulting in positive calendar year returns in most fixed income sectors.
In our view, the credit cycle1 is firmly in the ‘late cycle’ stage. Monetary policy is in restrictive territory and lending standards have tightened. Up to this point, the US labor market has been resilient and underpinned consumer spending, while corporate fundamentals have remained stable and supportive of economic activity. Looking forward, we believe that economic growth is decelerating. Our base case calls for below-trend US growth in 2024, however, we do not anticipate a technical recession of back-to-back quarters with negative gross domestic product (GDP). We expect European economic growth to remain stagnant while economic growth in China is showing signs of bottoming, but continues to remain sluggish.
We believe that inflation has peaked and positive real rates should have the effect of slowing growth and continuing to lower inflation over time. The Fed appears to be satisfied with the progress it has made against inflation and now sees labor market/economic softening as an equal risk to inflation, thus the pivot. We believe the market may be too aggressive in pricing in rate cuts for 2024, as we believe it will take longer for core inflation to hit the Fed’s target and that Fed easing may ultimately come in some combination of rate cuts and a slowing of balance sheet normalization. Our view is that inflation will be ‘unstable’ over the long term as secular trends, such as deglobalization, decarbonization and the greenification of energy sources, aging demographics, and growing government deficits, have the potential to keep a floor under inflation but also have the potential to make it more volatile going forward. We expect to see dips in inflation as the cycles progress, but believe we're likely to experience higher lows than what we've experienced over the last 15 years. From an interest rate risk perspective, we believe the 10-year US Treasury range is currently 3.50% - 4.50% and have structured our portfolios for a steeper yield curve, likely driven by a fall in short-term rates as inflation moderates combined with secular trends that could potentially keep a floor under long-term yields.
Corporate fundamentals appear stable and while there has been some recent weakness in broader fundamentals, factors such as leverage and interest coverage ratios remain strong in a historical context, and specific to the high yield market, the maturity wall seems manageable in our opinion through 2025. Our Credit Health Index (CHIN) suggests defaults/losses will remain relatively low, while slowly increasing to more normal levels associated with a ‘late-cycle’ environment. Throughout 2023, we have been monitoring the pace of corporate earnings growth as an indicator of future economic activity. Positive earnings growth in the third quarter of 2023 confirmed our view that earnings would likely trough by the end of the year. The earnings recession experienced over the first half of 2023 was not deep enough to drive the credit cycle into downturn and improving earnings growth should alleviate some pressure for companies to aggressively cut costs through job cuts, in our opinion. Under this scenario, the economic downside is likely a mild or shallow recession, as we believe unemployment will remain low and a healthy consumer combined with stable corporate fundamentals should serve to minimize the potential for a hard landing by providing a floor to economic activity.
Loomis Sayles Strategic Income Fund
We believe that value has returned to fixed income markets and a combination of discount-to-par (positive convexity), favorable yields and an increase in issuer performance dispersion is helping to create opportunities in the bond markets. In our view, bond markets will likely be supported with strong demand as investors sit on record levels of cash that will be seeking yield as the Fed potentially cuts rates on the front end. We are mindful of the risks going forward, such as tighter financial conditions and their impact on the financial system, slower Chinese economic growth, geopolitical risk, the broader economic impact of a further decline in the commercial real estate market, and the upcoming US Presidential election. We believe that much of the turmoil leaves us with a wide range of potential outcomes for growth, inflation and central bank policy response. Based on the uncertain backdrop, we feel it is prudent to maintain a balanced risk profile between interest rate and spread risk. While our average position in liquid reserves was reduced in 2023, we continue to maintain liquidity as we patiently wait for opportunities to potentially develop. If volatility increases and we see what we view as more attractive yields and spreads, we would consider redeploying reserves.
1 A credit cycle is a cyclical pattern that follows credit availability and corporate health.
Hypothetical Growth of $100,000 Investment in Class Y Shares1 |
December 31, 2013 through December 31, 2023 |
Loomis Sayles Strategic Income Fund
Average Annual Total Returns —December 31, 20231 |
| | | | |
| | |
| | | | | |
| | | | | |
| | | | | |
| | | | | |
With 4.25% Maximum Sales Charge | | | | | |
| | | | | |
| | | | | |
| | | | | |
| | | | | |
| | | | | |
| | | | | |
| | | | | |
| | | | | |
Bloomberg U.S. Aggregate Bond Index2 | | | | | |
Bloomberg U.S. Universal Bond Index3 | | | | | |
Performance data shown represents past performance and is no guarantee of, and not necessarily indicative of, future results. Total return and value will vary, and you may have a gain or loss when shares are sold. Current performance may be lower or higher than quoted. For most recent month-end performance, visit im.natixis.com/performance. Performance for other share classes will be greater or less than shown based on differences in fees and sales charges. You may not invest directly in an index. Performance for periods less than one year is cumulative, not annualized. Returns reflect changes in share price and reinvestment of dividends and capital gains, if any. The table(s) do not reflect taxes shareholders might owe on any fund distributions or when they redeem their shares.
| Fund performance has been increased by fee waivers and/or expense reimbursements, if any, without which performance would have been lower. |
| Bloomberg U.S. Aggregate Bond Index is a broad-based index that covers the U.S. dollar-denominated, investment-grade, fixed-rate, taxable bond market of SEC- registered securities. The index includes bonds from the Treasury, government-related, corporate, mortgage-backed securities, asset-backed securities, and collateralized mortgage-backed securities sectors. |
| Bloomberg U.S. Universal Bond Index represents the union of the U.S. Aggregate Index, the U.S. High-Yield Corporate Index, the 144A Index, the Eurodollar Index, the Emerging Markets Index, and the non-ERISA portion of the CMBS Index. Municipal debt, private placements, and non-dollar-denominated issues are excluded from the Universal Bond Index. The only constituent of the index that includes floating-rate debt is the Emerging Markets Index. |
| Expense ratios are as shown in the Fund’s prospectus in effect as of the date of this report. The expense ratios for the current reporting period can be found in the Financial Highlights section of this report under Ratios to Average Net Assets. Net expenses reflect contractual expense limitations set to expire on 4/30/25. When a Fund’s expenses are below the limitation, gross and net expense ratios will be the same. See Note 6 of the Notes to Financial Statements for more information about the Fund’s expense limitations. |
| Performance for Class C shares assumes a 1.00% contingent deferred sales charge (“CDSC”) applied when you sell shares within one year of purchase, and includes automatic conversion to Class A shares after eight years. |
ADDITIONAL INFORMATION
The views expressed in this report reflect those of the portfolio managers as of the dates indicated. The managers’ views are subject to change at any time without notice based on changes in market or other conditions. References to specific securities or industries should not be regarded as investment advice. Because the Funds are actively managed, there is no assurance that they will continue to invest in the securities or industries mentioned.
All investing involves risk, including the risk of loss. There is no assurance that any investment will meet its performance objectives or that losses will be avoided.
ADDITIONAL INDEX INFORMATION
This document may contain references to third party copyrights, indexes, and trademarks, each of which is the property of its respective owner. Such owner is not affiliated with Natixis Investment Managers or any of its related or affiliated companies (collectively “Natixis Affiliates”) and does not sponsor, endorse or participate in the provision of any Natixis Affiliates services, funds or other financial products.
The index information contained herein is derived from third parties and is provided on an “as is” basis. The user of this information assumes the entire risk of use of this information. Each of the third party entities involved in compiling, computing or creating index information disclaims all warranties (including, without limitation, any warranties of originality, accuracy, completeness, timeliness, non-infringement, merchantability and fitness for a particular purpose) with respect to such information.
PROXY VOTING INFORMATION
A description of the Natixis Funds' proxy voting policies and procedures is available without charge, upon request, by calling Natixis Funds at 800-225-5478; on the Natixis Funds’ website at im.natixis.com, and on the Securities and Exchange Commission (“SEC”) website at www.sec.gov. Information about how the Natixis Funds voted proxies relating to portfolio securities during the most recent 12-month period ended June 30 is available through the Natixis Funds’ website and the SEC website.
QUARTERLY PORTFOLIO SCHEDULES
The Natixis Funds file a complete schedule of portfolio holdings with the SEC for the first and third quarters of each fiscal year as an exhibit to its reports on Form N-PORT. The Funds’ Form N-PORT reports are available on the SEC website at www.sec.gov. First and third quarter schedules of portfolio holdings are also available at im.natixis.com/funddocuments. A hard copy may be requested from the Fund at no charge by calling 800-225-5478.
TAILORED SHAREHOLDER REPORTS FOR MUTUAL FUNDS AND EXCHANGE-TRADED FUNDS
In October 2022, the SEC adopted rule and form amendments requiring mutual funds and exchange-traded funds to transmit concise and visually engaging streamlined annual and semiannual reports that highlight key information to shareholders. Other information, including financial statements, will no longer appear in the funds’ shareholder reports but will be available online, delivered free of charge upon request, and filed with the SEC on a semiannual basis on Form N-CSR. The rule and form amendments have a compliance date of July 24, 2024.
CFA® and Chartered Financial Analyst® are registered trademarks owned by the CFA Institute.
Understanding Fund Expenses
As a mutual fund shareholder, you incur different costs: transaction costs, including sales charges (loads) on purchases and contingent deferred sales charges on redemptions, and ongoing costs, including management fees, distribution and/or service fees ("12b-1 fees"), and other fund expenses. Certain exemptions may apply. These costs are described in more detail in the Funds’ prospectus. The following examples are intended to help you understand the ongoing costs of investing in the Funds and help you compare these with the ongoing costs of investing in other mutual funds.
The first line in the table of each class of Fund shares shows the actual account values and actual Fund expenses you would have paid on a $1,000 investment in the Fund from July 1, 2023 through December 31, 2023. To estimate the expenses you paid over the period, simply divide your account value by $1,000 (for example $8,600 account value divided by $1,000 = 8.60) and multiply the result by the number in the Expenses Paid During Period column as shown for your class.
The second line in the table for each class of fund shares provides information about hypothetical account values and hypothetical expenses based on the Fund’s actual expense ratios and an assumed rate of return of 5% per year before expenses, which is not the Fund’s actual return. The hypothetical account values and expenses may not be used to estimate the actual ending account balance or expenses you paid on your investment for the period. You may use this information to compare the ongoing costs of investing in the Fund and other funds. To do so, compare this 5% hypothetical example with the 5% hypothetical examples that appear in the shareholder reports of the other funds.
Please note that the expenses shown reflect ongoing costs only, and do not include any transaction costs, such as sales charges. Therefore, the second line in the table of each fund is useful in comparing ongoing costs only, and will not help you determine the relative costs of owning funds. If transaction costs were included, total costs would be higher.
Loomis Sayles High Income Fund | Beginning
Account Value
7/1/2023 | Ending
Account Value
12/31/2023 | Expenses Paid
7/1/2023 – 12/31/2023 |
| | | |
| | | |
Hypothetical (5% return before expenses) | | | |
| | | |
| | | |
Hypothetical (5% return before expenses) | | | |
| | | |
| | | |
Hypothetical (5% return before expenses) | | | |
| | | |
| | | |
Hypothetical (5% return before expenses) | | | |
| Expenses are equal to the Fund's annualized expense ratio (after waiver/reimbursement): 0.95%, 1.70%, 0.65% and 0.70% for Class A, C, N and Y, respectively, multiplied by the average account value over the period, multiplied by the number of days in the most recent fiscal half–year (184), divided by 365 (to reflect the half–year period). |
Loomis Sayles Investment Grade Bond Fund | Beginning
Account Value
7/1/2023 | Ending
Account Value
12/31/2023 | Expenses Paid
During Period
|
| | | |
| | | |
Hypothetical (5% return before expenses) | | | |
| | | |
| | | |
Hypothetical (5% return before expenses) | | | |
| | | |
| | | |
Hypothetical (5% return before expenses) | | | |
| | | |
| | | |
Hypothetical (5% return before expenses) | | | |
| | | |
| | | |
Hypothetical (5% return before expenses) | | | |
| Expenses are equal to the Fund's annualized expense ratio (after waiver/reimbursement): 0.74, 1.49, 0.44, 0.49 and 0.99 for Class A, C, N, Y and Admin Class, respectively, multiplied by the average account value over the period, multiplied by the number of days in the most recent fiscal half–year (184), divided by 365 (to reflect the half–year period). |
Loomis Sayles Strategic Alpha Fund | Beginning
Account Value
7/1/2023 | Ending
Account Value
12/31/2023 | Expenses Paid
7/1/2023 – 12/31/2023 |
| | | |
| | | |
Hypothetical (5% return before expenses) | | | |
| | | |
| | | |
Hypothetical (5% return before expenses) | | | |
| | | |
| | | |
Hypothetical (5% return before expenses) | | | |
| | | |
| | | |
Hypothetical (5% return before expenses) | | | |
| Expenses are equal to the Fund’s annualized expense ratio (after waiver/reimbursement): 1.00%, 1.75%, 0.70% and 0.75% for Class A, C, N and Y, respectively, multiplied by the average account value over the period, multiplied by the number of days in the most recent fiscal half-year (184), divided by 365 (to reflect the half-year period). |
Loomis Sayles Strategic Income Fund | Beginning
Account Value
7/1/2023 | Ending
Account Value
12/31/2023 | Expenses Paid
7/1/2023 – 12/31/2023 |
| | | |
| | | |
Hypothetical (5% return before expenses) | | | |
| | | |
| | | |
Hypothetical (5% return before expenses) | | | |
| | | |
| | | |
Hypothetical (5% return before expenses) | | | |
| | | |
| | | |
Hypothetical (5% return before expenses) | | | |
| | | |
| | | |
Hypothetical (5% return before expenses) | | | |
| Expenses are equal to the Fund's annualized expense ratio (after waiver/reimbursement): 0.93, 1.68, 0.63, 0.68 and 1.18 for Class A, C, N, Y and Admin Class, respectively, multiplied by the average account value over the period, multiplied by the number of days in the most recent fiscal half–year (184), divided by 365 (to reflect the half–year period). |
Portfolio of Investments – as of December 31, 2023Loomis Sayles High Income Fund
| | |
Bonds and Notes — 92.8% of Net Assets |
|
|
Non-Convertible Bonds — 89.0% |
| |
| DSLA Mortgage Loan Trust, Series 2005-AR5, Class 2A1A, 1 mo. USD SOFR + 0.774%, 6.130%, 9/19/2045(a) | |
| Aerospace & Defense — 1.4% |
| Bombardier, Inc., 6.000%, 2/15/2028(b) | |
| Bombardier, Inc., 7.125%, 6/15/2026(b) | |
| Bombardier, Inc., 8.750%, 11/15/2030(b) | |
| TransDigm, Inc., 6.750%, 8/15/2028(b) | |
| TransDigm, Inc., 6.875%, 12/15/2030(b) | |
| | |
| |
| Allegiant Travel Co., 7.250%, 8/15/2027(b) | |
| American Airlines, Inc./AAdvantage Loyalty IP Ltd., 5.750%, 4/20/2029(b) | |
| Hawaiian Brand Intellectual Property Ltd./HawaiianMiles Loyalty Ltd., 5.750%, 1/20/2026(b) | |
| Spirit Loyalty Cayman Ltd./Spirit IP Cayman Ltd., 8.000%, 9/20/2025(b) | |
| Spirit Loyalty Cayman Ltd./Spirit IP Cayman Ltd., 8.000%, 9/20/2025(b) | |
| | |
| |
| Allison Transmission, Inc., 4.750%, 10/01/2027(b) | |
| American Axle & Manufacturing, Inc., 5.000%, 10/01/2029 | |
| Ford Motor Co., 3.250%, 2/12/2032 | |
| Ford Motor Credit Co. LLC, 2.300%, 2/10/2025 | |
| Wheel Pros, Inc., 6.500%, 5/15/2029(b) | |
| ZF North America Capital, Inc., 6.875%, 4/14/2028(b) | |
| | |
| |
| Barclays PLC, (fixed rate to 6/27/2033, variable rate thereafter), 7.119%, 6/27/2034 | |
| Deutsche Bank AG, (fixed rate to 12/01/2027, variable rate thereafter), 4.875%, 12/01/2032 | |
| Intesa Sanpaolo SpA, 6.625%, 6/20/2033(b) | |
| UniCredit SpA, (fixed rate to 6/30/2030, variable rate thereafter), 5.459%, 6/30/2035(b) | |
| | |
| |
| Coinbase Global, Inc., 3.375%, 10/01/2028(b) | |
| Coinbase Global, Inc., 3.625%, 10/01/2031(b) | |
| NFP Corp., 4.875%, 8/15/2028(b) | |
| NFP Corp., 6.875%, 8/15/2028(b) | |
| NFP Corp., 8.500%, 10/01/2031(b) | |
| | |
| Building Materials — 3.0% |
| ACProducts Holdings, Inc., 6.375%, 5/15/2029(b) | |
| Beacon Roofing Supply, Inc., 6.500%, 8/01/2030(b) | |
| Builders FirstSource, Inc., 4.250%, 2/01/2032(b) | |
| Builders FirstSource, Inc., 5.000%, 3/01/2030(b) | |
| Camelot Return Merger Sub, Inc., 8.750%, 8/01/2028(b) | |
| Cemex SAB de CV, 3.875%, 7/11/2031(b) | |
| Cornerstone Building Brands, Inc., 6.125%, 1/15/2029(b) | |
| | |
|
| Building Materials — continued |
| Foundation Building Materials, Inc., 6.000%, 3/01/2029(b) | |
| LBM Acquisition LLC, 6.250%, 1/15/2029(b) | |
| MIWD Holdco II LLC/MIWD Finance Corp., 5.500%, 2/01/2030(b) | |
| Patrick Industries, Inc., 4.750%, 5/01/2029(b) | |
| Specialty Building Products Holdings LLC/SBP Finance Corp., 6.375%, 9/30/2026(b) | |
| Standard Industries, Inc., 4.375%, 7/15/2030(b) | |
| Summit Materials LLC/Summit Materials Finance Corp., 7.250%, 1/15/2031(b) | |
| | |
| |
| Altice Financing SA, 5.000%, 1/15/2028(b) | |
| CCO Holdings LLC/CCO Holdings Capital Corp., 4.250%, 2/01/2031(b) | |
| CCO Holdings LLC/CCO Holdings Capital Corp., 4.250%, 1/15/2034(b) | |
| CCO Holdings LLC/CCO Holdings Capital Corp., 4.500%, 6/01/2033(b) | |
| CCO Holdings LLC/CCO Holdings Capital Corp., 4.750%, 3/01/2030(b) | |
| CSC Holdings LLC, 3.375%, 2/15/2031(b) | |
| CSC Holdings LLC, 4.625%, 12/01/2030(b) | |
| CSC Holdings LLC, 5.000%, 11/15/2031(b) | |
| Directv Financing LLC/Directv Financing Co-Obligor, Inc., 5.875%, 8/15/2027(b) | |
| DISH DBS Corp., 5.125%, 6/01/2029 | |
| DISH DBS Corp., 5.250%, 12/01/2026(b) | |
| DISH DBS Corp., 5.750%, 12/01/2028(b) | |
| DISH DBS Corp., 7.375%, 7/01/2028 | |
| DISH DBS Corp., 7.750%, 7/01/2026 | |
| DISH Network Corp., 11.750%, 11/15/2027(b) | |
| Radiate Holdco LLC/Radiate Finance, Inc., 6.500%, 9/15/2028(b) | |
| Sirius XM Radio, Inc., 3.875%, 9/01/2031(b) | |
| Telesat Canada/Telesat LLC, 5.625%, 12/06/2026(b) | |
| Viasat, Inc., 6.500%, 7/15/2028(b) | |
| Virgin Media Secured Finance PLC, 5.500%, 5/15/2029(b) | |
| Ziggo Bond Co. BV, 6.000%, 1/15/2027(b) | |
| | |
| |
| ASP Unifrax Holdings, Inc., 5.250%, 9/30/2028(b) | |
| Braskem Netherlands Finance BV, 8.500%, 1/12/2031(b) | |
| Hercules LLC, 6.500%, 6/30/2029 | |
| Olympus Water U.S. Holding Corp., 9.750%, 11/15/2028(b) | |
| | |
| Consumer Cyclical Services — 3.0% |
| ADT Security Corp., 4.125%, 8/01/2029(b) | |
| ANGI Group LLC, 3.875%, 8/15/2028(b) | |
| Arches Buyer, Inc., 4.250%, 6/01/2028(b) | |
| Arches Buyer, Inc., 6.125%, 12/01/2028(b) | |
| Realogy Group LLC/Realogy Co-Issuer Corp., 5.750%, 1/15/2029(b) | |
| Uber Technologies, Inc., 4.500%, 8/15/2029(b) | |
| VT Topco, Inc., 8.500%, 8/15/2030(b) | |
| | |
See accompanying notes to financial statements.
Portfolio of Investments – as of December 31, 2023Loomis Sayles High Income Fund (continued) | | |
|
| |
| Coty, Inc./HFC Prestige Products, Inc./HFC Prestige International U.S. LLC, 4.750%, 1/15/2029(b) | |
| Coty, Inc./HFC Prestige Products, Inc./HFC Prestige International U.S. LLC, 6.625%, 7/15/2030(b) | |
| Energizer Holdings, Inc., 4.375%, 3/31/2029(b) | |
| Prestige Brands, Inc., 3.750%, 4/01/2031(b) | |
| Tempur Sealy International, Inc., 3.875%, 10/15/2031(b) | |
| | |
| Diversified Manufacturing — 0.3% |
| Madison IAQ LLC, 5.875%, 6/30/2029(b) | |
| Resideo Funding, Inc., 4.000%, 9/01/2029(b) | |
| | |
| |
| Calpine Corp., 4.500%, 2/15/2028(b) | |
| NRG Energy, Inc., 3.625%, 2/15/2031(b) | |
| NRG Energy, Inc., 3.875%, 2/15/2032(b) | |
| PG&E Corp., 5.000%, 7/01/2028 | |
| PG&E Corp., 5.250%, 7/01/2030 | |
| Talen Energy Supply LLC, 8.625%, 6/01/2030(b) | |
| | |
| |
| Covanta Holding Corp., 4.875%, 12/01/2029(b) | |
| GFL Environmental, Inc., 4.000%, 8/01/2028(b) | |
| GFL Environmental, Inc., 6.750%, 1/15/2031(b) | |
| | |
| |
| Aircastle Ltd., 6.500%, 7/18/2028(b) | |
| Blackstone Secured Lending Fund, 2.750%, 9/16/2026 | |
| Blackstone Secured Lending Fund, 3.625%, 1/15/2026 | |
| Blue Owl Capital Corp., 3.400%, 7/15/2026 | |
| Global Aircraft Leasing Co. Ltd., 7.250% PIK or 6.500% Cash, 9/15/2024(b)(c) | |
| Nationstar Mortgage Holdings, Inc., 5.000%, 2/01/2026(b) | |
| Nationstar Mortgage Holdings, Inc., 5.125%, 12/15/2030(b) | |
| Nationstar Mortgage Holdings, Inc., 5.750%, 11/15/2031(b) | |
| Navient Corp., 4.875%, 3/15/2028 | |
| Navient Corp., 5.500%, 3/15/2029 | |
| Navient Corp., 6.750%, 6/25/2025 | |
| OneMain Finance Corp., 3.500%, 1/15/2027 | |
| OneMain Finance Corp., 3.875%, 9/15/2028 | |
| OneMain Finance Corp., 4.000%, 9/15/2030 | |
| OneMain Finance Corp., 5.375%, 11/15/2029 | |
| OneMain Finance Corp., 7.125%, 3/15/2026 | |
| PennyMac Financial Services, Inc., 7.875%, 12/15/2029(b) | |
| Provident Funding Associates LP/PFG Finance Corp., 6.375%, 6/15/2025(b) | |
| Rocket Mortgage LLC/Rocket Mortgage Co-Issuer, Inc., 2.875%, 10/15/2026(b) | |
| Rocket Mortgage LLC/Rocket Mortgage Co-Issuer, Inc., 2.875%, 10/15/2026 | |
| Rocket Mortgage LLC/Rocket Mortgage Co-Issuer, Inc., 3.625%, 3/01/2029 | |
| Rocket Mortgage LLC/Rocket Mortgage Co-Issuer, Inc., 3.625%, 3/01/2029(b) | |
| | |
|
| Finance Companies — continued |
| Rocket Mortgage LLC/Rocket Mortgage Co-Issuer, Inc., 3.875%, 3/01/2031(b) | |
| Rocket Mortgage LLC/Rocket Mortgage Co-Issuer, Inc., 4.000%, 10/15/2033(b) | |
| | |
| |
| Agile Group Holdings Ltd., 6.050%, 10/13/2025 | |
| CFLD Cayman Investment Ltd., 2.500%, 1/31/2031(b)(d) | |
| CFLD Cayman Investment Ltd., 2.500%, 1/31/2031(b)(d) | |
| CFLD Cayman Investment Ltd., Zero Coupon, 0.000%–27.988%, 1/31/2031(b)(e) | |
| China Aoyuan Group Ltd., 6.200%, 3/24/2026(f) | |
| China Evergrande Group, 8.750%, 6/28/2025(f) | |
| Easy Tactic Ltd., 7.500% PIK or 6.500% Cash, 7/11/2027(g) | |
| Fantasia Holdings Group Co. Ltd., 11.875%, 6/01/2023(f) | |
| Icahn Enterprises LP/Icahn Enterprises Finance Corp., 4.750%, 9/15/2024 | |
| Icahn Enterprises LP/Icahn Enterprises Finance Corp., 5.250%, 5/15/2027 | |
| Icahn Enterprises LP/Icahn Enterprises Finance Corp., 6.375%, 12/15/2025 | |
| Kaisa Group Holdings Ltd., 9.375%, 6/30/2024(f) | |
| Kaisa Group Holdings Ltd., 11.650%, 6/01/2026(f) | |
| Kaisa Group Holdings Ltd., 11.700%, 11/11/2025(f) | |
| Shimao Group Holdings Ltd., 6.125%, 2/21/2024(f) | |
| Sunac China Holdings Ltd., 6.000% PIK or 5.000% Cash, 9/30/2026(b)(h) | |
| Sunac China Holdings Ltd., 6.250% PIK or 5.250% Cash, 9/30/2027(b)(h) | |
| Sunac China Holdings Ltd., 6.500% PIK or 5.500% Cash, 9/30/2027(b)(h) | |
| Sunac China Holdings Ltd., 6.750% PIK or 5.750% Cash, 9/30/2028(b)(h) | |
| Sunac China Holdings Ltd., 7.000% PIK or 6.000% Cash, 9/30/2029(b)(h) | |
| Sunac China Holdings Ltd., 7.250% PIK or 6.250% Cash, 9/30/2030(b)(h) | |
| Times China Holdings Ltd., 6.200%, 3/22/2026(f) | |
| Yuzhou Group Holdings Co. Ltd., 6.350%, 1/13/2027(f) | |
| Zhenro Properties Group Ltd., 6.630%, 1/07/2026(f) | |
| Zhenro Properties Group Ltd., 6.700%, 8/04/2026(f) | |
| | |
| |
| HLF Financing SARL LLC/Herbalife International, Inc., 4.875%, 6/01/2029(b) | |
| Lamb Weston Holdings, Inc., 4.375%, 1/31/2032(b) | |
| Post Holdings, Inc., 4.625%, 4/15/2030(b) | |
| Post Holdings, Inc., 5.750%, 3/01/2027(b) | |
| Simmons Foods, Inc./Simmons Prepared Foods, Inc./Simmons Pet Food, Inc./Simmons Feed, 4.625%, 3/01/2029(b) | |
| | |
| |
| Light & Wonder International, Inc., 7.000%, 5/15/2028(b) | |
See accompanying notes to financial statements.
Portfolio of Investments – as of December 31, 2023Loomis Sayles High Income Fund (continued) | | |
|
| |
| Light & Wonder International, Inc., 7.500%, 9/01/2031(b) | |
| Melco Resorts Finance Ltd., 5.375%, 12/04/2029(b) | |
| Wynn Macau Ltd., 5.125%, 12/15/2029(b) | |
| Wynn Resorts Finance LLC/Wynn Resorts Capital Corp., 5.125%, 10/01/2029(b) | |
| | |
| Government Owned - No Guarantee — 0.2% |
| Petroleos Mexicanos, 5.950%, 1/28/2031 | |
| |
| MPT Operating Partnership LP/MPT Finance Corp., 3.500%, 3/15/2031 | |
| |
| Molina Healthcare, Inc., 3.875%, 11/15/2030(b) | |
| Molina Healthcare, Inc., 3.875%, 5/15/2032(b) | |
| | |
| |
| AdaptHealth LLC, 4.625%, 8/01/2029(b) | |
| AdaptHealth LLC, 5.125%, 3/01/2030(b) | |
| Bausch & Lomb Escrow Corp., 8.375%, 10/01/2028(b) | |
| CHS/Community Health Systems, Inc., 5.250%, 5/15/2030(b) | |
| DaVita, Inc., 3.750%, 2/15/2031(b) | |
| Encompass Health Corp., 4.750%, 2/01/2030 | |
| Fortrea Holdings, Inc., 7.500%, 7/01/2030(b) | |
| Garden Spinco Corp., 8.625%, 7/20/2030(b) | |
| Hologic, Inc., 3.250%, 2/15/2029(b) | |
| LifePoint Health, Inc., 5.375%, 1/15/2029(b) | |
| Medline Borrower LP, 3.875%, 4/01/2029(b) | |
| RP Escrow Issuer LLC, 5.250%, 12/15/2025(b) | |
| Star Parent, Inc., 9.000%, 10/01/2030(b) | |
| U.S. Acute Care Solutions LLC, 6.375%, 3/01/2026(b) | |
| | |
| |
| Brookfield Residential Properties, Inc./Brookfield Residential U.S. LLC, 4.875%, 2/15/2030(b) | |
| Corp. GEO SAB de CV, 8.875%, 3/27/2022(b)(f)(i) | |
| Empire Communities Corp., 7.000%, 12/15/2025(b) | |
| | |
| Independent Energy — 5.1% |
| Antero Resources Corp., 5.375%, 3/01/2030(b) | |
| Ascent Resources Utica Holdings LLC/ARU Finance Corp., 7.000%, 11/01/2026(b) | |
| Baytex Energy Corp., 8.500%, 4/30/2030(b) | |
| Baytex Energy Corp., 8.750%, 4/01/2027(b) | |
| Chesapeake Energy Corp., 6.750%, 4/15/2029(b) | |
| Civitas Resources, Inc., 8.375%, 7/01/2028(b) | |
| Civitas Resources, Inc., 8.625%, 11/01/2030(b) | |
| Crescent Energy Finance LLC, 7.250%, 5/01/2026(b) | |
| Crescent Energy Finance LLC, 9.250%, 2/15/2028(b) | |
| Gulfport Energy Corp., 8.000%, 5/17/2026(b) | |
| Leviathan Bond Ltd., 6.750%, 6/30/2030(b) | |
| Matador Resources Co., 5.875%, 9/15/2026 | |
| MEG Energy Corp., 5.875%, 2/01/2029(b) | |
| Murphy Oil Corp., 5.875%, 12/01/2042 | |
| Northern Oil & Gas, Inc., 8.125%, 3/01/2028(b) | |
| Northern Oil & Gas, Inc., 8.750%, 6/15/2031(b) | |
| Permian Resources Operating LLC, 5.375%, 1/15/2026(b) | |
| | |
|
| Independent Energy — continued |
| Permian Resources Operating LLC, 5.875%, 7/01/2029(b) | |
| Permian Resources Operating LLC, 6.875%, 4/01/2027(b) | |
| Permian Resources Operating LLC, 7.000%, 1/15/2032(b) | |
| Range Resources Corp., 8.250%, 1/15/2029 | |
| Sitio Royalties Operating Partnership LP/Sitio Finance Corp., 7.875%, 11/01/2028(b) | |
| SM Energy Co., 5.625%, 6/01/2025 | |
| SM Energy Co., 6.750%, 9/15/2026 | |
| Southwestern Energy Co., 5.375%, 2/01/2029 | |
| Strathcona Resources Ltd., 6.875%, 8/01/2026(b) | |
| | |
| |
| Brundage-Bone Concrete Pumping Holdings, Inc., 6.000%, 2/01/2026(b) | |
| Installed Building Products, Inc., 5.750%, 2/01/2028(b) | |
| | |
| |
| Carnival Corp., 5.750%, 3/01/2027(b) | |
| Carnival Corp., 6.000%, 5/01/2029(b) | |
| Carnival Corp., 7.000%, 8/15/2029(b) | |
| Cinemark USA, Inc., 5.250%, 7/15/2028(b) | |
| NCL Corp. Ltd., 5.875%, 3/15/2026(b) | |
| NCL Corp. Ltd., 5.875%, 3/15/2026 | |
| NCL Corp. Ltd., 8.125%, 1/15/2029(b) | |
| NCL Finance Ltd., 6.125%, 3/15/2028(b) | |
| Royal Caribbean Cruises Ltd., 3.700%, 3/15/2028 | |
| Royal Caribbean Cruises Ltd., 4.250%, 7/01/2026(b) | |
| Royal Caribbean Cruises Ltd., 5.500%, 4/01/2028(b) | |
| Royal Caribbean Cruises Ltd., 11.625%, 8/15/2027(b) | |
| SeaWorld Parks & Entertainment, Inc., 5.250%, 8/15/2029(b) | |
| Speedway Motorsports LLC/Speedway Funding II, Inc., 4.875%, 11/01/2027(b) | |
| Viking Cruises Ltd., 5.875%, 9/15/2027(b) | |
| Viking Cruises Ltd., 7.000%, 2/15/2029(b) | |
| Viking Ocean Cruises Ship VII Ltd., 5.625%, 2/15/2029(b) | |
| | |
| |
| Hilton Grand Vacations Borrower Escrow LLC/Hilton Grand Vacations Borrower Escrow, Inc., 4.875%, 7/01/2031(b) | |
| Hilton Grand Vacations Borrower Escrow LLC/Hilton Grand Vacations Borrower Escrow, Inc., 5.000%, 6/01/2029(b) | |
| Marriott Ownership Resorts, Inc., 4.500%, 6/15/2029(b) | |
| Travel & Leisure Co., 4.500%, 12/01/2029(b) | |
| Travel & Leisure Co., 4.625%, 3/01/2030(b) | |
| | |
| Media Entertainment — 1.5% |
| Diamond Sports Group LLC/Diamond Sports Finance Co., 5.375%, 8/15/2026(b)(f) | |
| Diamond Sports Group LLC/Diamond Sports Finance Co., 6.625%, 8/15/2027(b)(f) | |
| iHeartCommunications, Inc., 4.750%, 1/15/2028(b) | |
| iHeartCommunications, Inc., 4.750%, 1/15/2028 | |
See accompanying notes to financial statements.
Portfolio of Investments – as of December 31, 2023Loomis Sayles High Income Fund (continued) | | |
|
| Media Entertainment — continued |
| Outfront Media Capital LLC/Outfront Media Capital Corp., 5.000%, 8/15/2027(b) | |
| Outfront Media Capital LLC/Outfront Media Capital Corp., 7.375%, 2/15/2031(b) | |
| Playtika Holding Corp., 4.250%, 3/15/2029(b) | |
| Stagwell Global LLC, 5.625%, 8/15/2029(b) | |
| | |
| |
| ATI, Inc., 4.875%, 10/01/2029 | |
| ATI, Inc., 7.250%, 8/15/2030 | |
| Commercial Metals Co., 4.125%, 1/15/2030 | |
| First Quantum Minerals Ltd., 6.875%, 3/01/2026(b) | |
| First Quantum Minerals Ltd., 6.875%, 10/15/2027(b) | |
| GrafTech Finance, Inc., 4.625%, 12/15/2028(b) | |
| GrafTech Global Enterprises, Inc., 9.875%, 12/15/2028(b) | |
| Mineral Resources Ltd., 8.000%, 11/01/2027(b) | |
| Mineral Resources Ltd., 8.125%, 5/01/2027(b) | |
| Mineral Resources Ltd., 9.250%, 10/01/2028(b) | |
| Novelis Corp., 4.750%, 1/30/2030(b) | |
| Volcan Cia Minera SAA, 4.375%, 2/11/2026(b) | |
| | |
| |
| Antero Midstream Partners LP/Antero Midstream Finance Corp., 5.375%, 6/15/2029(b) | |
| Antero Midstream Partners LP/Antero Midstream Finance Corp., 7.875%, 5/15/2026(b) | |
| Buckeye Partners LP, 5.600%, 10/15/2044 | |
| Buckeye Partners LP, 5.850%, 11/15/2043 | |
| Energy Transfer LP, 6.000%, 2/01/2029(b) | |
| Energy Transfer LP, Series A, 3 mo. USD LIBOR + 4.028%, 9.669%(a)(j) | |
| EnLink Midstream LLC, 6.500%, 9/01/2030(b) | |
| EnLink Midstream Partners LP, 5.050%, 4/01/2045 | |
| EnLink Midstream Partners LP, 5.450%, 6/01/2047 | |
| EnLink Midstream Partners LP, 5.600%, 4/01/2044 | |
| EQM Midstream Partners LP, 5.500%, 7/15/2028 | |
| EQM Midstream Partners LP, 6.500%, 7/01/2027(b) | |
| EQM Midstream Partners LP, 6.500%, 7/15/2048 | |
| EQM Midstream Partners LP, 7.500%, 6/01/2027(b) | |
| EQM Midstream Partners LP, 7.500%, 6/01/2030(b) | |
| Ferrellgas LP/Ferrellgas Finance Corp., 5.375%, 4/01/2026(b) | |
| Hess Midstream Operations LP, 4.250%, 2/15/2030(b) | |
| Hess Midstream Operations LP, 5.125%, 6/15/2028(b) | |
| Hess Midstream Operations LP, 5.625%, 2/15/2026(b) | |
| Kinetik Holdings LP, 5.875%, 6/15/2030(b) | |
| Kinetik Holdings LP, 6.625%, 12/15/2028(b) | |
| Suburban Propane Partners LP/Suburban Energy Finance Corp., 5.000%, 6/01/2031(b) | |
| Sunoco LP/Sunoco Finance Corp., 4.500%, 5/15/2029 | |
| Venture Global Calcasieu Pass LLC, 3.875%, 11/01/2033(b) | |
| Venture Global Calcasieu Pass LLC, 4.125%, 8/15/2031(b) | |
| Venture Global LNG, Inc., 8.375%, 6/01/2031(b) | |
| | |
| | |
|
| Non-Agency Commercial Mortgage-Backed Securities — 1.8% |
| CG-CCRE Commercial Mortgage Trust, Series 2014-FL2, Class COL1, 1 mo. USD SOFR + 3.614%, 8.976%, 11/15/2031(a)(b) | |
| CG-CCRE Commercial Mortgage Trust, Series 2014-FL2, Class COL2, 1 mo. USD SOFR + 4.614%, 9.976%, 11/15/2031(a)(b) | |
| Credit Suisse Mortgage Trust, Series 2014-USA, Class E, 4.373%, 9/15/2037(b) | |
| Starwood Retail Property Trust, Series 2014-STAR, Class D, PRIME + 0.000%, 8.500%, 11/15/2027(a)(b)(d)(i) | |
| Starwood Retail Property Trust, Series 2014-STAR, Class E, PRIME + 0.000%, 8.500%, 11/15/2027(a)(b)(d)(i) | |
| Wells Fargo Commercial Mortgage Trust, Series 2016-C36, Class C, 4.118%, 11/15/2059(a) | |
| WFRBS Commercial Mortgage Trust, Series 2011-C3, Class D, 5.855%, 3/15/2044(a)(b) | |
| WFRBS Commercial Mortgage Trust, Series 2012-C10, Class C, 4.329%, 12/15/2045(a) | |
| | |
| Oil Field Services — 1.8% |
| Diamond Foreign Asset Co./Diamond Finance LLC, 8.500%, 10/01/2030(b) | |
| Nabors Industries, Inc., 9.125%, 1/31/2030(b) | |
| Oceaneering International, Inc., 6.000%, 2/01/2028(b) | |
| Solaris Midstream Holdings LLC, 7.625%, 4/01/2026(b) | |
| Transocean Aquila Ltd., 8.000%, 9/30/2028(b) | |
| Transocean Poseidon Ltd., 6.875%, 2/01/2027(b) | |
| Transocean Titan Financing Ltd., 8.375%, 2/01/2028(b) | |
| Transocean, Inc., 7.500%, 1/15/2026(b) | |
| Weatherford International Ltd., 8.625%, 4/30/2030(b) | |
| | |
| |
| Service Properties Trust, 4.750%, 10/01/2026 | |
| Service Properties Trust, 7.500%, 9/15/2025 | |
| Service Properties Trust, 8.625%, 11/15/2031(b) | |
| | |
| |
| Graham Packaging Co., Inc., 7.125%, 8/15/2028(b) | |
| Sealed Air Corp./Sealed Air Corp. U.S., 6.125%, 2/01/2028(b) | |
| | |
| |
| Bausch Health Cos., Inc., 4.875%, 6/01/2028(b) | |
| Bausch Health Cos., Inc., 5.250%, 1/30/2030(b) | |
| Bausch Health Cos., Inc., 6.125%, 2/01/2027(b) | |
| Cheplapharm Arzneimittel GmbH, 5.500%, 1/15/2028(b) | |
| Organon & Co./Organon Foreign Debt Co-Issuer BV, 5.125%, 4/30/2031(b) | |
| Perrigo Finance Unlimited Co., 4.650%, 6/15/2030 | |
| Teva Pharmaceutical Finance Co. LLC, 6.150%, 2/01/2036 | |
| Teva Pharmaceutical Finance Netherlands III BV, 3.150%, 10/01/2026 | |
See accompanying notes to financial statements.
Portfolio of Investments – as of December 31, 2023Loomis Sayles High Income Fund (continued) | | |
|
| Pharmaceuticals — continued |
| Teva Pharmaceutical Finance Netherlands III BV, 4.100%, 10/01/2046 | |
| Teva Pharmaceutical Finance Netherlands III BV, 7.875%, 9/15/2029 | |
| | |
| Property & Casualty Insurance — 1.2% |
| Acrisure LLC/Acrisure Finance, Inc., 4.250%, 2/15/2029(b) | |
| Alliant Holdings Intermediate LLC/Alliant Holdings Co-Issuer, 6.750%, 10/15/2027(b) | |
| AmWINS Group, Inc., 4.875%, 6/30/2029(b) | |
| AssuredPartners, Inc., 5.625%, 1/15/2029(b) | |
| BroadStreet Partners, Inc., 5.875%, 4/15/2029(b) | |
| HUB International Ltd., 7.250%, 6/15/2030(b) | |
| Liberty Mutual Group, Inc., 4.300%, 2/01/2061(b) | |
| | |
| |
| CVR Energy, Inc., 5.250%, 2/15/2025(b) | |
| CVR Energy, Inc., 8.500%, 1/15/2029(b) | |
| HF Sinclair Corp., 5.000%, 2/01/2028(b) | |
| Parkland Corp., 4.500%, 10/01/2029(b) | |
| PBF Holding Co. LLC/PBF Finance Corp., 7.875%, 9/15/2030(b) | |
| | |
| |
| 1011778 BC ULC/New Red Finance, Inc., 3.875%, 1/15/2028(b) | |
| Papa John's International, Inc., 3.875%, 9/15/2029(b) | |
| Yum! Brands, Inc., 3.625%, 3/15/2031 | |
| Yum! Brands, Inc., 4.625%, 1/31/2032 | |
| | |
| |
| Asbury Automotive Group, Inc., 4.500%, 3/01/2028 | |
| Asbury Automotive Group, Inc., 4.625%, 11/15/2029(b) | |
| Asbury Automotive Group, Inc., 4.750%, 3/01/2030 | |
| Bath & Body Works, Inc., 5.250%, 2/01/2028 | |
| Bath & Body Works, Inc., 6.750%, 7/01/2036 | |
| Bath & Body Works, Inc., 6.875%, 11/01/2035 | |
| Ken Garff Automotive LLC, 4.875%, 9/15/2028(b) | |
| Lithia Motors, Inc., 4.375%, 1/15/2031(b) | |
| Michaels Cos., Inc., 7.875%, 5/01/2029(b) | |
| NMG Holding Co., Inc./Neiman Marcus Group LLC, 7.125%, 4/01/2026(b) | |
| Sonic Automotive, Inc., 4.625%, 11/15/2029(b) | |
| Sonic Automotive, Inc., 4.875%, 11/15/2031(b) | |
| | |
| |
| Cloud Software Group, Inc., 6.500%, 3/31/2029(b) | |
| CommScope Technologies LLC, 5.000%, 3/15/2027(b) | |
| CommScope, Inc., 4.750%, 9/01/2029(b) | |
| CommScope, Inc., 6.000%, 3/01/2026(b) | |
| Dun & Bradstreet Corp., 5.000%, 12/15/2029(b) | |
| Elastic NV, 4.125%, 7/15/2029(b) | |
| Everi Holdings, Inc., 5.000%, 7/15/2029(b) | |
| GoTo Group, Inc., 5.500%, 9/01/2027(b) | |
| GTCR W-2 Merger Sub LLC, 7.500%, 1/15/2031(b) | |
| Iron Mountain, Inc., 4.500%, 2/15/2031(b) | |
| Iron Mountain, Inc., 4.875%, 9/15/2029(b) | |
| Iron Mountain, Inc., 5.250%, 7/15/2030(b) | |
| | |
|
| |
| NCR Atleos Corp., 9.500%, 4/01/2029(b) | |
| NCR Voyix Corp., 5.000%, 10/01/2028(b) | |
| NCR Voyix Corp., 5.125%, 4/15/2029(b) | |
| Neptune Bidco U.S., Inc., 9.290%, 4/15/2029(b) | |
| Newfold Digital Holdings Group, Inc., 11.750%, 10/15/2028(b) | |
| Paysafe Finance PLC/Paysafe Holdings U.S. Corp., 4.000%, 6/15/2029(b) | |
| Presidio Holdings, Inc., 8.250%, 2/01/2028(b) | |
| Rackspace Technology Global, Inc., 5.375%, 12/01/2028(b) | |
| Sabre Global, Inc., 11.250%, 12/15/2027(b) | |
| Seagate HDD Cayman, 4.091%, 6/01/2029 | |
| Seagate HDD Cayman, 4.875%, 6/01/2027 | |
| Seagate HDD Cayman, 8.250%, 12/15/2029(b) | |
| Sensata Technologies, Inc., 3.750%, 2/15/2031(b) | |
| Sensata Technologies, Inc., 4.375%, 2/15/2030(b) | |
| Western Digital Corp., 2.850%, 2/01/2029 | |
| Ziff Davis, Inc., 4.625%, 10/15/2030(b) | |
| | |
| Transportation Services — 0.7% |
| Rand Parent LLC, 8.500%, 2/15/2030(b) | |
| |
| U.S. Treasury Notes, 2.750%, 2/15/2024 | |
| |
| Altice France SA, 5.125%, 1/15/2029(b) | |
| Altice France SA, 8.125%, 2/01/2027(b) | |
| SoftBank Group Corp., 4.625%, 7/06/2028 | |
| | |
| |
| Cincinnati Bell Telephone Co. LLC, 6.300%, 12/01/2028 | |
| Frontier Communications Holdings LLC, 5.000%, 5/01/2028(b) | |
| Frontier Communications Holdings LLC, 5.875%, 10/15/2027(b) | |
| Level 3 Financing, Inc., 3.625%, 1/15/2029(b) | |
| Level 3 Financing, Inc., 4.250%, 7/01/2028(b) | |
| Lumen Technologies, Inc., 4.000%, 2/15/2027(b) | |
| Telecom Italia Capital SA, 6.375%, 11/15/2033 | |
| Uniti Group LP/Uniti Group Finance, Inc./CSL Capital LLC, 4.750%, 4/15/2028(b) | |
| | |
| Total Non-Convertible Bonds
(Identified Cost $48,561,186) | |
|
|
|
| |
| Southwest Airlines Co., 1.250%, 5/01/2025 | |
| |
| DISH Network Corp., 3.375%, 8/15/2026 | |
| DISH Network Corp., Zero Coupon, 6.944%–33.530%, 12/15/2025(e) | |
| | |
| Consumer Cyclical Services — 0.1% |
| Zillow Group, Inc., 1.375%, 9/01/2026 | |
| |
| Sunac China Holdings Ltd., 7.800% PIK or 7.800% Cash, 9/30/2032(b)(h) | |
See accompanying notes to financial statements.
Portfolio of Investments – as of December 31, 2023Loomis Sayles High Income Fund (continued) | | |
|
| |
| Penn Entertainment, Inc., 2.750%, 5/15/2026 | |
| |
| Envista Holdings Corp., 1.750%, 8/15/2028(b) | |
| Independent Energy — 0.2% |
| Northern Oil & Gas, Inc., 3.625%, 4/15/2029 | |
| |
| NCL Corp. Ltd., 1.125%, 2/15/2027 | |
| |
| BioMarin Pharmaceutical, Inc., 1.250%, 5/15/2027 | |
| |
| Wolfspeed, Inc., 0.250%, 2/15/2028 | |
| Wolfspeed, Inc., 1.875%, 12/01/2029 | |
| | |
| Total Convertible Bonds
(Identified Cost $2,590,140) | |
| Total Bonds and Notes
(Identified Cost $51,151,326) | |
|
|
|
| Aerospace & Defense — 0.3% |
| TransDigm, Inc., 2023 Term Loan J, 3 mo. USD SOFR + 3.250%, 8.598%, 2/14/2031(a)(k) | |
| |
| Edelman Financial Center LLC, 2021 Term Loan B, 4/07/2028(l) | |
| |
| Chemours Co., 2023 USD Term Loan B, 1 mo. USD SOFR + 3.500%, 8.856%, 8/18/2028(a)(k) | |
| |
| Talen Energy Supply LLC, 2023 Term Loan B, 3 mo. USD SOFR + 4.500%, 9.869%, 5/17/2030(a)(k) | |
| |
| Chobani LLC, 2023 Incremental Term Loan, 3 mo. USD SOFR + 3.750%, 9.112%, 10/25/2027(a)(k) | |
| |
| IVC Acquisition Ltd., 2023 USD Term Loan B, 11/17/2028(l) | |
| Star Parent, Inc., Term Loan B, 3 mo. USD SOFR + 4.000%, 9.348%, 9/27/2030(a)(k) | |
| | |
| |
| Carnival Corp., 2021 Incremental Term Loan B, 1 mo. USD SOFR + 3.250%, 8.720%, 10/18/2028(a)(k) | |
| Carnival Corp., 2023 Term Loan B, 1 mo. USD SOFR + 3.000%, 8.357%, 8/08/2027(a)(k) | |
| | |
| Media Entertainment — 0.2% |
| MH Sub I LLC, 2023 Term Loan, 1 mo. USD SOFR + 4.250%, 9.606%, 5/03/2028(a)(k) | |
| Property & Casualty Insurance — 0.5% |
| Acrisure LLC, 2020 Term Loan B, 2/15/2027(a)(k) | |
| Acrisure LLC, 2020 Term Loan B, 2/15/2027(l) | |
| AssuredPartners, Inc., 2023 Term Loan B4, 2/12/2027(l) | |
| | |
|
| Property & Casualty Insurance — continued |
| USI, Inc., 2023 Acquisition Term Loan, 3 mo. USD SOFR + 3.250%, 8.598%, 9/27/2030(a)(k) | |
| USI, Inc., 2023 Term Loan B, 3 mo. USD SOFR + 3.000%, 8.348%, 11/22/2029(a)(k) | |
| | |
| |
| Iron Mountain, Inc., 2023 Term Loan B, 1/31/2031(l) | |
| Neptune Bidco U.S., Inc., 2022 USD Term Loan B, 3 mo. USD SOFR + 5.000%, 10.507%, 4/11/2029(a)(k) | |
| | |
| Transportation Services — 0.2% |
| PODS LLC, 2021 Term Loan B, 1 mo. USD SOFR + 3.000%, 8.470%, 3/31/2028(l) | |
| Total Senior Loans
(Identified Cost $1,355,497) | |
|
|
Collateralized Loan Obligations — 1.1% |
| Battalion CLO XVI Ltd., Series 2019-16A, Class ER, 3 mo. USD SOFR + 6.862%, 12.277%, 12/19/2032(a)(b) | |
| NYACK Park CLO Ltd., Series 2021-1A, Class E, 3 mo. USD SOFR + 6.362%, 11.777%, 10/20/2034(a)(b) | |
| Total Collateralized Loan Obligations
(Identified Cost $500,000) | |
| | |
|
|
|
Convertible Preferred Stock — 0.3% |
| |
| Clarivate PLC, Series A, 5.250%
(Identified Cost $169,212) | |
|
|
|
| Energy Equipment & Services — 0.0% |
| McDermott International Ltd.(d) | |
| |
| iHeartMedia, Inc., Class A(d) | |
| Oil, Gas & Consumable Fuels — 0.1% |
| | |
| Total Common Stocks
(Identified Cost $841,517) | |
|
|
|
| McDermott International Ltd., Tranche A, Expiration on 5/1/2024, (d)(i) | |
| McDermott International Ltd., Tranche B, Expiration on 5/1/2024, (d)(i) | |
| Total Warrants
(Identified Cost $31,517) | |
|
|
|
| |
| ECAF I Blocker, Ltd.(i)(m)
(Identified Cost $1,000,000) | |
See accompanying notes to financial statements.
Portfolio of Investments – as of December 31, 2023Loomis Sayles High Income Fund (continued)
| | |
Short-Term Investments — 3.3% |
| Tri-Party Repurchase Agreement with Fixed Income Clearing Corporation, dated 12/29/2023 at 2.500% to be repurchased at $911,857 on 1/02/2024 collateralized by $913,300 U.S. Treasury Note, 4.125% due 9/30/2027 valued at $929,842 including accrued interest (Note 2 of Notes to Financial Statements) | |
| U.S. Treasury Bills, 5.170%–5.237%, 4/09/2024(n)(o) | |
| Total Short-Term Investments
(Identified Cost $1,483,307) | |
| Total Investments — 100.6%
(Identified Cost $56,532,376) | |
| Other assets less liabilities — (0.6)% | |
| | |
| See Note 2 of Notes to Financial Statements. |
| Variable rate security. Rate as of December 31, 2023 is disclosed. Issuers comprised of various lots with differing coupon rates have been aggregated for the purpose of presentation in the Portfolio of Investments and show a weighted average rate. Certain variable rate securities are not based on a published reference rate and spread, rather are determined by the issuer or agent and are based on current market conditions. These securities may not indicate a reference rate and/or spread in their description. |
| All or a portion of these securities are exempt from registration under Rule 144A of the Securities Act of 1933. These securities may be resold in transactions exempt from registration, normally to qualified institutional buyers. At December 31, 2023, the value of Rule 144A holdings amounted to $32,057,040 or 71.1% of net assets. |
| Payment-in-kind security for which the issuer, at each interest payment date, may make interest payments in cash and/or additional principal. For the period ended December 31, 2023, interest payments were made in cash. |
| Non-income producing security. |
| Interest rate represents annualized yield at time of purchase; not a coupon rate. The Fund’s investment in this security is comprised of various lots with differing annualized yields. |
| The issuer is in default with respect to interest and/or principal payments. Income is not being accrued. |
| Payment–in–kind security for which the issuer, at each interest payment date, may make interest payments in cash and/or additional principal. For the period ended December 31, 2023, interest payments were made in principal. |
| Payment–in–kind security for which the issuer, at each interest payment date, may make interest payments in cash and/or additional principal. No payments were received during the period. |
| Level 3 security. Value has been determined using significant unobservable inputs. See Note 3 of Notes to Financial Statements. |
| Perpetual bond with no specified maturity date. |
| Stated interest rate has been determined in accordance with the provisions of the loan agreement and is subject to a minimum benchmark floor rate which may range from 0.00% to 2.50%, to which the spread is added. |
| Position is unsettled. Contract rate was not determined at December 31, 2023 and does not take effect until settlement date. Maturity date is not finalized until settlement date. |
| Securities subject to restriction on resale. At December 31, 2023, the restricted securities held by the Fund are as follows: |
| The Fund's investment in U.S. Government/Agency securities is comprised of various lots with differing discount rates. These separate investments, which have the same maturity date, have been aggregated for the purpose of presentation in the Portfolio of Investments. |
| Interest rate represents discount rate at time of purchase; not a coupon rate. |
| |
| London Interbank Offered Rate |
| |
| Real Estate Investment Trusts |
| Secured Overnight Financing Rate |
At December 31, 2023, the Fund had the following open centrally cleared credit default swap agreements:
| | | | | Unamortized
Up Front Premium
Paid/(Received) | | Unrealized
Appreciation
(Depreciation) |
| | | | | | | |
| Notional value stated in U.S. dollars unless otherwise noted. |
| Implied credit spreads, represented in absolute terms, serve as an indicator of the current status of the payment/performance risk and represent the likelihood or risk of default for the credit derivative. The implied credit spread of a particular reference entity reflects the cost of buying/selling protection and may include upfront payments required to be made to enter into the agreement. Wider credit spreads represent a deterioration of the reference entity’s credit soundness and a greater likelihood or risk of default or other credit event occurring as defined under the terms of the agreement. |
| CDX.NA.HY is an index composed of North American high yield credit default swaps. |
See accompanying notes to financial statements.
Portfolio of Investments – as of December 31, 2023Loomis Sayles High Income Fund (continued) Industry Summary at December 31, 2023
| |
| |
| |
| |
| |
| |
| |
| |
| |
Consumer Cyclical Services | |
| |
| |
| |
Other Investments, less than 2% each | |
Collateralized Loan Obligations | |
| |
| |
Other assets less liabilities (including swap agreements) | |
| |
See accompanying notes to financial statements.
Portfolio of Investments – as of December 31, 2023Loomis Sayles Investment Grade Bond Fund
| | |
Bonds and Notes — 74.9% of Net Assets |
|
|
Non-Convertible Bonds — 73.4% |
| |
| American Credit Acceptance Receivables Trust, Series 2022-1, Class D, 2.460%, 3/13/2028(a) | |
| American Credit Acceptance Receivables Trust, Series 2022-4, Class C, 7.860%, 2/15/2029(a) | |
| American Credit Acceptance Receivables Trust, Series 2023-2, Class C, 5.960%, 8/13/2029(a) | |
| American Credit Acceptance Receivables Trust, Series 2023-3, Class D, 6.820%, 10/12/2029(a) | |
| American Credit Acceptance Receivables Trust, Series 2023-4, Class D, 7.650%, 9/12/2030(a) | |
| AmeriCredit Automobile Receivables Trust, Series 2019-2, Class D, 2.990%, 6/18/2025 | |
| AmeriCredit Automobile Receivables Trust, Series 2020-2, Class D, 2.130%, 3/18/2026 | |
| Avis Budget Rental Car Funding AESOP LLC, Series 2018-2A, Class D, 3.040%, 3/20/2025(a) | |
| Avis Budget Rental Car Funding AESOP LLC, Series 2020-2A, Class A, 2.020%, 2/20/2027(a) | |
| Avis Budget Rental Car Funding AESOP LLC, Series 2021-2A, Class D, 4.080%, 2/20/2028(a) | |
| Avis Budget Rental Car Funding AESOP LLC, Series 2023-4A, Class C, 7.240%, 6/20/2029(a) | |
| Avis Budget Rental Car Funding AESOP LLC, Series 2023-8A, Class C, 7.340%, 2/20/2030(a) | |
| Bridgecrest Lending Auto Securitization Trust, Series 2023-1, Class D, 7.840%, 8/15/2029 | |
| CarMax Auto Owner Trust, Series 2021-3, Class D, 1.500%, 1/18/2028 | |
| CarMax Auto Owner Trust, Series 2022-1, Class D, 2.470%, 7/17/2028 | |
| CarMax Auto Owner Trust, Series 2023-1, Class D, 6.270%, 11/15/2029 | |
| CarMax Auto Owner Trust, Series 2023-2, Class D, 6.550%, 10/15/2029 | |
| CarMax Auto Owner Trust, Series 2023-4, Class D, 7.160%, 4/15/2030 | |
| Carvana Auto Receivables Trust, Series 2023-N1, Class D, 6.690%, 7/10/2029(a) | |
| Carvana Auto Receivables Trust, Series 2023-N4, Class D, 7.220%, 2/11/2030(a) | |
| Credit Acceptance Auto Loan Trust, Series 2020-3A, Class C, 2.280%, 2/15/2030(a) | |
| Credit Acceptance Auto Loan Trust, Series 2023-1A, Class C, 7.710%, 7/15/2033(a) | |
| Credit Acceptance Auto Loan Trust, Series 2023-2A, Class C, 7.150%, 9/15/2033(a) | |
| Credit Acceptance Auto Loan Trust, Series 2023-3A, Class C, 7.620%, 12/15/2033(a) | |
| DT Auto Owner Trust, Series 2022-1A, Class D, 3.400%, 12/15/2027(a) | |
| DT Auto Owner Trust, Series 2023-1A, Class D, 6.440%, 11/15/2028(a) | |
| DT Auto Owner Trust, Series 2023-2A, Class D, 6.620%, 2/15/2029(a) | |
| | |
|
| |
| DT Auto Owner Trust, Series 2023-3A, Class D, 7.120%, 5/15/2029(a) | |
| Exeter Automobile Receivables Trust, Series 2021-1A, Class D, 1.080%, 11/16/2026 | |
| Exeter Automobile Receivables Trust, Series 2022-2A, Class D, 4.560%, 7/17/2028 | |
| Exeter Automobile Receivables Trust, Series 2022-3A, Class D, 6.760%, 9/15/2028 | |
| Exeter Automobile Receivables Trust, Series 2022-6A, Class C, 6.320%, 5/15/2028 | |
| Exeter Automobile Receivables Trust, Series 2023-1A, Class D, 6.690%, 6/15/2029 | |
| Exeter Automobile Receivables Trust, Series 2023-2A, Class D, 6.320%, 8/15/2029 | |
| Exeter Automobile Receivables Trust, Series 2023-3A, Class D, 6.680%, 4/16/2029 | |
| Exeter Automobile Receivables Trust, Series 2023-5A, Class D, 7.130%, 2/15/2030 | |
| First Investors Auto Owner Trust, Series 2022-1A, Class D, 3.790%, 6/15/2028(a) | |
| First Investors Auto Owner Trust, Series 2022-2A, Class D, 8.710%, 10/16/2028(a) | |
| Flagship Credit Auto Trust, Series 2019-3, Class D, 2.860%, 12/15/2025(a) | |
| Flagship Credit Auto Trust, Series 2023-1, Class D, 6.460%, 5/15/2029(a) | |
| Flagship Credit Auto Trust, Series 2023-2, Class D, 6.620%, 5/15/2029(a) | |
| Flagship Credit Auto Trust, Series 2023-3, Class D, 6.580%, 8/15/2029(a) | |
| Ford Credit Auto Lease Trust, Series 2023-B, Class D, 6.970%, 6/15/2028 | |
| Ford Credit Auto Owner Trust, Series 2020-C, Class A3, 0.410%, 7/15/2025 | |
| Ford Credit Auto Owner Trust, Series 2021-A, Class A3, 0.300%, 8/15/2025 | |
| GLS Auto Receivables Issuer Trust, Series 2023-2A, Class D, 6.310%, 3/15/2029(a) | |
| GLS Auto Receivables Issuer Trust, Series 2023-3A, Class D, 6.440%, 5/15/2029(a) | |
| GLS Auto Receivables Issuer Trust, Series 2023-4A, Class D, 7.180%, 8/15/2029(a) | |
| GM Financial Consumer Automobile Receivables Trust, Series 2021-1, Class A3, 0.350%, 10/16/2025 | |
| GM Financial Consumer Automobile Receivables Trust, Series 2021-2, Class A3, 0.510%, 4/16/2026 | |
| Hertz Vehicle Financing III LLC, Series 2022-1A, Class D, 4.850%, 6/25/2026(a) | |
| Hertz Vehicle Financing III LLC, Series 2022-3A, Class D, 6.310%, 3/25/2025(a) | |
| Hertz Vehicle Financing III LLC, Series 2023-1A, Class D2, 9.130%, 6/25/2027(a) | |
| Hertz Vehicle Financing III LLC, Series 2023-3A, Class D, 9.430%, 2/25/2028(a) | |
| Hertz Vehicle Financing LLC, Series 2022-2A, Class D, 5.160%, 6/26/2028(a) | |
| Hertz Vehicle Financing LLC, Series 2022-4A, Class D, 6.560%, 9/25/2026(a) | |
| Honda Auto Receivables Owner Trust, Series 2021-1, Class A3, 0.270%, 4/21/2025 | |
See accompanying notes to financial statements.
Portfolio of Investments – as of December 31, 2023Loomis Sayles Investment Grade Bond Fund (continued) | | |
|
| |
| JPMorgan Chase Bank N.A, Series 2021-1, Class D, 1.174%, 9/25/2028(a) | |
| LAD Auto Receivables Trust, Series 2023-3A, Class C, 6.430%, 12/15/2028(a) | |
| LAD Auto Receivables Trust, Series 2023-4A, Class C, 6.760%, 3/15/2029(a) | |
| LAD Auto Receivables Trust, Series 2023-4A, Class D, 7.370%, 4/15/2031(a) | |
| OneMain Direct Auto Receivables Trust, Series 2023-1A, Class D, 7.070%, 2/14/2033(a) | |
| Prestige Auto Receivables Trust, Series 2020-1A, Class E, 3.670%, 2/15/2028(a) | |
| Prestige Auto Receivables Trust, Series 2023-1A, Class D, 6.330%, 4/16/2029(a) | |
| Prestige Auto Receivables Trust, Series 2023-2A, Class D, 7.710%, 8/15/2029(a) | |
| SFS Auto Receivables Securitization Trust, Series 2023-1A, Class C, 5.970%, 2/20/2031(a) | |
| Westlake Automobile Receivables Trust, Series 2023-1A, Class D, 6.790%, 11/15/2028(a) | |
| Westlake Automobile Receivables Trust, Series 2023-2A, Class D, 7.010%, 11/15/2028(a) | |
| Westlake Automobile Receivables Trust, Series 2023-3A, Class D, 6.470%, 3/15/2029(a) | |
| Westlake Automobile Receivables Trust, Series 2023-4A, Class D, 7.190%, 7/16/2029(a) | |
| | |
| |
| Mission Lane Credit Card Master Trust, Series 2023-A, Class A, 7.230%, 7/17/2028(a) | |
| Mission Lane Credit Card Master Trust, Series 2023-B, Class A, 7.690%, 11/15/2028(a) | |
| | |
| |
| American Homes 4 Rent Trust, Series 2015-SFR1, Class E, 5.639%, 4/17/2052(a) | |
| Citigroup Mortgage Loan Trust, Inc., Series 2019-RP1, Class A1, 3.500%, 1/25/2066(a)(b) | |
| COLT Mortgage Loan Trust, Series 2021-6, Class A1, 1.907%, 12/25/2066(a)(b) | |
| CoreVest American Finance Ltd., Series 2019-1, Class D, 4.818%, 3/15/2052(a) | |
| CoreVest American Finance Ltd., Series 2019-3, Class A, 2.705%, 10/15/2052(a) | |
| CoreVest American Finance Ltd., Series 2019-3, Class B, 3.163%, 10/15/2052(a) | |
| CoreVest American Finance Ltd., Series 2020-2, Class C, 4.586%, 5/15/2052(a)(b) | |
| CoreVest American Finance Ltd., Series 2021-3, Class D, 3.469%, 10/15/2054(a) | |
| CoreVest American Finance Ltd., Series 2021-RTL1, Class A1, 2.239%, 3/28/2029(a)(b) | |
| CoreVest American Finance Ltd., Series 2023-RTL1, Class A1, 7.553%, 12/28/2030(a)(b) | |
| Credit Suisse Mortgage Trust, Series 2020-RPL3, Class A1, 4.046%, 3/25/2060(a)(b) | |
| | |
|
| ABS Home Equity — continued |
| Credit Suisse Mortgage Trust, Series 2021-RPL1, Class A1, 1.668%, 9/27/2060(a)(b) | |
| Deephaven Residential Mortgage Trust, Series 2021-2, Class A1, 0.899%, 4/25/2066(a)(b) | |
| Federal Home Loan Mortgage Corp., Series 2022-DNA3, Class M1A, REMICS, 30 day USD SOFR Average + 2.000%, 7.337%, 4/25/2042(a)(b) | |
| Federal Home Loan Mortgage Corp. Structured Agency Credit Risk Debt Notes, Series 2023-DNA2, Class M1A, 30 day USD SOFR Average + 2.100%, 7.437%, 4/25/2043(a)(b) | |
| Federal National Mortgage Association Connecticut Avenue Securities, Series 2022-R06, Class 1M1, 30 day USD SOFR Average + 2.750%, 8.087%, 5/25/2042(a)(b) | |
| Federal National Mortgage Association Connecticut Avenue Securities, Series 2023-R02, Class 1M1, 30 day USD SOFR Average + 2.300%, 7.637%, 1/25/2043(a)(b) | |
| Federal National Mortgage Association Connecticut Avenue Securities, Series 2023-R08, Class 1M1, 30 day USD SOFR Average + 1.500%, 6.837%, 10/25/2043(a)(b) | |
| FirstKey Homes Trust, Series 2020-SFR1, Class D, 2.241%, 8/17/2037(a) | |
| FirstKey Homes Trust, Series 2020-SFR1, Class E, 2.791%, 8/17/2037(a) | |
| FirstKey Homes Trust, Series 2020-SFR2, Class D, 1.968%, 10/19/2037(a) | |
| FirstKey Homes Trust, Series 2021-SFR2, Class B, 1.607%, 9/17/2038(a) | |
| FirstKey Homes Trust, Series 2021-SFR3, Class B, 2.435%, 12/17/2038(a) | |
| FirstKey Homes Trust, Series 2022-SFR2, Class D, 4.500%, 7/17/2039(a) | |
| GCAT Trust, Series 2019-RPL1, Class A1, 2.650%, 10/25/2068(a)(b) | |
| GITSIT Mortgage Loan Trust, Series 2023-NPL1, Class A1, 8.353%, 5/25/2053(a)(b) | |
| Home Partners of America Trust, Series 2019-1, Class D, 3.406%, 9/17/2039(a) | |
| Home Partners of America Trust, Series 2019-2, Class D, 3.121%, 10/19/2039(a) | |
| Home Partners of America Trust, Series 2021-1, Class E, 2.577%, 9/17/2041(a) | |
| Home Partners of America Trust, Series 2021-2, Class E1, 2.852%, 12/17/2026(a) | |
| Home Partners of America Trust, Series 2021-2, Class E2, 2.952%, 12/17/2026(a) | |
| Legacy Mortgage Asset Trust, Series 2019-GS7, Class A1, 7.250%, 11/25/2059(a)(b) | |
| Legacy Mortgage Asset Trust, Series 2020-GS1, Class A1, 5.882%, 10/25/2059(a)(b) | |
| Legacy Mortgage Asset Trust, Series 2020-GS5, Class A1, 6.250%, 6/25/2060(a)(b) | |
| Legacy Mortgage Asset Trust, Series 2021-GS4, Class A1, 1.650%, 11/25/2060(a)(b) | |
| Mill City Mortgage Loan Trust, Series 2018-2, Class M1, 3.750%, 5/25/2058(a)(b) | |
See accompanying notes to financial statements.
Portfolio of Investments – as of December 31, 2023Loomis Sayles Investment Grade Bond Fund (continued) | | |
|
| ABS Home Equity — continued |
| Mill City Mortgage Loan Trust, Series 2019-1, Class A1, 3.250%, 10/25/2069(a)(b) | |
| Mill City Mortgage Loan Trust, Series 2019-1, Class M1, 3.500%, 10/25/2069(a)(b) | |
| Mill City Mortgage Loan Trust, Series 2019-GS1, Class A1, 2.750%, 7/25/2059(a)(b) | |
| NLT Trust, Series 2023-1, Class A1, 3.200%, 10/25/2062(a)(b) | |
| OBX Trust, Series 2021-NQM3, Class A1, 1.054%, 7/25/2061(a)(b) | |
| Progress Residential Trust, Series 2019-SFR4, Class D, 3.136%, 10/17/2036(a) | |
| Progress Residential Trust, Series 2020-SFR2, Class C, 3.077%, 6/17/2037(a) | |
| Progress Residential Trust, Series 2020-SFR3, Class B, 1.495%, 10/17/2027(a) | |
| Progress Residential Trust, Series 2020-SFR3, Class D, 1.896%, 10/17/2027(a) | |
| Progress Residential Trust, Series 2020-SFR3, Class E, 2.296%, 10/17/2027(a) | |
| Progress Residential Trust, Series 2021-SFR2, Class E1, 2.547%, 4/19/2038(a) | |
| Progress Residential Trust, Series 2021-SFR3, Class C, 2.088%, 5/17/2026(a) | |
| Progress Residential Trust, Series 2021-SFR3, Class E1, 2.538%, 5/17/2026(a) | |
| Progress Residential Trust, Series 2021-SFR3, Class E2, 2.688%, 5/17/2026(a) | |
| Progress Residential Trust, Series 2021-SFR6, Class E1, 2.425%, 7/17/2038(a) | |
| Progress Residential Trust, Series 2021-SFR6, Class E2, 2.525%, 7/17/2038(a) | |
| Progress Residential Trust, Series 2021-SFR9, Class E1, 2.811%, 11/17/2040(a) | |
| Progress Residential Trust, Series 2021-SFR9, Class E2, 3.010%, 11/17/2040(a) | |
| Progress Residential Trust, Series 2023-SFR1, Class C, 4.650%, 3/17/2040(a) | |
| Progress Residential Trust, Series 2023-SFR1, Class D, 4.650%, 3/17/2040(a) | |
| Progress Residential Trust, Series 2023-SFR2, Class B, 4.500%, 10/17/2028(a) | |
| PRPM LLC, Series 2020-4, Class A1, 5.951%, 10/25/2025(a)(b) | |
| PRPM LLC, Series 2021-1, Class A1, 2.115%, 1/25/2026(a)(b) | |
| PRPM LLC, Series 2021-10, Class A1, 2.487%, 10/25/2026(a)(b) | |
| PRPM LLC, Series 2021-2, Class A1, 2.115%, 3/25/2026(a)(b) | |
| PRPM LLC, Series 2021-8, Class A1, 1.743%, 9/25/2026(a)(b) | |
| PRPM LLC, Series 2022-5, Class A1, 6.900%, 9/27/2027(a)(b) | |
| PRPM LLC, Series 2023-RCF2, Class A1, 4.000%, 11/25/2053(a)(b) | |
| Redwood Funding Trust, Series 2023-1, Class A, 7.500%, 7/25/2059(a)(b) | |
| Sequoia Mortgage Trust, Series 2017-CH2, Class A1, 4.000%, 12/25/2047(a)(b) | |
| Towd Point Mortgage Trust, Series 2017-4, Class M2, 3.250%, 6/25/2057(a)(b) | |
| | |
|
| ABS Home Equity — continued |
| Towd Point Mortgage Trust, Series 2018-4, Class A2, 3.000%, 6/25/2058(a)(b) | |
| Towd Point Mortgage Trust, Series 2018-5, Class M1, 3.250%, 7/25/2058(a)(b) | |
| Towd Point Mortgage Trust, Series 2019-2, Class M1, 3.750%, 12/25/2058(a)(b) | |
| Towd Point Mortgage Trust, Series 2019-4, Class A1, 2.900%, 10/25/2059(a)(b) | |
| Towd Point Mortgage Trust, Series 2020-1, Class A2B, 3.250%, 1/25/2060(a)(b) | |
| Tricon American Homes, Series 2020-SFR1, Class B, 2.049%, 7/17/2038(a) | |
| Tricon American Homes, Series 2020-SFR1, Class D, 2.548%, 7/17/2038(a) | |
| Tricon American Homes Trust, Series 2019-SFR1, Class D, 3.198%, 3/17/2038(a) | |
| VCAT LLC, Series 2021-NPL1, Class A1, 5.289%, 12/26/2050(a)(b) | |
| VCAT LLC, Series 2021-NPL5, Class A1, 1.868%, 8/25/2051(a)(b) | |
| VCAT LLC, Series 2021-NPL6, Class A1, 1.917%, 9/25/2051(a)(b) | |
| Verus Securitization Trust, Series 2021-3, Class A1, 1.046%, 6/25/2066(a)(b) | |
| Verus Securitization Trust, Series 2021-7, Class A1, 1.829%, 10/25/2066(a)(b) | |
| VOLT XCII LLC, Series 2021-NPL1, Class A1, 1.893%, 2/27/2051(a)(b) | |
| VOLT XCIII LLC, Series 2021-NPL2, Class A1, 1.893%, 2/27/2051(a)(b) | |
| VOLT XCIV LLC, Series 2021-NPL3, Class A1, 2.240%, 2/27/2051(a)(b) | |
| VOLT XCVI LLC, Series 2021-NPL5, Class A1, 2.116%, 3/27/2051(a)(b) | |
| VOLT XCVII LLC, Series 2021-NPL6, Class A1, 2.240%, 4/25/2051(a)(b) | |
| | |
| |
| AASET LLC, Series 2022-1A, Class A, 6.000%, 5/16/2047(a) | |
| AASET Trust, Series 2021-1A, Class A, 2.950%, 11/16/2041(a) | |
| ACHV ABS Trust, Series 2023-1PL, Class D, 8.470%, 3/18/2030(a) | |
| Affirm Asset Securitization Trust, Series 2023-A, Class A, 6.610%, 1/18/2028(a) | |
| Affirm Asset Securitization Trust, Series 2023-B, Class A, 6.820%, 9/15/2028(a) | |
| Affirm Asset Securitization Trust, Series 2023-X1, Class A, 7.110%, 11/15/2028(a) | |
| Auxilior Term Funding LLC, Series 2023-1A, Class A2, 6.180%, 12/15/2028(a) | |
| BHG Securitization Trust, Series 2022-A, Class B, 2.700%, 2/20/2035(a) | |
| BHG Securitization Trust, Series 2023-B, Class B, 7.450%, 12/17/2036(a) | |
| Business Jet Securities LLC, Series 2021-1A, Class A, 2.162%, 4/15/2036(a) | |
| CAL Funding IV Ltd., Series 2020-1A, Class A, 2.220%, 9/25/2045(a) | |
See accompanying notes to financial statements.
Portfolio of Investments – as of December 31, 2023Loomis Sayles Investment Grade Bond Fund (continued) | | |
|
| |
| Castlelake Aircraft Structured Trust, Series 2019-1A, Class A, 3.967%, 4/15/2039(a) | |
| Chesapeake Funding II LLC, Series 2023-1A, Class D, 6.690%, 5/15/2035(a) | |
| CLI Funding VI LLC, Series 2020-3A, Class A, 2.070%, 10/18/2045(a) | |
| CLI Funding VIII LLC, Series 2021-1A, Class A, 1.640%, 2/18/2046(a) | |
| Foundation Finance Trust, Series 2023-2A, Class A, 6.530%, 6/15/2049(a) | |
| Foundation Finance Trust, Series 2023-2A, Class B, 6.970%, 6/15/2049(a) | |
| Frontier Issuer LLC, Series 2023-1, Class A2, 6.600%, 8/20/2053(a) | |
| Hardee's Funding LLC, Series 2018-1A, Class A2II, 4.959%, 6/20/2048(a) | |
| Hilton Grand Vacations Trust, Series 2022-1D, Class C, 4.690%, 6/20/2034(a) | |
| Hilton Grand Vacations Trust, Series 2023-1A, Class C, 6.940%, 1/25/2038(a) | |
| Horizon Aircraft Finance I Ltd., Series 2018-1, Class A, 4.458%, 12/15/2038(a) | |
| Horizon Aircraft Finance II Ltd., Series 2019-1, Class A, 3.721%, 7/15/2039(a) | |
| Horizon Aircraft Finance III Ltd., Series 2019-2, Class A, 3.425%, 11/15/2039(a) | |
| HPEFS Equipment Trust, Series 2022-1A, Class D, 2.400%, 11/20/2029(a) | |
| HPEFS Equipment Trust, Series 2023-2A, Class D, 6.970%, 7/21/2031(a) | |
| Jack in the Box Funding LLC, Series 2019-1A, Class A2II, 4.476%, 8/25/2049(a) | |
| Jack in the Box Funding LLC, Series 2022-1A, Class A2I, 3.445%, 2/26/2052(a) | |
| Kestrel Aircraft Funding Ltd., Series 2018-1A, Class A, 4.250%, 12/15/2038(a) | |
| Lunar Structured Aircraft Portfolio Notes, Series 2021-1, Class A, 2.636%, 10/15/2046(a) | |
| MAPS Ltd., Series 2018-1A, Class A, 4.212%, 5/15/2043(a) | |
| MAPS Ltd., Series 2019-1A, Class A, 4.458%, 3/15/2044(a) | |
| MAPS Trust, Series 2021-1A, Class A, 2.521%, 6/15/2046(a) | |
| Marlette Funding Trust, Series 2023-2A, Class B, 6.540%, 6/15/2033(a) | |
| Merchants Fleet Funding LLC, Series 2023-1A, Class A, 7.210%, 5/20/2036(a) | |
| Merchants Fleet Funding LLC, Series 2023-1A, Class D, 8.200%, 5/20/2036(a) | |
| Merlin Aviation Holdings DAC, Series 2016-1, Class A, 4.500%, 12/15/2032(a)(b) | |
| MVW LLC, Series 2020-1A, Class C, 4.210%, 10/20/2037(a) | |
| MVW Owner Trust, Series 2019-1A, Class C, 3.330%, 11/20/2036(a) | |
| Navigator Aircraft ABS Ltd., Series 2021-1, Class A, 2.771%, 11/15/2046(a)(b) | |
| OneMain Financial Issuance Trust, Series 2022-S1, Class D, 5.200%, 5/14/2035(a) | |
| SCF Equipment Leasing LLC, Series 2021-1A, Class D, 1.930%, 9/20/2030(a) | |
| | |
|
| |
| SCF Equipment Leasing LLC, Series 2022-1A, Class D, 3.790%, 11/20/2031(a) | |
| SCF Equipment Leasing LLC, Series 2022-2A, Class C, 6.500%, 8/20/2032(a) | |
| Shenton Aircraft Investment I Ltd., Series 2015-1A, Class A, 4.750%, 10/15/2042(a) | |
| Sierra Timeshare Receivables Funding LLC, Series 2021-1A, Class C, 1.790%, 11/20/2037(a) | |
| Sierra Timeshare Receivables Funding LLC, Series 2023-1A, Class C, 7.000%, 1/20/2040(a) | |
| Sierra Timeshare Receivables Funding LLC, Series 2023-2A, Class C, 7.300%, 4/20/2040(a) | |
| Sierra Timeshare Receivables Funding LLC, Series 2023-3A, Class C, 7.120%, 9/20/2040(a) | |
| SLM Private Credit Student Loan Trust, Series 2003-C, Class A3, 28 day Auction Rate Security, 8.960%, 9/15/2032(b) | |
| SLM Private Credit Student Loan Trust, Series 2003-C, Class A4, 28 day Auction Rate Security, 8.974%, 9/15/2032(b) | |
| Sunnova Helios X Issuer LLC, Series 2022-C, Class A, 5.300%, 11/22/2049(a) | |
| Sunnova Helios XI Issuer LLC, Series 2023-A, Class B, 5.600%, 5/20/2050(a) | |
| Sunnova Helios XII Issuer LLC, Series 2023-B, Class B, 5.600%, 8/22/2050(a) | |
| WAVE Trust, Series 2017-1A, Class A, 3.844%, 11/15/2042(a) | |
| Willis Engine Structured Trust IV, Series 2018-A, Class A, 4.750%, 9/15/2043(a)(b) | |
| Willis Engine Structured Trust VI, Series 2021-A, Class A, 3.104%, 5/15/2046(a) | |
| Willis Engine Structured Trust VI, Series 2021-A, Class B, 5.438%, 5/15/2046(a) | |
| Willis Engine Structured Trust VII, Series 2023-A, Class A, 8.000%, 10/15/2048(a) | |
| | |
| |
| College Avenue Student Loans LLC, Series 2021-A, Class C, 2.920%, 7/25/2051(a) | |
| College Avenue Student Loans LLC, Series 2023-B, Class C, 7.580%, 6/25/2054(a) | |
| Commonbond Student Loan Trust, Series 2020-1, Class A, 1.690%, 10/25/2051(a) | |
| EDvestinU Private Education Loan Issue No. 3 LLC, Series 2021-A, Class A, 1.800%, 11/25/2045(a) | |
| ELFI Graduate Loan Program LLC, Series 2019-A, Class A, 2.540%, 3/25/2044(a) | |
| Laurel Road Prime Student Loan Trust, Series 2020-A, Class A2FX, 1.400%, 11/25/2050(a) | |
| Navient Private Education Refi Loan Trust, Series 2020-HA, Class A, 1.310%, 1/15/2069(a) | |
| Navient Private Education Refi Loan Trust, Series 2021-A, Class A, 0.840%, 5/15/2069(a) | |
| Navient Private Education Refi Loan Trust, Series 2021-A, Class B, 2.240%, 5/15/2069(a) | |
| Navient Private Education Refi Loan Trust, Series 2021-EA, Class B, 2.030%, 12/16/2069(a) | |
See accompanying notes to financial statements.
Portfolio of Investments – as of December 31, 2023Loomis Sayles Investment Grade Bond Fund (continued) | | |
|
| ABS Student Loan — continued |
| Navient Private Education Refi Loan Trust, Series 2021-FA, Class B, 2.120%, 2/18/2070(a) | |
| Navient Student Loan Trust, Series 2023-BA, Class B, 7.230%, 3/15/2072(a) | |
| SLM Private Credit Student Loan Trust, Series 2003-A, Class A3, 28 day Auction Rate Security, 7.920%, 6/15/2032(b) | |
| SLM Private Credit Student Loan Trust, Series 2003-A, Class A4, 28 day Auction Rate Security, 8.979%, 6/15/2032(b) | |
| SLM Private Credit Student Loan Trust, Series 2003-B, Class A3, 28 day Auction Rate Security, 8.969%, 3/15/2033(b) | |
| SLM Private Credit Student Loan Trust, Series 2003-B, Class A4, 28 day Auction Rate Security, 7.970%, 3/15/2033(b) | |
| SMB Private Education Loan Trust, Series 2015-C, Class B, 3.500%, 9/15/2043(a) | |
| SMB Private Education Loan Trust, Series 2018-B, Class B, 4.000%, 7/15/2042(a) | |
| SMB Private Education Loan Trust, Series 2018-C, Class B, 4.000%, 11/17/2042(a) | |
| SMB Private Education Loan Trust, Series 2019-A, Class A2A, 3.440%, 7/15/2036(a) | |
| SMB Private Education Loan Trust, Series 2019-B, Class A2A, 2.840%, 6/15/2037(a) | |
| SMB Private Education Loan Trust, Series 2020-A, Class A2A, 2.230%, 9/15/2037(a) | |
| SMB Private Education Loan Trust, Series 2023-C, Class B, 6.360%, 11/15/2052(a) | |
| | |
| ABS Whole Business — 0.6% |
| Applebee's Funding LLC/IHOP Funding LLC, Series 2023-1A, Class A2, 7.824%, 3/05/2053(a) | |
| Domino's Pizza Master Issuer LLC, Series 2017-1A, Class A23, 4.118%, 7/25/2047(a) | |
| Domino's Pizza Master Issuer LLC, Series 2018-1A, Class A2II, 4.328%, 7/25/2048(a) | |
| EWC Master Issuer LLC, Series 2022-1A, Class A2, 5.500%, 3/15/2052(a) | |
| FOCUS Brands Funding, Series 2023-2, Class A2, 8.241%, 10/30/2053(a) | |
| Planet Fitness Master Issuer LLC, Series 2018-1A, Class A2II, 4.666%, 9/05/2048(a) | |
| Planet Fitness Master Issuer LLC, Series 2019-1A, Class A2, 3.858%, 12/05/2049(a) | |
| Planet Fitness Master Issuer LLC, Series 2022-1A, Class A2I, 3.251%, 12/05/2051(a) | |
| Wendy's Funding LLC, Series 2018-1A, Class A2II, 3.884%, 3/15/2048(a) | |
| | |
| Aerospace & Defense — 1.2% |
| BAE Systems PLC, 3.400%, 4/15/2030(a) | |
| Embraer Netherlands Finance BV, 7.000%, 7/28/2030(a) | |
| Huntington Ingalls Industries, Inc., 3.844%, 5/01/2025 | |
| Huntington Ingalls Industries, Inc., 4.200%, 5/01/2030 | |
| RTX Corp., 2.375%, 3/15/2032 | |
| RTX Corp., 5.150%, 2/27/2033 | |
| | |
|
| Aerospace & Defense — continued |
| RTX Corp., 6.100%, 3/15/2034 | |
| Textron, Inc., 2.450%, 3/15/2031 | |
| Textron, Inc., 3.000%, 6/01/2030 | |
| | |
| |
| American Airlines Pass-Through Trust, Series 2016-1, Class B, 5.250%, 7/15/2025 | |
| American Airlines Pass-Through Trust, Series 2016-3, Class A, 3.250%, 4/15/2030 | |
| American Airlines Pass-Through Trust, Series 2016-3, Class B, 3.750%, 4/15/2027 | |
| American Airlines Pass-Through Trust, Series 2017-2, Class A, 3.600%, 4/15/2031 | |
| American Airlines Pass-Through Trust, Series 2017-2, Class B, 3.700%, 4/15/2027 | |
| American Airlines Pass-Through Trust, Series 2019-1, Class B, 3.850%, 8/15/2029 | |
| British Airways Pass-Through Trust, Series 2019-1, Class A, 3.350%, 12/15/2030(a) | |
| United Airlines Pass-Through Trust, Series 2018-1, Class A, 3.700%, 9/01/2031 | |
| United Airlines Pass-Through Trust, Series 2020-1, Class A, 5.875%, 4/15/2029 | |
| United Airlines Pass-Through Trust, Series 2023-1, Class A, 5.800%, 7/15/2037 | |
| | |
| |
| American Homes 4 Rent LP, 2.375%, 7/15/2031 | |
| |
| American Honda Finance Corp., MTN, 0.550%, 7/12/2024 | |
| Aptiv PLC/Aptiv Corp., 3.250%, 3/01/2032 | |
| Cummins, Inc., 6.750%, 2/15/2027 | |
| Daimler Truck Finance North America LLC, 5.500%, 9/20/2033(a) | |
| General Motors Co., 5.200%, 4/01/2045 | |
| General Motors Co., 5.400%, 4/01/2048 | |
| General Motors Co., 5.600%, 10/15/2032 | |
| General Motors Co., 5.950%, 4/01/2049 | |
| General Motors Co., 6.250%, 10/02/2043 | |
| General Motors Financial Co., Inc., 3.100%, 1/12/2032 | |
| General Motors Financial Co., Inc., 5.850%, 4/06/2030 | |
| General Motors Financial Co., Inc., 6.000%, 1/09/2028 | |
| General Motors Financial Co., Inc., 6.400%, 1/09/2033 | |
| Volkswagen Group of America Finance LLC, 3.350%, 5/13/2025(a) | |
| | |
| |
| AIB Group PLC, (fixed rate to 9/13/2028, variable rate thereafter), 6.608%, 9/13/2029(a) | |
| Ally Financial, Inc., 2.200%, 11/02/2028 | |
| Ally Financial, Inc., 4.625%, 3/30/2025 | |
| Ally Financial, Inc., 8.000%, 11/01/2031 | |
| American Express Co., 5.850%, 11/05/2027 | |
| American Express Co., (fixed rate to 8/03/2032, variable rate thereafter), 4.420%, 8/03/2033 | |
See accompanying notes to financial statements.
Portfolio of Investments – as of December 31, 2023Loomis Sayles Investment Grade Bond Fund (continued) | | |
|
| |
| Banco Santander Mexico SA Institucion de Banca Multiple Grupo Financiero Santand, 5.375%, 4/17/2025(a) | |
| Banco Santander SA, 2.749%, 12/03/2030 | |
| Bank of America Corp., (fixed rate to 12/20/2027, variable rate thereafter), 3.419%, 12/20/2028 | |
| Bank of America Corp., (fixed rate to 3/08/2032, variable rate thereafter), 3.846%, 3/08/2037 | |
| Bank of America Corp., (fixed rate to 9/15/2033, variable rate thereafter), 5.872%, 9/15/2034 | |
| Bank of America Corp., (fixed rate to 9/21/2031, variable rate thereafter), 2.482%, 9/21/2036 | |
| Bank of America Corp., MTN, 4.250%, 10/22/2026 | |
| Bank of America Corp., MTN, (fixed rate to 7/22/2032, variable rate thereafter), 5.015%, 7/22/2033 | |
| Bank of America Corp., Series L, 4.183%, 11/25/2027 | |
| Barclays PLC, (fixed rate to 11/24/2026, variable rate thereafter), 2.279%, 11/24/2027 | |
| Barclays PLC, (fixed rate to 5/09/2033, variable rate thereafter), 6.224%, 5/09/2034 | |
| Barclays PLC, (fixed rate to 6/20/2029, variable rate thereafter), 5.088%, 6/20/2030 | |
| Barclays PLC, (fixed rate to 9/23/2030, variable rate thereafter), 3.564%, 9/23/2035 | |
| BBVA Bancomer SA, 1.875%, 9/18/2025(a) | |
| BNP Paribas SA, (fixed rate to 1/20/2027, variable rate thereafter), 2.591%, 1/20/2028(a) | |
| BNP Paribas SA, (fixed rate to 3/01/2028, variable rate thereafter), 4.375%, 3/01/2033(a) | |
| CaixaBank SA, (fixed rate to 9/13/2033, variable rate thereafter), 6.840%, 9/13/2034(a) | |
| Capital One Financial Corp., 4.200%, 10/29/2025 | |
| Citigroup, Inc., 4.125%, 7/25/2028 | |
| Citigroup, Inc., (fixed rate to 9/29/2025, variable rate thereafter), 5.610%, 9/29/2026 | |
| Credit Agricole SA, (fixed rate to 1/10/2028, variable rate thereafter), 4.000%, 1/10/2033(a) | |
| Credit Suisse AG, MTN, 3.700%, 2/21/2025 | |
| Danske Bank AS, 5.375%, 1/12/2024(a) | |
| Danske Bank AS, (fixed rate to 12/20/2024, variable rate thereafter), 3.244%, 12/20/2025(a) | |
| Deutsche Bank AG, (fixed rate to 10/14/2030, variable rate thereafter), 3.729%, 1/14/2032 | |
| Deutsche Bank AG, (fixed rate to 11/20/2028, variable rate thereafter), 6.819%, 11/20/2029 | |
| Deutsche Bank AG, (fixed rate to 12/01/2027, variable rate thereafter), 4.875%, 12/01/2032 | |
| Deutsche Bank AG, (fixed rate to 9/18/2030, variable rate thereafter), 3.547%, 9/18/2031 | |
| Goldman Sachs Group, Inc., (fixed rate to 2/24/2032, variable rate thereafter), 3.102%, 2/24/2033 | |
| Goldman Sachs Group, Inc., (fixed rate to 8/23/2027, variable rate thereafter), 4.482%, 8/23/2028 | |
| Goldman Sachs Group, Inc., (fixed rate to 9/10/2026, variable rate thereafter), 1.542%, 9/10/2027 | |
| | |
|
| |
| HSBC Holdings PLC, (fixed rate to 3/09/2028, variable rate thereafter), 6.161%, 3/09/2029 | |
| ING Groep NV, (fixed rate to 9/11/2033, variable rate thereafter), 6.114%, 9/11/2034 | |
| Intesa Sanpaolo SpA, 6.625%, 6/20/2033(a) | |
| Intesa Sanpaolo SpA, 7.200%, 11/28/2033(a) | |
| JPMorgan Chase & Co., 4.125%, 12/15/2026 | |
| JPMorgan Chase & Co., (fixed rate to 3/24/2030, variable rate thereafter), 4.493%, 3/24/2031 | |
| JPMorgan Chase & Co., (fixed rate to 4/22/2026, variable rate thereafter), 1.578%, 4/22/2027 | |
| JPMorgan Chase & Co., (fixed rate to 7/25/2032, variable rate thereafter), 4.912%, 7/25/2033 | |
| KeyBank NA, 6.950%, 2/01/2028 | |
| Mitsubishi UFJ Financial Group, Inc., 3.850%, 3/01/2026 | |
| Morgan Stanley, (fixed rate to 1/19/2033, variable rate thereafter), 5.948%, 1/19/2038 | |
| Morgan Stanley, (fixed rate to 10/18/2032, variable rate thereafter), 6.342%, 10/18/2033 | |
| Morgan Stanley, (fixed rate to 2/01/2028, variable rate thereafter), 5.123%, 2/01/2029 | |
| Morgan Stanley, (fixed rate to 4/20/2032, variable rate thereafter), 5.297%, 4/20/2037 | |
| Morgan Stanley, (fixed rate to 4/28/2025, variable rate thereafter), 2.188%, 4/28/2026 | |
| Morgan Stanley, (fixed rate to 9/16/2031, variable rate thereafter), 2.484%, 9/16/2036 | |
| Morgan Stanley, MTN, (fixed rate to 7/21/2033, variable rate thereafter), 5.424%, 7/21/2034 | |
| Nationwide Building Society, 0.550%, 1/22/2024(a) | |
| NatWest Group PLC, (fixed rate to 9/30/2027, variable rate thereafter), 5.516%, 9/30/2028 | |
| Santander Holdings USA, Inc., 3.244%, 10/05/2026 | |
| Societe Generale SA, 4.250%, 4/14/2025(a) | |
| Societe Generale SA, (fixed rate to 7/08/2030, variable rate thereafter), 3.653%, 7/08/2035(a) | |
| Standard Chartered PLC, (fixed rate to 11/18/2030, variable rate thereafter), 3.265%, 2/18/2036(a) | |
| Sumitomo Mitsui Financial Group, Inc., 1.474%, 7/08/2025 | |
| Sumitomo Mitsui Financial Group, Inc., 5.464%, 1/13/2026 | |
| Synchrony Bank, 5.400%, 8/22/2025 | |
| Synchrony Bank, 5.625%, 8/23/2027 | |
| Synchrony Financial, 4.375%, 3/19/2024 | |
| UBS Group AG, (fixed rate to 1/12/2028, variable rate thereafter), 3.869%, 1/12/2029(a) | |
| UBS Group AG, (fixed rate to 11/15/2032, variable rate thereafter), 9.016%, 11/15/2033(a) | |
| UBS Group AG, (fixed rate to 6/05/2025, variable rate thereafter), 2.193%, 6/05/2026(a) | |
| UBS Group AG, (fixed rate to 7/15/2025, variable rate thereafter), 6.373%, 7/15/2026(a) | |
| UBS Group AG, (fixed rate to 8/11/2027, variable rate thereafter), 6.442%, 8/11/2028(a) | |
| UBS Group AG, (fixed rate to 8/12/2032, variable rate thereafter), 6.537%, 8/12/2033(a) | |
See accompanying notes to financial statements.
Portfolio of Investments – as of December 31, 2023Loomis Sayles Investment Grade Bond Fund (continued) | | |
|
| |
| UniCredit SpA, (fixed rate to 6/03/2026, variable rate thereafter), 1.982%, 6/03/2027(a) | |
| UniCredit SpA, (fixed rate to 6/30/2030, variable rate thereafter), 5.459%, 6/30/2035(a) | |
| | |
| |
| Jefferies Financial Group, Inc., 5.875%, 7/21/2028 | |
| Jefferies Financial Group, Inc., 6.250%, 1/15/2036 | |
| Jefferies Financial Group, Inc., 6.450%, 6/08/2027 | |
| | |
| Building Materials — 1.0% |
| Cemex SAB de CV, 3.875%, 7/11/2031(a) | |
| Cemex SAB de CV, 5.200%, 9/17/2030(a) | |
| Cemex SAB de CV, 5.450%, 11/19/2029(a) | |
| Ferguson Finance PLC, 3.250%, 6/02/2030(a) | |
| Owens Corning, 7.000%, 12/01/2036 | |
| | |
| |
| CCO Holdings LLC/CCO Holdings Capital Corp., 4.250%, 1/15/2034(a) | |
| Charter Communications Operating LLC/Charter Communications Operating Capital, 2.300%, 2/01/2032 | |
| Charter Communications Operating LLC/Charter Communications Operating Capital, 2.800%, 4/01/2031 | |
| Charter Communications Operating LLC/Charter Communications Operating Capital, 3.950%, 6/30/2062 | |
| Charter Communications Operating LLC/Charter Communications Operating Capital, 4.400%, 4/01/2033 | |
| Charter Communications Operating LLC/Charter Communications Operating Capital, 4.400%, 12/01/2061 | |
| Charter Communications Operating LLC/Charter Communications Operating Capital, 4.800%, 3/01/2050 | |
| CSC Holdings LLC, 3.375%, 2/15/2031(a) | |
| CSC Holdings LLC, 4.125%, 12/01/2030(a) | |
| CSC Holdings LLC, 4.500%, 11/15/2031(a) | |
| CSC Holdings LLC, 4.625%, 12/01/2030(a) | |
| CSC Holdings LLC, 5.000%, 11/15/2031(a) | |
| CSC Holdings LLC, 5.750%, 1/15/2030(a) | |
| CSC Holdings LLC, 6.500%, 2/01/2029(a) | |
| DISH DBS Corp., 5.125%, 6/01/2029 | |
| DISH DBS Corp., 5.250%, 12/01/2026(a) | |
| DISH DBS Corp., 5.750%, 12/01/2028(a) | |
| Sirius XM Radio, Inc., 5.000%, 8/01/2027(a) | |
| Sirius XM Radio, Inc., 5.500%, 7/01/2029(a) | |
| Time Warner Cable LLC, 4.500%, 9/15/2042 | |
| Time Warner Cable LLC, 5.500%, 9/01/2041 | |
| | |
| |
| Braskem Netherlands Finance BV, 4.500%, 1/31/2030(a) | |
| | |
|
| |
| Braskem Netherlands Finance BV, 5.875%, 1/31/2050(a) | |
| Celanese U.S. Holdings LLC, 6.330%, 7/15/2029 | |
| Celanese U.S. Holdings LLC, 6.379%, 7/15/2032 | |
| Celanese U.S. Holdings LLC, 6.550%, 11/15/2030 | |
| Celanese U.S. Holdings LLC, 6.700%, 11/15/2033 | |
| CF Industries, Inc., 4.500%, 12/01/2026(a) | |
| FMC Corp., 3.450%, 10/01/2029 | |
| | |
| Construction Machinery — 0.5% |
| Ashtead Capital, Inc., 5.500%, 8/11/2032(a) | |
| Ashtead Capital, Inc., 5.550%, 5/30/2033(a) | |
| Ashtead Capital, Inc., 5.950%, 10/15/2033(a) | |
| Caterpillar Financial Services Corp., MTN, 0.950%, 1/10/2024 | |
| John Deere Capital Corp., MTN, 0.900%, 1/10/2024 | |
| John Deere Capital Corp., MTN, 1.250%, 1/10/2025 | |
| | |
| Consumer Cyclical Services — 1.0% |
| Expedia Group, Inc., 2.950%, 3/15/2031 | |
| Expedia Group, Inc., 3.250%, 2/15/2030 | |
| Uber Technologies, Inc., 4.500%, 8/15/2029(a) | |
| Uber Technologies, Inc., 6.250%, 1/15/2028(a) | |
| Uber Technologies, Inc., 7.500%, 9/15/2027(a) | |
| Uber Technologies, Inc., 8.000%, 11/01/2026(a) | |
| | |
| |
| Hasbro, Inc., 6.600%, 7/15/2028 | |
| Natura Cosmeticos SA, 4.125%, 5/03/2028(a) | |
| | |
| Diversified Manufacturing — 0.9% |
| Carrier Global Corp., 5.900%, 3/15/2034(a) | |
| GE Capital Funding LLC, 4.550%, 5/15/2032 | |
| Ingersoll Rand, Inc., 5.700%, 8/14/2033 | |
| Nordson Corp., 5.600%, 9/15/2028 | |
| Nordson Corp., 5.800%, 9/15/2033 | |
| Veralto Corp., 5.450%, 9/18/2033(a) | |
| | |
| |
| AES Corp., 2.450%, 1/15/2031 | |
| AES Corp., 3.950%, 7/15/2030(a) | |
| Alta Wind Holdings LLC, 7.000%, 6/30/2035(a) | |
| Calpine Corp., 3.750%, 3/01/2031(a) | |
| Enel Finance International NV, 6.000%, 10/07/2039(a) | |
| Enel Finance International NV, 6.800%, 9/15/2037(a) | |
| IPALCO Enterprises, Inc., 4.250%, 5/01/2030 | |
| NRG Energy, Inc., 4.450%, 6/15/2029(a) | |
| Pacific Gas & Electric Co., 3.250%, 6/01/2031 | |
| Pacific Gas & Electric Co., 4.300%, 3/15/2045 | |
| Pacific Gas & Electric Co., 4.550%, 7/01/2030 | |
| Pacific Gas & Electric Co., 5.450%, 6/15/2027 | |
| Southern California Edison Co., 5.300%, 3/01/2028 | |
See accompanying notes to financial statements.
Portfolio of Investments – as of December 31, 2023Loomis Sayles Investment Grade Bond Fund (continued) | | |
|
| |
| Southern Co., 5.700%, 3/15/2034 | |
| Vistra Operations Co. LLC, 3.700%, 1/30/2027(a) | |
| | |
| |
| AerCap Ireland Capital DAC/AerCap Global Aviation Trust, 3.000%, 10/29/2028 | |
| AerCap Ireland Capital DAC/AerCap Global Aviation Trust, 3.300%, 1/30/2032 | |
| AerCap Ireland Capital DAC/AerCap Global Aviation Trust, 3.400%, 10/29/2033 | |
| AerCap Ireland Capital DAC/AerCap Global Aviation Trust, 3.650%, 7/21/2027 | |
| AerCap Ireland Capital DAC/AerCap Global Aviation Trust, 5.750%, 6/06/2028 | |
| AerCap Ireland Capital DAC/AerCap Global Aviation Trust, 6.150%, 9/30/2030 | |
| Air Lease Corp., 3.125%, 12/01/2030 | |
| Air Lease Corp., 3.250%, 10/01/2029 | |
| Air Lease Corp., 3.375%, 7/01/2025 | |
| Air Lease Corp., 4.625%, 10/01/2028 | |
| Air Lease Corp., MTN, 3.000%, 2/01/2030 | |
| Aircastle Ltd., 4.125%, 5/01/2024 | |
| Aircastle Ltd., 6.500%, 7/18/2028(a) | |
| Ares Capital Corp., 2.875%, 6/15/2028 | |
| Ares Capital Corp., 3.200%, 11/15/2031 | |
| Aviation Capital Group LLC, 1.950%, 1/30/2026(a) | |
| Aviation Capital Group LLC, 5.500%, 12/15/2024(a) | |
| Aviation Capital Group LLC, 6.250%, 4/15/2028(a) | |
| Aviation Capital Group LLC, 6.375%, 7/15/2030(a) | |
| Aviation Capital Group LLC, 6.750%, 10/25/2028(a) | |
| Barings BDC, Inc., 3.300%, 11/23/2026 | |
| Blackstone Secured Lending Fund, 2.125%, 2/15/2027 | |
| Blue Owl Capital Corp., 2.625%, 1/15/2027 | |
| Blue Owl Capital Corp., 2.875%, 6/11/2028 | |
| Blue Owl Technology Finance Corp., 2.500%, 1/15/2027 | |
| GATX Corp., 5.450%, 9/15/2033 | |
| GATX Corp., 6.050%, 3/15/2034 | |
| GATX Corp., 6.900%, 5/01/2034 | |
| Oaktree Specialty Lending Corp., 2.700%, 1/15/2027 | |
| Rocket Mortgage LLC/Rocket Mortgage Co-Issuer, Inc., 2.875%, 10/15/2026(a) | |
| Rocket Mortgage LLC/Rocket Mortgage Co-Issuer, Inc., 3.625%, 3/01/2029(a) | |
| Rocket Mortgage LLC/Rocket Mortgage Co-Issuer, Inc., 3.625%, 3/01/2029 | |
| Rocket Mortgage LLC/Rocket Mortgage Co-Issuer, Inc., 3.875%, 3/01/2031(a) | |
| Rocket Mortgage LLC/Rocket Mortgage Co-Issuer, Inc., 4.000%, 10/15/2033(a) | |
| SMBC Aviation Capital Finance DAC, 5.450%, 5/03/2028(a) | |
| | |
| | |
|
| |
| CIFI Holdings Group Co. Ltd., 6.000%, 7/16/2025(c) | |
| CIFI Holdings Group Co. Ltd., 6.450%, 11/07/2024(c) | |
| Country Garden Holdings Co. Ltd., 3.300%, 1/12/2031(c) | |
| Icahn Enterprises LP/Icahn Enterprises Finance Corp., 4.375%, 2/01/2029 | |
| Logan Group Co. Ltd., 4.250%, 7/12/2025(c) | |
| Logan Group Co. Ltd., 4.850%, 12/14/2026(c) | |
| Shimao Group Holdings Ltd., 3.450%, 1/11/2031(c) | |
| Shimao Group Holdings Ltd., 4.600%, 7/13/2030(c) | |
| Shimao Group Holdings Ltd., 4.750%, 7/03/2022(c) | |
| Shimao Group Holdings Ltd., 5.200%, 1/16/2027(c) | |
| Shimao Group Holdings Ltd., 5.600%, 7/15/2026(c) | |
| Shimao Group Holdings Ltd., 6.125%, 2/21/2024(c) | |
| Times China Holdings Ltd., 5.750%, 1/14/2027(c) | |
| Times China Holdings Ltd., 6.200%, 3/22/2026(c) | |
| Times China Holdings Ltd., 6.750%, 7/08/2025(c) | |
| | |
| |
| Bacardi Ltd./Bacardi-Martini BV, 5.400%, 6/15/2033(a) | |
| JBS USA LUX SA/JBS USA Food Co./JBS USA Finance, Inc., 3.000%, 2/02/2029 | |
| JBS USA LUX SA/JBS USA Food Co./JBS USA Finance, Inc., 3.750%, 12/01/2031 | |
| JBS USA LUX SA/JBS USA Food Co./JBS USA Finance, Inc., 5.500%, 1/15/2030 | |
| Pilgrim's Pride Corp., 3.500%, 3/01/2032 | |
| Pilgrim's Pride Corp., 4.250%, 4/15/2031 | |
| Smithfield Foods, Inc., 3.000%, 10/15/2030(a) | |
| | |
| |
| Genm Capital Labuan Ltd., 3.882%, 4/19/2031(a) | |
| GLP Capital LP/GLP Financing II, Inc., 3.250%, 1/15/2032 | |
| GLP Capital LP/GLP Financing II, Inc., 6.750%, 12/01/2033 | |
| VICI Properties LP, 5.125%, 5/15/2032 | |
| VICI Properties LP/VICI Note Co., Inc., 3.875%, 2/15/2029(a) | |
| VICI Properties LP/VICI Note Co., Inc., 4.250%, 12/01/2026(a) | |
| VICI Properties LP/VICI Note Co., Inc., 4.500%, 9/01/2026(a) | |
| VICI Properties LP/VICI Note Co., Inc., 4.625%, 6/15/2025(a) | |
| VICI Properties LP/VICI Note Co., Inc., 5.625%, 5/01/2024(a) | |
| | |
| Government Owned - No Guarantee — 0.3% |
| Antares Holdings LP, 2.750%, 1/15/2027(a) | |
| Antares Holdings LP, 3.750%, 7/15/2027(a) | |
See accompanying notes to financial statements.
Portfolio of Investments – as of December 31, 2023Loomis Sayles Investment Grade Bond Fund (continued) | | |
|
| Government Owned - No Guarantee — continued |
| Antares Holdings LP, 7.950%, 8/11/2028(a) | |
| Sino-Ocean Land Treasure IV Ltd., 4.750%, 8/05/2029(c) | |
| Sino-Ocean Land Treasure IV Ltd., 4.750%, 1/14/2030(c) | |
| | |
| |
| Welltower OP LLC, 6.500%, 3/15/2041 | |
| |
| Centene Corp., 2.450%, 7/15/2028 | |
| Centene Corp., 2.500%, 3/01/2031 | |
| Centene Corp., 2.625%, 8/01/2031 | |
| Centene Corp., 3.000%, 10/15/2030 | |
| Centene Corp., 3.375%, 2/15/2030 | |
| Centene Corp., 4.625%, 12/15/2029 | |
| Elevance Health, Inc., 4.100%, 5/15/2032 | |
| | |
| |
| Alcon Finance Corp., 5.375%, 12/06/2032(a) | |
| Cigna Group, 4.375%, 10/15/2028 | |
| CVS Health Corp., 1.750%, 8/21/2030 | |
| CVS Health Corp., 3.250%, 8/15/2029 | |
| CVS Health Corp., 5.250%, 1/30/2031 | |
| CVS Pass-Through Trust, 5.773%, 1/10/2033(a) | |
| CVS Pass-Through Trust, 6.036%, 12/10/2028 | |
| CVS Pass-Through Trust, Series 2013, 4.704%, 1/10/2036(a) | |
| CVS Pass-Through Trust, Series 2014, 4.163%, 8/11/2036(a) | |
| Encompass Health Corp., 4.750%, 2/01/2030 | |
| HCA, Inc., 2.375%, 7/15/2031 | |
| HCA, Inc., 3.500%, 9/01/2030 | |
| HCA, Inc., 4.125%, 6/15/2029 | |
| HCA, Inc., 4.500%, 2/15/2027 | |
| HCA, Inc., 5.500%, 6/01/2033 | |
| Quest Diagnostics, Inc., 6.400%, 11/30/2033 | |
| | |
| |
| MDC Holdings, Inc., 3.966%, 8/06/2061 | |
| MDC Holdings, Inc., 6.000%, 1/15/2043 | |
| Meritage Homes Corp., 3.875%, 4/15/2029(a) | |
| | |
| Independent Energy — 2.8% |
| Aker BP ASA, 2.000%, 7/15/2026(a) | |
| Aker BP ASA, 3.100%, 7/15/2031(a) | |
| Aker BP ASA, 3.750%, 1/15/2030(a) | |
| Aker BP ASA, 4.000%, 1/15/2031(a) | |
| Continental Resources, Inc., 2.875%, 4/01/2032(a) | |
| Continental Resources, Inc., 4.375%, 1/15/2028 | |
| Continental Resources, Inc., 5.750%, 1/15/2031(a) | |
| Energian Israel Finance Ltd., 5.375%, 3/30/2028(a) | |
| Energian Israel Finance Ltd., 5.875%, 3/30/2031(a) | |
| EQT Corp., 3.125%, 5/15/2026(a) | |
| EQT Corp., 3.625%, 5/15/2031(a) | |
| EQT Corp., 3.900%, 10/01/2027 | |
| | |
|
| Independent Energy — continued |
| EQT Corp., 5.000%, 1/15/2029 | |
| EQT Corp., 5.700%, 4/01/2028 | |
| EQT Corp., 6.125%, 2/01/2025 | |
| Hess Corp., 4.300%, 4/01/2027 | |
| Leviathan Bond Ltd., 6.125%, 6/30/2025(a) | |
| Marathon Oil Corp., 6.800%, 3/15/2032 | |
| Occidental Petroleum Corp., 5.550%, 3/15/2026 | |
| Occidental Petroleum Corp., 6.125%, 1/01/2031 | |
| Occidental Petroleum Corp., 6.625%, 9/01/2030 | |
| Occidental Petroleum Corp., 7.500%, 5/01/2031 | |
| Ovintiv, Inc., 6.500%, 8/15/2034 | |
| Ovintiv, Inc., 7.375%, 11/01/2031 | |
| Southwestern Energy Co., 4.750%, 2/01/2032 | |
| Var Energi ASA, 7.500%, 1/15/2028(a) | |
| Var Energi ASA, 8.000%, 11/15/2032(a) | |
| Viper Energy, Inc., 7.375%, 11/01/2031(a) | |
| | |
| |
| Jacobs Engineering Group, Inc., 6.350%, 8/18/2028 | |
| |
| Carnival Corp., 4.000%, 8/01/2028(a) | |
| Carnival Corp., 5.750%, 3/01/2027(a) | |
| Carnival Corp., 7.000%, 8/15/2029(a) | |
| NCL Corp. Ltd., 5.875%, 3/15/2026(a) | |
| NCL Corp. Ltd., 5.875%, 2/15/2027(a) | |
| NCL Corp. Ltd., 8.125%, 1/15/2029(a) | |
| Royal Caribbean Cruises Ltd., 5.500%, 4/01/2028(a) | |
| | |
| |
| Athene Global Funding, 1.608%, 6/29/2026(a) | |
| Athene Global Funding, 1.716%, 1/07/2025(a) | |
| Athene Global Funding, 2.550%, 11/19/2030(a) | |
| Athene Holding Ltd., 3.500%, 1/15/2031 | |
| CNO Financial Group, Inc., 5.250%, 5/30/2029 | |
| Fidelity & Guaranty Life Holdings, Inc., 5.500%, 5/01/2025(a) | |
| Mutual of Omaha Insurance Co., 6.800%, 6/15/2036(a) | |
| National Life Insurance Co., 10.500%, 9/15/2039(a) | |
| NLV Financial Corp., 7.500%, 8/15/2033(a) | |
| Penn Mutual Life Insurance Co., 6.650%, 6/15/2034(a) | |
| Penn Mutual Life Insurance Co., 7.625%, 6/15/2040(a) | |
| | |
| |
| Province of Quebec, 0.600%, 7/23/2025 | |
| |
| Marriott International, Inc., Series FF, 4.625%, 6/15/2030 | |
| Marriott International, Inc., Series HH, 2.850%, 4/15/2031 | |
| Marriott Ownership Resorts, Inc., 4.500%, 6/15/2029(a) | |
| Travel & Leisure Co., 4.500%, 12/01/2029(a) | |
| Travel & Leisure Co., 4.625%, 3/01/2030(a) | |
See accompanying notes to financial statements.
Portfolio of Investments – as of December 31, 2023Loomis Sayles Investment Grade Bond Fund (continued) | | |
|
| |
| Travel & Leisure Co., 6.000%, 4/01/2027 | |
| Travel & Leisure Co., 6.625%, 7/31/2026(a) | |
| | |
| Media Entertainment — 1.5% |
| Electronic Arts, Inc., 1.850%, 2/15/2031 | |
| iHeartCommunications, Inc., 4.750%, 1/15/2028(a) | |
| iHeartCommunications, Inc., 5.250%, 8/15/2027(a) | |
| Meta Platforms, Inc., 4.950%, 5/15/2033 | |
| Netflix, Inc., 4.875%, 4/15/2028 | |
| Netflix, Inc., 4.875%, 6/15/2030(a) | |
| Netflix, Inc., 5.375%, 11/15/2029(a) | |
| Netflix, Inc., 5.875%, 11/15/2028 | |
| Netflix, Inc., 6.375%, 5/15/2029 | |
| Warnermedia Holdings, Inc., 3.755%, 3/15/2027 | |
| Warnermedia Holdings, Inc., 4.054%, 3/15/2029 | |
| Warnermedia Holdings, Inc., 4.279%, 3/15/2032 | |
| | |
| |
| Alcoa Nederland Holding BV, 4.125%, 3/31/2029(a) | |
| Alcoa Nederland Holding BV, 6.125%, 5/15/2028(a) | |
| Anglo American Capital PLC, 2.625%, 9/10/2030(a) | |
| Anglo American Capital PLC, 2.875%, 3/17/2031(a) | |
| Anglo American Capital PLC, 4.000%, 9/11/2027(a) | |
| Anglo American Capital PLC, 4.500%, 3/15/2028(a) | |
| Anglo American Capital PLC, 4.750%, 4/10/2027(a) | |
| Anglo American Capital PLC, 5.500%, 5/02/2033(a) | |
| ArcelorMittal SA, 6.750%, 3/01/2041 | |
| ArcelorMittal SA, 6.800%, 11/29/2032 | |
| First Quantum Minerals Ltd., 6.875%, 3/01/2026(a) | |
| First Quantum Minerals Ltd., 6.875%, 10/15/2027(a) | |
| First Quantum Minerals Ltd., 7.500%, 4/01/2025(a) | |
| FMG Resources August 2006 Pty. Ltd., 4.375%, 4/01/2031(a) | |
| FMG Resources August 2006 Pty. Ltd., 4.500%, 9/15/2027(a) | |
| Freeport-McMoRan, Inc., 4.250%, 3/01/2030 | |
| Freeport-McMoRan, Inc., 4.625%, 8/01/2030 | |
| Glencore Funding LLC, 2.500%, 9/01/2030(a) | |
| Glencore Funding LLC, 2.625%, 9/23/2031(a) | |
| Glencore Funding LLC, 2.850%, 4/27/2031(a) | |
| Glencore Funding LLC, 3.875%, 10/27/2027(a) | |
| Glencore Funding LLC, 4.000%, 3/27/2027(a) | |
| Glencore Funding LLC, 5.700%, 5/08/2033(a) | |
| Glencore Funding LLC, 6.125%, 10/06/2028(a) | |
| Glencore Funding LLC, 6.375%, 10/06/2030(a) | |
| Glencore Funding LLC, 6.500%, 10/06/2033(a) | |
| Newmont Corp./Newcrest Finance Pty. Ltd., 3.250%, 5/13/2030(a) | |
| | |
|
| Metals & Mining — continued |
| Reliance Steel & Aluminum Co., 2.150%, 8/15/2030 | |
| Steel Dynamics, Inc., 3.250%, 1/15/2031 | |
| Volcan Cia Minera SAA, 4.375%, 2/11/2026(a) | |
| | |
| |
| Cheniere Energy Partners LP, 3.250%, 1/31/2032 | |
| Cheniere Energy Partners LP, 4.000%, 3/01/2031 | |
| Cheniere Energy Partners LP, 4.500%, 10/01/2029 | |
| Cheniere Energy Partners LP, 5.950%, 6/30/2033(a) | |
| DCP Midstream Operating LP, 3.250%, 2/15/2032 | |
| DCP Midstream Operating LP, 5.125%, 5/15/2029 | |
| DCP Midstream Operating LP, 6.450%, 11/03/2036(a) | |
| Enbridge, Inc., 5.700%, 3/08/2033 | |
| Energy Transfer LP, 4.950%, 6/15/2028 | |
| Energy Transfer LP, 5.250%, 4/15/2029 | |
| Energy Transfer LP, 5.750%, 2/15/2033 | |
| EnLink Midstream LLC, 6.500%, 9/01/2030(a) | |
| Enterprise Products Operating LLC, 5.350%, 1/31/2033 | |
| Gray Oak Pipeline LLC, 3.450%, 10/15/2027(a) | |
| MPLX LP, 4.250%, 12/01/2027 | |
| MPLX LP, 5.000%, 3/01/2033 | |
| NGPL PipeCo LLC, 7.768%, 12/15/2037(a) | |
| Plains All American Pipeline LP/PAA Finance Corp., 3.550%, 12/15/2029 | |
| Plains All American Pipeline LP/PAA Finance Corp., 3.800%, 9/15/2030 | |
| Plains All American Pipeline LP/PAA Finance Corp., 4.300%, 1/31/2043 | |
| Sabine Pass Liquefaction LLC, 4.500%, 5/15/2030 | |
| Targa Resources Corp., 5.200%, 7/01/2027 | |
| Targa Resources Corp., 6.125%, 3/15/2033 | |
| Targa Resources Corp., 6.500%, 3/30/2034 | |
| Targa Resources Partners LP/Targa Resources Partners Finance Corp., 4.000%, 1/15/2032 | |
| Targa Resources Partners LP/Targa Resources Partners Finance Corp., 4.875%, 2/01/2031 | |
| Targa Resources Partners LP/Targa Resources Partners Finance Corp., 5.500%, 3/01/2030 | |
| Venture Global Calcasieu Pass LLC, 3.875%, 11/01/2033(a) | |
| Venture Global Calcasieu Pass LLC, 4.125%, 8/15/2031(a) | |
| Venture Global Calcasieu Pass LLC, 6.250%, 1/15/2030(a) | |
| Western Midstream Operating LP, 4.050%, 2/01/2030 | |
| Western Midstream Operating LP, 5.250%, 2/01/2050 | |
| Western Midstream Operating LP, 5.300%, 3/01/2048 | |
| Western Midstream Operating LP, 5.450%, 4/01/2044 | |
| Western Midstream Operating LP, 5.500%, 8/15/2048 | |
See accompanying notes to financial statements.
Portfolio of Investments – as of December 31, 2023Loomis Sayles Investment Grade Bond Fund (continued) | | |
|
| |
| Western Midstream Operating LP, 6.150%, 4/01/2033 | |
| Western Midstream Operating LP, 6.350%, 1/15/2029 | |
| Williams Cos., Inc., 4.650%, 8/15/2032 | |
| | |
| | |
| Federal National Mortgage Association, 6.000%, 7/01/2029 | |
| |
| Southern Co. Gas Capital Corp., 5.750%, 9/15/2033 | |
| Non-Agency Commercial Mortgage-Backed Securities — 1.3% |
| BANK, Series 2021-BN35, Class AS, 2.457%, 6/15/2064 | |
| BBSG Mortgage Trust, Series 2016-MRP, Class A, 3.275%, 6/05/2036(a) | |
| BB-UBS Trust, Series 2012-TFT, Class A, 2.892%, 6/05/2030(a) | |
| BPR Trust, Series 2022-SSP, Class A, 1 mo. USD SOFR + 3.000%, 8.362%, 5/15/2039(a)(b) | |
| BPR Trust, Series 2022-STAR, Class A, 1 mo. USD SOFR + 3.232%, 8.594%, 8/15/2024(a)(b) | |
| Commercial Mortgage Pass-Through Certificates, Series 2012-CR3, Class AM, 3.416%, 10/15/2045(a) | |
| Commercial Mortgage Pass-Through Certificates, Series 2012-LTRT, Class A2, 3.400%, 10/05/2030(a) | |
| Commercial Mortgage Trust, Series 2012-LC4, Class B, 4.934%, 12/10/2044(b) | |
| Commercial Mortgage Trust, Series 2012-LC4, Class C, 5.294%, 12/10/2044(b) | |
| Credit Suisse Mortgage Trust, Series 2014-USA, Class B, 4.185%, 9/15/2037(a) | |
| Credit Suisse Mortgage Trust, Series 2014-USA, Class C, 4.336%, 9/15/2037(a) | |
| Credit Suisse Mortgage Trust, Series 2014-USA, Class D, 4.373%, 9/15/2037(a) | |
| DBUBS Mortgage Trust, Series 2017-BRBK, Class D, 3.530%, 10/10/2034(a)(b) | |
| DC Commercial Mortgage Trust, Series 2023-DC, Class B, 6.804%, 9/12/2040(a) | |
| Extended Stay America Trust, Series 2021-ESH, Class B, 1 mo. USD SOFR + 1.494%, 6.857%, 7/15/2038(a)(b) | |
| Extended Stay America Trust, Series 2021-ESH, Class C, 1 mo. USD SOFR + 1.814%, 7.177%, 7/15/2038(a)(b) | |
| GS Mortgage Securities Corp. Trust, Series 2012-BWTR, Class A, 2.954%, 11/05/2034(a) | |
| GS Mortgage Securities Corp. Trust, Series 2013-PEMB, Class A, 3.550%, 3/05/2033, 144A(a)(b) | |
| GS Mortgage Securities Corp. Trust, Series 2013-PEMB, Class D, 3.550%, 3/05/2033(a)(b) | |
| GS Mortgage Securities Trust, Series 2014-GC18, Class B, 4.885%, 1/10/2047(b) | |
| | |
|
| Non-Agency Commercial Mortgage-Backed Securities — continued |
| Hudsons Bay Simon JV Trust, Series 2015-HB7, Class A7, 3.914%, 8/05/2034(a) | |
| JP Morgan Chase Commercial Mortgage Securities Trust, Series 2012-LC9, Class C, 3.784%, 12/15/2047(a)(b) | |
| JP Morgan Chase Commercial Mortgage Securities Trust, Series 2012-LC9, Class D, 3.784%, 12/15/2047(a)(b) | |
| JPMBB Commercial Mortgage Securities Trust, Series 2015-C32, Class A5, 3.598%, 11/15/2048 | |
| Med Trust, Series 2021-MDLN, Class B, 1 mo. USD SOFR + 1.564%, 6.927%, 11/15/2038(a)(b) | |
| Med Trust, Series 2021-MDLN, Class C, 1 mo. USD SOFR + 1.914%, 7.277%, 11/15/2038(a)(b) | |
| Med Trust, Series 2021-MDLN, Class D, 1 mo. USD SOFR + 2.114%, 7.477%, 11/15/2038(a)(b) | |
| Morgan Stanley Bank of America Merrill Lynch Trust, Series 2013-C12, Class C, 7.432%, 10/15/2046(b) | |
| Morgan Stanley Capital I Trust, Series 2011-C2, Class E, 5.211%, 6/15/2044(a)(b) | |
| MSBAM Commercial Mortgage Securities Trust, Series 2012-CKSV, Class A2, 3.277%, 10/15/2030(a) | |
| SCOTT Trust, Series 2023-SFS, Class A, 5.910%, 3/15/2040(a) | |
| Wells Fargo Commercial Mortgage Trust, Series 2013-LC12, Class B, 3.954%, 7/15/2046(b) | |
| Wells Fargo Commercial Mortgage Trust, Series 2014-LC16, Class AS, 4.020%, 8/15/2050 | |
| Wells Fargo Commercial Mortgage Trust, Series 2016-C36, Class AS, 3.419%, 11/15/2059 | |
| WFRBS Commercial Mortgage Trust, Series 2011-C3, Class D, 5.855%, 3/15/2044(a)(b) | |
| WFRBS Commercial Mortgage Trust, Series 2012-C10, Class B, 3.744%, 12/15/2045 | |
| WFRBS Commercial Mortgage Trust, Series 2014-C20, Class B, 4.378%, 5/15/2047 | |
| WFRBS Commercial Mortgage Trust, Series 2014-C24, Class B, 4.204%, 11/15/2047(b) | |
| | |
| |
| Corporate Office Properties LP, 2.750%, 4/15/2031 | |
| |
| Extra Space Storage LP, 5.900%, 1/15/2031 | |
| |
| Suzano Austria GmbH, 3.750%, 1/15/2031 | |
| Weyerhaeuser Co., 4.000%, 4/15/2030 | |
| WRKCo, Inc., 4.000%, 3/15/2028 | |
| | |
| |
| Amgen, Inc., 5.250%, 3/02/2033 | |
| Bausch Health Cos., Inc., 4.875%, 6/01/2028(a) | |
| Pfizer Investment Enterprises Pte. Ltd., 4.750%, 5/19/2033 | |
| Teva Pharmaceutical Finance Co. LLC, 6.150%, 2/01/2036 | |
See accompanying notes to financial statements.
Portfolio of Investments – as of December 31, 2023Loomis Sayles Investment Grade Bond Fund (continued) | | |
|
| Pharmaceuticals — continued |
| Teva Pharmaceutical Finance Netherlands III BV, 3.150%, 10/01/2026 | |
| Teva Pharmaceutical Finance Netherlands III BV, 4.100%, 10/01/2046 | |
| Teva Pharmaceutical Finance Netherlands III BV, 4.750%, 5/09/2027 | |
| Teva Pharmaceutical Finance Netherlands III BV, 5.125%, 5/09/2029 | |
| Teva Pharmaceutical Finance Netherlands III BV, 6.750%, 3/01/2028 | |
| Teva Pharmaceutical Finance Netherlands III BV, 7.875%, 9/15/2029 | |
| Teva Pharmaceutical Finance Netherlands III BV, 8.125%, 9/15/2031 | |
| | |
| Property & Casualty Insurance — 0.3% |
| Fidelity National Financial, Inc., 3.400%, 6/15/2030 | |
| SiriusPoint Ltd., 4.600%, 11/01/2026(a) | |
| Stewart Information Services Corp., 3.600%, 11/15/2031 | |
| | |
| |
| 1011778 BC ULC/New Red Finance, Inc., 4.000%, 10/15/2030(a) | |
| KFC Holding Co./Pizza Hut Holdings LLC/Taco Bell of America LLC, 4.750%, 6/01/2027(a) | |
| Starbucks Corp., 3.000%, 2/14/2032 | |
| Yum! Brands, Inc., 4.750%, 1/15/2030(a) | |
| | |
| |
| Brixmor Operating Partnership LP, 2.250%, 4/01/2028 | |
| Brixmor Operating Partnership LP, 4.050%, 7/01/2030 | |
| Simon Property Group LP, 2.650%, 7/15/2030 | |
| | |
| |
| AutoNation, Inc., 3.850%, 3/01/2032 | |
| AutoNation, Inc., 4.750%, 6/01/2030 | |
| AutoZone, Inc., 4.000%, 4/15/2030 | |
| Dollar General Corp., 3.500%, 4/03/2030 | |
| Dollar Tree, Inc., 2.650%, 12/01/2031 | |
| Lithia Motors, Inc., 3.875%, 6/01/2029(a) | |
| Marks & Spencer PLC, 7.125%, 12/01/2037(a) | |
| Tapestry, Inc., 3.050%, 3/15/2032 | |
| | |
| |
| Koninklijke Ahold Delhaize NV, 5.700%, 10/01/2040 | |
| |
| Arrow Electronics, Inc., 2.950%, 2/15/2032 | |
| Broadcom, Inc., 2.450%, 2/15/2031(a) | |
| Broadcom, Inc., 2.600%, 2/15/2033(a) | |
| Broadcom, Inc., 3.137%, 11/15/2035(a) | |
| Broadcom, Inc., 3.187%, 11/15/2036(a) | |
| Broadcom, Inc., 3.419%, 4/15/2033(a) | |
| Broadcom, Inc., 3.469%, 4/15/2034(a) | |
| Broadcom, Inc., 4.150%, 11/15/2030 | |
| | |
|
| |
| Broadcom, Inc., 4.150%, 4/15/2032(a) | |
| Broadcom, Inc., 4.300%, 11/15/2032 | |
| CDW LLC/CDW Finance Corp., 2.670%, 12/01/2026 | |
| CDW LLC/CDW Finance Corp., 3.250%, 2/15/2029 | |
| CDW LLC/CDW Finance Corp., 3.276%, 12/01/2028 | |
| CDW LLC/CDW Finance Corp., 3.569%, 12/01/2031 | |
| CDW LLC/CDW Finance Corp., 4.250%, 4/01/2028 | |
| CommScope Technologies LLC, 5.000%, 3/15/2027(a) | |
| CommScope, Inc., 4.750%, 9/01/2029(a) | |
| CommScope, Inc., 6.000%, 3/01/2026(a) | |
| CommScope, Inc., 7.125%, 7/01/2028(a) | |
| Dell International LLC/EMC Corp., 5.750%, 2/01/2033 | |
| Entegris Escrow Corp., 4.750%, 4/15/2029(a) | |
| Equinix, Inc., 2.150%, 7/15/2030 | |
| Equinix, Inc., 3.200%, 11/18/2029 | |
| Fiserv, Inc., 5.625%, 8/21/2033 | |
| Flex Ltd., 6.000%, 1/15/2028 | |
| Gartner, Inc., 3.625%, 6/15/2029(a) | |
| Global Payments, Inc., 2.900%, 5/15/2030 | |
| Global Payments, Inc., 2.900%, 11/15/2031 | |
| Global Payments, Inc., 5.300%, 8/15/2029 | |
| Global Payments, Inc., 5.400%, 8/15/2032 | |
| Jabil, Inc., 1.700%, 4/15/2026 | |
| Jabil, Inc., 3.000%, 1/15/2031 | |
| KLA Corp., 5.650%, 11/01/2034 | |
| Leidos, Inc., 2.300%, 2/15/2031 | |
| Leidos, Inc., 4.375%, 5/15/2030 | |
| Leidos, Inc., 5.750%, 3/15/2033 | |
| Marvell Technology, Inc., 2.450%, 4/15/2028 | |
| Marvell Technology, Inc., 2.950%, 4/15/2031 | |
| Marvell Technology, Inc., 5.950%, 9/15/2033 | |
| Microchip Technology, Inc., 0.983%, 9/01/2024 | |
| Micron Technology, Inc., 2.703%, 4/15/2032 | |
| Micron Technology, Inc., 4.663%, 2/15/2030 | |
| Micron Technology, Inc., 5.327%, 2/06/2029 | |
| Micron Technology, Inc., 5.875%, 2/09/2033 | |
| Micron Technology, Inc., 5.875%, 9/15/2033 | |
| Motorola Solutions, Inc., 5.600%, 6/01/2032 | |
| Open Text Corp., 6.900%, 12/01/2027(a) | |
| Oracle Corp., 2.950%, 4/01/2030 | |
| Oracle Corp., 3.600%, 4/01/2050 | |
| Oracle Corp., 6.150%, 11/09/2029 | |
| Oracle Corp., 6.250%, 11/09/2032 | |
| S&P Global, Inc., 4.250%, 5/01/2029 | |
| S&P Global, Inc., 5.250%, 9/15/2033(a) | |
| Seagate HDD Cayman, 4.091%, 6/01/2029 | |
| Sensata Technologies BV, 5.875%, 9/01/2030(a) | |
| Sensata Technologies, Inc., 3.750%, 2/15/2031(a) | |
| Sensata Technologies, Inc., 4.375%, 2/15/2030(a) | |
| SK Hynix, Inc., 6.375%, 1/17/2028(a) | |
| Skyworks Solutions, Inc., 1.800%, 6/01/2026 | |
| SS&C Technologies, Inc., 5.500%, 9/30/2027(a) | |
| TD SYNNEX Corp., 1.750%, 8/09/2026 | |
See accompanying notes to financial statements.
Portfolio of Investments – as of December 31, 2023Loomis Sayles Investment Grade Bond Fund (continued) | | |
|
| |
| Trimble, Inc., 6.100%, 3/15/2033 | |
| Verisk Analytics, Inc., 5.750%, 4/01/2033 | |
| VMware LLC, 2.200%, 8/15/2031 | |
| Western Digital Corp., 2.850%, 2/01/2029 | |
| Western Digital Corp., 4.750%, 2/15/2026 | |
| | |
| Transportation Services — 0.3% |
| ERAC USA Finance LLC, 4.900%, 5/01/2033(a) | |
| Penske Truck Leasing Co. LP/PTL Finance Corp., 6.050%, 8/01/2028(a) | |
| | |
| |
| U.S. Treasury Bonds, 2.000%, 11/15/2041 | |
| U.S. Treasury Bonds, 2.250%, 2/15/2052(d) | |
| U.S. Treasury Bonds, 3.250%, 5/15/2042 | |
| U.S. Treasury Notes, 4.625%, 6/30/2025 | |
| U.S. Treasury Notes, 4.875%, 11/30/2025 | |
| | |
| |
| American Tower Corp., 5.500%, 3/15/2028 | |
| American Tower Corp., 5.900%, 11/15/2033 | |
| Sprint Capital Corp., 6.875%, 11/15/2028 | |
| Sprint Capital Corp., 8.750%, 3/15/2032 | |
| T-Mobile USA, Inc., 2.400%, 3/15/2029 | |
| T-Mobile USA, Inc., 2.700%, 3/15/2032 | |
| T-Mobile USA, Inc., 3.375%, 4/15/2029 | |
| T-Mobile USA, Inc., 3.500%, 4/15/2031 | |
| T-Mobile USA, Inc., 3.875%, 4/15/2030 | |
| T-Mobile USA, Inc., 5.750%, 1/15/2034 | |
| | |
| |
| Level 3 Financing, Inc., 4.625%, 9/15/2027(a) | |
| Verizon Communications, Inc., 2.355%, 3/15/2032 | |
| | |
| Total Non-Convertible Bonds
(Identified Cost $7,823,288,294) | |
|
|
|
| |
| Southwest Airlines Co., 1.250%, 5/01/2025 | |
| |
| DISH Network Corp., 2.375%, 3/15/2024 | |
| DISH Network Corp., 3.375%, 8/15/2026 | |
| DISH Network Corp., Zero Coupon, 6.944%–9.514%, 12/15/2025(e) | |
| | |
| Consumer Cyclical Services — 0.1% |
| Uber Technologies, Inc., Zero Coupon, 0.000%–4.509%, 12/15/2025(e) | |
| |
| PPL Capital Funding, Inc., 2.875%, 3/15/2028(a) | |
| |
| Teladoc Health, Inc., 1.250%, 6/01/2027 | |
| |
| BioMarin Pharmaceutical, Inc., 0.599%, 8/01/2024 | |
| | |
|
| Pharmaceuticals — continued |
| BioMarin Pharmaceutical, Inc., 1.250%, 5/15/2027 | |
| Livongo Health, Inc., 0.875%, 6/01/2025 | |
| | |
| |
| Etsy, Inc., 0.125%, 9/01/2027 | |
| Etsy, Inc., 0.250%, 6/15/2028 | |
| | |
| Total Convertible Bonds
(Identified Cost $165,479,882) | |
|
|
|
| |
| Tobacco Settlement Financing Corp., 6.706%, 6/01/2046
(Identified Cost $6,710,453) | |
| Total Bonds and Notes
(Identified Cost $7,995,478,629) | |
|
|
Collateralized Loan Obligations — 3.0% |
| 522 Funding CLO Ltd., Series 2018-3A, Class AR, 3 mo. USD SOFR + 1.302%, 6.717%, 10/20/2031(a)(b) | |
| 522 Funding CLO Ltd., Series 2021-7A, Class D, 3 mo. USD SOFR + 3.162%, 8.574%, 4/23/2034(a)(b) | |
| AGL CLO 5 Ltd., Series 2020-5A, Class BR, 3 mo. USD SOFR + 1.962%, 7.377%, 7/20/2034(a)(b) | |
| AIMCO CLO 12 Ltd., Series 2020-12A, Class AR, 3 mo. USD SOFR + 1.170%, 6.573%, 1/17/2032(a)(b) | |
| Alinea CLO Ltd., Series 2018-1A, Class B, 3 mo. USD SOFR + 1.912%, 7.327%, 7/20/2031(a)(b) | |
| Allegro CLO VIII Ltd., Series 2018-2A, Class B1, 3 mo. USD SOFR + 1.932%, 7.326%, 7/15/2031(a)(b) | |
| Anchorage Capital CLO 9 Ltd., Series 2016-9A, Class AR2, 3 mo. USD SOFR + 1.402%, 6.796%, 7/15/2032(a)(b) | |
| ARES Loan Funding I Ltd., Series 2021-ALFA, Class D, 3 mo. USD SOFR + 3.262%, 8.656%, 10/15/2034(a)(b) | |
| ARES XXXVII CLO Ltd., Series 2015-4A, Class A3R, 3 mo. USD SOFR + 1.762%, 7.156%, 10/15/2030(a)(b) | |
| Atrium XV, Series 15A, Class D, 3 mo. USD SOFR + 3.262%, 8.674%, 1/23/2031(a)(b) | |
| Ballyrock CLO Ltd., Series 2019-2A, Class A2R, 3 mo. USD SOFR + 1.662%, 7.029%, 11/20/2030(a)(b) | |
| Battalion CLO VIII Ltd., Series 2015-8A, Class A2R2, 3 mo. USD SOFR + 1.812%, 7.207%, 7/18/2030(a)(b) | |
| Canyon CLO Ltd., Series 2018-1A, Class B, 3 mo. USD SOFR + 1.962%, 7.356%, 7/15/2031(a)(b) | |
| Canyon CLO Ltd., Series 2021-4A, Class B, 3 mo. USD SOFR + 1.962%, 7.356%, 10/15/2034(a)(b) | |
| Carlyle U.S. CLO Ltd., Series 2021-9A, Class B, 3 mo. USD SOFR + 1.912%, 7.327%, 10/20/2034(a)(b) | |
See accompanying notes to financial statements.
Portfolio of Investments – as of December 31, 2023Loomis Sayles Investment Grade Bond Fund (continued) | | |
|
| CIFC Funding Ltd., Series 2014-5A, Class BR2, 3 mo. USD SOFR + 2.062%, 7.464%, 10/17/2031(a)(b) | |
| CIFC Funding Ltd., Series 2017-1A, Class B, 3 mo. USD SOFR + 1.962%, 7.374%, 4/23/2029(a)(b) | |
| CIFC Funding Ltd., Series 2021-6A, Class B, 3 mo. USD SOFR + 1.912%, 7.306%, 10/15/2034(a)(b) | |
| Clover CLO LLC, Series 2018-1A, Class A1R, 3 mo. USD SOFR + 1.382%, 6.797%, 4/20/2032(a)(b) | |
| Clover CLO LLC, Series 2021-2A, Class A, 3 mo. USD SOFR + 1.432%, 6.847%, 7/20/2034(a)(b) | |
| Dryden 53 CLO Ltd., Series 2017-53A, Class B, 3 mo. USD SOFR + 1.662%, 7.056%, 1/15/2031(a)(b) | |
| Galaxy XXV CLO Ltd., Series 2018-25A, Class B, 3 mo. USD SOFR + 1.912%, 7.290%, 10/25/2031(a)(b) | |
| Galaxy XXVI CLO Ltd., Series 2018-26A, Class B, 3 mo. USD SOFR + 1.962%, 7.333%, 11/22/2031(a)(b) | |
| GoldenTree Loan Management U.S. CLO 3 Ltd., Series 2018-3A, Class B1, 3 mo. USD SOFR + 1.812%, 7.227%, 4/20/2030(a)(b) | |
| Golub Capital Partners CLO 41B-R Ltd., Series 2019-41A, Class AR, 3 mo. USD SOFR + 1.582%, 6.997%, 1/20/2034(a)(b) | |
| Hayfin U.S. XII Ltd., Series 2018-8A, Class B, 3 mo. USD SOFR + 1.742%, 7.157%, 4/20/2031(a)(b) | |
| Invesco CLO Ltd., Series 2021-1A, Class D, 3 mo. USD SOFR + 3.312%, 8.706%, 4/15/2034(a)(b) | |
| Madison Park Funding XIV Ltd., Series 2014-14A, Class BRR, 3 mo. USD SOFR + 1.962%, 7.374%, 10/22/2030(a)(b) | |
| Madison Park Funding XXV Ltd., Series 2017-25A, Class A1R, 3 mo. USD SOFR + 1.232%, 6.610%, 4/25/2029(a)(b) | |
| Madison Park Funding XXXVII Ltd., Series 2019-37A, Class AR, 3 mo. USD SOFR + 1.332%, 6.726%, 7/15/2033(a)(b) | |
| Magnetite XIV-R Ltd., Series 2015-14RA, Class B, 3 mo. USD SOFR + 1.862%, 7.257%, 10/18/2031(a)(b) | |
| Magnetite XV Ltd., Series 2015-15A, Class AR, 3 mo. USD SOFR + 1.272%, 6.650%, 7/25/2031(a)(b) | |
| Morgan Stanley Eaton Vance CLO Ltd., Series 2022-16A, Class B, 3 mo. USD SOFR + 1.950%, 7.344%, 4/15/2035(a)(b) | |
| Neuberger Berman CLO XVIII Ltd., Series 2014-18A, Class A2R2, 3 mo. USD SOFR + 1.962%, 7.374%, 10/21/2030(a)(b) | |
| Neuberger Berman CLO XVI-S Ltd., Series 2017-16SA, Class DR, 3 mo. USD SOFR + 3.162%, 8.556%, 4/15/2034(a)(b) | |
| Neuberger Berman Loan Advisers CLO 45 Ltd., Series 2021-45A, Class A, 3 mo. USD SOFR + 1.392%, 6.786%, 10/14/2035(a)(b) | |
| | |
|
| OCP CLO Ltd., Series 2016-12A, Class BR2, 3 mo. USD SOFR + 1.810%, 7.205%, 4/18/2033(a)(b) | |
| OCP CLO Ltd., Series 2020-8RA, Class A2, 3 mo. USD SOFR + 1.812%, 7.214%, 1/17/2032(a)(b) | |
| Octagon Investment Partners 18-R Ltd., Series 2018-18A, Class A2, 3 mo. USD SOFR + 1.732%, 7.126%, 4/16/2031(a)(b) | |
| Octagon Investment Partners 26 Ltd., Series 2016-1A, Class BR, 3 mo. USD SOFR + 1.862%, 7.256%, 7/15/2030(a)(b) | |
| Octagon Investment Partners 28 Ltd., Series 2016-1A, Class BR, 3 mo. USD SOFR + 2.062%, 7.460%, 10/24/2030(a)(b) | |
| Octagon Investment Partners 46 Ltd., Series 2020-2A, Class DR, 3 mo. USD SOFR + 3.562%, 8.956%, 7/15/2036(a)(b) | |
| Octagon Investment Partners XV Ltd., Series 2013-1A, Class A1RR, 3 mo. USD SOFR + 1.232%, 6.628%, 7/19/2030(a)(b) | |
| OHA Credit Partners XVI, Series 2021-16A, Class A, 3 mo. USD SOFR + 1.412%, 6.807%, 10/18/2034(a)(b) | |
| Palmer Square CLO Ltd., Series 2015-1A, Class A2R4, 3 mo. USD SOFR + 1.962%, 7.329%, 5/21/2034(a)(b) | |
| Palmer Square CLO Ltd., Series 2021-2A, Class A, 3 mo. USD SOFR + 1.412%, 6.806%, 7/15/2034(a)(b) | |
| Palmer Square Loan Funding Ltd., Series 2021-3A, Class A1, 3 mo. USD SOFR + 1.062%, 6.477%, 7/20/2029(a)(b) | |
| Post CLO Ltd., Series 2022-1A, Class B, 3 mo. USD SOFR + 1.900%, 7.316%, 4/20/2035(a)(b) | |
| Post CLO Ltd., Series 2023-1A, Class A, 3 mo. USD SOFR + 1.950%, 7.366%, 4/20/2036(a)(b) | |
| Rad CLO 15 Ltd., Series 2021-15A, Class B, 3 mo. USD SOFR + 1.912%, 7.327%, 1/20/2034(a)(b) | |
| Recette CLO Ltd., Series 2015-1A, Class BRR, 3 mo. USD SOFR + 1.662%, 7.077%, 4/20/2034(a)(b) | |
| Regatta XV Funding Ltd., Series 2018-4A, Class A2, 3 mo. USD SOFR + 2.112%, 7.490%, 10/25/2031(a)(b) | |
| Rockford Tower CLO Ltd., Series 2017-1A, Class DR2A, 3 mo. USD SOFR + 3.512%, 8.927%, 4/20/2034(a)(b) | |
| Venture XXIX CLO Ltd., Series 2017-29A, Class AR, 3 mo. USD SOFR + 1.252%, 6.631%, 9/07/2030(a)(b) | |
| Vibrant CLO XIV Ltd., Series 2021-14A, Class C, 3 mo. USD SOFR + 4.012%, 9.427%, 10/20/2034(a)(b) | |
| Voya CLO Ltd., Series 2013-3A, Class A2RR, 3 mo. USD SOFR + 1.961%, 7.356%, 10/18/2031(a)(b) | |
See accompanying notes to financial statements.
Portfolio of Investments – as of December 31, 2023Loomis Sayles Investment Grade Bond Fund (continued) | | |
|
| Voya CLO Ltd., Series 2016-3A, Class A3R, 3 mo. USD SOFR + 2.012%, 7.407%, 10/18/2031(a)(b) | |
| Voya CLO Ltd., Series 2018-3A, Class B, 3 mo. USD SOFR + 1.912%, 7.306%, 10/15/2031(a)(b) | |
| Total Collateralized Loan Obligations
(Identified Cost $312,391,385) | |
|
|
|
| Building Materials — 0.1% |
| Summit Materials LLC, 2023 Incremental Term Loan B, 11/30/2028(f) | |
| |
| Carnival Corp., 2021 Incremental Term Loan B, 1 mo. USD SOFR + 3.250%, 8.720%, 10/18/2028(b)(g) | |
| Carnival Corp., 2023 Term Loan B, 1 mo. USD SOFR + 3.000%, 8.357%, 8/08/2027(b)(g) | |
| | |
| |
| GTCR W Merger Sub LLC, USD Term Loan B, 9/20/2030(f) | |
| Total Senior Loans
(Identified Cost $35,732,896) | |
| | |
|
|
|
Convertible Preferred Stocks — 0.2% |
| |
| Bank of America Corp., Series L, 7.250% | |
| Wells Fargo & Co., Series L, Class A, 7.500% | |
| | |
| Total Preferred Stocks
(Identified Cost $27,400,785) | |
| | |
Short-Term Investments — 20.9% |
| Tri-Party Repurchase Agreement with Fixed Income Clearing Corporation, dated 12/29/2023 at 2.500% to be repurchased at $226,602,518 on 1/02/2024 collateralized by $220,247,900 U.S. Treasury Note, 0.625% due 3/31/2027 valued at $198,157,245; $34,175,600 U.S. Treasury Note, 2.500% due 3/31/2027 valued at $32,913,208 including accrued interest (Note 2 of Notes to Financial Statements) | |
| U.S. Treasury Bills, 5.043%, 6/27/2024(h) | |
| U.S. Treasury Bills, 5.071%–5.125%, 6/20/2024(h)(i) | |
| U.S. Treasury Bills, 5.083%–5.180%, 6/13/2024(h)(i) | |
| U.S. Treasury Bills, 5.225%, 1/11/2024(h) | |
| U.S. Treasury Bills, 5.230%, 4/09/2024(h) | |
| | |
| U.S. Treasury Bills, 5.246%, 1/04/2024(h) | |
| U.S. Treasury Bills, 5.252%, 1/18/2024(h) | |
| U.S. Treasury Bills, 5.305%, 3/21/2024(h) | |
| U.S. Treasury Bills, 5.325%, 2/29/2024(h) | |
| Total Short-Term Investments
(Identified Cost $2,165,027,415) | |
| Total Investments — 99.4%
(Identified Cost $10,536,031,110) | |
| Other assets less liabilities — 0.6% | |
| | |
| See Note 2 of Notes to Financial Statements. |
| All or a portion of these securities are exempt from registration under Rule 144A of the Securities Act of 1933. These securities may be resold in transactions exempt from registration, normally to qualified institutional buyers. At December 31, 2023, the value of Rule 144A holdings amounted to $3,502,096,316 or 33.8% of net assets. |
| Variable rate security. Rate as of December 31, 2023 is disclosed. Issuers comprised of various lots with differing coupon rates have been aggregated for the purpose of presentation in the Portfolio of Investments and show a weighted average rate. Certain variable rate securities are not based on a published reference rate and spread, rather are determined by the issuer or agent and are based on current market conditions. These securities may not indicate a reference rate and/or spread in their description. |
| The issuer is in default with respect to interest and/or principal payments. Income is not being accrued. |
| Security (or a portion thereof) has been pledged as collateral for open derivative contracts. |
| Interest rate represents annualized yield at time of purchase; not a coupon rate. The Fund’s investment in this security is comprised of various lots with differing annualized yields. |
| Position is unsettled. Contract rate was not determined at December 31, 2023 and does not take effect until settlement date. Maturity date is not finalized until settlement date. |
| Stated interest rate has been determined in accordance with the provisions of the loan agreement and is subject to a minimum benchmark floor rate which may range from 0.00% to 2.50%, to which the spread is added. |
| Interest rate represents discount rate at time of purchase; not a coupon rate. |
| The Fund's investment in U.S. Government/Agency securities is comprised of various lots with differing discount rates. These separate investments, which have the same maturity date, have been aggregated for the purpose of presentation in the Portfolio of Investments. |
| |
| |
| Real Estate Investment Trusts |
| Real Estate Mortgage Investment Conduits |
| |
| Secured Overnight Financing Rate |
See accompanying notes to financial statements.
Portfolio of Investments – as of December 31, 2023Loomis Sayles Investment Grade Bond Fund (continued) At December 31, 2023, open long futures contracts were as follows:
| | | | | Unrealized
Appreciation
(Depreciation) |
CBOT 10 Year U.S. Treasury Notes Futures | | | | | |
CBOT 2 Year U.S. Treasury Notes Futures | | | | | |
CBOT 5 Year U.S. Treasury Notes Futures | | | | | |
CBOT U.S. Long Bond Futures | | | | | |
| | | | | |
At December 31, 2023, open short futures contracts were as follows:
| | | | | Unrealized
Appreciation
(Depreciation) |
CME Ultra Long Term U.S. Treasury Bond Futures | | | | | |
Ultra 10-Year U.S. Treasury Notes Futures | | | | | |
| | | | | |
Industry Summary at December 31, 2023
| |
| |
| |
| |
| |
| |
| |
| |
| |
| |
Other Investments, less than 2% each | |
Collateralized Loan Obligations | |
| |
| |
Other assets less liabilities (including futures contracts) | |
| |
See accompanying notes to financial statements.
Portfolio of Investments – as of December 31, 2023Loomis Sayles Strategic Alpha Fund
| | |
Bonds and Notes — 81.0% of Net Assets |
|
|
Non-Convertible Bonds — 76.7% |
| |
| American Credit Acceptance Receivables Trust, Series 2023-3, Class D, 6.820%, 10/12/2029(a) | |
| American Credit Acceptance Receivables Trust, Series 2023-4, Class D, 7.650%, 9/12/2030(a) | |
| Avis Budget Rental Car Funding AESOP LLC, Series 2020-1A, Class C, 3.020%, 8/20/2026(a) | |
| Avis Budget Rental Car Funding AESOP LLC, Series 2020-2A, Class C, 4.250%, 2/20/2027(a) | |
| Avis Budget Rental Car Funding AESOP LLC, Series 2023-8A, Class C, 7.340%, 2/20/2030(a) | |
| Carvana Auto Receivables Trust, Series 2023-N1, Class D, 6.690%, 7/10/2029(a) | |
| Carvana Auto Receivables Trust, Series 2023-N4, Class D, 7.220%, 2/11/2030(a) | |
| Credit Acceptance Auto Loan Trust, Series 2020-3A, Class C, 2.280%, 2/15/2030(a) | |
| DT Auto Owner Trust, Series 2020-3A, Class D, 1.840%, 6/15/2026(a) | |
| DT Auto Owner Trust, Series 2022-2A, Class D, 5.460%, 3/15/2028(a) | |
| DT Auto Owner Trust, Series 2023-3A, Class D, 7.120%, 5/15/2029(a) | |
| Exeter Automobile Receivables Trust, Series 2023-5A, Class D, 7.130%, 2/15/2030 | |
| First Investors Auto Owner Trust, Series 2019-2A, Class D, 2.800%, 12/15/2025(a) | |
| First Investors Auto Owner Trust, Series 2019-2A, Class E, 3.880%, 1/15/2026(a) | |
| Flagship Credit Auto Trust, Series 2023-3, Class D, 6.580%, 8/15/2029(a) | |
| Ford Credit Auto Lease Trust, Series 2023-B, Class D, 6.970%, 6/15/2028 | |
| Ford Credit Auto Owner Trust, Series 2023-2, Class D, 6.600%, 2/15/2036(a) | |
| GLS Auto Receivables Issuer Trust, Series 2021-4A, Class D, 2.480%, 10/15/2027(a) | |
| GLS Auto Receivables Issuer Trust, Series 2023-3A, Class D, 6.440%, 5/15/2029(a) | |
| Hertz Vehicle Financing III LLC, Series 2022-1A, Class D, 4.850%, 6/25/2026(a) | |
| Hertz Vehicle Financing III LLC, Series 2022-3A, Class D, 6.310%, 3/25/2025(a) | |
| Hertz Vehicle Financing III LLC, Series 2023-1A, Class D2, 9.130%, 6/25/2027(a) | |
| Hertz Vehicle Financing III LLC, Series 2023-2A, Class D, 9.400%, 9/25/2029(a) | |
| Hertz Vehicle Financing LLC, Series 2022-2A, Class D, 5.160%, 6/26/2028(a) | |
| Hertz Vehicle Financing LLC, Series 2022-4A, Class D, 6.560%, 9/25/2026(a) | |
| Prestige Auto Receivables Trust, Series 2019-1A, Class E, 3.900%, 5/15/2026(a) | |
| Prestige Auto Receivables Trust, Series 2023-2A, Class D, 7.710%, 8/15/2029(a) | |
| Westlake Automobile Receivables Trust, Series 2022-2A, Class D, 5.480%, 9/15/2027(a) | |
| | |
|
| |
| Westlake Automobile Receivables Trust, Series 2023-3A, Class D, 6.470%, 3/15/2029(a) | |
| Westlake Automobile Receivables Trust, Series 2023-4A, Class D, 7.190%, 7/16/2029(a) | |
| | |
| |
| Mission Lane Credit Card Master Trust, Series 2023-A, Class A, 7.230%, 7/17/2028(a) | |
| Mission Lane Credit Card Master Trust, Series 2023-B, Class A, 7.690%, 11/15/2028(a) | |
| | |
| |
| Banc of America Alternative Loan Trust, Series 2003-8, Class 1CB1, 5.500%, 10/25/2033 | |
| Banc of America Funding Trust, Series 2005-7, Class 3A1, 5.750%, 11/25/2035 | |
| Banc of America Funding Trust, Series 2007-4, Class 5A1, 5.500%, 11/25/2034 | |
| BINOM Securitization Trust, Series 2022-RPL1, Class M1, 3.000%, 2/25/2061(a)(b) | |
| CHL Mortgage Pass-Through Trust, Series 2004-HYB4, Class 2A1, 5.186%, 9/20/2034(b)(c) | |
| CIM Trust, Series 2021-NR2, Class A1, 2.568%, 7/25/2059(a)(b) | |
| CoreVest American Finance Ltd., Series 2019-2, Class B, 3.424%, 6/15/2052(a) | |
| CoreVest American Finance Ltd., Series 2020-2, Class C, 4.586%, 5/15/2052(a)(b) | |
| CoreVest American Finance Ltd., Series 2020-4, Class C, 2.250%, 12/15/2052(a) | |
| CoreVest American Finance Ltd., Series 2023-RTL1, Class A1, 7.553%, 12/28/2030(a)(b) | |
| Countrywide Alternative Loan Trust, Series 2003-22CB, Class 1A1, 5.750%, 12/25/2033 | |
| Countrywide Alternative Loan Trust, Series 2004-16CB, Class 1A1, 5.500%, 7/25/2034 | |
| Countrywide Alternative Loan Trust, Series 2004-16CB, Class 3A1, 5.500%, 8/25/2034 | |
| Countrywide Alternative Loan Trust, Series 2004-J10, Class 2CB1, 6.000%, 9/25/2034 | |
| Countrywide Alternative Loan Trust, Series 2005-J1, Class 2A1, 5.500%, 2/25/2025(c) | |
| Credit Suisse Mortgage Trust, Series 2020-RPL3, Class A1, 4.046%, 3/25/2060(a)(b) | |
| Credit Suisse Mortgage Trust, Series 2021-RPL4, Class A1, 1.796%, 12/27/2060(a)(b) | |
| CSFB Mortgage-Backed Pass-Through Certificates, Series 2003-27, Class 4A4, 5.750%, 11/25/2033 | |
| DSLA Mortgage Loan Trust, Series 2005-AR5, Class 2A1A, 1 mo. USD SOFR + 0.774%, 6.130%, 9/19/2045(b) | |
| Federal Home Loan Mortgage Corp., Series 2022-DNA4, Class M1A, REMICS, 30 day USD SOFR Average + 2.200%, 7.537%, 5/25/2042(a)(b) | |
See accompanying notes to financial statements.
Portfolio of Investments – as of December 31, 2023Loomis Sayles Strategic Alpha Fund (continued) | | |
|
| ABS Home Equity — continued |
| Federal National Mortgage Association Connecticut Avenue Securities, Series 2020-R01, Class 1M2, 30 day USD SOFR Average + 2.164%, 7.502%, 1/25/2040(a)(b) | |
| Federal National Mortgage Association Connecticut Avenue Securities, Series 2022-R06, Class 1M1, 30 day USD SOFR Average + 2.750%, 8.087%, 5/25/2042(a)(b) | |
| Federal National Mortgage Association Connecticut Avenue Securities, Series 2023-R06, Class 1M2, 30 day USD SOFR Average + 2.700%, 8.037%, 7/25/2043(a)(b) | |
| Federal National Mortgage Association Connecticut Avenue Securities, Series 2023-R08, Class 1M2, 30 day USD SOFR Average + 2.500%, 7.837%, 10/25/2043(a)(b) | |
| FirstKey Homes Trust, Series 2020-SFR2, Class E, 2.668%, 10/19/2037(a) | |
| GCAT Trust, Series 2019-RPL1, Class A1, 2.650%, 10/25/2068(a)(b) | |
| GITSIT Mortgage Loan Trust, Series 2023-NPL1, Class A1, 8.353%, 5/25/2053(a)(b) | |
| Home Partners of America Trust, Series 2021-1, Class E, 2.577%, 9/17/2041(a) | |
| IndyMac INDX Mortgage Loan Trust, Series 2004-AR7, Class A5, 1 mo. USD SOFR + 1.334%, 6.690%, 9/25/2034(b) | |
| JP Morgan Mortgage Trust, Series 2004-S1, Class 2A1, 6.000%, 9/25/2034 | |
| Lehman XS Trust, Series 2006-2N, Class 1A1, 1 mo. USD SOFR + 0.634%, 5.990%, 2/25/2046(b) | |
| MASTR Adjustable Rate Mortgages Trust, Series 2004-4, Class 5A1, 5.750%, 5/25/2034(b) | |
| MASTR Alternative Loan Trust, Series 2003-9, Class 4A1, 5.250%, 11/25/2033 | |
| MASTR Alternative Loan Trust, Series 2004-5, Class 1A1, 5.500%, 6/25/2034 | |
| MASTR Alternative Loan Trust, Series 2004-5, Class 2A1, 6.000%, 6/25/2034 | |
| MASTR Alternative Loan Trust, Series 2004-8, Class 2A1, 6.000%, 9/25/2034 | |
| Merrill Lynch Mortgage Investors Trust, Series 2006-2, Class 2A, 5.470%, 5/25/2036(b)(c) | |
| Mill City Mortgage Loan Trust, Series 2021-NMR1, Class M2, 2.500%, 11/25/2060(a)(b) | |
| Morgan Stanley Mortgage Loan Trust, Series 2005-7, Class 4A2, 5.500%, 11/25/2035 | |
| Morgan Stanley Mortgage Loan Trust, Series 2005-7, Class 7A5, 5.500%, 11/25/2035 | |
| NLT Trust, Series 2023-1, Class A1, 3.200%, 10/25/2062(a)(b) | |
| Progress Residential Trust, Series 2019-SFR3, Class D, 2.871%, 9/17/2036(a) | |
| Progress Residential Trust, Series 2021-SFR2, Class E2, 2.647%, 4/19/2038(a) | |
| Progress Residential Trust, Series 2021-SFR3, Class E1, 2.538%, 5/17/2026(a) | |
| Progress Residential Trust, Series 2021-SFR3, Class E2, 2.688%, 5/17/2026(a) | |
| | |
|
| ABS Home Equity — continued |
| Progress Residential Trust, Series 2021-SFR5, Class E1, 2.209%, 7/17/2038(a) | |
| Progress Residential Trust, Series 2021-SFR5, Class E2, 2.359%, 7/17/2038(a) | |
| Progress Residential Trust, Series 2021-SFR6, Class E2, 2.525%, 7/17/2038(a) | |
| Progress Residential Trust, Series 2021-SFR7, Class E2, 2.640%, 8/17/2040(a) | |
| Progress Residential Trust, Series 2023-SFR2, Class D, 4.500%, 10/17/2028(a) | |
| PRPM LLC, Series 2021-2, Class A1, 2.115%, 3/25/2026(a)(b) | |
| PRPM LLC, Series 2021-9, Class A1, 2.363%, 10/25/2026(a)(b) | |
| PRPM LLC, Series 2023-RCF2, Class A1, 4.000%, 11/25/2053(a)(b) | |
| Redwood Funding Trust, Series 2023-1, Class A, 7.500%, 7/25/2059(a)(b) | |
| Structured Adjustable Rate Mortgage Loan Trust, Series 2005-14, Class A1, 1 mo. USD SOFR + 0.424%, 5.780%, 7/25/2035(b) | |
| Tricon American Homes, Series 2020-SFR1, Class E, 3.544%, 7/17/2038(a) | |
| Tricon American Homes Trust, Series 2020-SFR2, Class E1, 2.730%, 11/17/2039(a) | |
| VCAT LLC, Series 2021-NPL5, Class A1, 1.868%, 8/25/2051(a)(b) | |
| VOLT XCII LLC, Series 2021-NPL1, Class A1, 1.893%, 2/27/2051(a)(b) | |
| VOLT XCIII LLC, Series 2021-NPL2, Class A1, 1.893%, 2/27/2051(a)(b) | |
| VOLT XCIV LLC, Series 2021-NPL3, Class A1, 2.240%, 2/27/2051(a)(b) | |
| | |
| |
| AASET Trust, Series 2021-1A, Class A, 2.950%, 11/16/2041(a) | |
| Accelerated Assets LLC, Series 2018-1, Class B, 4.510%, 12/02/2033(a) | |
| Affirm Asset Securitization Trust, Series 2023-B, Class A, 6.820%, 9/15/2028(a) | |
| Affirm Asset Securitization Trust, Series 2023-X1, Class A, 7.110%, 11/15/2028(a) | |
| AIM Aviation Finance Ltd., Series 2015-1A, Class B1, 5.072%, 2/15/2040(a)(b) | |
| Aqua Finance Trust, Series 2019-A, Class C, 4.010%, 7/16/2040(a) | |
| BHG Securitization Trust, Series 2022-A, Class B, 2.700%, 2/20/2035(a) | |
| BHG Securitization Trust, Series 2023-B, Class B, 7.450%, 12/17/2036(a) | |
| Blackbird Capital Aircraft Lease Securitization Ltd., Series 2016-1A, Class A, 4.213%, 12/16/2041(a)(b) | |
| Castlelake Aircraft Securitization Trust, Series 2018-1, Class B, 5.300%, 6/15/2043(a) | |
| Castlelake Aircraft Structured Trust, Series 2019-1A, Class A, 3.967%, 4/15/2039(a) | |
| Foundation Finance Trust, Series 2023-2A, Class D, 9.100%, 6/15/2049(a) | |
See accompanying notes to financial statements.
Portfolio of Investments – as of December 31, 2023Loomis Sayles Strategic Alpha Fund (continued) | | |
|
| |
| FREED ABS Trust, Series 2021-2, Class C, 1.940%, 6/19/2028(a) | |
| Frontier Issuer LLC, Series 2023-1, Class A2, 6.600%, 8/20/2053(a) | |
| Hilton Grand Vacations Trust, Series 2018-AA, Class C, 4.000%, 2/25/2032(a) | |
| Hilton Grand Vacations Trust, Series 2022-1D, Class C, 4.690%, 6/20/2034(a) | |
| Horizon Aircraft Finance I Ltd., Series 2018-1, Class A, 4.458%, 12/15/2038(a) | |
| Horizon Aircraft Finance III Ltd., Series 2019-2, Class A, 3.425%, 11/15/2039(a) | |
| HPEFS Equipment Trust, Series 2023-2A, Class D, 6.970%, 7/21/2031(a) | |
| Kestrel Aircraft Funding Ltd., Series 2018-1A, Class A, 4.250%, 12/15/2038(a) | |
| MAPS Ltd., Series 2018-1A, Class A, 4.212%, 5/15/2043(a) | |
| MAPS Ltd., Series 2018-1A, Class B, 5.193%, 5/15/2043(a) | |
| Marlette Funding Trust, Series 2021-2A, Class C, 1.500%, 9/15/2031(a) | |
| Marlette Funding Trust, Series 2023-4A, Class B, 8.150%, 12/15/2033(a) | |
| Merlin Aviation Holdings DAC, Series 2016-1, Class A, 4.500%, 12/15/2032(a)(b) | |
| MVW LLC, Series 2020-1A, Class C, 4.210%, 10/20/2037(a) | |
| MVW Owner Trust, Series 2019-1A, Class C, 3.330%, 11/20/2036(a) | |
| Navient Private Education Refi Loan Trust, Series 2020-HA, Class B, 2.780%, 1/15/2069(a) | |
| OneMain Financial Issuance Trust, Series 2020-2A, Class C, 2.760%, 9/14/2035(a) | |
| OneMain Financial Issuance Trust, Series 2021-1A, Class D, 2.470%, 6/16/2036(a) | |
| Sierra Timeshare Receivables Funding LLC, Series 2020-2A, Class C, 3.510%, 7/20/2037(a) | |
| Sierra Timeshare Receivables Funding LLC, Series 2023-1A, Class C, 7.000%, 1/20/2040(a) | |
| Sierra Timeshare Receivables Funding LLC, Series 2023-2A, Class C, 7.300%, 4/20/2040(a) | |
| Slam Ltd., Series 2021-1A, Class B, 3.422%, 6/15/2046(a) | |
| SpringCastle America Funding LLC, Series 2020-AA, Class A, 1.970%, 9/25/2037(a) | |
| Sunnova Helios XII Issuer LLC, Series 2023-B, Class B, 5.600%, 8/22/2050(a) | |
| TIF Funding II LLC, Series 2021-1A, Class A, 1.650%, 2/20/2046(a) | |
| WAVE Trust, Series 2017-1A, Class A, 3.844%, 11/15/2042(a) | |
| Willis Engine Structured Trust IV, Series 2018-A, Class A, 4.750%, 9/15/2043(a)(b) | |
| Willis Engine Structured Trust V, Series 2020-A, Class A, 3.228%, 3/15/2045(a) | |
| Willis Engine Structured Trust VI, Series 2021-A, Class A, 3.104%, 5/15/2046(a) | |
| | |
| | |
|
| |
| College Avenue Student Loans LLC, Series 2021-A, Class D, 4.120%, 7/25/2051(a) | |
| Education Funding Trust, Series 2020-A, Class A, 2.790%, 7/25/2041(a) | |
| Navient Private Education Refi Loan Trust, Series 2018-A, Class B, 3.680%, 2/18/2042(a) | |
| Navient Private Education Refi Loan Trust, Series 2018-CA, Class B, 4.220%, 6/16/2042(a) | |
| Navient Private Education Refi Loan Trust, Series 2019-FA, Class B, 3.120%, 8/15/2068(a) | |
| Navient Private Education Refi Loan Trust, Series 2019-GA, Class B, 3.080%, 10/15/2068(a) | |
| Navient Private Education Refi Loan Trust, Series 2020-DA, Class B, 3.330%, 5/15/2069(a) | |
| Navient Private Education Refi Loan Trust, Series 2020-FA, Class B, 2.690%, 7/15/2069(a) | |
| Nelnet Student Loan Trust, Series 2021-DA, Class B, 2.900%, 4/20/2062(a) | |
| SLM Private Credit Student Loan Trust, Series 2003-A, Class A3, 28 day Auction Rate Security, 7.920%, 6/15/2032(b) | |
| SLM Private Credit Student Loan Trust, Series 2003-B, Class A3, 28 day Auction Rate Security, 8.969%, 3/15/2033(b) | |
| SLM Private Credit Student Loan Trust, Series 2003-B, Class A4, 28 day Auction Rate Security, 7.970%, 3/15/2033(b) | |
| SMB Private Education Loan Trust, Series 2015-C, Class B, 3.500%, 9/15/2043(a) | |
| SMB Private Education Loan Trust, Series 2017-B, Class A2B, 1 mo. USD SOFR + 0.864%, 6.226%, 10/15/2035(a)(b) | |
| SMB Private Education Loan Trust, Series 2018-B, Class B, 4.000%, 7/15/2042(a) | |
| SMB Private Education Loan Trust, Series 2018-C, Class B, 4.000%, 11/17/2042(a) | |
| SoFi Professional Loan Program LLC, Series 2020-A, Class BFX, 3.120%, 5/15/2046(a) | |
| | |
| ABS Whole Business — 0.7% |
| Applebee's Funding LLC/IHOP Funding LLC, Series 2023-1A, Class A2, 7.824%, 3/05/2053(a) | |
| FOCUS Brands Funding, Series 2023-2, Class A2, 8.241%, 10/30/2053(a) | |
| Planet Fitness Master Issuer LLC, Series 2019-1A, Class A2, 3.858%, 12/05/2049(a) | |
| | |
| Aerospace & Defense — 0.5% |
| Embraer Netherlands Finance BV, 7.000%, 7/28/2030(a) | |
| RTX Corp., 6.100%, 3/15/2034 | |
| | |
| |
| United Airlines Pass-Through Trust, Series 2019-2, Class B, 3.500%, 11/01/2029 | |
| |
| General Motors Co., 5.200%, 4/01/2045 | |
| General Motors Co., 5.400%, 4/01/2048 | |
| General Motors Co., 5.950%, 4/01/2049 | |
See accompanying notes to financial statements.
Portfolio of Investments – as of December 31, 2023Loomis Sayles Strategic Alpha Fund (continued) | | |
|
| |
| General Motors Financial Co., Inc., 1.200%, 10/15/2024 | |
| General Motors Financial Co., Inc., Series A, (fixed rate to 9/30/2027, variable rate thereafter), 5.750%(d) | |
| General Motors Financial Co., Inc., Series B, (fixed rate to 9/30/2028, variable rate thereafter), 6.500%(d) | |
| General Motors Financial Co., Inc., Series C, (fixed rate to 9/30/2030, variable rate thereafter), 5.700%(d) | |
| ZF North America Capital, Inc., 6.875%, 4/14/2028(a) | |
| ZF North America Capital, Inc., 7.125%, 4/14/2030(a) | |
| | |
| |
| Ally Financial, Inc., Series B, (fixed rate to 5/15/2026, variable rate thereafter), 4.700%(d) | |
| Ally Financial, Inc., Series C, (fixed rate to 5/15/2028, variable rate thereafter), 4.700%(d) | |
| Banco Santander SA, 5.147%, 8/18/2025 | |
| Bank of America Corp., (fixed rate to 3/08/2032, variable rate thereafter), 3.846%, 3/08/2037 | |
| Barclays PLC, (fixed rate to 3/15/2028, variable rate thereafter), 4.375%(d) | |
| Barclays PLC, (fixed rate to 9/23/2030, variable rate thereafter), 3.564%, 9/23/2035 | |
| Citigroup, Inc., (fixed rate to 1/25/2025, variable rate thereafter), 2.014%, 1/25/2026 | |
| Citigroup, Inc., (fixed rate to 5/01/2024, variable rate thereafter), 0.981%, 5/01/2025 | |
| Deutsche Bank AG, (fixed rate to 10/07/2031, variable rate thereafter), 3.742%, 1/07/2033 | |
| Deutsche Bank AG, (fixed rate to 10/14/2030, variable rate thereafter), 3.729%, 1/14/2032 | |
| Intesa Sanpaolo SpA, 7.200%, 11/28/2033(a) | |
| Morgan Stanley, MTN, (fixed rate to 10/21/2024, variable rate thereafter), 1.164%, 10/21/2025 | |
| Standard Chartered PLC, (fixed rate to 11/18/2030, variable rate thereafter), 3.265%, 2/18/2036(a) | |
| UBS Group AG, (fixed rate to 11/15/2032, variable rate thereafter), 9.016%, 11/15/2033(a) | |
| UBS Group AG, (fixed rate to 5/14/2031, variable rate thereafter), 3.091%, 5/14/2032(a) | |
| UBS Group AG, (fixed rate to 6/05/2025, variable rate thereafter), 2.193%, 6/05/2026(a) | |
| UBS Group AG, (fixed rate to 8/11/2027, variable rate thereafter), 6.442%, 8/11/2028(a) | |
| UBS Group AG, (fixed rate to 8/12/2032, variable rate thereafter), 6.537%, 8/12/2033(a) | |
| | |
| Building Materials — 1.3% |
| Cemex SAB de CV, 3.875%, 7/11/2031(a) | |
| Cemex SAB de CV, 5.200%, 9/17/2030(a) | |
| Cemex SAB de CV, 5.450%, 11/19/2029(a) | |
| Cemex SAB de CV, (fixed rate to 6/08/2026, variable rate thereafter), 5.125%(a)(d) | |
| | |
| | |
|
| |
| CCO Holdings LLC/CCO Holdings Capital Corp., 5.125%, 5/01/2027(a) | |
| CCO Holdings LLC/CCO Holdings Capital Corp., 5.500%, 5/01/2026(a) | |
| Charter Communications Operating LLC/Charter Communications Operating Capital, 2.300%, 2/01/2032 | |
| Charter Communications Operating LLC/Charter Communications Operating Capital, 2.800%, 4/01/2031 | |
| Charter Communications Operating LLC/Charter Communications Operating Capital, 4.400%, 4/01/2033 | |
| Charter Communications Operating LLC/Charter Communications Operating Capital, 4.400%, 12/01/2061 | |
| CSC Holdings LLC, 3.375%, 2/15/2031(a) | |
| CSC Holdings LLC, 4.500%, 11/15/2031(a) | |
| CSC Holdings LLC, 4.625%, 12/01/2030(a) | |
| CSC Holdings LLC, 5.000%, 11/15/2031(a) | |
| CSC Holdings LLC, 5.750%, 1/15/2030(a) | |
| DISH DBS Corp., 5.125%, 6/01/2029 | |
| DISH DBS Corp., 5.250%, 12/01/2026(a) | |
| DISH DBS Corp., 5.750%, 12/01/2028(a) | |
| | |
| |
| Braskem Netherlands Finance BV, 4.500%, 1/31/2030(a) | |
| Celanese U.S. Holdings LLC, 6.330%, 7/15/2029 | |
| Celanese U.S. Holdings LLC, 6.550%, 11/15/2030 | |
| Celanese U.S. Holdings LLC, 6.700%, 11/15/2033 | |
| | |
| Consumer Cyclical Services — 1.5% |
| Go Daddy Operating Co. LLC/GD Finance Co., Inc., 5.250%, 12/01/2027(a) | |
| Uber Technologies, Inc., 4.500%, 8/15/2029(a) | |
| Uber Technologies, Inc., 6.250%, 1/15/2028(a) | |
| | |
| Diversified Manufacturing — 0.2% |
| Veralto Corp., 5.450%, 9/18/2033(a) | |
| |
| Pacific Gas & Electric Co., 4.300%, 3/15/2045 | |
| Pacific Gas & Electric Co., 5.450%, 6/15/2027 | |
| | |
| |
| AerCap Ireland Capital DAC/AerCap Global Aviation Trust, 3.300%, 1/30/2032 | |
| AerCap Ireland Capital DAC/AerCap Global Aviation Trust, 3.400%, 10/29/2033 | |
| AerCap Ireland Capital DAC/AerCap Global Aviation Trust, 6.150%, 9/30/2030 | |
| Aircastle Ltd., 6.500%, 7/18/2028(a) | |
| Aircastle Ltd., Series A, (fixed rate to 6/15/2026, variable rate thereafter), 5.250%(a)(d) | |
| Ares Capital Corp., 2.875%, 6/15/2028 | |
| Ares Capital Corp., 3.200%, 11/15/2031 | |
| Blue Owl Capital Corp., 2.875%, 6/11/2028 | |
| Blue Owl Technology Finance Corp., 2.500%, 1/15/2027 | |
See accompanying notes to financial statements.
Portfolio of Investments – as of December 31, 2023Loomis Sayles Strategic Alpha Fund (continued) | | |
|
| Finance Companies — continued |
| OneMain Finance Corp., 3.500%, 1/15/2027 | |
| OneMain Finance Corp., 3.875%, 9/15/2028 | |
| OneMain Finance Corp., 4.000%, 9/15/2030 | |
| OneMain Finance Corp., 5.375%, 11/15/2029 | |
| OneMain Finance Corp., 6.875%, 3/15/2025 | |
| Rocket Mortgage LLC/Rocket Mortgage Co-Issuer, Inc., 2.875%, 10/15/2026(a) | |
| Rocket Mortgage LLC/Rocket Mortgage Co-Issuer, Inc., 3.625%, 3/01/2029(a) | |
| Rocket Mortgage LLC/Rocket Mortgage Co-Issuer, Inc., 3.875%, 3/01/2031(a) | |
| Rocket Mortgage LLC/Rocket Mortgage Co-Issuer, Inc., 4.000%, 10/15/2033(a) | |
| | |
| |
| Agile Group Holdings Ltd., 5.500%, 4/21/2025 | |
| Agile Group Holdings Ltd., 5.500%, 5/17/2026 | |
| Agile Group Holdings Ltd., 5.750%, 1/02/2025 | |
| Agile Group Holdings Ltd., 6.050%, 10/13/2025 | |
| Central China Real Estate Ltd., 7.250%, 7/16/2024(e) | |
| Central China Real Estate Ltd., 7.250%, 8/13/2024(e) | |
| Central China Real Estate Ltd., 7.650%, 8/27/2025(e) | |
| Central China Real Estate Ltd., 7.750%, 5/24/2024(e) | |
| CFLD Cayman Investment Ltd., 2.500%, 1/31/2031(a)(f) | |
| CFLD Cayman Investment Ltd., 2.500%, 1/31/2031(a)(f) | |
| CFLD Cayman Investment Ltd., Zero Coupon, 0.000%–28.181%, 1/31/2031(a)(g) | |
| China Aoyuan Group Ltd., 6.350%, 2/08/2024(e) | |
| China Aoyuan Group Ltd., 7.950%, 2/19/2023(e) | |
| China Evergrande Group, 8.250%, 3/23/2022(e) | |
| China Evergrande Group, 8.750%, 6/28/2025(e) | |
| China Evergrande Group, 9.500%, 4/11/2022(e) | |
| China Evergrande Group, 9.500%, 3/29/2024(e) | |
| CIFI Holdings Group Co. Ltd., 4.450%, 8/17/2026(e) | |
| Icahn Enterprises LP/Icahn Enterprises Finance Corp., 4.375%, 2/01/2029 | |
| Icahn Enterprises LP/Icahn Enterprises Finance Corp., 4.750%, 9/15/2024 | |
| Icahn Enterprises LP/Icahn Enterprises Finance Corp., 5.250%, 5/15/2027 | |
| Icahn Enterprises LP/Icahn Enterprises Finance Corp., 6.250%, 5/15/2026 | |
| Icahn Enterprises LP/Icahn Enterprises Finance Corp., 6.375%, 12/15/2025 | |
| Kaisa Group Holdings Ltd., 9.375%, 6/30/2024(e) | |
| Kaisa Group Holdings Ltd., 9.950%, 7/23/2025(e) | |
| Kaisa Group Holdings Ltd., 10.500%, 1/15/2025(e) | |
| Kaisa Group Holdings Ltd., 11.250%, 4/16/2025(e) | |
| Kaisa Group Holdings Ltd., 11.650%, 6/01/2026(e) | |
| Kaisa Group Holdings Ltd., 11.700%, 11/11/2025(e) | |
| | |
|
| Financial Other — continued |
| KWG Group Holdings Ltd., 6.000%, 8/14/2026(e) | |
| KWG Group Holdings Ltd., 6.300%, 2/13/2026(e) | |
| Logan Group Co. Ltd., 4.250%, 7/12/2025(e) | |
| Logan Group Co. Ltd., 4.850%, 12/14/2026(e) | |
| Shimao Group Holdings Ltd., 3.450%, 1/11/2031(e) | |
| Shimao Group Holdings Ltd., 5.200%, 1/16/2027(e) | |
| Shimao Group Holdings Ltd., 6.125%, 2/21/2024(e) | |
| Sunac China Holdings Ltd., 6.000% PIK or 5.000% Cash, 9/30/2026(a)(h) | |
| Sunac China Holdings Ltd., 6.250% PIK or 5.250% Cash, 9/30/2027(a)(h) | |
| Sunac China Holdings Ltd., 6.500% PIK or 5.500% Cash, 9/30/2027(a)(h) | |
| Sunac China Holdings Ltd., 6.750% PIK or 5.750% Cash, 9/30/2028(a)(h) | |
| Sunac China Holdings Ltd., 7.000% PIK or 6.000% Cash, 9/30/2029(a)(h) | |
| Sunac China Holdings Ltd., 7.250% PIK or 6.250% Cash, 9/30/2030(a)(h) | |
| Times China Holdings Ltd., 5.750%, 1/14/2027(e) | |
| Times China Holdings Ltd., 6.200%, 3/22/2026(e) | |
| Yuzhou Group Holdings Co. Ltd., 6.350%, 1/13/2027(e) | |
| Yuzhou Group Holdings Co. Ltd., 7.375%, 1/13/2026(e) | |
| Yuzhou Group Holdings Co. Ltd., 7.700%, 2/20/2025(e) | |
| Yuzhou Group Holdings Co. Ltd., 7.850%, 8/12/2026(e) | |
| Zhenro Properties Group Ltd., 6.630%, 1/07/2026(e) | |
| Zhenro Properties Group Ltd., 6.700%, 8/04/2026(e) | |
| Zhenro Properties Group Ltd., 7.350%, 2/05/2025(e) | |
| | |
| |
| JBS USA LUX SA/JBS USA Food Co./JBS USA Finance, Inc., 3.000%, 2/02/2029 | |
| |
| Genm Capital Labuan Ltd., 3.882%, 4/19/2031(a) | |
| GLP Capital LP/GLP Financing II, Inc., 6.750%, 12/01/2033 | |
| Light & Wonder International, Inc., 7.000%, 5/15/2028(a) | |
| Light & Wonder International, Inc., 7.250%, 11/15/2029(a) | |
| Light & Wonder International, Inc., 7.500%, 9/01/2031(a) | |
| VICI Properties LP/VICI Note Co., Inc., 3.875%, 2/15/2029(a) | |
| VICI Properties LP/VICI Note Co., Inc., 4.625%, 6/15/2025(a) | |
| | |
| Government Owned - No Guarantee — 0.9% |
| Antares Holdings LP, 2.750%, 1/15/2027(a) | |
See accompanying notes to financial statements.
Portfolio of Investments – as of December 31, 2023Loomis Sayles Strategic Alpha Fund (continued) | | |
|
| Government Owned - No Guarantee — continued |
| Antares Holdings LP, 3.750%, 7/15/2027(a) | |
| Antares Holdings LP, 3.950%, 7/15/2026(a) | |
| | |
| |
| National Health Investors, Inc., 3.000%, 2/01/2031 | |
| |
| Centene Corp., 3.375%, 2/15/2030 | |
| Centene Corp., 4.625%, 12/15/2029 | |
| Molina Healthcare, Inc., 4.375%, 6/15/2028(a) | |
| | |
| Independent Energy — 2.7% |
| Aker BP ASA, 4.000%, 1/15/2031(a) | |
| Continental Resources, Inc., 2.875%, 4/01/2032(a) | |
| Continental Resources, Inc., 5.750%, 1/15/2031(a) | |
| Energian Israel Finance Ltd., 5.375%, 3/30/2028(a) | |
| EQT Corp., 3.625%, 5/15/2031(a) | |
| Leviathan Bond Ltd., 6.125%, 6/30/2025(a) | |
| Leviathan Bond Ltd., 6.500%, 6/30/2027(a) | |
| Occidental Petroleum Corp., 7.875%, 9/15/2031 | |
| Occidental Petroleum Corp., 8.875%, 7/15/2030 | |
| Ovintiv, Inc., 6.500%, 8/15/2034 | |
| Ovintiv, Inc., 6.500%, 2/01/2038 | |
| Ovintiv, Inc., 6.625%, 8/15/2037 | |
| Ovintiv, Inc., 7.200%, 11/01/2031 | |
| Ovintiv, Inc., 7.375%, 11/01/2031 | |
| Ovintiv, Inc., 8.125%, 9/15/2030 | |
| Var Energi ASA, 7.500%, 1/15/2028(a) | |
| Var Energi ASA, 8.000%, 11/15/2032(a) | |
| Viper Energy, Inc., 7.375%, 11/01/2031(a) | |
| | |
| |
| Carnival Corp., 5.750%, 3/01/2027(a) | |
| Carnival Corp., 6.000%, 5/01/2029(a) | |
| NCL Corp. Ltd., 5.875%, 3/15/2026(a) | |
| NCL Corp. Ltd., 5.875%, 2/15/2027(a) | |
| NCL Corp. Ltd., 8.125%, 1/15/2029(a) | |
| NCL Finance Ltd., 6.125%, 3/15/2028(a) | |
| Royal Caribbean Cruises Ltd., 4.250%, 7/01/2026(a) | |
| Royal Caribbean Cruises Ltd., 5.500%, 4/01/2028(a) | |
| VOC Escrow Ltd., 5.000%, 2/15/2028(a) | |
| | |
| |
| Global Atlantic Fin Co., 4.400%, 10/15/2029(a) | |
| |
| Provincia de Buenos Aires/Government Bonds, Argentina Deposit Rates Badlar Pvt Banks + 3.750%, 129.126%, 4/12/2025, (ARS)(a) | |
| |
| Hilton Grand Vacations Borrower Escrow LLC/Hilton Grand Vacations Borrower Escrow, Inc., 4.875%, 7/01/2031(a) | |
| | |
|
| |
| Hilton Grand Vacations Borrower Escrow LLC/Hilton Grand Vacations Borrower Escrow, Inc., 5.000%, 6/01/2029(a) | |
| Marriott International, Inc., 5.550%, 10/15/2028 | |
| Marriott Ownership Resorts, Inc., 4.500%, 6/15/2029(a) | |
| Travel & Leisure Co., 4.500%, 12/01/2029(a) | |
| Travel & Leisure Co., 4.625%, 3/01/2030(a) | |
| | |
| Media Entertainment — 1.8% |
| iHeartCommunications, Inc., 5.250%, 8/15/2027(a) | |
| Netflix, Inc., 4.875%, 6/15/2030(a) | |
| Netflix, Inc., 5.375%, 11/15/2029(a) | |
| Netflix, Inc., 5.875%, 11/15/2028 | |
| Netflix, Inc., 6.375%, 5/15/2029 | |
| Warnermedia Holdings, Inc., 4.054%, 3/15/2029 | |
| Warnermedia Holdings, Inc., 4.279%, 3/15/2032 | |
| | |
| |
| ArcelorMittal SA, 6.800%, 11/29/2032 | |
| First Quantum Minerals Ltd., 6.875%, 3/01/2026(a) | |
| First Quantum Minerals Ltd., 7.500%, 4/01/2025(a) | |
| Glencore Funding LLC, 6.125%, 10/06/2028(a) | |
| Glencore Funding LLC, 6.375%, 10/06/2030(a) | |
| Glencore Funding LLC, 6.500%, 10/06/2033(a) | |
| | |
| |
| EnLink Midstream LLC, 6.500%, 9/01/2030(a) | |
| Targa Resources Corp., 6.125%, 3/15/2033 | |
| Targa Resources Corp., 6.500%, 3/30/2034 | |
| Targa Resources Partners LP/Targa Resources Partners Finance Corp., 4.875%, 2/01/2031 | |
| Venture Global Calcasieu Pass LLC, 3.875%, 11/01/2033(a) | |
| Venture Global Calcasieu Pass LLC, 4.125%, 8/15/2031(a) | |
| Western Midstream Operating LP, 6.150%, 4/01/2033 | |
| | |
| Non-Agency Commercial Mortgage-Backed |
| BBCMS Mortgage Trust, Series 2020-BID, Class B, 1 mo. USD SOFR + 2.654%, 8.017%, 10/15/2037(a)(b) | |
| BPR Trust, Series 2021-NRD, Class F, 1 mo. USD SOFR + 6.870%, 12.232%, 12/15/2038(a)(b) | |
| Citigroup Commercial Mortgage Trust, Series 2014-GC21, Class D, 4.937%, 5/10/2047(a)(b) | |
| Commercial Mortgage Trust, Series 2012-CR3, Class B, 3.922%, 10/15/2045(a) | |
| Commercial Mortgage Trust, Series 2012-LC4, Class C, 5.294%, 12/10/2044(b) | |
| Credit Suisse Mortgage Trust, Series 2014-USA, Class D, 4.373%, 9/15/2037(a) | |
| Credit Suisse Mortgage Trust, Series 2014-USA, Class E, 4.373%, 9/15/2037(a) | |
See accompanying notes to financial statements.
Portfolio of Investments – as of December 31, 2023Loomis Sayles Strategic Alpha Fund (continued) | | |
|
| Non-Agency Commercial Mortgage-Backed Securities — continued |
| DBUBS Mortgage Trust, Series 2017-BRBK, Class D, 3.530%, 10/10/2034(a)(b) | |
| DC Commercial Mortgage Trust, Series 2023-DC, Class C, 7.141%, 9/12/2040(a)(b) | |
| Extended Stay America Trust, Series 2021-ESH, Class D, 1 mo. USD SOFR + 2.364%, 7.727%, 7/15/2038(a)(b) | |
| GS Mortgage Securities Corp. Trust, Series 2012-BWTR, Class A, 2.954%, 11/05/2034(a) | |
| GS Mortgage Securities Corp. Trust, Series 2013-G1, Class B, 3.721%, 4/10/2031(a)(b) | |
| GS Mortgage Securities Corp. Trust, Series 2013-PEMB, Class D, 3.550%, 3/05/2033(a)(b) | |
| GS Mortgage Securities Trust, Series 2011-GC5, Class C, 5.153%, 8/10/2044(a)(b) | |
| GS Mortgage Securities Trust, Series 2011-GC5, Class D, 5.153%, 8/10/2044(a)(b) | |
| GS Mortgage Securities Trust, Series 2014-GC18, Class B, 4.885%, 1/10/2047(b) | |
| JP Morgan Chase Commercial Mortgage Securities Trust, Series 2011-C3, Class C, 5.360%, 2/15/2046(a)(b) | |
| JP Morgan Chase Commercial Mortgage Securities Trust, Series 2012-LC9, Class C, 3.784%, 12/15/2047(a)(b) | |
| Morgan Stanley Capital I Trust, Series 2011-C2, Class D, 5.211%, 6/15/2044(a)(b) | |
| Morgan Stanley Capital I Trust, Series 2011-C2, Class E, 5.211%, 6/15/2044(a)(b) | |
| Starwood Retail Property Trust, Series 2014-STAR, Class C, 8.500%, 11/15/2027(a)(b)(c)(f) | |
| Starwood Retail Property Trust, Series 2014-STAR, Class D, PRIME + 0.000%, 8.500%, 11/15/2027(a)(b)(c)(f) | |
| Starwood Retail Property Trust, Series 2014-STAR, Class E, PRIME + 0.000%, 8.500%, 11/15/2027(a)(b)(c)(f) | |
| Wells Fargo Commercial Mortgage Trust, Series 2013-LC12, Class B, 3.954%, 7/15/2046(b) | |
| Wells Fargo Commercial Mortgage Trust, Series 2016-C36, Class B, 3.671%, 11/15/2059(b) | |
| Wells Fargo Commercial Mortgage Trust, Series 2016-C36, Class C, 4.118%, 11/15/2059(b) | |
| WFRBS Commercial Mortgage Trust, Series 2011-C3, Class D, 5.855%, 3/15/2044(a)(b) | |
| WFRBS Commercial Mortgage Trust, Series 2011-C4, Class E, 4.979%, 6/15/2044(a)(b) | |
| WFRBS Commercial Mortgage Trust, Series 2012-C10, Class C, 4.329%, 12/15/2045(b) | |
| WFRBS Commercial Mortgage Trust, Series 2014-C20, Class B, 4.378%, 5/15/2047 | |
| | |
| |
| Bausch Health Cos., Inc., 4.875%, 6/01/2028(a) | |
| | |
|
| Pharmaceuticals — continued |
| Teva Pharmaceutical Finance Netherlands II BV, 4.375%, 5/09/2030, (EUR) | |
| Teva Pharmaceutical Finance Netherlands II BV, 7.375%, 9/15/2029, (EUR) | |
| Teva Pharmaceutical Finance Netherlands II BV, 7.875%, 9/15/2031, (EUR) | |
| Teva Pharmaceutical Finance Netherlands III BV, 3.150%, 10/01/2026 | |
| Teva Pharmaceutical Finance Netherlands III BV, 4.100%, 10/01/2046 | |
| Teva Pharmaceutical Finance Netherlands III BV, 4.750%, 5/09/2027 | |
| Teva Pharmaceutical Finance Netherlands III BV, 7.875%, 9/15/2029 | |
| Teva Pharmaceutical Finance Netherlands III BV, 8.125%, 9/15/2031 | |
| | |
| |
| Lithia Motors, Inc., 3.875%, 6/01/2029(a) | |
| |
| Republic of Uzbekistan International Bonds, 7.850%, 10/12/2028(a) | |
| |
| Broadcom, Inc., 2.450%, 2/15/2031(a) | |
| Broadcom, Inc., 2.600%, 2/15/2033(a) | |
| Broadcom, Inc., 3.137%, 11/15/2035(a) | |
| Broadcom, Inc., 3.419%, 4/15/2033(a) | |
| Broadcom, Inc., 3.469%, 4/15/2034(a) | |
| Broadcom, Inc., 4.150%, 11/15/2030 | |
| Broadcom, Inc., 4.150%, 4/15/2032(a) | |
| CDW LLC/CDW Finance Corp., 3.250%, 2/15/2029 | |
| CommScope Technologies LLC, 5.000%, 3/15/2027(a) | |
| CommScope, Inc., 4.750%, 9/01/2029(a) | |
| CommScope, Inc., 7.125%, 7/01/2028(a) | |
| Everi Holdings, Inc., 5.000%, 7/15/2029(a) | |
| Global Payments, Inc., 2.900%, 11/15/2031 | |
| Global Payments, Inc., 5.400%, 8/15/2032 | |
| Leidos, Inc., 5.750%, 3/15/2033 | |
| Micron Technology, Inc., 5.875%, 2/09/2033 | |
| Micron Technology, Inc., 5.875%, 9/15/2033 | |
| Micron Technology, Inc., 6.750%, 11/01/2029 | |
| Open Text Corp., 6.900%, 12/01/2027(a) | |
| S&P Global, Inc., 5.250%, 9/15/2033(a) | |
| Trimble, Inc., 6.100%, 3/15/2033 | |
| VMware LLC, 2.200%, 8/15/2031 | |
| Western Digital Corp., 2.850%, 2/01/2029 | |
| | |
| Transportation Services — 0.3% |
| Rand Parent LLC, 8.500%, 2/15/2030(a) | |
| |
| Brazil Notas do Tesouro Nacional, Series NTNF, 10.000%, 1/01/2029, (BRL) | |
| Indonesia Treasury Bonds, Series 101, 6.875%, 4/15/2029, (IDR) | |
| Indonesia Treasury Bonds, Series FR95, 6.375%, 8/15/2028, (IDR) | |
| Mexico Bonos, Series M, 7.500%, 5/26/2033, (MXN) | |
See accompanying notes to financial statements.
Portfolio of Investments – as of December 31, 2023Loomis Sayles Strategic Alpha Fund (continued) | | |
|
| |
| Republic of South Africa Government Bonds, Series 2037, 8.500%, 1/31/2037, (ZAR) | |
| U.S. Treasury Notes, 4.500%, 11/30/2024(k) | |
| Uruguay Government International Bonds, 8.250%, 5/21/2031, (UYU) | |
| | |
| |
| American Tower Corp., 5.900%, 11/15/2033 | |
| IHS Holding Ltd., 5.625%, 11/29/2026(a) | |
| | |
| Total Non-Convertible Bonds
(Identified Cost $548,593,378) | |
|
|
|
| |
| Southwest Airlines Co., 1.250%, 5/01/2025 | |
| |
| DISH Network Corp., 2.375%, 3/15/2024 | |
| DISH Network Corp., 3.375%, 8/15/2026 | |
| DISH Network Corp., Zero Coupon, 7.761%–33.747%, 12/15/2025(g) | |
| | |
| Consumer Cyclical Services — 0.3% |
| Uber Technologies, Inc., Zero Coupon, 0.000%–5.582%, 12/15/2025(g) | |
| |
| Sunac China Holdings Ltd., 7.800% PIK or 7.800% Cash, 9/30/2032(a)(h) | |
| |
| Penn Entertainment, Inc., 2.750%, 5/15/2026 | |
| |
| Envista Holdings Corp., 1.750%, 8/15/2028(a) | |
| Teladoc Health, Inc., 1.250%, 6/01/2027 | |
| | |
| |
| NCL Corp. Ltd., 1.125%, 2/15/2027 | |
| Media Entertainment — 0.1% |
| Spotify USA, Inc., Zero Coupon, 5.189%–5.777%, 3/15/2026(g) | |
| |
| BioMarin Pharmaceutical, Inc., 0.599%, 8/01/2024 | |
| BioMarin Pharmaceutical, Inc., 1.250%, 5/15/2027 | |
| Guardant Health, Inc., Zero Coupon, 0.000%, 11/15/2027(l) | |
| Livongo Health, Inc., 0.875%, 6/01/2025 | |
| | |
| |
| Etsy, Inc., 0.125%, 9/01/2027 | |
| Etsy, Inc., 0.250%, 6/15/2028 | |
| | |
| | |
|
| |
| Splunk, Inc., 1.125%, 6/15/2027 | |
| Unity Software, Inc., Zero Coupon, 7.084%–8.213%, 11/15/2026(g) | |
| | |
| Total Convertible Bonds
(Identified Cost $32,597,520) | |
| Total Bonds and Notes
(Identified Cost $581,190,898) | |
|
|
Collateralized Loan Obligations — 9.1% |
| AIMCO CLO 12 Ltd., Series 2020-12A, Class AR, 3 mo. USD SOFR + 1.170%, 6.573%, 1/17/2032(a)(b) | |
| Apidos CLO XX Ltd., Series 2015-20A, Class BRR, 3 mo. USD SOFR + 2.212%, 7.606%, 7/16/2031(a)(b) | |
| Apidos CLO XXIII Ltd., Series 2015-23A, Class CR, 3 mo. USD SOFR + 2.262%, 7.656%, 4/15/2033(a)(b) | |
| ARES LIX CLO Ltd., Series 2021-59A, Class E, 3 mo. USD SOFR + 6.512%, 11.890%, 4/25/2034(a)(b) | |
| Barings CLO Ltd., Series 2019-4A, Class C, 3 mo. USD SOFR + 3.062%, 8.456%, 1/15/2033(a)(b) | |
| Battalion CLO XVI Ltd., Series 2019-16A, Class DR, 3 mo. USD SOFR + 3.512%, 8.927%, 12/19/2032(a)(b) | |
| Bristol Park CLO Ltd., Series 2016-1A, Class CR, 3 mo. USD SOFR + 2.212%, 7.606%, 4/15/2029(a)(b) | |
| Burnham Park CLO Ltd., Series 2016-1A, Class CR, 3 mo. USD SOFR + 2.412%, 7.827%, 10/20/2029(a)(b) | |
| Carbone CLO Ltd., Series 2017-1A, Class B, 3 mo. USD SOFR + 2.062%, 7.477%, 1/20/2031(a)(b) | |
| Carlyle U.S. CLO Ltd., Series 2016-4A, Class A2R, 3 mo. USD SOFR + 1.712%, 7.127%, 10/20/2027(a)(b) | |
| CarVal CLO IV Ltd., Series 2021-1A, Class D, 3 mo. USD SOFR + 3.512%, 8.927%, 7/20/2034(a)(b) | |
| CIFC Funding Ltd., Series 2013-2A, Class A3LR, 3 mo. USD SOFR + 2.212%, 7.607%, 10/18/2030(a)(b) | |
| CIFC Funding Ltd., Series 2014-2RA, Class A3, 3 mo. USD SOFR + 2.162%, 7.560%, 4/24/2030(a)(b) | |
| Clover CLO LLC, Series 2021-2A, Class A, 3 mo. USD SOFR + 1.432%, 6.847%, 7/20/2034(a)(b) | |
| Dryden 45 Senior Loan Fund, Series 2016-45A, Class ER, 3 mo. USD SOFR + 6.112%, 11.506%, 10/15/2030(a)(b) | |
| Dryden 64 CLO Ltd., Series 2018-64A, Class C, 3 mo. USD SOFR + 2.012%, 7.407%, 4/18/2031(a)(b) | |
| Dryden XXVI Senior Loan Fund, Series 2013-26A, Class CR, 3 mo. USD SOFR + 2.112%, 7.506%, 4/15/2029(a)(b) | |
See accompanying notes to financial statements.
Portfolio of Investments – as of December 31, 2023Loomis Sayles Strategic Alpha Fund (continued) | | |
|
| Galaxy XXVI CLO Ltd., Series 2018-26A, Class E, 3 mo. USD SOFR + 6.112%, 11.483%, 11/22/2031(a)(b) | |
| GoldenTree Loan Management U.S. CLO 3 Ltd., Series 2018-3A, Class C, 3 mo. USD SOFR + 2.162%, 7.577%, 4/20/2030(a)(b) | |
| Golub Capital Partners CLO 41B-R Ltd., Series 2019-41A, Class AR, 3 mo. USD SOFR + 1.582%, 6.997%, 1/20/2034(a)(b) | |
| Hayfin U.S. XII Ltd., Series 2020-12A, Class D, 3 mo. USD SOFR + 4.422%, 9.837%, 1/20/2034(a)(b) | |
| LCM 30 Ltd., Series 30A, Class DR, 3 mo. USD SOFR + 3.262%, 8.677%, 4/20/2031(a)(b) | |
| Madison Park Funding XXXI Ltd., Series 2018-31A, Class C, 3 mo. USD SOFR + 2.412%, 7.824%, 1/23/2031(a)(b) | |
| Neuberger Berman CLO XIV Ltd., Series 2013-14A, Class CR2, 3 mo. USD SOFR + 2.162%, 7.552%, 1/28/2030(a)(b) | |
| Neuberger Berman Loan Advisers CLO 45 Ltd., Series 2021-45A, Class A, 3 mo. USD SOFR + 1.392%, 6.786%, 10/14/2035(a)(b) | |
| Oaktree CLO Ltd., Series 2019-4A, Class E, 3 mo. USD SOFR + 7.492%, 12.907%, 10/20/2032(a)(b) | |
| Octagon Investment Partners 39 Ltd., Series 2018-3A, Class E, 3 mo. USD SOFR + 6.012%, 11.427%, 10/20/2030(a)(b) | |
| Octagon Investment Partners XXII Ltd., Series 2014-1A, Class CRR, 3 mo. USD SOFR + 2.162%, 7.574%, 1/22/2030(a)(b) | |
| OHA Credit Funding 2 Ltd., Series 2019-2A, Class ER, 3 mo. USD SOFR + 6.622%, 12.034%, 4/21/2034(a)(b) | |
| OHA Credit Funding 3 Ltd., Series 2019-3A, Class ER, 3 mo. USD SOFR + 6.512%, 11.927%, 7/02/2035(a)(b) | |
| OHA Credit Funding 4 Ltd., Series 2019-4A, Class ER, 3 mo. USD SOFR + 6.662%, 12.074%, 10/22/2036(a)(b) | |
| OHA Credit Funding 5 Ltd., Series 2020-5A, Class C, 3 mo. USD SOFR + 2.262%, 7.657%, 4/18/2033(a)(b) | |
| OHA Credit Partners XVI, Series 2021-16A, Class A, 3 mo. USD SOFR + 1.412%, 6.807%, 10/18/2034(a)(b) | |
| OHA Loan Funding Ltd., Series 2016-1A, Class CR, 3 mo. USD SOFR + 2.212%, 7.627%, 1/20/2033(a)(b) | |
| OZLM XXIII Ltd., Series 2019-23A, Class DR, 3 mo. USD SOFR + 4.012%, 9.406%, 4/15/2034(a)(b) | |
| Palmer Square CLO Ltd., Series 2015-2A, Class BR2, 3 mo. USD SOFR + 2.212%, 7.627%, 7/20/2030(a)(b) | |
| Parallel Ltd., Series 2017-1A, Class CR, 3 mo. USD SOFR + 2.262%, 7.677%, 7/20/2029(a)(b) | |
| Point Au Roche Park CLO Ltd., Series 2021-1A, Class D, 3 mo. USD SOFR + 3.062%, 8.477%, 7/20/2034(a)(b) | |
| Post CLO Ltd., Series 2023-1A, Class A, 3 mo. USD SOFR + 1.950%, 7.366%, 4/20/2036(a)(b) | |
| | |
|
| Rockford Tower CLO Ltd., Series 2017-2A, Class CR, 3 mo. USD SOFR + 2.162%, 7.556%, 10/15/2029(a)(b) | |
| Rockford Tower CLO Ltd., Series 2018-1A, Class A, 3 mo. USD SOFR + 1.362%, 6.729%, 5/20/2031(a)(b) | |
| Signal Peak CLO 1 Ltd., Series 2014-1A, Class AR3, 3 mo. USD SOFR + 1.422%, 6.824%, 4/17/2034(a)(b) | |
| TCW CLO Ltd., Series 2018-1A, Class D, 3 mo. USD SOFR + 3.172%, 8.550%, 4/25/2031(a)(b) | |
| TICP CLO VII Ltd., Series 2017-7A, Class CR, 3 mo. USD SOFR + 2.412%, 7.806%, 4/15/2033(a)(b) | |
| TICP CLO XV Ltd., Series 2020-15A, Class C, 3 mo. USD SOFR + 2.412%, 7.827%, 4/20/2033(a)(b) | |
| TRESTLES CLO II Ltd., Series 2018-2A, Class D, 3 mo. USD SOFR + 6.012%, 11.390%, 7/25/2031(a)(b) | |
| Verde CLO Ltd., Series 2019-1A, Class AR, 3 mo. USD SOFR + 1.362%, 6.756%, 4/15/2032(a)(b) | |
| Total Collateralized Loan Obligations
(Identified Cost $54,288,137) | |
|
|
|
| Building Materials — 0.1% |
| Summit Materials LLC, 2023 Incremental Term Loan B, 11/30/2028(m) | |
| |
| Ziggo BV, 2019 EUR Term Loan H, 6 mo. EURIBOR + 3.000%, 6.928%, 1/31/2029, (EUR)(b)(n) | |
| Consumer Cyclical Services — 0.3% |
| Uber Technologies, Inc., 2023 Term Loan B, 3 mo. USD SOFR + 2.750%, 8.135%, 3/03/2030(b)(n) | |
| |
| Bausch & Lomb Corp., 2023 Incremental Term Loan, 1 mo. USD SOFR + 4.000%, 9.356%, 9/29/2028(b)(n) | |
| Star Parent, Inc., Term Loan B, 3 mo. USD SOFR + 4.000%, 9.348%, 9/27/2030(b)(n) | |
| | |
| |
| Carnival Corp., 2021 Incremental Term Loan B, 1 mo. USD SOFR + 3.250%, 8.720%, 10/18/2028(b)(n) | |
| Carnival Corp., 2023 Term Loan B, 1 mo. USD SOFR + 3.000%, 8.357%, 8/08/2027(b)(n) | |
| | |
| Media Entertainment — 0.7% |
| MH Sub I LLC, 2023 Term Loan, 1 mo. USD SOFR + 4.250%, 9.606%, 5/03/2028(b)(n) | |
| Playtika Holding Corp., 2021 Term Loan, 1 mo. USD SOFR + 2.750%, 8.220%, 3/13/2028(b)(n) | |
| | |
See accompanying notes to financial statements.
Portfolio of Investments – as of December 31, 2023Loomis Sayles Strategic Alpha Fund (continued) | | |
|
| Property & Casualty Insurance — 0.1% |
| AmWINS Group, Inc., 2023 Incremental Term Loan B, 1 mo. USD SOFR + 2.750%, 8.220%, 2/19/2028(b)(n) | |
| HUB International Ltd., 2023 Term Loan B, 3 mo. USD SOFR + 4.250%, 9.662%, 6/20/2030(b)(n) | |
| | |
| |
| 1011778 B.C. Unlimited Liability Co., 2023 Term Loan B5, 1 mo. USD SOFR + 2.250%, 7.606%, 9/20/2030(b)(n) | |
| |
| GTCR W Merger Sub LLC, USD Term Loan B, 9/20/2030(m) | |
| Open Text Corp., 2023 Term Loan B, 1 mo. USD SOFR + 2.750%, 8.206%, 1/31/2030(b)(n) | |
| | |
| Transportation Services — 0.1% |
| Rand Parent LLC, 2023 Term Loan B, 3 mo. USD SOFR + 4.250%, 9.598%, 3/17/2030(b)(n) | |
| Total Senior Loans
(Identified Cost $20,634,064) | |
| | |
|
| Aerospace & Defense — 0.1% |
| | |
| Air Freight & Logistics — 0.1% |
| United Parcel Service, Inc., Class B | |
| |
| | |
| |
| | |
| |
| | |
| |
| | |
| | |
| | |
| |
| | |
| Communications Equipment — 0.0% |
| | |
| Construction Materials — 0.4% |
| | |
| Consumer Staples Distribution & Retail — 0.1% |
| | |
| | |
| | |
| Containers & Packaging — 0.0% |
| Packaging Corp. of America | |
| Electric Utilities — 0.0% |
| | |
| Electrical Equipment — 0.0% |
| | |
| | |
| Financial Services — 0.0% |
| Mastercard, Inc., Class A | |
| Ground Transportation — 0.0% |
| | |
| Health Care Equipment & Supplies — 0.0% |
| | |
| Health Care Providers & Services — 0.1% |
| | |
| | |
| | |
| Hotels, Restaurants & Leisure — 0.0% |
| | |
| Household Products — 0.0% |
| | |
| |
| | |
| Life Sciences Tools & Services — 0.0% |
| Thermo Fisher Scientific, Inc. | |
| |
| | |
| |
| Altice USA, Inc., Class A(f) | |
| | |
| | |
| |
| | |
| Oil, Gas & Consumable Fuels — 0.4% |
| Canadian Natural Resources Ltd. | |
| | |
| Pioneer Natural Resources Co. | |
| | |
| | |
| |
| | |
| | |
| | |
| | |
| Semiconductors & Semiconductor Equipment — 0.1% |
| | |
| Microchip Technology, Inc. | |
| | |
| | |
| |
| | |
| |
| | |
| |
| | |
| Technology Hardware, Storage & Peripherals — 0.1% |
| | |
See accompanying notes to financial statements.
Portfolio of Investments – as of December 31, 2023Loomis Sayles Strategic Alpha Fund (continued) | | |
| Trading Companies & Distributors — 0.0% |
| | |
| Total Common Stocks
(Identified Cost $13,812,430) | |
|
|
|
|
|
Convertible Preferred Stocks — 0.3% |
| |
| El Paso Energy Capital Trust I, 4.750% | |
| |
| Clarivate PLC, Series A, 5.250% | |
| Total Convertible Preferred Stocks
(Identified Cost $2,380,317) | |
| Total Preferred Stocks
(Identified Cost $2,380,317) | |
|
|
|
| |
| ECAF I Blocker, Ltd.(c)(o)
(Identified Cost $9,000,000) | |
| Total Purchased Options — 0.0%
(Identified Cost $132,457) (see details below) | |
| | |
Short-Term Investments — 1.5% |
| Tri-Party Repurchase Agreement with Fixed Income Clearing Corporation, dated 12/29/2023 at 2.500% to be repurchased at $9,122,854 on 1/02/2024 collateralized by $9,137,300 U.S. Treasury Note, 4.125% due 9/30/2027 valued at $9,302,797 including accrued interest (Note 2 of Notes to Financial Statements)
(Identified Cost $9,120,320) | |
| Total Investments — 97.4%
(Identified Cost $690,558,623) | |
| Other assets less liabilities — 2.6% | |
| | |
Purchased Options — 0.0%
| | | | | | |
Options on Futures — 0.0% |
CBOT 5 Year U.S. Treasury Notes, Put | | | | | | |
Written Options — (0.0%)
| | | | | | |
Options on Futures — (0.0%) |
CBOT 5 Year U.S. Treasury Notes, Call | | | | | | |
| | | | | | |
Options on Securities — (0.0%) |
Abbott Laboratories, Call | | | | | | |
| | | | | | |
American Tower Corp., Call | | | | | | |
| | | | | | |
Bristol-Myers Squibb Co., Call | | | | | | |
| | | | | | |
Cisco Systems, Inc., Call | | | | | | |
| | | | | | |
| | | | | | |
Costco Wholesale Corp., Call | | | | | | |
| | | | | | |
| | | | | | |
Elevance Health, Inc., Call | | | | | | |
Emerson Electric Co., Call | | | | | | |
| | | | | | |
| | | | | | |
JPMorgan Chase & Co., Call | | | | | | |
See accompanying notes to financial statements.
Portfolio of Investments – as of December 31, 2023Loomis Sayles Strategic Alpha Fund (continued) | | | | | | |
| | | | | | |
| | | | | | |
| | | | | | |
Microchip Technology, Inc., Call | | | | | | |
| | | | | | |
| | | | | | |
| | | | | | |
Packaging Corp. of America, Call | | | | | | |
| | | | | | |
Thermo Fisher Scientific, Inc., Call | | | | | | |
Union Pacific Corp., Call | | | | | | |
United Parcel Service, Inc., Call | | | | | | |
UnitedHealth Group, Inc., Call | | | | | | |
Williams Cos., Inc., Call | | | | | | |
| | | | | | |
| | | | | | |
| See Note 2 of Notes to Financial Statements. |
| Principal Amount stated in U.S. dollars unless otherwise noted. |
| Options on securities are expressed as shares. Options on futures are expressed as contracts. |
| All or a portion of these securities are exempt from registration under Rule 144A of the Securities Act of 1933. These securities may be resold in transactions exempt from registration, normally to qualified institutional buyers. At December 31, 2023, the value of Rule 144A holdings amounted to $336,144,857 or 55.8% of net assets. |
| Variable rate security. Rate as of December 31, 2023 is disclosed. Issuers comprised of various lots with differing coupon rates have been aggregated for the purpose of presentation in the Portfolio of Investments and show a weighted average rate. Certain variable rate securities are not based on a published reference rate and spread, rather are determined by the issuer or agent and are based on current market conditions. These securities may not indicate a reference rate and/or spread in their description. |
| Level 3 security. Value has been determined using significant unobservable inputs. See Note 3 of Notes to Financial Statements. |
| Perpetual bond with no specified maturity date. |
| The issuer is in default with respect to interest and/or principal payments. Income is not being accrued. |
| Non-income producing security. |
| Interest rate represents annualized yield at time of purchase; not a coupon rate. The Fund’s investment in this security is comprised of various lots with differing annualized yields. |
| Payment–in–kind security for which the issuer, at each interest payment date, may make interest payments in cash and/or additional principal. No payments were received during the period. |
| Amount shown represents units. One unit represents a principal amount of 1,000. |
| Amount shown represents units. One unit represents a principal amount of 100. |
| Security (or a portion thereof) has been pledged as collateral for open derivative contracts. |
| Interest rate represents annualized yield at time of purchase; not a coupon rate. |
| Position is unsettled. Contract rate was not determined at December 31, 2023 and does not take effect until settlement date. Maturity date is not finalized until settlement date. |
| Stated interest rate has been determined in accordance with the provisions of the loan agreement and is subject to a minimum benchmark floor rate which may range from 0.00% to 2.50%, to which the spread is added. |
| Securities subject to restriction on resale. At December 31, 2023, the restricted securities held by the Fund are as follows: |
| |
| An American Depositary Receipt is a certificate issued by a custodian bank representing the right to receive securities of the foreign issuer described. The values of ADRs may be significantly influenced by trading on exchanges not located in the United States. |
| Euro Interbank Offered Rate |
| Johannesburg Interbank Agreed Rate |
| |
| |
| Real Estate Investment Trusts |
| Real Estate Mortgage Investment Conduits |
| South African Futures Exchange |
| |
| Secured Overnight Financing Rate |
See accompanying notes to financial statements.
Portfolio of Investments – as of December 31, 2023Loomis Sayles Strategic Alpha Fund (continued) At December 31, 2023, the Fund had the following open centrally cleared interest rate swap agreements:
At December 31, 2023, the Fund had the following open centrally cleared credit default swap agreements:
| | | | Unamortized
Up Front Premium
Paid/(Received) | | Unrealized
Appreciation
(Depreciation) |
| | | | | | |
| | | | | | |
| | | | | | |
| Notional value stated in U.S. dollars unless otherwise noted. |
| Payments are made quarterly. |
| Differences between unrealized appreciation (depreciation) and market value, if any, are due to interest booked as part of the initial trades. |
| CDX.NA.HY is an index composed of North American high yield credit default swaps. |
At December 31, 2023, the Fund had the following open forward foreign currency contracts:
| | Currency
Bought/
Sold (B/S) | | | | Unrealized
Appreciation
(Depreciation) |
| | | | | | | |
| | | | | | | |
| | | | | | | |
| | | | | | | |
Goldman Sachs International | | | | | | | |
Goldman Sachs International | | | | | | | |
| | | | | | | |
At December 31, 2023, open long futures contracts were as follows:
| | | | | Unrealized
Appreciation
(Depreciation) |
CBOT 2 Year U.S. Treasury Notes Futures | | | | | |
CBOT 5 Year U.S. Treasury Notes Futures | | | | | |
| | | | | |
At December 31, 2023, open short futures contracts were as follows:
| | | | | Unrealized
Appreciation
(Depreciation) |
CBOT U.S. Long Bond Futures | | | | | |
CME Ultra Long Term U.S. Treasury Bond Futures | | | | | |
Ultra 10-Year U.S. Treasury Notes Futures | | | | | |
| | | | | |
See accompanying notes to financial statements.
Portfolio of Investments – as of December 31, 2023Loomis Sayles Strategic Alpha Fund (continued) Industry Summary at December 31, 2023
| |
| |
| |
| |
Non-Agency Commercial Mortgage-Backed Securities | |
| |
| |
| |
| |
| |
| |
| |
| |
| |
| |
Consumer Cyclical Services | |
Other Investments, less than 2% each | |
Collateralized Loan Obligations | |
| |
| |
Other assets less liabilities (Including open written options, swap agreements, forward foreign currency and futures contracts) | |
| |
See accompanying notes to financial statements.
Portfolio of Investments – as of December 31, 2023Loomis Sayles Strategic Income Fund
| | |
Bonds and Notes — 87.3% of Net Assets |
|
|
Non-Convertible Bonds — 78.2% |
| |
| American Credit Acceptance Receivables Trust, Series 2022-4, Class C, 7.860%, 2/15/2029(a) | |
| Avis Budget Rental Car Funding AESOP LLC, Series 2019-2A, Class D, 3.040%, 9/22/2025(a) | |
| Avis Budget Rental Car Funding AESOP LLC, Series 2020-1A, Class D, 3.340%, 8/20/2026(a) | |
| First Investors Auto Owner Trust, Series 2022-2A, Class D, 8.710%, 10/16/2028(a) | |
| Hertz Vehicle Financing III LLC, Series 2022-1A, Class D, 4.850%, 6/25/2026(a) | |
| Hertz Vehicle Financing III LLC, Series 2022-3A, Class D, 6.310%, 3/25/2025(a) | |
| Hertz Vehicle Financing III LLC, Series 2023-1A, Class D2, 9.130%, 6/25/2027(a) | |
| Hertz Vehicle Financing III LLC, Series 2023-2A, Class D, 9.400%, 9/25/2029(a) | |
| Hertz Vehicle Financing LLC, Series 2022-2A, Class D, 5.160%, 6/26/2028(a) | |
| Hertz Vehicle Financing LLC, Series 2022-4A, Class D, 6.560%, 9/25/2026(a) | |
| Prestige Auto Receivables Trust, Series 2022-1A, Class D, 8.080%, 8/15/2028(a) | |
| Westlake Automobile Receivables Trust, Series 2023-1A, Class D, 6.790%, 11/15/2028(a) | |
| | |
| |
| 510 Asset-Backed Trust, Series 2021-NPL1, Class A1, 2.240%, 6/25/2061(a)(b) | |
| CoreVest American Finance Ltd., Series 2021-1, Class D, 3.247%, 4/15/2053(a) | |
| CoreVest American Finance Ltd., Series 2021-3, Class D, 3.469%, 10/15/2054(a) | |
| CoreVest American Finance Ltd., Series 2023-RTL1, Class A1, 7.553%, 12/28/2030(a)(b) | |
| Credit Suisse Mortgage Trust, Series 2021-RPL6, Class M2, 3.125%, 10/25/2060(a) | |
| FirstKey Homes Trust, Series 2020-SFR1, Class F2, 4.284%, 8/17/2037(a) | |
| FirstKey Homes Trust, Series 2021-SFR1, Class F1, 3.238%, 8/17/2038(a) | |
| GITSIT Mortgage Loan Trust, Series 2023-NPL1, Class A1, 8.353%, 5/25/2053(a)(b) | |
| Home Partners of America Trust, Series 2021-2, Class E1, 2.852%, 12/17/2026(a) | |
| | |
|
| ABS Home Equity — continued |
| Home Partners of America Trust, Series 2021-2, Class E2, 2.952%, 12/17/2026(a) | |
| Progress Residential Trust, Series 2021-SFR5, Class F, 3.158%, 7/17/2038(a) | |
| Progress Residential Trust, Series 2021-SFR6, Class F, 3.422%, 7/17/2038(a) | |
| PRPM LLC, Series 2021-4, Class A2, 3.474%, 4/25/2026(a)(b) | |
| PRPM LLC, Series 2021-5, Class A1, 1.793%, 6/25/2026(a)(b) | |
| PRPM LLC, Series 2021-9, Class A1, 2.363%, 10/25/2026(a)(b) | |
| PRPM LLC, Series 2022-5, Class A1, 6.900%, 9/27/2027(a)(b) | |
| Redwood Funding Trust, Series 2023-1, Class A, 7.500%, 7/25/2059(a)(b) | |
| Toorak Mortgage Corp. Ltd., Series 2021-1, Class A1, 3.240%, 6/25/2024(a)(b) | |
| Towd Point Mortgage Trust, Series 2017-4, Class M2, 3.250%, 6/25/2057(a)(b) | |
| Towd Point Mortgage Trust, Series 2019-4, Class M1, 3.500%, 10/25/2059(a)(b) | |
| VCAT LLC, Series 2021-NPL5, Class A2, 3.844%, 8/25/2051(a)(b) | |
| VCAT LLC, Series 2021-NPL6, Class A2, 3.967%, 9/25/2051(a)(b) | |
| | |
| |
| AASET Trust, Series 2021-2A, Class B, 3.538%, 1/15/2047(a) | |
| Castlelake Aircraft Securitization Trust, Series 2018-1, Class B, 5.300%, 6/15/2043(a) | |
| Elara HGV Timeshare Issuer LLC, Series 2021-A, Class C, 2.090%, 8/27/2035(a) | |
| Foundation Finance Trust, Series 2023-2A, Class D, 9.100%, 6/15/2049(a) | |
| Frontier Issuer LLC, Series 2023-1, Class A2, 6.600%, 8/20/2053(a) | |
| HIN Timeshare Trust, Series 2020-A, Class C, 3.420%, 10/09/2039(a) | |
| Lunar Structured Aircraft Portfolio Notes, Series 2021-1, Class B, 3.432%, 10/15/2046(a) | |
| MAPS Trust, Series 2021-1A, Class A, 2.521%, 6/15/2046(a) | |
| Navigator Aircraft ABS Ltd., Series 2021-1, Class B, 3.571%, 11/15/2046(a)(b) | |
| SCF Equipment Leasing LLC, Series 2022-2A, Class C, 6.500%, 8/20/2032(a) | |
| Shenton Aircraft Investment I Ltd., Series 2015-1A, Class A, 4.750%, 10/15/2042(a) | |
| Slam Ltd., Series 2021-1A, Class A, 2.434%, 6/15/2046(a) | |
| Willis Engine Structured Trust VI, Series 2021-A, Class A, 3.104%, 5/15/2046(a) | |
| | |
See accompanying notes to financial statements.
Portfolio of Investments – as of December 31, 2023Loomis Sayles Strategic Income Fund (continued) | | |
|
| ABS Whole Business — 0.4% |
| Applebee's Funding LLC/IHOP Funding LLC, Series 2023-1A, Class A2, 7.824%, 3/05/2053(a) | |
| FOCUS Brands Funding, Series 2023-2, Class A2, 8.241%, 10/30/2053(a) | |
| Hardee's Funding LLC, Series 2021-1A, Class A2, 2.865%, 6/20/2051(a) | |
| Planet Fitness Master Issuer LLC, Series 2019-1A, Class A2, 3.858%, 12/05/2049(a) | |
| Planet Fitness Master Issuer LLC, Series 2022-1A, Class A2I, 3.251%, 12/05/2051(a) | |
| | |
| Aerospace & Defense — 0.5% |
| Embraer Netherlands Finance BV, 7.000%, 7/28/2030(a) | |
| RTX Corp., 2.375%, 3/15/2032 | |
| RTX Corp., 5.150%, 2/27/2033 | |
| | |
| |
| American Airlines Pass-Through Trust, Series 2016-3, Class B, 3.750%, 4/15/2027 | |
| American Airlines Pass-Through Trust, Series 2017-2, Class B, 3.700%, 4/15/2027 | |
| | |
| |
| General Motors Co., 5.200%, 4/01/2045 | |
| General Motors Co., 6.250%, 10/02/2043 | |
| General Motors Financial Co., Inc., 3.100%, 1/12/2032 | |
| General Motors Financial Co., Inc., 6.400%, 1/09/2033 | |
| General Motors Financial Co., Inc., Series A, (fixed rate to 9/30/2027, variable rate thereafter), 5.750%(c) | |
| General Motors Financial Co., Inc., Series C, (fixed rate to 9/30/2030, variable rate thereafter), 5.700%(c) | |
| ZF North America Capital, Inc., 6.875%, 4/14/2028(a) | |
| ZF North America Capital, Inc., 7.125%, 4/14/2030(a) | |
| | |
| |
| AIB Group PLC, (fixed rate to 9/13/2028, variable rate thereafter), 6.608%, 9/13/2029(a) | |
| Ally Financial, Inc., 8.000%, 11/01/2031 | |
| Ally Financial, Inc., Series B, (fixed rate to 5/15/2026, variable rate thereafter), 4.700%(c) | |
| Ally Financial, Inc., Series C, (fixed rate to 5/15/2028, variable rate thereafter), 4.700%(c) | |
| Bank of America Corp., (fixed rate to 9/15/2033, variable rate thereafter), 5.872%, 9/15/2034 | |
| Barclays PLC, (fixed rate to 3/15/2028, variable rate thereafter), 4.375%(c) | |
| | |
|
| |
| Barclays PLC, (fixed rate to 9/23/2030, variable rate thereafter), 3.564%, 9/23/2035 | |
| CaixaBank SA, (fixed rate to 9/13/2033, variable rate thereafter), 6.840%, 9/13/2034(a) | |
| Deutsche Bank AG, (fixed rate to 10/07/2031, variable rate thereafter), 3.742%, 1/07/2033 | |
| Deutsche Bank AG, (fixed rate to 10/14/2030, variable rate thereafter), 3.729%, 1/14/2032 | |
| Deutsche Bank AG, (fixed rate to 12/01/2027, variable rate thereafter), 4.875%, 12/01/2032 | |
| ING Groep NV, (fixed rate to 9/11/2033, variable rate thereafter), 6.114%, 9/11/2034 | |
| Intesa Sanpaolo SpA, 7.200%, 11/28/2033(a) | |
| Morgan Stanley, (fixed rate to 1/19/2033, variable rate thereafter), 5.948%, 1/19/2038 | |
| NatWest Group PLC, (fixed rate to 8/28/2030, variable rate thereafter), 3.032%, 11/28/2035 | |
| Synchrony Bank, 5.625%, 8/23/2027 | |
| UBS Group AG, (fixed rate to 1/12/2028, variable rate thereafter), 3.869%, 1/12/2029(a) | |
| UBS Group AG, (fixed rate to 11/15/2032, variable rate thereafter), 9.016%, 11/15/2033(a) | |
| UBS Group AG, (fixed rate to 5/14/2031, variable rate thereafter), 3.091%, 5/14/2032(a) | |
| UBS Group AG, (fixed rate to 8/11/2027, variable rate thereafter), 6.442%, 8/11/2028(a) | |
| UBS Group AG, (fixed rate to 8/12/2032, variable rate thereafter), 6.537%, 8/12/2033(a) | |
| UniCredit SpA, (fixed rate to 6/30/2030, variable rate thereafter), 5.459%, 6/30/2035(a) | |
| | |
| |
| Jefferies Financial Group, Inc., 6.250%, 1/15/2036 | |
| Building Materials — 1.4% |
| Cemex SAB de CV, 3.875%, 7/11/2031(a) | |
| Cemex SAB de CV, (fixed rate to 3/14/2028, variable rate thereafter), 9.125%(a)(c) | |
| Cemex SAB de CV, (fixed rate to 6/08/2026, variable rate thereafter), 5.125%(a)(c) | |
| JELD-WEN, Inc., 4.875%, 12/15/2027(a) | |
| Masco Corp., 6.500%, 8/15/2032 | |
| | |
| |
| CCO Holdings LLC/CCO Holdings Capital Corp., 4.250%, 1/15/2034(a) | |
| CCO Holdings LLC/CCO Holdings Capital Corp., 4.750%, 2/01/2032(a) | |
| Charter Communications Operating LLC/Charter Communications Operating Capital, 2.300%, 2/01/2032 | |
| Charter Communications Operating LLC/Charter Communications Operating Capital, 2.800%, 4/01/2031 | |
See accompanying notes to financial statements.
Portfolio of Investments – as of December 31, 2023Loomis Sayles Strategic Income Fund (continued) | | |
|
| Cable Satellite — continued |
| Charter Communications Operating LLC/Charter Communications Operating Capital, 3.700%, 4/01/2051 | |
| Charter Communications Operating LLC/Charter Communications Operating Capital, 3.850%, 4/01/2061 | |
| Charter Communications Operating LLC/Charter Communications Operating Capital, 3.950%, 6/30/2062 | |
| Charter Communications Operating LLC/Charter Communications Operating Capital, 4.400%, 4/01/2033 | |
| CSC Holdings LLC, 3.375%, 2/15/2031(a) | |
| CSC Holdings LLC, 4.125%, 12/01/2030(a) | |
| CSC Holdings LLC, 4.500%, 11/15/2031(a) | |
| CSC Holdings LLC, 4.625%, 12/01/2030(a) | |
| CSC Holdings LLC, 5.000%, 11/15/2031(a) | |
| CSC Holdings LLC, 5.375%, 2/01/2028(a) | |
| CSC Holdings LLC, 5.750%, 1/15/2030(a) | |
| Directv Financing LLC/Directv Financing Co-Obligor, Inc., 5.875%, 8/15/2027(a) | |
| DISH DBS Corp., 5.125%, 6/01/2029 | |
| DISH DBS Corp., 5.250%, 12/01/2026(a) | |
| DISH DBS Corp., 5.750%, 12/01/2028(a) | |
| DISH DBS Corp., 7.750%, 7/01/2026 | |
| | |
| |
| Ashland, Inc., 3.375%, 9/01/2031(a) | |
| Braskem Netherlands Finance BV, 4.500%, 1/31/2030(a) | |
| Braskem Netherlands Finance BV, 5.875%, 1/31/2050(a) | |
| Braskem Netherlands Finance BV, 8.500%, 1/12/2031(a) | |
| Celanese U.S. Holdings LLC, 6.330%, 7/15/2029 | |
| Celanese U.S. Holdings LLC, 6.550%, 11/15/2030 | |
| Celanese U.S. Holdings LLC, 6.700%, 11/15/2033 | |
| | |
| Construction Machinery — 0.1% |
| Ashtead Capital, Inc., 5.500%, 8/11/2032(a) | |
| Ashtead Capital, Inc., 5.550%, 5/30/2033(a) | |
| | |
| Consumer Cyclical Services — 0.9% |
| Go Daddy Operating Co. LLC/GD Finance Co., Inc., 3.500%, 3/01/2029(a) | |
| TriNet Group, Inc., 3.500%, 3/01/2029(a) | |
| Uber Technologies, Inc., 4.500%, 8/15/2029(a) | |
| Uber Technologies, Inc., 6.250%, 1/15/2028(a) | |
| | |
| |
| Natura Cosmeticos SA, 4.125%, 5/03/2028(a) | |
| | |
|
| Diversified Manufacturing — 0.1% |
| Ingersoll Rand, Inc., 5.700%, 8/14/2033 | |
| Nordson Corp., 5.800%, 9/15/2033 | |
| | |
| |
| Alta Wind Holdings LLC, 7.000%, 6/30/2035(a) | |
| Enel Generacion Chile SA, 7.875%, 2/01/2027 | |
| Southern Co., 5.700%, 3/15/2034 | |
| | |
| |
| AerCap Ireland Capital DAC/AerCap Global Aviation Trust, 3.000%, 10/29/2028 | |
| AerCap Ireland Capital DAC/AerCap Global Aviation Trust, 3.300%, 1/30/2032 | |
| AerCap Ireland Capital DAC/AerCap Global Aviation Trust, 3.400%, 10/29/2033 | |
| AerCap Ireland Capital DAC/AerCap Global Aviation Trust, 5.750%, 6/06/2028 | |
| AerCap Ireland Capital DAC/AerCap Global Aviation Trust, 6.150%, 9/30/2030 | |
| Air Lease Corp., Series B, (fixed rate to 6/15/2026, variable rate thereafter), 4.650%(c) | |
| Aircastle Ltd., Series A, (fixed rate to 6/15/2026, variable rate thereafter), 5.250%(a)(c) | |
| Ares Capital Corp., 3.200%, 11/15/2031 | |
| Aviation Capital Group LLC, 1.950%, 1/30/2026(a) | |
| Aviation Capital Group LLC, 6.250%, 4/15/2028(a) | |
| Aviation Capital Group LLC, 6.750%, 10/25/2028(a) | |
| Barings BDC, Inc., 3.300%, 11/23/2026 | |
| Blue Owl Capital Corp., 2.875%, 6/11/2028 | |
| Blue Owl Capital Corp., 4.250%, 1/15/2026 | |
| GATX Corp., 5.450%, 9/15/2033 | |
| GATX Corp., 6.050%, 3/15/2034 | |
| Hercules Capital, Inc., 3.375%, 1/20/2027 | |
| Nationstar Mortgage Holdings, Inc., 5.000%, 2/01/2026(a) | |
| Nationstar Mortgage Holdings, Inc., 5.125%, 12/15/2030(a) | |
| Nationstar Mortgage Holdings, Inc., 5.500%, 8/15/2028(a) | |
| Navient Corp., 5.000%, 3/15/2027 | |
| Navient Corp., 6.750%, 6/15/2026 | |
| Navient Corp., Series A, MTN, 5.625%, 8/01/2033 | |
| OneMain Finance Corp., 3.500%, 1/15/2027 | |
| OneMain Finance Corp., 3.875%, 9/15/2028 | |
| OneMain Finance Corp., 4.000%, 9/15/2030 | |
| OneMain Finance Corp., 5.375%, 11/15/2029 | |
| OneMain Finance Corp., 7.125%, 3/15/2026 | |
| Rocket Mortgage LLC/Rocket Mortgage Co-Issuer, Inc., 2.875%, 10/15/2026(a) | |
| Rocket Mortgage LLC/Rocket Mortgage Co-Issuer, Inc., 3.625%, 3/01/2029(a) | |
See accompanying notes to financial statements.
Portfolio of Investments – as of December 31, 2023Loomis Sayles Strategic Income Fund (continued) | | |
|
| Finance Companies — continued |
| Rocket Mortgage LLC/Rocket Mortgage Co-Issuer, Inc., 3.875%, 3/01/2031(a) | |
| Rocket Mortgage LLC/Rocket Mortgage Co-Issuer, Inc., 4.000%, 10/15/2033(a) | |
| | |
| |
| Agile Group Holdings Ltd., 5.500%, 4/21/2025 | |
| Agile Group Holdings Ltd., 5.500%, 5/17/2026 | |
| Agile Group Holdings Ltd., 5.750%, 1/02/2025 | |
| Agile Group Holdings Ltd., 6.050%, 10/13/2025 | |
| Central China Real Estate Ltd., 7.250%, 7/16/2024(d) | |
| Central China Real Estate Ltd., 7.250%, 8/13/2024(d) | |
| Central China Real Estate Ltd., 7.250%, 4/28/2025(d) | |
| Central China Real Estate Ltd., 7.500%, 7/14/2025(d) | |
| Central China Real Estate Ltd., 7.650%, 8/27/2025(d) | |
| Central China Real Estate Ltd., 7.750%, 5/24/2024(d) | |
| CFLD Cayman Investment Ltd., 2.500%, 1/31/2031(a)(e) | |
| CFLD Cayman Investment Ltd., 2.500%, 1/31/2031(a)(e) | |
| CFLD Cayman Investment Ltd., Zero Coupon, 0.000%–28.181%, 1/31/2031(a)(f) | |
| China Aoyuan Group Ltd., 6.200%, 3/24/2026(d) | |
| China Aoyuan Group Ltd., 6.350%, 2/08/2024(d) | |
| China Aoyuan Group Ltd., 7.950%, 2/19/2023(d) | |
| China Evergrande Group, 8.250%, 3/23/2022(d) | |
| China Evergrande Group, 8.750%, 6/28/2025(d) | |
| China Evergrande Group, 9.500%, 4/11/2022(d) | |
| China Evergrande Group, 9.500%, 3/29/2024(d) | |
| CIFI Holdings Group Co. Ltd., 4.450%, 8/17/2026(d) | |
| Icahn Enterprises LP/Icahn Enterprises Finance Corp., 4.375%, 2/01/2029 | |
| Icahn Enterprises LP/Icahn Enterprises Finance Corp., 4.750%, 9/15/2024 | |
| Icahn Enterprises LP/Icahn Enterprises Finance Corp., 5.250%, 5/15/2027 | |
| Icahn Enterprises LP/Icahn Enterprises Finance Corp., 6.375%, 12/15/2025 | |
| Kaisa Group Holdings Ltd., 9.375%, 6/30/2024(d) | |
| Kaisa Group Holdings Ltd., 9.950%, 7/23/2025(d) | |
| Kaisa Group Holdings Ltd., 10.500%, 1/15/2025(d) | |
| Kaisa Group Holdings Ltd., 11.250%, 4/16/2025(d) | |
| | |
|
| Financial Other — continued |
| Kaisa Group Holdings Ltd., 11.650%, 6/01/2026(d) | |
| Kaisa Group Holdings Ltd., 11.700%, 11/11/2025(d) | |
| KWG Group Holdings Ltd., 6.000%, 8/14/2026(d) | |
| KWG Group Holdings Ltd., 6.300%, 2/13/2026(d) | |
| Logan Group Co. Ltd., 4.250%, 7/12/2025(d) | |
| Logan Group Co. Ltd., 4.850%, 12/14/2026(d) | |
| Shimao Group Holdings Ltd., 3.450%, 1/11/2031(d) | |
| Shimao Group Holdings Ltd., 4.600%, 7/13/2030(d) | |
| Shimao Group Holdings Ltd., 5.200%, 1/16/2027(d) | |
| Shimao Group Holdings Ltd., 5.600%, 7/15/2026(d) | |
| Shimao Group Holdings Ltd., 6.125%, 2/21/2024(d) | |
| Sunac China Holdings Ltd., 6.000% PIK or 5.000% Cash, 9/30/2026(a)(g) | |
| Sunac China Holdings Ltd., 6.250% PIK or 5.250% Cash, 9/30/2027(a)(g) | |
| Sunac China Holdings Ltd., 6.500% PIK or 5.500% Cash, 9/30/2027(a)(g) | |
| Sunac China Holdings Ltd., 6.750% PIK or 5.750% Cash, 9/30/2028(a)(g) | |
| Sunac China Holdings Ltd., 7.000% PIK or 6.000% Cash, 9/30/2029(a)(g) | |
| Sunac China Holdings Ltd., 7.250% PIK or 6.250% Cash, 9/30/2030(a)(g) | |
| Times China Holdings Ltd., 5.750%, 1/14/2027(d) | |
| Times China Holdings Ltd., 6.200%, 3/22/2026(d) | |
| Yuzhou Group Holdings Co. Ltd., 6.350%, 1/13/2027(d) | |
| Yuzhou Group Holdings Co. Ltd., 7.375%, 1/13/2026(d) | |
| Yuzhou Group Holdings Co. Ltd., 7.700%, 2/20/2025(d) | |
| Yuzhou Group Holdings Co. Ltd., 7.850%, 8/12/2026(d) | |
| Yuzhou Group Holdings Co. Ltd., 8.300%, 5/27/2025(d) | |
| Zhenro Properties Group Ltd., 6.630%, 1/07/2026(d) | |
| Zhenro Properties Group Ltd., 6.700%, 8/04/2026(d) | |
| Zhenro Properties Group Ltd., 7.350%, 2/05/2025(d) | |
| | |
| |
| Pilgrim's Pride Corp., 3.500%, 3/01/2032 | |
| Post Holdings, Inc., 4.500%, 9/15/2031(a) | |
| | |
| |
| Genm Capital Labuan Ltd., 3.882%, 4/19/2031(a) | |
See accompanying notes to financial statements.
Portfolio of Investments – as of December 31, 2023Loomis Sayles Strategic Income Fund (continued) | | |
|
| |
| GLP Capital LP/GLP Financing II, Inc., 3.250%, 1/15/2032 | |
| Light & Wonder International, Inc., 7.000%, 5/15/2028(a) | |
| Light & Wonder International, Inc., 7.250%, 11/15/2029(a) | |
| Light & Wonder International, Inc., 7.500%, 9/01/2031(a) | |
| VICI Properties LP/VICI Note Co., Inc., 4.500%, 9/01/2026(a) | |
| | |
| Government Owned - No Guarantee — 0.5% |
| Antares Holdings LP, 2.750%, 1/15/2027(a) | |
| Antares Holdings LP, 3.750%, 7/15/2027(a) | |
| Petroleos Mexicanos, 6.625%, 6/15/2035 | |
| Petroleos Mexicanos, 6.950%, 1/28/2060 | |
| | |
| |
| Centene Corp., 2.500%, 3/01/2031 | |
| Centene Corp., 3.000%, 10/15/2030 | |
| Centene Corp., 3.375%, 2/15/2030 | |
| Centene Corp., 4.625%, 12/15/2029 | |
| Molina Healthcare, Inc., 3.875%, 11/15/2030(a) | |
| Molina Healthcare, Inc., 3.875%, 5/15/2032(a) | |
| | |
| |
| Bausch & Lomb Escrow Corp., 8.375%, 10/01/2028(a) | |
| HCA, Inc., 5.500%, 6/01/2033 | |
| | |
| |
| PulteGroup, Inc., 6.000%, 2/15/2035 | |
| Independent Energy — 3.9% |
| Aker BP ASA, 4.000%, 1/15/2031(a) | |
| Civitas Resources, Inc., 8.625%, 11/01/2030(a) | |
| Continental Resources, Inc., 2.875%, 4/01/2032(a) | |
| Continental Resources, Inc., 5.750%, 1/15/2031(a) | |
| Energian Israel Finance Ltd., 5.375%, 3/30/2028(a) | |
| Energian Israel Finance Ltd., 5.875%, 3/30/2031(a) | |
| EQT Corp., 3.625%, 5/15/2031(a) | |
| EQT Corp., 5.000%, 1/15/2029 | |
| EQT Corp., 7.000%, 2/01/2030 | |
| Leviathan Bond Ltd., 6.125%, 6/30/2025(a) | |
| Leviathan Bond Ltd., 6.500%, 6/30/2027(a) | |
| Matador Resources Co., 6.875%, 4/15/2028(a) | |
| Ovintiv, Inc., 6.500%, 8/15/2034 | |
| Ovintiv, Inc., 6.500%, 2/01/2038 | |
| Ovintiv, Inc., 6.625%, 8/15/2037 | |
| Ovintiv, Inc., 7.200%, 11/01/2031 | |
| Ovintiv, Inc., 7.375%, 11/01/2031 | |
| Ovintiv, Inc., 8.125%, 9/15/2030 | |
| | |
|
| Independent Energy — continued |
| Sanchez Energy Corp., 6.125%, 1/15/2023(d) | |
| Sanchez Energy Corp., 7.750%, 6/15/2021(d) | |
| Southwestern Energy Co., 4.750%, 2/01/2032 | |
| Var Energi ASA, 8.000%, 11/15/2032(a) | |
| Viper Energy, Inc., 7.375%, 11/01/2031(a) | |
| | |
| |
| Carnival Corp., 5.750%, 3/01/2027(a) | |
| Carnival Corp., 6.000%, 5/01/2029(a) | |
| Carnival Corp., 7.000%, 8/15/2029(a) | |
| NCL Corp. Ltd., 5.875%, 3/15/2026(a) | |
| NCL Corp. Ltd., 5.875%, 2/15/2027(a) | |
| NCL Corp. Ltd., 8.125%, 1/15/2029(a) | |
| NCL Finance Ltd., 6.125%, 3/15/2028(a) | |
| Royal Caribbean Cruises Ltd., 4.250%, 7/01/2026(a) | |
| Royal Caribbean Cruises Ltd., 5.500%, 4/01/2028(a) | |
| VOC Escrow Ltd., 5.000%, 2/15/2028(a) | |
| | |
| |
| National Life Insurance Co., 10.500%, 9/15/2039(a) | |
| NLV Financial Corp., 7.500%, 8/15/2033(a) | |
| | |
| |
| Hilton Domestic Operating Co., Inc., 3.625%, 2/15/2032(a) | |
| Hilton Grand Vacations Borrower Escrow LLC/Hilton Grand Vacations Borrower Escrow, Inc., 4.875%, 7/01/2031(a) | |
| Hilton Grand Vacations Borrower Escrow LLC/Hilton Grand Vacations Borrower Escrow, Inc., 5.000%, 6/01/2029(a) | |
| Marriott Ownership Resorts, Inc., 4.500%, 6/15/2029(a) | |
| Travel & Leisure Co., 4.500%, 12/01/2029(a) | |
| Travel & Leisure Co., 4.625%, 3/01/2030(a) | |
| | |
| Media Entertainment — 1.6% |
| iHeartCommunications, Inc., 4.750%, 1/15/2028(a) | |
| iHeartCommunications, Inc., 5.250%, 8/15/2027(a) | |
| Netflix, Inc., 4.875%, 6/15/2030(a) | |
| Netflix, Inc., 5.875%, 11/15/2028 | |
| Netflix, Inc., 6.375%, 5/15/2029 | |
| Outfront Media Capital LLC/Outfront Media Capital Corp., 7.375%, 2/15/2031(a) | |
| Warnermedia Holdings, Inc., 4.279%, 3/15/2032 | |
| | |
| |
| Anglo American Capital PLC, 5.500%, 5/02/2033(a) | |
| ArcelorMittal SA, 6.750%, 3/01/2041 | |
| First Quantum Minerals Ltd., 6.875%, 3/01/2026(a) | |
See accompanying notes to financial statements.
Portfolio of Investments – as of December 31, 2023Loomis Sayles Strategic Income Fund (continued) | | |
|
| Metals & Mining — continued |
| First Quantum Minerals Ltd., 6.875%, 10/15/2027(a) | |
| Glencore Funding LLC, 2.500%, 9/01/2030(a) | |
| Glencore Funding LLC, 5.700%, 5/08/2033(a) | |
| Glencore Funding LLC, 6.125%, 10/06/2028(a) | |
| Glencore Funding LLC, 6.375%, 10/06/2030(a) | |
| Glencore Funding LLC, 6.500%, 10/06/2033(a) | |
| JSW Steel Ltd., 5.050%, 4/05/2032(a) | |
| Volcan Cia Minera SAA, 4.375%, 2/11/2026(a) | |
| | |
| |
| Cheniere Energy Partners LP, 3.250%, 1/31/2032 | |
| Cheniere Energy Partners LP, 4.000%, 3/01/2031 | |
| Hess Midstream Operations LP, 4.250%, 2/15/2030(a) | |
| Hess Midstream Operations LP, 5.625%, 2/15/2026(a) | |
| NGPL PipeCo LLC, 7.768%, 12/15/2037(a) | |
| Targa Resources Partners LP/Targa Resources Partners Finance Corp., 4.000%, 1/15/2032 | |
| Targa Resources Partners LP/Targa Resources Partners Finance Corp., 4.875%, 2/01/2031 | |
| Venture Global Calcasieu Pass LLC, 3.875%, 11/01/2033(a) | |
| Venture Global Calcasieu Pass LLC, 4.125%, 8/15/2031(a) | |
| Western Midstream Operating LP, 4.050%, 2/01/2030 | |
| Western Midstream Operating LP, 5.250%, 2/01/2050 | |
| Western Midstream Operating LP, 5.300%, 3/01/2048 | |
| Western Midstream Operating LP, 5.450%, 4/01/2044 | |
| Western Midstream Operating LP, 5.500%, 8/15/2048 | |
| Western Midstream Operating LP, 6.150%, 4/01/2033 | |
| Western Midstream Operating LP, 6.350%, 1/15/2029 | |
| | |
| |
| Southern Co. Gas Capital Corp., 5.750%, 9/15/2033 | |
| Non-Agency Commercial Mortgage-Backed |
| BBSG Mortgage Trust, Series 2016-MRP, Class A, 3.275%, 6/05/2036(a) | |
| BPR Trust, Series 2021-NRD, Class F, 1 mo. USD SOFR + 6.870%, 12.232%, 12/15/2038(a)(b) | |
| Citigroup Commercial Mortgage Trust, Series 2012-GC8, Class C, 4.942%, 9/10/2045(a)(b) | |
| | |
|
| Non-Agency Commercial Mortgage-Backed Securities — continued |
| Commercial Mortgage Pass-Through Certificates, Series 2012-LTRT, Class A2, 3.400%, 10/05/2030(a) | |
| Credit Suisse Mortgage Trust, Series 2014-USA, Class B, 4.185%, 9/15/2037(a) | |
| Credit Suisse Mortgage Trust, Series 2014-USA, Class D, 4.373%, 9/15/2037(a) | |
| DC Commercial Mortgage Trust, Series 2023-DC, Class C, 7.141%, 9/12/2040(a)(b) | |
| GS Mortgage Securities Corp. Trust, Series 2013-G1, Class B, 3.721%, 4/10/2031(a)(b) | |
| GS Mortgage Securities Corp. Trust, Series 2013-PEMB, Class C, 3.550%, 3/05/2033(a)(b) | |
| GS Mortgage Securities Trust, Series 2014-GC22, Class D, 4.685%, 6/10/2047(a)(b) | |
| JP Morgan Chase Commercial Mortgage Securities Trust, Series 2012-LC9, Class D, 3.784%, 12/15/2047(a)(b) | |
| JP Morgan Chase Commercial Mortgage Securities Trust, Series 2013-LC11, Class C, 3.958%, 4/15/2046(b) | |
| Med Trust, Series 2021-MDLN, Class C, 1 mo. USD SOFR + 1.914%, 7.277%, 11/15/2038(a)(b) | |
| Morgan Stanley Bank of America Merrill Lynch Trust, Series 2013-C11, Class B, 4.077%, 8/15/2046(b) | |
| Morgan Stanley Capital I Trust, Series 2012-C4, Class D, 5.164%, 3/15/2045(a)(b) | |
| Wells Fargo Commercial Mortgage Trust, Series 2013-LC12, Class B, 3.954%, 7/15/2046(b) | |
| Wells Fargo Commercial Mortgage Trust, Series 2014-LC16, Class B, 4.322%, 8/15/2050 | |
| WFRBS Commercial Mortgage Trust, Series 2012-C10, Class B, 3.744%, 12/15/2045 | |
| WFRBS Commercial Mortgage Trust, Series 2013-C15, Class B, 4.204%, 8/15/2046(b) | |
| WFRBS Commercial Mortgage Trust, Series 2013-C15, Class C, 4.204%, 8/15/2046(b) | |
| WFRBS Commercial Mortgage Trust, Series 2014-C20, Class B, 4.378%, 5/15/2047 | |
| | |
| |
| EPR Properties, 3.600%, 11/15/2031 | |
| |
| Bausch Health Cos., Inc., 4.875%, 6/01/2028(a) | |
| Teva Pharmaceutical Finance Co. LLC, 6.150%, 2/01/2036 | |
See accompanying notes to financial statements.
Portfolio of Investments – as of December 31, 2023Loomis Sayles Strategic Income Fund (continued) | | |
|
| Pharmaceuticals — continued |
| Teva Pharmaceutical Finance Netherlands II BV, 7.375%, 9/15/2029, (EUR) | |
| Teva Pharmaceutical Finance Netherlands II BV, 7.875%, 9/15/2031, (EUR) | |
| Teva Pharmaceutical Finance Netherlands III BV, 4.100%, 10/01/2046 | |
| Teva Pharmaceutical Finance Netherlands III BV, 4.750%, 5/09/2027 | |
| Teva Pharmaceutical Finance Netherlands III BV, 5.125%, 5/09/2029 | |
| Teva Pharmaceutical Finance Netherlands III BV, 7.875%, 9/15/2029 | |
| Teva Pharmaceutical Finance Netherlands III BV, 8.125%, 9/15/2031 | |
| | |
| Property & Casualty Insurance — 0.3% |
| MBIA Insurance Corp., 3 mo. USD SOFR + 11.522%, 16.916%, 1/15/2033(a)(e) | |
| Stewart Information Services Corp., 3.600%, 11/15/2031 | |
| | |
| |
| Yum! Brands, Inc., 4.625%, 1/31/2032 | |
| |
| Dillard's, Inc., 7.000%, 12/01/2028 | |
| Dillard's, Inc., 7.750%, 7/15/2026 | |
| Lithia Motors, Inc., 3.875%, 6/01/2029(a) | |
| Marks & Spencer PLC, 7.125%, 12/01/2037(a) | |
| | |
| |
| Republic of Uzbekistan International Bonds, 7.850%, 10/12/2028(a) | |
| |
| Avnet, Inc., 5.500%, 6/01/2032 | |
| Block, Inc., 3.500%, 6/01/2031 | |
| Broadcom, Inc., 2.450%, 2/15/2031(a) | |
| Broadcom, Inc., 2.600%, 2/15/2033(a) | |
| Broadcom, Inc., 3.137%, 11/15/2035(a) | |
| Broadcom, Inc., 3.419%, 4/15/2033(a) | |
| Broadcom, Inc., 3.469%, 4/15/2034(a) | |
| Broadcom, Inc., 4.150%, 11/15/2030 | |
| Broadcom, Inc., 4.150%, 4/15/2032(a) | |
| CDW LLC/CDW Finance Corp., 3.250%, 2/15/2029 | |
| CDW LLC/CDW Finance Corp., 3.276%, 12/01/2028 | |
| CDW LLC/CDW Finance Corp., 3.569%, 12/01/2031 | |
| CDW LLC/CDW Finance Corp., 4.250%, 4/01/2028 | |
| CommScope, Inc., 4.750%, 9/01/2029(a) | |
| Entegris Escrow Corp., 4.750%, 4/15/2029(a) | |
| Everi Holdings, Inc., 5.000%, 7/15/2029(a) | |
| Gartner, Inc., 3.625%, 6/15/2029(a) | |
| Gartner, Inc., 3.750%, 10/01/2030(a) | |
| Global Payments, Inc., 2.900%, 11/15/2031 | |
| Global Payments, Inc., 5.400%, 8/15/2032 | |
| GTCR W-2 Merger Sub LLC, 7.500%, 1/15/2031(a) | |
| Iron Mountain, Inc., 4.875%, 9/15/2029(a) | |
| | |
|
| |
| Leidos, Inc., 5.750%, 3/15/2033 | |
| Marvell Technology, Inc., 5.950%, 9/15/2033 | |
| Micron Technology, Inc., 5.875%, 2/09/2033 | |
| Micron Technology, Inc., 5.875%, 9/15/2033 | |
| MSCI, Inc., 3.250%, 8/15/2033(a) | |
| Sensata Technologies BV, 4.000%, 4/15/2029(a) | |
| Sensata Technologies BV, 5.875%, 9/01/2030(a) | |
| Sensata Technologies, Inc., 3.750%, 2/15/2031(a) | |
| VMware LLC, 2.200%, 8/15/2031 | |
| Western Digital Corp., 2.850%, 2/01/2029 | |
| Western Digital Corp., 4.750%, 2/15/2026 | |
| | |
| Transportation Services — 0.4% |
| Rand Parent LLC, 8.500%, 2/15/2030(a) | |
| |
| Brazil Notas do Tesouro Nacional, Series NTNF, 10.000%, 1/01/2029, (BRL) | |
| Indonesia Treasury Bonds, Series 101, 6.875%, 4/15/2029, (IDR) | |
| Indonesia Treasury Bonds, Series FR95, 6.375%, 8/15/2028, (IDR) | |
| Mexico Bonos, Series M, 7.500%, 5/26/2033, (MXN) | |
| Republic of South Africa Government Bonds, Series 2035, 8.875%, 2/28/2035, (ZAR) | |
| U.S. Treasury Bonds, 2.250%, 2/15/2052 | |
| U.S. Treasury Bonds, 3.250%, 5/15/2042 | |
| U.S. Treasury Bonds, 3.875%, 2/15/2043 | |
| U.S. Treasury Notes, 4.625%, 6/30/2025 | |
| Uruguay Government International Bonds, 8.250%, 5/21/2031, (UYU) | |
| | |
| |
| American Tower Corp., 5.900%, 11/15/2033 | |
| CT Trust, 5.125%, 2/03/2032(a) | |
| IHS Holding Ltd., 5.625%, 11/29/2026(a) | |
| SBA Communications Corp., 3.125%, 2/01/2029 | |
| SoftBank Group Corp., 4.625%, 7/06/2028 | |
| Sprint Capital Corp., 8.750%, 3/15/2032 | |
| T-Mobile USA, Inc., 5.750%, 1/15/2034 | |
| | |
| |
| Cincinnati Bell Telephone Co. LLC, 6.300%, 12/01/2028 | |
| Liquid Telecommunications Financing PLC, 5.500%, 9/04/2026(a) | |
| Telecom Italia Capital SA, 6.000%, 9/30/2034 | |
| Telecom Italia Capital SA, 6.375%, 11/15/2033 | |
| | |
| Total Non-Convertible Bonds
(Identified Cost $2,551,680,141) | |
|
|
|
| |
| Southwest Airlines Co., 1.250%, 5/01/2025 | |
See accompanying notes to financial statements.
Portfolio of Investments – as of December 31, 2023Loomis Sayles Strategic Income Fund (continued) | | |
|
| |
| DISH Network Corp., 3.375%, 8/15/2026 | |
| Consumer Cyclical Services — 0.5% |
| Uber Technologies, Inc., Zero Coupon, 0.000%–1.922%, 12/15/2025(f) | |
| Zillow Group, Inc., 1.375%, 9/01/2026 | |
| | |
| |
| PPL Capital Funding, Inc., 2.875%, 3/15/2028(a) | |
| |
| Sunac China Holdings Ltd., 7.800% PIK or 7.800% Cash, 9/30/2032(a)(g) | |
| |
| Penn Entertainment, Inc., 2.750%, 5/15/2026 | |
| |
| Envista Holdings Corp., 1.750%, 8/15/2028(a) | |
| Teladoc Health, Inc., 1.250%, 6/01/2027 | |
| | |
| |
| NCL Corp. Ltd., 1.125%, 2/15/2027 | |
| Media Entertainment — 0.2% |
| Spotify USA, Inc., Zero Coupon, 5.189%–5.873%, 3/15/2026(f) | |
| |
| BioMarin Pharmaceutical, Inc., 0.599%, 8/01/2024 | |
| BioMarin Pharmaceutical, Inc., 1.250%, 5/15/2027 | |
| | |
| |
| Etsy, Inc., 0.125%, 9/01/2027 | |
| Etsy, Inc., 0.250%, 6/15/2028 | |
| | |
| |
| Splunk, Inc., 1.125%, 6/15/2027 | |
| Unity Software, Inc., Zero Coupon, 7.084%–8.213%, 11/15/2026(f) | |
| Wolfspeed, Inc., 0.250%, 2/15/2028 | |
| Wolfspeed, Inc., 1.875%, 12/01/2029 | |
| | |
| Total Convertible Bonds
(Identified Cost $288,768,623) | |
|
|
|
| |
| Tobacco Settlement Financing Corp., 6.706%, 6/01/2046
(Identified Cost $62,549,774) | |
| Total Bonds and Notes
(Identified Cost $2,902,998,538) | |
| | |
|
| Aerospace & Defense — 0.1% |
| | |
| | |
| Air Freight & Logistics — 0.1% |
| United Parcel Service, Inc., Class B | |
| |
| | |
| |
| | |
| |
| | |
| |
| | |
| | |
| | |
| |
| | |
| Communications Equipment — 0.0% |
| | |
| Consumer Staples Distribution & Retail — 0.2% |
| | |
| | |
| | |
| Containers & Packaging — 0.0% |
| Packaging Corp. of America | |
| |
| NexPoint Diversified Real Estate Trust | |
| Electric Utilities — 0.0% |
| | |
| Electrical Equipment — 0.0% |
| | |
| Financial Services — 0.0% |
| Mastercard, Inc., Class A | |
| Ground Transportation — 0.1% |
| | |
| Health Care Equipment & Supplies — 0.1% |
| | |
| Health Care Providers & Services — 0.2% |
| | |
| | |
| | |
| Hotels, Restaurants & Leisure — 0.1% |
| | |
| Household Products — 0.1% |
| | |
| |
| | |
| Life Sciences Tools & Services — 0.1% |
| Thermo Fisher Scientific, Inc. | |
| |
| | |
| |
| Altice USA, Inc., Class A(e) | |
| | |
| iHeartMedia, Inc., Class A(e) | |
| | |
| |
| | |
See accompanying notes to financial statements.
Portfolio of Investments – as of December 31, 2023Loomis Sayles Strategic Income Fund (continued) | | |
| Oil, Gas & Consumable Fuels — 0.8% |
| | |
| Canadian Natural Resources Ltd. | |
| | |
| Pioneer Natural Resources Co. | |
| | |
| | |
| |
| | |
| | |
| | |
| | |
| Professional Services — 0.0% |
| | |
| Semiconductors & Semiconductor Equipment — 0.3% |
| | |
| Microchip Technology, Inc. | |
| | |
| | |
| |
| | |
| |
| | |
| |
| | |
| Technology Hardware, Storage & Peripherals — 0.1% |
| | |
| | |
| | |
| Trading Companies & Distributors — 0.0% |
| | |
| Total Common Stocks
(Identified Cost $140,162,179) | |
| | |
Collateralized Loan Obligations — 3.9% |
| 522 Funding CLO Ltd., Series 2018-3A, Class DR, 3 mo. USD SOFR + 3.362%, 8.777%, 10/20/2031(a)(b) | |
| AGL CLO 12 Ltd., Series 2021-12A, Class B, 3 mo. USD SOFR + 1.862%, 7.277%, 7/20/2034(a)(b) | |
| AGL CLO 12 Ltd., Series 2021-12A, Class D, 3 mo. USD SOFR + 3.112%, 8.527%, 7/20/2034(a)(b) | |
| AGL CLO 7 Ltd., Series 2020-7A, Class DR, 3 mo. USD SOFR + 3.362%, 8.756%, 7/15/2034(a)(b) | |
| ARES Loan Funding I Ltd., Series 2021-ALFA, Class D, 3 mo. USD SOFR + 3.262%, 8.656%, 10/15/2034(a)(b) | |
| Bain Capital Credit CLO Ltd., Series 2017-2A, Class DR2, 3 mo. USD SOFR + 3.362%, 8.740%, 7/25/2034(a)(b) | |
| Ballyrock CLO Ltd., Series 2019-2A, Class A2R, 3 mo. USD SOFR + 1.662%, 7.029%, 11/20/2030(a)(b) | |
| | |
| Benefit Street Partners CLO XVI Ltd., Series 2018-16A, Class DR, 3 mo. USD SOFR + 3.262%, 8.664%, 1/17/2032(a)(b) | |
| CarVal CLO III Ltd., Series 2019-2A, Class DR, 3 mo. USD SOFR + 3.212%, 8.627%, 7/20/2032(a)(b) | |
| CIFC Funding Ltd., Series 2021-5A, Class D, 3 mo. USD SOFR + 3.512%, 8.906%, 7/15/2034(a)(b) | |
| Clover CLO LLC, Series 2021-1A, Class D, 3 mo. USD SOFR + 3.212%, 8.624%, 4/22/2034(a)(b) | |
| Clover CLO LLC, Series 2021-2A, Class D, 3 mo. USD SOFR + 3.312%, 8.727%, 7/20/2034(a)(b) | |
| Crown City CLO I, Series 2020-1A, Class CR, 3 mo. USD SOFR + 3.682%, 9.097%, 7/20/2034(a)(b) | |
| Elmwood CLO VIII Ltd., Series 2021-1A, Class D2, 3 mo. USD SOFR + 3.112%, 8.527%, 1/20/2034(a)(b) | |
| LCM 30 Ltd., Series 30A, Class CR, 3 mo. USD SOFR + 2.262%, 7.677%, 4/20/2031(a)(b) | |
| LCM 30 Ltd., Series 30A, Class DR, 3 mo. USD SOFR + 3.262%, 8.677%, 4/20/2031(a)(b) | |
| Madison Park Funding XXIII Ltd., Series 2017-23A, Class DR, 3 mo. USD SOFR + 3.462%, 8.849%, 7/27/2031(a)(b) | |
| Madison Park Funding XXXI Ltd., Series 2018-31A, Class D, 3 mo. USD SOFR + 3.262%, 8.674%, 1/23/2031(a)(b) | |
| Neuberger Berman CLO XX Ltd., Series 2015-20A, Class BRR, 3 mo. USD SOFR + 1.912%, 7.306%, 7/15/2034(a)(b) | |
| OCP CLO Ltd., Series 2019-17A, Class DR, 3 mo. USD SOFR + 3.362%, 8.777%, 7/20/2032(a)(b) | |
| Octagon Investment Partners 42 Ltd., Series 2019-3A, Class DR, 3 mo. USD SOFR + 3.412%, 8.806%, 7/15/2034(a)(b) | |
| Octagon Investment Partners 46 Ltd., Series 2020-2A, Class DR, 3 mo. USD SOFR + 3.562%, 8.956%, 7/15/2036(a)(b) | |
| OHA Credit Funding 3 Ltd., Series 2019-3A, Class BR, 3 mo. USD SOFR + 1.912%, 7.327%, 7/02/2035(a)(b) | |
| Palmer Square CLO Ltd., Series 2015-1A, Class A2R4, 3 mo. USD SOFR + 1.962%, 7.329%, 5/21/2034(a)(b) | |
| Palmer Square CLO Ltd., Series 2021-4A, Class E, 3 mo. USD SOFR + 6.312%, 11.706%, 10/15/2034(a)(b) | |
| THL Credit Wind River CLO Ltd., Series 2018-3A, Class D, 3 mo. USD SOFR + 3.212%, 8.627%, 1/20/2031(a)(b) | |
| Vibrant CLO XIV Ltd., Series 2021-14A, Class C, 3 mo. USD SOFR + 4.012%, 9.427%, 10/20/2034(a)(b) | |
| Total Collateralized Loan Obligations
(Identified Cost $111,557,561) | |
See accompanying notes to financial statements.
Portfolio of Investments – as of December 31, 2023Loomis Sayles Strategic Income Fund (continued)
| | |
|
|
|
Convertible Preferred Stocks — 1.0% |
| |
| Bank of America Corp., Series L, 7.250% | |
| Wells Fargo & Co., Series L, Class A, 7.500% | |
| | |
| |
| El Paso Energy Capital Trust I, 4.750% | |
| |
| Clarivate PLC, Series A, 5.250% | |
| Total Convertible Preferred Stocks
(Identified Cost $36,508,529) | |
|
|
Non-Convertible Preferred Stocks — 0.4% |
| |
| Hovnanian Enterprises, Inc., 7.625% | |
| |
| Highwoods Properties, Inc., Series A, 8.625%(j) | |
| |
| Prologis, Inc., Series Q, 8.540% | |
| Total Non-Convertible Preferred Stocks
(Identified Cost $8,332,902) | |
| Total Preferred Stocks
(Identified Cost $44,841,431) | |
| | |
|
| Aerospace & Defense — 0.0% |
| TransDigm, Inc., 2023 Term Loan J, 2/14/2031(k) | |
| Building Materials — 0.2% |
| Summit Materials LLC, 2023 Incremental Term Loan B, 11/30/2028(k) | |
| Consumer Cyclical Services — 0.1% |
| Uber Technologies, Inc., 2023 Term Loan B, 3 mo. USD SOFR + 2.750%, 8.135%, 3/03/2030(b)(l) | |
| |
| Bausch & Lomb Corp., 2023 Incremental Term Loan, 1 mo. USD SOFR + 4.000%, 9.356%, 9/29/2028(b)(l) | |
| Star Parent, Inc., Term Loan B, 3 mo. USD SOFR + 4.000%, 9.348%, 9/27/2030(b)(l) | |
| | |
| |
| Carnival Corp., 2021 Incremental Term Loan B, 1 mo. USD SOFR + 3.250%, 8.720%, 10/18/2028(b)(l) | |
| Carnival Corp., 2023 Term Loan B, 1 mo. USD SOFR + 3.000%, 8.357%, 8/08/2027(b)(l) | |
| | |
| Property & Casualty Insurance — 0.1% |
| HUB International Ltd., 2023 Term Loan B, 3 mo. USD SOFR + 4.250%, 9.662%, 6/20/2030(b)(l) | |
| | |
| |
| 1011778 B.C. Unlimited Liability Co., 2023 Term Loan B5, 1 mo. USD SOFR + 2.250%, 7.606%, 9/20/2030(b)(l) | |
| |
| GTCR W Merger Sub LLC, USD Term Loan B, 9/20/2030(k) | |
| Total Senior Loans
(Identified Cost $40,511,208) | |
|
|
Short-Term Investments — 1.4% |
| Tri-Party Repurchase Agreement with Fixed Income Clearing Corporation, dated 12/29/2023 at 2.500% to be repurchased at $33,435,401 on 1/02/2024 collateralized by $38,121,700 U.S. Treasury Note, 0.500% due 4/30/2027 valued at $34,094,719 including accrued interest (Note 2 of Notes to Financial Statements) | |
| U.S. Treasury Bills, 5.242%, 5/02/2024(m) | |
| Total Short-Term Investments
(Identified Cost $39,000,312) | |
| Total Investments — 99.3%
(Identified Cost $3,279,071,229) | |
| Other assets less liabilities — 0.7% | |
| | |
| See Note 2 of Notes to Financial Statements. |
| Principal Amount stated in U.S. dollars unless otherwise noted. |
| All or a portion of these securities are exempt from registration under Rule 144A of the Securities Act of 1933. These securities may be resold in transactions exempt from registration, normally to qualified institutional buyers. At December 31, 2023, the value of Rule 144A holdings amounted to $1,249,566,924 or 43.8% of net assets. |
| Variable rate security. Rate as of December 31, 2023 is disclosed. Issuers comprised of various lots with differing coupon rates have been aggregated for the purpose of presentation in the Portfolio of Investments and show a weighted average rate. Certain variable rate securities are not based on a published reference rate and spread, rather are determined by the issuer or agent and are based on current market conditions. These securities may not indicate a reference rate and/or spread in their description. |
| Perpetual bond with no specified maturity date. |
| The issuer is in default with respect to interest and/or principal payments. Income is not being accrued. |
| Non-income producing security. |
| Interest rate represents annualized yield at time of purchase; not a coupon rate. The Fund’s investment in this security is comprised of various lots with differing annualized yields. |
| Payment–in–kind security for which the issuer, at each interest payment date, may make interest payments in cash and/or additional principal. No payments were received during the period. |
| Amount shown represents units. One unit represents a principal amount of 1,000. |
| Amount shown represents units. One unit represents a principal amount of 100. |
See accompanying notes to financial statements.
Portfolio of Investments – as of December 31, 2023Loomis Sayles Strategic Income Fund (continued) | Level 3 security. Value has been determined using significant unobservable inputs. See Note 3 of Notes to Financial Statements. |
| Position is unsettled. Contract rate was not determined at December 31, 2023 and does not take effect until settlement date. Maturity date is not finalized until settlement date. |
| Stated interest rate has been determined in accordance with the provisions of the loan agreement and is subject to a minimum benchmark floor rate which may range from 0.00% to 2.50%, to which the spread is added. |
| Interest rate represents discount rate at time of purchase; not a coupon rate. |
| |
| |
| |
| Real Estate Investment Trusts |
| Secured Overnight Financing Rate |
At December 31, 2023, the Fund had the following open forward foreign currency contracts:
| | Currency
Bought/
Sold (B/S) | | | | Unrealized
Appreciation
(Depreciation) |
| | | | | | | |
At December 31, 2023, open long futures contracts were as follows:
| | | | | Unrealized
Appreciation
(Depreciation) |
CBOT 2 Year U.S. Treasury Notes Futures | | | | | |
CBOT 5 Year U.S. Treasury Notes Futures | | | | | |
CBOT U.S. Long Bond Futures | | | | | |
| | | | | |
At December 31, 2023, open short futures contracts were as follows:
| | | | | Unrealized
Appreciation
(Depreciation) |
CME Ultra Long Term U.S. Treasury Bond Futures | | | | | |
Ultra 10-Year U.S. Treasury Notes Futures | | | | | |
| | | | | |
See accompanying notes to financial statements.
Portfolio of Investments – as of December 31, 2023Loomis Sayles Strategic Income Fund (continued) Industry Summary at December 31, 2023
| |
| |
| |
| |
| |
| |
| |
| |
| |
| |
| |
| |
Other Investments, less than 2% each | |
Collateralized Loan Obligations | |
| |
| |
Other assets less liabilities (including forward foreign currency and futures contracts) | |
| |
See accompanying notes to financial statements.
Statements of Assets and Liabilities
| | | | |
| | | | |
| | | | |
Net unrealized depreciation | | | | |
| | | | |
| | | | |
Due from brokers (Note 2) | | | | |
Foreign currency at value (identified cost $285, $0, $2,410,831 and $146, respectively) | | | | |
Receivable for Fund shares sold | | | | |
Receivable from investment adviser (Note 6) | | | | |
Receivable for securities sold | | | | |
Dividends and interest receivable | | | | |
Unrealized appreciation on forward foreign currency contracts (Note 2) | | | | |
| | | | |
Receivable for variation margin on centrally cleared swap agreements (Note 2) | | | | |
Receivable for variation margin on futures contracts (Note 2) | | | | |
Prepaid expenses (Note 8) | | | | |
| | | | |
| | | | |
Options written, at value (premiums received $0, $0, $196,420 and $0, respectively) (Note 2) | | | | |
Payable for securities purchased | | | | |
Payable for Fund shares redeemed | | | | |
Payable for variation margin on centrally cleared swap agreements (Note 2) | | | | |
Unrealized depreciation on forward foreign currency contracts (Note 2) | | | | |
Foreign taxes payable (Note 2) | | | | |
Management fees payable (Note 6) | | | | |
Deferred Trustees’ fees (Note 6) | | | | |
Administrative fees payable (Note 6) | | | | |
Payable to distributor (Note 6d) | | | | |
Audit and tax services fees payable | | | | |
Other accounts payable and accrued expenses | | | | |
| | | | |
COMMITMENTS AND CONTINGENCIES(a) | | | | |
| | | | |
| | | | |
| | | | |
| | | | |
| | | | |
See accompanying notes to financial statements.
Statements of Assets and Liabilities (continued)
| | | | |
COMPUTATION OF NET ASSET VALUE AND OFFERING PRICE: | | | | |
| | | | |
| | | | |
Shares of beneficial interest | | | | |
Net asset value and redemption price per share | | | | |
Offering price per share (100/95.75 of net asset value) (Note 1) | | | | |
Class C shares: (redemption price per share is equal to net asset value less any applicable contingent deferred sales charge) (Note 1) | | | | |
| | | | |
Shares of beneficial interest | | | | |
Net asset value and offering price per share | | | | |
| | | | |
| | | | |
Shares of beneficial interest | | | | |
Net asset value, offering and redemption price per share | | | | |
| | | | |
| | | | |
Shares of beneficial interest | | | | |
Net asset value, offering and redemption price per share | | | | |
| | | | |
| | | | |
Shares of beneficial interest | | | | |
Net asset value, offering and redemption price per share | | | | |
| As disclosed in the Notes to Financial Statements, if applicable. |
See accompanying notes to financial statements.
For the Year Ended December 31, 2023
| | | | |
| | | | |
| | | | |
| | | | |
Less net foreign taxes withheld | | | | |
| | | | |
| | | | |
| | | | |
Service and distribution fees (Note 6) | | | | |
Administrative fees (Note 6) | | | | |
Trustees' fees and expenses (Note 6) | | | | |
Transfer agent fees and expenses (Notes 6 and 7) | | | | |
Audit and tax services fees | | | | |
Custodian fees and expenses | | | | |
| | | | |
| | | | |
Shareholder reporting expenses | | | | |
| | | | |
| | | | |
Less waiver and/or expense reimbursement (Note 6) | | | | |
| | | | |
| | | | |
Net realized and unrealized gain (loss) on Investments, Futures contracts, Options written, Swap agreements, Forward foreign currency contracts and Foreign currency transactions | | | | |
Net realized gain (loss) on: | | | | |
| | | | |
| | | | |
| | | | |
| | | | |
Forward foreign currency contracts (Note 2d) | | | | |
Foreign currency transactions (Note 2c) | | | | |
Net change in unrealized appreciation (depreciation) on: | | | | |
| | | | |
| | | | |
| | | | |
| | | | |
Forward foreign currency contracts (Note 2d) | | | | |
Foreign currency translations (Note 2c) | | | | |
Net realized and unrealized gain on Investments, Futures contracts, Options written, Swap agreements, Forward foreign currency contracts and Foreign currency transactions | | | | |
NET INCREASE IN NET ASSETS RESULTING FROM OPERATIONS | | | | |
See accompanying notes to financial statements.
Statements of Changes in Net Assets
| | Investment Grade Bond Fund |
| Year Ended
December 31,2023 | Year Ended
December 31,2022 | Year Ended
December 31,2023 | Year Ended
December 31,2022 |
| | | | |
| | | | |
Net realized loss on investments, futures contracts, swap agreements and foreign currency transactions | | | | |
Net change in unrealized appreciation (depreciation) on investments, futures contracts, swap agreements and foreign currency translations | | | | |
Net increase (decrease) in net assets resulting from operations | | | | |
FROM DISTRIBUTIONS TO SHAREHOLDERS: | | | | |
| | | | |
| | | | |
| | | | |
| | | | |
| | | | |
| | | | |
NET INCREASE (DECREASE) IN NET ASSETS FROM CAPITAL
SHARES TRANSACTIONS (Note 11) | | | | |
Net increase (decrease) in net assets | | | | |
| | | | |
| | | | |
| | | | |
See accompanying notes to financial statements.
Statements of Changes in Net Assets (continued)
| | |
| Year Ended
December 31,2023 | Year Ended
December 31,2022 | Year Ended
December 31,2023 | Year Ended
December 31,2022 |
| | | | |
| | | | |
Net realized loss on investments, futures contracts, swap agreements, written options, forward foreign currency contracts and foreign currency transactions | | | | |
Net change in unrealized appreciation (depreciation) on investments, futures contracts, swap agreements, written options, forward foreign currency contracts and foreign currency translations | | | | |
Net increase (decrease) in net assets resulting from operations | | | | |
FROM DISTRIBUTIONS TO SHAREHOLDERS: | | | | |
| | | | |
| | | | |
| | | | |
| | | | |
| | | | |
| | | | |
NET DECREASE IN NET ASSETS FROM CAPITAL
SHARES TRANSACTIONS (Note 11) | | | | |
Net decrease in net assets | | | | |
| | | | |
| | | | |
| | | | |
See accompanying notes to financial statements.
For a share outstanding throughout each period.
| |
| Year Ended
December 31,
2023 | Year Ended
December 31,
2022 | Year Ended
December 31,
2021 | Year Ended
December 31,
2020 | Year Ended
December 31,
2019 |
Net asset value, beginning of the period | | | | | |
INCOME (LOSS) FROM INVESTMENT OPERATIONS: | | | | | |
| | | | | |
Net realized and unrealized gain (loss) | | | | | |
Total from Investment Operations | | | | | |
| | | | | |
| | | | | |
Net asset value, end of the period | | | | | |
| | | | | |
RATIOS TO AVERAGE NET ASSETS: | | | | | |
Net assets, end of the period (000's) | | | | | |
| | | | | |
| | | | | |
| | | | | |
| | | | | |
| Per share net investment income has been calculated using the average shares outstanding during the period. |
| The amount shown for a share outstanding does not correspond with the aggregate realized and unrealized gain (loss) on investments for the period due to the timing of sales and redemptions of fund shares in relation to fluctuating market values of investments of the Fund. |
| A sales charge for Class A shares is not reflected in total return calculations. |
| Had certain expenses not been waived/reimbursed during the period, total returns would have been lower. |
| The investment adviser agreed to waive its fees and/or reimburse a portion of the Fund’s expenses during the period. Without this waiver/reimbursement, expenses would have been higher. |
| Effective July 1, 2023, the expense limit decreased from 1.00% to 0.95%. See Note 6 of Notes to Financial Statements. |
| Effective July 1, 2019, the expense limit decreased from 1.05% to 1.00%. |
| The variation in the Fund’s turnover rate from 2019 to 2020 was primarily due to a significant repositioning of the portfolio as a result of increased market volatility. |
See accompanying notes to financial statements.
Financial Highlights (continued)
For a share outstanding throughout each period.
| |
| Year Ended
December 31,
2023 | Year Ended
December 31,
2022 | Year Ended
December 31,
2021 | Year Ended
December 31,
2020 | Year Ended
December 31,
2019 |
Net asset value, beginning of the period | | | | | |
INCOME (LOSS) FROM INVESTMENT OPERATIONS: | | | | | |
| | | | | |
Net realized and unrealized gain (loss) | | | | | |
Total from Investment Operations | | | | | |
| | | | | |
| | | | | |
Net asset value, end of the period | | | | | |
| | | | | |
RATIOS TO AVERAGE NET ASSETS: | | | | | |
Net assets, end of the period (000's) | | | | | |
| | | | | |
| | | | | |
| | | | | |
| | | | | |
| Per share net investment income has been calculated using the average shares outstanding during the period. |
| The amount shown for a share outstanding does not correspond with the aggregate realized and unrealized gain (loss) on investments for the period due to the timing of sales and redemptions of fund shares in relation to fluctuating market values of investments of the Fund. |
| A contingent deferred sales charge for Class C shares is not reflected in total return calculations. |
| Had certain expenses not been waived/reimbursed during the period, total returns would have been lower. |
| The investment adviser agreed to waive its fees and/or reimburse a portion of the Fund’s expenses during the period. Without this waiver/reimbursement, expenses would have been higher. |
| Effective July 1, 2023, the expense limit decreased from 1.75% to 1.70%. See Note 6 of Notes to Financial Statements. |
| Effective July 1, 2019, the expense limit decreased from 1.80% to 1.75%. |
| The variation in the Fund’s turnover rate from 2019 to 2020 was primarily due to a significant repositioning of the portfolio as a result of increased market volatility. |
See accompanying notes to financial statements.
Financial Highlights (continued)
For a share outstanding throughout each period.
| |
| Year Ended
December 31,
2023 | Year Ended
December 31,
2022 | Year Ended
December 31,
2021 | Year Ended
December 31,
2020 | Year Ended
December 31,
2019 |
Net asset value, beginning of the period | | | | | |
INCOME (LOSS) FROM INVESTMENT OPERATIONS: | | | | | |
| | | | | |
Net realized and unrealized gain (loss) | | | | | |
Total from Investment Operations | | | | | |
| | | | | |
| | | | | |
Net asset value, end of the period | | | | | |
| | | | | |
RATIOS TO AVERAGE NET ASSETS: | | | | | |
Net assets, end of the period (000's) | | | | | |
| | | | | |
| | | | | |
| | | | | |
| | | | | |
| Per share net investment income has been calculated using the average shares outstanding during the period. |
| The amount shown for a share outstanding does not correspond with the aggregate realized and unrealized gain (loss) on investments for the period due to the timing of sales and redemptions of fund shares in relation to fluctuating market values of investments of the Fund. |
| Had certain expenses not been waived/reimbursed during the period, total returns would have been lower. |
| The investment adviser agreed to waive its fees and/or reimburse a portion of the Fund’s expenses during the period. Without this waiver/reimbursement, expenses would have been higher. |
| Effective July 1, 2023, the expense limit decreased from 0.70% to 0.65%. See Note 6 of Notes to Financial Statements. |
| Effective July 1, 2019, the expense limit decreased from 0.75% to 0.70%. |
| The variation in the Fund’s turnover rate from 2019 to 2020 was primarily due to a significant repositioning of the portfolio as a result of increased market volatility. |
See accompanying notes to financial statements.
Financial Highlights (continued)
For a share outstanding throughout each period.
| |
| Year Ended
December 31,
2023 | Year Ended
December 31,
2022 | Year Ended
December 31,
2021 | Year Ended
December 31,
2020 | Year Ended
December 31,
2019 |
Net asset value, beginning of the period | | | | | |
INCOME (LOSS) FROM INVESTMENT OPERATIONS: | | | | | |
| | | | | |
Net realized and unrealized gain (loss) | | | | | |
Total from Investment Operations | | | | | |
| | | | | |
| | | | | |
Net asset value, end of the period | | | | | |
| | | | | |
RATIOS TO AVERAGE NET ASSETS: | | | | | |
Net assets, end of the period (000's) | | | | | |
| | | | | |
| | | | | |
| | | | | |
| | | | | |
| Per share net investment income has been calculated using the average shares outstanding during the period. |
| The amount shown for a share outstanding does not correspond with the aggregate realized and unrealized gain (loss) on investments for the period due to the timing of sales and redemptions of fund shares in relation to fluctuating market values of investments of the Fund. |
| Had certain expenses not been waived/reimbursed during the period, total returns would have been lower. |
| The investment adviser agreed to waive its fees and/or reimburse a portion of the Fund’s expenses during the period. Without this waiver/reimbursement, expenses would have been higher. |
| Effective July 1, 2023, the expense limit decreased from 0.75% to 0.70%. See Note 6 of Notes to Financial Statements. |
| Effective July 1, 2019, the expense limit decreased from 0.80% to 0.75%. |
| The variation in the Fund’s turnover rate from 2019 to 2020 was primarily due to a significant repositioning of the portfolio as a result of increased market volatility. |
See accompanying notes to financial statements.
Financial Highlights (continued)
For a share outstanding throughout each period.
| Investment Grade Bond Fund—Class A |
| Year Ended
December 31,
2023 | Year Ended
December 31,
2022 | Year Ended
December 31,
2021 | Year Ended
December 31,
2020 | Year Ended
December 31,
2019 |
Net asset value, beginning of the period | | | | | |
INCOME (LOSS) FROM INVESTMENT OPERATIONS: | | | | | |
| | | | | |
Net realized and unrealized gain (loss) | | | | | |
Total from Investment Operations | | | | | |
| | | | | |
| | | | | |
Net realized capital gains | | | | | |
| | | | | |
Net asset value, end of the period | | | | | |
| | | | | |
RATIOS TO AVERAGE NET ASSETS: | | | | | |
Net assets, end of the period (000's) | | | | | |
| | | | | |
| | | | | |
| | | | | |
| | | | | |
| Per share net investment income has been calculated using the average shares outstanding during the period. |
| Amount rounds to less than $0.01 per share. |
| A sales charge for Class A shares is not reflected in total return calculations. |
| Had certain expenses not been waived/reimbursed during the period, total returns would have been lower. |
| The investment adviser agreed to waive its fees and/or reimburse a portion of the Fund’s expenses during the period. Without this waiver/reimbursement, expenses would have been higher. |
| Effective July 1, 2022, the expense limit decreased from 0.75% to 0.74%. |
| Effective July 1, 2020, the expense limit decreased from 0.76% to 0.75%. |
| Effective July 1, 2019, the expense limit decreased from 0.78% to 0.76%. |
| The variation in the Fund’s turnover rate from 2019 to 2020 was primarily due to a significant repositioning of the portfolio as a result of increased market volatility. |
See accompanying notes to financial statements.
Financial Highlights (continued)
For a share outstanding throughout each period.
| Investment Grade Bond Fund—Class C |
| Year Ended
December 31,
2023 | Year Ended
December 31,
2022 | Year Ended
December 31,
2021 | Year Ended
December 31,
2020 | Year Ended
December 31,
2019 |
Net asset value, beginning of the period | | | | | |
INCOME (LOSS) FROM INVESTMENT OPERATIONS: | | | | | |
| | | | | |
Net realized and unrealized gain (loss) | | | | | |
Total from Investment Operations | | | | | |
| | | | | |
| | | | | |
Net realized capital gains | | | | | |
| | | | | |
Net asset value, end of the period | | | | | |
| | | | | |
RATIOS TO AVERAGE NET ASSETS: | | | | | |
Net assets, end of the period (000's) | | | | | |
| | | | | |
| | | | | |
| | | | | |
| | | | | |
| Per share net investment income has been calculated using the average shares outstanding during the period. |
| A contingent deferred sales charge for Class C shares is not reflected in total return calculations. |
| Had certain expenses not been waived/reimbursed during the period, total returns would have been lower. |
| The investment adviser agreed to waive its fees and/or reimburse a portion of the Fund’s expenses during the period. Without this waiver/reimbursement, expenses would have been higher. |
| Effective July 1, 2022, the expense limit decreased from 1.50% to 1.49%. |
| Effective July 1, 2020, the expense limit decreased from 1.51% to 1.50%. |
| Effective July 1, 2019, the expense limit decreased from 1.53% to 1.51%. |
| The variation in the Fund’s turnover rate from 2019 to 2020 was primarily due to a significant repositioning of the portfolio as a result of increased market volatility. |
See accompanying notes to financial statements.
Financial Highlights (continued)
For a share outstanding throughout each period.
| Investment Grade Bond Fund—Class N |
| Year Ended
December 31,
2023 | Year Ended
December 31,
2022 | Year Ended
December 31,
2021 | Year Ended
December 31,
2020 | Year Ended
December 31,
2019 |
Net asset value, beginning of the period | | | | | |
INCOME (LOSS) FROM INVESTMENT OPERATIONS: | | | | | |
| | | | | |
Net realized and unrealized gain (loss) | | | | | |
Total from Investment Operations | | | | | |
| | | | | |
| | | | | |
Net realized capital gains | | | | | |
| | | | | |
Net asset value, end of the period | | | | | |
| | | | | |
RATIOS TO AVERAGE NET ASSETS: | | | | | |
Net assets, end of the period (000's) | | | | | |
| | | | | |
| | | | | |
| | | | | |
| | | | | |
| Per share net investment income has been calculated using the average shares outstanding during the period. |
| Had certain expenses not been waived/reimbursed during the period, total returns would have been lower. |
| The investment adviser agreed to waive its fees and/or reimburse a portion of the Fund’s expenses during the period. Without this waiver/reimbursement, expenses would have been higher. |
| Effective July 1, 2022, the expense limit decreased from 0.45% to 0.44%. |
| Effective July 1, 2020, the expense limit decreased from 0.46% to 0.45%. |
| Effective July 1, 2019, the expense limit decreased from 0.48% to 0.46%. |
| The variation in the Fund’s turnover rate from 2019 to 2020 was primarily due to a significant repositioning of the portfolio as a result of increased market volatility. |
See accompanying notes to financial statements.
Financial Highlights (continued)
For a share outstanding throughout each period.
| Investment Grade Bond Fund—Class Y |
| Year Ended
December 31,
2023 | Year Ended
December 31,
2022 | Year Ended
December 31,
2021 | Year Ended
December 31,
2020 | Year Ended
December 31,
2019 |
Net asset value, beginning of the period | | | | | |
INCOME (LOSS) FROM INVESTMENT OPERATIONS: | | | | | |
| | | | | |
Net realized and unrealized gain (loss) | | | | | |
Total from Investment Operations | | | | | |
| | | | | |
| | | | | |
Net realized capital gains | | | | | |
| | | | | |
Net asset value, end of the period | | | | | |
| | | | | |
RATIOS TO AVERAGE NET ASSETS: | | | | | |
Net assets, end of the period (000's) | | | | | |
| | | | | |
| | | | | |
| | | | | |
| | | | | |
| Per share net investment income has been calculated using the average shares outstanding during the period. |
| Had certain expenses not been waived/reimbursed during the period, total returns would have been lower. |
| The investment adviser agreed to waive its fees and/or reimburse a portion of the Fund’s expenses during the period. Without this waiver/reimbursement, expenses would have been higher. |
| Effective July 1, 2022, the expense limit decreased from 0.50% to 0.49%. |
| Effective July 1, 2020, the expense limit decreased from 0.51% to 0.50%. |
| Effective July 1, 2019, the expense limit decreased from 0.53% to 0.51%. |
| The variation in the Fund’s turnover rate from 2019 to 2020 was primarily due to a significant repositioning of the portfolio as a result of increased market volatility. |
See accompanying notes to financial statements.
Financial Highlights (continued)
For a share outstanding throughout each period.
| Investment Grade Bond Fund—Admin Class |
| Year Ended
December 31,
2023 | Year Ended
December 31,
2022 | Year Ended
December 31,
2021 | Year Ended
December 31,
2020 | Year Ended
December 31,
2019 |
Net asset value, beginning of the year | | | | | |
INCOME (LOSS) FROM INVESTMENT OPERATIONS: |
| | | | | |
Net realized and unrealized gain (loss) | | | | | |
Total from Investment Operations | | | | | |
| | | | | |
| | | | | |
Net realized capital gains | | | | | |
| | | | | |
Net asset value, end of the period | | | | | |
| | | | | |
RATIOS TO AVERAGE NET ASSETS: | | | | | |
Net assets, end of the period (000's) | | | | | |
| | | | | |
| | | | | |
| | | | | |
| | | | | |
| Per share net investment income has been calculated using the average shares outstanding during the period. |
| Had certain expenses not been waived/reimbursed during the period, total returns would have been lower. |
| The investment adviser agreed to waive its fees and/or reimburse a portion of the Fund’s expenses during the period. Without this waiver/reimbursement, expenses would have been higher. |
| Effective July 1, 2022, the expense limit decreased from 1.00% to 0.99%. |
| Effective July 1, 2020, the expense limit decreased from 1.01% to 1.00%. |
| Effective July 1, 2019, the expense limit decreased from 1.03% to 1.01%. |
| The variation in the Fund’s turnover rate from 2019 to 2020 was primarily due to a significant repositioning of the portfolio as a result of increased market volatility. |
See accompanying notes to financial statements.
Financial Highlights (continued)
For a share outstanding throughout each period.
| Strategic Alpha Fund—Class A |
| Year Ended
December 31,
2023 | Year Ended
December 31,
2022 | Year Ended
December 31,
2021 | Year Ended
December 31,
2020 | Year Ended
December 31,
2019 |
Net asset value, beginning of the period | | | | | |
INCOME (LOSS) FROM INVESTMENT OPERATIONS: | | | | | |
| | | | | |
Net realized and unrealized gain (loss) | | | | | |
Total from Investment Operations | | | | | |
| | | | | |
| | | | | |
Net asset value, end of the period | | | | | |
| | | | | |
RATIOS TO AVERAGE NET ASSETS: | | | | | |
Net assets, end of the period (000's) | | | | | |
| | | | | |
| | | | | |
| | | | | |
| | | | | |
| Per share net investment income has been calculated using the average shares outstanding during the period. |
| A sales charge for Class A shares is not reflected in total return calculations. |
| Had certain expenses not been waived/reimbursed during the period, total returns would have been lower. |
| The investment adviser agreed to waive its fees and/or reimburse a portion of the Fund’s expenses during the period. Without this waiver/reimbursement, expenses would have been higher. |
| The variation in the Fund’s turnover rate from 2020 to 2021 was primarily due to a decrease in trading volume and shareholder flows which has continued through 2022. |
See accompanying notes to financial statements.
Financial Highlights (continued)
For a share outstanding throughout each period.
| Strategic Alpha Fund—Class C |
| Year Ended
December 31,
2023 | Year Ended
December 31,
2022 | Year Ended
December 31,
2021 | Year Ended
December 31,
2020 | Year Ended
December 31,
2019 |
Net asset value, beginning of the period | | | | | |
INCOME (LOSS) FROM INVESTMENT OPERATIONS: | | | | | |
| | | | | |
Net realized and unrealized gain (loss) | | | | | |
Total from Investment Operations | | | | | |
| | | | | |
| | | | | |
Net asset value, end of the period | | | | | |
| | | | | |
RATIOS TO AVERAGE NET ASSETS: | | | | | |
Net assets, end of the period (000's) | | | | | |
| | | | | |
| | | | | |
| | | | | |
| | | | | |
| Per share net investment income has been calculated using the average shares outstanding during the period. |
| A contingent deferred sales charge for Class C shares is not reflected in total return calculations. |
| Had certain expenses not been waived/reimbursed during the period, total returns would have been lower. |
| The investment adviser agreed to waive its fees and/or reimburse a portion of the Fund’s expenses during the period. Without this waiver/reimbursement, expenses would have been higher. |
| The administrator agreed to waive its fees and/or reimburse a portion of the Fund’s expenses during the period. Without this waiver/reimbursement, expenses would have been higher. |
| The variation in the Fund’s turnover rate from 2020 to 2021 was primarily due to a decrease in trading volume and shareholder flows which has continued through 2022. |
See accompanying notes to financial statements.
Financial Highlights (continued)
For a share outstanding throughout each period.
| Strategic Alpha Fund—Class N |
| Year Ended
December 31,
2023 | Year Ended
December 31,
2022 | Year Ended
December 31,
2021 | Year Ended
December 31,
2020 | Year Ended
December 31,
2019 |
Net asset value, beginning of the period | | | | | |
INCOME (LOSS) FROM INVESTMENT OPERATIONS: | | | | | |
| | | | | |
Net realized and unrealized gain (loss) | | | | | |
Total from Investment Operations | | | | | |
| | | | | |
| | | | | |
Net asset value, end of the period | | | | | |
| | | | | |
RATIOS TO AVERAGE NET ASSETS: | | | | | |
Net assets, end of the period (000's) | | | | | |
| | | | | |
| | | | | |
| | | | | |
| | | | | |
| Per share net investment income has been calculated using the average shares outstanding during the period. |
| Had certain expenses not been waived/reimbursed during the period, total returns would have been lower. |
| The investment adviser agreed to waive its fees and/or reimburse a portion of the Fund’s expenses during the period. Without this waiver/reimbursement, expenses would have been higher. |
| The variation in the Fund’s turnover rate from 2020 to 2021 was primarily due to a decrease in trading volume and shareholder flows which has continued through 2022. |
See accompanying notes to financial statements.
Financial Highlights (continued)
For a share outstanding throughout each period.
| Strategic Alpha Fund—Class Y |
| Year Ended
December 31,
2023 | Year Ended
December 31,
2022 | Year Ended
December 31,
2021 | Year Ended
December 31,
2020 | Year Ended
December 31,
2019 |
Net asset value, beginning of the period | | | | | |
INCOME (LOSS) FROM INVESTMENT OPERATIONS: | | | | | |
| | | | | |
Net realized and unrealized gain (loss) | | | | | |
Total from Investment Operations | | | | | |
| | | | | |
| | | | | |
Net asset value, end of the period | | | | | |
| | | | | |
RATIOS TO AVERAGE NET ASSETS: | | | | | |
Net assets, end of the period (000's) | | | | | |
| | | | | |
| | | | | |
| | | | | |
| | | | | |
| Per share net investment income has been calculated using the average shares outstanding during the period. |
| Had certain expenses not been waived/reimbursed during the period, total returns would have been lower. |
| The investment adviser agreed to waive its fees and/or reimburse a portion of the Fund’s expenses during the period. Without this waiver/reimbursement, expenses would have been higher. |
| The variation in the Fund’s turnover rate from 2020 to 2021 was primarily due to a decrease in trading volume and shareholder flows which has continued through 2022. |
See accompanying notes to financial statements.
Financial Highlights (continued)
For a share outstanding throughout each period.
| Strategic Income Fund—Class A |
| Year Ended
December 31,
2023 | Year Ended
December 31,
2022 | Year Ended
December 31,
2021 | Period Ended
December 31,
2020* | Year Ended
September 30,
2020 | Year Ended
September 30,
2019 |
Net asset value, beginning of the year | | | | | | |
INCOME (LOSS) FROM INVESTMENT OPERATIONS: | | | | | | |
| | | | | | |
Net realized and unrealized gain (loss) | | | | | | |
Total from Investment Operations | | | | | | |
| | | | | | |
Net iNet investment income | | | | | | |
Net realized capital gains | | | | | | |
| | | | | | |
Net asset value, end of the period | | | | | | |
| | | | | | |
RATIOS TO AVERAGE NET ASSETS: | | | | | | |
Net assets, end of the period (000's) | | | | | | |
| | | | | | |
| | | | | | |
| | | | | | |
| | | | | | |
| For the three month period ended December 31, 2020 due to change in fiscal year. |
| Per share net investment income has been calculated using the average shares outstanding during the period. |
| A sales charge for Class A shares is not reflected in total return calculations. |
| Had certain expenses not been waived/reimbursed during the period, total returns would have been lower. |
| Periods less than one year are not annualized. |
| The investment adviser agreed to waive its fees and/or reimburse a portion of the Fund’s expenses during the period. Without this waiver/reimbursement, expenses would have been higher. |
| Effective July 1, 2023, the expense limit decreased from 0.94% to 0.93%. See Note 6 of Notes to Financial Statements. |
| Effective July 1, 2022, the expense limit decreased from 0.95% to 0.94%. |
| Effective July 1, 2021, the expense limit decreased from 1.00% to 0.95%. |
| Computed on an annualized basis for periods less than one year. |
| Effective July 1, 2020, the expense limit decreased from 1.25% to 1.00%. |
| The variation in the Fund’s turnover rate from the year ended September 30, 2020 to the year ended December 31, 2021 was primarily due to a repositioning of the
portfolio. |
| The variation in the Fund’s turnover rate, if annualized, from the year ended September 30, 2020 to the period ended December 31, 2020 was primarily due to the disposition and realignment of certain foreign currency-denominated positions. |
See accompanying notes to financial statements.
Financial Highlights (continued)
For a share outstanding throughout each period.
| Strategic Income Fund—Class C |
| Year Ended
December 31,
2023 | Year Ended
December 31,
2022 | Year Ended
December 31,
2021 | Period Ended
December 31,
2020* | Year Ended
September 30,
2020 | Year Ended
September 30,
2019 |
Net asset value, beginning of the year | | | | | | |
INCOME (LOSS) FROM INVESTMENT OPERATIONS: | | | | | | |
| | | | | | |
Net realized and unrealized gain (loss) | | | | | | |
Total from Investment Operations | | | | | | |
| | | | | | |
| | | | | | |
Net realized capital gains | | | | | | |
| | | | | | |
Net asset value, end of the period | | | | | | |
| | | | | | |
RATIOS TO AVERAGE NET ASSETS: | | | | | | |
Net assets, end of the period (000's) | | | | | | |
| | | | | | |
| | | | | | |
| | | | | | |
| | | | | | |
| For the three month period ended December 31, 2020 due to change in fiscal year. |
| Per share net investment income has been calculated using the average shares outstanding during the period. |
| A contingent deferred sales charge for Class C shares is not reflected in total return calculations. |
| Had certain expenses not been waived/reimbursed during the period, total returns would have been lower. |
| Periods less than one year are not annualized. |
| The investment adviser agreed to waive its fees and/or reimburse a portion of the Fund’s expenses during the period. Without this waiver/reimbursement, expenses would have been higher. |
| Effective July 1, 2023, the expense limit decreased from 1.69% to 1.68%. See Note 6 of Notes to Financial Statements. |
| Effective July 1, 2022, the expense limit decreased from 1.70% to 1.69%. |
| Effective July 1, 2021, the expense limit decreased from 1.75% to 1.70%. |
| Computed on an annualized basis for periods less than one year. |
| Effective July 1, 2020, the expense limit decreased from 2.00% to 1.75%. |
| The variation in the Fund’s turnover rate from the year ended September 30, 2020 to the year ended December 31, 2021 was primarily due to a repositioning of the
portfolio. |
| The variation in the Fund’s turnover rate, if annualized, from the year ended September 30, 2020 to the period ended December 31, 2020 was primarily due to the disposition and realignment of certain foreign currency-denominated positions. |
See accompanying notes to financial statements.
Financial Highlights (continued)
For a share outstanding throughout each period.
| Strategic Income Fund—Class N |
| Year Ended
December 31,
2023 | Year Ended
December 31,
2022 | Year Ended
December 31,
2021 | Period Ended
December 31,
2020* | Year Ended
September 30,
2020 | Year Ended
September 30,
2019 |
Net asset value, beginning of the year | | | | | | |
INCOME (LOSS) FROM INVESTMENT OPERATIONS: | | | | | | |
| | | | | | |
Net realized and unrealized gain (loss) | | | | | | |
Total from Investment Operations | | | | | | |
| | | | | | |
| | | | | | |
Net realized capital gains | | | | | | |
| | | | | | |
Net asset value, end of the period | | | | | | |
| | | | | | |
RATIOS TO AVERAGE NET ASSETS: | | | | | | |
Net assets, end of the period (000's) | | | | | | |
| | | | | | |
| | | | | | |
| | | | | | |
| | | | | | |
| For the three month period ended December 31, 2020 due to change in fiscal year. |
| Per share net investment income has been calculated using the average shares outstanding during the period. |
| Had certain expenses not been waived/reimbursed during the period, total returns would have been lower. |
| Periods less than one year are not annualized. |
| The investment adviser agreed to waive its fees and/or reimburse a portion of the Fund’s expenses during the period. Without this waiver/reimbursement, expenses would have been higher. |
| Effective July 1, 2023, the expense limit decreased from 0.64% to 0.63%. See Note 6 of Notes to Financial Statements. |
| Effective July 1, 2022, the expense limit decreased from 0.65% to 0.64%. |
| Effective July 1, 2021, the expense limit decreased from 0.70% to 0.65%. |
| Computed on an annualized basis for periods less than one year. |
| Effective July 1, 2020, the expense limit decreased from 0.95% to 0.70%. |
| The variation in the Fund’s turnover rate from the year ended September 30, 2020 to the year ended December 31, 2021 was primarily due to a repositioning of the
portfolio. |
| The variation in the Fund’s turnover rate, if annualized, from the year ended September 30, 2020 to the period ended December 31, 2020 was primarily due to the disposition and realignment of certain foreign currency-denominated positions. |
See accompanying notes to financial statements.
Financial Highlights (continued)
For a share outstanding throughout each period.
| Strategic Income Fund—Class Y |
| Year Ended
December 31,
2023 | Year Ended
December 31,
2022 | Year Ended
December 31,
2021 | Period Ended
December 31,
2020* | Year Ended
September 30,
2020 | Year Ended
September 30,
2019 |
Net asset value, beginning of the year | | | | | | |
INCOME (LOSS) FROM INVESTMENT OPERATIONS: | | | | | | |
| | | | | | |
Net realized and unrealized gain (loss) | | | | | | |
Total from Investment Operations | | | | | | |
| | | | | | |
| | | | | | |
Net realized capital gains | | | | | | |
| | | | | | |
Net asset value, end of the period | | | | | | |
| | | | | | |
RATIOS TO AVERAGE NET ASSETS: | | | | | | |
Net assets, end of the period (000's) | | | | | | |
| | | | | | |
| | | | | | |
| | | | | | |
| | | | | | |
| For the three month period ended December 31, 2020 due to change in fiscal year. |
| Per share net investment income has been calculated using the average shares outstanding during the period. |
| Had certain expenses not been waived/reimbursed during the period, total returns would have been lower. |
| Periods less than one year are not annualized. |
| The investment adviser agreed to waive its fees and/or reimburse a portion of the Fund’s expenses during the period. Without this waiver/reimbursement, expenses would have been higher. |
| Effective July 1, 2023, the expense limit decreased from 0.69% to 0.68%. See Note 6 of Notes to Financial Statements. |
| Effective July 1, 2022, the expense limit decreased from 0.70% to 0.69%. |
| Effective July 1, 2021, the expense limit decreased from 0.75% to 0.70%. |
| Computed on an annualized basis for periods less than one year. |
| Effective July 1, 2020, the expense limit decreased from 1.00% to 0.75%. |
| The variation in the Fund’s turnover rate from the year ended September 30, 2020 to the year ended December 31, 2021 was primarily due to a repositioning of the
portfolio. |
| The variation in the Fund’s turnover rate, if annualized, from the year ended September 30, 2020 to the period ended December 31, 2020 was primarily due to the disposition and realignment of certain foreign currency-denominated positions. |
See accompanying notes to financial statements.
Financial Highlights (continued)
For a share outstanding throughout each period.
| Strategic Income Fund—Admin Class |
| Year Ended
December 31,
2023 | Year Ended
December 31,
2022 | Year Ended
December 31,
2021 | Period Ended
December 31,
2020* | Year Ended
September 30,
2020 | Year Ended
September 30,
2019 |
Net asset value, beginning of the year | | | | | | |
INCOME (LOSS) FROM INVESTMENT OPERATIONS: | | | | | | |
| | | | | | |
Net realized and unrealized gain (loss) | | | | | | |
Total from Investment Operations | | | | | | |
| | | | | | |
| | | | | | |
Net realized capital gains | | | | | | |
| | | | | | |
Net asset value, end of the period | | | | | | |
| | | | | | |
RATIOS TO AVERAGE NET ASSETS: | | | | | | |
Net assets, end of the period (000's) | | | | | | |
| | | | | | |
| | | | | | |
| | | | | | |
| | | | | | |
| For the three month period ended December 31, 2020 due to change in fiscal year. |
| Per share net investment income has been calculated using the average shares outstanding during the period. |
| Had certain expenses not been waived/reimbursed during the period, total returns would have been lower. |
| Periods less than one year are not annualized. |
| The investment adviser agreed to waive its fees and/or reimburse a portion of the Fund’s expenses during the period. Without this waiver/reimbursement, expenses would have been higher. |
| Effective July 1, 2023, the expense limit decreased from 1.19% to 1.18%. See Note 6 of Notes to Financial Statements. |
| Effective July 1, 2022, the expense limit decreased from 1.20% to 1.19%. |
| Effective July 1, 2021, the expense limit decreased from 1.25% to 1.20%. |
| Computed on an annualized basis for periods less than one year. |
| Effective July 1, 2020, the expense limit decreased from 1.50% to 1.25%. |
| Includes refund of prior year service fee of 0.01%. |
| The variation in the Fund’s turnover rate from the year ended September 30, 2020 to the year ended December 31, 2021 was primarily due to a repositioning of the
portfolio. |
| The variation in the Fund’s turnover rate, if annualized, from the year ended September 30, 2020 to the period ended December 31, 2020 was primarily due to the disposition and realignment of certain foreign currency-denominated positions. |
See accompanying notes to financial statements.
Notes to Financial Statements
1.Organization. Loomis Sayles Funds II and Natixis Funds Trust II (the “Trusts” and each a “Trust”) are each organized as a Massachusetts business trust. Each Trust is registered under the Investment Company Act of 1940, as amended (the “1940 Act”), as an open-end management investment company. Each Declaration of Trust permits the Board of Trustees to authorize the issuance of an unlimited number of shares of the Trust in multiple series. The financial statements for certain funds of the Trusts are presented in separate reports. The following funds (individually, a “Fund” and collectively, the “Funds”) are included in this report:
Loomis Sayles Funds II:
Loomis Sayles High Income Fund (“High Income Fund”)
Loomis Sayles Investment Grade Bond Fund (“Investment Grade Bond Fund”)
Loomis Sayles Strategic Income Fund (“Strategic Income Fund”)
Natixis Funds Trust II:
Loomis Sayles Strategic Alpha Fund (“Strategic Alpha Fund”)
Each Fund is a diversified investment company.
Each Fund offers Class A, Class C, Class N and Class Y shares. In addition, Investment Grade Bond Fund and Strategic Income Fund also offer Admin Class shares.
Class A shares are sold with a maximum front-end sales charge of 4.25% for each Fund. Class C shares do not pay a front-end sales charge, pay higher Rule 12b-1 fees than Class A shares for eight years (at which point they automatically convert to Class A shares) (prior to May 1, 2021, Class C shares automatically converted to Class A shares after ten years) and may be subject to a contingent deferred sales charge (“CDSC”) of 1.00% if those shares are redeemed within one year of acquisition, except for reinvested distributions. Class N and Class Y shares do not pay a front-end sales charge, a CDSC or Rule 12b-1 fees. Class N shares are offered with an initial minimum investment of $1,000,000. Class Y shares are offered with an initial minimum investment of $100,000. Certain categories of investors are exempted from the minimum investment amounts for Class N and Class Y as outlined in the relevant Funds’ prospectus. Admin Class shares do not pay a front-end sales charge or a CDSC, but do pay a Rule 12b-1 fee. Admin Class shares are offered exclusively through intermediaries.
Most expenses can be directly attributed to a Fund. Expenses which cannot be directly attributed to a Fund are generally apportioned based on the relative net assets of each of the Funds in Natixis Funds Trust I, Natixis Funds Trust II, Natixis Funds Trust IV and Gateway Trust (“Natixis Funds Trusts”), Loomis Sayles Funds I and Loomis Sayles Funds II (“Loomis Sayles Funds Trusts”), and Natixis ETF Trust and Natixis ETF Trust II (“Natixis ETF Trusts”). Expenses of a Fund are borne pro rata by the holders of each class of shares, except that each class bears expenses unique to that class (such as the Rule 12b-1 fee applicable to Class A, Class C and Admin Class) and transfer agent fees are borne collectively for Class A, Class C, Class Y and Admin Class, and individually for Class N. In addition, each class votes as a class only with respect to its own Rule 12b-1 Plan. Shares of each class would receive their pro rata share of the net assets of a Fund if the Fund were liquidated. The Trustees approve separate distributions from net investment income on each class of shares.
2.Significant Accounting Policies. The following is a summary of significant accounting policies consistently followed by each Fund in the preparation of its financial statements. The Funds' financial statements follow the accounting and reporting guidelines provided for investment companies and are prepared in accordance with accounting principles generally accepted in the United States of America which require the use of management estimates that affect the reported amounts and disclosures in the financial statements. Actual results could differ from those estimates. Management has evaluated the events and transactions subsequent to year-end through the date the financial statements were issued and has determined that there were no material events that would require disclosure in the Funds' financial statements.
a. Valuation. Registered investment companies are required to value portfolio investments using an unadjusted, readily available market quotation. Each Fund obtains readily available market quotations from independent pricing services. Fund investments for which readily available market quotations are not available are priced at fair value pursuant to the Funds’ Valuation Procedures. The Board of Trustees has approved a valuation designee who is subject to the Board’s oversight.
Unadjusted readily available market quotations that are utilized for exchange traded equity securities (including shares of closed-end investment companies and exchange-traded funds) include the last sale price quoted on the exchange where the security is traded most extensively. Futures contracts are valued at the closing settlement price on the exchange on which the valuation designee believes that, over time, they are traded most extensively. Domestic, exchange-traded index and single name equity option contracts (including options on exchange-traded funds) are valued at the mean of the National Best Bid and Offer quotations as determined by the Options Price Reporting Authority. Options on futures contracts are valued using the current settlement price on the exchange on which, over time, they are traded most extensively. Option contracts on foreign indices are priced at the most recent settlement price.
Notes to Financial Statements (continued)
Other exchange-traded options are valued at the average of the closing bid and ask quotations on the exchange on which, over time, they are traded most extensively. Shares of open-end investment companies are valued at net asset value (“NAV”) per share.
Exchange traded equity securities for which there is no reported sale during the day are fair valued at the closing bid quotation as reported by an independent pricing service. Unlisted equity securities (except unlisted preferred equity securities) are fair valued at the last sale price quoted in the market where they are traded most extensively or, if there is no reported sale during the day, the closing bid quotation as reported by an independent pricing service. If there is no last sale price or closing bid quotation available, unlisted equity securities will be fair valued using evaluated bids furnished by an independent pricing service, if available.
Debt securities and unlisted preferred equity securities are fair valued based on evaluated bids furnished to the Funds by an independent pricing service or bid prices obtained from broker-dealers. Senior loans and collateralized loan obligations (“CLOs”) are fair valued at bid prices supplied by an independent pricing service, if available. Broker-dealer bid prices may be used to fair value debt, unlisted equities, senior loans and CLOs where an independent pricing service is unable to price an investment or where an independent pricing service does not provide a reliable price for the investment. Forward foreign currency contracts are fair valued utilizing interpolated rates determined based on information provided by an independent pricing service. Bilateral credit default swaps are fair valued based on mid prices (between the bid price and the ask price) supplied by an independent pricing service. Bilateral interest rate swaps are fair valued based on prices supplied by an independent pricing source. Centrally cleared swap agreements are fair valued at settlement prices of the clearing house on which the contracts were traded or prices obtained from broker-dealers. Over-the-counter (“OTC”) currency options and swaptions are valued at mid prices (between the bid and the ask price) supplied by an independent pricing service, if available. Other OTC option contracts (including currency options and swaptions not priced through an independent pricing service) are valued based on quotations obtained from broker-dealers.
The Funds may also fair value investments in other circumstances such as when extraordinary events occur after the close of a foreign market, but prior to the close of the New York Stock Exchange. This may include situations relating to a single issuer (such as a declaration of bankruptcy or a delisting of the issuer’s security from the primary market on which it has traded) as well as events affecting the securities markets in general (such as market disruptions or closings and significant fluctuations in U.S. and/or foreign markets). When fair valuing a Fund’s investments, the valuation designee may, among other things, use modeling tools or other processes that may take into account factors such as issuer specific information, or other related market activity and/or information that occurred after the close of the foreign market but before the time the Fund’s NAV is calculated. Fair valuation by the Fund(s) valuation designee may require subjective determinations about the value of the investment, and fair values used to determine a Fund’s NAV may differ from quoted or published prices, or from prices that are used by others, for the same investments. In addition, the use of fair value pricing may not always result in adjustments to the prices of investments held by a Fund.
b. Investment Transactions and Related Investment Income. Investment transactions are accounted for on a trade date plus one day basis for daily NAV calculation. However, for financial reporting purposes, investment transactions are reported on trade date. Dividend income (including income reinvested) and foreign withholding tax, if applicable, are recorded on the ex-dividend date, or in the case of certain foreign securities, as soon as a Fund is notified, and interest income is recorded on an accrual basis. Loan consent fees, upfront origination fees and/or amendment fees are recorded when received and included in interest income on the Statements of Operations. Interest income is increased by the accretion of discount and decreased by the amortization of premium, if applicable. For payment-in-kind securities, income received in-kind is reflected as an increase to the principal and cost basis of the securities. Periodic principal adjustments for inflation-protected securities are recorded to interest income. Negative principal adjustments (in the event of deflation) are recorded as reductions of interest income to the extent of interest income earned, not to exceed the amount of positive principal adjustments on a cumulative basis. For securities with paydown provisions, principal payments received are treated as a proportionate reduction to the cost basis of the securities, and excess or shortfall amounts are recorded as income. Distributions received from investments in securities that represent a return of capital or capital gain are recorded as a reduction of cost of the investments or as a realized gain, respectively. The calendar year-end amounts of ordinary income, capital gains, and return of capital included in distributions received from the Funds’ investments in real estate investment trusts (“REITs”) are reported to the Funds after the end of the fiscal year; accordingly, the Funds estimate these amounts for accounting purposes until the characterization of REIT distributions is reported to the Funds after the end of the fiscal year. Estimates are based on the most recent REIT distribution information available. In determining net gain or loss on securities sold, the cost of securities has been determined on an identified cost basis. Investment income, non-class specific expenses and realized and unrealized gains and losses are allocated on a pro rata basis to each class based on the relative net assets of each class to the total net assets of the Fund.
c. Foreign Currency Translation. The books and records of the Funds are maintained in U.S. dollars. The values of securities, currencies and other assets and liabilities denominated in currencies other than U.S. dollars, if any, are translated into U.S. dollars based upon foreign exchange rates prevailing at the end of the period. Purchases and sales of investment securities, income and expenses are translated into U.S. dollars on the respective dates of such transactions.
Notes to Financial Statements (continued)
Net realized foreign exchange gains or losses arise from sales of foreign currency, changes in exchange rates between the trade and settlement dates on securities transactions and the difference between the amounts of dividends, interest and foreign withholding taxes recorded in the Funds’ books and records and the U.S. dollar equivalent of the amounts actually received or paid. Net unrealized foreign exchange gains or losses arise from changes in the value of assets and liabilities, other than investment securities, as of the end of the fiscal period, resulting from changes in exchange rates. Net realized foreign exchange gains or losses and the net change in unrealized foreign exchange gains or losses are disclosed in the Statements of Operations. For federal income tax purposes, net realized foreign exchange gains or losses are characterized as ordinary income and may, if the Funds have net losses, reduce the amount of income available to be distributed by the Funds.
The values of investment securities are presented at the foreign exchange rates prevailing at the end of the period for financial reporting purposes. Net realized and unrealized gains or losses on investments reported in the Statements of Operations reflect gains or losses resulting from changes in exchange rates and fluctuations which arise due to changes in market prices of investment securities. For federal income tax purposes, a portion of the net realized gain or loss on investments arising from changes in exchange rates, which is reflected in the Statements of Operations, may be characterized as ordinary income and may, if the Funds have net losses, reduce or eliminate the amount of income available to be distributed by the Funds.
For the year ended December 31, 2023, the amount of income available to be distributed has been reduced by the following amounts as a result of losses arising from changes in exchange rates:
The Funds may use foreign currency exchange contracts to facilitate transactions in foreign-denominated investments. Losses may arise from changes in the value of the foreign currency or if the counterparties do not perform under the contracts’ terms.
d. Forward Foreign Currency Contracts. A Fund may enter into forward foreign currency contracts, including forward foreign cross currency contracts, to acquire exposure to foreign currencies or to hedge the Funds’ investments against currency fluctuation. A contract can also be used to offset a previous contract. These contracts involve market risk in excess of the unrealized appreciation (depreciation) reflected in the Funds’ Statements of Assets and Liabilities. The U.S. dollar value of the currencies a Fund has committed to buy or sell represents the aggregate exposure to each currency a Fund has acquired or hedged through currency contracts outstanding at period end. Gains or losses are recorded for financial statement purposes as unrealized until settlement date. Contracts are traded over-the-counter directly with a counterparty. Risks may arise upon entering into these contracts from the potential inability of counterparties to meet the terms of their contracts and from unanticipated movements in the value of a foreign currency relative to the U.S. dollar. Certain contracts may require the movement of cash and/or securities as collateral for the Funds’ or counterparty’s net obligations under the contracts. Forward foreign currency contracts outstanding at the end of the period, if any, are listed in each applicable Fund's Portfolio of Investments.
e. Futures Contracts. A Fund may enter into futures contracts. Futures contracts are agreements between two parties to buy and sell a particular instrument or index for a specified price on a specified future date.
When a Fund enters into a futures contract, it is required to deposit with (or for the benefit of) its broker an amount of cash or short-term high-quality securities as “initial margin.” As the value of the contract changes, the value of the futures contract position increases or declines. Subsequent payments, known as “variation margin,” are made or received by a Fund, depending on the price fluctuations in the fair value of the contract and the value of cash or securities on deposit with the broker. The aggregate principal amounts of the contracts are not recorded in the financial statements. Daily fluctuations in the value of the contracts are recorded in the Statements of Assets and Liabilities as a receivable (payable) and in the Statements of Operations as unrealized appreciation (depreciation) until the contracts are closed, when they are recorded as realized gains (losses). Realized gain or loss on a futures position is equal to the difference between the value of the contract at the time it was opened and the value at the time it was closed, minus brokerage commissions. When a Fund enters into a futures contract certain risks may arise, such as illiquidity in the futures market, which may limit a Fund’s ability to close out a futures contract prior to settlement date, and unanticipated movements in the value of securities or interest rates. Futures contracts outstanding at the end of the period, if any, are listed in each applicable Fund’s Portfolio of Investments.
Futures contracts are exchange-traded. Exchange-traded futures contracts are standardized and are settled through a clearing house with fulfillment supported by the credit of the exchange. Therefore, counterparty credit risks to the Funds are reduced; however, in the event that a counterparty enters into bankruptcy, a Fund’s claim against initial/variation margin on deposit with the counterparty may be subject to terms of a final settlement in bankruptcy court.
Notes to Financial Statements (continued)
f. Option Contracts. A Fund may enter into option contracts. When a Fund purchases an option, it pays a premium and the option is subsequently marked-to-market to reflect current value. Premiums paid for purchasing options which expire are treated as realized losses. Premiums paid for purchasing options which are exercised are added to the cost or deducted from the proceeds on the underlying instrument to determine the realized gain or loss. If the Fund enters into a closing sale transaction, the difference between the premium paid and the proceeds of the closing sale transaction is treated as a realized gain or loss. The risk associated with purchasing options is limited to the premium paid.
When a Fund writes an option, an amount equal to the net premium received (the premium less commission) is recorded as a liability and is subsequently adjusted to the current value. Net premiums received for written options which expire are treated as realized gains. Net premiums received for written options which are exercised are deducted from the cost or added to the proceeds on the underlying instrument to determine the realized gain or loss. If the Fund enters into a closing purchase transaction, the difference between the net premium received and any amount paid on effecting a closing purchase transaction, including commissions, is treated as a realized gain or, if the net premium received is less than the amount paid, as a realized loss. The Fund, as writer of a written option, bears the risk of an unfavorable change in the market value of the instrument or index underlying the written option.
Exchange-traded options contracts are standardized and are settled through a clearing house with fulfillment supported by the credit of the exchange. Therefore, counterparty credit risks to the Funds are reduced. OTC options are subject to the risk that the counterparty is unable or unwilling to meet its obligations under the option. Option contracts outstanding at the end of the period, if any, are listed in each applicable Fund’s Portfolio of Investments.
g. Swap Agreements. A Fund may enter into credit default and interest rate swaps. A credit default swap is an agreement between two parties (the “protection buyer” and “protection seller”) to exchange the credit risk of an issuer (“reference obligation”) for a specified time period. The reference obligation may be one or more debt securities or an index of such securities. The Funds may be either the protection buyer or the protection seller. As a protection buyer, the Funds have the ability to hedge the downside risk of an issuer or group of issuers. As a protection seller, the Funds have the ability to gain exposure to an issuer or group of issuers whose bonds are unavailable or in short supply in the cash bond market, as well as realize additional income in the form of fees paid by the protection buyer. The protection buyer is obligated to pay the protection seller a stream of payments (“fees”) over the term of the contract, provided that no credit event, such as a default or a downgrade in credit rating, occurs on the reference obligation. The Funds may also pay or receive upfront premiums. If a credit event occurs, the protection seller must pay the protection buyer the difference between the agreed upon notional value and market value of the reference obligation. Market value in this case is determined by a facilitated auction whereby a minimum number of allowable broker bids, together with a specified valuation method, are used to calculate the value. The maximum potential amount of undiscounted future payments that a Fund as the protection seller could be required to make under a credit default swap agreement would be an amount equal to the notional amount of the agreement.
Implied credit spreads, represented in absolute terms, are disclosed in the Portfolio of Investments for those agreements for which the Fund is the protection seller. Implied credit spreads serve as an indicator of the current status of the payment/performance risk and represent the likelihood or risk of default for the credit derivative. The implied credit spread of a particular reference entity reflects the cost of buying/selling protection and may include upfront payments required to be made to enter into the agreement. Wider credit spreads represent a deterioration of the reference entity’s credit soundness and a greater likelihood or risk of default or other credit event occurring as defined under the terms of the agreement.
An interest rate swap is an agreement with another party to receive or pay interest (e.g., an exchange of fixed rate payments for floating rate payments) to protect themselves from interest rate fluctuations. This type of swap is an agreement that obligates two parties to exchange a series of cash flows at specified intervals based upon or calculated by reference to a specified interest rate(s) for a specified notional amount. The payment flows are usually netted against each other, with the difference being paid by one party to the other.
The notional amounts of swap agreements are not recorded in the financial statements. Swap agreements are valued daily and fluctuations in the value are recorded in the Statements of Operations as change in unrealized appreciation (depreciation) on swap agreements. Fees are accrued in accordance with the terms of the agreement and are recorded in the Statements of Assets and Liabilities as part of unrealized appreciation (depreciation) on swap agreements. When received or paid, fees are recorded in the Statements of Operations as realized gain or loss. Upfront premiums paid or received by the Funds are recorded on the Statements of Assets and Liabilities as an asset or liability, respectively, and are amortized or accreted over the term of the agreement and recorded as realized gain or loss. Payments made or received by the Funds as a result of a credit event or termination of the agreement are recorded as realized gain or loss.
Swap agreements are privately negotiated in the OTC market and may be entered into as a bilateral contract or centrally cleared (“centrally cleared swaps”). Bilateral swap agreements are traded between counterparties and, as such, are subject to the risk that a
Notes to Financial Statements (continued)
party to the agreement will not be able to meet its obligations. In a centrally cleared swap, immediately following execution of the swap agreement, the swap agreement is novated to a central counterparty (the “CCP”) and the Fund faces the CCP through a broker. Upon entering into a centrally cleared swap, the Fund is required to deposit initial margin with the broker in the form of cash or securities in an amount that varies depending on the size and risk profile of the particular swap. Subsequent payments, known as “variation margin,” are made or received by the Fund based on the daily change in the value of the centrally cleared swap agreement. For centrally cleared swaps, the Fund’s counterparty credit risk is reduced as the CCP stands between the Fund and the counterparty. Swap agreements outstanding at the end of the period, if any, are listed in each applicable Fund's Portfolio of Investments.
h. Swaptions. A Fund may enter into interest rate swaptions. An interest rate swaption gives the holder the right, but not the obligation, to enter into or cancel an interest rate swap agreement at a future date. Interest rate swaptions may be either purchased or written. The buyer of an interest rate swaption may purchase either the right to receive a fixed rate in the underlying swap (known as a “receiver swaption”) or to pay a fixed rate (known as a “payer swaption”), based on the notional amount of the swap agreement, in exchange for a floating rate. The notional amounts of swaptions are not recorded in the financial statements.
When a Fund purchases an interest rate swaption, it pays a premium and the swaption is subsequently marked-to-market to reflect current value. Premiums paid for purchasing interest rate swaptions which expire are treated as realized losses. Premiums paid for purchasing interest rate swaptions which are exercised are added to the cost or deducted from the proceeds on the underlying swap to determine the realized gain or loss. If a Fund enters into a closing sale transaction, the difference between the premium paid and the proceeds of the closing sale transaction is treated as a realized gain or loss. The risk associated with purchasing interest rate swaptions is limited to the premium paid.
When a Fund writes an interest rate swaption, an amount equal to the premium received is recorded as a liability and is subsequently adjusted to the current value. Premiums received for written interest rate swaptions which expire are treated as realized gains. Premiums received for written interest rate swaptions which are exercised are deducted from the cost or added to the proceeds on the underlying swap to determine the realized gain or loss. If a Fund enters into a closing purchase transaction, the difference between the premium received and any amount paid on effecting a closing purchase transaction, including commission, is treated as a realized gain or, if the premium received is less than the amount paid, as a realized loss. A Fund, as writer of a written interest rate swaption, bears the risk of an unfavorable change in the market value of the swap underlying the written interest rate swaption.
OTC interest rate swaptions are subject to the risk that the counterparty is unable or unwilling to meet its obligations under the swaption. Swaptions outstanding at the end of the period, if any, are listed in each applicable Fund's Portfolio of Investments.
i. Due from Brokers. Transactions and positions in certain options and swap agreements are maintained and cleared by registered U.S. broker/dealers pursuant to customer agreements between the Funds and the various broker/dealers. The due from brokers balance in the Statements of Assets and Liabilities for High Income Fund represents cash pledged as initial margin for centrally cleared swap agreements. The due from brokers balance in the Statements of Assets and Liabilities for Investment Grade Bond Fund and Strategic Income Fund represents cash pledged as initial margin for closed centrally cleared swap agreements. The due from brokers balance in the Statements of Assets and Liabilities for Strategic Alpha Fund represents cash pledged as collateral for options and as initial margin for centrally cleared swap agreements. In certain circumstances the Funds’ use of cash, securities and/ or foreign currency held at brokers is restricted by regulation or broker mandated limits.
j. Federal and Foreign Income Taxes. The Trusts treat each Fund as a separate entity for federal income tax purposes. Each Fund intends to meet the requirements of the Internal Revenue Code of 1986, as amended, applicable to regulated investment companies, and to distribute to its shareholders substantially all of its net investment income and any net realized capital gains at least annually. Management has performed an analysis of each Fund’s tax positions for the open tax years as of December 31, 2023 and has concluded that no provisions for income tax are required. The Funds’ federal tax returns for the prior three fiscal years remain subject to examination by the Internal Revenue Service. Management is not aware of any events that are reasonably possible to occur in the next twelve months that would result in the amounts of any unrecognized tax benefits significantly increasing or decreasing for the Funds. However, management’s conclusions regarding tax positions taken may be subject to review and adjustment at a later date based on factors including, but not limited to, new tax laws and accounting regulations and interpretations thereof.
A Fund may be subject to foreign withholding taxes on investment income and taxes on capital gains on investments that are accrued and paid based upon the Fund’s understanding of the tax rules and regulations that exist in the countries in which the Fund invests. Foreign withholding taxes on dividend and interest income are reflected on the Statements of Operations as a reduction of investment income, net of amounts that have been or are expected to be reclaimed and paid. Dividends and interest receivable on the Statements of Assets and Liabilities are net of foreign withholding taxes. Foreign withholding taxes where reclaims have been or are expected to be filed and paid are reflected on the Statements of Assets and Liabilities as tax reclaims receivable. Capital gains taxes paid are included in net realized gain (loss) on investments in the Statements of Operations. Accrued but unpaid capital gains taxes are
Notes to Financial Statements (continued)
reflected as foreign taxes payable on the Statements of Assets and Liabilities, if applicable, and reduce unrealized gains on investments. In the event that realized gains on investments are subsequently offset by realized losses, taxes paid on realized gains may be returned to a Fund. Such amounts, if applicable, are reflected as foreign tax rebates receivable on the Statements of Assets and Liabilities and are recorded as a realized gain when received.
k. Dividends and Distributions to Shareholders. Dividends and distributions are recorded on the ex-dividend date. The timing and characterization of certain income and capital gain distributions are determined in accordance with federal tax regulations, which may differ from accounting principles generally accepted in the United States of America. Permanent differences are primarily due to differing treatments for book and tax purposes of items such as premium amortization, paydown gains and losses, defaulted and/or non-income producing securities, convertible bond adjustments, corporate actions, foreign currency gains and losses, deferred Trustees’ fees, return of capital distributions received, capital gain distributions received, swap contracts adjustments and trust preferred securities. Permanent book and tax basis differences relating to shareholder distributions, net investment income and net realized gains will result in reclassifications to capital accounts reported on the Statements of Assets and Liabilities. Temporary differences between book and tax distributable earnings are primarily due to deferred Trustees’ fees, premium amortization, defaulted and/or non-income producing securities, swap contracts adjustments, wash sales, futures contract mark-to-market, return of capital distributions received, capital gain distributions received, trust preferred securities, perpetual bond adjustments, corporate actions, convertible bond adjustments, forward foreign currency contract mark-to-market, paydown gains and losses, straddle loss deferral adjustments and options contract mark-to-market. Amounts of income and capital gain available to be distributed on a tax basis are determined annually, and at other times during the Funds’ fiscal year as may be necessary to avoid knowingly declaring and paying a return of capital distribution. Distributions from net investment income and net realized short-term capital gains are reported as distributed from ordinary income for tax purposes.
The tax characterization of distributions is determined on an annual basis. The tax character of distributions paid to shareholders during the years ended December 31, 2023 and 2022 was as follows:
| | |
| | | | | | |
| | | | | | |
Investment Grade Bond Fund | | | | | | |
| | | | | | |
| | | | | | |
Distributions paid to shareholders from net investment income and net realized capital gains, based on accounting principles generally accepted in the United States of America, are consolidated and reported on the Statements of Changes in Net Assets as Distributions to Shareholders. Distributions paid to shareholders from net investment income and net realized capital gains expressed in per-share amounts, based on accounting principles generally accepted in the United States of America, are separately stated and reported within the Financial Highlights.
Notes to Financial Statements (continued)
As of December 31, 2023, the components of distributable earnings on a tax basis were as follows:
| | | | |
Undistributed ordinary income | | | | |
Capital loss carryforward: | | | | |
| | | | |
| | | | |
| | | | |
| | | | |
Total capital loss carryforward | | | | |
Late-year ordinary and post-October
| | | | |
| | | | |
| | | | |
| Under current tax law, capital losses, foreign currency losses, and losses on passive foreign investment companies and contingent payment debt instruments after October 31 or December 31, as applicable, may be deferred and treated as occurring on the first day of the following taxable year. Strategic Alpha Fund is deferring foreign currency losses. |
As of December 31, 2023, unrealized appreciation (depreciation) as a component of distributable earnings was as follows:
| | | | |
Unrealized appreciation (depreciation) | | | | |
| | | | |
Foreign currency translations | | | | |
Total unrealized depreciation | | | | |
As of December 31, 2023, the tax cost of investments (including derivatives, if applicable) and unrealized appreciation (depreciation) on a federal tax basis were as follows:
The difference between these amounts and those reported in the preceding table, if any, are primarily attributable to foreign currency mark-to-market.
l. Senior Loans. A Fund’s investment in senior loans may be to corporate, governmental or other borrowers. Senior loans, which include both secured and unsecured loans made by banks and other financial institutions to corporate customers, typically hold the most senior position in a borrower’s capital structure, may be secured by the borrower’s assets and have interest rates that reset frequently. Senior Loans can include term loans, revolving credit facility loans and second lien loans. A senior loan is often administered by a bank or other financial institution that acts as agent for all holders. The agent administers the terms of the senior loan, as specified in the loan agreement. Large loans may be shared or syndicated among several lenders. The Fund may enter into the primary syndicate for a loan or it may also purchase all or a portion of loans from other lenders (sometimes referred to as loan assignments), in either case becoming a direct lender. The settlement period for senior loans is uncertain as there is no standardized
Notes to Financial Statements (continued)
settlement schedule applicable to such investments. Senior loans outstanding at the end of the period, if any, are listed in each applicable Fund’s Portfolio of Investments.
m. Loan Participations. A Fund’s investment in senior loans may be in the form of participations in loans. When investing in a loan participation, a Fund has the right to receive payments of principal, interest and any fees to which it is entitled only from the party from whom the Fund has purchased the participation and only upon receipt by that party of payments from the borrower. A Fund generally has no right to enforce compliance by the borrower with the terms of the loan agreement or to vote on matters arising under the loan agreement. Thus, a Fund may be subject to credit risk from both the party from whom it purchased the loan participation and the borrower. Additionally, a Fund may have minimal control over the terms of any loan modification. Loan participations outstanding at the end of the period, if any, are listed in each applicable Fund’s Portfolio of Investments.
n. Collateralized Loan Obligations. A Fund may invest in CLOs. A CLO is a type of asset-backed security designed to redirect the cash flows from a pool of leveraged loans to investors based on their risk preferences. Cash flows from a CLO are split into two or more portions, called tranches, varying in risk and yield. The risk of an investment in a CLO depends largely on the type of the collateralized securities and the class of the instrument in which the Fund invests. CLOs outstanding at the end of the period, if any, are listed in each applicable Fund’s Portfolio of Investments.
o. Repurchase Agreements. Each Fund may enter into repurchase agreements, under the terms of a Master Repurchase Agreement, under which each Fund acquires securities as collateral and agrees to resell the securities at an agreed upon time and at an agreed upon price. It is each Fund’s policy that the market value of the collateral for repurchase agreements be at least equal to 102% of the repurchase price, including interest. Certain repurchase agreements are tri-party arrangements whereby the collateral is held in a segregated account for the benefit of the Fund and on behalf of the counterparty. Repurchase agreements could involve certain risks in the event of default or insolvency of the counterparty, including possible delays or restrictions upon a Fund’s ability to dispose of the underlying securities. As of December 31, 2023, each Fund, as applicable, had investments in repurchase agreements for which the value of the related collateral exceeded the value of the repurchase agreement. The gross value of repurchase agreements is included in the Statements of Assets and Liabilities for financial reporting purposes.
p. When-Issued and Delayed Delivery Transactions. A Fund may enter into when-issued or delayed delivery transactions. When-issued refers to transactions made conditionally because a security, although authorized, has not been issued. Delayed delivery refers to transactions for which delivery or payment will occur at a later date, beyond the normal settlement period. The price of when-issued and delayed delivery securities and the date when the securities will be delivered and paid for are fixed at the time the transaction is negotiated. The security and the obligation to pay for it are recorded by the Funds at the time the commitment is entered into. The value of the security may vary with market fluctuations during the time before the Funds take delivery of the security. No interest accrues to the Funds until the transaction settles.
Delayed delivery transactions include those designated as To Be Announced (“TBAs”) in the Portfolios of Investments. For TBAs, the actual security that will be delivered to fulfill the transaction is not designated at the time of the trade. The security is “to be announced” 48 hours prior to the established trade settlement date. Certain transactions require the Funds or counterparty to post cash and/or securities as collateral for the net mark-to-market exposure to the other party.
Purchases of when-issued or delayed delivery securities may have a similar effect on the Funds’ NAV as if the Funds’ had created a degree of leverage in the portfolio. Risks may arise upon entering into such transactions from the potential inability of counterparties to meet their obligations under the transactions. Additionally, losses may arise due to changes in the value of the underlying securities.
There were no when-issued or delayed delivery securities held by the Funds as of December 31, 2023.
q. Stripped Securities. A Fund may invest in stripped securities, which are usually structured with two or more classes that receive different proportions of the interest and principal distribution on a pool of U.S. or foreign government securities or mortgage assets. In some cases, one class will receive all of the interest (the interest-only or “IO” class), while the other class will receive all of the principal (the principal-only or “PO” class). Stripped securities commonly have greater market volatility than other types of fixed-income securities. In the case of stripped mortgage securities, if the underlying mortgage assets experience greater than anticipated prepayments of principal, a Fund may fail to recoup fully its investments in IOs. Stripped securities outstanding at the end of the period, if any, are listed in each applicable Fund's Portfolio of Investments.
r. Unfunded Loan Commitments. A Fund may enter into unfunded loan commitments, which are contractual obligations for future funding at the option of the borrower. Unfunded loan commitments represent a future obligation, in full, even though a percentage of the committed amount may not be utilized by the borrower. Unfunded loan commitments, and the obligation for future funding, are recorded as a liability on the Statements of Assets and Liabilities at par value at the time the commitment is entered into. Purchases of unfunded loan commitments may have a similar effect on the Fund's NAV as if the Fund had created a degree of leverage in the
Notes to Financial Statements (continued)
portfolio. Market risk exists with these commitments to the same extent as if the securities were owned on a settled basis. Losses may arise due to changes in the value of the unfunded loan commitments. Unfunded loan commitments outstanding at the end of the period, if any, are listed in each applicable Fund's Portfolio of Investments.
s. Indemnifications. Under the Trusts’ organizational documents, their officers and Trustees are indemnified against certain liabilities arising out of the performance of their duties to the Funds. Additionally, in the normal course of business, the Funds enter into contracts with service providers that contain general indemnification clauses. The Funds' maximum exposure under these arrangements is unknown as this would involve future claims that may be made against the Funds that have not yet occurred. However, based on experience, the Funds expect the risk of loss to be remote.
t. New Accounting Pronouncement. In March 2020, the Financial Accounting Standards Board (“FASB”) issued ASU 2020-04, Reference Rate Reform (Topic 848) (“ASU 2020-04”) in response to concerns about structural risks of interbank offered rates, and particularly the risk of cessation of the London Interbank Offered Rate (“LIBOR”), which was expected to occur no later than June 30, 2023. In January 2021, FASB issued Accounting Standard Update 2021-01 (“ASU 2021-01”), which is an update of ASU 2020-04. Regulators have undertaken reference rate reform initiatives to identify alternative reference rates that are more observable or transaction based and less susceptible to manipulation than LIBOR. ASU 2020-04 provides temporary guidance to ease the potential burden in accounting for (or recognizing the effects of) reference rate reform on financial reporting. ASU 2020-04 is elective and applies to all entities, subject to meeting certain criteria, that have contracts that reference LIBOR or another reference rate expected to be discontinued because of reference rate reform. ASU 2020-04 amendments offer optional expedients for contract modifications that would allow an entity to account for such modifications by prospectively adjusting the effective interest rate, instead of evaluating each contract, in accordance with existing accounting standards, as to whether reference rate modifications constitute the establishment of new contracts or the continuation of existing contracts. ASU 2021-01 clarifies that certain provisions in Topic 848, if elected by an entity, apply to derivative instruments that use an interest rate for margining, discounting, or contract price alignment that is modified as a result of reference rate reform. In December 2022, FASB issued a further update to Topic 848 under ASU 2022-06, which defers the sunset date of Topic 848 to December 31, 2024, after which entities will no longer be permitted to apply the optional expedients provided in Topic 848. As of June 30, 2023, LIBOR had ceased to be published on a representative basis, and will be replaced by an alternative reference rate at the next reset date subsequent to June 30, 2023 for all investments for which LIBOR is the current reference rate. Management has elected to apply the optional expedients when appropriate and account for such modifications by prospectively adjusting the effective interest rate. There is no material impact to the Funds' financial statements.
u. Regulatory Update. Effective January 24, 2023, the SEC adopted a release (the “Release”) containing rule and form amendments to require mutual funds and ETFs to transmit concise and visually engaging streamlined annual and semiannual reports to shareholders that highlight key information deemed important for retail investors to assess and monitor their fund investments. Other information, including financial statements, will no longer appear in the new tailored shareholder reports but will be available online, delivered free of charge upon request, and filed with the SEC on a semiannual basis on Form N-CSR. In addition to the removal of financial statements from the new tailored shareholder reports, the Release requires mandatory mailing of the reports, unless a shareholder specifically opts out and chooses electronic delivery. The Release also requires that the new tailored shareholder reports be no longer than 2-4 pages, include only a single share class of a single fund, and use a broad-based securities market index for performance comparison purposes. Management is evaluating the impact of the Release on the content of the current shareholder report and newly created tailored shareholder reports and expects to meet the required compliance date of July 24, 2024.
3.Fair Value Measurements. In accordance with accounting standards related to fair value measurements and disclosures, the Funds have categorized the inputs utilized in determining the value of each Fund’s assets or liabilities. These inputs are summarized in the three broad levels listed below:
• Level 1 — quoted prices in active markets for identical assets or liabilities;
• Level 2 — prices determined using other significant inputs that are observable either directly, or indirectly through corroboration with observable market data (which could include quoted prices for similar assets or liabilities, interest rates, credit risk, etc.); and
• Level 3 — prices determined using significant unobservable inputs when quoted prices or observable inputs are unavailable such as when there is little or no market activity for an asset or liability (unobservable inputs reflect each Fund’s own assumptions in determining the fair value of assets or liabilities and would be based on the best information available).
The inputs or methodology used for valuing securities are not necessarily an indication of the risk associated with investing in those securities.
Notes to Financial Statements (continued)
The Funds' pricing policies have been approved by the Board of Trustees. Investments for which market quotations are readily available are categorized in Level 1. Other investments for which an independent pricing service is utilized are categorized in Level 2. Broker-dealer bid prices for which the Funds have knowledge of the inputs used by the broker-dealer are categorized in Level 2. All other investments, including broker-dealer bid prices for which the Funds do not have knowledge of the inputs used by the broker-dealer, as well as investments fair valued by the valuation designee, are categorized in Level 3. All Level 2 and 3 securities are defined as being fair valued.
Under certain conditions and based upon specific facts and circumstances, the Fund’s valuation designee may determine that a fair valuation should be made for portfolio investment(s). These valuation designee fair valuations will be based upon a significant amount of Level 3 inputs.
The following is a summary of the inputs used to value the Funds' investments as of December 31, 2023, at value:
|
|
| | | | |
| | | | |
| | | | |
| | | | |
Non-Agency Commercial Mortgage-Backed Securities | | | | |
All Other Non-Convertible Bonds(a) | | | | |
Total Non-Convertible Bonds | | | | |
| | | | |
| | | | |
| | | | |
Collateralized Loan Obligations | | | | |
| | | | |
| | | | |
| | | | |
| | | | |
| | | | |
| | | | |
Centrally Cleared Credit Default Swap Agreements (unrealized appreciation) | | | | |
| | | | |
| Details of the major categories of the Fund’s investments are reflected within the Portfolio of Investments. |
Notes to Financial Statements (continued)
Investment Grade Bond Fund |
|
| | | | |
| | | | |
Collateralized Loan Obligations | | | | |
| | | | |
| | | | |
| | | | |
| | | | |
Futures Contracts (unrealized appreciation) | | | | |
| | | | |
|
Liability Valuation Inputs |
| | | | |
Futures Contracts (unrealized depreciation) | | | | |
| Details of the major categories of the Fund’s investments are reflected within the Portfolio of Investments. |
|
|
| | | | |
| | | | |
| | | | |
| | | | |
Non-Agency Commercial Mortgage-Backed Securities | | | | |
All Other Non-Convertible Bonds(a) | | | | |
Total Non-Convertible Bonds | | | | |
| | | | |
| | | | |
Collateralized Loan Obligations | | | | |
| | | | |
| | | | |
| | | | |
| | | | |
| | | | |
| | | | |
| | | | |
Centrally Cleared Interest Rate Swap Agreements (unrealized appreciation) | | | | |
Forward Foreign Currency Contracts (unrealized appreciation) | | | | |
Futures Contracts (unrealized appreciation) | | | | |
| | | | |
Liability Valuation Inputs |
| | | | |
| | | | |
Notes to Financial Statements (continued)
Liability Valuation Inputs |
| | | | |
Centrally Cleared Credit Default Swap Agreements (unrealized depreciation) | | | | |
Forward Foreign Currency Contracts (unrealized depreciation) | | | | |
Futures Contracts (unrealized depreciation) | | | | |
| | | | |
| Details of the major categories of the Fund’s investments are reflected within the Portfolio of Investments. |
|
|
| | | | |
| | | | |
| | | | |
| | | | |
| | | | |
| | | | |
| | | | |
Technology Hardware, Storage & Peripherals | | | | |
All Other Common Stocks(a) | | | | |
| | | | |
Collateralized Loan Obligations | | | | |
| | | | |
Convertible Preferred Stocks(a) | | | | |
Non-Convertible Preferred Stocks | | | | |
| | | | |
| | | | |
All Other Non-Convertible Preferred Stocks(a) | | | | |
Total Non-Convertible Preferred Stocks | | | | |
| | | | |
| | | | |
| | | | |
| | | | |
Futures Contracts (unrealized appreciation) | | | | |
| | | | |
Liability Valuation Inputs |
| | | | |
Forward Foreign Currency Contracts (unrealized depreciation) | | | | |
Futures Contracts (unrealized depreciation) | | | | |
| | | | |
| Details of the major categories of the Fund’s investments are reflected within the Portfolio of Investments. |
Notes to Financial Statements (continued)
The following is a reconciliation of Level 3 investments for which significant unobservable inputs were used to determine fair value as of December 31, 2022 and/or December 31, 2023:
|
|
Investments in Securities | Balance as of
December 31,
2022 | Accrued
Discounts
(Premiums) | | Change in
Unrealized
Appreciation
(Depreciation) | | | | | Balance as of
December 31,
2023 | Change in
Unrealized
Appreciation
(Depreciation)
from
Investments
Still Held at
December 31,
2023 |
| | | | | | | | | | |
| | | | | | | | | | |
| | | | | | | | | | |
Non-Agency Commercial Mortgage- Backed Securities | | | | | | | | | | |
| | | | | | | | | | |
| | | | | | | | | | |
| | | | | | | | | | |
| | | | | | | | | | |
|
|
| Balance as of
December 31,
2022 | Accrued
Discounts
(Premiums) | | Change in
Unrealized
Appreciation
(Depreciation) | | | | | Balance as of
December 31,
2023 | Change in
Unrealized
Appreciation
(Depreciation)
from
Investments
Still Held at
December 31,
2023 |
| | | | | | | | | | |
| | | | | | | | | | |
| | | | | | | | | | |
Non-Agency Commercial Mortgage- Backed Securities | | | | | | | | | | |
| | | | | | | | | | |
| | | | | | | | | | |
| | | | | | | | | | |
Debt securities valued at $167,774 were transferred from Level 2 to Level 3 during the period ended December 31, 2023. At December 31, 2022, these securities were fair valued based on evaluated bids furnished to the Fund by an independent pricing service
Notes to Financial Statements (continued)
in accordance with the Fund's valuation policies. At December 31, 2023, these securities were fair valued as determined by the Fund's valuation designee as an independent pricing service did not provide a reliable price for the securities.
|
|
| Balance as of
December 31,
2022 | Accrued
Discounts
(Premiums) | | Change in
Unrealized
Appreciation
(Depreciation) | | | | | Balance as of
December 31,
2023 | Change in
Unrealized
Appreciation
(Depreciation)
from
Investments
Still Held at
December 31,
2023 |
| | | | | | | | | | |
| | | | | | | | | | |
Property & Casualty Insurance | | | | | | | | | | |
| | | | | | | | | | |
Non-Convertible Preferred Stocks | | | | | | | | | | |
| | | | | | | | | | |
| | | | | | | | | | |
A debt security valued at $1,251,000 was transferred from Level 3 to Level 2 during the period ended December 31, 2023. At December 31, 2022, this security was fair valued as determined by the Fund's valuation designee as an independent pricing service was unable to price the security. At December 31, 2023, this security was fair valued based on evaluated bids furnished to the Fund by an independent pricing service in accordance with the Fund's valuation policies.
4.Derivatives. Derivative instruments are defined as financial instruments whose value and performance are based on the value and performance of an underlying asset, reference rate or index. Derivative instruments that the Funds used during the period include forward foreign currency contracts, futures contracts, option contracts and swap agreements.
The Funds are subject to the risk that companies in which the Fund invests will fail financially or otherwise be unwilling or unable to meet their obligations to the Fund. The Funds may use credit default swaps, as a protection buyer, to hedge its credit exposure to issuers of bonds it holds without having to sell the bonds. The Funds may also use credit default swaps, as a protection seller, to gain investment exposure. During the year ended December 31, 2023, High Income Fund, Strategic Alpha Fund and Strategic Income Fund engaged in credit default swap agreements (as a protection seller) to gain investment exposure. Strategic Alpha Fund also engaged in credit default swap agreements (as a protection buyer) to hedge its credit exposure.
Strategic Alpha Fund and Strategic Income Fund are subject to the risk that changes in foreign currency exchange rates will have an unfavorable effect on the value of Fund assets denominated in foreign currencies. The Funds may enter into forward foreign currency exchange contracts for hedging purposes to protect the value of the Funds’ holdings of foreign securities. The Funds may also use forward foreign currency contracts to gain exposure to foreign currencies, regardless of whether securities denominated in such currencies are held in the Funds. During the year ended December 31, 2023, the Funds engaged in forward foreign currency contracts for hedging purposes and Strategic Alpha Fund also engaged in forward foreign currency contracts to gain exposure to foreign currencies.
Investment Grade Bond Fund, Strategic Alpha Fund and Strategic Income Fund are subject to the risk that changes in interest rates will affect the value of the Funds’ investments in fixed-income securities. The Funds will be subject to increased interest rate risk to the extent that they invest in fixed-income securities with longer maturities or durations, as compared to investing in fixed-income securities with shorter maturities or durations. The Funds may use futures contracts and interest rate swap agreements to hedge against changes in interest rates and to manage duration without having to buy or sell portfolio securities. The Funds may also use futures contracts and interest rate swap agreements to gain investment exposure. During the year ended December 31, 2023, Strategic Alpha Fund engaged in futures contracts (including options on futures) and interest rate swap agreements for hedging purposes, yield
Notes to Financial Statements (continued)
curve management and to manage duration and interest rate swap agreements to gain investment exposure. During the year ended December 31, 2023, Investment Grade Bond Fund and Strategic Income Fund used futures contracts to manage duration.
Strategic Alpha Fund is subject to the risk of unpredictable declines in the value of individual equity securities and periods of below average performance in individual securities or in the equity market as a whole. The Fund may use futures contracts, purchased put options and written call options to hedge against a decline in value of an equity security that it owns. The Fund may also write put options to offset the cost of options used for hedging purposes and use futures and option contracts to gain investment exposure. During the year ended December 31, 2023, the Fund engaged in option contracts for hedging purposes and to gain investment exposure.
The following is a summary of derivative instruments for High Income Fund as of December 31, 2023, as reflected within the Statements of Assets and Liabilities:
| |
Exchange-traded/cleared asset derivatives | |
| |
| Represents swap agreements, at value. Market value of swap agreements is reported in the Portfolio of Investments along with the unamortized upfront premium paid (received), if any, and unrealized appreciation (depreciation) on each individual contract. Unrealized appreciation (depreciation) and upfront premiums paid (received) for bilateral swap agreements are reported within the Statements of Assets and Liabilities. Only the current day’s variation margin on centrally cleared swap agreements is reported within the Statements of Assets and Liabilities as receivable or payable for variation margin, as applicable. |
Transactions in derivative instruments for High Income Fund during the year ended December 31, 2023, as reflected within the Statements of Operations were as follows:
Net Realized Gain (Loss) on: | |
| |
Net Change in Unrealized
Appreciation (Depreciation) on: | |
| |
The following is a summary of derivative instruments for Investment Grade Bond Fund as of December 31, 2023, as reflected within the Statements of Assets and Liabilities:
| Unrealized
appreciation
on futures
|
Exchange-traded asset derivatives | |
| |
| Unrealized
depreciation
on futures
|
Exchange-traded liability derivatives | |
| |
| Represents cumulative unrealized appreciation (depreciation) on futures contracts. Only the current day’s variation margin on futures contracts is reported within the Statements of Assets and Liabilities as receivable or payable for variation margin, as applicable. |
Notes to Financial Statements (continued)
Transactions in derivative instruments for Investment Grade Bond Fund during the year ended December 31, 2023, as reflected within the Statements of Operations were as follows:
Net Realized Gain (Loss) on: | |
| |
Net Change in Unrealized
Appreciation (Depreciation) on: | |
| |
The following is a summary of derivative instruments for Strategic Alpha Fund as of December 31, 2023, as reflected within the Statements of Assets and Liabilities:
| | Unrealized
appreciation
on forward
foreign
currency
contracts | Unrealized
appreciation
on futures
| | |
Over-the-counter asset derivatives | | | | | |
Foreign exchange contracts | | | | | |
Exchange-traded/cleared asset derivatives | | | | | |
| | | | | |
| | | | | |
| | Unrealized
depreciation
on forward
foreign
currency
contracts | Unrealized
depreciation
on futures
| | |
Over-the-counter liability derivatives | | | | | |
Foreign exchange contracts | | | | | |
Exchange-traded/cleared liability derivatives | | | | | |
| | | | | |
| | | | | |
| | | | | |
Total exchange-traded/cleared liability derivatives | | | | | |
Total liability derivatives | | | | | |
| Represents purchased options, at value. |
| Represents cumulative unrealized appreciation (depreciation) on futures contracts. Only the current day’s variation margin on futures contracts is reported within the Statements of Assets and Liabilities as receivable or payable for variation margin, as applicable. |
| Represents swap agreements, at value. Market value of swap agreements is reported in the Portfolio of Investments along with the unamortized upfront premium paid (received), if any, and unrealized appreciation (depreciation) on each individual contract. Unrealized appreciation (depreciation) and upfront premiums paid (received) for bilateral swap agreements are reported within the Statements of Assets and Liabilities. Only the current day’s variation margin on centrally cleared swap agreements is reported within the Statements of Assets and Liabilities as receivable or payable for variation margin, as applicable. |
Notes to Financial Statements (continued)
Transactions in derivative instruments for Strategic Alpha Fund during the year ended December 31, 2023, as reflected within the Statements of Operations were as follows:
Net Realized Gain (Loss) on: | | Forward
foreign
currency
contracts | | | |
| | | | | |
Foreign exchange contracts | | | | | |
| | | | | |
| | | | | |
| | | | | |
Net Change in Unrealized
Appreciation (Depreciation) on: | | Forward
foreign
currency
contracts | | | |
| | | | | |
Foreign exchange contracts | | | | | |
| | | | | |
| | | | | |
| | | | | |
| Represents realized gain and change in unrealized appreciation (depreciation), respectively, for purchased options during the period. |
The following is a summary of derivative instruments for Strategic Income Fund as of December 31, 2023, as reflected within the Statements of Assets and Liabilities:
| Unrealized
appreciation
on futures
|
Exchange-traded asset derivatives | |
| |
| Unrealized
depreciation
on forward
foreign
currency
contracts | Unrealized
depreciation
on futures
| |
Over-the-counter liability derivatives | | | |
Foreign exchange contracts | | | |
Exchange-traded liability derivatives | | | |
| | | |
Total liability derivatives | | | |
| Represents cumulative unrealized appreciation (depreciation) on futures contracts. Only the current day’s variation margin on futures contracts is reported within the Statements of Assets and Liabilities as receivable or payable for variation margin, as applicable. |
Notes to Financial Statements (continued)
Transactions in derivative instruments for Strategic Income Fund during the year ended December 31, 2023, as reflected within the Statements of Operations were as follows:
Net Realized Gain (Loss) on: | Forward
foreign
currency
contracts | | |
| | | |
Foreign exchange contracts | | | |
| | | |
| | | |
Net Change in Unrealized
Appreciation (Depreciation) on: | Forward
foreign
currency
contracts | | |
| | | |
Foreign exchange contracts | | | |
| | | |
| | | |
As the Funds value their derivatives at fair value and recognize changes in fair value through the Statements of Operations, they do not qualify for hedge accounting under authoritative guidance for derivative instruments. The Funds’ investments in derivatives may represent an economic hedge; however, they are considered to be non-hedge transactions for the purpose of these disclosures.
The volume of forward foreign currency contract, futures contract and swap agreement activity, as a percentage of net assets for High Income Fund, Investment Grade Bond Fund, Strategic Alpha Fund and Strategic Income Fund, based on gross month-end or daily (as applicable) notional amounts outstanding during the period, including long and short positions at absolute value, was as follows for the year ended December 31, 2023:
| |
Average Notional Amount Outstanding | |
Highest Notional Amount Outstanding | |
Lowest Notional Amount Outstanding | |
Notional Amount Outstanding as of December 31, 2023 | |
Investment Grade Bond Fund | |
Average Notional Amount Outstanding | |
Highest Notional Amount Outstanding | |
Lowest Notional Amount Outstanding | |
Notional Amount Outstanding as of December 31, 2023 | |
| | | | |
Average Notional Amount Outstanding | | | | |
Highest Notional Amount Outstanding | | | | |
Lowest Notional Amount Outstanding | | | | |
Notional Amount Outstanding as of December 31, 2023 | | | | |
Notes to Financial Statements (continued)
| | | |
Average Notional Amount Outstanding | | | |
Highest Notional Amount Outstanding | | | |
Lowest Notional Amount Outstanding | | | |
Notional Amount Outstanding as of December 31, 2023 | | | |
Unrealized gain and/or loss on open forwards, futures and swaps is recorded in the Statements of Assets and Liabilities. The aggregate notional values of forward, futures and swap contracts are not recorded in the Statements of Assets and Liabilities, and therefore are not included in the Funds’ net assets.
The volume of option contract activity, as a percentage of net assets for Strategic Alpha Fund, based on the month-end market values of instruments underlying purchased and written options, at absolute value, was as follows for the year ended December 31, 2023:
| | | |
Average Market Value of Underlying Instruments | | | |
Highest Market Value of Underlying Instruments | | | |
Lowest Market Value of Underlying Instruments | | | |
Market Value of Underlying Instruments as of December 31, 2023 | | | |
| Market value of underlying instruments is determined by multiplying option shares by the price of the option’s underlying security. |
Amounts outstanding at the end of the prior period, if applicable, are included in the average amount outstanding.
Over-the-counter derivatives, including forward foreign currency contracts and swap agreements, are entered into pursuant to International Swaps and Derivatives Association, Inc. (“ISDA”) agreements negotiated between the Funds and their counterparties. ISDA agreements typically contain, among other things, terms for the posting of collateral and master netting provisions in the event of a default or other termination event. Collateral is posted by a Fund or the counterparty to the extent of the net mark-to-market exposure to the other party of all open contracts under the agreement, subject to minimum transfer requirements. Master netting provisions allow the Funds and the counterparty, in the event of a default or other termination event, to offset amounts owed by each related to derivative contracts, including any posted collateral, to one net amount payable by either the Funds or the counterparty. The Funds' ISDA agreements typically contain provisions that allow a counterparty to terminate open contracts early if the NAV of a Fund declines beyond a certain threshold. For financial reporting purposes, the Funds do not offset derivative assets and liabilities, and any related collateral received or pledged, on the Statements of Assets and Liabilities.
As of December 31, 2023, gross amounts of over-the-counter derivative assets and liabilities not offset in the Statements of Assets and Liabilities and the related net amounts after taking into account master netting arrangements, by counterparty, are as follows:
|
| | | | Collateral
(Received)/
Pledged | |
Goldman Sachs International | | | | | |
|
| Gross Amounts of
Liabilities | | | Collateral
(Received)/
Pledged | |
| | | | | |
| | | | | |
| | | | | |
Goldman Sachs International | | | | | |
| | | | | |
Notes to Financial Statements (continued)
|
| Gross Amounts of
Liabilities | | | Collateral
(Received)/
Pledged | |
| | | | | |
The actual collateral received or pledged, if any, may exceed the amounts shown in the table due to overcollateralization. Timing differences may exist between when contracts under the ISDA agreements are marked-to-market and when collateral moves. The ISDA agreements include tri-party control agreements under which collateral is held for the benefit of the secured party at a third party custodian, State Street Bank and Trust Company (“State Street Bank”).
Counterparty risk is managed based on policies and procedures established by each Fund’s adviser. Such policies and procedures may include, but are not limited to, minimum counterparty credit rating requirements, monitoring of counterparty credit default swap spreads and posting of collateral. A Fund’s risk of loss from counterparty credit risk on over-the-counter derivatives is generally limited to the Fund’s aggregated unrealized gains and the amount of any collateral pledged to the counterparty, which may be offset by any collateral posted to the Fund by the counterparty. ISDA master agreements can help to manage counterparty risk by specifying collateral posting arrangements at pre-arranged exposure levels. Under these ISDA agreements, collateral is routinely transferred if the total net exposure in respect of certain transactions, net of existing collateral already in place, exceeds a specified amount. With exchange-traded derivatives, there is minimal counterparty credit risk to the Fund because the exchange’s clearing house, as counterparty to these instruments, stands between the buyer and the seller of the contract. Credit risk still exists in exchange-traded derivatives with respect to initial and variation margin that is held in a broker’s customer accounts. While brokers typically are required to segregate customer margin for exchange-traded derivatives from their own assets, in the event that a broker becomes insolvent or goes into bankruptcy and at that time there is a shortfall in the aggregate amount of margin held by the broker for all its customers, U.S. bankruptcy laws will typically allocate that shortfall on a pro rata basis across all of the broker’s customers, potentially resulting in losses to the Fund.
5.Purchases and Sales of Securities. For the year ended December 31, 2023, purchases and sales of securities (excluding short-term investments and option/swaption contracts and including paydowns) were as follows:
| U.S. Government/
Agency Securities | |
| | | | |
| | | | |
Investment Grade Bond Fund | | | | |
| | | | |
| | | | |
6.Management Fees and Other Transactions with Affiliates.
a. Management Fees. Loomis, Sayles & Company, L.P. (“Loomis Sayles”) serves as investment adviser to each Fund. Loomis Sayles is a limited partnership whose sole general partner, Loomis, Sayles & Company, Inc., is indirectly owned by Natixis Investment Managers, LLC, which is part of Natixis Investment Managers, an international asset management group based in Paris, France.
Under the terms of the management agreements, each Fund pays a management fee at the following annual rates, calculated daily and payable monthly, based on each Fund’s average daily net assets:
| Percentage of Average Daily Net Assets |
| | | | | | |
| | | | | | |
Investment Grade Bond Fund | | | | | | |
| | | | | | |
| | | | | | |
Notes to Financial Statements (continued)
Prior to July 1, 2023, High Income Fund and Strategic Income Fund paid a management fee at the following annual rates, calculated daily and payable monthly, based on each Fund’s average daily net assets:
| Percentage of Average Daily Net Assets |
| | | | | | |
| | | | | | |
| | | | | | |
Loomis Sayles have given binding undertakings to the Funds to waive management fees and/or reimburse certain expenses to limit the Funds’ operating expenses, exclusive of acquired fund fees and expenses, brokerage expenses, interest expense, taxes, organizational and extraordinary expenses such as litigation and indemnification expenses. These undertakings are in effect until April 30, 2024 except for High Income Fund and Strategic Income Fund which is in effect until April 30, 2025, may be terminated before then only with the consent of the Funds’ Board of Trustees, and are reevaluated on an annual basis. Management fees payable, as reflected on the Statements of Assets and Liabilities, is net of waivers and/or expense reimbursements, if any, pursuant to these undertakings. Waivers/reimbursements that exceed management fees payable are reflected on the Statements of Assets and Liabilities as receivable from investment adviser.
For the year ended December 31, 2023, the expense limits as a percentage of average daily net assets under the expense limitation agreement were as follows:
| Expense Limit as a Percentage of
Average Daily Net Assets |
| | | | | |
| | | | | |
Investment Grade Bond Fund | | | | | |
| | | | | |
| | | | | |
Prior to July 1, 2023, the expense limits as a percentage of average daily net assets under the expense limitation agreements for High Income Fund and Strategic Income Fund were as follows:
| Expense Limit as a Percentage of
Average Daily Net Assets |
| | | | | |
| | | | | |
| | | | | |
Loomis Sayles shall be permitted to recover expenses borne under the expense limitation agreements (whether through waiver of management fees or otherwise) on a class by class basis in later periods to the extent the annual operating expenses of a class fall below both (1) a class’ expense limitation ratio in place at the time such amounts were waived/reimbursed and (2) a class’ current applicable expense limitation ratio, provided, however, that a class is not obligated to pay such waived/reimbursed fees or expenses more than one year after the end of the fiscal year in which the fees or expenses were waived/reimbursed.
Notes to Financial Statements (continued)
For year ended December 31, 2023, the management fees and waivers of management fees for each Fund were as follows:
| | Contractual
Waivers of
Management
| | Percentage of
Average
Daily Net Assets |
| | |
| | | | | |
Investment Grade Bond Fund | | | | | |
| | | | | |
| | | | | |
| Management fee waivers are subject to possible recovery until December 31, 2024. |
No expenses were recovered for any of the Funds during the year ended December 31, 2023 under the terms of the expense limitation agreements.
b. Service and Distribution Fees. Natixis Distribution, LLC (“Natixis Distribution"), which is a wholly-owned subsidiary of Natixis Investment Managers, LLC, has entered into a distribution agreement with the Trusts. Pursuant to this agreement, Natixis Distribution serves as principal underwriter of the Funds of the Trusts.
Pursuant to Rule 12b-1 under the 1940 Act, the Trusts have adopted a Service Plan relating to each Fund’s Class A shares (the “Class A Plans”), a Distribution and Service Plan relating to each Fund’s Class C shares (the “Class C Plans”), and Investment Grade Bond Fund and Strategic Income Fund have adopted a Distribution Plan relating to their Admin Class shares (the “Admin Class Plans”).
Under the Class A Plans, each Fund pays Natixis Distribution a monthly service fee at an annual rate not to exceed 0.25% of the average daily net assets attributable to the Fund’s Class A shares, as reimbursement for expenses incurred by Natixis Distribution in providing personal services to investors in Class A shares and/or the maintenance of shareholder accounts.
Under the Class C Plans, each Fund pays Natixis Distribution a monthly service fee at an annual rate not to exceed 0.25% of the average daily net assets attributable to the Fund’s Class C shares, as compensation for services provided by Natixis Distribution in providing personal services to investors in Class C shares and/or the maintenance of shareholder accounts.
Also under the Class C Plans, each Fund pays Natixis Distribution a monthly distribution fee at an annual rate of 0.75% of the average daily net assets attributable to the Fund’s Class C shares, as compensation for services provided by Natixis Distribution in connection with the marketing or sale of Class C shares.
Under the Admin Class Plans, Investment Grade Bond Fund and Strategic Income Fund pay Natixis Distribution a monthly distribution fee at an annual rate not to exceed 0.25% of the average daily net assets attributable to the Funds’ Admin Class shares, as compensation for services provided by Natixis Distribution in connection with the marketing or sale of Admin Class shares or for payments made by Natixis Distribution to securities dealers or other financial intermediaries as commissions, asset-based sales charges or other compensation with respect to the sale of Admin Class shares, or for providing personal services to investors and/or the maintenance of shareholder accounts.
In addition, the Admin Class shares of Investment Grade Bond Fund and Strategic Income Fund may pay Natixis Distribution an administrative service fee, at an annual rate not to exceed 0.25% of the average daily net assets attributable to Admin Class shares. These fees are subsequently paid to securities dealers or financial intermediaries for providing personal services and/or account maintenance for their customers who hold such shares.
For the year ended December 31, 2023, the service and distribution fees for each Fund were as follows:
| | | |
| | | | | | |
| | | | | | |
Investment Grade Bond Fund | | | | | | |
| | | | | | |
| | | | | | |
c. Administrative Fees. Natixis Advisors, LLC (“Natixis Advisors”) provides certain administrative services for the Funds and contracts with State Street Bank to serve as sub-administrator. Natixis Advisors is a wholly-owned subsidiary of Natixis Investment Managers, LLC. Pursuant to an agreement among Natixis Funds Trusts, Loomis Sayles Funds Trusts, Natixis ETF Trusts and Natixis
Notes to Financial Statements (continued)
Advisors, each Fund pays Natixis Advisors monthly its pro rata portion of fees equal to an annual rate of 0.0540% of the first $15 billion of the average daily net assets of the Natixis Funds Trusts, Loomis Sayles Funds Trusts and Natixis ETF Trusts, 0.0500% of the next $15 billion, 0.0400% of the next $30 billion, 0.0275% of the next $30 billion and 0.0225% of such assets in excess of $90 billion, subject to an annual aggregate minimum fee for the Natixis Funds Trusts, Loomis Sayles Funds Trusts and Natixis ETF Trusts of $10 million, which is reevaluated on an annual basis.
For the year ended December 31, 2023, the administrative fees for each Fund were as follows:
| |
| |
Investment Grade Bond Fund | |
| |
| |
d. Sub-Transfer Agent Fees. Natixis Distribution has entered into agreements, which include servicing agreements, with financial intermediaries that provide recordkeeping, processing, shareholder communications and other services to customers of the intermediaries that hold positions in the Funds and has agreed to compensate the intermediaries for providing those services. Intermediaries transact with the Funds primarily through the use of omnibus accounts on behalf of their customers who hold positions in the Funds. These services would have been provided by the Funds’ transfer agent and other service providers if the shareholders’ accounts were maintained directly at the Funds’ transfer agent. Accordingly, the Funds have agreed to reimburse Natixis Distribution for all or a portion of the servicing fees paid to these intermediaries. The reimbursement amounts (sub-transfer agent fees) paid to Natixis Distribution are subject to a current per-account equivalent fee limit approved by the Funds’ Board of Trustees, which is based on fees for similar services paid to the Funds’ transfer agent and other service providers. Class N shares do not bear such expenses.
For the year ended December 31, 2023, the sub-transfer agent fees (which are reflected in transfer agent fees and expenses in the Statements of Operations) for each Fund were as follows:
| |
| |
Investment Grade Bond Fund | |
| |
| |
As of December 31, 2023, the Funds owe Natixis Distribution the following reimbursements for sub-transfer agent fees (which are reflected in the Statements of Assets and Liabilities as payable to distributor):
| Reimbursements
of Sub-Transfer
Agent Fees |
| |
Investment Grade Bond Fund | |
| |
| |
Sub-transfer agent fees attributable to Class A, Class C, Class Y, and Admin Class are allocated on a pro rata basis to each class based on the relative net assets of each class to the total net assets of those classes.
e. Commissions. Commissions (including CDSCs) on Fund shares retained by Natixis Distribution during the year ended December 31, 2023 were as follows:
| |
| |
Investment Grade Bond Fund | |
| |
| |
Notes to Financial Statements (continued)
f. Trustees Fees and Expenses. The Trusts do not pay any compensation directly to their officers or Trustees who are directors, officers or employees of Natixis Advisors, Natixis Distribution, Natixis Investment Managers, LLC or their affiliates. The Chairperson of the Board of Trustees receives a retainer fee at the annual rate of $369,000. The Chairperson does not receive any meeting attendance fees for Board of Trustees meetings or committee meetings that he attends. Each Independent Trustee (other than the Chairperson) receives, in the aggregate, a retainer fee at the annual rate of $210,000. Each Independent Trustee also receives a meeting attendance fee of $10,000 for each meeting of the Board of Trustees that he or she attends in person and $5,000 for each meeting of the Board of Trustees that he or she attends telephonically. In addition, the chairperson of the Contract Review Committee, the chairperson of the Audit Committee and the chairperson of the Governance Committee each receive an additional retainer fee at the annual rate of $20,000. Each Contract Review Committee member is compensated $6,000 for each Committee meeting that he or she attends in person and $3,000 for each meeting that he or she attends telephonically. Each Audit Committee member is compensated $6,000 for each Committee meeting that he or she attends in person and $3,000 for each meeting that he or she attends telephonically. Each Governance Committee member is compensated $2,500 for each Committee meeting that he or she attends either in person or telephonically. These fees are allocated among the funds in the Natixis Funds Trusts, Loomis Sayles Funds Trusts and Natixis ETF Trusts based on a formula that takes into account, among other factors, the relative net assets of each fund. Trustees are reimbursed for travel expenses in connection with attendance at meetings.
Effective January 1, 2024, the Chairperson of the Board of Trustees will receive a retainer fee at the annual rate of $385,000 and each Independent Trustee (other than the Chairperson) will receive, in the aggregate, a retainer fee at the annual rate of $225,000. Each Independent Trustee will receive a meeting attendance fee of $10,000 for each meeting of the Board of Trustees that he or she attends in person. The chairperson of the Contract Review Committee and the chairperson of the Audit Committee each will receive an additional retainer fee at the annual rate of $25,000. All other Trustees fees will remain unchanged.
A deferred compensation plan (the “Plan”) is available to the Trustees on a voluntary basis. The value of a participating Trustee’s deferral account is based on theoretical investments of deferred amounts, on the normal payment dates, in certain funds of the Natixis Funds Trusts, Loomis Sayles Funds Trusts and Natixis ETF Trusts as designated by the participating Trustees. Changes in the value of participants’ deferral accounts are allocated pro rata among the funds in the Natixis Funds Trusts, Loomis Sayles Funds Trusts and Natixis ETF Trusts and are normally reflected as Trustees’ fees and expenses in the Statements of Operations. Deferred amounts remain in the funds until distributed in accordance with the provisions of the Plan. The portions of the accrued obligations allocated to the Funds under the Plan are reflected as Deferred Trustees’ fees in the Statements of Assets and Liabilities.
Certain officers and employees of Natixis Advisors and Loomis Sayles are also officers and/or Trustees of the Trusts.
g. Reimbursement of Transfer Agent Fees and Expenses. Natixis Advisors has given a binding contractual undertaking to High Income Fund to reimburse any and all transfer agency expenses for the Fund's Class N shares. This undertaking is in effect through April 30, 2024 and is not subject to recovery under the expense limitation agreement described above.
For the year ended December 31, 2023, Natixis Advisors reimbursed High Income Fund $1,047 for transfer agency expenses related to Class N shares.
h. Affiliated Ownership. As of December 31, 2023, the percentage of each Fund’s net assets owned by affiliates is as follows:
| | |
| | |
Investment Grade Bond Fund | | |
Investment activities of affiliated shareholders could have material impacts on the Fund.
7.Class-Specific Transfer Agent Fees and Expenses. Transfer agent fees and expenses attributable to Class A, Class C, Class Y and Admin Class are allocated on a pro rata basis to each class based on the relative net assets of each class to the total net assets of those classes. Transfer agent fees and expenses attributable to Class N are allocated to Class N.
Notes to Financial Statements (continued)
For the year ended December 31, 2023 the Funds incurred the following class-specific transfer agent fees and expenses (including sub-transfer agent fees, where applicable):
| Transfer Agent Fees and Expenses |
| | | | | |
| | | | | |
Investment Grade Bond Fund | | | | | |
| | | | | |
| | | | | |
8.Line of Credit. Each Fund, together with certain other funds of Natixis Funds Trusts, Loomis Sayles Funds Trusts and Natixis ETF Trusts, entered into a syndicated, revolving, committed, unsecured line of credit with State Street Bank as administrative agent. The aggregate revolving commitment amount is $575,000,000. Any one Fund may borrow up to $402,500,000 under the line of credit agreement (as long as all borrowings by all Funds in the aggregate do not exceed the $575,000,000 limit at any time), subject to each Fund’s investment restrictions and its contractual obligations under the line of credit. Interest is charged to the Funds based upon the terms set forth in the agreement. In addition, a commitment fee of 0.15% per annum, payable at the end of each calendar quarter, is accrued and apportioned among the participating funds based on their average daily unused portion of the line of credit. The Funds paid certain legal fees in connection with the line of credit agreement, which are being amortized over a period of 364 days and are reflected in legal fees on the Statements of Operations. The unamortized balance is reflected as prepaid expenses on the Statements of Assets and Liabilities.
Prior to April 6, 2023, each Fund, together with certain other funds of Natixis Funds Trusts and Loomis Sayles Funds Trusts and Natixis ETF Trusts, entered into a $500,000,000 committed unsecured line of credit provided by State Street Bank. Any one Fund was able to borrow up to $350,000,000 under the line of credit agreement (as long as all borrowings by all Funds in the aggregate did not exceed the $500,000,000 limit at any time), subject to each Fund’s investment restrictions and its contractual obligations under the line of credit. Interest was charged to the Funds based upon the terms set forth in the agreement. In addition, a commitment fee of 0.15% per annum, payable at the end of each calendar quarter, was accrued and apportioned among the participating funds based on their average daily unused portion of the line of credit.
For the year ended December 31, 2023, none of the Funds had borrowings under this agreement.
9.Risk. The Funds’ investments in foreign securities, as applicable, may be subject to greater political, economic, environmental, credit/counterparty and information risks. The Funds’ investments in foreign securities also are subject to foreign currency fluctuations and other foreign currency-related risks. Foreign securities may be subject to higher volatility than U.S. securities, varying degrees of regulation and limited liquidity.
Geopolitical events (such as trading halts, sanctions or wars) could increase volatility and uncertainty in the financial markets and adversely affect regional and global economies. These, and other related events, could significantly impact a Fund's performance and the value of an investment in the Fund, even if the Fund does not have direct exposure to issuers in the country or countries involved.
10.Concentration of Ownership. From time to time, a Fund may have a concentration of one or more accounts constituting a significant percentage of shares outstanding. Investment activities by holders of such accounts could have material impacts on the Funds. As of December 31, 2023, based on management’s evaluation of the shareholder account base, the Funds had accounts representing controlling ownership of more than 5% of the Fund’s total outstanding shares. The number of such accounts, based on accounts that represent more than 5% of an individual class of shares, and the aggregate percentage of net assets represented by such holdings were as follows:
| Number of 5%
Non-Affiliated
Account Holders | Percentage of
Non-Affiliated
Ownership | Percentage of
Affiliated
Ownership
(Note 6h) | Total
Percentage of
Ownership |
| | | | |
| | | | |
Omnibus shareholder accounts for which Natixis Advisors understands that the intermediary has discretion over the underlying shareholder accounts or investment models where a shareholder account may be invested for a non-discretionary customer are
Notes to Financial Statements (continued)
included in the table above. For other omnibus accounts, the Fund does not have information on the individual shareholder accounts underlying the omnibus accounts; therefore, there could be other 5% shareholders in addition to those disclosed in the table above.
11.Capital Shares. Each Fund may issue an unlimited number of shares of beneficial interest, without par value. Transactions in capital shares were as follows:
|
| Year Ended
December 31, 2023 | Year Ended
December 31, 2022 |
| | | | |
| | | | |
Issued from the sale of shares | | | | |
Issued in connection with the reinvestment of distributions | | | | |
| | | | |
| | | | |
| | | | |
Issued from the sale of shares | | | | |
Issued in connection with the reinvestment of distributions | | | | |
| | | | |
| | | | |
| | | | |
Issued from the sale of shares | | | | |
Issued in connection with the reinvestment of distributions | | | | |
| | | | |
| | | | |
| | | | |
Issued from the sale of shares | | | | |
Issued in connection with the reinvestment of distributions | | | | |
| | | | |
| | | | |
Increase (decrease) from capital share transactions | | | | |
Notes to Financial Statements (continued)
11.Capital Shares (continued).
|
| Year Ended
December 31, 2023 | Year Ended
December 31, 2022 |
Investment Grade Bond Fund | | | | |
| | | | |
Issued from the sale of shares | | | | |
Issued in connection with the reinvestment of distributions | | | | |
| | | | |
| | | | |
| | | | |
Issued from the sale of shares | | | | |
Issued in connection with the reinvestment of distributions | | | | |
| | | | |
| | | | |
| | | | |
Issued from the sale of shares | | | | |
Issued in connection with the reinvestment of distributions | | | | |
| | | | |
| | | | |
| | | | |
Issued from the sale of shares | | | | |
Issued in connection with the reinvestment of distributions | | | | |
| | | | |
| | | | |
| | | | |
Issued from the sale of shares | | | | |
Issued in connection with the reinvestment of distributions | | | | |
| | | | |
| | | | |
Increase from capital share transactions | | | | |
Notes to Financial Statements (continued)
11.Capital Shares (continued).
|
| Year Ended
December 31, 2023 | Year Ended
December 31, 2022 |
| | | | |
| | | | |
Issued from the sale of shares | | | | |
Issued in connection with the reinvestment of distributions | | | | |
| | | | |
| | | | |
| | | | |
Issued from the sale of shares | | | | |
Issued in connection with the reinvestment of distributions | | | | |
| | | | |
| | | | |
| | | | |
Issued from the sale of shares | | | | |
Issued in connection with the reinvestment of distributions | | | | |
| | | | |
| | | | |
| | | | |
Issued from the sale of shares | | | | |
Issued in connection with the reinvestment of distributions | | | | |
| | | | |
| | | | |
Decrease from capital share transactions | | | | |
Notes to Financial Statements (continued)
11.Capital Shares (continued).
|
| Year Ended
December 31, 2023 | Year Ended
December 31, 2022 |
| | | | |
| | | | |
Issued from the sale of shares | | | | |
Issued in connection with the reinvestment of distributions | | | | |
| | | | |
| | | | |
| | | | |
Issued from the sale of shares | | | | |
Issued in connection with the reinvestment of distributions | | | | |
| | | | |
| | | | |
| | | | |
Issued from the sale of shares | | | | |
Issued in connection with the reinvestment of distributions | | | | |
| | | | |
| | | | |
| | | | |
Issued from the sale of shares | | | | |
Issued in connection with the reinvestment of distributions | | | | |
| | | | |
| | | | |
| | | | |
Issued from the sale of shares | | | | |
Issued in connection with the reinvestment of distributions | | | | |
| | | | |
| | | | |
Decrease from capital share transactions | | | | |
Report of Independent Registered Public Accounting Firm
To the Boards of Trustees of Loomis Sayles Funds II and Natixis Funds Trust II and Shareholders of Loomis Sayles High Income Fund, Loomis Sayles Investment Grade Bond Fund, Loomis Sayles Strategic Income Fund and Loomis Sayles Strategic Alpha Fund
Opinions on the Financial Statements
We have audited the accompanying statements of assets and liabilities, including the portfolios of investments, of Loomis Sayles High Income Fund, Loomis Sayles Investment Grade Bond Fund and Loomis Sayles Strategic Income Fund (three of the funds constituting Loomis Sayles Funds II) and Loomis Sayles Strategic Alpha Fund (one of the funds constituting Natixis Funds Trust II) (hereafter collectively referred to as the "Funds") as of December 31, 2023, the related statements of operations for the year ended December 31, 2023, the statements of changes in net assets for each of the two years in the period ended December 31, 2023, including the related notes, and the financial highlights for each of the periods indicated therein (collectively referred to as the “financial statements”). In our opinion, the financial statements present fairly, in all material respects, the financial position of each of the Funds as of December 31, 2023, the results of each of their operations for the year then ended, the changes in each of their net assets for each of the two years in the period ended December 31, 2023 and each of the financial highlights for each of the periods indicated therein, in conformity with accounting principles generally accepted in the United States of America.
Basis for Opinions
These financial statements are the responsibility of the Funds’ management. Our responsibility is to express an opinion on the Funds’ financial statements based on our audits. We are a public accounting firm registered with the Public Company Accounting Oversight Board (United States) (PCAOB) and are required to be independent with respect to the Funds in accordance with the U.S. federal securities laws and the applicable rules and regulations of the Securities and Exchange Commission and the PCAOB.
We conducted our audits of these financial statements in accordance with the standards of the PCAOB. Those standards require that we plan and perform the audit to obtain reasonable assurance about whether the financial statements are free of material misstatement, whether due to error or fraud.
Our audits included performing procedures to assess the risks of material misstatement of the financial statements, whether due to error or fraud, and performing procedures that respond to those risks. Such procedures included examining, on a test basis, evidence regarding the amounts and disclosures in the financial statements. Our audits also included evaluating the accounting principles used and significant estimates made by management, as well as evaluating the overall presentation of the financial statements. Our procedures included confirmation of securities owned as of December 31, 2023 by correspondence with the custodian, agent banks and brokers; when replies were not received from brokers, we performed other auditing procedures. We believe that our audits provide a reasonable basis for our opinions.
/s/PricewaterhouseCoopers LLP
Boston, Massachusetts
February 22, 2024
We have served as the auditor of one or more investment companies in Natixis Investment Company Complex since at least 1995. We have not been able to determine the specific year we began serving as auditor.
2023 U.S. Tax Distribution Information to Shareholders (Unaudited)
Corporate Dividends Received Deduction. For the fiscal year ended December 31, 2023, a percentage of dividends distributed by the Funds listed below qualify for the dividends received deduction for corporate shareholders. These percentages are as follows:
| |
| |
Investment Grade Bond Fund | |
| |
| |
Qualified Dividend Income. For the fiscal year ended December 31, 2023, the Funds below will designate up to the maximum amount allowable pursuant to the Internal Revenue Code as qualified dividend income eligible for reduced tax rates. These lower rates range from 0% to 20% depending on an individual’s tax bracket. If the Funds pay a distribution during calendar year 2023, complete information will be reported in conjunction with Form 1099-DIV. These percentages are noted below:
| |
| |
Investment Grade Bond Fund | |
| |
| |
Trustee and Officer Information
The tables below provide certain information regarding the Trustees and officers of Natixis Funds Trust II, Loomis Sayles Funds I and Loomis Sayles Funds II (the “Trusts”). Unless otherwise indicated, the address of all persons below is 888 Boylston Street, Suite 800, Boston, MA 02199-8197. The Funds' Statements of Additional Information include additional information about the Trustees of the Trusts and are available by calling Natixis Funds/Loomis Sayles Funds at 800-225-5478/800-633-3330.
| Position(s) Held with
the Trusts, Length
of Time Served and
| Principal
Occupation(s)
During Past 5 Years | Number of Portfolios
in Fund Complex
Overseen2and Other
Directorships Held
During Past 5 Years | Experience,
Qualifications,
Attributes, Skills for
Board Membership |
| | | | |
| Trustee since 2013
Contract Review
Committee Member | Executive Chairman of Bob’s Discount Furniture (retail) | 51
Director, Burlington Stores, Inc. (retail); Director, Rue La La
(e-commerce retail) | Significant experience on the Board and on the boards of other business organizations (including retail companies and a bank); executive experience (including at a retail company) |
| Trustee since 2015
Chairperson of the
Audit Committee | | 51
Formerly, Director of Triumph Group (aerospace industry) | Significant experience on the Board and executive experience (including his role as Vice President and treasurer of a defense company and experience at a financial services company) |
| Trustee since 2012
Chairperson of the
Governance Committee
and Contract Review
Committee Member | President, University of Massachusetts | | Significant experience on the Board and on the boards of other business organizations; experience as President of the University of Massachusetts; government experience (including as a member of the U.S. House of Representatives); academic experience |
Maureen B. Mitchell
(1951) | Trustee since 2017
Chairperson of the
Contract Review
Committee | | 51
Director, Sterling Bancorp (bank) | Significant experience on the Board; financial services industry and executive experience (including role as President of global sales and marketing at a financial services company) |
Trustee and Officer Information
| Position(s) Held with the Trusts, Length of Time Served and Term of Office1 | Principal Occupation(s) During Past 5 Years | Number of Portfolios in Fund Complex Overseen2and Other Directorships Held During Past 5 Years | Experience, Qualifications, Attributes, Skills for Board Membership |
Independent Trustees − continued |
| Trustee since 2016
Audit Committee
Member and
Governance
Committee
Member | Founding Partner, Breton Capital Management, LLC (private equity); formerly, Partner, STEP Partners, LLC (private equity) | 51
Director, Candidly (chemicals and biofuels) | Significant experience on the Board; financial services industry and executive experience (including roles as Chief Executive Officer of client management and asset servicing for a banking and financial services company) |
| Chairperson of the Board
of Trustees since 2021
Trustee since 2009
Ex Officio Member of the
Audit Committee,
Contract Review
Committee and
Governance Committee | Retired; formerly, Professor of Finance at Babson College | | Significant experience on the Board; experience as Director of the Division of Trading and Markets at the Securities and Exchange Commission; academic experience; training as an economist |
| Trustee since 2009
Contract Review
Committee
Member | | | Significant experience on the Board; mutual fund industry and executive experience (including roles as President and Chief Executive Officer for an investment adviser) |
Trustee and Officer Information
| Position(s) Held with the Trusts, Length of Time Served and Term of Office1 | Principal Occupation(s) During Past 5 Years | Number of Portfolios in Fund Complex Overseen2and Other Directorships Held During Past 5 Years | Experience, Qualifications, Attributes, Skills for Board Membership |
Independent Trustees − continued |
| Trustee since 2019
Audit Committee
Member and Governance
Committee Member | Managing Director of Accordia Partners, LLC (real estate development); President of Primary Corporation (real estate development); Managing Principal of Merrick Capital Partners (infrastructure finance) | 51
Advisor/Risk Management Committee, Eastern Bank (bank); Director, Apartment Investment and Management Company (real estate investment trust); formerly, Director, Ares Commercial Real Estate Corporation (real estate investment trust) | Experience on the Board and significant experience on the boards of other business organizations (including real estate companies and banks) |
| Trustee since 2005
Audit Committee
and Governance
Committee Member | Retired; formerly, Deputy Dean for Finance and Administration, Yale University School of Medicine | | Significant experience on the Board; executive experience in a variety of academic organizations (including roles as dean for finance and administration) |
| | | | |
(1965)
One Financial Center
Boston, MA 02111 | Trustee since 2015
President and Chief
Executive Officer of
Loomis Sayles Funds I
since 2015 | President, Chief Executive Officer and Chairman of the Board of Directors, Loomis, Sayles & Company, L.P. | | Significant experience on the Board; continuing service as President, Chief Executive Officer and Chairman of the Board of Directors of Loomis, Sayles & Company, L.P. |
Trustee and Officer Information
| Position(s) Held with the Trusts, Length of Time Served and Term of Office1 | Principal Occupation(s) During Past 5 Years | Number of Portfolios in Fund Complex Overseen2and Other Directorships Held During Past 5 Years | Experience, Qualifications, Attributes, Skills for Board Membership |
Interested Trustees − continued |
| Trustee since 2011
President and Chief
Executive Officer of
Natixis Funds Trust I and
Natixis Funds Trust II
since 2008; President of
Loomis Sayles Funds II
since 2008; Chief
Executive Officer of
Loomis Sayles Funds II
since 2015 | President and Chief Executive Officer, Natixis Advisors, LLC and Natixis Distribution, LLC | | Significant experience on the Board; experience as President and Chief Executive Officer of Natixis Advisors, LLC and Natixis Distribution, LLC |
| Each Trustee serves until retirement, resignation or removal from the Board. The current retirement age is 75. The position of Chairperson of the Board is appointed for a three-year term. |
| The Trustees of the Trusts serve as Trustees of a fund complex that includes all series of the Natixis Funds Trust I, Natixis Funds Trust II, Natixis Funds Trust IV, Gateway Trust, Loomis Sayles Funds I, Loomis Sayles Funds II, Natixis ETF Trust and Natixis ETF Trust II (collectively, the “Fund Complex”). |
| Mr. Charleston is deemed an “interested person” of the Trusts because he holds the following positions with an affiliated person of the Trusts: President, Chief Executive Officer and Chairman of the Board of Directors of Loomis, Sayles & Company, L.P. |
| Mr. Giunta is deemed an “interested person” of the Trusts because he holds the following positions with an affiliated person of the Trusts: President and Chief Executive Officer, Natixis Advisors, LLC and Natixis Distribution, LLC. |
Trustee and Officer Information
| Position(s) Held
with the Trusts | | |
| | | |
| Treasurer, Principal
Financial and
Accounting Officer | | Senior Vice President, Natixis Advisors, LLC and Natixis Distribution, LLC; formerly, Vice President, Natixis Advisors, LLC and Natixis Distribution, LLC; Assistant Treasurer of the Fund Complex |
| Secretary and Chief
Legal Officer | | Executive Vice President, General Counsel and Secretary, Natixis Advisors, LLC and Natixis Distribution, LLC; formerly, Executive Vice President and Chief Compliance Officer of Natixis Investment Managers (March 2019 – May 2022) and Senior Vice President and Head of Compliance, U.S. for Natixis Investment Managers (July 2011 – March 2019) |
| Chief Compliance
Officer, Assistant
Secretary and
Anti-Money
Laundering Officer | | Senior Vice President, Natixis Advisors, LLC and Natixis Distribution, LLC; formerly, Vice President, Head of Corporate Compliance, Global Atlantic Financial Group |
| Each officer of the Trusts serves for an indefinite term in accordance with the Trusts' current by-laws until the date his or her successor is elected and qualified, or until he or she sooner dies, retires, is removed or becomes disqualified. |
| Each person listed above, except as noted, holds the same position(s) with the Fund Complex. Previous positions during the past five years with Natixis Distribution, LLC, Natixis Advisors, LLC or Loomis, Sayles & Company, L.P. are omitted, if not materially different from an officer’s current position with such entity. |
This Page Intentionally Left Blank
˃To learn more about Natixis Funds products and services:
Visit: im.natixis.com Call: 800-225-5478
Before investing, consider the fund’s investment objectives, risks, charges, and expenses. Visit im.natixis.com or call 800-225-5478 for a prospectus or summary prospectus containing this and other information.
Contact us by mail:
If you wish to communicate with the funds’ Board of Trustees, you may do so by writing to:
Secretary of the Funds
Natixis Advisors, LLC
888 Boylston Street, Suite 800
Boston, MA 02199-8197
The correspondence must (a) be signed by the shareholder; (b) include the shareholder’s name and address; and (c) identify the fund(s), account number, share class, and number of shares held in that fund, as of a recent date.
Or by e-mail:
secretaryofthefunds@natixis.com (Communications regarding recommendations for Trustee candidates may not be submitted by e-mail.)
Please note: Unlike written correspondence, e-mail is not secure. Please do NOT include your account number, Social Security number, PIN, or any other non-public personal information in an e-mail communication because this information may be viewed by others.
 Exp. 3/1/20256255538.1.1IF58A-1223
This page not part of shareholder report
(b) Not Applicable.
Item 2. Code of Ethics.
The Registrant has adopted a code of ethics that applies to the Registrant’s principal executive officer, principal financial officer and persons performing similar functions. There have been no amendments or waivers of the Registrant’s code of ethics during the period.
Item 3. Audit Committee Financial Expert.
The Board of Trustees of the Registrant has established an audit committee. Mr. Richard A. Goglia, Mr. James P. Palermo, Mr. Kirk A. Sykes and Ms. Cynthia L. Walker are members of the audit committee and have been designated as “audit committee financial experts” by the Board of Trustees. Each of these individuals is also an Independent Trustee of the Registrant.
Item 4. Principal Accountant Fees and Services.
Fees billed by the Principal Accountant for services rendered to the Registrant.
The table below sets forth fees billed by the principal accountant, PricewaterhouseCoopers LLP, for the past two fiscal years for professional services rendered in connection with a) the audit of the Registrant’s annual financial statements and services provided in connection with regulatory filings; b) audit-related services (including services that are reasonably related to the performance of the audit of the Registrant’s financial statements but not reported under “Audit Fees”); c) tax compliance, tax advice and tax planning and d) all other fees billed for professional services rendered by the principal accountant to the Registrant, other than the services reported as a part of (a) through (c) of this Item.
| | | | | | | | | | | | | | | | | | | | | | | | | | | | | | | | |
| | | Audit fees | | | Audit-related fees1 | | | Tax fees2 | | | All other fees | |
| | | 1/1/22-
12/31/22 | | | 1/1/23-
12/31/23 | | | 1/1/22-
12/31/22 | | | 1/1/23-
12/31/23 | | | 1/1/22-
12/31/22 | | | 1/1/23-
12/31/23 | | | 1/1/22-
12/31/22 | | | 1/1/23-
12/31/23 | |
Loomis Sayles High Income Fund, Loomis Sayles International Growth Fund, Loomis Sayles Investment Grade Bond Fund and Loomis Sayles Strategic Income Fund | | $ | 198,969 | | | $ | 204,938 | | | $ | 2,257 | | | $ | 2,623 | | | $ | 34,383 | | | $ | 37,665 | | | $ | — | | | $ | — | |
| | 1. | Audit-related fees consist of: |
2022 & 2023 – performance of agreed-upon procedures related to the Registrant’s deferred compensation plan.
2022 & 2023 – review of the Registrant’s tax returns (2022 & 2023) and consulting services related to a portfolio investment (2023).
Aggregate fees billed to the Registrant for non-audit services during 2022 and 2023 were $36,640 and $40,288, respectively.
Fees billed by the Principal Accountant for services rendered to the Adviser and Control Affiliates.
The following table sets forth the fees billed by the Registrant’s principal accountant for non-audit services rendered to Loomis, Sayles & Company, L.P. (“Loomis Sayles”) and entities controlling, controlled by or under common control with Loomis Sayles (“Control Affiliates”) that provide ongoing services to the Registrant, for engagements that related directly to the operations and financial reporting of the Registrant for the last two fiscal years.
| | | | | | | | | | | | | | | | | | | | | | | | |
| | | Audit-related fees | | | Tax fees | | | All other fees | |
| | | 1/1/22-
12/31/22 | | | 1/1/23-
12/31/23 | | | 1/1/22-
12/31/22 | | | 1/1/23-
12/31/23 | | | 1/1/22-
12/31/22 | | | 1/1/23-
12/31/23 | |
Control Affiliates | | $ | — | | | $ | — | | | $ | — | | | $ | — | | | $ | 50,000 | | | $ | — | |
The following table sets forth the aggregate fees billed by the Registrant’s principal accountant for non-audit services rendered to Loomis Sayles and Control Affiliates that provide ongoing services to the Registrant, for the last two fiscal years, including the fees disclosed in the table above.
| | | | | | | | |
| | | Aggregate Non-Audit Fees | |
| | | 1/1/22-12/31/22 | | | 1/1/23-12/31/23 | |
Control Affiliates | | $ | 50,000 | | | $ | 110,000 | |
None of the services described above were approved pursuant to paragraph (c)(7)(i)(C) of Regulation S-X.
Audit Committee Pre Approval Policies.
Annually, the Registrant’s Audit Committee reviews the audit, audit-related, tax and other non-audit services together with the projected fees, for services proposed to be rendered to the Registrant and/or other entities for which pre-approval is required during the upcoming year. Any subsequent revisions to already pre-approved services or fees (including fee increases) and requests for pre-approval of new services would be presented for consideration quarterly as needed.
If, in the opinion of management, a proposed engagement by the Registrant’s independent accountants needs to commence before the next regularly scheduled Audit Committee meeting, any member of the Audit Committee who is an independent Trustee of the Registrant is authorized to pre-approve the engagement, but only for engagements to provide audit, audit-related and tax services. This approval is subject to review by the full Audit Committee at its next quarterly meeting. All other engagements require the approval of all the members of the Audit Committee.
Item 5. Audit Committee of Listed Registrants.
Not applicable.
Item 6. Schedule of Investments.
Included as part of the Report to Shareholders filed as Item 1 herewith.
Item 7. Disclosure of Proxy Voting Policies and Procedures for Closed-End Management Investment Companies.
Not applicable.
Item 8. Portfolio Managers of Closed-End Management Investment Companies
Not applicable.
Item 9. Purchases of Equity Securities by Closed-End Management Investment Companies and Affiliated Purchasers.
Not applicable.
Item 10. Submission of Matters to a Vote of Securities Holders.
There were no material changes to the procedures by which shareholders may recommend nominees to the Registrant’s Board of Trustees.
Item 11. Controls and Procedures.
The Registrant’s principal executive officer and principal financial officer have concluded that the Registrant’s disclosure controls and procedures are sufficient to ensure that information required to be disclosed by the Registrant in this Form N-CSR was recorded, processed, summarized and reported within the time periods specified in the Securities and Exchange Commission’s rules and forms, based upon such officers’ evaluation of these controls and procedures as of a date within 90 days of the filing date of the report.
There were no changes in the Registrant’s internal control over financial reporting that occurred during the period covered by the report that have materially affected, or are reasonably likely to materially affect, the Registrant’s internal control over financial reporting.
Item 12. Disclosure of Securities Lending Activities for Closed-End Management Investment Companies.
Not applicable.
Item 13. Recovery of Erroneously Awarded Compensation.
Not applicable.
Item 14. Exhibits.
SIGNATURES
Pursuant to the requirements of the Securities Exchange Act of 1934 and the Investment Company Act of 1940, the Registrant has duly caused this report to be signed on its behalf by the undersigned, thereunto duly authorized.
| | |
| Loomis Sayles Funds II |
| |
| By: | | /s/ David L. Giunta |
| |
| Name: | | David L. Giunta |
| Title: | | President and Chief Executive Officer |
| Date: | | February 22, 2024 |
Pursuant to the requirements of the Securities Exchange Act of 1934 and the Investment Company Act of 1940, this report has been signed by the following persons on behalf of the Registrant and in the capacities and on the dates indicated.
| | |
| By: | | /s/ David L. Giunta |
| |
| Name: | | David L. Giunta |
| Title: | | President and Chief Executive Officer |
| Date: | | February 22, 2024 |
| |
| By: | | /s/ Matthew Block |
| |
| Name: | | Matthew Block |
| Title: | | Treasurer and Principal Financial and Accounting Officer |
| Date: | | February 22, 2024 |