0000872649natixis:C000027671Member2023-03-310000872649natixis:C000018227Membernatixis:SectorEntertainmentSectorMember2024-09-300000872649natixis:C000018242Membernatixis:SectorAgencyCommercialMortgageMinusBackedSecuritiesSectorMember2024-09-300000872649natixis:NATIXISINDEXRussell3000Index17930BroadBasedIndexMember2016-09-300000872649natixis:NATIXISINDEXRussell3000Index18041BroadBasedIndexMember2017-02-28
UNITED STATES
SECURITIES AND EXCHANGE COMMISSION
Washington, D.C. 20549
FORM N-CSR
CERTIFIED SHAREHOLDER REPORT OF REGISTERED
MANAGEMENT INVESTMENT COMPANIES
Investment Company Act file number: 811-06241
Loomis Sayles Funds II
(Exact name of Registrant as specified in charter)
888 Boylston Street, Suite 800 Boston, Massachusetts 02199-8197
(Address of principal executive offices) (Zip code)
Susan McWhan Tobin, Esq.
Natixis Distribution, LLC
888 Boylston Street, Suite 800
Boston, Massachusetts 02199-8197
(Name and address of agent for service)
Registrant’s telephone number, including area code: (617) 449-2139
Date of fiscal year end: September 30
Date of reporting period: September 30, 2024
Item 1. Reports to Stockholders.
(a) The Registrant’s annual report transmitted to shareholders pursuant to Rule 30e-1 under the Investment Company Act of 1940 is as follows:
Loomis Sayles Global Allocation Fund
Annual Shareholder Report - September 30, 2024
This annual shareholder report contains important information about Loomis Sayles Global Allocation Fund for the period of October 1, 2023 to September 30, 2024. You can find additional information (including tax information) about the Fund at im.natixis.com/funddocuments. You can also request the information by contacting us at (800) 225-5478 or by contacting your financial intermediary directly.
What were the fund costs for the last year? (based on a hypothetical $10,000 investment)
| Class Name | Costs of a $10,000 investment | Costs paid as a percentage of a $10,000 investmentFootnote Reference† |
|---|
| Class Y | $104 | 0.91% |
| Footnote | Description |
Footnote† | Annualized for periods less than one year. |
How did the fund perform last year and what affected its performance?
Explanation of Fund Performance
Top Contributors to Performance
• In equities, the industrials, consumer staples and energy sectors were the largest contributors to relative performance.
• The largest three individual contributors to performance were Nvidia, Amazon and S&P Global.
• In fixed income, yield curve and duration positioning was a top contributor to performance over the period. In particular, allocations to the US dollar, Canadian dollar, and euro-pay markets contributed as yields fell over the year.
• Credit positioning contributed to performance over the period, particularly allocations to the Communications, Consumer Cyclical, and Consumer Non-Cyclical industries. Holdings of Dish, Uber and Teva Pharmaceuticals were strong individual contributors.
Top Detractors from Performance
• In equities, the consumer discretionary and communication services were the largest detractors from relative results. Not having exposure to the utilities sector also detracted on a relative basis.
• The largest three individual detractors from performance were Nike, Airbnb and Zions Bancorporation.
• In fixed income, select names in the Communications and Financial Other sectors detracted from performance. Within communications, cable satellite provider Altice particularly detracted. Within Financial Other, Icahn Enterprises was a notable underperformer.
• Although currency positioning as a whole contributed to performance, allocations to the Brazilian real and Mexican peso detracted over the period, as both currencies weakened against the US dollar over the year.
The Fund’s benchmarks are unmanaged indices used as a general measure of market performance. Calculations assume dividends and capital gains are reinvested. The tables do not reflect taxes shareholders might owe on any fund distributions or when they redeem their shares. You cannot invest directly in an index.
Total Return Based on a Hypothetical $10,000 Investment
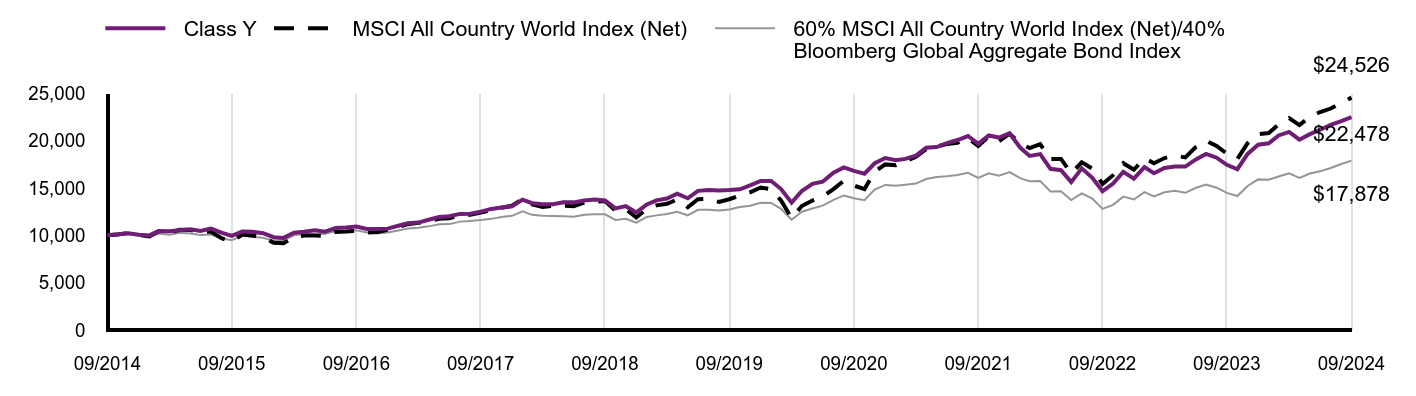
| Class Y | MSCI All Country World Index (Net) | 60% MSCI All Country World Index (Net)/40% Bloomberg Global Aggregate Bond Index |
|---|
| 09/2014 | $10,000 | $10,000 | $10,000 |
| 10/2014 | $10,106 | $10,070 | $10,043 |
| 11/2014 | $10,216 | $10,239 | $10,129 |
| 12/2014 | $10,051 | $10,041 | $9,984 |
| 01/2015 | $9,987 | $9,884 | $9,884 |
| 02/2015 | $10,442 | $10,435 | $10,182 |
| 03/2015 | $10,420 | $10,273 | $10,048 |
| 04/2015 | $10,522 | $10,571 | $10,266 |
| 05/2015 | $10,629 | $10,557 | $10,184 |
| 06/2015 | $10,447 | $10,309 | $10,023 |
| 07/2015 | $10,698 | $10,398 | $10,084 |
| 08/2015 | $10,276 | $9,685 | $9,674 |
| 09/2015 | $9,928 | $9,334 | $9,483 |
| 10/2015 | $10,383 | $10,067 | $9,938 |
| 11/2015 | $10,367 | $9,984 | $9,823 |
| 12/2015 | $10,221 | $9,804 | $9,737 |
| 01/2016 | $9,797 | $9,213 | $9,419 |
| 02/2016 | $9,723 | $9,149 | $9,464 |
| 03/2016 | $10,261 | $9,827 | $9,987 |
| 04/2016 | $10,374 | $9,972 | $10,128 |
| 05/2016 | $10,516 | $9,985 | $10,082 |
| 06/2016 | $10,374 | $9,924 | $10,163 |
| 07/2016 | $10,776 | $10,352 | $10,456 |
| 08/2016 | $10,821 | $10,387 | $10,457 |
| 09/2016 | $10,917 | $10,451 | $10,518 |
| 10/2016 | $10,663 | $10,273 | $10,295 |
| 11/2016 | $10,657 | $10,351 | $10,178 |
| 12/2016 | $10,699 | $10,575 | $10,291 |
| 01/2017 | $11,003 | $10,864 | $10,506 |
| 02/2017 | $11,262 | $11,169 | $10,703 |
| 03/2017 | $11,336 | $11,305 | $10,788 |
| 04/2017 | $11,641 | $11,482 | $10,938 |
| 05/2017 | $11,917 | $11,735 | $11,150 |
| 06/2017 | $12,009 | $11,789 | $11,177 |
| 07/2017 | $12,256 | $12,118 | $11,439 |
| 08/2017 | $12,267 | $12,164 | $11,511 |
| 09/2017 | $12,491 | $12,399 | $11,603 |
| 10/2017 | $12,779 | $12,657 | $11,730 |
| 11/2017 | $12,939 | $12,902 | $11,918 |
| 12/2017 | $13,064 | $13,110 | $12,050 |
| 01/2018 | $13,759 | $13,850 | $12,516 |
| 02/2018 | $13,382 | $13,268 | $12,156 |
| 03/2018 | $13,270 | $12,984 | $12,051 |
| 04/2018 | $13,270 | $13,108 | $12,043 |
| 05/2018 | $13,476 | $13,124 | $12,016 |
| 06/2018 | $13,470 | $13,053 | $11,955 |
| 07/2018 | $13,664 | $13,447 | $12,164 |
| 08/2018 | $13,776 | $13,552 | $12,226 |
| 09/2018 | $13,676 | $13,611 | $12,216 |
| 10/2018 | $12,835 | $12,591 | $11,612 |
| 11/2018 | $13,070 | $12,776 | $11,728 |
| 12/2018 | $12,406 | $11,876 | $11,328 |
| 01/2019 | $13,258 | $12,813 | $11,933 |
| 02/2019 | $13,684 | $13,156 | $12,097 |
| 03/2019 | $13,875 | $13,322 | $12,249 |
| 04/2019 | $14,381 | $13,771 | $12,483 |
| 05/2019 | $13,900 | $12,955 | $12,106 |
| 06/2019 | $14,683 | $13,803 | $12,689 |
| 07/2019 | $14,776 | $13,843 | $12,697 |
| 08/2019 | $14,727 | $13,515 | $12,620 |
| 09/2019 | $14,764 | $13,799 | $12,728 |
| 10/2019 | $14,850 | $14,177 | $12,971 |
| 11/2019 | $15,257 | $14,523 | $13,121 |
| 12/2019 | $15,731 | $15,034 | $13,429 |
| 01/2020 | $15,731 | $14,868 | $13,409 |
| 02/2020 | $14,874 | $13,667 | $12,795 |
| 03/2020 | $13,438 | $11,822 | $11,644 |
| 04/2020 | $14,670 | $13,089 | $12,484 |
| 05/2020 | $15,426 | $13,658 | $12,831 |
| 06/2020 | $15,655 | $14,094 | $13,123 |
| 07/2020 | $16,576 | $14,840 | $13,707 |
| 08/2020 | $17,155 | $15,748 | $14,202 |
| 09/2020 | $16,786 | $15,240 | $13,907 |
| 10/2020 | $16,494 | $14,870 | $13,709 |
| 11/2020 | $17,599 | $16,703 | $14,823 |
| 12/2020 | $18,151 | $17,478 | $15,315 |
| 01/2021 | $17,915 | $17,399 | $15,220 |
| 02/2021 | $18,063 | $17,802 | $15,326 |
| 03/2021 | $18,408 | $18,277 | $15,454 |
| 04/2021 | $19,231 | $19,076 | $15,938 |
| 05/2021 | $19,312 | $19,373 | $16,146 |
| 06/2021 | $19,724 | $19,628 | $16,217 |
| 07/2021 | $20,049 | $19,764 | $16,370 |
| 08/2021 | $20,474 | $20,258 | $16,589 |
| 09/2021 | $19,643 | $19,422 | $16,060 |
| 10/2021 | $20,535 | $20,413 | $16,536 |
| 11/2021 | $20,312 | $19,921 | $16,278 |
| 12/2021 | $20,762 | $20,718 | $16,660 |
| 01/2022 | $19,256 | $19,701 | $16,032 |
| 02/2022 | $18,376 | $19,192 | $15,707 |
| 03/2022 | $18,565 | $19,608 | $15,720 |
| 04/2022 | $17,008 | $18,038 | $14,621 |
| 05/2022 | $16,863 | $18,059 | $14,647 |
| 06/2022 | $15,604 | $16,537 | $13,718 |
| 07/2022 | $17,059 | $17,692 | $14,410 |
| 08/2022 | $16,062 | $17,040 | $13,864 |
| 09/2022 | $14,651 | $15,409 | $12,783 |
| 10/2022 | $15,451 | $16,339 | $13,210 |
| 11/2022 | $16,695 | $17,606 | $14,074 |
| 12/2022 | $15,975 | $16,913 | $13,772 |
| 01/2023 | $17,194 | $18,126 | $14,545 |
| 02/2023 | $16,545 | $17,606 | $14,101 |
| 03/2023 | $17,098 | $18,149 | $14,541 |
| 04/2023 | $17,258 | $18,410 | $14,692 |
| 05/2023 | $17,250 | $18,213 | $14,482 |
| 06/2023 | $17,979 | $19,270 | $14,987 |
| 07/2023 | $18,581 | $19,976 | $15,357 |
| 08/2023 | $18,188 | $19,418 | $15,016 |
| 09/2023 | $17,434 | $18,615 | $14,468 |
| 10/2023 | $16,969 | $18,055 | $14,137 |
| 11/2023 | $18,589 | $19,721 | $15,206 |
| 12/2023 | $19,559 | $20,669 | $15,897 |
| 01/2024 | $19,709 | $20,790 | $15,865 |
| 02/2024 | $20,535 | $21,682 | $16,193 |
| 03/2024 | $20,910 | $22,363 | $16,534 |
| 04/2024 | $20,085 | $21,625 | $16,040 |
| 05/2024 | $20,668 | $22,503 | $16,515 |
| 06/2024 | $21,136 | $23,004 | $16,745 |
| 07/2024 | $21,661 | $23,375 | $17,092 |
| 08/2024 | $22,036 | $23,969 | $17,514 |
| 09/2024 | $22,478 | $24,526 | $17,878 |
Performance data shown represents past performance and is no guarantee of, and is not necessarily indicative of, future results. Total return and value will vary, and you may have a gain or loss when shares are sold. Current performance may be lower or higher than quoted. For the most recent month-end performance, visit im.natixis.com/en-us/products/mutual-funds/price-and-performance.
Average Annual Total Returns (%)
| 1 Year | 5 Years | 10 Years | Since Inception 2/1/06 |
|---|
| Class Y | 28.93% | 8.77% | 8.44% | 9.40% |
| MSCI All Country World Index (Net) | 31.76% | 12.19% | 9.39% | -% |
| 60% MSCI All Country World Index (Net)/40% Bloomberg Global Aggregate Bond Index | 23.57% | 7.03% | 5.98% | -% |
| Total Net Assets | $3,088,807,008 |
| # of Portfolio Holdings (including overnight repurchase agreements and derivatives) | 508 |
| Portfolio Turnover Rate | 22% |
| Total Advisory Fees Paid (after waiver/reimbursement, if applicable) | $21,777,170 |
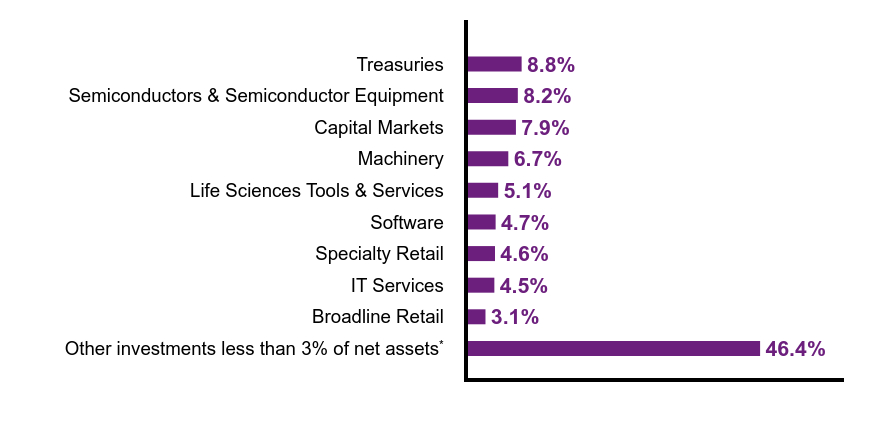
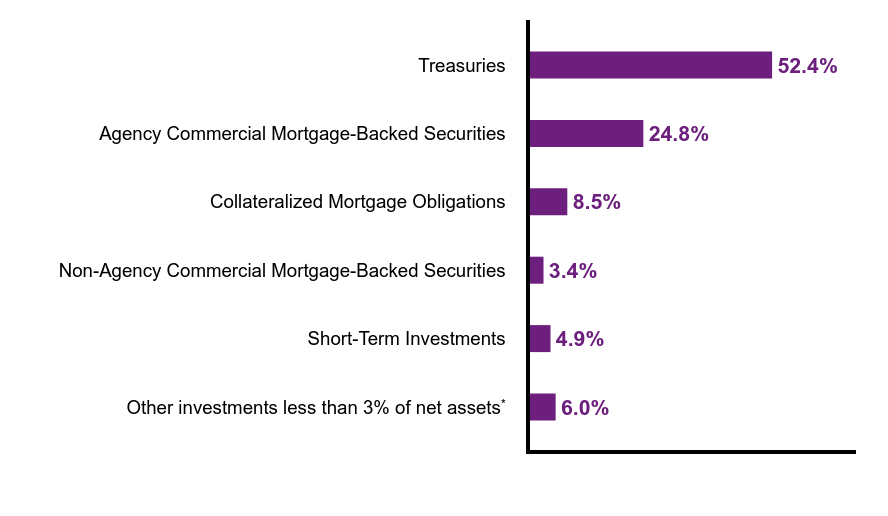
What did the Fund invest in? (% of Net Assets)
| Value | Value |
|---|
Other investments less than 3% of net assetsFootnote Reference* | 46.4% |
| Broadline Retail | 3.1% |
| IT Services | 4.5% |
| Specialty Retail | 4.6% |
| Software | 4.7% |
| Life Sciences Tools & Services | 5.1% |
| Machinery | 6.7% |
| Capital Markets | 7.9% |
| Semiconductors & Semiconductor Equipment | 8.2% |
| Treasuries | 8.8% |
| Footnote | Description |
Footnote* | Net of other assets less liabilities (including forward foreign currency contracts and futures contracts) |
| S&P Global, Inc. | 3.5% |
| NVIDIA Corp. | 3.4% |
| Amazon.com, Inc. | 3.1% |
| Alphabet, Inc., Class A | 2.9% |
| Mastercard, Inc., Class A | 2.9% |
| Linde PLC | 2.6% |
| UnitedHealth Group, Inc. | 2.6% |
| Atlas Copco AB, Class A | 2.5% |
| Roper Technologies, Inc. | 2.5% |
| Parker-Hannifin Corp. | 2.4% |
There were no material fund changes during the period.
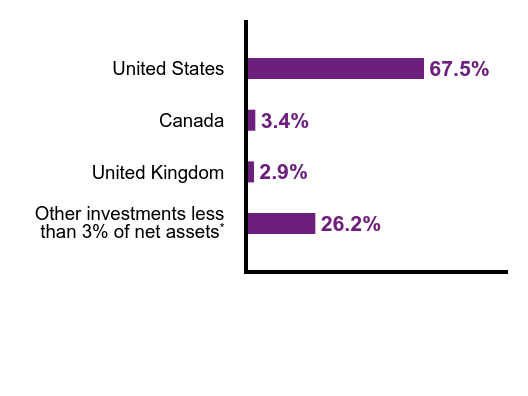
| Value | Value |
|---|
Other investments less than 3% of net assetsFootnote Reference* | 26.2% |
| United Kingdom | 2.9% |
| Canada | 3.4% |
| United States | 67.5% |
| Footnote | Description |
Footnote* | Net of other assets less liabilities (including forward foreign currency contracts and futures contracts) |
There were no changes in or disagreements with Accountants during the period.
For additional information about the Fund; including its prospectus, financial information, holdings and proxy information, scan the QR code or visit im.natixis.com/funddocuments.
Loomis Sayles Global Allocation Fund
Annual Shareholder Report
September 30, 2024
Loomis Sayles Global Allocation Fund
Annual Shareholder Report - September 30, 2024
This annual shareholder report contains important information about Loomis Sayles Global Allocation Fund for the period of October 1, 2023 to September 30, 2024. You can find additional information (including tax information) about the Fund at im.natixis.com/funddocuments. You can also request the information by contacting us at (800) 225-5478 or by contacting your financial intermediary directly.
What were the fund costs for the last year? (based on a hypothetical $10,000 investment)
| Class Name | Costs of a $10,000 investment | Costs paid as a percentage of a $10,000 investmentFootnote Reference† |
|---|
| Class A | $133 | 1.16% |
| Footnote | Description |
Footnote† | Annualized for periods less than one year. |
How did the fund perform last year and what affected its performance?
Explanation of Fund Performance
Top Contributors to Performance
• In equities, the industrials, consumer staples and energy sectors were the largest contributors to relative performance.
• The largest three individual contributors to performance were Nvidia, Amazon and S&P Global.
• In fixed income, yield curve and duration positioning was a top contributor to performance over the period. In particular, allocations to the US dollar, Canadian dollar, and euro-pay markets contributed as yields fell over the year.
• Credit positioning contributed to performance over the period, particularly allocations to the Communications, Consumer Cyclical, and Consumer Non-Cyclical industries. Holdings of Dish, Uber and Teva Pharmaceuticals were strong individual contributors.
Top Detractors from Performance
• In equities, the consumer discretionary and communication services were the largest detractors from relative results. Not having exposure to the utilities sector also detracted on a relative basis.
• The largest three individual detractors from performance were Nike, Airbnb and Zions Bancorporation.
• In fixed income, select names in the Communications and Financial Other sectors detracted from performance. Within communications, cable satellite provider Altice particularly detracted. Within Financial Other, Icahn Enterprises was a notable underperformer.
• Although currency positioning as a whole contributed to performance, allocations to the Brazilian real and Mexican peso detracted over the period, as both currencies weakened against the US dollar over the year.
The Fund’s benchmarks are unmanaged indices used as a general measure of market performance. Calculations assume dividends and capital gains are reinvested. The tables do not reflect taxes shareholders might owe on any fund distributions or when they redeem their shares. You cannot invest directly in an index.
Total Return Based on a Hypothetical $10,000 Investment
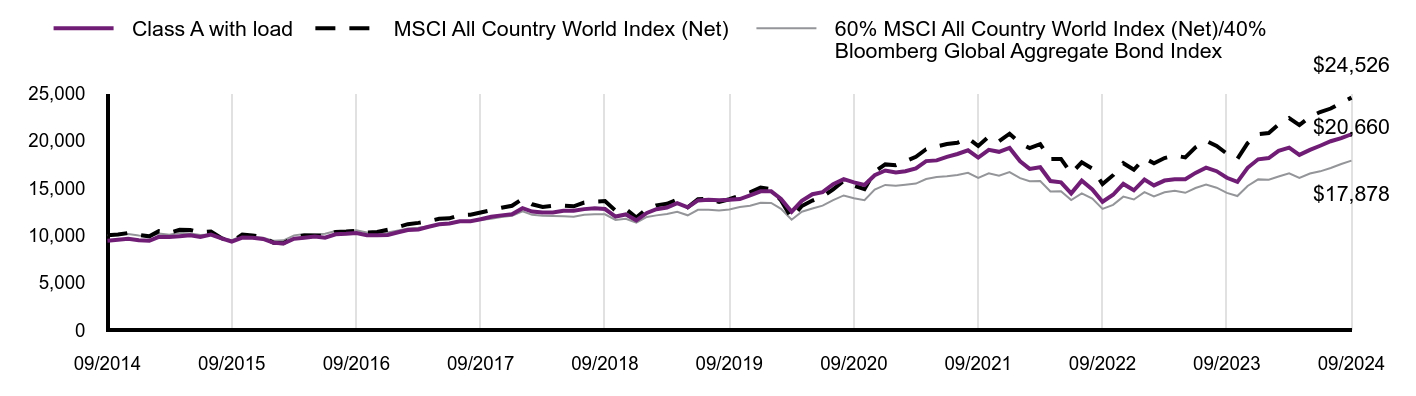
| Class A with load | MSCI All Country World Index (Net) | 60% MSCI All Country World Index (Net)/40% Bloomberg Global Aggregate Bond Index |
|---|
| 09/2014 | $9,423 | $10,000 | $10,000 |
| 10/2014 | $9,523 | $10,070 | $10,043 |
| 11/2014 | $9,623 | $10,239 | $10,129 |
| 12/2014 | $9,464 | $10,041 | $9,984 |
| 01/2015 | $9,409 | $9,884 | $9,884 |
| 02/2015 | $9,834 | $10,435 | $10,182 |
| 03/2015 | $9,809 | $10,273 | $10,048 |
| 04/2015 | $9,900 | $10,571 | $10,266 |
| 05/2015 | $10,001 | $10,557 | $10,184 |
| 06/2015 | $9,829 | $10,309 | $10,023 |
| 07/2015 | $10,062 | $10,398 | $10,084 |
| 08/2015 | $9,662 | $9,685 | $9,674 |
| 09/2015 | $9,338 | $9,334 | $9,483 |
| 10/2015 | $9,758 | $10,067 | $9,938 |
| 11/2015 | $9,738 | $9,984 | $9,823 |
| 12/2015 | $9,608 | $9,804 | $9,737 |
| 01/2016 | $9,202 | $9,213 | $9,419 |
| 02/2016 | $9,132 | $9,149 | $9,464 |
| 03/2016 | $9,634 | $9,827 | $9,987 |
| 04/2016 | $9,741 | $9,972 | $10,128 |
| 05/2016 | $9,869 | $9,985 | $10,082 |
| 06/2016 | $9,736 | $9,924 | $10,163 |
| 07/2016 | $10,104 | $10,352 | $10,456 |
| 08/2016 | $10,152 | $10,387 | $10,457 |
| 09/2016 | $10,238 | $10,451 | $10,518 |
| 10/2016 | $9,998 | $10,273 | $10,295 |
| 11/2016 | $9,992 | $10,351 | $10,178 |
| 12/2016 | $10,027 | $10,575 | $10,291 |
| 01/2017 | $10,313 | $10,864 | $10,506 |
| 02/2017 | $10,551 | $11,169 | $10,703 |
| 03/2017 | $10,616 | $11,305 | $10,788 |
| 04/2017 | $10,898 | $11,482 | $10,938 |
| 05/2017 | $11,152 | $11,735 | $11,150 |
| 06/2017 | $11,238 | $11,789 | $11,177 |
| 07/2017 | $11,471 | $12,118 | $11,439 |
| 08/2017 | $11,482 | $12,164 | $11,511 |
| 09/2017 | $11,682 | $12,399 | $11,603 |
| 10/2017 | $11,952 | $12,657 | $11,730 |
| 11/2017 | $12,098 | $12,902 | $11,918 |
| 12/2017 | $12,211 | $13,110 | $12,050 |
| 01/2018 | $12,858 | $13,850 | $12,516 |
| 02/2018 | $12,504 | $13,268 | $12,156 |
| 03/2018 | $12,399 | $12,984 | $12,051 |
| 04/2018 | $12,394 | $13,108 | $12,043 |
| 05/2018 | $12,582 | $13,124 | $12,016 |
| 06/2018 | $12,576 | $13,053 | $11,955 |
| 07/2018 | $12,759 | $13,447 | $12,164 |
| 08/2018 | $12,858 | $13,552 | $12,226 |
| 09/2018 | $12,764 | $13,611 | $12,216 |
| 10/2018 | $11,974 | $12,591 | $11,612 |
| 11/2018 | $12,195 | $12,776 | $11,728 |
| 12/2018 | $11,572 | $11,876 | $11,328 |
| 01/2019 | $12,359 | $12,813 | $11,933 |
| 02/2019 | $12,752 | $13,156 | $12,097 |
| 03/2019 | $12,926 | $13,322 | $12,249 |
| 04/2019 | $13,394 | $13,771 | $12,483 |
| 05/2019 | $12,949 | $12,955 | $12,106 |
| 06/2019 | $13,672 | $13,803 | $12,689 |
| 07/2019 | $13,759 | $13,843 | $12,697 |
| 08/2019 | $13,707 | $13,515 | $12,620 |
| 09/2019 | $13,741 | $13,799 | $12,728 |
| 10/2019 | $13,816 | $14,177 | $12,971 |
| 11/2019 | $14,198 | $14,523 | $13,121 |
| 12/2019 | $14,634 | $15,034 | $13,429 |
| 01/2020 | $14,634 | $14,868 | $13,409 |
| 02/2020 | $13,826 | $13,667 | $12,795 |
| 03/2020 | $12,489 | $11,822 | $11,644 |
| 04/2020 | $13,636 | $13,089 | $12,484 |
| 05/2020 | $14,331 | $13,658 | $12,831 |
| 06/2020 | $14,545 | $14,094 | $13,123 |
| 07/2020 | $15,394 | $14,840 | $13,707 |
| 08/2020 | $15,929 | $15,748 | $14,202 |
| 09/2020 | $15,584 | $15,240 | $13,907 |
| 10/2020 | $15,311 | $14,870 | $13,709 |
| 11/2020 | $16,327 | $16,703 | $14,823 |
| 12/2020 | $16,837 | $17,478 | $15,315 |
| 01/2021 | $16,616 | $17,399 | $15,220 |
| 02/2021 | $16,755 | $17,802 | $15,326 |
| 03/2021 | $17,064 | $18,277 | $15,454 |
| 04/2021 | $17,827 | $19,076 | $15,938 |
| 05/2021 | $17,902 | $19,373 | $16,146 |
| 06/2021 | $18,274 | $19,628 | $16,217 |
| 07/2021 | $18,577 | $19,764 | $16,370 |
| 08/2021 | $18,961 | $20,258 | $16,589 |
| 09/2021 | $18,192 | $19,422 | $16,060 |
| 10/2021 | $19,012 | $20,413 | $16,536 |
| 11/2021 | $18,804 | $19,921 | $16,278 |
| 12/2021 | $19,213 | $20,718 | $16,660 |
| 01/2022 | $17,814 | $19,701 | $16,032 |
| 02/2022 | $17,000 | $19,192 | $15,707 |
| 03/2022 | $17,176 | $19,608 | $15,720 |
| 04/2022 | $15,723 | $18,038 | $14,621 |
| 05/2022 | $15,588 | $18,059 | $14,647 |
| 06/2022 | $14,420 | $16,537 | $13,718 |
| 07/2022 | $15,764 | $17,692 | $14,410 |
| 08/2022 | $14,841 | $17,040 | $13,864 |
| 09/2022 | $13,537 | $15,409 | $12,783 |
| 10/2022 | $14,271 | $16,339 | $13,210 |
| 11/2022 | $15,418 | $17,606 | $14,074 |
| 12/2022 | $14,746 | $16,913 | $13,772 |
| 01/2023 | $15,870 | $18,126 | $14,545 |
| 02/2023 | $15,263 | $17,606 | $14,101 |
| 03/2023 | $15,772 | $18,149 | $14,541 |
| 04/2023 | $15,914 | $18,410 | $14,692 |
| 05/2023 | $15,914 | $18,213 | $14,482 |
| 06/2023 | $16,581 | $19,270 | $14,987 |
| 07/2023 | $17,135 | $19,976 | $15,357 |
| 08/2023 | $16,761 | $19,418 | $15,016 |
| 09/2023 | $16,064 | $18,615 | $14,468 |
| 10/2023 | $15,637 | $18,055 | $14,137 |
| 11/2023 | $17,120 | $19,721 | $15,206 |
| 12/2023 | $18,015 | $20,669 | $15,897 |
| 01/2024 | $18,147 | $20,790 | $15,865 |
| 02/2024 | $18,902 | $21,682 | $16,193 |
| 03/2024 | $19,244 | $22,363 | $16,534 |
| 04/2024 | $18,482 | $21,625 | $16,040 |
| 05/2024 | $19,010 | $22,503 | $16,515 |
| 06/2024 | $19,446 | $23,004 | $16,745 |
| 07/2024 | $19,921 | $23,375 | $17,092 |
| 08/2024 | $20,255 | $23,969 | $17,514 |
| 09/2024 | $20,660 | $24,526 | $17,878 |
Performance data shown represents past performance and is no guarantee of, and is not necessarily indicative of, future results. Total return and value will vary, and you may have a gain or loss when shares are sold. Current performance may be lower or higher than quoted. For the most recent month-end performance, visit im.natixis.com/en-us/products/mutual-funds/price-and-performance.
Average Annual Total Returns (%)
| 1 Year | 5 Years | 10 Years | Since Inception 2/1/06 |
|---|
| Class A at NAV | 28.61% | 8.50% | 8.17% | 9.13% |
Class A with 5.75% MSCFootnote Reference1 | 21.20% | 7.22% | 7.53% | 8.90% |
| MSCI All Country World Index (Net) | 31.76% | 12.19% | 9.39% | -% |
| 60% MSCI All Country World Index (Net)/40% Bloomberg Global Aggregate Bond Index | 23.57% | 7.03% | 5.98% | -% |
| Footnote | Description |
Footnote1 | Maximum sales charge |
| Total Net Assets | $3,088,807,008 |
| # of Portfolio Holdings (including overnight repurchase agreements and derivatives) | 508 |
| Portfolio Turnover Rate | 22% |
| Total Advisory Fees Paid (after waiver/reimbursement, if applicable) | $21,777,170 |
What did the Fund invest in? (% of Net Assets)
| Value | Value |
|---|
Other investments less than 3% of net assetsFootnote Reference* | 46.4% |
| Broadline Retail | 3.1% |
| IT Services | 4.5% |
| Specialty Retail | 4.6% |
| Software | 4.7% |
| Life Sciences Tools & Services | 5.1% |
| Machinery | 6.7% |
| Capital Markets | 7.9% |
| Semiconductors & Semiconductor Equipment | 8.2% |
| Treasuries | 8.8% |
| Footnote | Description |
Footnote* | Net of other assets less liabilities (including forward foreign currency contracts and futures contracts) |
| S&P Global, Inc. | 3.5% |
| NVIDIA Corp. | 3.4% |
| Amazon.com, Inc. | 3.1% |
| Alphabet, Inc., Class A | 2.9% |
| Mastercard, Inc., Class A | 2.9% |
| Linde PLC | 2.6% |
| UnitedHealth Group, Inc. | 2.6% |
| Atlas Copco AB, Class A | 2.5% |
| Roper Technologies, Inc. | 2.5% |
| Parker-Hannifin Corp. | 2.4% |
There were no material fund changes during the period.
| Value | Value |
|---|
Other investments less than 3% of net assetsFootnote Reference* | 26.2% |
| United Kingdom | 2.9% |
| Canada | 3.4% |
| United States | 67.5% |
| Footnote | Description |
Footnote* | Net of other assets less liabilities (including forward foreign currency contracts and futures contracts) |
There were no changes in or disagreements with Accountants during the period.
For additional information about the Fund; including its prospectus, financial information, holdings and proxy information, scan the QR code or visit im.natixis.com/funddocuments.
Loomis Sayles Global Allocation Fund
Annual Shareholder Report
September 30, 2024
Loomis Sayles Global Allocation Fund
Annual Shareholder Report - September 30, 2024
This annual shareholder report contains important information about Loomis Sayles Global Allocation Fund for the period of October 1, 2023 to September 30, 2024. You can find additional information (including tax information) about the Fund at im.natixis.com/funddocuments. You can also request the information by contacting us at (800) 225-5478 or by contacting your financial intermediary directly.
What were the fund costs for the last year? (based on a hypothetical $10,000 investment)
| Class Name | Costs of a $10,000 investment | Costs paid as a percentage of a $10,000 investmentFootnote Reference† |
|---|
| Class C | $217 | 1.91% |
| Footnote | Description |
Footnote† | Annualized for periods less than one year. |
How did the fund perform last year and what affected its performance?
Explanation of Fund Performance
Top Contributors to Performance
• In equities, the industrials, consumer staples and energy sectors were the largest contributors to relative performance.
• The largest three individual contributors to performance were Nvidia, Amazon and S&P Global.
• In fixed income, yield curve and duration positioning was a top contributor to performance over the period. In particular, allocations to the US dollar, Canadian dollar, and euro-pay markets contributed as yields fell over the year.
• Credit positioning contributed to performance over the period, particularly allocations to the Communications, Consumer Cyclical, and Consumer Non-Cyclical industries. Holdings of Dish, Uber and Teva Pharmaceuticals were strong individual contributors.
Top Detractors from Performance
• In equities, the consumer discretionary and communication services were the largest detractors from relative results. Not having exposure to the utilities sector also detracted on a relative basis.
• The largest three individual detractors from performance were Nike, Airbnb and Zions Bancorporation.
• In fixed income, select names in the Communications and Financial Other sectors detracted from performance. Within communications, cable satellite provider Altice particularly detracted. Within Financial Other, Icahn Enterprises was a notable underperformer.
• Although currency positioning as a whole contributed to performance, allocations to the Brazilian real and Mexican peso detracted over the period, as both currencies weakened against the US dollar over the year.
The Fund’s benchmarks are unmanaged indices used as a general measure of market performance. Calculations assume dividends and capital gains are reinvested. The tables do not reflect taxes shareholders might owe on any fund distributions or when they redeem their shares. You cannot invest directly in an index.
Total Return Based on a Hypothetical $10,000 Investment
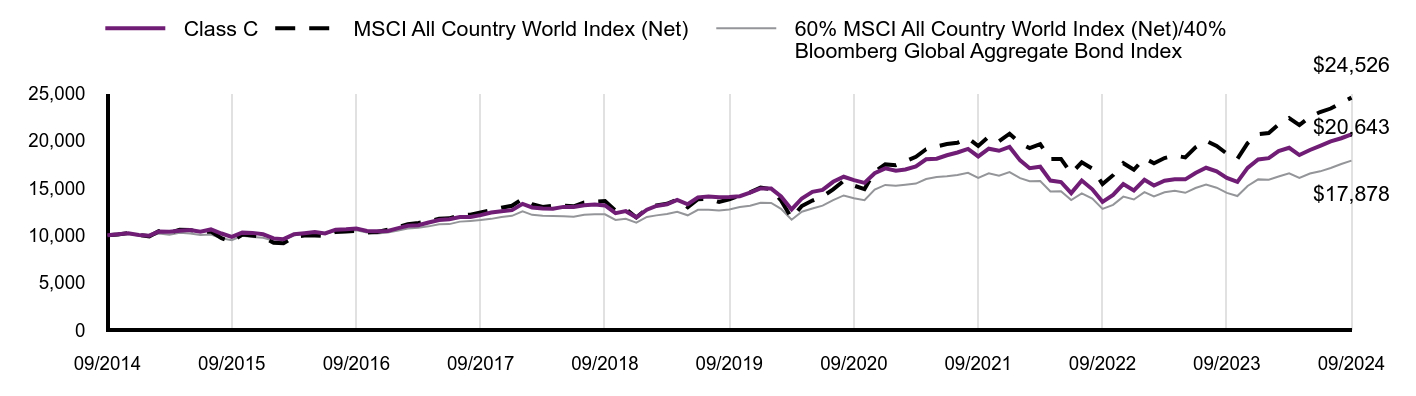
| Class C | MSCI All Country World Index (Net) | 60% MSCI All Country World Index (Net)/40% Bloomberg Global Aggregate Bond Index |
|---|
| 09/2014 | $10,000 | $10,000 | $10,000 |
| 10/2014 | $10,103 | $10,070 | $10,043 |
| 11/2014 | $10,200 | $10,239 | $10,129 |
| 12/2014 | $10,029 | $10,041 | $9,984 |
| 01/2015 | $9,958 | $9,884 | $9,884 |
| 02/2015 | $10,402 | $10,435 | $10,182 |
| 03/2015 | $10,369 | $10,273 | $10,048 |
| 04/2015 | $10,467 | $10,571 | $10,266 |
| 05/2015 | $10,559 | $10,557 | $10,184 |
| 06/2015 | $10,375 | $10,309 | $10,023 |
| 07/2015 | $10,613 | $10,398 | $10,084 |
| 08/2015 | $10,185 | $9,685 | $9,674 |
| 09/2015 | $9,834 | $9,334 | $9,483 |
| 10/2015 | $10,277 | $10,067 | $9,938 |
| 11/2015 | $10,250 | $9,984 | $9,823 |
| 12/2015 | $10,101 | $9,804 | $9,737 |
| 01/2016 | $9,670 | $9,213 | $9,419 |
| 02/2016 | $9,591 | $9,149 | $9,464 |
| 03/2016 | $10,107 | $9,827 | $9,987 |
| 04/2016 | $10,220 | $9,972 | $10,128 |
| 05/2016 | $10,345 | $9,985 | $10,082 |
| 06/2016 | $10,197 | $9,924 | $10,163 |
| 07/2016 | $10,583 | $10,352 | $10,456 |
| 08/2016 | $10,622 | $10,387 | $10,457 |
| 09/2016 | $10,707 | $10,451 | $10,518 |
| 10/2016 | $10,447 | $10,273 | $10,295 |
| 11/2016 | $10,435 | $10,351 | $10,178 |
| 12/2016 | $10,461 | $10,575 | $10,291 |
| 01/2017 | $10,757 | $10,864 | $10,506 |
| 02/2017 | $10,996 | $11,169 | $10,703 |
| 03/2017 | $11,058 | $11,305 | $10,788 |
| 04/2017 | $11,349 | $11,482 | $10,938 |
| 05/2017 | $11,605 | $11,735 | $11,150 |
| 06/2017 | $11,685 | $11,789 | $11,177 |
| 07/2017 | $11,918 | $12,118 | $11,439 |
| 08/2017 | $11,918 | $12,164 | $11,511 |
| 09/2017 | $12,123 | $12,399 | $11,603 |
| 10/2017 | $12,397 | $12,657 | $11,730 |
| 11/2017 | $12,539 | $12,902 | $11,918 |
| 12/2017 | $12,647 | $13,110 | $12,050 |
| 01/2018 | $13,311 | $13,850 | $12,516 |
| 02/2018 | $12,936 | $13,268 | $12,156 |
| 03/2018 | $12,820 | $12,984 | $12,051 |
| 04/2018 | $12,809 | $13,108 | $12,043 |
| 05/2018 | $12,993 | $13,124 | $12,016 |
| 06/2018 | $12,976 | $13,053 | $11,955 |
| 07/2018 | $13,161 | $13,447 | $12,164 |
| 08/2018 | $13,253 | $13,552 | $12,226 |
| 09/2018 | $13,149 | $13,611 | $12,216 |
| 10/2018 | $12,330 | $12,591 | $11,612 |
| 11/2018 | $12,543 | $12,776 | $11,728 |
| 12/2018 | $11,897 | $11,876 | $11,328 |
| 01/2019 | $12,701 | $12,813 | $11,933 |
| 02/2019 | $13,097 | $13,156 | $12,097 |
| 03/2019 | $13,264 | $13,322 | $12,249 |
| 04/2019 | $13,738 | $13,771 | $12,483 |
| 05/2019 | $13,270 | $12,955 | $12,106 |
| 06/2019 | $14,002 | $13,803 | $12,689 |
| 07/2019 | $14,086 | $13,843 | $12,697 |
| 08/2019 | $14,020 | $13,515 | $12,620 |
| 09/2019 | $14,050 | $13,799 | $12,728 |
| 10/2019 | $14,116 | $14,177 | $12,971 |
| 11/2019 | $14,494 | $14,523 | $13,121 |
| 12/2019 | $14,936 | $15,034 | $13,429 |
| 01/2020 | $14,924 | $14,868 | $13,409 |
| 02/2020 | $14,096 | $13,667 | $12,795 |
| 03/2020 | $12,722 | $11,822 | $11,644 |
| 04/2020 | $13,881 | $13,089 | $12,484 |
| 05/2020 | $14,581 | $13,658 | $12,831 |
| 06/2020 | $14,783 | $14,094 | $13,123 |
| 07/2020 | $15,642 | $14,840 | $13,707 |
| 08/2020 | $16,175 | $15,748 | $14,202 |
| 09/2020 | $15,813 | $15,240 | $13,907 |
| 10/2020 | $15,525 | $14,870 | $13,709 |
| 11/2020 | $16,550 | $16,703 | $14,823 |
| 12/2020 | $17,056 | $17,478 | $15,315 |
| 01/2021 | $16,822 | $17,399 | $15,220 |
| 02/2021 | $16,945 | $17,802 | $15,326 |
| 03/2021 | $17,257 | $18,277 | $15,454 |
| 04/2021 | $18,015 | $19,076 | $15,938 |
| 05/2021 | $18,073 | $19,373 | $16,146 |
| 06/2021 | $18,443 | $19,628 | $16,217 |
| 07/2021 | $18,735 | $19,764 | $16,370 |
| 08/2021 | $19,111 | $20,258 | $16,589 |
| 09/2021 | $18,320 | $19,422 | $16,060 |
| 10/2021 | $19,137 | $20,413 | $16,536 |
| 11/2021 | $18,916 | $19,921 | $16,278 |
| 12/2021 | $19,318 | $20,718 | $16,660 |
| 01/2022 | $17,898 | $19,701 | $16,032 |
| 02/2022 | $17,073 | $19,192 | $15,707 |
| 03/2022 | $17,234 | $19,608 | $15,720 |
| 04/2022 | $15,772 | $18,038 | $14,621 |
| 05/2022 | $15,618 | $18,059 | $14,647 |
| 06/2022 | $14,443 | $16,537 | $13,718 |
| 07/2022 | $15,779 | $17,692 | $14,410 |
| 08/2022 | $14,849 | $17,040 | $13,864 |
| 09/2022 | $13,527 | $15,409 | $12,783 |
| 10/2022 | $14,259 | $16,339 | $13,210 |
| 11/2022 | $15,406 | $17,606 | $14,074 |
| 12/2022 | $14,735 | $16,913 | $13,772 |
| 01/2023 | $15,857 | $18,126 | $14,545 |
| 02/2023 | $15,251 | $17,606 | $14,101 |
| 03/2023 | $15,760 | $18,149 | $14,541 |
| 04/2023 | $15,902 | $18,410 | $14,692 |
| 05/2023 | $15,902 | $18,213 | $14,482 |
| 06/2023 | $16,568 | $19,270 | $14,987 |
| 07/2023 | $17,122 | $19,976 | $15,357 |
| 08/2023 | $16,748 | $19,418 | $15,016 |
| 09/2023 | $16,052 | $18,615 | $14,468 |
| 10/2023 | $15,625 | $18,055 | $14,137 |
| 11/2023 | $17,107 | $19,721 | $15,206 |
| 12/2023 | $18,001 | $20,669 | $15,897 |
| 01/2024 | $18,133 | $20,790 | $15,865 |
| 02/2024 | $18,887 | $21,682 | $16,193 |
| 03/2024 | $19,229 | $22,363 | $16,534 |
| 04/2024 | $18,467 | $21,625 | $16,040 |
| 05/2024 | $18,996 | $22,503 | $16,515 |
| 06/2024 | $19,431 | $23,004 | $16,745 |
| 07/2024 | $19,905 | $23,375 | $17,092 |
| 08/2024 | $20,239 | $23,969 | $17,514 |
| 09/2024 | $20,643 | $24,526 | $17,878 |
Performance data shown represents past performance and is no guarantee of, and is not necessarily indicative of, future results. Total return and value will vary, and you may have a gain or loss when shares are sold. Current performance may be lower or higher than quoted. For the most recent month-end performance, visit im.natixis.com/en-us/products/mutual-funds/price-and-performance.
Average Annual Total Returns (%)
| 1 Year | 5 Years | 10 Years | Since Inception 2/1/06 |
|---|
| Class C at NAV | 27.63% | 7.68% | 7.52% | 8.89% |
Class C with CDSCFootnote Reference1 | 26.63% | 7.68% | 7.52% | 8.89% |
| MSCI All Country World Index (Net) | 31.76% | 12.19% | 9.39% | -% |
| 60% MSCI All Country World Index (Net)/40% Bloomberg Global Aggregate Bond Index | 23.57% | 7.03% | 5.98% | -% |
| Footnote | Description |
Footnote1 | Contingent deferred sales charge |
| Total Net Assets | $3,088,807,008 |
| # of Portfolio Holdings (including overnight repurchase agreements and derivatives) | 508 |
| Portfolio Turnover Rate | 22% |
| Total Advisory Fees Paid (after waiver/reimbursement, if applicable) | $21,777,170 |
What did the Fund invest in? (% of Net Assets)
| Value | Value |
|---|
Other investments less than 3% of net assetsFootnote Reference* | 46.4% |
| Broadline Retail | 3.1% |
| IT Services | 4.5% |
| Specialty Retail | 4.6% |
| Software | 4.7% |
| Life Sciences Tools & Services | 5.1% |
| Machinery | 6.7% |
| Capital Markets | 7.9% |
| Semiconductors & Semiconductor Equipment | 8.2% |
| Treasuries | 8.8% |
| Footnote | Description |
Footnote* | Net of other assets less liabilities (including forward foreign currency contracts and futures contracts) |
| S&P Global, Inc. | 3.5% |
| NVIDIA Corp. | 3.4% |
| Amazon.com, Inc. | 3.1% |
| Alphabet, Inc., Class A | 2.9% |
| Mastercard, Inc., Class A | 2.9% |
| Linde PLC | 2.6% |
| UnitedHealth Group, Inc. | 2.6% |
| Atlas Copco AB, Class A | 2.5% |
| Roper Technologies, Inc. | 2.5% |
| Parker-Hannifin Corp. | 2.4% |
There were no material fund changes during the period.
| Value | Value |
|---|
Other investments less than 3% of net assetsFootnote Reference* | 26.2% |
| United Kingdom | 2.9% |
| Canada | 3.4% |
| United States | 67.5% |
| Footnote | Description |
Footnote* | Net of other assets less liabilities (including forward foreign currency contracts and futures contracts) |
There were no changes in or disagreements with Accountants during the period.
For additional information about the Fund; including its prospectus, financial information, holdings and proxy information, scan the QR code or visit im.natixis.com/funddocuments.
Loomis Sayles Global Allocation Fund
Annual Shareholder Report
September 30, 2024
Loomis Sayles Global Allocation Fund
Annual Shareholder Report - September 30, 2024
This annual shareholder report contains important information about Loomis Sayles Global Allocation Fund for the period of October 1, 2023 to September 30, 2024. You can find additional information (including tax information) about the Fund at im.natixis.com/funddocuments. You can also request the information by contacting us at (800) 225-5478 or by contacting your financial intermediary directly.
What were the fund costs for the last year? (based on a hypothetical $10,000 investment)
| Class Name | Costs of a $10,000 investment | Costs paid as a percentage of a $10,000 investmentFootnote Reference† |
|---|
| Class N | $94 | 0.82% |
| Footnote | Description |
Footnote† | Annualized for periods less than one year. |
How did the fund perform last year and what affected its performance?
Explanation of Fund Performance
Top Contributors to Performance
• In equities, the industrials, consumer staples and energy sectors were the largest contributors to relative performance.
• The largest three individual contributors to performance were Nvidia, Amazon and S&P Global.
• In fixed income, yield curve and duration positioning was a top contributor to performance over the period. In particular, allocations to the US dollar, Canadian dollar, and euro-pay markets contributed as yields fell over the year.
• Credit positioning contributed to performance over the period, particularly allocations to the Communications, Consumer Cyclical, and Consumer Non-Cyclical industries. Holdings of Dish, Uber and Teva Pharmaceuticals were strong individual contributors.
Top Detractors from Performance
• In equities, the consumer discretionary and communication services were the largest detractors from relative results. Not having exposure to the utilities sector also detracted on a relative basis.
• The largest three individual detractors from performance were Nike, Airbnb and Zions Bancorporation.
• In fixed income, select names in the Communications and Financial Other sectors detracted from performance. Within communications, cable satellite provider Altice particularly detracted. Within Financial Other, Icahn Enterprises was a notable underperformer.
• Although currency positioning as a whole contributed to performance, allocations to the Brazilian real and Mexican peso detracted over the period, as both currencies weakened against the US dollar over the year.
The Fund’s benchmarks are unmanaged indices used as a general measure of market performance. Calculations assume dividends and capital gains are reinvested. The tables do not reflect taxes shareholders might owe on any fund distributions or when they redeem their shares. You cannot invest directly in an index.
Total Return Based on a Hypothetical $10,000 Investment
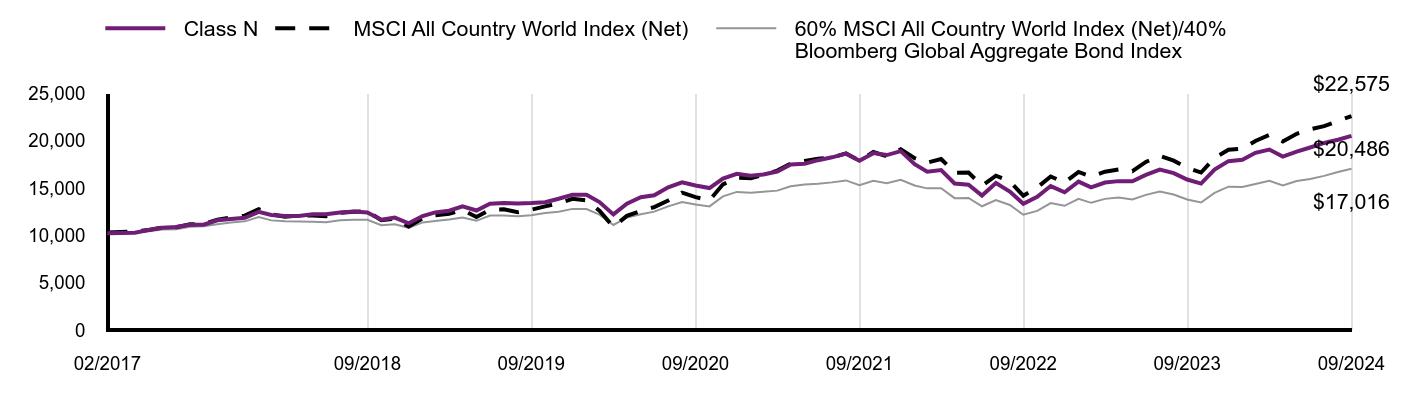
| Class N | MSCI All Country World Index (Net) | 60% MSCI All Country World Index (Net)/40% Bloomberg Global Aggregate Bond Index |
|---|
| 02/2017 | $10,208 | $10,281 | $10,187 |
| 04/2017 | $10,276 | $10,406 | $10,268 |
| 05/2017 | $10,547 | $10,568 | $10,411 |
| 06/2017 | $10,797 | $10,802 | $10,613 |
| 07/2017 | $10,880 | $10,851 | $10,638 |
| 08/2017 | $11,104 | $11,154 | $10,888 |
| 09/2017 | $11,120 | $11,197 | $10,956 |
| 10/2017 | $11,583 | $11,650 | $11,165 |
| 11/2017 | $11,724 | $11,876 | $11,344 |
| 12/2017 | $11,838 | $12,067 | $11,469 |
| 01/2018 | $12,473 | $12,748 | $11,912 |
| 02/2018 | $12,132 | $12,213 | $11,570 |
| 03/2018 | $12,030 | $11,951 | $11,471 |
| 04/2018 | $12,030 | $12,065 | $11,463 |
| 05/2018 | $12,217 | $12,080 | $11,437 |
| 06/2018 | $12,212 | $12,015 | $11,379 |
| 07/2018 | $12,393 | $12,377 | $11,577 |
| 08/2018 | $12,494 | $12,475 | $11,637 |
| 09/2018 | $12,404 | $12,529 | $11,627 |
| 10/2018 | $11,641 | $11,590 | $11,052 |
| 11/2018 | $11,860 | $11,759 | $11,163 |
| 12/2018 | $11,256 | $10,931 | $10,782 |
| 01/2019 | $12,023 | $11,794 | $11,358 |
| 02/2019 | $12,410 | $12,110 | $11,514 |
| 03/2019 | $12,584 | $12,262 | $11,659 |
| 04/2019 | $13,049 | $12,676 | $11,881 |
| 05/2019 | $12,612 | $11,924 | $11,523 |
| 06/2019 | $13,323 | $12,705 | $12,078 |
| 07/2019 | $13,413 | $12,742 | $12,085 |
| 08/2019 | $13,362 | $12,440 | $12,012 |
| 09/2019 | $13,402 | $12,702 | $12,114 |
| 10/2019 | $13,480 | $13,049 | $12,346 |
| 11/2019 | $13,850 | $13,368 | $12,489 |
| 12/2019 | $14,284 | $13,839 | $12,782 |
| 01/2020 | $14,284 | $13,686 | $12,763 |
| 02/2020 | $13,505 | $12,580 | $12,178 |
| 03/2020 | $12,201 | $10,882 | $11,083 |
| 04/2020 | $13,321 | $12,048 | $11,882 |
| 05/2020 | $14,007 | $12,572 | $12,213 |
| 06/2020 | $14,215 | $12,973 | $12,491 |
| 07/2020 | $15,058 | $13,659 | $13,046 |
| 08/2020 | $15,583 | $14,496 | $13,517 |
| 09/2020 | $15,248 | $14,028 | $13,236 |
| 10/2020 | $14,983 | $13,687 | $13,048 |
| 11/2020 | $15,987 | $15,374 | $14,108 |
| 12/2020 | $16,487 | $16,088 | $14,577 |
| 01/2021 | $16,279 | $16,015 | $14,486 |
| 02/2021 | $16,414 | $16,386 | $14,588 |
| 03/2021 | $16,727 | $16,824 | $14,709 |
| 04/2021 | $17,476 | $17,559 | $15,169 |
| 05/2021 | $17,555 | $17,832 | $15,368 |
| 06/2021 | $17,924 | $18,067 | $15,435 |
| 07/2021 | $18,224 | $18,192 | $15,581 |
| 08/2021 | $18,611 | $18,647 | $15,789 |
| 09/2021 | $17,856 | $17,877 | $15,286 |
| 10/2021 | $18,666 | $18,789 | $15,739 |
| 11/2021 | $18,464 | $18,337 | $15,493 |
| 12/2021 | $18,879 | $19,070 | $15,857 |
| 01/2022 | $17,509 | $18,134 | $15,259 |
| 02/2022 | $16,715 | $17,665 | $14,950 |
| 03/2022 | $16,887 | $18,048 | $14,963 |
| 04/2022 | $15,465 | $16,603 | $13,916 |
| 05/2022 | $15,332 | $16,623 | $13,941 |
| 06/2022 | $14,194 | $15,222 | $13,057 |
| 07/2022 | $15,518 | $16,285 | $13,715 |
| 08/2022 | $14,618 | $15,685 | $13,196 |
| 09/2022 | $13,327 | $14,184 | $12,166 |
| 10/2022 | $14,062 | $15,039 | $12,574 |
| 11/2022 | $15,193 | $16,206 | $13,395 |
| 12/2022 | $14,539 | $15,568 | $13,108 |
| 01/2023 | $15,654 | $16,684 | $13,844 |
| 02/2023 | $15,056 | $16,206 | $13,422 |
| 03/2023 | $15,559 | $16,706 | $13,840 |
| 04/2023 | $15,712 | $16,946 | $13,984 |
| 05/2023 | $15,705 | $16,764 | $13,784 |
| 06/2023 | $16,369 | $17,738 | $14,264 |
| 07/2023 | $16,923 | $18,387 | $14,617 |
| 08/2023 | $16,558 | $17,873 | $14,292 |
| 09/2023 | $15,880 | $17,134 | $13,770 |
| 10/2023 | $15,457 | $16,619 | $13,456 |
| 11/2023 | $16,930 | $18,153 | $14,473 |
| 12/2023 | $17,821 | $19,025 | $15,130 |
| 01/2024 | $17,958 | $19,136 | $15,100 |
| 02/2024 | $18,702 | $19,957 | $15,413 |
| 03/2024 | $19,051 | $20,584 | $15,737 |
| 04/2024 | $18,300 | $19,905 | $15,267 |
| 05/2024 | $18,831 | $20,713 | $15,719 |
| 06/2024 | $19,264 | $21,175 | $15,938 |
| 07/2024 | $19,742 | $21,516 | $16,268 |
| 08/2024 | $20,084 | $22,063 | $16,670 |
| 09/2024 | $20,486 | $22,575 | $17,016 |
Performance data shown represents past performance and is no guarantee of, and is not necessarily indicative of, future results. Total return and value will vary, and you may have a gain or loss when shares are sold. Current performance may be lower or higher than quoted. For the most recent month-end performance, visit im.natixis.com/en-us/products/mutual-funds/price-and-performance.
Average Annual Total Returns (%)
| 1 Year | 5 Years | Since Inception 2/1/17 |
|---|
| Class N | 29.01% | 8.86% | 9.81% |
| MSCI All Country World Index (Net) | 31.76% | 12.19% | 11.17% |
| 60% MSCI All Country World Index (Net)/40% Bloomberg Global Aggregate Bond Index | 23.57% | 7.03% | 7.16% |
| Total Net Assets | $3,088,807,008 |
| # of Portfolio Holdings (including overnight repurchase agreements and derivatives) | 508 |
| Portfolio Turnover Rate | 22% |
| Total Advisory Fees Paid (after waiver/reimbursement, if applicable) | $21,777,170 |
What did the Fund invest in? (% of Net Assets)
| Value | Value |
|---|
Other investments less than 3% of net assetsFootnote Reference* | 46.4% |
| Broadline Retail | 3.1% |
| IT Services | 4.5% |
| Specialty Retail | 4.6% |
| Software | 4.7% |
| Life Sciences Tools & Services | 5.1% |
| Machinery | 6.7% |
| Capital Markets | 7.9% |
| Semiconductors & Semiconductor Equipment | 8.2% |
| Treasuries | 8.8% |
| Footnote | Description |
Footnote* | Net of other assets less liabilities (including forward foreign currency contracts and futures contracts) |
| S&P Global, Inc. | 3.5% |
| NVIDIA Corp. | 3.4% |
| Amazon.com, Inc. | 3.1% |
| Alphabet, Inc., Class A | 2.9% |
| Mastercard, Inc., Class A | 2.9% |
| Linde PLC | 2.6% |
| UnitedHealth Group, Inc. | 2.6% |
| Atlas Copco AB, Class A | 2.5% |
| Roper Technologies, Inc. | 2.5% |
| Parker-Hannifin Corp. | 2.4% |
There were no material fund changes during the period.
| Value | Value |
|---|
Other investments less than 3% of net assetsFootnote Reference* | 26.2% |
| United Kingdom | 2.9% |
| Canada | 3.4% |
| United States | 67.5% |
| Footnote | Description |
Footnote* | Net of other assets less liabilities (including forward foreign currency contracts and futures contracts) |
There were no changes in or disagreements with Accountants during the period.
For additional information about the Fund; including its prospectus, financial information, holdings and proxy information, scan the QR code or visit im.natixis.com/funddocuments.
Loomis Sayles Global Allocation Fund
Annual Shareholder Report
September 30, 2024
Loomis Sayles Growth Fund
Annual Shareholder Report - September 30, 2024
This annual shareholder report contains important information about Loomis Sayles Growth Fund for the period of October 1, 2023 to September 30, 2024. You can find additional information (including tax information) about the Fund at im.natixis.com/funddocuments. You can also request the information by contacting us at (800) 225-5478 or by contacting your financial intermediary directly.
What were the fund costs for the last year? (based on a hypothetical $10,000 investment)
| Class Name | Costs of a $10,000 investment | Costs paid as a percentage of a $10,000 investmentFootnote Reference† |
|---|
| Class Y | $79 | 0.66% |
| Footnote | Description |
Footnote† | Annualized for periods less than one year. |
How did the fund perform last year and what affected its performance?
Explanation of Fund Performance
We are an active manager with a long-term, private equity approach to investing. Through our proprietary bottom-up research framework, we look to invest in those few high-quality businesses with sustainable competitive advantages and profitable growth when they trade at a significant discount to intrinsic value. Given the rare confluence of quality, growth, and valuation, ours is a selective, high-conviction portfolio of typically 30-40 names.
Top Contributors to Performance
• The Fund’s positions in Nvidia, Meta Platforms, and Netflix contributed the most to performance.
• Stock selection in the information technology, communication services, and healthcare sectors, along with our allocations in the communication services, consumer staples, and consumer discretionary sectors, contributed positively to relative performance.
Top Detractors from Performance
• The Fund’s positions in Boeing, Yum China, and Illumina detracted the most from performance.
• Stock selection in the industrials, financials, consumer staples, and consumer discretionary sectors, along with our allocations in the information technology, healthcare, financials, and industrials sectors, detracted from relative performance.
Investment Activity
All aspects of our quality-growth-valuation investment thesis must be present simultaneously for us to make an investment. Often our research is completed well in advance of the opportunity to invest. We are patient investors and maintain coverage of high-quality businesses in order to take advantage of meaningful price dislocations if and when they occur. During the period, we initiated a new position in Nike. We added to our existing holdings in Boeing, Disney, Monster Beverage, Shopify, Starbucks, Tesla, and Thermo Fisher Scientific. We trimmed our positions in Meta Platforms and Nvidia as they reached our historic maximum allowable position size due to market appreciation. We sold our positions in Grail and Sandoz, both of which we received as spin-offs from existing holdings Illumina and Novartis, respectively.
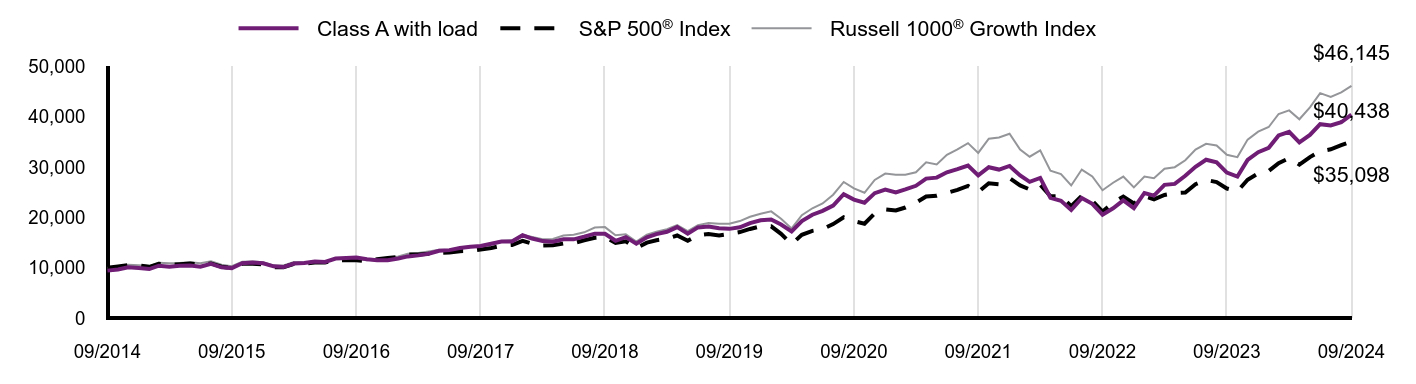
The Fund’s benchmarks are unmanaged indices used as a general measure of market performance. Calculations assume dividends and capital gains are reinvested. The tables do not reflect taxes shareholders might owe on any fund distributions or when they redeem their shares. You cannot invest directly in an index.
Total Return Based on a Hypothetical $10,000 Investment
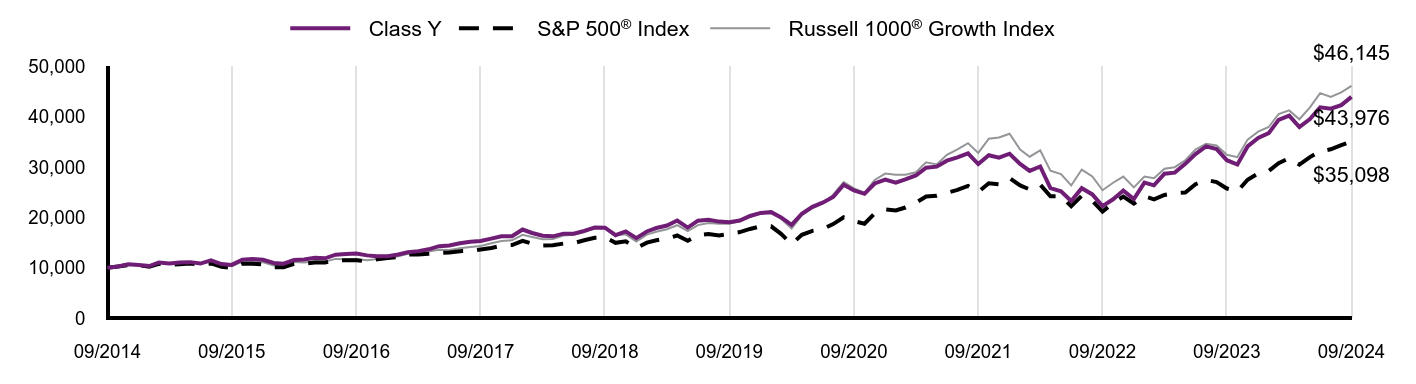
| Class Y | S&P 500® Index | Russell 1000® Growth Index |
|---|
| 09/2014 | $10,000 | $10,000 | $10,000 |
| 10/2014 | $10,239 | $10,244 | $10,264 |
| 11/2014 | $10,687 | $10,520 | $10,589 |
| 12/2014 | $10,529 | $10,493 | $10,478 |
| 01/2015 | $10,338 | $10,178 | $10,318 |
| 02/2015 | $11,050 | $10,763 | $11,006 |
| 03/2015 | $10,850 | $10,593 | $10,881 |
| 04/2015 | $11,030 | $10,695 | $10,935 |
| 05/2015 | $11,110 | $10,832 | $11,089 |
| 06/2015 | $10,829 | $10,622 | $10,894 |
| 07/2015 | $11,451 | $10,845 | $11,263 |
| 08/2015 | $10,729 | $10,191 | $10,579 |
| 09/2015 | $10,559 | $9,939 | $10,317 |
| 10/2015 | $11,612 | $10,777 | $11,206 |
| 11/2015 | $11,732 | $10,809 | $11,237 |
| 12/2015 | $11,584 | $10,638 | $11,072 |
| 01/2016 | $10,939 | $10,111 | $10,454 |
| 02/2016 | $10,797 | $10,097 | $10,450 |
| 03/2016 | $11,523 | $10,782 | $11,154 |
| 04/2016 | $11,644 | $10,824 | $11,053 |
| 05/2016 | $11,967 | $11,018 | $11,267 |
| 06/2016 | $11,876 | $11,047 | $11,223 |
| 07/2016 | $12,592 | $11,454 | $11,753 |
| 08/2016 | $12,723 | $11,470 | $11,694 |
| 09/2016 | $12,834 | $11,472 | $11,737 |
| 10/2016 | $12,451 | $11,263 | $11,461 |
| 11/2016 | $12,259 | $11,680 | $11,711 |
| 12/2016 | $12,264 | $11,911 | $11,856 |
| 01/2017 | $12,622 | $12,137 | $12,255 |
| 02/2017 | $13,082 | $12,619 | $12,764 |
| 03/2017 | $13,297 | $12,633 | $12,912 |
| 04/2017 | $13,655 | $12,763 | $13,207 |
| 05/2017 | $14,279 | $12,943 | $13,551 |
| 06/2017 | $14,422 | $13,023 | $13,515 |
| 07/2017 | $14,872 | $13,291 | $13,874 |
| 08/2017 | $15,159 | $13,332 | $14,129 |
| 09/2017 | $15,312 | $13,607 | $14,312 |
| 10/2017 | $15,793 | $13,925 | $14,867 |
| 11/2017 | $16,253 | $14,352 | $15,318 |
| 12/2017 | $16,266 | $14,511 | $15,438 |
| 01/2018 | $17,597 | $15,342 | $16,531 |
| 02/2018 | $16,905 | $14,777 | $16,098 |
| 03/2018 | $16,361 | $14,401 | $15,656 |
| 04/2018 | $16,235 | $14,456 | $15,711 |
| 05/2018 | $16,769 | $14,804 | $16,400 |
| 06/2018 | $16,759 | $14,896 | $16,557 |
| 07/2018 | $17,314 | $15,450 | $17,044 |
| 08/2018 | $17,974 | $15,953 | $17,975 |
| 09/2018 | $17,953 | $16,044 | $18,076 |
| 10/2018 | $16,465 | $14,947 | $16,459 |
| 11/2018 | $17,230 | $15,252 | $16,634 |
| 12/2018 | $15,863 | $13,875 | $15,204 |
| 01/2019 | $17,205 | $14,987 | $16,571 |
| 02/2019 | $17,893 | $15,468 | $17,164 |
| 03/2019 | $18,392 | $15,769 | $17,652 |
| 04/2019 | $19,390 | $16,407 | $18,450 |
| 05/2019 | $17,981 | $15,364 | $17,284 |
| 06/2019 | $19,346 | $16,447 | $18,471 |
| 07/2019 | $19,556 | $16,684 | $18,888 |
| 08/2019 | $19,168 | $16,419 | $18,744 |
| 09/2019 | $19,046 | $16,727 | $18,746 |
| 10/2019 | $19,379 | $17,089 | $19,274 |
| 11/2019 | $20,289 | $17,709 | $20,129 |
| 12/2019 | $20,894 | $18,244 | $20,737 |
| 01/2020 | $21,053 | $18,237 | $21,200 |
| 02/2020 | $20,005 | $16,735 | $19,757 |
| 03/2020 | $18,513 | $14,668 | $17,813 |
| 04/2020 | $20,734 | $16,549 | $20,449 |
| 05/2020 | $22,101 | $17,337 | $21,822 |
| 06/2020 | $22,933 | $17,682 | $22,772 |
| 07/2020 | $24,072 | $18,679 | $24,524 |
| 08/2020 | $26,499 | $20,021 | $27,055 |
| 09/2020 | $25,360 | $19,260 | $25,782 |
| 10/2020 | $24,699 | $18,748 | $24,906 |
| 11/2020 | $26,750 | $20,801 | $27,456 |
| 12/2020 | $27,532 | $21,600 | $28,719 |
| 01/2021 | $26,914 | $21,382 | $28,506 |
| 02/2021 | $27,556 | $21,972 | $28,500 |
| 03/2021 | $28,341 | $22,934 | $28,990 |
| 04/2021 | $29,900 | $24,158 | $30,962 |
| 05/2021 | $30,102 | $24,327 | $30,534 |
| 06/2021 | $31,280 | $24,895 | $32,449 |
| 07/2021 | $31,935 | $25,486 | $33,519 |
| 08/2021 | $32,732 | $26,261 | $34,772 |
| 09/2021 | $30,614 | $25,040 | $32,824 |
| 10/2021 | $32,375 | $26,794 | $35,668 |
| 11/2021 | $31,887 | $26,608 | $35,886 |
| 12/2021 | $32,666 | $27,801 | $36,644 |
| 01/2022 | $30,647 | $26,362 | $33,499 |
| 02/2022 | $29,252 | $25,573 | $32,077 |
| 03/2022 | $30,124 | $26,522 | $33,331 |
| 04/2022 | $25,824 | $24,209 | $29,306 |
| 05/2022 | $25,188 | $24,254 | $28,625 |
| 06/2022 | $23,257 | $22,252 | $26,357 |
| 07/2022 | $25,812 | $24,304 | $29,521 |
| 08/2022 | $24,578 | $23,312 | $28,146 |
| 09/2022 | $22,260 | $21,165 | $25,409 |
| 10/2022 | $23,606 | $22,879 | $26,895 |
| 11/2022 | $25,338 | $24,158 | $28,120 |
| 12/2022 | $23,639 | $22,766 | $25,967 |
| 01/2023 | $26,935 | $24,196 | $28,132 |
| 02/2023 | $26,383 | $23,606 | $27,798 |
| 03/2023 | $28,707 | $24,473 | $29,698 |
| 04/2023 | $28,910 | $24,855 | $29,991 |
| 05/2023 | $30,652 | $24,963 | $31,358 |
| 06/2023 | $32,583 | $26,612 | $33,502 |
| 07/2023 | $34,123 | $27,467 | $34,631 |
| 08/2023 | $33,585 | $27,030 | $34,320 |
| 09/2023 | $31,378 | $25,741 | $32,453 |
| 10/2023 | $30,522 | $25,200 | $31,991 |
| 11/2023 | $34,123 | $27,501 | $35,479 |
| 12/2023 | $35,794 | $28,750 | $37,050 |
| 01/2024 | $36,765 | $29,233 | $37,974 |
| 02/2024 | $39,415 | $30,794 | $40,565 |
| 03/2024 | $40,232 | $31,785 | $41,279 |
| 04/2024 | $37,952 | $30,487 | $39,528 |
| 05/2024 | $39,554 | $31,999 | $41,894 |
| 06/2024 | $41,896 | $33,147 | $44,719 |
| 07/2024 | $41,619 | $33,550 | $43,959 |
| 08/2024 | $42,328 | $34,364 | $44,874 |
| 09/2024 | $43,976 | $35,098 | $46,145 |
Performance data shown represents past performance and is no guarantee of, and is not necessarily indicative of, future results. Total return and value will vary, and you may have a gain or loss when shares are sold. Current performance may be lower or higher than quoted. For the most recent month-end performance, visit im.natixis.com/en-us/products/mutual-funds/price-and-performance.
Average Annual Total Returns (%)
| 1 Year | 5 Years | 10 Years | Since Inception 12/30/96 |
|---|
| Class Y | 40.15% | 18.22% | 15.96% | 10.05% |
S&P 500® Index | 36.35% | 15.98% | 13.38% | -% |
Russell 1000® Growth Index | 42.19% | 19.74% | 16.52% | -% |
Effective February 1, 2024, in accordance with new regulations, the Fund's primary broad-based index changed to the S&P 500® Index. The Fund will retain the Russell 1000® Growth Index as an additional benchmark for performance comparison.
| Total Net Assets | $14,883,036,750 |
| # of Portfolio Holdings (including overnight repurchase agreements) | 39 |
| Portfolio Turnover Rate | 10% |
| Total Advisory Fees Paid (after waiver/reimbursement, if applicable) | $65,131,960 |
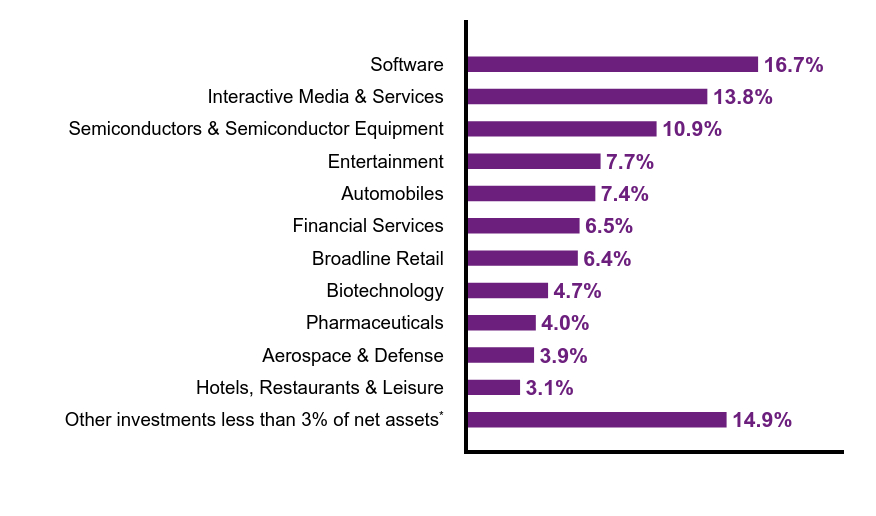
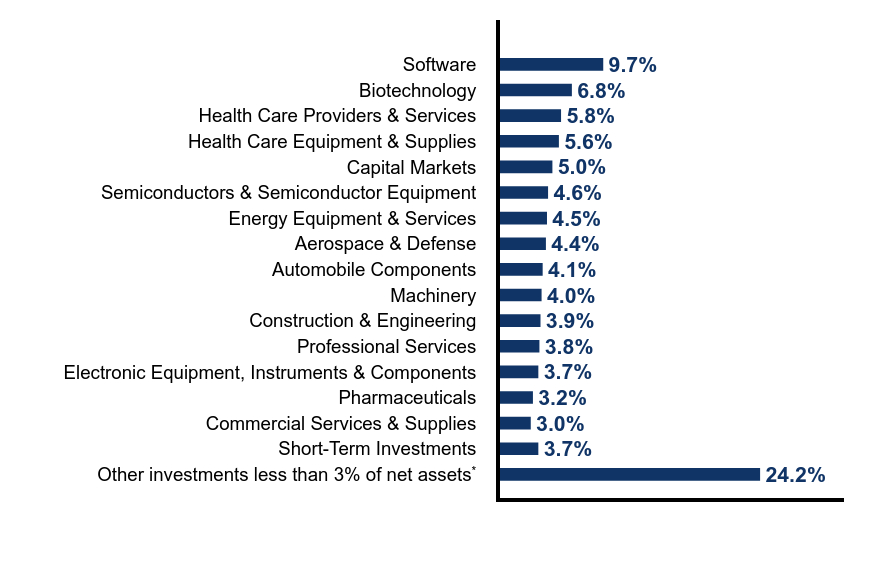
What did the Fund invest in? (% of Net Assets)
| Value | Value |
|---|
Other investments less than 3% of net assetsFootnote Reference* | 14.9% |
| Hotels, Restaurants & Leisure | 3.1% |
| Aerospace & Defense | 3.9% |
| Pharmaceuticals | 4.0% |
| Biotechnology | 4.7% |
| Broadline Retail | 6.4% |
| Financial Services | 6.5% |
| Automobiles | 7.4% |
| Entertainment | 7.7% |
| Semiconductors & Semiconductor Equipment | 10.9% |
| Interactive Media & Services | 13.8% |
| Software | 16.7% |
| Footnote | Description |
Footnote* | Net of other assets less liabilities |
| NVIDIA Corp. | 9.2% |
| Meta Platforms, Inc., Class A | 7.8% |
| Tesla, Inc. | 7.4% |
| Amazon.com, Inc. | 5.5% |
| Oracle Corp. | 5.3% |
| Netflix, Inc. | 5.2% |
| Microsoft Corp. | 4.7% |
| Visa, Inc., Class A | 4.7% |
| Alphabet, Inc., Class A | 4.1% |
| Boeing Co. | 3.9% |
There were no material fund changes during the period.
There were no changes in or disagreements with Accountants during the period.
For additional information about the Fund; including its prospectus, financial information, holdings and proxy information, scan the QR code or visit im.natixis.com/funddocuments.
Loomis Sayles Growth Fund
Annual Shareholder Report
September 30, 2024
Loomis Sayles Growth Fund
Annual Shareholder Report - September 30, 2024
This annual shareholder report contains important information about Loomis Sayles Growth Fund for the period of October 1, 2023 to September 30, 2024. You can find additional information (including tax information) about the Fund at im.natixis.com/funddocuments. You can also request the information by contacting us at (800) 225-5478 or by contacting your financial intermediary directly.
What were the fund costs for the last year? (based on a hypothetical $10,000 investment)
| Class Name | Costs of a $10,000 investment | Costs paid as a percentage of a $10,000 investmentFootnote Reference† |
|---|
| Class A | $109 | 0.91% |
| Footnote | Description |
Footnote† | Annualized for periods less than one year. |
How did the fund perform last year and what affected its performance?
Explanation of Fund Performance
We are an active manager with a long-term, private equity approach to investing. Through our proprietary bottom-up research framework, we look to invest in those few high-quality businesses with sustainable competitive advantages and profitable growth when they trade at a significant discount to intrinsic value. Given the rare confluence of quality, growth, and valuation, ours is a selective, high-conviction portfolio of typically 30-40 names.
Top Contributors to Performance
• The Fund’s positions in Nvidia, Meta Platforms, and Netflix contributed the most to performance.
• Stock selection in the information technology, communication services, and healthcare sectors, along with our allocations in the communication services, consumer staples, and consumer discretionary sectors, contributed positively to relative performance.
Top Detractors from Performance
• The Fund’s positions in Boeing, Yum China, and Illumina detracted the most from performance.
• Stock selection in the industrials, financials, consumer staples, and consumer discretionary sectors, along with our allocations in the information technology, healthcare, financials, and industrials sectors, detracted from relative performance.
Investment Activity
All aspects of our quality-growth-valuation investment thesis must be present simultaneously for us to make an investment. Often our research is completed well in advance of the opportunity to invest. We are patient investors and maintain coverage of high-quality businesses in order to take advantage of meaningful price dislocations if and when they occur. During the period, we initiated a new position in Nike. We added to our existing holdings in Boeing, Disney, Monster Beverage, Shopify, Starbucks, Tesla, and Thermo Fisher Scientific. We trimmed our positions in Meta Platforms and Nvidia as they reached our historic maximum allowable position size due to market appreciation. We sold our positions in Grail and Sandoz, both of which we received as spin-offs from existing holdings Illumina and Novartis, respectively.
The Fund’s benchmarks are unmanaged indices used as a general measure of market performance. Calculations assume dividends and capital gains are reinvested. The tables do not reflect taxes shareholders might owe on any fund distributions or when they redeem their shares. You cannot invest directly in an index.
Total Return Based on a Hypothetical $10,000 Investment
| Class A with load | S&P 500® Index | Russell 1000® Growth Index |
|---|
| 09/2014 | $9,422 | $10,000 | $10,000 |
| 10/2014 | $9,641 | $10,244 | $10,264 |
| 11/2014 | $10,070 | $10,520 | $10,589 |
| 12/2014 | $9,921 | $10,493 | $10,478 |
| 01/2015 | $9,731 | $10,178 | $10,318 |
| 02/2015 | $10,402 | $10,763 | $11,006 |
| 03/2015 | $10,212 | $10,593 | $10,881 |
| 04/2015 | $10,382 | $10,695 | $10,935 |
| 05/2015 | $10,452 | $10,832 | $11,089 |
| 06/2015 | $10,182 | $10,622 | $10,894 |
| 07/2015 | $10,763 | $10,845 | $11,263 |
| 08/2015 | $10,082 | $10,191 | $10,579 |
| 09/2015 | $9,921 | $9,939 | $10,317 |
| 10/2015 | $10,903 | $10,777 | $11,206 |
| 11/2015 | $11,024 | $10,809 | $11,237 |
| 12/2015 | $10,879 | $10,638 | $11,072 |
| 01/2016 | $10,275 | $10,111 | $10,454 |
| 02/2016 | $10,134 | $10,097 | $10,450 |
| 03/2016 | $10,819 | $10,782 | $11,154 |
| 04/2016 | $10,929 | $10,824 | $11,053 |
| 05/2016 | $11,231 | $11,018 | $11,267 |
| 06/2016 | $11,151 | $11,047 | $11,223 |
| 07/2016 | $11,815 | $11,454 | $11,753 |
| 08/2016 | $11,936 | $11,470 | $11,694 |
| 09/2016 | $12,037 | $11,472 | $11,737 |
| 10/2016 | $11,674 | $11,263 | $11,461 |
| 11/2016 | $11,493 | $11,680 | $11,711 |
| 12/2016 | $11,496 | $11,911 | $11,856 |
| 01/2017 | $11,823 | $12,137 | $12,255 |
| 02/2017 | $12,251 | $12,619 | $12,764 |
| 03/2017 | $12,455 | $12,633 | $12,912 |
| 04/2017 | $12,782 | $12,763 | $13,207 |
| 05/2017 | $13,373 | $12,943 | $13,551 |
| 06/2017 | $13,496 | $13,023 | $13,515 |
| 07/2017 | $13,914 | $13,291 | $13,874 |
| 08/2017 | $14,179 | $13,332 | $14,129 |
| 09/2017 | $14,322 | $13,607 | $14,312 |
| 10/2017 | $14,771 | $13,925 | $14,867 |
| 11/2017 | $15,199 | $14,352 | $15,318 |
| 12/2017 | $15,209 | $14,511 | $15,438 |
| 01/2018 | $16,451 | $15,342 | $16,531 |
| 02/2018 | $15,804 | $14,777 | $16,098 |
| 03/2018 | $15,292 | $14,401 | $15,656 |
| 04/2018 | $15,167 | $14,456 | $15,711 |
| 05/2018 | $15,658 | $14,804 | $16,400 |
| 06/2018 | $15,647 | $14,896 | $16,557 |
| 07/2018 | $16,169 | $15,450 | $17,044 |
| 08/2018 | $16,774 | $15,953 | $17,975 |
| 09/2018 | $16,754 | $16,044 | $18,076 |
| 10/2018 | $15,355 | $14,947 | $16,459 |
| 11/2018 | $16,075 | $15,252 | $16,634 |
| 12/2018 | $14,795 | $13,875 | $15,204 |
| 01/2019 | $16,034 | $14,987 | $16,571 |
| 02/2019 | $16,676 | $15,468 | $17,164 |
| 03/2019 | $17,141 | $15,769 | $17,652 |
| 04/2019 | $18,071 | $16,407 | $18,450 |
| 05/2019 | $16,754 | $15,364 | $17,284 |
| 06/2019 | $18,015 | $16,447 | $18,471 |
| 07/2019 | $18,203 | $16,684 | $18,888 |
| 08/2019 | $17,838 | $16,419 | $18,744 |
| 09/2019 | $17,727 | $16,727 | $18,746 |
| 10/2019 | $18,037 | $17,089 | $19,274 |
| 11/2019 | $18,878 | $17,709 | $20,129 |
| 12/2019 | $19,440 | $18,244 | $20,737 |
| 01/2020 | $19,577 | $18,237 | $21,200 |
| 02/2020 | $18,600 | $16,735 | $19,757 |
| 03/2020 | $17,202 | $14,668 | $17,813 |
| 04/2020 | $19,270 | $16,549 | $20,449 |
| 05/2020 | $20,543 | $17,337 | $21,822 |
| 06/2020 | $21,304 | $17,682 | $22,772 |
| 07/2020 | $22,361 | $18,679 | $24,524 |
| 08/2020 | $24,610 | $20,021 | $27,055 |
| 09/2020 | $23,542 | $19,260 | $25,782 |
| 10/2020 | $22,929 | $18,748 | $24,906 |
| 11/2020 | $24,826 | $20,801 | $27,456 |
| 12/2020 | $25,547 | $21,600 | $28,719 |
| 01/2021 | $24,965 | $21,382 | $28,506 |
| 02/2021 | $25,559 | $21,972 | $28,500 |
| 03/2021 | $26,284 | $22,934 | $28,990 |
| 04/2021 | $27,723 | $24,158 | $30,962 |
| 05/2021 | $27,913 | $24,327 | $30,534 |
| 06/2021 | $28,983 | $24,895 | $32,449 |
| 07/2021 | $29,589 | $25,486 | $33,519 |
| 08/2021 | $30,326 | $26,261 | $34,772 |
| 09/2021 | $28,353 | $25,040 | $32,824 |
| 10/2021 | $29,982 | $26,794 | $35,668 |
| 11/2021 | $29,518 | $26,608 | $35,886 |
| 12/2021 | $30,237 | $27,801 | $36,644 |
| 01/2022 | $28,362 | $26,362 | $33,499 |
| 02/2022 | $27,075 | $25,573 | $32,077 |
| 03/2022 | $27,862 | $26,522 | $33,331 |
| 04/2022 | $23,887 | $24,209 | $29,306 |
| 05/2022 | $23,300 | $24,254 | $28,625 |
| 06/2022 | $21,500 | $22,252 | $26,357 |
| 07/2022 | $23,850 | $24,304 | $29,521 |
| 08/2022 | $22,712 | $23,312 | $28,146 |
| 09/2022 | $20,562 | $21,165 | $25,409 |
| 10/2022 | $21,812 | $22,879 | $26,895 |
| 11/2022 | $23,400 | $24,158 | $28,120 |
| 12/2022 | $21,834 | $22,766 | $25,967 |
| 01/2023 | $24,862 | $24,196 | $28,132 |
| 02/2023 | $24,345 | $23,606 | $27,798 |
| 03/2023 | $26,487 | $24,473 | $29,698 |
| 04/2023 | $26,665 | $24,855 | $29,991 |
| 05/2023 | $28,275 | $24,963 | $31,358 |
| 06/2023 | $30,062 | $26,612 | $33,502 |
| 07/2023 | $31,466 | $27,467 | $34,631 |
| 08/2023 | $30,963 | $27,030 | $34,320 |
| 09/2023 | $28,925 | $25,741 | $32,453 |
| 10/2023 | $28,127 | $25,200 | $31,991 |
| 11/2023 | $31,436 | $27,501 | $35,479 |
| 12/2023 | $32,975 | $28,750 | $37,050 |
| 01/2024 | $33,859 | $29,233 | $37,974 |
| 02/2024 | $36,304 | $30,794 | $40,565 |
| 03/2024 | $37,030 | $31,785 | $41,279 |
| 04/2024 | $34,931 | $30,487 | $39,528 |
| 05/2024 | $36,399 | $31,999 | $41,894 |
| 06/2024 | $38,544 | $33,147 | $44,719 |
| 07/2024 | $38,276 | $33,550 | $43,959 |
| 08/2024 | $38,923 | $34,364 | $44,874 |
| 09/2024 | $40,438 | $35,098 | $46,145 |
Performance data shown represents past performance and is no guarantee of, and is not necessarily indicative of, future results. Total return and value will vary, and you may have a gain or loss when shares are sold. Current performance may be lower or higher than quoted. For the most recent month-end performance, visit im.natixis.com/en-us/products/mutual-funds/price-and-performance.
Average Annual Total Returns (%)
| 1 Year | 5 Years | 10 Years | Since Inception 12/30/96 |
|---|
| Class A at NAV | 39.80% | 17.93% | 15.68% | 9.80% |
Class A with 5.75% MSCFootnote Reference1 | 31.79% | 16.54% | 14.99% | 9.60% |
S&P 500® Index | 36.35% | 15.98% | 13.38% | -% |
Russell 1000® Growth Index | 42.19% | 19.74% | 16.52% | -% |
| Footnote | Description |
Footnote1 | Maximum sales charge |
Effective February 1, 2024, in accordance with new regulations, the Fund's primary broad-based index changed to the S&P 500® Index. The Fund will retain the Russell 1000® Growth Index as an additional benchmark for performance comparison.
| Total Net Assets | $14,883,036,750 |
| # of Portfolio Holdings (including overnight repurchase agreements) | 39 |
| Portfolio Turnover Rate | 10% |
| Total Advisory Fees Paid (after waiver/reimbursement, if applicable) | $65,131,960 |
What did the Fund invest in? (% of Net Assets)
| Value | Value |
|---|
Other investments less than 3% of net assetsFootnote Reference* | 14.9% |
| Hotels, Restaurants & Leisure | 3.1% |
| Aerospace & Defense | 3.9% |
| Pharmaceuticals | 4.0% |
| Biotechnology | 4.7% |
| Broadline Retail | 6.4% |
| Financial Services | 6.5% |
| Automobiles | 7.4% |
| Entertainment | 7.7% |
| Semiconductors & Semiconductor Equipment | 10.9% |
| Interactive Media & Services | 13.8% |
| Software | 16.7% |
| Footnote | Description |
Footnote* | Net of other assets less liabilities |
| NVIDIA Corp. | 9.2% |
| Meta Platforms, Inc., Class A | 7.8% |
| Tesla, Inc. | 7.4% |
| Amazon.com, Inc. | 5.5% |
| Oracle Corp. | 5.3% |
| Netflix, Inc. | 5.2% |
| Microsoft Corp. | 4.7% |
| Visa, Inc., Class A | 4.7% |
| Alphabet, Inc., Class A | 4.1% |
| Boeing Co. | 3.9% |
There were no material fund changes during the period.
There were no changes in or disagreements with Accountants during the period.
For additional information about the Fund; including its prospectus, financial information, holdings and proxy information, scan the QR code or visit im.natixis.com/funddocuments.
Loomis Sayles Growth Fund
Annual Shareholder Report
September 30, 2024
Loomis Sayles Growth Fund
Annual Shareholder Report - September 30, 2024
This annual shareholder report contains important information about Loomis Sayles Growth Fund for the period of October 1, 2023 to September 30, 2024. You can find additional information (including tax information) about the Fund at im.natixis.com/funddocuments. You can also request the information by contacting us at (800) 225-5478 or by contacting your financial intermediary directly.
What were the fund costs for the last year? (based on a hypothetical $10,000 investment)
| Class Name | Costs of a $10,000 investment | Costs paid as a percentage of a $10,000 investmentFootnote Reference† |
|---|
| Class C | $198 | 1.66% |
| Footnote | Description |
Footnote† | Annualized for periods less than one year. |
How did the fund perform last year and what affected its performance?
Explanation of Fund Performance
We are an active manager with a long-term, private equity approach to investing. Through our proprietary bottom-up research framework, we look to invest in those few high-quality businesses with sustainable competitive advantages and profitable growth when they trade at a significant discount to intrinsic value. Given the rare confluence of quality, growth, and valuation, ours is a selective, high-conviction portfolio of typically 30-40 names.
Top Contributors to Performance
• The Fund’s positions in Nvidia, Meta Platforms, and Netflix contributed the most to performance.
• Stock selection in the information technology, communication services, and healthcare sectors, along with our allocations in the communication services, consumer staples, and consumer discretionary sectors, contributed positively to relative performance.
Top Detractors from Performance
• The Fund’s positions in Boeing, Yum China, and Illumina detracted the most from performance.
• Stock selection in the industrials, financials, consumer staples, and consumer discretionary sectors, along with our allocations in the information technology, healthcare, financials, and industrials sectors, detracted from relative performance.
Investment Activity
All aspects of our quality-growth-valuation investment thesis must be present simultaneously for us to make an investment. Often our research is completed well in advance of the opportunity to invest. We are patient investors and maintain coverage of high-quality businesses in order to take advantage of meaningful price dislocations if and when they occur. During the period, we initiated a new position in Nike. We added to our existing holdings in Boeing, Disney, Monster Beverage, Shopify, Starbucks, Tesla, and Thermo Fisher Scientific. We trimmed our positions in Meta Platforms and Nvidia as they reached our historic maximum allowable position size due to market appreciation. We sold our positions in Grail and Sandoz, both of which we received as spin-offs from existing holdings Illumina and Novartis, respectively.
The Fund’s benchmarks are unmanaged indices used as a general measure of market performance. Calculations assume dividends and capital gains are reinvested. The tables do not reflect taxes shareholders might owe on any fund distributions or when they redeem their shares. You cannot invest directly in an index.
Total Return Based on a Hypothetical $10,000 Investment
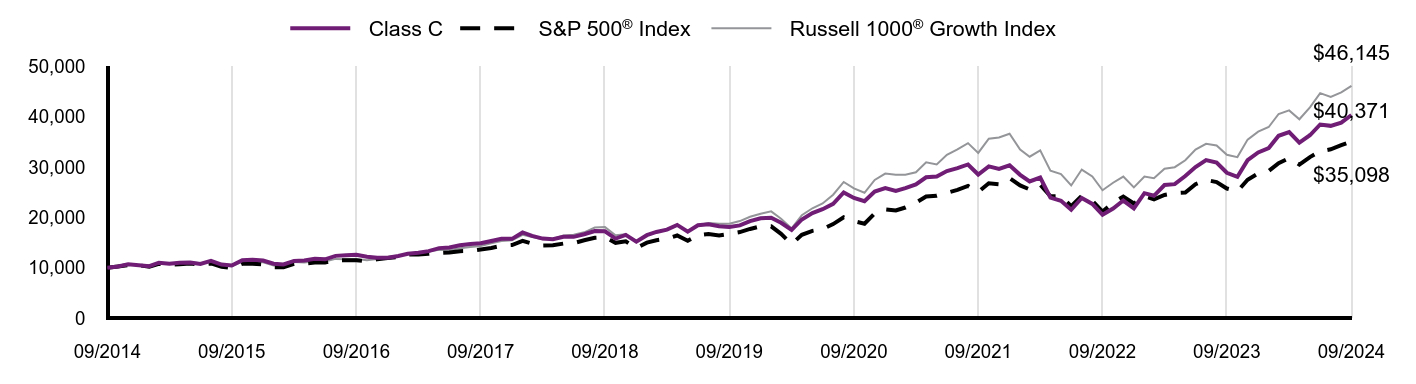
| Class C | S&P 500® Index | Russell 1000® Growth Index |
|---|
| 09/2014 | $10,000 | $10,000 | $10,000 |
| 10/2014 | $10,228 | $10,244 | $10,264 |
| 11/2014 | $10,671 | $10,520 | $10,589 |
| 12/2014 | $10,501 | $10,493 | $10,478 |
| 01/2015 | $10,296 | $10,178 | $10,318 |
| 02/2015 | $11,001 | $10,763 | $11,006 |
| 03/2015 | $10,785 | $10,593 | $10,881 |
| 04/2015 | $10,967 | $10,695 | $10,935 |
| 05/2015 | $11,024 | $10,832 | $11,089 |
| 06/2015 | $10,739 | $10,622 | $10,894 |
| 07/2015 | $11,354 | $10,845 | $11,263 |
| 08/2015 | $10,626 | $10,191 | $10,579 |
| 09/2015 | $10,444 | $9,939 | $10,317 |
| 10/2015 | $11,479 | $10,777 | $11,206 |
| 11/2015 | $11,593 | $10,809 | $11,237 |
| 12/2015 | $11,433 | $10,638 | $11,072 |
| 01/2016 | $10,785 | $10,111 | $10,454 |
| 02/2016 | $10,637 | $10,097 | $10,450 |
| 03/2016 | $11,354 | $10,782 | $11,154 |
| 04/2016 | $11,456 | $10,824 | $11,053 |
| 05/2016 | $11,763 | $11,018 | $11,267 |
| 06/2016 | $11,672 | $11,047 | $11,223 |
| 07/2016 | $12,355 | $11,454 | $11,753 |
| 08/2016 | $12,480 | $11,470 | $11,694 |
| 09/2016 | $12,582 | $11,472 | $11,737 |
| 10/2016 | $12,196 | $11,263 | $11,461 |
| 11/2016 | $11,991 | $11,680 | $11,711 |
| 12/2016 | $11,977 | $11,911 | $11,856 |
| 01/2017 | $12,322 | $12,137 | $12,255 |
| 02/2017 | $12,759 | $12,619 | $12,764 |
| 03/2017 | $12,966 | $12,633 | $12,912 |
| 04/2017 | $13,299 | $12,763 | $13,207 |
| 05/2017 | $13,897 | $12,943 | $13,551 |
| 06/2017 | $14,023 | $13,023 | $13,515 |
| 07/2017 | $14,448 | $13,291 | $13,874 |
| 08/2017 | $14,713 | $13,332 | $14,129 |
| 09/2017 | $14,851 | $13,607 | $14,312 |
| 10/2017 | $15,311 | $13,925 | $14,867 |
| 11/2017 | $15,736 | $14,352 | $15,318 |
| 12/2017 | $15,738 | $14,511 | $15,438 |
| 01/2018 | $17,006 | $15,342 | $16,531 |
| 02/2018 | $16,336 | $14,777 | $16,098 |
| 03/2018 | $15,796 | $14,401 | $15,656 |
| 04/2018 | $15,655 | $14,456 | $15,711 |
| 05/2018 | $16,160 | $14,804 | $16,400 |
| 06/2018 | $16,137 | $14,896 | $16,557 |
| 07/2018 | $16,665 | $15,450 | $17,044 |
| 08/2018 | $17,276 | $15,953 | $17,975 |
| 09/2018 | $17,241 | $16,044 | $18,076 |
| 10/2018 | $15,796 | $14,947 | $16,459 |
| 11/2018 | $16,524 | $15,252 | $16,634 |
| 12/2018 | $15,195 | $13,875 | $15,204 |
| 01/2019 | $16,466 | $14,987 | $16,571 |
| 02/2019 | $17,115 | $15,468 | $17,164 |
| 03/2019 | $17,576 | $15,769 | $17,652 |
| 04/2019 | $18,511 | $16,407 | $18,450 |
| 05/2019 | $17,152 | $15,364 | $17,284 |
| 06/2019 | $18,436 | $16,447 | $18,471 |
| 07/2019 | $18,623 | $16,684 | $18,888 |
| 08/2019 | $18,236 | $16,419 | $18,744 |
| 09/2019 | $18,112 | $16,727 | $18,746 |
| 10/2019 | $18,411 | $17,089 | $19,274 |
| 11/2019 | $19,259 | $17,709 | $20,129 |
| 12/2019 | $19,823 | $18,244 | $20,737 |
| 01/2020 | $19,951 | $18,237 | $21,200 |
| 02/2020 | $18,941 | $16,735 | $19,757 |
| 03/2020 | $17,509 | $14,668 | $17,813 |
| 04/2020 | $19,593 | $16,549 | $20,449 |
| 05/2020 | $20,872 | $17,337 | $21,822 |
| 06/2020 | $21,640 | $17,682 | $22,772 |
| 07/2020 | $22,701 | $18,679 | $24,524 |
| 08/2020 | $24,965 | $20,021 | $27,055 |
| 09/2020 | $23,865 | $19,260 | $25,782 |
| 10/2020 | $23,225 | $18,748 | $24,906 |
| 11/2020 | $25,144 | $20,801 | $27,456 |
| 12/2020 | $25,853 | $21,600 | $28,719 |
| 01/2021 | $25,248 | $21,382 | $28,506 |
| 02/2021 | $25,826 | $21,972 | $28,500 |
| 03/2021 | $26,553 | $22,934 | $28,990 |
| 04/2021 | $27,978 | $24,158 | $30,962 |
| 05/2021 | $28,153 | $24,327 | $30,534 |
| 06/2021 | $29,216 | $24,895 | $32,449 |
| 07/2021 | $29,808 | $25,486 | $33,519 |
| 08/2021 | $30,534 | $26,261 | $34,772 |
| 09/2021 | $28,530 | $25,040 | $32,824 |
| 10/2021 | $30,144 | $26,794 | $35,668 |
| 11/2021 | $29,660 | $26,608 | $35,886 |
| 12/2021 | $30,365 | $27,801 | $36,644 |
| 01/2022 | $28,472 | $26,362 | $33,499 |
| 02/2022 | $27,148 | $25,573 | $32,077 |
| 03/2022 | $27,931 | $26,522 | $33,331 |
| 04/2022 | $23,931 | $24,209 | $29,306 |
| 05/2022 | $23,319 | $24,254 | $28,625 |
| 06/2022 | $21,525 | $22,252 | $26,357 |
| 07/2022 | $23,860 | $24,304 | $29,521 |
| 08/2022 | $22,692 | $23,312 | $28,146 |
| 09/2022 | $20,528 | $21,165 | $25,409 |
| 10/2022 | $21,776 | $22,879 | $26,895 |
| 11/2022 | $23,361 | $24,158 | $28,120 |
| 12/2022 | $21,798 | $22,766 | $25,967 |
| 01/2023 | $24,821 | $24,196 | $28,132 |
| 02/2023 | $24,305 | $23,606 | $27,798 |
| 03/2023 | $26,444 | $24,473 | $29,698 |
| 04/2023 | $26,621 | $24,855 | $29,991 |
| 05/2023 | $28,228 | $24,963 | $31,358 |
| 06/2023 | $30,013 | $26,612 | $33,502 |
| 07/2023 | $31,414 | $27,467 | $34,631 |
| 08/2023 | $30,912 | $27,030 | $34,320 |
| 09/2023 | $28,877 | $25,741 | $32,453 |
| 10/2023 | $28,081 | $25,200 | $31,991 |
| 11/2023 | $31,384 | $27,501 | $35,479 |
| 12/2023 | $32,921 | $28,750 | $37,050 |
| 01/2024 | $33,803 | $29,233 | $37,974 |
| 02/2024 | $36,244 | $30,794 | $40,565 |
| 03/2024 | $36,969 | $31,785 | $41,279 |
| 04/2024 | $34,874 | $30,487 | $39,528 |
| 05/2024 | $36,339 | $31,999 | $41,894 |
| 06/2024 | $38,481 | $33,147 | $44,719 |
| 07/2024 | $38,213 | $33,550 | $43,959 |
| 08/2024 | $38,859 | $34,364 | $44,874 |
| 09/2024 | $40,371 | $35,098 | $46,145 |
Performance data shown represents past performance and is no guarantee of, and is not necessarily indicative of, future results. Total return and value will vary, and you may have a gain or loss when shares are sold. Current performance may be lower or higher than quoted. For the most recent month-end performance, visit im.natixis.com/en-us/products/mutual-funds/price-and-performance.
Average Annual Total Returns (%)
| 1 Year | 5 Years | 10 Years | Since Inception 9/15/03 |
|---|
| Class C at NAV | 38.69% | 17.03% | 14.98% | 9.65% |
Class C with CDSCFootnote Reference1 | 37.69% | 17.03% | 14.98% | 9.65% |
S&P 500® Index | 36.35% | 15.98% | 13.38% | -% |
Russell 1000® Growth Index | 42.19% | 19.74% | 16.52% | -% |
| Footnote | Description |
Footnote1 | Contingent deferred sales charge |
Effective February 1, 2024, in accordance with new regulations, the Fund's primary broad-based index changed to the S&P 500® Index. The Fund will retain the Russell 1000® Growth Index as an additional benchmark for performance comparison.
| Total Net Assets | $14,883,036,750 |
| # of Portfolio Holdings (including overnight repurchase agreements) | 39 |
| Portfolio Turnover Rate | 10% |
| Total Advisory Fees Paid (after waiver/reimbursement, if applicable) | $65,131,960 |
What did the Fund invest in? (% of Net Assets)
| Value | Value |
|---|
Other investments less than 3% of net assetsFootnote Reference* | 14.9% |
| Hotels, Restaurants & Leisure | 3.1% |
| Aerospace & Defense | 3.9% |
| Pharmaceuticals | 4.0% |
| Biotechnology | 4.7% |
| Broadline Retail | 6.4% |
| Financial Services | 6.5% |
| Automobiles | 7.4% |
| Entertainment | 7.7% |
| Semiconductors & Semiconductor Equipment | 10.9% |
| Interactive Media & Services | 13.8% |
| Software | 16.7% |
| Footnote | Description |
Footnote* | Net of other assets less liabilities |
| NVIDIA Corp. | 9.2% |
| Meta Platforms, Inc., Class A | 7.8% |
| Tesla, Inc. | 7.4% |
| Amazon.com, Inc. | 5.5% |
| Oracle Corp. | 5.3% |
| Netflix, Inc. | 5.2% |
| Microsoft Corp. | 4.7% |
| Visa, Inc., Class A | 4.7% |
| Alphabet, Inc., Class A | 4.1% |
| Boeing Co. | 3.9% |
There were no material fund changes during the period.
There were no changes in or disagreements with Accountants during the period.
For additional information about the Fund; including its prospectus, financial information, holdings and proxy information, scan the QR code or visit im.natixis.com/funddocuments.
Loomis Sayles Growth Fund
Annual Shareholder Report
September 30, 2024
Loomis Sayles Growth Fund
Annual Shareholder Report - September 30, 2024
This annual shareholder report contains important information about Loomis Sayles Growth Fund for the period of October 1, 2023 to September 30, 2024. You can find additional information (including tax information) about the Fund at im.natixis.com/funddocuments. You can also request the information by contacting us at (800) 225-5478 or by contacting your financial intermediary directly.
What were the fund costs for the last year? (based on a hypothetical $10,000 investment)
| Class Name | Costs of a $10,000 investment | Costs paid as a percentage of a $10,000 investmentFootnote Reference† |
|---|
| Class N | $68 | 0.57% |
| Footnote | Description |
Footnote† | Annualized for periods less than one year. |
How did the fund perform last year and what affected its performance?
Explanation of Fund Performance
We are an active manager with a long-term, private equity approach to investing. Through our proprietary bottom-up research framework, we look to invest in those few high-quality businesses with sustainable competitive advantages and profitable growth when they trade at a significant discount to intrinsic value. Given the rare confluence of quality, growth, and valuation, ours is a selective, high-conviction portfolio of typically 30-40 names.
Top Contributors to Performance
• The Fund’s positions in Nvidia, Meta Platforms, and Netflix contributed the most to performance.
• Stock selection in the information technology, communication services, and healthcare sectors, along with our allocations in the communication services, consumer staples, and consumer discretionary sectors, contributed positively to relative performance.
Top Detractors from Performance
• The Fund’s positions in Boeing, Yum China, and Illumina detracted the most from performance.
• Stock selection in the industrials, financials, consumer staples, and consumer discretionary sectors, along with our allocations in the information technology, healthcare, financials, and industrials sectors, detracted from relative performance.
Investment Activity
All aspects of our quality-growth-valuation investment thesis must be present simultaneously for us to make an investment. Often our research is completed well in advance of the opportunity to invest. We are patient investors and maintain coverage of high-quality businesses in order to take advantage of meaningful price dislocations if and when they occur. During the period, we initiated a new position in Nike. We added to our existing holdings in Boeing, Disney, Monster Beverage, Shopify, Starbucks, Tesla, and Thermo Fisher Scientific. We trimmed our positions in Meta Platforms and Nvidia as they reached our historic maximum allowable position size due to market appreciation. We sold our positions in Grail and Sandoz, both of which we received as spin-offs from existing holdings Illumina and Novartis, respectively.
The Fund’s benchmarks are unmanaged indices used as a general measure of market performance. Calculations assume dividends and capital gains are reinvested. The tables do not reflect taxes shareholders might owe on any fund distributions or when they redeem their shares. You cannot invest directly in an index.
Total Return Based on a Hypothetical $10,000 Investment
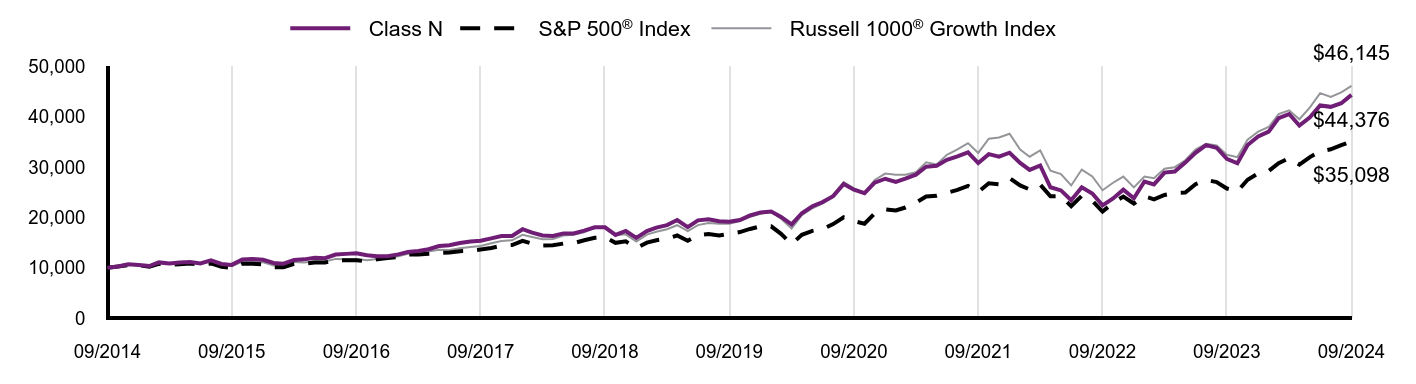
| Class N | S&P 500® Index | Russell 1000® Growth Index |
|---|
| 09/2014 | $10,000 | $10,000 | $10,000 |
| 10/2014 | $10,230 | $10,244 | $10,264 |
| 11/2014 | $10,689 | $10,520 | $10,589 |
| 12/2014 | $10,535 | $10,493 | $10,478 |
| 01/2015 | $10,334 | $10,178 | $10,318 |
| 02/2015 | $11,057 | $10,763 | $11,006 |
| 03/2015 | $10,846 | $10,593 | $10,881 |
| 04/2015 | $11,037 | $10,695 | $10,935 |
| 05/2015 | $11,117 | $10,832 | $11,089 |
| 06/2015 | $10,836 | $10,622 | $10,894 |
| 07/2015 | $11,459 | $10,845 | $11,263 |
| 08/2015 | $10,736 | $10,191 | $10,579 |
| 09/2015 | $10,565 | $9,939 | $10,317 |
| 10/2015 | $11,619 | $10,777 | $11,206 |
| 11/2015 | $11,750 | $10,809 | $11,237 |
| 12/2015 | $11,590 | $10,638 | $11,072 |
| 01/2016 | $10,953 | $10,111 | $10,454 |
| 02/2016 | $10,812 | $10,097 | $10,450 |
| 03/2016 | $11,539 | $10,782 | $11,154 |
| 04/2016 | $11,660 | $10,824 | $11,053 |
| 05/2016 | $11,994 | $11,018 | $11,267 |
| 06/2016 | $11,903 | $11,047 | $11,223 |
| 07/2016 | $12,620 | $11,454 | $11,753 |
| 08/2016 | $12,752 | $11,470 | $11,694 |
| 09/2016 | $12,863 | $11,472 | $11,737 |
| 10/2016 | $12,479 | $11,263 | $11,461 |
| 11/2016 | $12,287 | $11,680 | $11,711 |
| 12/2016 | $12,290 | $11,911 | $11,856 |
| 01/2017 | $12,649 | $12,137 | $12,255 |
| 02/2017 | $13,110 | $12,619 | $12,764 |
| 03/2017 | $13,336 | $12,633 | $12,912 |
| 04/2017 | $13,685 | $12,763 | $13,207 |
| 05/2017 | $14,321 | $12,943 | $13,551 |
| 06/2017 | $14,465 | $13,023 | $13,515 |
| 07/2017 | $14,916 | $13,291 | $13,874 |
| 08/2017 | $15,203 | $13,332 | $14,129 |
| 09/2017 | $15,357 | $13,607 | $14,312 |
| 10/2017 | $15,839 | $13,925 | $14,867 |
| 11/2017 | $16,301 | $14,352 | $15,318 |
| 12/2017 | $16,315 | $14,511 | $15,438 |
| 01/2018 | $17,651 | $15,342 | $16,531 |
| 02/2018 | $16,967 | $14,777 | $16,098 |
| 03/2018 | $16,421 | $14,401 | $15,656 |
| 04/2018 | $16,294 | $14,456 | $15,711 |
| 05/2018 | $16,820 | $14,804 | $16,400 |
| 06/2018 | $16,820 | $14,896 | $16,557 |
| 07/2018 | $17,377 | $15,450 | $17,044 |
| 08/2018 | $18,039 | $15,953 | $17,975 |
| 09/2018 | $18,029 | $16,044 | $18,076 |
| 10/2018 | $16,526 | $14,947 | $16,459 |
| 11/2018 | $17,304 | $15,252 | $16,634 |
| 12/2018 | $15,926 | $13,875 | $15,204 |
| 01/2019 | $17,274 | $14,987 | $16,571 |
| 02/2019 | $17,965 | $15,468 | $17,164 |
| 03/2019 | $18,467 | $15,769 | $17,652 |
| 04/2019 | $19,481 | $16,407 | $18,450 |
| 05/2019 | $18,055 | $15,364 | $17,284 |
| 06/2019 | $19,425 | $16,447 | $18,471 |
| 07/2019 | $19,637 | $16,684 | $18,888 |
| 08/2019 | $19,247 | $16,419 | $18,744 |
| 09/2019 | $19,136 | $16,727 | $18,746 |
| 10/2019 | $19,470 | $17,089 | $19,274 |
| 11/2019 | $20,384 | $17,709 | $20,129 |
| 12/2019 | $20,998 | $18,244 | $20,737 |
| 01/2020 | $21,158 | $18,237 | $21,200 |
| 02/2020 | $20,104 | $16,735 | $19,757 |
| 03/2020 | $18,604 | $14,668 | $17,813 |
| 04/2020 | $20,838 | $16,549 | $20,449 |
| 05/2020 | $22,224 | $17,337 | $21,822 |
| 06/2020 | $23,048 | $17,682 | $22,772 |
| 07/2020 | $24,205 | $18,679 | $24,524 |
| 08/2020 | $26,646 | $20,021 | $27,055 |
| 09/2020 | $25,500 | $19,260 | $25,782 |
| 10/2020 | $24,836 | $18,748 | $24,906 |
| 11/2020 | $26,909 | $20,801 | $27,456 |
| 12/2020 | $27,692 | $21,600 | $28,719 |
| 01/2021 | $27,069 | $21,382 | $28,506 |
| 02/2021 | $27,716 | $21,972 | $28,500 |
| 03/2021 | $28,506 | $22,934 | $28,990 |
| 04/2021 | $30,074 | $24,158 | $30,962 |
| 05/2021 | $30,290 | $24,327 | $30,534 |
| 06/2021 | $31,463 | $24,895 | $32,449 |
| 07/2021 | $32,133 | $25,486 | $33,519 |
| 08/2021 | $32,936 | $26,261 | $34,772 |
| 09/2021 | $30,805 | $25,040 | $32,824 |
| 10/2021 | $32,588 | $26,794 | $35,668 |
| 11/2021 | $32,086 | $26,608 | $35,886 |
| 12/2021 | $32,869 | $27,801 | $36,644 |
| 01/2022 | $30,850 | $26,362 | $33,499 |
| 02/2022 | $29,446 | $25,573 | $32,077 |
| 03/2022 | $30,324 | $26,522 | $33,331 |
| 04/2022 | $25,997 | $24,209 | $29,306 |
| 05/2022 | $25,370 | $24,254 | $28,625 |
| 06/2022 | $23,426 | $22,252 | $26,357 |
| 07/2022 | $25,984 | $24,304 | $29,521 |
| 08/2022 | $24,755 | $23,312 | $28,146 |
| 09/2022 | $22,410 | $21,165 | $25,409 |
| 10/2022 | $23,777 | $22,879 | $26,895 |
| 11/2022 | $25,520 | $24,158 | $28,120 |
| 12/2022 | $23,811 | $22,766 | $25,967 |
| 01/2023 | $27,141 | $24,196 | $28,132 |
| 02/2023 | $26,572 | $23,606 | $27,798 |
| 03/2023 | $28,924 | $24,473 | $29,698 |
| 04/2023 | $29,128 | $24,855 | $29,991 |
| 05/2023 | $30,896 | $24,963 | $31,358 |
| 06/2023 | $32,853 | $26,612 | $33,502 |
| 07/2023 | $34,387 | $27,467 | $34,631 |
| 08/2023 | $33,861 | $27,030 | $34,320 |
| 09/2023 | $31,641 | $25,741 | $32,453 |
| 10/2023 | $30,764 | $25,200 | $31,991 |
| 11/2023 | $34,402 | $27,501 | $35,479 |
| 12/2023 | $36,099 | $28,750 | $37,050 |
| 01/2024 | $37,075 | $29,233 | $37,974 |
| 02/2024 | $39,757 | $30,794 | $40,565 |
| 03/2024 | $40,563 | $31,785 | $41,279 |
| 04/2024 | $38,284 | $30,487 | $39,528 |
| 05/2024 | $39,896 | $31,999 | $41,894 |
| 06/2024 | $42,268 | $33,147 | $44,719 |
| 07/2024 | $41,989 | $33,550 | $43,959 |
| 08/2024 | $42,702 | $34,364 | $44,874 |
| 09/2024 | $44,376 | $35,098 | $46,145 |
Performance data shown represents past performance and is no guarantee of, and is not necessarily indicative of, future results. Total return and value will vary, and you may have a gain or loss when shares are sold. Current performance may be lower or higher than quoted. For the most recent month-end performance, visit im.natixis.com/en-us/products/mutual-funds/price-and-performance.
Average Annual Total Returns (%)
| 1 Year | 5 Years | 10 Years | Since Inception 2/1/13 |
|---|
| Class N | 40.25% | 18.32% | 16.07% | 16.40% |
S&P 500® Index | 36.35% | 15.98% | 13.38% | -% |
Russell 1000® Growth Index | 42.19% | 19.74% | 16.52% | -% |
Effective February 1, 2024, in accordance with new regulations, the Fund's primary broad-based index changed to the S&P 500® Index. The Fund will retain the Russell 1000® Growth Index as an additional benchmark for performance comparison.
| Total Net Assets | $14,883,036,750 |
| # of Portfolio Holdings (including overnight repurchase agreements) | 39 |
| Portfolio Turnover Rate | 10% |
| Total Advisory Fees Paid (after waiver/reimbursement, if applicable) | $65,131,960 |
What did the Fund invest in? (% of Net Assets)
| Value | Value |
|---|
Other investments less than 3% of net assetsFootnote Reference* | 14.9% |
| Hotels, Restaurants & Leisure | 3.1% |
| Aerospace & Defense | 3.9% |
| Pharmaceuticals | 4.0% |
| Biotechnology | 4.7% |
| Broadline Retail | 6.4% |
| Financial Services | 6.5% |
| Automobiles | 7.4% |
| Entertainment | 7.7% |
| Semiconductors & Semiconductor Equipment | 10.9% |
| Interactive Media & Services | 13.8% |
| Software | 16.7% |
| Footnote | Description |
Footnote* | Net of other assets less liabilities |
| NVIDIA Corp. | 9.2% |
| Meta Platforms, Inc., Class A | 7.8% |
| Tesla, Inc. | 7.4% |
| Amazon.com, Inc. | 5.5% |
| Oracle Corp. | 5.3% |
| Netflix, Inc. | 5.2% |
| Microsoft Corp. | 4.7% |
| Visa, Inc., Class A | 4.7% |
| Alphabet, Inc., Class A | 4.1% |
| Boeing Co. | 3.9% |
There were no material fund changes during the period.
There were no changes in or disagreements with Accountants during the period.
For additional information about the Fund; including its prospectus, financial information, holdings and proxy information, scan the QR code or visit im.natixis.com/funddocuments.
Loomis Sayles Growth Fund
Annual Shareholder Report
September 30, 2024
Loomis Sayles Limited Term Government and Agency Fund
Annual Shareholder Report - September 30, 2024
This annual shareholder report contains important information about Loomis Sayles Limited Term Government and Agency Fund for the period of October 1, 2023 to September 30, 2024. You can find additional information (including tax information) about the Fund at im.natixis.com/funddocuments. You can also request the information by contacting us at (800) 225-5478 or by contacting your financial intermediary directly.
What were the fund costs for the last year? (based on a hypothetical $10,000 investment)
| Class Name | Costs of a $10,000 investment | Costs paid as a percentage of a $10,000 investmentFootnote Reference† |
|---|
| Class Y | $47 | 0.45% |
| Footnote | Description |
Footnote† | Annualized for periods less than one year. |
How did the fund perform last year and what affected its performance?
Explanation of Fund Performance
Top Contributors to Performance
• Holdings within securitized sectors benefitted the portfolio during the period, specifically exposure to agency and non-agency commercial mortgage-backed securities.
• Holdings in collateralized mortgage obligations were also beneficial to relative performance.
Top Detractors from Performance
• Duration effect had a negative impact on relative performance during the period.
• Issue selection within US Treasurys securities detracted from performance slightly.
The Fund’s benchmarks are unmanaged indices used as a general measure of market performance. Calculations assume dividends and capital gains are reinvested. The tables do not reflect taxes shareholders might owe on any fund distributions or when they redeem their shares. You cannot invest directly in an index.
Total Return Based on a Hypothetical $10,000 Investment
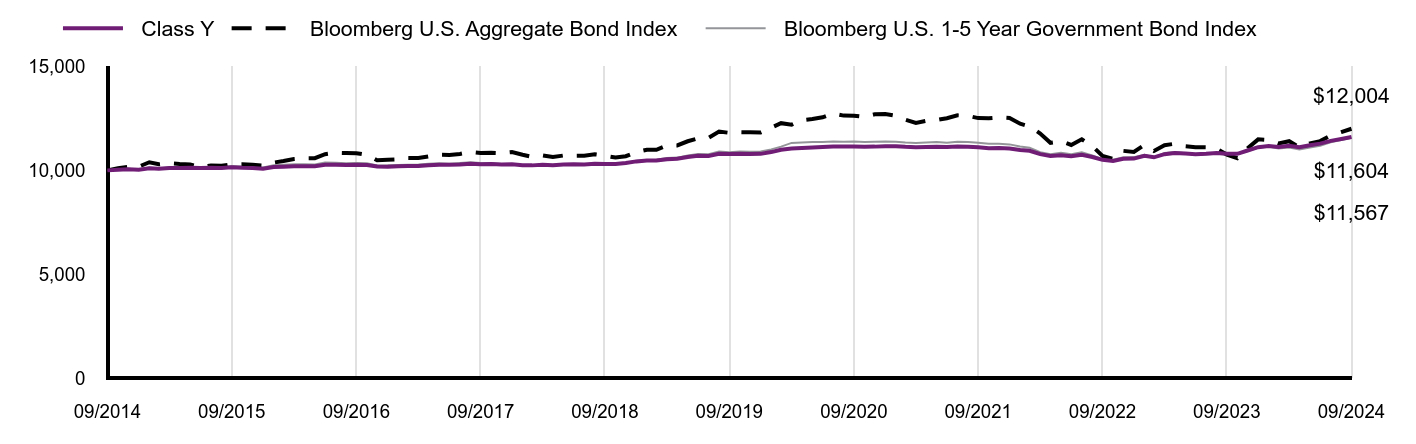
| Class Y | Bloomberg U.S. Aggregate Bond Index | Bloomberg U.S. 1-5 Year Government Bond Index |
|---|
| 09/2014 | $10,000 | $10,000 | $10,000 |
| 10/2014 | $10,034 | $10,098 | $10,048 |
| 11/2014 | $10,059 | $10,170 | $10,077 |
| 12/2014 | $10,036 | $10,179 | $10,045 |
| 01/2015 | $10,104 | $10,393 | $10,141 |
| 02/2015 | $10,077 | $10,295 | $10,093 |
| 03/2015 | $10,109 | $10,343 | $10,133 |
| 04/2015 | $10,115 | $10,306 | $10,136 |
| 05/2015 | $10,122 | $10,281 | $10,145 |
| 06/2015 | $10,110 | $10,169 | $10,136 |
| 07/2015 | $10,124 | $10,240 | $10,154 |
| 08/2015 | $10,120 | $10,225 | $10,153 |
| 09/2015 | $10,151 | $10,294 | $10,205 |
| 10/2015 | $10,122 | $10,296 | $10,183 |
| 11/2015 | $10,109 | $10,269 | $10,154 |
| 12/2015 | $10,083 | $10,235 | $10,139 |
| 01/2016 | $10,159 | $10,376 | $10,247 |
| 02/2016 | $10,172 | $10,450 | $10,272 |
| 03/2016 | $10,194 | $10,546 | $10,295 |
| 04/2016 | $10,200 | $10,586 | $10,294 |
| 05/2016 | $10,196 | $10,589 | $10,279 |
| 06/2016 | $10,273 | $10,779 | $10,378 |
| 07/2016 | $10,270 | $10,847 | $10,373 |
| 08/2016 | $10,258 | $10,835 | $10,342 |
| 09/2016 | $10,272 | $10,829 | $10,360 |
| 10/2016 | $10,259 | $10,746 | $10,338 |
| 11/2016 | $10,185 | $10,492 | $10,240 |
| 12/2016 | $10,179 | $10,506 | $10,242 |
| 01/2017 | $10,193 | $10,527 | $10,261 |
| 02/2017 | $10,208 | $10,598 | $10,276 |
| 03/2017 | $10,215 | $10,592 | $10,282 |
| 04/2017 | $10,248 | $10,674 | $10,315 |
| 05/2017 | $10,273 | $10,756 | $10,339 |
| 06/2017 | $10,272 | $10,745 | $10,324 |
| 07/2017 | $10,279 | $10,792 | $10,352 |
| 08/2017 | $10,314 | $10,888 | $10,389 |
| 09/2017 | $10,294 | $10,836 | $10,354 |
| 10/2017 | $10,302 | $10,843 | $10,343 |
| 11/2017 | $10,282 | $10,829 | $10,313 |
| 12/2017 | $10,290 | $10,879 | $10,312 |
| 01/2018 | $10,243 | $10,753 | $10,253 |
| 02/2018 | $10,241 | $10,651 | $10,239 |
| 03/2018 | $10,268 | $10,720 | $10,272 |
| 04/2018 | $10,248 | $10,640 | $10,236 |
| 05/2018 | $10,285 | $10,716 | $10,286 |
| 06/2018 | $10,293 | $10,703 | $10,285 |
| 07/2018 | $10,284 | $10,705 | $10,275 |
| 08/2018 | $10,321 | $10,774 | $10,320 |
| 09/2018 | $10,303 | $10,705 | $10,291 |
| 10/2018 | $10,304 | $10,620 | $10,304 |
| 11/2018 | $10,352 | $10,683 | $10,354 |
| 12/2018 | $10,433 | $10,880 | $10,470 |
| 01/2019 | $10,472 | $10,995 | $10,504 |
| 02/2019 | $10,473 | $10,989 | $10,507 |
| 03/2019 | $10,541 | $11,200 | $10,598 |
| 04/2019 | $10,562 | $11,203 | $10,615 |
| 05/2019 | $10,648 | $11,402 | $10,723 |
| 06/2019 | $10,706 | $11,545 | $10,793 |
| 07/2019 | $10,698 | $11,570 | $10,775 |
| 08/2019 | $10,803 | $11,870 | $10,903 |
| 09/2019 | $10,785 | $11,807 | $10,876 |
| 10/2019 | $10,803 | $11,842 | $10,910 |
| 11/2019 | $10,793 | $11,836 | $10,898 |
| 12/2019 | $10,796 | $11,828 | $10,913 |
| 01/2020 | $10,881 | $12,056 | $11,011 |
| 02/2020 | $10,993 | $12,273 | $11,143 |
| 03/2020 | $11,048 | $12,200 | $11,323 |
| 04/2020 | $11,072 | $12,417 | $11,344 |
| 05/2020 | $11,103 | $12,475 | $11,361 |
| 06/2020 | $11,125 | $12,554 | $11,370 |
| 07/2020 | $11,145 | $12,741 | $11,388 |
| 08/2020 | $11,145 | $12,638 | $11,382 |
| 09/2020 | $11,146 | $12,632 | $11,385 |
| 10/2020 | $11,135 | $12,575 | $11,370 |
| 11/2020 | $11,144 | $12,698 | $11,378 |
| 12/2020 | $11,166 | $12,716 | $11,387 |
| 01/2021 | $11,165 | $12,625 | $11,384 |
| 02/2021 | $11,134 | $12,443 | $11,345 |
| 03/2021 | $11,113 | $12,287 | $11,321 |
| 04/2021 | $11,121 | $12,384 | $11,340 |
| 05/2021 | $11,138 | $12,425 | $11,363 |
| 06/2021 | $11,126 | $12,512 | $11,333 |
| 07/2021 | $11,153 | $12,652 | $11,377 |
| 08/2021 | $11,141 | $12,628 | $11,369 |
| 09/2021 | $11,109 | $12,518 | $11,336 |
| 10/2021 | $11,067 | $12,515 | $11,278 |
| 11/2021 | $11,073 | $12,552 | $11,279 |
| 12/2021 | $11,055 | $12,520 | $11,252 |
| 01/2022 | $10,984 | $12,250 | $11,146 |
| 02/2022 | $10,943 | $12,114 | $11,092 |
| 03/2022 | $10,784 | $11,777 | $10,874 |
| 04/2022 | $10,695 | $11,330 | $10,781 |
| 05/2022 | $10,733 | $11,403 | $10,853 |
| 06/2022 | $10,685 | $11,224 | $10,781 |
| 07/2022 | $10,746 | $11,498 | $10,866 |
| 08/2022 | $10,644 | $11,174 | $10,718 |
| 09/2022 | $10,507 | $10,691 | $10,540 |
| 10/2022 | $10,451 | $10,552 | $10,518 |
| 11/2022 | $10,556 | $10,940 | $10,635 |
| 12/2022 | $10,567 | $10,891 | $10,638 |
| 01/2023 | $10,707 | $11,226 | $10,755 |
| 02/2023 | $10,629 | $10,936 | $10,621 |
| 03/2023 | $10,781 | $11,214 | $10,836 |
| 04/2023 | $10,834 | $11,282 | $10,881 |
| 05/2023 | $10,808 | $11,159 | $10,823 |
| 06/2023 | $10,772 | $11,119 | $10,740 |
| 07/2023 | $10,797 | $11,111 | $10,771 |
| 08/2023 | $10,835 | $11,040 | $10,800 |
| 09/2023 | $10,800 | $10,760 | $10,761 |
| 10/2023 | $10,797 | $10,590 | $10,771 |
| 11/2023 | $10,957 | $11,069 | $10,935 |
| 12/2023 | $11,119 | $11,493 | $11,104 |
| 01/2024 | $11,168 | $11,462 | $11,139 |
| 02/2024 | $11,122 | $11,300 | $11,055 |
| 03/2024 | $11,181 | $11,404 | $11,100 |
| 04/2024 | $11,115 | $11,116 | $11,007 |
| 05/2024 | $11,207 | $11,304 | $11,106 |
| 06/2024 | $11,287 | $11,411 | $11,185 |
| 07/2024 | $11,421 | $11,678 | $11,353 |
| 08/2024 | $11,513 | $11,846 | $11,465 |
| 09/2024 | $11,604 | $12,004 | $11,567 |
Performance data shown represents past performance and is no guarantee of, and is not necessarily indicative of, future results. Total return and value will vary, and you may have a gain or loss when shares are sold. Current performance may be lower or higher than quoted. For the most recent month-end performance, visit im.natixis.com/en-us/products/mutual-funds/price-and-performance.
Average Annual Total Returns (%)
| 1 Year | 5 Years | 10 Years | Since Inception 9/15/05 |
|---|
| Class Y | 7.45% | 1.48% | 1.50% | 3.57% |
| Bloomberg U.S. Aggregate Bond Index | 11.57% | 0.33% | 1.84% | -% |
| Bloomberg U.S. 1-5 Year Government Bond Index | 7.49% | 1.24% | 1.47% | -% |
Effective February 1, 2024, in accordance with new regulations, the Fund's primary broad-based index changed to the Bloomberg U.S. Aggregate Bond Index. The Fund will retain the Bloomberg U.S. 1-5 Year Government Bond Index as an additional benchmark for performance comparison.
| Total Net Assets | $742,199,472 |
| # of Portfolio Holdings (including overnight repurchase agreements) | 268 |
| Portfolio Turnover Rate | 217% |
| Total Advisory Fees Paid (after waiver/reimbursement, if applicable) | $1,905,982 |
What did the Fund invest in? (% of Net Assets)
| Value | Value |
|---|
Other investments less than 3% of net assetsFootnote Reference* | 6.0% |
| Short-Term Investments | 4.9% |
| Non-Agency Commercial Mortgage-Backed Securities | 3.4% |
| Collateralized Mortgage Obligations | 8.5% |
| Agency Commercial Mortgage-Backed Securities | 24.8% |
| Treasuries | 52.4% |
| Footnote | Description |
Footnote* | Net of other assets less liabilities |
Credit QualityFootnote Reference†
| Value | Value |
|---|
| Cash & equivalents | 5.0 |
| US Treasury | 52.8 |
Not ratedFootnote Reference^ | 3.5 |
| A | 0.1 |
| AA | 35.7 |
| AAA | 2.9 |
| Footnote | Description |
Footnote† | Credit ratings are by S&P Global Ratings. A credit rating is an assessment provided by a nationally recognized statistical rating organization (NRSRO) of the creditworthiness of an issuer with respect to debt obligations except for those debt obligations that are only privately rated. Ratings are measured on a scale that generally ranges from AAA (highest) to D (lowest). The credit ratings shown relate to the creditworthiness of the issuers of the underlying securities in the Fund, and not to the Fund or its shares. Credit ratings are subject to change. |
Footnote^ | Not Rated category represents only those securities not rated by S&P Global Ratings. Such securities may be rated by other NRSROs not shown here. |
There were no material fund changes during the period.
There were no changes in or disagreements with Accountants during the period.
For additional information about the Fund; including its prospectus, financial information, holdings and proxy information, scan the QR code or visit im.natixis.com/funddocuments.
Loomis Sayles Limited Term Government and Agency Fund
Annual Shareholder Report
September 30, 2024
Loomis Sayles Limited Term Government and Agency Fund
Annual Shareholder Report - September 30, 2024
This annual shareholder report contains important information about Loomis Sayles Limited Term Government and Agency Fund for the period of October 1, 2023 to September 30, 2024. You can find additional information (including tax information) about the Fund at im.natixis.com/funddocuments. You can also request the information by contacting us at (800) 225-5478 or by contacting your financial intermediary directly.
What were the fund costs for the last year? (based on a hypothetical $10,000 investment)
| Class Name | Costs of a $10,000 investment | Costs paid as a percentage of a $10,000 investmentFootnote Reference† |
|---|
| Class A | $72 | 0.70% |
| Footnote | Description |
Footnote† | Annualized for periods less than one year. |
How did the fund perform last year and what affected its performance?
Explanation of Fund Performance
Top Contributors to Performance
• Holdings within securitized sectors benefitted the portfolio during the period, specifically exposure to agency and non-agency commercial mortgage-backed securities.
• Holdings in collateralized mortgage obligations were also beneficial to relative performance.
Top Detractors from Performance
• Duration effect had a negative impact on relative performance during the period.
• Issue selection within US Treasurys securities detracted from performance slightly.
The Fund’s benchmarks are unmanaged indices used as a general measure of market performance. Calculations assume dividends and capital gains are reinvested. The tables do not reflect taxes shareholders might owe on any fund distributions or when they redeem their shares. You cannot invest directly in an index.
Total Return Based on a Hypothetical $10,000 Investment
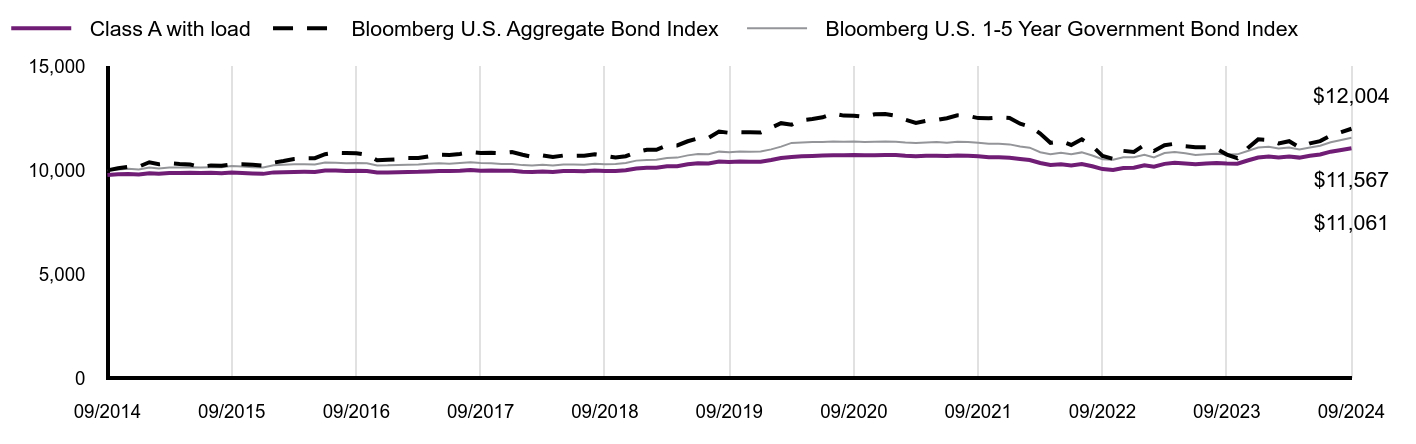
| Class A with load | Bloomberg U.S. Aggregate Bond Index | Bloomberg U.S. 1-5 Year Government Bond Index |
|---|
| 09/2014 | $9,773 | $10,000 | $10,000 |
| 10/2014 | $9,812 | $10,098 | $10,048 |
| 11/2014 | $9,826 | $10,170 | $10,077 |
| 12/2014 | $9,801 | $10,179 | $10,045 |
| 01/2015 | $9,866 | $10,393 | $10,141 |
| 02/2015 | $9,837 | $10,295 | $10,093 |
| 03/2015 | $9,875 | $10,343 | $10,133 |
| 04/2015 | $9,871 | $10,306 | $10,136 |
| 05/2015 | $9,884 | $10,281 | $10,145 |
| 06/2015 | $9,871 | $10,169 | $10,136 |
| 07/2015 | $9,882 | $10,240 | $10,154 |
| 08/2015 | $9,867 | $10,225 | $10,153 |
| 09/2015 | $9,896 | $10,294 | $10,205 |
| 10/2015 | $9,873 | $10,296 | $10,183 |
| 11/2015 | $9,850 | $10,269 | $10,154 |
| 12/2015 | $9,832 | $10,235 | $10,139 |
| 01/2016 | $9,903 | $10,376 | $10,247 |
| 02/2016 | $9,914 | $10,450 | $10,272 |
| 03/2016 | $9,925 | $10,546 | $10,295 |
| 04/2016 | $9,928 | $10,586 | $10,294 |
| 05/2016 | $9,923 | $10,589 | $10,279 |
| 06/2016 | $9,996 | $10,779 | $10,378 |
| 07/2016 | $9,990 | $10,847 | $10,373 |
| 08/2016 | $9,976 | $10,835 | $10,342 |
| 09/2016 | $9,988 | $10,829 | $10,360 |
| 10/2016 | $9,974 | $10,746 | $10,338 |
| 11/2016 | $9,899 | $10,492 | $10,240 |
| 12/2016 | $9,900 | $10,506 | $10,242 |
| 01/2017 | $9,911 | $10,527 | $10,261 |
| 02/2017 | $9,924 | $10,598 | $10,276 |
| 03/2017 | $9,929 | $10,592 | $10,282 |
| 04/2017 | $9,950 | $10,674 | $10,315 |
| 05/2017 | $9,973 | $10,756 | $10,339 |
| 06/2017 | $9,969 | $10,745 | $10,324 |
| 07/2017 | $9,983 | $10,792 | $10,352 |
| 08/2017 | $10,014 | $10,888 | $10,389 |
| 09/2017 | $9,984 | $10,836 | $10,354 |
| 10/2017 | $9,989 | $10,843 | $10,343 |
| 11/2017 | $9,977 | $10,829 | $10,313 |
| 12/2017 | $9,982 | $10,879 | $10,312 |
| 01/2018 | $9,934 | $10,753 | $10,253 |
| 02/2018 | $9,922 | $10,651 | $10,239 |
| 03/2018 | $9,946 | $10,720 | $10,272 |
| 04/2018 | $9,925 | $10,640 | $10,236 |
| 05/2018 | $9,967 | $10,716 | $10,286 |
| 06/2018 | $9,964 | $10,703 | $10,285 |
| 07/2018 | $9,953 | $10,705 | $10,275 |
| 08/2018 | $9,996 | $10,774 | $10,320 |
| 09/2018 | $9,967 | $10,705 | $10,291 |
| 10/2018 | $9,975 | $10,620 | $10,304 |
| 11/2018 | $10,010 | $10,683 | $10,354 |
| 12/2018 | $10,095 | $10,880 | $10,470 |
| 01/2019 | $10,123 | $10,995 | $10,504 |
| 02/2019 | $10,131 | $10,989 | $10,507 |
| 03/2019 | $10,194 | $11,200 | $10,598 |
| 04/2019 | $10,203 | $11,203 | $10,615 |
| 05/2019 | $10,294 | $11,402 | $10,723 |
| 06/2019 | $10,339 | $11,545 | $10,793 |
| 07/2019 | $10,329 | $11,570 | $10,775 |
| 08/2019 | $10,428 | $11,870 | $10,903 |
| 09/2019 | $10,408 | $11,807 | $10,876 |
| 10/2019 | $10,424 | $11,842 | $10,910 |
| 11/2019 | $10,412 | $11,836 | $10,898 |
| 12/2019 | $10,412 | $11,828 | $10,913 |
| 01/2020 | $10,501 | $12,056 | $11,011 |
| 02/2020 | $10,599 | $12,273 | $11,143 |
| 03/2020 | $10,649 | $12,200 | $11,323 |
| 04/2020 | $10,679 | $12,417 | $11,344 |
| 05/2020 | $10,698 | $12,475 | $11,361 |
| 06/2020 | $10,717 | $12,554 | $11,370 |
| 07/2020 | $10,734 | $12,741 | $11,388 |
| 08/2020 | $10,732 | $12,638 | $11,382 |
| 09/2020 | $10,740 | $12,632 | $11,385 |
| 10/2020 | $10,727 | $12,575 | $11,370 |
| 11/2020 | $10,734 | $12,698 | $11,378 |
| 12/2020 | $10,743 | $12,716 | $11,387 |
| 01/2021 | $10,740 | $12,625 | $11,384 |
| 02/2021 | $10,708 | $12,443 | $11,345 |
| 03/2021 | $10,685 | $12,287 | $11,321 |
| 04/2021 | $10,701 | $12,384 | $11,340 |
| 05/2021 | $10,705 | $12,425 | $11,363 |
| 06/2021 | $10,691 | $12,512 | $11,333 |
| 07/2021 | $10,715 | $12,652 | $11,377 |
| 08/2021 | $10,701 | $12,628 | $11,369 |
| 09/2021 | $10,677 | $12,518 | $11,336 |
| 10/2021 | $10,634 | $12,515 | $11,278 |
| 11/2021 | $10,629 | $12,552 | $11,279 |
| 12/2021 | $10,609 | $12,520 | $11,252 |
| 01/2022 | $10,548 | $12,250 | $11,146 |
| 02/2022 | $10,497 | $12,114 | $11,092 |
| 03/2022 | $10,353 | $11,777 | $10,874 |
| 04/2022 | $10,264 | $11,330 | $10,781 |
| 05/2022 | $10,289 | $11,403 | $10,853 |
| 06/2022 | $10,241 | $11,224 | $10,781 |
| 07/2022 | $10,307 | $11,498 | $10,866 |
| 08/2022 | $10,197 | $11,174 | $10,718 |
| 09/2022 | $10,063 | $10,691 | $10,540 |
| 10/2022 | $10,017 | $10,552 | $10,518 |
| 11/2022 | $10,115 | $10,940 | $10,635 |
| 12/2022 | $10,124 | $10,891 | $10,638 |
| 01/2023 | $10,247 | $11,226 | $10,755 |
| 02/2023 | $10,179 | $10,936 | $10,621 |
| 03/2023 | $10,314 | $11,214 | $10,836 |
| 04/2023 | $10,362 | $11,282 | $10,881 |
| 05/2023 | $10,335 | $11,159 | $10,823 |
| 06/2023 | $10,298 | $11,119 | $10,740 |
| 07/2023 | $10,330 | $11,111 | $10,771 |
| 08/2023 | $10,354 | $11,040 | $10,800 |
| 09/2023 | $10,328 | $10,760 | $10,761 |
| 10/2023 | $10,323 | $10,590 | $10,771 |
| 11/2023 | $10,475 | $11,069 | $10,935 |
| 12/2023 | $10,617 | $11,493 | $11,104 |
| 01/2024 | $10,671 | $11,462 | $11,139 |
| 02/2024 | $10,625 | $11,300 | $11,055 |
| 03/2024 | $10,670 | $11,404 | $11,100 |
| 04/2024 | $10,615 | $11,116 | $11,007 |
| 05/2024 | $10,700 | $11,304 | $11,106 |
| 06/2024 | $10,765 | $11,411 | $11,185 |
| 07/2024 | $10,901 | $11,678 | $11,353 |
| 08/2024 | $10,986 | $11,846 | $11,465 |
| 09/2024 | $11,061 | $12,004 | $11,567 |
Performance data shown represents past performance and is no guarantee of, and is not necessarily indicative of, future results. Total return and value will vary, and you may have a gain or loss when shares are sold. Current performance may be lower or higher than quoted. For the most recent month-end performance, visit im.natixis.com/en-us/products/mutual-funds/price-and-performance.
Average Annual Total Returns (%)
| 1 Year | 5 Years | 10 Years | Since Inception 9/15/05 |
|---|
| Class A at NAV | 7.09% | 1.22% | 1.25% | 4.02% |
Class A with 2.25% MSCFootnote Reference1 | 4.71% | 0.77% | 1.01% | 3.96% |
| Bloomberg U.S. Aggregate Bond Index | 11.57% | 0.33% | 1.84% | -% |
| Bloomberg U.S. 1-5 Year Government Bond Index | 7.49% | 1.24% | 1.47% | -% |
| Footnote | Description |
Footnote1 | Maximum sales charge |
Effective February 1, 2024, in accordance with new regulations, the Fund's primary broad-based index changed to the Bloomberg U.S. Aggregate Bond Index. The Fund will retain the Bloomberg U.S. 1-5 Year Government Bond Index as an additional benchmark for performance comparison.
| Total Net Assets | $742,199,472 |
| # of Portfolio Holdings (including overnight repurchase agreements) | 268 |
| Portfolio Turnover Rate | 217% |
| Total Advisory Fees Paid (after waiver/reimbursement, if applicable) | $1,905,982 |
What did the Fund invest in? (% of Net Assets)
| Value | Value |
|---|
Other investments less than 3% of net assetsFootnote Reference* | 6.0% |
| Short-Term Investments | 4.9% |
| Non-Agency Commercial Mortgage-Backed Securities | 3.4% |
| Collateralized Mortgage Obligations | 8.5% |
| Agency Commercial Mortgage-Backed Securities | 24.8% |
| Treasuries | 52.4% |
| Footnote | Description |
Footnote* | Net of other assets less liabilities |
Credit QualityFootnote Reference†
| Value | Value |
|---|
| Cash & equivalents | 5.0 |
| US Treasury | 52.8 |
Not ratedFootnote Reference^ | 3.5 |
| A | 0.1 |
| AA | 35.7 |
| AAA | 2.9 |
| Footnote | Description |
Footnote† | Credit ratings are by S&P Global Ratings. A credit rating is an assessment provided by a nationally recognized statistical rating organization (NRSRO) of the creditworthiness of an issuer with respect to debt obligations except for those debt obligations that are only privately rated. Ratings are measured on a scale that generally ranges from AAA (highest) to D (lowest). The credit ratings shown relate to the creditworthiness of the issuers of the underlying securities in the Fund, and not to the Fund or its shares. Credit ratings are subject to change. |
Footnote^ | Not Rated category represents only those securities not rated by S&P Global Ratings. Such securities may be rated by other NRSROs not shown here. |
There were no material fund changes during the period.
There were no changes in or disagreements with Accountants during the period.
For additional information about the Fund; including its prospectus, financial information, holdings and proxy information, scan the QR code or visit im.natixis.com/funddocuments.
Loomis Sayles Limited Term Government and Agency Fund
Annual Shareholder Report
September 30, 2024
Loomis Sayles Limited Term Government and Agency Fund
Annual Shareholder Report - September 30, 2024
This annual shareholder report contains important information about Loomis Sayles Limited Term Government and Agency Fund for the period of October 1, 2023 to September 30, 2024. You can find additional information (including tax information) about the Fund at im.natixis.com/funddocuments. You can also request the information by contacting us at (800) 225-5478 or by contacting your financial intermediary directly.
What were the fund costs for the last year? (based on a hypothetical $10,000 investment)
| Class Name | Costs of a $10,000 investment | Costs paid as a percentage of a $10,000 investmentFootnote Reference† |
|---|
| Class C | $150 | 1.45% |
| Footnote | Description |
Footnote† | Annualized for periods less than one year. |
How did the fund perform last year and what affected its performance?
Explanation of Fund Performance
Top Contributors to Performance
• Holdings within securitized sectors benefitted the portfolio during the period, specifically exposure to agency and non-agency commercial mortgage-backed securities.
• Holdings in collateralized mortgage obligations were also beneficial to relative performance.
Top Detractors from Performance
• Duration effect had a negative impact on relative performance during the period.
• Issue selection within US Treasurys securities detracted from performance slightly.
The Fund’s benchmarks are unmanaged indices used as a general measure of market performance. Calculations assume dividends and capital gains are reinvested. The tables do not reflect taxes shareholders might owe on any fund distributions or when they redeem their shares. You cannot invest directly in an index.
Total Return Based on a Hypothetical $10,000 Investment
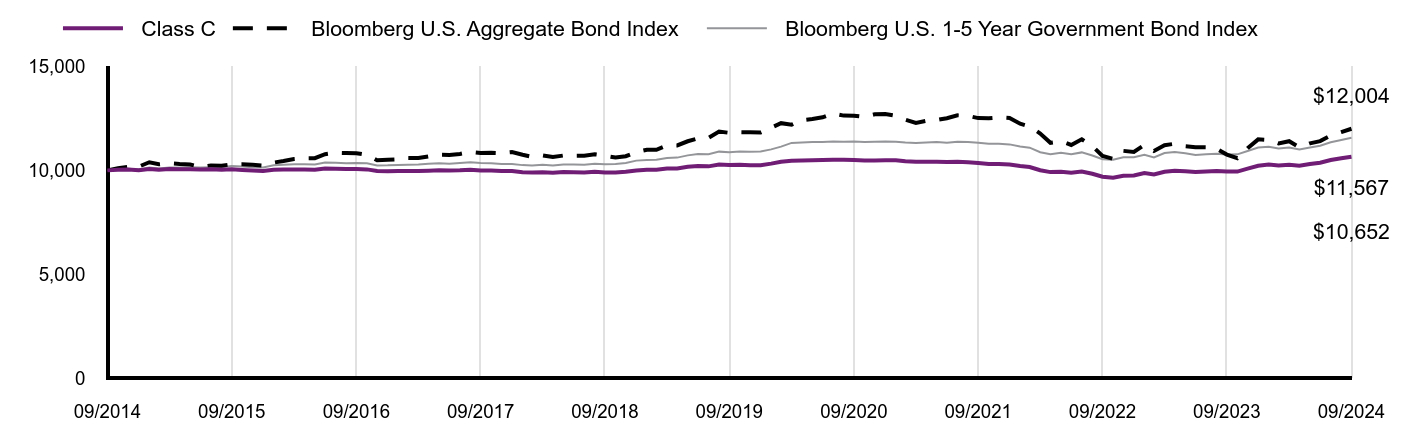
| Class C | Bloomberg U.S. Aggregate Bond Index | Bloomberg U.S. 1-5 Year Government Bond Index |
|---|
| 09/2014 | $10,000 | $10,000 | $10,000 |
| 10/2014 | $10,034 | $10,098 | $10,048 |
| 11/2014 | $10,042 | $10,170 | $10,077 |
| 12/2014 | $10,010 | $10,179 | $10,045 |
| 01/2015 | $10,070 | $10,393 | $10,141 |
| 02/2015 | $10,035 | $10,295 | $10,093 |
| 03/2015 | $10,067 | $10,343 | $10,133 |
| 04/2015 | $10,057 | $10,306 | $10,136 |
| 05/2015 | $10,055 | $10,281 | $10,145 |
| 06/2015 | $10,044 | $10,169 | $10,136 |
| 07/2015 | $10,049 | $10,240 | $10,154 |
| 08/2015 | $10,028 | $10,225 | $10,153 |
| 09/2015 | $10,051 | $10,294 | $10,205 |
| 10/2015 | $10,021 | $10,296 | $10,183 |
| 11/2015 | $9,992 | $10,269 | $10,154 |
| 12/2015 | $9,967 | $10,235 | $10,139 |
| 01/2016 | $10,033 | $10,376 | $10,247 |
| 02/2016 | $10,038 | $10,450 | $10,272 |
| 03/2016 | $10,043 | $10,546 | $10,295 |
| 04/2016 | $10,040 | $10,586 | $10,294 |
| 05/2016 | $10,028 | $10,589 | $10,279 |
| 06/2016 | $10,095 | $10,779 | $10,378 |
| 07/2016 | $10,083 | $10,847 | $10,373 |
| 08/2016 | $10,063 | $10,835 | $10,342 |
| 09/2016 | $10,069 | $10,829 | $10,360 |
| 10/2016 | $10,048 | $10,746 | $10,338 |
| 11/2016 | $9,967 | $10,492 | $10,240 |
| 12/2016 | $9,952 | $10,506 | $10,242 |
| 01/2017 | $9,966 | $10,527 | $10,261 |
| 02/2017 | $9,973 | $10,598 | $10,276 |
| 03/2017 | $9,972 | $10,592 | $10,282 |
| 04/2017 | $9,987 | $10,674 | $10,315 |
| 05/2017 | $10,003 | $10,756 | $10,339 |
| 06/2017 | $9,993 | $10,745 | $10,324 |
| 07/2017 | $10,001 | $10,792 | $10,352 |
| 08/2017 | $10,026 | $10,888 | $10,389 |
| 09/2017 | $9,990 | $10,836 | $10,354 |
| 10/2017 | $9,989 | $10,843 | $10,343 |
| 11/2017 | $9,970 | $10,829 | $10,313 |
| 12/2017 | $9,969 | $10,879 | $10,312 |
| 01/2018 | $9,915 | $10,753 | $10,253 |
| 02/2018 | $9,897 | $10,651 | $10,239 |
| 03/2018 | $9,914 | $10,720 | $10,272 |
| 04/2018 | $9,887 | $10,640 | $10,236 |
| 05/2018 | $9,923 | $10,716 | $10,286 |
| 06/2018 | $9,914 | $10,703 | $10,285 |
| 07/2018 | $9,897 | $10,705 | $10,275 |
| 08/2018 | $9,933 | $10,774 | $10,320 |
| 09/2018 | $9,898 | $10,705 | $10,291 |
| 10/2018 | $9,900 | $10,620 | $10,304 |
| 11/2018 | $9,929 | $10,683 | $10,354 |
| 12/2018 | $9,998 | $10,880 | $10,470 |
| 01/2019 | $10,027 | $10,995 | $10,504 |
| 02/2019 | $10,030 | $10,989 | $10,507 |
| 03/2019 | $10,086 | $11,200 | $10,598 |
| 04/2019 | $10,089 | $11,203 | $10,615 |
| 05/2019 | $10,172 | $11,402 | $10,723 |
| 06/2019 | $10,210 | $11,545 | $10,793 |
| 07/2019 | $10,194 | $11,570 | $10,775 |
| 08/2019 | $10,285 | $11,870 | $10,903 |
| 09/2019 | $10,259 | $11,807 | $10,876 |
| 10/2019 | $10,268 | $11,842 | $10,910 |
| 11/2019 | $10,249 | $11,836 | $10,898 |
| 12/2019 | $10,243 | $11,828 | $10,913 |
| 01/2020 | $10,324 | $12,056 | $11,011 |
| 02/2020 | $10,415 | $12,273 | $11,143 |
| 03/2020 | $10,458 | $12,200 | $11,323 |
| 04/2020 | $10,481 | $12,417 | $11,344 |
| 05/2020 | $10,493 | $12,475 | $11,361 |
| 06/2020 | $10,505 | $12,554 | $11,370 |
| 07/2020 | $10,515 | $12,741 | $11,388 |
| 08/2020 | $10,507 | $12,638 | $11,382 |
| 09/2020 | $10,499 | $12,632 | $11,385 |
| 10/2020 | $10,481 | $12,575 | $11,370 |
| 11/2020 | $10,481 | $12,698 | $11,378 |
| 12/2020 | $10,484 | $12,716 | $11,387 |
| 01/2021 | $10,484 | $12,625 | $11,384 |
| 02/2021 | $10,439 | $12,443 | $11,345 |
| 03/2021 | $10,411 | $12,287 | $11,321 |
| 04/2021 | $10,421 | $12,384 | $11,340 |
| 05/2021 | $10,421 | $12,425 | $11,363 |
| 06/2021 | $10,402 | $12,512 | $11,333 |
| 07/2021 | $10,421 | $12,652 | $11,377 |
| 08/2021 | $10,393 | $12,628 | $11,369 |
| 09/2021 | $10,357 | $12,518 | $11,336 |
| 10/2021 | $10,312 | $12,515 | $11,278 |
| 11/2021 | $10,302 | $12,552 | $11,279 |
| 12/2021 | $10,280 | $12,520 | $11,252 |
| 01/2022 | $10,208 | $12,250 | $11,146 |
| 02/2022 | $10,162 | $12,114 | $11,092 |
| 03/2022 | $10,008 | $11,777 | $10,874 |
| 04/2022 | $9,917 | $11,330 | $10,781 |
| 05/2022 | $9,935 | $11,403 | $10,853 |
| 06/2022 | $9,882 | $11,224 | $10,781 |
| 07/2022 | $9,940 | $11,498 | $10,866 |
| 08/2022 | $9,837 | $11,174 | $10,718 |
| 09/2022 | $9,691 | $10,691 | $10,540 |
| 10/2022 | $9,647 | $10,552 | $10,518 |
| 11/2022 | $9,742 | $10,940 | $10,635 |
| 12/2022 | $9,750 | $10,891 | $10,638 |
| 01/2023 | $9,869 | $11,226 | $10,755 |
| 02/2023 | $9,803 | $10,936 | $10,621 |
| 03/2023 | $9,933 | $11,214 | $10,836 |
| 04/2023 | $9,980 | $11,282 | $10,881 |
| 05/2023 | $9,953 | $11,159 | $10,823 |
| 06/2023 | $9,918 | $11,119 | $10,740 |
| 07/2023 | $9,949 | $11,111 | $10,771 |
| 08/2023 | $9,972 | $11,040 | $10,800 |
| 09/2023 | $9,947 | $10,760 | $10,761 |
| 10/2023 | $9,942 | $10,590 | $10,771 |
| 11/2023 | $10,088 | $11,069 | $10,935 |
| 12/2023 | $10,225 | $11,493 | $11,104 |
| 01/2024 | $10,277 | $11,462 | $11,139 |
| 02/2024 | $10,233 | $11,300 | $11,055 |
| 03/2024 | $10,276 | $11,404 | $11,100 |
| 04/2024 | $10,223 | $11,116 | $11,007 |
| 05/2024 | $10,305 | $11,304 | $11,106 |
| 06/2024 | $10,367 | $11,411 | $11,185 |
| 07/2024 | $10,498 | $11,678 | $11,353 |
| 08/2024 | $10,581 | $11,846 | $11,465 |
| 09/2024 | $10,652 | $12,004 | $11,567 |
Performance data shown represents past performance and is no guarantee of, and is not necessarily indicative of, future results. Total return and value will vary, and you may have a gain or loss when shares are sold. Current performance may be lower or higher than quoted. For the most recent month-end performance, visit im.natixis.com/en-us/products/mutual-funds/price-and-performance.
Average Annual Total Returns (%)
| 1 Year | 5 Years | 10 Years | Since Inception 9/15/05 |
|---|
| Class C at NAV | 6.40% | 0.47% | 0.63% | 3.16% |
Class C with CDSCFootnote Reference1 | 5.40% | 0.47% | 0.63% | 3.16% |
| Bloomberg U.S. Aggregate Bond Index | 11.57% | 0.33% | 1.84% | -% |
| Bloomberg U.S. 1-5 Year Government Bond Index | 7.49% | 1.24% | 1.47% | -% |
| Footnote | Description |
Footnote1 | Contingent deferred sales charge |
Effective February 1, 2024, in accordance with new regulations, the Fund's primary broad-based index changed to the Bloomberg U.S. Aggregate Bond Index. The Fund will retain the Bloomberg U.S. 1-5 Year Government Bond Index as an additional benchmark for performance comparison.
| Total Net Assets | $742,199,472 |
| # of Portfolio Holdings (including overnight repurchase agreements) | 268 |
| Portfolio Turnover Rate | 217% |
| Total Advisory Fees Paid (after waiver/reimbursement, if applicable) | $1,905,982 |
What did the Fund invest in? (% of Net Assets)
| Value | Value |
|---|
Other investments less than 3% of net assetsFootnote Reference* | 6.0% |
| Short-Term Investments | 4.9% |
| Non-Agency Commercial Mortgage-Backed Securities | 3.4% |
| Collateralized Mortgage Obligations | 8.5% |
| Agency Commercial Mortgage-Backed Securities | 24.8% |
| Treasuries | 52.4% |
| Footnote | Description |
Footnote* | Net of other assets less liabilities |
Credit QualityFootnote Reference†
| Value | Value |
|---|
| Cash & equivalents | 5.0 |
| US Treasury | 52.8 |
Not ratedFootnote Reference^ | 3.5 |
| A | 0.1 |
| AA | 35.7 |
| AAA | 2.9 |
| Footnote | Description |
Footnote† | Credit ratings are by S&P Global Ratings. A credit rating is an assessment provided by a nationally recognized statistical rating organization (NRSRO) of the creditworthiness of an issuer with respect to debt obligations except for those debt obligations that are only privately rated. Ratings are measured on a scale that generally ranges from AAA (highest) to D (lowest). The credit ratings shown relate to the creditworthiness of the issuers of the underlying securities in the Fund, and not to the Fund or its shares. Credit ratings are subject to change. |
Footnote^ | Not Rated category represents only those securities not rated by S&P Global Ratings. Such securities may be rated by other NRSROs not shown here. |
There were no material fund changes during the period.
There were no changes in or disagreements with Accountants during the period.
For additional information about the Fund; including its prospectus, financial information, holdings and proxy information, scan the QR code or visit im.natixis.com/funddocuments.
Loomis Sayles Limited Term Government and Agency Fund
Annual Shareholder Report
September 30, 2024
Loomis Sayles Limited Term Government and Agency Fund
Annual Shareholder Report - September 30, 2024
This annual shareholder report contains important information about Loomis Sayles Limited Term Government and Agency Fund for the period of October 1, 2023 to September 30, 2024. You can find additional information (including tax information) about the Fund at im.natixis.com/funddocuments. You can also request the information by contacting us at (800) 225-5478 or by contacting your financial intermediary directly.
What were the fund costs for the last year? (based on a hypothetical $10,000 investment)
| Class Name | Costs of a $10,000 investment | Costs paid as a percentage of a $10,000 investmentFootnote Reference† |
|---|
| Class N | $42 | 0.40% |
| Footnote | Description |
Footnote† | Annualized for periods less than one year. |
How did the fund perform last year and what affected its performance?
Explanation of Fund Performance
Top Contributors to Performance
• Holdings within securitized sectors benefitted the portfolio during the period, specifically exposure to agency and non-agency commercial mortgage-backed securities.
• Holdings in collateralized mortgage obligations were also beneficial to relative performance.
Top Detractors from Performance
• Duration effect had a negative impact on relative performance during the period.
• Issue selection within US Treasurys securities detracted from performance slightly.
The Fund’s benchmarks are unmanaged indices used as a general measure of market performance. Calculations assume dividends and capital gains are reinvested. The tables do not reflect taxes shareholders might owe on any fund distributions or when they redeem their shares. You cannot invest directly in an index.
Total Return Based on a Hypothetical $10,000 Investment
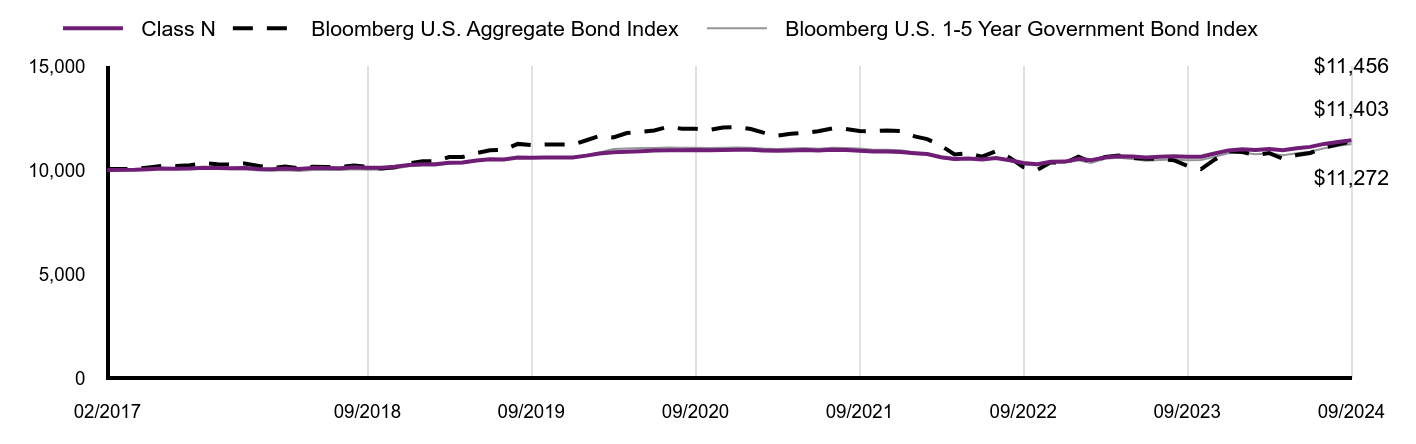
| Class N | Bloomberg U.S. Aggregate Bond Index | Bloomberg U.S. 1-5 Year Government Bond Index |
|---|
| 02/2017 | $10,014 | $10,067 | $10,015 |
| 04/2017 | $10,030 | $10,062 | $10,020 |
| 05/2017 | $10,055 | $10,140 | $10,053 |
| 06/2017 | $10,089 | $10,218 | $10,076 |
| 07/2017 | $10,079 | $10,207 | $10,061 |
| 08/2017 | $10,096 | $10,251 | $10,089 |
| 09/2017 | $10,131 | $10,343 | $10,124 |
| 10/2017 | $10,111 | $10,300 | $10,080 |
| 11/2017 | $10,101 | $10,287 | $10,051 |
| 12/2017 | $10,110 | $10,334 | $10,050 |
| 01/2018 | $10,064 | $10,215 | $9,992 |
| 02/2018 | $10,054 | $10,118 | $9,979 |
| 03/2018 | $10,090 | $10,183 | $10,011 |
| 04/2018 | $10,063 | $10,107 | $9,976 |
| 05/2018 | $10,109 | $10,179 | $10,024 |
| 06/2018 | $10,109 | $10,167 | $10,023 |
| 07/2018 | $10,101 | $10,169 | $10,014 |
| 08/2018 | $10,147 | $10,235 | $10,057 |
| 09/2018 | $10,121 | $10,169 | $10,029 |
| 10/2018 | $10,131 | $10,088 | $10,042 |
| 11/2018 | $10,170 | $10,149 | $10,091 |
| 12/2018 | $10,259 | $10,335 | $10,203 |
| 01/2019 | $10,290 | $10,445 | $10,237 |
| 02/2019 | $10,301 | $10,439 | $10,240 |
| 03/2019 | $10,368 | $10,639 | $10,328 |
| 04/2019 | $10,380 | $10,642 | $10,345 |
| 05/2019 | $10,475 | $10,831 | $10,450 |
| 06/2019 | $10,533 | $10,967 | $10,519 |
| 07/2019 | $10,526 | $10,991 | $10,501 |
| 08/2019 | $10,621 | $11,276 | $10,626 |
| 09/2019 | $10,603 | $11,216 | $10,599 |
| 10/2019 | $10,622 | $11,250 | $10,633 |
| 11/2019 | $10,622 | $11,244 | $10,621 |
| 12/2019 | $10,625 | $11,236 | $10,635 |
| 01/2020 | $10,710 | $11,452 | $10,731 |
| 02/2020 | $10,812 | $11,658 | $10,860 |
| 03/2020 | $10,876 | $11,590 | $11,035 |
| 04/2020 | $10,901 | $11,796 | $11,055 |
| 05/2020 | $10,923 | $11,851 | $11,072 |
| 06/2020 | $10,955 | $11,925 | $11,080 |
| 07/2020 | $10,966 | $12,103 | $11,099 |
| 08/2020 | $10,967 | $12,006 | $11,093 |
| 09/2020 | $10,977 | $11,999 | $11,095 |
| 10/2020 | $10,968 | $11,946 | $11,081 |
| 11/2020 | $10,977 | $12,063 | $11,089 |
| 12/2020 | $10,990 | $12,079 | $11,097 |
| 01/2021 | $10,989 | $11,993 | $11,094 |
| 02/2021 | $10,960 | $11,820 | $11,057 |
| 03/2021 | $10,940 | $11,672 | $11,033 |
| 04/2021 | $10,959 | $11,764 | $11,052 |
| 05/2021 | $10,976 | $11,803 | $11,074 |
| 06/2021 | $10,955 | $11,886 | $11,045 |
| 07/2021 | $10,992 | $12,018 | $11,088 |
| 08/2021 | $10,981 | $11,996 | $11,080 |
| 09/2021 | $10,950 | $11,892 | $11,048 |
| 10/2021 | $10,909 | $11,888 | $10,992 |
| 11/2021 | $10,905 | $11,924 | $10,992 |
| 12/2021 | $10,888 | $11,893 | $10,966 |
| 01/2022 | $10,829 | $11,637 | $10,862 |
| 02/2022 | $10,788 | $11,507 | $10,810 |
| 03/2022 | $10,633 | $11,187 | $10,597 |
| 04/2022 | $10,545 | $10,763 | $10,507 |
| 05/2022 | $10,574 | $10,832 | $10,577 |
| 06/2022 | $10,527 | $10,662 | $10,507 |
| 07/2022 | $10,598 | $10,923 | $10,590 |
| 08/2022 | $10,488 | $10,614 | $10,446 |
| 09/2022 | $10,352 | $10,156 | $10,272 |
| 10/2022 | $10,298 | $10,024 | $10,250 |
| 11/2022 | $10,411 | $10,393 | $10,364 |
| 12/2022 | $10,423 | $10,346 | $10,367 |
| 01/2023 | $10,562 | $10,664 | $10,481 |
| 02/2023 | $10,485 | $10,388 | $10,351 |
| 03/2023 | $10,626 | $10,652 | $10,560 |
| 04/2023 | $10,678 | $10,717 | $10,605 |
| 05/2023 | $10,663 | $10,600 | $10,548 |
| 06/2023 | $10,618 | $10,562 | $10,467 |
| 07/2023 | $10,653 | $10,555 | $10,498 |
| 08/2023 | $10,681 | $10,488 | $10,526 |
| 09/2023 | $10,657 | $10,221 | $10,487 |
| 10/2023 | $10,655 | $10,060 | $10,497 |
| 11/2023 | $10,813 | $10,515 | $10,657 |
| 12/2023 | $10,963 | $10,918 | $10,822 |
| 01/2024 | $11,021 | $10,888 | $10,855 |
| 02/2024 | $10,977 | $10,734 | $10,774 |
| 03/2024 | $11,026 | $10,833 | $10,817 |
| 04/2024 | $10,971 | $10,560 | $10,727 |
| 05/2024 | $11,062 | $10,739 | $10,824 |
| 06/2024 | $11,132 | $10,840 | $10,901 |
| 07/2024 | $11,275 | $11,093 | $11,064 |
| 08/2024 | $11,366 | $11,253 | $11,174 |
| 09/2024 | $11,456 | $11,403 | $11,272 |
Performance data shown represents past performance and is no guarantee of, and is not necessarily indicative of, future results. Total return and value will vary, and you may have a gain or loss when shares are sold. Current performance may be lower or higher than quoted. For the most recent month-end performance, visit im.natixis.com/en-us/products/mutual-funds/price-and-performance.
Average Annual Total Returns (%)
| 1 Year | 5 Years | Since Inception 2/1/17 |
|---|
| Class N | 7.50% | 1.56% | 1.79% |
| Bloomberg U.S. Aggregate Bond Index | 11.57% | 0.33% | 1.72% |
| Bloomberg U.S. 1-5 Year Government Bond Index | 7.49% | 1.24% | 1.57% |
Effective February 1, 2024, in accordance with new regulations, the Fund's primary broad-based index changed to the Bloomberg U.S. Aggregate Bond Index. The Fund will retain the Bloomberg U.S. 1-5 Year Government Bond Index as an additional benchmark for performance comparison.
| Total Net Assets | $742,199,472 |
| # of Portfolio Holdings (including overnight repurchase agreements) | 268 |
| Portfolio Turnover Rate | 217% |
| Total Advisory Fees Paid (after waiver/reimbursement, if applicable) | $1,905,982 |
What did the Fund invest in? (% of Net Assets)
| Value | Value |
|---|
Other investments less than 3% of net assetsFootnote Reference* | 6.0% |
| Short-Term Investments | 4.9% |
| Non-Agency Commercial Mortgage-Backed Securities | 3.4% |
| Collateralized Mortgage Obligations | 8.5% |
| Agency Commercial Mortgage-Backed Securities | 24.8% |
| Treasuries | 52.4% |
| Footnote | Description |
Footnote* | Net of other assets less liabilities |
Credit QualityFootnote Reference†
| Value | Value |
|---|
| Cash & equivalents | 5.0 |
| US Treasury | 52.8 |
Not ratedFootnote Reference^ | 3.5 |
| A | 0.1 |
| AA | 35.7 |
| AAA | 2.9 |
| Footnote | Description |
Footnote† | Credit ratings are by S&P Global Ratings. A credit rating is an assessment provided by a nationally recognized statistical rating organization (NRSRO) of the creditworthiness of an issuer with respect to debt obligations except for those debt obligations that are only privately rated. Ratings are measured on a scale that generally ranges from AAA (highest) to D (lowest). The credit ratings shown relate to the creditworthiness of the issuers of the underlying securities in the Fund, and not to the Fund or its shares. Credit ratings are subject to change. |
Footnote^ | Not Rated category represents only those securities not rated by S&P Global Ratings. Such securities may be rated by other NRSROs not shown here. |
There were no material fund changes during the period.
There were no changes in or disagreements with Accountants during the period.
For additional information about the Fund; including its prospectus, financial information, holdings and proxy information, scan the QR code or visit im.natixis.com/funddocuments.
Loomis Sayles Limited Term Government and Agency Fund
Annual Shareholder Report
September 30, 2024
Loomis Sayles Small Cap Growth Fund
Annual Shareholder Report - September 30, 2024
This annual shareholder report contains important information about Loomis Sayles Small Cap Growth Fund for the period of October 1, 2023 to September 30, 2024. You can find additional information about the Fund at im.natixis.com/funddocuments. You can also request this information by contacting us at (800) 633-3330 or by contacting your financial intermediary directly.
What were the fund costs for the last year? (based on a hypothetical $10,000 investment)
| Class Name | Costs of a $10,000 investment | Costs paid as a percentage of a $10,000 investmentFootnote Reference† |
|---|
| Institutional Class | $105 | 0.94% |
| Footnote | Description |
Footnote† | Annualized for periods less than one year. |
How did the fund perform last year and what affected its performance?
Explanation of Fund Performance
Top Contributors to Performance
• Security selection within the consumer discretionary, financials and energy sectors contributed positively to Fund performance.
• Zero exposure to the utilities sector as well as underweight allocations to the communication services and materials sectors also positively impacted Fund performance.
• Hamilton Lane, Insmed and PROCEPT BioRobotics were the largest individual contributors to Fund performance.
Top Detractors from Performance
• The Fund was negatively impacted by security selection within the information technology, healthcare and consumer staples sectors.
• The Fund was also negatively impacted by an overweight allocation to the energy sector.
• Ventyx Biosciences, AtriCure and Flywire were the largest individual detractors from Fund performance.
The Fund’s benchmarks are unmanaged indices used as a general measure of market performance. Calculations assume dividends and capital gains are reinvested. The tables do not reflect taxes shareholders might owe on any fund distributions or when they redeem their shares. You cannot invest directly in an index.
Total Return Based on a Hypothetical $10,000 Investment
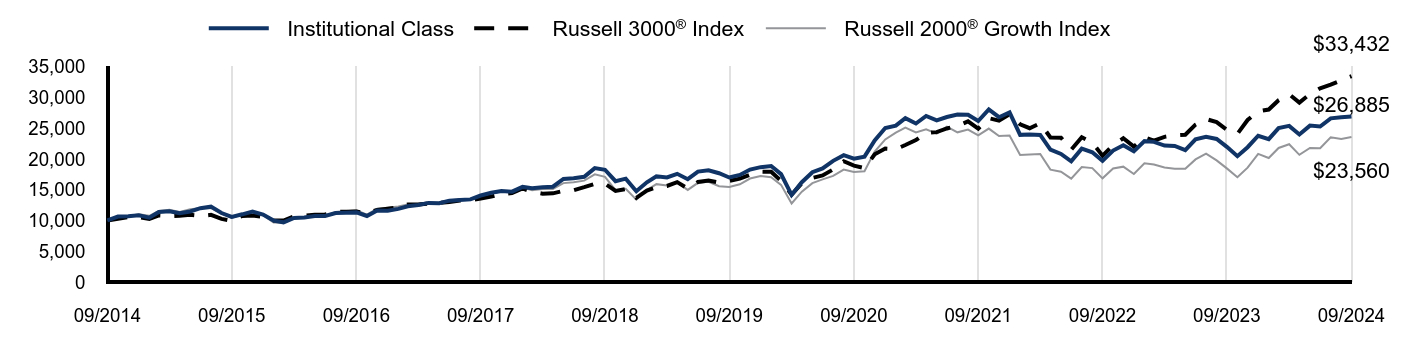
| Institutional Class | Russell 3000® Index | Russell 2000® Growth Index |
|---|
| 09/2014 | $10,000 | $10,000 | $10,000 |
| 10/2014 | $10,626 | $10,275 | $10,620 |
| 11/2014 | $10,684 | $10,524 | $10,689 |
| 12/2014 | $10,826 | $10,524 | $11,006 |
| 01/2015 | $10,440 | $10,231 | $10,755 |
| 02/2015 | $11,383 | $10,824 | $11,529 |
| 03/2015 | $11,507 | $10,713 | $11,736 |
| 04/2015 | $11,174 | $10,762 | $11,390 |
| 05/2015 | $11,464 | $10,911 | $11,809 |
| 06/2015 | $11,988 | $10,728 | $11,968 |
| 07/2015 | $12,240 | $10,908 | $12,016 |
| 08/2015 | $11,202 | $10,249 | $11,106 |
| 09/2015 | $10,578 | $9,951 | $10,404 |
| 10/2015 | $10,997 | $10,736 | $10,995 |
| 11/2015 | $11,445 | $10,796 | $11,397 |
| 12/2015 | $10,946 | $10,574 | $10,854 |
| 01/2016 | $9,976 | $9,978 | $9,678 |
| 02/2016 | $9,693 | $9,975 | $9,609 |
| 03/2016 | $10,417 | $10,677 | $10,346 |
| 04/2016 | $10,474 | $10,743 | $10,449 |
| 05/2016 | $10,710 | $10,935 | $10,730 |
| 06/2016 | $10,715 | $10,958 | $10,681 |
| 07/2016 | $11,203 | $11,393 | $11,379 |
| 08/2016 | $11,259 | $11,422 | $11,500 |
| 09/2016 | $11,311 | $11,440 | $11,666 |
| 10/2016 | $10,720 | $11,192 | $10,941 |
| 11/2016 | $11,603 | $11,693 | $11,920 |
| 12/2016 | $11,573 | $11,921 | $12,082 |
| 01/2017 | $11,876 | $12,145 | $12,278 |
| 02/2017 | $12,312 | $12,597 | $12,580 |
| 03/2017 | $12,512 | $12,606 | $12,729 |
| 04/2017 | $12,851 | $12,739 | $12,963 |
| 05/2017 | $12,800 | $12,870 | $12,845 |
| 06/2017 | $13,216 | $12,986 | $13,287 |
| 07/2017 | $13,323 | $13,231 | $13,400 |
| 08/2017 | $13,421 | $13,256 | $13,385 |
| 09/2017 | $14,052 | $13,579 | $14,113 |
| 10/2017 | $14,489 | $13,876 | $14,332 |
| 11/2017 | $14,792 | $14,297 | $14,744 |
| 12/2017 | $14,681 | $14,440 | $14,761 |
| 01/2018 | $15,450 | $15,201 | $15,336 |
| 02/2018 | $15,230 | $14,641 | $14,899 |
| 03/2018 | $15,380 | $14,347 | $15,100 |
| 04/2018 | $15,484 | $14,402 | $15,115 |
| 05/2018 | $16,744 | $14,808 | $16,066 |
| 06/2018 | $16,843 | $14,905 | $16,192 |
| 07/2018 | $17,097 | $15,400 | $16,470 |
| 08/2018 | $18,507 | $15,940 | $17,496 |
| 09/2018 | $18,235 | $15,967 | $17,086 |
| 10/2018 | $16,374 | $14,791 | $14,924 |
| 11/2018 | $16,785 | $15,087 | $15,158 |
| 12/2018 | $14,747 | $13,683 | $13,387 |
| 01/2019 | $16,199 | $14,858 | $14,933 |
| 02/2019 | $17,161 | $15,380 | $15,897 |
| 03/2019 | $16,981 | $15,605 | $15,682 |
| 04/2019 | $17,575 | $16,228 | $16,159 |
| 05/2019 | $16,703 | $15,178 | $14,960 |
| 06/2019 | $17,930 | $16,244 | $16,113 |
| 07/2019 | $18,156 | $16,485 | $16,270 |
| 08/2019 | $17,665 | $16,149 | $15,568 |
| 09/2019 | $16,981 | $16,433 | $15,440 |
| 10/2019 | $17,387 | $16,786 | $15,880 |
| 11/2019 | $18,266 | $17,424 | $16,814 |
| 12/2019 | $18,656 | $17,928 | $17,200 |
| 01/2020 | $18,846 | $17,908 | $17,010 |
| 02/2020 | $17,532 | $16,442 | $15,782 |
| 03/2020 | $14,152 | $14,181 | $12,768 |
| 04/2020 | $16,218 | $16,059 | $14,670 |
| 05/2020 | $17,834 | $16,918 | $16,056 |
| 06/2020 | $18,452 | $17,304 | $16,673 |
| 07/2020 | $19,682 | $18,287 | $17,246 |
| 08/2020 | $20,610 | $19,612 | $18,258 |
| 09/2020 | $20,033 | $18,898 | $17,867 |
| 10/2020 | $20,371 | $18,490 | $18,002 |
| 11/2020 | $23,006 | $20,739 | $21,177 |
| 12/2020 | $25,020 | $21,672 | $23,156 |
| 01/2021 | $25,406 | $21,576 | $24,273 |
| 02/2021 | $26,614 | $22,250 | $25,074 |
| 03/2021 | $25,749 | $23,048 | $24,285 |
| 04/2021 | $26,972 | $24,236 | $24,815 |
| 05/2021 | $26,250 | $24,346 | $24,106 |
| 06/2021 | $26,800 | $24,947 | $25,236 |
| 07/2021 | $27,200 | $25,369 | $24,317 |
| 08/2021 | $27,158 | $26,092 | $24,759 |
| 09/2021 | $26,150 | $24,921 | $23,810 |
| 10/2021 | $28,037 | $26,607 | $24,925 |
| 11/2021 | $26,772 | $26,202 | $23,708 |
| 12/2021 | $27,540 | $27,234 | $23,813 |
| 01/2022 | $23,903 | $25,631 | $20,621 |
| 02/2022 | $23,972 | $24,986 | $20,711 |
| 03/2022 | $23,886 | $25,796 | $20,806 |
| 04/2022 | $21,513 | $23,481 | $18,253 |
| 05/2022 | $20,799 | $23,450 | $17,908 |
| 06/2022 | $19,595 | $21,488 | $16,800 |
| 07/2022 | $21,667 | $23,504 | $18,681 |
| 08/2022 | $21,065 | $22,627 | $18,505 |
| 09/2022 | $19,673 | $20,528 | $16,840 |
| 10/2022 | $21,349 | $22,212 | $18,439 |
| 11/2022 | $22,218 | $23,371 | $18,739 |
| 12/2022 | $21,227 | $22,003 | $17,536 |
| 01/2023 | $22,884 | $23,518 | $19,281 |
| 02/2023 | $22,768 | $22,968 | $19,072 |
| 03/2023 | $22,157 | $23,583 | $18,601 |
| 04/2023 | $22,113 | $23,834 | $18,385 |
| 05/2023 | $21,422 | $23,927 | $18,388 |
| 06/2023 | $23,176 | $25,560 | $19,913 |
| 07/2023 | $23,592 | $26,477 | $20,844 |
| 08/2023 | $23,238 | $25,966 | $19,759 |
| 09/2023 | $21,962 | $24,729 | $18,456 |
| 10/2023 | $20,438 | $24,073 | $17,032 |
| 11/2023 | $21,900 | $26,318 | $18,583 |
| 12/2023 | $23,758 | $27,714 | $20,808 |
| 01/2024 | $23,205 | $28,021 | $20,141 |
| 02/2024 | $25,009 | $29,538 | $21,777 |
| 03/2024 | $25,362 | $30,491 | $22,386 |
| 04/2024 | $23,966 | $29,149 | $20,662 |
| 05/2024 | $25,407 | $30,526 | $21,769 |
| 06/2024 | $25,262 | $31,471 | $21,732 |
| 07/2024 | $26,586 | $32,056 | $23,511 |
| 08/2024 | $26,767 | $32,754 | $23,251 |
| 09/2024 | $26,885 | $33,432 | $23,560 |
Performance data shown represents past performance and is no guarantee of, and is not necessarily indicative of, future results. Total return and value will vary, and you may have a gain or loss when shares are sold. Current performance may be lower or higher than quoted. For the most recent month-end performance, visit im.natixis.com/en-us/products/mutual-funds/price-and-performance.
Average Annual Total Returns (%)
| 1 Year | 5 Years | 10 Years | Since Inception 12/20/96 |
|---|
| Institutional Class | 22.41% | 9.63% | 10.40% | 7.71% |
Russell 3000® Index | 35.19% | 15.26% | 12.83% | -% |
Russell 2000® Growth Index | 27.66% | 8.82% | 8.95% | -% |
Effective February 1, 2024, in accordance with new regulations, the Fund's primary broad-based index changed to the Russell 3000® Index. The Fund will retain the Russell 2000® Growth Index as an additional benchmark for performance comparison.
| Total Net Assets | $2,358,313,287 |
| # of Portfolio Holdings (including overnight repurchase agreements) | 93 |
| Portfolio Turnover Rate | 39% |
| Total Advisory Fees Paid (after waiver/reimbursement, if applicable) | $16,767,178 |
What did the Fund invest in? (% of Net Assets)
| Value | Value |
|---|
Other investments less than 3% of net assetsFootnote Reference* | 24.2% |
| Short-Term Investments | 3.7% |
| Commercial Services & Supplies | 3.0% |
| Pharmaceuticals | 3.2% |
| Electronic Equipment, Instruments & Components | 3.7% |
| Professional Services | 3.8% |
| Construction & Engineering | 3.9% |
| Machinery | 4.0% |
| Automobile Components | 4.1% |
| Aerospace & Defense | 4.4% |
| Energy Equipment & Services | 4.5% |
| Semiconductors & Semiconductor Equipment | 4.6% |
| Capital Markets | 5.0% |
| Health Care Equipment & Supplies | 5.6% |
| Health Care Providers & Services | 5.8% |
| Biotechnology | 6.8% |
| Software | 9.7% |
| Footnote | Description |
Footnote* | Net of other assets less liabilities |
| Hamilton Lane, Inc., Class A | 2.0% |
| MACOM Technology Solutions Holdings, Inc. | 1.8% |
| Varonis Systems, Inc. | 1.8% |
| Merit Medical Systems, Inc. | 1.7% |
| Casella Waste Systems, Inc., Class A | 1.7% |
| Boot Barn Holdings, Inc. | 1.6% |
| PJT Partners, Inc., Class A | 1.6% |
| Baldwin Insurance Group, Inc. | 1.6% |
| Intapp, Inc. | 1.5% |
| PROCEPT BioRobotics Corp. | 1.5% |
There were no material fund changes during the period.
There were no changes in or disagreements with Accountants during the period.
For additional information about the Fund; including its prospectus, financial information, holdings and proxy information, scan the QR code or visit im.natixis.com/funddocuments.
Loomis Sayles Small Cap Growth Fund
Annual Shareholder Report
September 30, 2024
Loomis Sayles Small Cap Growth Fund
Annual Shareholder Report - September 30, 2024
This annual shareholder report contains important information about Loomis Sayles Small Cap Growth Fund for the period of October 1, 2023 to September 30, 2024. You can find additional information about the Fund at im.natixis.com/funddocuments. You can also request this information by contacting us at (800) 633-3330 or by contacting your financial intermediary directly.
What were the fund costs for the last year? (based on a hypothetical $10,000 investment)
| Class Name | Costs of a $10,000 investment | Costs paid as a percentage of a $10,000 investmentFootnote Reference† |
|---|
| Retail Class | $132 | 1.19% |
| Footnote | Description |
Footnote† | Annualized for periods less than one year. |
How did the fund perform last year and what affected its performance?
Explanation of Fund Performance
Top Contributors to Performance
• Security selection within the consumer discretionary, financials and energy sectors contributed positively to Fund performance.
• Zero exposure to the utilities sector as well as underweight allocations to the communication services and materials sectors also positively impacted Fund performance.
• Hamilton Lane, Insmed and PROCEPT BioRobotics were the largest individual contributors to Fund performance.
Top Detractors from Performance
• The Fund was negatively impacted by security selection within the information technology, healthcare and consumer staples sectors.
• The Fund was also negatively impacted by an overweight allocation to the energy sector.
• Ventyx Biosciences, AtriCure and Flywire were the largest individual detractors from Fund performance.
The Fund’s benchmarks are unmanaged indices used as a general measure of market performance. Calculations assume dividends and capital gains are reinvested. The tables do not reflect taxes shareholders might owe on any fund distributions or when they redeem their shares. You cannot invest directly in an index.
Total Return Based on a Hypothetical $10,000 Investment
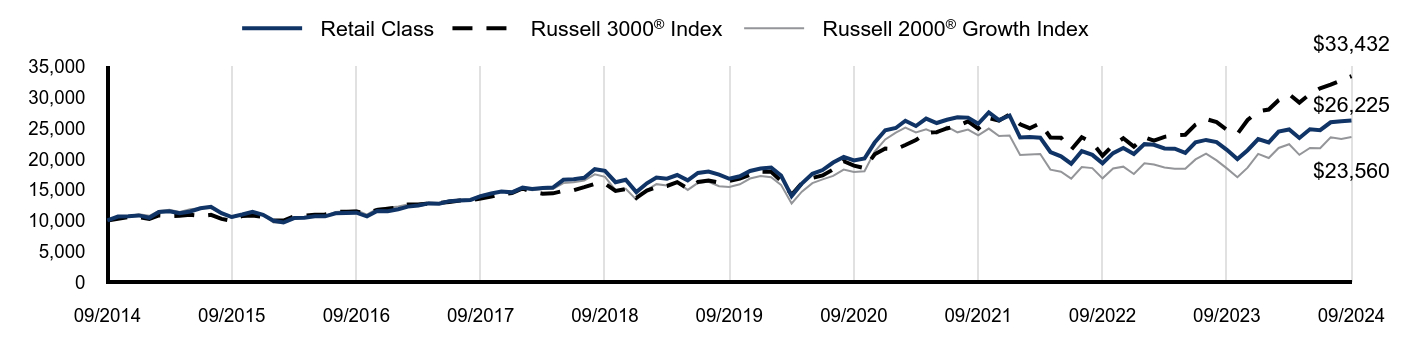
| Retail Class | Russell 3000® Index | Russell 2000® Growth Index |
|---|
| 09/2014 | $10,000 | $10,000 | $10,000 |
| 10/2014 | $10,628 | $10,275 | $10,620 |
| 11/2014 | $10,684 | $10,524 | $10,689 |
| 12/2014 | $10,820 | $10,524 | $11,006 |
| 01/2015 | $10,432 | $10,231 | $10,755 |
| 02/2015 | $11,375 | $10,824 | $11,529 |
| 03/2015 | $11,496 | $10,713 | $11,736 |
| 04/2015 | $11,158 | $10,762 | $11,390 |
| 05/2015 | $11,450 | $10,911 | $11,809 |
| 06/2015 | $11,970 | $10,728 | $11,968 |
| 07/2015 | $12,217 | $10,908 | $12,016 |
| 08/2015 | $11,178 | $10,249 | $11,106 |
| 09/2015 | $10,558 | $9,951 | $10,404 |
| 10/2015 | $10,971 | $10,736 | $10,995 |
| 11/2015 | $11,415 | $10,796 | $11,397 |
| 12/2015 | $10,912 | $10,574 | $10,854 |
| 01/2016 | $9,944 | $9,978 | $9,678 |
| 02/2016 | $9,666 | $9,975 | $9,609 |
| 03/2016 | $10,382 | $10,677 | $10,346 |
| 04/2016 | $10,436 | $10,743 | $10,449 |
| 05/2016 | $10,666 | $10,935 | $10,730 |
| 06/2016 | $10,671 | $10,958 | $10,681 |
| 07/2016 | $11,152 | $11,393 | $11,379 |
| 08/2016 | $11,207 | $11,422 | $11,500 |
| 09/2016 | $11,256 | $11,440 | $11,666 |
| 10/2016 | $10,666 | $11,192 | $10,941 |
| 11/2016 | $11,545 | $11,693 | $11,920 |
| 12/2016 | $11,507 | $11,921 | $12,082 |
| 01/2017 | $11,813 | $12,145 | $12,278 |
| 02/2017 | $12,245 | $12,597 | $12,580 |
| 03/2017 | $12,436 | $12,606 | $12,729 |
| 04/2017 | $12,769 | $12,739 | $12,963 |
| 05/2017 | $12,715 | $12,870 | $12,845 |
| 06/2017 | $13,130 | $12,986 | $13,287 |
| 07/2017 | $13,234 | $13,231 | $13,400 |
| 08/2017 | $13,327 | $13,256 | $13,385 |
| 09/2017 | $13,950 | $13,579 | $14,113 |
| 10/2017 | $14,381 | $13,876 | $14,332 |
| 11/2017 | $14,682 | $14,297 | $14,744 |
| 12/2017 | $14,563 | $14,440 | $14,761 |
| 01/2018 | $15,327 | $15,201 | $15,336 |
| 02/2018 | $15,103 | $14,641 | $14,899 |
| 03/2018 | $15,252 | $14,347 | $15,100 |
| 04/2018 | $15,352 | $14,402 | $15,115 |
| 05/2018 | $16,599 | $14,808 | $16,066 |
| 06/2018 | $16,692 | $14,905 | $16,192 |
| 07/2018 | $16,934 | $15,400 | $16,470 |
| 08/2018 | $18,331 | $15,940 | $17,496 |
| 09/2018 | $18,058 | $15,967 | $17,086 |
| 10/2018 | $16,214 | $14,791 | $14,924 |
| 11/2018 | $16,612 | $15,087 | $15,158 |
| 12/2018 | $14,597 | $13,683 | $13,387 |
| 01/2019 | $16,033 | $14,858 | $14,933 |
| 02/2019 | $16,978 | $15,380 | $15,897 |
| 03/2019 | $16,796 | $15,605 | $15,682 |
| 04/2019 | $17,384 | $16,228 | $16,159 |
| 05/2019 | $16,516 | $15,178 | $14,960 |
| 06/2019 | $17,721 | $16,244 | $16,113 |
| 07/2019 | $17,945 | $16,485 | $16,270 |
| 08/2019 | $17,454 | $16,149 | $15,568 |
| 09/2019 | $16,775 | $16,433 | $15,440 |
| 10/2019 | $17,174 | $16,786 | $15,880 |
| 11/2019 | $18,036 | $17,424 | $16,814 |
| 12/2019 | $18,425 | $17,928 | $17,200 |
| 01/2020 | $18,602 | $17,908 | $17,010 |
| 02/2020 | $17,302 | $16,442 | $15,782 |
| 03/2020 | $13,965 | $14,181 | $12,768 |
| 04/2020 | $15,995 | $16,059 | $14,670 |
| 05/2020 | $17,587 | $16,918 | $16,056 |
| 06/2020 | $18,194 | $17,304 | $16,673 |
| 07/2020 | $19,409 | $18,287 | $17,246 |
| 08/2020 | $20,316 | $19,612 | $18,258 |
| 09/2020 | $19,740 | $18,898 | $17,867 |
| 10/2020 | $20,070 | $18,490 | $18,002 |
| 11/2020 | $22,654 | $20,739 | $21,177 |
| 12/2020 | $24,643 | $21,672 | $23,156 |
| 01/2021 | $25,019 | $21,576 | $24,273 |
| 02/2021 | $26,195 | $22,250 | $25,074 |
| 03/2021 | $25,341 | $23,048 | $24,285 |
| 04/2021 | $26,540 | $24,236 | $24,815 |
| 05/2021 | $25,827 | $24,346 | $24,106 |
| 06/2021 | $26,360 | $24,947 | $25,236 |
| 07/2021 | $26,752 | $25,369 | $24,317 |
| 08/2021 | $26,705 | $26,092 | $24,759 |
| 09/2021 | $25,701 | $24,921 | $23,810 |
| 10/2021 | $27,551 | $26,607 | $24,925 |
| 11/2021 | $26,305 | $26,202 | $23,708 |
| 12/2021 | $27,053 | $27,234 | $23,813 |
| 01/2022 | $23,471 | $25,631 | $20,621 |
| 02/2022 | $23,539 | $24,986 | $20,711 |
| 03/2022 | $23,452 | $25,796 | $20,806 |
| 04/2022 | $21,115 | $23,481 | $18,253 |
| 05/2022 | $20,410 | $23,450 | $17,908 |
| 06/2022 | $19,223 | $21,488 | $16,800 |
| 07/2022 | $21,250 | $23,504 | $18,681 |
| 08/2022 | $20,652 | $22,627 | $18,505 |
| 09/2022 | $19,290 | $20,528 | $16,840 |
| 10/2022 | $20,932 | $22,212 | $18,439 |
| 11/2022 | $21,781 | $23,371 | $18,739 |
| 12/2022 | $20,804 | $22,003 | $17,536 |
| 01/2023 | $22,423 | $23,518 | $19,281 |
| 02/2023 | $22,293 | $22,968 | $19,072 |
| 03/2023 | $21,693 | $23,583 | $18,601 |
| 04/2023 | $21,653 | $23,834 | $18,385 |
| 05/2023 | $20,964 | $23,927 | $18,388 |
| 06/2023 | $22,683 | $25,560 | $19,913 |
| 07/2023 | $23,082 | $26,477 | $20,844 |
| 08/2023 | $22,733 | $25,966 | $19,759 |
| 09/2023 | $21,474 | $24,729 | $18,456 |
| 10/2023 | $19,985 | $24,073 | $17,032 |
| 11/2023 | $21,414 | $26,318 | $18,583 |
| 12/2023 | $23,229 | $27,714 | $20,808 |
| 01/2024 | $22,675 | $28,021 | $20,141 |
| 02/2024 | $24,430 | $29,538 | $21,777 |
| 03/2024 | $24,779 | $30,491 | $22,386 |
| 04/2024 | $23,404 | $29,149 | $20,662 |
| 05/2024 | $24,809 | $30,526 | $21,769 |
| 06/2024 | $24,666 | $31,471 | $21,732 |
| 07/2024 | $25,948 | $32,056 | $23,511 |
| 08/2024 | $26,112 | $32,754 | $23,251 |
| 09/2024 | $26,225 | $33,432 | $23,560 |
Performance data shown represents past performance and is no guarantee of, and is not necessarily indicative of, future results. Total return and value will vary, and you may have a gain or loss when shares are sold. Current performance may be lower or higher than quoted. For the most recent month-end performance, visit im.natixis.com/en-us/products/mutual-funds/price-and-performance.
Average Annual Total Returns (%)
| 1 Year | 5 Years | 10 Years | Since Inception 12/20/96 |
|---|
| Retail Class | 22.13% | 9.35% | 10.12% | 7.43% |
Russell 3000® Index | 35.19% | 15.26% | 12.83% | -% |
Russell 2000® Growth Index | 27.66% | 8.82% | 8.95% | -% |
Effective February 1, 2024, in accordance with new regulations, the Fund's primary broad-based index changed to the Russell 3000® Index. The Fund will retain the Russell 2000® Growth Index as an additional benchmark for performance comparison.
| Total Net Assets | $2,358,313,287 |
| # of Portfolio Holdings (including overnight repurchase agreements) | 93 |
| Portfolio Turnover Rate | 39% |
| Total Advisory Fees Paid (after waiver/reimbursement, if applicable) | $16,767,178 |
What did the Fund invest in? (% of Net Assets)
| Value | Value |
|---|
Other investments less than 3% of net assetsFootnote Reference* | 24.2% |
| Short-Term Investments | 3.7% |
| Commercial Services & Supplies | 3.0% |
| Pharmaceuticals | 3.2% |
| Electronic Equipment, Instruments & Components | 3.7% |
| Professional Services | 3.8% |
| Construction & Engineering | 3.9% |
| Machinery | 4.0% |
| Automobile Components | 4.1% |
| Aerospace & Defense | 4.4% |
| Energy Equipment & Services | 4.5% |
| Semiconductors & Semiconductor Equipment | 4.6% |
| Capital Markets | 5.0% |
| Health Care Equipment & Supplies | 5.6% |
| Health Care Providers & Services | 5.8% |
| Biotechnology | 6.8% |
| Software | 9.7% |
| Footnote | Description |
Footnote* | Net of other assets less liabilities |
| Hamilton Lane, Inc., Class A | 2.0% |
| MACOM Technology Solutions Holdings, Inc. | 1.8% |
| Varonis Systems, Inc. | 1.8% |
| Merit Medical Systems, Inc. | 1.7% |
| Casella Waste Systems, Inc., Class A | 1.7% |
| Boot Barn Holdings, Inc. | 1.6% |
| PJT Partners, Inc., Class A | 1.6% |
| Baldwin Insurance Group, Inc. | 1.6% |
| Intapp, Inc. | 1.5% |
| PROCEPT BioRobotics Corp. | 1.5% |
There were no material fund changes during the period.
There were no changes in or disagreements with Accountants during the period.
For additional information about the Fund; including its prospectus, financial information, holdings and proxy information, scan the QR code or visit im.natixis.com/funddocuments.
Loomis Sayles Small Cap Growth Fund
Annual Shareholder Report
September 30, 2024
Loomis Sayles Small Cap Growth Fund
Annual Shareholder Report - September 30, 2024
This annual shareholder report contains important information about Loomis Sayles Small Cap Growth Fund for the period of October 1, 2023 to September 30, 2024. You can find additional information about the Fund at im.natixis.com/funddocuments. You can also request this information by contacting us at (800) 633-3330 or by contacting your financial intermediary directly.
What were the fund costs for the last year? (based on a hypothetical $10,000 investment)
| Class Name | Costs of a $10,000 investment | Costs paid as a percentage of a $10,000 investmentFootnote Reference† |
|---|
| Class N | $92 | 0.83% |
| Footnote | Description |
Footnote† | Annualized for periods less than one year. |
How did the fund perform last year and what affected its performance?
Explanation of Fund Performance
Top Contributors to Performance
• Security selection within the consumer discretionary, financials and energy sectors contributed positively to Fund performance.
• Zero exposure to the utilities sector as well as underweight allocations to the communication services and materials sectors also positively impacted Fund performance.
• Hamilton Lane, Insmed and PROCEPT BioRobotics were the largest individual contributors to Fund performance.
Top Detractors from Performance
• The Fund was negatively impacted by security selection within the information technology, healthcare and consumer staples sectors.
• The Fund was also negatively impacted by an overweight allocation to the energy sector.
• Ventyx Biosciences, AtriCure and Flywire were the largest individual detractors from Fund performance.
The Fund’s benchmarks are unmanaged indices used as a general measure of market performance. Calculations assume dividends and capital gains are reinvested. The tables do not reflect taxes shareholders might owe on any fund distributions or when they redeem their shares. You cannot invest directly in an index.
Total Return Based on a Hypothetical $10,000 Investment
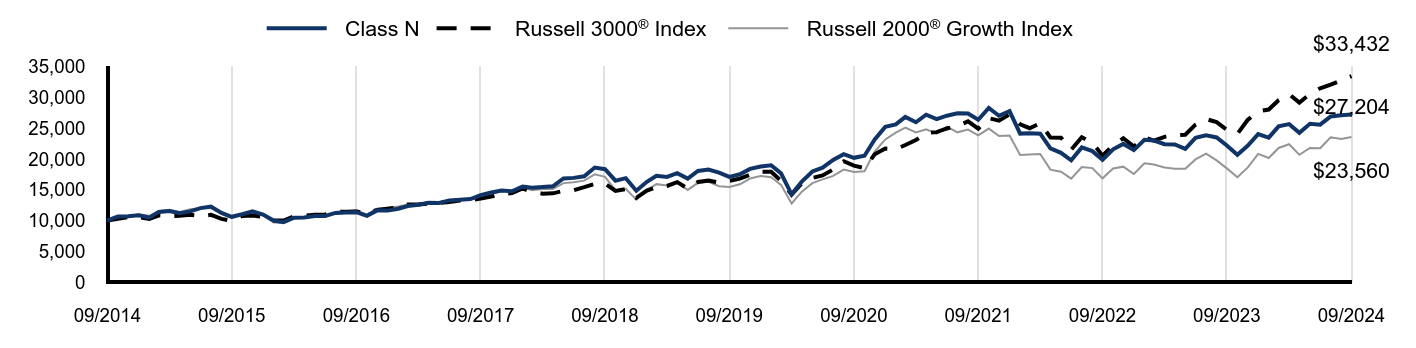
| Class N | Russell 3000® Index | Russell 2000® Growth Index |
|---|
| 09/2014 | $10,000 | $10,000 | $10,000 |
| 10/2014 | $10,630 | $10,275 | $10,620 |
| 11/2014 | $10,688 | $10,524 | $10,689 |
| 12/2014 | $10,829 | $10,524 | $11,006 |
| 01/2015 | $10,444 | $10,231 | $10,755 |
| 02/2015 | $11,386 | $10,824 | $11,529 |
| 03/2015 | $11,514 | $10,713 | $11,736 |
| 04/2015 | $11,181 | $10,762 | $11,390 |
| 05/2015 | $11,471 | $10,911 | $11,809 |
| 06/2015 | $11,999 | $10,728 | $11,968 |
| 07/2015 | $12,251 | $10,908 | $12,016 |
| 08/2015 | $11,210 | $10,249 | $11,106 |
| 09/2015 | $10,592 | $9,951 | $10,404 |
| 10/2015 | $11,010 | $10,736 | $10,995 |
| 11/2015 | $11,462 | $10,796 | $11,397 |
| 12/2015 | $10,959 | $10,574 | $10,854 |
| 01/2016 | $9,995 | $9,978 | $9,678 |
| 02/2016 | $9,713 | $9,975 | $9,609 |
| 03/2016 | $10,441 | $10,677 | $10,346 |
| 04/2016 | $10,492 | $10,743 | $10,449 |
| 05/2016 | $10,728 | $10,935 | $10,730 |
| 06/2016 | $10,738 | $10,958 | $10,681 |
| 07/2016 | $11,225 | $11,393 | $11,379 |
| 08/2016 | $11,287 | $11,422 | $11,500 |
| 09/2016 | $11,338 | $11,440 | $11,666 |
| 10/2016 | $10,743 | $11,192 | $10,941 |
| 11/2016 | $11,636 | $11,693 | $11,920 |
| 12/2016 | $11,600 | $11,921 | $12,082 |
| 01/2017 | $11,907 | $12,145 | $12,278 |
| 02/2017 | $12,348 | $12,597 | $12,580 |
| 03/2017 | $12,548 | $12,606 | $12,729 |
| 04/2017 | $12,887 | $12,739 | $12,963 |
| 05/2017 | $12,841 | $12,870 | $12,845 |
| 06/2017 | $13,256 | $12,986 | $13,287 |
| 07/2017 | $13,369 | $13,231 | $13,400 |
| 08/2017 | $13,466 | $13,256 | $13,385 |
| 09/2017 | $14,102 | $13,579 | $14,113 |
| 10/2017 | $14,538 | $13,876 | $14,332 |
| 11/2017 | $14,851 | $14,297 | $14,744 |
| 12/2017 | $14,735 | $14,440 | $14,761 |
| 01/2018 | $15,514 | $15,201 | $15,336 |
| 02/2018 | $15,295 | $14,641 | $14,899 |
| 03/2018 | $15,445 | $14,347 | $15,100 |
| 04/2018 | $15,549 | $14,402 | $15,115 |
| 05/2018 | $16,818 | $14,808 | $16,066 |
| 06/2018 | $16,916 | $14,905 | $16,192 |
| 07/2018 | $17,175 | $15,400 | $16,470 |
| 08/2018 | $18,595 | $15,940 | $17,496 |
| 09/2018 | $18,324 | $15,967 | $17,086 |
| 10/2018 | $16,454 | $14,791 | $14,924 |
| 11/2018 | $16,870 | $15,087 | $15,158 |
| 12/2018 | $14,824 | $13,683 | $13,387 |
| 01/2019 | $16,286 | $14,858 | $14,933 |
| 02/2019 | $17,252 | $15,380 | $15,897 |
| 03/2019 | $17,072 | $15,605 | $15,682 |
| 04/2019 | $17,670 | $16,228 | $16,159 |
| 05/2019 | $16,795 | $15,178 | $14,960 |
| 06/2019 | $18,031 | $16,244 | $16,113 |
| 07/2019 | $18,263 | $16,485 | $16,270 |
| 08/2019 | $17,767 | $16,149 | $15,568 |
| 09/2019 | $17,084 | $16,433 | $15,440 |
| 10/2019 | $17,497 | $16,786 | $15,880 |
| 11/2019 | $18,379 | $17,424 | $16,814 |
| 12/2019 | $18,775 | $17,928 | $17,200 |
| 01/2020 | $18,971 | $17,908 | $17,010 |
| 02/2020 | $17,647 | $16,442 | $15,782 |
| 03/2020 | $14,251 | $14,181 | $12,768 |
| 04/2020 | $16,324 | $16,059 | $14,670 |
| 05/2020 | $17,956 | $16,918 | $16,056 |
| 06/2020 | $18,579 | $17,304 | $16,673 |
| 07/2020 | $19,825 | $18,287 | $17,246 |
| 08/2020 | $20,757 | $19,612 | $18,258 |
| 09/2020 | $20,176 | $18,898 | $17,867 |
| 10/2020 | $20,519 | $18,490 | $18,002 |
| 11/2020 | $23,173 | $20,739 | $21,177 |
| 12/2020 | $25,208 | $21,672 | $23,156 |
| 01/2021 | $25,600 | $21,576 | $24,273 |
| 02/2021 | $26,818 | $22,250 | $25,074 |
| 03/2021 | $25,949 | $23,048 | $24,285 |
| 04/2021 | $27,181 | $24,236 | $24,815 |
| 05/2021 | $26,462 | $24,346 | $24,106 |
| 06/2021 | $27,018 | $24,947 | $25,236 |
| 07/2021 | $27,424 | $25,369 | $24,317 |
| 08/2021 | $27,381 | $26,092 | $24,759 |
| 09/2021 | $26,362 | $24,921 | $23,810 |
| 10/2021 | $28,271 | $26,607 | $24,925 |
| 11/2021 | $27,003 | $26,202 | $23,708 |
| 12/2021 | $27,776 | $27,234 | $23,813 |
| 01/2022 | $24,109 | $25,631 | $20,621 |
| 02/2022 | $24,178 | $24,986 | $20,711 |
| 03/2022 | $24,101 | $25,796 | $20,806 |
| 04/2022 | $21,699 | $23,481 | $18,253 |
| 05/2022 | $20,990 | $23,450 | $17,908 |
| 06/2022 | $19,776 | $21,488 | $16,800 |
| 07/2022 | $21,870 | $23,504 | $18,681 |
| 08/2022 | $21,263 | $22,627 | $18,505 |
| 09/2022 | $19,853 | $20,528 | $16,840 |
| 10/2022 | $21,554 | $22,212 | $18,439 |
| 11/2022 | $22,434 | $23,371 | $18,739 |
| 12/2022 | $21,432 | $22,003 | $17,536 |
| 01/2023 | $23,113 | $23,518 | $19,281 |
| 02/2023 | $22,990 | $22,968 | $19,072 |
| 03/2023 | $22,383 | $23,583 | $18,601 |
| 04/2023 | $22,339 | $23,834 | $18,385 |
| 05/2023 | $21,635 | $23,927 | $18,388 |
| 06/2023 | $23,413 | $25,560 | $19,913 |
| 07/2023 | $23,835 | $26,477 | $20,844 |
| 08/2023 | $23,483 | $25,966 | $19,759 |
| 09/2023 | $22,189 | $24,729 | $18,456 |
| 10/2023 | $20,658 | $24,073 | $17,032 |
| 11/2023 | $22,136 | $26,318 | $18,583 |
| 12/2023 | $24,017 | $27,714 | $20,808 |
| 01/2024 | $23,459 | $28,021 | $20,141 |
| 02/2024 | $25,287 | $29,538 | $21,777 |
| 03/2024 | $25,647 | $30,491 | $22,386 |
| 04/2024 | $24,242 | $29,149 | $20,662 |
| 05/2024 | $25,701 | $30,526 | $21,769 |
| 06/2024 | $25,557 | $31,471 | $21,732 |
| 07/2024 | $26,889 | $32,056 | $23,511 |
| 08/2024 | $27,078 | $32,754 | $23,251 |
| 09/2024 | $27,204 | $33,432 | $23,560 |
Performance data shown represents past performance and is no guarantee of, and is not necessarily indicative of, future results. Total return and value will vary, and you may have a gain or loss when shares are sold. Current performance may be lower or higher than quoted. For the most recent month-end performance, visit im.natixis.com/en-us/products/mutual-funds/price-and-performance.
Average Annual Total Returns (%)
| 1 Year | 5 Years | 10 Years | Since Inception 2/1/13 |
|---|
| Class N | 22.60% | 9.75% | 10.53% | 11.35% |
Russell 3000® Index | 35.19% | 15.26% | 12.83% | -% |
Russell 2000® Growth Index | 27.66% | 8.82% | 8.95% | -% |
Effective February 1, 2024, in accordance with new regulations, the Fund's primary broad-based index changed to the Russell 3000® Index. The Fund will retain the Russell 2000® Growth Index as an additional benchmark for performance comparison.
| Total Net Assets | $2,358,313,287 |
| # of Portfolio Holdings (including overnight repurchase agreements) | 93 |
| Portfolio Turnover Rate | 39% |
| Total Advisory Fees Paid (after waiver/reimbursement, if applicable) | $16,767,178 |
What did the Fund invest in? (% of Net Assets)
| Value | Value |
|---|
Other investments less than 3% of net assetsFootnote Reference* | 24.2% |
| Short-Term Investments | 3.7% |
| Commercial Services & Supplies | 3.0% |
| Pharmaceuticals | 3.2% |
| Electronic Equipment, Instruments & Components | 3.7% |
| Professional Services | 3.8% |
| Construction & Engineering | 3.9% |
| Machinery | 4.0% |
| Automobile Components | 4.1% |
| Aerospace & Defense | 4.4% |
| Energy Equipment & Services | 4.5% |
| Semiconductors & Semiconductor Equipment | 4.6% |
| Capital Markets | 5.0% |
| Health Care Equipment & Supplies | 5.6% |
| Health Care Providers & Services | 5.8% |
| Biotechnology | 6.8% |
| Software | 9.7% |
| Footnote | Description |
Footnote* | Net of other assets less liabilities |
| Hamilton Lane, Inc., Class A | 2.0% |
| MACOM Technology Solutions Holdings, Inc. | 1.8% |
| Varonis Systems, Inc. | 1.8% |
| Merit Medical Systems, Inc. | 1.7% |
| Casella Waste Systems, Inc., Class A | 1.7% |
| Boot Barn Holdings, Inc. | 1.6% |
| PJT Partners, Inc., Class A | 1.6% |
| Baldwin Insurance Group, Inc. | 1.6% |
| Intapp, Inc. | 1.5% |
| PROCEPT BioRobotics Corp. | 1.5% |
There were no material fund changes during the period.
There were no changes in or disagreements with Accountants during the period.
For additional information about the Fund; including its prospectus, financial information, holdings and proxy information, scan the QR code or visit im.natixis.com/funddocuments.
Loomis Sayles Small Cap Growth Fund
Annual Shareholder Report
September 30, 2024
Loomis Sayles Small/Mid Cap Growth Fund
Annual Shareholder Report - September 30, 2024
This annual shareholder report contains important information about Loomis Sayles Small/Mid Cap Growth Fund for the period of October 1, 2023 to September 30, 2024. You can find additional information about the Fund at im.natixis.com/funddocuments. You can also request this information by contacting us at (800) 633-3330 or by contacting your financial intermediary directly.
What were the fund costs for the last year? (based on a hypothetical $10,000 investment)
| Class Name | Costs of a $10,000 investment | Costs paid as a percentage of a $10,000 investmentFootnote Reference† |
|---|
| Institutional Class | $96 | 0.85% |
| Footnote | Description |
Footnote† | Annualized for periods less than one year. |
How did the fund perform last year and what affected its performance?
Explanation of Fund Performance
Top Contributors to Performance
• Security selection within the industrials, financials and the materials sectors contributed positively to Fund performance.
• Underweight allocation to the communication sector also positively impacted Fund performance.
• Natera, Nova and Axon Enterprises were the largest individual contributors to Fund performance.
Top Detractors from Performance
• The Fund was negatively impacted by security selection within the energy and consumer discretionary sectors.
• The Fund was also negatively impacted by an overweight allocation to the consumer staples and energy sectors.
• Ventyx Biosciences, Exact Sciences and Expro Group Holdings were the largest individual detractors from Fund performance.
The Fund’s benchmarks are unmanaged indices used as a general measure of market performance. Calculations assume dividends and capital gains are reinvested. The tables do not reflect taxes shareholders might owe on any fund distributions or when they redeem their shares. You cannot invest directly in an index.
Total Return Based on a Hypothetical $10,000 Investment
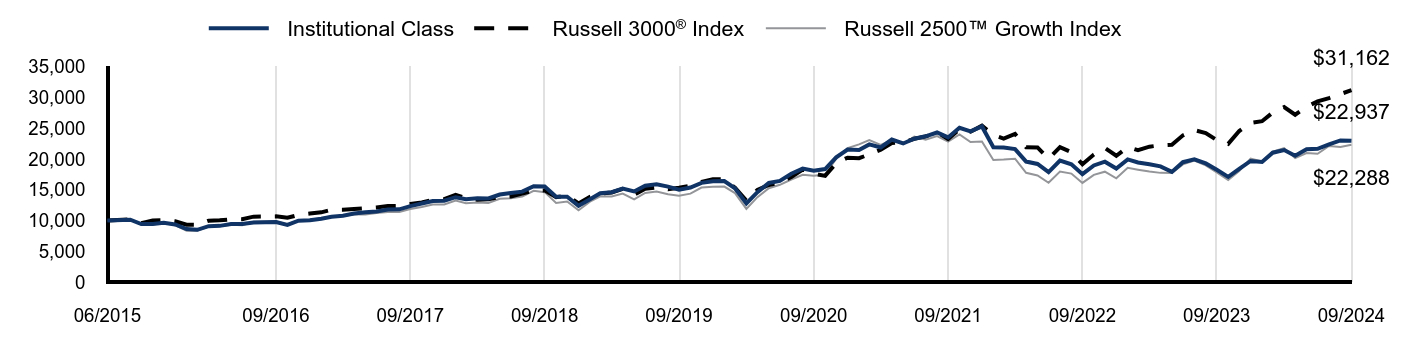
| Institutional Class | Russell 3000® Index | Russell 2500™ Growth Index |
|---|
| 06/2015 | $10,000 | $10,000 | $10,000 |
| 08/2015 | $10,120 | $10,167 | $10,119 |
| 09/2015 | $9,410 | $9,553 | $9,410 |
| 10/2015 | $9,430 | $10,008 | $9,360 |
| 11/2015 | $9,610 | $10,063 | $9,572 |
| 12/2015 | $9,340 | $9,857 | $9,234 |
| 01/2016 | $8,600 | $9,300 | $8,321 |
| 02/2016 | $8,480 | $9,297 | $8,346 |
| 03/2016 | $9,070 | $9,952 | $8,988 |
| 04/2016 | $9,120 | $10,014 | $9,074 |
| 05/2016 | $9,410 | $10,193 | $9,300 |
| 06/2016 | $9,440 | $10,214 | $9,231 |
| 07/2016 | $9,680 | $10,619 | $9,779 |
| 08/2016 | $9,720 | $10,646 | $9,847 |
| 09/2016 | $9,730 | $10,663 | $9,876 |
| 10/2016 | $9,270 | $10,432 | $9,360 |
| 11/2016 | $9,970 | $10,899 | $10,042 |
| 12/2016 | $10,018 | $11,112 | $10,132 |
| 01/2017 | $10,278 | $11,321 | $10,372 |
| 02/2017 | $10,599 | $11,742 | $10,687 |
| 03/2017 | $10,769 | $11,750 | $10,765 |
| 04/2017 | $11,120 | $11,875 | $10,955 |
| 05/2017 | $11,330 | $11,996 | $10,960 |
| 06/2017 | $11,470 | $12,104 | $11,210 |
| 07/2017 | $11,761 | $12,333 | $11,359 |
| 08/2017 | $11,811 | $12,356 | $11,381 |
| 09/2017 | $12,332 | $12,658 | $11,857 |
| 10/2017 | $12,743 | $12,934 | $12,175 |
| 11/2017 | $13,143 | $13,327 | $12,576 |
| 12/2017 | $13,204 | $13,460 | $12,610 |
| 01/2018 | $13,775 | $14,169 | $13,239 |
| 02/2018 | $13,454 | $13,647 | $12,805 |
| 03/2018 | $13,594 | $13,373 | $12,910 |
| 04/2018 | $13,574 | $13,424 | $12,828 |
| 05/2018 | $14,205 | $13,803 | $13,510 |
| 06/2018 | $14,456 | $13,893 | $13,624 |
| 07/2018 | $14,676 | $14,354 | $13,879 |
| 08/2018 | $15,568 | $14,858 | $14,816 |
| 09/2018 | $15,518 | $14,883 | $14,600 |
| 10/2018 | $13,845 | $13,787 | $12,846 |
| 11/2018 | $13,865 | $14,063 | $13,089 |
| 12/2018 | $12,377 | $12,754 | $11,668 |
| 01/2019 | $13,439 | $13,849 | $13,058 |
| 02/2019 | $14,412 | $14,336 | $13,918 |
| 03/2019 | $14,592 | $14,545 | $13,884 |
| 04/2019 | $15,175 | $15,126 | $14,370 |
| 05/2019 | $14,711 | $14,147 | $13,415 |
| 06/2019 | $15,654 | $15,141 | $14,459 |
| 07/2019 | $15,879 | $15,366 | $14,685 |
| 08/2019 | $15,490 | $15,053 | $14,267 |
| 09/2019 | $15,011 | $15,317 | $13,999 |
| 10/2019 | $15,340 | $15,647 | $14,358 |
| 11/2019 | $16,103 | $16,242 | $15,336 |
| 12/2019 | $16,356 | $16,711 | $15,479 |
| 01/2020 | $16,402 | $16,692 | $15,496 |
| 02/2020 | $15,224 | $15,326 | $14,445 |
| 03/2020 | $12,776 | $13,218 | $11,885 |
| 04/2020 | $14,597 | $14,969 | $13,790 |
| 05/2020 | $16,096 | $15,769 | $15,230 |
| 06/2020 | $16,417 | $16,130 | $15,791 |
| 07/2020 | $17,595 | $17,046 | $16,655 |
| 08/2020 | $18,422 | $18,281 | $17,405 |
| 09/2020 | $18,070 | $17,615 | $17,271 |
| 10/2020 | $18,345 | $17,235 | $17,475 |
| 11/2020 | $20,258 | $19,331 | $20,020 |
| 12/2020 | $21,519 | $20,201 | $21,743 |
| 01/2021 | $21,457 | $20,111 | $22,351 |
| 02/2021 | $22,350 | $20,740 | $23,053 |
| 03/2021 | $21,857 | $21,483 | $22,284 |
| 04/2021 | $23,136 | $22,591 | $23,066 |
| 05/2021 | $22,504 | $22,694 | $22,425 |
| 06/2021 | $23,275 | $23,253 | $23,629 |
| 07/2021 | $23,675 | $23,647 | $23,117 |
| 08/2021 | $24,291 | $24,321 | $23,696 |
| 09/2021 | $23,490 | $23,230 | $22,794 |
| 10/2021 | $25,061 | $24,801 | $23,963 |
| 11/2021 | $24,461 | $24,423 | $22,728 |
| 12/2021 | $25,275 | $25,385 | $22,840 |
| 01/2022 | $21,904 | $23,891 | $19,826 |
| 02/2022 | $21,853 | $23,290 | $19,886 |
| 03/2022 | $21,599 | $24,045 | $20,029 |
| 04/2022 | $19,566 | $21,887 | $17,742 |
| 05/2022 | $19,176 | $21,858 | $17,311 |
| 06/2022 | $17,855 | $20,029 | $16,113 |
| 07/2022 | $19,735 | $21,908 | $17,952 |
| 08/2022 | $19,109 | $21,091 | $17,611 |
| 09/2022 | $17,516 | $19,135 | $16,094 |
| 10/2022 | $18,939 | $20,704 | $17,402 |
| 11/2022 | $19,549 | $21,785 | $17,920 |
| 12/2022 | $18,431 | $20,509 | $16,853 |
| 01/2023 | $19,922 | $21,922 | $18,540 |
| 02/2023 | $19,413 | $21,409 | $18,247 |
| 03/2023 | $19,142 | $21,982 | $17,956 |
| 04/2023 | $18,787 | $22,216 | $17,729 |
| 05/2023 | $17,889 | $22,302 | $17,710 |
| 06/2023 | $19,464 | $23,825 | $19,108 |
| 07/2023 | $19,939 | $24,679 | $19,746 |
| 08/2023 | $19,261 | $24,203 | $18,942 |
| 09/2023 | $18,228 | $23,050 | $17,801 |
| 10/2023 | $17,076 | $22,439 | $16,566 |
| 11/2023 | $18,380 | $24,532 | $18,034 |
| 12/2023 | $19,668 | $25,833 | $20,043 |
| 01/2024 | $19,498 | $26,119 | $19,590 |
| 02/2024 | $21,006 | $27,533 | $21,177 |
| 03/2024 | $21,429 | $28,421 | $21,749 |
| 04/2024 | $20,498 | $27,170 | $20,128 |
| 05/2024 | $21,582 | $28,454 | $20,944 |
| 06/2024 | $21,633 | $29,335 | $20,832 |
| 07/2024 | $22,344 | $29,880 | $22,101 |
| 08/2024 | $23,005 | $30,531 | $21,930 |
| 09/2024 | $22,937 | $31,162 | $22,288 |
Performance data shown represents past performance and is no guarantee of, and is not necessarily indicative of, future results. Total return and value will vary, and you may have a gain or loss when shares are sold. Current performance may be lower or higher than quoted. For the most recent month-end performance, visit im.natixis.com/en-us/products/mutual-funds/price-and-performance.
Average Annual Total Returns (%)
| 1 Year | 5 Years | Since Inception 6/30/15 |
|---|
| Institutional Class | 25.84% | 8.85% | 9.39% |
Russell 3000® Index | 35.19% | 15.26% | 13.06% |
| Russell 2500™ Growth Index | 25.20% | 9.75% | 9.11% |
Effective February 1, 2024, in accordance with new regulations, the Fund's primary broad-based index changed to the Russell 3000® Index. The Fund will retain the Russell 2500™ Growth Index as an additional benchmark for performance comparison.
| Total Net Assets | $207,189,962 |
| # of Portfolio Holdings (including overnight repurchase agreements) | 81 |
| Portfolio Turnover Rate | 74% |
| Total Advisory Fees Paid (after waiver/reimbursement, if applicable) | $1,015,564 |
What did the Fund invest in? (% of Net Assets)
| Value | Value |
|---|
Other investments less than 3% of net assetsFootnote Reference* | 33.3% |
| Short-Term Investments | 3.6% |
| Health Care Providers & Services | 3.0% |
| Diversified Consumer Services | 3.0% |
| Consumer Staples Distribution & Retail | 3.7% |
| Commercial Services & Supplies | 3.9% |
| Professional Services | 4.4% |
| Semiconductors & Semiconductor Equipment | 4.7% |
| Aerospace & Defense | 4.9% |
| Hotels, Restaurants & Leisure | 5.2% |
| Capital Markets | 5.4% |
| Health Care Equipment & Supplies | 7.4% |
| Software | 7.8% |
| Biotechnology | 9.7% |
| Footnote | Description |
Footnote* | Net of other assets less liabilities |
| Hamilton Lane, Inc., Class A | 2.3% |
| CyberArk Software Ltd. | 2.1% |
| Tetra Tech, Inc. | 2.0% |
| Insmed, Inc. | 1.8% |
| StepStone Group, Inc., Class A | 1.8% |
| Merit Medical Systems, Inc. | 1.7% |
| PROCEPT BioRobotics Corp. | 1.7% |
| Bright Horizons Family Solutions, Inc. | 1.7% |
| Knife River Corp. | 1.7% |
| ATI, Inc. | 1.7% |
There were no material fund changes during the period.
There were no changes in or disagreements with Accountants during the period.
For additional information about the Fund; including its prospectus, financial information, holdings and proxy information, scan the QR code or visit im.natixis.com/funddocuments.
Loomis Sayles Small/Mid Cap Growth Fund
Annual Shareholder Report
September 30, 2024
Loomis Sayles Small/Mid Cap Growth Fund
Annual Shareholder Report - September 30, 2024
This annual shareholder report contains important information about Loomis Sayles Small/Mid Cap Growth Fund for the period of October 1, 2023 to September 30, 2024. You can find additional information about the Fund at im.natixis.com/funddocuments. You can also request this information by contacting us at (800) 633-3330 or by contacting your financial intermediary directly.
What were the fund costs for the last year? (based on a hypothetical $10,000 investment)
| Class Name | Costs of a $10,000 investment | Costs paid as a percentage of a $10,000 investmentFootnote Reference† |
|---|
| Class N | $94 | 0.83% |
| Footnote | Description |
Footnote† | Annualized for periods less than one year. |
How did the fund perform last year and what affected its performance?
Explanation of Fund Performance
Top Contributors to Performance
• Security selection within the industrials, financials and the materials sectors contributed positively to Fund performance.
• Underweight allocation to the communication sector also positively impacted Fund performance.
• Natera, Nova and Axon Enterprises were the largest individual contributors to Fund performance.
Top Detractors from Performance
• The Fund was negatively impacted by security selection within the energy and consumer discretionary sectors.
• The Fund was also negatively impacted by an overweight allocation to the consumer staples and energy sectors.
• Ventyx Biosciences, Exact Sciences and Expro Group Holdings were the largest individual detractors from Fund performance.
The Fund’s benchmarks are unmanaged indices used as a general measure of market performance. Calculations assume dividends and capital gains are reinvested. The tables do not reflect taxes shareholders might owe on any fund distributions or when they redeem their shares. You cannot invest directly in an index.
Total Return Based on a Hypothetical $10,000 Investment
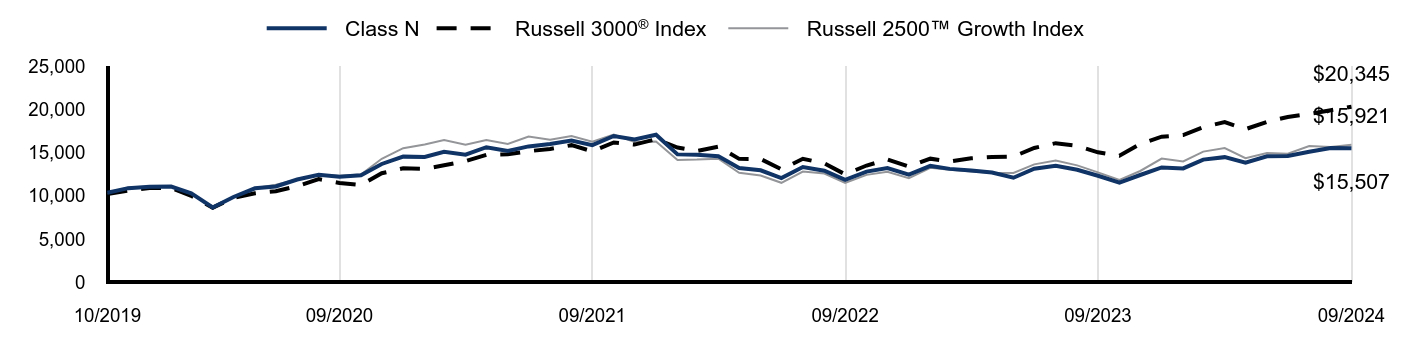
| Class N | Russell 3000® Index | Russell 2500™ Growth Index |
|---|
| 10/2019 | $10,364 | $10,215 | $10,257 |
| 11/2019 | $10,890 | $10,604 | $10,955 |
| 12/2019 | $11,051 | $10,910 | $11,057 |
| 01/2020 | $11,082 | $10,898 | $11,069 |
| 02/2020 | $10,286 | $10,006 | $10,318 |
| 03/2020 | $8,642 | $8,630 | $8,490 |
| 04/2020 | $9,862 | $9,773 | $9,851 |
| 05/2020 | $10,875 | $10,295 | $10,880 |
| 06/2020 | $11,092 | $10,531 | $11,280 |
| 07/2020 | $11,888 | $11,128 | $11,897 |
| 08/2020 | $12,446 | $11,935 | $12,433 |
| 09/2020 | $12,208 | $11,500 | $12,337 |
| 10/2020 | $12,394 | $11,252 | $12,483 |
| 11/2020 | $13,697 | $12,621 | $14,301 |
| 12/2020 | $14,549 | $13,189 | $15,532 |
| 01/2021 | $14,507 | $13,130 | $15,966 |
| 02/2021 | $15,111 | $13,540 | $16,467 |
| 03/2021 | $14,778 | $14,026 | $15,918 |
| 04/2021 | $15,642 | $14,749 | $16,477 |
| 05/2021 | $15,215 | $14,816 | $16,019 |
| 06/2021 | $15,735 | $15,181 | $16,879 |
| 07/2021 | $16,006 | $15,438 | $16,513 |
| 08/2021 | $16,422 | $15,878 | $16,927 |
| 09/2021 | $15,881 | $15,166 | $16,283 |
| 10/2021 | $16,942 | $16,191 | $17,117 |
| 11/2021 | $16,537 | $15,945 | $16,235 |
| 12/2021 | $17,087 | $16,573 | $16,315 |
| 01/2022 | $14,809 | $15,598 | $14,163 |
| 02/2022 | $14,775 | $15,205 | $14,205 |
| 03/2022 | $14,603 | $15,698 | $14,308 |
| 04/2022 | $13,230 | $14,289 | $12,674 |
| 05/2022 | $12,967 | $14,270 | $12,366 |
| 06/2022 | $12,062 | $13,076 | $11,510 |
| 07/2022 | $13,344 | $14,303 | $12,824 |
| 08/2022 | $12,921 | $13,769 | $12,580 |
| 09/2022 | $11,845 | $12,493 | $11,496 |
| 10/2022 | $12,806 | $13,517 | $12,431 |
| 11/2022 | $13,218 | $14,223 | $12,801 |
| 12/2022 | $12,463 | $13,390 | $12,039 |
| 01/2023 | $13,470 | $14,312 | $13,244 |
| 02/2023 | $13,127 | $13,977 | $13,034 |
| 03/2023 | $12,944 | $14,351 | $12,826 |
| 04/2023 | $12,703 | $14,504 | $12,665 |
| 05/2023 | $12,097 | $14,560 | $12,651 |
| 06/2023 | $13,150 | $15,555 | $13,649 |
| 07/2023 | $13,482 | $16,112 | $14,105 |
| 08/2023 | $13,024 | $15,801 | $13,531 |
| 09/2023 | $12,326 | $15,049 | $12,716 |
| 10/2023 | $11,536 | $14,650 | $11,833 |
| 11/2023 | $12,417 | $16,016 | $12,882 |
| 12/2023 | $13,299 | $16,865 | $14,318 |
| 01/2024 | $13,184 | $17,052 | $13,994 |
| 02/2024 | $14,203 | $17,975 | $15,128 |
| 03/2024 | $14,489 | $18,555 | $15,536 |
| 04/2024 | $13,859 | $17,739 | $14,378 |
| 05/2024 | $14,580 | $18,577 | $14,961 |
| 06/2024 | $14,626 | $19,152 | $14,881 |
| 07/2024 | $15,107 | $19,508 | $15,787 |
| 08/2024 | $15,553 | $19,932 | $15,665 |
| 09/2024 | $15,507 | $20,345 | $15,921 |
Performance data shown represents past performance and is no guarantee of, and is not necessarily indicative of, future results. Total return and value will vary, and you may have a gain or loss when shares are sold. Current performance may be lower or higher than quoted. For the most recent month-end performance, visit im.natixis.com/en-us/products/mutual-funds/price-and-performance.
Average Annual Total Returns (%)
| 1 Year | Since Inception 10/1/19 |
|---|
| Class N | 25.81% | 9.17% |
Russell 3000® Index | 35.19% | 15.20% |
| Russell 2500™ Growth Index | 25.20% | 9.71% |
Effective February 1, 2024, in accordance with new regulations, the Fund's primary broad-based index changed to the Russell 3000® Index. The Fund will retain the Russell 2500™ Growth Index as an additional benchmark for performance comparison.
| Total Net Assets | $207,189,962 |
| # of Portfolio Holdings (including overnight repurchase agreements) | 81 |
| Portfolio Turnover Rate | 74% |
| Total Advisory Fees Paid (after waiver/reimbursement, if applicable) | $1,015,564 |
What did the Fund invest in? (% of Net Assets)
| Value | Value |
|---|
Other investments less than 3% of net assetsFootnote Reference* | 33.3% |
| Short-Term Investments | 3.6% |
| Health Care Providers & Services | 3.0% |
| Diversified Consumer Services | 3.0% |
| Consumer Staples Distribution & Retail | 3.7% |
| Commercial Services & Supplies | 3.9% |
| Professional Services | 4.4% |
| Semiconductors & Semiconductor Equipment | 4.7% |
| Aerospace & Defense | 4.9% |
| Hotels, Restaurants & Leisure | 5.2% |
| Capital Markets | 5.4% |
| Health Care Equipment & Supplies | 7.4% |
| Software | 7.8% |
| Biotechnology | 9.7% |
| Footnote | Description |
Footnote* | Net of other assets less liabilities |
| Hamilton Lane, Inc., Class A | 2.3% |
| CyberArk Software Ltd. | 2.1% |
| Tetra Tech, Inc. | 2.0% |
| Insmed, Inc. | 1.8% |
| StepStone Group, Inc., Class A | 1.8% |
| Merit Medical Systems, Inc. | 1.7% |
| PROCEPT BioRobotics Corp. | 1.7% |
| Bright Horizons Family Solutions, Inc. | 1.7% |
| Knife River Corp. | 1.7% |
| ATI, Inc. | 1.7% |
There were no material fund changes during the period.
There were no changes in or disagreements with Accountants during the period.
For additional information about the Fund; including its prospectus, financial information, holdings and proxy information, scan the QR code or visit im.natixis.com/funddocuments.
Loomis Sayles Small/Mid Cap Growth Fund
Annual Shareholder Report
September 30, 2024
(b) Not Applicable.
Item 2. Code of Ethics.
The Registrant has adopted a code of ethics that applies to the Registrant’s principal executive officer, principal financial officer and persons performing similar functions. There have been no amendments or waivers of the Registrant’s code of ethics during the period.
Item 3. Audit Committee Financial Expert.
The Board of Trustees of the Registrant has established an audit committee. Mr. Richard A. Goglia, Mr. James P. Palermo, Mr. Kirk A. Sykes and Ms. Cynthia L. Walker are members of the audit committee and have been designated as “audit committee financial experts” by the Board of Trustees. Each of these individuals is also an Independent Trustee of the Registrant.
Item 4. Principal Accountant Fees and Services.
Fees billed by the Principal Accountant for services rendered to the Registrant.
The table below sets forth fees billed by the principal accountant, PricewaterhouseCoopers LLP, for the past two fiscal years for professional services rendered in connection with a) the audit of the Registrant’s annual financial statements and services provided in connection with regulatory filings; b) audit-related services (including services that are reasonably related to the performance of the audit of the Registrant’s financial statements but not reported under “Audit Fees”); c) tax compliance, tax advice and tax planning and d) all other fees billed for professional services rendered by the principal accountant to the Registrant, other than the services reported as a part of (a) through (c) of this Item.
| | | | | | | | | | | | | | | | |
| | | Audit fees | | Audit-related fees1 | | Tax fees2 | | All other fees |
| | | 10/1/22- 9/30/23 | | 10/1/23- 9/30/24 | | 10/1/22- 9/30/23 | | 10/1/23- 9/30/24 | | 10/1/22- 9/30/23 | | 10/1/23- 9/30/24 | | 10/1/22- 9/30/23 | | 10/1/23- 9/30/24 |
| Loomis Sayles Funds II - Loomis Sayles Global Allocation Fund, Loomis Sayles Growth Fund, Loomis Sayles Limited Term Government and Agency Fund, Loomis Sayles Small Cap Growth Fund and Loomis Sayles Small/Mid Cap Growth Fund | | $276,847 | | $223,863 | | $3,713 | | $4,242 | | $47,739 | | $45,057 | | $-- | | $-- |
| | 1. | Audit-related fees consist of: |
2023 & 2024 – performance of agreed-upon procedures related to the Registrant’s deferred compensation plan.
2023 & 2024 – review of Registrant’s tax returns
Aggregate fees billed to the Registrant for non-audit services during 2023 and 2024 were $51,452 and $49,299, respectively.
(e)(1) Audit Committee Pre Approval Policies.
Annually, the Registrant’s Audit Committee reviews the audit, audit-related, tax and other non-audit services together with the projected fees, for services proposed to be rendered to the Registrant and/or other entities for which pre-approval is required during the upcoming year. Any subsequent revisions to
already pre-approved services or fees (including fee increases) and requests for pre-approval of new services would be presented for consideration quarterly as needed.
If, in the opinion of management, a proposed engagement by the Registrant’s independent accountants needs to commence before the next regularly scheduled Audit Committee meeting, any member of the Audit Committee who is an Independent Trustee of the Registrant is authorized to pre-approve the engagement, but only for engagements to provide audit, audit related and tax services. This approval is subject to review by the full Audit Committee at its next quarterly meeting. All other engagements require the approval of all the members of the Audit Committee.
(e)(2) None of the services described in each of Items 4 (b) through (d) were approved pursuant to de minimis exception in paragraph (c)(7)(i)(C) of Rule 2-01 of Regulation S-X.
(f) Not applicable.
(g) Fees billed by the Principal Accountant for services rendered to the Adviser and Control Affiliates.
The following table sets forth the fees billed by the Registrant’s principal accountant for non-audit services rendered to Loomis, Sayles & Company, L.P. and entities controlling, controlled by or under common control with Loomis, Sayles & Company, L.P. (“Control Affiliates”) that provide ongoing services to the Registrant, for engagements that related directly to the operations and financial reporting of the Registrant for the last two fiscal years.
| | | | | | | | | | | | |
| | | Audit-related fees | | Tax fees | | All other fees |
| | | 10/1/22- 9/30/23 | | 10/1/23- 9/30/24 | | 10/1/22- 9/30/23 | | 10/1/23- 9/30/24 | | 10/1/22- 9/30/23 | | 10/1/23- 9/30/24 |
Control Affiliates | | $ -- | | $-- | | $ -- | | $-- | | $-- | | $- |
The following table sets forth the aggregate fees billed by the Registrant’s principal accountant for non-audit services rendered to Loomis, Sayles & Company, L.P. and Control Affiliates that provide ongoing services to the Registrant, for the last two fiscal years, including the fees disclosed in the table above.
| | | | |
| | | Aggregate Non-Audit Fees |
| | | 10/1/22-9/30/23 | | 10/1/23-9/30/24 |
Control Affiliates | | $-- | | $165,000 |
(h) The audit committee has considered and determined that the provisions of non-audit services that were rendered to the Registrant’s investment adviser, and any entity controlling, controlled by, or under common control with the investment adviser that provides ongoing services to the Registrant that were not pre-approved pursuant to paragraph (c)(7)(i)(C) of Rule 2-01 of Regulation S-X is compatible with maintaining the principal accountant’s independence.
(i) Not applicable.
(j) Not applicable.
Item 5. Audit Committee of Listed Registrants.
Not applicable.
Item 6. Schedule of Investments.
The Schedule of Investments are incorporated by reference as part of the Financial Statements and Other Important Information for Open-End Management Investment Companies filed as Item 7 herewith.
Item 7. Financial Statements and Financial Highlights for Open-End Management Investment Companies.
(a) The Registrant’s Financial Statements are attached herewith.
(b) The Registrant’s Financial Highlights are attached herewith.
Loomis Sayles Small Cap Growth Fund |
Loomis Sayles Small Cap Value Fund |
Loomis Sayles Small/Mid Cap Growth Fund |
Annual Financial Statements and Other Important Information
Portfolio of Investments – as of September 30, 2024Loomis Sayles Small Cap Growth Fund
| | |
Common Stocks— 96.5% of Net Assets |
| Aerospace & Defense — 4.4% |
| | |
| | |
| | |
| Kratos Defense & Security Solutions, Inc.(a) | |
| | |
| Automobile Components — 4.1% |
| | |
| | |
| Modine Manufacturing Co.(a) | |
| | |
| | |
| |
| | |
| |
| | |
| |
| Agios Pharmaceuticals, Inc.(a) | |
| | |
| | |
| Mirum Pharmaceuticals, Inc.(a) | |
| | |
| Rhythm Pharmaceuticals, Inc.(a) | |
| | |
| | |
| Xenon Pharmaceuticals, Inc.(a) | |
| | |
| |
| | |
| | |
| | |
| |
| Hamilton Lane, Inc., Class A | |
| | |
| PJT Partners, Inc., Class A | |
| | |
| |
| | |
| Commercial Services & Supplies — 3.0% |
| ACV Auctions, Inc., Class A(a) | |
| Casella Waste Systems, Inc., Class A(a) | |
| | |
| Construction & Engineering — 3.9% |
| | |
| Construction Partners, Inc., Class A(a) | |
| Sterling Infrastructure, Inc.(a) | |
| | |
| | |
| Diversified Consumer Services — 1.5% |
| Grand Canyon Education, Inc.(a) | |
| | |
| | |
| Electronic Equipment, Instruments & |
| Advanced Energy Industries, Inc. | |
| | |
| | |
| | |
| Energy Equipment & Services — 4.5% |
| | |
| | |
| Oceaneering International, Inc.(a) | |
| Weatherford International PLC | |
| | |
| Financial Services — 1.1% |
| | |
| Ground Transportation — 0.7% |
| | |
| Health Care Equipment & Supplies — 5.6% |
| | |
| Integer Holdings Corp.(a) | |
| iRhythm Technologies, Inc.(a) | |
| Merit Medical Systems, Inc.(a) | |
| PROCEPT BioRobotics Corp.(a) | |
| | |
| Health Care Providers & Services — 5.8% |
| Acadia Healthcare Co., Inc.(a) | |
| | |
| | |
| | |
| | |
| | |
| | |
| Hotels, Restaurants & Leisure — 2.3% |
| Life Time Group Holdings, Inc.(a) | |
| | |
| | |
| Household Durables — 1.1% |
| Installed Building Products, Inc. | |
| |
| Baldwin Insurance Group, Inc.(a) | |
| Kinsale Capital Group, Inc. | |
| | |
| Interactive Media & Services — 0.5% |
| | |
| Life Sciences Tools & Services — 1.2% |
| Medpace Holdings, Inc.(a) | |
See accompanying notes to financial statements.
Portfolio of Investments – as of September 30, 2024Loomis Sayles Small Cap Growth Fund (continued) | | |
| |
| Albany International Corp., Class A | |
| | |
| | |
| | |
| | |
| |
| | |
| Oil, Gas & Consumable Fuels — 1.0% |
| Magnolia Oil & Gas Corp., Class A | |
| Personal Care Products — 1.9% |
| | |
| | |
| | |
| |
| Axsome Therapeutics, Inc.(a) | |
| Ligand Pharmaceuticals, Inc.(a) | |
| Supernus Pharmaceuticals, Inc.(a) | |
| Verona Pharma PLC, ADR(a) | |
| | |
| Professional Services — 3.8% |
| | |
| Huron Consulting Group, Inc.(a) | |
| | |
| | |
| | |
| Semiconductors & Semiconductor Equipment — 4.6% |
| MACOM Technology Solutions Holdings, Inc.(a) | |
| | |
| Silicon Laboratories, Inc.(a) | |
| Veeco Instruments, Inc.(a) | |
| | |
| |
| | |
| Clearwater Analytics Holdings, Inc., Class A(a) | |
| | |
| Procore Technologies, Inc.(a) | |
| Tenable Holdings, Inc.(a) | |
| | |
| | |
| | |
| | |
| |
| Boot Barn Holdings, Inc.(a) | |
| Warby Parker, Inc., Class A(a) | |
| | |
| Textiles, Apparel & Luxury Goods — 0.7% |
| | |
| | |
| Trading Companies & Distributors — 2.3% |
| Applied Industrial Technologies, Inc. | |
| SiteOne Landscape Supply, Inc.(a) | |
| | |
| Total Common Stocks
(Identified Cost $1,655,007,177)
| |
| | |
Short-Term Investments — 3.7% |
| Tri-Party Repurchase Agreement with Fixed Income Clearing Corporation, dated 9/30/2024 at 3.000% to be repurchased at $86,702,783 on 10/01/2024 collateralized by $88,529,800 U.S. Treasury Note, 3.500% due 9/30/2026 valued at $88,429,556 including accrued interest (Note 2 of Notes to Financial Statements)
(Identified Cost $86,695,558) | |
| Total Investments — 100.2%
(Identified Cost $1,741,702,735)
| |
| Other assets less liabilities — (0.2)% | |
| | |
| See Note 2 of Notes to Financial Statements. |
| Non-income producing security. |
| An American Depositary Receipt is a certificate issued by a custodian bank representing the right to receive securities of the foreign issuer described. The values of ADRs may be significantly influenced by trading on exchanges not located in the United States. |
See accompanying notes to financial statements.
Portfolio of Investments – as of September 30, 2024Loomis Sayles Small Cap Growth Fund (continued) Industry Summary at September 30, 2024
| |
| |
Health Care Providers & Services | |
Health Care Equipment & Supplies | |
| |
Semiconductors & Semiconductor Equipment | |
Energy Equipment & Services | |
| |
| |
| |
Construction & Engineering | |
| |
Electronic Equipment, Instruments & Components | |
| |
Commercial Services & Supplies | |
| |
| |
Hotels, Restaurants & Leisure | |
Trading Companies & Distributors | |
Other Investments, less than 2% each | |
| |
| |
Other assets less liabilities | |
| |
See accompanying notes to financial statements.
Portfolio of Investments – as of September 30, 2024Loomis Sayles Small Cap Value Fund
| | |
Common Stocks— 99.2% of Net Assets |
| Aerospace & Defense — 3.8% |
| | |
| | |
| | |
| | |
| Automobile Components — 0.8% |
| | |
| |
| | |
| | |
| | |
| | |
| Pinnacle Financial Partners, Inc. | |
| | |
| Prosperity Bancshares, Inc. | |
| | |
| | |
| | |
| | |
| |
| | |
| United Therapeutics Corp.(a) | |
| | |
| |
| | |
| Quanex Building Products Corp. | |
| | |
| | |
| |
| | |
| |
| | |
| | |
| | |
| | |
| | |
| Commercial Services & Supplies — 2.4% |
| CECO Environmental Corp.(a) | |
| | |
| | |
| | |
| Construction & Engineering — 2.9% |
| | |
| Limbach Holdings, Inc.(a) | |
| MDU Resources Group, Inc. | |
| | |
| Construction Materials — 1.4% |
| | |
| | |
| Consumer Staples Distribution & Retail — 0.5% |
| | |
| Electric Utilities — 1.4% |
| | |
| | |
| | |
| Electrical Equipment — 0.9% |
| | |
| | |
| | |
| Electronic Equipment, Instruments & |
| | |
| | |
| | |
| | |
| TTM Technologies, Inc.(a) | |
| | |
| | |
| Energy Equipment & Services — 4.7% |
| | |
| Newpark Resources, Inc.(a) | |
| | |
| | |
| Weatherford International PLC | |
| | |
| |
| Atlanta Braves Holdings, Inc., Class C(a) | |
| Financial Services — 3.9% |
| Euronet Worldwide, Inc.(a) | |
| Federal Agricultural Mortgage Corp., Class C | |
| International Money Express, Inc.(a) | |
| | |
| | |
| |
| | |
| | |
| | |
| | |
| Health Care Equipment & Supplies — 3.2% |
| | |
| | |
| | |
| Lantheus Holdings, Inc.(a) | |
| UFP Technologies, Inc.(a) | |
| | |
| Health Care Providers & Services — 3.8% |
| Concentra Group Holdings Parent, Inc.(a) | |
| Option Care Health, Inc.(a) | |
See accompanying notes to financial statements.
Portfolio of Investments – as of September 30, 2024Loomis Sayles Small Cap Value Fund (continued) | | |
| Health Care Providers & Services — continued |
| Select Medical Holdings Corp. | |
| Tenet Healthcare Corp.(a) | |
| | |
| Hotels, Restaurants & Leisure — 1.5% |
| | |
| Six Flags Entertainment Corp. | |
| | |
| Household Durables — 2.2% |
| | |
| | |
| | |
| Household Products — 0.5% |
| Spectrum Brands Holdings, Inc. | |
| Independent Power & Renewable Electricity |
| | |
| |
| | |
| |
| | |
| | |
| | |
| Skyward Specialty Insurance Group, Inc.(a) | |
| | |
| |
| | |
| |
| Albany International Corp., Class A | |
| Allison Transmission Holdings, Inc. | |
| Atmus Filtration Technologies, Inc. | |
| | |
| | |
| | |
| | |
| Marine Transportation — 0.7% |
| Genco Shipping & Trading Ltd. | |
| |
| | |
| John Wiley & Sons, Inc., Class A | |
| | |
| |
| | |
| Postal Realty Trust, Inc., Class A | |
| | |
| Oil, Gas & Consumable Fuels — 4.3% |
| Antero Resources Corp.(a) | |
| California Resources Corp. | |
| | |
| Oil, Gas & Consumable Fuels — continued |
| Delek U.S. Holdings, Inc. | |
| International Seaways, Inc. | |
| | |
| | |
| | |
| Personal Care Products — 0.8% |
| | |
| |
| ANI Pharmaceuticals, Inc.(a) | |
| Supernus Pharmaceuticals, Inc.(a) | |
| | |
| Professional Services — 2.4% |
| | |
| | |
| | |
| | |
| Real Estate Management & Development — 1.2% |
| Colliers International Group, Inc. | |
| |
| | |
| Semiconductors & Semiconductor Equipment — 0.9% |
| | |
| |
| | |
| HashiCorp, Inc., Class A(a) | |
| | |
| | |
| |
| Academy Sports & Outdoors, Inc. | |
| Boot Barn Holdings, Inc.(a) | |
| | |
| Textiles, Apparel & Luxury Goods — 1.2% |
| | |
| Trading Companies & Distributors — 4.1% |
| | |
| Beacon Roofing Supply, Inc.(a) | |
| | |
| | |
| | |
| | |
| |
| | |
| Wireless Telecommunication Services — 1.5% |
| | |
| Total Common Stocks
(Identified Cost $262,629,283)
| |
See accompanying notes to financial statements.
Portfolio of Investments – as of September 30, 2024Loomis Sayles Small Cap Value Fund (continued)
| | |
Short-Term Investments — 1.5% |
| Tri-Party Repurchase Agreement with Fixed Income Clearing Corporation, dated 9/30/2024 at 3.000% to be repurchased at $6,046,513 on 10/01/2024 collateralized by $6,174,000 U.S. Treasury Note, 3.500% due 9/30/2026 valued at $6,167,082 including accrued interest (Note 2 of Notes to Financial Statements)
(Identified Cost $6,046,010) | |
| Total Investments — 100.7%
(Identified Cost $268,675,293)
| |
| Other assets less liabilities — (0.7)% | |
| | |
| See Note 2 of Notes to Financial Statements. |
| Non-income producing security. |
| Real Estate Investment Trusts |
Industry Summary at September 30, 2024
| |
Electronic Equipment, Instruments & Components | |
| |
Energy Equipment & Services | |
Oil, Gas & Consumable Fuels | |
Trading Companies & Distributors | |
| |
| |
Health Care Providers & Services | |
Health Care Equipment & Supplies | |
| |
| |
| |
Construction & Engineering | |
| |
Commercial Services & Supplies | |
| |
| |
Other Investments, less than 2% each | |
| |
| |
Other assets less liabilities | |
| |
See accompanying notes to financial statements.
Portfolio of Investments – as of September 30, 2024Loomis Sayles Small/Mid Cap Growth Fund
| | |
Common Stocks— 96.5% of Net Assets |
| Aerospace & Defense — 4.9% |
| | |
| | |
| | |
| | |
| | |
| Automobile Components — 1.1% |
| | |
| |
| | |
| |
| | |
| Ascendis Pharma AS, ADR(a) | |
| | |
| | |
| | |
| Neurocrine Biosciences, Inc.(a) | |
| | |
| United Therapeutics Corp.(a) | |
| | |
| |
| Ollie's Bargain Outlet Holdings, Inc.(a) | |
| |
| | |
| |
| Hamilton Lane, Inc., Class A | |
| Jefferies Financial Group, Inc. | |
| StepStone Group, Inc., Class A | |
| | |
| Commercial Services & Supplies — 3.9% |
| Casella Waste Systems, Inc., Class A(a) | |
| | |
| | |
| | |
| Communications Equipment — 1.2% |
| | |
| Construction Materials — 1.7% |
| | |
| Consumer Staples Distribution & Retail — 3.7% |
| BJ's Wholesale Club Holdings, Inc.(a) | |
| Casey's General Stores, Inc. | |
| Performance Food Group Co.(a) | |
| | |
| Diversified Consumer Services — 3.0% |
| Bright Horizons Family Solutions, Inc.(a) | |
| | |
| | |
| | |
| Electrical Equipment — 1.3% |
| Generac Holdings, Inc.(a) | |
| Electronic Equipment, Instruments & |
| Advanced Energy Industries, Inc. | |
| | |
| | |
| Energy Equipment & Services — 2.5% |
| | |
| Expro Group Holdings NV(a) | |
| | |
| | |
| Financial Services — 2.0% |
| Euronet Worldwide, Inc.(a) | |
| | |
| | |
| |
| | |
| Health Care Equipment & Supplies — 7.4% |
| | |
| Integer Holdings Corp.(a) | |
| Merit Medical Systems, Inc.(a) | |
| | |
| PROCEPT BioRobotics Corp.(a) | |
| | |
| Health Care Providers & Services — 3.0% |
| Acadia Healthcare Co., Inc.(a) | |
| | |
| Privia Health Group, Inc.(a) | |
| | |
| Hotels, Restaurants & Leisure — 5.2% |
| | |
| Life Time Group Holdings, Inc.(a) | |
| | |
| | |
| | |
| |
| Kinsale Capital Group, Inc. | |
| Reinsurance Group of America, Inc. | |
| | |
| |
| | |
| Life Sciences Tools & Services — 0.8% |
| Medpace Holdings, Inc.(a) | |
| |
| | |
| | |
| | |
See accompanying notes to financial statements.
Portfolio of Investments – as of September 30, 2024Loomis Sayles Small/Mid Cap Growth Fund (continued) | | |
| |
| | |
| Oil, Gas & Consumable Fuels — 2.2% |
| Magnolia Oil & Gas Corp., Class A | |
| | |
| | |
| Professional Services — 4.4% |
| ExlService Holdings, Inc.(a) | |
| | |
| | |
| | |
| | |
| Real Estate Management & Development — 0.9% |
| Colliers International Group, Inc. | |
| Semiconductors & Semiconductor Equipment — 4.7% |
| Allegro MicroSystems, Inc.(a) | |
| | |
| | |
| | |
| Silicon Laboratories, Inc.(a) | |
| | |
| |
| Alkami Technology, Inc.(a) | |
| Clearwater Analytics Holdings, Inc., Class A(a) | |
| CyberArk Software Ltd.(a) | |
| Guidewire Software, Inc.(a) | |
| | |
| Tyler Technologies, Inc.(a) | |
| | |
| | |
| |
| | |
| Textiles, Apparel & Luxury Goods — 2.2% |
| | |
| Skechers USA, Inc., Class A(a) | |
| | |
| Trading Companies & Distributors — 1.1% |
| SiteOne Landscape Supply, Inc.(a) | |
| Total Common Stocks
(Identified Cost $168,063,117)
| |
| | |
Short-Term Investments — 3.6% |
| Tri-Party Repurchase Agreement with Fixed Income Clearing Corporation, dated 9/30/2024 at 3.000% to be repurchased at $7,335,746 on 10/01/2024 collateralized by $7,490,400 U.S. Treasury Note, 3.500% due 9/30/2026 valued at $7,481,992 including accrued interest (Note 2 of Notes to Financial Statements)
(Identified Cost $7,335,135) | |
| Total Investments — 100.1%
(Identified Cost $175,398,252)
| |
| Other assets less liabilities — (0.1)% | |
| | |
| See Note 2 of Notes to Financial Statements. |
| Non-income producing security. |
| An American Depositary Receipt is a certificate issued by a custodian bank representing the right to receive securities of the foreign issuer described. The values of ADRs may be significantly influenced by trading on exchanges not located in the United States. |
Industry Summary at September 30, 2024
| |
| |
Health Care Equipment & Supplies | |
| |
Hotels, Restaurants & Leisure | |
| |
Semiconductors & Semiconductor Equipment | |
| |
Commercial Services & Supplies | |
Consumer Staples Distribution & Retail | |
Diversified Consumer Services | |
Health Care Providers & Services | |
| |
Electronic Equipment, Instruments & Components | |
Energy Equipment & Services | |
Oil, Gas & Consumable Fuels | |
Textiles, Apparel & Luxury Goods | |
| |
| |
Other Investments, less than 2% each | |
| |
| |
Other assets less liabilities | |
| |
See accompanying notes to financial statements.
Statements of Assets and Liabilities
| | | |
| | | |
| | | |
Net unrealized appreciation | | | |
| | | |
| | | |
Receivable for Fund shares sold | | | |
Receivable for securities sold | | | |
Dividends and interest receivable | | | |
| | | |
| | | |
| | | |
Payable for securities purchased | | | |
Payable for Fund shares redeemed | | | |
Management fees payable (Note 5) | | | |
Deferred Trustees’ fees (Note 5) | | | |
Administrative fees payable (Note 5) | | | |
Payable to distributor (Note 5d) | | | |
Audit and tax services fees payable | | | |
Other accounts payable and accrued expenses | | | |
| | | |
COMMITMENTS AND CONTINGENCIES(a) | | | |
| | | |
| | | |
| | | |
| | | |
| | | |
COMPUTATION OF NET ASSET VALUE AND OFFERING PRICE: | | | |
| | | |
| | | |
Shares of beneficial interest | | | |
Net asset value, offering and redemption price per share | | | |
| | | |
| | | |
Shares of beneficial interest | | | |
Net asset value, offering and redemption price per share | | | |
| | | |
| | | |
Shares of beneficial interest | | | |
Net asset value, offering and redemption price per share | | | |
| | | |
| | | |
Shares of beneficial interest | | | |
Net asset value, offering and redemption price per share | | | |
| As disclosed in the Notes to Financial Statements, if applicable. |
See accompanying notes to financial statements.
For the Year Ended September 30, 2024
| | | |
| | | |
| | | |
| | | |
Less net foreign taxes withheld | | | |
| | | |
| | | |
| | | |
Service and distribution fees (Note 5) | | | |
Administrative fees (Note 5) | | | |
Trustees' fees and expenses (Note 5) | | | |
Transfer agent fees and expenses (Notes 5, 6 and 7) | | | |
Audit and tax services fees | | | |
Custodian fees and expenses | | | |
| | | |
| | | |
Shareholder reporting expenses | | | |
| | | |
| | | |
Less waiver and/or expense reimbursement (Note 5) | | | |
Less expense offset (Note 7) | | | |
| | | |
Net investment income (loss) | | | |
Net realized and unrealized gain on Investments | | | |
| | | |
| | | |
Net change in unrealized appreciation (depreciation) on: | | | |
| | | |
Net realized and unrealized gain on Investments | | | |
NET INCREASE IN NET ASSETS RESULTING FROM OPERATIONS | | | |
See accompanying notes to financial statements.
Statements of Changes in Net Assets
| | |
| Year Ended
September 30,2024 | Year Ended
September 30,2023 | Year Ended
September 30,2024 | Year Ended
September 30,2023 |
| | | | |
Net investment income (loss) | | | | |
Net realized gain on investments | | | | |
Net change in unrealized appreciation on investments | | | | |
Net increase in net assets resulting from operations | | | | |
FROM DISTRIBUTIONS TO SHAREHOLDERS: | | | | |
| | | | |
| | | | |
| | | | |
| | | | |
| | | | |
NET INCREASE (DECREASE) IN NET ASSETS
FROM CAPITAL SHARES TRANSACTIONS
(Note 11) | | | | |
Net increase (decrease) in net assets | | | | |
| | | | |
| | | | |
| | | | |
See accompanying notes to financial statements.
Statements of Changes in Net Assets (continued)
| Small/Mid Cap Growth Fund |
| Year Ended
September 30,2024 | Year Ended
September 30,2023 |
| | |
| | |
Net realized gain (loss) on investments | | |
Net change in unrealized appreciation on investments | | |
Net increase in net assets resulting from operations | | |
NET INCREASE (DECREASE) IN NET ASSETS
FROM CAPITAL SHARES TRANSACTIONS
(Note 11) | | |
Net increase (decrease) in net assets | | |
| | |
| | |
| | |
See accompanying notes to financial statements.
For a share outstanding throughout each period.
| Small Cap Growth Fund – Institutional Class |
| Year Ended
September 30,
2024 | Year Ended
September 30,
2023 | Year Ended
September 30,
2022 | Year Ended
September 30,
2021 | Year Ended
September 30,
2020 |
Net asset value, beginning of the period | | | | | |
INCOME (LOSS) FROM INVESTMENT OPERATIONS: | | | | | |
| | | | | |
Net realized and unrealized gain (loss) | | | | | |
Total from Investment Operations | | | | | |
| | | | | |
Net realized capital gains | | | | | |
Net asset value, end of the period | | | | | |
| | | | | |
RATIOS TO AVERAGE NET ASSETS: | | | | | |
Net assets, end of the period (000's) | | | | | |
| | | | | |
| | | | | |
| | | | | |
| | | | | |
| Per share net investment loss has been calculated using the average shares outstanding during the period. |
| Includes a non-recurring dividend. Without this dividend, net investment loss per share would have been $(0.16), total return would have been (24.83%) and the ratio of net investment loss to average net assets would have been (0.56%). |
| Small Cap Growth Fund – Retail Class |
| Year Ended
September 30,
2024 | Year Ended
September 30,
2023 | Year Ended
September 30,
2022 | Year Ended
September 30,
2021 | Year Ended
September 30,
2020 |
Net asset value, beginning of the period | | | | | |
INCOME (LOSS) FROM INVESTMENT OPERATIONS: | | | | | |
| | | | | |
Net realized and unrealized gain (loss) | | | | | |
Total from Investment Operations | | | | | |
| | | | | |
Net realized capital gains | | | | | |
Net asset value, end of the period | | | | | |
| | | | | |
RATIOS TO AVERAGE NET ASSETS: | | | | | |
Net assets, end of the period (000's) | | | | | |
| | | | | |
| | | | | |
| | | | | |
| | | | | |
| Per share net investment loss has been calculated using the average shares outstanding during the period. |
| Includes a non-recurring dividend. Without this dividend, net investment loss per share would have been $(0.21), total return would have been (25.01%) and the ratio of net investment loss to average net assets would have been (0.81%). |
See accompanying notes to financial statements.
Financial Highlights (continued)
For a share outstanding throughout each period.
| Small Cap Growth Fund– Class N |
| Year Ended
September 30,
2024 | Year Ended
September 30,
2023 | Year Ended
September 30,
2022 | Year Ended
September 30,
2021 | Year Ended
September 30,
2020 |
Net asset value, beginning of the period | | | | | |
INCOME (LOSS) FROM INVESTMENT OPERATIONS: | | | | | |
| | | | | |
Net realized and unrealized gain (loss) | | | | | |
Total from Investment Operations | | | | | |
| | | | | |
Net realized capital gains | | | | | |
Net asset value, end of the period | | | | | |
| | | | | |
RATIOS TO AVERAGE NET ASSETS: | | | | | |
Net assets, end of the period (000's) | | | | | |
| | | | | |
| | | | | |
| | | | | |
| | | | | |
| Per share net investment loss has been calculated using the average shares outstanding during the period. |
| Includes a non-recurring dividend. Without this dividend, net investment loss per share would have been $(0.13), total return would have been (24.71%) and the ratio of net investment loss to average net assets would have been (0.44%). |
| Small Cap Value Fund – Institutional Class |
| Year Ended
September 30,
2024 | Year Ended
September 30,
2023 | Year Ended
September 30,
2022 | Year Ended
September 30,
2021 | Year Ended
September 30,
2020 |
Net asset value, beginning of the period | | | | | |
INCOME (LOSS) FROM INVESTMENT OPERATIONS: | | | | | |
| | | | | |
Net realized and unrealized gain (loss) | | | | | |
Total from Investment Operations | | | | | |
| | | | | |
| | | | | |
Net realized capital gains | | | | | |
| | | | | |
Net asset value, end of the period | | | | | |
| | | | | |
RATIOS TO AVERAGE NET ASSETS: | | | | | |
Net assets, end of the period (000's) | | | | | |
| | | | | |
| | | | | |
| | | | | |
| | | | | |
| Per share net investment income has been calculated using the average shares outstanding during the period. |
| Had certain expenses not been waived/reimbursed during the period, total returns would have been lower. |
| The investment adviser agreed to waive its fees and/or reimburse a portion of the Fund’s expenses during the period. Without this waiver/reimbursement, expenses would have been higher. |
See accompanying notes to financial statements.
Financial Highlights (continued)
For a share outstanding throughout each period.
| Small Cap Value Fund – Retail Class |
| Year Ended
September 30,
2024 | Year Ended
September 30,
2023 | Year Ended
September 30,
2022 | Year Ended
September 30,
2021 | Year Ended
September 30,
2020 |
Net asset value, beginning of the period | | | | | |
INCOME (LOSS) FROM INVESTMENT OPERATIONS: | | | | | |
Net investment income (loss)(a) | | | | | |
Net realized and unrealized gain (loss) | | | | | |
Total from Investment Operations | | | | | |
| | | | | |
| | | | | |
Net realized capital gains | | | | | |
| | | | | |
Net asset value, end of the period | | | | | |
| | | | | |
RATIOS TO AVERAGE NET ASSETS: | | | | | |
Net assets, end of the period (000's) | | | | | |
| | | | | |
| | | | | |
Net investment income (loss) | | | | | |
| | | | | |
| Per share net investment income (loss) has been calculated using the average shares outstanding during the period. |
| Had certain expenses not been waived/reimbursed during the period, total returns would have been lower. |
| The investment adviser agreed to waive its fees and/or reimburse a portion of the Fund’s expenses during the period. Without this waiver/reimbursement, expenses would have been higher. |
| Small Cap Value Fund– Admin Class |
| Year Ended
September 30,
2024 | Year Ended
September 30,
2023 | Year Ended
September 30,
2022 | Year Ended
September 30,
2021 | Year Ended
September 30,
2020 |
Net asset value, beginning of the year | | | | | |
INCOME (LOSS) FROM INVESTMENT OPERATIONS: |
| | | | | |
Net realized and unrealized gain (loss) | | | | | |
Total from Investment Operations | | | | | |
| | | | | |
| | | | | |
Net realized capital gains | | | | | |
| | | | | |
Net asset value, end of the period | | | | | |
| | | | | |
RATIOS TO AVERAGE NET ASSETS: | | | | | |
Net assets, end of the period (000's) | | | | | |
| | | | | |
| | | | | |
| | | | | |
| | | | | |
| Per share net investment loss has been calculated using the average shares outstanding during the period. |
| Had certain expenses not been waived/reimbursed during the period, total returns would have been lower. |
| The investment adviser agreed to waive its fees and/or reimburse a portion of the Fund’s expenses during the period. Without this waiver/reimbursement, expenses would have been higher. |
See accompanying notes to financial statements.
Financial Highlights (continued)
For a share outstanding throughout each period.
| Small Cap Value Fund– Class N |
| Year Ended
September 30,
2024 | Year Ended
September 30,
2023 | Year Ended
September 30,
2022 | Year Ended
September 30,
2021 | Year Ended
September 30,
2020 |
Net asset value, beginning of the period | | | | | |
INCOME (LOSS) FROM INVESTMENT OPERATIONS: | | | | | |
| | | | | |
Net realized and unrealized gain (loss) | | | | | |
Total from Investment Operations | | | | | |
| | | | | |
| | | | | |
Net realized capital gains | | | | | |
| | | | | |
Net asset value, end of the period | | | | | |
| | | | | |
RATIOS TO AVERAGE NET ASSETS: | | | | | |
Net assets, end of the period (000's) | | | | | |
| | | | | |
| | | | | |
| | | | | |
| | | | | |
| Per share net investment income has been calculated using the average shares outstanding during the period. |
| Had certain expenses not been waived/reimbursed during the period, total returns would have been lower. |
| The investment adviser agreed to waive its fees and/or reimburse a portion of the Fund’s expenses during the period. Without this waiver/reimbursement, expenses would have been higher. |
| Small/Mid Cap Growth Fund – Institutional Class |
| Year Ended
September 30,
2024 | Year Ended
September 30,
2023 | Year Ended
September 30,
2022 | Year Ended
September 30,
2021 | Year Ended
September 30,
2020 |
Net asset value, beginning of the period | | | | | |
INCOME (LOSS) FROM INVESTMENT OPERATIONS: | | | | | |
| | | | | |
Net realized and unrealized gain (loss) | | | | | |
Total from Investment Operations | | | | | |
| | | | | |
Net realized capital gains | | | | | |
Net asset value, end of the period | | | | | |
| | | | | |
RATIOS TO AVERAGE NET ASSETS: | | | | | |
Net assets, end of the period (000's) | | | | | |
| | | | | |
| | | | | |
| | | | | |
| | | | | |
| Per share net investment loss has been calculated using the average shares outstanding during the period. |
| Includes a non-recurring dividend. Without this dividend, net investment loss per share would have been $(0.08), total return would have been 29.49% and the ratio of net investment loss to average net assets would have been (0.52%). |
| Had certain expenses not been waived/reimbursed during the period, total returns would have been lower. |
| The investment adviser agreed to waive its fees and/or reimburse a portion of the Fund’s expenses during the period. Without this waiver/reimbursement, expenses would have been higher. |
| Includes additional voluntary waiver of advisory fee of 0.01%. |
See accompanying notes to financial statements.
Financial Highlights (continued)
For a share outstanding throughout each period.
| Small/Mid Cap Growth Fund– Class N |
| Year Ended
September 30,
2024 | Year Ended
September 30,
2023 | Year Ended
September 30,
2022 | Year Ended
September 30,
2021 | Period Ended
September 30,
|
Net asset value, beginning of the period | | | | | |
INCOME (LOSS) FROM INVESTMENT OPERATIONS: | | | | | |
| | | | | |
Net realized and unrealized gain (loss) | | | | | |
Total from Investment Operations | | | | | |
| | | | | |
Net realized capital gains | | | | | |
Net asset value, end of the period | | | | | |
| | | | | |
RATIOS TO AVERAGE NET ASSETS: | | | | | |
Net assets, end of the period (000's) | | | | | |
| | | | | |
| | | | | |
| | | | | |
| | | | | |
| Class operations commenced on October 1, 2019. |
| Per share net investment loss has been calculated using the average shares outstanding during the period. |
| Includes a non-recurring dividend. Without this dividend, net investment loss per share would have been $(0.07), total return would have been 29.66% and the ratio of net investment loss to average net assets would have been (0.50%). |
| Had certain expenses not been waived/reimbursed during the period, total returns would have been lower. |
| Periods less than one year are not annualized. |
| The investment adviser agreed to waive its fees and/or reimburse a portion of the Fund’s expenses during the period. Without this waiver/reimbursement, expenses would have been higher. |
| Computed on an annualized basis for periods less than one year. |
| Represents the Fund’s portfolio turnover rate for the year ended September 30, 2020. |
See accompanying notes to financial statements.
Notes to Financial Statements
1.Organization. Loomis Sayles Funds I and Loomis Sayles Funds II (the “Trusts” and each a “Trust”) are each organized as a Massachusetts business trust. Each Trust is registered under the Investment Company Act of 1940, as amended (the “1940 Act”), as an open-end management investment company. Each Declaration of Trust permits the Board of Trustees to authorize the issuance of an unlimited number of shares of the Trust in multiple series. The financial statements for certain funds of the Trusts are presented in separate reports. The following funds (individually, a “Fund” and collectively, the “Funds”) are included in this report:
Loomis Sayles Small Cap Value Fund (“Small Cap Value Fund”)
Loomis Sayles Small Cap Growth Fund (“Small Cap Growth Fund”)
Loomis Sayles Small/Mid Cap Growth Fund (“Small/Mid Cap Growth Fund”)
Each Fund is a diversified investment company.
Small Cap Growth Fund offers Institutional Class, Retail Class and Class N shares. Small Cap Value Fund offers Institutional Class, Retail Class, Admin Class and Class N shares. Small/Mid Cap Growth Fund offers Institutional Class and Class N shares.
Each share class is sold without a sales charge. Retail Class and Admin Class shares pay a Rule 12b-1 fee. Class N shares are offered with an initial minimum investment of $1,000,000. Institutional Class shares are intended for institutional investors with a minimum initial investment of $100,000. Certain categories of investors are exempted from the minimum investment amount for Class N and Institutional Class as outlined in the relevant Fund’s prospectus. Admin Class shares are offered exclusively through intermediaries.
Most expenses can be directly attributed to a Fund. Expenses which cannot be directly attributed to a Fund are generally apportioned based on the relative net assets of each of the Funds in Natixis Funds Trust I, Natixis Funds Trust II, Natixis Funds Trust IV and Gateway Trust (“Natixis Funds Trusts”), Loomis Sayles Funds I and Loomis Sayles Funds II (“Loomis Sayles Funds Trusts”), and Natixis ETF Trust and Natixis ETF Trust II (“Natixis ETF Trusts”). Expenses of a Fund are borne pro rata by the holders of each class of shares, except that each class bears expenses unique to that class (such as the Rule 12b-1 fees applicable to Retail Class and Admin Class), and transfer agent fees are borne collectively for Institutional Class, Retail Class and Admin Class, and individually for Class N. In addition, each class votes as a class only with respect to its own Rule 12b-1 Plan. Shares of each class would receive their pro rata share of the net assets of a Fund if the Fund were liquidated. The Trustees approve separate distributions from net investment income on each class of shares.
2.Significant Accounting Policies. The following is a summary of significant accounting policies consistently followed by each Fund in the preparation of its financial statements. The Funds' financial statements follow the accounting and reporting guidelines provided for investment companies and are prepared in accordance with accounting principles generally accepted in the United States of America which require the use of management estimates that affect the reported amounts and disclosures in the financial statements. Actual results could differ from those estimates. Management has evaluated the events and transactions subsequent to year-end through the date the financial statements were issued and has determined that there were no material events that would require disclosure in the Funds' financial statements.
a. Valuation. Registered investment companies are required to value portfolio investments using an unadjusted, readily available market quotation. Each Fund obtains readily available market quotations from independent pricing services. Fund investments for which readily
available market quotations are not available are priced at fair value pursuant to the Funds’ Valuation Procedures. The Board of Trustees has approved a valuation designee who is subject to the Board’s oversight.
Unadjusted readily available market quotations that are utilized for exchange traded equity securities (including shares of closed-end investment companies and exchange-traded funds) include the last sale price quoted on the exchange where the security is traded most extensively. Shares of open-end investment companies are valued at net asset value ("NAV") per share.
Exchange traded equity securities for which there is no reported sale during the day are fair valued at the closing bid quotation as reported by an independent pricing service. Unlisted equity securities (except unlisted preferred equity securities) are fair valued at the last sale price quoted in the market where they are traded most extensively or, if there is no reported sale during the day, the closing bid quotation as reported by an independent pricing service. If there is no last sale price or closing bid quotation available, unlisted equity securities will be fair valued using evaluated bids furnished by an independent pricing service, if available.
Debt securities and unlisted preferred equity securities are fair valued based on evaluated bids furnished to the Funds by an independent pricing service or bid prices obtained from broker-dealers. Broker-dealer bid prices may be used to fair value debt and unlisted equities where an independent pricing service is unable to price an investment or where an independent pricing service does not provide a reliable price for the investment.
The Funds may also fair value investments in other circumstances such as when extraordinary events occur after the close of a foreign market, but prior to the close of the New York Stock Exchange. This may include situations relating to a single issuer (such as a declaration of bankruptcy or a delisting of the issuer’s security from the primary market on which it has traded) as well as events affecting the securities
Notes to Financial Statements (continued)
markets in general (such as market disruptions or closings and significant fluctuations in U.S. and/or foreign markets). When fair valuing a Fund’s investments, the valuation designee may, among other things, use modeling tools or other processes that may take into account factors such as issuer specific information, or other related market activity and/or information that occurred after the close of the foreign market but before the time the Fund’s NAV is calculated. Fair valuation by the Fund(s) valuation designee may require subjective determinations about the value of the investment, and fair values used to determine a Fund’s NAV may differ from quoted or published prices, or from prices that are used by others, for the same investments. In addition, the use of fair value pricing may not always result in adjustments to the prices of investments held by a Fund.
b. Investment Transactions and Related Investment Income. Investment transactions are accounted for on a trade date plus one day basis for daily NAV calculation. However, for financial reporting purposes, investment transactions are reported on trade date. Dividend income (including income reinvested) and foreign withholding tax, if applicable, is recorded on the ex-dividend date, or in the case of certain foreign securities, as soon as a Fund is notified, and interest income is recorded on an accrual basis. Interest income is increased by the accretion of discount and decreased by the amortization of premium, if applicable. Distributions received from investments in securities that represent a return of capital or capital gain are recorded as a reduction of cost of investments or as a realized gain, respectively. The calendar year-end amounts of ordinary income, capital gains and return of capital included in distributions received from the Funds’ investments in real estate investment trusts (“REITs”) are reported to the Funds after the end of the fiscal year; accordingly, the Funds estimate these amounts for accounting purposes until the characterization of REIT distributions is reported to the Funds after the end of the fiscal year. Estimates are based on the most recent REIT distribution information available. In determining net gain or loss on securities sold, the cost of securities has been determined on an identified cost basis. Investment income, non-class specific expenses and realized and unrealized gains and losses are allocated on a pro rata basis to each class based on the relative net assets of each class to the total net assets of the Fund.
c. Foreign Currency Translation. The books and records of the Funds are maintained in U.S. dollars. The values of securities, currencies and other assets and liabilities denominated in currencies other than U.S. dollars, if any, are translated into U.S. dollars based upon foreign exchange rates prevailing at the end of the period. Purchases and sales of investment securities, income and expenses are translated into U.S. dollars on the respective dates of such transactions.
Net realized foreign exchange gains or losses arise from sales of foreign currency, changes in exchange rates between the trade and settlement dates on securities transactions and the difference between the amounts of dividends, interest and foreign withholding taxes recorded in the Funds’ books and records and the U.S. dollar equivalent of the amounts actually received or paid. Net unrealized foreign exchange gains or losses arise from changes in the value of assets and liabilities, other than investment securities, as of the end of the fiscal period, resulting from changes in exchange rates.
The values of investment securities are presented at the foreign exchange rates prevailing at the end of the period for financial reporting purposes. Net realized and unrealized gains or losses on investments reported in the Statements of Operations reflect gains or losses resulting from changes in exchange rates and fluctuations which arise due to changes in market prices of investment securities.
The Funds may use foreign currency exchange contracts to facilitate transactions in foreign-denominated investments. Losses may arise from changes in the value of the foreign currency or if the counterparties do not perform under the contracts’ terms.
d. Federal and Foreign Income Taxes. The Trusts treat each Fund as a separate entity for federal income tax purposes. Each Fund intends to meet the requirements of the Internal Revenue Code of 1986, as amended, applicable to regulated investment companies, and to distribute to its shareholders substantially all of its net investment income and any net realized capital gains at least annually. Management has performed an analysis of each Fund’s tax positions for the open tax years as of September 30, 2024 and has concluded that no provisions for income tax are required. The Funds’ federal tax returns for the prior three fiscal years remain subject to examination by the Internal Revenue Service. Management is not aware of any events that are reasonably possible to occur in the next twelve months that would result in the amounts of any unrecognized tax benefits significantly increasing or decreasing for the Funds. However, management’s conclusions regarding tax positions taken may be subject to review and adjustment at a later date based on factors including, but not limited to, new tax laws and accounting regulations and interpretations thereof.
A Fund may be subject to foreign withholding taxes on investment income and taxes on capital gains on investments that are accrued and paid based upon the Fund’s understanding of the tax rules and regulations that exist in the countries in which the Fund invests. Foreign withholding taxes on dividend and interest income are reflected on the Statements of Operations as a reduction of investment income, net of amounts that have been or are expected to be reclaimed and paid. Dividends and interest receivable on the Statements of Assets and Liabilities are net of foreign withholding taxes. Foreign withholding taxes where reclaims have been or are expected to be filed and paid are reflected on the Statements of Assets and Liabilities as tax reclaims receivable. Capital gains taxes paid are included in net realized gain (loss) on investments in the Statements of Operations. Accrued but unpaid capital gains taxes are reflected as foreign taxes payable on the Statements of Assets and Liabilities, if applicable, and reduce unrealized gains on investments. In the event that realized gains on investments are subsequently offset by realized losses, taxes paid on realized gains may be returned to a Fund. Such amounts, if applicable, are reflected as foreign tax rebates receivable on the Statements of Assets and Liabilities and are recorded as a realized gain when received.
Notes to Financial Statements (continued)
e. Dividends and Distributions to Shareholders. Dividends and distributions are recorded on the ex-dividend date. The timing and characterization of certain income and capital gain distributions are determined in accordance with federal tax regulations, which may differ from accounting principles generally accepted in the United States of America. Permanent differences are primarily due to differing treatments for book and tax purposes of items such as return of capital distributions received, distribution re-designations, capital gain distributions received, deferred Trustees’ fees, passive foreign investment company adjustments and net operating losses. Permanent book and tax basis differences relating to shareholder distributions will result in reclassifications to capital accounts reported on the Statements of Assets and Liabilities. Temporary differences between book and tax distributable earnings are primarily due to deferred Trustees’ fees, return of capital distributions received, passive foreign investment company adjustments, capital gain distributions received and wash sales. Amounts of income and capital gain available to be distributed on a tax basis are determined annually, and at other times during the Funds’ fiscal year as may be necessary to avoid knowingly declaring and paying a return of capital distribution. Distributions from net investment income and short-term capital gains are reported as distributed from ordinary income for tax purposes.
The tax characterization of distributions is determined on an annual basis. The tax character of distributions paid to shareholders during the years ended September 30, 2024 and 2023 was as follows:
| | |
| | | | | | |
| | | | | | |
| | | | | | |
Small/Mid Cap Growth Fund | | | | | | |
Distributions paid to shareholders from net investment income and net realized capital gains, based on accounting principles generally accepted in the United States of America, are consolidated and reported on the Statements of Changes in Net Assets as Distributions to Shareholders. Distributions paid to shareholders from net investment income and net realized capital gains expressed in per-share amounts, based on accounting principles generally accepted in the United States of America, are separately stated and reported within the Financial Highlights.
As of September 30, 2024, the components of distributable earnings on a tax basis were as follows:
| | | |
Undistributed ordinary income | | | |
Undistributed long-term capital gains | | | |
Total undistributed earnings | | | |
Capital loss carryforward: | | | |
| | | |
| | | |
Late-year ordinary and post-October
| | | |
| | | |
Total accumulated earnings | | | |
| Under current tax law, net operating losses, capital losses, foreign currency losses, and losses on passive foreign investment companies and contingent payment debt instruments after October 31 or December 31, as applicable, may be deferred and treated as occurring on the first day of the following taxable year. Small Cap Growth Fund and Small/Mid Cap Growth Fund are deferring net operating losses. |
As of September 30, 2024, the tax cost of investments and unrealized appreciation (depreciation) on a federal tax basis were as follows:
Notes to Financial Statements (continued)
f. Repurchase Agreements. Each Fund may enter into repurchase agreements, under the terms of a Master Repurchase Agreement, under which each Fund acquires securities as collateral and agrees to resell the securities at an agreed upon time and at an agreed upon price. It is each Fund’s policy that the market value of the collateral for repurchase agreements be at least equal to 102% of the repurchase price, including interest. Certain repurchase agreements are tri-party arrangements whereby the collateral is held in a segregated account for the benefit of the Fund and on behalf of the counterparty. Repurchase agreements could involve certain risks in the event of default or insolvency of the counterparty, including possible delays or restrictions upon a Fund’s ability to dispose of the underlying securities. As of September 30, 2024, each Fund, as applicable, had investments in repurchase agreements for which the value of the related collateral exceeded the value of the repurchase agreement. The gross value of repurchase agreements is included in the Statements of Assets and Liabilities for financial reporting purposes.
g. Indemnifications. Under the Trusts’ organizational documents, their officers and Trustees are indemnified against certain liabilities arising out of the performance of their duties to the Funds. Additionally, in the normal course of business, the Funds enter into contracts with service providers that contain general indemnification clauses. The Funds' maximum exposure under these arrangements is unknown as this would involve future claims that may be made against the Funds that have not yet occurred. However, based on experience, the Funds expect the risk of loss to be remote.
3.Fair Value Measurements. In accordance with accounting standards related to fair value measurements and disclosures, the Funds have categorized the inputs utilized in determining the value of each Fund’s assets or liabilities. These inputs are summarized in the three broad levels listed below:
• Level 1 — quoted prices in active markets for identical assets or liabilities;
• Level 2 — prices determined using other significant inputs that are observable either directly, or indirectly through corroboration with observable market data (which could include quoted prices for similar assets or liabilities, interest rates, credit risk, etc.); and
• Level 3 — prices determined using significant unobservable inputs when quoted prices or observable inputs are unavailable such as when there is little or no market activity for an asset or liability (unobservable inputs reflect each Fund’s own assumptions in determining the fair value of assets or liabilities and would be based on the best information available).
The inputs or methodology used for valuing securities are not necessarily an indication of the risk associated with investing in those securities.
The Funds' pricing policies have been approved by the Board of Trustees. Investments for which market quotations are readily available are categorized in Level 1. Other investments for which an independent pricing service is utilized are categorized in Level 2. Broker-dealer bid prices for which the Funds have knowledge of the inputs used by the broker-dealer are categorized in Level 2. All other investments, including broker-dealer bid prices for which the Funds do not have knowledge of the inputs used by the broker-dealer, as well as investments fair valued by the valuation designee, are categorized in Level 3. All Level 2 and 3 securities are defined as being fair valued.
Under certain conditions and based upon specific facts and circumstances, the Fund’s valuation designee may determine that a fair valuation should be made for portfolio investment(s). These valuation designee fair valuations will be based upon a significant amount of Level 3 inputs.
The following is a summary of the inputs used to value the Funds' investments as of September 30, 2024, at value:
| Details of the major categories of the Fund’s investments are reflected within the Portfolio of Investments. |
Notes to Financial Statements (continued)
| Details of the major categories of the Fund’s investments are reflected within the Portfolio of Investments. |
Small/Mid Cap Growth Fund |
|
| | | | |
| | | | |
| | | | |
| | | | |
| Details of the major categories of the Fund’s investments are reflected within the Portfolio of Investments. |
4.Purchases and Sales of Securities. For the year ended September 30, 2024, purchases and sales of securities (excluding short-term investments) were as follows:
| | |
| | |
| | |
Small/Mid Cap Growth Fund | | |
5.Management Fees and Other Transactions with Affiliates.
a. Management Fees. Loomis, Sayles & Company, L.P. (“Loomis Sayles”) serves as investment adviser to each Fund. Loomis Sayles is a limited partnership whose sole general partner, Loomis, Sayles & Company, Inc., is indirectly owned by Natixis Investment Managers, LLC, which is part of Natixis Investment Managers, an international asset management group based in Paris, France.
Under the terms of the management agreements, each Fund pays a management fee at the following annual rates, calculated daily and payable monthly, based on each Fund’s average daily net assets:
| Percentage of
Average Daily
Net Assets |
| |
| |
Small/Mid Cap Growth Fund | |
Loomis Sayles has given binding undertakings to the Funds to waive management fees and/or reimburse certain expenses to limit the Funds’ operating expenses, exclusive of acquired fund fees and expenses, brokerage expenses, interest expense, taxes, organizational and extraordinary expenses such as litigation and indemnification expenses. These undertakings are in effect until January 31, 2025, may be terminated before then only with the consent of the Funds’ Board of Trustees and are reevaluated on an annual basis. Management fees payable, as reflected on the Statements of Assets and Liabilities, is net of waivers and/or expense reimbursements, if any, pursuant to these undertakings. Waivers/reimbursements that exceed management fees payable are reflected on the Statements of Assets and Liabilities as receivable from investment adviser.
Notes to Financial Statements (continued)
For the year ended September 30, 2024 the expense limits as a percentage of average daily net assets under the expense limitation agreements were as follows:
| Expense Limit as a Percentage of
Average Daily Net Assets |
| | | | |
| | | | |
| | | | |
Small/Mid Cap Growth Fund | | | | |
Loomis Sayles shall be permitted to recover expenses borne under the expense limitation agreements (whether through waiver of management fees or otherwise) on a class by class basis in later periods to the extent the annual operating expenses of a class fall below both (1) a class’ expense limitation ratio in place at the time such amounts were waived/reimbursed and (2) a class’ current applicable expense limitation ratio, provided, however, that a class is not obligated to pay such waived/reimbursed fees or expenses more than one year after the end of the fiscal year in which the fees or expenses were waived/reimbursed.
For the year ended September 30, 2024, the management fees for each Fund were as follows:
| | Contractual
Waivers of
Management
| | Percentage of
Average
Daily Net Assets |
| | |
| | | | | |
| | | | | |
Small/Mid Cap Growth Fund | | | | | |
| Waiver/expense reimbursements are subject to possible recovery until September 30, 2025. |
b. Service and Distribution Fees. Natixis Distribution, LLC (“Natixis Distribution”), which is a wholly-owned subsidiary of Natixis Investment Managers, LLC, has entered into a distribution agreement with the Trusts. Pursuant to this agreement, Natixis Distribution serves as principal underwriter of the Funds of the Trusts.
Pursuant to Rule 12b-1 under the 1940 Act, Small Cap Growth Fund and Small Cap Value Fund have adopted a Distribution Plan relating to each Fund’s Retail Class shares (the “Retail Class Plans”) and Small Cap Value Fund has adopted a Distribution Plan relating to its Admin Class shares (the “Admin Class Plan”).
Under the Retail Class Plans, each Fund pays Natixis Distribution a monthly distribution fee at an annual rate not to exceed 0.25% of the average daily net assets attributable to the Fund’s Retail Class shares, as compensation for services provided by Natixis Distribution in connection with the marketing or sale of Retail Class shares or for payments made by Natixis Distribution to securities dealers or other financial intermediaries as commissions, asset-based sales charges or other compensation with respect to the sale of Retail Class shares, or for providing personal services to investors and/or the maintenance of shareholder accounts.
Under the Admin Class Plan, Small Cap Value Fund pays Natixis Distribution a monthly distribution fee at an annual rate not to exceed 0.25% of the average daily net assets attributable to the Fund’s Admin Class shares, as compensation for services provided by Natixis Distribution in connection with the marketing or sale of Admin Class shares or for payments made by Natixis Distribution to securities dealers or other financial intermediaries as commissions, asset-based sales charges or other compensation with respect to the sale of Admin Class shares, or for providing personal services to investors and/or the maintenance of shareholder accounts.
In addition, the Admin Class shares of Small Cap Value Fund may pay Natixis Distribution an administrative service fee, at an annual rate not to exceed 0.25% of the average daily net assets attributable to Admin Class shares. These fees are subsequently paid to securities dealers or financial intermediaries for providing personal services and/or account maintenance for their customers who hold such shares.
For the year ended September 30, 2024, the service and distribution fees for each Fund were as follows:
Notes to Financial Statements (continued)
c. Administrative Fees. Natixis Advisors, LLC (“Natixis Advisors”) provides certain administrative services for the Funds and contracts with State Street Bank and Trust Company (“State Street Bank”) to serve as sub-administrator. Natixis Advisors is a wholly-owned subsidiary of
Natixis Investment Managers, LLC. Pursuant to an agreement among Natixis Funds Trusts, Loomis Sayles Funds Trusts, Natixis ETF Trusts and Natixis Advisors, each Fund pays Natixis Advisors monthly its pro rata portion of fees equal to an annual rate of 0.0540% of the first $15 billion of the average daily net assets of the Natixis Funds Trusts, Loomis Sayles Funds Trusts and Natixis ETF Trusts, 0.0500% of the next $15 billion, 0.0400% of the next $30 billion, 0.0275% of the next $30 billion and 0.0225% of such assets in excess of $90 billion, subject to an annual aggregate minimum fee for the Natixis Funds Trusts, Loomis Sayles Funds Trusts and Natixis ETF Trusts of $10 million, which is reevaluated on an annual basis.
For the year ended September 30, 2024, the administrative fees for each Fund were as follows:
| |
| |
| |
Small/Mid Cap Growth Fund | |
d. Sub-Transfer Agent Fees. Natixis Distribution has entered into agreements, which include servicing agreements, with financial intermediaries that provide recordkeeping, processing, shareholder communications and other services to customers of the intermediaries that hold positions in the Funds and has agreed to compensate the intermediaries for providing those services. Intermediaries transact with the Funds primarily through the use of omnibus accounts on behalf of their customers who hold positions in the Funds. These services would have been provided by the Funds’ transfer agent and other service providers if the shareholders’ accounts were maintained directly at the Funds’ transfer agent. Accordingly, the Funds have agreed to reimburse Natixis Distribution for all or a portion of the servicing fees paid to these intermediaries. The reimbursement amounts (sub-transfer agent fees) paid to Natixis Distribution are subject to a current per-account equivalent fee limit approved by the Funds’ Board of Trustees, which is based on fees for similar services paid to the Funds’ transfer agent and other service providers. Class N shares do not bear such expenses.
For the year ended September 30, 2024, the sub-transfer agent fees (which are reflected in transfer agent fees and expenses in the Statements of Operations) for each Fund were as follows:
| |
| |
| |
Small/Mid Cap Growth Fund | |
As of September 30, 2024, the Funds owe Natixis Distribution the following reimbursements for sub-transfer agent fees (which are reflected in the Statements of Assets and Liabilities as payable to distributor):
| Reimbursements
of Sub-Transfer
Agent Fees |
| |
| |
Small/Mid Cap Growth Fund | |
Sub-transfer agent fees attributable to Institutional Class, Retail Class and Admin Class are allocated on a pro rata basis to each class based on the relative net assets of each class to the total net assets of those classes.
e. Trustees Fees and Expenses. The Trusts do not pay any compensation directly to their officers or Trustees who are directors, officers or employees of Natixis Advisors, Natixis Distribution, Natixis Investment Managers, LLC or their affiliates. The Chairperson of the Board of Trustees receives a retainer fee at the annual rate of $400,000. The Chairperson does not receive any meeting attendance fees for Board of Trustees meetings or committee meetings that he attends. Each Independent Trustee (other than the Chairperson) receives, in the aggregate, a retainer fee at the annual rate of $225,000. Each Independent Trustee also receives a meeting attendance fee of $10,000 for each meeting of the Board of Trustees that he or she attends in person and $5,000 for each meeting of the Board of Trustees that he or she attends telephonically. In addition, the Chairperson of the Contract Review Committee and the Chairperson of the Audit Committee each receive an additional retainer fee at the annual rate of $25,000. The Chairperson of the Governance Committee receives an additional retainer fee at the annual rate of $20,000. Each Contract Review Committee member is compensated $6,000 for each Committee meeting that he or she
Notes to Financial Statements (continued)
attends in person and $3,000 for each meeting that he or she attends telephonically. Each Audit Committee member is compensated $6,000 for each Committee meeting that he or she attends in person and $3,000 for each meeting that he or she attends telephonically. Each Governance Committee member is compensated $2,500 for each Committee meeting that he or she attends. These fees are allocated among the funds in the Natixis Funds Trusts, Loomis Sayles Funds Trusts and Natixis ETF Trusts based on a formula that takes into account, among other factors, the relative net assets of each fund. Trustees are reimbursed for travel expenses in connection with attendance at meetings.
Prior to January 1, 2024, the Chairperson of the Board of Trustees received a retainer fee at the annual rate of $369,000 and each Independent Trustee (other than the Chairperson) received, in the aggregate, a retainer fee at the annual rate of $210,000. Each Independent Trustee received a meeting attendance fee of $10,000 for each meeting of the Board of Trustees that he or she attended in person. The Chairperson of the Contract Review Committee and the Chairperson of the Audit Committee each received an additional retainer fee at the annual rate of $20,000. All other Trustees fees remained unchanged.
A deferred compensation plan (the “Plan”) is available to the Trustees on a voluntary basis. The value of a participating Trustee’s deferral account is based on theoretical investments of deferred amounts, on the normal payment dates, in certain funds of the Natixis Funds Trusts, Loomis Sayles Funds Trusts and Natixis ETF Trusts as designated by the participating Trustees. Changes in the value of participants’ deferral accounts are allocated pro rata among the funds in the Natixis Funds Trusts, Loomis Sayles Funds Trusts and Natixis ETF Trusts and are normally reflected as Trustees’ fees and expenses in the Statements of Operations. Deferred amounts remain in the funds until distributed in accordance with the provisions of the Plan. The portions of the accrued obligations allocated to the Funds under the Plan are reflected as Deferred Trustees’ fees in the Statements of Assets and Liabilities.
Certain officers and employees of Natixis Advisors and Loomis Sayles are also officers and/or Trustees of the Trusts.
f. Affiliated Ownership. As of September 30, 2024, Loomis Sayles Funded Pension Plan and Trust (“Pension Plan”), Loomis Sayles Employees’ Profit Sharing Retirement Plan (“Retirement Plan”) and Loomis Sayles non-qualified retirement plans held shares of the Funds representing the following percentages of the Funds’ net assets:
| | | Non-Qualified
Retirement Plans | Total Affiliated
Ownership |
| | | | |
| | | | |
Investment activities of affiliated shareholders could have material impacts on the Funds.
g. Reimbursement of Transfer Agent Fees and Expenses. Natixis Advisors has given a binding contractual undertaking to Small/Mid Cap Growth Fund to reimburse any and all transfer agency expenses for the Fund’s Class N shares. This undertaking is in effect through January 31, 2025 and is not subject to recovery under the expense limitation agreement described above.
For the year ended September 30, 2024, Natixis Advisors reimbursed Small/Mid Cap Growth Fund $1,806 for transfer agency expenses related to Class N shares.
6.Class-Specific Transfer Agent Fees and Expenses. Transfer agent fees and expenses attributable to Institutional Class, Retail Class and Admin Class are allocated on a pro rata basis to each class based on the relative net assets of each class to the total net assets of those classes. Transfer agent fees and expenses attributable to Class N are allocated to Class N.
For the year ended September 30, 2024 the Funds incurred the following class-specific transfer agent fees and expenses (net of expense offsets and including sub-transfer agent fees, where applicable):
| Transfer Agent Fees and Expenses |
| | | | |
| | | | |
| | | | |
Small/Mid Cap Growth Fund | | | | |
7.Expense Offset Arrangements. The Funds have entered into an agreement with the transfer agent whereby certain transfer agent fees and expenses may be paid indirectly by credits earned on the Funds' cash balances. Transfer agent fees and expenses are presented in the Statements of Operations gross of such credits, and the credits are presented as offsets to expenses.
8.Line of Credit. Each Fund, together with certain other funds of Natixis Funds Trusts, Loomis Sayles Funds Trusts and Natixis ETF Trusts, entered into a syndicated, revolving, committed, unsecured line of credit with State Street Bank as administrative agent. The aggregate revolving commitment amount is $575,000,000. Any one Fund may borrow up to $402,500,000 under the line of credit agreement (as long
Notes to Financial Statements (continued)
as all borrowings by all Funds in the aggregate do not exceed the $575,000,000 limit at any time), subject to each Fund’s investment restrictions and its contractual obligations under the line of credit. Interest is charged to the Funds based upon the terms set forth in the agreement. In addition, a commitment fee of 0.15% per annum, payable at the end of each calendar quarter, is accrued and apportioned among the participating funds based on their average daily unused portion of the line of credit.
For the year ended September 30, 2024, Small Cap Value Fund had an average daily balance on the line of credit (for those days on which there were borrowings) of $2,500,000 at a weighted average interest rate of 6.43%. Interest expense incurred on the line of credit was $447.
For the year ended September 30, 2024, Small/Mid Cap Growth Fund had an average daily balance on the line of credit (for those days on which there were borrowings) of $7,600,000 at a weighted average interest rate of 6.43%. Interest expense incurred on the line of credit was $1,357.
9.Risk. Geopolitical events (such as trading halts, sanctions or wars) could increase volatility and uncertainty in the financial markets and adversely affect regional and global economies. These, and other related events, could significantly impact a Fund's performance and the value of an investment in the Fund, even if the Fund does not have direct exposure to issuers in the country or countries involved.
10.Concentration of Ownership. From time to time, a Fund may have a concentration of one or more accounts constituting a significant percentage of shares outstanding. Investment activities by holders of such accounts could have material impacts on the Funds. As of September 30, 2024, based on management’s evaluation of the shareholder account base, the Funds had accounts representing controlling ownership of more than 5% of the Funds’ total outstanding shares. The number of such accounts, based on accounts that represent more than 5% of an individual class of shares, and the aggregate percentage of net assets represented by such holdings were as follows:
| Number of 5%
Non-Affiliated
Account Holders | Percentage of
Non-Affiliated
Ownership | Percentage of
Affiliated
Ownership
(Note 5f) | Total
Percentage of
Ownership |
| | | | |
Small/Mid Cap Growth Fund | | | | |
Omnibus shareholder accounts for which Natixis Advisors understands that the intermediary has discretion over the underlying shareholder accounts or investment models where a shareholder account may be invested for a non-discretionary customer are included in the table above. For other omnibus accounts, the Funds do not have information on the individual shareholder accounts underlying the omnibus accounts; therefore, there could be other 5% shareholders in addition to those disclosed in the table above.
11.Capital Shares. Each Fund may issue an unlimited number of shares of beneficial interest, without par value. Transactions in capital shares were as follows:
|
| Year Ended
September 30, 2024 | Year Ended
September 30, 2023 |
| | | | |
| | | | |
Issued from the sale of shares | | | | |
Issued in connection with the reinvestment of distributions | | | | |
| | | | |
| | | | |
| | | | |
Issued from the sale of shares | | | | |
Issued in connection with the reinvestment of distributions | | | | |
| | | | |
| | | | |
| | | | |
Issued from the sale of shares | | | | |
Issued in connection with the reinvestment of distributions | | | | |
| | | | |
| | | | |
Increase (decrease) from capital share transactions | | | | |
Notes to Financial Statements (continued)
11.Capital Shares (continued).
|
| Year Ended
September 30, 2024 | Year Ended
September 30, 2023 |
| | | | |
| | | | |
Issued from the sale of shares | | | | |
Issued in connection with the reinvestment of distributions | | | | |
| | | | |
| | | | |
| | | | |
Issued from the sale of shares | | | | |
Issued in connection with the reinvestment of distributions | | | | |
| | | | |
| | | | |
| | | | |
Issued from the sale of shares | | | | |
Issued in connection with the reinvestment of distributions | | | | |
| | | | |
| | | | |
| | | | |
Issued from the sale of shares | | | | |
Issued in connection with the reinvestment of distributions | | | | |
| | | | |
| | | | |
Increase (decrease) from capital share transactions | | | | |
|
| Year Ended
September 30, 2024 | Year Ended
September 30, 2023 |
Small/Mid Cap Growth Fund | | | | |
| | | | |
Issued from the sale of shares | | | | |
| | | | |
| | | | |
| | | | |
Issued from the sale of shares | | | | |
| | | | |
Redeemed in-kind (Note 12) | | | | |
| | | | |
Increase (decrease) from capital share transactions | | | | |
12.Redemption In-Kind. In certain circumstances, a Fund may distribute portfolio securities rather than cash as payment for redemption of Fund shares (redemption in-kind). For financial reporting purposes, the Fund will recognize a gain on in-kind redemptions to the extent the value of the distributed securities on the date of redemption exceeds the cost of those securities; the Fund will recognize a loss if the cost exceeds value. Gains and losses realized on redemptions in-kind are not recognized for tax purposes, and are re-classified from realized gain (loss) to paid-in-capital. For the year ended September 30, 2023, Small/Mid Cap Growth Fund participated in a redemption in-kind transaction.
Report of Independent Registered Public Accounting Firm
To the Board of Trustees of Loomis Sayles Funds I and Loomis Sayles Funds II and Shareholders of Loomis Sayles Small Cap Value Fund, Loomis Sayles Small Cap Growth Fund and Loomis Sayles Small/Mid Cap Growth Fund:
Opinions on the Financial Statements
We have audited the accompanying statements of assets and liabilities, including the portfolios of investments, of Loomis Sayles Small Cap Value Fund (one of the funds constituting Loomis Sayles Funds I), and Loomis Sayles Small Cap Growth Fund and Loomis Sayles Small/Mid Cap Growth Fund (two of the funds constituting Loomis Sayles Funds II) (hereafter collectively referred to as the "Funds") as of September 30, 2024, the related statements of operations for the year ended September 30, 2024, the statements of changes in net assets for each of the two years in the period ended September 30, 2024, including the related notes, and each of the financial highlights for each of the periods indicated therein (collectively referred to as the “financial statements”). In our opinion, the financial statements present fairly, in all material respects, the financial position of each of the Funds as of September 30, 2024, the results of each of their operations for the year then ended, the changes in each of their net assets for each of the two years in the period ended September 30, 2024 and each of the financial highlights for each of the periods indicated therein in conformity with accounting principles generally accepted in the United States of America.
These financial statements are the responsibility of the Funds’ management. Our responsibility is to express an opinion on the Funds’ financial statements based on our audits. We are a public accounting firm registered with the Public Company Accounting Oversight Board (United States) (PCAOB) and are required to be independent with respect to the Funds in accordance with the U.S. federal securities laws and the applicable rules and regulations of the Securities and Exchange Commission and the PCAOB.
We conducted our audits of these financial statements in accordance with the standards of the PCAOB. Those standards require that we plan and perform the audit to obtain reasonable assurance about whether the financial statements are free of material misstatement, whether due to error or fraud.
Our audits included performing procedures to assess the risks of material misstatement of the financial statements, whether due to error or fraud, and performing procedures that respond to those risks. Such procedures included examining, on a test basis, evidence regarding the amounts and disclosures in the financial statements. Our audits also included evaluating the accounting principles used and significant estimates made by management, as well as evaluating the overall presentation of the financial statements. Our procedures included confirmation of securities owned as of September 30, 2024 by correspondence with the custodian, and brokers; when replies were not received from brokers, we performed other auditing procedures. We believe that our audits provide a reasonable basis for our opinions.
/s/PricewaterhouseCoopers LLP
Boston, Massachusetts
November 22, 2024
We have served as the auditor of one or more investment companies in the Natixis Investment Company Complex since at least 1995. We have not determined the specific year we began serving as auditor.
2024 U.S. Tax Distribution Information to Shareholders (Unaudited)
Corporate Dividends Received Deduction. For the fiscal year ended September 30, 2024, a percentage of dividends distributed by the Fund listed below qualifies for the dividends received deduction for corporate shareholders. This percentage is as follows:
Qualified Dividend Income. For the fiscal year ended September 30, 2024, the Funds below will designate up to the maximum amount allowable pursuant to the Internal Revenue Code as qualified dividend income eligible for reduced tax rates. These lower rates range from 0% to 20% depending on an individual’s tax bracket. If the Funds pay a distribution during calendar year 2024, complete information will be reported in conjunction with Form 1099-DIV.
Fund
Small Cap Value Fund
Capital Gains Distributions. Pursuant to Internal Revenue Section 852(b), the following Funds paid distributions, which have been designated as capital gains distributions for the fiscal year ended September 30, 2024, unless subsequently determined to be different.
BOARD APPROVAL OF THE EXISTING ADVISORY AGREEMENTS
The Board of Trustees of the Trusts (the “Board”), including the Independent Trustees, considers matters bearing on each Fund’s advisory agreement (collectively, the “Agreements”) at most of its meetings throughout the year. Each year, usually in the spring, the Contract Review Committee of the Board meets to review the Agreements to determine whether to recommend that the full Board approve the continuation of the Agreements, typically for an additional one-year period. This meeting typically includes all the Independent Trustees, including the Trustees who do not serve on the Contract Review Committee. After the Contract Review Committee has made its recommendation, the full Board, including the Independent Trustees, determines whether to approve the continuation of the Agreements at its June Board meeting.
In connection with these meetings, the Trustees receive materials that the Funds’ investment adviser (the “Adviser”) believes to be reasonably necessary for the Trustees to evaluate the Agreements. These materials generally include, among other items, (i) information on the investment performance of the Funds and the performance of peer groups of funds and the Funds’ performance benchmarks, (ii) information on the Funds’ advisory fees and other expenses, including information comparing the Funds’ advisory fees to the fees charged to institutional accounts with similar strategies managed by the Adviser, if any, and to those of peer groups of funds and information about any applicable expense limitations and/or fee “breakpoints,” (iii) sales and redemption data in respect of the Funds, (iv) information about the profitability of the Agreements to the Adviser, including how profitability is determined for the Funds, and (v) information obtained through the completion by the Adviser of questionnaires distributed on behalf of the Trustees throughout the year. The Board, including the Independent Trustees, also considers other matters such as (i) each Fund’s investment objective and strategies and the size, education and experience of the Adviser’s investment staff and its use of technology, external research and trading cost measurement tools, (ii) arrangements in respect of the distribution of the Funds’ shares and the related costs, (iii) the allocation of the Funds’ brokerage, if any, including, to the extent applicable, allocations to brokers affiliated with the Adviser and the use of “soft” commission dollars to pay for research and other similar services, (iv) the Adviser’s policies and procedures relating to, among other things, compliance, trading and best execution, proxy voting, liquidity and valuation, (v) information about amounts invested by the Funds’ portfolio managers in the Funds or in similar accounts that they manage and (vi) the general economic outlook with particular emphasis on the mutual fund industry. Throughout the process, the Trustees are afforded the opportunity to ask questions of and request additional materials from the Adviser and the Independent Trustees meet separately with independent legal counsel outside the presence of Adviser personnel.
In addition to the materials requested by the Trustees in connection with their annual consideration of the continuation of the Agreements, the Trustees receive materials in advance of each regular quarterly meeting of the Board that provide detailed information about the Funds’ investment performance and the fees charged to the Funds for advisory and other services. The information received by the Trustees generally includes, where available, among other things, an internal performance rating for each Fund based on agreed-upon criteria, graphs showing each Fund’s performance and expense differentials against each Fund’s peer group/category of funds, total return information for various periods, performance rankings provided by a third-party data provider for various periods comparing a Fund against similarly categorized funds, and performance ratings provided by a different third-party rating organization. The portfolio management team for each Fund or other representatives of the Adviser make periodic presentations to the Contract Review Committee and/or the full Board, and Funds identified as presenting possible performance concerns may be subject to more frequent Board or Committee presentations and reviews. In addition, the Trustees are periodically provided with detailed statistical information about each Fund’s portfolio. The Trustees also receive periodic updates between meetings, both at the Board and at the Committee level.
The Board most recently approved the continuation of the Agreements for a one-year period at its meeting held in June 2024. In considering whether to approve the continuation of the Agreements, the Board, including the Independent Trustees, did not identify any single factor as determinative. Individual Trustees may have evaluated the information presented differently from one another, giving different weights to various factors. Matters considered by the Trustees, including the Independent Trustees, in connection with their approval of the Agreements included, but were not limited to, the factors listed below.
The nature, extent and quality of the services provided to the Funds under the Agreements. The Trustees considered the nature, extent and quality of the services provided by the Adviser and its affiliates to the Funds and the resources dedicated to the Funds by the Adviser and its affiliates. The Trustees also considered their experience with other funds advised or sub-advised by the Adviser as well as the affiliation between the Adviser and Natixis Investment Managers, LLC, whose affiliates provide investment advisory services to other funds in the Natixis family of funds.
The Trustees considered not only the advisory services provided by the Adviser to the Funds, but also the benefits to the Funds from the monitoring and oversight services provided by Natixis Advisors, LLC (“Natixis Advisors”). They also considered the administrative and shareholder services provided by Natixis Advisors and its affiliates to the Funds. They also took into consideration increases in the services provided resulting from new regulatory requirements, such as recent rules relating to the fair valuation of investments and the use of derivatives, implementation of tailored shareholder reports and amendments to the Names Rule, as well as from monitoring proposed rules, such as those relating to cybersecurity, environmental, social, and governance-specific regulatory changes, and vendor oversight.
For each Fund, the Trustees also considered the benefits to shareholders of investing in a mutual fund that is part of a family of funds that offers shareholders the right to exchange shares of one type of fund for shares of another type of fund, and provides a variety of fund and shareholder services.
After reviewing these and related factors, the Trustees concluded, within the context of their overall conclusions regarding each of the Agreements, that the nature, extent and quality of services provided supported the renewal of the Agreements.
Investment performance of the Funds and the Adviser. As noted above, the Trustees received information about the performance of the Funds over various time periods, including information that compared the performance of the Funds to the performance of peer groups and categories of funds and the Funds’ respective performance benchmarks. The Board noted that while it found the data provided by the independent third-party data provider useful, it recognized its limitations, including, in particular, that notable differences may exist between the Funds and the performance comparisons (for example, with respect to investment strategies) and that the results of the performance comparisons may vary depending on (i) the end dates for the performance periods that were selected and (ii) the selection of the performance comparisons. The Trustees also received information about how comparative peer groups are constructed. In addition, the Trustees reviewed data prepared by an independent third-party rating organization that analyzed the performance of the Funds using a variety of performance metrics, including metrics that measured the performance of the Funds on a risk adjusted basis.
The Board noted that, through December 31, 2023, each Fund’s one-, three- and five-year performance, stated as percentile rankings within categories selected by the independent third-party data provider was as follows (where the best performance would be in the first percentile of its category):
| | | |
Loomis Sayles Small Cap Growth Fund | | | |
Loomis Sayles Small Cap Value Fund | | | |
Loomis Sayles Small/Mid Cap Growth Fund | | | |
In the case of each Fund that had performance that lagged that of a relevant category median as determined by the independent third-party data provider for certain periods, the Board concluded that other factors relevant to performance supported renewal of the Agreements. These factors included one or more of the following: (1) that the underperformance was attributable, to a significant extent, to investment decisions (such as security selection or sector allocation) by the Adviser that were reasonable and consistent with the Fund’s investment objective and policies; (2) that the Fund’s longer-term (three-year) performance was stronger relative to its category; (3) that the Fund’s long-term (ten-year) performance was stronger relative to its category; and (4) that the Fund’s performance for one or more recent (though not necessarily the most recent) calendar years was stronger relative to its category. The Board also considered information about the Funds’ more recent performance, including how performance over various periods had been impacted by various factors such as market and economic events.
The Trustees also considered the Adviser’s performance and reputation generally, the performance of the fund family generally, and the historical responsiveness of the Adviser to Trustee concerns about performance and the willingness of the Adviser to take steps intended to improve performance.
After reviewing these and related factors, the Trustees concluded, within the context of their overall conclusions regarding each of the Agreements, that the performance of the Funds and the Adviser and/or other relevant factors supported the renewal of the Agreements.
The costs of the services to be provided and profits to be realized by the Adviser and its affiliates from their respective relationships with the Funds. The Trustees considered the fees charged to the Funds for advisory and administrative services as well as the total expense levels of the Funds. This information included comparisons (provided both by management and by an independent third party) of the Funds’ advisory fees and total expense levels to those of their peer groups and information about the advisory fees charged by the Adviser to comparable accounts (such as institutional separate accounts), as well as information about differences in such fees and the reasons for any such differences. In considering the fees charged to comparable accounts, the Trustees considered, among other things, management’s representations about the differences between managing mutual funds as compared to other types of accounts, including the additional resources required to effectively manage mutual fund assets, the greater regulatory costs associated with the management of such assets, and the entrepreneurial, regulatory and other risks associated with sponsoring and managing mutual funds. In evaluating each Fund’s advisory fee, the Trustees also took into account the demands, complexity and quality of the investment management of such Fund and the need for the Adviser to offer competitive compensation and the potential need to expend additional resources to the extent the Fund grows in size. The Trustees considered that over the past several years, management had demonstrated its intention to have competitive fee levels by making recommendations regarding reductions in advisory fee rates, implementation of advisory fee breakpoints and the institution of advisory fee waivers and expense limitations for various funds in the fund family. They noted that all of the Funds have expense limitations in place, and they considered the amounts waived or reimbursed by the Adviser for certain Funds under their respective expense limitation agreements. The Trustees also considered that Loomis Sayles Small Cap Growth Fund’s current expenses are below its expense limitation. The Trustees also noted that the Funds had total advisory fee rates that were at or below the medians of their respective peer groups of funds. The Board also considered that the fee and expense information reflected information as of a certain date and that historical asset levels may differ from current asset levels, particularly in a period of market volatility.
The Trustees also considered the compensation directly or indirectly received by the Adviser and its affiliates from their relationships with the Funds. The Trustees reviewed information provided by management as to the profitability of the Adviser’s and its affiliates’ relationships with
the Funds, and information about how expenses are determined and allocated for purposes of profitability calculations. They also reviewed information provided by management about the effect of distribution costs and changes in asset levels on Adviser profitability, including information regarding resources spent on distribution activities. When reviewing profitability, the Trustees also considered information about court cases in which adviser compensation or profitability were issues, the performance of the Funds, the expense levels of the Funds, whether the Adviser had implemented breakpoints and/or expense limitations with respect to such Funds and the overall profit margin of Natixis Investment Managers, LLC compared to that of certain other investment managers for which such data was available. The Board also noted the competitive nature of the global asset management industry.
After reviewing these and related factors, the Trustees concluded, within the context of their overall conclusions regarding each of the Agreements, that the advisory fee charged to each of the Funds was fair and reasonable, and that the costs of these services generally and the related profitability of the Adviser and its affiliates in respect of their relationships with the Funds supported the renewal of the Agreements.
Economies of Scale. The Trustees considered the existence of any economies of scale in the provision of services by the Adviser and whether those economies are shared with the Funds through breakpoints in their investment advisory fees or other means, such as expense limitations. The Trustees also considered management’s explanation of the factors that are taken into account with respect to the implementation of breakpoints in investment advisory fees or expense limitations, which reduced the total expenses borne by shareholders of certain Funds. With respect to economies of scale, the Trustees noted that although none of the Funds’ advisory fees were subject to breakpoints, each of the Funds was subject to an expense limitation. In considering these issues, the Trustees also took note of the costs of the services provided (both on an absolute and on a relative basis) and the profitability to the Adviser and its affiliates of their relationships with the Funds, as discussed above. The Trustees also considered that the Funds have benefitted from the substantial reinvestment the Adviser has made into its business.
After reviewing these and related factors, the Trustees concluded, within the context of their overall conclusions regarding each of the Agreements, that the extent to which economies of scale were shared with the Funds supported the renewal of the Agreements.
The Trustees also considered other factors, which included but were not limited to the following:
• The effect of various factors and recent market and economic events, such as recent market volatility, geopolitical instability, aggressive domestic and foreign bank policies, and adverse developments affecting the financial services industry generally, as applicable, on the performance, asset levels and expense ratios of each Fund.
• Whether each Fund has operated in accordance with its investment objective and the Fund’s record of compliance with its investment restrictions, and the compliance programs of the Funds and the Adviser. They also considered the compliance-related resources the Adviser and its affiliates were providing to the Funds.
• So-called “fallout benefits” to the Adviser, such as the engagement of affiliates of the Adviser to provide distribution and administrative services to the Funds, and the benefits of research made available to the Adviser by reason of brokerage commissions (if any) generated by the Funds’ securities transactions. The Trustees considered the possible conflicts of interest associated with these fallout and other benefits, and the reporting, disclosure and other processes in place to disclose and monitor such possible conflicts of interest.
• The Trustees’ review and discussion of the Funds’ advisory arrangements in prior years, and management’s record of responding to Trustee concerns raised during the year and in prior years.
Based on their evaluation of all factors that they deemed to be material, including those factors described above, and assisted by the advice of independent counsel, the Trustees, including the Independent Trustees, concluded that each of the existing Agreements should be continued through June 30, 2025.
Loomis Sayles Funds, a Boston-based family of mutual funds advised by Loomis, Sayles & Company, L.P., offers a range of fixed income and equity investments to fit the goals of the most demanding investor. Investment minimums and a pricing structure that includes multiple share classes make the funds suitable investments for individual investors, retirement plan participants, high net worth individuals and small institutions, including endowments and foundations.
PHONE 800-633-3330 FOR THE FOLLOWING FUND INFORMATION:
• Net asset values, yields, distribution information, fund information and fund literature
• Speak to a customer service representative regarding new or existing accounts
Before investing, consider the fund’s investment objectives, risks, charges, and expenses. Please visit www.loomissayles.com or call 800-633-3330 for a prospectus and a summary prospectus, if available, containing this and other information.
If you wish to communicate with the funds’ Board of Trustees, you may do so by writing to:
Natixis Advisors, LLC
888 Boylston Street, Suite 800
Boston, MA 02199-8197
The correspondence must be in writing, signed by the shareholder, including the shareholder’s name and address, and should identify the fund(s), account number, class of shares, and number of shares held in the fund(s) as of a recent date.
or by email at:secretaryofthefunds@natixis.comCommunications regarding recommendations for Trustee candidates may not be submitted by e-mail.Please note: Unlike written correspondence, e-mail is not secure. Please do NOT include your account number, social security number, PIN, or any other non-public, personal information in an e-mail communication because this information may be viewed by others.
 Exp. 11/30/256031442.2.1M-LSEFA-0924
Annual Financial Statements and Other Important Information
Loomis Sayles Core Plus Bond Fund |
Loomis Sayles Global Allocation Fund |
Loomis Sayles Growth Fund |
Loomis Sayles Intermediate Duration Bond Fund |
Loomis Sayles Limited Term Government and Agency Fund |
Portfolio of Investments – as of September 30, 2024Loomis Sayles Core Plus Bond Fund
| | |
Bonds and Notes — 91.2% of Net Assets |
|
|
Non-Convertible Bonds — 91.1% |
| |
| AmeriCredit Automobile Receivables Trust, Series 2023-1, Class C, 5.800%, 12/18/2028 | |
| Avis Budget Rental Car Funding AESOP LLC, Series 2020-2A, Class A, 2.020%, 2/20/2027(a) | |
| Avis Budget Rental Car Funding AESOP LLC, Series 2022-1A, Class A, 3.830%, 8/21/2028(a) | |
| Avis Budget Rental Car Funding AESOP LLC, Series 2023-2A, Class A, 5.200%, 10/20/2027(a) | |
| Avis Budget Rental Car Funding AESOP LLC, Series 2023-8A, Class A, 6.020%, 2/20/2030(a) | |
| DT Auto Owner Trust, Series 2023-1A, Class C, 5.550%, 10/16/2028(a) | |
| Exeter Automobile Receivables Trust, Series 2023-1A, Class C, 5.820%, 2/15/2028 | |
| Ford Credit Auto Lease Trust, Series 2023-B, Class C, 6.430%, 4/15/2027 | |
| Hertz Vehicle Financing III LLC, Series 2023-2A, Class A, 5.570%, 9/25/2029(a) | |
| Hertz Vehicle Financing LLC, Series 2021-1A, Class A, 1.210%, 12/26/2025(a) | |
| Santander Bank Auto Credit-Linked Notes, Series 2022-C, Class B, 6.451%, 12/15/2032(a) | |
| Santander Bank Auto Credit-Linked Notes, Series 2022-C, Class C, 6.986%, 12/15/2032(a) | |
| Westlake Automobile Receivables Trust, Series 2022-2A, Class C, 4.850%, 9/15/2027(a) | |
| Westlake Automobile Receivables Trust, Series 2023-1A, Class B, 5.410%, 1/18/2028(a) | |
| Westlake Automobile Receivables Trust, Series 2023-2A, Class C, 6.290%, 3/15/2028(a) | |
| | |
| |
| CoreVest American Finance Ltd., Series 2019-3, Class A, 2.705%, 10/15/2052(a) | |
| Countrywide Asset-Backed Certificates, Series 2004-S1, Class A3, 5.115%, 2/25/2035(b)(c) | |
| OBX Trust, Series 2018-EXP1, Class 1A3, 4.000%, 4/25/2048(a)(c) | |
| Progress Residential Trust, Series 2023-SFR1, Class A, 4.300%, 3/17/2040(a) | |
| PRPM LLC, Series 2024-1, Class A1, 6.959%, 2/25/2029(a)(c) | |
| Sequoia Mortgage Trust, Series 2017-CH1, Class A1, 4.000%, 8/25/2047(a)(c) | |
| Sequoia Mortgage Trust, Series 2018-CH1, Class A1, 4.000%, 3/25/2048(a)(c) | |
| Sequoia Mortgage Trust, Series 2018-CH3, Class A2, 4.000%, 8/25/2048(a)(c) | |
| Toorak Mortgage Trust, Series 2024-RRTL1, Class A1, 6.597%, 2/25/2039(a)(c) | |
| Towd Point Mortgage Trust, Series 2015-1, Class A5, 4.718%, 10/25/2053(a)(c) | |
| Towd Point Mortgage Trust, Series 2015-4, Class M2, 3.750%, 4/25/2055(a)(c) | |
| | |
|
| ABS Home Equity — continued |
| Towd Point Mortgage Trust, Series 2016-2, Class M2, 3.000%, 8/25/2055(a)(c) | |
| Towd Point Mortgage Trust, Series 2018-3, Class A1, 3.750%, 5/25/2058(a)(c) | |
| | |
| |
| Affirm Asset Securitization Trust, Series 2023-A, Class A, 6.610%, 1/18/2028(a) | |
| CLI Funding VIII LLC, Series 2021-1A, Class A, 1.640%, 2/18/2046(a) | |
| Crockett Partners Equipment Co. IIA LLC, Series 2024-1C, Class A, 6.050%, 1/20/2031(a) | |
| Frontier Issuer LLC, Series 2024-1, Class A2, 6.190%, 6/20/2054(a) | |
| GreenSky Home Improvement Trust, Series 2024-1, Class A4, 5.670%, 6/25/2059(a) | |
| Horizon Aircraft Finance IV Ltd., Series 2024-1, Class A, 5.375%, 9/15/2049(a) | |
| Jack in the Box Funding LLC, Series 2022-1A, Class A2I, 3.445%, 2/26/2052(a) | |
| Jack in the Box Funding LLC, Series 2022-1A, Class A2II, 4.136%, 2/26/2052(a) | |
| Lunar Structured Aircraft Portfolio Notes, Series 2021-1, Class A, 2.636%, 10/15/2046(a) | |
| MVW LLC, Series 2024-2A, Class A, 4.430%, 3/20/2042(a) | |
| Navigator Aircraft ABS Ltd., Series 2021-1, Class A, 2.771%, 11/15/2046(a)(c) | |
| SCF Equipment Leasing LLC, Series 2023-1A, Class A2, 6.560%, 1/22/2030(a) | |
| SCF Equipment Leasing LLC, Series 2024-1A, Class A3, 5.520%, 1/20/2032(a) | |
| Textainer Marine Containers VII Ltd., Series 2020-2A, Class A, 2.100%, 9/20/2045(a) | |
| Wheels Fleet Lease Funding 1 LLC, Series 2023-1A, Class A, 5.800%, 4/18/2038(a) | |
| Willis Engine Structured Trust VII, Series 2023-A, Class A, 8.000%, 10/15/2048(a) | |
| Ziply Fiber Issuer LLC, Series 2024-1A, Class A2, 6.640%, 4/20/2054(a) | |
| | |
| |
| Navient Private Education Refi Loan Trust, Series 2020-HA, Class A, 1.310%, 1/15/2069(a) | |
| Navient Private Education Refi Loan Trust, Series 2021-CA, Class A, 1.060%, 10/15/2069(a) | |
| Navient Private Education Refi Loan Trust, Series 2023-A, Class A, 5.510%, 10/15/2071(a) | |
| SMB Private Education Loan Trust, Series 2021-A, Class APT2, 1.070%, 1/15/2053(a) | |
| SMB Private Education Loan Trust, Series 2021-C, Class A2, 1 mo. USD SOFR + 0.914%, 6.011%, 1/15/2053(a)(c) | |
| SMB Private Education Loan Trust, Series 2023-A, Class A1A, 5.380%, 1/15/2053(a) | |
| SoFi Professional Loan Program LLC, Series 2020-A, Class A2FX, 2.540%, 5/15/2046(a) | |
| | |
See accompanying notes to financial statements.
Portfolio of Investments – as of September 30, 2024Loomis Sayles Core Plus Bond Fund (continued) | | |
|
| ABS Whole Business — 0.3% |
| Domino's Pizza Master Issuer LLC, Series 2018-1A, Class A2I, 4.116%, 7/25/2048(a) | |
| Planet Fitness Master Issuer LLC, Series 2022-1A, Class A2I, 3.251%, 12/05/2051(a) | |
| Planet Fitness Master Issuer LLC, Series 2022-1A, Class A2II, 4.008%, 12/05/2051(a) | |
| | |
| Aerospace & Defense — 0.4% |
| Boeing Co., 5.705%, 5/01/2040 | |
| Boeing Co., 6.298%, 5/01/2029(a) | |
| Boeing Co., 6.858%, 5/01/2054(a) | |
| Bombardier, Inc., 7.000%, 6/01/2032(a) | |
| | |
| Agency Commercial Mortgage-Backed Securities — 0.4% |
| Federal Home Loan Mortgage Corp., 3.350%, 8/01/2037 | |
| Federal Home Loan Mortgage Corp., 3.450%, 5/01/2037 | |
| Federal Home Loan Mortgage Corp., 3.700%, 5/01/2037 | |
| Federal Home Loan Mortgage Corp., 3.750%, 5/01/2037 | |
| Federal Home Loan Mortgage Corp., 3.900%, 7/01/2037 | |
| Federal Home Loan Mortgage Corp., 3.900%, 7/01/2037 | |
| Federal National Mortgage Association, 3.850%, 9/01/2037 | |
| Federal National Mortgage Association, 3.940%, 9/01/2032 | |
| Federal National Mortgage Association, 4.240%, 7/01/2038 | |
| | |
| |
| American Airlines, Inc./AAdvantage Loyalty IP Ltd., 5.500%, 4/20/2026(a) | |
| American Airlines, Inc./AAdvantage Loyalty IP Ltd., 5.750%, 4/20/2029(a) | |
| Continental Airlines Pass-Through Trust, Series 2012-2, Class A, 4.000%, 4/29/2026 | |
| Delta Air Lines, Inc./SkyMiles IP Ltd., 4.750%, 10/20/2028(a) | |
| United Airlines Pass-Through Trust, Series 2020-1, Class B, 4.875%, 7/15/2027 | |
| United Airlines Pass-Through Trust, Series 2023-1, Class A, 5.800%, 7/15/2037 | |
| United Airlines, Inc., 4.375%, 4/15/2026(a) | |
| United Airlines, Inc., 4.625%, 4/15/2029(a) | |
| | |
| |
| American Homes 4 Rent LP, 3.375%, 7/15/2051 | |
| |
| Ford Motor Credit Co. LLC, 4.271%, 1/09/2027 | |
| Ford Motor Credit Co. LLC, 6.800%, 5/12/2028 | |
| Ford Motor Credit Co. LLC, 6.950%, 3/06/2026 | |
| Ford Motor Credit Co. LLC, 7.122%, 11/07/2033 | |
| General Motors Co., 5.000%, 4/01/2035 | |
| | |
|
| |
| General Motors Financial Co., Inc., 2.350%, 1/08/2031 | |
| General Motors Financial Co., Inc., 2.900%, 2/26/2025 | |
| Hyundai Capital America, 2.375%, 10/15/2027(a) | |
| Hyundai Capital America, 2.650%, 2/10/2025(a) | |
| Hyundai Capital America, 3.000%, 2/10/2027(a) | |
| Hyundai Capital America, 5.400%, 6/24/2031(a) | |
| Hyundai Capital America, 6.100%, 9/21/2028(a) | |
| Lear Corp., 3.550%, 1/15/2052 | |
| Lear Corp., 5.250%, 5/15/2049 | |
| Nissan Motor Acceptance Co. LLC, 7.050%, 9/15/2028(a) | |
| Phinia, Inc., 6.750%, 4/15/2029(a) | |
| Volkswagen Group of America Finance LLC, 6.450%, 11/16/2030(a) | |
| | |
| |
| AIB Group PLC, (fixed rate to 3/28/2034, variable rate thereafter), 5.871%, 3/28/2035(a) | |
| Banco Santander Chile, 2.700%, 1/10/2025(a) | |
| Banco Santander SA, 1.849%, 3/25/2026 | |
| Banco Santander SA, 2.958%, 3/25/2031 | |
| Bangkok Bank PCL, 5.650%, 7/05/2034(a) | |
| Bank of America Corp., (fixed rate to 11/10/2027, variable rate thereafter), 6.204%, 11/10/2028 | |
| Bank of America Corp., (fixed rate to 4/24/2027, variable rate thereafter), 3.705%, 4/24/2028 | |
| Bank of America Corp., (fixed rate to 4/25/2033, variable rate thereafter), 5.288%, 4/25/2034 | |
| Bank of America Corp., MTN, (fixed rate to 4/23/2026, variable rate thereafter), 3.559%, 4/23/2027 | |
| Barclays PLC, (fixed rate to 3/10/2041, variable rate thereafter), 3.811%, 3/10/2042 | |
| Barclays PLC, (fixed rate to 5/09/2033, variable rate thereafter), 6.224%, 5/09/2034 | |
| BBVA Bancomer SA, 1.875%, 9/18/2025(a) | |
| BBVA Bancomer SA, 5.250%, 9/10/2029(a) | |
| BNP Paribas SA, (fixed rate to 1/13/2026, variable rate thereafter), 1.323%, 1/13/2027(a) | |
| BNP Paribas SA, (fixed rate to 11/19/2024, variable rate thereafter), 2.819%, 11/19/2025(a) | |
| Capital One Financial Corp., (fixed rate to 6/08/2033, variable rate thereafter), 6.377%, 6/08/2034 | |
| Credit Agricole SA, (fixed rate to 1/10/2034, variable rate thereafter), 6.251%, 1/10/2035(a) | |
| Danske Bank AS, (fixed rate to 10/02/2029, variable rate thereafter), 4.613%, 10/02/2030(a) | |
| Deutsche Bank AG, 1.686%, 3/19/2026 | |
| Deutsche Bank AG, (fixed rate to 10/07/2031, variable rate thereafter), 3.742%, 1/07/2033 | |
| Deutsche Bank AG, (fixed rate to 10/14/2030, variable rate thereafter), 3.729%, 1/14/2032 | |
| Deutsche Bank AG, (fixed rate to 11/10/2032, variable rate thereafter), 7.079%, 2/10/2034 | |
| Deutsche Bank AG, (fixed rate to 11/24/2025, variable rate thereafter), 2.129%, 11/24/2026 | |
See accompanying notes to financial statements.
Portfolio of Investments – as of September 30, 2024Loomis Sayles Core Plus Bond Fund (continued) | | |
|
| |
| Goldman Sachs Group, Inc., 6.750%, 10/01/2037 | |
| Goldman Sachs Group, Inc., (fixed rate to 6/05/2027, variable rate thereafter), 3.691%, 6/05/2028 | |
| HSBC Holdings PLC, 4.950%, 3/31/2030 | |
| Intesa Sanpaolo SpA, 7.200%, 11/28/2033(a) | |
| Intesa Sanpaolo SpA, (fixed rate to 6/01/2031, variable rate thereafter), 4.198%, 6/01/2032(a) | |
| JPMorgan Chase & Co., (fixed rate to 10/15/2029, variable rate thereafter), 2.739%, 10/15/2030 | |
| JPMorgan Chase & Co., (fixed rate to 5/13/2030, variable rate thereafter), 2.956%, 5/13/2031 | |
| Macquarie Bank Ltd., 3.231%, 3/21/2025(a) | |
| Mitsubishi UFJ Financial Group, Inc., (fixed rate to 7/20/2031, variable rate thereafter), 2.309%, 7/20/2032 | |
| Morgan Stanley, 3.591%, 7/22/2028(c) | |
| Morgan Stanley, (fixed rate to 2/01/2028, variable rate thereafter), 5.123%, 2/01/2029 | |
| Morgan Stanley, MTN, (fixed rate to 4/20/2028, variable rate thereafter), 5.164%, 4/20/2029 | |
| PNC Financial Services Group, Inc., (fixed rate to 1/24/2033, variable rate thereafter), 5.068%, 1/24/2034 | |
| Santander Holdings USA, Inc., (fixed rate to 1/06/2027, variable rate thereafter), 2.490%, 1/06/2028 | |
| Societe Generale SA, 2.625%, 1/22/2025(a) | |
| Societe Generale SA, (fixed rate to 1/19/2054, variable rate thereafter), 7.132%, 1/19/2055(a) | |
| Standard Chartered PLC, (fixed rate to 1/12/2032, variable rate thereafter), 3.603%, 1/12/2033(a) | |
| Standard Chartered PLC, (fixed rate to 1/30/2025, variable rate thereafter), 2.819%, 1/30/2026(a) | |
| Standard Chartered PLC, (fixed rate to 3/15/2028, variable rate thereafter), 4.866%, 3/15/2033(a) | |
| Standard Chartered PLC, (fixed rate to 7/06/2033, variable rate thereafter), 6.296%, 7/06/2034(a) | |
| Sumitomo Mitsui Financial Group, Inc., 1.474%, 7/08/2025 | |
| Sumitomo Mitsui Financial Group, Inc., 3.040%, 7/16/2029 | |
| Truist Financial Corp., MTN, (fixed rate to 6/08/2033, variable rate thereafter), 5.867%, 6/08/2034 | |
| UBS Group AG, (fixed rate to 11/15/2032, variable rate thereafter), 9.016%, 11/15/2033(a) | |
| UBS Group AG, (fixed rate to 7/15/2025, variable rate thereafter), 6.373%, 7/15/2026(a) | |
| UBS Group AG, (fixed rate to 8/11/2027, variable rate thereafter), 6.442%, 8/11/2028(a) | |
| UniCredit SpA, (fixed rate to 6/03/2026, variable rate thereafter), 1.982%, 6/03/2027(a) | |
| | |
| | |
|
| Building Materials — 0.1% |
| American Builders & Contractors Supply Co., Inc., 3.875%, 11/15/2029(a) | |
| Mohawk Industries, Inc., 3.625%, 5/15/2030 | |
| Mohawk Industries, Inc., 5.850%, 9/18/2028 | |
| | |
| |
| CCO Holdings LLC/CCO Holdings Capital Corp., 4.250%, 1/15/2034(a) | |
| Time Warner Cable LLC, 4.500%, 9/15/2042 | |
| Time Warner Cable LLC, 5.500%, 9/01/2041 | |
| Time Warner Cable LLC, 5.875%, 11/15/2040 | |
| Time Warner Cable LLC, 6.550%, 5/01/2037 | |
| Time Warner Cable LLC, 6.750%, 6/15/2039 | |
| | |
| |
| Alpek SAB de CV, 3.250%, 2/25/2031(a) | |
| Braskem America Finance Co., 7.125%, 7/22/2041(a) | |
| Celanese U.S. Holdings LLC, 6.050%, 3/15/2025 | |
| Celanese U.S. Holdings LLC, 6.330%, 7/15/2029 | |
| Celanese U.S. Holdings LLC, 6.379%, 7/15/2032 | |
| Nutrien Ltd., 5.800%, 3/27/2053 | |
| Orbia Advance Corp. SAB de CV, 5.875%, 9/17/2044(a) | |
| Orbia Advance Corp. SAB de CV, 6.750%, 9/19/2042(a) | |
| Sociedad Quimica y Minera de Chile SA, 3.500%, 9/10/2051(a) | |
| Sociedad Quimica y Minera de Chile SA, 4.250%, 1/22/2050(a) | |
| Sociedad Quimica y Minera de Chile SA, 6.500%, 11/07/2033(a) | |
| | |
| Collateralized Mortgage Obligations — 0.9% |
| Federal Home Loan Mortgage Corp., Series 406, Class F15, 30 day USD SOFR Average + 1.450%, 6.730%, 10/25/2053(c) | |
| Federal Home Loan Mortgage Corp., Series 5365, Class LY, REMICS, 6.500%, 12/25/2053 | |
| Federal National Mortgage Association, Series 2023-51, Class L, REMICS, 6.500%, 11/25/2053 | |
| Government National Mortgage Association, Series 2010-H24, Class FA, 1 mo. USD SOFR + 0.464%, 5.817%, 10/20/2060(b)(c) | |
| Government National Mortgage Association, Series 2012-H18, Class NA, 1 mo. USD SOFR + 0.634%, 5.987%, 8/20/2062(b)(c) | |
| Government National Mortgage Association, Series 2013-H01, Class FA, 1.650%, 1/20/2063(b) | |
| Government National Mortgage Association, Series 2013-H03, Class HA, 1.750%, 12/20/2062(b) | |
| Government National Mortgage Association, Series 2013-H04, Class BA, 1.650%, 2/20/2063(b) | |
| Government National Mortgage Association, Series 2013-H10, Class PA, 2.500%, 4/20/2063(b) | |
See accompanying notes to financial statements.
Portfolio of Investments – as of September 30, 2024Loomis Sayles Core Plus Bond Fund (continued) | | |
|
| Collateralized Mortgage Obligations — continued |
| Government National Mortgage Association, Series 2015-H10, Class JA, 2.250%, 4/20/2065 | |
| Government National Mortgage Association, Series 2015-H13, Class FL, 1 mo. USD SOFR + 0.394%, 5.747%, 5/20/2063(b)(c) | |
| | |
| Consumer Cyclical Services — 0.0% |
| Expedia Group, Inc., 6.250%, 5/01/2025(a) | |
| |
| Kimberly-Clark de Mexico SAB de CV, 2.431%, 7/01/2031(a) | |
| Natura &Co. Luxembourg Holdings SARL, 4.125%, 5/03/2028(a) | |
| Natura &Co. Luxembourg Holdings SARL, 6.000%, 4/19/2029(a) | |
| | |
| |
| AES Corp., 3.300%, 7/15/2025(a) | |
| AES Corp., 3.950%, 7/15/2030(a) | |
| Clearway Energy Operating LLC, 3.750%, 2/15/2031(a) | |
| Cometa Energia SA de CV, 6.375%, 4/24/2035(a) | |
| DPL, Inc., 4.350%, 4/15/2029 | |
| Edison International, 4.950%, 4/15/2025 | |
| Enel Americas SA, 4.000%, 10/25/2026 | |
| Entergy Corp., 2.800%, 6/15/2030 | |
| IPALCO Enterprises, Inc., 4.250%, 5/01/2030 | |
| Lightning Power LLC, 7.250%, 8/15/2032(a) | |
| National Rural Utilities Cooperative Finance Corp., 3 mo. USD SOFR + 3.172%, 8.427%, 4/30/2043(c) | |
| Transelec SA, 4.250%, 1/14/2025(a) | |
| | |
| |
| AerCap Ireland Capital DAC/AerCap Global Aviation Trust, 3.000%, 10/29/2028 | |
| AerCap Ireland Capital DAC/AerCap Global Aviation Trust, 5.100%, 1/19/2029 | |
| Air Lease Corp., GMTN, 3.750%, 6/01/2026 | |
| Aircastle Ltd., 2.850%, 1/26/2028(a) | |
| ARES Capital Corp., 2.150%, 7/15/2026 | |
| Avolon Holdings Funding Ltd., 2.750%, 2/21/2028(a) | |
| Blue Owl Capital Corp., 2.625%, 1/15/2027 | |
| Blue Owl Capital Corp., 3.400%, 7/15/2026 | |
| Blue Owl Technology Finance Corp., 3.750%, 6/17/2026(a) | |
| FS KKR Capital Corp., 3.400%, 1/15/2026 | |
| GATX Corp., 6.050%, 3/15/2034 | |
| GATX Corp., 6.050%, 6/05/2054 | |
| Main Street Capital Corp., 6.950%, 3/01/2029 | |
| Navient Corp., 4.875%, 3/15/2028 | |
| Navient Corp., 5.000%, 3/15/2027 | |
| Rocket Mortgage LLC/Rocket Mortgage Co-Issuer, Inc., 3.875%, 3/01/2031(a) | |
| Rocket Mortgage LLC/Rocket Mortgage Co-Issuer, Inc., 4.000%, 10/15/2033(a) | |
| | |
| | |
|
| |
| Icahn Enterprises LP/Icahn Enterprises Finance Corp., 4.375%, 2/01/2029 | |
| |
| BRF SA, 5.750%, 9/21/2050(a) | |
| Gruma SAB de CV, 4.875%, 12/01/2024(a) | |
| JBS USA Holding Lux SARL/ JBS USA Food Co./ JBS Lux Co. SARL, 7.250%, 11/15/2053(a) | |
| Minerva Luxembourg SA, 4.375%, 3/18/2031(a) | |
| Smithfield Foods, Inc., 3.000%, 10/15/2030(a) | |
| | |
| |
| Caesars Entertainment, Inc., 6.500%, 2/15/2032(a) | |
| MGM Resorts International, 6.500%, 4/15/2032 | |
| | |
| Government Owned - No Guarantee — 0.9% |
| Antares Holdings LP, 3.950%, 7/15/2026(a) | |
| Ascot Group Ltd., 4.250%, 12/15/2030(a) | |
| Ecopetrol SA, 8.375%, 1/19/2036 | |
| Empresa de los Ferrocarriles del Estado, 3.068%, 8/18/2050(a) | |
| Freeport Indonesia PT, 5.315%, 4/14/2032(a) | |
| OCP SA, 3.750%, 6/23/2031(a) | |
| OCP SA, 6.750%, 5/02/2034(a) | |
| Saudi Arabian Oil Co., 3.500%, 11/24/2070(a) | |
| Tennessee Valley Authority, 4.250%, 9/15/2065 | |
| Tennessee Valley Authority, 4.625%, 9/15/2060 | |
| Tennessee Valley Authority, 4.875%, 1/15/2048 | |
| | |
| |
| Centene Corp., 3.375%, 2/15/2030 | |
| |
| HCA, Inc., 4.625%, 3/15/2052 | |
| |
| Forestar Group, Inc., 3.850%, 5/15/2026(a) | |
| NVR, Inc., 3.000%, 5/15/2030 | |
| | |
| Independent Energy — 0.7% |
| Baytex Energy Corp., 7.375%, 3/15/2032(a) | |
| Devon Energy Corp., 4.500%, 1/15/2030 | |
| EQT Corp., 3.125%, 5/15/2026(a) | |
| EQT Corp., 3.900%, 10/01/2027 | |
| EQT Corp., 5.000%, 1/15/2029 | |
| Leviathan Bond Ltd., 6.125%, 6/30/2025(a) | |
| Pan American Energy LLC, 9.125%, 4/30/2027(a) | |
| Permian Resources Operating LLC, 6.250%, 2/01/2033(a) | |
| SM Energy Co., 6.750%, 8/01/2029(a) | |
| SM Energy Co., 7.000%, 8/01/2032(a) | |
| | |
| |
| Georgetown University, Series A, 5.215%, 10/01/2118 | |
See accompanying notes to financial statements.
Portfolio of Investments – as of September 30, 2024Loomis Sayles Core Plus Bond Fund (continued) | | |
|
| |
| Brighthouse Financial, Inc., 5.625%, 5/15/2030 | |
| OneAmerica Financial Partners, Inc., 4.250%, 10/15/2050(a) | |
| | |
| Media Entertainment — 0.6% |
| Grupo Televisa SAB, EMTN, 7.250%, 5/14/2043, (MXN) | |
| Outfront Media Capital LLC/Outfront Media Capital Corp., 4.250%, 1/15/2029(a) | |
| Prosus NV, 3.680%, 1/21/2030(a) | |
| Prosus NV, 3.832%, 2/08/2051(a) | |
| Warnermedia Holdings, Inc., 5.391%, 3/15/2062 | |
| | |
| |
| Anglo American Capital PLC, 2.250%, 3/17/2028(a) | |
| Anglo American Capital PLC, 3.875%, 3/16/2029(a) | |
| Anglo American Capital PLC, 3.950%, 9/10/2050(a) | |
| Anglo American Capital PLC, 5.625%, 4/01/2030(a) | |
| FMG Resources August 2006 Pty. Ltd., 4.375%, 4/01/2031(a) | |
| Fresnillo PLC, 4.250%, 10/02/2050(a) | |
| Glencore Funding LLC, 2.500%, 9/01/2030(a) | |
| Glencore Funding LLC, 6.375%, 10/06/2030(a) | |
| POSCO, 5.625%, 1/17/2026(a) | |
| SunCoke Energy, Inc., 4.875%, 6/30/2029(a) | |
| | |
| |
| Energy Transfer LP, 5.150%, 2/01/2043 | |
| Energy Transfer LP, 5.300%, 4/15/2047 | |
| Energy Transfer LP, 5.400%, 10/01/2047 | |
| Energy Transfer LP, 5.950%, 10/01/2043 | |
| Energy Transfer LP, 6.500%, 2/01/2042 | |
| Energy Transfer LP, 6.625%, 10/15/2036 | |
| EQM Midstream Partners LP, 6.375%, 4/01/2029(a) | |
| EQM Midstream Partners LP, 6.500%, 7/01/2027(a) | |
| Gray Oak Pipeline LLC, 2.600%, 10/15/2025(a) | |
| Gray Oak Pipeline LLC, 3.450%, 10/15/2027(a) | |
| Sempra Infrastructure Partners LP, 3.250%, 1/15/2032(a) | |
| Targa Resources Corp., 5.500%, 2/15/2035 | |
| Targa Resources Partners LP/Targa Resources Partners Finance Corp., 6.500%, 7/15/2027 | |
| | |
| | |
| Federal Home Loan Mortgage Corp., 1.500%, 12/01/2050 | |
| Federal Home Loan Mortgage Corp., 1.500%, 4/01/2051 | |
| Federal Home Loan Mortgage Corp., 2.000%, 8/01/2050 | |
| Federal Home Loan Mortgage Corp., 2.000%, 11/01/2050 | |
| Federal Home Loan Mortgage Corp., 2.000%, 11/01/2050 | |
| | |
|
| Mortgage Related — continued | |
| Federal Home Loan Mortgage Corp., 2.000%, 11/01/2050 | |
| Federal Home Loan Mortgage Corp., 2.000%, 11/01/2050 | |
| Federal Home Loan Mortgage Corp., 2.000%, 12/01/2050 | |
| Federal Home Loan Mortgage Corp., 2.000%, 12/01/2050 | |
| Federal Home Loan Mortgage Corp., 2.000%, 12/01/2050 | |
| Federal Home Loan Mortgage Corp., 2.000%, 12/01/2050 | |
| Federal Home Loan Mortgage Corp., 2.000%, 1/01/2051 | |
| Federal Home Loan Mortgage Corp., 2.000%, 2/01/2051 | |
| Federal Home Loan Mortgage Corp., 2.000%, 3/01/2052 | |
| Federal Home Loan Mortgage Corp., 2.000%, 3/01/2052 | |
| Federal Home Loan Mortgage Corp., 2.000%, 3/01/2052 | |
| Federal Home Loan Mortgage Corp., 2.500%, 7/01/2050 | |
| Federal Home Loan Mortgage Corp., 2.500%, 7/01/2050 | |
| Federal Home Loan Mortgage Corp., 2.500%, 9/01/2050 | |
| Federal Home Loan Mortgage Corp., 2.500%, 10/01/2050 | |
| Federal Home Loan Mortgage Corp., 2.500%, 11/01/2050 | |
| Federal Home Loan Mortgage Corp., 2.500%, 12/01/2050 | |
| Federal Home Loan Mortgage Corp., 2.500%, 3/01/2051 | |
| Federal Home Loan Mortgage Corp., 2.500%, 10/01/2051 | |
| Federal Home Loan Mortgage Corp., 2.500%, 12/01/2051 | |
| Federal Home Loan Mortgage Corp., 3.000%, 11/01/2042 | |
| Federal Home Loan Mortgage Corp., 3.000%, 9/01/2048 | |
| Federal Home Loan Mortgage Corp., 3.000%, 10/01/2049 | |
| Federal Home Loan Mortgage Corp., 3.000%, 5/01/2050 | |
| Federal Home Loan Mortgage Corp., 3.000%, 5/01/2050 | |
| Federal Home Loan Mortgage Corp., 3.000%, 12/01/2051 | |
| Federal Home Loan Mortgage Corp., 3.500%, 4/01/2043 | |
| Federal Home Loan Mortgage Corp., 3.500%, 4/01/2043 | |
| Federal Home Loan Mortgage Corp., 3.500%, 7/01/2043 | |
| Federal Home Loan Mortgage Corp., 3.500%, 10/01/2043 | |
| Federal Home Loan Mortgage Corp., 3.500%, 3/01/2045 | |
See accompanying notes to financial statements.
Portfolio of Investments – as of September 30, 2024Loomis Sayles Core Plus Bond Fund (continued) | | |
|
| Mortgage Related — continued | |
| Federal Home Loan Mortgage Corp., 3.500%, 8/01/2047 | |
| Federal Home Loan Mortgage Corp., 3.500%, 4/01/2050 | |
| Federal Home Loan Mortgage Corp., 4.000%, 12/01/2044 | |
| Federal Home Loan Mortgage Corp., 4.000%, 7/01/2045 | |
| Federal Home Loan Mortgage Corp., 4.000%, 9/01/2045 | |
| Federal Home Loan Mortgage Corp., 4.000%, 6/01/2047 | |
| Federal Home Loan Mortgage Corp., 4.000%, 7/01/2052 | |
| Federal Home Loan Mortgage Corp., 4.000%, 7/01/2052 | |
| Federal Home Loan Mortgage Corp., 4.000%, 8/01/2052 | |
| Federal Home Loan Mortgage Corp., 4.000%, 9/01/2052 | |
| Federal Home Loan Mortgage Corp., 4.000%, 9/01/2052 | |
| Federal Home Loan Mortgage Corp., 4.000%, 10/01/2052 | |
| Federal Home Loan Mortgage Corp., 4.000%, 10/01/2052 | |
| Federal Home Loan Mortgage Corp., 4.000%, 10/01/2052 | |
| Federal Home Loan Mortgage Corp., 4.500%, 7/01/2041 | |
| Federal Home Loan Mortgage Corp., 4.500%, 1/01/2044 | |
| Federal Home Loan Mortgage Corp., 4.500%, 4/01/2044 | |
| Federal Home Loan Mortgage Corp., 4.500%, 3/01/2046 | |
| Federal Home Loan Mortgage Corp., 4.500%, 7/01/2046 | |
| Federal Home Loan Mortgage Corp., 4.500%, 3/01/2048 | |
| Federal Home Loan Mortgage Corp., 4.500%, 8/01/2052 | |
| Federal Home Loan Mortgage Corp., 4.500%, 8/01/2052 | |
| Federal Home Loan Mortgage Corp., 4.500%, 8/01/2052 | |
| Federal Home Loan Mortgage Corp., 5.000%, 7/01/2048 | |
| Federal Home Loan Mortgage Corp., 5.000%, 8/01/2048 | |
| Federal Home Loan Mortgage Corp., 5.000%, 9/01/2048 | |
| Federal Home Loan Mortgage Corp., 5.000%, 10/01/2048 | |
| Federal Home Loan Mortgage Corp., 5.000%, 12/01/2048 | |
| Federal Home Loan Mortgage Corp., 5.000%, 12/01/2053 | |
| Federal Home Loan Mortgage Corp., 5.500%, 5/01/2053 | |
| Federal Home Loan Mortgage Corp., 5.500%, 5/01/2053 | |
| | |
|
| Mortgage Related — continued | |
| Federal Home Loan Mortgage Corp., 5.500%, 5/01/2053 | |
| Federal Home Loan Mortgage Corp., 5.500%, 6/01/2053 | |
| Federal Home Loan Mortgage Corp., 5.500%, 6/01/2053 | |
| Federal Home Loan Mortgage Corp., 5.500%, 7/01/2053 | |
| Federal Home Loan Mortgage Corp., 5.500%, 7/01/2053 | |
| Federal Home Loan Mortgage Corp., 5.500%, 7/01/2053 | |
| Federal Home Loan Mortgage Corp., 5.500%, 7/01/2053 | |
| Federal Home Loan Mortgage Corp., 6.000%, 6/01/2035 | |
| Federal Home Loan Mortgage Corp., 6.000%, 5/01/2053 | |
| Federal Home Loan Mortgage Corp., 6.000%, 5/01/2053 | |
| Federal Home Loan Mortgage Corp., 6.000%, 5/01/2053 | |
| Federal Home Loan Mortgage Corp., 6.000%, 5/01/2053 | |
| Federal Home Loan Mortgage Corp., 6.000%, 5/01/2053 | |
| Federal Home Loan Mortgage Corp., 6.000%, 5/01/2053 | |
| Federal Home Loan Mortgage Corp., 6.000%, 5/01/2053 | |
| Federal Home Loan Mortgage Corp., 6.000%, 5/01/2053 | |
| Federal Home Loan Mortgage Corp., 6.000%, 7/01/2053 | |
| Federal Home Loan Mortgage Corp., 6.000%, 7/01/2053 | |
| Federal Home Loan Mortgage Corp., 6.000%, 7/01/2053 | |
| Federal Home Loan Mortgage Corp., 6.000%, 7/01/2053 | |
| Federal Home Loan Mortgage Corp., 6.000%, 8/01/2053 | |
| Federal Home Loan Mortgage Corp., 6.000%, 3/01/2054 | |
| Federal Home Loan Mortgage Corp., 6.000%, 4/01/2054 | |
| Federal Home Loan Mortgage Corp., 6.000%, 4/01/2054 | |
| Federal Home Loan Mortgage Corp., 6.500%, 4/01/2053 | |
| Federal Home Loan Mortgage Corp., 6.500%, 7/01/2053 | |
| Federal Home Loan Mortgage Corp., 6.500%, 7/01/2053 | |
| Federal Home Loan Mortgage Corp., 6.500%, 7/01/2053 | |
| Federal Home Loan Mortgage Corp., 6.500%, 8/01/2053 | |
| Federal Home Loan Mortgage Corp., 6.500%, 8/01/2053 | |
| Federal Home Loan Mortgage Corp., 6.500%, 8/01/2053 | |
See accompanying notes to financial statements.
Portfolio of Investments – as of September 30, 2024Loomis Sayles Core Plus Bond Fund (continued) | | |
|
| Mortgage Related — continued | |
| Federal Home Loan Mortgage Corp., 6.500%, 9/01/2053 | |
| Federal Home Loan Mortgage Corp., 6.500%, 12/01/2053 | |
| Federal Home Loan Mortgage Corp., 6.500%, 1/01/2054 | |
| Federal Home Loan Mortgage Corp., 6.500%, 1/01/2054 | |
| Federal Home Loan Mortgage Corp., 6.500%, 2/01/2054 | |
| Federal Home Loan Mortgage Corp., 6.500%, 2/01/2054 | |
| Federal Home Loan Mortgage Corp., 6.500%, 4/01/2054 | |
| Federal Home Loan Mortgage Corp., 6.500%, 5/01/2054 | |
| Federal Home Loan Mortgage Corp., 6.500%, 5/01/2054 | |
| Federal Home Loan Mortgage Corp., 6.500%, 5/01/2054 | |
| Federal Home Loan Mortgage Corp., 6.500%, 6/01/2054 | |
| Federal Home Loan Mortgage Corp., 7.000%, 9/01/2053 | |
| Federal Home Loan Mortgage Corp., 7.000%, 12/01/2053 | |
| Federal Home Loan Mortgage Corp., 7.000%, 1/01/2054 | |
| Federal Home Loan Mortgage Corp., 7.000%, 2/01/2054 | |
| Federal Home Loan Mortgage Corp., 7.000%, 2/01/2054 | |
| Federal Home Loan Mortgage Corp., 7.000%, 2/01/2054 | |
| Federal Home Loan Mortgage Corp., 7.000%, 4/01/2054 | |
| Federal Home Loan Mortgage Corp., 7.000%, 6/01/2054 | |
| Federal Home Loan Mortgage Corp., 7.000%, 6/01/2054 | |
| Federal Home Loan Mortgage Corp., 7.000%, 7/01/2054 | |
| Federal Home Loan Mortgage Corp., 7.500%, 1/01/2054 | |
| Federal Home Loan Mortgage Corp., 8.000%, 2/01/2054 | |
| Federal National Mortgage Association, 1.500%, 12/01/2050 | |
| Federal National Mortgage Association, 1.500%, 3/01/2051 | |
| Federal National Mortgage Association, 1.500%, 9/01/2051 | |
| Federal National Mortgage Association, 1.500%, 10/01/2051 | |
| Federal National Mortgage Association, 2.000%, 5/01/2037 | |
| Federal National Mortgage Association, 2.000%, 10/01/2050 | |
| Federal National Mortgage Association, 2.000%, 11/01/2050 | |
| Federal National Mortgage Association, 2.000%, 11/01/2050 | |
| | |
|
| Mortgage Related — continued | |
| Federal National Mortgage Association, 2.000%, 11/01/2050 | |
| Federal National Mortgage Association, 2.000%, 11/01/2050 | |
| Federal National Mortgage Association, 2.000%, 12/01/2050 | |
| Federal National Mortgage Association, 2.000%, 12/01/2050 | |
| Federal National Mortgage Association, 2.000%, 12/01/2050 | |
| Federal National Mortgage Association, 2.000%, 12/01/2050 | |
| Federal National Mortgage Association, 2.000%, 12/01/2050 | |
| Federal National Mortgage Association, 2.000%, 12/01/2050 | |
| Federal National Mortgage Association, 2.000%, 1/01/2051 | |
| Federal National Mortgage Association, 2.000%, 2/01/2051 | |
| Federal National Mortgage Association, 2.000%, 3/01/2051 | |
| Federal National Mortgage Association, 2.000%, 4/01/2051 | |
| Federal National Mortgage Association, 2.000%, 4/01/2051 | |
| Federal National Mortgage Association, 2.000%, 4/01/2051 | |
| Federal National Mortgage Association, 2.000%, 11/01/2051 | |
| Federal National Mortgage Association, 2.000%, 11/01/2051 | |
| Federal National Mortgage Association, 2.000%, 11/01/2051 | |
| Federal National Mortgage Association, 2.000%, 12/01/2051 | |
| Federal National Mortgage Association, 2.000%, 1/01/2052 | |
| Federal National Mortgage Association, 2.000%, 2/01/2052 | |
| Federal National Mortgage Association, 2.000%, 2/01/2052 | |
| Federal National Mortgage Association, 2.000%, 2/01/2052 | |
| Federal National Mortgage Association, 2.000%, 3/01/2052 | |
| Federal National Mortgage Association, 2.000%, 3/01/2052 | |
| Federal National Mortgage Association, 2.500%, 4/01/2045 | |
| Federal National Mortgage Association, 2.500%, 5/01/2050 | |
| Federal National Mortgage Association, 2.500%, 7/01/2050 | |
| Federal National Mortgage Association, 2.500%, 8/01/2050 | |
| Federal National Mortgage Association, 2.500%, 10/01/2050 | |
| Federal National Mortgage Association, 2.500%, 11/01/2050 | |
| Federal National Mortgage Association, 2.500%, 11/01/2050 | |
See accompanying notes to financial statements.
Portfolio of Investments – as of September 30, 2024Loomis Sayles Core Plus Bond Fund (continued) | | |
|
| Mortgage Related — continued | |
| Federal National Mortgage Association, 2.500%, 5/01/2051 | |
| Federal National Mortgage Association, 2.500%, 9/01/2051 | |
| Federal National Mortgage Association, 2.500%, 5/01/2052 | |
| Federal National Mortgage Association, 2.500%, 12/01/2061 | |
| Federal National Mortgage Association, 2.500%, 3/01/2062 | |
| Federal National Mortgage Association, 2.500%, 3/01/2062 | |
| Federal National Mortgage Association, 2.500%, 3/01/2062 | |
| Federal National Mortgage Association, 2.500%, 3/01/2062 | |
| Federal National Mortgage Association, 2.500%, 3/01/2062 | |
| Federal National Mortgage Association, 2.500%, 3/01/2062 | |
| Federal National Mortgage Association, 2.500%, 4/01/2062 | |
| Federal National Mortgage Association, 2.500%, 5/01/2062 | |
| Federal National Mortgage Association, 2.500%, 6/01/2062 | |
| Federal National Mortgage Association, 2.500%, 12/01/2062 | |
| Federal National Mortgage Association, 2.500%, 9/01/2063 | |
| Federal National Mortgage Association, 2.500%, 9/01/2063 | |
| Federal National Mortgage Association, 3.000%, 3/01/2045 | |
| Federal National Mortgage Association, 3.000%, 3/01/2045 | |
| Federal National Mortgage Association, 3.000%, 6/01/2046 | |
| Federal National Mortgage Association, 3.000%, 6/01/2046 | |
| Federal National Mortgage Association, 3.000%, 7/01/2046 | |
| Federal National Mortgage Association, 3.000%, 8/01/2046 | |
| Federal National Mortgage Association, 3.000%, 8/01/2046 | |
| Federal National Mortgage Association, 3.000%, 9/01/2046 | |
| Federal National Mortgage Association, 3.000%, 11/01/2046 | |
| Federal National Mortgage Association, 3.000%, 11/01/2046 | |
| Federal National Mortgage Association, 3.000%, 11/01/2046 | |
| Federal National Mortgage Association, 3.000%, 11/01/2046 | |
| Federal National Mortgage Association, 3.000%, 11/01/2046 | |
| Federal National Mortgage Association, 3.000%, 1/01/2047 | |
| Federal National Mortgage Association, 3.000%, 1/01/2047 | |
| | |
|
| Mortgage Related — continued | |
| Federal National Mortgage Association, 3.000%, 3/01/2047 | |
| Federal National Mortgage Association, 3.000%, 11/01/2047 | |
| Federal National Mortgage Association, 3.000%, 4/01/2048 | |
| Federal National Mortgage Association, 3.000%, 6/01/2048 | |
| Federal National Mortgage Association, 3.000%, 7/01/2050 | |
| Federal National Mortgage Association, 3.000%, 11/01/2051 | |
| Federal National Mortgage Association, 3.000%, 2/01/2052 | |
| Federal National Mortgage Association, 3.000%, 10/01/2052 | |
| Federal National Mortgage Association, 3.000%, 9/01/2062 | |
| Federal National Mortgage Association, 3.000%, 9/01/2062 | |
| Federal National Mortgage Association, 3.000%, 3/01/2063 | |
| Federal National Mortgage Association, 3.000%, 6/01/2063 | |
| Federal National Mortgage Association, 3.000%, 6/01/2063 | |
| Federal National Mortgage Association, 3.500%, 1/01/2045 | |
| Federal National Mortgage Association, 3.500%, 2/01/2045 | |
| Federal National Mortgage Association, 3.500%, 4/01/2045 | |
| Federal National Mortgage Association, 3.500%, 7/01/2046 | |
| Federal National Mortgage Association, 3.500%, 8/01/2046 | |
| Federal National Mortgage Association, 3.500%, 2/01/2047 | |
| Federal National Mortgage Association, 3.500%, 6/01/2047 | |
| Federal National Mortgage Association, 3.500%, 9/01/2047 | |
| Federal National Mortgage Association, 3.500%, 11/01/2047 | |
| Federal National Mortgage Association, 3.500%, 11/01/2049 | |
| Federal National Mortgage Association, 3.500%, 2/01/2050 | |
| Federal National Mortgage Association, 3.500%, 5/01/2052 | |
| Federal National Mortgage Association, 3.500%, 6/01/2052 | |
| Federal National Mortgage Association, 3.500%, 6/01/2062 | |
| Federal National Mortgage Association, 3.500%, 9/01/2062 | |
| Federal National Mortgage Association, 3.500%, 12/01/2062 | |
| Federal National Mortgage Association, 3.500%, 12/01/2062 | |
| Federal National Mortgage Association, 3.500%, 6/01/2063 | |
See accompanying notes to financial statements.
Portfolio of Investments – as of September 30, 2024Loomis Sayles Core Plus Bond Fund (continued) | | |
|
| Mortgage Related — continued | |
| Federal National Mortgage Association, 3.500%, 9/01/2063 | |
| Federal National Mortgage Association, 4.000%, 9/01/2041 | |
| Federal National Mortgage Association, 4.000%, 8/01/2042 | |
| Federal National Mortgage Association, 4.000%, 11/01/2044 | |
| Federal National Mortgage Association, 4.000%, 2/01/2045 | |
| Federal National Mortgage Association, 4.000%, 7/01/2046 | |
| Federal National Mortgage Association, 4.000%, 8/01/2046 | |
| Federal National Mortgage Association, 4.000%, 4/01/2047 | |
| Federal National Mortgage Association, 4.000%, 4/01/2047 | |
| Federal National Mortgage Association, 4.000%, 4/01/2047 | |
| Federal National Mortgage Association, 4.000%, 4/01/2047 | |
| Federal National Mortgage Association, 4.000%, 6/01/2047 | |
| Federal National Mortgage Association, 4.000%, 11/01/2047 | |
| Federal National Mortgage Association, 4.000%, 12/01/2047 | |
| Federal National Mortgage Association, 4.000%, 3/01/2048 | |
| Federal National Mortgage Association, 4.000%, 6/01/2048 | |
| Federal National Mortgage Association, 4.000%, 2/01/2050 | |
| Federal National Mortgage Association, 4.000%, 5/01/2052 | |
| Federal National Mortgage Association, 4.000%, 6/01/2052 | |
| Federal National Mortgage Association, 4.000%, 7/01/2052 | |
| Federal National Mortgage Association, 4.000%, 8/01/2052 | |
| Federal National Mortgage Association, 4.000%, 11/01/2052 | |
| Federal National Mortgage Association, 4.500%, 8/01/2043 | |
| Federal National Mortgage Association, 4.500%, 3/01/2044 | |
| Federal National Mortgage Association, 4.500%, 5/01/2044 | |
| Federal National Mortgage Association, 4.500%, 1/01/2045 | |
| Federal National Mortgage Association, 4.500%, 1/01/2045 | |
| Federal National Mortgage Association, 4.500%, 7/01/2045 | |
| Federal National Mortgage Association, 4.500%, 8/01/2045 | |
| Federal National Mortgage Association, 4.500%, 8/01/2045 | |
| Federal National Mortgage Association, 4.500%, 10/01/2045 | |
| | |
|
| Mortgage Related — continued | |
| Federal National Mortgage Association, 4.500%, 11/01/2045 | |
| Federal National Mortgage Association, 4.500%, 3/01/2046 | |
| Federal National Mortgage Association, 4.500%, 7/01/2046 | |
| Federal National Mortgage Association, 4.500%, 9/01/2046 | |
| Federal National Mortgage Association, 4.500%, 2/01/2047 | |
| Federal National Mortgage Association, 4.500%, 5/01/2047 | |
| Federal National Mortgage Association, 4.500%, 7/01/2048 | |
| Federal National Mortgage Association, 4.500%, 8/01/2048 | |
| Federal National Mortgage Association, 4.500%, 10/01/2049 | |
| Federal National Mortgage Association, 4.500%, 3/01/2053 | |
| Federal National Mortgage Association, 4.500%, 4/01/2053 | |
| Federal National Mortgage Association, 5.000%, 7/01/2048 | |
| Federal National Mortgage Association, 5.000%, 8/01/2048 | |
| Federal National Mortgage Association, 5.000%, 9/01/2048 | |
| Federal National Mortgage Association, 5.000%, 1/01/2049 | |
| Federal National Mortgage Association, 5.000%, 3/01/2049 | |
| Federal National Mortgage Association, 5.000%, 5/01/2053 | |
| Federal National Mortgage Association, 5.500%, 4/01/2050 | |
| Federal National Mortgage Association, 5.500%, 7/01/2053 | |
| Federal National Mortgage Association, 5.500%, 7/01/2053 | |
| Federal National Mortgage Association, 5.500%, 7/01/2053 | |
| Federal National Mortgage Association, 6.000%, 8/01/2034 | |
| Federal National Mortgage Association, 6.000%, 1/01/2037 | |
| Federal National Mortgage Association, 6.000%, 5/01/2049 | |
| Federal National Mortgage Association, 6.000%, 5/01/2053 | |
| Federal National Mortgage Association, 6.000%, 5/01/2053 | |
| Federal National Mortgage Association, 6.000%, 5/01/2053 | |
| Federal National Mortgage Association, 6.000%, 5/01/2053 | |
| Federal National Mortgage Association, 6.000%, 5/01/2053 | |
| Federal National Mortgage Association, 6.000%, 6/01/2053 | |
| Federal National Mortgage Association, 6.000%, 6/01/2053 | |
See accompanying notes to financial statements.
Portfolio of Investments – as of September 30, 2024Loomis Sayles Core Plus Bond Fund (continued) | | |
|
| Mortgage Related — continued | |
| Federal National Mortgage Association, 6.000%, 7/01/2053 | |
| Federal National Mortgage Association, 6.000%, 7/01/2053 | |
| Federal National Mortgage Association, 6.000%, 7/01/2053 | |
| Federal National Mortgage Association, 6.000%, 7/01/2053 | |
| Federal National Mortgage Association, 6.000%, 7/01/2053 | |
| Federal National Mortgage Association, 6.000%, 8/01/2053 | |
| Federal National Mortgage Association, 6.000%, 8/01/2053 | |
| Federal National Mortgage Association, 6.000%, 8/01/2053 | |
| Federal National Mortgage Association, 6.500%, 1/01/2029 | |
| Federal National Mortgage Association, 6.500%, 5/01/2031 | |
| Federal National Mortgage Association, 6.500%, 6/01/2053 | |
| Federal National Mortgage Association, 6.500%, 6/01/2053 | |
| Federal National Mortgage Association, 6.500%, 7/01/2053 | |
| Federal National Mortgage Association, 6.500%, 7/01/2053 | |
| Federal National Mortgage Association, 6.500%, 7/01/2053 | |
| Federal National Mortgage Association, 6.500%, 8/01/2053 | |
| Federal National Mortgage Association, 6.500%, 8/01/2053 | |
| Federal National Mortgage Association, 6.500%, 8/01/2053 | |
| Federal National Mortgage Association, 6.500%, 9/01/2053 | |
| Federal National Mortgage Association, 6.500%, 1/01/2054 | |
| Federal National Mortgage Association, 6.500%, 7/01/2054 | |
| Federal National Mortgage Association, 7.000%, 10/01/2030 | |
| Federal National Mortgage Association, 7.000%, 10/01/2030 | |
| Federal National Mortgage Association, 7.000%, 10/01/2053 | |
| Federal National Mortgage Association, 7.000%, 10/01/2053 | |
| Federal National Mortgage Association, 7.000%, 11/01/2053 | |
| Federal National Mortgage Association, 7.000%, 2/01/2054 | |
| Federal National Mortgage Association, 7.000%, 3/01/2054 | |
| Federal National Mortgage Association, 7.000%, 3/01/2054 | |
| Federal National Mortgage Association, 7.500%, 7/01/2030 | |
| Federal National Mortgage Association, 7.500%, 2/01/2032 | |
| | |
|
| Mortgage Related — continued | |
| Federal National Mortgage Association, 8.000%, 1/01/2054 | |
| Government National Mortgage Association, 5.500%, 4/15/2038 | |
| Government National Mortgage Association, 6.000%, 1/15/2029 | |
| Government National Mortgage Association, 6.000%, 4/15/2038 | |
| Government National Mortgage Association, 6.500%, 1/15/2029 | |
| Government National Mortgage Association, 6.500%, 2/15/2031 | |
| Government National Mortgage Association, 6.500%, 9/15/2032 | |
| Government National Mortgage Association, 6.500%, 9/15/2032 | |
| Government National Mortgage Association, 7.000%, 9/15/2025 | |
| Government National Mortgage Association, 7.500%, 10/15/2025 | |
| Government National Mortgage Association, 7.500%, 7/15/2030 | |
| Uniform Mortgage-Backed Security, TBA, 2.500%, 10/01/2054(d) | |
| | |
| |
| Boston Gas Co., 3.001%, 8/01/2029(a) | |
| Non-Agency Commercial Mortgage-Backed Securities — 1.5% |
| AOA Mortgage Trust, Series 2021-1177, Class A, 1 mo. USD SOFR + 0.989%, 6.086%, 10/15/2038(a)(c) | |
| Bank, Series 2019-BN16, Class A4, 4.005%, 2/15/2052 | |
| Bank, Series 2019-BN20, Class A3, 3.011%, 9/15/2062 | |
| Bank, Series 2019-BN22, Class A4, 2.978%, 11/15/2062 | |
| Bank, Series 2019-BN24, Class A3, 2.960%, 11/15/2062 | |
| BPR Trust, Series 2021-NRD, Class A, 1 mo. USD SOFR + 1.525%, 6.622%, 12/15/2038(a)(c) | |
| Citigroup Commercial Mortgage Trust, Series 2019-C7, Class A4, 3.102%, 12/15/2072 | |
| Citigroup Commercial Mortgage Trust, Series 2019-GC43, Class A4, 3.038%, 11/10/2052 | |
| Citigroup Commercial Mortgage Trust, Series 2020-GC46, Class A5, 2.717%, 2/15/2053 | |
| Commercial Mortgage Trust, Series 2010-C1, Class D, 5.985%, 7/10/2046(a)(c) | |
| Credit Suisse Mortgage Trust, Series 2014-USA, Class A1, 3.304%, 9/15/2037(a) | |
| Credit Suisse Mortgage Trust, Series 2014-USA, Class A2, 3.953%, 9/15/2037(a) | |
| DC Commercial Mortgage Trust, Series 2023-DC, Class A, 6.314%, 9/12/2040(a) | |
| Extended Stay America Trust, Series 2021-ESH, Class A, 1 mo. USD SOFR + 1.194%, 6.292%, 7/15/2038(a)(c) | |
See accompanying notes to financial statements.
Portfolio of Investments – as of September 30, 2024Loomis Sayles Core Plus Bond Fund (continued) | | |
|
| Non-Agency Commercial Mortgage-Backed Securities — continued |
| Extended Stay America Trust, Series 2021-ESH, Class D, 1 mo. USD SOFR + 2.364%, 7.462%, 7/15/2038(a)(c) | |
| GS Mortgage Securities Trust, Series 2011-GC5, Class C, 5.297%, 8/10/2044(a)(c) | |
| GS Mortgage Securities Trust, Series 2020-GC45, Class A5, 2.911%, 2/13/2053 | |
| WFRBS Commercial Mortgage Trust, Series 2011-C4, Class D, 5.149%, 6/15/2044(a)(c) | |
| | |
| |
| EPR Properties, 3.600%, 11/15/2031 | |
| |
| Klabin Austria GmbH, 7.000%, 4/03/2049(a) | |
| |
| Amgen, Inc., 5.750%, 3/02/2063 | |
| Teva Pharmaceutical Finance Netherlands III BV, 3.150%, 10/01/2026 | |
| Teva Pharmaceutical Finance Netherlands III BV, 7.125%, 1/31/2025 | |
| Viatris, Inc., 4.000%, 6/22/2050 | |
| | |
| Property & Casualty Insurance — 0.3% |
| Ardonagh Finco Ltd., 7.750%, 2/15/2031(a) | |
| Liberty Mutual Group, Inc., 3.950%, 5/15/2060(a) | |
| | |
| |
| Raizen Fuels Finance SA, 6.450%, 3/05/2034(a) | |
| Raizen Fuels Finance SA, 6.950%, 3/05/2054(a) | |
| Thaioil Treasury Center Co. Ltd., 3.750%, 6/18/2050(a) | |
| Thaioil Treasury Center Co. Ltd., 4.875%, 1/23/2043(a) | |
| | |
| |
| Alibaba Group Holding Ltd., 3.250%, 2/09/2061 | |
| Dick's Sporting Goods, Inc., 4.100%, 1/15/2052 | |
| Falabella SA, 3.375%, 1/15/2032(a) | |
| Lithia Motors, Inc., 4.375%, 1/15/2031(a) | |
| MercadoLibre, Inc., 3.125%, 1/14/2031 | |
| | |
| |
| Colombia Government International Bonds, 8.000%, 11/14/2035 | |
| Dominican Republic International Bonds, 6.600%, 6/01/2036(a) | |
| Dominican Republic International Bonds, 7.050%, 2/03/2031(a) | |
| Republic of South Africa Government International Bonds, 7.300%, 4/20/2052 | |
| | |
| |
| Kroger Co., 5.500%, 9/15/2054 | |
| | |
|
| |
| Baidu, Inc., 3.075%, 4/07/2025 | |
| Broadcom, Inc., 3.137%, 11/15/2035(a) | |
| Corning, Inc., 5.450%, 11/15/2079 | |
| Equifax, Inc., 2.600%, 12/15/2025 | |
| Equifax, Inc., 7.000%, 7/01/2037 | |
| Hewlett Packard Enterprise Co., 6.200%, 10/15/2035 | |
| Iron Mountain, Inc., 4.500%, 2/15/2031(a) | |
| Jabil, Inc., 3.000%, 1/15/2031 | |
| Jabil, Inc., 5.450%, 2/01/2029 | |
| Oracle Corp., 4.100%, 3/25/2061 | |
| Sabre Global, Inc., 8.625%, 6/01/2027(a) | |
| Science Applications International Corp., 4.875%, 4/01/2028(a) | |
| Sensata Technologies, Inc., 3.750%, 2/15/2031(a) | |
| TD SYNNEX Corp., 6.100%, 4/12/2034 | |
| Tencent Holdings Ltd., 3.290%, 6/03/2060(a) | |
| Ziff Davis, Inc., 4.625%, 10/15/2030(a) | |
| | |
| |
| Brazil Notas do Tesouro Nacional, 10.000%, 1/01/2033, (BRL) | |
| Mexico Bonos, 5.750%, 3/05/2026, (MXN) | |
| Mexico Bonos, 8.500%, 5/31/2029, (MXN) | |
| U.S. Treasury Bonds, 1.750%, 8/15/2041 | |
| U.S. Treasury Bonds, 2.000%, 11/15/2041 | |
| U.S. Treasury Bonds, 2.375%, 2/15/2042 | |
| U.S. Treasury Bonds, 3.000%, 11/15/2044 | |
| U.S. Treasury Bonds, 3.250%, 5/15/2042 | |
| U.S. Treasury Bonds, 3.375%, 8/15/2042 | |
| U.S. Treasury Bonds, 3.625%, 2/15/2053 | |
| U.S. Treasury Bonds, 3.875%, 2/15/2043 | |
| U.S. Treasury Bonds, 3.875%, 5/15/2043 | |
| U.S. Treasury Bonds, 4.125%, 8/15/2053 | |
| U.S. Treasury Bonds, 4.250%, 2/15/2054 | |
| U.S. Treasury Bonds, 4.250%, 8/15/2054 | |
| U.S. Treasury Bonds, 4.500%, 2/15/2044 | |
| U.S. Treasury Bonds, 4.625%, 5/15/2044 | |
| U.S. Treasury Bonds, 4.625%, 5/15/2054 | |
| U.S. Treasury Bonds, 4.750%, 11/15/2043 | |
| U.S. Treasury Notes, 2.750%, 7/31/2027 | |
| U.S. Treasury Notes, 2.750%, 8/15/2032 | |
| U.S. Treasury Notes, 2.875%, 5/15/2032 | |
| U.S. Treasury Notes, 3.125%, 8/31/2029 | |
| U.S. Treasury Notes, 3.375%, 5/15/2033 | |
| U.S. Treasury Notes, 3.500%, 1/31/2028 | |
| U.S. Treasury Notes, 3.500%, 4/30/2028 | |
| U.S. Treasury Notes, 3.500%, 9/30/2029 | |
| U.S. Treasury Notes, 3.500%, 1/31/2030 | |
| U.S. Treasury Notes, 3.500%, 2/15/2033 | |
| U.S. Treasury Notes, 3.625%, 3/31/2028 | |
| U.S. Treasury Notes, 3.625%, 8/31/2029 | |
| U.S. Treasury Notes, 3.625%, 9/30/2031 | |
| U.S. Treasury Notes, 3.750%, 12/31/2028 | |
| U.S. Treasury Notes, 3.750%, 6/30/2030 | |
| U.S. Treasury Notes, 3.750%, 8/31/2031 | |
| U.S. Treasury Notes, 3.875%, 11/30/2027 | |
| U.S. Treasury Notes, 3.875%, 12/31/2027 | |
| U.S. Treasury Notes, 3.875%, 11/30/2029 | |
| U.S. Treasury Notes, 3.875%, 8/15/2033 | |
See accompanying notes to financial statements.
Portfolio of Investments – as of September 30, 2024Loomis Sayles Core Plus Bond Fund (continued) | | |
|
| |
| U.S. Treasury Notes, 3.875%, 8/15/2034 | |
| U.S. Treasury Notes, 4.000%, 2/15/2034 | |
| U.S. Treasury Notes, 4.125%, 9/30/2027 | |
| U.S. Treasury Notes, 4.125%, 10/31/2027 | |
| U.S. Treasury Notes, 4.125%, 3/31/2031 | |
| U.S. Treasury Notes, 4.125%, 11/15/2032 | |
| U.S. Treasury Notes, 4.250%, 6/30/2029 | |
| U.S. Treasury Notes, 4.500%, 11/15/2033 | |
| Uruguay Government International Bonds, 8.250%, 5/21/2031, (UYU) | |
| Uruguay Government International Bonds, 8.500%, 3/15/2028, (UYU)(a) | |
| Uruguay Government International Bonds, 8.500%, 3/15/2028, (UYU) | |
| Uruguay Government International Bonds, 9.750%, 7/20/2033, (UYU) | |
| | |
| |
| Bharti Airtel Ltd., 4.375%, 6/10/2025(a) | |
| Crown Castle, Inc., 4.150%, 7/01/2050 | |
| Empresa Nacional de Telecomunicaciones SA, 3.050%, 9/14/2032(a) | |
| Millicom International Cellular SA, 4.500%, 4/27/2031(a) | |
| SBA Communications Corp., 3.125%, 2/01/2029 | |
| Sitios Latinoamerica SAB de CV, 5.375%, 4/04/2032(a) | |
| | |
| |
| AT&T, Inc., 3.500%, 9/15/2053 | |
| AT&T, Inc., 3.550%, 9/15/2055 | |
| AT&T, Inc., 3.650%, 6/01/2051 | |
| AT&T, Inc., 3.650%, 9/15/2059 | |
| AT&T, Inc., 3.800%, 12/01/2057 | |
| | |
| Total Non-Convertible Bonds
(Identified Cost $7,530,003,318) | |
|
|
|
| |
| University of Virginia, 3.227%, 9/01/2119
(Identified Cost $12,785,000) | |
| Total Bonds and Notes
(Identified Cost $7,542,788,318) | |
|
|
Collateralized Loan Obligations — 3.8% |
| 37 Capital CLO 1 Ltd., Series 2021-1A, Class D, 3 mo. USD SOFR + 3.782%, 9.083%, 10/15/2034(a)(c) | |
| 37 Capital CLO II Ltd., Series 2022-1A, Class CR, 3 mo. USD SOFR + 2.200%, 7.501%, 7/15/2034(a)(c) | |
| 37 Capital CLO II Ltd., Series 2022-1A, Class DR, 3 mo. USD SOFR + 3.400%, 8.701%, 7/15/2034(a)(c) | |
| 720 East CLO IV Ltd., Series 2024-1A, Class C, 3 mo. USD SOFR + 2.400%, 7.695%, 4/15/2037(a)(c) | |
| AGL CLO 21 Ltd., Series 2022-21A, Class BR, 3 mo. USD SOFR + 1.650%, 6.830%, 10/21/2037(a)(c) | |
| | |
|
| AGL CLO 30 Ltd., Series 2024-30A, Class B, 3 mo. USD SOFR + 2.050%, 7.332%, 4/21/2037(a)(c) | |
| Anchorage Capital CLO 13 LLC, Series 2019-13A, Class B1R, 3 mo. USD SOFR + 2.062%, 7.363%, 4/15/2034(a)(c) | |
| Anchorage Capital CLO 19 Ltd., Series 2021-19A, Class B1, 3 mo. USD SOFR + 2.112%, 7.413%, 10/15/2034(a)(c) | |
| Anchorage Capital CLO 28 Ltd., Series 2024-28A, Class B, 3 mo. USD SOFR + 2.250%, 7.535%, 4/20/2037(a)(c) | |
| Anchorage Capital CLO 29 Ltd., Series 2024-29A, Class B1, 3 mo. USD SOFR + 2.150%, 7.471%, 7/20/2037(a)(c) | |
| Atlas Senior Loan Fund Ltd., Series 2017-8A, Class B, 3 mo. USD SOFR + 1.932%, 7.218%, 1/16/2030(a)(c) | |
| Atrium XV, Series 15A, Class B1R, 3 mo. USD SOFR + 1.800%, 7.138%, 7/16/2037(a)(c) | |
| Atrium XV, Series 15A, Class D1R, 3 mo. USD SOFR + 3.300%, 8.638%, 7/16/2037(a)(c) | |
| Bain Capital CLO Ltd., Series 2024-1A, Class B, 3 mo. USD SOFR + 2.000%, 7.325%, 4/16/2037(a)(c) | |
| Bain Capital Credit CLO Ltd., Series 2021-7A, Class D, 3 mo. USD SOFR + 3.512%, 8.794%, 1/22/2035(a)(c) | |
| Bain Capital Credit CLO Ltd., Series 2023-1A, Class D, 3 mo. USD SOFR + 4.900%, 10.186%, 4/16/2036(a)(c) | |
| Bain Capital Credit CLO Ltd., Series 2024-4A, Class B, 3 mo. USD SOFR + 1.650%, 6.520%, 10/23/2037(a)(c) | |
| Balboa Bay Loan Funding Ltd., Series 2023-1A, Class BR, 3 mo. USD SOFR + 2.050%, 7.332%, 4/20/2036(a)(c) | |
| Ballyrock CLO Ltd., Series 2019-1A, Class A2R, 3 mo. USD SOFR + 1.812%, 7.113%, 7/15/2032(a)(c) | |
| Barings CLO Ltd., Series 2018-2A, Class B2R, 3 mo. USD SOFR + 1.750%, 6.986%, 7/15/2036(a)(c) | |
| Battalion CLO VIII Ltd., Series 2015-8A, Class BR2, 3 mo. USD SOFR + 2.262%, 7.541%, 7/18/2030(a)(c) | |
| Battalion CLO X Ltd., Series 2016-10A, Class A1R2, 3 mo. USD SOFR + 1.432%, 6.715%, 1/25/2035(a)(c) | |
| Battalion CLO XIX Ltd., Series 2021-19A, Class D, 3 mo. USD SOFR + 3.512%, 8.813%, 4/15/2034(a)(c) | |
| Betony CLO 2 Ltd., Series 2018-1A, Class A2, 3 mo. USD SOFR + 1.862%, 7.117%, 4/30/2031(a)(c) | |
| Birch Grove CLO 9 Ltd., Series 2024-9A, Class C, 3 mo. USD SOFR + 2.000%, 7.182%, 10/22/2037(a)(c) | |
| BlueMountain CLO XXIX Ltd., Series 2020-29A, Class BR, 3 mo. USD SOFR + 2.012%, 7.296%, 7/25/2034(a)(c) | |
See accompanying notes to financial statements.
Portfolio of Investments – as of September 30, 2024Loomis Sayles Core Plus Bond Fund (continued) | | |
|
| Bryant Park Funding Ltd., Series 2024-22A, Class A1, 3 mo. USD SOFR + 1.620%, 6.933%, 4/15/2037(a)(c) | |
| Canyon CLO Ltd., Series 2018-1A, Class B, 3 mo. USD SOFR + 1.962%, 7.263%, 7/15/2031(a)(c) | |
| Canyon CLO Ltd., Series 2021-4A, Class B, 3 mo. USD SOFR + 1.962%, 7.263%, 10/15/2034(a)(c) | |
| Carlyle Global Market Strategies CLO Ltd., Series 2015-5A, Class A2R3, 3 mo. USD SOFR + 1.650%, 6.932%, 1/20/2032(a)(c) | |
| CarVal CLO III Ltd., Series 2019-2A, Class DR, 3 mo. USD SOFR + 3.212%, 8.494%, 7/20/2032(a)(c) | |
| Carval CLO X-C Ltd., Series 2024-2A, Class A, 3 mo. USD SOFR + 1.460%, 6.748%, 7/20/2037(a)(c) | |
| Cayuga Park CLO Ltd., Series 2020-1A, Class B1R, 3 mo. USD SOFR + 1.912%, 7.197%, 7/17/2034(a)(c) | |
| Cerberus Loan Funding XLVII LLC, Series 2024-3A, Class A, 3 mo. USD SOFR + 1.750%, 7.082%, 7/15/2036(a)(c) | |
| CIFC Funding Ltd., Series 2018-1A, Class B, 3 mo. USD SOFR + 1.662%, 6.941%, 4/18/2031(a)(c) | |
| CIFC Funding Ltd., Series 2020-1A, Class BR, 3 mo. USD SOFR + 1.912%, 7.213%, 7/15/2036(a)(c) | |
| CIFC Funding Ltd., Series 2020-3A, Class DR, 3 mo. USD SOFR + 3.362%, 8.644%, 10/20/2034(a)(c) | |
| CIFC Funding Ltd., Series 2021-7A, Class D, 3 mo. USD SOFR + 3.262%, 8.545%, 1/23/2035(a)(c) | |
| CIFC Funding Ltd., Series 2024-3A, Class B, 3 mo. USD SOFR + 1.850%, 7.183%, 7/21/2037(a)(c) | |
| Clover CLO LLC, Series 2018-1A, Class A1RR, 3 mo. USD SOFR + 1.530%, 6.854%, 4/20/2037(a)(c) | |
| Clover CLO Ltd., Series 2019-1A, Class BR, 3 mo. USD SOFR + 1.850%, 7.129%, 4/18/2035(a)(c) | |
| Crown City CLO III, Series 2021-1A, Class A1A, 3 mo. USD SOFR + 1.432%, 6.714%, 7/20/2034(a)(c) | |
| Elmwood CLO 26 Ltd., Series 2024-1A, Class B, 3 mo. USD SOFR + 2.000%, 7.292%, 4/18/2037(a)(c) | |
| Generate CLO 13 Ltd., Series 2023-13A, Class A1, 3 mo. USD SOFR + 1.800%, 7.083%, 1/20/2037(a)(c) | |
| Generate CLO 7 Ltd., Series 7A, Class A1R, 3 mo. USD SOFR + 1.620%, 6.902%, 4/22/2037(a)(c) | |
| Generate CLO 9 Ltd., Series 9A, Class A, 3 mo. USD SOFR + 1.462%, 6.744%, 10/20/2034(a)(c) | |
| Golub Capital Partners CLO 72 B Ltd., Series 2024-72A, Class B, 3 mo. USD SOFR + 2.100%, 7.396%, 4/25/2037(a)(c) | |
| | |
|
| Greywolf CLO VI Ltd., Series 2018-1A, Class A2, 3 mo. USD SOFR + 1.892%, 7.171%, 4/26/2031(a)(c) | |
| KKR CLO 22 Ltd., Series 22A, Class B, 3 mo. USD SOFR + 1.862%, 7.144%, 7/20/2031(a)(c) | |
| Long Point Park CLO Ltd., Series 2017-1A, Class A2, 3 mo. USD SOFR + 1.637%, 6.922%, 1/17/2030(a)(c) | |
| Madison Park Funding XL Ltd., Series 9A, Class BR2, 3 mo. USD SOFR + 1.762%, 6.823%, 5/28/2030(a)(c) | |
| Madison Park Funding XLII Ltd., Series 13A, Class B, 3 mo. USD SOFR + 1.762%, 7.045%, 11/21/2030(a)(c) | |
| Madison Park Funding XXII Ltd., Series 2016-22A, Class BR, 3 mo. USD SOFR + 1.862%, 7.163%, 1/15/2033(a)(c) | |
| Madison Park Funding XXXV Ltd., Series 2019-35A, Class CR, 3 mo. USD SOFR + 2.162%, 7.444%, 4/20/2032(a)(c) | |
| Madison Park Funding XXXVIII Ltd., Series 2021-38A, Class B, 3 mo. USD SOFR + 1.912%, 7.197%, 7/17/2034(a)(c) | |
| Milos CLO Ltd., Series 2017-1A, Class BR, 3 mo. USD SOFR + 1.812%, 7.094%, 10/20/2030(a)(c) | |
| Nassau Ltd., Series 2022-1A, Class CR, 3 mo. USD SOFR + 2.700%, 8.001%, 1/15/2031(a)(c) | |
| Neuberger Berman CLO XIV Ltd., Series 2013-14A, Class BR2, 3 mo. USD SOFR + 1.762%, 7.025%, 1/28/2030(a)(c) | |
| Neuberger Berman CLO XIV Ltd., Series 2013-14A, Class CR2, 3 mo. USD SOFR + 2.162%, 7.425%, 1/28/2030(a)(c) | |
| Neuberger Berman Loan Advisers CLO 27 Ltd., Series 2018-27A, Class D1R, 3 mo. USD SOFR + 3.100%, 8.401%, 7/15/2038(a)(c) | |
| NYACK Park CLO Ltd., Series 2021-1A, Class D, 3 mo. USD SOFR + 3.062%, 8.344%, 10/20/2034(a)(c) | |
| Octagon Investment Partners 31 Ltd., Series 2017-1A, Class B1RR, 3 mo. USD SOFR + 1.500%, 6.782%, 7/20/2030(a)(c) | |
| Octagon Investment Partners 32 Ltd., Series 2017-1A, Class CR, 3 mo. USD SOFR + 2.312%, 7.613%, 7/15/2029(a)(c) | |
| Octagon Investment Partners 49 Ltd., Series 2020-5A, Class CR, 3 mo. USD SOFR + 2.400%, 7.701%, 4/15/2037(a)(c) | |
| OHA Credit Funding 17 Ltd., Series 2024-17A, Class B1, 3 mo. USD SOFR + 1.900%, 7.213%, 4/20/2037(a)(c) | |
| OHA Credit Funding 3 Ltd., Series 2019-3A, Class BR, 3 mo. USD SOFR + 1.912%, 7.194%, 7/02/2035(a)(c) | |
| OHA Credit Funding 8 Ltd., Series 2021-8A, Class B1, 3 mo. USD SOFR + 1.762%, 7.041%, 1/18/2034(a)(c) | |
| OHA Credit Partners XI Ltd., Series 2015-11A, Class B1R2, 3 mo. USD SOFR + 1.800%, 7.082%, 4/20/2037(a)(c) | |
| Palmer Square BDC CLO 1 Ltd., Series 1A, Class A, 3 mo. USD SOFR + 1.600%, 6.925%, 7/15/2037(a)(c) | |
See accompanying notes to financial statements.
Portfolio of Investments – as of September 30, 2024Loomis Sayles Core Plus Bond Fund (continued) | | |
|
| Palmer Square BDC CLO 1 Ltd., Series 1A, Class B1, 3 mo. USD SOFR + 2.150%, 7.475%, 7/15/2037(a)(c) | |
| Palmer Square CLO Ltd., Series 2015-2A, Class BR2, 3 mo. USD SOFR + 2.212%, 7.494%, 7/20/2030(a)(c) | |
| Palmer Square CLO Ltd., Series 2019-1A, Class A2R, 3 mo. USD SOFR + 1.962%, 7.078%, 11/14/2034(a)(c) | |
| Palmer Square CLO Ltd., Series 2024-2A, Class D1, 3 mo. USD SOFR + 2.950%, 8.244%, 7/20/2037(a)(c) | |
| Palmer Square Loan Funding Ltd., Series 2021-1A, Class B, 3 mo. USD SOFR + 2.062%, 7.344%, 4/20/2029(a)(c) | |
| Palmer Square Loan Funding Ltd., Series 2021-4A, Class A2, 3 mo. USD SOFR + 1.662%, 6.963%, 10/15/2029(a)(c) | |
| Palmer Square Loan Funding Ltd., Series 2022-2A, Class A2, 3 mo. USD SOFR + 1.900%, 7.201%, 10/15/2030(a)(c) | |
| Palmer Square Loan Funding Ltd., Series 2022-4A, Class A2, 3 mo. USD SOFR + 2.300%, 7.583%, 7/24/2031(a)(c) | |
| Point Au Roche Park CLO Ltd., Series 2021-1A, Class B1, 3 mo. USD SOFR + 1.862%, 7.144%, 7/20/2034(a)(c) | |
| Post CLO Ltd., Series 2021-1A, Class B, 3 mo. USD SOFR + 2.012%, 7.313%, 10/15/2034(a)(c) | |
| Post CLO Ltd., Series 2022-1A, Class B, 3 mo. USD SOFR + 1.900%, 7.182%, 4/20/2035(a)(c) | |
| Post CLO Ltd., Series 2024-1A, Class B, 3 mo. USD SOFR + 2.100%, 7.372%, 4/20/2037(a)(c) | |
| PPM CLO 5 Ltd., Series 2021-5A, Class B, 3 mo. USD SOFR + 1.962%, 7.241%, 10/18/2034(a)(c) | |
| Reese Park CLO Ltd., Series 2020-1A, Class BR, 3 mo. USD SOFR + 1.912%, 7.213%, 10/15/2034(a)(c) | |
| Rockford Tower CLO Ltd., Series 2017-1A, Class BR2A, 3 mo. USD SOFR + 1.912%, 7.194%, 4/20/2034(a)(c) | |
| Rockford Tower CLO Ltd., Series 2021-2A, Class B, 3 mo. USD SOFR + 2.012%, 7.294%, 7/20/2034(a)(c) | |
| Rockland Park CLO Ltd., Series 2021-1A, Class B, 3 mo. USD SOFR + 1.912%, 7.194%, 4/20/2034(a)(c) | |
| RR 26 Ltd., Series 2023-26A, Class A1, 3 mo. USD SOFR + 1.780%, 7.081%, 4/15/2038(a)(c) | |
| RR 28 Ltd., Series 2024-28RA, Class A2R, 3 mo. USD SOFR + 2.050%, 7.351%, 4/15/2037(a)(c) | |
| Signal Peak CLO 1 Ltd., Series 2014-1A, Class AR3, 3 mo. USD SOFR + 1.422%, 6.707%, 4/17/2034(a)(c) | |
| Silver Point CLO 4 Ltd., Series 2024-4A, Class A1, 3 mo. USD SOFR + 1.630%, 6.887%, 4/15/2037(a)(c) | |
| Sixth Street CLO XXIV Ltd., Series 2024-24A, Class A, 3 mo. USD SOFR + 1.520%, 6.815%, 4/23/2037(a)(c) | |
| Sycamore Tree CLO Ltd., Series 2023-2A, Class CR, 3 mo. USD SOFR + 2.750%, 8.032%, 1/20/2037(a)(c) | |
| | |
|
| TICP CLO XII Ltd., Series 2018-12A, Class BR, 3 mo. USD SOFR + 1.912%, 7.213%, 7/15/2034(a)(c) | |
| Trestles CLO IV Ltd., Series 2021-4A, Class A, 3 mo. USD SOFR + 1.432%, 6.714%, 7/21/2034(a)(c) | |
| Wellfleet CLO Ltd., Series 2024-1A, Class B, 3 mo. USD SOFR + 2.050%, 7.372%, 7/18/2037(a)(c) | |
| Wellfleet CLO X Ltd., Series 2019-XA, Class BR, 3 mo. USD SOFR + 2.462%, 7.744%, 7/20/2032(a)(c) | |
| Wellington Management CLO 1 Ltd., Series 2023-1A, Class C, 3 mo. USD SOFR + 3.100%, 8.382%, 10/20/2036(a)(c) | |
| Total Collateralized Loan Obligations
(Identified Cost $302,194,617) | |
|
|
Short-Term Investments — 4.6% |
| Tri-Party Repurchase Agreement with Fixed Income Clearing Corporation, dated 9/30/2024 at 3.000% to be repurchased at $94,127,557 on 10/01/2024 collateralized by $70,026,300 U.S. Treasury Bond, 1.875% due 2/15/2041 valued at $51,731,968; $48,636,100 U.S. Treasury Bond, 3.375% due 8/15/2042 valued at $44,270,283 including accrued interest (Note 2 of Notes to Financial Statements) | |
| Federal Home Loan Bank Discount Notes, 4.630%, 10/03/2024(g) | |
| Federal Home Loan Bank Discount Notes, 4.650%, 10/07/2024(g) | |
| Federal Home Loan Bank Discount Notes, 4.650%, 10/09/2024(g) | |
| Federal Home Loan Bank Discount Notes, 4.650%, 10/15/2024(g) | |
| U.S. Treasury Bills, 4.500%, 10/03/2024(g) | |
| U.S. Treasury Bills, 5.176%–5.195%, 10/17/2024(g)(h)(i) | |
| Total Short-Term Investments
(Identified Cost $365,643,633) | |
| Total Investments — 99.6%
(Identified Cost $8,210,626,568) | |
| Other assets less liabilities — 0.4% | |
| | |
| See Note 2 of Notes to Financial Statements. |
| Principal Amount stated in U.S. dollars unless otherwise noted. |
| All or a portion of these securities are exempt from registration under Rule 144A of the Securities Act of 1933. These securities may be resold in transactions exempt from registration, normally to qualified institutional buyers. At September 30, 2024, the value of Rule 144A holdings amounted to $1,718,371,804 or 21.6% of net assets. |
| Level 3 security. Value has been determined using significant unobservable inputs. See Note 3 of Notes to Financial Statements. |
See accompanying notes to financial statements.
Portfolio of Investments – as of September 30, 2024Loomis Sayles Core Plus Bond Fund (continued) | Variable rate security. Rate as of September 30, 2024 is disclosed. Issuers comprised of various lots with differing coupon rates have been aggregated for the purpose of presentation in the Portfolio of Investments and show a weighted average rate. Certain variable rate securities are not based on a published reference rate and spread, rather are determined by the issuer or agent and are based on current market conditions. These securities may not indicate a reference rate and/or spread in their description. |
| When–issued/delayed delivery. |
| Amount shown represents units. One unit represents a principal amount of 1,000. |
| Amount shown represents units. One unit represents a principal amount of 100. |
| Interest rate represents discount rate at time of purchase; not a coupon rate. |
| Security (or a portion thereof) has been pledged as collateral for open derivative contracts. |
| The Fund's investment in U.S. Government/Agency securities is comprised of various lots with differing discount rates. These separate investments, which have the same maturity date, have been aggregated for the purpose of presentation in the Portfolio of Investments. |
| |
| |
| |
| |
| Real Estate Investment Trusts |
| Real Estate Mortgage Investment Conduits |
| Secured Overnight Financing Rate |
| |
At September 30, 2024, the Fund had the following open long futures contracts:
| | | | | Unrealized
Appreciation
(Depreciation) |
CBOT 10 Year U.S. Treasury Notes Futures | | | | | |
CBOT Ultra Long-Term U.S. Treasury Bond Futures | | | | | |
Ultra 10 Year U.S. Treasury Notes Futures | | | | | |
| | | | | |
Industry Summary at September 30, 2024
| |
| |
| |
| |
Other Investments, less than 2% each | |
Collateralized Loan Obligations | |
| |
| |
Other assets less liabilities (including futures contracts) | |
| |
See accompanying notes to financial statements.
Portfolio of Investments – as of September 30, 2024Loomis Sayles Global Allocation Fund
| | |
Common Stocks — 67.6% of Net Assets |
| |
| | |
| |
| LVMH Moet Hennessy Louis Vuitton SE | |
| |
| | |
| |
| Nomura Research Institute Ltd. | |
| |
| | |
| |
| | |
| |
| Taiwan Semiconductor Manufacturing Co. Ltd. | |
| |
| | |
| London Stock Exchange Group PLC | |
| | |
| |
| | |
| | |
| Allison Transmission Holdings, Inc. | |
| | |
| | |
| | |
| Builders FirstSource, Inc.(a) | |
| | |
| | |
| | |
| | |
| Goldman Sachs Group, Inc. | |
| | |
| | |
| | |
| | |
| Mastercard, Inc., Class A | |
| Mettler-Toledo International, Inc.(a) | |
| | |
| O'Reilly Automotive, Inc.(a) | |
| | |
| | |
| | |
| | |
| | |
| | |
| | |
| | |
| | |
| | |
| Total Common Stocks
(Identified Cost $1,435,563,658) | |
| | |
|
|
|
Non-Convertible Bonds — 28.4% |
| |
| AngloGold Ashanti Holdings PLC, 3.375%, 11/01/2028 | |
| Australia Government Bonds, 0.500%, 9/21/2026, (AUD) | |
| Australia Government Bonds, 3.000%, 11/21/2033, (AUD) | |
| GAIF Bond Issuer Pty. Ltd., 3.400%, 9/30/2026(b) | |
| Glencore Funding LLC, 6.500%, 10/06/2033(b) | |
| Macquarie Group Ltd., (fixed rate to 1/14/2032, variable rate thereafter), 2.871%, 1/14/2033(b) | |
| New South Wales Treasury Corp., 2.000%, 3/08/2033, (AUD) | |
| Sydney Airport Finance Co. Pty. Ltd., 3.375%, 4/30/2025(b) | |
| | |
| |
| Anheuser-Busch InBev SA, EMTN, 2.000%, 1/23/2035, (EUR) | |
| |
| Brazil Government International Bonds, 6.000%, 10/20/2033 | |
| Brazil Notas do Tesouro Nacional, 10.000%, 1/01/2031, (BRL) | |
| Brazil Notas do Tesouro Nacional, 10.000%, 1/01/2035, (BRL) | |
| Centrais Eletricas Brasileiras SA, 4.625%, 2/04/2030(b) | |
| Raizen Fuels Finance SA, 5.300%, 1/20/2027(b) | |
| Suzano Austria GmbH, 2.500%, 9/15/2028 | |
| Suzano Austria GmbH, 3.750%, 1/15/2031 | |
| Suzano Austria GmbH, Series DM3N, 3.125%, 1/15/2032 | |
| | |
| |
| 1011778 BC ULC/New Red Finance, Inc., 4.000%, 10/15/2030(b) | |
| 1011778 BC ULC/New Red Finance, Inc., 5.625%, 9/15/2029(b) | |
| Air Canada Pass-Through Trust, Series 2015-2, Class A, 4.125%, 6/15/2029(b) | |
| Air Canada Pass-Through Trust, Series 2017-1, Class AA, 3.300%, 7/15/2031(b) | |
| Antares Holdings LP, 3.750%, 7/15/2027(b) | |
| Antares Holdings LP, 3.950%, 7/15/2026(b) | |
| Antares Holdings LP, 7.950%, 8/11/2028(b) | |
| Bell Telephone Co. of Canada or Bell Canada, MTN, 3.600%, 9/29/2027, (CAD) | |
| Brookfield Finance I U.K. PLC/Brookfield Finance, Inc., 2.340%, 1/30/2032 | |
| Brookfield Finance, Inc., 3.900%, 1/25/2028 | |
| Brookfield Renewable Partners ULC, MTN, 4.250%, 1/15/2029, (CAD) | |
| Canada Government Bonds, 4.000%, 8/01/2026, (CAD) | |
See accompanying notes to financial statements.
Portfolio of Investments – as of September 30, 2024Loomis Sayles Global Allocation Fund (continued) | | |
|
| |
| Enbridge Gas, Inc., MTN, 2.900%, 4/01/2030, (CAD) | |
| Enbridge, Inc., MTN, 2.990%, 10/03/2029, (CAD) | |
| Federation des Caisses Desjardins du Quebec, (fixed rate to 5/26/2025, variable rate thereafter), 2.856%, 5/26/2030, (CAD) | |
| Ontario Power Generation, Inc., MTN, 2.977%, 9/13/2029, (CAD) | |
| Province of Quebec, 4.500%, 9/08/2033 | |
| Rogers Communications, Inc., 3.300%, 12/10/2029, (CAD) | |
| Toronto-Dominion Bank, MTN, 1.150%, 6/12/2025 | |
| Videotron Ltd., 5.125%, 4/15/2027(b) | |
| | |
| |
| Antofagasta PLC, 2.375%, 10/14/2030 | |
| Antofagasta PLC, 5.625%, 5/13/2032 | |
| Antofagasta PLC, 6.250%, 5/02/2034(b) | |
| Banco Santander Chile, 3.177%, 10/26/2031(b) | |
| Chile Government International Bonds, 2.550%, 1/27/2032 | |
| Colbun SA, 3.150%, 3/06/2030 | |
| Corp. Nacional del Cobre de Chile, 3.000%, 9/30/2029(b) | |
| Corp. Nacional del Cobre de Chile, 6.300%, 9/08/2053(b) | |
| Empresa Nacional de Telecomunicaciones SA, 3.050%, 9/14/2032(b) | |
| Empresa Nacional del Petroleo, 3.450%, 9/16/2031(b) | |
| Enel Chile SA, 4.875%, 6/12/2028 | |
| Engie Energia Chile SA, 3.400%, 1/28/2030 | |
| Engie Energia Chile SA, 6.375%, 4/17/2034(b) | |
| Sociedad Quimica y Minera de Chile SA, 5.500%, 9/10/2034(b) | |
| Sociedad Quimica y Minera de Chile SA, 6.500%, 11/07/2033(b) | |
| Transelec SA, 4.250%, 1/14/2025(b) | |
| | |
| |
| Tencent Holdings Ltd., 2.880%, 4/22/2031(b) | |
| |
| Colombia Government International Bonds, 3.125%, 4/15/2031 | |
| Colombia Government International Bonds, 3.875%, 4/25/2027 | |
| Colombia Government International Bonds, 7.500%, 2/02/2034 | |
| Colombia TES, 6.250%, 11/26/2025, (COP) | |
| Colombia TES, 7.500%, 8/26/2026, (COP) | |
| Ecopetrol SA, 5.875%, 5/28/2045 | |
| Empresas Publicas de Medellin ESP, 4.250%, 7/18/2029(b) | |
| | |
| | |
|
| |
| CEZ AS, EMTN, 0.875%, 12/02/2026, (EUR) | |
| CEZ AS, EMTN, 3.000%, 6/05/2028, (EUR) | |
| | |
| |
| Danske Bank AS, EMTN, (fixed rate to 6/21/2029, variable rate thereafter), 4.750%, 6/21/2030, (EUR) | |
| Orsted AS, EMTN, 2.125%, 5/17/2027, (GBP) | |
| | |
| Dominican Republic — 0.2% |
| Dominican Republic International Bonds, 4.500%, 1/30/2030(b) | |
| Dominican Republic International Bonds, 4.875%, 9/23/2032(b) | |
| Dominican Republic International Bonds, 5.950%, 1/25/2027(b) | |
| Dominican Republic International Bonds, 6.000%, 7/19/2028(b) | |
| Dominican Republic International Bonds, 8.625%, 4/20/2027(b) | |
| | |
| |
| BNP Paribas SA, 4.375%, 5/12/2026(b) | |
| BNP Paribas SA, (fixed rate to 1/09/2029, variable rate thereafter), 5.176%, 1/09/2030(b) | |
| Electricite de France SA, 4.875%, 9/21/2038(b) | |
| Engie SA, 1.250%, 10/24/2041, (EUR) | |
| Societe Generale SA, 4.750%, 11/24/2025(b) | |
| Societe Generale SA, (fixed rate to 1/19/2034, variable rate thereafter), 6.066%, 1/19/2035(b) | |
| | |
| |
| Deutsche Bank AG, (fixed rate to 1/07/2027, variable rate thereafter), 2.552%, 1/07/2028 | |
| Deutsche Bank AG, (fixed rate to 10/07/2031, variable rate thereafter), 3.742%, 1/07/2033 | |
| Deutsche Bank AG, (fixed rate to 10/14/2030, variable rate thereafter), 3.729%, 1/14/2032 | |
| Mercedes-Benz Finance North America LLC, 4.800%, 8/01/2029(b) | |
| Siemens Financieringsmaatschappij NV, 2.350%, 10/15/2026(b) | |
| ZF North America Capital, Inc., 6.750%, 4/23/2030(b) | |
| ZF North America Capital, Inc., 6.875%, 4/14/2028(b) | |
| ZF North America Capital, Inc., 6.875%, 4/23/2032(b) | |
| ZF North America Capital, Inc., 7.125%, 4/14/2030(b) | |
| | |
| |
| CT Trust, 5.125%, 2/03/2032(b) | |
| |
| Bharti Airtel Ltd., 3.250%, 6/03/2031 | |
See accompanying notes to financial statements.
Portfolio of Investments – as of September 30, 2024Loomis Sayles Global Allocation Fund (continued) | | |
|
| |
| Export-Import Bank of India, 2.250%, 1/13/2031(b) | |
| Power Finance Corp. Ltd., 3.950%, 4/23/2030(b) | |
| Shriram Finance Ltd., 4.150%, 7/18/2025(b) | |
| | |
| |
| Indonesia Treasury Bonds, 7.000%, 9/15/2030, (IDR) | |
| Indonesia Treasury Bonds, 7.500%, 5/15/2038, (IDR) | |
| | |
| |
| AerCap Ireland Capital DAC/AerCap Global Aviation Trust, 3.300%, 1/30/2032 | |
| AIB Group PLC, (fixed rate to 9/13/2028, variable rate thereafter), 6.608%, 9/13/2029(b) | |
| Ireland Government Bonds, Zero Coupon, 0.029%, 10/18/2031, (EUR)(d) | |
| | |
| |
| Israel Electric Corp. Ltd., GMTN, 3.750%, 2/22/2032(b) | |
| Teva Pharmaceutical Finance Co. LLC, 6.150%, 2/01/2036 | |
| Teva Pharmaceutical Finance Netherlands III BV, 3.150%, 10/01/2026 | |
| Teva Pharmaceutical Finance Netherlands III BV, 4.100%, 10/01/2046 | |
| Teva Pharmaceutical Finance Netherlands III BV, 4.750%, 5/09/2027 | |
| Teva Pharmaceutical Finance Netherlands III BV, 5.125%, 5/09/2029 | |
| Teva Pharmaceutical Finance Netherlands III BV, 7.875%, 9/15/2029 | |
| Teva Pharmaceutical Finance Netherlands III BV, 8.125%, 9/15/2031 | |
| | |
| |
| Intesa Sanpaolo SpA, 5.710%, 1/15/2026(b) | |
| Intesa Sanpaolo SpA, 6.625%, 6/20/2033(b) | |
| Italy Buoni Poliennali Del Tesoro, 3.350%, 7/01/2029, (EUR) | |
| Italy Buoni Poliennali Del Tesoro, 3.850%, 9/15/2026, (EUR) | |
| Italy Buoni Poliennali Del Tesoro, 3.850%, 7/01/2034, (EUR) | |
| UniCredit SpA, (fixed rate to 4/02/2029, variable rate thereafter), 7.296%, 4/02/2034(b) | |
| UniCredit SpA, (fixed rate to 6/19/2027, variable rate thereafter), 5.861%, 6/19/2032(b) | |
| | |
|
| |
| UniCredit SpA, (fixed rate to 6/30/2030, variable rate thereafter), 5.459%, 6/30/2035(b) | |
| UniCredit SpA, EMTN, (fixed rate to 7/22/2026, variable rate thereafter), 2.200%, 7/22/2027, (EUR) | |
| | |
| |
| Japan Government CPI-Linked Bonds, 0.100%, 3/10/2028, (JPY) | |
| Japan Government Ten Year Bonds, 1.100%, 6/20/2034, (JPY) | |
| Mizuho Financial Group, Inc., 2.564%, 9/13/2031 | |
| Nomura Holdings, Inc., 1.851%, 7/16/2025 | |
| Nomura Holdings, Inc., 2.710%, 1/22/2029 | |
| Sumitomo Mitsui Financial Group, Inc., 5.766%, 1/13/2033 | |
| | |
| |
| Kia Corp., 2.750%, 2/14/2027(b) | |
| Korea East-West Power Co. Ltd., 1.750%, 5/06/2025(b) | |
| Korea Treasury Bonds, 1.125%, 9/10/2025, (KRW) | |
| Korea Treasury Bonds, 1.500%, 12/10/2030, (KRW) | |
| Korea Treasury Bonds, 3.500%, 9/10/2028, (KRW) | |
| Shinhan Bank Co. Ltd., 3.875%, 3/24/2026(b) | |
| SK Hynix, Inc., 2.375%, 1/19/2031(b) | |
| SK Hynix, Inc., 6.375%, 1/17/2028(b) | |
| SK Telecom Co. Ltd., 6.625%, 7/20/2027(b) | |
| | |
| |
| ArcelorMittal SA, 6.750%, 3/01/2041 | |
| Blackstone Property Partners Europe Holdings SARL, EMTN, 1.625%, 4/20/2030, (EUR) | |
| Logicor Financing SARL, EMTN, 0.875%, 1/14/2031, (EUR) | |
| Logicor Financing SARL, EMTN, 1.625%, 1/17/2030, (EUR) | |
| Logicor Financing SARL, EMTN, 2.000%, 1/17/2034, (EUR) | |
| | |
| |
| Alfa SAB de CV, 6.875%, 3/25/2044 | |
| America Movil SAB de CV, 2.125%, 3/10/2028, (EUR) | |
| America Movil SAB de CV, 2.875%, 5/07/2030 | |
| Banco Santander Mexico SA Institucion de Banca Multiple Grupo Financiero Santand, 5.375%, 4/17/2025(b) | |
| Cemex SAB de CV, 3.875%, 7/11/2031(b) | |
| Cemex SAB de CV, 5.200%, 9/17/2030(b) | |
| Cemex SAB de CV, 5.450%, 11/19/2029 | |
| Cemex SAB de CV, (fixed rate to 6/08/2026, variable rate thereafter), 5.125%(b)(f) | |
See accompanying notes to financial statements.
Portfolio of Investments – as of September 30, 2024Loomis Sayles Global Allocation Fund (continued) | | |
|
| |
| Coca-Cola Femsa SAB de CV, 2.750%, 1/22/2030 | |
| Grupo Televisa SAB, EMTN, 7.250%, 5/14/2043, (MXN) | |
| Kimberly-Clark de Mexico SAB de CV, 2.431%, 7/01/2031 | |
| Kimberly-Clark de Mexico SAB de CV, 2.431%, 7/01/2031(b) | |
| Mexico Bonos, 5.750%, 3/05/2026, (MXN) | |
| Mexico Bonos, 7.500%, 6/03/2027, (MXN) | |
| Mexico Bonos, 8.500%, 5/31/2029, (MXN) | |
| Mexico Bonos, 8.500%, 11/18/2038, (MXN) | |
| Mexico Government International Bonds, 3.250%, 4/16/2030 | |
| Mexico Government International Bonds, 3.500%, 2/12/2034 | |
| Mexico Government International Bonds, 4.000%, 3/15/2115, (EUR) | |
| Mexico Government International Bonds, 4.875%, 5/19/2033 | |
| Mexico Government International Bonds, 6.000%, 5/07/2036 | |
| Mexico Government International Bonds, 6.338%, 5/04/2053 | |
| Orbia Advance Corp. SAB de CV, 1.875%, 5/11/2026(b) | |
| Orbia Advance Corp. SAB de CV, 4.000%, 10/04/2027 | |
| Sigma Finance Netherlands BV, 4.875%, 3/27/2028 | |
| | |
| |
| OCP SA, 6.750%, 5/02/2034(b) | |
| |
| Cooperatieve Rabobank UA, 4.375%, 8/04/2025 | |
| ING Groep NV, (fixed rate to 7/01/2025, variable rate thereafter), 1.400%, 7/01/2026(b) | |
| Netherlands Government Bonds, Zero Coupon, 2.523%, 1/15/2029, (EUR)(b)(d) | |
| | |
| |
| Fonterra Co-Operative Group Ltd., MTN, 3.750%, 6/16/2026, (AUD) | |
| Fonterra Co-Operative Group Ltd., MTN, 4.000%, 11/02/2027, (AUD) | |
| New Zealand Government Bonds, 1.500%, 5/15/2031, (NZD) | |
| New Zealand Government Bonds, 3.000%, 4/20/2029, (NZD) | |
| | |
| |
| Aker BP ASA, 6.000%, 6/13/2033(b) | |
| Equinor ASA, 3.625%, 4/06/2040 | |
| Norway Government Bonds, 1.375%, 8/19/2030, (NOK)(b) | |
| Norway Government Bonds, 1.500%, 2/19/2026, (NOK)(b) | |
| | |
|
| |
| Norway Government Bonds, 1.750%, 2/17/2027, (NOK)(b) | |
| Norway Government Bonds, 2.000%, 4/26/2028, (NOK)(b) | |
| Var Energi ASA, 8.000%, 11/15/2032(b) | |
| | |
| |
| Paraguay Government International Bonds, 4.950%, 4/28/2031(b) | |
| Paraguay Government International Bonds, 5.000%, 4/15/2026(b) | |
| | |
| |
| Corp. Financiera de Desarrollo SA, 2.400%, 9/28/2027(b) | |
| Transportadora de Gas del Peru SA, 4.250%, 4/30/2028(b) | |
| | |
| |
| Republic of Poland Government Bonds, 1.250%, 10/25/2030, (PLN) | |
| Republic of Poland Government Bonds, 3.250%, 7/25/2025, (PLN) | |
| | |
| |
| EDP Finance BV, 1.710%, 1/24/2028(b) | |
| |
| QatarEnergy, 2.250%, 7/12/2031(b) | |
| |
| Romania Government International Bonds, 2.000%, 4/14/2033, (EUR)(b) | |
| |
| Singapore Government Bonds, 2.125%, 6/01/2026, (SGD) | |
| |
| Anglo American Capital PLC, 2.625%, 9/10/2030(b) | |
| Anglo American Capital PLC, 5.625%, 4/01/2030(b) | |
| Republic of South Africa Government Bonds, 7.000%, 2/28/2031, (ZAR) | |
| Republic of South Africa Government Bonds, 8.875%, 2/28/2035, (ZAR) | |
| Republic of South Africa Government International Bonds, 5.750%, 9/30/2049 | |
| | |
| |
| Banco Santander SA, 6.938%, 11/07/2033 | |
| Banco Santander SA, (fixed rate to 9/14/2026, variable rate thereafter), 1.722%, 9/14/2027 | |
| CaixaBank SA, (fixed rate to 1/18/2028, variable rate thereafter), 6.208%, 1/18/2029(b) | |
| CaixaBank SA, EMTN, (fixed rate to 11/23/2027, variable rate thereafter), 6.250%, 2/23/2033, (EUR) | |
See accompanying notes to financial statements.
Portfolio of Investments – as of September 30, 2024Loomis Sayles Global Allocation Fund (continued) | | |
|
| |
| Cellnex Telecom SA, EMTN, 1.750%, 10/23/2030, (EUR) | |
| Naturgy Finance Iberia SA, EMTN, 1.500%, 1/29/2028, (EUR) | |
| Spain Government Bonds, 3.500%, 5/31/2029, (EUR) | |
| | |
| |
| International Bank for Reconstruction & Development, 1.200%, 7/22/2026, (CAD) | |
| Nordic Investment Bank, EMTN, 1.500%, 3/13/2025, (NOK) | |
| | |
| |
| Swedbank AB, 6.136%, 9/12/2026(b) | |
| Sweden Government Bonds, 0.125%, 5/12/2031, (SEK) | |
| Sweden Government Bonds, 2.500%, 5/12/2025, (SEK) | |
| | |
| |
| Novartis Capital Corp., 2.000%, 2/14/2027 | |
| UBS Group AG, (fixed rate to 11/15/2032, variable rate thereafter), 9.016%, 11/15/2033(b) | |
| UBS Group AG, (fixed rate to 5/14/2031, variable rate thereafter), 3.091%, 5/14/2032(b) | |
| UBS Group AG, (fixed rate to 8/12/2032, variable rate thereafter), 6.537%, 8/12/2033(b) | |
| Willow No. 2 Ireland PLC for Zurich Insurance Co. Ltd., EMTN, (fixed rate to 10/01/2025, variable rate thereafter), 4.250%, 10/01/2045 | |
| | |
| |
| TSMC Arizona Corp., 2.500%, 10/25/2031 | |
| Trinidad And Tobago — 0.0% |
| Trinidad Generation UnLtd, 5.250%, 11/04/2027(b) | |
| |
| Republic of Turkiye, 6.500%, 1/03/2035 | |
| TC Ziraat Bankasi AS, 5.375%, 3/02/2026(b) | |
| Turkcell Iletisim Hizmetleri AS, 5.800%, 4/11/2028 | |
| Turkiye Government International Bonds, 5.250%, 3/13/2030 | |
| Turkiye Government International Bonds, 7.625%, 4/26/2029 | |
| | |
| United Arab Emirates — 0.0% |
| Abu Dhabi Government International Bonds, 3.125%, 4/16/2030(b) | |
| |
| BAE Systems PLC, 5.250%, 3/26/2031(b) | |
| BAE Systems PLC, 5.300%, 3/26/2034(b) | |
| | |
|
| United Kingdom — continued |
| CK Hutchison International 19 Ltd., 3.625%, 4/11/2029(b) | |
| Diageo Capital PLC, 2.125%, 4/29/2032 | |
| Macquarie Airfinance Holdings Ltd., 6.400%, 3/26/2029(b) | |
| Macquarie Airfinance Holdings Ltd., 6.500%, 3/26/2031(b) | |
| Nationwide Building Society, (fixed rate to 7/18/2029, variable rate thereafter), 3.960%, 7/18/2030(b) | |
| Santander U.K. Group Holdings PLC, (fixed rate to 1/11/2027, variable rate thereafter), 2.469%, 1/11/2028 | |
| Standard Chartered PLC, (fixed rate to 11/18/2030, variable rate thereafter), 3.265%, 2/18/2036(b) | |
| Standard Chartered PLC, (fixed rate to 3/30/2025, variable rate thereafter), 3.971%, 3/30/2026(b) | |
| Standard Chartered PLC, EMTN, 3.125%, 11/19/2024, (EUR) | |
| U.K. Gilts, 4.125%, 1/29/2027, (GBP) | |
| U.K. Gilts, 4.250%, 7/31/2034, (GBP) | |
| | |
| |
| Aircastle Ltd., Series A, (fixed rate to 6/15/2026, variable rate thereafter), 5.250%(b)(f) | |
| Albemarle Corp., 5.050%, 6/01/2032 | |
| American Airlines Pass-Through Trust, Series 2016-3, Class B, 3.750%, 4/15/2027 | |
| American Airlines Pass-Through Trust, Series B, Class B, 3.700%, 4/15/2027 | |
| American Airlines Pass-Through Trust, Series B, Class B, 4.950%, 8/15/2026 | |
| Aptiv PLC, 1.600%, 9/15/2028, (EUR) | |
| Ashland, Inc., 3.375%, 9/01/2031(b) | |
| Bank of America Corp., (fixed rate to 3/08/2032, variable rate thereafter), 3.846%, 3/08/2037 | |
| Bank of America Corp., (fixed rate to 9/15/2026, variable rate thereafter), 1.978%, 9/15/2027, (CAD) | |
| Bank of America Corp., (fixed rate to 9/21/2031, variable rate thereafter), 2.482%, 9/21/2036 | |
| Bausch & Lomb Corp., 8.375%, 10/01/2028(b) | |
| Bausch Health Cos., Inc., 4.875%, 6/01/2028(b) | |
| Block, Inc., 3.500%, 6/01/2031 | |
| Blue Owl Capital Corp., 4.250%, 1/15/2026 | |
| Blue Owl Finance LLC, 6.250%, 4/18/2034(b) | |
| Blue Owl Technology Finance Corp., 2.500%, 1/15/2027 | |
| Blue Owl Technology Finance Corp., 4.750%, 12/15/2025(b) | |
| Boeing Co., 3.625%, 2/01/2031 | |
| Boeing Co., 5.150%, 5/01/2030 | |
| Boeing Co., 5.705%, 5/01/2040 | |
| Boeing Co., 5.805%, 5/01/2050 | |
| Boeing Co., 5.930%, 5/01/2060 | |
See accompanying notes to financial statements.
Portfolio of Investments – as of September 30, 2024Loomis Sayles Global Allocation Fund (continued) | | |
|
| United States — continued |
| Boeing Co., 6.528%, 5/01/2034(b) | |
| Boeing Co., 6.858%, 5/01/2054(b) | |
| Boeing Co., 7.008%, 5/01/2064(b) | |
| BPR Trust, Series 2021-NRD, Class E, 1 mo. USD SOFR + 5.621%, 10.718%, 12/15/2038(b)(h) | |
| BPR Trust, Series 2021-NRD, Class F, 1 mo. USD SOFR + 6.870%, 11.967%, 12/15/2038(b)(h) | |
| Broadcom, Inc., 2.450%, 2/15/2031(b) | |
| Broadcom, Inc., 2.600%, 2/15/2033(b) | |
| Broadcom, Inc., 3.187%, 11/15/2036(b) | |
| Broadcom, Inc., 3.419%, 4/15/2033(b) | |
| Broadcom, Inc., 3.469%, 4/15/2034(b) | |
| Broadcom, Inc., 4.150%, 4/15/2032(b) | |
| Carnival Corp., 5.750%, 3/01/2027(b) | |
| Carnival Corp., 7.000%, 8/15/2029(b) | |
| CCO Holdings LLC/CCO Holdings Capital Corp., 4.250%, 2/01/2031(b) | |
| CCO Holdings LLC/CCO Holdings Capital Corp., 4.250%, 1/15/2034(b) | |
| CCO Holdings LLC/CCO Holdings Capital Corp., 4.750%, 2/01/2032(b) | |
| Celanese U.S. Holdings LLC, 6.330%, 7/15/2029 | |
| Celanese U.S. Holdings LLC, 6.379%, 7/15/2032 | |
| Celanese U.S. Holdings LLC, 6.700%, 11/15/2033 | |
| Centene Corp., 2.500%, 3/01/2031 | |
| Centene Corp., 3.000%, 10/15/2030 | |
| Charter Communications Operating LLC/Charter Communications Operating Capital, 3.950%, 6/30/2062 | |
| Charter Communications Operating LLC/Charter Communications Operating Capital, 4.400%, 4/01/2033 | |
| Charter Communications Operating LLC/Charter Communications Operating Capital, 4.400%, 12/01/2061 | |
| Civitas Resources, Inc., 8.625%, 11/01/2030(b) | |
| CommScope Technologies LLC, 5.000%, 3/15/2027(b) | |
| Continental Resources, Inc., 2.875%, 4/01/2032(b) | |
| Continental Resources, Inc., 5.750%, 1/15/2031(b) | |
| CSC Holdings LLC, 3.375%, 2/15/2031(b) | |
| CSC Holdings LLC, 4.125%, 12/01/2030(b) | |
| CSC Holdings LLC, 4.500%, 11/15/2031(b) | |
| CSC Holdings LLC, 4.625%, 12/01/2030(b) | |
| CSC Holdings LLC, 5.000%, 11/15/2031(b) | |
| CSC Holdings LLC, 5.375%, 2/01/2028(b) | |
| CSC Holdings LLC, 5.750%, 1/15/2030(b) | |
| CSC Holdings LLC, 7.500%, 4/01/2028(b) | |
| DH Europe Finance II SARL, 0.750%, 9/18/2031, (EUR) | |
| Dillard's, Inc., 7.000%, 12/01/2028 | |
| Dillard's, Inc., 7.750%, 7/15/2026 | |
| Directv Financing LLC/Directv Financing Co-Obligor, Inc., 5.875%, 8/15/2027(b) | |
| | |
|
| United States — continued |
| DISH DBS Corp., 5.125%, 6/01/2029 | |
| DISH DBS Corp., 5.250%, 12/01/2026(b) | |
| DISH DBS Corp., 5.750%, 12/01/2028(b) | |
| DISH DBS Corp., 7.750%, 7/01/2026 | |
| EnLink Midstream LLC, 6.500%, 9/01/2030(b) | |
| EnLink Midstream Partners LP, 5.450%, 6/01/2047 | |
| EPR Properties, 3.600%, 11/15/2031 | |
| EQT Corp., 3.625%, 5/15/2031(b) | |
| Expedia Group, Inc., 2.950%, 3/15/2031 | |
| Freeport-McMoRan, Inc., 4.375%, 8/01/2028 | |
| Freeport-McMoRan, Inc., 5.400%, 11/14/2034 | |
| Gartner, Inc., 3.625%, 6/15/2029(b) | |
| Gartner, Inc., 3.750%, 10/01/2030(b) | |
| General Motors Financial Co., Inc., 3.100%, 1/12/2032 | |
| GLP Capital LP/GLP Financing II, Inc., 3.250%, 1/15/2032 | |
| Hess Midstream Operations LP, 4.250%, 2/15/2030(b) | |
| Hilton Grand Vacations Borrower Escrow LLC/Hilton Grand Vacations Borrower Escrow, Inc., 4.875%, 7/01/2031(b) | |
| Hologic, Inc., 3.250%, 2/15/2029(b) | |
| Hyundai Capital America, 5.400%, 6/24/2031(b) | |
| Hyundai Capital America, 6.375%, 4/08/2030(b) | |
| Icahn Enterprises LP/Icahn Enterprises Finance Corp., 4.375%, 2/01/2029 | |
| Icahn Enterprises LP/Icahn Enterprises Finance Corp., 5.250%, 5/15/2027 | |
| iHeartCommunications, Inc., 5.250%, 8/15/2027(b) | |
| Ingersoll Rand, Inc., 5.700%, 8/14/2033 | |
| Iron Mountain, Inc., 4.875%, 9/15/2029(b) | |
| JBS USA Holding Lux SARL/JBS USA Food Co./JBS Lux Co. SARL, 3.750%, 12/01/2031 | |
| Jefferies Financial Group, Inc., 6.200%, 4/14/2034 | |
| Lamb Weston Holdings, Inc., 4.875%, 5/15/2028, 144A(b) | |
| Light & Wonder International, Inc., 7.000%, 5/15/2028(b) | |
| Light & Wonder International, Inc., 7.250%, 11/15/2029(b) | |
| Light & Wonder International, Inc., 7.500%, 9/01/2031(b) | |
| Marriott Ownership Resorts, Inc., 4.500%, 6/15/2029(b) | |
| Matador Resources Co., 6.875%, 4/15/2028(b) | |
| Medline Borrower LP/Medline Co-Issuer, Inc., 6.250%, 4/01/2029(b) | |
| Medtronic Global Holdings SCA, 1.125%, 3/07/2027, (EUR) | |
| Micron Technology, Inc., 5.875%, 2/09/2033 | |
| Molina Healthcare, Inc., 3.875%, 5/15/2032(b) | |
| Molina Healthcare, Inc., 4.375%, 6/15/2028(b) | |
See accompanying notes to financial statements.
Portfolio of Investments – as of September 30, 2024Loomis Sayles Global Allocation Fund (continued) | | |
|
| United States — continued |
| Morgan Stanley, (fixed rate to 9/16/2031, variable rate thereafter), 2.484%, 9/16/2036 | |
| MSCI, Inc., 3.250%, 8/15/2033(b) | |
| NCL Corp. Ltd., 5.875%, 3/15/2026(b) | |
| NCL Corp. Ltd., 5.875%, 2/15/2027(b) | |
| NCL Corp. Ltd., 8.125%, 1/15/2029(b) | |
| NCL Finance Ltd., 6.125%, 3/15/2028(b) | |
| Netflix, Inc., 4.875%, 6/15/2030(b) | |
| NGPL PipeCo LLC, 7.768%, 12/15/2037(b) | |
| Ovintiv, Inc., 6.250%, 7/15/2033 | |
| Ovintiv, Inc., 6.500%, 8/15/2034 | |
| Ovintiv, Inc., 6.500%, 2/01/2038 | |
| Ovintiv, Inc., 6.625%, 8/15/2037 | |
| Ovintiv, Inc., 7.200%, 11/01/2031 | |
| Ovintiv, Inc., 7.375%, 11/01/2031 | |
| Ovintiv, Inc., 8.125%, 9/15/2030 | |
| Permian Resources Operating LLC, 6.250%, 2/01/2033(b) | |
| Pilgrim's Pride Corp., 3.500%, 3/01/2032 | |
| Pilgrim's Pride Corp., 4.250%, 4/15/2031 | |
| Plains All American Pipeline LP/PAA Finance Corp., 3.550%, 12/15/2029 | |
| Plains All American Pipeline LP/PAA Finance Corp., 3.800%, 9/15/2030 | |
| Post Holdings, Inc., 4.500%, 9/15/2031(b) | |
| Post Holdings, Inc., 6.250%, 10/15/2034(b) | |
| Prologis Euro Finance LLC, 0.250%, 9/10/2027, (EUR) | |
| Prologis Euro Finance LLC, 1.875%, 1/05/2029, (EUR) | |
| Prologis LP, 2.250%, 6/30/2029, (GBP) | |
| Realty Income Corp., 5.125%, 7/06/2034, (EUR) | |
| Realty Income Corp., EMTN, 1.625%, 12/15/2030, (GBP) | |
| Rocket Mortgage LLC/Rocket Mortgage Co-Issuer, Inc., 2.875%, 10/15/2026(b) | |
| Rocket Mortgage LLC/Rocket Mortgage Co-Issuer, Inc., 3.625%, 3/01/2029 | |
| Rocket Mortgage LLC/Rocket Mortgage Co-Issuer, Inc., 3.625%, 3/01/2029(b) | |
| Rocket Mortgage LLC/Rocket Mortgage Co-Issuer, Inc., 3.875%, 3/01/2031(b) | |
| Rocket Mortgage LLC/Rocket Mortgage Co-Issuer, Inc., 4.000%, 10/15/2033(b) | |
| Royal Caribbean Cruises Ltd., 4.250%, 7/01/2026(b) | |
| Royal Caribbean Cruises Ltd., 5.500%, 4/01/2028(b) | |
| Royal Caribbean Cruises Ltd., 5.625%, 9/30/2031(b) | |
| Royal Caribbean Cruises Ltd., 6.000%, 2/01/2033(b) | |
| Royal Caribbean Cruises Ltd., 6.250%, 3/15/2032(b) | |
| Ryan Specialty LLC, 5.875%, 8/01/2032(b) | |
| Sensata Technologies BV, 4.000%, 4/15/2029(b) | |
| Sensata Technologies, Inc., 3.750%, 2/15/2031(b) | |
| Sensata Technologies, Inc., 6.625%, 7/15/2032(b) | |
| | |
|
| United States — continued |
| Silgan Holdings, Inc., 3.250%, 3/15/2025, (EUR) | |
| SM Energy Co., 6.500%, 7/15/2028 | |
| SM Energy Co., 6.750%, 8/01/2029(b) | |
| SM Energy Co., 7.000%, 8/01/2032(b) | |
| Tapestry, Inc., 3.050%, 3/15/2032 | |
| Targa Resources Corp., 6.125%, 3/15/2033 | |
| Targa Resources Partners LP/Targa Resources Partners Finance Corp., 4.000%, 1/15/2032 | |
| Targa Resources Partners LP/Targa Resources Partners Finance Corp., 4.875%, 2/01/2031 | |
| TD SYNNEX Corp., 6.100%, 4/12/2034 | |
| Thermo Fisher Scientific Finance I BV, 2.000%, 10/18/2051, (EUR) | |
| Thermo Fisher Scientific, Inc., EMTN, 1.500%, 10/01/2039, (EUR) | |
| Time Warner Cable LLC, 4.500%, 9/15/2042 | |
| Time Warner Cable LLC, 5.500%, 9/01/2041 | |
| T-Mobile USA, Inc., 3.875%, 4/15/2030 | |
| TopBuild Corp., 4.125%, 2/15/2032(b) | |
| TransDigm, Inc., 6.750%, 8/15/2028(b) | |
| Travel & Leisure Co., 4.500%, 12/01/2029(b) | |
| Travel & Leisure Co., 4.625%, 3/01/2030(b) | |
| TriNet Group, Inc., 3.500%, 3/01/2029(b) | |
| U.S. Airways Pass-Through Trust, Series 2012-2, Class A, 4.625%, 12/03/2026 | |
| U.S. Treasury Bonds, 2.250%, 2/15/2052 | |
| U.S. Treasury Bonds, 3.625%, 5/15/2053 | |
| U.S. Treasury Bonds, 4.125%, 8/15/2053 | |
| U.S. Treasury Inflation-Indexed Notes, 1.375%, 7/15/2033(i) | |
| U.S. Treasury Notes, 3.500%, 9/30/2026 | |
| U.S. Treasury Notes, 4.000%, 2/15/2034 | |
| U.S. Treasury Notes, 4.375%, 7/31/2026 | |
| U.S. Treasury Notes, 4.500%, 3/31/2026(j) | |
| U.S. Treasury Notes, 4.625%, 2/28/2026 | |
| Uber Technologies, Inc., 4.500%, 8/15/2029(b) | |
| Uber Technologies, Inc., 4.800%, 9/15/2034 | |
| Uber Technologies, Inc., 6.250%, 1/15/2028(b) | |
| Uber Technologies, Inc., 7.500%, 9/15/2027(b) | |
| Uber Technologies, Inc., 8.000%, 11/01/2026(b) | |
| United Airlines Pass-Through Trust, Series 16-2, Class B, 3.650%, 4/07/2027 | |
| United Rentals North America, Inc., 6.125%, 3/15/2034(b) | |
| Venture Global Calcasieu Pass LLC, 3.875%, 11/01/2033(b) | |
| Venture Global Calcasieu Pass LLC, 4.125%, 8/15/2031(b) | |
| Venture Global Calcasieu Pass LLC, 6.250%, 1/15/2030(b) | |
| Verizon Communications, Inc., 2.500%, 5/16/2030, (CAD) | |
| VICI Properties LP/VICI Note Co., Inc., 4.250%, 12/01/2026(b) | |
| Viper Energy, Inc., 7.375%, 11/01/2031(b) | |
See accompanying notes to financial statements.
Portfolio of Investments – as of September 30, 2024Loomis Sayles Global Allocation Fund (continued) | | |
|
| United States — continued |
| VMware LLC, 2.200%, 8/15/2031 | |
| Western Digital Corp., 2.850%, 2/01/2029 | |
| Western Digital Corp., 3.100%, 2/01/2032 | |
| Western Midstream Operating LP, 4.050%, 2/01/2030 | |
| Western Midstream Operating LP, 5.250%, 2/01/2050 | |
| Western Midstream Operating LP, 5.300%, 3/01/2048 | |
| Western Midstream Operating LP, 5.450%, 4/01/2044 | |
| Western Midstream Operating LP, 5.500%, 8/15/2048 | |
| Western Midstream Operating LP, 6.150%, 4/01/2033 | |
| Yum! Brands, Inc., 4.625%, 1/31/2032 | |
| | |
| |
| Uruguay Government International Bonds, 8.250%, 5/21/2031, (UYU) | |
| Total Non-Convertible Bonds
(Identified Cost $917,069,781) | |
|
|
|
| |
| BioMarin Pharmaceutical, Inc., 1.250%, 5/15/2027 | |
| Carnival Corp., 5.750%, 12/01/2027 | |
| DISH Network Corp., 3.375%, 8/15/2026 | |
| DISH Network Corp., Zero Coupon, 0.000%-9.514%, 12/15/2025(k) | |
| Southwest Airlines Co., 1.250%, 5/01/2025 | |
| Spotify USA, Inc., Zero Coupon, 5.189%-5.873%, 3/15/2026(k) | |
| Uber Technologies, Inc., Series 2028, 0.875%, 12/01/2028(b) | |
| Zillow Group, Inc., 1.375%, 9/01/2026 | |
| Total Convertible Bonds
(Identified Cost $54,688,070) | |
|
|
|
| |
| Tobacco Settlement Financing Corp., Series A-1, 6.706%-, 6/01/2046
(Identified cost $114,990) | |
| Total Bonds and Notes
(Identified Cost $971,872,841) | |
|
|
|
| |
| Ardonagh Midco 3 PLC, 2024 USD Term Loan B, 2/15/2031(l) | |
| |
| Alliant Holdings Intermediate LLC, 2024 Term Loan B6, 9/19/2031(l) | |
| Asplundh Tree Expert LLC, 2024 Incremental Term Loan B, 1 mo. USD SOFR + 1.750%, 6.595%, 5/23/2031(h) | |
| Boost Newco Borrower LLC, 2024 USD Term Loan B, 3 mo. USD SOFR + 2.500%, 7.104%, 1/31/2031(h)(m) | |
| | |
|
| United States — continued |
| Carnival Corp., 2024 Term Loan B1, 1 mo. USD SOFR + 2.750%, 7.595%, 10/18/2028(h)(m) | |
| Carnival Corp., 2024 Term Loan B2, 1 mo. USD SOFR + 2.750%, 7.595%, 8/08/2027(h)(m) | |
| Foundation Building Materials Holding Co. LLC, 2024 Term Loan B2, 3 mo. USD SOFR + 4.000%, 9.252%, 1/29/2031(h)(m) | |
| Hilton Domestic Operating Co., Inc., 2023 Term Loan B4, 1 mo. USD SOFR + 1.750%, 6.605%, 11/08/2030(h) | |
| Hilton Grand Vacations Borrower LLC, 2021 Term Loan B, 1 mo. USD SOFR + 2.500%, 7.345%, 8/02/2028(h)(m) | |
| Hilton Grand Vacations Borrower LLC, 2024 Incremental Term Loan B, 1 mo. USD SOFR + 2.250%, 7.095%, 1/17/2031(h)(m) | |
| HUB International Ltd., 2024 1st Lien Term Loan B, 3 mo. USD SOFR + 3.000%, 8.255%, 6/20/2030(h)(m) | |
| Light & Wonder International, Inc., 2024 Term Loan B2, 1 mo. USD SOFR + 2.250%, 7.333%, 4/14/2029(h)(m) | |
| Resideo Funding, Inc., 2024 M&A Term Loan B, 3 mo. USD SOFR + 2.000%, 7.301%, 6/13/2031(h)(m) | |
| Resideo Funding, Inc., 2024 Term Loan B, 1 mo. USD SOFR + 2.000%, 6.855%, 2/11/2028(h)(m) | |
| Ryan Specialty Group LLC, 2024 USD Term Loan B, 1 mo. USD SOFR + 2.250%, 7.095%, 9/15/2031(h)(m) | |
| Six Flags Entertainment Corp., 2024 Term Loan B, 1 mo. USD SOFR + 2.000%, 6.845%, 5/01/2031(h)(m) | |
| Star Parent, Inc., Term Loan B, 3 mo. USD SOFR + 3.750%, 8.354%, 9/27/2030(h)(m) | |
| Summit Materials LLC, 2023 Incremental Term Loan B, 3 mo. USD SOFR + 1.750%, 7.054%, 1/12/2029(h)(m) | |
| Trans Union LLC, 2024 Term Loan B8, 1 mo. USD SOFR + 1.750%, 6.595%, 6/24/2031(h)(m) | |
| TransDigm, Inc., 2023 Term Loan J, 3 mo. USD SOFR + 2.500%, 7.104%, 2/28/2031(h)(m) | |
| TransDigm, Inc., 2024 Term Loan I, 3 mo. USD SOFR + 2.750%, 7.354%, 8/24/2028(h)(m) | |
| Truist Insurance Holdings LLC, 1st Lien Term Loan, 3 mo. USD SOFR + 3.250%, 7.854%, 5/06/2031(h)(m) | |
| Wyndham Hotels & Resorts, Inc., 2024 Term Loan, 5/24/2030(l) | |
| Wyndham Hotels & Resorts, Inc., 2024 Term Loan, 1 mo. USD SOFR + 1.750%, 6.595%, 5/24/2030(h)(m) | |
| | |
| Total Senior Loans
(Identified Cost $18,501,461) | |
|
|
See accompanying notes to financial statements.
Portfolio of Investments – as of September 30, 2024Loomis Sayles Global Allocation Fund (continued) | | |
|
Short-Term Investments — 1.2% |
| Tri-Party Repurchase Agreement with Fixed Income Clearing Corporation, dated 9/30/2024 at 3.000% to be repurchased at $37,767,692 on 10/01/2024 collateralized by $38,563,600 U.S. Treasury Note, 3.500% due 9/30/2026 valued at $38,519,994 including accrued interest (Note 2 of Notes to Financial Statements)
(Identified Cost$37,764,545) | |
| Total Investments — 99.4%
(Identified Cost $2,463,702,505) | |
| Other assets less liabilities — 0.6% | |
| | |
| See Note 2 of Notes to Financial Statements. |
| Principal Amount stated in U.S. dollars unless otherwise noted. |
| Non-income producing security. |
| All or a portion of these securities are exempt from registration under Rule 144A of the Securities Act of 1933. These securities may be resold in transactions exempt from registration, normally to qualified institutional buyers. At September 30, 2024, the value of Rule 144A holdings amounted to $346,885,402 or 11.2% of net assets. |
| Amount shown represents units. One unit represents a principal amount of 1,000. |
| Interest rate represents annualized yield at time of purchase; not a coupon rate. |
| Amount shown represents principal amount including inflation adjustments. |
| Perpetual bond with no specified maturity date. |
| Amount shown represents units. One unit represents a principal amount of 100. |
| Variable rate security. Rate as of September 30, 2024 is disclosed. Issuers comprised of various lots with differing coupon rates have been aggregated for the purpose of presentation in the Portfolio of Investments and show a weighted average rate. Certain variable rate securities are not based on a published reference rate and spread, rather are determined by the issuer or agent and are based on current market conditions. These securities may not indicate a reference rate and/or spread in their description. |
| Treasury Inflation Protected Security (TIPS). |
| Security (or a portion thereof) has been pledged as collateral for open derivative contracts. |
| Interest rate represents annualized yield at time of purchase; not a coupon rate. The Fund’s investment in this security is comprised of various lots with differing annualized yields. |
| Position is unsettled. Contract rate was not determined at September 30, 2024 and does not take effect until settlement date. Maturity date is not finalized until settlement date. |
| Stated interest rate has been determined in accordance with the provisions of the loan agreement and is subject to a minimum benchmark floor rate which may range from 0.00% to 1.00%, to which the spread is added. |
| |
| |
| |
| |
| Secured Overnight Financing Rate |
At September 30, 2024, the Fund had the following open forward foreign currency contracts:
| | Currency
Bought/
Sold (B/S) | | | | Unrealized
Appreciation
(Depreciation) |
| | | | | | | |
| | | | | | | |
| | | | | | | |
| | | | | | | |
| | | | | | | |
| | | | | | | |
| | | | | | | |
| | | | | | | |
Morgan Stanley Capital Services LLC | | | | | | | |
See accompanying notes to financial statements.
Portfolio of Investments – as of September 30, 2024Loomis Sayles Global Allocation Fund (continued) | | | | | | Unrealized Appreciation (Depreciation) |
Morgan Stanley Capital Services LLC | | | | | | | |
| | | | | | | |
| | | | | | | |
At September 30, 2024, the Fund had the following open forward cross currency contracts:
| | | | | Unrealized
Appreciation
(Depreciation) |
Morgan Stanley Capital Services LLC | | | | | | | |
At September 30, 2024, the Fund had the following open long futures contracts:
| | | | | Unrealized
Appreciation
(Depreciation) |
CBOT 10 Year U.S. Treasury Notes Futures | | | | | |
CBOT 2 Year U.S. Treasury Notes Futures | | | | | |
CBOT 5 Year U.S. Treasury Notes Futures | | | | | |
| | | | | |
At September 30, 2024, the Fund had the following open short futures contracts:
| | | | | Unrealized
Appreciation
(Depreciation) |
CBOT U.S. Long Bond Futures | | | | | |
CBOT Ultra Long-Term U.S. Treasury Bond Futures | | | | | |
Ultra 10 Year U.S. Treasury Notes Futures | | | | | |
| | | | | |
See accompanying notes to financial statements.
Portfolio of Investments – as of September 30, 2024Loomis Sayles Global Allocation Fund (continued) Industry Summary at September 30, 2024
| |
Semiconductors & Semiconductor Equipment | |
| |
| |
Life Sciences Tools & Services | |
| |
| |
| |
| |
Interactive Media & Services | |
| |
| |
| |
Health Care Providers & Services | |
Consumer Staples Distribution & Retail | |
Hotels, Restaurants & Leisure | |
| |
Other Investments, less than 2% each | |
| |
| |
Other assets less liabilities (including forward foreign currency and futures contracts) | |
| |
Currency Exposure Summary at September 30, 2024
| |
| |
| |
| |
| |
| |
| |
| |
| |
Other assets less liabilities (including forward foreign currency and futures contracts) | |
| |
See accompanying notes to financial statements.
Portfolio of Investments – as of September 30, 2024Loomis Sayles Growth Fund
| | |
Common Stocks — 98.9% of Net Assets |
| Aerospace & Defense — 3.9% |
| | |
| Air Freight & Logistics — 1.4% |
| Expeditors International of Washington, Inc. | |
| |
| | |
| |
| Monster Beverage Corp.(a) | |
| |
| Regeneron Pharmaceuticals, Inc.(a) | |
| Vertex Pharmaceuticals, Inc.(a) | |
| | |
| |
| Alibaba Group Holding Ltd., ADR(b) | |
| | |
| | |
| |
| FactSet Research Systems, Inc. | |
| | |
| | |
| |
| | |
| | |
| | |
| Financial Services — 6.5% |
| | |
| | |
| | |
| | |
| Health Care Equipment & Supplies — 1.6% |
| Intuitive Surgical, Inc.(a) | |
| Hotels, Restaurants & Leisure — 3.1% |
| | |
| Yum China Holdings, Inc.(b) | |
| | |
| | |
| Interactive Media & Services — 13.8% |
| | |
| | |
| Meta Platforms, Inc., Class A | |
| | |
| |
| Shopify, Inc., Class A(a) | |
| Life Sciences Tools & Services — 2.5% |
| | |
| Thermo Fisher Scientific, Inc. | |
| | |
| |
| | |
| |
| | |
| | |
| | |
| | |
| | |
| Semiconductors & Semiconductor Equipment — 10.9% |
| | |
| | |
| | |
| |
| | |
| | |
| | |
| | |
| Workday, Inc., Class A(a) | |
| | |
| Textiles, Apparel & Luxury Goods — 1.1% |
| | |
| Total Common Stocks
(Identified Cost $6,710,934,243) | |
|
|
Affiliated Exchange-Traded Funds — 1.0% |
| Natixis Loomis Sayles Focused Growth ETF
(Identified Cost $133,847,928) | |
| | |
Short-Term Investments — 0.1% |
| Tri-Party Repurchase Agreement with Fixed Income Clearing Corporation, dated 9/30/2024 at 3.000% to be repurchased at $14,475,351 on 10/01/2024 collateralized by $14,780,400 U.S. Treasury Note, 3.500% due 9/30/2026 valued at $14,763,685 including accrued interest (Note 2 of Notes to Financial Statements)
(Identified Cost $14,474,145) | |
| Total Investments — 100.0%
(Identified Cost $6,859,256,316) | |
| Other assets less liabilities — 0.0% | |
| | |
| See Note 2 of Notes to Financial Statements. |
| Non-income producing security. |
| Security invests in variable interest entities based in China. See Note 9 of Notes to Financial Statements. |
| An American Depositary Receipt is a certificate issued by a custodian bank representing the right to receive securities of the foreign issuer described. The values of ADRs may be significantly influenced by trading on exchanges not located in the United States. |
| |
See accompanying notes to financial statements.
Portfolio of Investments – as of September 30, 2024Loomis Sayles Growth Fund (continued) Industry Summary at September 30, 2024
| |
Interactive Media & Services | |
Semiconductors & Semiconductor Equipment | |
| |
| |
| |
| |
| |
| |
| |
Hotels, Restaurants & Leisure | |
Life Sciences Tools & Services | |
| |
| |
| |
Other Investments, less than 2% each | |
Affiliated Exchange-Traded Funds | |
| |
| |
Other assets less liabilities | |
| |
See accompanying notes to financial statements.
Portfolio of Investments – as of September 30, 2024Loomis Sayles Intermediate Duration Bond Fund
| | |
Bonds and Notes — 98.0% of Net Assets |
| |
| Ally Auto Receivables Trust, Series 2022-3, Class A3, 5.070%, 4/15/2027 | |
| American Credit Acceptance Receivables Trust, Series 2022-4, Class C, 7.860%, 2/15/2029(a) | |
| American Credit Acceptance Receivables Trust, Series 2023-3, Class C, 6.440%, 10/12/2029(a) | |
| American Credit Acceptance Receivables Trust, Series 2023-4, Class B, 6.630%, 2/14/2028(a) | |
| AmeriCredit Automobile Receivables Trust, Series 2021-2, Class B, 0.690%, 1/19/2027 | |
| AmeriCredit Automobile Receivables Trust, Series 2021-3, Class C, 1.410%, 8/18/2027 | |
| AmeriCredit Automobile Receivables Trust, Series 2022-2, Class A3, 4.380%, 4/18/2028 | |
| AmeriCredit Automobile Receivables Trust, Series 2023-1, Class B, 5.570%, 3/20/2028 | |
| AmeriCredit Automobile Receivables Trust, Series 2024-1, Class A3, 5.430%, 1/18/2029 | |
| Avis Budget Rental Car Funding AESOP LLC, Series 2023-3A, Class A, 5.440%, 2/22/2028(a) | |
| Bridgecrest Lending Auto Securitization Trust, Series 2023-1, Class A3, 6.510%, 11/15/2027 | |
| Bridgecrest Lending Auto Securitization Trust, Series 2024-3, Class B, 5.370%, 10/16/2028 | |
| CarMax Auto Owner Trust, Series 2023-2, Class A3, 5.050%, 1/18/2028 | |
| Carvana Auto Receivables Trust, Series 2021-P4, Class A3, 1.310%, 1/11/2027 | |
| Carvana Auto Receivables Trust, Series 2023-N1, Class A, 6.360%, 4/12/2027(a) | |
| Carvana Auto Receivables Trust, Series 2023-P1, Class A3, 5.980%, 12/10/2027(a) | |
| Carvana Auto Receivables Trust, Series 2024-P2, Class A3, 5.330%, 7/10/2029 | |
| Carvana Auto Receivables Trust, Series 2024-P3, Class A3, 4.260%, 10/10/2029 | |
| Chase Auto Owner Trust, Series 2024-5A, Class A3, 4.180%, 8/27/2029(a) | |
| Citizens Auto Receivables Trust, Series 2024-1, Class A3, 5.110%, 4/17/2028(a) | |
| Credit Acceptance Auto Loan Trust, Series 2022-3A, Class A, 6.570%, 10/15/2032(a) | |
| Credit Acceptance Auto Loan Trust, Series 2023-1A, Class A, 6.480%, 3/15/2033(a) | |
| Credit Acceptance Auto Loan Trust, Series 2023-2A, Class B, 6.610%, 7/15/2033(a) | |
| Credit Acceptance Auto Loan Trust, Series 2023-3A, Class C, 7.620%, 12/15/2033(a) | |
| Credit Acceptance Auto Loan Trust, Series 2024-2A, Class A, 5.950%, 6/15/2034(a) | |
| Drive Auto Receivables Trust, Series 2024-2, Class B, 4.520%, 7/16/2029 | |
| DT Auto Owner Trust, Series 2021-4A, Class C, 1.500%, 9/15/2027(a) | |
| DT Auto Owner Trust, Series 2022-3A, Class B, 6.740%, 7/17/2028(a) | |
| DT Auto Owner Trust, Series 2023-2A, Class B, 5.410%, 2/15/2029(a) | |
| Exeter Automobile Receivables Trust, Series 2022-5A, Class B, 5.970%, 3/15/2027 | |
| | |
| |
| Exeter Automobile Receivables Trust, Series 2023-1A, Class B, 5.720%, 4/15/2027 | |
| Exeter Automobile Receivables Trust, Series 2023-2A, Class B, 5.610%, 9/15/2027 | |
| Exeter Automobile Receivables Trust, Series 2023-5A, Class A3, 6.320%, 3/15/2027 | |
| Flagship Credit Auto Trust, Series 2022-4, Class A3, 6.320%, 6/15/2027(a) | |
| Flagship Credit Auto Trust, Series 2023-1, Class A3, 5.010%, 8/16/2027(a) | |
| Flagship Credit Auto Trust, Series 2023-2, Class C, 5.810%, 5/15/2029(a) | |
| Ford Credit Auto Owner Trust, Series 2018-1, Class A, 3.190%, 7/15/2031(a) | |
| Ford Credit Auto Owner Trust, Series 2021-1, Class A, 1.370%, 10/17/2033(a) | |
| Foursight Capital Automobile Receivables Trust, Series 2022-1, Class A3, 1.830%, 12/15/2026(a) | |
| Foursight Capital Automobile Receivables Trust, Series 2022-2, Class A3, 4.590%, 6/15/2027(a) | |
| GECU Auto Receivables Trust, Series 2023-1A, Class A3, 5.630%, 8/15/2028(a) | |
| GLS Auto Receivables Issuer Trust, Series 2024-1A, Class A3, 5.400%, 9/15/2027(a) | |
| GLS Auto Receivables Issuer Trust, Series 2024-2A, Class B, 5.770%, 11/15/2028(a) | |
| GLS Auto Receivables Issuer Trust, Series 2024-3A, Class B, 5.080%, 1/16/2029(a) | |
| GLS Auto Select Receivables Trust, Series 2024-2A, Class A2, 5.580%, 6/17/2030(a) | |
| GLS Auto Select Receivables Trust, Series 2024-3A, Class A2, 5.590%, 10/15/2029(a) | |
| GM Financial Automobile Leasing Trust, Series 2024-3, Class A3, 4.210%, 10/20/2027 | |
| GM Financial Revolving Receivables Trust, Series 2024-1, Class A, 4.980%, 12/11/2036(a) | |
| Harley-Davidson Motorcycle Trust, Series 2023-B, Class A3, 5.690%, 8/15/2028 | |
| Harley-Davidson Motorcycle Trust, Series 2023-B, Class A4, 5.780%, 4/15/2031 | |
| Hertz Vehicle Financing III LLC, Series 2023-3A, Class A, 5.940%, 2/25/2028(a) | |
| Hertz Vehicle Financing III LLC, Series 2024-1A, Class A, 5.440%, 1/25/2029(a) | |
| Huntington Auto Trust, Series 2024-1A, Class A3, 5.230%, 1/16/2029(a) | |
| LAD Auto Receivables Trust, Series 2023-4A, Class B, 6.390%, 10/16/2028(a) | |
| LAD Auto Receivables Trust, Series 2024-1A, Class A4, 5.170%, 9/15/2028(a) | |
| LAD Auto Receivables Trust, Series 2024-2A, Class A3, 5.610%, 8/15/2028(a) | |
| PenFed Auto Receivables Owner Trust, Series 2024-A, Class A3, 4.700%, 6/15/2029(a) | |
| Prestige Auto Receivables Trust, Series 2021-1A, Class C, 1.530%, 2/15/2028(a) | |
| Prestige Auto Receivables Trust, Series 2023-1A, Class C, 5.650%, 2/15/2028(a) | |
| Santander Drive Auto Receivables Trust, Series 2022-4, Class B, 4.420%, 11/15/2027 | |
| Santander Drive Auto Receivables Trust, Series 2023-1, Class C, 5.090%, 5/15/2030 | |
See accompanying notes to financial statements.
Portfolio of Investments – as of September 30, 2024Loomis Sayles Intermediate Duration Bond Fund (continued) | | |
| |
| Santander Drive Auto Receivables Trust, Series 2023-3, Class C, 5.770%, 11/15/2030 | |
| Santander Drive Auto Receivables Trust, Series 2023-4, Class B, 5.770%, 12/15/2028 | |
| Santander Drive Auto Receivables Trust, Series 2023-5, Class B, 6.160%, 12/17/2029 | |
| Santander Drive Auto Receivables Trust, Series 2024-3, Class A3, 5.630%, 1/16/2029 | |
| Santander Drive Auto Receivables Trust, Series 2024-4, Class A3, 4.850%, 1/16/2029 | |
| SBNA Auto Lease Trust, Series 2024-A, Class A3, 5.390%, 11/20/2026(a) | |
| SBNA Auto Lease Trust, Series 2024-B, Class A3, 5.560%, 11/22/2027(a) | |
| SBNA Auto Lease Trust, Series 2024-C, Class A3, 4.560%, 2/22/2028(a) | |
| SFS Auto Receivables Securitization Trust, Series 2023-1A, Class A3, 5.470%, 10/20/2028(a) | |
| Toyota Auto Loan Extended Note Trust, Series 2020-1A, Class A, 1.350%, 5/25/2033(a) | |
| Toyota Auto Receivables Owner Trust, Series 2023-C, Class A3, 5.160%, 4/17/2028 | |
| Toyota Lease Owner Trust, Series 2024-B, Class A3, 4.210%, 9/20/2027(a) | |
| United Auto Credit Securitization Trust, Series 2022-2, Class C, 5.810%, 5/10/2027(a) | |
| VStrong Auto Receivables Trust, Series 2024-A, Class B, 5.770%, 7/15/2030(a) | |
| Westlake Automobile Receivables Trust, Series 2023-3A, Class C, 6.020%, 9/15/2028(a) | |
| Westlake Automobile Receivables Trust, Series 2024-2A, Class A3, 5.560%, 2/15/2028(a) | |
| World Omni Auto Receivables Trust, Series 2024-C, Class A3, 4.430%, 12/17/2029 | |
| World Omni Select Auto Trust, Series 2021-A, Class B, 0.850%, 8/16/2027 | |
| | |
| |
| Brex Commercial Charge Card Master Trust, Series 2024-1, Class A1, 6.050%, 7/15/2027(a) | |
| Mission Lane Credit Card Master Trust, Series 2023-A, Class A, 7.230%, 7/17/2028(a) | |
| | |
| |
| Countrywide Asset-Backed Certificates, Series 2004-S1, Class A3, 5.115%, 2/25/2035(b)(c) | |
| |
| Affirm Asset Securitization Trust, Series 2023-A, Class A, 6.610%, 1/18/2028(a) | |
| Affirm Asset Securitization Trust, Series 2023-B, Class A, 6.820%, 9/15/2028(a) | |
| Affirm Asset Securitization Trust, Series 2023-X1, Class A, 7.110%, 11/15/2028(a) | |
| Affirm Asset Securitization Trust, Series 2024-A, Class 1A, 5.610%, 2/15/2029(a) | |
| Affirm Asset Securitization Trust, Series 2024-A, Class A, 5.610%, 2/15/2029(a) | |
| Aqua Finance Trust, Series 2021-A, Class A, 1.540%, 7/17/2046(a) | |
| Auxilior Term Funding LLC, Series 2023-1A, Class A2, 6.180%, 12/15/2028(a) | |
| | |
| |
| BHG Securitization Trust, Series 2022-C, Class A, 5.320%, 10/17/2035(a) | |
| BHG Securitization Trust, Series 2024-1CON, Class A, 5.810%, 4/17/2035(a) | |
| Chesapeake Funding II LLC, Series 2023-1A, Class A1, 5.650%, 5/15/2035(a) | |
| Chesapeake Funding II LLC, Series 2024-1A, Class A1, 5.520%, 5/15/2036(a) | |
| Compass Datacenters Issuer II LLC, Series 2024-2A, Class A1, 5.022%, 8/25/2049(a) | |
| Crockett Partners Equipment Co. IIA LLC, Series 2024-1C, Class A, 6.050%, 1/20/2031(a) | |
| Dell Equipment Finance Trust, Series 2023-3, Class A3, 5.930%, 4/23/2029(a) | |
| Dell Equipment Finance Trust, Series 2024-1, Class A3, 5.390%, 3/22/2030(a) | |
| DLLMT LLC, Series 2023-1A, Class A3, 5.340%, 3/22/2027(a) | |
| Enterprise Fleet Financing LLC, Series 2022-3, Class A2, 4.380%, 7/20/2029(a) | |
| Enterprise Fleet Financing LLC, Series 2023-2, Class A2, 5.560%, 4/22/2030(a) | |
| Enterprise Fleet Financing LLC, Series 2024-1, Class A3, 5.160%, 9/20/2030(a) | |
| Enterprise Fleet Financing LLC, Series 2024-3, Class A4, 5.060%, 3/20/2031(a) | |
| Frontier Issuer LLC, Series 2023-1, Class A2, 6.600%, 8/20/2053(a) | |
| Frontier Issuer LLC, Series 2024-1, Class A2, 6.190%, 6/20/2054(a) | |
| GreenSky Home Improvement Trust, Series 2024-1, Class A3, 5.550%, 6/25/2059(a) | |
| Hertz Vehicle Financing LLC, Series 2022-2A, Class A, 2.330%, 6/26/2028(a) | |
| Hilton Grand Vacations Trust, Series 2022-2A, Class C, 5.570%, 1/25/2037(a) | |
| M&T Equipment Notes, Series 2023-1A, Class A3, 5.740%, 7/15/2030(a) | |
| Merchants Fleet Funding LLC, Series 2023-1A, Class A, 7.210%, 5/20/2036(a) | |
| Mercury Financial Credit Card Master Trust, Series 2024-2A, Class A, 6.560%, 7/20/2029(a) | |
| MVW LLC, Series 2020-1A, Class A, 1.740%, 10/20/2037(a) | |
| MVW LLC, Series 2024-1A, Class A, 5.320%, 2/20/2043(a) | |
| Octane Receivables Trust, Series 2024-2A, Class A2, 5.800%, 7/20/2032(a) | |
| OneMain Financial Issuance Trust, Series 2022-S1, Class A, 4.130%, 5/14/2035(a) | |
| Post Road Equipment Finance LLC, Series 2024-1A, Class A2, 5.590%, 11/15/2029(a) | |
| Regional Management Issuance Trust, Series 2024-1, Class A, 5.830%, 7/15/2036(a) | |
| Republic Finance Issuance Trust, Series 2024-A, Class A, 5.910%, 8/20/2032(a) | |
| SCF Equipment Leasing LLC, Series 2022-1A, Class A3, 2.920%, 7/20/2029(a) | |
| SCF Equipment Leasing LLC, Series 2023-1A, Class A2, 6.560%, 1/22/2030(a) | |
| SCF Equipment Leasing LLC, Series 2024-1A, Class A3, 5.520%, 1/20/2032(a) | |
See accompanying notes to financial statements.
Portfolio of Investments – as of September 30, 2024Loomis Sayles Intermediate Duration Bond Fund (continued) | | |
| |
| SEB Funding LLC, Series 2024-1A, Class A2, 7.386%, 4/30/2054(a) | |
| Sierra Timeshare Receivables Funding LLC, Series 2020-2A, Class A, 1.330%, 7/20/2037(a) | |
| Sierra Timeshare Receivables Funding LLC, Series 2024-2A, Class A, 5.140%, 6/20/2041(a) | |
| Stream Innovations Issuer Trust, Series 2024-1A, Class A, 6.270%, 7/15/2044(a) | |
| Wheels Fleet Lease Funding 1 LLC, Series 2023-1A, Class A, 5.800%, 4/18/2038(a) | |
| Wheels Fleet Lease Funding 1 LLC, Series 2024-1A, Class A1, 5.490%, 2/18/2039(a) | |
| Wheels Fleet Lease Funding 1 LLC, Series 2024-2A, Class A1, 4.870%, 6/21/2039(a) | |
| Ziply Fiber Issuer LLC, Series 2024-1A, Class A2, 6.640%, 4/20/2054(a) | |
| | |
| |
| Massachusetts Educational Financing Authority, Series 2018-A, Class A, 3.850%, 5/25/2033 | |
| Navient Private Education Refi Loan Trust, Series 2020-GA, Class A, 1.170%, 9/16/2069(a) | |
| | |
| Aerospace & Defense — 0.4% |
| BAE Systems PLC, 5.125%, 3/26/2029(a) | |
| L3Harris Technologies, Inc., 5.250%, 6/01/2031 | |
| | |
| Agency Commercial Mortgage-Backed Securities — 0.6% |
| Federal Home Loan Mortgage Corp. Multifamily Structured Pass-Through Certificates, Series K042, Class A2, 2.670%, 12/25/2024 | |
| Federal Home Loan Mortgage Corp. Multifamily Structured Pass-Through Certificates, Series KJ26, Class A2, 2.606%, 7/25/2027 | |
| | |
| |
| ERP Operating LP, 4.650%, 9/15/2034 | |
| |
| American Honda Finance Corp., GMTN, 4.400%, 9/05/2029 | |
| Aptiv PLC/Aptiv Global Financing DAC, 5.150%, 9/13/2034 | |
| Daimler Truck Finance North America LLC, 5.200%, 1/17/2025(a) | |
| Denso Corp., 1.239%, 9/16/2026(a) | |
| General Motors Financial Co., Inc., 6.050%, 10/10/2025 | |
| Harley-Davidson Financial Services, Inc., 3.350%, 6/08/2025(a) | |
| Hyundai Capital America, 4.750%, 9/26/2031(a) | |
| Hyundai Capital America, 5.300%, 6/24/2029(a) | |
| LKQ Corp., 5.750%, 6/15/2028 | |
| Mercedes-Benz Finance North America LLC, 4.800%, 8/01/2029(a) | |
| Nissan Motor Acceptance Co. LLC, 5.550%, 9/13/2029(a) | |
| PACCAR Financial Corp., 4.000%, 9/26/2029 | |
| | |
| |
| Toyota Motor Credit Corp., 5.050%, 5/16/2029 | |
| Volkswagen Group of America Finance LLC, 5.250%, 3/22/2029(a) | |
| | |
| |
| ABN AMRO Bank NV, (fixed rate to 9/18/2026, variable rate thereafter), 6.339%, 9/18/2027(a) | |
| AIB Group PLC, (fixed rate to 9/13/2028, variable rate thereafter), 6.608%, 9/13/2029(a) | |
| AIB Group PLC, (fixed rate to 10/14/2025, variable rate thereafter), 7.583%, 10/14/2026(a) | |
| ANZ New Zealand International Ltd., 5.355%, 8/14/2028(a) | |
| Australia & New Zealand Banking Group Ltd., 4.900%, 7/16/2027 | |
| Banco Santander SA, 5.439%, 7/15/2031 | |
| Bank of America Corp., MTN, (fixed rate to 4/02/2025, variable rate thereafter), 3.384%, 4/02/2026 | |
| Bank of America Corp., (fixed rate to 8/15/2034, variable rate thereafter), MTN, 5.425%, 8/15/2035 | |
| Bank of Ireland Group PLC, (fixed rate to 3/20/2029, variable rate thereafter), 5.601%, 3/20/2030(a) | |
| Bank of Ireland Group PLC, (fixed rate to 9/16/2025, variable rate thereafter), 6.253%, 9/16/2026(a) | |
| Bank of Montreal, 5.511%, 6/04/2031 | |
| Bank of New York Mellon Corp., (fixed rate to 4/26/2026, variable rate thereafter), 4.947%, 4/26/2027 | |
| Bank of New York Mellon Corp., (fixed rate to 7/22/2031, variable rate thereafter), 5.060%, 7/22/2032 | |
| Bank of New Zealand, 2.285%, 1/27/2027(a) | |
| Bank of Nova Scotia, GMTN, 5.450%, 8/01/2029 | |
| Banque Federative du Credit Mutuel SA, 5.194%, 2/16/2028(a) | |
| Canadian Imperial Bank of Commerce, (fixed rate to 9/11/2029, variable rate thereafter), 4.631%, 9/11/2030 | |
| Canadian Imperial Bank of Commerce, 5.237%, 6/28/2027 | |
| Capital One Financial Corp., (fixed rate to 10/29/2026, variable rate thereafter), 7.149%, 10/29/2027 | |
| Citigroup, Inc., (fixed rate to 9/19/2029, variable rate thereafter), 4.542%, 9/19/2030 | |
| Citizens Financial Group, Inc., (fixed rate to 5/21/2032, variable rate thereafter), 5.641%, 5/21/2037 | |
| Citizens Financial Group, Inc., (fixed rate to 7/23/2031, variable rate thereafter), 5.718%, 7/23/2032 | |
| Comerica, Inc., (fixed rate to 1/30/2029, variable rate thereafter), 5.982%, 1/30/2030 | |
| Credit Agricole SA, (fixed rate to 9/11/2027, variable rate thereafter), 4.631%, 9/11/2028(a) | |
| Deutsche Bank AG, 5.414%, 5/10/2029 | |
| DNB Bank ASA, (fixed rate to 9/16/2025, variable rate thereafter), 1.127%, 9/16/2026(a) | |
| Federation des Caisses Desjardins du Quebec, 5.700%, 3/14/2028(a) | |
See accompanying notes to financial statements.
Portfolio of Investments – as of September 30, 2024Loomis Sayles Intermediate Duration Bond Fund (continued) | | |
| |
| Goldman Sachs Bank USA, (fixed rate to 5/21/2026, variable rate thereafter), 5.414%, 5/21/2027 | |
| Goldman Sachs Group, Inc., (fixed rate to 7/23/2029, variable rate thereafter), 5.049%, 7/23/2030 | |
| Goldman Sachs Group, Inc., (fixed rate to 4/25/2029, variable rate thereafter), 5.727%, 4/25/2030 | |
| Goldman Sachs Group, Inc., (fixed rate to 8/10/2025, variable rate thereafter), 5.798%, 8/10/2026 | |
| HSBC Holdings PLC, (fixed rate to 8/14/2026, variable rate thereafter), 5.887%, 8/14/2027 | |
| HSBC USA, Inc., 5.625%, 3/17/2025 | |
| Huntington Bancshares, Inc., (fixed rate to 8/21/2028, variable rate thereafter), 6.208%, 8/21/2029 | |
| JPMorgan Chase & Co., (fixed rate to 6/01/2028, variable rate thereafter), 2.069%, 6/01/2029 | |
| JPMorgan Chase & Co., (fixed rate to 4/22/2029, variable rate thereafter), 5.581%, 4/22/2030 | |
| JPMorgan Chase Bank NA, 5.110%, 12/08/2026 | |
| Morgan Stanley, (fixed rate to 7/20/2028, variable rate thereafter), 5.449%, 7/20/2029 | |
| Morgan Stanley Bank NA, (fixed rate to 5/26/2027, variable rate thereafter), 5.504%, 5/26/2028 | |
| National Australia Bank Ltd., 4.900%, 6/13/2028 | |
| National Bank of Canada, 5.600%, 12/18/2028 | |
| Nationwide Building Society, 5.127%, 7/29/2029(a) | |
| NatWest Group PLC, (fixed rate to 8/15/2029, variable rate thereafter), 4.964%, 8/15/2030 | |
| NatWest Markets PLC, 1.600%, 9/29/2026(a) | |
| Nordea Bank Abp, 4.375%, 9/10/2029(a) | |
| Regions Financial Corp., (fixed rate to 9/06/2034, variable rate thereafter), 5.502%, 9/06/2035 | |
| Royal Bank of Canada, GMTN, (fixed rate to 8/02/2029, variable rate thereafter), 4.969%, 8/02/2030 | |
| Santander Holdings USA, Inc., (fixed rate to 9/06/2029, variable rate thereafter), 5.353%, 9/06/2030 | |
| Standard Chartered PLC, (fixed rate to 2/08/2029, variable rate thereafter), 7.018%, 2/08/2030(a) | |
| State Street Corp., (fixed rate to 2/20/2028, variable rate thereafter), 4.530%, 2/20/2029 | |
| Sumitomo Mitsui Trust Bank Ltd., 5.200%, 3/07/2027(a) | |
| Swedbank AB, 5.407%, 3/14/2029(a) | |
| Swedbank AB, 6.136%, 9/12/2026(a) | |
| Synchrony Bank, 5.400%, 8/22/2025 | |
| Synchrony Financial, 4.875%, 6/13/2025 | |
| Synchrony Financial, (fixed rate to 8/02/2029, variable rate thereafter), 5.935%, 8/02/2030 | |
| Truist Financial Corp., MTN, (fixed rate to 10/30/2028, variable rate thereafter), 7.161%, 10/30/2029 | |
| UBS AG, 5.000%, 7/09/2027 | |
| UniCredit SpA, (fixed rate to 9/22/2025, variable rate thereafter), 2.569%, 9/22/2026(a) | |
| Wells Fargo & Co., MTN, (fixed rate to 4/25/2025, variable rate thereafter), 3.908%, 4/25/2026 | |
| Wells Fargo & Co., MTN, (fixed rate to 4/22/2027, variable rate thereafter), 5.707%, 4/22/2028 | |
| Westpac Banking Corp., 5.050%, 4/16/2029 | |
| | |
| | |
| |
| Cantor Fitzgerald LP, 7.200%, 12/12/2028(a) | |
| Jefferies Financial Group, Inc., 5.875%, 7/21/2028 | |
| | |
| |
| Charter Communications Operating LLC/Charter Communications Operating Capital, 6.100%, 6/01/2029 | |
| |
| Cabot Corp., 4.000%, 7/01/2029 | |
| Huntsman International LLC, 5.700%, 10/15/2034 | |
| LYB International Finance III LLC, 5.500%, 3/01/2034 | |
| | |
| Collateralized Mortgage Obligations — 1.0% |
| BB-UBS Trust, Series 2012-TFT, Class A, 2.892%, 6/05/2030(a) | |
| Government National Mortgage Association, Series 2014-H14, Class FA, 1 mo. USD SOFR + 0.614%, 5.946%, 7/20/2064(c) | |
| Government National Mortgage Association, Series 2014-H15, Class FA, 1 mo. USD SOFR + 0.614%, 5.967%, 7/20/2064(c) | |
| Government National Mortgage Association, Series 2015-H09, Class HA, 1.750%, 3/20/2065(b) | |
| Government National Mortgage Association, Series 2015-H10, Class JA, 2.250%, 4/20/2065 | |
| Government National Mortgage Association, Series 2016-H06, Class FC, 1 mo. USD SOFR + 1.034%, 6.387%, 2/20/2066(c) | |
| Government National Mortgage Association, Series 2018-H17, Class JA, 3.750%, 9/20/2068(c) | |
| Government National Mortgage Association, Series 2019-H01, Class FL, 1 mo. USD SOFR + 0.564%, 5.917%, 12/20/2068(c) | |
| Government National Mortgage Association, Series 2019-H01, Class FT, 1 mo. USD SOFR + 0.514%, 5.867%, 10/20/2068(c) | |
| Government National Mortgage Association, Series 2019-H10, Class FM, 1 mo. USD SOFR + 0.514%, 5.867%, 5/20/2069(c) | |
| GS Mortgage Securities Corp. Trust, Series 2012-BWTR, Class A, 2.954%, 11/05/2034(a) | |
| GS Mortgage Securities Corp. Trust, Series 2013-PEMB, Class A, 3.668%, 3/05/2033(a)(c) | |
| Hudsons Bay Simon JV Trust, Series 2015-HB10, Class A10, 4.155%, 8/05/2034(a) | |
| | |
| Construction Machinery — 0.3% |
| John Deere Capital Corp., MTN, 4.900%, 3/07/2031 | |
| Consumer Cyclical Services — 0.1% |
| Expedia Group, Inc., 6.250%, 5/01/2025(a) | |
| Diversified Manufacturing — 0.9% |
| Honeywell International, Inc., 4.700%, 2/01/2030 | |
| Ingersoll Rand, Inc., 5.176%, 6/15/2029 | |
| Johnson Controls International PLC/Tyco Fire & Security Finance SCA, 5.500%, 4/19/2029 | |
| Nordson Corp., 4.500%, 12/15/2029 | |
| | |
| |
| AES Corp., 3.300%, 7/15/2025(a) | |
See accompanying notes to financial statements.
Portfolio of Investments – as of September 30, 2024Loomis Sayles Intermediate Duration Bond Fund (continued) | | |
| |
| Alliant Energy Finance LLC, 5.400%, 6/06/2027(a) | |
| Ameren Corp., 5.000%, 1/15/2029 | |
| American Electric Power Co., Inc., 5.699%, 8/15/2025 | |
| CenterPoint Energy, Inc., 5.400%, 6/01/2029 | |
| Consolidated Edison Co. of New York, Inc., Series B, 2.900%, 12/01/2026 | |
| DTE Energy Co., 4.220%, 11/01/2024 | |
| DTE Energy Co., 4.950%, 7/01/2027 | |
| Edison International, 4.700%, 8/15/2025 | |
| Entergy Corp., 0.900%, 9/15/2025 | |
| Liberty Utilities Co., 5.577%, 1/31/2029(a) | |
| National Rural Utilities Cooperative Finance Corp., MTN, 5.600%, 11/13/2026 | |
| National Rural Utilities Cooperative Finance Corp., 3 mo. USD SOFR + 3.172%, 8.427%, 4/30/2043(c) | |
| Niagara Energy SAC, 5.746%, 10/03/2034(a) | |
| Vistra Operations Co. LLC, 5.125%, 5/13/2025(a) | |
| WEC Energy Group, Inc., 4.750%, 1/09/2026 | |
| | |
| |
| AerCap Ireland Capital DAC/AerCap Global Aviation Trust, 4.625%, 9/10/2029 | |
| Air Lease Corp., MTN, 5.200%, 7/15/2031 | |
| Aircastle Ltd., 2.850%, 1/26/2028(a) | |
| Aircastle Ltd., 5.950%, 2/15/2029(a) | |
| Aircastle Ltd., 6.500%, 7/18/2028(a) | |
| Apollo Debt Solutions BDC, 6.700%, 7/29/2031(a) | |
| ARES Capital Corp., 5.950%, 7/15/2029 | |
| ARES Capital Corp., 7.000%, 1/15/2027 | |
| ARES Strategic Income Fund, 6.350%, 8/15/2029(a) | |
| Aviation Capital Group LLC, 5.375%, 7/15/2029(a) | |
| Bain Capital Specialty Finance, Inc., 2.550%, 10/13/2026 | |
| Blackstone Secured Lending Fund, 2.850%, 9/30/2028 | |
| Blue Owl Capital Corp., 3.750%, 7/22/2025 | |
| Blue Owl Capital Corp., 4.250%, 1/15/2026 | |
| Blue Owl Capital Corp., 8.450%, 11/15/2026(a) | |
| Blue Owl Credit Income Corp., 5.800%, 3/15/2030(a) | |
| Blue Owl Credit Income Corp., 7.950%, 6/13/2028 | |
| Blue Owl Technology Finance Corp., 4.750%, 12/15/2025(a) | |
| Blue Owl Technology Finance Corp. II, 6.750%, 4/04/2029(a) | |
| FS KKR Capital Corp., 6.875%, 8/15/2029 | |
| FS KKR Capital Corp., 7.875%, 1/15/2029 | |
| GATX Corp., 5.400%, 3/15/2027 | |
| Golub Capital BDC, Inc., 2.500%, 8/24/2026 | |
| Hercules Capital, Inc., 3.375%, 1/20/2027 | |
| HPS Corporate Lending Fund, 6.250%, 9/30/2029(a) | |
| Main Street Capital Corp., 3.000%, 7/14/2026 | |
| Main Street Capital Corp., 6.500%, 6/04/2027 | |
| Mitsubishi HC Finance America LLC, 5.150%, 10/24/2029(a) | |
| New Mountain Finance Corp., 6.200%, 10/15/2027 | |
| New Mountain Finance Corp., 6.875%, 2/01/2029 | |
| Oaktree Strategic Credit Fund, 6.500%, 7/23/2029(a) | |
| Sixth Street Lending Partners, 5.750%, 1/15/2030(a) | |
| Sixth Street Lending Partners, 6.500%, 3/11/2029(a) | |
| | |
| Finance Companies — continued |
| Sixth Street Specialty Lending, Inc., 6.125%, 3/01/2029 | |
| USAA Capital Corp., 3.375%, 5/01/2025(a) | |
| | |
| |
| LeasePlan Corp. NV, 2.875%, 10/24/2024(a) | |
| ORIX Corp., 3.250%, 12/04/2024 | |
| | |
| |
| Campbell Soup Co., 4.750%, 3/23/2035 | |
| Conagra Brands, Inc., 5.300%, 10/01/2026 | |
| Constellation Brands, Inc., 4.800%, 1/15/2029 | |
| Pernod Ricard International Finance LLC, 1.250%, 4/01/2028(a) | |
| Suntory Holdings Ltd., 5.124%, 6/11/2029(a) | |
| | |
| Government Owned - No Guarantee — 0.2% |
| Antares Holdings LP, 3.750%, 7/15/2027(a) | |
| |
| Omega Healthcare Investors, Inc., 4.500%, 1/15/2025 | |
| |
| Humana, Inc., 5.375%, 4/15/2031 | |
| UnitedHealth Group, Inc., 4.950%, 1/15/2032 | |
| | |
| |
| GE HealthCare Technologies, Inc., 5.550%, 11/15/2024 | |
| Illumina, Inc., 4.650%, 9/09/2026 | |
| IQVIA, Inc., 5.700%, 5/15/2028 | |
| McKesson Corp., 4.250%, 9/15/2029 | |
| Stryker Corp., 4.625%, 9/11/2034 | |
| Universal Health Services, Inc., 4.625%, 10/15/2029 | |
| | |
| |
| Federal Home Loan Mortgage Corp., 1 yr. CMT + 2.225%, 6.984%, 1/01/2035(c) | |
| Federal Home Loan Mortgage Corp., 1 yr. CMT + 2.500%, 7.111%, 5/01/2036(c) | |
| | |
| Independent Energy — 0.2% |
| Pioneer Natural Resources Co., 5.100%, 3/29/2026 | |
| |
| Mitsubishi Corp., 5.000%, 7/02/2029(a) | |
| |
| TotalEnergies Capital SA, 4.724%, 9/10/2034 | |
| |
| American National Group, Inc., 5.750%, 10/01/2029 | |
| Athene Global Funding, 2.500%, 3/24/2028(a) | |
| Athene Global Funding, 5.583%, 1/09/2029(a) | |
| Brighthouse Financial Global Funding, 1.750%, 1/13/2025(a) | |
| Brighthouse Financial Global Funding, 5.550%, 4/09/2027(a) | |
| CNO Global Funding, 2.650%, 1/06/2029(a) | |
| Corebridge Global Funding, 5.200%, 6/24/2029(a) | |
| F&G Global Funding, 5.150%, 7/07/2025(a) | |
See accompanying notes to financial statements.
Portfolio of Investments – as of September 30, 2024Loomis Sayles Intermediate Duration Bond Fund (continued) | | |
| Life Insurance — continued |
| GA Global Funding Trust, 2.250%, 1/06/2027(a) | |
| Jackson National Life Global Funding, 1.750%, 1/12/2025(a) | |
| Jackson National Life Global Funding, 3.875%, 6/11/2025(a) | |
| Met Tower Global Funding, 4.000%, 10/01/2027(a) | |
| MetLife, Inc., 5.300%, 12/15/2034 | |
| New York Life Global Funding, 5.000%, 6/06/2029(a) | |
| Northwestern Mutual Global Funding, 4.900%, 6/12/2028(a) | |
| Principal Life Global Funding II, 5.100%, 1/25/2029(a) | |
| Principal Life Global Funding II, Series C, 4.600%, 8/19/2027(a) | |
| Protective Life Global Funding, 5.215%, 6/12/2029(a) | |
| Reliance Standard Life Global Funding II, 2.750%, 5/07/2025(a) | |
| Reliance Standard Life Global Funding II, 5.243%, 2/02/2026(a) | |
| RGA Global Funding, 5.448%, 5/24/2029(a) | |
| Voya Financial, Inc., 5.000%, 9/20/2034 | |
| | |
| |
| Hyatt Hotels Corp., 5.250%, 6/30/2029 | |
| Marriott International, Inc., 5.550%, 10/15/2028 | |
| | |
| Media Entertainment — 0.3% |
| Take-Two Interactive Software, Inc., 4.950%, 3/28/2028 | |
| Take-Two Interactive Software, Inc., 5.400%, 6/12/2029 | |
| | |
| |
| ArcelorMittal SA, 6.000%, 6/17/2034 | |
| |
| Enterprise Products Operating LLC, 4.950%, 2/15/2035 | |
| Kinder Morgan, Inc., 5.100%, 8/01/2029 | |
| ONEOK, Inc., 5.050%, 11/01/2034 | |
| Williams Cos., Inc., 5.400%, 3/02/2026 | |
| | |
| |
| Federal Home Loan Mortgage Corp., 3.000%, 10/01/2026 | |
| Federal Home Loan Mortgage Corp., 8.000%, 7/01/2025 | |
| Government National Mortgage Association, 3.890%, 5/20/2062(c) | |
| Government National Mortgage Association, 3.890%, 10/20/2062(c) | |
| Government National Mortgage Association, 4.015%, 4/20/2063(c) | |
| Government National Mortgage Association, 4.234%, 9/20/2066(c) | |
| Government National Mortgage Association, 4.372%, 10/20/2066(c) | |
| Government National Mortgage Association, 4.379%, 11/20/2064(c) | |
| | |
| Mortgage Related — continued |
| Government National Mortgage Association, 4.390%, 6/20/2066(c) | |
| Government National Mortgage Association, 4.398%, 10/20/2066(c) | |
| Government National Mortgage Association, 4.424%, 11/20/2066(c) | |
| Government National Mortgage Association, 4.459%, 9/20/2066(c) | |
| Government National Mortgage Association, 4.486%, 8/20/2066(c) | |
| Government National Mortgage Association, 4.500%, 11/20/2066(c) | |
| Government National Mortgage Association, 4.560%, 10/20/2066(c) | |
| Government National Mortgage Association, 4.585%, 7/20/2067(c) | |
| Government National Mortgage Association, 4.639%, 4/20/2067(c) | |
| Government National Mortgage Association, 4.700%, 1/20/2067(c) | |
| | |
| |
| NiSource, Inc., 5.200%, 7/01/2029 | |
| Sempra, 5.400%, 8/01/2026 | |
| | |
| Non-Agency Commercial Mortgage-Backed Securities — 6.4% |
| Bank, Series 2020-BN25, Class A5, 2.649%, 1/15/2063 | |
| Bank, Series 2021-BN37, Class A5, 2.618%, 11/15/2064(c) | |
| Bank5, Series 2023-5YR3, Class A3, 6.724%, 9/15/2056(c) | |
| Bank5, Series 2023-5YR4, Class A3, 6.500%, 12/15/2056 | |
| Bank5 Trust, Series 2024-5YR6, Class A3, 6.225%, 5/15/2057 | |
| BBCMS Mortgage Trust, Series 2020-BID, Class A, 1 mo. USD SOFR + 2.254%, 7.352%, 10/15/2037(a)(c) | |
| BBCMS Mortgage Trust, Series 2021-C12, Class A5, 2.689%, 11/15/2054 | |
| Benchmark Mortgage Trust, Series 2020-B16, Class A5, 2.732%, 2/15/2053 | |
| Benchmark Mortgage Trust, Series 2023-V2, Class A3, 5.812%, 5/15/2055(c) | |
| BPR Trust, Series 2021-NRD, Class A, 1 mo. USD SOFR + 1.525%, 6.622%, 12/15/2038(a)(c) | |
| BPR Trust, Series 2022-OANA, Class A, 1 mo. USD SOFR + 1.898%, 6.995%, 4/15/2037(a)(c) | |
| BX Trust, Series 2024-VLT4, Class A, 1 mo. USD SOFR + 1.491%, 6.588%, 7/15/2029(a)(c) | |
| CFCRE Commercial Mortgage Trust, Series 2016-C3, Class A3, 3.865%, 1/10/2048 | |
| CFCRE Commercial Mortgage Trust, Series 2016-C4, Class A4, 3.283%, 5/10/2058 | |
| Citigroup Commercial Mortgage Trust, Series 2016-GC37, Class A4, 3.314%, 4/10/2049 | |
| Citigroup Commercial Mortgage Trust, Series 2019-C7, Class A4, 3.102%, 12/15/2072 | |
| Commercial Mortgage Pass-Through Certificates, Series 2012-LTRT, Class A2, 3.400%, 10/05/2030(a) | |
See accompanying notes to financial statements.
Portfolio of Investments – as of September 30, 2024Loomis Sayles Intermediate Duration Bond Fund (continued) | | |
| Non-Agency Commercial Mortgage-Backed Securities — continued |
| Commercial Mortgage Trust, Series 2014-UBS3, Class A4, 3.819%, 6/10/2047 | |
| Commercial Mortgage Trust, Series 2015-DC1, Class A5, 3.350%, 2/10/2048 | |
| Commercial Mortgage Trust, Series 2016-DC2, Class A5, 3.765%, 2/10/2049 | |
| Credit Suisse Mortgage Trust, Series 2014-USA, Class A2, 3.953%, 9/15/2037(a) | |
| CSAIL Commercial Mortgage Trust, Series 2015-C4, Class ASB, 3.617%, 11/15/2048 | |
| CSAIL Commercial Mortgage Trust, Series 2019-C18, Class A4, 2.968%, 12/15/2052 | |
| DC Commercial Mortgage Trust, Series 2023-DC, Class A, 6.314%, 9/12/2040(a) | |
| GS Mortgage Securities Corp. Trust, Series 2023-SHIP, Class A, 4.466%, 9/10/2038(a)(c) | |
| GS Mortgage Securities Trust, Series 2020-GC45, Class A5, 2.911%, 2/13/2053 | |
| Hudsons Bay Simon JV Trust, Series 2015-HB7, Class A7, 3.914%, 8/05/2034(a) | |
| JPMCC Commercial Mortgage Securities Trust, Series 2019-COR5, Class A4, 3.386%, 6/13/2052 | |
| Morgan Stanley Bank of America Merrill Lynch Trust, Series 2015-C22, Class A4, 3.306%, 4/15/2048 | |
| Morgan Stanley Capital I Trust, Series 2020-L4, Class A3, 2.698%, 2/15/2053 | |
| New Economy Assets Phase 1 Sponsor LLC, Series 2021-1, Class A1, 1.910%, 10/20/2061(a) | |
| SCOTT Trust, Series 2023-SFS, Class A, 5.910%, 3/10/2040(a) | |
| SPGN Mortgage Trust, Series 2022-TFLM, Class A, 1 mo. USD SOFR + 1.550%, 6.647%, 2/15/2039(a)(c) | |
| Wells Fargo Commercial Mortgage Trust, Series 2016-C33, Class A4, 3.426%, 3/15/2059 | |
| Wells Fargo Commercial Mortgage Trust, Series 2020-C58, Class A4, 2.092%, 7/15/2053 | |
| Wells Fargo Commercial Mortgage Trust, Series 2022-C62, Class A4, 4.000%, 4/15/2055(c) | |
| | |
| |
| Hudson Pacific Properties LP, 5.950%, 2/15/2028 | |
| Oil Field Services — 0.1% |
| Helmerich & Payne, Inc., 5.500%, 12/01/2034(a) | |
| |
| Prologis LP, 5.000%, 1/31/2035 | |
| |
| Amcor Flexibles North America, Inc., 4.000%, 5/17/2025 | |
| Amcor Group Finance PLC, 5.450%, 5/23/2029 | |
| | |
| |
| Astrazeneca Finance LLC, 4.850%, 2/26/2029 | |
| Novartis Capital Corp., 4.200%, 9/18/2034 | |
| Royalty Pharma PLC, 5.400%, 9/02/2034 | |
| | |
| Property & Casualty Insurance — 1.2% |
| Allstate Corp., 5.050%, 6/24/2029 | |
| Chubb INA Holdings LLC, 4.650%, 8/15/2029 | |
| | |
| Property & Casualty Insurance — continued |
| Enact Holdings, Inc., 6.250%, 5/28/2029 | |
| Essent Group Ltd., 6.250%, 7/01/2029 | |
| NMI Holdings, Inc., 6.000%, 8/15/2029 | |
| Radian Group, Inc., 6.200%, 5/15/2029 | |
| SiriusPoint Ltd., 7.000%, 4/05/2029 | |
| Trustage Financial Group, Inc., 4.625%, 4/15/2032(a) | |
| | |
| |
| Canadian National Railway Co., 4.375%, 9/18/2034 | |
| |
| Phillips 66 Co., 5.250%, 6/15/2031 | |
| Raizen Fuels Finance SA, 5.700%, 1/17/2035(a) | |
| | |
| |
| Darden Restaurants, Inc., 4.550%, 10/15/2029 | |
| |
| Simon Property Group LP, 4.750%, 9/26/2034 | |
| |
| AutoNation, Inc., 3.500%, 11/15/2024 | |
| AutoNation, Inc., 4.500%, 10/01/2025 | |
| AutoZone, Inc., 5.050%, 7/15/2026 | |
| Genuine Parts Co., 4.950%, 8/15/2029 | |
| Tapestry, Inc., 7.700%, 11/27/2030 | |
| Target Corp., 4.500%, 9/15/2034 | |
| | |
| |
| Kroger Co., 4.650%, 9/15/2029 | |
| |
| Arrow Electronics, Inc., 5.150%, 8/21/2029 | |
| Automatic Data Processing, Inc., 4.450%, 9/09/2034 | |
| Avnet, Inc., 6.250%, 3/15/2028 | |
| Broadcom, Inc., 5.050%, 7/12/2029 | |
| CDW LLC/CDW Finance Corp., 3.276%, 12/01/2028 | |
| Equifax, Inc., 4.800%, 9/15/2029 | |
| Equifax, Inc., 5.100%, 6/01/2028 | |
| Fiserv, Inc., 4.750%, 3/15/2030 | |
| Flex Ltd., 5.250%, 1/15/2032 | |
| Flex Ltd., 6.000%, 1/15/2028 | |
| Global Payments, Inc., 1.500%, 11/15/2024 | |
| Hewlett Packard Enterprise Co., 5.000%, 10/15/2034 | |
| Micron Technology, Inc., 6.750%, 11/01/2029 | |
| PayPal Holdings, Inc., 5.150%, 6/01/2034 | |
| Qorvo, Inc., 1.750%, 12/15/2024 | |
| Tyco Electronics Group SA, 4.625%, 2/01/2030 | |
| | |
| |
| Imperial Brands Finance PLC, 5.500%, 2/01/2030(a) | |
| Philip Morris International, Inc., 5.125%, 2/13/2031 | |
| | |
| Transportation Services — 0.4% |
| Element Fleet Management Corp., 3.850%, 6/15/2025(a) | |
| Element Fleet Management Corp., 6.319%, 12/04/2028(a) | |
| Penske Truck Leasing Co. LP/PTL Finance Corp., 4.000%, 7/15/2025(a) | |
| Ryder System, Inc., GMTN, 4.950%, 9/01/2029 | |
| | |
See accompanying notes to financial statements.
Portfolio of Investments – as of September 30, 2024Loomis Sayles Intermediate Duration Bond Fund (continued) | | |
| |
| U.S. Treasury Notes, 3.500%, 9/30/2029 | |
| U.S. Treasury Notes, 3.625%, 5/31/2028 | |
| U.S. Treasury Notes, 3.625%, 8/31/2029 | |
| U.S. Treasury Notes, 3.750%, 8/31/2026 | |
| U.S. Treasury Notes, 3.875%, 11/30/2027 | |
| U.S. Treasury Notes, 3.875%, 8/15/2034 | |
| U.S. Treasury Notes, 4.000%, 1/31/2029 | |
| U.S. Treasury Notes, 4.000%, 7/31/2029 | |
| U.S. Treasury Notes, 4.125%, 7/31/2028 | |
| U.S. Treasury Notes, 4.250%, 2/28/2029 | |
| U.S. Treasury Notes, 4.250%, 6/30/2029 | |
| U.S. Treasury Notes, 4.375%, 7/31/2026 | |
| U.S. Treasury Notes, 4.375%, 11/30/2028 | |
| U.S. Treasury Notes, 4.375%, 5/15/2034 | |
| U.S. Treasury Notes, 4.500%, 5/31/2029 | |
| U.S. Treasury Notes, 4.625%, 4/30/2029 | |
| | |
| |
| Essential Utilities, Inc., 4.800%, 8/15/2027 | |
| |
| Crown Castle, Inc., 4.900%, 9/01/2029 | |
| |
| NTT Finance Corp., 5.110%, 7/02/2029(a) | |
| Total Bonds and Notes
(Identified Cost $257,621,870) | |
|
|
Short-Term Investments — 1.7% |
| Tri-Party Repurchase Agreement with Fixed Income Clearing Corporation, dated 9/30/2024 at 3.000% to be repurchased at $4,543,709 on 10/01/2024 collateralized by $4,639,500 U.S. Treasury Note, 3.500% due 9/30/2026 valued at $4,634,292 including accrued interest (Note 2 of Notes to Financial Statements)
(Identified Cost $4,543,330) | |
| Total Investments — 99.7%
(Identified Cost $262,165,200) | |
| Other assets less liabilities — 0.3% | |
| | |
| See Note 2 of Notes to Financial Statements. |
| All or a portion of these securities are exempt from registration under Rule 144A of the Securities Act of 1933. These securities may be resold in transactions exempt from registration, normally to qualified institutional buyers. At September 30, 2024, the value of Rule 144A holdings amounted to $79,523,677 or 30.0% of net assets. |
| Level 3 security. Value has been determined using significant unobservable inputs. See Note 3 of Notes to Financial Statements. |
| Variable rate security. Rate as of September 30, 2024 is disclosed. Issuers comprised of various lots with differing coupon rates have been aggregated for the purpose of presentation in the Portfolio of Investments and show a weighted average rate. Certain variable rate securities are not based on a published reference rate and spread, rather are determined by the issuer or agent and are based on current market conditions. These securities may not indicate a reference rate and/or spread in their description. |
| |
| Adjustable Rate Mortgages |
| Constant Maturity Treasury |
| |
| |
| Real Estate Investment Trusts |
| Secured Overnight Financing Rate |
At September 30, 2024, the Fund had the following open long futures contracts:
| | | | | Unrealized
Appreciation
(Depreciation) |
CBOT 5 Year U.S. Treasury Notes Futures | | | | | |
Ultra 10 Year U.S. Treasury Notes Futures | | | | | |
| | | | | |
See accompanying notes to financial statements.
Portfolio of Investments – as of September 30, 2024Loomis Sayles Intermediate Duration Bond Fund (continued) Industry Summary at September 30, 2024
| |
| |
| |
Non-Agency Commercial Mortgage-Backed Securities | |
| |
| |
| |
| |
| |
| |
Other Investments, less than 2% each | |
| |
| |
Other assets less liabilities (including futures contracts) | |
| |
See accompanying notes to financial statements.
Portfolio of Investments – as of September 30, 2024Loomis Sayles Limited Term Government and Agency Fund
| | |
Bonds and Notes — 94.7% of Net Assets |
| |
| Avis Budget Rental Car Funding AESOP LLC, Series 2022-1A, Class A, 3.830%, 8/21/2028(a) | |
| Carvana Auto Receivables Trust, Series 2021-N2, Class A2, 0.970%, 3/10/2028 | |
| GM Financial Revolving Receivables Trust, Series 2021-1, Class A, 1.170%, 6/12/2034(a) | |
| Hertz Vehicle Financing III LLC, Series 2023-3A, Class A, 5.940%, 2/25/2028(a) | |
| NextGear Floorplan Master Owner Trust, Series 2024-1A, Class A2, 5.120%, 3/15/2029(a) | |
| PenFed Auto Receivables Owner Trust, Series 2022-A, Class A4, 4.180%, 12/15/2028(a) | |
| Toyota Auto Loan Extended Note Trust, Series 2020-1A, Class A, 1.350%, 5/25/2033(a) | |
| Toyota Auto Loan Extended Note Trust, Series 2022-1A, Class A, 3.820%, 4/25/2035(a) | |
| | |
| |
| Federal Home Loan Mortgage Corp. Structured Pass-Through Certificates, Series T-60, Class 2A1, 4.195%, 3/25/2044(b)(c) | |
| Federal National Mortgage Association, Series 2002-W10, Class A7, REMICS, 4.629%, 8/25/2042(b)(c) | |
| | |
| |
| BHG Securitization Trust, Series 2024-1CON, Class A, 5.810%, 4/17/2035(a) | |
| Enterprise Fleet Financing LLC, Series 2022-3, Class A2, 4.380%, 7/20/2029(a) | |
| MVW LLC, Series 2020-1A, Class A, 1.740%, 10/20/2037(a) | |
| MVW LLC, Series 2024-1A, Class A, 5.320%, 2/20/2043(a) | |
| Sierra Timeshare Receivables Funding LLC, Series 2020-2A, Class A, 1.330%, 7/20/2037(a) | |
| Welk Resorts LLC, Series 2019-AA, Class A, 2.800%, 6/15/2038(a) | |
| Wheels Fleet Lease Funding 1 LLC, Series 2023-1A, Class A, 5.800%, 4/18/2038(a) | |
| | |
| |
| Navient Private Education Refi Loan Trust, Series 2019-FA, Class A2, 2.600%, 8/15/2068(a) | |
| Navient Private Education Refi Loan Trust, Series 2020-DA, Class A, 1.690%, 5/15/2069(a) | |
| Navient Private Education Refi Loan Trust, Series 2021-CA, Class A, 1.060%, 10/15/2069(a) | |
| Navient Private Education Refi Loan Trust, Series 2021-EA, Class A, 0.970%, 12/16/2069(a) | |
| SMB Private Education Loan Trust, Series 2021-D, Class A1A, 1.340%, 3/17/2053(a) | |
| | |
| Agency Commercial Mortgage-Backed Securities — 24.8% |
| Federal Home Loan Mortgage Corp. Multifamily Structured Pass-Through Certificates, Series K064, Class A2, 3.224%, 3/25/2027 | |
| | |
| Agency Commercial Mortgage-Backed Securities — continued |
| Federal Home Loan Mortgage Corp. Multifamily Structured Pass-Through Certificates, Series K139, Class A1, 2.209%, 10/25/2031 | |
| Federal Home Loan Mortgage Corp. Multifamily Structured Pass-Through Certificates, Series K747, Class A2, 2.050%, 11/25/2028(c) | |
| Federal Home Loan Mortgage Corp. Multifamily Structured Pass-Through Certificates, Series KC06, Class A2, 2.541%, 8/25/2026 | |
| Federal Home Loan Mortgage Corp. Multifamily Structured Pass-Through Certificates, Series K-F100, Class AS, 30 day USD SOFR Average + 0.180%, 5.527%, 1/25/2028(c) | |
| Federal Home Loan Mortgage Corp. Multifamily Structured Pass-Through Certificates, Series K-F121, Class AS, 30 day USD SOFR Average + 0.180%, 5.527%, 8/25/2028(c) | |
| Federal Home Loan Mortgage Corp. Multifamily Structured Pass-Through Certificates, Series KF123, Class AS, 30 day USD SOFR Average + 0.200%, 5.547%, 9/25/2028(c) | |
| Federal Home Loan Mortgage Corp. Multifamily Structured Pass-Through Certificates, Series KF53, Class A, 30 day USD SOFR Average + 0.504%, 5.851%, 10/25/2025(c) | |
| Federal Home Loan Mortgage Corp. Multifamily Structured Pass-Through Certificates, Series KF72, Class A, 30 day USD SOFR Average + 0.614%, 5.961%, 10/25/2026(c) | |
| Federal Home Loan Mortgage Corp. Multifamily Structured Pass-Through Certificates, Series KF74, Class AS, 1 mo. USD SOFR Historical Calendar Day Compounded + 0.530%, 5.877%, 1/25/2027(c) | |
| Federal Home Loan Mortgage Corp. Multifamily Structured Pass-Through Certificates, Series KF77, Class AL, 30 day USD SOFR Average + 0.814%, 6.161%, 2/25/2027(c) | |
| Federal Home Loan Mortgage Corp. Multifamily Structured Pass-Through Certificates, Series KF77, Class AS, 30 day USD SOFR Average + 0.900%, 6.247%, 2/25/2027(c) | |
| Federal Home Loan Mortgage Corp. Multifamily Structured Pass-Through Certificates, Series KF78, Class AL, 30 day USD SOFR Average + 0.914%, 6.261%, 3/25/2030(c) | |
| Federal Home Loan Mortgage Corp. Multifamily Structured Pass-Through Certificates, Series KF78, Class AS, 30 day USD SOFR Average + 1.000%, 6.347%, 3/25/2030(c) | |
| Federal Home Loan Mortgage Corp. Multifamily Structured Pass-Through Certificates, Series KF79, Class AL, 30 day USD SOFR Average + 0.584%, 5.931%, 5/25/2030(c) | |
| Federal Home Loan Mortgage Corp. Multifamily Structured Pass-Through Certificates, Series KF79, Class AS, 30 day USD SOFR Average + 0.580%, 5.927%, 5/25/2030(c) | |
| Federal Home Loan Mortgage Corp. Multifamily Structured Pass-Through Certificates, Series KF80, Class AL, 30 day USD SOFR Average + 0.554%, 5.901%, 6/25/2030(c) | |
See accompanying notes to financial statements.
Portfolio of Investments – as of September 30, 2024Loomis Sayles Limited Term Government and Agency Fund (continued) | | |
| Agency Commercial Mortgage-Backed Securities — continued |
| Federal Home Loan Mortgage Corp. Multifamily Structured Pass-Through Certificates, Series KF80, Class AS, 30 day USD SOFR Average + 0.510%, 5.857%, 6/25/2030(c) | |
| Federal Home Loan Mortgage Corp. Multifamily Structured Pass-Through Certificates, Series KF81, Class AL, 30 day USD SOFR Average + 0.474%, 5.821%, 6/25/2027(c) | |
| Federal Home Loan Mortgage Corp. Multifamily Structured Pass-Through Certificates, Series KF81, Class AS, 30 day USD SOFR Average + 0.400%, 5.747%, 6/25/2027(c) | |
| Federal Home Loan Mortgage Corp. Multifamily Structured Pass-Through Certificates, Series KF84, Class AL, 30 day USD SOFR Average + 0.414%, 5.761%, 7/25/2030(c) | |
| Federal Home Loan Mortgage Corp. Multifamily Structured Pass-Through Certificates, Series KF84, Class AS, 30 day USD SOFR Average + 0.320%, 5.667%, 7/25/2030(c) | |
| Federal Home Loan Mortgage Corp. Multifamily Structured Pass-Through Certificates, Series KF85, Class AL, 30 day USD SOFR Average + 0.414%, 5.761%, 8/25/2030(c) | |
| Federal Home Loan Mortgage Corp. Multifamily Structured Pass-Through Certificates, Series KF85, Class AS, 30 day USD SOFR Average + 0.330%, 5.677%, 8/25/2030(c) | |
| Federal Home Loan Mortgage Corp. Multifamily Structured Pass-Through Certificates, Series KF86, Class AL, 30 day USD SOFR Average + 0.404%, 5.751%, 8/25/2027(c) | |
| Federal Home Loan Mortgage Corp. Multifamily Structured Pass-Through Certificates, Series KF86, Class AS, 30 day USD SOFR Average + 0.320%, 5.667%, 8/25/2027(c) | |
| Federal Home Loan Mortgage Corp. Multifamily Structured Pass-Through Certificates, Series KF93, Class AL, 30 day USD SOFR Average + 0.394%, 5.741%, 10/25/2027(c) | |
| Federal Home Loan Mortgage Corp. Multifamily Structured Pass-Through Certificates, Series KF93, Class AS, 30 day USD SOFR Average + 0.310%, 5.657%, 10/25/2027(c) | |
| Federal Home Loan Mortgage Corp. Multifamily Structured Pass-Through Certificates, Series KF97, Class AS, 30 day USD SOFR Average + 0.250%, 5.597%, 12/25/2030(c) | |
| Federal Home Loan Mortgage Corp. Multifamily Structured Pass-Through Certificates, Series KJ20, Class A2, 3.799%, 12/25/2025 | |
| Federal Home Loan Mortgage Corp. Multifamily Structured Pass-Through Certificates, Series KJ21, Class A2, 3.700%, 9/25/2026 | |
| Federal Home Loan Mortgage Corp. Multifamily Structured Pass-Through Certificates, Series KJ26, Class A2, 2.606%, 7/25/2027 | |
| Federal Home Loan Mortgage Corp. Multifamily Structured Pass-Through Certificates, Series KJ37, Class A2, 2.333%, 11/25/2030 | |
| | |
| Agency Commercial Mortgage-Backed Securities — continued |
| Federal Home Loan Mortgage Corp. Multifamily Structured Pass-Through Certificates, Series KJ42, Class A2, 4.118%, 11/25/2032 | |
| Federal Home Loan Mortgage Corp. Multifamily Structured Pass-Through Certificates, Series KS12, Class A, 30 day USD SOFR Average + 0.764%, 6.111%, 8/25/2029(c) | |
| Federal Home Loan Mortgage Corp. Multifamily Structured Pass-Through Certificates, Series KS14, Class AL, 30 day USD SOFR Average + 0.454%, 5.801%, 4/25/2030(c) | |
| Federal Home Loan Mortgage Corp. Multifamily Structured Pass-Through Certificates, Series KS14, Class AS, 30 day USD SOFR Average + 0.370%, 5.717%, 4/25/2030(c) | |
| Federal Home Loan Mortgage Corp. Multifamily Structured Pass-Through Certificates, Series Q008, Class A, 30 day USD SOFR Average + 0.504%, 5.851%, 10/25/2045(c) | |
| Federal Home Loan Mortgage Corp. Multifamily Structured Pass-Through Certificates, Series Q016, Class APT1, 1.241%, 5/25/2051(c) | |
| Federal National Mortgage Association, 3.580%, 1/01/2026 | |
| Federal National Mortgage Association, Series 2020-M5, Class FA, 30 day USD SOFR Average + 0.574%, 5.921%, 1/25/2027(c) | |
| Government National Mortgage Association, Series 2003-72, Class Z, 5.422%, 11/16/2045(c) | |
| | |
| Collateralized Mortgage Obligations — 8.5% |
| Federal Home Loan Mortgage Corp., Series 2131, Class ZB, REMICS, 6.000%, 3/15/2029(b) | |
| Federal Home Loan Mortgage Corp., Series 2978, Class JG, REMICS, 5.500%, 5/15/2035(b) | |
| Federal Home Loan Mortgage Corp., Series 3036, Class NE, REMICS, 5.000%, 9/15/2035(b) | |
| Federal Home Loan Mortgage Corp., Series 3412, Class AY, REMICS, 5.500%, 2/15/2038(b) | |
| Federal Home Loan Mortgage Corp., Series 3561, Class W, REMICS, 2.561%, 6/15/2048(c) | |
| Federal Home Loan Mortgage Corp., Series 3620, Class AT, REMICS, 4.051%, 12/15/2036(b)(c) | |
| Federal Home Loan Mortgage Corp., Series 4212, Class FW, REMICS, 0.000%, 6/15/2043(b)(c) | |
| Federal Home Loan Mortgage Corp. Structured Pass-Through Certificates, Series T-62, Class 1A1, 1 yr. MTA + 1.200%, 6.323%, 10/25/2044(b)(c) | |
| Federal National Mortgage Association, Series 2003-48, Class GH, REMICS, 5.500%, 6/25/2033(b) | |
| Federal National Mortgage Association, Series 2007-73, Class A1, REMICS, 30 day USD SOFR Average + 0.174%, 5.707%, 7/25/2037(b)(c) | |
| Federal National Mortgage Association, Series 2008-86, Class LA, REMICS, 3.520%, 8/25/2038(c) | |
| Federal National Mortgage Association, Series 2012-56, Class FK, REMICS, 30 day USD SOFR Average + 0.564%, 5.845%, 6/25/2042(b)(c) | |
See accompanying notes to financial statements.
Portfolio of Investments – as of September 30, 2024Loomis Sayles Limited Term Government and Agency Fund (continued) | | |
| Collateralized Mortgage Obligations — continued |
| Federal National Mortgage Association, Series 2012-58, Class KF, REMICS, 30 day USD SOFR Average + 0.664%, 5.945%, 6/25/2042(c) | |
| Federal National Mortgage Association, Series 2012-83, Class LF, REMICS, 30 day USD SOFR Average + 0.624%, 5.905%, 8/25/2042(c) | |
| Federal National Mortgage Association, Series 2013-67, Class NF, REMICS, 30 day USD SOFR Average + 1.114%, 5.000%, 7/25/2043(c) | |
| Federal National Mortgage Association, Series 2015-4, Class BF, REMICS, 30 day USD SOFR Average + 0.514%, 5.795%, 2/25/2045(c) | |
| Federal National Mortgage Association, Series 2020-35, Class FA, REMICS, 30 day USD SOFR Average + 0.614%, 5.966%, 6/25/2050(c) | |
| Government National Mortgage Association, Series 2005-18, Class F, 1 mo. USD SOFR + 0.314%, 5.275%, 2/20/2035(b)(c) | |
| Government National Mortgage Association, Series 2007-59, Class FM, 1 mo. USD SOFR + 0.634%, 5.595%, 10/20/2037(b)(c) | |
| Government National Mortgage Association, Series 2009-H01, Class FA, 1 mo. USD SOFR + 1.264%, 6.225%, 11/20/2059(b)(c) | |
| Government National Mortgage Association, Series 2010-H20, Class AF, 1 mo. USD SOFR + 0.444%, 5.797%, 10/20/2060(c) | |
| Government National Mortgage Association, Series 2010-H24, Class FA, 1 mo. USD SOFR + 0.464%, 5.817%, 10/20/2060(b)(c) | |
| Government National Mortgage Association, Series 2010-H27, Class FA, 1 mo. USD SOFR + 0.494%, 5.847%, 12/20/2060(b)(c) | |
| Government National Mortgage Association, Series 2011-H08, Class FA, 1 mo. USD SOFR + 0.714%, 6.067%, 2/20/2061(b)(c) | |
| Government National Mortgage Association, Series 2012-18, Class FM, 1 mo. USD SOFR + 0.364%, 5.325%, 9/20/2038(c) | |
| Government National Mortgage Association, Series 2012-H15, Class FA, 1 mo. USD SOFR + 0.564%, 5.500%, 5/20/2062(b)(c) | |
| Government National Mortgage Association, Series 2012-H18, Class NA, 1 mo. USD SOFR + 0.634%, 5.987%, 8/20/2062(b)(c) | |
| Government National Mortgage Association, Series 2012-H29, Class HF, 1 mo. USD SOFR + 0.614%, 5.967%, 10/20/2062(b)(c) | |
| Government National Mortgage Association, Series 2013-H02, Class GF, 1 mo. USD SOFR + 0.614%, 5.967%, 12/20/2062(b)(c) | |
| Government National Mortgage Association, Series 2013-H08, Class FA, 1 mo. USD SOFR + 0.464%, 5.817%, 3/20/2063(b)(c) | |
| Government National Mortgage Association, Series 2013-H10, Class FA, 1 mo. USD SOFR + 0.514%, 5.867%, 3/20/2063(b)(c) | |
| Government National Mortgage Association, Series 2013-H14, Class FG, 1 mo. USD SOFR + 0.584%, 5.937%, 5/20/2063(b)(c) | |
| | |
| Collateralized Mortgage Obligations — continued |
| Government National Mortgage Association, Series 2014-H14, Class FA, 1 mo. USD SOFR + 0.614%, 5.946%, 7/20/2064(c) | |
| Government National Mortgage Association, Series 2014-H15, Class FA, 1 mo. USD SOFR + 0.614%, 5.967%, 7/20/2064(c) | |
| Government National Mortgage Association, Series 2015-H04, Class FL, 1 mo. USD SOFR + 0.584%, 5.916%, 2/20/2065(c) | |
| Government National Mortgage Association, Series 2015-H09, Class HA, 1.750%, 3/20/2065(b) | |
| Government National Mortgage Association, Series 2015-H10, Class FC, 1 mo. USD SOFR + 0.594%, 5.947%, 4/20/2065(c) | |
| Government National Mortgage Association, Series 2015-H10, Class JA, 2.250%, 4/20/2065 | |
| Government National Mortgage Association, Series 2015-H11, Class FA, 1 mo. USD SOFR + 0.364%, 5.717%, 4/20/2065(b)(c) | |
| Government National Mortgage Association, Series 2015-H12, Class FL, 1 mo. USD SOFR + 0.344%, 5.697%, 5/20/2065(c) | |
| Government National Mortgage Association, Series 2015-H19, Class FH, 1 mo. USD SOFR + 0.414%, 5.767%, 7/20/2065(b)(c) | |
| Government National Mortgage Association, Series 2015-H29, Class FA, 1 mo. USD SOFR + 0.814%, 6.167%, 10/20/2065(b)(c) | |
| Government National Mortgage Association, Series 2015-H30, Class FA, 1 mo. USD SOFR + 0.794%, 6.147%, 8/20/2061(b)(c) | |
| Government National Mortgage Association, Series 2016-H06, Class FC, 1 mo. USD SOFR + 1.034%, 6.387%, 2/20/2066(c) | |
| Government National Mortgage Association, Series 2016-H20, Class FB, 1 mo. USD SOFR + 0.664%, 6.017%, 9/20/2066(b)(c) | |
| Government National Mortgage Association, Series 2017-H05, Class FC, 1 mo. USD SOFR + 0.864%, 6.217%, 2/20/2067(c) | |
| Government National Mortgage Association, Series 2018-H11, Class FJ, 1yr. USD SOFR + 0.795%, 5.997%, 6/20/2068(c) | |
| Government National Mortgage Association, Series 2018-H14, Class FG, 1 mo. USD SOFR + 0.464%, 5.817%, 9/20/2068(c) | |
| Government National Mortgage Association, Series 2018-H16, Class FA, 1 mo. USD SOFR + 0.534%, 5.887%, 9/20/2068(c) | |
| Government National Mortgage Association, Series 2019-H04, Class NA, 3.500%, 9/20/2068 | |
| Government National Mortgage Association, Series 2019-H13, Class FT, 1 yr. CMT + 0.450%, 5.100%, 8/20/2069(c) | |
| Government National Mortgage Association, Series 2020-30, Class F, 1 mo. USD SOFR + 0.514%, 5.715%, 4/20/2048(c) | |
| Government National Mortgage Association, Series 2020-53, Class NF, 1 mo. USD SOFR + 0.564%, 5.765%, 5/20/2046(c) | |
See accompanying notes to financial statements.
Portfolio of Investments – as of September 30, 2024Loomis Sayles Limited Term Government and Agency Fund (continued) | | |
| Collateralized Mortgage Obligations — continued |
| Government National Mortgage Association, Series 2020-H01, Class FT, 1 yr. CMT + 0.500%, 5.150%, 1/20/2070(c) | |
| Government National Mortgage Association, Series 2020-H02, Class FG, 1 mo. USD SOFR + 0.714%, 6.067%, 1/20/2070(c) | |
| Government National Mortgage Association, Series 2020-H04, Class FP, 1 mo. USD SOFR + 0.614%, 5.967%, 6/20/2069(c) | |
| Government National Mortgage Association, Series 2020-H07, Class FL, 1 mo. USD SOFR + 0.764%, 6.117%, 4/20/2070(c) | |
| Government National Mortgage Association, Series 2020-H10, Class FD, 1 mo. USD SOFR + 0.514%, 5.867%, 5/20/2070(c) | |
| | |
| |
| Federal Home Loan Mortgage Corp., 1 yr. RFUCC Treasury + 1.750%, 6.097%, 12/01/2037(c) | |
| Federal Home Loan Mortgage Corp., 1 yr. RFUCC Treasury + 1.748%, 6.169%, 4/01/2037(c) | |
| Federal Home Loan Mortgage Corp., 1 yr. CMT + 2.165%, 6.290%, 4/01/2036(c) | |
| Federal Home Loan Mortgage Corp., 1 yr. CMT + 2.286%, 6.427%, 2/01/2036(c) | |
| Federal Home Loan Mortgage Corp., 1 yr. RFUCC Treasury + 1.902%, 6.445%, 4/01/2037(c) | |
| Federal Home Loan Mortgage Corp., 1 yr. CMT + 2.207%, 6.493%, 9/01/2038(c) | |
| Federal Home Loan Mortgage Corp., 1 yr. CMT + 2.250%, 6.500%, 2/01/2035(c) | |
| Federal Home Loan Mortgage Corp., 1 yr. CMT + 2.261%, 6.536%, 2/01/2036(c) | |
| Federal Home Loan Mortgage Corp., 1 yr. CMT + 2.245%, 6.538%, 3/01/2036(c) | |
| Federal Home Loan Mortgage Corp., 6 mo. RFUCC Treasury + 1.771%, 6.644%, 6/01/2037(c) | |
| Federal Home Loan Mortgage Corp., 1 yr. RFUCC Treasury + 1.840%, 6.667%, 1/01/2046(c) | |
| Federal Home Loan Mortgage Corp., 1 yr. RFUCC Treasury + 1.686%, 6.876%, 3/01/2038(c) | |
| Federal Home Loan Mortgage Corp., 1 yr. CMT + 2.249%, 6.885%, 3/01/2037(c) | |
| Federal Home Loan Mortgage Corp., 1 yr. RFUCC Treasury + 1.777%, 6.971%, 11/01/2038(c) | |
| Federal Home Loan Mortgage Corp., 1 yr. RFUCC Treasury + 1.918%, 7.030%, 12/01/2034(c) | |
| Federal Home Loan Mortgage Corp., 1 yr. CMT + 2.248%, 7.219%, 9/01/2038(c) | |
| Federal Home Loan Mortgage Corp., 1 yr. RFUCC Treasury + 1.894%, 7.268%, 9/01/2041(c) | |
| Federal Home Loan Mortgage Corp., 1 yr. RFUCC Treasury + 1.765%, 7.313%, 9/01/2035(c) | |
| Federal Home Loan Mortgage Corp., 1 yr. RFUCC Treasury + 1.713%, 7.344%, 11/01/2038(c) | |
| Federal Home Loan Mortgage Corp., 1 yr. CMT + 2.220%, 7.345%, 7/01/2033(c) | |
| Federal National Mortgage Association, 1 yr. RFUCC Treasury + 1.800%, 6.050%, 10/01/2041(c) | |
| Federal National Mortgage Association, 1 yr. RFUCC Treasury + 1.800%, 6.050%, 12/01/2041(c) | |
| | |
| |
| Federal National Mortgage Association, 1 yr. RFUCC Treasury + 1.727%, 6.073%, 1/01/2037(c) | |
| Federal National Mortgage Association, 1 yr. RFUCC Treasury + 1.734%, 6.188%, 2/01/2037(c) | |
| Federal National Mortgage Association, 1 yr. RFUCC Treasury + 1.735%, 6.202%, 11/01/2035(c) | |
| Federal National Mortgage Association, 1 yr. CMT + 2.185%, 6.310%, 1/01/2036(c) | |
| Federal National Mortgage Association, 1 yr. RFUCC Treasury + 1.565%, 6.315%, 4/01/2037(c) | |
| Federal National Mortgage Association, 1 yr. RFUCC Treasury + 1.670%, 6.356%, 10/01/2033(c) | |
| Federal National Mortgage Association, 1 yr. RFUCC Treasury + 1.820%, 6.445%, 2/01/2047(c) | |
| Federal National Mortgage Association, 1 yr. CMT + 2.146%, 6.478%, 9/01/2034(c) | |
| Federal National Mortgage Association, 1 yr. RFUCC Treasury + 1.553%, 6.495%, 7/01/2035(c) | |
| Federal National Mortgage Association, 1 yr. RFUCC Treasury + 1.805%, 6.508%, 3/01/2037(c) | |
| Federal National Mortgage Association, 1 yr. RFUCC Treasury + 1.800%, 6.544%, 3/01/2034(c) | |
| Federal National Mortgage Association, 1 yr. CMT + 2.225%, 6.551%, 4/01/2034(c) | |
| Federal National Mortgage Association, 1 yr. CMT + 2.486%, 6.611%, 5/01/2035(c) | |
| Federal National Mortgage Association, 1 yr. RFUCC Treasury + 1.550%, 6.631%, 4/01/2037(c) | |
| Federal National Mortgage Association, 1 yr. CMT + 2.195%, 6.642%, 4/01/2034(c) | |
| Federal National Mortgage Association, 1 yr. CMT + 2.131%, 6.716%, 6/01/2036(c) | |
| Federal National Mortgage Association, 1 yr. CMT + 2.287%, 6.803%, 10/01/2033(c) | |
| Federal National Mortgage Association, 1 yr. RFUCC Treasury + 1.670%, 6.811%, 11/01/2036(c) | |
| Federal National Mortgage Association, 1 yr. RFUCC Treasury + 1.705%, 6.852%, 9/01/2037(c) | |
| Federal National Mortgage Association, 1 yr. CMT + 2.216%, 6.936%, 10/01/2034(c) | |
| Federal National Mortgage Association, 1 yr. RFUCC Treasury + 1.809%, 6.939%, 7/01/2041(c) | |
| Federal National Mortgage Association, 1 yr. CMT + 2.174%, 6.949%, 12/01/2040(c) | |
| Federal National Mortgage Association, 1 yr. CMT + 2.183%, 7.034%, 11/01/2033(c) | |
| Federal National Mortgage Association, 6 mo. RFUCC Treasury + 2.061%, 7.053%, 7/01/2037(c) | |
| Federal National Mortgage Association, 1 yr. CMT + 2.212%, 7.087%, 4/01/2033(c) | |
| Federal National Mortgage Association, 6 mo. RFUCC Treasury + 1.460%, 7.133%, 2/01/2037(c) | |
| Federal National Mortgage Association, 6 mo. RFUCC Treasury + 1.543%, 7.215%, 7/01/2035(c) | |
| Federal National Mortgage Association, 1 yr. CMT + 2.500%, 7.241%, 8/01/2036(c) | |
| Federal National Mortgage Association, 1 yr. RFUCC Treasury + 1.513%, 7.263%, 8/01/2035(c) | |
| Federal National Mortgage Association, 1 yr. CMT + 2.145%, 7.270%, 9/01/2036(c) | |
| Federal National Mortgage Association, 1 yr. RFUCC Treasury + 1.584%, 7.282%, 9/01/2037(c) | |
See accompanying notes to financial statements.
Portfolio of Investments – as of September 30, 2024Loomis Sayles Limited Term Government and Agency Fund (continued) | | |
| |
| Federal National Mortgage Association, 1 yr. CMT + 2.223%, 7.348%, 8/01/2035(c) | |
| Federal National Mortgage Association, 1 yr. CMT + 2.270%, 7.395%, 6/01/2037(c) | |
| Federal National Mortgage Association, 1 yr. CMT + 2.287%, 7.412%, 6/01/2033(c) | |
| Federal National Mortgage Association, 1 yr. RFUCC Treasury + 1.616%, 7.452%, 8/01/2038(c) | |
| Federal National Mortgage Association, 1 yr. RFUCC Treasury + 1.713%, 7.463%, 8/01/2034(c) | |
| Federal National Mortgage Association, 1 yr. RFUCC Treasury + 1.681%, 7.556%, 7/01/2038(c) | |
| Federal National Mortgage Association, 1 yr. CMT + 2.440%, 7.565%, 8/01/2033(c) | |
| Federal National Mortgage Association, 1 yr. RFUCC Treasury + 2.473%, 8.223%, 6/01/2035(c) | |
| | |
| |
| Federal Home Loan Mortgage Corp., 3.000%, 10/01/2026 | |
| Federal Home Loan Mortgage Corp., 4.000%, 12/01/2024 | |
| Federal Home Loan Mortgage Corp., 4.000%, 1/01/2042 | |
| Federal Home Loan Mortgage Corp., 4.500%, 1/01/2025 | |
| Federal Home Loan Mortgage Corp., 4.500%, 5/01/2034 | |
| Federal Home Loan Mortgage Corp., 6.500%, 12/01/2034 | |
| Federal Home Loan Mortgage Corp., 7.500%, 6/01/2026 | |
| Federal National Mortgage Association, 3.000%, 3/01/2042 | |
| Federal National Mortgage Association, 5.000%, 7/01/2037 | |
| Federal National Mortgage Association, 5.000%, 2/01/2038 | |
| Federal National Mortgage Association, 5.500%, 3/01/2033 | |
| Federal National Mortgage Association, 6.500%, 1/01/2033 | |
| Federal National Mortgage Association, 6.500%, 10/01/2033 | |
| Federal National Mortgage Association, 6.500%, 10/01/2033 | |
| Federal National Mortgage Association, 6.500%, 10/01/2033 | |
| Federal National Mortgage Association, 6.500%, 12/01/2034 | |
| Federal National Mortgage Association, 6.500%, 2/01/2036 | |
| Federal National Mortgage Association, 6.500%, 11/01/2037 | |
| Federal National Mortgage Association, 7.500%, 7/01/2031 | |
| Federal National Mortgage Association, 7.500%, 9/01/2032 | |
| Government National Mortgage Association, 4.140%, 12/20/2061(c) | |
| | |
| Mortgage Related — continued |
| Government National Mortgage Association, 4.140%, 7/20/2063(c) | |
| Government National Mortgage Association, 4.248%, 11/20/2063(c) | |
| Government National Mortgage Association, 4.390%, 12/20/2062(c) | |
| Government National Mortgage Association, 4.430%, 10/20/2065(c) | |
| Government National Mortgage Association, 4.528%, 2/20/2066(c) | |
| Government National Mortgage Association, 4.565%, 8/20/2062(c) | |
| Government National Mortgage Association, 4.630%, 8/20/2061(c) | |
| Government National Mortgage Association, 4.630%, 2/20/2062(c) | |
| Government National Mortgage Association, 4.700%, 6/20/2061(c) | |
| Government National Mortgage Association, 4.700%, 2/20/2062(c) | |
| Government National Mortgage Association, 4.700%, 6/20/2062(c) | |
| Government National Mortgage Association, 4.700%, 6/20/2063(c) | |
| Government National Mortgage Association, 4.700%, 1/20/2064(c) | |
| Government National Mortgage Association, 4.806%, 4/20/2061(c) | |
| Government National Mortgage Association, 6.000%, 12/15/2031 | |
| Government National Mortgage Association, 6.500%, 5/15/2031 | |
| Government National Mortgage Association, 7.000%, 10/15/2028 | |
| Government National Mortgage Association, 1 mo. RFUCC Treasury + 1.816%, 7.317%, 2/20/2061(c) | |
| Government National Mortgage Association, 1 mo. RFUCC Treasury + 1.890%, 7.341%, 2/20/2063(c) | |
| Government National Mortgage Association, 1 mo. RFUCC Treasury + 2.103%, 7.556%, 5/20/2065(c) | |
| Government National Mortgage Association, 1 mo. RFUCC Treasury + 2.165%, 7.612%, 3/20/2063(c) | |
| Government National Mortgage Association, 1 mo. RFUCC Treasury + 2.197%, 7.640%, 6/20/2065(c) | |
| Government National Mortgage Association, 1 mo. RFUCC Treasury + 2.302%, 7.756%, 2/20/2063(c) | |
| | |
| Non-Agency Commercial Mortgage-Backed Securities — 3.4% |
| Bank, Series 2020-BN25, Class A5, 2.649%, 1/15/2063 | |
| Bank5, Series 2023-5YR4, Class A3, 6.500%, 12/15/2056 | |
| BBCMS Mortgage Trust, Series 2020-BID, Class A, 1 mo. USD SOFR + 2.254%, 7.352%, 10/15/2037(a)(c) | |
| BPR Trust, Series 2021-NRD, Class A, 1 mo. USD SOFR + 1.525%, 6.622%, 12/15/2038(a)(c) | |
| BPR Trust, Series 2022-SSP, Class A, 1 mo. USD SOFR + 3.000%, 8.097%, 5/15/2039(a)(c) | |
| CFCRE Commercial Mortgage Trust, Series 2016-C7, Class A3, 3.839%, 12/10/2054 | |
See accompanying notes to financial statements.
Portfolio of Investments – as of September 30, 2024Loomis Sayles Limited Term Government and Agency Fund (continued) | | |
| Non-Agency Commercial Mortgage-Backed Securities — continued |
| Commercial Mortgage Pass-Through Certificates, Series 2012-LTRT, Class A2, 3.400%, 10/05/2030(a) | |
| Commercial Mortgage Trust, Series 2016-DC2, Class ASB, 3.550%, 2/10/2049 | |
| DROP Mortgage Trust, Series 2021-FILE, Class A, 1 mo. USD SOFR + 1.264%, 6.362%, 10/15/2043(a)(c) | |
| Hudsons Bay Simon JV Trust, Series 2015-HB7, Class A7, 3.914%, 8/05/2034(a) | |
| SPGN Mortgage Trust, Series 2022-TFLM, Class A, 1 mo. USD SOFR + 1.550%, 6.647%, 2/15/2039(a)(c) | |
| Starwood Retail Property Trust, Series 2014-STAR, Class A, Prime + 0.000%, 8.500%, 11/15/2027(a)(c) | |
| | |
| |
| U.S. Treasury Notes, 0.375%, 9/30/2027 | |
| U.S. Treasury Notes, 2.750%, 4/30/2027 | |
| U.S. Treasury Notes, 2.750%, 2/15/2028 | |
| U.S. Treasury Notes, 3.500%, 9/30/2026 | |
| U.S. Treasury Notes, 3.500%, 9/30/2029 | |
| U.S. Treasury Notes, 3.625%, 8/31/2029 | |
| U.S. Treasury Notes, 3.750%, 8/31/2026 | |
| U.S. Treasury Notes, 3.750%, 12/31/2028 | |
| U.S. Treasury Notes, 3.875%, 11/30/2027 | |
| U.S. Treasury Notes, 3.875%, 12/31/2027 | |
| U.S. Treasury Notes, 4.000%, 2/29/2028 | |
| U.S. Treasury Notes, 4.000%, 6/30/2028 | |
| U.S. Treasury Notes, 4.000%, 1/31/2029 | |
| U.S. Treasury Notes, 4.000%, 7/31/2029 | |
| U.S. Treasury Notes, 4.125%, 10/31/2027 | |
| U.S. Treasury Notes, 4.125%, 7/31/2028 | |
| U.S. Treasury Notes, 4.125%, 3/31/2029 | |
| U.S. Treasury Notes, 4.250%, 12/31/2025 | |
| U.S. Treasury Notes, 4.250%, 1/31/2026 | |
| U.S. Treasury Notes, 4.250%, 6/30/2029 | |
| U.S. Treasury Notes, 4.375%, 8/31/2028 | |
| U.S. Treasury Notes, 4.500%, 3/31/2026 | |
| U.S. Treasury Notes, 4.625%, 3/15/2026 | |
| U.S. Treasury Notes, 4.625%, 11/15/2026 | |
| U.S. Treasury Notes, 4.625%, 4/30/2029 | |
| U.S. Treasury Notes, 4.875%, 10/31/2028 | |
| U.S. Treasury Notes, 5.000%, 10/31/2025 | |
| | |
| Total Bonds and Notes
(Identified Cost $708,123,719) | |
|
|
| | |
|
Short-Term Investments — 4.9% |
| Tri-Party Repurchase Agreement with Fixed Income Clearing Corporation, dated 9/30/2024 at 3.000% to be repurchased at $3,824,226 on 10/01/2024 collateralized by $3,687,400 U.S. Treasury Note, 4.500% due 5/31/2029 valued at $3,900,482 including accrued interest (Note 2 of Notes to Financial Statements) | |
| Federal Home Loan Bank Discount Notes, 4.600%–4.650%, 10/09/2024(d)(e) | |
| Total Short-Term Investments
(Identified Cost $36,625,114) | |
| Total Investments — 99.6%
(Identified Cost $744,748,833) | |
| Other assets less liabilities — 0.4% | |
| | |
| See Note 2 of Notes to Financial Statements. |
| All or a portion of these securities are exempt from registration under Rule 144A of the Securities Act of 1933. These securities may be resold in transactions exempt from registration, normally to qualified institutional buyers. At September 30, 2024, the value of Rule 144A holdings amounted to $41,582,648 or 5.6% of net assets. |
| Level 3 security. Value has been determined using significant unobservable inputs. See Note 3 of Notes to Financial Statements. |
| Variable rate security. Rate as of September 30, 2024 is disclosed. Issuers comprised of various lots with differing coupon rates have been aggregated for the purpose of presentation in the Portfolio of Investments and show a weighted average rate. Certain variable rate securities are not based on a published reference rate and spread, rather are determined by the issuer or agent and are based on current market conditions. These securities may not indicate a reference rate and/or spread in their description. |
| The Fund's investment in U.S. Government/Agency securities is comprised of various lots with differing discount rates. These separate investments, which have the same maturity date, have been aggregated for the purpose of presentation in the Portfolio of Investments. |
| Interest rate represents discount rate at time of purchase; not a coupon rate. |
| |
| Adjustable Rate Mortgages |
| Constant Maturity Treasury |
| Monthly Treasury Average Interest |
| Real Estate Mortgage Investment Conduits |
| Secured Overnight Financing Rate |
See accompanying notes to financial statements.
Portfolio of Investments – as of September 30, 2024Loomis Sayles Limited Term Government and Agency Fund (continued) Industry Summary at September 30, 2024
| |
Agency Commercial Mortgage-Backed Securities | |
Collateralized Mortgage Obligations | |
Non-Agency Commercial Mortgage-Backed Securities | |
Other Investments, less than 2% each | |
| |
| |
Other assets less liabilities | |
| |
See accompanying notes to financial statements.
Statements of Assets and Liabilities
| | | |
| | | |
Unaffiliated investments at cost | | | |
Affiliated investments at cost | | | |
Net unrealized appreciation (depreciation) on unaffiliated investments | | | |
Net unrealized appreciation on affiliated investments | | | |
| | | |
| | | |
Due from brokers (Note 2) | | | |
Foreign currency at value (identified cost $53, $18,442,435 and $0, respectively) | | | |
Receivable for Fund shares sold | | | |
Receivable for securities sold | | | |
Collateral received for open forward foreign currency contracts (Notes 2 and 4) | | | |
Dividends and interest receivable | | | |
Unrealized appreciation on forward foreign currency contracts (Note 2) | | | |
| | | |
| | | |
| | | |
| | | |
Payable for securities purchased | | | |
Payable for when-issued/delayed delivery securities purchased (Note 2) | | | |
Payable for Fund shares redeemed | | | |
Payable for variation margin on futures contracts (Note 2) | | | |
Unrealized depreciation on forward foreign currency contracts (Note 2) | | | |
Foreign taxes payable (Note 2) | | | |
| | | |
Management fees payable (Note 6) | | | |
Deferred Trustees’ fees (Note 6) | | | |
Administrative fees payable (Note 6) | | | |
Payable to distributor (Note 6d) | | | |
Audit and tax services fees payable | | | |
Other accounts payable and accrued expenses | | | |
| | | |
COMMITMENTS AND CONTINGENCIES(a) | | | |
| | | |
| | | |
| | | |
Accumulated earnings (loss) | | | |
| | | |
See accompanying notes to financial statements.
Statements of Assets and Liabilities (continued)
| | | |
COMPUTATION OF NET ASSET VALUE AND OFFERING PRICE: | | | |
| | | |
| | | |
Shares of beneficial interest | | | |
Net asset value and redemption price per share | | | |
Offering price per share (100/[100-maximum sales charge] of net asset value) (Note 1) | | | |
Class C shares: (redemption price per share is equal to net asset value less any applicable contingent deferred sales charge) (Note 1) | | | |
| | | |
Shares of beneficial interest | | | |
Net asset value and offering price per share | | | |
| | | |
| | | |
Shares of beneficial interest | | | |
Net asset value, offering and redemption price per share | | | |
| | | |
| | | |
Shares of beneficial interest | | | |
Net asset value, offering and redemption price per share | | | |
| As disclosed in the Notes to Financial Statements, if applicable. |
See accompanying notes to financial statements.
Statements of Assets and Liabilities (continued)
| Intermediate
Duration Bond
Fund | Limited Term
Government
and Agency
Fund |
| | |
Unaffiliated investments at cost | | |
Net unrealized appreciation (depreciation) on unaffiliated investments | | |
| | |
| | |
Due from brokers (Note 2) | | |
Receivable for Fund shares sold | | |
Receivable for securities sold | | |
Dividends and interest receivable | | |
| | |
| | |
| | |
Payable for securities purchased | | |
Payable for Fund shares redeemed | | |
Payable for variation margin on futures contracts (Note 2) | | |
| | |
Management fees payable (Note 6) | | |
Deferred Trustees’ fees (Note 6) | | |
Administrative fees payable (Note 6) | | |
Payable to distributor (Note 6d) | | |
Audit and tax services fees payable | | |
Other accounts payable and accrued expenses | | |
| | |
COMMITMENTS AND CONTINGENCIES(a) | | |
| | |
| | |
| | |
| | |
| | |
COMPUTATION OF NET ASSET VALUE AND OFFERING PRICE: | | |
| | |
| | |
Shares of beneficial interest | | |
Net asset value and redemption price per share | | |
Offering price per share (100/[100-maximum sales charge] of net asset value) (Note 1) | | |
Class C shares: (redemption price per share is equal to net asset value less any applicable contingent deferred sales charge) (Note 1) | | |
| | |
Shares of beneficial interest | | |
Net asset value and offering price per share | | |
| | |
| | |
Shares of beneficial interest | | |
Net asset value, offering and redemption price per share | | |
| | |
| | |
Shares of beneficial interest | | |
Net asset value, offering and redemption price per share | | |
| As disclosed in the Notes to Financial Statements, if applicable. |
See accompanying notes to financial statements.
For the Year Ended September 30, 2024
| | | |
| | | |
| | | |
| | | |
Less net foreign taxes withheld | | | |
| | | |
| | | |
| | | |
Service and distribution fees (Note 6) | | | |
Administrative fees (Note 6) | | | |
Trustees' fees and expenses (Note 6) | | | |
Transfer agent fees and expenses (Notes 6, 7 and 8) | | | |
Audit and tax services fees | | | |
Custodian fees and expenses | | | |
| | | |
| | | |
Shareholder reporting expenses | | | |
| | | |
| | | |
Less waiver and/or expense reimbursement (Note 6) | | | |
Less expense offset (Note 8) | | | |
| | | |
Net investment income (loss) | | | |
Net realized and unrealized gain (loss) on Investments, Futures contracts, Forward foreign currency contracts and Foreign currency transactions | | | |
Net realized gain (loss) on: | | | |
| | | |
| | | |
Forward foreign currency contracts (Note 2e) | | | |
Foreign currency transactions (Note 2d) | | | |
Net change in unrealized appreciation (depreciation) on: | | | |
| | | |
| | | |
| | | |
Forward foreign currency contracts (Note 2e) | | | |
Foreign currency translations (Note 2d) | | | |
Net realized and unrealized gain on Investments, Futures contracts, Forward foreign currency contracts and Foreign currency transactions | | | |
NET INCREASE IN NET ASSETS RESULTING FROM OPERATIONS | | | |
See accompanying notes to financial statements.
Statements of Operations (continued)
For the Year Ended September 30, 2024
| Intermediate
Duration Bond
Fund | Limited Term
Government
and Agency
Fund |
| | |
| | |
Less net foreign taxes withheld | | |
| | |
| | |
| | |
Service and distribution fees (Note 6) | | |
Administrative fees (Note 6) | | |
Trustees' fees and expenses (Note 6) | | |
Transfer agent fees and expenses (Notes 6, 7 and 8) | | |
Audit and tax services fees | | |
Custodian fees and expenses | | |
| | |
| | |
Shareholder reporting expenses | | |
| | |
| | |
Less waiver and/or expense reimbursement (Note 6) | | |
Less expense offset (Note 8) | | |
| | |
| | |
Net realized and unrealized gain (loss) on Investments and Futures contracts | | |
Net realized gain (loss) on: | | |
| | |
| | |
Net change in unrealized appreciation (depreciation) on: | | |
| | |
| | |
Net realized and unrealized gain on Investments and Futures contracts | | |
NET INCREASE IN NET ASSETS RESULTING FROM OPERATIONS | | |
See accompanying notes to financial statements.
Statements of Changes in Net Assets
| | |
| Year Ended
September 30,2024 | Year Ended
September 30,2023 | Year Ended
September 30,2024 | Year Ended
September 30,2023 |
| | | | |
| | | | |
Net realized gain (loss) on investments, futures contracts, forward foreign currency contracts and foreign currency transactions | | | | |
Net change in unrealized appreciation on investments, futures contracts, forward foreign currency contracts and foreign currency translations | | | | |
Net increase in net assets resulting from operations | | | | |
FROM DISTRIBUTIONS TO SHAREHOLDERS: | | | | |
| | | | |
| | | | |
| | | | |
| | | | |
| | | | |
NET INCREASE (DECREASE) IN NET ASSETS
FROM CAPITAL SHARES TRANSACTIONS
(Note 12) | | | | |
Net increase (decrease) in net assets | | | | |
| | | | |
| | | | |
| | | | |
See accompanying notes to financial statements.
Statements of Changes in Net Assets (continued)
| | Intermediate Duration Bond
Fund |
| Year Ended
September 30,2024 | Year Ended
September 30,2023 | Year Ended
September 30,2024 | Year Ended
September 30,2023 |
| | | | |
Net investment income (loss) | | | | |
Net realized gain (loss) on investments and futures contracts | | | | |
Net change in unrealized appreciation on investments, futures contracts and foreign currency translations | | | | |
Net increase in net assets resulting from operations | | | | |
FROM DISTRIBUTIONS TO SHAREHOLDERS: | | | | |
| | | | |
| | | | |
| | | | |
| | | | |
| | | | |
NET INCREASE (DECREASE) IN NET ASSETS
FROM CAPITAL SHARES TRANSACTIONS
(Note 12) | | | | |
Net increase (decrease) in net assets | | | | |
| | | | |
| | | | |
| | | | |
See accompanying notes to financial statements.
Statements of Changes in Net Assets (continued)
| Limited Term Government and
Agency Fund |
| Year Ended
September 30,2024 | Year Ended
September 30,2023 |
| | |
| | |
Net realized gain (loss) on investments | | |
Net change in unrealized appreciation on investments | | |
Net increase in net assets resulting from operations | | |
FROM DISTRIBUTIONS TO SHAREHOLDERS: | | |
| | |
| | |
| | |
| | |
| | |
NET DECREASE IN NET ASSETS
FROM CAPITAL SHARES TRANSACTIONS
(Note 12) | | |
Net decrease in net assets | | |
| | |
| | |
| | |
See accompanying notes to financial statements.
For a share outstanding throughout each period.
| Core Plus Bond Fund—Class A |
| Year Ended
September 30,
2024 | Year Ended
September 30,
2023 | Year Ended
September 30,
2022 | Year Ended
September 30,
2021 | Year Ended
September 30,
2020 |
Net asset value, beginning of the period | | | | | |
INCOME (LOSS) FROM INVESTMENT OPERATIONS: | | | | | |
| | | | | |
Net realized and unrealized gain (loss) | | | | | |
Total from Investment Operations | | | | | |
| | | | | |
| | | | | |
Net realized capital gains | | | | | |
| | | | | |
Net asset value, end of the period | | | | | |
| | | | | |
RATIOS TO AVERAGE NET ASSETS: | | | | | |
Net assets, end of the period (000's) | | | | | |
| | | | | |
| | | | | |
| | | | | |
| | | | | |
| Per share net investment income has been calculated using the average shares outstanding during the period. |
| A sales charge for Class A shares is not reflected in total return calculations. |
| Had certain expenses not been waived/reimbursed during the period, total returns would have been lower. |
| The investment adviser agreed to waive its fees and/or reimburse a portion of the Fund’s expenses during the period. Without this waiver/reimbursement, expenses would have been higher. |
| Effective July 1, 2022, the expense limit decreased from 0.75% to 0.74%. |
| Effective July 1, 2020, the expense limit decreased from 0.80% to 0.75%. |
See accompanying notes to financial statements.
Financial Highlights (continued)
For a share outstanding throughout each period.
| Core Plus Bond Fund—Class C |
| Year Ended
September 30,
2024 | Year Ended
September 30,
2023 | Year Ended
September 30,
2022 | Year Ended
September 30,
2021 | Year Ended
September 30,
2020 |
Net asset value, beginning of the period | | | | | |
INCOME (LOSS) FROM INVESTMENT OPERATIONS: | | | | | |
| | | | | |
Net realized and unrealized gain (loss) | | | | | |
Total from Investment Operations | | | | | |
| | | | | |
| | | | | |
Net realized capital gains | | | | | |
| | | | | |
Net asset value, end of the period | | | | | |
| | | | | |
RATIOS TO AVERAGE NET ASSETS: | | | | | |
Net assets, end of the period (000's) | | | | | |
| | | | | |
| | | | | |
| | | | | |
| | | | | |
| Per share net investment income has been calculated using the average shares outstanding during the period. |
| A contingent deferred sales charge for Class C shares is not reflected in total return calculations. |
| Had certain expenses not been waived/reimbursed during the period, total returns would have been lower. |
| The investment adviser agreed to waive its fees and/or reimburse a portion of the Fund’s expenses during the period. Without this waiver/reimbursement, expenses would have been higher. |
| Effective July 1, 2022, the expense limit decreased from 1.50% to 1.49%. |
| Effective July 1, 2020, the expense limit decreased from 1.55% to 1.50%. |
See accompanying notes to financial statements.
Financial Highlights (continued)
For a share outstanding throughout each period.
| Core Plus Bond Fund—Class N |
| Year Ended
September 30,
2024 | Year Ended
September 30,
2023 | Year Ended
September 30,
2022 | Year Ended
September 30,
2021 | Year Ended
September 30,
2020 |
Net asset value, beginning of the period | | | | | |
INCOME (LOSS) FROM INVESTMENT OPERATIONS: | | | | | |
| | | | | |
Net realized and unrealized gain (loss) | | | | | |
Total from Investment Operations | | | | | |
| | | | | |
| | | | | |
Net realized capital gains | | | | | |
| | | | | |
Net asset value, end of the period | | | | | |
| | | | | |
RATIOS TO AVERAGE NET ASSETS: | | | | | |
Net assets, end of the period (000's) | | | | | |
| | | | | |
| | | | | |
| | | | | |
| | | | | |
| Per share net investment income has been calculated using the average shares outstanding during the period. |
| Effective July 1, 2022, the expense limit decreased from 0.45% to 0.44%. |
| Effective July 1, 2020, the expense limit decreased from 0.50% to 0.45%. |
See accompanying notes to financial statements.
Financial Highlights (continued)
For a share outstanding throughout each period.
| Core Plus Bond Fund—Class Y |
| Year Ended
September 30,
2024 | Year Ended
September 30,
2023 | Year Ended
September 30,
2022 | Year Ended
September 30,
2021 | Year Ended
September 30,
2020 |
Net asset value, beginning of the period | | | | | |
INCOME (LOSS) FROM INVESTMENT OPERATIONS: | | | | | |
| | | | | |
Net realized and unrealized gain (loss) | | | | | |
Total from Investment Operations | | | | | |
| | | | | |
| | | | | |
Net realized capital gains | | | | | |
| | | | | |
Net asset value, end of the period | | | | | |
| | | | | |
RATIOS TO AVERAGE NET ASSETS: | | | | | |
Net assets, end of the period (000's) | | | | | |
| | | | | |
| | | | | |
| | | | | |
| | | | | |
| Per share net investment income has been calculated using the average shares outstanding during the period. |
| Had certain expenses not been waived/reimbursed during the period, total returns would have been lower. |
| The investment adviser agreed to waive its fees and/or reimburse a portion of the Fund’s expenses during the period. Without this waiver/reimbursement, expenses would have been higher. |
| Effective July 1, 2022, the expense limit decreased from 0.50% to 0.49%. |
| Effective July 1, 2020, the expense limit decreased from 0.55% to 0.50%. |
See accompanying notes to financial statements.
Financial Highlights (continued)
For a share outstanding throughout each period.
| Global Allocation Fund—Class A |
| Year Ended
September 30,
2024 | Year Ended
September 30,
2023 | Year Ended
September 30,
2022 | Year Ended
September 30,
2021 | Year Ended
September 30,
2020 |
Net asset value, beginning of the period | | | | | |
INCOME (LOSS) FROM INVESTMENT OPERATIONS: | | | | | |
| | | | | |
Net realized and unrealized gain (loss) | | | | | |
Total from Investment Operations | | | | | |
| | | | | |
| | | | | |
Net realized capital gains | | | | | |
| | | | | |
Net asset value, end of the period | | | | | |
| | | | | |
RATIOS TO AVERAGE NET ASSETS: | | | | | |
Net assets, end of the period (000's) | | | | | |
| | | | | |
| | | | | |
| | | | | |
| | | | | |
| Per share net investment income has been calculated using the average shares outstanding during the period. |
| A sales charge for Class A shares is not reflected in total return calculations. |
See accompanying notes to financial statements.
Financial Highlights (continued)
For a share outstanding throughout each period.
| Global Allocation Fund—Class C |
| Year Ended
September 30,
2024 | Year Ended
September 30,
2023 | Year Ended
September 30,
2022 | Year Ended
September 30,
2021 | Year Ended
September 30,
2020 |
Net asset value, beginning of the period | | | | | |
INCOME (LOSS) FROM INVESTMENT OPERATIONS: | | | | | |
Net investment income (loss)(a) | | | | | |
Net realized and unrealized gain (loss) | | | | | |
Total from Investment Operations | | | | | |
| | | | | |
Net realized capital gains | | | | | |
Net asset value, end of the period | | | | | |
| | | | | |
RATIOS TO AVERAGE NET ASSETS: | | | | | |
Net assets, end of the period (000's) | | | | | |
| | | | | |
| | | | | |
Net investment income (loss) | | | | | |
| | | | | |
| Per share net investment income (loss) has been calculated using the average shares outstanding during the period. |
| A contingent deferred sales charge for Class C shares is not reflected in total return calculations. |
See accompanying notes to financial statements.
Financial Highlights (continued)
For a share outstanding throughout each period.
| Global Allocation Fund—Class N |
| Year Ended
September 30,
2024 | Year Ended
September 30,
2023 | Year Ended
September 30,
2022 | Year Ended
September 30,
2021 | Year Ended
September 30,
2020 |
Net asset value, beginning of the period | | | | | |
INCOME (LOSS) FROM INVESTMENT OPERATIONS: | | | | | |
| | | | | |
Net realized and unrealized gain (loss) | | | | | |
Total from Investment Operations | | | | | |
| | | | | |
| | | | | |
Net realized capital gains | | | | | |
| | | | | |
Net asset value, end of the period | | | | | |
| | | | | |
RATIOS TO AVERAGE NET ASSETS: | | | | | |
Net assets, end of the period (000's) | | | | | |
| | | | | |
| | | | | |
| | | | | |
| | | | | |
| Per share net investment income has been calculated using the average shares outstanding during the period. |
See accompanying notes to financial statements.
Financial Highlights (continued)
For a share outstanding throughout each period.
| Global Allocation Fund—Class Y |
| Year Ended
September 30,
2024 | Year Ended
September 30,
2023 | Year Ended
September 30,
2022 | Year Ended
September 30,
2021 | Year Ended
September 30,
2020 |
Net asset value, beginning of the period | | | | | |
INCOME (LOSS) FROM INVESTMENT OPERATIONS: | | | | | |
| | | | | |
Net realized and unrealized gain (loss) | | | | | |
Total from Investment Operations | | | | | |
| | | | | |
| | | | | |
Net realized capital gains | | | | | |
| | | | | |
Net asset value, end of the period | | | | | |
| | | | | |
RATIOS TO AVERAGE NET ASSETS: | | | | | |
Net assets, end of the period (000's) | | | | | |
| | | | | |
| | | | | |
| | | | | |
| | | | | |
| Per share net investment income has been calculated using the average shares outstanding during the period. |
See accompanying notes to financial statements.
Financial Highlights (continued)
For a share outstanding throughout each period.
| |
| Year Ended
September 30,
2024 | Year Ended
September 30,
2023 | Year Ended
September 30,
2022 | Year Ended
September 30,
2021 | Year Ended
September 30,
2020 |
Net asset value, beginning of the period | | | | | |
INCOME (LOSS) FROM INVESTMENT OPERATIONS: | | | | | |
Net investment income (loss)(a) | | | | | |
Net realized and unrealized gain (loss) | | | | | |
Total from Investment Operations | | | | | |
| | | | | |
| | | | | |
Net realized capital gains | | | | | |
| | | | | |
Net asset value, end of the period | | | | | |
| | | | | |
RATIOS TO AVERAGE NET ASSETS: | | | | | |
Net assets, end of the period (000's) | | | | | |
| | | | | |
| | | | | |
Net investment income (loss) | | | | | |
| | | | | |
| Per share net investment income (loss) has been calculated using the average shares outstanding during the period. |
| A sales charge for Class A shares is not reflected in total return calculations. |
| Includes transfer agent fees and expenses before expense offset. Without these expenses the ratio of gross expenses would have been 0.91%. See Note 8 of Notes to Financial Statements. |
See accompanying notes to financial statements.
Financial Highlights (continued)
For a share outstanding throughout each period.
| |
| Year Ended
September 30,
2024 | Year Ended
September 30,
2023 | Year Ended
September 30,
2022 | Year Ended
September 30,
2021 | Year Ended
September 30,
2020 |
Net asset value, beginning of the period | | | | | |
INCOME (LOSS) FROM INVESTMENT OPERATIONS: | | | | | |
| | | | | |
Net realized and unrealized gain (loss) | | | | | |
Total from Investment Operations | | | | | |
| | | | | |
Net realized capital gains | | | | | |
Net asset value, end of the period | | | | | |
| | | | | |
RATIOS TO AVERAGE NET ASSETS: | | | | | |
Net assets, end of the period (000's) | | | | | |
| | | | | |
| | | | | |
| | | | | |
| | | | | |
| Per share net investment loss has been calculated using the average shares outstanding during the period. |
| A contingent deferred sales charge for Class C shares is not reflected in total return calculations. |
See accompanying notes to financial statements.
Financial Highlights (continued)
For a share outstanding throughout each period.
| |
| Year Ended
September 30,
2024 | Year Ended
September 30,
2023 | Year Ended
September 30,
2022 | Year Ended
September 30,
2021 | Year Ended
September 30,
2020 |
Net asset value, beginning of the period | | | | | |
INCOME (LOSS) FROM INVESTMENT OPERATIONS: | | | | | |
Net investment income (loss)(a) | | | | | |
Net realized and unrealized gain (loss) | | | | | |
Total from Investment Operations | | | | | |
| | | | | |
| | | | | |
Net realized capital gains | | | | | |
| | | | | |
Net asset value, end of the period | | | | | |
| | | | | |
RATIOS TO AVERAGE NET ASSETS: | | | | | |
Net assets, end of the period (000's) | | | | | |
| | | | | |
| | | | | |
Net investment income (loss) | | | | | |
| | | | | |
| Per share net investment income (loss) has been calculated using the average shares outstanding during the period. |
| Amount rounds to less than $0.01 per share. |
See accompanying notes to financial statements.
Financial Highlights (continued)
For a share outstanding throughout each period.
| |
| Year Ended
September 30,
2024 | Year Ended
September 30,
2023 | Year Ended
September 30,
2022 | Year Ended
September 30,
2021 | Year Ended
September 30,
2020 |
Net asset value, beginning of the period | | | | | |
INCOME (LOSS) FROM INVESTMENT OPERATIONS: | | | | | |
Net investment income (loss)(a) | | | | | |
Net realized and unrealized gain (loss) | | | | | |
Total from Investment Operations | | | | | |
| | | | | |
| | | | | |
Net realized capital gains | | | | | |
| | | | | |
Net asset value, end of the period | | | | | |
| | | | | |
RATIOS TO AVERAGE NET ASSETS: | | | | | |
Net assets, end of the period (000's) | | | | | |
| | | | | |
| | | | | |
Net investment income (loss) | | | | | |
| | | | | |
| Per share net investment income (loss) has been calculated using the average shares outstanding during the period. |
See accompanying notes to financial statements.
Financial Highlights (continued)
For a share outstanding throughout each period.
| Intermediate Duration Bond Fund—Class A |
| Year Ended
September 30,
2024 | Year Ended
September 30,
2023 | Year Ended
September 30,
2022 | Year Ended
September 30,
2021 | Year Ended
September 30,
2020 |
Net asset value, beginning of the period | | | | | |
INCOME (LOSS) FROM INVESTMENT OPERATIONS: | | | | | |
| | | | | |
Net realized and unrealized gain (loss) | | | | | |
Total from Investment Operations | | | | | |
| | | | | |
| | | | | |
Net realized capital gains | | | | | |
| | | | | |
Net asset value, end of the period | | | | | |
| | | | | |
RATIOS TO AVERAGE NET ASSETS: | | | | | |
Net assets, end of the period (000's) | | | | | |
| | | | | |
| | | | | |
| | | | | |
| | | | | |
| Per share net investment income has been calculated using the average shares outstanding during the period. |
| Amount rounds to less than $0.01 per share. |
| A sales charge for Class A shares is not reflected in total return calculations. |
| Had certain expenses not been waived/reimbursed during the period, total returns would have been lower. |
| The investment adviser agreed to waive its fees and/or reimburse a portion of the Fund’s expenses during the period. Without this waiver/reimbursement, expenses would have been higher. |
See accompanying notes to financial statements.
Financial Highlights (continued)
For a share outstanding throughout each period.
| Intermediate Duration Bond Fund—Class C |
| Year Ended
September 30,
2024 | Year Ended
September 30,
2023 | Year Ended
September 30,
2022 | Year Ended
September 30,
2021 | Year Ended
September 30,
2020 |
Net asset value, beginning of the period | | | | | |
INCOME (LOSS) FROM INVESTMENT OPERATIONS: | | | | | |
| | | | | |
Net realized and unrealized gain (loss) | | | | | |
Total from Investment Operations | | | | | |
| | | | | |
| | | | | |
Net realized capital gains | | | | | |
| | | | | |
Net asset value, end of the period | | | | | |
| | | | | |
RATIOS TO AVERAGE NET ASSETS: | | | | | |
Net assets, end of the period (000's) | | | | | |
| | | | | |
| | | | | |
| | | | | |
| | | | | |
| Per share net investment income has been calculated using the average shares outstanding during the period. |
| A contingent deferred sales charge for Class C shares is not reflected in total return calculations. |
| Had certain expenses not been waived/reimbursed during the period, total returns would have been lower. |
| The investment adviser agreed to waive its fees and/or reimburse a portion of the Fund’s expenses during the period. Without this waiver/reimbursement, expenses would have been higher. |
See accompanying notes to financial statements.
Financial Highlights (continued)
For a share outstanding throughout each period.
| Intermediate Duration Bond Fund—Class N |
| Year Ended
September 30,
2024 | Year Ended
September 30,
2023 | Year Ended
September 30,
2022 | Year Ended
September 30,
2021 | Year Ended
September 30,
2020 |
Net asset value, beginning of the period | | | | | |
INCOME (LOSS) FROM INVESTMENT OPERATIONS: | | | | | |
| | | | | |
Net realized and unrealized gain (loss) | | | | | |
Total from Investment Operations | | | | | |
| | | | | |
| | | | | |
Net realized capital gains | | | | | |
| | | | | |
Net asset value, end of the period | | | | | |
| | | | | |
RATIOS TO AVERAGE NET ASSETS: | | | | | |
Net assets, end of the period (000's) | | | | | |
| | | | | |
| | | | | |
| | | | | |
| | | | | |
| Per share net investment income has been calculated using the average shares outstanding during the period. |
| Had certain expenses not been waived/reimbursed during the period, total returns would have been lower. |
| The investment adviser agreed to waive its fees and/or reimburse a portion of the Fund’s expenses during the period. Without this waiver/reimbursement, expenses would have been higher. |
See accompanying notes to financial statements.
Financial Highlights (continued)
For a share outstanding throughout each period.
| Intermediate Duration Bond Fund—Class Y |
| Year Ended
September 30,
2024 | Year Ended
September 30,
2023 | Year Ended
September 30,
2022 | Year Ended
September 30,
2021 | Year Ended
September 30,
2020 |
Net asset value, beginning of the period | | | | | |
INCOME (LOSS) FROM INVESTMENT OPERATIONS: | | | | | |
| | | | | |
Net realized and unrealized gain (loss) | | | | | |
Total from Investment Operations | | | | | |
| | | | | |
| | | | | |
Net realized capital gains | | | | | |
| | | | | |
Net asset value, end of the period | | | | | |
| | | | | |
RATIOS TO AVERAGE NET ASSETS: | | | | | |
Net assets, end of the period (000's) | | | | | |
| | | | | |
| | | | | |
| | | | | |
| | | | | |
| Per share net investment income has been calculated using the average shares outstanding during the period. |
| Had certain expenses not been waived/reimbursed during the period, total returns would have been lower. |
| The investment adviser agreed to waive its fees and/or reimburse a portion of the Fund’s expenses during the period. Without this waiver/reimbursement, expenses would have been higher. |
See accompanying notes to financial statements.
Financial Highlights (continued)
For a share outstanding throughout each period.
| Limited Term Government and Agency Fund—Class A |
| Year Ended
September 30,
2024 | Year Ended
September 30,
2023 | Year Ended
September 30,
2022 | Year Ended
September 30,
2021 | Year Ended
September 30,
2020 |
Net asset value, beginning of the period | | | | | |
INCOME (LOSS) FROM INVESTMENT OPERATIONS: | | | | | |
| | | | | |
Net realized and unrealized gain (loss) | | | | | |
Total from Investment Operations | | | | | |
| | | | | |
| | | | | |
Net asset value, end of the period | | | | | |
| | | | | |
RATIOS TO AVERAGE NET ASSETS: | | | | | |
Net assets, end of the period (000's) | | | | | |
| | | | | |
| | | | | |
| | | | | |
| | | | | |
| Per share net investment income has been calculated using the average shares outstanding during the period. |
| A sales charge for Class A shares is not reflected in total return calculations. |
| Had certain expenses not been waived/reimbursed during the period, total returns would have been lower. |
| The investment adviser agreed to waive its fees and/or reimburse a portion of the Fund’s expenses during the period. Without this waiver/reimbursement, expenses would have been higher. |
| Includes refund of prior year service fee of less than 0.01%. See Note 6b of Notes to Financial Statements. |
| Includes refund of prior year service fee of 0.01%. |
| Effective July 1, 2021, the expense limit decreased from 0.75% to 0.70%. |
| Effective July 1, 2020, the expense limit decreased from 0.80% to 0.75%. |
| Includes transfer agent fees and expenses before expense offset. Without these expenses the ratio of gross expenses would have been 0.76%. See Note 8 of Notes to Financial Statements. |
See accompanying notes to financial statements.
Financial Highlights (continued)
For a share outstanding throughout each period.
| Limited Term Government and Agency Fund—Class C |
| Year Ended
September 30,
2024 | Year Ended
September 30,
2023 | Year Ended
September 30,
2022 | Year Ended
September 30,
2021 | Year Ended
September 30,
2020 |
Net asset value, beginning of the period | | | | | |
INCOME (LOSS) FROM INVESTMENT OPERATIONS: | | | | | |
Net investment income (loss)(a) | | | | | |
Net realized and unrealized gain (loss) | | | | | |
Total from Investment Operations | | | | | |
| | | | | |
| | | | | |
Net asset value, end of the period | | | | | |
| | | | | |
RATIOS TO AVERAGE NET ASSETS: | | | | | |
Net assets, end of the period (000's) | | | | | |
| | | | | |
| | | | | |
Net investment income (loss) | | | | | |
| | | | | |
| Per share net investment income (loss) has been calculated using the average shares outstanding during the period. |
| Amount rounds to less than $0.01 per share. |
| A contingent deferred sales charge for Class C shares is not reflected in total return calculations. |
| Had certain expenses not been waived/reimbursed during the period, total returns would have been lower. |
| The investment adviser agreed to waive its fees and/or reimburse a portion of the Fund’s expenses during the period. Without this waiver/reimbursement, expenses would have been higher. |
| Effective July 1, 2021, the expense limit decreased from 1.50% to 1.45%. |
| Effective July 1, 2020, the expense limit decreased from 1.55% to 1.50%. |
See accompanying notes to financial statements.
Financial Highlights (continued)
For a share outstanding throughout each period.
| Limited Term Government and Agency Fund—Class N |
| Year Ended
September 30,
2024 | Year Ended
September 30,
2023 | Year Ended
September 30,
2022 | Year Ended
September 30,
2021 | Year Ended
September 30,
2020 |
Net asset value, beginning of the period | | | | | |
INCOME (LOSS) FROM INVESTMENT OPERATIONS: | | | | | |
| | | | | |
Net realized and unrealized gain (loss) | | | | | |
Total from Investment Operations | | | | | |
| | | | | |
| | | | | |
Net asset value, end of the period | | | | | |
| | | | | |
RATIOS TO AVERAGE NET ASSETS: | | | | | |
Net assets, end of the period (000's) | | | | | |
| | | | | |
| | | | | |
| | | | | |
| | | | | |
| Per share net investment income has been calculated using the average shares outstanding during the period. |
| Had certain expenses not been waived/reimbursed during the period, total returns would have been lower. |
| The investment adviser agreed to waive its fees and/or reimburse a portion of the Fund’s expenses during the period. Without this waiver/reimbursement, expenses would have been higher. |
| Effective July 1, 2021, the expense limit decreased from 0.45% to 0.40% |
| Effective July 1, 2020, the expense limit decreased from 0.50% to 0.45%. |
See accompanying notes to financial statements.
Financial Highlights (continued)
For a share outstanding throughout each period.
| Limited Term Government and Agency Fund—Class Y |
| Year Ended
September 30,
2024 | Year Ended
September 30,
2023 | Year Ended
September 30,
2022 | Year Ended
September 30,
2021 | Year Ended
September 30,
2020 |
Net asset value, beginning of the period | | | | | |
INCOME (LOSS) FROM INVESTMENT OPERATIONS: | | | | | |
| | | | | |
Net realized and unrealized gain (loss) | | | | | |
Total from Investment Operations | | | | | |
| | | | | |
| | | | | |
Net asset value, end of the period | | | | | |
| | | | | |
RATIOS TO AVERAGE NET ASSETS: | | | | | |
Net assets, end of the period (000's) | | | | | |
| | | | | |
| | | | | |
| | | | | |
| | | | | |
| Per share net investment income has been calculated using the average shares outstanding during the period. |
| Had certain expenses not been waived/reimbursed during the period, total returns would have been lower. |
| The investment adviser agreed to waive its fees and/or reimburse a portion of the Fund’s expenses during the period. Without this waiver/reimbursement, expenses would have been higher. |
| Effective July 1, 2021, the expense limit decreased from 0.50% to 0.45%. |
| Effective July 1, 2020, the expense limit decreased from 0.55% to 0.50%. |
See accompanying notes to financial statements.
Notes to Financial Statements
1.Organization. Natixis Funds Trust I, Loomis Sayles Funds I and Loomis Sayles Funds II (the “Trusts” and each a “Trust”) are each organized as a Massachusetts business trust. Each Trust is registered under the Investment Company Act of 1940, as amended (the “1940 Act”) as an open-end management investment company. Each Declaration of Trust permits the Board of Trustees to authorize the issuance of an unlimited number of shares of the Trust in multiple series. The financial statements for certain funds of the Trusts are presented in separate reports. The following funds (individually, a “Fund” and collectively, the “Funds”) are included in this report:
Natixis Funds Trust I:
Loomis Sayles Core Plus Bond Fund ("Core Plus Bond Fund")
Loomis Sayles Funds I:
Loomis Sayles Intermediate Duration Bond Fund (“Intermediate Duration Bond Fund”)
Loomis Sayles Funds II:
Loomis Sayles Global Allocation Fund (“Global Allocation Fund”)
Loomis Sayles Growth Fund (“Growth Fund”)
Loomis Sayles Limited Term Government and Agency Fund (“Limited Term Government and Agency Fund”)
Each Fund is a diversified investment company.
Each Fund offers Class A, Class C, Class N and Class Y shares.
Effective February 1, 2024, Growth Fund's principal investment strategies disclosure was amended to permit the Fund to invest in affiliated and unaffiliated mutual funds and exchange-traded funds, to the extent permitted by the Investment Company Act of 1940.
Class A shares are sold with a maximum front-end sales charge of 4.25% for Core Plus Bond Fund and Intermediate Duration Bond Fund, 5.75% for Global Allocation Fund and Growth Fund, and 2.25% for Limited Term Government and Agency Fund. Class C shares do not pay a front-end sales charge, pay higher Rule 12b-1 fees than Class A shares for eight years (at which point they automatically convert to Class A shares) (prior to May 1, 2021, Class C shares automatically converted to Class A shares after ten years) and may be subject to a contingent deferred sales charge (“CDSC”) of 1.00% if those shares are redeemed within one year of acquisition, except for reinvested distributions. Class N and Class Y shares do not pay a front-end sales charge, a CDSC or Rule 12b-1 fees. Class N shares are offered with an initial minimum investment of $1,000,000. Class Y shares are offered with an initial minimum investment of $100,000. Certain categories of investors are exempted from the minimum investment amounts for Class N and Class Y as outlined in the relevant Funds' prospectus.
Most expenses can be directly attributed to a Fund. Expenses which cannot be directly attributed to a Fund are generally apportioned based on the relative net assets of each of the Funds in Natixis Funds Trust I, Natixis Funds Trust II, Natixis Funds Trust IV and Gateway Trust (“Natixis Funds Trusts”), Loomis Sayles Funds I and Loomis Sayles Funds II (“Loomis Sayles Funds Trusts”), and Natixis ETF Trust and Natixis ETF Trust II ("Natixis ETF Trusts"). Expenses of a Fund are borne pro rata by the holders of each class of shares, except that each class bears expenses unique to that class (such as the Rule 12b-1 fees applicable to Class A and Class C), and transfer agent fees are borne collectively for Class A, Class C and Class Y, and individually for Class N. In addition, each class votes as a class only with respect to its own Rule 12b-1 Plan. Shares of each class would receive their pro rata share of the net assets of the Fund if the Fund were liquidated. The Trustees approve separate distributions from net investment income on each class of shares.
2.Significant Accounting Policies. The following is a summary of significant accounting policies consistently followed by each Fund in the preparation of its financial statements. The Funds' financial statements follow the accounting and reporting guidelines provided for investment companies and are prepared in accordance with accounting principles generally accepted in the United States of America which require the use of management estimates that affect the reported amounts and disclosures in the financial statements. Actual results could differ from those estimates. Management has evaluated the events and transactions subsequent to year-end through the date the financial statements were issued and has determined that there were no material events that would require disclosure in the Funds' financial statements.
a. Valuation. Registered investment companies are required to value portfolio investments using an unadjusted, readily available market quotation. Each Fund obtains readily available market quotations from independent pricing services. Fund investments for which readily available market quotations are not available are priced at fair value pursuant to the Funds’ Valuation Procedures. The Board of Trustees has approved a valuation designee who is subject to the Board’s oversight.
Unadjusted readily available market quotations that are utilized for exchange traded equity securities (including shares of closed-end investment companies and exchange-traded funds) include the last sale price quoted on the exchange where the security is traded
Notes to Financial Statements (continued)
most extensively. Futures contracts are valued at the closing settlement price on the exchange on which the valuation designee believes that, over time, they are traded most extensively. Shares of open-end investment companies are valued at net asset value (“NAV”) per share.
Exchange traded equity securities for which there is no reported sale during the day are fair valued at the closing bid quotation as reported by an independent pricing service. Unlisted equity securities (except unlisted preferred equity securities) are fair valued at the last sale price quoted in the market where they are traded most extensively or, if there is no reported sale during the day, the closing bid quotation as reported by an independent pricing service. If there is no last sale price or closing bid quotation available, unlisted equity securities will be fair valued using evaluated bids furnished by an independent pricing service, if available.
Debt securities and unlisted preferred equity securities are fair valued based on evaluated bids furnished to the Funds by an independent pricing service or bid prices obtained from broker-dealers. Short sales of debt investments are fair valued based on an evaluated ask price furnished to the Funds by an independent pricing service. Senior loans and collateralized loan obligations (“CLOs”) are fair valued at bid prices supplied by an independent pricing service, if available. Broker-dealer bid prices may be used to fair value debt, unlisted equities, senior loans and CLOs where an independent pricing service is unable to price an investment or where an independent pricing service does not provide a reliable price for the investment. Forward foreign currency contracts are fair valued utilizing interpolated rates determined based on information provided by an independent pricing service. Bilateral credit default swaps are fair valued based on mid prices (between the bid price and the ask price) supplied by an independent pricing service. Bilateral interest rate swaps are fair valued based on prices supplied by an independent pricing source. Centrally cleared swap agreements are fair valued at settlement prices of the clearing house on which the contracts were traded or prices obtained from broker-dealers.
The Funds may also fair value investments in other circumstances such as when extraordinary events occur after the close of a foreign market, but prior to the close of the New York Stock Exchange. This may include situations relating to a single issuer (such as a declaration of bankruptcy or a delisting of the issuer’s security from the primary market on which it has traded) as well as events affecting the securities markets in general (such as market disruptions or closings and significant fluctuations in U.S. and/or foreign markets). When fair valuing a Fund’s investments, the valuation designee may, among other things, use modeling tools or other processes that may take into account factors such as issuer specific information, or other related market activity and/or information that occurred after the close of the foreign market but before the time the Fund’s NAV is calculated. Fair valuation by the Fund(s) valuation designee may require subjective determinations about the value of the investment, and fair values used to determine a Fund’s NAV may differ from quoted or published prices, or from prices that are used by others, for the same investments. In addition, the use of fair value pricing may not always result in adjustments to the prices of investments held by a Fund.
b. Investment Transactions and Related Investment Income. Investment transactions are accounted for on a trade date plus one day basis for daily NAV calculation. However, for financial reporting purposes, investment transactions are reported on trade date. Dividend income (including income reinvested) and foreign withholding tax, if applicable, is recorded on the ex-dividend date, or in the case of certain foreign securities, as soon as a Fund is notified, and interest income is recorded on an accrual basis. Loan consent fees, upfront origination fees and/or amendment fees are recorded when received and included in interest income on the Statements of Operations. Interest income is increased by the accretion of discount and decreased by the amortization of premium, if applicable. Periodic principal adjustments for inflation-protected securities are recorded to interest income. Negative principal adjustments (in the event of deflation) are recorded as reductions of interest income to the extent of interest income earned, not to exceed the amount of positive principal adjustments on a cumulative basis. For securities with paydown provisions, principal payments received are treated as a proportionate reduction to the cost basis of the securities, and excess or shortfall amounts are recorded as income. In determining net gain or loss on securities sold, the cost of securities has been determined on an identified cost basis. Investment income, non-class specific expenses and realized and unrealized gains and losses are allocated on a pro rata basis to each class based on the relative net assets of each class to the total net assets of the Fund.
c. Short Sales. A short sale is a transaction in which a Fund sells a security it does not own, usually in anticipation of a decline in the fair market value of the security. When closing out a short position, a Fund will have to purchase the security it originally sold short. The value of short sales is reflected as a liability in the Statements of Assets and Liabilities and is marked-to-market daily. A Fund will realize a profit from closing out a short position if the price of the security sold short has declined since the short position was opened; a Fund will realize a loss from closing out a short position if the value of the shorted security has risen since the short position was opened. Because there is no upper limit on the price to which a security can rise, short selling exposes a Fund to potentially unlimited losses. The Funds intend to cover their short sale transactions by segregating or earmarking liquid assets, such that the segregated/earmarked amount, equals the current market value of the securities underlying the short sale.
d. Foreign Currency Translation. The books and records of the Funds are maintained in U.S. dollars. The values of securities, currencies and other assets and liabilities denominated in currencies other than U.S. dollars, if any, are translated into U.S. dollars
Notes to Financial Statements (continued)
based upon foreign exchange rates prevailing at the end of the period. Purchases and sales of investment securities, income and expenses are translated into U.S. dollars on the respective dates of such transactions.
Net realized foreign exchange gains or losses arise from sales of foreign currency, changes in exchange rates between the trade and settlement dates on securities transactions and the difference between the amounts of dividends, interest and foreign withholding taxes recorded in the Funds’ books and records and the U.S. dollar equivalent of the amounts actually received or paid. Net unrealized foreign exchange gains or losses arise from changes in the value of assets and liabilities, other than investment securities, as of the end of the fiscal period, resulting from changes in exchange rates. Net realized foreign exchange gains or losses and the net change in unrealized foreign exchange gains or losses are disclosed in the Statements of Operations. For federal income tax purposes, net realized foreign exchange gains or losses are characterized as ordinary income and may, if the Funds have net losses, reduce the amount of income available to be distributed by the Funds.
The values of investment securities are presented at the foreign exchange rates prevailing at the end of the period for financial reporting purposes. Net realized and unrealized gains or losses on investments reported in the Statements of Operations reflect gains or losses resulting from changes in exchange rates and fluctuations which arise due to changes in market prices of investment securities. For federal income tax purposes, a portion of the net realized gain or loss on investments arising from changes in exchange rates, which is reflected in the Statements of Operations, may be characterized as ordinary income and may, if the Funds have net losses, reduce the amount of income available to be distributed by the Funds.
The Funds may use foreign currency exchange contracts to facilitate transactions in foreign-denominated investments. Losses may arise from changes in the value of the foreign currency or if the counterparties do not perform under the contracts’ terms.
e. Forward Foreign Currency Contracts. A Fund may enter into forward foreign currency contracts, including forward foreign cross currency contracts, to acquire exposure to foreign currencies or to hedge the Funds’ investments against currency fluctuation. A contract can also be used to offset a previous contract. These contracts involve market risk in excess of the unrealized appreciation (depreciation) reflected in the Funds’ Statements of Assets and Liabilities. The U.S. dollar value of the currencies a Fund has committed to buy or sell represents the aggregate exposure to each currency a Fund has acquired or hedged through currency contracts outstanding at period end. Gains or losses are recorded for financial statement purposes as unrealized until settlement date. Contracts are traded over-the-counter directly with a counterparty. Risks may arise upon entering into these contracts from the potential inability of counterparties to meet the terms of their contracts and from unanticipated movements in the value of a foreign currency relative to the U.S. dollar. Certain contracts may require the movement of cash and/or securities as collateral for the Funds’ or counterparty’s net obligations under the contracts. Forward foreign currency contracts outstanding at the end of the period, if any, are listed in each applicable Fund's Portfolio of Investments.
f. Futures Contracts. A Fund may enter into futures contracts. Futures contracts are agreements between two parties to buy and sell a particular instrument or index for a specified price on a specified future date.
When a Fund enters into a futures contract, it is required to deposit with (or for the benefit of) its broker an amount of cash or short-term high-quality securities as “initial margin.” As the value of the contract changes, the value of the futures contract position increases or declines. Subsequent payments, known as “variation margin,” are made or received by a Fund, depending on the price fluctuations in the fair value of the contract and the value of cash or securities on deposit with the broker. The aggregate principal amounts of the contracts are not recorded in the financial statements. Daily fluctuations in the value of the contracts are recorded in the Statements of Assets and Liabilities as a receivable (payable) and in the Statements of Operations as unrealized appreciation (depreciation) until the contracts are closed, when they are recorded as realized gains (losses). Realized gain or loss on a futures position is equal to the difference between the value of the contract at the time it was opened and the value at the time it was closed, minus brokerage commissions. When a Fund enters into a futures contract certain risks may arise, such as illiquidity in the futures market, which may limit a Fund’s ability to close out a futures contract prior to settlement date, and unanticipated movements in the value of securities or interest rates. Futures contracts outstanding at the end of the period, if any, are listed in each applicable Fund’s Portfolio of Investments.
Futures contracts are exchange-traded. Exchange-traded futures contracts are standardized and are settled through a clearing house with fulfillment supported by the credit of the exchange. Therefore, counterparty credit risks to the Funds are reduced; however, in the event that a counterparty enters into bankruptcy, a Fund’s claim against initial/variation margin on deposit with the counterparty may be subject to terms of a final settlement in bankruptcy court.
g. Swap Agreements. A Fund may enter into credit default swaps. A credit default swap is an agreement between two parties (the “protection buyer” and “protection seller”) to exchange the credit risk of an issuer (“reference obligation”) for a specified time period. The reference obligation may be one or more debt securities or an index of such securities. The Funds may be either the protection buyer or the protection seller. As a protection buyer, the Funds have the ability to hedge the downside risk of an issuer or group of
Notes to Financial Statements (continued)
issuers. As a protection seller, the Funds have the ability to gain exposure to an issuer or group of issuers whose bonds are unavailable or in short supply in the cash bond market, as well as realize additional income in the form of fees paid by the protection buyer. The protection buyer is obligated to pay the protection seller a stream of payments (“fees”) over the term of the contract, provided that no credit event, such as a default or a downgrade in credit rating, occurs on the reference obligation. The Funds may also pay or receive upfront premiums. If a credit event occurs, the protection seller must pay the protection buyer the difference between the agreed upon notional value and market value of the reference obligation. Market value in this case is determined by a facilitated auction whereby a minimum number of allowable broker bids, together with a specified valuation method, are used to calculate the value. The maximum potential amount of undiscounted future payments that a Fund as the protection seller could be required to make under a credit default swap agreement would be an amount equal to the notional amount of the agreement.
Implied credit spreads, represented in absolute terms, are disclosed in the Portfolio of Investments for those agreements for which the Fund is the protection seller. Implied credit spreads serve as an indicator of the current status of the payment/performance risk and represent the likelihood or risk of default for the credit derivative. The implied credit spread of a particular reference entity reflects the cost of buying/selling protection and may include upfront payments required to be made to enter into the agreement. Wider credit spreads represent a deterioration of the reference entity’s credit soundness and a greater likelihood or risk of default or other credit event occurring as defined under the terms of the agreement.
The notional amounts of swap agreements are not recorded in the financial statements. Swap agreements are valued daily and fluctuations in the value are recorded in the Statements of Operations as change in unrealized appreciation (depreciation) on swap agreements. Fees are accrued in accordance with the terms of the agreement and are recorded in the Statements of Assets and Liabilities as part of unrealized appreciation (depreciation) on swap agreements. When received or paid, fees are recorded in the Statements of Operations as realized gain or loss. Upfront premiums paid or received by the Funds are recorded on the Statements of Assets and Liabilities as an asset or liability, respectively, and are amortized or accreted over the term of the agreement and recorded as realized gain or loss. Payments made or received by the Funds as a result of a credit event or termination of the agreement are recorded as realized gain or loss.
Swap agreements are privately negotiated in the over-the-counter market and may be entered into as a bilateral contract or centrally cleared (“centrally cleared swaps”). Bilateral swap agreements are traded between counterparties and, as such, are subject to the risk that a party to the agreement will not be able to meet its obligations. In a centrally cleared swap, immediately following execution of the swap agreement, the swap agreement is novated to a central counterparty (the “CCP”) and the Fund faces the CCP through a broker. Upon entering into a centrally cleared swap, the Fund is required to deposit initial margin with the broker in the form of cash or securities in an amount that varies depending on the size and risk profile of the particular swap. Subsequent payments, known as “variation margin,” are made or received by the Fund based on the daily change in the value of the centrally cleared swap agreement. For centrally cleared swaps, the Fund’s counterparty credit risk is reduced as the CCP stands between the Fund and the counterparty. Swap agreements outstanding at the end of the period, if any, are listed in each applicable Fund's Portfolio of Investments.
h. When-Issued and Delayed Delivery Transactions. A Fund may enter into when-issued or delayed delivery transactions. When-issued refers to transactions made conditionally because a security, although authorized, has not been issued. Delayed delivery refers to transactions for which delivery or payment will occur at a later date, beyond the normal settlement period. The price of when-issued and delayed delivery securities and the date when the securities will be delivered and paid for are fixed at the time the transaction is negotiated. The security and the obligation to pay for it are recorded by the Funds at the time the commitment is entered into. The value of the security may vary with market fluctuations during the time before the Funds take delivery of the security. No interest accrues to the Funds until the transaction settles.
Delayed delivery transactions include those designated as To Be Announced (“TBAs”) in the Portfolios of Investments. For TBAs, the actual security that will be delivered to fulfill the transaction is not designated at the time of the trade. The security is "to be announced" 48 hours prior to the established trade settlement date. Certain transactions require the Funds or counterparty to post cash and/or securities as collateral for the net mark-to-market exposure to the other party.
Purchases of when-issued or delayed delivery securities may have a similar effect on the Funds’ NAV as if the Funds’ had created a degree of leverage in the portfolio. Risks may arise upon entering into such transactions from the potential inability of counterparties to meet their obligations under the transactions. Additionally, losses may arise due to changes in the value of the underlying securities.
i. Federal and Foreign Income Taxes. The Trusts treat each Fund as a separate entity for federal income tax purposes. Each Fund intends to meet the requirements of the Internal Revenue Code of 1986, as amended, applicable to regulated investment companies, and to distribute to its shareholders substantially all of its net investment income and any net realized capital gains at least annually. Management has performed an analysis of each Fund’s tax positions for the open tax years as of September 30, 2024 and has concluded that no provisions for income tax are required. The Funds’ federal tax returns for the prior three fiscal years remain subject
Notes to Financial Statements (continued)
to examination by the Internal Revenue Service. Management is not aware of any events that are reasonably possible to occur in the next twelve months that would result in the amounts of any unrecognized tax benefits significantly increasing or decreasing for the Funds. However, management’s conclusions regarding tax positions taken may be subject to review and adjustment at a later date based on factors including, but not limited to, new tax laws and accounting regulations and interpretations thereof.
A Fund may be subject to foreign withholding taxes on investment income and taxes on capital gains on investments that are accrued and paid based upon the Fund’s understanding of the tax rules and regulations that exist in the countries in which the Fund invests. Foreign withholding taxes on dividend and interest income are reflected on the Statements of Operations as a reduction of investment income, net of amounts that have been or are expected to be reclaimed and paid. Dividends and interest receivable on the Statements of Assets and Liabilities are net of foreign withholding taxes. Foreign withholding taxes where reclaims have been or are expected to be filed and paid are reflected on the Statements of Assets and Liabilities as tax reclaims receivable. Capital gains taxes paid are included in net realized gain (loss) on investments in the Statements of Operations. Accrued but unpaid capital gains taxes are reflected as foreign taxes payable on the Statements of Assets and Liabilities, if applicable, and reduce unrealized gains on investments. In the event that realized gains on investments are subsequently offset by realized losses, taxes paid on realized gains may be returned to a Fund. Such amounts, if applicable, are reflected as foreign tax rebates receivable on the Statements of Assets and Liabilities and are recorded as a realized gain when received.
Certain Funds have filed tax reclaims for previously withheld taxes on dividends earned in certain European Union countries ("EU reclaims") and may continue to make such filings when it is determined to be in the best interest of the Funds and their shareholders. These filings are subject to various administrative proceedings by the local jurisdictions’ tax authorities within the European Union, as well as a number of related judicial proceedings. EU reclaims are recognized by a Fund when deemed more likely than not to be collected, and are reflected as a reduction of foreign taxes withheld in the Statements of Operations. Any related receivable is reflected as tax reclaims receivable in the Statements of Assets and Liabilities. Under certain circumstances, EU reclaims may be subject to closing agreements with the Internal Revenue Service ("IRS"), which may materially reduce the reclaim amounts realized by the Funds. Fees and expenses associated with closing agreements will be reflected in the Statements of Operations when it is determined that a closing agreement with the IRS is required.
j. Dividends and Distributions to Shareholders. Dividends and distributions are recorded on the ex-dividend date. The timing and characterization of certain income and capital gain distributions are determined in accordance with federal tax regulations, which may differ from accounting principles generally accepted in the United States of America. Permanent differences are primarily due to differing treatments for book and tax purposes of items such as foreign currency gains and losses, net operating losses, premium amortization, capital gains taxes, convertible bond adjustments, defaulted and/or non-income producing securities, return of capital distributions received, deferred Trustees' fees, trust preferred securities and paydown gains and losses. Permanent book and tax basis differences relating to shareholder distributions will result in reclassifications to capital accounts reported on the Statements of Assets and Liabilities. Temporary differences between book and tax distributable earnings are primarily due to deferred Trustees’ fees, forward foreign currency contract mark-to-market, wash sales, premium amortization, futures contract mark-to-market, convertible bond adjustments, defaulted and/or non-income producing securities, dividends payable, return of capital distributions received, straddle loss deferral adjustments, trust preferred securities and paydown gains and losses. Amounts of income and capital gain available to be distributed on a tax basis are determined annually, and at other times during the Funds’ fiscal year as may be necessary to avoid knowingly declaring and paying a return of capital distribution. Distributions from net investment income and net realized short-term capital gains are considered to be distributed from ordinary income for tax purposes.
The tax characterization of distributions is determined on an annual basis. The tax character of distributions paid to shareholders during the years ended September 30, 2024 and 2023 was as follows:
| | |
| | | | | | |
| | | | | | |
| | | | | | |
| | | | | | |
Intermediate Duration Bond Fund | | | | | | |
Limited Term Government and Agency Fund | | | | | | |
Distributions paid to shareholders from net investment income and net realized capital gains, based on accounting principles generally accepted in the United States of America, are consolidated and reported on the Statements of Changes in Net Assets as Distributions
Notes to Financial Statements (continued)
to Shareholders. Distributions paid to shareholders from net investment income and net realized capital gains expressed in per-share amounts, based on accounting principles generally accepted in the United States of America, are separately stated and reported within the Financial Highlights.
As of September 30, 2024, the components of distributable earnings on a tax basis were as follows:
| | | | Intermediate
Duration Bond
Fund | Limited Term
Government
and Agency
Fund |
Undistributed ordinary income | | | | | |
Undistributed long-term capital gains | | | | | |
Total undistributed earnings | | | | | |
Capital loss carryforward: | | | | | |
| | | | | |
| | | | | |
| | | | | |
| | | | | |
Total capital loss carryforward | | | | | |
Late-year ordinary and post-October
| | | | | |
Unrealized appreciation (depreciation) | | | | | |
Total accumulated earnings (losses) | | | | | |
| Under current tax law, net operating losses, capital losses, foreign currency losses, and losses on passive foreign investment companies and contingent payment debt instruments after October 31 or December 31, as applicable, may be deferred and treated as occurring on the first day of the following taxable year. Growth Fund is deferring net operating losses. |
As of September 30, 2024, the tax cost of investments (including derivatives, if applicable) and unrealized appreciation (depreciation) on a federal tax basis were as follows:
| | | | Intermediate
Duration Bond
Fund | Limited Term
Government
and Agency
Fund |
| | | | | |
| | | | | |
| | | | | |
Net tax appreciation (depreciation) | | | | | |
The difference between these amounts and those reported in the components of distributable earnings, if any, is primarily attributable to capital gains taxes and foreign exchange gains or losses.
k. Senior Loans. A Fund’s investment in senior loans may be to corporate, governmental or other borrowers. Senior loans, which include both secured and unsecured loans made by banks and other financial institutions to corporate customers, typically hold the most senior position in a borrower’s capital structure, may be secured by the borrower’s assets and have interest rates that reset frequently. Senior Loans can include term loans, revolving credit facility loans and second lien loans. A senior loan is often administered by a bank or other financial institution that acts as agent for all holders. The agent administers the terms of the senior loan, as specified in the loan agreement. Large loans may be shared or syndicated among several lenders. The Fund may enter into the primary syndicate for a loan or it may also purchase all or a portion of loans from other lenders (sometimes referred to as loan assignments), in either case becoming a direct lender. The settlement period for senior loans is uncertain as there is no standardized settlement schedule applicable to such investments. Senior loans outstanding at the end of the period, if any, are listed in each applicable Fund’s Portfolio of Investments.
Notes to Financial Statements (continued)
l. Collateralized Loan Obligations. A Fund may invest in CLOs. A CLO is a type of asset-backed security designed to redirect the cash flows from a pool of leveraged loans to investors based on their risk preferences. Cash flows from a CLO are split into two or more portions, called tranches, varying in risk and yield. The risk of an investment in a CLO depends largely on the type of the collateralized securities and the class of the instrument in which the Fund invests. CLOs outstanding at the end of the period, if any, are listed in each applicable Fund’s Portfolio of Investments.
m. Repurchase Agreements. Each Fund may enter into repurchase agreements, under the terms of a Master Repurchase Agreement, under which each Fund acquires securities as collateral and agrees to resell the securities at an agreed upon time and at an agreed upon price. It is each Fund’s policy that the market value of the collateral for repurchase agreements be at least equal to 102% of the repurchase price, including interest. Certain repurchase agreements are tri-party arrangements whereby the collateral is held in a segregated account for the benefit of the Fund and on behalf of the counterparty. Repurchase agreements could involve certain risks in the event of default or insolvency of the counterparty, including possible delays or restrictions upon a Fund’s ability to dispose of the underlying securities. As of September 30, 2024, each Fund, as applicable, had investments in repurchase agreements for which the value of the related collateral exceeded the value of the repurchase agreement. The gross value of repurchase agreements is included in the Statements of Assets and Liabilities for financial reporting purposes.
n. Due to/from Brokers. Transactions and positions in certain futures, forward foreign currency contracts and delayed delivery commitments are maintained and cleared by registered U.S. broker/dealers pursuant to customer agreements between the Funds and the various broker/ dealers. The due from brokers balance in the Statements of Assets and Liabilities for Core Plus Bond Fund represents cash pledged as collateral for delayed delivery securities. The due from brokers balance in the Statements of Assets and Liabilities for Global Allocation Fund represents cash pledged as collateral for forward foreign currency contracts. The due from brokers balance in the Statements of Assets and Liabilities for Intermediate Duration Bond Fund represents cash pledged as initial margin for futures contracts. The due to brokers balance in the Statements of Assets and Liabilities for Global Allocation Fund represents securities received as collateral for forward foreign currency contracts. In certain circumstances a Fund’s use of cash held at brokers is restricted by regulation or broker mandated limits.
o. Indemnifications. Under the Trusts' organizational documents, their officers and Trustees are indemnified against certain liabilities arising out of the performance of their duties to the Funds. Additionally, in the normal course of business, the Funds enter into contracts with service providers that contain general indemnification clauses. The Funds’ maximum exposure under these arrangements is unknown as this would involve future claims that may be made against the Funds that have not yet occurred. However, based on experience, the Funds expect the risk of loss to be remote.
3.Fair Value Measurements. In accordance with accounting standards related to fair value measurements and disclosures, the Funds have categorized the inputs utilized in determining the value of each Fund’s assets or liabilities. These inputs are summarized in the three broad levels listed below:
• Level 1 — quoted prices in active markets for identical assets or liabilities;
• Level 2 — prices determined using other significant inputs that are observable either directly, or indirectly through corroboration with observable market data (which could include quoted prices for similar assets or liabilities, interest rates, credit risk, etc.); and
• Level 3 — prices determined using significant unobservable inputs when quoted prices or observable inputs are unavailable such as when there is little or no market activity for an asset or liability (unobservable inputs reflect each Fund’s own assumptions in determining the fair value of assets or liabilities and would be based on the best information available).
The inputs or methodology used for valuing securities are not necessarily an indication of the risk associated with investing in those securities.
The Funds' pricing policies have been approved by the Board of Trustees. Investments for which market quotations are readily available are categorized in Level 1. Other investments for which an independent pricing service is utilized are categorized in Level 2. Broker-dealer bid prices for which the Funds have knowledge of the inputs used by the broker-dealer are categorized in Level 2. All other investments, including broker-dealer bid prices for which the Funds do not have knowledge of the inputs used by the broker-dealer, as well as investments fair valued by the valuation designee, are categorized in Level 3. All Level 2 and 3 securities are defined as being fair valued.
Notes to Financial Statements (continued)
Under certain conditions and based upon specific facts and circumstances, the Fund’s valuation designee may determine that a fair valuation should be made for portfolio investment(s). These valuation designee fair valuations will be based upon a significant amount of Level 3 inputs.
The following is a summary of the inputs used to value the Funds' investments as of September 30, 2024, at value:
|
|
| | | | |
| | | | |
| | | | |
| | | | |
Collateralized Mortgage Obligations | | | | |
All Other Non-Convertible Bonds(a) | | | | |
Total Non-Convertible Bonds | | | | |
| | | | |
| | | | |
Collateralized Loan Obligations | | | | |
| | | | |
| | | | |
Futures Contracts (unrealized appreciation) | | | | |
| | | | |
Liability Valuation Inputs |
| | | | |
Futures Contracts (unrealized depreciation) | | | | |
| Details of the major categories of the Fund’s investments are reflected within the Portfolio of Investments. |
Notes to Financial Statements (continued)
|
|
| | | | |
| | | | |
| | | | |
| | | | |
| | | | |
| | | | |
| | | | |
| | | | |
| | | | |
All Other Common Stocks(a) | | | | |
| | | | |
| | | | |
| | | | |
| | | | |
| | | | |
Forward Foreign Currency Contracts (unrealized appreciation) | | | | |
Futures Contracts (unrealized appreciation) | | | | |
| | | | |
|
Liability Valuation Inputs |
| | | | |
Forward Foreign Currency Contracts (unrealized depreciation) | | | | |
Futures Contracts (unrealized depreciation) | | | | |
| | | | |
| Details of the major categories of the Fund’s investments are reflected within the Portfolio of Investments. |
|
|
| | | | |
| | | | |
Affiliated Exchange-Traded Funds | | | | |
| | | | |
| | | | |
| Details of the major categories of the Fund’s investments are reflected within the Portfolio of Investments. |
Notes to Financial Statements (continued)
Intermediate Duration Bond Fund |
|
| | | | |
| | | | |
| | | | |
Collateralized Mortgage Obligations | | | | |
All Other Bonds and Notes(a) | | | | |
| | | | |
| | | | |
| | | | |
Futures Contracts (unrealized appreciation) | | | | |
| | | | |
|
Liability Valuation Inputs |
| | | | |
Futures Contracts (unrealized depreciation) | | | | |
| Details of the major categories of the Fund’s investments are reflected within the Portfolio of Investments. |
Limited Term Government and Agency Fund |
|
| | | | |
| | | | |
| | | | |
Collateralized Mortgage Obligations | | | | |
All Other Bonds and Notes(a) | | | | |
| | | | |
| | | | |
| | | | |
| Details of the major categories of the Fund’s investments are reflected within the Portfolio of Investments. |
Notes to Financial Statements (continued)
The following is a reconciliation of Level 3 investments for which significant unobservable inputs were used to determine fair value as of September 30, 2023 and/or September 30, 2024:
|
|
| Balance as of
September 30,
2023 | Accrued
Discounts
(Premiums) | | Change in
Unrealized
Appreciation
(Depreciation) | | | | | Balance as of
September 30,
2024 | Change in
Unrealized
Appreciation
(Depreciation)
from
Investments
Still Held at
September 30,
2024 |
| | | | | | | | | | |
| | | | | | | | | | |
| | | | | | | | | | |
Collateralized Mortgage Obligations | | | | | | | | | | |
| | | | | | | | | | |
Debt securities valued at $260,338 were transferred from Level 2 to Level 3 during the period ended September 30, 2024. At September 30, 2023, these securities were fair valued based on evaluated bids furnished to the Fund by an independent pricing service in accordance with the Fund's valuation policies. At September 30, 2024, these securities were fair valued as determined by the Fund's valuation designee as an independent pricing service did not provide a reliable price for the securities.
Intermediate Duration Bond Fund |
|
| Balance as of
September 30,
2023 | Accrued
Discounts
(Premiums) | | Change in
Unrealized
Appreciation
(Depreciation) | | | | | Balance as of
September 30,
2024 | Change in
Unrealized
Appreciation
(Depreciation)
from
Investments
Still Held at
September 30,
2024 |
| | | | | | | | | | |
| | | | | | | | | | |
Collateralized Mortgage Obligations | | | | | | | | | | |
| | | | | | | | | | |
A debt security valued at $1,511 was transferred from Level 2 to Level 3 during the period ended September 30, 2024. At September 30, 2023, this security was fair valued based on evaluated bids furnished to the Fund by an independent pricing service in accordance with
Notes to Financial Statements (continued)
the Fund's valuation policies. At September 30, 2024, this security was fair valued as determined by the Fund's valuation designee as an independent pricing service did not provide a reliable price for the security.
Limited Term Government and Agency Fund |
|
| Balance as of
September 30,
2023 | Accrued
Discounts
(Premiums) | | Change in
Unrealized
Appreciation
(Depreciation) | | | | | Balance as of
September 30,
2024 | Change in
Unrealized
Appreciation
(Depreciation)
from
Investments
Still Held at
September 30,
2024 |
| | | | | | | | | | |
| | | | | | | | | | |
Collateralized Mortgage Obligations | | | | | | | | | | |
| | | | | | | | | | |
Debt securities valued at $2,686,916 were transferred from Level 2 to Level 3 during the period ended September 30, 2024. At September 30, 2023, these securities were fair valued based on evaluated bids furnished to the Fund by an independent pricing service in accordance with the Fund's valuation policies. At September 30, 2024, these securities were fair valued as determined by the Fund's valuation designee as an independent pricing service did not provide a reliable price for the securities.
4.Derivatives. Derivative instruments are defined as financial instruments whose value and performance are based on the value and performance of an underlying asset, reference rate or index. Derivative instruments that Core Plus Bond Fund, Global Allocation Fund and Intermediate Duration Bond Fund used during the period include forward foreign currency contracts and futures contracts.
The Funds are subject to the risk that changes in foreign currency exchange rates will have an unfavorable effect on the value of Fund assets denominated in foreign currencies. The Funds may enter into forward foreign currency contracts for hedging purposes to protect the value of the Funds’ holdings of foreign securities. The Funds may also use forward foreign currency contracts to gain exposure to foreign currencies, regardless of whether securities denominated in such currencies are held in the Funds. During the year ended September 30, 2024, Global Allocation Fund engaged in forward foreign currency transactions for hedging purposes and to gain exposure to foreign currencies.
The Funds are subject to the risk that changes in interest rates will affect the value of the Funds’ investments in fixed income securities. The Funds will be subject to increased interest rate risk to the extent that they invest in fixed income securities with longer maturities or durations, as compared to investing in fixed income securities with shorter maturities or durations. The Funds may use futures contracts to hedge against changes in interest rates and to manage duration without having to buy or sell portfolio securities. The Funds may also use futures contracts to gain investment exposure. During the year ended September 30, 2024, Core Plus Bond Fund, Global Allocation Fund and Intermediate Duration Bond Fund each used futures contracts to manage duration.
The following is a summary of derivative instruments for Core Plus Bond Fund as of September 30, 2024, as reflected within the Statements of Assets and Liabilities:
| Unrealized
appreciation
on futures
|
Exchange-traded asset derivatives | |
| |
Notes to Financial Statements (continued)
| Unrealized
depreciation
on futures
|
Exchange-traded liability derivatives | |
| |
| Represents cumulative unrealized appreciation (depreciation) on futures contracts. Only the current day’s variation margin on futures contracts is reported within the Statements of Assets and Liabilities as receivable or payable for variation margin, as applicable. |
Transactions in derivative instruments for Core Plus Bond Fund during the year ended September 30, 2024, as reflected within the Statements of Operations were as follows:
Net Realized Gain (Loss) on: | |
| |
Net Change in Unrealized
Appreciation (Depreciation) on: | |
| |
The following is a summary of derivative instruments for Global Allocation Fund as of September 30, 2024, as reflected within the Statements of Assets and Liabilities:
| Unrealized
appreciation
on forward
foreign
currency
contracts | Unrealized
appreciation
on futures
| |
Over-the-counter asset derivatives | | | |
Foreign exchange contracts | | | |
Exchange-traded asset derivatives | | | |
| | | |
| | | |
| Unrealized
depreciation
on forward
foreign
currency
contracts | Unrealized
depreciation
on futures
| |
Over-the-counter liability derivatives | | | |
Foreign exchange contracts | | | |
Exchange-traded liability derivatives | | | |
| | | |
Total liability derivatives | | | |
| Represents cumulative unrealized appreciation (depreciation) on futures contracts. Only the current day’s variation margin on futures contracts is reported within the Statements of Assets and Liabilities as receivable or payable for variation margin, as applicable. |
Notes to Financial Statements (continued)
Transactions in derivative instruments for Global Allocation Fund during the year ended September 30, 2024, as reflected within the Statements of Operations were as follows:
Net Realized Gain (Loss) on: | Forward
foreign
currency
contracts | |
| | |
Foreign exchange contracts | | |
| | |
Net Change in Unrealized
Appreciation (Depreciation) on: | Forward
foreign
currency
contracts | |
| | |
Foreign exchange contracts | | |
| | |
The following is a summary of derivative instruments for Intermediate Duration Bond Fund as of September 30, 2024, as reflected within the Statements of Assets and Liabilities:
| Unrealized
appreciation
on futures
|
Exchange-traded asset derivatives | |
| |
| Unrealized
depreciation
on futures
|
Exchange-traded liability derivatives | |
| |
| Represents cumulative unrealized appreciation (depreciation) on futures contracts. Only the current day’s variation margin on futures contracts is reported within the Statements of Assets and Liabilities as receivable or payable for variation margin, as applicable. |
Transactions in derivative instruments for Intermediate Duration Bond Fund during the year ended September 30, 2024, as reflected within the Statements of Operations were as follows:
Net Realized Gain (Loss) on: | |
| |
Net Change in Unrealized
Appreciation (Depreciation) on: | |
| |
As the Funds value their derivatives at fair value and recognize changes in fair value through the Statements of Operations, they do not qualify for hedge accounting under authoritative guidance for derivative instruments. The Funds’ investments in derivatives may represent an economic hedge; however, they are considered to be non-hedge transactions for the purpose of these disclosures.
Notes to Financial Statements (continued)
The volume of forward foreign currency contract and futures contract activity, as a percentage of net assets for Core Plus Bond Fund, Global Allocation Fund and Intermediate Duration Bond Fund, based on gross month-end notional amounts outstanding during the period, including long and short positions at absolute value, was as follows for the year ended September 30, 2024:
| |
Average Notional Amount Outstanding | |
Highest Notional Amount Outstanding | |
Lowest Notional Amount Outstanding | |
Notional Amount Outstanding as of September 30, 2024 | |
| | |
Average Notional Amount Outstanding | | |
Highest Notional Amount Outstanding | | |
Lowest Notional Amount Outstanding | | |
Notional Amount Outstanding as of September 30, 2024 | | |
Intermediate Duration Bond Fund | |
Average Notional Amount Outstanding | |
Highest Notional Amount Outstanding | |
Lowest Notional Amount Outstanding | |
Notional Amount Outstanding as of September 30, 2024 | |
Notional amounts outstanding at the end of the prior period are included in the average notional amount outstanding.
Unrealized gain and/or loss on open forwards and futures is recorded in the Statements of Assets and Liabilities. The aggregate notional values of forwards and futures contracts are not recorded in the Statements of Assets and Liabilities, and therefore are not included in the Funds’ net assets.
Over-the-counter derivatives, including forward foreign currency contracts, are entered into pursuant to International Swaps and Derivatives Association, Inc. (“ISDA”) agreements negotiated between the Funds and their counterparties. ISDA agreements typically contain, among other things, terms for the posting of collateral and master netting provisions in the event of a default or other termination event. Collateral is posted by a Fund or the counterparty to the extent of the net mark-to-market exposure to the other party of all open contracts under the agreement, subject to minimum transfer requirements. Master netting provisions allow the Funds and the counterparty, in the event of a default or other termination event, to offset amounts owed by each related to derivative contracts, including any posted collateral, to one net amount payable by either the Funds or the counterparty. The Funds' ISDA agreements typically contain provisions that allow a counterparty to terminate open contracts early if the NAV of a Fund declines beyond a certain threshold. For financial reporting purposes, the Funds do not offset derivative assets and liabilities, and any related collateral received or pledged, on the Statements of Assets and Liabilities.
As of September 30, 2024, gross amounts of over-the-counter derivative assets and liabilities not offset in the Statements of Assets and Liabilities and the related net amounts after taking into account master netting arrangements, by counterparty, are as follows:
|
| | | | Collateral
(Received)/
Pledged | |
| | | | | |
Morgan Stanley Capital Services LLC | | | | | |
| | | | | |
|
| Gross Amounts of
Liabilities | | | Collateral
(Received)/
Pledged | |
| | | | | |
| | | | | |
Notes to Financial Statements (continued)
|
| Gross Amounts of Liabilities | | | Collateral (Received)/ Pledged | |
Morgan Stanley Capital Services LLC | | | | | |
| | | | | |
| | | | | |
The actual collateral received or pledged, if any, may exceed the amounts shown in the table due to overcollateralization. Timing differences may exist between when contracts under the ISDA agreements are marked-to-market and when collateral moves. The ISDA agreements include tri-party control agreements under which collateral is held for the benefit of the secured party at a third party custodian, State Street Bank and Trust Company (“State Street Bank”).
Counterparty risk is managed based on policies and procedures established by each Fund’s adviser. Such policies and procedures may include, but are not limited to, minimum counterparty credit rating requirements, monitoring of counterparty credit default swap spreads and posting of collateral. A Fund’s risk of loss from counterparty credit risk on over-the-counter derivatives is generally limited to the Fund’s aggregated unrealized gains and the amount of any collateral pledged to the counterparty, which may be offset by any collateral posted to the Fund by the counterparty. ISDA master agreements can help to manage counterparty risk by specifying collateral posting arrangements at pre-arranged exposure levels. Under these ISDA agreements, collateral is routinely transferred if the total net exposure in respect of certain transactions, net of existing collateral already in place, exceeds a specified amount. With exchange-traded derivatives, there is minimal counterparty credit risk to the Fund because the exchange’s clearing house, as counterparty to these instruments, stands between the buyer and the seller of the contract. Credit risk still exists in exchange-traded derivatives with respect to initial and variation margin that is held in a broker’s customer accounts. While brokers typically are required to segregate customer margin for exchange-traded derivatives from their own assets, in the event that a broker becomes insolvent or goes into bankruptcy and at that time there is a shortfall in the aggregate amount of margin held by the broker for all its customers, U.S. bankruptcy laws will typically allocate that shortfall on a pro rata basis across all of the broker’s customers, potentially resulting in losses to the Fund.
5.Purchases and Sales of Securities. For the year ended September 30, 2024, purchases and sales of securities (excluding short-term investments and including paydowns) were as follows:
| U.S. Government/
Agency Securities | |
| | | | |
| | | | |
| | | | |
| | | | |
Intermediate Duration Bond Fund | | | | |
Limited Term Government and Agency Fund | | | | |
6.Management Fees and Other Transactions with Affiliates.
a. Management Fees. Loomis, Sayles & Company, L.P. (“Loomis Sayles”) serves as investment adviser to each Fund. Loomis Sayles is a limited partnership whose sole general partner, Loomis, Sayles & Company, Inc., is indirectly owned by Natixis Investment Managers, LLC, which is part of Natixis Investment Managers, an international asset management group based in Paris, France.
Notes to Financial Statements (continued)
Under the terms of the management agreements, each Fund pays a management fee at the following annual rates, calculated daily and payable monthly, based on the Fund’s average daily net assets:
| Percentage of Average Daily Net Assets |
| | | | | | |
| | | | | | |
| | | | | | |
| | | | | | |
Intermediate Duration Bond Fund | | | | | | |
Limited Term Government and Agency Fund | | | | | | |
Natixis Advisors, LLC ("Natixis Advisors") serves as the advisory administrator to Core Plus Bond Fund. Natixis Advisors is a wholly-owned subsidiary of Natixis Investment Managers, LLC. Under the terms of the advisory administration agreement, the Fund pays an advisory administration fee at the following annual rates, calculated daily and payable monthly, based on its average daily net assets:
| Percentage of Average Daily Net Assets |
| | | |
| | | |
Management and advisory administration fees are presented in the Statements of Operations as management fees.
Loomis Sayles has given binding undertakings to the Funds to waive management fees and/or reimburse certain expenses to limit the Funds' operating expenses, exclusive of acquired fund fees and expenses, brokerage expenses, interest expense, taxes, organizational and extraordinary expenses such as litigation and indemnification expenses. These undertakings are in effect until January 31, 2025, may be terminated before then only with the consent of the Funds' Board of Trustees and are reevaluated on an annual basis. In addition, Loomis Sayles will voluntarily waive its management fee on any portion of the Growth Fund’s assets that are invested in the Natixis Loomis Sayles Focused Growth ETF. Management fees payable, as reflected on the Statements of Assets and Liabilities, is net of waivers and/or expense reimbursements, if any, pursuant to these undertakings. Waivers/reimbursements that exceed management fees payable are reflected on the Statements of Assets and Liabilities as receivable from investment adviser.
For the year ended September 30, 2024 the expense limits as a percentage of average daily net assets under the expense limitation agreements were as follows:
| Expense Limit as a Percentage of
Average Daily Net Assets |
| | | | |
| | | | |
| | | | |
| | | | |
Intermediate Duration Bond Fund | | | | |
Limited Term Government and Agency Fund | | | | |
Loomis Sayles and Natixis Advisors have agreed to equally bear the waivers and/or expense reimbursements for Core Plus Bond Fund.
Loomis Sayles (and Natixis Advisors for Core Plus Bond Fund) shall be permitted to recover expenses borne under the expense limitation agreements (whether through waiver of management fees or otherwise) on a class by class basis in later periods to the extent the annual operating expenses of a class fall below both (1) a class' expense limitation ratio in place at the time such amounts were waived/reimbursed and (2) a class' current applicable expense limitation ratio, provided, however, that a class is not obligated to pay such waived/reimbursed fees or expenses more than one year after the end of the fiscal year in which the fees or expenses were waived/reimbursed.
Notes to Financial Statements (continued)
For the year ended September 30, 2024, the management fees and waivers of management fees for each Fund were as follows:
| | Contractual
Waivers of
Management
| Voluntary
Waivers of
Management
| | Percentage of
Average
Daily Net Assets |
| | |
| | | | | | |
| | | | | | |
| | | | | | |
Intermediate Duration Bond Fund | | | | | | |
Limited Term Government and Agency Fund | | | | | | |
| Waiver/expense reimbursements are subject to possible recovery until September 30, 2025. |
| Voluntary management fee waivers are not subject to recovery under the expense limitation agreement described above. |
For the year ended September 30, 2024, class-specific expenses have been reimbursed as follows:
For the year ended September 30, 2024, the advisory administration fees for Core Plus Bond Fund were $11,782,873 (effective rate of 0.16% of average daily net assets).
No expenses were recovered for any of the Funds during the year ended September 30, 2024 under the terms of the expense limitation agreements.
b. Service and Distribution Fees. Natixis Distribution, LLC (“Natixis Distribution”), which is a wholly-owned subsidiary of Natixis Investment Managers, LLC, has entered into a distribution agreement with the Trust. Pursuant to this agreement, Natixis Distribution serves as principal underwriter of the Funds of the Trusts.
Pursuant to Rule 12b-1 under the 1940 Act, the Trusts have adopted a Service Plan relating to the Fund’s Class A shares (the “Class A Plans”) and a Distribution and Service Plan relating to the Fund’s Class C shares (the “Class C Plans”).
Under the Class A Plans, each Fund pays Natixis Distribution a monthly service fee at an annual rate not to exceed 0.25% of the average daily net assets attributable to the Fund’s Class A shares, as reimbursement for expenses incurred by Natixis Distribution in providing personal services to investors in Class A shares and/or the maintenance of shareholder accounts.
Under the Class C Plans, each Fund pays Natixis Distribution a monthly service fee at an annual rate not to exceed 0.25% of the average daily net assets attributable to the Fund’s Class C shares, as compensation for services provided by Natixis Distribution in providing personal services to investors in Class C shares and/or the maintenance of shareholder accounts.
Also under the Class C Plans, each Fund pays Natixis Distribution a monthly distribution fee at the annual rate of 0.75% of the average daily net assets attributable to the Fund’s Class C shares, as compensation for services provided by Natixis Distribution in connection with the marketing or sale of Class C shares.
For the year ended September 30, 2024, the service and distribution fees for each Fund were as follows:
| | | |
| | | | |
| | | | |
| | | | |
| | | | |
Intermediate Duration Bond Fund | | | | |
Limited Term Government and Agency Fund | | | | |
For the year ended September 30, 2024, Natixis Distribution refunded Limited Term Government and Agency Fund $2,472 of prior year Class A service fees paid to Natixis Distribution in excess of amounts subsequently paid to securities dealers or financial intermediaries. Service and distribution fees on the Statements of Operations have been reduced by these amounts.
Notes to Financial Statements (continued)
c. Administrative Fees. Natixis Advisors provides certain administrative services for the Funds and contracts with State Street Bank to serve as sub-administrator. Pursuant to an agreement among Natixis Funds Trusts, Loomis Sayles Funds Trusts, Natixis ETF Trusts and Natixis Advisors, each Fund pays Natixis Advisors monthly its pro rata portion of fees equal to an annual rate of 0.0540% of the first $15 billion of the average daily net assets of the Natixis Funds Trusts, Loomis Sayles Funds Trusts and Natixis ETF Trusts, 0.0500% of the next $15 billion, 0.0400% of the next $30 billion, 0.0275% of the next $30 billion and 0.0225% of such assets in excess of $90 billion, subject to an annual aggregate minimum fee for the Natixis Funds Trusts, Loomis Sayles Funds Trusts and Natixis ETF Trusts of $10 million, which is reevaluated on an annual basis.
For the year ended September 30, 2024, the administrative fees for each Fund were as follows:
| |
| |
| |
| |
Intermediate Duration Bond Fund | |
Limited Term Government and Agency Fund | |
d. Sub-Transfer Agent Fees. Natixis Distribution has entered into agreements, which include servicing agreements, with financial intermediaries that provide recordkeeping, processing, shareholder communications and other services to customers of the intermediaries that hold positions in the Funds and has agreed to compensate the intermediaries for providing those services. Intermediaries transact with the Funds primarily through the use of omnibus accounts on behalf of their customers who hold positions in the Funds. These services would have been provided by the Funds’ transfer agent and other service providers if the shareholders’ accounts were maintained directly at the Funds’ transfer agent. Accordingly, the Funds have agreed to reimburse Natixis Distribution for all or a portion of the servicing fees paid to these intermediaries. The reimbursement amounts (sub-transfer agent fees) paid to Natixis Distribution are subject to a current per-account equivalent fee limit approved by the Funds’ Board of Trustees, which is based on fees for similar services paid to the Funds’ transfer agent and other service providers. Class N shares do not bear such expenses.
For the year ended September 30, 2024, the sub-transfer agent fees (which are reflected in transfer agent fees and expenses in the Statements of Operations) for each Fund were as follows:
| |
| |
| |
| |
Intermediate Duration Bond Fund | |
Limited Term Government and Agency Fund | |
As of September 30, 2024, the Funds owe Natixis Distribution the following reimbursements for sub-transfer agent fees (which are reflected in the Statements of Assets and Liabilities as payable to distributor):
| Reimbursements
of Sub-Transfer
Agent Fees |
| |
| |
| |
Intermediate Duration Bond Fund | |
Limited Term Government and Agency Fund | |
Notes to Financial Statements (continued)
e. Commissions. Commissions (including CDSCs) on Fund shares retained by Natixis Distribution during the year ended September 30, 2024 were as follows:
| |
| |
| |
| |
Intermediate Duration Bond Fund | |
Limited Term Government and Agency Fund | |
f. Trustees Fees and Expenses. The Trusts do not pay any compensation directly to their officers or Trustees who are directors, officers or employees of Natixis Advisors, Natixis Distribution, Natixis Investment Managers, LLC or their affiliates. The Chairperson of the Board of Trustees receives a retainer fee at the annual rate of $400,000. The Chairperson does not receive any meeting attendance fees for Board of Trustees meetings or committee meetings that he attends. Each Independent Trustee (other than the Chairperson) receives, in the aggregate, a retainer fee at the annual rate of $225,000. Each Independent Trustee also receives a meeting attendance fee of $10,000 for each meeting of the Board of Trustees that he or she attends in person and $5,000 for each meeting of the Board of Trustees that he or she attends telephonically. In addition, the Chairperson of the Contract Review Committee and the Chairperson of the Audit Committee each receive an additional retainer fee at the annual rate of $25,000. The Chairperson of the Governance Committee receives an additional retainer fee at the annual rate of $20,000. Each Contract Review Committee member is compensated $6,000 for each Committee meeting that he or she attends in person and $3,000 for each meeting that he or she attends telephonically. Each Audit Committee member is compensated $6,000 for each Committee meeting that he or she attends in person and $3,000 for each meeting that he or she attends telephonically. Each Governance Committee member is compensated $2,500 for each Committee meeting that he or she attends. These fees are allocated among the funds in the Natixis Funds Trusts, Loomis Sayles Funds Trusts and Natixis ETF Trusts based on a formula that takes into account, among other factors, the relative net assets of each fund. Trustees are reimbursed for travel expenses in connection with attendance at meetings.
Prior to January 1, 2024, the Chairperson of the Board of Trustees received a retainer fee at the annual rate of $369,000 and each Independent Trustee (other than the Chairperson) received, in the aggregate, a retainer fee at the annual rate of $210,000. Each Independent Trustee received a meeting attendance fee of $10,000 for each meeting of the Board of Trustees that he or she attended in person. The Chairperson of the Contract Review Committee and the Chairperson of the Audit Committee each received an additional retainer fee at the annual rate of $20,000. All other Trustees fees remained unchanged.
A deferred compensation plan (the “Plan”) is available to the Trustees on a voluntary basis. The value of a participating Trustee’s deferral account is based on theoretical investments of deferred amounts, on the normal payment dates, in certain funds of the Natixis Funds Trusts, Loomis Sayles Funds Trusts and Natixis ETF Trusts as designated by the participating Trustees. Changes in the value of participants’ deferral accounts are allocated pro rata among the funds in the Natixis Funds Trusts, Loomis Sayles Funds Trusts and Natixis ETF Trusts and are normally reflected as Trustees’ fees and expenses in the Statements of Operations. Deferred amounts remain in the funds until distributed in accordance with the provisions of the Plan. The portions of the accrued obligations allocated to the Funds under the Plan are reflected as Deferred Trustees’ fees in the Statements of Assets and Liabilities.
Certain officers and employees of Natixis Advisors and Loomis Sayles are also officers and/or Trustees of the Trusts.
Notes to Financial Statements (continued)
g. Affiliated Ownership. As of September 30, 2024, the percentage of each Fund’s net assets owned by affiliates is as follows:
| |
| |
Loomis Sayles Employees’ Profit Sharing Retirement Plan | |
| |
Loomis Sayles Employees’ Profit Sharing Retirement Plan | |
| |
Loomis Sayles Employees’ Profit Sharing Retirement Plan | |
Loomis Sayles Funded Pension Plan and Trust | |
| |
Limited Term Government and Agency Fund | |
Loomis Sayles Employees’ Profit Sharing Retirement Plan | |
Loomis Sayles Distribution and Trust | |
Natixis Target Retirement 2015 Fund | |
Natixis Target Retirement 2020 Fund | |
Natixis Target Retirement 2025 Fund | |
Natixis Target Retirement 2030 Fund | |
Natixis Target Retirement 2035 Fund | |
Natixis Target Retirement 2040 Fund | |
Natixis Target Retirement 2045 Fund | |
| |
Investment activities of affiliated shareholders could have material impacts on the Funds.
h. Reimbursement of Transfer Agent Fees and Expenses. Natixis Advisors has given a binding contractual undertaking to Intermediate Duration Bond Fund and Limited Term Government and Agency Fund to reimburse any and all transfer agency expenses for the Funds’ Class N shares. This undertaking is in effect through January 31, 2025 and is not subject to recovery under the expense limitation agreement described above.
For the year ended September 30, 2024, Natixis Advisors reimbursed the Funds for transfer agency expenses as follows:
| Reimbursement of
Transfer Agency
Expenses |
| |
Intermediate Duration Bond Fund | |
Limited Term Government and Agency Fund | |
Notes to Financial Statements (continued)
i. Affiliated Fund Transactions. A summary of affiliated fund transactions for each underlying fund held by the Funds for the year ended September 30, 2024, is as follows:
|
| | | | | Change in
Unrealized
Gain
(Loss) | | Shares
as of
September 30,
2024 | |
Natixis Loomis Sayles Focused Growth ETF | | | | | | | | |
| Purchase cost includes dividend reinvested, if any. |
| Distributions received includes distributions from net investment income and from capital gains, if any. |
7.Class-Specific Transfer Agent Fees and Expenses. Transfer agent fees and expenses attributable to Class A, Class C and Class Y are allocated on a pro rata basis to each class based on the relative net assets of each class to the total net assets of those classes. Transfer agent fees and expenses attributable to Class N are allocated to Class N.
For the year ended September 30, 2024 the Funds incurred the following class-specific transfer agent fees and expenses (net of expense offsets and including sub-transfer agent fees, where applicable):
| Transfer Agent Fees and Expenses |
| | | | |
| | | | |
| | | | |
| | | | |
Intermediate Duration Bond Fund | | | | |
Limited Term Government and Agency Fund | | | | |
8.Expense Offset Arrangements. The Funds have entered into an agreement with the transfer agent whereby certain transfer agent fees and expenses may be paid indirectly by credits earned on the Funds' cash balances. Transfer agent fees and expenses are presented in the Statements of Operations gross of such credits, and the credits are presented as offsets to expenses.
9.Line of Credit. Each Fund, together with certain other funds of Natixis Funds Trusts, Loomis Sayles Funds Trusts and Natixis ETF Trusts, entered into a syndicated, revolving, committed, unsecured line of credit with State Street Bank as administrative agent. The aggregate revolving commitment amount is $575,000,000. Any one Fund may borrow up to $402,500,000 under the line of credit agreement (as long as all borrowings by all Funds in the aggregate do not exceed the $575,000,000 limit at any time), subject to each Fund’s investment restrictions and its contractual obligations under the line of credit. Interest is charged to the Funds based upon the terms set forth in the agreement. In addition, a commitment fee of 0.15% per annum, payable at the end of each calendar quarter, is accrued and apportioned among the participating funds based on their average daily unused portion of the line of credit.
For the year ended September 30, 2024, Growth Fund had an average daily balance on the line of credit (for those days on which there were borrowings) of $33,700,000 at a weighted average interest rate of 6.43%. Interest expense incurred on the line of credit was $6,019.
10.Risk. Global Allocation Fund's investments in foreign securities may be subject to greater political, economic, environmental, credit/counterparty and information risks. The Fund's investments in foreign securities also are subject to foreign currency fluctuations and other foreign currency-related risks. Foreign securities may be subject to higher volatility than U.S. securities, varying degrees of regulation and limited liquidity.
Core Plus Bond Fund and Limited Term Government and Agency Fund's investments in mortgage-related and asset-backed securities are subject to certain risks not associated with investments in other securities. Mortgage-related and asset-backed securities are subject to the risk that unexpected changes in interest rates will have a direct effect on expected maturity. A shortened maturity may result in the reinvestment of prepaid amounts in securities with lower yields than the original obligations. An extended maturity may result in a reduction of a security's value.
Notes to Financial Statements (continued)
Geopolitical events (such as trading halts, sanctions or wars) could increase volatility and uncertainty in the financial markets and adversely affect regional and global economies. These, and other related events, could significantly impact a Fund's performance and the value of an investment in the Fund, even if the Fund does not have direct exposure to issuers in the country or countries involved.
11.Concentration of Ownership. From time to time, a Fund may have a concentration of one or more accounts constituting a significant percentage of shares outstanding. Investment activities by holders of such accounts could have material impacts on the Funds. As of September 30, 2024, based on management’s evaluation of the shareholder account base, the Funds had accounts representing controlling ownership of more than 5% of the Funds' total outstanding shares. The number of such accounts, based on accounts that represent more than 5% of an individual class of shares, and the aggregate percentage of net assets represented by such holdings were as follows:
| Number of 5%
Account Holders | |
| | |
| | |
Intermediate Duration Bond Fund | | |
Limited Term Government and Agency Fund | | |
Omnibus shareholder accounts for which Natixis Advisors understands that the intermediary has discretion over the underlying shareholder accounts or investment models where a shareholder account may be invested for a non-discretionary customer are included in the table above. For other omnibus accounts, the Funds do not have information on the individual shareholder accounts underlying the omnibus accounts; therefore, there could be other 5% shareholders in addition to those disclosed in the table above.
12.Capital Shares. Each Fund may issue an unlimited number of shares of beneficial interest, without par value. Transactions in capital shares were as follows:
|
| Year Ended
September 30, 2024 | Year Ended
September 30, 2023 |
| | | | |
| | | | |
Issued from the sale of shares | | | | |
Issued in connection with the reinvestment of distributions | | | | |
| | | | |
| | | | |
| | | | |
Issued from the sale of shares | | | | |
Issued in connection with the reinvestment of distributions | | | | |
| | | | |
| | | | |
| | | | |
Issued from the sale of shares | | | | |
Issued in connection with the reinvestment of distributions | | | | |
| | | | |
| | | | |
| | | | |
Issued from the sale of shares | | | | |
Issued in connection with the reinvestment of distributions | | | | |
| | | | |
| | | | |
Increase from capital share transactions | | | | |
Notes to Financial Statements (continued)
12.Capital Shares (continued).
|
| Year Ended
September 30, 2024 | Year Ended
September 30, 2023 |
| | | | |
| | | | |
Issued from the sale of shares | | | | |
Issued in connection with the reinvestment of distributions | | | | |
| | | | |
| | | | |
| | | | |
Issued from the sale of shares | | | | |
Issued in connection with the reinvestment of distributions | | | | |
| | | | |
| | | | |
| | | | |
Issued from the sale of shares | | | | |
Issued in connection with the reinvestment of distributions | | | | |
| | | | |
| | | | |
| | | | |
Issued from the sale of shares | | | | |
Issued in connection with the reinvestment of distributions | | | | |
| | | | |
| | | | |
Decrease from capital share transactions | | | | |
Notes to Financial Statements (continued)
12.Capital Shares (continued).
|
| Year Ended
September 30, 2024 | Year Ended
September 30, 2023 |
| | | | |
| | | | |
Issued from the sale of shares | | | | |
Issued in connection with the reinvestment of distributions | | | | |
| | | | |
| | | | |
| | | | |
Issued from the sale of shares | | | | |
Issued in connection with the reinvestment of distributions | | | | |
| | | | |
| | | | |
| | | | |
Issued from the sale of shares | | | | |
Issued in connection with the reinvestment of distributions | | | | |
| | | | |
| | | | |
| | | | |
Issued from the sale of shares | | | | |
Issued in connection with the reinvestment of distributions | | | | |
| | | | |
Redeemed in-kind (Note 13) | | | | |
| | | | |
Increase (decrease) from capital share transactions | | | | |
Notes to Financial Statements (continued)
12.Capital Shares (continued).
|
| Year Ended
September 30, 2024 | Year Ended
September 30, 2023 |
Intermediate Duration Bond Fund | | | | |
| | | | |
Issued from the sale of shares | | | | |
Issued in connection with the reinvestment of distributions | | | | |
| | | | |
| | | | |
| | | | |
Issued from the sale of shares | | | | |
Issued in connection with the reinvestment of distributions | | | | |
| | | | |
| | | | |
| | | | |
Issued from the sale of shares | | | | |
Issued in connection with the reinvestment of distributions | | | | |
| | | | |
| | | | |
| | | | |
Issued from the sale of shares | | | | |
Issued in connection with the reinvestment of distributions | | | | |
| | | | |
| | | | |
Increase (decrease) from capital share transactions | | | | |
Notes to Financial Statements (continued)
12.Capital Shares (continued).
|
| Year Ended
September 30, 2024 | Year Ended
September 30, 2023 |
Limited Term Government and Agency Fund | | | | |
| | | | |
Issued from the sale of shares | | | | |
Issued in connection with the reinvestment of distributions | | | | |
| | | | |
| | | | |
| | | | |
Issued from the sale of shares | | | | |
Issued in connection with the reinvestment of distributions | | | | |
| | | | |
| | | | |
| | | | |
Issued from the sale of shares | | | | |
Issued in connection with the reinvestment of distributions | | | | |
| | | | |
| | | | |
| | | | |
Issued from the sale of shares | | | | |
Issued in connection with the reinvestment of distributions | | | | |
| | | | |
| | | | |
Decrease from capital share transactions | | | | |
13.Redemption In-Kind. In certain circumstances, a Fund may distribute portfolio securities rather than cash as payment for redemption of Fund shares (redemption in-kind). For financial reporting purposes, the Fund will recognize a gain on in-kind redemptions to the extent the value of the distributed securities on the date of redemption exceeds the cost of those securities; the Fund will recognize a loss if the cost exceeds value. Gains and losses realized on redemptions in-kind are not recognized for tax purposes, and are re-classified from realized gain (loss) to paid-in-capital. For the year ended September 30, 2023, Growth Fund participated in a redemption in-kind transaction.
Report of Independent Registered Public Accounting Firm
To the Board of Trustees of Natixis Funds Trust I, Loomis Sayles Funds I and Loomis Sayles Funds II and Shareholders of Loomis Sayles Core Plus Bond Fund, Loomis Sayles Intermediate Duration Bond Fund, Loomis Sayles Global Allocation Fund, Loomis Sayles Growth Fund and Loomis Sayles Limited Term Government and Agency Fund:
Opinions on the Financial Statements
We have audited the accompanying statements of assets and liabilities, including the portfolios of investments, of Loomis Sayles Core Plus Bond Fund (one of the funds constituting Natixis Funds Trust I), Loomis Sayles Intermediate Duration Bond Fund (one of the funds constituting Loomis Sayles Funds I), and Loomis Sayles Global Allocation Fund, Loomis Sayles Growth Fund and Loomis Sayles Limited Term Government and Agency Fund (three of the funds constituting Loomis Sayles Funds II) (hereafter collectively referred to as the "Funds") as of September 30, 2024, the related statements of operations for the year ended September 30, 2024, the statements of changes in net assets for each of the two years in the period ended September 30, 2024, including the related notes, and the financial highlights for each of the five years in the period ended September 30, 2024 (collectively referred to as the “financial statements”). In our opinion, the financial statements present fairly, in all material respects, the financial position of each of the Funds as of September 30, 2024, the results of each of their operations for the year then ended, the changes in each of their net assets for each of the two years in the period ended September 30, 2024 and each of the financial highlights for each of the five years in the period ended September 30, 2024 in conformity with accounting principles generally accepted in the United States of America.
These financial statements are the responsibility of the Funds’ management. Our responsibility is to express an opinion on the Funds’ financial statements based on our audits. We are a public accounting firm registered with the Public Company Accounting Oversight Board (United States) (PCAOB) and are required to be independent with respect to the Funds in accordance with the U.S. federal securities laws and the applicable rules and regulations of the Securities and Exchange Commission and the PCAOB.
We conducted our audits of these financial statements in accordance with the standards of the PCAOB. Those standards require that we plan and perform the audit to obtain reasonable assurance about whether the financial statements are free of material misstatement, whether due to error or fraud.
Our audits included performing procedures to assess the risks of material misstatement of the financial statements, whether due to error or fraud, and performing procedures that respond to those risks. Such procedures included examining, on a test basis, evidence regarding the amounts and disclosures in the financial statements. Our audits also included evaluating the accounting principles used and significant estimates made by management, as well as evaluating the overall presentation of the financial statements. Our procedures included confirmation of securities owned as of September 30, 2024 by correspondence with the custodian, agent banks and brokers; when replies were not received from brokers and agent banks, we performed other auditing procedures. We believe that our audits provide a reasonable basis for our opinions.
/s/PricewaterhouseCoopers LLP
Boston, Massachusetts
November 22, 2024
We have served as the auditor of one or more investment companies in the Natixis Investment Company Complex since at least 1995. We have not determined the specific year we began serving as auditor.
2024 U.S. Tax Distribution Information to Shareholders (Unaudited)
Corporate Dividends Received Deduction. For the fiscal year ended September 30, 2024, a percentage of dividends distributed by the Fund listed below qualifies for the dividends received deduction for corporate shareholders. This percentage is as follows:
Qualified Dividend Income. For the fiscal year ended September 30, 2024, the Funds below will designate up to the maximum amount allowable pursuant to the Internal Revenue Code as qualified dividend income eligible for reduced tax rates. These lower rates range from 0% to 20% depending on an individual’s tax bracket. If the Funds pay a distribution during calendar year 2024, complete information will be reported in conjunction with Form 1099-DIV.
Fund
Growth Fund
Global Allocation Fund
Capital Gains Distributions. Pursuant to Internal Revenue Section 852(b), the following Funds paid distributions, which have been designated as capital gains distributions for the fiscal year ended September 30, 2024, unless subsequently determined to be different.
BOARD APPROVAL OF THE EXISTING ADVISORY AGREEMENTS
The Board of Trustees of the Trusts (the “Board”), including the Independent Trustees, considers matters bearing on each Fund’s advisory agreement (collectively, the “Agreements”) at most of its meetings throughout the year. Each year, usually in the spring, the Contract Review Committee of the Board meets to review the Agreements to determine whether to recommend that the full Board approve the continuation of the Agreements, typically for an additional one-year period. This meeting typically includes all the Independent Trustees, including the Trustees who do not serve on the Contract Review Committee. After the Contract Review Committee has made its recommendation, the full Board, including the Independent Trustees, determines whether to approve the continuation of the Agreements at its June Board meeting.
In connection with these meetings, the Trustees receive materials that the Funds’ investment adviser and Loomis Sayles Core Plus Bond Fund’s advisory administrator (the “Advisers”) believe to be reasonably necessary for the Trustees to evaluate the Agreements. These materials generally include, among other items, (i) information on the investment performance of the Funds and the performance of peer groups of funds and the Funds’ performance benchmarks, (ii) information on the Funds’ advisory fees and other expenses, including information comparing the Funds’ advisory fees to the fees charged to institutional accounts with similar strategies managed by the Advisers, if any, and to those of peer groups of funds and information about any applicable expense limitations and/or fee “breakpoints,” (iii) sales and redemption data in respect of the Funds, (iv) information about the profitability of the Agreements to the Advisers, including how profitability is determined by the Funds, and (v) information obtained through the completion by the Advisers of questionnaires distributed throughout the year on behalf of the Trustees. The Board, including the Independent Trustees, also considers other matters such as (i) each Fund’s investment objective and strategies and the size, education and experience of the Advisers’ investment staffs and their use of technology, external research and trading cost measurement tools, (ii) arrangements in respect of the distribution of the Funds’ shares and the related costs, (iii) the allocation of the Funds’ brokerage, if any, including, to the extent applicable, allocations to brokers affiliated with the Advisers and the use of “soft” commission dollars to pay for research and other similar services, (iv) the Advisers’ policies and procedures relating to, among other things, compliance, trading and best execution, proxy voting, liquidity and valuation, (v) information about amounts invested by the Funds’ portfolio managers in the Funds or in similar accounts that they manage and (vi) the general economic outlook with particular emphasis on the mutual fund industry. Throughout the process, the Trustees are afforded the opportunity to ask questions of and request additional materials from the Advisers and the Independent Trustees meet separately with independent legal counsel outside the presence of Adviser personnel.
In addition to the materials requested by the Trustees in connection with their annual consideration of the continuation of the Agreements, the Trustees receive materials in advance of each regular quarterly meeting of the Board that provide detailed information about the Funds’ investment performance and the fees charged to the Funds for advisory and other services. The information received by the Trustees generally includes, where available, among other things, an internal performance rating for each Fund based on agreed-upon criteria, graphs showing each Fund’s performance and expense differentials against each Fund’s peer group/category of funds, total return information for various periods, performance rankings provided by a third-party data provider for various periods comparing a Fund against similarly categorized funds, and performance ratings provided by a different third-party rating organization. The portfolio management team for each Fund or other representatives of the Advisers make periodic presentations to the Contract Review Committee and/or the full Board, and Funds identified as presenting possible performance concerns may be subject to more frequent Board or Committee presentations and reviews. In addition, the Trustees are periodically provided with detailed statistical information about each Fund’s portfolio. The Trustees also receive periodic updates between meetings, both at the Board and at the Committee level.
The Board most recently approved the continuation of the Agreements for a one-year period at its meeting held in June 2024. In considering whether to approve the continuation of the Agreements, the Board, including the Independent Trustees, did not identify any single factor as determinative. Individual Trustees may have evaluated the information presented differently from one another, giving different weights to various factors. Matters considered by the Trustees, including the Independent Trustees, in connection with their approval of the Agreements included, but were not limited to, the factors listed below.
The nature, extent and quality of the services provided to the Funds under the Agreements. The Trustees considered the nature, extent and quality of the services provided by the Advisers and their affiliates to the Funds and the resources dedicated to the Funds by the Advisers and their affiliates. The Trustees also considered their experience with other funds advised or sub-advised by the Advisers, as well as the affiliation between the Advisers and Natixis Investment Managers, LLC, whose affiliates provide investment advisory services to other funds in the Natixis family of funds.
The Trustees considered not only the advisory services provided by the Advisers to the Funds, but also the benefits to the Funds from the monitoring and oversight services provided by Natixis Advisors, LLC (“Natixis Advisors”). They also considered the administrative and shareholder services provided by Natixis Advisors and its affiliates to the Funds. They also took into consideration increases in the services provided resulting from new regulatory requirements, such as recent rules relating to the fair valuation of investments and the use of derivatives, implementation of tailored shareholder reports and amendments to the Names Rule, as well as from monitoring proposed rules, such as those relating to cybersecurity, environmental, social, and governance-specific regulatory changes, and vendor oversight.
For each Fund, the Trustees also considered the benefits to shareholders of investing in a mutual fund that is part of a family of funds that offers shareholders the right to exchange shares of one type of fund for shares of another type of fund, and provides a variety of fund and shareholder services.
After reviewing these and related factors, the Trustees concluded, within the context of their overall conclusions regarding each of the Agreements, that the nature, extent and quality of services provided supported the renewal of the Agreements.
Investment performance of the Funds and the Advisers. As noted above, the Trustees received information about the performance of the Funds over various time periods, including information that compared the performance of the Funds to the performance of peer groups and categories of funds and the Funds’ respective performance benchmarks. The Board noted that while it found the data provided by the independent third-party data provider useful, it recognized its limitations, including, in particular, that notable differences may exist between the Funds and the performance comparisons (for example, with respect to investment strategies) and that the results of the performance comparisons may vary depending on (i) the end dates for the performance periods that were selected and (ii) the selection of the performance comparisons. The Trustees also received information about how comparative peer groups are constructed. In addition, the Trustees reviewed data prepared by an independent third-party rating organization that analyzed the performance of the Funds using a variety of performance metrics, including metrics that measured the performance of the Funds on a risk adjusted basis.
The Board noted that, through December 31, 2023, each Fund’s one-, three- and five-year performance, stated as percentile rankings within categories selected by the independent third-party data provider, was as follows (where the best performance would be in the first percentile of its category):
| | | |
Loomis Sayles Core Plus Bond Fund | | | |
Loomis Sayles Global Allocation Fund | | | |
Loomis Sayles Growth Fund | | | |
Loomis Sayles Intermediate Duration Bond Fund | | | |
Loomis Sayles Limited Term Government and Agency Fund | | | |
In the case of a Fund that had performance that lagged that of a relevant category median as determined by the independent third-party data provider for certain (although not necessarily all) periods, the Board concluded that other factors relevant to performance supported renewal of the Agreements. These factors included one or more of the following: (1) that the underperformance was attributable, to a significant extent, to investment decisions (such as security selection or sector allocation) by the Advisers that were reasonable and consistent with the Fund’s investment objective and policies; (2) that the Fund had outperformed its relevant performance benchmark for the one-year period ended December 31, 2023; (3) that the Fund had outperformed its relevant performance benchmark for all periods; (4) that the average duration of funds in the Fund’s category is considerably shorter than that of the Fund, as a result of the Fund’s mandate, such that its performance relative to its category would be expected to lag in certain market conditions; (5) that the Fund’s shorter-term (one-year) performance has been strong relative to its category; and (6) that the Fund’s long-term (five-year and 10-year) performance was stronger relative to its category. The Board also considered information about the Funds’ more recent performance, including how performance over various periods had been impacted by various factors such as market and economic events.
The Trustees also considered the Advisers’ performance and reputation generally, the performance of the fund family generally, and the historical responsiveness of the Advisers to Trustee concerns about performance and the willingness of the Advisers to take steps intended to improve performance.
After reviewing these and related factors, the Trustees concluded, within the context of their overall conclusions regarding each of the Agreements, that the performance of the Funds and the Advisers and/or other relevant factors supported the renewal of the Agreements.
The costs of the services to be provided and profits to be realized by the Advisers and their affiliates from their respective relationships with the Funds. The Trustees considered the fees charged to the Funds for advisory and administrative services as well as the total expense levels of the Funds. This information included comparisons (provided both by management and by an independent third party) of the Funds’ advisory fees and total expense levels to those of their peer groups and information about the advisory fees charged by the Advisers to comparable accounts (such as institutional separate accounts), as well as information about differences in such fees and the reasons for any such differences. In considering the fees charged to comparable accounts, the Trustees considered, among other things, management’s representations about the differences between managing mutual funds as compared to other types of accounts, including the additional resources required to effectively manage mutual fund assets, the greater regulatory costs associated with the management of such assets, and the entrepreneurial, regulatory and other risks associated with sponsoring and managing mutual funds. In evaluating each Fund’s advisory fee, the Trustees also took into account the demands, complexity and quality of the investment management of
such Fund, as well as the need for the Advisers to offer competitive compensation and the potential need to expend additional resources to the extent the Fund grows in size. The Trustees considered that over the past several years, management had demonstrated its intention to have competitive fee levels by making recommendations regarding reductions in advisory fee rates, implementation of advisory fee breakpoints and the institution of advisory fee waivers and expense limitations for various funds in the fund family. They noted that the Funds have expense limitations in place, and they considered the amounts waived or reimbursed by the Advisers for Loomis Sayles Core Plus Bond Fund, Loomis Sayles Intermediate Duration Bond Fund, and Loomis Sayles Limited Term Government and Agency Fund under their respective expense limitation agreements. The Trustees also considered that the current expenses for Loomis Sayles Global Allocation Fund and Loomis Sayles Growth Fund were below each Fund’s expense limitation. The Trustees also noted that the total advisory fee rate for each of the Funds was below the median of its peer group of funds. The Board also considered that the fee and expense information reflected information as of a certain date and that historical asset levels may differ from current asset levels, particularly in a period of market volatility.
The Trustees also considered the compensation directly or indirectly received by the Advisers and their affiliates from their relationships with the Funds. The Trustees reviewed information provided by management as to the profitability of the Advisers’ and their affiliates’ relationships with the Funds, and information about how expenses are determined and allocated for purposes of profitability calculations. They also reviewed information provided by management about the effect of distribution costs and changes in asset levels on Adviser profitability, including information regarding resources spent on distribution activities. When reviewing profitability, the Trustees also considered information about court cases in which adviser compensation or profitability were issues, the performance of the Funds, the expense levels of the Funds, whether the Advisers had implemented breakpoints and/or expense limitations with respect to such Funds and the overall profit margin of Natixis Investment Managers, LLC compared to that of certain other investment managers for which such data was available. The Board also noted the competitive nature of the global asset management industry.
After reviewing these and related factors, the Trustees concluded, within the context of their overall conclusions regarding each of the Agreements, that the advisory fee charged to each of the Funds was fair and reasonable, and that the costs of these services generally and the related profitability of the Advisers and their affiliates in respect of their relationships with the Funds supported the renewal of the Agreements.
Economies of Scale. The Trustees considered the existence of any economies of scale in the provision of services by the Advisers and whether those economies are shared with the Funds through breakpoints in their investment advisory fees or other means, such as expense limitations. The Trustees also considered management’s explanation of the factors that are taken into account with respect to the implementation of breakpoints in investment advisory fees or expense limitations, which reduced the total expenses borne by shareholders of certain Funds. With respect to economies of scale, the Trustees noted that each of Loomis Sayles Core Plus Bond Fund, Loomis Sayles Global Allocation Fund and Loomis Sayles Limited Term Government and Agency Fund had breakpoints in its advisory fee and that each of the Funds was subject to an expense limitation. In considering these issues, the Trustees also took note of the costs of the services provided (both on an absolute and on a relative basis) and the profitability to the Advisers and their affiliates of their relationships with the Funds, as discussed above. The Trustees also considered that the Funds have benefitted from the substantial reinvestment each Adviser has made into its business.
After reviewing these and related factors, the Trustees concluded, within the context of their overall conclusions regarding the Agreements, that the extent to which economies of scale were shared with the Funds supported the renewal of the Agreements.
The Trustees also considered other factors, which included but were not limited to the following:
• The effect of various factors and recent market and economic events, such as recent market volatility, geopolitical instability, aggressive domestic and foreign central bank policies, and adverse developments affecting the financial services industry generally, as applicable, on the performance, asset levels and expense ratios of each Fund.
• Whether each Fund has operated in accordance with its investment objective and the Fund’s record of compliance with its investment restrictions, and the compliance programs of the Funds and the Advisers. They also considered the compliance-related resources the Advisers and their affiliates were providing to the Funds.
• So-called “fallout benefits” to the Advisers, such as the engagement of affiliates of the Advisers to provide distribution and administrative services to the Funds, and the benefits of research made available to the Advisers by reason of brokerage commissions (if any) generated by the Funds’ securities transactions. The Trustees considered the possible conflicts of interest associated with these fallout and other benefits, and the reporting, disclosure and other processes in place to disclose and monitor such possible conflicts of interest.
• The Trustees’ review and discussion of the Funds’ advisory arrangements in prior years, and management’s record of responding to Trustee concerns raised during the year and in prior years.
Based on their evaluation of all factors that they deemed to be material, including those factors described above, and assisted by the advice of independent counsel, the Trustees, including the Independent Trustees, concluded that the existing Agreements should be continued through June 30, 2025.
This Page Intentionally Left Blank
Contact us by mail:
If you wish to communicate with the funds’ Board of Trustees, you may do so by writing to:
Secretary of the Funds
Natixis Advisors, LLC
888 Boylston Street, Suite 800
Boston, MA 02199-8197
The correspondence must (a) be signed by the shareholder; (b) include the shareholder’s name and address; and (c) identify the fund(s), account number, share class, and number of shares held in that fund, as of a recent date.
Or by e-mail:
secretaryofthefunds@natixis.com (Communications regarding recommendations for Trustee candidates may not be submitted by e-mail.)
Please note: Unlike written correspondence, e-mail is not secure. Please do NOT include your account number, Social Security number, PIN, or any other non-public personal information in an e-mail communication because this information may be viewed by others.
 Exp. 11/30/256031448.2.1LSIF58A-0924
Item 8. Changes in and Disagreements with Accountants for Open-End Management Investment Companies
Not applicable.
Item 9. Proxy Disclosures for Open-End Management Investment Companies.
Not applicable.
Item 10. Remuneration Paid to Directors, Officers, and Others of Open-End Management Investment Companies.
The remuneration paid to Directors and Officers are incorporated by reference as part of the Financial Statements and Other Important Information for Open-End Management Investment Companies filed as Item 7 herewith.
Item 11. Statement Regarding Basis for Approval of Investment Advisory Contract.
The statements regarding basis for approval of investment advisory contracts are incorporated by reference as part of the Financial Statements and Other Important Information for Open-End Management Investment Companies filed as Item 7 herewith.
Item 12. Disclosure of Proxy Voting Policies and Procedures for Closed-End Management Investment Companies.
Not applicable.
Item 13. Portfolio Managers of Closed-End Management Investment Companies
Not applicable.
Item 14. Purchases of Equity Securities by Closed-End Management Investment Companies and Affiliated Purchasers.
Not applicable.
Item 15. Submission of Matters to a Vote of Securities Holders.
There were no material changes to the procedures by which shareholders may recommend nominees to the Registrant’s Board of Trustees.
Item 16. Controls and Procedures.
(a) The Registrant’s principal executive officer and principal financial officer have concluded that the Registrant’s disclosure controls and procedures are sufficient to ensure that information required to be disclosed by the Registrant in this Form N-CSR was recorded, processed, summarized and reported within the time periods specified in the Securities and Exchange Commission’s rules and forms, based upon such officers’ evaluation of these controls and procedures as of a date within 90 days of the filing date of the report.
(b) There were no changes in the Registrant’s internal control over financial reporting that occurred during the period covered by the report that have materially affected, or is reasonably likely to materially affect, the Registrant’s internal control over financial reporting.
Item 17. Disclosure of Securities Lending Activities for Closed-End Management Investment Companies.
Not applicable.
Item 18. Recovery of Erroneously Awarded Compensation.
Not applicable.
Item 19. Exhibits.
SIGNATURES
Pursuant to the requirements of the Securities Exchange Act of 1934 and the Investment Company Act of 1940, the Registrant has duly caused this report to be signed on its behalf by the undersigned, thereunto duly authorized.
| | |
| Loomis Sayles Funds II |
|
| By: /s/ David L. Giunta |
| |
| Name: | | David L. Giunta |
| Title: | | President and Chief Executive Officer |
| Date: | | November 22, 2024 |
Pursuant to the requirements of the Securities Exchange Act of 1934 and the Investment Company Act of 1940, this report has been signed by the following persons on behalf of the Registrant and in the capacities and on the dates indicated.
| | |
| By: /s/ David L. Giunta |
| |
| Name: | | David L. Giunta |
| Title: | | President and Chief Executive Officer |
| Date: | | November 22, 2024 |
|
| By: /s/ Matthew J. Block |
| |
| Name: | | Matthew J. Block |
| Title: | | Treasurer and Principal Financial and |
| | Accounting Officer |
| Date: | | November 22, 2024 |