UNITED STATES
SECURITIES AND EXCHANGE COMMISSION
Washington, D.C. 20549
FORM N-CSR
CERTIFIED SHAREHOLDER REPORT OF REGISTERED
MANAGEMENT INVESTMENT COMPANIES
| Investment Company Act file number | 811-06247 | |||||
| AMERICAN CENTURY WORLD MUTUAL FUNDS, INC. | ||||||
| (Exact name of registrant as specified in charter) | ||||||
| 4500 MAIN STREET, KANSAS CITY, MISSOURI | 64111 | |||||
| (Address of principal executive offices) | (Zip Code) | |||||
CHARLES A. ETHERINGTON 4500 MAIN STREET, KANSAS CITY, MISSOURI 64111 | ||||||
| (Name and address of agent for service) | ||||||
| Registrant’s telephone number, including area code: | 816-531-5575 | |||||
| Date of fiscal year end: | 11-30 | |||||
| Date of reporting period: | 11-30-2014 | |||||
ITEM 1. REPORTS TO STOCKHOLDERS.
ANNUAL REPORT | NOVEMBER 30, 2014 |


Emerging Markets Fund
| Table of Contents |
| President’s Letter | |
| Performance | |
| Portfolio Commentary | |
| Fund Characteristics | |
| Shareholder Fee Example | |
| Schedule of Investments | |
| Statement of Assets and Liabilities | |
| Statement of Operations | |
| Statement of Changes in Net Assets | |
| Notes to Financial Statements | |
| Financial Highlights | |
| Report of Independent Registered Public Accounting Firm | |
| Management | |
| Approval of Management Agreement | |
| Additional Information | |
Any opinions expressed in this report reflect those of the author as of the date of the report, and do not necessarily represent the opinions of American Century Investments® or any other person in the American Century Investments organization. Any such opinions are subject to change at any time based upon market or other conditions and American Century Investments disclaims any responsibility to update such opinions. These opinions may not be relied upon as investment advice and, because investment decisions made by American Century Investments funds are based on numerous factors, may not be relied upon as an indication of trading intent on behalf of any American Century Investments fund. Security examples are used for representational purposes only and are not intended as recommendations to purchase or sell securities. Performance information for comparative indices and securities is provided to American Century Investments by third party vendors. To the best of American Century Investments’ knowledge, such information is accurate at the time of printing.
| President’s Letter |
 | Dear Investor: Thank you for reviewing this annual report for the 12 months ended November 30, 2014. It provides investment performance and portfolio information for the reporting period, plus longer-term historical performance data. Annual reports remain important vehicles for conveying information about fund returns, including market and economic factors that affected performance during the reporting period. For additional, updated investment and market insights, we encourage you to visit our website, americancentury.com. |
| Jonathan Thomas | |
Favorable Fiscal Year for U.S. Investments, While Non-U.S. Lagged
“Global divergence” between the U.S. and the rest of the world emerged as a prevalent theme during the reporting period. As 2014 approached its conclusion, the U.S. appeared to be on a different economic and monetary policy track than most other nations. This theme covered not only the stronger economic growth enjoyed by the U.S. compared with the rest of the world, but also the related contrast between the U.S. Federal Reserve’s unwinding of monetary stimulus versus the continuation and expansion of monetary stimulus by most other central banks.
Global divergence could also generally describe the broad difference between investment returns for U.S. and non-U.S. markets. The perceived strength, safe-haven qualities, and higher yields of U.S. investments attracted global demand. For the reporting period, the S&P 500 Index, the Barclays U.S. Aggregate Bond Index, and the U.S. Dollar Index returned 16.86%, 5.27%, and 9.34%, respectively. By contrast, for U.S. investors unhedged for currency exposure (the dollar’s strength reduced the returns of non-dollar-denominated securities when they were converted to dollars), the MSCI EAFE Index, the MSCI Emerging Markets Index, and the Barclays Global Aggregate Bond Index (ex-USD, unhedged) returned -0.02%, 1.06%, and -2.53%, respectively.
We expect global divergence in economic growth and monetary policies to continue well into 2015, aligned with expectations that the Federal Reserve might finally start raising short-term U.S. interest rates. However, global economic weakness (reflected in recent commodity price declines) and low inflation might delay the rate hikes until the second half of 2015. In this environment, we continue to believe in a disciplined, diversified, long-term investment approach, using professionally managed stock and bond portfolios to meet financial goals. We appreciate your continued trust in us.
Sincerely,

Jonathan Thomas
President and Chief Executive Officer
American Century Investments
2
| Performance |
| Total Returns as of November 30, 2014 | ||||||
Average Annual Returns | ||||||
Ticker Symbol | 1 year | 5 years | 10 years | Since Inception | Inception Date | |
Investor Class | TWMIX | 1.84%(1) | 4.48%(1) | 8.96%(1) | 6.75% | 9/30/97 |
| MSCI Emerging Markets Index | — | 1.06% | 3.54% | 9.45% | N/A(2) | — |
| Institutional Class | AMKIX | 2.07%(1) | 4.69%(1) | 9.18%(1) | 10.22% | 1/28/99 |
A Class(3) | AEMMX | 5/12/99 | ||||
| No sales charge* | 1.59%(1) | 4.23%(1) | 8.71%(1) | 8.04% | ||
| With sales charge* | -4.21%(1) | 3.01%(1) | 8.06%(1) | 7.63% | ||
| C Class | ACECX | 0.82%(1) | 3.43%(1) | 7.87%(1) | 9.07%(1) | 12/18/01 |
| R Class | AEMRX | 1.38%(1) | 3.96%(1) | — | -2.69%(1) | 9/28/07 |
| R6 Class | AEDMX | 2.23%(1) | — | — | 7.21%(1) | 7/26/13 |
* Sales charges include initial sales charges and contingent deferred sales charges (CDSCs), as applicable. A Class shares have a 5.75% maximum initial sales charge and may be subject to a maximum CDSC of 1.00%. C Class shares redeemed within 12 months of purchase are subject to a maximum CDSC of 1.00%. The SEC requires that mutual funds provide performance information net of maximum sales charges in all cases where charges could be applied.
| (1) | Returns would have been lower if a portion of the management fee had not been waived. |
| (2) | Benchmark data first available January 2001. |
| (3) | Prior to September 4, 2007, the A Class was referred to as the Advisor Class and did not have a front-end sales charge. Performance has been adjusted to reflect this charge. |
Data presented reflect past performance. Past performance is no guarantee of future results. Current performance may be higher or lower than the performance shown. Investment return and principal value will fluctuate, and redemption value may be more or less than original cost. Data assumes reinvestment of dividends and capital gains, and none of the charts reflect the deduction of taxes that a shareholder would pay on fund distributions or the redemption of fund shares. To obtain performance data current to the most recent month end, please call 1-800-345-2021 or visit americancentury.com. For additional information about the fund, please consult the prospectus.
3
| Growth of $10,000 Over 10 Years |
| $10,000 investment made November 30, 2004 |
| Performance for other share classes will vary due to differences in fee structure. |
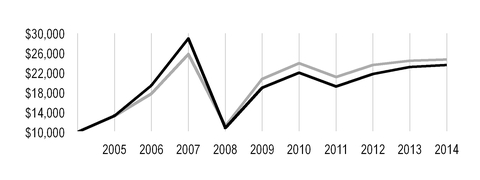
| Value on November 30, 2014 | |
| Investor Class — $23,592* | |
| MSCI Emerging Markets Index — $24,678 | |
*Ending value would have been lower if a portion of the management fee had not been waived.
Total Annual Fund Operating Expenses | |||||
Investor Class | Institutional Class | A Class | C Class | R Class | R6 Class |
| 1.72% | 1.52% | 1.97% | 2.72% | 2.22% | 1.37% |
The total annual fund operating expenses shown is as stated in the fund’s prospectus current as of the date of this report. The prospectus may vary from the expense ratio shown elsewhere in this report because it is based on a different time period, includes acquired fund fees and expenses, and, if applicable, does not include fee waivers or expense reimbursements.
Data presented reflect past performance. Past performance is no guarantee of future results. Current performance may be higher or lower than the performance shown. Investment return and principal value will fluctuate, and redemption value may be more or less than original cost. Data assumes reinvestment of dividends and capital gains, and none of the charts reflect the deduction of taxes that a shareholder would pay on fund distributions or the redemption of fund shares. To obtain performance data current to the most recent month end, please call 1-800-345-2021 or visit americancentury.com. For additional information about the fund, please consult the prospectus.
4
| Portfolio Commentary |
Portfolio Managers: Patricia Ribeiro and Anthony Han
Performance Summary
Emerging Markets advanced 1.84%* for the 12 months ended November 30, 2014. The portfolio’s benchmark, the MSCI Emerging Markets Index, advanced 1.06% for the same period.
Emerging markets stocks struggled with sluggish global growth and an overall volatile backdrop, which contributed to weak 12-month performance for the broad benchmark. Early in the period, stocks in developing countries generally slumped on news the U.S. Federal Reserve (the Fed) would gradually unwind its massive bond-buying program, which had helped buoy investments in emerging nations. But, emerging markets investors slowly grew more comfortable with waning quantitative easing from the Fed, as other leading central banks, including the European Central Bank (ECB) and the Bank of Japan (BOJ), maintained aggressive stimulus programs. Optimism about improving U.S. economic growth and continued accommodations from other central banks helped spark a strong rally among emerging market stocks during the second calendar quarter of 2014. That rally was short-lived, though, as concerns about divergence in central bank policy and global economic growth took center stage. A continued slowdown in China’s economic growth outlook also weighed on the broad emerging markets benchmark.
Political unrest also triggered volatility within the emerging markets. In particular, the ongoing Russia-Ukraine conflict; a military coup in Thailand; numerous election-related uncertainties, particularly in Brazil; mounting turmoil throughout the Middle East; and pro-democracy protests in Hong Kong pressured stocks. Not all the political news was negative, though, as voters in India elected a pro-business prime minister. Meanwhile, commodity prices (particularly oil) plunged, driving down stocks in many emerging market nations, and the U.S. dollar soared, stifling currency values throughout much of the developing world.
The fund outperformed its benchmark during the period, primarily due to positioning in the information technology, materials, and financials sectors. Regionally, stock selection and underweight positions in Brazil and South Korea, along with stock selection in South Africa, also contributed to the fund’s outperformance.
Internet Company Was a Top Contributor
Within the top-performing information technology sector, the internet and software services industry was a leading contributor. An overweight position in China’s Tencent Holdings, one of the largest holdings in the portfolio, drove the fund’s performance in that industry. The company, which offers interactive games, instant messaging, videos, and other services, benefited from the growth of internet-related services in China.
In addition, within the South Korean market, an overweight position in CJ Korea Express, a logistics firm, was among the fund’s top contributors. The company experienced strong growth and increasing market share with the recovery in its parcel delivery business, largely stemming from growth in online shopping. The company also reported improving margins due to cost savings. Furthermore, a rival firm’s switch to weekday-only delivery further supported the stock.
* All fund returns referenced in this commentary are for Investor Class shares. Returns would have been lower if a portion of the management fee had not been waived. Performance for other share classes will vary due to differences in fee structure; when Investor Class performance exceeds that of the fund's benchmark, other share classes may not. See page 3 for returns for all share classes.
5
Growth in online shopping also boosted China-based Vipshop Holdings. A portfolio-only position in the company was among the fund’s top contributors for the 12-month period. Growing consumer demand for quality goods, insufficient purchasing channels, and lack of promotional discounts for foreign brands in China have led to a rapidly growing online shopping market. As China’s leading online discount retailer for brands through flash sales, Vipshop has benefited from this trend.
China, Russia, Turkey Were Main Detractors
Stock selection in China, Russia, and Turkey, along with underweight positions in China and Russia, detracted from relative results. In terms of sector exposure, positioning in the industrials, energy, and utilities sectors weighed on the fund’s relative performance.
An overweight position in China Oilfield Services was among the largest performance detractors. The China-based company, which specializes in deep-water drilling, retreated early in the period, as weak results from Western markets lowered demand and hurt pricing for its services. The company also projected 2014 revenues would grow at a lower rate than in recent quarters. As the period progressed, the company’s stock suffered further due to tumbling oil prices. We exited the position.
A portfolio-only position in Turkey’s Pegasus Hava Tasimaciligi, a low-cost airline, also was among the largest detractors for the period. Competitor Turkish Airlines moved capacity from Istanbul Atatürk International Airport to the smaller airport in Istanbul, Sabiha Gokcen International Airport, which is Pegasus’ main hub. This move created more competition for Pegasus in its domestic routes, affecting yields and driving down the company’s stock price.
A portfolio-only position in Russia’s Mail.ru Group also detracted from fund performance. The company, which provides various online communication products and entertainment services for Russian speakers worldwide, announced a 2014 revenue outlook below analyst expectations given the macroeconomic slowdown. Furthermore, Russia’s actions in Ukraine prompted many investors to exit Russian stocks given heightened geopolitical risks. We sold the fund's position in the company.
Outlook
In managing the fund, our primary emphasis is at the company level, where we invest in firms we believe have considerable earnings acceleration potential. That said, we believe slower growth in China will present challenges for Asia and emerging markets commodity producers more broadly. However, we also believe lower oil prices should support many emerging markets by reducing import prices and restraining inflation. Furthermore, global liquidity received another boost late in the period, as the BOJ, and to a lesser extent the ECB, expanded their stimulus efforts. Growth in the U.S. has held up relatively well without pushing inflation higher, largely due to a stronger dollar and falling oil prices. We believe this presents an ideal combination for emerging markets, as it reduces the pressure on the Fed to aggressively hike rates.
6
| Fund Characteristics |
| NOVEMBER 30, 2014 | |
Top Ten Holdings | % of net assets |
| Taiwan Semiconductor Manufacturing Co. Ltd. | 4.5% |
| Tencent Holdings Ltd. | 3.6% |
| Itau Unibanco Holding SA ADR | 3.2% |
| Samsung Electronics Co. Ltd. | 2.9% |
| China Mobile Ltd. | 2.2% |
| Credicorp Ltd. | 1.8% |
| Cemex SAB de CV ADR | 1.7% |
| Ping An Insurance Group Co., H Shares | 1.7% |
| CJ Korea Express Co. Ltd. | 1.6% |
| Industrial & Commercial Bank of China Ltd., H Shares | 1.6% |
Types of Investments in Portfolio | % of net assets |
| Foreign Common Stocks | 97.4% |
| Temporary Cash Investments | 3.0% |
| Other Assets and Liabilities | (0.4)% |
Investments by Country | % of net assets |
| China | 21.0% |
| South Korea | 12.0% |
| Brazil | 10.7% |
| Taiwan | 10.2% |
| South Africa | 8.2% |
| India | 7.6% |
| Mexico | 5.1% |
| Indonesia | 3.2% |
| Thailand | 2.8% |
| Turkey | 2.7% |
| Poland | 2.2% |
| Russia | 2.1% |
| Other Countries | 9.6% |
| Cash and Equivalents* | 2.6% |
*Includes temporary cash investments and other assets and liabilities.
7
| Shareholder Fee Example |
Fund shareholders may incur two types of costs: (1) transaction costs, including sales charges (loads) on purchase payments and redemption/exchange fees; and (2) ongoing costs, including management fees; distribution and service (12b-1) fees; and other fund expenses. This example is intended to help you understand your ongoing costs (in dollars) of investing in your fund and to compare these costs with the ongoing cost of investing in other mutual funds.
The example is based on an investment of $1,000 made at the beginning of the period and held for the entire period from June 1, 2014 to November 30, 2014.
Actual Expenses
The table provides information about actual account values and actual expenses for each class. You may use the information, together with the amount you invested, to estimate the expenses that you paid over the period. First, identify the share class you own. Then simply divide your account value by $1,000 (for example, an $8,600 account value divided by $1,000 = 8.6), then multiply the result by the number under the heading “Expenses Paid During Period” to estimate the expenses you paid on your account during this period.
If you hold Investor Class shares of any American Century Investments fund, or Institutional Class shares of the American Century Diversified Bond Fund, in an American Century Investments account (i.e., not a financial intermediary or retirement plan account), American Century Investments may charge you a $12.50 semiannual account maintenance fee if the value of those shares is less than $10,000. We will redeem shares automatically in one of your accounts to pay the $12.50 fee. In determining your total eligible investment amount, we will include your investments in all personal accounts (including American Century Investments Brokerage accounts) registered under your Social Security number. Personal accounts include individual accounts, joint accounts, UGMA/UTMA accounts, personal trusts, Coverdell Education Savings Accounts and IRAs (including traditional, Roth, Rollover, SEP-, SARSEP- and SIMPLE-IRAs), and certain other retirement accounts. If you have only business, business retirement, employer-sponsored or American Century Investments Brokerage accounts, you are currently not subject to this fee. If you are subject to the Account Maintenance Fee, your account value could be reduced by the fee amount.
Hypothetical Example for Comparison Purposes
The table also provides information about hypothetical account values and hypothetical expenses based on the actual expense ratio of each class of your fund and an assumed rate of return of 5% per year before expenses, which is not the actual return of a fund’s share class. The hypothetical account values and expenses may not be used to estimate the actual ending account balance or expenses you paid for the period. You may use this information to compare the ongoing costs of investing in your fund and other funds. To do so, compare this 5% hypothetical example with the 5% hypothetical examples that appear in the shareholder reports of the other funds.
Please note that the expenses shown in the table are meant to highlight your ongoing costs only and do not reflect any transactional costs, such as sales charges (loads) or redemption/exchange fees. Therefore, the table is useful in comparing ongoing costs only, and will not help you determine the relative total costs of owning different funds. In addition, if these transactional costs were included, your costs would have been higher.
8
| Beginning Account Value 6/1/14 | Ending Account Value 11/30/14 | Expenses Paid During Period(1)6/1/14 - 11/30/14 | Annualized Expense Ratio(1) | |
Actual | ||||
| Investor Class (after waiver) | $1,000 | $1,018.10 | $7.34 | 1.45% |
| Investor Class (before waiver) | $1,000 | $1,018.10(2) | $8.60 | 1.70% |
| Institutional Class (after waiver) | $1,000 | $1,019.90 | $6.33 | 1.25% |
| Institutional Class (before waiver) | $1,000 | $1,019.90(2) | $7.60 | 1.50% |
| A Class (after waiver) | $1,000 | $1,016.40 | $8.59 | 1.70% |
| A Class (before waiver) | $1,000 | $1,016.40(2) | $9.86 | 1.95% |
| C Class (after waiver) | $1,000 | $1,012.40 | $12.36 | 2.45% |
| C Class (before waiver) | $1,000 | $1,012.40(2) | $13.62 | 2.70% |
| R Class (after waiver) | $1,000 | $1,016.10 | $9.86 | 1.95% |
| R Class (before waiver) | $1,000 | $1,016.10(2) | $11.12 | 2.20% |
| R6 Class (after waiver) | $1,000 | $1,019.80 | $5.57 | 1.10% |
| R6 Class (before waiver) | $1,000 | $1,019.80(2) | $6.84 | 1.35% |
Hypothetical | ||||
| Investor Class (after waiver) | $1,000 | $1,017.80 | $7.33 | 1.45% |
| Investor Class (before waiver) | $1,000 | $1,016.55 | $8.59 | 1.70% |
| Institutional Class (after waiver) | $1,000 | $1,018.80 | $6.33 | 1.25% |
| Institutional Class (before waiver) | $1,000 | $1,017.55 | $7.59 | 1.50% |
| A Class (after waiver) | $1,000 | $1,016.55 | $8.59 | 1.70% |
| A Class (before waiver) | $1,000 | $1,015.29 | $9.85 | 1.95% |
| C Class (after waiver) | $1,000 | $1,012.79 | $12.36 | 2.45% |
| C Class (before waiver) | $1,000 | $1,011.53 | $13.62 | 2.70% |
| R Class (after waiver) | $1,000 | $1,015.29 | $9.85 | 1.95% |
| R Class (before waiver) | $1,000 | $1,014.04 | $11.11 | 2.20% |
| R6 Class (after waiver) | $1,000 | $1,019.55 | $5.57 | 1.10% |
| R6 Class (before waiver) | $1,000 | $1,018.30 | $6.83 | 1.35% |
| (1) | Expenses are equal to the class's annualized expense ratio listed in the table above, multiplied by the average account value over the period, multiplied by 183, the number of days in the most recent fiscal half-year, divided by 365, to reflect the one-half year period. |
| (2) | Ending account value assumes the return earned after waiver and would have been lower if a portion of the management fee had not been waived. |
9
| Schedule of Investments |
NOVEMBER 30, 2014
| Shares | Value | ||||
| COMMON STOCKS — 97.4% | |||||
| Brazil — 10.7% | |||||
| BB Seguridade Participacoes SA | 375,300 | $ | 4,808,996 | ||
| BRF SA ADR | 155,130 | 4,034,931 | |||
| Cia Brasileira de Distribuicao Grupo Pao de Acucar ADR | 49,620 | 2,089,498 | |||
| Cielo SA | 252,800 | 4,254,913 | |||
| Estacio Participacoes SA | 298,700 | 3,265,762 | |||
Hypermarcas SA(1) | 472,800 | 3,200,006 | |||
| Itau Unibanco Holding SA ADR | 928,976 | 13,990,379 | |||
| Kroton Educacional SA | 785,652 | 5,430,394 | |||
| Lojas Americanas SA Preference Shares | 369,900 | 2,424,514 | |||
| Ultrapar Participacoes SA | 160,800 | 3,422,420 | |||
| 46,921,813 | |||||
| Chile — 0.4% | |||||
| SACI Falabella | 263,461 | 1,898,748 | |||
| China — 21.0% | |||||
Alibaba Group Holding Ltd. ADR(1) | 48,998 | 5,470,137 | |||
| Brilliance China Automotive Holdings Ltd. | 2,202,000 | 3,753,643 | |||
| China Mobile Ltd. | 784,000 | 9,659,418 | |||
| China Overseas Land & Investment Ltd. | 1,614,000 | 4,849,128 | |||
| CNOOC Ltd. | 4,041,000 | 5,908,893 | |||
| CSR Corp. Ltd., H Shares | 6,833,000 | 6,951,726 | |||
| ENN Energy Holdings Ltd. | 286,000 | 1,748,029 | |||
| Great Wall Motor Co. Ltd., H Shares | 1,214,000 | 6,120,680 | |||
| Industrial & Commercial Bank of China Ltd., H Shares | 10,549,645 | 7,155,299 | |||
| Ping An Insurance Group Co., H Shares | 886,000 | 7,431,649 | |||
| Shenzhou International Group Holdings Ltd. | 1,471,000 | 4,893,691 | |||
| Sinotrans Ltd., H Shares | 7,699,000 | 5,807,569 | |||
| Tencent Holdings Ltd. | 1,000,500 | 15,997,163 | |||
Vipshop Holdings Ltd. ADR(1) | 290,270 | 6,635,572 | |||
| 92,382,597 | |||||
| Colombia — 0.8% | |||||
Cemex Latam Holdings SA(1) | 440,850 | 3,360,024 | |||
| Egypt — 1.1% | |||||
| Commercial International Bank Egypt S.A.E. | 685,650 | 4,737,185 | |||
| Greece — 1.1% | |||||
| OPAP SA | 190,290 | 2,385,091 | |||
| Titan Cement Co. SA | 95,060 | 2,252,937 | |||
| 4,638,028 | |||||
| Hong Kong — 0.8% | |||||
Qihoo 360 Technology Co. Ltd. ADR(1) | 46,980 | 3,492,023 | |||
| India — 7.6% | |||||
| Bharti Infratel Ltd. | 876,875 | 4,241,303 | |||
10
| Shares | Value | ||||
| HCL Technologies Ltd. | 218,270 | $ | 5,847,089 | ||
| HDFC Bank Ltd. | 419,929 | 6,477,078 | |||
| ICICI Bank Ltd. ADR | 87,430 | 5,148,753 | |||
| ITC Ltd. | 764,614 | 4,474,572 | |||
| Larsen & Toubro Ltd. | 132,530 | 3,501,137 | |||
| Tata Motors Ltd. | 430,735 | 3,703,120 | |||
| 33,393,052 | |||||
| Indonesia — 3.2% | |||||
| PT Bank Rakyat Indonesia (Persero) Tbk | 4,937,000 | 4,662,318 | |||
| PT Matahari Department Store Tbk | 3,644,900 | 4,479,965 | |||
| PT Tower Bersama Infrastructure Tbk | 6,262,000 | 4,836,066 | |||
| 13,978,349 | |||||
| Malaysia — 1.5% | |||||
| Axiata Group Bhd | 2,153,100 | 4,493,980 | |||
| Sapurakencana Petroleum Bhd | 2,350,600 | 1,945,803 | |||
| 6,439,783 | |||||
| Mexico — 5.1% | |||||
Alsea SAB de CV(1) | 1,060,847 | 3,278,573 | |||
Cemex SAB de CV ADR(1) | 611,771 | 7,653,255 | |||
| Grupo Mexico SAB de CV | 1,170,510 | 3,841,268 | |||
| Infraestructura Energetica Nova SAB de CV | 748,310 | 4,392,459 | |||
Promotora y Operadora de Infraestructura SAB de CV(1) | 272,715 | 3,396,810 | |||
| 22,562,365 | |||||
| Peru — 1.8% | |||||
| Credicorp Ltd. | 48,134 | 7,973,878 | |||
| Philippines — 1.5% | |||||
| Universal Robina Corp. | 1,539,390 | 6,688,230 | |||
| Poland — 2.2% | |||||
Alior Bank SA(1) | 132,520 | 3,111,030 | |||
| Cyfrowy Polsat SA | 287,960 | 2,113,609 | |||
| Powszechny Zaklad Ubezpieczen SA | 30,189 | 4,306,114 | |||
| 9,530,753 | |||||
| Qatar — 0.6% | |||||
| Qatar National Bank SAQ | 44,810 | 2,815,296 | |||
| Russia — 2.1% | |||||
| Magnit PJSC GDR | 80,741 | 4,670,867 | |||
| MMC Norilsk Nickel OJSC ADR | 126,810 | 2,252,145 | |||
| NovaTek OAO GDR | 26,862 | 2,538,459 | |||
| 9,461,471 | |||||
| South Africa — 8.2% | |||||
| Aspen Pharmacare Holdings Ltd. | 176,952 | 6,391,187 | |||
| Capitec Bank Holdings Ltd. | 174,870 | 4,993,737 | |||
| Discovery Holdings Ltd. | 547,736 | 5,514,577 | |||
| Mr Price Group Ltd. | 272,760 | 5,816,877 | |||
| MTN Group Ltd. | 224,280 | 4,418,264 | |||
| Naspers Ltd., N Shares | 40,473 | 5,240,449 | |||
11
| Shares | Value | ||||
| Sasol Ltd. | 82,900 | $ | 3,457,925 | ||
| 35,833,016 | |||||
| South Korea — 12.0% | |||||
CJ Korea Express Co. Ltd.(1) | 40,530 | 7,188,181 | |||
| Coway Co. Ltd. | 53,980 | 4,209,461 | |||
| Daewoo International Corp. | 146,340 | 4,517,197 | |||
| Hyundai Development Co-Engineering & Construction | 167,590 | 5,369,778 | |||
LG Display Co. Ltd.(1) | 192,030 | 5,884,217 | |||
| LG Household & Health Care Ltd. | 5,900 | 3,317,568 | |||
Naturalendo Tech Co. Ltd.(1) | 60,722 | 2,932,106 | |||
| Samsung Electronics Co. Ltd. | 11,122 | 12,919,368 | |||
| Shinhan Financial Group Co. Ltd. | 93,360 | 4,179,481 | |||
SK Hynix, Inc.(1) | 51,690 | 2,241,712 | |||
| 52,759,069 | |||||
| Taiwan — 10.2% | |||||
| Chailease Holding Co. Ltd. | 1,448,000 | 3,719,719 | |||
| Ginko International Co. Ltd. | 311,000 | 3,451,927 | |||
| Hon Hai Precision Industry Co. Ltd. | 1,032,760 | 3,237,021 | |||
| Hota Industrial Manufacturing Co. Ltd. | 1,576,000 | 2,872,167 | |||
| Largan Precision Co. Ltd. | 64,000 | 4,932,224 | |||
| MediaTek, Inc. | 300,000 | 4,507,634 | |||
| Taiwan Semiconductor Manufacturing Co. Ltd. | 4,301,939 | 19,669,581 | |||
| TPK Holding Co. Ltd. | 350,000 | 2,250,586 | |||
| 44,640,859 | |||||
| Thailand — 2.8% | |||||
| CP ALL PCL | 2,264,200 | 3,034,104 | |||
| Kasikornbank PCL NVDR | 666,600 | 5,014,472 | |||
| Thaicom PCL | 3,609,900 | 4,067,803 | |||
| 12,116,379 | |||||
| Turkey — 2.7% | |||||
| BIM Birlesik Magazalar AS | 131,190 | 2,917,433 | |||
Pegasus Hava Tasimaciligi AS(1) | 160,820 | 2,345,623 | |||
| TAV Havalimanlari Holding AS | 522,593 | 4,469,824 | |||
| Ulker Biskuvi Sanayi AS | 294,110 | 2,211,055 | |||
| 11,943,935 | |||||
TOTAL COMMON STOCKS (Cost $337,125,418) | 427,566,853 | ||||
| TEMPORARY CASH INVESTMENTS — 3.0% | |||||
State Street Institutional Liquid Reserves Fund, Premier Class (Cost $12,991,941) | 12,991,941 | 12,991,941 | |||
TOTAL INVESTMENT SECURITIES — 100.4% (Cost $350,117,359) | 440,558,794 | ||||
| OTHER ASSETS AND LIABILITIES — (0.4)% | (1,607,836 | ) | |||
| TOTAL NET ASSETS — 100.0% | $ | 438,950,958 | |||
12
| MARKET SECTOR DIVERSIFICATION | ||
(as a % of net assets) | ||
| Financials | 23.2 | % |
| Information Technology | 20.5 | % |
| Consumer Discretionary | 15.6 | % |
| Industrials | 9.8 | % |
| Consumer Staples | 8.3 | % |
| Telecommunication Services | 7.2 | % |
| Materials | 4.4 | % |
| Energy | 4.0 | % |
| Health Care | 3.0 | % |
| Utilities | 1.4 | % |
| Cash and Equivalents* | 2.6 | % |
*Includes temporary cash investments and other assets and liabilities.
| NOTES TO SCHEDULE OF INVESTMENTS | ||
| ADR | - | American Depositary Receipt |
| GDR | - | Global Depositary Receipt |
| NVDR | - | Non-Voting Depositary Receipt |
| OJSC | - | Open Joint Stock Company |
| PJSC | - | Public Joint Stock Company |
(1) Non-income producing.
See Notes to Financial Statements.
13
| Statement of Assets and Liabilities |
| NOVEMBER 30, 2014 | |||
| Assets | |||
| Investment securities, at value (cost of $350,117,359) | $ | 440,558,794 | |
| Cash | 62,467 | ||
| Foreign currency holdings, at value (cost of $589,062) | 588,725 | ||
| Receivable for investments sold | 1,611,502 | ||
| Receivable for capital shares sold | 48,163 | ||
| Dividends and interest receivable | 197,191 | ||
| 443,066,842 | |||
| Liabilities | |||
| Payable for investments purchased | 3,436,671 | ||
| Payable for capital shares redeemed | 165,770 | ||
| Accrued management fees | 508,222 | ||
| Distribution and service fees payable | 5,221 | ||
| 4,115,884 | |||
| Net Assets | $ | 438,950,958 | |
| Net Assets Consist of: | |||
| Capital (par value and paid-in surplus) | $ | 407,498,591 | |
| Undistributed net investment income | 354,510 | ||
| Accumulated net realized loss | (59,332,200 | ) | |
| Net unrealized appreciation | 90,430,057 | ||
| $ | 438,950,958 | ||
| Net Assets | Shares Outstanding | Net Asset Value Per Share | ||||
| Investor Class, $0.01 Par Value | $393,357,403 | 43,693,126 | $9.00 | |||
| Institutional Class, $0.01 Par Value | $16,300,052 | 1,764,666 | $9.24 | |||
| A Class, $0.01 Par Value | $9,277,703 | 1,066,331 | $8.70* | |||
| C Class, $0.01 Par Value | $3,129,274 | 383,787 | $8.15 | |||
| R Class, $0.01 Par Value | $1,712,440 | 194,153 | $8.82 | |||
| R6 Class, $0.01 Par Value | $15,174,086 | 1,640,583 | $9.25 | |||
*Maximum offering price $9.23 (net asset value divided by 0.9425).
See Notes to Financial Statements.
14
| Statement of Operations |
| YEAR ENDED NOVEMBER 30, 2014 | |||
| Investment Income (Loss) | |||
| Income: | |||
| Dividends (net of foreign taxes withheld of $895,601) | $ | 7,762,431 | |
| Interest | 690 | ||
| 7,763,121 | |||
| Expenses: | |||
| Management fees | 7,483,290 | ||
| Distribution and service fees: | |||
| A Class | 27,613 | ||
| C Class | 33,035 | ||
| R Class | 7,258 | ||
| Directors' fees and expenses | 1,609 | ||
| Other expenses | 8,653 | ||
| 7,561,458 | |||
| Fees waived | (1,112,028 | ) | |
| 6,449,430 | |||
| Net investment income (loss) | 1,313,691 | ||
| Realized and Unrealized Gain (Loss) | |||
| Net realized gain (loss) on: | |||
| Investment transactions | 38,571,132 | ||
| Foreign currency transactions | (574,882 | ) | |
| 37,996,250 | |||
| Change in net unrealized appreciation (depreciation) on: | |||
| Investments | (31,477,982 | ) | |
| Translation of assets and liabilities in foreign currencies | (42 | ) | |
| (31,478,024 | ) | ||
| Net realized and unrealized gain (loss) | 6,518,226 | ||
| Net Increase (Decrease) in Net Assets Resulting from Operations | $ | 7,831,917 | |
See Notes to Financial Statements.
15
| Statement of Changes in Net Assets |
| YEARS ENDED NOVEMBER 30, 2014 AND NOVEMBER 30, 2013 | ||||||
| Increase (Decrease) in Net Assets | November 30, 2014 | November 30, 2013 | ||||
| Operations | ||||||
| Net investment income (loss) | $ | 1,313,691 | $ | 805,903 | ||
| Net realized gain (loss) | 37,996,250 | 36,603,521 | ||||
| Change in net unrealized appreciation (depreciation) | (31,478,024 | ) | (6,393,203 | ) | ||
| Net increase (decrease) in net assets resulting from operations | 7,831,917 | 31,016,221 | ||||
| Distributions to Shareholders | ||||||
| From net investment income: | ||||||
| Investor Class | (1,395,788 | ) | (1,646,742 | ) | ||
| Institutional Class | (127,266 | ) | (181,997 | ) | ||
| A Class | (30,576 | ) | (15,732 | ) | ||
| C Class | (2,582 | ) | — | |||
| R Class | (2,497 | ) | — | |||
| R6 Class | (117 | ) | — | |||
| Decrease in net assets from distributions | (1,558,826 | ) | (1,844,471 | ) | ||
| Capital Share Transactions | ||||||
| Net increase (decrease) in net assets from capital share transactions (Note 5) | (37,366,838 | ) | (57,978,517 | ) | ||
| Redemption Fees | ||||||
| Increase in net assets from redemption fees | 13,217 | 24,913 | ||||
| Net increase (decrease) in net assets | (31,080,530 | ) | (28,781,854 | ) | ||
| Net Assets | ||||||
| Beginning of period | 470,031,488 | 498,813,342 | ||||
| End of period | $ | 438,950,958 | $ | 470,031,488 | ||
| Undistributed net investment income | $ | 354,510 | $ | 101,931 | ||
See Notes to Financial Statements.
16
| Notes to Financial Statements |
NOVEMBER 30, 2014
1. Organization
American Century World Mutual Funds, Inc. (the corporation) is registered under the Investment Company Act of 1940, as amended (the 1940 Act), as an open-end management investment company and is organized as a Maryland corporation. Emerging Markets Fund (the fund) is one fund in a series issued by the corporation. The fund is diversified as defined under the 1940 Act. The fund’s investment objective is to seek capital growth.
The fund offers the Investor Class, the Institutional Class, the A Class, the C Class, the R Class and the R6 Class. The A Class may incur an initial sales charge. The A Class and C Class may be subject to a contingent deferred sales charge. The share classes differ principally in their respective sales charges and distribution and shareholder servicing expenses and arrangements. The Institutional Class and R6 Class shareholders do not require the same level of shareholder and administrative services from American Century Investment Management, Inc. (ACIM) (the investment advisor) as shareholders of other classes. In addition, financial intermediaries do not receive any service, distribution or administrative fees for the R6 Class. As a result, the Institutional Class and R6 Class are charged lower unified management fees. Sale of the R6 Class commenced on July 26, 2013.
2. Significant Accounting Policies
The following is a summary of significant accounting policies consistently followed by the fund in preparation of its financial statements. The fund is an investment company and follows accounting and reporting guidance in accordance with accounting principles generally accepted in the United States of America. This may require management to make certain estimates and assumptions at the date of the financial statements. Actual results could differ from these estimates. Management evaluated the impact of events or transactions occurring through the date the financial statements were issued that would merit recognition or disclosure.
Investment Valuations — The fund determines the fair value of its investments and computes its net asset value per share at the close of regular trading (usually 4 p.m. Eastern time) on the New York Stock Exchange (NYSE) on each day the NYSE is open. The Board of Directors has adopted valuation policies and procedures to guide the investment advisor in the fund’s investment valuation process and to provide methodologies for the oversight of the fund’s pricing function.
Equity securities that are listed or traded on a domestic securities exchange are valued at the last reported sales price or at the official closing price as provided by the exchange. Equity securities traded on foreign securities exchanges are generally valued at the closing price of such securities on the exchange where primarily traded or at the close of the NYSE, if that is earlier. If no last sales price is reported, or if local convention or regulation so provides, the mean of the latest bid and asked prices may be used. Securities traded over-the-counter are valued at the mean of the latest bid and asked prices, the last sales price, or the official closing price. Equity securities initially expressed in local currencies are translated into U.S. dollars at the mean of the appropriate currency exchange rate at the close of the NYSE as provided by an independent pricing service.
Fixed income securities maturing within 60 days at the time of purchase may be valued at cost, plus or minus any amortized discount or premium or at the evaluated mean as provided by an independent pricing service. Evaluated mean prices are commonly derived through utilization of market models, which may consider, among other factors: trade data, quotations from dealers and active market makers, relevant yield curve and spread data, related sector levels, creditworthiness, trade data or market information on comparable securities, and other relevant security specific information.
Open-end management investment companies are valued at the reported net asset value per share. Repurchase agreements are valued at cost, which approximates fair value.
17
If the fund determines that the market price for an investment is not readily available or the valuation methods mentioned above do not reflect an investment’s fair value, such investment is valued as determined in good faith by the Board of Directors or its delegate, in accordance with policies and procedures adopted by the Board of Directors. In its determination of fair value, the fund may review several factors including, but not limited to, market information regarding the specific investment or comparable investments and correlation with other investment types, futures indices or general market indicators. Circumstances that may cause the fund to use these procedures to value an investment include, but are not limited to: an investment has been declared in default or is distressed; trading in a security has been suspended during the trading day or a security is not actively trading on its principal exchange; prices received from a regular pricing source are deemed unreliable; or there is a foreign market holiday and no trading occurred.
The fund monitors for significant events occurring after the close of an investment’s primary exchange but before the fund’s net asset value per share is determined. Significant events may include, but are not limited to: corporate announcements and transactions; governmental action and political unrest that could impact a specific investment or an investment sector; or armed conflicts, natural disasters and similar events that could affect investments in a specific country or region. The fund also monitors for significant fluctuations between domestic and foreign markets, as evidenced by the U.S. market or such other indicators that the Board of Directors, or its delegate, deems appropriate. If significant fluctuations in foreign markets are identified, the fund may apply a model-derived factor to the closing price of equity securities traded on foreign securities exchanges. The factor is based on observable market data as provided by an independent pricing service.
Security Transactions — Security transactions are accounted for as of the trade date. Net realized gains and losses are determined on the identified cost basis, which is also used for federal income tax purposes.
Investment Income — Dividend income less foreign taxes withheld, if any, is recorded as of the ex-dividend date. Distributions received on securities that represent a return of capital or long-term capital gain are recorded as a reduction of cost of investments and/or as a realized gain. The fund may estimate the components of distributions received that may be considered nontaxable distributions or long-term capital gain distributions for income tax purposes. Interest income is recorded on the accrual basis and includes accretion of discounts and amortization of premiums.
Foreign Currency Translations — All assets and liabilities initially expressed in foreign currencies are translated into U.S. dollars at prevailing exchange rates at period end. The fund may enter into spot foreign currency exchange contracts to facilitate transactions denominated in a foreign currency. Purchases and sales of investment securities, dividend and interest income, spot foreign currency exchange contracts, and expenses are translated at the rates of exchange prevailing on the respective dates of such transactions. Net realized and unrealized foreign currency exchange gains or losses related to investment securities are a component of net realized gain (loss) on investment transactions and change in net unrealized appreciation (depreciation) on investments, respectively.
Repurchase Agreements — The fund may enter into repurchase agreements with institutions that ACIM has determined are creditworthy pursuant to criteria adopted by the Board of Directors. The fund requires that the collateral, represented by securities, received in a repurchase transaction be transferred to the custodian in a manner sufficient to enable the fund to obtain those securities in the event of a default under the repurchase agreement. ACIM monitors, on a daily basis, the securities transferred to ensure the value, including accrued interest, of the securities under each repurchase agreement is equal to or greater than amounts owed to the fund under each repurchase agreement.
Joint Trading Account — Pursuant to an Exemptive Order issued by the Securities and Exchange Commission, the fund, along with certain other funds in the American Century Investments family of funds, may transfer uninvested cash balances into a joint trading account. These balances are invested in one or more repurchase agreements that are collateralized by U.S. Treasury or Agency obligations.
Income Tax Status — It is the fund’s policy to distribute substantially all net investment income and net realized gains to shareholders and to otherwise qualify as a regulated investment company under provisions of the Internal Revenue Code. Accordingly, no provision has been made for income taxes. The fund files U.S. federal, state, local and non-U.S. tax returns as applicable. The fund's tax returns are subject to examination by the relevant taxing authority until expiration of the applicable statute of limitations, which is generally three years from the date of filing but can be longer in certain jurisdictions. At this time, management believes there are no uncertain tax positions which, based on their technical merit, would not be sustained upon examination and for which it is reasonably possible that the total amounts of unrecognized tax benefits will significantly change in the next twelve months.
18
Multiple Class — All shares of the fund represent an equal pro rata interest in the net assets of the class to which such shares belong, and have identical voting, dividend, liquidation and other rights and the same terms and conditions, except for class specific expenses and exclusive rights to vote on matters affecting only individual classes. Income, non-class specific expenses, and realized and unrealized capital gains and losses of the fund are allocated to each class of shares based on their relative net assets.
Distributions to Shareholders — Distributions from net investment income and net realized gains, if any, are generally declared and paid annually. The fund may make distributions on a more frequent basis to comply with the distribution requirements of the Internal Revenue Code, in all events in a manner consistent with provisions of the 1940 Act.
Redemption Fees — The fund may impose a 2.00% redemption fee on shares held less than 60 days. The fee may not be applicable to all classes. The redemption fee is retained by the fund and helps cover transaction costs that long-term investors may bear when the fund sells securities to meet investor redemptions.
Indemnifications — Under the corporation’s organizational documents, its officers and directors are indemnified against certain liabilities arising out of the performance of their duties to the fund. In addition, in the normal course of business, the fund enters into contracts that provide general indemnifications. The maximum exposure under these arrangements is unknown as this would involve future claims that may be made against a fund. The risk of material loss from such claims is considered by management to be remote.
3. Fees and Transactions with Related Parties
Certain officers and directors of the corporation are also officers and/or directors of American Century Companies, Inc. (ACC). The corporation’s investment advisor, ACIM, the corporation's distributor, American Century Investment Services, Inc. (ACIS), and the corporation’s transfer agent, American Century Services, LLC, are wholly owned, directly or indirectly, by ACC. Various funds issued by American Century Asset Allocation Portfolios, Inc. and American Century Strategic Asset Allocations, Inc. own, in aggregate, 35% of the shares of the fund. Related parties do not invest in the fund for the purpose of exercising management or control.
Management Fees — The corporation has entered into a management agreement with ACIM, under which ACIM provides the fund with investment advisory and management services in exchange for a single, unified management fee (the fee) per class. The agreement provides that all expenses of managing and operating the fund, except distribution and service fees, brokerage expenses, taxes, interest, fees and expenses of the independent directors (including legal counsel fees), and extraordinary expenses, will be paid by ACIM. The fee is computed and accrued daily based on each class’s daily net assets and paid monthly in arrears. The rate of the fee is determined by applying a fee rate calculation formula. This formula takes into account the fund’s assets as well as certain assets, if any, of other clients of the investment advisor outside the American Century Investments family of funds (such as subadvised funds and separate accounts) that have very similar investment teams and investment strategies (strategy assets). The strategy assets of the fund also include the assets of NT Emerging Markets Fund, one fund in a series issued by the corporation. The annual management fee schedule ranges from 1.250% to 1.850% for the Investor Class, A Class, C Class and R Class. The annual management fee schedule ranges from 1.050% to 1.650% for the Institutional Class and 0.900% to 1.500% for the R6 Class. During the year ended November 30, 2014, the investment advisor voluntarily agreed to waive 0.250% of its management fee. The investment advisor expects the fee waiver to continue through March 31, 2015, and cannot terminate it without the approval of the Board of Directors. The total amount of the waiver for each class for the year ended November 30, 2014 was $993,231, $68,231, $27,613, $8,259, $3,629 and $11,065 for the Investor Class, Institutional Class, A Class, C Class, R Class and R6 Class, respectively. The effective annual management fee before waiver for each class for the year ended November 30, 2014 was 1.70% for the Investor Class, A Class, C Class and R Class, 1.50% for the Institutional Class and 1.35% for the R6 Class. The effective annual management fee after waiver for each class for the year ended November 30, 2014 was 1.45% for the Investor Class, A Class, C Class and R Class, 1.25% for the Institutional Class and 1.10% for the R6 Class.
Distribution and Service Fees — The Board of Directors has adopted a separate Master Distribution and Individual Shareholder Services Plan for each of the A Class, C Class and R Class (collectively the plans), pursuant to Rule 12b-1 of the 1940 Act. The plans provide that the A Class will pay ACIS an annual distribution and service fee of 0.25%. The plans provide that the C Class will pay ACIS an annual distribution and service fee of 1.00%, of which 0.25% is paid for individual shareholder services and 0.75% is paid for distribution services. The plans provide that the R Class will pay ACIS an annual distribution and service fee of 0.50%. The fees are computed and accrued daily based on each class’s daily net assets and paid monthly in arrears.
19
The fees are used to pay financial intermediaries for distribution and individual shareholder services. Fees incurred under the plans during the year ended November 30, 2014 are detailed in the Statement of Operations.
Directors' Fees and Expenses — The Board of Directors is responsible for overseeing the investment advisor’s management and operations of the fund. The directors receive detailed information about the fund and its investment advisor regularly throughout the year, and meet at least quarterly with management of the investment advisor to review reports about fund operations. Fees and expenses incurred in conjunction with the directors during the year ended November 30, 2014 are detailed in the Statement of Operations. The fund’s officers do not receive compensation from the fund.
4. Investment Transactions
Purchases and sales of investment securities, excluding short-term investments, for the year ended November 30, 2014 were $328,619,232 and $378,167,085, respectively.
5. Capital Share Transactions
Transactions in shares of the fund were as follows:
Year ended November 30, 2014 | Year ended November 30, 2013(1) | |||||||||
| Shares | Amount | Shares | Amount | |||||||
| Investor Class/Shares Authorized | 400,000,000 | 400,000,000 | ||||||||
| Sold | 6,046,004 | $ | 53,257,554 | 7,313,071 | $ | 62,218,485 | ||||
| Issued in reinvestment of distributions | 163,232 | 1,369,513 | 186,256 | 1,607,394 | ||||||
| Redeemed | (10,001,738 | ) | (88,028,807 | ) | (14,123,267 | ) | (121,216,351 | ) | ||
| (3,792,502 | ) | (33,401,740 | ) | (6,623,940 | ) | (57,390,472 | ) | |||
| Institutional Class/Shares Authorized | 40,000,000 | 40,000,000 | ||||||||
| Sold | 502,581 | 4,463,970 | 967,833 | 8,551,403 | ||||||
| Issued in reinvestment of distributions | 14,812 | 127,234 | 20,606 | 181,954 | ||||||
| Redeemed | (2,323,383 | ) | (21,877,486 | ) | (750,390 | ) | (6,606,195 | ) | ||
| (1,805,990 | ) | (17,286,282 | ) | 238,049 | 2,127,162 | |||||
| A Class/Shares Authorized | 40,000,000 | 40,000,000 | ||||||||
| Sold | 800,095 | 6,886,332 | 756,334 | 6,291,182 | ||||||
| Issued in reinvestment of distributions | 3,655 | 29,682 | 1,779 | 14,890 | ||||||
| Redeemed | (1,084,971 | ) | (9,426,423 | ) | (1,109,049 | ) | (9,338,269 | ) | ||
| (281,221 | ) | (2,510,409 | ) | (350,936 | ) | (3,032,197 | ) | |||
| C Class/Shares Authorized | 5,000,000 | 5,000,000 | ||||||||
| Sold | 56,096 | 451,926 | 134,704 | 1,071,648 | ||||||
| Issued in reinvestment of distributions | 322 | 2,462 | — | — | ||||||
| Redeemed | (113,862 | ) | (900,439 | ) | (133,416 | ) | (1,038,723 | ) | ||
| (57,444 | ) | (446,051 | ) | 1,288 | 32,925 | |||||
| R Class/Shares Authorized | 10,000,000 | 10,000,000 | ||||||||
| Sold | 86,235 | 740,864 | 68,244 | 581,011 | ||||||
| Issued in reinvestment of distributions | 303 | 2,497 | — | — | ||||||
| Redeemed | (22,314 | ) | (189,885 | ) | (38,453 | ) | (321,946 | ) | ||
| 64,224 | 553,476 | 29,791 | 259,065 | |||||||
| R6 Class/Shares Authorized | 50,000,000 | 50,000,000 | ||||||||
| Sold | 1,702,690 | 16,329,589 | 2,955 | 25,000 | ||||||
| Issued in reinvestment of distributions | 14 | 117 | — | — | ||||||
| Redeemed | (65,076 | ) | (605,538 | ) | — | — | ||||
| 1,637,628 | 15,724,168 | 2,955 | 25,000 | |||||||
| Net increase (decrease) | (4,235,305 | ) | $ | (37,366,838 | ) | (6,702,793 | ) | $ | (57,978,517 | ) |
| (1) | July 26, 2013 (commencement of sale) through November 30, 2013 for the R6 Class. |
20
6. Fair Value Measurements
The fund’s investments valuation process is based on several considerations and may use multiple inputs to determine the fair value of the investments held by the fund. In conformity with accounting principles generally accepted in the United States of America, the inputs used to determine a valuation are classified into three broad levels.
| • | Level 1 valuation inputs consist of unadjusted quoted prices in an active market for identical investments. |
| • | Level 2 valuation inputs consist of direct or indirect observable market data (including quoted prices for comparable investments, evaluations of subsequent market events, interest rates, prepayment speeds, credit risk, etc.). These inputs also consist of quoted prices for identical investments initially expressed in local currencies that are adjusted through translation into U.S. dollars. |
| • | Level 3 valuation inputs consist of unobservable data (including a fund’s own assumptions). |
The level classification is based on the lowest level input that is significant to the fair valuation measurement. The valuation inputs are not necessarily an indication of the risks associated with investing in these securities or other financial instruments. There were no significant transfers between levels during the period.
The following is a summary of the level classifications as of period end. The Schedule of Investments provides additional information on the fund’s portfolio holdings.
| Level 1 | Level 2 | Level 3 | ||||||
| Assets | ||||||||
| Investment Securities | ||||||||
| Common Stocks | ||||||||
| Brazil | $ | 20,114,808 | $ | 26,807,005 | — | |||
| China | 12,105,709 | 80,276,888 | — | |||||
| Hong Kong | 3,492,023 | — | — | |||||
| India | 5,148,753 | 28,244,299 | — | |||||
| Mexico | 7,653,255 | 14,909,110 | — | |||||
| Peru | 7,973,878 | — | — | |||||
| Other Countries | — | 220,841,125 | — | |||||
| Temporary Cash Investments | 12,991,941 | — | — | |||||
| $ | 69,480,367 | $ | 371,078,427 | — | ||||
7. Risk Factors
There are certain risks involved in investing in foreign securities. These risks include those resulting from future adverse political, social and economic developments, fluctuations in currency exchange rates, the possible imposition of exchange controls, and other foreign laws or restrictions. Investing in emerging markets may accentuate these risks.
8. Federal Tax Information
The tax character of distributions paid during the years ended November 30, 2014 and November 30, 2013 were as follows:
| 2014 | 2013 | |||||
| Distributions Paid From | ||||||
| Ordinary income | $ | 1,558,826 | $ | 1,844,471 | ||
| Long-term capital gains | — | — | ||||
The book-basis character of distributions made during the year from net investment income or net realized gains may differ from their ultimate characterization for federal income tax purposes. These differences reflect the differing character of certain income items and net realized gains and losses for financial statement and tax purposes, and may result in reclassification among certain capital accounts on the financial statements.
21
As of November 30, 2014, the federal tax cost of investments and the components of distributable earnings on a tax-basis were as follows:
| Federal tax cost of investments | $ | 350,419,783 | |
| Gross tax appreciation of investments | $ | 101,233,482 | |
| Gross tax depreciation of investments | (11,094,471 | ) | |
| Net tax appreciation (depreciation) of investments | 90,139,011 | ||
| Net tax appreciation (depreciation) on translation of assets and liabilities in foreign currencies | (11,378 | ) | |
| Net tax appreciation (depreciation) | $ | 90,127,633 | |
| Undistributed ordinary income | $ | 374,716 | |
| Accumulated short-term capital losses | $ | (57,815,598 | ) |
| Post-October capital loss deferral | $ | (1,234,384 | ) |
The difference between book-basis and tax-basis unrealized appreciation (depreciation) is attributable primarily to the tax deferral of losses on wash sales.
Accumulated capital losses represent net capital loss carryovers that may be used to offset future realized capital gains for federal income tax purposes. Future capital loss carryover utilization in any given year may be subject to Internal Revenue Code limitations. Capital loss carryovers expire in 2017.
Loss deferrals represent certain qualified losses that the fund has elected to treat as having been incurred in the following fiscal year for federal income tax purposes.
22
| Financial Highlights |
| For a Share Outstanding Throughout the Years Ended November 30 (except as noted) | |||||||||||||||
| Per-Share Data | Ratios and Supplemental Data | ||||||||||||||
| Income From Investment Operations: | Ratio to Average Net Assets of: | ||||||||||||||
| Net Asset Value, Beginning of Period | Net Investment Income (Loss)(1) | Net Realized and Unrealized Gain (Loss) | Total From Investment Operations | Distributions From Net Investment Income | Net Asset Value, End of Period | Total Return(2) | Operating Expenses | Operating Expenses (before expense waiver) | Net Investment Income (Loss) | Net Investment Income (Loss) (before expense waiver) | Portfolio Turnover Rate | Net Assets, End of Period (in thousands) | |||
| Investor Class | |||||||||||||||
| 2014 | $8.87 | 0.03 | 0.13 | 0.16 | (0.03) | $9.00 | 1.84% | 1.45% | 1.70% | 0.29% | 0.04% | 74% | $393,357 | ||
| 2013 | $8.36 | 0.01 | 0.53 | 0.54 | (0.03) | $8.87 | 6.48% | 1.63% | 1.72% | 0.17% | 0.08% | 68% | $421,274 | ||
| 2012 | $7.38 | 0.02 | 0.96 | 0.98 | — | $8.36 | 13.28% | 1.74% | 1.74% | 0.29% | 0.29% | 85% | $452,331 | ||
| 2011 | $8.46 | 0.01 | (1.09) | (1.08) | — | $7.38 | (12.77)% | 1.71% | 1.71% | 0.17% | 0.17% | 71% | $435,079 | ||
| 2010 | $7.28 | —(3) | 1.18 | 1.18 | — | $8.46 | 16.21% | 1.72% | 1.72% | (0.02)% | (0.02)% | 87% | $583,978 | ||
| Institutional Class | |||||||||||||||
| 2014 | $9.09 | 0.05 | 0.14 | 0.19 | (0.04) | $9.24 | 2.07% | 1.25% | 1.50% | 0.49% | 0.24% | 74% | $16,300 | ||
| 2013 | $8.56 | 0.03 | 0.55 | 0.58 | (0.05) | $9.09 | 6.77% | 1.43% | 1.52% | 0.37% | 0.28% | 68% | $32,452 | ||
| 2012 | $7.56 | 0.04 | 0.97 | 1.01 | (0.01) | $8.56 | 13.43% | 1.54% | 1.54% | 0.49% | 0.49% | 85% | $28,536 | ||
| 2011 | $8.65 | 0.03 | (1.12) | (1.09) | — | $7.56 | (12.60)% | 1.51% | 1.51% | 0.37% | 0.37% | 71% | $29,695 | ||
| 2010 | $7.43 | 0.02 | 1.20 | 1.22 | — | $8.65 | 16.42% | 1.52% | 1.52% | 0.18% | 0.18% | 87% | $40,969 | ||
23
| For a Share Outstanding Throughout the Years Ended November 30 (except as noted) | |||||||||||||||
| Per-Share Data | Ratios and Supplemental Data | ||||||||||||||
| Income From Investment Operations: | Ratio to Average Net Assets of: | ||||||||||||||
| Net Asset Value, Beginning of Period | Net Investment Income (Loss)(1) | Net Realized and Unrealized Gain (Loss) | Total From Investment Operations | Distributions From Net Investment Income | Net Asset Value, End of Period | Total Return(2) | Operating Expenses | Operating Expenses (before expense waiver) | Net Investment Income (Loss) | Net Investment Income (Loss) (before expense waiver) | Portfolio Turnover Rate | Net Assets, End of Period (in thousands) | |||
| A Class | |||||||||||||||
| 2014 | $8.59 | 0.01 | 0.12 | 0.13 | (0.02) | $8.70 | 1.59% | 1.70% | 1.95% | 0.04% | (0.21)% | 74% | $9,278 | ||
| 2013 | $8.09 | (0.01) | 0.52 | 0.51 | (0.01) | $8.59 | 6.30% | 1.88% | 1.97% | (0.08)% | (0.17)% | 68% | $11,575 | ||
| 2012 | $7.16 | —(3) | 0.93 | 0.93 | — | $8.09 | 12.99% | 1.99% | 1.99% | 0.04% | 0.04% | 85% | $13,745 | ||
| 2011 | $8.23 | (0.01) | (1.06) | (1.07) | — | $7.16 | (13.00)% | 1.96% | 1.96% | (0.08)% | (0.08)% | 71% | $15,339 | ||
| 2010 | $7.10 | (0.02) | 1.15 | 1.13 | — | $8.23 | 15.92% | 1.97% | 1.97% | (0.27)% | (0.27)% | 87% | $29,572 | ||
| C Class | |||||||||||||||
| 2014 | $8.09 | (0.06) | 0.13 | 0.07 | (0.01) | $8.15 | 0.82% | 2.45% | 2.70% | (0.71)% | (0.96)% | 74% | $3,129 | ||
| 2013 | $7.67 | (0.06) | 0.48 | 0.42 | — | $8.09 | 5.48% | 2.63% | 2.72% | (0.83)% | (0.92)% | 68% | $3,571 | ||
| 2012 | $6.84 | (0.05) | 0.88 | 0.83 | — | $7.67 | 12.13% | 2.74% | 2.74% | (0.71)% | (0.71)% | 85% | $3,376 | ||
| 2011 | $7.93 | (0.07) | (1.02) | (1.09) | — | $6.84 | (13.75)% | 2.71% | 2.71% | (0.83)% | (0.83)% | 71% | $3,896 | ||
| 2010 | $6.89 | (0.07) | 1.11 | 1.04 | — | $7.93 | 15.09% | 2.72% | 2.72% | (1.02)% | (1.02)% | 87% | $5,257 | ||
| R Class | |||||||||||||||
| 2014 | $8.72 | (0.02) | 0.14 | 0.12 | (0.02) | $8.82 | 1.38% | 1.95% | 2.20% | (0.21)% | (0.46)% | 74% | $1,712 | ||
| 2013 | $8.23 | (0.02) | 0.51 | 0.49 | — | $8.72 | 5.95% | 2.13% | 2.22% | (0.33)% | (0.42)% | 68% | $1,133 | ||
| 2012 | $7.30 | (0.02) | 0.95 | 0.93 | — | $8.23 | 12.74% | 2.24% | 2.24% | (0.21)% | (0.21)% | 85% | $824 | ||
| 2011 | $8.42 | (0.03) | (1.09) | (1.12) | — | $7.30 | (13.30)% | 2.21% | 2.21% | (0.33)% | (0.33)% | 71% | $631 | ||
| 2010 | $7.28 | (0.04) | 1.18 | 1.14 | — | $8.42 | 15.66% | 2.22% | 2.22% | (0.52)% | (0.52)% | 87% | $828 | ||
24
| For a Share Outstanding Throughout the Years Ended November 30 (except as noted) | |||||||||||||||
| Per-Share Data | Ratios and Supplemental Data | ||||||||||||||
| Income From Investment Operations: | Ratio to Average Net Assets of: | ||||||||||||||
| Net Asset Value, Beginning of Period | Net Investment Income (Loss)(1) | Net Realized and Unrealized Gain (Loss) | Total From Investment Operations | Distributions From Net Investment Income | Net Asset Value, End of Period | Total Return(2) | Operating Expenses | Operating Expenses (before expense waiver) | Net Investment Income (Loss) | Net Investment Income (Loss) (before expense waiver) | Portfolio Turnover Rate | Net Assets, End of Period (in thousands) | |||
| R6 Class | |||||||||||||||
| 2014 | $9.09 | —(3) | 0.20 | 0.20 | (0.04) | $9.25 | 2.23% | 1.10% | 1.35% | 0.64% | 0.39% | 74% | $15,174 | ||
2013(4) | $8.46 | —(3) | 0.63 | 0.63 | — | $9.09 | 7.45% | 1.12%(5) | 1.37%(5) | 0.14%(5) | (0.11)%(5) | 68%(6) | $27 | ||
| Notes to Financial Highlights | |
| (1) | Computed using average shares outstanding throughout the period. |
| (2) | Total returns are calculated based on the net asset value of the last business day and do not reflect applicable sales charges, if any. Total returns for periods less than one year are not annualized. |
| (3) | Per-share amount was less than $0.005. |
| (4) | July 26, 2013 (commencement of sale) through November 30, 2013. |
| (5) | Annualized. |
| (6) | Portfolio turnover is calculated at the fund level. Percentage indicated was calculated for the year ended November 30, 2013. |
See Notes to Financial Statements.
25
| Report of Independent Registered Public Accounting Firm |
To the Board of Directors and Shareholders of
American Century World Mutual Funds, Inc.:
We have audited the accompanying statement of assets and liabilities, including the schedule of investments, of Emerging Markets Fund (the “Fund”), one of the funds constituting American Century World Mutual Funds, Inc., as of November 30, 2014, and the related statement of operations for the year then ended, the statements of changes in net assets for each of the two years in the period then ended, and the financial highlights for each of the periods presented. These financial statements and financial highlights are the responsibility of the Fund's management. Our responsibility is to express an opinion on these financial statements and financial highlights based on our audits.
We conducted our audits in accordance with the standards of the Public Company Accounting Oversight Board (United States). Those standards require that we plan and perform the audit to obtain reasonable assurance about whether the financial statements and financial highlights are free of material misstatement. The Fund is not required to have, nor were we engaged to perform, an audit of its internal control over financial reporting. Our audits included consideration of internal control over financial reporting as a basis for designing audit procedures that are appropriate in the circumstances, but not for the purpose of expressing an opinion on the effectiveness of the Fund's internal control over financial reporting. Accordingly, we express no such opinion. An audit also includes examining, on a test basis, evidence supporting the amounts and disclosures in the financial statements, assessing the accounting principles used and significant estimates made by management, as well as evaluating the overall financial statement presentation. Our procedures included confirmation of securities owned as of November 30, 2014, by correspondence with the custodian and brokers; where replies were not received from brokers, we performed other auditing procedures. We believe that our audits provide a reasonable basis for our opinion.
In our opinion, the financial statements and financial highlights referred to above present fairly, in all material respects, the financial position of Emerging Markets Fund of American Century World Mutual Funds, Inc. as of November 30, 2014, the results of its operations for the year then ended, the changes in its net assets for each of the two years in the period then ended, and the financial highlights for each of the periods presented, in conformity with accounting principles generally accepted in the United States of America.
DELOITTE & TOUCHE LLP
Kansas City, Missouri
January 16, 2015
26
| Management |
The Board of Directors
The individuals listed below serve as directors of the funds. Each director will continue to serve in this capacity until death, retirement, resignation or removal from office. The board has adopted a mandatory retirement age for directors who are not “interested persons,” as that term is defined in the Investment Company Act (independent directors). Independent directors shall retire by December 31 of the year in which they reach their 75th birthday.
Mr. Thomas is an “interested person” because he currently serves as President and Chief Executive Officer of American Century Companies, Inc. (ACC), the parent company of American Century Investment Management, Inc. (ACIM or the advisor). Mr. Fink is treated as an “interested person” because of his recent employment with ACC and American Century Services, LLC (ACS). The other directors (more than three-fourths of the total number) are independent. They are not employees, directors or officers of, and have no financial interest in, ACC or any of its wholly owned, direct or indirect, subsidiaries, including ACIM, American Century Investment Services, Inc. (ACIS) and ACS, and they do not have any other affiliations, positions or relationships that would cause them to be considered “interested persons” under the Investment Company Act. The directors serve in this capacity for seven (in the case of Mr. Thomas, 15) registered investment companies in the American Century Investments family of funds.
The following table presents additional information about the directors. The mailing address for each director is 4500 Main Street, Kansas City, Missouri 64111.
Name (Year of Birth) | Position(s) Held with Funds | Length of Time Served | Principal Occupation(s) During Past 5 Years | Number of American Century Portfolios Overseen by Director | Other Directorships Held During Past 5 Years |
| Independent Directors | |||||
Thomas A. Brown (1940) | Director | Since 1980 | Managing Member, Associated Investments, LLC (real estate investment company); Brown Cascade Properties, LLC (real estate investment company) (2001 to 2009) | 73 | None |
Andrea C. Hall (1945) | Director | Since 1997 | Retired | 73 | None |
Jan M. Lewis (1957) | Director | Since 2011 | Retired; President and Chief Executive Officer, Catholic Charities of Northeast Kansas (human services organization) (2006 to 2013) | 73 | None |
James A. Olson (1942) | Director and Chairman of the Board | Since 2007 (Chairman since 2014) | Member, Plaza Belmont LLC (private equity fund manager) | 73 | Saia, Inc. (2002 to 2012) and EPR Properties (2003 to 2013) |
27
Name (Year of Birth) | Position(s) Held with Funds | Length of Time Served | Principal Occupation(s) During Past 5 Years | Number of American Century Portfolios Overseen by Director | Other Directorships Held During Past 5 Years |
| Independent Directors | |||||
M. Jeannine Strandjord (1945) | Director | Since 1994 | Retired | 73 | Euronet Worldwide Inc.; MGP Ingredients, Inc.; Charming Shoppes, Inc. (2006 to 2010); and DST Systems Inc. (1996 to 2012) |
John R. Whitten (1946) | Director | Since 2008 | Retired | 73 | Rudolph Technologies, Inc. |
Stephen E. Yates (1948) | Director | Since 2012 | Retired; Executive Vice President, Technology & Operations, KeyCorp. (computer services) (2004 to 2010) | 73 | Applied Industrial Technologies, Inc. (2001 to 2010) |
| Interested Directors | |||||
Barry Fink (1955) | Director | Since 2012 | Retired; Executive Vice President, ACC (September 2007 to February 2013); President, ACS (October 2007 to February 2013); Chief Operating Officer, ACC (September 2007 to November 2012) | 73 | None |
Jonathan S. Thomas (1963) | Director and President | Since 2007 | President and Chief Executive Officer, ACC (March 2007 to present). Also serves as Chief Executive Officer, ACS; Executive Vice President, ACIM; Director, ACC, ACIM and other ACC subsidiaries | 118 | BioMed Valley Discoveries, Inc. |
The Statement of Additional Information has additional information about the fund's directors and is available without charge, upon request, by calling 1-800-345-2021.
28
Officers
The following table presents certain information about the executive officers of the funds. Each officer serves as an officer for each of the 15 investment companies in the American Century family of funds, unless otherwise noted. No officer is compensated for his or her service as an officer of the funds. The listed officers are interested persons of the funds and are appointed or re-appointed on an annual basis. The mailing address for each officer listed below is 4500 Main Street, Kansas City, Missouri 64111.
Name (Year of Birth) | Offices with the Funds | Principal Occupation(s) During the Past Five Years |
Jonathan S. Thomas (1963) | Director and President since 2007 | President and Chief Executive Officer, ACC (March 2007 to present). Also serves as Chief Executive Officer, ACS; Executive Vice President, ACIM; Director, ACC, ACIM and other ACC subsidiaries |
Amy D. Shelton (1964) | Chief Compliance Officer and Vice President since 2014 | Chief Compliance Officer, American Century funds, (March 2014 to present); Chief Compliance Officer, ACIM (February 2014 to present); Chief Compliance Officer, ACIS (October 2009 to present); Vice President, Client Interactions and Marketing, ACIS (February 2013 to January 2014); Director, Client Interactions and Marketing, ACIS (June 2007 to January 2013). Also serves as Vice President, ACIS |
Charles A. Etherington (1957) | General Counsel since 2007 and Senior Vice President since 2006 | Attorney, ACC (February 1994 to present); Vice President, ACC (November 2005 to present); General Counsel, ACC (March 2007 to present). Also serves as General Counsel, ACIM, ACS, ACIS and other ACC subsidiaries; and Senior Vice President, ACIM and ACS |
C. Jean Wade (1964) | Vice President, Treasurer and Chief Financial Officer since 2012 | Vice President, ACS (February 2000 to present) |
Robert J. Leach (1966) | Vice President since 2006 and Assistant Treasurer since 2012 | Vice President, ACS (February 2000 to present) |
David H. Reinmiller (1963) | Vice President since 2000 | Attorney, ACC (January 1994 to present); Associate General Counsel, ACC (January 2001 to present). Also serves as Vice President, ACIM and ACS |
Ward D. Stauffer (1960) | Secretary since 2005 | Attorney, ACC (June 2003 to present) |
29
| Approval of Management Agreement |
At a meeting held on June 18, 2014, the Fund’s Board of Directors unanimously approved the renewal of the management agreement pursuant to which American Century Investment Management, Inc. (the “Advisor”) acts as the investment advisor for the Fund. Under Section 15(c) of the Investment Company Act, contracts for investment advisory services are required to be reviewed, evaluated, and approved by a majority of a fund’s directors (the “Directors”), including a majority of the independent Directors, each year.
Prior to its consideration of the renewal of the management agreement, the Board requested and reviewed extensive data and information compiled by the Advisor and certain independent providers of evaluation data concerning the Fund and the services provided to the Fund by the Advisor. This review was in addition to the oversight and evaluation undertaken by the Board and its committees on a continuous basis and the information received was supplemental to the extensive information that the Board and its committees receive and consider throughout the year.
In connection with its consideration of the renewal of the management agreement, the Board’s review and evaluation of the services provided by the Advisor included, but was not limited to, the following:
| • | the nature, extent, and quality of investment management, shareholder services, and other services provided by the Advisor to the Fund; |
| • | the wide range of other programs and services the Advisor provides to the Fund and its shareholders on a routine and non-routine basis; |
| • | the Fund’s investment performance compared to appropriate benchmarks and/or a peer group of other mutual funds with similar investment objectives and strategies; |
| • | the cost of owning the Fund compared to the cost of owning similar funds; |
| • | the Advisor’s compliance policies, procedures, and regulatory experience; |
| • | financial data showing the cost of services provided to the Fund, the profitability of the Fund to the Advisor, and the overall profitability of the Advisor; |
| • | possible economies of scale associated with the Advisor’s management of the Fund and other accounts under its management; |
| • | the services provided and charges to other investment management clients of the Advisor; |
| • | acquired fund fees and expenses; and |
| • | any collateral benefits derived by the Advisor from the management of the Fund. |
In keeping with its practice, the Board held two in-person meetings and one telephonic meeting to review and discuss the information provided. The independent Directors also had the benefit of the advice of their independent counsel throughout the process.
Factors Considered
The Directors considered all of the information provided by the Advisor, the independent data providers, and independent counsel, and evaluated such information for the Fund. In connection with their review, the Directors did not identify any single factor as being all-important or controlling, and each Director may have attributed different levels of importance to different factors. In deciding to renew the management agreement, the Board based its decision on a number of factors, including the following:
30
Nature, Extent and Quality of Services — Generally. Under the management agreement, the Advisor is responsible for providing or arranging for all services necessary for the operation of the Fund. The Board noted that under the management agreement, the Advisor provides or arranges at its own expense a wide variety of services including:
| • | constructing and designing the Fund |
| • | portfolio research and security selection |
| • | initial capitalization/funding |
| • | securities trading |
| • | Fund administration |
| • | custody of Fund assets |
| • | daily valuation of the Fund’s portfolio |
| • | shareholder servicing and transfer agency, including shareholder confirmations, recordkeeping, and communications |
| • | legal services (except the independent Directors’ counsel) |
| • | regulatory and portfolio compliance |
| • | financial reporting |
| • | marketing and distribution (except Rule 12b-1 plans) |
The Board noted that many of these services have expanded over time both in terms of quantity and complexity in response to shareholder demands, competition in the industry, changing distribution channels, and the changing regulatory environment.
Investment Management Services. The nature of the investment management services provided to the Fund is quite complex and allows Fund shareholders access to professional money management, instant diversification of their investments within an asset class, the opportunity to easily diversify among asset classes by investing in or exchanging among various American Century Investments funds, and liquidity. In evaluating investment performance, the Board expects the Advisor to manage the Fund in accordance with its investment objectives and approved strategies. Further, the Directors recognize that the Advisor has an obligation to monitor trading activities, and in particular to seek the best execution of fund trades, and to evaluate the use of and payment for research. In providing these services, the Advisor utilizes teams of investment professionals (portfolio managers, analysts, research assistants, and securities traders) who require extensive information technology, research, training, compliance and other systems to conduct their business. The Board, directly and through its Fund Performance Review Committee, regularly reviews investment performance information for the Fund, together with comparative information for appropriate benchmarks and/or peer groups of similarly-managed funds, over different time horizons. The Directors also review detailed performance information during the management agreement approval process. If performance concerns are identified, the Fund receives special reviews until performance improves, during which the Board discusses with the Advisor the reasons for such results (e.g., market conditions, security selection) and any efforts being undertaken to improve performance. The Fund’s performance was above its benchmark for the one-, three-, five-, and ten-year periods reviewed by the Board. The Board found the investment management services provided by the Advisor to the Fund to be satisfactory and consistent with the management agreement.
Shareholder and Other Services. Under the management agreement, the Advisor provides the Fund with a comprehensive package of transfer agency, shareholder, and other services. The Board, directly and through various committees of the Board, regularly reviews reports and evaluations of such services at its regular meetings. These reports include, but are not limited to, information regarding the operational efficiency and accuracy of the shareholder and transfer agency services provided, staffing levels, shareholder satisfaction (as measured by external as well as internal sources), technology support, new products and services offered to Fund shareholders, securities trading activities, portfolio valuation services, auditing services, and legal and operational compliance activities. Certain aspects of shareholder and transfer agency service level efficiency and the quality of securities trading activities are measured by independent third party providers and are presented in comparison to other fund groups not managed by the Advisor. The Board
31
found the services provided by the Advisor to the Fund under the management agreement to be competitive and of high quality.
Costs of Services and Profitability. The Advisor provides detailed information concerning its cost of providing various services to the Fund, its profitability in managing the Fund (pre- and post-distribution), its overall profitability, and its financial condition. The Directors have reviewed with the Advisor the methodology used to prepare this financial information. The financial information regarding the Advisor is considered in evaluating the Advisor’s financial condition, its ability to continue to provide services under the management agreement, and the reasonableness of the current management fee. The Board concluded that the Advisor’s profits were reasonable in light of the services provided to the Fund.
Ethics. The Board generally considers the Advisor’s commitment to providing quality services to shareholders and to conducting its business ethically. They noted that the Advisor’s practices generally meet or exceed industry best practices.
Economies of Scale. The Board also reviewed information provided by the Advisor regarding the possible existence of economies of scale in connection with the management of the Fund. The Board concluded that economies of scale are difficult to measure and predict with precision, especially on a fund-by-fund basis. The Board concluded that the Advisor is appropriately sharing economies of scale through its competitive fee structure, offering competitive fees from fund inception, and through reinvestment in its business to provide shareholders additional content and services.
Comparison to Other Funds’ Fees. The management agreement provides that the Fund pays the Advisor a single, all-inclusive (or unified) management fee for providing all services necessary for the management and operation of the Fund, other than brokerage expenses, taxes, interest, extraordinary expenses, and the fees and expenses of the Fund’s independent directors (including their independent legal counsel) and expenses incurred in connection with the provision of shareholder services and distribution services under a plan adopted pursuant to Rule 12b-1 under the 1940 Act. Under the unified fee structure, the Advisor is responsible for providing all investment advisory, custody, audit, administrative, compliance, recordkeeping, marketing and shareholder services, or arranging and supervising third parties to provide such services. By contrast, most other funds are charged a variety of fees, including an investment advisory fee, a transfer agency fee, an administrative fee, distribution charges and other expenses. Other than their investment advisory fees and any applicable Rule 12b-1 distribution fees, all other components of the total fees charged by these other funds may be increased without shareholder approval. The Board believes the unified fee structure is a benefit to Fund shareholders because it clearly discloses to shareholders the cost of owning Fund shares, and, since the unified fee cannot be increased without a vote of Fund shareholders, it shifts to the Advisor the risk of increased costs of operating the Fund and provides a direct incentive to minimize administrative inefficiencies. Part of the Board’s analysis of fee levels involves reviewing certain evaluative data compiled by an independent provider comparing the Fund’s unified fee to the total expense ratios of its peers. The unified fee charged to shareholders of the Fund was above the median of the total expense ratios of the Fund’s peer expense universe and was within the range of its peer expense group. The Board concluded that the management fee paid by the Fund to the Advisor under the management agreement is reasonable in light of the services provided to the Fund.
Comparison to Fees and Services Provided to Other Clients of the Advisor. The Board also requested and received information from the Advisor concerning the nature of the services, fees, costs and profitability of its advisory services to advisory clients other than the Fund. They observed that these varying types of client accounts require different services and involve different regulatory and entrepreneurial risks than the management of the Fund. The Board analyzed this information and concluded that the fees charged and services provided to the Fund were reasonable by comparison.
32
Collateral or “Fall-Out” Benefits Derived by the Advisor. The Board considered the existence of collateral benefits the Advisor may receive as a result of its relationship with the Fund. They concluded that the Advisor’s primary business is managing mutual funds and it generally does not use fund or shareholder information to generate profits in other lines of business, and therefore does not derive any significant collateral benefits from them. The Board noted that the Advisor receives proprietary research from broker-dealers that execute fund portfolio transactions and concluded that this research is likely to benefit Fund shareholders. The Board also determined that the Advisor is able to provide investment management services to certain clients other than the Fund, at least in part, due to its existing infrastructure built to serve the fund complex. The Board concluded, however, that the assets of those other clients are not material to the analysis and, where applicable, may be included with the assets of the Fund to determine breakpoints in the management fee schedule.
Existing Relationship. The Board also considered whether there was any reason for not continuing the existing arrangement with the Advisor. In this regard, the Board was mindful of the potential disruptions of the Fund’s operations and various risks, uncertainties, and other effects that could occur as a result of a decision not to continue such relationship. In particular, the Board recognized that most shareholders have invested in the Fund on the strength of the Advisor’s industry standing and reputation and in the expectation that the Advisor will have a continuing role in providing advisory services to the Fund.
Conclusion of the Directors. As a result of this process, the Board, including all of the independent Directors, taking into account all of the factors discussed above and the information provided by the Advisor and others, concluded that the management agreement between the Fund and the Advisor is fair and reasonable in light of the services provided and should be renewed.
33
| Additional Information |
Retirement Account Information
As required by law, distributions you receive from certain IRAs are subject to federal income tax withholding, unless you elect not to have withholding apply. Tax will be withheld on the total amount withdrawn even though you may be receiving amounts that are not subject to withholding, such as nondeductible contributions. In such case, excess amounts of withholding could occur. You may adjust your withholding election so that a greater or lesser amount will be withheld.
If you don’t want us to withhold on this amount, you must notify us to not withhold the federal income tax. You may notify us in writing or in certain situations by telephone or through other electronic means. For systematic withdrawals, your withholding election will remain in effect until revoked or changed by filing a new election. You have the right to revoke your election at any time.
Remember, even if you elect not to have income tax withheld, you are liable for paying income tax on the taxable portion of your withdrawal. If you elect not to have income tax withheld or you don’t have enough income tax withheld, you may be responsible for payment of estimated tax. You may incur penalties under the estimated tax rules if your withholding and estimated tax payments are not sufficient. You can reduce or defer the income tax on a distribution by directly or indirectly rolling such distribution over to another IRA or eligible plan. You should consult your tax advisor for additional information.
State tax will be withheld if, at the time of your distribution, your address is within one of the mandatory withholding states and you have federal income tax withheld (or as otherwise required by state law). State taxes will be withheld from your distribution in accordance with the respective state rules.
Distributions you receive from 403(b), 457 and qualified plans are subject to special tax and withholding rules. Your plan administrator or plan sponsor is required to provide you with a special tax notice explaining those rules at the time you request a distribution. If applicable, federal and/or state taxes may be withheld from your distribution amount.
Proxy Voting Policies
A description of the policies that the fund's investment advisor uses in exercising the voting rights associated with the securities purchased and/or held by the fund is available without charge, upon request, by calling 1-800-345-2021. It is also available on the "About Us" page of American Century Investments’ website at americancentury.com and on the Securities and Exchange Commission’s website at sec.gov. Information regarding how the investment advisor voted proxies relating to portfolio securities during the most recent 12-month period ended June 30 is available on the "About Us" page at americancentury.com. It is also available at sec.gov.
Quarterly Portfolio Disclosure
The fund files its complete schedule of portfolio holdings with the Securities and Exchange Commission (SEC) for the first and third quarters of each fiscal year on Form N-Q. The fund’s Forms N-Q are available on the SEC’s website at sec.gov, and may be reviewed and copied at the SEC’s Public Reference Room in Washington, DC. Information on the operation of the Public Reference Room may be obtained by calling 1-800-SEC-0330. The fund also makes its complete schedule of portfolio holdings for the most recent quarter of its fiscal year available on its
website at americancentury.com and, upon request, by calling 1-800-345-2021.
34
Other Tax Information
The following information is provided pursuant to provisions of the Internal Revenue Code.
The fund hereby designates up to the maximum amount allowable as qualified dividend income for the fiscal year ended November 30, 2014.
For the fiscal year ended November 30, 2014, the fund intends to pass through to shareholders $895,601, or up to the maximum amount allowable, as a foreign tax credit which represents taxes paid on income derived from sources within foreign countries or possessions of the United States. During the fiscal year ended November 30, 2014, the fund earned $8,658,032 from income derived from foreign sources. Foreign source income and foreign tax expense per outstanding share on November 30, 2014 are $0.1776 and $0.0184, respectively.
35
| Notes |
36
| ||
| Contact Us | americancentury.com | |
| Automated Information Line | 1-800-345-8765 | |
| Investor Services Representative | 1-800-345-2021 or 816-531-5575 | |
| Investors Using Advisors | 1-800-378-9878 | |
| Business, Not-For-Profit, Employer-Sponsored Retirement Plans | 1-800-345-3533 | |
| Banks and Trust Companies, Broker-Dealers, Financial Professionals, Insurance Companies | 1-800-345-6488 | |
| Telecommunications Relay Service for the Deaf | 711 | |
| American Century World Mutual Funds, Inc. | ||
Investment Advisor: American Century Investment Management, Inc. Kansas City, Missouri | ||
| This report and the statements it contains are submitted for the general information of our shareholders. The report is not authorized for distribution to prospective investors unless preceded or accompanied by an effective prospectus. | ||
©2015 American Century Proprietary Holdings, Inc. All rights reserved. CL-ANN-84131 1501 | ||
ANNUAL REPORT | NOVEMBER 30, 2014 |
Global Growth Fund
| Table of Contents |
| President’s Letter | |
| Performance | |
| Portfolio Commentary | |
| Fund Characteristics | |
| Shareholder Fee Example | |
| Schedule of Investments | |
| Statement of Assets and Liabilities | |
| Statement of Operations | |
| Statement of Changes in Net Assets | |
| Notes to Financial Statements | |
| Financial Highlights | |
| Report of Independent Registered Public Accounting Firm | |
| Management | |
| Approval of Management Agreement | |
| Additional Information | |
Any opinions expressed in this report reflect those of the author as of the date of the report, and do not necessarily represent the opinions of American Century Investments® or any other person in the American Century Investments organization. Any such opinions are subject to change at any time based upon market or other conditions and American Century Investments disclaims any responsibility to update such opinions. These opinions may not be relied upon as investment advice and, because investment decisions made by American Century Investments funds are based on numerous factors, may not be relied upon as an indication of trading intent on behalf of any American Century Investments fund. Security examples are used for representational purposes only and are not intended as recommendations to purchase or sell securities. Performance information for comparative indices and securities is provided to American Century Investments by third party vendors. To the best of American Century Investments’ knowledge, such information is accurate at the time of printing.
| President’s Letter |
| Dear Investor: Thank you for reviewing this annual report for the 12 months ended November 30, 2014. It provides investment performance and portfolio information for the reporting period, plus longer-term historical performance data. Annual reports remain important vehicles for conveying information about fund returns, including market and economic factors that affected performance during the reporting period. For additional, updated investment and market insights, we encourage you to visit our website, americancentury.com. |
| Jonathan Thomas | |
Favorable Fiscal Year for U.S. Investments, While Non-U.S. Lagged
“Global divergence” between the U.S. and the rest of the world emerged as a prevalent theme during the reporting period. As 2014 approached its conclusion, the U.S. appeared to be on a different economic and monetary policy track than most other nations. This theme covered not only the stronger economic growth enjoyed by the U.S. compared with the rest of the world, but also the related contrast between the U.S. Federal Reserve’s unwinding of monetary stimulus versus the continuation and expansion of monetary stimulus by most other central banks.
Global divergence could also generally describe the broad difference between investment returns for U.S. and non-U.S. markets. The perceived strength, safe-haven qualities, and higher yields of U.S. investments attracted global demand. For the reporting period, the S&P 500 Index, the Barclays U.S. Aggregate Bond Index, and the U.S. Dollar Index returned 16.86%, 5.27%, and 9.34%, respectively. By contrast, for U.S. investors unhedged for currency exposure (the dollar’s strength reduced the returns of non-dollar-denominated securities when they were converted to dollars), the MSCI EAFE Index, the MSCI Emerging Markets Index, and the Barclays Global Aggregate Bond Index (ex-USD, unhedged) returned -0.02%, 1.06%, and -2.53%, respectively.
We expect global divergence in economic growth and monetary policies to continue well into 2015, aligned with expectations that the Federal Reserve might finally start raising short-term U.S. interest rates. However, global economic weakness (reflected in recent commodity price declines) and low inflation might delay the rate hikes until the second half of 2015. In this environment, we continue to believe in a disciplined, diversified, long-term investment approach, using professionally managed stock and bond portfolios to meet financial goals. We appreciate your continued trust in us.
Sincerely,
Jonathan Thomas
President and Chief Executive Officer
American Century Investments
2
| Performance |
| Total Returns as of Novemeber 30, 2014 | ||||||
Average Annual Returns | ||||||
Ticker Symbol | 1 year | 5 years | 10 years | Since Inception | Inception Date | |
Investor Class | TWGGX | 7.53% | 11.72% | 8.50% | 8.69% | 12/1/98 |
MSCI World Index | — | 8.91% | 10.95% | 6.59% | 4.78%(1) | — |
| Institutional Class | AGGIX | 7.68% | 11.92% | 8.72% | 4.71% | 8/1/00 |
A Class(2) | AGGRX | 2/5/99 | ||||
| No sales charge* | 7.23% | 11.43% | 8.23% | 7.77% | ||
| With sales charge* | 1.10% | 10.11% | 7.60% | 7.37% | ||
| C Class | AGLCX | 6.39% | 10.58% | 7.43% | 7.21% | 3/1/02 |
| R Class | AGORX | 7.00% | 11.16% | — | 7.26% | 7/29/05 |
| R6 Class | AGGDX | 7.80% | — | — | 14.76% | 7/26/13 |
| * | Sales charges include initial sales charges and contingent deferred sales charges (CDSCs), as applicable. A Class shares have a 5.75% maximum initial sales charge and may be subject to a maximum CDSC of 1.00%. C Class shares redeemed within 12 months of purchase are subject to a maximum CDSC of 1.00%. The SEC requires that mutual funds provide performance information net of maximum sales charges in all cases where charges could be applied. |
| (1) | Since November 30, 1998, the date nearest the Investor Class’s inception for which data are available. |
| (2) | Prior to September 4, 2007, the A Class was referred to as the Advisor Class and did not have a front-end sales charge. Performance has been adjusted to reflect this charge. |
Data presented reflect past performance. Past performance is no guarantee of future results. Current performance may be higher or lower than the performance shown. Investment return and principal value will fluctuate, and redemption value may be more or less than original cost. Data assumes reinvestment of dividends and capital gains, and none of the charts reflect the deduction of taxes that a shareholder would pay on fund distributions or the redemption of fund shares. To obtain performance data current to the most recent month end, please call 1-800-345-2021 or visit americancentury.com. For additional information about the fund, please consult the prospectus.
3
| Growth of $10,000 Over 10 Years |
| $10,000 investment made November 30, 2004 |
| Performance for other share classes will vary due to differences in fee structure. |
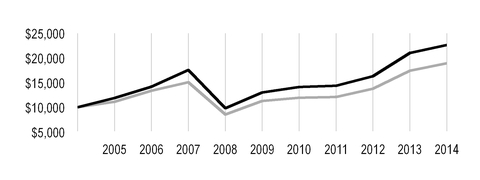
| Value on November 30, 2014 | |
| Investor Class — $22,617 | |
| MSCI World Index — $18,946 | |
Total Annual Fund Operating Expenses | |||||
Investor Class | Institutional Class | A Class | C Class | R Class | R6 Class |
| 1.09% | 0.89% | 1.34% | 2.09% | 1.59% | 0.74% |
The total annual fund operating expenses shown is as stated in the fund’s prospectus current as of the date of this report. The prospectus may vary from the expense ratio shown elsewhere in this report because it is based on a different time period, includes acquired fund fees and expenses, and, if applicable, does not include fee waivers or expense reimbursements.
Data presented reflect past performance. Past performance is no guarantee of future results. Current performance may be higher or lower than the performance shown. Investment return and principal value will fluctuate, and redemption value may be more or less than original cost. Data assumes reinvestment of dividends and capital gains, and none of the charts reflect the deduction of taxes that a shareholder would pay on fund distributions or the redemption of fund shares. To obtain performance data current to the most recent month end, please call 1-800-345-2021 or visit americancentury.com. For additional information about the fund, please consult the prospectus.
4
| Portfolio Commentary |
Portfolio Managers: Keith Creveling and Brent Puff
Portfolio Manager Ted Harlan joined the Global Growth team as of December 2014.
Performance Summary
Global Growth returned 7.53%* for the 12 months ended November 30, 2014, compared with its benchmark, the MSCI World Index, which returned 8.91%.
Global equity markets advanced during the 12-month period, although returns were somewhat mixed. U.S. indices produced solid gains, outperforming holdings in Europe and Asia, which were pressured by weak economic recovery and in Japan’s case, recession. Large- and mid-cap holdings generally outpaced small-cap stocks, and global growth equities outperformed global value stocks.
Geographically, U.S.-based holdings were among the top detractors from the fund’s returns, though stock choices in Switzerland and Sweden, as well as exposure to Russia-based companies, also impacted results. Successful security selection and positioning in the U.K., Germany, and Denmark bolstered gains. On a sector basis, stock selection in the financials and consumer staples sectors was detrimental, while industrials sector holdings contributed favorably to returns.
Financials Holdings Main Detractors
A number of holdings in the diversified financial services industry fell substantially, leading the financials sector to be among the fund’s greatest underperformers. An overweight position, relative to the benchmark, in Japan-based financial services conglomerate ORIX detracted from results. The company faced headwinds early in the period, driven largely by the general decline of Japanese equities, which fell due to a strengthening yen and concerns about an impending consumption tax hike’s impact on consumer demand. The stock declined further toward period-end after an analyst downgrade. Despite recent market headwinds, ORIX continued to produce solid revenue and earnings growth and we believe that the holding’s prospects remain strong. Elsewhere in the sector, Austria-based consumer bank Erste Group Bank declined on lowered earnings projections following unexpected regulatory changes in its key Central and Eastern European markets. We sold the holding due to its uncertain future.
Grocery retailers in the consumer staples sector also underperformed. France-based grocery chain Carrefour suffered on declining sales as economic weakness and austerity measures negatively impacted consumer spending in Europe. Despite domestic difficulties, Carrefour saw gains in Brazil that helped to offset the slowdowns in Europe, and we believe that the company will benefit from management’s ongoing restructuring efforts. Elsewhere in the sector, Sweden-based Svenska Cellulosa AB tumbled as the krona faltered against the euro. We ultimately exited the position.
Individual detraction also came from several oil-related holdings, which fell as the price of oil continued to decline. Oil stocks were further pressured by OPEC’s decision to maintain current production levels despite a global glut in oil supply, which pushed the price of oil to a four-year low. Within the portfolio, an overweight position in oil producer Continental Resources detracted from relative gains. Nevertheless, we believe that the holding is a market leader and is well positioned to generate long-term earnings growth despite short-term industry volatility.
* All fund returns referenced in this commentary are for Investor Class shares. Performance for other share classes will vary due to differences in fee structure; when Investor Class performance exceeds that of the fund's benchmark, other share classes may not. See page 3 for returns for all share classes.
5
Industrials Sector Outperformed
Railway holdings led the industrials sector to be a leading contributor to relative gains. An overweight position in U.S.-based rail operator Union Pacific benefited the fund as the company’s stock appreciated steadily, reaching all-time highs during the reporting period. Gains were driven by volume expansion, particularly in the transportation of agricultural and industrial products, as well as from rising oil and gas production levels that are leading to increased transportation demand. Other sector contributors included United Rentals, the largest renter of construction equipment in the U.S., which advanced on strong financial results helped by growth in non-residential construction activity and higher rental rates.
The portfolio’s overweight positions in several retailers and luxury-goods manufacturers led the consumer discretionary sector to be among the top contributors to relative performance. Pandora, a Denmark-based maker of charm bracelets and other jewelry, appreciated on revenue growth from new product offerings combined with strategic alliances to increase Pandora’s global distribution capabilities.
A number of technology sector holdings also bolstered gains. These included U.S.-based social networking site Facebook, which appreciated 65% over the course of the period through continued success in monetizing its large and growing user base via accelerating mobile advertising revenue. Substantial contribution also came from U.S.-based data center operator Equinix, which produced higher-than-expected revenues stemming from rising demand for cloud computing-based data center services.
Outlook
As we move into 2015, worries persist about the global economic recovery. While growth in the U.S. appears to be progressing, albeit at a slower pace than during prior post-recessionary periods, Europe faces possible deflation, Japan has fallen back into a recession (two consecutive quarters of negative economic growth as measured by a country’s gross domestic product), and growth in China continues to slow while other emerging markets face debt, currency and political challenges. The fund remains overweight to the U.S., as our bottom-up stock selection process has helped us to identify companies positioned to benefit from improving economic trends. At the same time, we have had difficulty identifying European names that demonstrate sustainable acceleration in earnings growth amid economic weakness in the eurozone, leading to an underweight in the region. Likewise, we maintain limited exposure to Asia, particularly in Japan, where our focus remains on exporters and select names likely to benefit from a weaker yen.
From a sector perspective, consumer discretionary and industrials are the portfolio’s largest sector overweights as we seek opportunities in traditionally cyclical sectors likely to benefit from rising consumer and business spending as economic growth expands. We also have significant exposure in the information technology sector, with focus on market share leaders in online search and mobile advertising. The fund’s largest sector underweights remain in financials and energy given the difficulty in identifying investment opportunities that fit the portfolio’s earnings growth parameters in those sectors.
6
| Fund Characteristics |
| NOVEMBER 30, 2014 | |
Top Ten Holdings | % of net assets |
| Google, Inc.* | 3.0% |
| Roche Holding AG | 2.2% |
| Union Pacific Corp. | 2.1% |
| Home Depot, Inc. (The) | 1.9% |
| Royal Bank of Scotland Group plc | 1.8% |
| American Tower Corp. | 1.8% |
| Facebook, Inc., Class A | 1.8% |
| Liberty Global plc* | 1.7% |
| Cognizant Technology Solutions Corp., Class A | 1.7% |
| Harman International Industries, Inc. | 1.6% |
| *Includes all classes of the issuer. | |
Types of Investments in Portfolio | % of net assets |
| Domestic Common Stocks | 59.4% |
| Foreign Common Stocks | 39.7% |
Total Common Stocks | 99.1% |
| Temporary Cash Investments | 0.6% |
| Other Assets and Liabilities | 0.3% |
Investments by Country | % of net assets |
| United States | 59.4% |
| United Kingdom | 10.0% |
| Japan | 5.9% |
| Switzerland | 4.7% |
| France | 3.0% |
| Netherlands | 2.4% |
| Other Countries | 13.7% |
| Cash and Equivalents** | 0.9% |
| **Includes temporary cash investments and other assets and liabilities. | |
7
| Shareholder Fee Example |
Fund shareholders may incur two types of costs: (1) transaction costs, including sales charges (loads) on purchase payments and redemption/exchange fees; and (2) ongoing costs, including management fees; distribution and service (12b-1) fees; and other fund expenses. This example is intended to help you understand your ongoing costs (in dollars) of investing in your fund and to compare these costs with the ongoing cost of investing in other mutual funds.
The example is based on an investment of $1,000 made at the beginning of the period and held for the entire period from June 1, 2014 to November 30, 2014.
Actual Expenses
The table provides information about actual account values and actual expenses for each class. You may use the information, together with the amount you invested, to estimate the expenses that you paid over the period. First, identify the share class you own. Then simply divide your account value by $1,000 (for example, an $8,600 account value divided by $1,000 = 8.6), then multiply the result by the number under the heading “Expenses Paid During Period” to estimate the expenses you paid on your account during this period.
If you hold Investor Class shares of any American Century Investments fund, or Institutional Class shares of the American Century Diversified Bond Fund, in an American Century Investments account (i.e., not a financial intermediary or retirement plan account), American Century Investments may charge you a $12.50 semiannual account maintenance fee if the value of those shares is less than $10,000. We will redeem shares automatically in one of your accounts to pay the $12.50 fee. In determining your total eligible investment amount, we will include your investments in all personal accounts (including American Century Investments Brokerage accounts) registered under your Social Security number. Personal accounts include individual accounts, joint accounts, UGMA/UTMA accounts, personal trusts, Coverdell Education Savings Accounts and IRAs (including traditional, Roth, Rollover, SEP-, SARSEP- and SIMPLE-IRAs), and certain other retirement accounts. If you have only business, business retirement, employer-sponsored or American Century Investments Brokerage accounts, you are currently not subject to this fee. If you are subject to the Account Maintenance Fee, your account value could be reduced by the fee amount.
Hypothetical Example for Comparison Purposes
The table also provides information about hypothetical account values and hypothetical expenses based on the actual expense ratio of each class of your fund and an assumed rate of return of 5% per year before expenses, which is not the actual return of a fund’s share class. The hypothetical account values and expenses may not be used to estimate the actual ending account balance or expenses you paid for the period. You may use this information to compare the ongoing costs of investing in your fund and other funds. To do so, compare this 5% hypothetical example with the 5% hypothetical examples that appear in the shareholder reports of the other funds.
Please note that the expenses shown in the table are meant to highlight your ongoing costs only and do not reflect any transactional costs, such as sales charges (loads) or redemption/exchange fees. Therefore, the table is useful in comparing ongoing costs only, and will not help you determine the relative total costs of owning different funds. In addition, if these transactional costs were included, your costs would have been higher.
8
| Beginning Account Value 6/1/14 | Ending Account Value 11/30/14 | Expenses Paid During Period(1) 6/1/14 - 11/30/14 | Annualized Expense Ratio(1) | |
Actual | ||||
| Investor Class | $1,000 | $1,027.00 | $5.49 | 1.08% |
| Institutional Class | $1,000 | $1,027.50 | $4.47 | 0.88% |
| A Class | $1,000 | $1,025.80 | $6.75 | 1.33% |
| C Class | $1,000 | $1,021.00 | $10.54 | 2.08% |
| R Class | $1,000 | $1,024.30 | $8.02 | 1.58% |
| R6 Class | $1,000 | $1,028.20 | $3.71 | 0.73% |
Hypothetical | ||||
| Investor Class | $1,000 | $1,019.65 | $5.47 | 1.08% |
| Institutional Class | $1,000 | $1,020.66 | $4.46 | 0.88% |
| A Class | $1,000 | $1,018.40 | $6.73 | 1.33% |
| C Class | $1,000 | $1,014.64 | $10.50 | 2.08% |
| R Class | $1,000 | $1,017.15 | $7.99 | 1.58% |
| R6 Class | $1,000 | $1,021.41 | $3.70 | 0.73% |
| (1) | Expenses are equal to the class's annualized expense ratio listed in the table above, multiplied by the average account value over the period, multiplied by 183, the number of days in the most recent fiscal half-year, divided by 365, to reflect the one-half year period. |
9
| Schedule of Investments |
NOVEMBER 30, 2014
| Shares | Value | ||||
| COMMON STOCKS — 99.1% | |||||
| Australia — 0.7% | |||||
| CSL Ltd. | 61,143 | $ | 4,295,835 | ||
| Brazil — 0.8% | |||||
| Kroton Educacional SA | 695,900 | 4,810,032 | |||
| Canada — 0.5% | |||||
| Canadian Pacific Railway Ltd. | 17,790 | 3,431,362 | |||
| China — 1.9% | |||||
Alibaba Group Holding Ltd. ADR(1) | 16,225 | 1,811,359 | |||
Baidu, Inc. ADR(1) | 21,860 | 5,358,105 | |||
| ENN Energy Holdings Ltd. | 158,000 | 965,694 | |||
Vipshop Holdings Ltd. ADR(1) | 178,300 | 4,075,938 | |||
| 12,211,096 | |||||
| Colombia — 0.3% | |||||
| Bancolombia SA ADR | 37,630 | 1,945,471 | |||
| Denmark — 1.8% | |||||
| GN Store Nord A/S | 119,000 | 2,541,605 | |||
| Pandora A/S | 96,206 | 8,537,424 | |||
| 11,079,029 | |||||
| France — 3.0% | |||||
| Accor SA | 189,930 | 8,959,052 | |||
| Carrefour SA | 263,790 | 8,346,207 | |||
Peugeot SA(1) | 98,770 | 1,265,000 | |||
| 18,570,259 | |||||
| Germany — 0.7% | |||||
| Symrise AG | 69,530 | 4,155,560 | |||
| Hong Kong — 0.7% | |||||
| Hang Seng Bank Ltd. | 276,200 | 4,601,404 | |||
| India — 0.7% | |||||
| ICICI Bank Ltd. ADR | 16,010 | 942,829 | |||
| Maruti Suzuki India Ltd. | 70,190 | 3,784,865 | |||
| 4,727,694 | |||||
| Japan — 5.9% | |||||
| Daikin Industries Ltd. | 70,500 | 4,676,642 | |||
| Keyence Corp. | 18,000 | 8,312,008 | |||
| Nidec Corp. | 147,400 | 9,774,104 | |||
| ORIX Corp. | 452,700 | 5,969,775 | |||
| Unicharm Corp. | 345,600 | 7,909,659 | |||
| 36,642,188 | |||||
| Mexico — 1.0% | |||||
Cemex SAB de CV ADR(1) | 499,020 | 6,242,740 | |||
| Netherlands — 2.4% | |||||
| Akzo Nobel NV | 91,050 | 6,290,289 | |||
| ASML Holding NV | 54,479 | 5,753,321 | |||
| ASML Holding NV New York Shares | 30,244 | 3,196,186 | |||
| 15,239,796 | |||||
10
| Shares | Value | ||||
| Peru — 0.7% | |||||
| Credicorp Ltd. | 25,334 | $ | 4,196,830 | ||
| Russia — 0.6% | |||||
| Magnit PJSC GDR | 64,080 | 3,707,028 | |||
| Spain — 1.4% | |||||
Bankia SA(1) | 3,280,410 | 5,751,427 | |||
| Grifols SA | 72,223 | 3,217,289 | |||
| 8,968,716 | |||||
| Sweden — 1.9% | |||||
| Electrolux AB | 189,050 | 5,618,346 | |||
| Skandinaviska Enskilda Banken AB, A Shares | 460,500 | 6,083,142 | |||
| 11,701,488 | |||||
| Switzerland — 4.7% | |||||
| Adecco SA | 110,822 | 7,781,912 | |||
| Credit Suisse Group AG | 278,430 | 7,440,169 | |||
| Roche Holding AG | 46,811 | 14,020,288 | |||
| 29,242,369 | |||||
| United Kingdom — 10.0% | |||||
| Admiral Group plc | 145,470 | 2,817,579 | |||
| Ashtead Group plc | 278,358 | 4,582,740 | |||
| Capita plc | 356,153 | 5,952,526 | |||
| Johnson Matthey plc | 108,600 | 5,641,999 | |||
Liberty Global plc(1) | 131,970 | 6,587,942 | |||
Liberty Global plc, Class A(1) | 79,150 | 4,115,009 | |||
Lloyds Banking Group plc(1) | 4,640,261 | 5,823,837 | |||
| Prudential plc | 257,360 | 6,222,902 | |||
Royal Bank of Scotland Group plc(1) | 1,833,730 | 11,322,521 | |||
| Shire plc | 45,870 | 3,265,042 | |||
| Whitbread plc | 84,970 | 6,088,009 | |||
| 62,420,106 | |||||
| United States — 59.4% | |||||
Adobe Systems, Inc.(1) | 131,820 | 9,712,498 | |||
Alexion Pharmaceuticals, Inc.(1) | 25,784 | 5,025,302 | |||
Alliance Data Systems Corp.(1) | 10,142 | 2,899,294 | |||
| American Tower Corp. | 105,760 | 11,105,858 | |||
Antero Resources Corp.(1) | 75,200 | 3,528,384 | |||
Autodesk, Inc.(1) | 20,710 | 1,284,020 | |||
Biogen Idec, Inc.(1) | 27,106 | 8,340,245 | |||
| Bristol-Myers Squibb Co. | 155,830 | 9,201,761 | |||
Celgene Corp.(1) | 64,278 | 7,307,766 | |||
Cerner Corp.(1) | 73,386 | 4,726,058 | |||
| Charles Schwab Corp. (The) | 227,864 | 6,453,108 | |||
Cognizant Technology Solutions Corp., Class A(1) | 197,660 | 10,671,663 | |||
Continental Resources, Inc.(1) | 112,008 | 4,590,088 | |||
| Costco Wholesale Corp. | 59,437 | 8,447,186 | |||
Dollar Tree, Inc.(1) | 23,310 | 1,593,472 | |||
| Ecolab, Inc. | 28,785 | 3,136,126 | |||
| EQT Corp. | 95,260 | 8,666,755 | |||
| Equinix, Inc. | 28,660 | 6,510,692 | |||
| Estee Lauder Cos., Inc. (The), Class A | 106,995 | 7,932,609 | |||
11
| Shares | Value | ||||
Facebook, Inc., Class A(1) | 141,041 | $ | 10,958,886 | ||
| FedEx Corp. | 55,661 | 9,917,677 | |||
| Fortune Brands Home & Security, Inc. | 152,103 | 6,832,467 | |||
Gilead Sciences, Inc.(1) | 94,730 | 9,503,314 | |||
Google, Inc., Class A(1) | 17,235 | 9,463,394 | |||
Google, Inc., Class C(1) | 17,235 | 9,338,440 | |||
| Halliburton Co. | 135,830 | 5,732,026 | |||
| Harman International Industries, Inc. | 92,825 | 10,074,297 | |||
| Home Depot, Inc. (The) | 120,084 | 11,936,350 | |||
| Ingersoll-Rand plc | 144,350 | 9,102,711 | |||
| Intercontinental Exchange, Inc. | 42,475 | 9,598,925 | |||
| MasterCard, Inc., Class A | 101,990 | 8,902,707 | |||
| McKesson Corp. | 44,050 | 9,283,978 | |||
| Mead Johnson Nutrition Co. | 59,260 | 6,153,558 | |||
Michael Kors Holdings Ltd.(1) | 84,093 | 6,450,774 | |||
| Mondelez International, Inc., Class A | 254,990 | 9,995,608 | |||
| Monsanto Co. | 60,431 | 7,246,281 | |||
Priceline Group, Inc. (The)(1) | 4,880 | 5,661,727 | |||
| Schlumberger Ltd. | 67,404 | 5,793,374 | |||
| Signet Jewelers Ltd. | 53,810 | 7,046,958 | |||
| Towers Watson & Co., Class A | 35,350 | 3,993,136 | |||
| Tractor Supply Co. | 81,583 | 6,276,180 | |||
| Twenty-First Century Fox, Inc. | 259,000 | 9,531,200 | |||
| Tyco International plc | 178,970 | 7,677,813 | |||
Ulta Salon Cosmetics & Fragrance, Inc.(1) | 41,850 | 5,293,606 | |||
| Union Pacific Corp. | 110,862 | 12,945,356 | |||
United Continental Holdings, Inc.(1) | 66,650 | 4,080,980 | |||
United Rentals, Inc.(1) | 41,412 | 4,692,394 | |||
| Visa, Inc., Class A | 35,463 | 9,156,192 | |||
WhiteWave Foods Co., Class A(1) | 199,129 | 7,294,095 | |||
| Yum! Brands, Inc. | 72,620 | 5,609,895 | |||
| Zions Bancorp. | 180,040 | 5,051,922 | |||
| 371,729,106 | |||||
TOTAL COMMON STOCKS (Cost $455,291,743) | 619,918,109 | ||||
| TEMPORARY CASH INVESTMENTS — 0.6% | |||||
| Repurchase Agreement, Bank of America Merrill Lynch, (collateralized by various U.S. Treasury obligations, 0.875% - 1.50%, 6/30/16 - 12/31/16, valued at $2,983,148), in a joint trading account at 0.06%, dated 11/28/14, due 12/1/14 (Delivery value $2,923,190) | 2,923,175 | ||||
| Repurchase Agreement, Credit Suisse First Boston, Inc., (collateralized by various U.S. Treasury obligations, 3.00%, 9/30/16, valued at $1,192,832), in a joint trading account at 0.02%, dated 11/28/14, due 12/1/14 (Delivery value $1,169,272) | 1,169,270 | ||||
TOTAL TEMPORARY CASH INVESTMENTS (Cost $4,092,445) | 4,092,445 | ||||
TOTAL INVESTMENT SECURITIES — 99.7% (Cost $459,384,188) | 624,010,554 | ||||
| OTHER ASSETS AND LIABILITIES — 0.3% | 1,628,636 | ||||
| TOTAL NET ASSETS — 100.0% | $ | 625,639,190 | |||
12
| MARKET SECTOR DIVERSIFICATION | ||
(as a % of net assets) | ||
| Consumer Discretionary | 19.7 | % |
| Information Technology | 16.5 | % |
| Industrials | 15.3 | % |
| Financials | 15.1 | % |
| Health Care | 12.9 | % |
| Consumer Staples | 9.7 | % |
| Materials | 5.3 | % |
| Energy | 4.5 | % |
| Utilities | 0.1 | % |
| Cash and Equivalents* | 0.9 | % |
*Includes temporary cash investments and other assets and liabilities.
| NOTES TO SCHEDULE OF INVESTMENTS | ||
| ADR | - | American Depositary Receipt |
| GDR | - | Global Depositary Receipt |
| PJSC | - | Public Joint Stock Company |
| (1) | Non-income producing. |
See Notes to Financial Statements.
13
| Statement of Assets and Liabilities |
| NOVEMBER 30, 2014 | |||
| Assets | |||
| Investment securities, at value (cost of $459,384,188) | $ | 624,010,554 | |
| Cash | 2,577,464 | ||
| Foreign currency holdings, at value (cost of $87,705) | 86,473 | ||
| Receivable for investments sold | 1,848,960 | ||
| Receivable for capital shares sold | 134,099 | ||
| Dividends and interest receivable | 674,718 | ||
| Other assets | 16,589 | ||
| 629,348,857 | |||
| Liabilities | |||
| Payable for investments purchased | 3,099,999 | ||
| Payable for capital shares redeemed | 61,756 | ||
| Accrued management fees | 528,704 | ||
| Distribution and service fees payable | 19,208 | ||
| 3,709,667 | |||
| Net Assets | $ | 625,639,190 | |
| Net Assets Consist of: | |||
| Capital (par value and paid-in surplus) | $ | 412,941,892 | |
| Distributions in excess of net investment income | (2,780,335 | ) | |
| Undistributed net realized gain | 50,843,365 | ||
| Net unrealized appreciation | 164,634,268 | ||
| $ | 625,639,190 | ||
| Net Assets | Shares Outstanding | Net Asset Value Per Share | ||||
| Investor Class, $0.01 Par Value | $462,889,421 | 35,780,764 | $12.94 | |||
| Institutional Class, $0.01 Par Value | $78,801,680 | 6,020,181 | $13.09 | |||
| A Class, $0.01 Par Value | $54,090,508 | 4,253,172 | $12.72* | |||
| C Class, $0.01 Par Value | $7,233,726 | 619,214 | $11.68 | |||
| R Class, $0.01 Par Value | $5,632,016 | 444,937 | $12.66 | |||
| R6 Class, $0.01 Par Value | $16,991,839 | 1,296,042 | $13.11 | |||
*Maximum offering price $13.50 (net asset value divided by 0.9425).
See Notes to Financial Statements.
14
| Statement of Operations |
| YEAR ENDED NOVEMBER 30, 2014 | |||
| Investment Income (Loss) | |||
| Income: | |||
| Dividends (net of foreign taxes withheld of $365,641) | $ | 6,705,483 | |
| Interest | 1,263 | ||
| 6,706,746 | |||
| Expenses: | |||
| Management fees | 6,316,372 | ||
| Distribution and service fees: | |||
| A Class | 135,711 | ||
| C Class | 65,541 | ||
| R Class | 25,300 | ||
| Directors' fees and expenses | 9,990 | ||
| Other expenses | 55 | ||
| 6,552,969 | |||
| Net investment income (loss) | 153,777 | ||
| Realized and Unrealized Gain (Loss) | |||
| Net realized gain (loss) on: | |||
| Investment transactions | 52,014,510 | ||
| Foreign currency transactions | (118,503 | ) | |
| 51,896,007 | |||
| Change in net unrealized appreciation (depreciation) on: | |||
| Investments | (8,598,898 | ) | |
| Translation of assets and liabilities in foreign currencies | (21,224 | ) | |
| (8,620,122 | ) | ||
| Net realized and unrealized gain (loss) | 43,275,885 | ||
| Net Increase (Decrease) in Net Assets Resulting from Operations | $ | 43,429,662 | |
See Notes to Financial Statements.
15
| Statement of Changes in Net Assets |
| YEARS ENDED NOVEMBER 30, 2014 AND NOVEMBER 30, 2013 | ||||||
| Increase (Decrease) in Net Assets | November 30, 2014 | November 30, 2013 | ||||
| Operations | ||||||
| Net investment income (loss) | $ | 153,777 | $ | 498,222 | ||
| Net realized gain (loss) | 51,896,007 | 56,708,423 | ||||
| Change in net unrealized appreciation (depreciation) | (8,620,122 | ) | 71,714,914 | |||
| Net increase (decrease) in net assets resulting from operations | 43,429,662 | 128,921,559 | ||||
| Distributions to Shareholders | ||||||
| From net investment income: | ||||||
| Investor Class | (2,865,018 | ) | (1,492,644 | ) | ||
| Institutional Class | (560,772 | ) | (273,982 | ) | ||
| A Class | (302,173 | ) | (52,005 | ) | ||
| C Class | (24,440 | ) | — | |||
| R Class | (23,517 | ) | — | |||
| R6 Class | (209 | ) | — | |||
| From net realized gains: | ||||||
| Investor Class | (9,757,039 | ) | — | |||
| Institutional Class | (1,784,697 | ) | — | |||
| A Class | (1,171,760 | ) | — | |||
| C Class | (140,516 | ) | — | |||
| R Class | (100,231 | ) | — | |||
| R6 Class | (620 | ) | — | |||
| Decrease in net assets from distributions | (16,730,992 | ) | (1,818,631 | ) | ||
| Capital Share Transactions | ||||||
| Net increase (decrease) in net assets from capital share transactions (Note 5) | 18,873,715 | (7,786,769 | ) | |||
| Redemption Fees | ||||||
| Increase in net assets from redemption fees | 15,930 | 21,725 | ||||
| Net increase (decrease) in net assets | 45,588,315 | 119,337,884 | ||||
| Net Assets | ||||||
| Beginning of period | 580,050,875 | 460,712,991 | ||||
| End of period | $ | 625,639,190 | $ | 580,050,875 | ||
| Distributions in excess of net investment income | $ | (2,780,335 | ) | $ | (913,005 | ) |
See Notes to Financial Statements.
16
| Notes to Financial Statements |
NOVEMBER 30, 2014
1. Organization
American Century World Mutual Funds, Inc. (the corporation) is registered under the Investment Company Act of 1940, as amended (the 1940 Act), as an open-end management investment company and is organized as a Maryland corporation. Global Growth Fund (the fund) is one fund in a series issued by the corporation. The fund is diversified as defined under the 1940 Act. The fund's investment objective is to seek capital growth.
The fund offers the Investor Class, the Institutional Class, the A Class, the C Class, the R Class and the R6 Class. The A Class may incur an initial sales charge. The A Class and C Class may be subject to a contingent deferred sales charge. The share classes differ principally in their respective sales charges and distribution and shareholder servicing expenses and arrangements. The Institutional Class and R6 Class shareholders do not require the same level of shareholder and administrative services from American Century Investment Management, Inc. (ACIM) (the investment advisor) as shareholders of other classes. In addition, financial intermediaries do not receive any service, distribution or administrative fees for the R6 Class. As a result, the Institutional Class and R6 Class are charged lower unified management fees. Sale of the R6 Class commenced on July 26, 2013.
2. Significant Accounting Policies
The following is a summary of significant accounting policies consistently followed by the fund in preparation of its financial statements. The fund is an investment company and follows accounting and reporting guidance in accordance with accounting principles generally accepted in the United States of America. This may require management to make certain estimates and assumptions at the date of the financial statements. Actual results could differ from these estimates. Management evaluated the impact of events or transactions occurring through the date the financial statements were issued that would merit recognition or disclosure.
Investment Valuations — The fund determines the fair value of its investments and computes its net asset value per share at the close of regular trading (usually 4 p.m. Eastern time) on the New York Stock Exchange (NYSE) on each day the NYSE is open. The Board of Directors has adopted valuation policies and procedures to guide the investment advisor in the fund’s investment valuation process and to provide methodologies for the oversight of the fund’s pricing function.
Equity securities that are listed or traded on a domestic securities exchange are valued at the last reported sales price or at the official closing price as provided by the exchange. Equity securities traded on foreign securities exchanges are generally valued at the closing price of such securities on the exchange where primarily traded or at the close of the NYSE, if that is earlier. If no last sales price is reported, or if local convention or regulation so provides, the mean of the latest bid and asked prices may be used. Securities traded over-the-counter are valued at the mean of the latest bid and asked prices, the last sales price, or the official closing price. Equity securities initially expressed in local currencies are translated into U.S. dollars at the mean of the appropriate currency exchange rate at the close of the NYSE as provided by an independent pricing service.
Fixed income securities maturing within 60 days at the time of purchase may be valued at cost, plus or minus any amortized discount or premium or at the evaluated mean as provided by an independent pricing service. Evaluated mean prices are commonly derived through utilization of market models, which may consider, among other factors: trade data, quotations from dealers and active market makers, relevant yield curve and spread data, related sector levels, creditworthiness, trade data or market information on comparable securities, and other relevant security specific information.
Open-end management investment companies are valued at the reported net asset value per share. Repurchase agreements are valued at cost, which approximates fair value.
If the fund determines that the market price for an investment is not readily available or the valuation methods mentioned above do not reflect an investment’s fair value, such investment is valued as determined in good faith by the Board of Directors or its delegate, in accordance with policies and procedures adopted by the Board of Directors. In its determination of fair value, the fund may review several factors including, but not limited to, market information regarding the specific investment or comparable investments and correlation with other investment types, futures indices or general market indicators. Circumstances that may cause the
17
fund to use these procedures to value an investment include, but are not limited to: an investment has been declared in default or is distressed; trading in a security has been suspended during the trading day or a security is not actively trading on its principal exchange; prices received from a regular pricing source are deemed unreliable; or there is a foreign market holiday and no trading occurred.
The fund monitors for significant events occurring after the close of an investment’s primary exchange but before the fund’s net asset value per share is determined. Significant events may include, but are not limited to: corporate announcements and transactions; governmental action and political unrest that could impact a specific investment or an investment sector; or armed conflicts, natural disasters and similar events that could affect investments in a specific country or region. The fund also monitors for significant fluctuations between domestic and foreign markets, as evidenced by the U.S. market or such other indicators that the Board of Directors, or its delegate, deems appropriate. If significant fluctuations in foreign markets are identified, the fund may apply a model-derived factor to the closing price of equity securities traded on foreign securities exchanges. The factor is based on observable market data as provided by an independent pricing service.
Security Transactions — Security transactions are accounted for as of the trade date. Net realized gains and losses are determined on the identified cost basis, which is also used for federal income tax purposes.
Investment Income — Dividend income less foreign taxes withheld, if any, is recorded as of the ex-dividend date. Distributions received on securities that represent a return of capital or long-term capital gain are recorded as a reduction of cost of investments and/or as a realized gain. The fund may estimate the components of distributions received that may be considered nontaxable distributions or long-term capital gain distributions for income tax purposes. Interest income is recorded on the accrual basis and includes accretion of discounts and amortization of premiums.
Foreign Currency Translations — All assets and liabilities initially expressed in foreign currencies are translated into U.S. dollars at prevailing exchange rates at period end. The fund may enter into spot foreign currency exchange contracts to facilitate transactions denominated in a foreign currency. Purchases and sales of investment securities, dividend and interest income, spot foreign currency exchange contracts, and expenses are translated at the rates of exchange prevailing on the respective dates of such transactions. Net realized and unrealized foreign currency exchange gains or losses related to investment securities are a component of net realized gain (loss) on investment transactions and change in net unrealized appreciation (depreciation) on investments, respectively.
Repurchase Agreements — The fund may enter into repurchase agreements with institutions that ACIM has determined are creditworthy pursuant to criteria adopted by the Board of Directors. The fund requires that the collateral, represented by securities, received in a repurchase transaction be transferred to the custodian in a manner sufficient to enable the fund to obtain those securities in the event of a default under the repurchase agreement. ACIM monitors, on a daily basis, the securities transferred to ensure the value, including accrued interest, of the securities under each repurchase agreement is equal to or greater than amounts owed to the fund under each repurchase agreement.
Joint Trading Account — Pursuant to an Exemptive Order issued by the Securities and Exchange Commission, the fund, along with certain other funds in the American Century Investments family of funds, may transfer uninvested cash balances into a joint trading account. These balances are invested in one or more repurchase agreements that are collateralized by U.S. Treasury or Agency obligations.
Income Tax Status — It is the fund’s policy to distribute substantially all net investment income and net realized gains to shareholders and to otherwise qualify as a regulated investment company under provisions of the Internal Revenue Code. Accordingly, no provision has been made for income taxes. The fund files U.S. federal, state, local and non-U.S. tax returns as applicable. The fund's tax returns are subject to examination by the relevant taxing authority until expiration of the applicable statute of limitations, which is generally three years from the date of filing but can be longer in certain jurisdictions. At this time, management believes there are no uncertain tax positions which, based on their technical merit, would not be sustained upon examination and for which it is reasonably possible that the total amounts of unrecognized tax benefits will significantly change in the next twelve months.
Multiple Class — All shares of the fund represent an equal pro rata interest in the net assets of the class to which such shares belong, and have identical voting, dividend, liquidation and other rights and the same terms and conditions, except for class specific expenses and exclusive rights to vote on matters affecting only individual classes. Income, non-class specific expenses, and realized and unrealized capital gains and losses of the fund are allocated to each class of shares based on their relative net assets.
18
Distributions to Shareholders — Distributions from net investment income and net realized gains, if any, are generally declared and paid annually. The fund may make distributions on a more frequent basis to comply with the distribution requirements of the Internal Revenue Code, in all events in a manner consistent with provisions of the 1940 Act.
Redemption Fees — The fund may impose a 2.00% redemption fee on shares held less than 60 days. The fee may not be applicable to all classes. The redemption fee is retained by the fund and helps cover transaction costs that long-term investors may bear when the fund sells securities to meet investor redemptions.
Indemnifications — Under the corporation’s organizational documents, its officers and directors are indemnified against certain liabilities arising out of the performance of their duties to the fund. In addition, in the normal course of business, the fund enters into contracts that provide general indemnifications. The maximum exposure under these arrangements is unknown as this would involve future claims that may be made against a fund. The risk of material loss from such claims is considered by management to be remote.
3. Fees and Transactions with Related Parties
Certain officers and directors of the corporation are also officers and/or directors of American Century Companies, Inc. (ACC). The corporation’s investment advisor, ACIM, the corporation's distributor, American Century Investment Services, Inc. (ACIS), and the corporation’s transfer agent, American Century Services, LLC, are wholly owned, directly or indirectly, by ACC.
Management Fees — The corporation has entered into a management agreement with ACIM, under which ACIM provides the fund with investment advisory and management services in exchange for a single, unified management fee (the fee) per class. The agreement provides that all expenses of managing and operating the fund, except distribution and service fees, brokerage expenses, taxes, interest, fees and expenses of the independent directors (including legal counsel fees), and extraordinary expenses, will be paid by ACIM. The fee is computed and accrued daily based on each class’s daily net assets and paid monthly in arrears. The rate of the fee is determined by applying a fee rate calculation formula. This formula takes into account the fund’s assets as well as certain assets, if any, of other clients of the investment advisor outside the American Century Investments family of funds (such as subadvised funds and separate accounts) that have very similar investment teams and investment strategies (strategy assets). The annual management fee schedule ranges from 1.050% to 1.300% for the Investor Class, A Class, C Class and R Class. The annual management fee schedule ranges from 0.850% to 1.100% for the Institutional Class and 0.700% to 0.950% for the R6 Class. The effective annual management fee for each class for the year ended November 30, 2014 was 1.08% for the Investor Class, A Class, C Class and R Class, 0.88% for the Institutional Class and 0.73% for the R6 Class.
Distribution and Service Fees — The Board of Directors has adopted a separate Master Distribution and Individual Shareholder Services Plan for each of the A Class, C Class and R Class (collectively the plans), pursuant to Rule 12b-1 of the 1940 Act. The plans provide that the A Class will pay ACIS an annual distribution and service fee of 0.25%. The plans provide that the C Class will pay ACIS an annual distribution and service fee of 1.00%, of which 0.25% is paid for individual shareholder services and 0.75% is paid for distribution services. The plans provide that the R Class will pay ACIS an annual distribution and service fee of 0.50%. The fees are computed and accrued daily based on each class’s daily net assets and paid monthly in arrears. The fees are used to pay financial intermediaries for distribution and individual shareholder services. Fees incurred under the plans during the year ended November 30, 2014 are detailed in the Statement of Operations.
Directors' Fees and Expenses — The Board of Directors is responsible for overseeing the investment advisor’s management and operations of the fund. The directors receive detailed information about the fund and its investment advisor regularly throughout the year, and meet at least quarterly with management of the investment advisor to review reports about fund operations. Fees and expenses incurred in conjunction with the directors during the year ended November 30, 2014 are detailed in the Statement of Operations. The fund’s officers do not receive compensation from the fund.
4. Investment Transactions
Purchases and sales of investment securities, excluding short-term investments, for the year ended November 30, 2014 were $288,900,720 and $276,741,600, respectively.
19
5. Capital Share Transactions
Transactions in shares of the fund were as follows:
Year ended November 30, 2014 | Year ended November 30, 2013(1) | |||||||||
| Shares | Amount | Shares | Amount | |||||||
| Investor Class/Shares Authorized | 200,000,000 | 200,000,000 | ||||||||
| Sold | 3,938,235 | $ | 48,885,183 | 3,867,396 | $ | 41,349,199 | ||||
| Issued in reinvestment of distributions | 1,019,394 | 12,336,801 | 142,377 | 1,459,360 | ||||||
| Redeemed | (4,485,388 | ) | (55,928,846 | ) | (7,522,825 | ) | (80,330,603 | ) | ||
| 472,241 | 5,293,138 | (3,513,052 | ) | (37,522,044 | ) | |||||
| Institutional Class/Shares Authorized | 35,000,000 | 35,000,000 | ||||||||
| Sold | 1,303,256 | 16,573,202 | 2,715,772 | 32,463,147 | ||||||
| Issued in reinvestment of distributions | 191,773 | 2,345,469 | 26,496 | 273,969 | ||||||
| Redeemed | (1,942,389 | ) | (24,606,149 | ) | (1,126,926 | ) | (12,038,152 | ) | ||
| (447,360 | ) | (5,687,478 | ) | 1,615,342 | 20,698,964 | |||||
| A Class/Shares Authorized | 35,000,000 | 35,000,000 | ||||||||
| Sold | 1,276,731 | 15,619,984 | 1,659,451 | 17,366,675 | ||||||
| Issued in reinvestment of distributions | 122,631 | 1,460,436 | 5,001 | 50,611 | ||||||
| Redeemed | (1,351,849 | ) | (16,591,233 | ) | (1,035,690 | ) | (10,762,776 | ) | ||
| 47,513 | 489,187 | 628,762 | 6,654,510 | |||||||
| C Class/Shares Authorized | 10,000,000 | 10,000,000 | ||||||||
| Sold | 196,729 | 2,219,689 | 107,127 | 1,077,402 | ||||||
| Issued in reinvestment of distributions | 11,449 | 125,535 | — | — | ||||||
| Redeemed | (85,886 | ) | (964,322 | ) | (74,025 | ) | (714,493 | ) | ||
| 122,292 | 1,380,902 | 33,102 | 362,909 | |||||||
| R Class/Shares Authorized | 5,000,000 | 5,000,000 | ||||||||
| Sold | 158,047 | 1,930,221 | 276,036 | 2,772,191 | ||||||
| Issued in reinvestment of distributions | 10,431 | 123,748 | — | — | ||||||
| Redeemed | (92,275 | ) | (1,129,865 | ) | (74,809 | ) | (778,299 | ) | ||
| 76,203 | 924,104 | 201,227 | 1,993,892 | |||||||
| R6 Class/Shares Authorized | 50,000,000 | 50,000,000 | ||||||||
| Sold | 1,337,765 | 17,030,076 | 2,228 | 25,000 | ||||||
| Issued in reinvestment of distributions | 67 | 829 | — | — | ||||||
| Redeemed | (44,018 | ) | (557,043 | ) | — | — | ||||
| 1,293,814 | 16,473,862 | 2,228 | 25,000 | |||||||
| Net increase (decrease) | 1,564,703 | $ | 18,873,715 | (1,032,391 | ) | $ | (7,786,769 | ) | ||
(1) July 26, 2013 (commencement of sale) through November 30, 2013 for the R6 Class.
20
6. Fair Value Measurements
The fund’s investments valuation process is based on several considerations and may use multiple inputs to determine the fair value of the investments held by the fund. In conformity with accounting principles generally accepted in the United States of America, the inputs used to determine a valuation are classified into three broad levels.
| • | Level 1 valuation inputs consist of unadjusted quoted prices in an active market for identical investments. |
| • | Level 2 valuation inputs consist of direct or indirect observable market data (including quoted prices for comparable investments, evaluations of subsequent market events, interest rates, prepayment speeds, credit risk, etc.). These inputs also consist of quoted prices for identical investments initially expressed in local currencies that are adjusted through translation into U.S. dollars. |
| • | Level 3 valuation inputs consist of unobservable data (including a fund’s own assumptions). |
The level classification is based on the lowest level input that is significant to the fair valuation measurement. The valuation inputs are not necessarily an indication of the risks associated with investing in these securities or other financial instruments. There were no significant transfers between levels during the period.
The following is a summary of the level classifications as of period end. The Schedule of Investments provides additional information on the fund’s portfolio holdings.
| Level 1 | Level 2 | Level 3 | ||||||
| Assets | ||||||||
| Investment Securities | ||||||||
| Common Stocks | ||||||||
| Australia | — | $ | 4,295,835 | — | ||||
| Brazil | — | 4,810,032 | — | |||||
| Canada | — | 3,431,362 | — | |||||
| China | $ | 11,245,402 | 965,694 | — | ||||
| Denmark | — | 11,079,029 | — | |||||
| France | — | 18,570,259 | — | |||||
| Germany | — | 4,155,560 | — | |||||
| Hong Kong | — | 4,601,404 | — | |||||
| India | 942,829 | 3,784,865 | — | |||||
| Japan | — | 36,642,188 | — | |||||
| Netherlands | 3,196,186 | 12,043,610 | — | |||||
| Russia | — | 3,707,028 | — | |||||
| Spain | — | 8,968,716 | — | |||||
| Sweden | — | 11,701,488 | — | |||||
| Switzerland | — | 29,242,369 | — | |||||
| United Kingdom | 10,702,951 | 51,717,155 | — | |||||
| Other Countries | 384,114,147 | — | — | |||||
| Temporary Cash Investments | — | 4,092,445 | — | |||||
| $ | 410,201,515 | $ | 213,809,039 | — | ||||
7. Risk Factors
There are certain risks involved in investing in foreign securities. These risks include those resulting from future adverse political, social and economic developments, fluctuations in currency exchange rates, the possible imposition of exchange controls, and other foreign laws or restrictions. Investing in emerging markets may accentuate these risks.
21
8. Federal Tax Information
On December 16, 2014, the fund declared and paid a per-share distribution from net realized gains to shareholders of record on December 15, 2014 of $0.8753 for the Investor Class, Institutional Class, A Class, C Class, R Class and R6 Class.
The tax character of distributions paid during the years ended November 30, 2014 and November 30, 2013 were as follows:
| 2014 | 2013 | |||||
| Distributions Paid From | ||||||
| Ordinary income | $ | 3,771,929 | $ | 1,818,631 | ||
| Long-term capital gains | $ | 12,959,063 | — | |||
The book-basis character of distributions made during the year from net investment income or net realized gains may differ from their ultimate characterization for federal income tax purposes. These differences reflect the differing character of certain income items and net realized gains and losses for financial statement and tax purposes, and may result in reclassification among certain capital accounts on the financial statements.
As of November 30, 2014, the federal tax cost of investments and the components of distributable earnings on a tax-basis were as follows:
| Federal tax cost of investments | $ | 462,524,215 | |
| Gross tax appreciation of investments | $ | 167,866,322 | |
| Gross tax depreciation of investments | (6,379,983 | ) | |
| Net tax appreciation (depreciation) of investments | 161,486,339 | ||
| Net tax appreciation (depreciation) on translation of assets and liabilities in foreign currencies | 7,902 | ||
| Net tax appreciation (depreciation) | $ | 161,494,241 | |
| Undistributed ordinary income | — | ||
Accumulated long-term gains | $ | 51,203,057 | |
The difference between book-basis and tax-basis unrealized appreciation (depreciation) is attributable primarily to the realization to ordinary income for tax purposes of unrealized gains on investments in passive foreign investment companies.
22
| Financial Highlights |
| For a Share Outstanding Throughout the Years Ended November 30 (except as noted) | |||||||||||||||
| Per-Share Data | Ratios and Supplemental Data | ||||||||||||||
| Income From Investment Operations: | Distributions From: | Ratio to Average Net Assets of: | |||||||||||||
Net Asset Value, Beginning of Period | Net Investment Income (Loss)(1) | Net Realized and Unrealized Gain (Loss) | Total From Investment Operations | Net Investment Income | Net Realized Gains | Total Distributions | Net Asset Value, End of Period | Total Return(2) | Operating Expenses | Net Investment Income (Loss) | Portfolio Turnover Rate | Net Assets, End of Period (in thousands) | |||
| Investor Class | |||||||||||||||
| 2014 | $12.39 | —(3) | 0.91 | 0.91 | (0.08) | (0.28) | (0.36) | $12.94 | 7.53% | 1.08% | 0.03% | 46% | $462,889 | ||
| 2013 | $9.63 | 0.01 | 2.79 | 2.80 | (0.04) | — | (0.04) | $12.39 | 29.15% | 1.09% | 0.11% | 64% | $437,599 | ||
| 2012 | $8.52 | 0.03 | 1.11 | 1.14 | (0.03) | — | (0.03) | $9.63 | 13.37% | 1.10% | 0.28% | 54% | $373,887 | ||
| 2011 | $8.41 | 0.03 | 0.13 | 0.16 | (0.05) | — | (0.05) | $8.52 | 1.82% | 1.11% | 0.28% | 53% | $322,672 | ||
| 2010 | $7.80 | 0.03 | 0.64 | 0.67 | (0.06) | — | (0.06) | $8.41 | 8.61% | 1.16% | 0.33% | 100% | $344,950 | ||
| Institutional Class | |||||||||||||||
| 2014 | $12.52 | 0.03 | 0.91 | 0.94 | (0.09) | (0.28) | (0.37) | $13.09 | 7.68% | 0.88% | 0.23% | 46% | $78,802 | ||
| 2013 | $9.73 | 0.03 | 2.82 | 2.85 | (0.06) | — | (0.06) | $12.52 | 29.42% | 0.89% | 0.31% | 64% | $80,968 | ||
| 2012 | $8.60 | 0.05 | 1.13 | 1.18 | (0.05) | — | (0.05) | $9.73 | 13.71% | 0.90% | 0.48% | 54% | $47,203 | ||
| 2011 | $8.49 | 0.04 | 0.13 | 0.17 | (0.06) | — | (0.06) | $8.60 | 2.00% | 0.91% | 0.48% | 53% | $35,991 | ||
| 2010 | $7.90 | 0.04 | 0.64 | 0.68 | (0.09) | — | (0.09) | $8.49 | 8.68% | 0.96% | 0.53% | 100% | $45,459 | ||
| A Class | |||||||||||||||
| 2014 | $12.21 | (0.03) | 0.89 | 0.86 | (0.07) | (0.28) | (0.35) | $12.72 | 7.23% | 1.33% | (0.22)% | 46% | $54,091 | ||
| 2013 | $9.49 | (0.02) | 2.75 | 2.73 | (0.01) | — | (0.01) | $12.21 | 28.83% | 1.34% | (0.14)% | 64% | $51,351 | ||
| 2012 | $8.39 | —(3) | 1.10 | 1.10 | —(3) | — | —(3) | $9.49 | 13.16% | 1.35% | 0.03% | 54% | $33,938 | ||
| 2011 | $8.28 | —(3) | 0.13 | 0.13 | (0.02) | — | (0.02) | $8.39 | 1.58% | 1.36% | 0.03% | 53% | $26,908 | ||
| 2010 | $7.67 | 0.01 | 0.62 | 0.63 | (0.02) | — | (0.02) | $8.28 | 8.20% | 1.41% | 0.08% | 100% | $33,641 | ||
23
| For a Share Outstanding Throughout the Years Ended November 30 (except as noted) | |||||||||||||||
| Per-Share Data | Ratios and Supplemental Data | ||||||||||||||
| Income From Investment Operations: | Distributions From: | Ratio to Average Net Assets of: | |||||||||||||
Net Asset Value, Beginning of Period | Net Investment Income (Loss)(1) | Net Realized and Unrealized Gain (Loss) | Total From Investment Operations | Net Investment Income | Net Realized Gains | Total Distributions | Net Asset Value, End of Period | Total Return(2) | Operating Expenses | Net Investment Income (Loss) | Portfolio Turnover Rate | Net Assets, End of Period (in thousands) | |||
| C Class | |||||||||||||||
| 2014 | $11.30 | (0.11) | 0.81 | 0.70 | (0.04) | (0.28) | (0.32) | $11.68 | 6.39% | 2.08% | (0.97)% | 46% | $7,234 | ||
| 2013 | $8.84 | (0.09) | 2.55 | 2.46 | — | — | — | $11.30 | 27.97% | 2.09% | (0.89)% | 64% | $5,615 | ||
| 2012 | $7.87 | (0.06) | 1.03 | 0.97 | — | — | — | $8.84 | 12.20% | 2.10% | (0.72)% | 54% | $4,098 | ||
| 2011 | $7.81 | (0.06) | 0.12 | 0.06 | — | — | — | $7.87 | 0.77% | 2.11% | (0.72)% | 53% | $3,557 | ||
| 2010 | $7.27 | (0.05) | 0.59 | 0.54 | — | — | — | $7.81 | 7.43% | 2.16% | (0.67)% | 100% | $4,579 | ||
| R Class | |||||||||||||||
| 2014 | $12.18 | (0.06) | 0.88 | 0.82 | (0.06) | (0.28) | (0.34) | $12.66 | 7.00% | 1.58% | (0.47)% | 46% | $5,632 | ||
| 2013 | $9.47 | (0.04) | 2.75 | 2.71 | — | — | — | $12.18 | 28.51% | 1.59% | (0.39)% | 64% | $4,489 | ||
| 2012 | $8.39 | (0.02) | 1.10 | 1.08 | — | — | — | $9.47 | 12.87% | 1.60% | (0.22)% | 54% | $1,587 | ||
| 2011 | $8.29 | (0.02) | 0.12 | 0.10 | — | — | — | $8.39 | 1.21% | 1.61% | (0.22)% | 53% | $636 | ||
| 2010 | $7.67 | (0.01) | 0.63 | 0.62 | — | — | — | $8.29 | 8.08% | 1.66% | (0.17)% | 100% | $490 | ||
| R6 Class | |||||||||||||||
| 2014 | $12.53 | 0.02 | 0.93 | 0.95 | (0.09) | (0.28) | (0.37) | $13.11 | 7.80% | 0.73% | 0.38% | 46% | $16,992 | ||
2013(4) | $11.22 | —(3) | 1.31 | 1.31 | — | — | — | $12.53 | 11.68% | 0.74%(5) | 0.00%(5)(6) | 64%(7) | $28 | ||
24
| Notes to Financial Highlights |
| (1) | Computed using average shares outstanding throughout the period. |
| (2) | Total returns are calculated based on the net asset value of the last business day and do not reflect applicable sales charges, if any. Total returns for periods less than one year are not annualized. |
| (3) | Per-share amount was less than $0.005. |
| (4) | July 26, 2013 (commencement of sale) through November 30, 2013. |
| (5) | Annualized. |
| (6) | Ratio was less than 0.005%. |
| (7) | Portfolio turnover is calculated at the fund level. Percentage indicated was calculated for the year ended November 30, 2013. |
See Notes to Financial Statements.
25
| Report of Independent Registered Public Accounting Firm |
To the Board of Directors and Shareholders of
American Century World Mutual Funds, Inc.:
We have audited the accompanying statement of assets and liabilities, including the schedule of investments, of Global Growth Fund (the “Fund”), one of the funds constituting American Century World Mutual Funds, Inc., as of November 30, 2014, and the related statement of operations for the year then ended, the statements of changes in net assets for each of the two years in the period then ended, and the financial highlights for each of the periods presented. These financial statements and financial highlights are the responsibility of the Fund's management. Our responsibility is to express an opinion on these financial statements and financial highlights based on our audits.
We conducted our audits in accordance with the standards of the Public Company Accounting Oversight Board (United States). Those standards require that we plan and perform the audit to obtain reasonable assurance about whether the financial statements and financial highlights are free of material misstatement. The Fund is not required to have, nor were we engaged to perform, an audit of its internal control over financial reporting. Our audits included consideration of internal control over financial reporting as a basis for designing audit procedures that are appropriate in the circumstances, but not for the purpose of expressing an opinion on the effectiveness of the Fund's internal control over financial reporting. Accordingly, we express no such opinion. An audit also includes examining, on a test basis, evidence supporting the amounts and disclosures in the financial statements, assessing the accounting principles used and significant estimates made by management, as well as evaluating the overall financial statement presentation. Our procedures included confirmation of securities owned as of November 30, 2014, by correspondence with the custodian and brokers; where replies were not received from brokers, we performed other auditing procedures. We believe that our audits provide a reasonable basis for our opinion.
In our opinion, the financial statements and financial highlights referred to above present fairly, in all material respects, the financial position of Global Growth Fund of American Century World Mutual Funds, Inc. as of November 30, 2014, the results of its operations for the year then ended, the changes in its net assets for each of the two years in the period then ended, and the financial highlights for each of the periods presented, in conformity with accounting principles generally accepted in the United States of America.
DELOITTE & TOUCHE LLP
Kansas City, Missouri
January 16, 2015
26
| Management |
The Board of Directors
The individuals listed below serve as directors of the funds. Each director will continue to serve in this capacity until death, retirement, resignation or removal from office. The board has adopted a mandatory retirement age for directors who are not “interested persons,” as that term is defined in the Investment Company Act (independent directors). Independent directors shall retire by December 31 of the year in which they reach their 75th birthday.
Mr. Thomas is an “interested person” because he currently serves as President and Chief Executive Officer of American Century Companies, Inc. (ACC), the parent company of American Century Investment Management, Inc. (ACIM or the advisor). Mr. Fink is treated as an “interested person” because of his recent employment with ACC and American Century Services, LLC (ACS). The other directors (more than three-fourths of the total number) are independent. They are not employees, directors or officers of, and have no financial interest in, ACC or any of its wholly owned, direct or indirect, subsidiaries, including ACIM, American Century Investment Services, Inc. (ACIS) and ACS, and they do not have any other affiliations, positions or relationships that would cause them to be considered “interested persons” under the Investment Company Act. The directors serve in this capacity for seven (in the case of Mr. Thomas, 15) registered investment companies in the American Century Investments family of funds.
The following table presents additional information about the directors. The mailing address for each director is 4500 Main Street, Kansas City, Missouri 64111.
Name (Year of Birth) | Position(s) Held with Funds | Length of Time Served | Principal Occupation(s) During Past 5 Years | Number of American Century Portfolios Overseen by Director | Other Directorships Held During Past 5 Years |
| Independent Directors | |||||
Thomas A. Brown (1940) | Director | Since 1980 | Managing Member, Associated Investments, LLC (real estate investment company); Brown Cascade Properties, LLC (real estate investment company) (2001 to 2009) | 73 | None |
Andrea C. Hall (1945) | Director | Since 1997 | Retired | 73 | None |
Jan M. Lewis (1957) | Director | Since 2011 | Retired; President and Chief Executive Officer, Catholic Charities of Northeast Kansas (human services organization) (2006 to 2013) | 73 | None |
James A. Olson (1942) | Director and Chairman of the Board | Since 2007 (Chairman since 2014) | Member, Plaza Belmont LLC (private equity fund manager) | 73 | Saia, Inc. (2002 to 2012) and EPR Properties (2003 to 2013) |
27
Name (Year of Birth) | Position(s) Held with Funds | Length of Time Served | Principal Occupation(s) During Past 5 Years | Number of American Century Portfolios Overseen by Director | Other Directorships Held During Past 5 Years |
| Independent Directors | |||||
M. Jeannine Strandjord (1945) | Director | Since 1994 | Retired | 73 | Euronet Worldwide Inc.; MGP Ingredients, Inc.; Charming Shoppes, Inc. (2006 to 2010); and DST Systems Inc. (1996 to 2012) |
John R. Whitten (1946) | Director | Since 2008 | Retired | 73 | Rudolph Technologies, Inc. |
Stephen E. Yates (1948) | Director | Since 2012 | Retired; Executive Vice President, Technology & Operations, KeyCorp. (computer services) (2004 to 2010) | 73 | Applied Industrial Technologies, Inc. (2001 to 2010) |
| Interested Directors | |||||
Barry Fink (1955) | Director | Since 2012 | Retired; Executive Vice President, ACC (September 2007 to February 2013); President, ACS (October 2007 to February 2013); Chief Operating Officer, ACC (September 2007 to November 2012) | 73 | None |
Jonathan S. Thomas (1963) | Director and President | Since 2007 | President and Chief Executive Officer, ACC (March 2007 to present). Also serves as Chief Executive Officer, ACS; Executive Vice President, ACIM; Director, ACC, ACIM and other ACC subsidiaries | 118 | BioMed Valley Discoveries, Inc. |
The Statement of Additional Information has additional information about the fund's directors and is available without charge, upon request, by calling 1-800-345-2021.
28
Officers
The following table presents certain information about the executive officers of the funds. Each officer serves as an officer for each of the 15 investment companies in the American Century family of funds, unless otherwise noted. No officer is compensated for his or her service as an officer of the funds. The listed officers are interested persons of the funds and are appointed or re-appointed on an annual basis. The mailing address for each officer listed below is 4500 Main Street, Kansas City, Missouri 64111.
Name (Year of Birth) | Offices with the Funds | Principal Occupation(s) During the Past Five Years |
Jonathan S. Thomas (1963) | Director and President since 2007 | President and Chief Executive Officer, ACC (March 2007 to present). Also serves as Chief Executive Officer, ACS; Executive Vice President, ACIM; Director, ACC, ACIM and other ACC subsidiaries |
Amy D. Shelton (1964) | Chief Compliance Officer and Vice President since 2014 | Chief Compliance Officer, American Century funds, (March 2014 to present); Chief Compliance Officer, ACIM (February 2014 to present); Chief Compliance Officer, ACIS (October 2009 to present); Vice President, Client Interactions and Marketing, ACIS (February 2013 to January 2014); Director, Client Interactions and Marketing, ACIS (June 2007 to January 2013). Also serves as Vice President, ACIS |
Charles A. Etherington (1957) | General Counsel since 2007 and Senior Vice President since 2006 | Attorney, ACC (February 1994 to present); Vice President, ACC (November 2005 to present); General Counsel, ACC (March 2007 to present). Also serves as General Counsel, ACIM, ACS, ACIS and other ACC subsidiaries; and Senior Vice President, ACIM and ACS |
C. Jean Wade (1964) | Vice President, Treasurer and Chief Financial Officer since 2012 | Vice President, ACS (February 2000 to present) |
Robert J. Leach (1966) | Vice President since 2006 and Assistant Treasurer since 2012 | Vice President, ACS (February 2000 to present) |
David H. Reinmiller (1963) | Vice President since 2000 | Attorney, ACC (January 1994 to present); Associate General Counsel, ACC (January 2001 to present). Also serves as Vice President, ACIM and ACS |
Ward D. Stauffer (1960) | Secretary since 2005 | Attorney, ACC (June 2003 to present) |
29
| Approval of Management Agreement |
At a meeting held on June 18, 2014, the Fund’s Board of Directors unanimously approved the renewal of the management agreement pursuant to which American Century Investment Management, Inc. (the “Advisor”) acts as the investment advisor for the Fund. Under Section 15(c) of the Investment Company Act, contracts for investment advisory services are required to be reviewed, evaluated, and approved by a majority of a fund’s directors (the “Directors”), including a majority of the independent Directors, each year.
Prior to its consideration of the renewal of the management agreement, the Board requested and reviewed extensive data and information compiled by the Advisor and certain independent providers of evaluation data concerning the Fund and the services provided to the Fund by the Advisor. This review was in addition to the oversight and evaluation undertaken by the Board and its committees on a continuous basis and the information received was supplemental to the extensive information that the Board and its committees receive and consider throughout the year.
In connection with its consideration of the renewal of the management agreement, the Board’s review and evaluation of the services provided by the Advisor included, but was not limited to, the following:
| • | the nature, extent, and quality of investment management, shareholder services, and other services provided by the Advisor to the Fund; |
| • | the wide range of other programs and services the Advisor provides to the Fund and its shareholders on a routine and non-routine basis; |
| • | the Fund’s investment performance compared to appropriate benchmarks and/or a peer group of other mutual funds with similar investment objectives and strategies; |
| • | the cost of owning the Fund compared to the cost of owning similar funds; |
| • | the Advisor’s compliance policies, procedures, and regulatory experience; |
| • | financial data showing the cost of services provided to the Fund, the profitability of the Fund to the Advisor, and the overall profitability of the Advisor; |
| • | possible economies of scale associated with the Advisor’s management of the Fund and other accounts under its management; |
| • | the services provided and charges to other investment management clients of the Advisor; |
| • | acquired fund fees and expenses; and |
| • | any collateral benefits derived by the Advisor from the management of the Fund. |
In keeping with its practice, the Board held two in-person meetings and one telephonic meeting to review and discuss the information provided. The independent Directors also had the benefit of the advice of their independent counsel throughout the process.
Factors Considered
The Directors considered all of the information provided by the Advisor, the independent data providers, and independent counsel, and evaluated such information for the Fund. In connection with their review, the Directors did not identify any single factor as being all-important or controlling, and each Director may have attributed different levels of importance to different factors. In deciding to renew the management agreement, the Board based its decision on a number of factors, including the following:
30
Nature, Extent and Quality of Services — Generally. Under the management agreement, the Advisor is responsible for providing or arranging for all services necessary for the operation of the Fund. The Board noted that under the management agreement, the Advisor provides or arranges at its own expense a wide variety of services including:
| • | constructing and designing the Fund |
| • | portfolio research and security selection |
| • | initial capitalization/funding |
| • | securities trading |
| • | Fund administration |
| • | custody of Fund assets |
| • | daily valuation of the Fund’s portfolio |
| • | shareholder servicing and transfer agency, including shareholder confirmations, recordkeeping, and communications |
| • | legal services (except the independent Directors’ counsel) |
| • | regulatory and portfolio compliance |
| • | financial reporting |
| • | marketing and distribution (except Rule 12b-1 plans) |
The Board noted that many of these services have expanded over time both in terms of quantity and complexity in response to shareholder demands, competition in the industry, changing distribution channels, and the changing regulatory environment.
Investment Management Services. The nature of the investment management services provided to the Fund is quite complex and allows Fund shareholders access to professional money management, instant diversification of their investments within an asset class, the opportunity to easily diversify among asset classes by investing in or exchanging among various American Century Investments funds, and liquidity. In evaluating investment performance, the Board expects the Advisor to manage the Fund in accordance with its investment objectives and approved strategies. Further, the Directors recognize that the Advisor has an obligation to monitor trading activities, and in particular to seek the best execution of fund trades, and to evaluate the use of and payment for research. In providing these services, the Advisor utilizes teams of investment professionals (portfolio managers, analysts, research assistants, and securities traders) who require extensive information technology, research, training, compliance and other systems to conduct their business. The Board, directly and through its Fund Performance Review Committee, regularly reviews investment performance information for the Fund, together with comparative information for appropriate benchmarks and/or peer groups of similarly-managed funds, over different time horizons. The Directors also review detailed performance information during the management agreement approval process. If performance concerns are identified, the Fund receives special reviews until performance improves, during which the Board discusses with the Advisor the reasons for such results (e.g., market conditions, security selection) and any efforts being undertaken to improve performance. The Fund’s performance was above its benchmark for the one-, three-, five-, and ten-year periods reviewed by the Board. The Board found the investment management services provided by the Advisor to the Fund to be satisfactory and consistent with the management agreement.
Shareholder and Other Services. Under the management agreement, the Advisor provides the Fund with a comprehensive package of transfer agency, shareholder, and other services. The Board, directly and through various committees of the Board, regularly reviews reports and evaluations of such services at its regular meetings. These reports include, but are not limited to, information regarding the operational efficiency and accuracy of the shareholder and transfer agency services provided, staffing levels, shareholder satisfaction (as measured by external as well as internal sources), technology support, new products and services offered to Fund shareholders, securities trading activities, portfolio valuation services, auditing services, and legal and operational compliance activities. Certain aspects of shareholder and transfer agency service level efficiency and the quality of securities trading activities are measured by independent third party providers and are presented in comparison to other fund groups not managed by the Advisor. The Board
31
found the services provided by the Advisor to the Fund under the management agreement to be competitive and of high quality.
Costs of Services and Profitability. The Advisor provides detailed information concerning its cost of providing various services to the Fund, its profitability in managing the Fund (pre- and post-distribution), its overall profitability, and its financial condition. The Directors have reviewed with the Advisor the methodology used to prepare this financial information. The financial information regarding the Advisor is considered in evaluating the Advisor’s financial condition, its ability to continue to provide services under the management agreement, and the reasonableness of the current management fee. The Board concluded that the Advisor’s profits were reasonable in light of the services provided to the Fund.
Ethics. The Board generally considers the Advisor’s commitment to providing quality services to shareholders and to conducting its business ethically. They noted that the Advisor’s practices generally meet or exceed industry best practices.
Economies of Scale. The Board also reviewed information provided by the Advisor regarding the possible existence of economies of scale in connection with the management of the Fund. The Board concluded that economies of scale are difficult to measure and predict with precision, especially on a fund-by-fund basis. The Board concluded that the Advisor is appropriately sharing economies of scale through its competitive fee structure, offering competitive fees from fund inception, and through reinvestment in its business to provide shareholders additional content and services.
Comparison to Other Funds’ Fees. The management agreement provides that the Fund pays the Advisor a single, all-inclusive (or unified) management fee for providing all services necessary for the management and operation of the Fund, other than brokerage expenses, taxes, interest, extraordinary expenses, and the fees and expenses of the Fund’s independent directors (including their independent legal counsel) and expenses incurred in connection with the provision of shareholder services and distribution services under a plan adopted pursuant to Rule 12b-1 under the 1940 Act. Under the unified fee structure, the Advisor is responsible for providing all investment advisory, custody, audit, administrative, compliance, recordkeeping, marketing and shareholder services, or arranging and supervising third parties to provide such services. By contrast, most other funds are charged a variety of fees, including an investment advisory fee, a transfer agency fee, an administrative fee, distribution charges and other expenses. Other than their investment advisory fees and any applicable Rule 12b-1 distribution fees, all other components of the total fees charged by these other funds may be increased without shareholder approval. The Board believes the unified fee structure is a benefit to Fund shareholders because it clearly discloses to shareholders the cost of owning Fund shares, and, since the unified fee cannot be increased without a vote of Fund shareholders, it shifts to the Advisor the risk of increased costs of operating the Fund and provides a direct incentive to minimize administrative inefficiencies. Part of the Board’s analysis of fee levels involves reviewing certain evaluative data compiled by an independent provider comparing the Fund’s unified fee to the total expense ratios of its peers. The unified fee charged to shareholders of the Fund was below the median of the total expense ratios of the Fund’s peer expense universe and was within the range of its peer expense group. The Board concluded that the management fee paid by the Fund to the Advisor under the management agreement is reasonable in light of the services provided to the Fund.
Comparison to Fees and Services Provided to Other Clients of the Advisor. The Board also requested and received information from the Advisor concerning the nature of the services, fees, costs and profitability of its advisory services to advisory clients other than the Fund. They observed that these varying types of client accounts require different services and involve different regulatory and entrepreneurial risks than the management of the Fund. The Board analyzed this information and concluded that the fees charged and services provided to the Fund were reasonable by comparison.
32
Collateral or “Fall-Out” Benefits Derived by the Advisor. The Board considered the existence of collateral benefits the Advisor may receive as a result of its relationship with the Fund. They concluded that the Advisor’s primary business is managing mutual funds and it generally does not use fund or shareholder information to generate profits in other lines of business, and therefore does not derive any significant collateral benefits from them. The Board noted that the Advisor receives proprietary research from broker-dealers that execute fund portfolio transactions and concluded that this research is likely to benefit Fund shareholders. The Board also determined that the Advisor is able to provide investment management services to certain clients other than the Fund, at least in part, due to its existing infrastructure built to serve the fund complex. The Board concluded, however, that the assets of those other clients are not material to the analysis and, where applicable, may be included with the assets of the Fund to determine breakpoints in the management fee schedule.
Existing Relationship. The Board also considered whether there was any reason for not continuing the existing arrangement with the Advisor. In this regard, the Board was mindful of the potential disruptions of the Fund’s operations and various risks, uncertainties, and other effects that could occur as a result of a decision not to continue such relationship. In particular, the Board recognized that most shareholders have invested in the Fund on the strength of the Advisor’s industry standing and reputation and in the expectation that the Advisor will have a continuing role in providing advisory services to the Fund.
Conclusion of the Directors. As a result of this process, the Board, including all of the independent Directors, taking into account all of the factors discussed above and the information provided by the Advisor and others, concluded that the management agreement between the Fund and the Advisor is fair and reasonable in light of the services provided and should be renewed.
33
| Additional Information |
Retirement Account Information
As required by law, distributions you receive from certain IRAs are subject to federal income tax withholding, unless you elect not to have withholding apply. Tax will be withheld on the total amount withdrawn even though you may be receiving amounts that are not subject to withholding, such as nondeductible contributions. In such case, excess amounts of withholding could occur. You may adjust your withholding election so that a greater or lesser amount will be withheld.
If you don’t want us to withhold on this amount, you must notify us to not withhold the federal income tax. You may notify us in writing or in certain situations by telephone or through other electronic means. For systematic withdrawals, your withholding election will remain in effect until revoked or changed by filing a new election. You have the right to revoke your election at any time.
Remember, even if you elect not to have income tax withheld, you are liable for paying income tax on the taxable portion of your withdrawal. If you elect not to have income tax withheld or you don’t have enough income tax withheld, you may be responsible for payment of estimated tax. You may incur penalties under the estimated tax rules if your withholding and estimated tax payments are not sufficient. You can reduce or defer the income tax on a distribution by directly or indirectly rolling such distribution over to another IRA or eligible plan. You should consult your tax advisor for additional information.
State tax will be withheld if, at the time of your distribution, your address is within one of the mandatory withholding states and you have federal income tax withheld (or as otherwise required by state law). State taxes will be withheld from your distribution in accordance with the respective state rules.
Distributions you receive from 403(b), 457 and qualified plans are subject to special tax and withholding rules. Your plan administrator or plan sponsor is required to provide you with a special tax notice explaining those rules at the time you request a distribution. If applicable, federal and/or state taxes may be withheld from your distribution amount.
Proxy Voting Policies
A description of the policies that the fund's investment advisor uses in exercising the voting rights associated with the securities purchased and/or held by the fund is available without charge, upon request, by calling 1-800-345-2021. It is also available on the "About Us" page of American Century Investments’ website at americancentury.com and on the Securities and Exchange Commission’s website at sec.gov. Information regarding how the investment advisor voted proxies relating to portfolio securities during the most recent 12-month period ended June 30 is available on the "About Us" page at americancentury.com. It is also available at sec.gov.
Quarterly Portfolio Disclosure
The fund files its complete schedule of portfolio holdings with the Securities and Exchange Commission (SEC) for the first and third quarters of each fiscal year on Form N-Q. The fund’s Forms N-Q are available on the SEC’s website at sec.gov, and may be reviewed and copied at the SEC’s Public Reference Room in Washington, DC. Information on the operation of the Public Reference Room may be obtained by calling 1-800-SEC-0330. The fund also makes its complete schedule of portfolio holdings for the most recent quarter of its fiscal year available on its
website at americancentury.com and, upon request, by calling 1-800-345-2021.
34
Other Tax Information
The following information is provided pursuant to provisions of the Internal Revenue Code.
The fund hereby designates up to the maximum amount allowable as qualified dividend income for the fiscal year ended November 30, 2014.
For corporate taxpayers, the fund hereby designates $2,024,107, or up to the maximum amount allowable, of ordinary income distributions paid during the fiscal year ended November 30, 2014 as qualified for the corporate dividends received deduction.
The fund hereby designates $12,959,063, or up to the maximum amount allowable, as long-term capital gain distributions for the fiscal year ended November 30, 2014.
35
| Notes |
36
| ||
| Contact Us | americancentury.com | |
| Automated Information Line | 1-800-345-8765 | |
| Investor Services Representative | 1-800-345-2021 or 816-531-5575 | |
| Investors Using Advisors | 1-800-378-9878 | |
| Business, Not-For-Profit, Employer-Sponsored Retirement Plans | 1-800-345-3533 | |
| Banks and Trust Companies, Broker-Dealers, Financial Professionals, Insurance Companies | 1-800-345-6488 | |
| Telecommunications Relay Service for the Deaf | 711 | |
| American Century World Mutual Funds, Inc. | ||
Investment Advisor: American Century Investment Management, Inc. Kansas City, Missouri | ||
| This report and the statements it contains are submitted for the general information of our shareholders. The report is not authorized for distribution to prospective investors unless preceded or accompanied by an effective prospectus. | ||
©2015 American Century Proprietary Holdings, Inc. All rights reserved. CL-ANN-84129 1501 | ||
ANNUAL REPORT | NOVEMBER 30, 2014 |
International Discovery Fund
| Table of Contents |
| President’s Letter | |
| Performance | |
| Portfolio Commentary | |
| Fund Characteristics | |
| Shareholder Fee Example | |
| Schedule of Investments | |
| Statement of Assets and Liabilities | |
| Statement of Operations | |
| Statement of Changes in Net Assets | |
| Notes to Financial Statements | |
| Financial Highlights | |
| Report of Independent Registered Public Accounting Firm | |
| Management | |
| Approval of Management Agreement | |
| Additional Information | |
Any opinions expressed in this report reflect those of the author as of the date of the report, and do not necessarily represent the opinions of American Century Investments® or any other person in the American Century Investments organization. Any such opinions are subject to change at any time based upon market or other conditions and American Century Investments disclaims any responsibility to update such opinions. These opinions may not be relied upon as investment advice and, because investment decisions made by American Century Investments funds are based on numerous factors, may not be relied upon as an indication of trading intent on behalf of any American Century Investments fund. Security examples are used for representational purposes only and are not intended as recommendations to purchase or sell securities. Performance information for comparative indices and securities is provided to American Century Investments by third party vendors. To the best of American Century Investments’ knowledge, such information is accurate at the time of printing.
| President’s Letter |
| Dear Investor: Thank you for reviewing this annual report for the 12 months ended November 30, 2014. It provides investment performance and portfolio information for the reporting period, plus longer-term historical performance data. Annual reports remain important vehicles for conveying information about fund returns, including market and economic factors that affected performance during the reporting period. For additional, updated investment and market insights, we encourage you to visit our website, americancentury.com. |
| Jonathan Thomas | |
Favorable Fiscal Year for U.S. Investments, While Non-U.S. Lagged
“Global divergence” between the U.S. and the rest of the world emerged as a prevalent theme during the reporting period. As 2014 approached its conclusion, the U.S. appeared to be on a different economic and monetary policy track than most other nations. This theme covered not only the stronger economic growth enjoyed by the U.S. compared with the rest of the world, but also the related contrast between the U.S. Federal Reserve’s unwinding of monetary stimulus versus the continuation and expansion of monetary stimulus by most other central banks.
Global divergence could also generally describe the broad difference between investment returns for U.S. and non-U.S. markets. The perceived strength, safe-haven qualities, and higher yields of U.S. investments attracted global demand. For the reporting period, the S&P 500 Index, the Barclays U.S. Aggregate Bond Index, and the U.S. Dollar Index returned 16.86%, 5.27%, and 9.34%, respectively. By contrast, for U.S. investors unhedged for currency exposure (the dollar’s strength reduced the returns of non-dollar-denominated securities when they were converted to dollars), the MSCI EAFE Index, the MSCI Emerging Markets Index, and the Barclays Global Aggregate Bond Index (ex-USD, unhedged) returned -0.02%, 1.06%, and -2.53%, respectively.
We expect global divergence in economic growth and monetary policies to continue well into 2015, aligned with expectations that the Federal Reserve might finally start raising short-term U.S. interest rates. However, global economic weakness (reflected in recent commodity price declines) and low inflation might delay the rate hikes until the second half of 2015. In this environment, we continue to believe in a disciplined, diversified, long-term investment approach, using professionally managed stock and bond portfolios to meet financial goals. We appreciate your continued trust in us.
Sincerely,
Jonathan Thomas
President and Chief Executive Officer
American Century Investments
2
| Performance |
| Total Returns as of November 30, 2014 | ||||||
Average Annual Returns | ||||||
Ticker Symbol | 1 year | 5 years | 10 years | Since Inception | Inception Date | |
Investor Class | TWEGX | -1.73% | 8.24% | 7.42% | 10.74% | 4/1/94 |
MSCI All Country World ex-U.S. Mid Cap Growth Index | — | 0.87% | 6.26% | 5.72% | N/A(1) | — |
| Institutional Class | TIDIX | -1.55% | 8.44% | 7.63% | 9.51% | 1/2/98 |
A Class(2) | ACIDX | 4/28/98 | ||||
| No sales charge* | -1.92% | 7.97% | 7.16% | 7.85% | ||
| With sales charge* | -7.53% | 6.71% | 6.53% | 7.46% | ||
| C Class | TWECX | -2.74% | — | — | 7.75% | 3/1/10 |
| R Class | TWERX | -2.19% | — | — | 8.28% | 3/1/10 |
| * | Sales charges include initial sales charges and contingent deferred sales charges (CDSCs), as applicable. A Class shares have a 5.75% maximum initial sales charge and may be subject to a maximum CDSC of 1.00%. C Class shares redeemed within 12 months of purchase are subject to a maximum CDSC of 1.00%. The SEC requires that mutual funds provide performance information net of maximum sales charges in all cases where charges could be applied. |
| (1) | Benchmark data first available June 1994. |
| (2) | Prior to March 1, 2010, the A Class was referred to as the Advisor Class and did not have a front-end sales charge. Performance has been adjusted to reflect this charge. |
Data presented reflect past performance. Past performance is no guarantee of future results. Current performance may be higher or lower than the performance shown. Investment return and principal value will fluctuate, and redemption value may be more or less than original cost. Data assumes reinvestment of dividends and capital gains, and none of the charts reflect the deduction of taxes that a shareholder would pay on fund distributions or the redemption of fund shares. To obtain performance data current to the most recent month end, please call 1-800-345-2021 or visit americancentury.com. For additional information about the fund, please consult the prospectus.
3
| Growth of $10,000 Over 10 Years |
| $10,000 investment made November 30, 2004 |
| Performance for other share classes will vary due to differences in fee structure. |
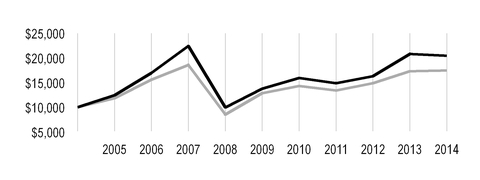
| Value on November 30, 2014 | |
| Investor Class — $20,471 | |
| MSCI All Country World ex-U.S. Mid Cap Growth Index — $17,443 | |
Total Annual Fund Operating Expenses | ||||
Investor Class | Institutional Class | A Class | C Class | R Class |
| 1.56% | 1.36% | 1.81% | 2.56% | 2.06% |
The total annual fund operating expenses shown is as stated in the fund’s prospectus current as of the date of this report. The prospectus may vary from the expense ratio shown elsewhere in this report because it is based on a different time period, includes acquired fund fees and expenses, and, if applicable, does not include fee waivers or expense reimbursements.
Data presented reflect past performance. Past performance is no guarantee of future results. Current performance may be higher or lower than the performance shown. Investment return and principal value will fluctuate, and redemption value may be more or less than original cost. Data assumes reinvestment of dividends and capital gains, and none of the charts reflect the deduction of taxes that a shareholder would pay on fund distributions or the redemption of fund shares. To obtain performance data current to the most recent month end, please call 1-800-345-2021 or visit americancentury.com. For additional information about the fund, please consult the prospectus.
4
| Portfolio Commentary |
Portfolio Managers: Brian Brady and Pratik Patel
As of September 30, 2014, Mark Kopinski left the fund’s management team, and Pratik Patel, who was a senior investment analyst on the fund’s management team, was promoted to portfolio manager.
Performance Summary
International Discovery declined -1.73%* for the 12 months ended November 30, 2014. The portfolio’s benchmark, the MSCI All Country World ex-U.S. Mid Cap Growth Index, advanced 0.87% for the same period.
Non-U.S. stocks generally struggled during the 12-month period, as geopolitical risks and sluggish global growth triggered uncertainty and market volatility. As the period unfolded, global growth decoupled, with the U.S. leading the way. Stronger relative growth in the U.S. led to a divergence in central bank policy, with the U.S. Federal Reserve scaling back its stimulus efforts as other leading central banks, including the European Central Bank (ECB) and the Bank of Japan (BOJ), maintained aggressive programs in response to weakening growth and low inflation. In Europe, growth stalled during the period, and concerns about deflation prompted the ECB to slash its key interest rates and initiate a selective bond-buying program. In Japan, growth weakened following an April 1 hike in the nation’s consumption tax, and late in the period the nation slipped into another recession. The BOJ responded with additional monetary easing, and the government postponed the next scheduled hike in the nation’s consumption tax. Diverging central bank policies also helped trigger a strong U.S. dollar rally, which served to further reduce non-U.S. stock returns for U.S.-based investors. The dollar’s relative strength, combined with mounting global supply/demand imbalances, also caused commodities prices (particularly oil) to weaken.
Meanwhile, political unrest also contributed to the challenging investment backdrop. In particular, the ongoing Russia-Ukraine conflict, mounting turmoil throughout the Middle East, and pro-democracy protests in Hong Kong pressured non-U.S. stocks.
Overall, emerging market stocks outpaced their developed market counterparts, and within the non-U.S. mid cap universe, value stocks generally outperformed growth stocks. Within the fund, stock selection primarily accounted for the underperformance versus the benchmark, particularly within the energy, materials, and consumer discretionary sectors. From a regional perspective, positioning in Canada, Japan, and Norway detracted from the fund’s relative performance.
Energy Companies Weighed on Relative Results
Within the struggling energy sector, portfolio-only positions in Precision Drilling and BW LPG were among the fund’s largest performance detractors. Precision Drilling, a Canada-based oil and gas exploration company, suffered due to the sharp decline in oil prices. Similarly, Norway’s BW LPG, an oil and gas shipping company focused mainly on the transportation of liquefied petroleum gas, declined due to falling oil and gas prices.
Within the materials sector, a portfolio-only position in Finland’s Outokumpu also was a prominent detractor. Stock in the stainless steel manufacturer declined on a weak outlook in Europe, which accounts for approximately 70% of Outokumpu’s volumes. Given this significant exposure to Europe and its fragile economy, we exited the position.
* All fund returns referenced in this commentary are for Investor Class shares. Performance for other share classes will vary due to differences in fee structure; when Investor Class performance exceeds that of the fund's benchmark, other share classes may not. See page 3 for returns for all share classes.
5
Stocks in the U.K., Denmark Were Top Performers
Our stock selection efforts in the U.K., Denmark, and Israel contributed favorably to the fund’s relative performance. Overweight positions relative to the benchmark in Denmark and Israel also lifted results. In terms of sector exposure, stock selection contributed to performance in the financials, industrials, and utilities sectors, as did underweight positions in industrials and utilities.
An overweight position in Denmark’s Pandora was among the fund’s top performers. The jewelry and charm maker and retailer advanced on strong earnings, favorable exposure to U.S. consumers and the improving U.S. economy, expanding store presence (especially in new markets such as China), and successful new product launches.
In addition, within the top-performing U.K. market, an overweight position in Ashtead Group, a construction equipment rental firm, drove results in the fund’s industrials sector and was among the portfolio’s top overall contributors. The company benefited from strong underlying demand and pricing trends, particularly in its key U.S. market. Late in the period, Ashtead said it expected full-year results to exceed previous projections, driving additional stock gains.
A portfolio-only position in China-based Vipshop Holdings also was a main contributor to performance. Growing consumer demand for quality goods, insufficient purchasing channels, and lack of promotional discounts for foreign brands in China have led to a rapidly growing online shopping market. As China’s leading online discount retailer for brands through flash sales, Vipshop has benefited from this trend.
Outlook
Despite the uncertainties in Europe, we continue to rely on our bottom-up stock selection to find companies we believe are demonstrating improving, sustainable growth. Specifically, we remain focused on European-based companies with exposure to the strengthening U.S. economy and those benefiting from company-specific or secular growth stories. We are maintaining an underweight position in Japan, favoring companies we believe can take advantage of a weak yen and firms advancing due to strong secular growth trends. The emerging markets continue to contend with slowing growth and persistent inflationary pressures. We remain selective, focusing on companies we believe are demonstrating sustainable fundamental improvements. We also favor emerging market companies benefiting from strong secular trends, such as growing demand for internet services, social media, and ecommerce in China. We are also finding opportunities in companies with exposure to the U.S. housing market and improved consumer confidence.
6
| Fund Characteristics |
| NOVEMBER 30, 2014 | |
Top Ten Holdings | % of net assets |
| Pandora A/S | 3.2% |
| Ashtead Group plc | 3.0% |
| London Stock Exchange Group plc | 2.8% |
| Linamar Corp. | 2.4% |
| Dixons Carphone plc | 2.3% |
| United Internet AG | 2.2% |
| Lonza Group AG | 2.2% |
| St. James's Place plc | 2.2% |
| GN Store Nord A/S | 1.9% |
| Caesarstone Sdot-Yam Ltd. | 1.9% |
Types of Investments in Portfolio | % of net assets |
| Foreign Common Stocks | 98.6% |
| Temporary Cash Investments | 0.6% |
| Other Assets and Liabilities | 0.8% |
Investments by Country | % of net assets |
| Japan | 17.6% |
| United Kingdom | 13.0% |
| Canada | 8.0% |
| France | 6.3% |
| Germany | 6.3% |
| Denmark | 5.7% |
| Switzerland | 5.7% |
| Australia | 4.8% |
| China | 4.8% |
| Taiwan | 3.9% |
| India | 3.8% |
| Spain | 3.2% |
| Israel | 2.9% |
| Sweden | 2.0% |
| Other Countries | 10.6% |
| Cash and Equivalents* | 1.4% |
*Includes temporary cash investments and other assets and liabilities.
7
| Shareholder Fee Example |
Fund shareholders may incur two types of costs: (1) transaction costs, including sales charges (loads) on purchase payments and redemption/exchange fees; and (2) ongoing costs, including management fees; distribution and service (12b-1) fees; and other fund expenses. This example is intended to help you understand your ongoing costs (in dollars) of investing in your fund and to compare these costs with the ongoing cost of investing in other mutual funds.
The example is based on an investment of $1,000 made at the beginning of the period and held for the entire period from June 1, 2014 to November 30, 2014.
Actual Expenses
The table provides information about actual account values and actual expenses for each class. You may use the information, together with the amount you invested, to estimate the expenses that you paid over the period. First, identify the share class you own. Then simply divide your account value by $1,000 (for example, an $8,600 account value divided by $1,000 = 8.6), then multiply the result by the number under the heading “Expenses Paid During Period” to estimate the expenses you paid on your account during this period.
If you hold Investor Class shares of any American Century Investments fund, or Institutional Class shares of the American Century Diversified Bond Fund, in an American Century Investments account (i.e., not a financial intermediary or retirement plan account), American Century Investments may charge you a $12.50 semiannual account maintenance fee if the value of those shares is less than $10,000. We will redeem shares automatically in one of your accounts to pay the $12.50 fee. In determining your total eligible investment amount, we will include your investments in all personal accounts (including American Century Investments Brokerage accounts) registered under your Social Security number. Personal accounts include individual accounts, joint accounts, UGMA/UTMA accounts, personal trusts, Coverdell Education Savings Accounts and IRAs (including traditional, Roth, Rollover, SEP-, SARSEP- and SIMPLE-IRAs), and certain other retirement accounts. If you have only business, business retirement, employer-sponsored or American Century Investments Brokerage accounts, you are currently not subject to this fee. If you are subject to the Account Maintenance Fee, your account value could be reduced by the fee amount.
Hypothetical Example for Comparison Purposes
The table also provides information about hypothetical account values and hypothetical expenses based on the actual expense ratio of each class of your fund and an assumed rate of return of 5% per year before expenses, which is not the actual return of a fund’s share class. The hypothetical account values and expenses may not be used to estimate the actual ending account balance or expenses you paid for the period. You may use this information to compare the ongoing costs of investing in your fund and other funds. To do so, compare this 5% hypothetical example with the 5% hypothetical examples that appear in the shareholder reports of the other funds.
Please note that the expenses shown in the table are meant to highlight your ongoing costs only and do not reflect any transactional costs, such as sales charges (loads) or redemption/exchange fees. Therefore, the table is useful in comparing ongoing costs only, and will not help you determine the relative total costs of owning different funds. In addition, if these transactional costs were included, your costs would have been higher.
8
Beginning Account Value 6/1/14 | Ending Account Value 11/30/14 | Expenses Paid During Period(1) 6/1/14 - 11/30/14 | Annualized Expense Ratio(1) | |
Actual | ||||
| Investor Class | $1,000 | $925.10 | $8.01 | 1.66% |
| Institutional Class | $1,000 | $925.90 | $7.05 | 1.46% |
| A Class | $1,000 | $924.00 | $9.21 | 1.91% |
| C Class | $1,000 | $920.30 | $12.80 | 2.66% |
| R Class | $1,000 | $923.00 | $10.41 | 2.16% |
Hypothetical | ||||
| Investor Class | $1,000 | $1,016.75 | $8.39 | 1.66% |
| Institutional Class | $1,000 | $1,017.75 | $7.39 | 1.46% |
| A Class | $1,000 | $1,015.49 | $9.65 | 1.91% |
| C Class | $1,000 | $1,011.73 | $13.41 | 2.66% |
| R Class | $1,000 | $1,014.24 | $10.91 | 2.16% |
| (1) | Expenses are equal to the class's annualized expense ratio listed in the table above, multiplied by the average account value over the period, multiplied by 183, the number of days in the most recent fiscal half-year, divided by 365, to reflect the one-half year period. |
9
| Schedule of Investments |
NOVEMBER 30, 2014
| Shares | Value | ||||
| COMMON STOCKS — 98.6% | |||||
| Australia — 4.8% | |||||
| Aristocrat Leisure Ltd. | 1,609,490 | $ | 8,915,545 | ||
| G8 Education Ltd. | 1,417,420 | 5,367,069 | |||
| Ramsay Health Care Ltd. | 183,150 | 8,438,864 | |||
| Seek Ltd. | 307,760 | 4,475,410 | |||
| 27,196,888 | |||||
| Brazil — 0.7% | |||||
| Estacio Participacoes SA | 367,800 | 4,021,249 | |||
| Canada — 8.0% | |||||
| Calfrac Well Services Ltd. | 121,990 | 1,301,511 | |||
| CCL Industries, Inc., Class B | 26,770 | 2,827,998 | |||
| Dollarama, Inc. | 204,920 | 9,601,761 | |||
Element Financial Corp.(1) | 423,660 | 5,361,050 | |||
| Gildan Activewear, Inc. | 148,660 | 8,595,889 | |||
| Linamar Corp. | 235,230 | 13,831,977 | |||
| Precision Drilling Corp. | 635,830 | 4,125,805 | |||
| 45,645,991 | |||||
| China — 4.8% | |||||
| China Gas Holdings Ltd. | 2,770,000 | 5,171,928 | |||
E-Commerce China Dangdang, Inc., A Shares ADR(1) | 250,330 | 2,776,160 | |||
| Haier Electronics Group Co. Ltd. | 742,000 | 2,071,410 | |||
| Shenzhou International Group Holdings Ltd. | 1,635,000 | 5,439,283 | |||
Vipshop Holdings Ltd. ADR(1) | 121,930 | 2,787,320 | |||
YY, Inc. ADR(1) | 59,380 | 4,539,601 | |||
| Zhuzhou CSR Times Electric Co. Ltd., H Shares | 1,000,500 | 4,302,463 | |||
| 27,088,165 | |||||
| Denmark — 5.7% | |||||
| GN Store Nord A/S | 513,390 | 10,964,995 | |||
| Pandora A/S | 202,510 | 17,970,956 | |||
Vestas Wind Systems A/S(1) | 92,080 | 3,391,619 | |||
| 32,327,570 | |||||
| France — 6.3% | |||||
| Groupe Eurotunnel SA | 657,940 | 8,504,311 | |||
Peugeot SA(1) | 719,690 | 9,217,456 | |||
| Teleperformance | 152,210 | 10,627,260 | |||
| Zodiac Aerospace | 235,220 | 7,794,708 | |||
| 36,143,735 | |||||
| Germany — 6.3% | |||||
| Aareal Bank AG | 160,750 | 7,020,947 | |||
| Deutsche Annington Immobilien SE | 195,940 | 6,309,100 | |||
| KUKA AG | 32,010 | 2,421,605 | |||
Morphosys AG(1) | 60,520 | 5,957,827 | |||
10
| Shares | Value | ||||
| Symrise AG | 29,250 | $ | 1,748,168 | ||
| United Internet AG | 282,790 | 12,456,679 | |||
| 35,914,326 | |||||
| Hong Kong — 1.8% | |||||
| Melco Crown Entertainment Ltd. ADR | 225,680 | 5,840,599 | |||
Tianhe Chemicals Group Ltd.(1)(2) | 9,454,000 | 1,682,282 | |||
| Xinyi Solar Holdings Ltd. | 8,910,000 | 2,562,045 | |||
| 10,084,926 | |||||
| India — 3.8% | |||||
| Aurobindo Pharma Ltd. | 204,840 | 3,600,833 | |||
| Bharat Forge Ltd. | 367,460 | 5,714,268 | |||
| Hindustan Petroleum Corp. Ltd. | 263,560 | 2,533,667 | |||
| LIC Housing Finance Ltd. | 727,440 | 4,951,586 | |||
| Yes Bank Ltd. | 441,610 | 5,052,309 | |||
| 21,852,663 | |||||
| Indonesia — 1.2% | |||||
| PT Jasa Marga | 7,599,400 | 4,203,208 | |||
| PT Matahari Department Store Tbk | 2,083,200 | 2,560,472 | |||
| 6,763,680 | |||||
| Ireland — 1.2% | |||||
Bank of Ireland(1) | 16,914,690 | 6,940,749 | |||
| Israel — 2.9% | |||||
| Caesarstone Sdot-Yam Ltd. | 174,510 | 10,819,620 | |||
Mellanox Technologies Ltd.(1) | 134,580 | 5,739,837 | |||
| 16,559,457 | |||||
| Italy — 0.6% | |||||
| Banca Generali SpA | 134,200 | 3,556,021 | |||
| Japan — 17.6% | |||||
| ABC-Mart, Inc. | 24,900 | 1,250,086 | |||
| Brother Industries Ltd. | 209,600 | 3,916,041 | |||
| Century Tokyo Leasing Corp. | 111,300 | 2,751,678 | |||
| Hikari Tsushin, Inc. | 52,400 | 3,407,556 | |||
| Japan Hotel REIT Investment Corp. | 6,200 | 4,031,841 | |||
| Kanamoto Co. Ltd. | 87,600 | 2,848,301 | |||
| Koito Manufacturing Co. Ltd. | 71,600 | 2,246,641 | |||
Leopalace21 Corp.(1) | 400,600 | 2,271,017 | |||
| M3, Inc. | 317,600 | 5,462,993 | |||
| Mabuchi Motor Co. Ltd. | 79,600 | 6,343,057 | |||
| Minebea Co. Ltd. | 407,000 | 5,097,999 | |||
| Nabtesco Corp. | 312,800 | 7,506,779 | |||
| Obayashi Corp. | 473,000 | 2,948,406 | |||
| Ono Pharmaceutical Co. Ltd. | 74,500 | 6,375,942 | |||
| Orix JREIT, Inc. | 1,610 | 2,235,000 | |||
| Rinnai Corp. | 39,400 | 2,927,246 | |||
| Ryohin Keikaku Co. Ltd. | 22,600 | 2,648,073 | |||
| Seiko Epson Corp. | 218,500 | 10,546,308 | |||
| Sohgo Security Services Co. Ltd. | 135,500 | 2,795,262 | |||
11
| Shares | Value | ||||
| Sysmex Corp. | 133,100 | $ | 5,717,980 | ||
| Tadano Ltd. | 176,000 | 2,570,728 | |||
| TDK Corp. | 94,900 | 5,715,664 | |||
| Tokyo Steel Manufacturing Co. Ltd. | 345,600 | 1,839,862 | |||
| Yamaha Motor Co. Ltd. | 315,500 | 6,705,189 | |||
| 100,159,649 | |||||
| Mexico — 0.6% | |||||
| Compartamos SAB de CV | 512,270 | 1,089,451 | |||
| Infraestructura Energetica Nova SAB de CV | 436,340 | 2,561,245 | |||
| 3,650,696 | |||||
| Netherlands — 0.6% | |||||
| Randstad Holding NV | 69,540 | 3,431,543 | |||
| Norway — 0.7% | |||||
BW LPG Ltd.(2) | 256,420 | 1,864,089 | |||
| Hexagon Composites ASA | 758,630 | 2,400,642 | |||
| 4,264,731 | |||||
| Philippines — 1.0% | |||||
| Universal Robina Corp. | 1,283,630 | 5,577,023 | |||
| South Africa — 1.1% | |||||
| Mediclinic International Ltd. | 297,380 | 2,526,512 | |||
| Mr Price Group Ltd. | 188,810 | 4,026,560 | |||
| 6,553,072 | |||||
| South Korea — 1.1% | |||||
| Hanssem Co. Ltd. | 37,430 | 3,935,732 | |||
| Orion Corp. | 2,820 | 2,489,246 | |||
| 6,424,978 | |||||
| Spain — 3.2% | |||||
Almirall SA(1) | 236,970 | 4,089,886 | |||
| Bankinter SA | 575,660 | 5,158,803 | |||
Gamesa Corp. Tecnologica SA(1) | 671,660 | 6,856,793 | |||
| Melia Hotels International SA | 218,070 | 2,223,505 | |||
| 18,328,987 | |||||
| Sweden — 2.0% | |||||
| Boliden AB | 256,070 | 4,327,044 | |||
| Husqvarna AB, B Shares | 725,250 | 5,339,765 | |||
| Tele2 AB, B Shares | 128,250 | 1,660,626 | |||
| 11,327,435 | |||||
| Switzerland — 5.7% | |||||
| ams AG | 163,370 | 6,061,386 | |||
| Aryzta AG | 85,450 | 6,818,313 | |||
| Chocoladefabriken Lindt & Spruengli AG | 1,400 | 7,051,798 | |||
| Lonza Group AG | 105,230 | 12,371,672 | |||
| 32,303,169 | |||||
| Taiwan — 3.9% | |||||
| Advanced Semiconductor Engineering, Inc. | 4,884,000 | 5,925,978 | |||
| Catcher Technology Co. Ltd. | 350,000 | 2,963,083 | |||
| Chailease Holding Co. Ltd. | 2,085,000 | 5,356,087 | |||
12
| Shares | Value | ||||
| Hermes Microvision, Inc. | 169,041 | $ | 8,029,413 | ||
| 22,274,561 | |||||
| United Kingdom — 13.0% | |||||
| Ashtead Group plc | 1,024,360 | 16,864,527 | |||
BTG plc(1) | 283,460 | 3,573,109 | |||
| Croda International plc | 88,840 | 3,405,368 | |||
| Dixons Carphone plc | 1,951,920 | 12,905,987 | |||
| Howden Joinery Group plc | 338,160 | 2,065,813 | |||
| London Stock Exchange Group plc | 454,980 | 16,025,802 | |||
| Persimmon plc | 286,480 | 6,859,894 | |||
| St. James's Place plc | 993,110 | 12,316,826 | |||
| 74,017,326 | |||||
TOTAL COMMON STOCKS (Cost $498,494,644) | 562,408,590 | ||||
| TEMPORARY CASH INVESTMENTS — 0.6% | |||||
| Repurchase Agreement, Bank of America Merrill Lynch, (collateralized by various U.S. Treasury obligations, 0.875% - 1.50%, 6/30/16 - 12/31/16, valued at $2,315,058), in a joint trading account at 0.06%, dated 11/28/14, due 12/1/14 (Delivery value $2,268,527) | 2,268,516 | ||||
| Repurchase Agreement, Credit Suisse First Boston, Inc., (collateralized by various U.S. Treasury obligations, 3.00%, 9/30/16, valued at $925,692), in a joint trading account at 0.02%, dated 11/28/14, due 12/1/14 (Delivery value $907,409) | 907,407 | ||||
TOTAL TEMPORARY CASH INVESTMENTS (Cost $3,175,923) | 3,175,923 | ||||
TOTAL INVESTMENT SECURITIES — 99.2% (Cost $501,670,567) | 565,584,513 | ||||
| OTHER ASSETS AND LIABILITIES — 0.8% | 4,534,660 | ||||
| TOTAL NET ASSETS — 100.0% | $ | 570,119,173 | |||
| MARKET SECTOR DIVERSIFICATION | ||
(as a % of net assets) | ||
| Consumer Discretionary | 28.4 | % |
| Industrials | 18.4 | % |
| Financials | 16.0 | % |
| Health Care | 12.1 | % |
| Information Technology | 12.0 | % |
| Materials | 4.7 | % |
| Consumer Staples | 3.8 | % |
| Energy | 1.6 | % |
| Utilities | 1.3 | % |
| Telecommunication Services | 0.3 | % |
| Cash and Equivalents* | 1.4 | % |
*Includes temporary cash investments and other assets and liabilities.
| NOTES TO SCHEDULE OF INVESTMENTS | ||
| ADR | - | American Depositary Receipt |
| (1) | Non-income producing. |
| (2) | Restricted security exempt from registration pursuant to Rule 144A under the Securities Act of 1933. These securities may be sold without restriction to qualified institutional investors and have been deemed liquid under policies approved by the Board of Directors. The aggregate value of these securities at the period end was $3,546,371, which represented 0.6% of total net assets. |
See Notes to Financial Statements.
13
| Statement of Assets and Liabilities |
| NOVEMBER 30, 2014 | |||
| Assets | |||
| Investment securities, at value (cost of $501,670,567) | $ | 565,584,513 | |
| Cash | 2,096,908 | ||
| Foreign currency holdings, at value (cost of $72,452) | 68,518 | ||
| Receivable for investments sold | 3,202,216 | ||
| Receivable for capital shares sold | 124,338 | ||
| Dividends and interest receivable | 596,362 | ||
| Other assets | 122,188 | ||
| 571,795,043 | |||
| Liabilities | |||
| Payable for investments purchased | 577,351 | ||
| Payable for capital shares redeemed | 370,905 | ||
| Accrued management fees | 725,973 | ||
| Distribution and service fees payable | 1,641 | ||
| 1,675,870 | |||
| Net Assets | $ | 570,119,173 | |
| Net Assets Consist of: | |||
| Capital (par value and paid-in surplus) | $ | 670,449,135 | |
| Distributions in excess of net investment income | (2,491,942 | ) | |
| Accumulated net realized loss | (161,646,715 | ) | |
| Net unrealized appreciation | 63,808,695 | ||
| $ | 570,119,173 | ||
| Net Assets | Shares Outstanding | Net Asset Value Per Share | ||||
| Investor Class, $0.01 Par Value | $541,410,026 | 43,839,741 | $12.35 | |||
| Institutional Class, $0.01 Par Value | $22,303,777 | 1,783,896 | $12.50 | |||
| A Class, $0.01 Par Value | $5,576,135 | 463,649 | $12.03* | |||
| C Class, $0.01 Par Value | $455,718 | 37,943 | $12.01 | |||
| R Class, $0.01 Par Value | $373,517 | 30,577 | $12.22 | |||
*Maximum offering price $12.76 (net asset value divided by 0.9425).
See Notes to Financial Statements.
14
| Statement of Operations |
| YEAR ENDED NOVEMBER 30, 2014 | |||
| Investment Income (Loss) | |||
| Income: | |||
| Dividends (net of foreign taxes withheld of $896,447) | $ | 11,794,819 | |
| Interest | 1,268 | ||
| 11,796,087 | |||
| Expenses: | |||
| Management fees | 9,874,300 | ||
| Distribution and service fees: | |||
| A Class | 11,898 | ||
| C Class | 4,506 | ||
| R Class | 2,101 | ||
| Directors' fees and expenses | 538,351 | ||
| Other expenses | 3,050 | ||
| 10,434,206 | |||
| Net investment income (loss) | 1,361,881 | ||
| Realized and Unrealized Gain (Loss) | |||
| Net realized gain (loss) on: | |||
| Investment transactions | 53,702,418 | ||
| Foreign currency transactions | (370,113 | ) | |
| 53,332,305 | |||
| Change in net unrealized appreciation (depreciation) on: | |||
| Investments | (62,686,420 | ) | |
| Translation of assets and liabilities in foreign currencies | (45,422 | ) | |
| (62,731,842 | ) | ||
| Net realized and unrealized gain (loss) | (9,399,537 | ) | |
| Net Increase (Decrease) in Net Assets Resulting from Operations | $ | (8,037,656 | ) |
See Notes to Financial Statements.
15
| Statement of Changes in Net Assets |
| YEARS ENDED NOVEMBER 30, 2014 AND NOVEMBER 30, 2013 | ||||||
| Increase (Decrease) in Net Assets | November 30, 2014 | November 30, 2013 | ||||
| Operations | ||||||
| Net investment income (loss) | $ | 1,361,881 | $ | 249,567 | ||
| Net realized gain (loss) | 53,332,305 | 128,353,831 | ||||
| Change in net unrealized appreciation (depreciation) | (62,731,842 | ) | 25,999,876 | |||
| Net increase (decrease) in net assets resulting from operations | (8,037,656 | ) | 154,603,274 | |||
| Distributions to Shareholders | ||||||
| From net investment income: | ||||||
| Investor Class | (6,710,325 | ) | (8,871,910 | ) | ||
| Institutional Class | (445,178 | ) | (778,029 | ) | ||
| A Class | (31,274 | ) | (41,551 | ) | ||
| C Class | (1,497 | ) | (566 | ) | ||
| R Class | (1,905 | ) | (3,285 | ) | ||
| Decrease in net assets from distributions | (7,190,179 | ) | (9,695,341 | ) | ||
| Capital Share Transactions | ||||||
| Net increase (decrease) in net assets from capital share transactions (Note 5) | (66,706,975 | ) | (127,252,463 | ) | ||
| Redemption Fees | ||||||
| Increase in net assets from redemption fees | 39,362 | 12,796 | ||||
| Net increase (decrease) in net assets | (81,895,448 | ) | 17,668,266 | |||
| Net Assets | ||||||
| Beginning of period | 652,014,621 | 634,346,355 | ||||
| End of period | $ | 570,119,173 | $ | 652,014,621 | ||
| Undistributed (distributions in excess of) net investment income | $ | (2,491,942 | ) | $ | 2,027,726 | |
See Notes to Financial Statements.
16
| Notes to Financial Statements |
NOVEMBER 30, 2014
1. Organization
American Century World Mutual Funds, Inc. (the corporation) is registered under the Investment Company Act of 1940, as amended (the 1940 Act), as an open-end management investment company and is organized as a Maryland corporation. International Discovery Fund (the fund) is one fund in a series issued by the corporation. The fund is diversified as defined under the 1940 Act. The fund's investment objective is to seek capital growth.
The fund offers the Investor Class, the Institutional Class, the A Class, the C Class and the R Class. The A Class may incur an initial sales charge. The A Class and C Class may be subject to a contingent deferred sales charge. The share classes differ principally in their respective sales charges and distribution and shareholder servicing expenses and arrangements. The Institutional Class is made available to institutional shareholders or through financial intermediaries whose clients do not require the same level of shareholder and administrative services as shareholders of other classes. As a result, the Institutional Class is charged a lower unified management fee.
2. Significant Accounting Policies
The following is a summary of significant accounting policies consistently followed by the fund in preparation of its financial statements. The fund is an investment company and follows accounting and reporting guidance in accordance with accounting principles generally accepted in the United States of America. This may require management to make certain estimates and assumptions at the date of the financial statements. Actual results could differ from these estimates. Management evaluated the impact of events or transactions occurring through the date the financial statements were issued that would merit recognition or disclosure.
Investment Valuations — The fund determines the fair value of its investments and computes its net asset value per share at the close of regular trading (usually 4 p.m. Eastern time) on the New York Stock Exchange (NYSE) on each day the NYSE is open. The Board of Directors has adopted valuation policies and procedures to guide the investment advisor in the fund’s investment valuation process and to provide methodologies for the oversight of the fund’s pricing function.
Equity securities that are listed or traded on a domestic securities exchange are valued at the last reported sales price or at the official closing price as provided by the exchange. Equity securities traded on foreign securities exchanges are generally valued at the closing price of such securities on the exchange where primarily traded or at the close of the NYSE, if that is earlier. If no last sales price is reported, or if local convention or regulation so provides, the mean of the latest bid and asked prices may be used. Securities traded over-the-counter are valued at the mean of the latest bid and asked prices, the last sales price, or the official closing price. Equity securities initially expressed in local currencies are translated into U.S. dollars at the mean of the appropriate currency exchange rate at the close of the NYSE as provided by an independent pricing service.
Fixed income securities maturing within 60 days at the time of purchase may be valued at cost, plus or minus any amortized discount or premium or at the evaluated mean as provided by an independent pricing service. Evaluated mean prices are commonly derived through utilization of market models, which may consider, among other factors: trade data, quotations from dealers and active market makers, relevant yield curve and spread data, related sector levels, creditworthiness, trade data or market information on comparable securities, and other relevant security specific information.
Open-end management investment companies are valued at the reported net asset value per share. Repurchase agreements are valued at cost, which approximates fair value.
If the fund determines that the market price for an investment is not readily available or the valuation methods mentioned above do not reflect an investment’s fair value, such investment is valued as determined in good faith by the Board of Directors or its delegate, in accordance with policies and procedures adopted by the Board of Directors. In its determination of fair value, the fund may review several factors including, but not limited to, market information regarding the specific investment or comparable investments and correlation with other investment types, futures indices or general market indicators. Circumstances that may cause the
17
fund to use these procedures to value an investment include, but are not limited to: an investment has been declared in default or is distressed; trading in a security has been suspended during the trading day or a security is not actively trading on its principal exchange; prices received from a regular pricing source are deemed unreliable; or there is a foreign market holiday and no trading occurred.
The fund monitors for significant events occurring after the close of an investment’s primary exchange but before the fund’s net asset value per share is determined. Significant events may include, but are not limited to: corporate announcements and transactions; governmental action and political unrest that could impact a specific investment or an investment sector; or armed conflicts, natural disasters and similar events that could affect investments in a specific country or region. The fund also monitors for significant fluctuations between domestic and foreign markets, as evidenced by the U.S. market or such other indicators that the Board of Directors, or its delegate, deems appropriate. If significant fluctuations in foreign markets are identified, the fund may apply a model-derived factor to the closing price of equity securities traded on foreign securities exchanges. The factor is based on observable market data as provided by an independent pricing service.
Security Transactions — Security transactions are accounted for as of the trade date. Net realized gains and losses are determined on the identified cost basis, which is also used for federal income tax purposes.
Investment Income — Dividend income less foreign taxes withheld, if any, is recorded as of the ex-dividend date. Distributions received on securities that represent a return of capital or long-term capital gain are recorded as a reduction of cost of investments and/or as a realized gain. The fund may estimate the components of distributions received that may be considered nontaxable distributions or long-term capital gain distributions for income tax purposes. Interest income is recorded on the accrual basis and includes accretion of discounts and amortization of premiums.
Foreign Currency Translations — All assets and liabilities initially expressed in foreign currencies are translated into U.S. dollars at prevailing exchange rates at period end. The fund may enter into spot foreign currency exchange contracts to facilitate transactions denominated in a foreign currency. Purchases and sales of investment securities, dividend and interest income, spot foreign currency exchange contracts, and expenses are translated at the rates of exchange prevailing on the respective dates of such transactions. Net realized and unrealized foreign currency exchange gains or losses related to investment securities are a component of net realized gain (loss) on investment transactions and change in net unrealized appreciation (depreciation) on investments, respectively.
Repurchase Agreements — The fund may enter into repurchase agreements with institutions that American Century Investment Management, Inc. (ACIM) (the investment advisor) has determined are creditworthy pursuant to criteria adopted by the Board of Directors. The fund requires that the collateral, represented by securities, received in a repurchase transaction be transferred to the custodian in a manner sufficient to enable the fund to obtain those securities in the event of a default under the repurchase agreement. ACIM monitors, on a daily basis, the securities transferred to ensure the value, including accrued interest, of the securities under each repurchase agreement is equal to or greater than amounts owed to the fund under each repurchase agreement.
Joint Trading Account — Pursuant to an Exemptive Order issued by the Securities and Exchange Commission, the fund, along with certain other funds in the American Century Investments family of funds, may transfer uninvested cash balances into a joint trading account. These balances are invested in one or more repurchase agreements that are collateralized by U.S. Treasury or Agency obligations.
Income Tax Status — It is the fund’s policy to distribute substantially all net investment income and net realized gains to shareholders and to otherwise qualify as a regulated investment company under provisions of the Internal Revenue Code. Accordingly, no provision has been made for income taxes. The fund files U.S. federal, state, local and non-U.S. tax returns as applicable. The fund's tax returns are subject to examination by the relevant taxing authority until expiration of the applicable statute of limitations, which is generally three years from the date of filing but can be longer in certain jurisdictions. At this time, management believes there are no uncertain tax positions which, based on their technical merit, would not be sustained upon examination and for which it is reasonably possible that the total amounts of unrecognized tax benefits will significantly change in the next twelve months.
Multiple Class — All shares of the fund represent an equal pro rata interest in the net assets of the class to which such shares belong, and have identical voting, dividend, liquidation and other rights and the same terms and conditions, except for class specific expenses and exclusive rights to vote on matters affecting only individual classes. Income, non-class specific expenses, and realized and unrealized capital gains and losses of the fund are allocated to each class of shares based on their relative net assets.
18
Distributions to Shareholders — Distributions from net investment income and net realized gains, if any, are generally declared and paid annually. The fund may make distributions on a more frequent basis to comply with the distribution requirements of the Internal Revenue Code, in all events in a manner consistent with provisions of the 1940 Act.
Redemption Fees — The fund may impose a 2.00% redemption fee on shares held less than 60 days. The fee may not be applicable to all classes. The redemption fee is retained by the fund and helps cover transaction costs that long-term investors may bear when the fund sells securities to meet investor redemptions.
Indemnifications — Under the corporation’s organizational documents, its officers and directors are indemnified against certain liabilities arising out of the performance of their duties to the fund. In addition, in the normal course of business, the fund enters into contracts that provide general indemnifications. The maximum exposure under these arrangements is unknown as this would involve future claims that may be made against a fund. The risk of material loss from such claims is considered by management to be remote.
3. Fees and Transactions with Related Parties
Certain officers and directors of the corporation are also officers and/or directors of American Century Companies, Inc. (ACC). The corporation’s investment advisor, ACIM, the corporation's distributor, American Century Investment Services, Inc. (ACIS), and the corporation’s transfer agent, American Century Services, LLC, are wholly owned, directly or indirectly, by ACC.
Management Fees — The corporation has entered into a management agreement with ACIM, under which ACIM provides the fund with investment advisory and management services in exchange for a single, unified management fee (the fee) per class. The agreement provides that all expenses of managing and operating the fund, except distribution and service fees, brokerage expenses, taxes, interest, fees and expenses of the independent directors (including legal counsel fees), and extraordinary expenses, will be paid by ACIM. The fee is computed and accrued daily based on each class’s daily net assets and paid monthly in arrears. The rate of the fee is determined by applying a fee rate calculation formula. This formula takes into account the fund’s assets as well as certain assets, if any, of other clients of the investment advisor outside the American Century Investments family of funds (such as subadvised funds and separate accounts) that have very similar investment teams and investment strategies (strategy assets). The annual management fee schedule ranges from 1.200% to 1.750% for the Investor Class, A Class, C Class and R Class. The annual management fee schedule ranges from 1.000% to 1.550% for the Institutional Class. The effective annual management fee for each class for the year ended November 30, 2014 was 1.53% for the Investor Class, A Class, C Class and R Class and 1.33% for the Institutional Class.
Distribution and Service Fees — The Board of Directors has adopted a separate Master Distribution and Individual Shareholder Services Plan for each of the A Class, C Class and R Class (collectively the plans), pursuant to Rule 12b-1 of the 1940 Act. The plans provide that the A Class will pay ACIS an annual distribution and service fee of 0.25%. The plans provide that the C Class will pay ACIS an annual distribution and service fee of 1.00%, of which 0.25% is paid for individual shareholder services and 0.75% is paid for distribution services. The plans provide that the R Class will pay ACIS an annual distribution and service fee of 0.50%. The fees are computed and accrued daily based on each class’s daily net assets and paid monthly in arrears. The fees are used to pay financial intermediaries for distribution and individual shareholder services. Fees incurred under the plans during the year ended November 30, 2014 are detailed in the Statement of Operations.
Directors' Fees and Expenses — The Board of Directors is responsible for overseeing the investment advisor’s management and operations of the fund. The directors receive detailed information about the fund and its investment advisor regularly throughout the year, and meet at least quarterly with management of the investment advisor to review reports about fund operations. Fees and expenses incurred in conjunction with the directors during the year ended November 30, 2014 are detailed in the Statement of Operations. The impact of directors' fees and expenses (including legal counsel fees) to the ratio of operating expenses to average net assets was 0.08% for the year ended November 30, 2014. The fund’s officers do not receive compensation from the fund.
4. Investment Transactions
Purchases and sales of investment securities, excluding short-term investments, for the year ended November 30, 2014 were $860,781,278 and $933,975,092, respectively.
19
5. Capital Share Transactions
Transactions in shares of the fund were as follows:
Year ended November 30, 2014 | Year ended November 30, 2013 | |||||||||
| Shares | Amount | Shares | Amount | |||||||
| Investor Class/Shares Authorized | 400,000,000 | 400,000,000 | ||||||||
| Sold | 4,156,039 | $ | 55,774,195 | 1,547,181 | $ | 17,131,175 | ||||
| Issued in reinvestment of distributions | 493,153 | 6,430,257 | 795,041 | 8,371,778 | ||||||
| Redeemed | (9,653,900 | ) | (126,648,667 | ) | (11,283,868 | ) | (122,824,641 | ) | ||
| (5,004,708 | ) | (64,444,215 | ) | (8,941,646 | ) | (97,321,688 | ) | |||
| Institutional Class/Shares Authorized | 70,000,000 | 70,000,000 | ||||||||
| Sold | 1,492,577 | 20,057,215 | 264,674 | 2,892,178 | ||||||
| Issued in reinvestment of distributions | 33,648 | 444,778 | 73,013 | 777,585 | ||||||
| Redeemed | (1,868,085 | ) | (25,112,803 | ) | (2,993,465 | ) | (33,838,869 | ) | ||
| (341,860 | ) | (4,610,810 | ) | (2,655,778 | ) | (30,169,106 | ) | |||
| A Class/Shares Authorized | 10,000,000 | 10,000,000 | ||||||||
| Sold | 251,885 | 3,206,500 | 145,076 | 1,601,685 | ||||||
| Issued in reinvestment of distributions | 2,425 | 31,274 | 3,872 | 39,768 | ||||||
| Redeemed | (80,633 | ) | (1,025,435 | ) | (148,232 | ) | (1,628,334 | ) | ||
| 173,677 | 2,212,339 | 716 | 13,119 | |||||||
| C Class/Shares Authorized | 10,000,000 | 10,000,000 | ||||||||
| Sold | 24,659 | 311,509 | 27,306 | 303,661 | ||||||
| Issued in reinvestment of distributions | 113 | 1,497 | 55 | 566 | ||||||
| Redeemed | (14,404 | ) | (177,537 | ) | (9,219 | ) | (97,824 | ) | ||
| 10,368 | 135,469 | 18,142 | 206,403 | |||||||
| R Class/Shares Authorized | 10,000,000 | 10,000,000 | ||||||||
| Sold | 9,628 | 127,326 | 2,569 | 28,230 | ||||||
| Issued in reinvestment of distributions | 141 | 1,905 | 315 | 3,285 | ||||||
| Redeemed | (10,089 | ) | (128,989 | ) | (1,158 | ) | (12,706 | ) | ||
| (320 | ) | 242 | 1,726 | 18,809 | ||||||
| Net increase (decrease) | (5,162,843 | ) | $ | (66,706,975 | ) | (11,576,840 | ) | $ | (127,252,463 | ) |
20
6. Fair Value Measurements
The fund’s investments valuation process is based on several considerations and may use multiple inputs to determine the fair value of the investments held by the fund. In conformity with accounting principles generally accepted in the United States of America, the inputs used to determine a valuation are classified into three broad levels.
| • | Level 1 valuation inputs consist of unadjusted quoted prices in an active market for identical investments. |
| • | Level 2 valuation inputs consist of direct or indirect observable market data (including quoted prices for comparable investments, evaluations of subsequent market events, interest rates, prepayment speeds, credit risk, etc.). These inputs also consist of quoted prices for identical investments initially expressed in local currencies that are adjusted through translation into U.S. dollars. |
| • | Level 3 valuation inputs consist of unobservable data (including a fund’s own assumptions). |
The level classification is based on the lowest level input that is significant to the fair valuation measurement. The valuation inputs are not necessarily an indication of the risks associated with investing in these securities or other financial instruments. There were no significant transfers between levels during the period.
The following is a summary of the level classifications as of period end. The Schedule of Investments provides additional information on the fund’s portfolio holdings.
| Level 1 | Level 2 | Level 3 | ||||||
| Assets | ||||||||
| Investment Securities | ||||||||
| Common Stocks | ||||||||
| China | $ | 10,103,081 | $ | 16,985,084 | — | |||
| Hong Kong | 5,840,599 | 4,244,327 | — | |||||
| Israel | 16,559,457 | — | — | |||||
| Other Countries | — | 508,676,042 | — | |||||
| Temporary Cash Investments | — | 3,175,923 | — | |||||
| $ | 32,503,137 | $ | 533,081,376 | — | ||||
7. Risk Factors
There are certain risks involved in investing in foreign securities. These risks include those resulting from future adverse political, social and economic developments, fluctuations in currency exchange rates, the possible imposition of exchange controls, and other foreign laws or restrictions. Investing in emerging markets may accentuate these risks.
The fund invests in common stocks of small companies. Because of this, the fund may be subject to greater risk and market fluctuations than a fund investing in larger, more established companies.
The fund’s investment process may result in high portfolio turnover, which could mean high transaction costs, affecting both performance and capital gains tax liabilities to investors.
8. Federal Tax Information
The tax character of distributions paid during the years ended November 30, 2014 and November 30, 2013 were as follows:
| 2014 | 2013 | |||||
| Distributions Paid From | ||||||
| Ordinary income | $ | 7,190,179 | $ | 9,695,341 | ||
| Long-term capital gains | — | — | ||||
21
The book-basis character of distributions made during the year from net investment income or net realized gains may differ from their ultimate characterization for federal income tax purposes. These differences reflect the differing character of certain income items and net realized gains and losses for financial statement and tax purposes, and may result in reclassification among certain capital accounts on the financial statements.
As of November 30, 2014, the federal tax cost of investments and the components of distributable earnings on a tax-basis were as follows:
| Federal tax cost of investments | $ | 507,164,320 | |
| Gross tax appreciation of investments | $ | 76,486,569 | |
| Gross tax depreciation of investments | (18,066,376 | ) | |
| Net tax appreciation (depreciation) of investments | 58,420,193 | ||
Net tax appreciation (depreciation) on translation of assets and liabilities in foreign currencies | (105,251 | ) | |
Net tax appreciation (depreciation) | $ | 58,314,942 | |
| Undistributed ordinary income | $ | 1,163,672 | |
| Accumulated short-term capital losses | $ | (146,565,779 | ) |
| Post-October capital loss deferral | $ | (13,242,797 | ) |
The difference between book-basis and tax-basis unrealized appreciation (depreciation) is attributable primarily to the realization to ordinary income for tax purposes of unrealized gains on investments in passive foreign investment companies.
Accumulated capital losses represent net capital loss carryovers that may be used to offset future realized capital gains for federal income tax purposes. Future capital loss carryover utilization in any given year may be subject to Internal Revenue Code limitations. Capital loss carryovers expire in 2017.
Loss deferrals represent certain qualified losses that the fund has elected to treat as having been incurred in the following fiscal year for federal income tax purposes.
22
| Financial Highlights |
| For a Share Outstanding Throughout the Years Ended November 30 (except as noted) | |||||||||||||
| Per-Share Data | Ratios and Supplemental Data | ||||||||||||
| Income From Investment Operations: | Ratio to Average Net Assets of: | ||||||||||||
Net Asset Value, Beginning of Period | Net Investment Income (Loss)(1) | Net Realized and Unrealized Gain (Loss) | Total From Investment Operations | Distributions From Net Investment Income | Net Asset Value, End of Period | Total Return(2) | Operating Expenses | Net Investment Income (Loss) | Portfolio Turnover Rate | Net Assets, End of Period (in thousands) | |||
| Investor Class | |||||||||||||
| 2014 | $12.70 | 0.03 | (0.24) | (0.21) | (0.14) | $12.35 | (1.73)% | 1.61% | 0.20% | 134% | $541,410 | ||
| 2013 | $10.08 | —(3) | 2.79 | 2.79 | (0.17) | $12.70 | 27.97% | 1.56% | 0.03% | 157% | $620,359 | ||
| 2012 | $9.22 | 0.04 | 0.82 | 0.86 | —(3) | $10.08 | 9.23% | 1.50% | 0.42% | 154% | $582,331 | ||
| 2011 | $9.88 | 0.02 | (0.68) | (0.66) | — | $9.22 | (6.58)% | 1.42% | 0.14% | 167% | $660,971 | ||
| 2010 | $8.55 | —(3) | 1.35 | 1.35 | (0.02) | $9.88 | 15.80% | 1.43% | 0.00%(4) | 199% | $878,530 | ||
| Institutional Class | |||||||||||||
| 2014 | $12.86 | 0.06 | (0.25) | (0.19) | (0.17) | $12.50 | (1.55)% | 1.41% | 0.40% | 134% | $22,304 | ||
| 2013 | $10.20 | 0.05 | 2.80 | 2.85 | (0.19) | $12.86 | 28.16% | 1.36% | 0.23% | 157% | $27,341 | ||
| 2012 | $9.34 | 0.05 | 0.83 | 0.88 | (0.02) | $10.20 | 9.44% | 1.30% | 0.62% | 154% | $48,794 | ||
| 2011 | $9.99 | 0.03 | (0.68) | (0.65) | — | $9.34 | (6.41)% | 1.22% | 0.34% | 167% | $97,063 | ||
| 2010 | $8.66 | 0.02 | 1.36 | 1.38 | (0.05) | $9.99 | 16.06% | 1.23% | 0.20% | 199% | $97,167 | ||
23
| For a Share Outstanding Throughout the Years Ended November 30 (except as noted) | |||||||||||||
| Per-Share Data | Ratios and Supplemental Data | ||||||||||||
| Income From Investment Operations: | Ratio to Average Net Assets of: | ||||||||||||
Net Asset Value, Beginning of Period | Net Investment Income (Loss)(1) | Net Realized and Unrealized Gain (Loss) | Total From Investment Operations | Distributions From Net Investment Income | Net Asset Value, End of Period | Total Return(2) | Operating Expenses | Net Investment Income (Loss) | Portfolio Turnover Rate | Net Assets, End of Period (in thousands) | |||
A Class(5) | |||||||||||||
| 2014 | $12.36 | (0.01) | (0.22) | (0.23) | (0.10) | $12.03 | (1.92)% | 1.86% | (0.05)% | 134% | $5,576 | ||
| 2013 | $9.81 | (0.03) | 2.72 | 2.69 | (0.14) | $12.36 | 27.69% | 1.81% | (0.22)% | 157% | $3,585 | ||
| 2012 | $9.00 | 0.01 | 0.80 | 0.81 | — | $9.81 | 8.88% | 1.75% | 0.17% | 154% | $2,838 | ||
| 2011 | $9.67 | (0.02) | (0.65) | (0.67) | — | $9.00 | (6.83)% | 1.67% | (0.11)% | 167% | $3,182 | ||
| 2010 | $8.37 | (0.02) | 1.32 | 1.30 | — | $9.67 | 15.53% | 1.68% | (0.25)% | 199% | $4,814 | ||
| C Class | |||||||||||||
| 2014 | $12.39 | (0.10) | (0.23) | (0.33) | (0.05) | $12.01 | (2.74)% | 2.61% | (0.80)% | 134% | $456 | ||
| 2013 | $9.83 | (0.14) | 2.76 | 2.62 | (0.06) | $12.39 | 26.75% | 2.56% | (0.97)% | 157% | $342 | ||
| 2012 | $9.08 | (0.05) | 0.80 | 0.75 | — | $9.83 | 8.14% | 2.50% | (0.58)% | 154% | $93 | ||
| 2011 | $9.82 | (0.07) | (0.67) | (0.74) | — | $9.08 | (7.43)% | 2.42% | (0.86)% | 167% | $87 | ||
2010(6) | $8.50 | (0.05) | 1.37 | 1.32 | — | $9.82 | 15.53% | 2.43%(7) | (0.77)%(7) | 199%(8) | $77 | ||
| R Class | |||||||||||||
| 2014 | $12.55 | (0.05) | (0.22) | (0.27) | (0.06) | $12.22 | (2.19)% | 2.11% | (0.30)% | 134% | $374 | ||
| 2013 | $9.96 | (0.06) | 2.76 | 2.70 | (0.11) | $12.55 | 27.35% | 2.06% | (0.47)% | 157% | $388 | ||
| 2012 | $9.15 | —(3) | 0.81 | 0.81 | — | $9.96 | 8.73% | 2.00% | (0.08)% | 154% | $290 | ||
| 2011 | $9.86 | (0.04) | (0.67) | (0.71) | — | $9.15 | (7.10)% | 1.92% | (0.36)% | 167% | $27 | ||
2010(6) | $8.50 | (0.01) | 1.37 | 1.36 | — | $9.86 | 16.00% | 1.93%(7) | (0.16)%(7) | 199%(8) | $29 | ||
| Notes to Financial Highlights |
24
| (1) | Computed using average shares outstanding throughout the period. |
| (2) | Total returns are calculated based on the net asset value of the last business day and do not reflect applicable sales charges, if any. Total returns for periods less than one year are not annualized. |
| (3) | Per-share amount was less than $0.005. |
| (4) | Ratio was less than 0.005%. |
| (5) | Prior to March 1, 2010, the A Class was referred to as the Advisor Class. |
| (6) | March 1, 2010 (commencement of sale) through November 30, 2010. |
| (7) | Annualized. |
| (8) | Portfolio turnover is calculated at the fund level. Percentage indicated was calculated for the year ended November 30, 2010. |
See Notes to Financial Statements.
25
| Report of Independent Registered Public Accounting Firm |
To the Board of Directors and Shareholders of
American Century World Mutual Funds, Inc.:
We have audited the accompanying statement of assets and liabilities, including the schedule of investments, of International Discovery Fund (the “Fund”), one of the funds constituting American Century World Mutual Funds, Inc., as of November 30, 2014, and the related statement of operations for the year then ended, the statements of changes in net assets for each of the two years in the period then ended, and the financial highlights for each of the periods presented. These financial statements and financial highlights are the responsibility of the Fund's management. Our responsibility is to express an opinion on these financial statements and financial highlights based on our audits.
We conducted our audits in accordance with the standards of the Public Company Accounting Oversight Board (United States). Those standards require that we plan and perform the audit to obtain reasonable assurance about whether the financial statements and financial highlights are free of material misstatement. The Fund is not required to have, nor were we engaged to perform, an audit of its internal control over financial reporting. Our audits included consideration of internal control over financial reporting as a basis for designing audit procedures that are appropriate in the circumstances, but not for the purpose of expressing an opinion on the effectiveness of the Fund's internal control over financial reporting. Accordingly, we express no such opinion. An audit also includes examining, on a test basis, evidence supporting the amounts and disclosures in the financial statements, assessing the accounting principles used and significant estimates made by management, as well as evaluating the overall financial statement presentation. Our procedures included confirmation of securities owned as of November 30, 2014, by correspondence with the custodian and brokers; where replies were not received from brokers, we performed other auditing procedures. We believe that our audits provide a reasonable basis for our opinion.
In our opinion, the financial statements and financial highlights referred to above present fairly, in all material respects, the financial position of International Discovery Fund of American Century World Mutual Funds, Inc. as of November 30, 2014, the results of its operations for the year then ended, the changes in its net assets for each of the two years in the period then ended, and the financial highlights for each of the periods presented, in conformity with accounting principles generally accepted in the United States of America.
DELOITTE & TOUCHE LLP
Kansas City, Missouri
January 16, 2015
26
| Management |
The Board of Directors
The individuals listed below serve as directors of the funds. Each director will continue to serve in this capacity until death, retirement, resignation or removal from office. The board has adopted a mandatory retirement age for directors who are not “interested persons,” as that term is defined in the Investment Company Act (independent directors). Independent directors shall retire by December 31 of the year in which they reach their 75th birthday.
Mr. Thomas is an “interested person” because he currently serves as President and Chief Executive Officer of American Century Companies, Inc. (ACC), the parent company of American Century Investment Management, Inc. (ACIM or the advisor). Mr. Fink is treated as an “interested person” because of his recent employment with ACC and American Century Services, LLC (ACS). The other directors (more than three-fourths of the total number) are independent. They are not employees, directors or officers of, and have no financial interest in, ACC or any of its wholly owned, direct or indirect, subsidiaries, including ACIM, American Century Investment Services, Inc. (ACIS) and ACS, and they do not have any other affiliations, positions or relationships that would cause them to be considered “interested persons” under the Investment Company Act. The directors serve in this capacity for seven (in the case of Mr. Thomas, 15) registered investment companies in the American Century Investments family of funds.
The following table presents additional information about the directors. The mailing address for each director is 4500 Main Street, Kansas City, Missouri 64111.
Name (Year of Birth) | Position(s) Held with Funds | Length of Time Served | Principal Occupation(s) During Past 5 Years | Number of American Century Portfolios Overseen by Director | Other Directorships Held During Past 5 Years |
| Independent Directors | |||||
Thomas A. Brown (1940) | Director | Since 1980 | Managing Member, Associated Investments, LLC (real estate investment company); Brown Cascade Properties, LLC (real estate investment company) (2001 to 2009) | 73 | None |
Andrea C. Hall (1945) | Director | Since 1997 | Retired | 73 | None |
Jan M. Lewis (1957) | Director | Since 2011 | Retired; President and Chief Executive Officer, Catholic Charities of Northeast Kansas (human services organization) (2006 to 2013) | 73 | None |
James A. Olson (1942) | Director and Chairman of the Board | Since 2007 (Chairman since 2014) | Member, Plaza Belmont LLC (private equity fund manager) | 73 | Saia, Inc. (2002 to 2012) and EPR Properties (2003 to 2013) |
27
Name (Year of Birth) | Position(s) Held with Funds | Length of Time Served | Principal Occupation(s) During Past 5 Years | Number of American Century Portfolios Overseen by Director | Other Directorships Held During Past 5 Years |
| Independent Directors | |||||
M. Jeannine Strandjord (1945) | Director | Since 1994 | Retired | 73 | Euronet Worldwide Inc.; MGP Ingredients, Inc.; Charming Shoppes, Inc. (2006 to 2010); and DST Systems Inc. (1996 to 2012) |
John R. Whitten (1946) | Director | Since 2008 | Retired | 73 | Rudolph Technologies, Inc. |
Stephen E. Yates (1948) | Director | Since 2012 | Retired; Executive Vice President, Technology & Operations, KeyCorp. (computer services) (2004 to 2010) | 73 | Applied Industrial Technologies, Inc. (2001 to 2010) |
| Interested Directors | |||||
Barry Fink (1955) | Director | Since 2012 | Retired; Executive Vice President, ACC (September 2007 to February 2013); President, ACS (October 2007 to February 2013); Chief Operating Officer, ACC (September 2007 to November 2012) | 73 | None |
Jonathan S. Thomas (1963) | Director and President | Since 2007 | President and Chief Executive Officer, ACC (March 2007 to present). Also serves as Chief Executive Officer, ACS; Executive Vice President, ACIM; Director, ACC, ACIM and other ACC subsidiaries | 118 | BioMed Valley Discoveries, Inc. |
The Statement of Additional Information has additional information about the fund's directors and is available without charge, upon request, by calling 1-800-345-2021.
28
Officers
The following table presents certain information about the executive officers of the funds. Each officer serves as an officer for each of the 15 investment companies in the American Century family of funds, unless otherwise noted. No officer is compensated for his or her service as an officer of the funds. The listed officers are interested persons of the funds and are appointed or re-appointed on an annual basis. The mailing address for each officer listed below is 4500 Main Street, Kansas City, Missouri 64111.
Name (Year of Birth) | Offices with the Funds | Principal Occupation(s) During the Past Five Years |
Jonathan S. Thomas (1963) | Director and President since 2007 | President and Chief Executive Officer, ACC (March 2007 to present). Also serves as Chief Executive Officer, ACS; Executive Vice President, ACIM; Director, ACC, ACIM and other ACC subsidiaries |
Amy D. Shelton (1964) | Chief Compliance Officer and Vice President since 2014 | Chief Compliance Officer, American Century funds, (March 2014 to present); Chief Compliance Officer, ACIM (February 2014 to present); Chief Compliance Officer, ACIS (October 2009 to present); Vice President, Client Interactions and Marketing, ACIS (February 2013 to January 2014); Director, Client Interactions and Marketing, ACIS (June 2007 to January 2013). Also serves as Vice President, ACIS |
Charles A. Etherington (1957) | General Counsel since 2007 and Senior Vice President since 2006 | Attorney, ACC (February 1994 to present); Vice President, ACC (November 2005 to present); General Counsel, ACC (March 2007 to present). Also serves as General Counsel, ACIM, ACS, ACIS and other ACC subsidiaries; and Senior Vice President, ACIM and ACS |
C. Jean Wade (1964) | Vice President, Treasurer and Chief Financial Officer since 2012 | Vice President, ACS (February 2000 to present) |
Robert J. Leach (1966) | Vice President since 2006 and Assistant Treasurer since 2012 | Vice President, ACS (February 2000 to present) |
David H. Reinmiller (1963) | Vice President since 2000 | Attorney, ACC (January 1994 to present); Associate General Counsel, ACC (January 2001 to present). Also serves as Vice President, ACIM and ACS |
Ward D. Stauffer (1960) | Secretary since 2005 | Attorney, ACC (June 2003 to present) |
29
| Approval of Management Agreement |
At a meeting held on June 18, 2014, the Fund’s Board of Directors unanimously approved the renewal of the management agreement pursuant to which American Century Investment Management, Inc. (the “Advisor”) acts as the investment advisor for the Fund. Under Section 15(c) of the Investment Company Act, contracts for investment advisory services are required to be reviewed, evaluated, and approved by a majority of a fund’s directors (the “Directors”), including a majority of the independent Directors, each year.
Prior to its consideration of the renewal of the management agreement, the Board requested and reviewed extensive data and information compiled by the Advisor and certain independent providers of evaluation data concerning the Fund and the services provided to the Fund by the Advisor. This review was in addition to the oversight and evaluation undertaken by the Board and its committees on a continuous basis and the information received was supplemental to the extensive information that the Board and its committees receive and consider throughout the year.
In connection with its consideration of the renewal of the management agreement, the Board’s review and evaluation of the services provided by the Advisor included, but was not limited to, the following:
| • | the nature, extent, and quality of investment management, shareholder services, and other services provided by the Advisor to the Fund; |
| • | the wide range of other programs and services the Advisor provides to the Fund and its shareholders on a routine and non-routine basis; |
| • | the Fund’s investment performance compared to appropriate benchmarks and/or a peer group of other mutual funds with similar investment objectives and strategies; |
| • | the cost of owning the Fund compared to the cost of owning similar funds; |
| • | the Advisor’s compliance policies, procedures, and regulatory experience; |
| • | financial data showing the cost of services provided to the Fund, the profitability of the Fund to the Advisor, and the overall profitability of the Advisor; |
| • | possible economies of scale associated with the Advisor’s management of the Fund and other accounts under its management; |
| • | the services provided and charges to other investment management clients of the Advisor; |
| • | acquired fund fees and expenses; and |
| • | any collateral benefits derived by the Advisor from the management of the Fund. |
In keeping with its practice, the Board held two in-person meetings and one telephonic meeting to review and discuss the information provided. The independent Directors also had the benefit of the advice of their independent counsel throughout the process.
Factors Considered
The Directors considered all of the information provided by the Advisor, the independent data providers, and independent counsel, and evaluated such information for the Fund. In connection with their review, the Directors did not identify any single factor as being all-important or controlling, and each Director may have attributed different levels of importance to different factors. In deciding to renew the management agreement, the Board based its decision on a number of factors, including the following:
30
Nature, Extent and Quality of Services — Generally. Under the management agreement, the Advisor is responsible for providing or arranging for all services necessary for the operation of the Fund. The Board noted that under the management agreement, the Advisor provides or arranges at its own expense a wide variety of services including:
| • | constructing and designing the Fund |
| • | portfolio research and security selection |
| • | initial capitalization/funding |
| • | securities trading |
| • | Fund administration |
| • | custody of Fund assets |
| • | daily valuation of the Fund’s portfolio |
| • | shareholder servicing and transfer agency, including shareholder confirmations, recordkeeping, and communications |
| • | legal services (except the independent Directors’ counsel) |
| • | regulatory and portfolio compliance |
| • | financial reporting |
| • | marketing and distribution (except Rule 12b-1 plans) |
The Board noted that many of these services have expanded over time both in terms of quantity and complexity in response to shareholder demands, competition in the industry, changing distribution channels, and the changing regulatory environment.
Investment Management Services. The nature of the investment management services provided to the Fund is quite complex and allows Fund shareholders access to professional money management, instant diversification of their investments within an asset class, the opportunity to easily diversify among asset classes by investing in or exchanging among various American Century Investments funds, and liquidity. In evaluating investment performance, the Board expects the Advisor to manage the Fund in accordance with its investment objectives and approved strategies. Further, the Directors recognize that the Advisor has an obligation to monitor trading activities, and in particular to seek the best execution of fund trades, and to evaluate the use of and payment for research. In providing these services, the Advisor utilizes teams of investment professionals (portfolio managers, analysts, research assistants, and securities traders) who require extensive information technology, research, training, compliance and other systems to conduct their business. The Board, directly and through its Fund Performance Review Committee, regularly reviews investment performance information for the Fund, together with comparative information for appropriate benchmarks and/or peer groups of similarly-managed funds, over different time horizons. The Directors also review detailed performance information during the management agreement approval process. If performance concerns are identified, the Fund receives special reviews until performance improves, during which the Board discusses with the Advisor the reasons for such results (e.g., market conditions, security selection) and any efforts being undertaken to improve performance. The Fund’s performance was above its benchmark for the one-, three-, five-, and ten-year periods reviewed by the Board. The Board found the investment management services provided by the Advisor to the Fund to be satisfactory and consistent with the management agreement.
Shareholder and Other Services. Under the management agreement, the Advisor provides the Fund with a comprehensive package of transfer agency, shareholder, and other services. The Board, directly and through various committees of the Board, regularly reviews reports and evaluations of such services at its regular meetings. These reports include, but are not limited to, information regarding the operational efficiency and accuracy of the shareholder and transfer agency services provided, staffing levels, shareholder satisfaction (as measured by external as well as internal sources), technology support, new products and services offered to Fund shareholders, securities trading activities, portfolio valuation services, auditing services, and legal and operational compliance activities. Certain aspects of shareholder and transfer agency service level efficiency and the quality of securities trading activities are measured by independent third party providers and are presented in comparison to other fund groups not managed by the Advisor. The Board
31
found the services provided by the Advisor to the Fund under the management agreement to be competitive and of high quality.
Costs of Services and Profitability. The Advisor provides detailed information concerning its cost of providing various services to the Fund, its profitability in managing the Fund (pre- and post-distribution), its overall profitability, and its financial condition. The Directors have reviewed with the Advisor the methodology used to prepare this financial information. The financial information regarding the Advisor is considered in evaluating the Advisor’s financial condition, its ability to continue to provide services under the management agreement, and the reasonableness of the current management fee. The Board concluded that the Advisor’s profits were reasonable in light of the services provided to the Fund.
Ethics. The Board generally considers the Advisor’s commitment to providing quality services to shareholders and to conducting its business ethically. They noted that the Advisor’s practices generally meet or exceed industry best practices.
Economies of Scale. The Board also reviewed information provided by the Advisor regarding the possible existence of economies of scale in connection with the management of the Fund. The Board concluded that economies of scale are difficult to measure and predict with precision, especially on a fund-by-fund basis. The Board concluded that the Advisor is appropriately sharing economies of scale through its competitive fee structure, offering competitive fees from fund inception, and through reinvestment in its business to provide shareholders additional content and services.
Comparison to Other Funds’ Fees. The management agreement provides that the Fund pays the Advisor a single, all-inclusive (or unified) management fee for providing all services necessary for the management and operation of the Fund, other than brokerage expenses, taxes, interest, extraordinary expenses, and the fees and expenses of the Fund’s independent directors (including their independent legal counsel) and expenses incurred in connection with the provision of shareholder services and distribution services under a plan adopted pursuant to Rule 12b-1 under the 1940 Act. Under the unified fee structure, the Advisor is responsible for providing all investment advisory, custody, audit, administrative, compliance, recordkeeping, marketing and shareholder services, or arranging and supervising third parties to provide such services. By contrast, most other funds are charged a variety of fees, including an investment advisory fee, a transfer agency fee, an administrative fee, distribution charges and other expenses. Other than their investment advisory fees and any applicable Rule 12b-1 distribution fees, all other components of the total fees charged by these other funds may be increased without shareholder approval. The Board believes the unified fee structure is a benefit to Fund shareholders because it clearly discloses to shareholders the cost of owning Fund shares, and, since the unified fee cannot be increased without a vote of Fund shareholders, it shifts to the Advisor the risk of increased costs of operating the Fund and provides a direct incentive to minimize administrative inefficiencies. Part of the Board’s analysis of fee levels involves reviewing certain evaluative data compiled by an independent provider comparing the Fund’s unified fee to the total expense ratios of its peers. The unified fee charged to shareholders of the Fund was above the median of the total expense ratios of the Fund’s peer expense universe and was within the range of its peer expense group. The Board concluded that the management fee paid by the Fund to the Advisor under the management agreement is reasonable in light of the services provided to the Fund.
Comparison to Fees and Services Provided to Other Clients of the Advisor. The Board also requested and received information from the Advisor concerning the nature of the services, fees, costs and profitability of its advisory services to advisory clients other than the Fund. They observed that these varying types of client accounts require different services and involve different regulatory and entrepreneurial risks than the management of the Fund. The Board analyzed this information and concluded that the fees charged and services provided to the Fund were reasonable by comparison.
32
Collateral or “Fall-Out” Benefits Derived by the Advisor. The Board considered the existence of collateral benefits the Advisor may receive as a result of its relationship with the Fund. They concluded that the Advisor’s primary business is managing mutual funds and it generally does not use fund or shareholder information to generate profits in other lines of business, and therefore does not derive any significant collateral benefits from them. The Board noted that the Advisor receives proprietary research from broker-dealers that execute fund portfolio transactions and concluded that this research is likely to benefit Fund shareholders. The Board also determined that the Advisor is able to provide investment management services to certain clients other than the Fund, at least in part, due to its existing infrastructure built to serve the fund complex. The Board concluded, however, that the assets of those other clients are not material to the analysis and, where applicable, may be included with the assets of the Fund to determine breakpoints in the management fee schedule.
Existing Relationship. The Board also considered whether there was any reason for not continuing the existing arrangement with the Advisor. In this regard, the Board was mindful of the potential disruptions of the Fund’s operations and various risks, uncertainties, and other effects that could occur as a result of a decision not to continue such relationship. In particular, the Board recognized that most shareholders have invested in the Fund on the strength of the Advisor’s industry standing and reputation and in the expectation that the Advisor will have a continuing role in providing advisory services to the Fund.
Conclusion of the Directors. As a result of this process, the Board, including all of the independent Directors, taking into account all of the factors discussed above and the information provided by the Advisor and others, concluded that the management agreement between the Fund and the Advisor is fair and reasonable in light of the services provided and should be renewed.
33
| Additional Information |
Retirement Account Information
As required by law, distributions you receive from certain IRAs are subject to federal income tax withholding, unless you elect not to have withholding apply. Tax will be withheld on the total amount withdrawn even though you may be receiving amounts that are not subject to withholding, such as nondeductible contributions. In such case, excess amounts of withholding could occur. You may adjust your withholding election so that a greater or lesser amount will be withheld.
If you don’t want us to withhold on this amount, you must notify us to not withhold the federal income tax. You may notify us in writing or in certain situations by telephone or through other electronic means. For systematic withdrawals, your withholding election will remain in effect until revoked or changed by filing a new election. You have the right to revoke your election at any time.
Remember, even if you elect not to have income tax withheld, you are liable for paying income tax on the taxable portion of your withdrawal. If you elect not to have income tax withheld or you don’t have enough income tax withheld, you may be responsible for payment of estimated tax. You may incur penalties under the estimated tax rules if your withholding and estimated tax payments are not sufficient. You can reduce or defer the income tax on a distribution by directly or indirectly rolling such distribution over to another IRA or eligible plan. You should consult your tax advisor for additional information.
State tax will be withheld if, at the time of your distribution, your address is within one of the mandatory withholding states and you have federal income tax withheld (or as otherwise required by state law). State taxes will be withheld from your distribution in accordance with the respective state rules.
Distributions you receive from 403(b), 457 and qualified plans are subject to special tax and withholding rules. Your plan administrator or plan sponsor is required to provide you with a special tax notice explaining those rules at the time you request a distribution. If applicable, federal and/or state taxes may be withheld from your distribution amount.
Proxy Voting Policies
A description of the policies that the fund's investment advisor uses in exercising the voting rights associated with the securities purchased and/or held by the fund is available without charge, upon request, by calling 1-800-345-2021. It is also available on the "About Us" page of American Century Investments’ website at americancentury.com and on the Securities and Exchange Commission’s website at sec.gov. Information regarding how the investment advisor voted proxies relating to portfolio securities during the most recent 12-month period ended June 30 is available on the "About Us" page at americancentury.com. It is also available at sec.gov.
Quarterly Portfolio Disclosure
The fund files its complete schedule of portfolio holdings with the Securities and Exchange Commission (SEC) for the first and third quarters of each fiscal year on Form N-Q. The fund’s Forms N-Q are available on the SEC’s website at sec.gov, and may be reviewed and copied at the SEC’s Public Reference Room in Washington, DC. Information on the operation of the Public Reference Room may be obtained by calling 1-800-SEC-0330. The fund also makes its complete schedule of portfolio holdings for the most recent quarter of its fiscal year available on its
website at americancentury.com and, upon request, by calling 1-800-345-2021.
34
Other Tax Information
The following information is provided pursuant to provisions of the Internal Revenue Code.
The fund hereby designates up to the maximum amount allowable as qualified dividend income for the fiscal year ended November 30, 2014.
For the fiscal year ended November 30, 2014, the fund intends to pass through to shareholders $896,447, or up to the maximum amount allowable, as a foreign tax credit which represents taxes paid on income derived from sources within foreign countries or possessions of the United States. During the fiscal year ended November 30, 2014, the fund earned $12,529,812 from income derived from foreign sources. Foreign source income and foreign tax expense per outstanding share on November 30, 2014 are $0.2715 and $0.0194, respectively.
35
| Notes |
36
| ||
| Contact Us | americancentury.com | |
| Automated Information Line | 1-800-345-8765 | |
| Investor Services Representative | 1-800-345-2021 or 816-531-5575 | |
| Investors Using Advisors | 1-800-378-9878 | |
| Business, Not-For-Profit, Employer-Sponsored Retirement Plans | 1-800-345-3533 | |
| Banks and Trust Companies, Broker-Dealers, Financial Professionals, Insurance Companies | 1-800-345-6488 | |
| Telecommunications Relay Service for the Deaf | 711 | |
| American Century World Mutual Funds, Inc. | ||
Investment Advisor: American Century Investment Management, Inc. Kansas City, Missouri | ||
| This report and the statements it contains are submitted for the general information of our shareholders. The report is not authorized for distribution to prospective investors unless preceded or accompanied by an effective prospectus. | ||
| ©2015 American Century Proprietary Holdings, Inc. All rights reserved. CL-ANN-84132 1501 | ||
ANNUAL REPORT | NOVEMBER 30, 2014 |
International Growth Fund
| Table of Contents |
| President’s Letter | |
| Performance | |
| Portfolio Commentary | |
| Fund Characteristics | |
| Shareholder Fee Example | |
| Schedule of Investments | |
| Statement of Assets and Liabilities | |
| Statement of Operations | |
| Statement of Changes in Net Assets | |
| Notes to Financial Statements | |
| Financial Highlights | |
| Report of Independent Registered Public Accounting Firm | |
| Management | |
| Approval of Management Agreement | |
| Additional Information | |
Any opinions expressed in this report reflect those of the author as of the date of the report, and do not necessarily represent the opinions of American Century Investments® or any other person in the American Century Investments organization. Any such opinions are subject to change at any time based upon market or other conditions and American Century Investments disclaims any responsibility to update such opinions. These opinions may not be relied upon as investment advice and, because investment decisions made by American Century Investments funds are based on numerous factors, may not be relied upon as an indication of trading intent on behalf of any American Century Investments fund. Security examples are used for representational purposes only and are not intended as recommendations to purchase or sell securities. Performance information for comparative indices and securities is provided to American Century Investments by third party vendors. To the best of American Century Investments’ knowledge, such information is accurate at the time of printing.
| President’s Letter |
| Dear Investor: Thank you for reviewing this annual report for the 12 months ended November 30, 2014. It provides investment performance and portfolio information for the reporting period, plus longer-term historical performance data. Annual reports remain important vehicles for conveying information about fund returns, including market and economic factors that affected performance during the reporting period. For additional, updated investment and market insights, we encourage you to visit our website, americancentury.com. |
| Jonathan Thomas | |
Favorable Fiscal Year for U.S. Investments, While Non-U.S. Lagged
“Global divergence” between the U.S. and the rest of the world emerged as a prevalent theme during the reporting period. As 2014 approached its conclusion, the U.S. appeared to be on a different economic and monetary policy track than most other nations. This theme covered not only the stronger economic growth enjoyed by the U.S. compared with the rest of the world, but also the related contrast between the U.S. Federal Reserve’s unwinding of monetary stimulus versus the continuation and expansion of monetary stimulus by most other central banks.
Global divergence could also generally describe the broad difference between investment returns for U.S. and non-U.S. markets. The perceived strength, safe-haven qualities, and higher yields of U.S. investments attracted global demand. For the reporting period, the S&P 500 Index, the Barclays U.S. Aggregate Bond Index, and the U.S. Dollar Index returned 16.86%, 5.27%, and 9.34%, respectively. By contrast, for U.S. investors unhedged for currency exposure (the dollar’s strength reduced the returns of non-dollar-denominated securities when they were converted to dollars), the MSCI EAFE Index, the MSCI Emerging Markets Index, and the Barclays Global Aggregate Bond Index (ex-USD, unhedged) returned -0.02%, 1.06%, and -2.53%, respectively.
We expect global divergence in economic growth and monetary policies to continue well into 2015, aligned with expectations that the Federal Reserve might finally start raising short-term U.S. interest rates. However, global economic weakness (reflected in recent commodity price declines) and low inflation might delay the rate hikes until the second half of 2015. In this environment, we continue to believe in a disciplined, diversified, long-term investment approach, using professionally managed stock and bond portfolios to meet financial goals. We appreciate your continued trust in us.
Sincerely,
Jonathan Thomas
President and Chief Executive Officer
American Century Investments
2
| Performance |
| Total Returns as of November 30, 2014 | ||||||
Average Annual Returns | ||||||
Ticker Symbol | 1 year | 5 years | 10 years | Since Inception | Inception Date | |
Investor Class | TWIEX | 0.80% | 8.54% | 6.51% | 8.02% | 5/9/91 |
MSCI EAFE Index | — | -0.02% | 6.38% | 5.25% | 5.56%(1) | — |
MSCI EAFE Growth Index | — | 0.65% | 7.36% | 5.72% | 4.35%(1) | — |
| Institutional Class | TGRIX | 0.91% | 8.73% | 6.71% | 6.08% | 11/20/97 |
A Class(2) | TWGAX | 10/2/96 | ||||
| No sales charge* | 0.49% | 8.26% | 6.24% | 6.44% | ||
| With sales charge* | -5.32% | 7.00% | 5.62% | 6.10% | ||
| C Class | AIWCX | -0.29% | 7.44% | 5.44% | 3.57% | 6/4/01 |
| R Class | ATGRX | 0.25% | 7.99% | 5.98% | 7.43% | 8/29/03 |
| R6 Class | ATGDX | 1.10% | — | — | 7.76% | 7/26/13 |
| * | Sales charges include initial sales charges and contingent deferred sales charges (CDSCs), as applicable. A Class shares have a 5.75% maximum initial sales charge and may be subject to a maximum CDSC of 1.00%. C Class shares redeemed within 12 months of purchase are subject to a maximum CDSC of 1.00%. The SEC requires that mutual funds provide performance information net of maximum sales charges in all cases where charges could be applied. |
| (1) | Since April 30, 1991, the date nearest the Investor Class’s inception for which data are available. |
| (2) | Prior to December 3, 2007, the A Class was referred to as the Advisor Class and did not have a front-end sales charge. Performance has been adjusted to reflect this charge. |
Data presented reflect past performance. Past performance is no guarantee of future results. Current performance may be higher or lower than the performance shown. Investment return and principal value will fluctuate, and redemption value may be more or less than original cost. Data assumes reinvestment of dividends and capital gains, and none of the charts reflect the deduction of taxes that a shareholder would pay on fund distributions or the redemption of fund shares. To obtain performance data current to the most recent month end, please call 1-800-345-2021 or visit americancentury.com. For additional information about the fund, please consult the prospectus.
3
| Growth of $10,000 Over 10 Years |
| $10,000 investment made November 30, 2004 |
| Performance for other share classes will vary due to differences in fee structure. |
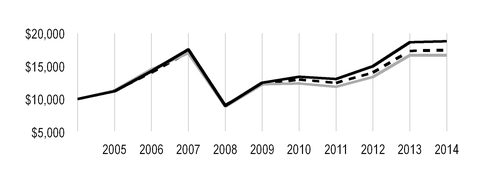
| Value on November 30, 2014 | |
| Investor Class — $18,794 | |
| MSCI EAFE Index — $16,684 | |
MSCI EAFE Growth Index — $17,444 | |
Total Annual Fund Operating Expenses | |||||
| Investor Class | Institutional Class | A Class | C Class | R Class | R6 Class |
| 1.22% | 1.02% | 1.47% | 2.22% | 1.72% | 0.87% |
The total annual fund operating expenses shown is as stated in the fund’s prospectus current as of the date of this report. The prospectus may vary from the expense ratio shown elsewhere in this report because it is based on a different time period, includes acquired fund fees and expenses, and, if applicable, does not include fee waivers or expense reimbursements.
Data presented reflect past performance. Past performance is no guarantee of future results. Current performance may be higher or lower than the performance shown. Investment return and principal value will fluctuate, and redemption value may be more or less than original cost. Data assumes reinvestment of dividends and capital gains, and none of the charts reflect the deduction of taxes that a shareholder would pay on fund distributions or the redemption of fund shares. To obtain performance data current to the most recent month end, please call 1-800-345-2021 or visit americancentury.com. For additional information about the fund, please consult the prospectus.
4
| Portfolio Commentary |
Portfolio Manager: Raj Gandhi
As of May 1, Alex Tedder left the fund's management team.
Performance Summary
International Growth advanced 0.80%* for the 12 months ended November 30, 2014. The portfolio’s benchmark, the MSCI EAFE Index, declined -0.02% for the same period.
Non-U.S. stocks generally struggled during the 12-month period, as geopolitical risks and sluggish global growth triggered uncertainty and market volatility. As the period unfolded, global growth decoupled, with the U.S. leading the way. Stronger relative growth in the U.S. led to a divergence in central bank policy, with the U.S. Federal Reserve scaling back its stimulus efforts as other leading central banks, including the European Central Bank (ECB) and the Bank of Japan (BOJ), maintained aggressive programs in response to weakening growth and low inflation. In Europe, growth stalled during the period, and concerns about deflation prompted the ECB to slash its key interest rates and initiate a selective bond-buying program. In Japan, growth weakened following an April 1 hike in the nation’s consumption tax, and late in the period the nation slipped into another recession. The BOJ responded with additional monetary easing, and the government postponed the next scheduled hike in the nation’s consumption tax. Diverging central bank policies also helped trigger a strong U.S. dollar rally, which served to further reduce non-U.S. stock returns for U.S.-based investors. The dollar’s relative strength, combined with mounting global supply/demand imbalances, also caused commodities prices (particularly oil) to weaken.
Meanwhile, political unrest also contributed to the challenging investment backdrop. In particular, the ongoing Russia-Ukraine conflict, mounting turmoil throughout the Middle East, and pro-democracy protests in Hong Kong pressured non-U.S. stocks.
Early in the period, investors generally favored value stocks over growth stocks. But this sentiment changed as the period progressed. Fundamentals returned to focus and investors reacted to company-specific events, providing a boost to the growth-oriented stocks the fund favors. Overall, the fund outperformed its benchmark during the period, primarily due to positioning in the information technology, consumer discretionary, and health care sectors. Regionally, an out-of-benchmark position in emerging markets (particularly China), which outpaced non-U.S. developed market stocks during the period, aided relative performance. Stock selection in the U.K. and Denmark, along with an overweight position in Denmark, also contributed to the fund’s outperformance.
Jewelry Retailer Was a Top Contributor
Within the top-performing consumer discretionary sector, the luxury goods industry was a leading contributor. An overweight position in Denmark’s Pandora drove the fund’s performance in that industry and was among the fund’s top overall performers. The jewelry and charm maker and retailer advanced on strong earnings, favorable exposure to U.S. consumers and the improving U.S. economy, expanding store presence (especially in new markets such as China), and successful new product launches.
In addition, within the top-performing U.K. market, an overweight position in Ashtead Group, a construction equipment rental firm, was among the fund’s top contributors. The company benefited
* | All fund returns referenced in this commentary are for Investor Class shares. Performance for other share classes will vary due to differences in fee structure; when Investor Class performance exceeds that of the fund's benchmark, other share classes may not. See page 3 for returns for all share classes. |
5
from strong underlying demand and pricing trends, particularly in its key U.S. market. Late in the
period, Ashtead said it expected full-year results to exceed previous projections, driving additional stock gains.
In the health care sector, an overweight position in Shire, a U.K.-based pharmaceutical firm, was a leading contributor to fund performance. Shire’s stock price advanced as the company received—and ultimately rejected—a takeover offer from U.S.-based AbbVie.
Financials Sector Was Main Laggard
Stock selection in the financials, telecommunication services, and utilities sectors, along with underweight positions in telecommunication services and utilities, detracted from relative performance. Regionally, positioning in France, Spain, and Hong Kong weighed on relative results.
An overweight position in Weir Group, a U.K.-based provider of products and services for the minerals, oil and gas, power, and industrial markets, was a main performance detractor, declining primarily due to plunging oil prices. Late in the period, we reduced the fund’s position in Weir Group on concerns about declining capital spending budgets and a reduction in drilling activity.
Similarly, an overweight position in the U.K.’s BG Group, an oil and natural gas producer, was among the fund’s largest detractors. The company’s stock price weakened along with the decline in oil prices.
Within the financials sector, an overweight position in Japan’s ORIX Corp., a diversified financial services company, was a prominent detractor. Early in the period, as the perception grew that Japan’s economy would fade rapidly after the April 1 consumption tax increase, Japan-based stocks broadly sold off—especially within the financials sector.
Outlook
Despite the uncertainties in Europe, we continue to find companies that meet our criteria of demonstrating improving, sustainable growth. Specifically, we remain focused on European-based companies with exposure to the strengthening U.S. economy and those benefiting from company-specific or secular growth stories. We are maintaining a slight underweight position in Japan, favoring companies that can take advantage of a weak yen and firms advancing due to strong secular growth trends. The emerging markets continue to contend with slowing growth and persistent inflationary pressures. We remain selective, focusing on companies we believe are demonstrating sustainable fundamental improvements. We also favor emerging market companies benefiting from strong secular trends, such as the growing demand for internet services in China.
6
| Fund Characteristics |
| NOVEMBER 30, 2014 | |
Top Ten Holdings | % of net assets |
| Roche Holding AG | 3.0% |
| Nestle SA | 2.0% |
| Novartis AG | 2.0% |
| Pandora A/S | 2.0% |
| Bayer AG | 1.8% |
| Nidec Corp. | 1.8% |
| ASML Holding NV | 1.8% |
| Ashtead Group plc | 1.8% |
| Associated British Foods plc | 1.7% |
| Keyence Corp. | 1.7% |
Types of Investments in Portfolio | % of net assets |
| Foreign Common Stocks | 98.5% |
| Temporary Cash Investments | 0.9% |
| Other Assets and Liabilities | 0.6% |
Investments by Country | % of net assets |
| United Kingdom | 22.4% |
| Japan | 18.0% |
| Switzerland | 10.9% |
| France | 6.4% |
| Netherlands | 5.8% |
| China | 4.3% |
| Denmark | 4.3% |
| Germany | 4.2% |
| Australia | 2.8% |
| India | 2.7% |
| Italy | 2.5% |
| Sweden | 2.5% |
| Spain | 2.3% |
| Belgium | 2.2% |
| Other Countries | 7.2% |
| Cash and Equivalents* | 1.5% |
*Includes temporary cash investments and other assets and liabilities.
7
| Shareholder Fee Example |
Fund shareholders may incur two types of costs: (1) transaction costs, including sales charges (loads) on purchase payments and redemption/exchange fees; and (2) ongoing costs, including management fees; distribution and service (12b-1) fees; and other fund expenses. This example is intended to help you understand your ongoing costs (in dollars) of investing in your fund and to compare these costs with the ongoing cost of investing in other mutual funds.
The example is based on an investment of $1,000 made at the beginning of the period and held for the entire period from June 1, 2014 to November 30, 2014.
Actual Expenses
The table provides information about actual account values and actual expenses for each class. You may use the information, together with the amount you invested, to estimate the expenses that you paid over the period. First, identify the share class you own. Then simply divide your account value by $1,000 (for example, an $8,600 account value divided by $1,000 = 8.6), then multiply the result by the number under the heading “Expenses Paid During Period” to estimate the expenses you paid on your account during this period.
If you hold Investor Class shares of any American Century Investments fund, or Institutional Class shares of the American Century Diversified Bond Fund, in an American Century Investments account (i.e., not a financial intermediary or retirement plan account), American Century Investments may charge you a $12.50 semiannual account maintenance fee if the value of those shares is less than $10,000. We will redeem shares automatically in one of your accounts to pay the $12.50 fee. In determining your total eligible investment amount, we will include your investments in all personal accounts (including American Century Investments Brokerage accounts) registered under your Social Security number. Personal accounts include individual accounts, joint accounts, UGMA/UTMA accounts, personal trusts, Coverdell Education Savings Accounts and IRAs (including traditional, Roth, Rollover, SEP-, SARSEP- and SIMPLE-IRAs), and certain other retirement accounts. If you have only business, business retirement, employer-sponsored or American Century Investments Brokerage accounts, you are currently not subject to this fee. If you are subject to the Account Maintenance Fee, your account value could be reduced by the fee amount.
Hypothetical Example for Comparison Purposes
The table also provides information about hypothetical account values and hypothetical expenses based on the actual expense ratio of each class of your fund and an assumed rate of return of 5% per year before expenses, which is not the actual return of a fund’s share class. The hypothetical account values and expenses may not be used to estimate the actual ending account balance or expenses you paid for the period. You may use this information to compare the ongoing costs of investing in your fund and other funds. To do so, compare this 5% hypothetical example with the 5% hypothetical examples that appear in the shareholder reports of the other funds.
Please note that the expenses shown in the table are meant to highlight your ongoing costs only and do not reflect any transactional costs, such as sales charges (loads) or redemption/exchange fees. Therefore, the table is useful in comparing ongoing costs only, and will not help you determine the relative total costs of owning different funds. In addition, if these transactional costs were included, your costs would have been higher.
8
| Beginning Account Value 6/1/14 | Ending Account Value 11/30/14 | Expenses Paid During Period(1)6/1/14 - 11/30/14 | Annualized Expense Ratio(1) | |
Actual | ||||
| Investor Class | $1,000 | $977.40 | $5.80 | 1.17% |
| Institutional Class | $1,000 | $978.00 | $4.81 | 0.97% |
| A Class | $1,000 | $975.40 | $7.03 | 1.42% |
| C Class | $1,000 | $971.30 | $10.72 | 2.17% |
| R Class | $1,000 | $974.20 | $8.26 | 1.67% |
| R6 Class | $1,000 | $978.70 | $4.07 | 0.82% |
Hypothetical | ||||
| Investor Class | $1,000 | $1,019.20 | $5.92 | 1.17% |
| Institutional Class | $1,000 | $1,020.21 | $4.91 | 0.97% |
| A Class | $1,000 | $1,017.95 | $7.18 | 1.42% |
| C Class | $1,000 | $1,014.19 | $10.96 | 2.17% |
| R Class | $1,000 | $1,016.70 | $8.44 | 1.67% |
| R6 Class | $1,000 | $1,020.96 | $4.15 | 0.82% |
| (1) | Expenses are equal to the class's annualized expense ratio listed in the table above, multiplied by the average account value over the period, multiplied by 183, the number of days in the most recent fiscal half-year, divided by 365, to reflect the one-half year period. |
9
| Schedule of Investments |
NOVEMBER 30, 2014
| Shares | Value | ||||
| COMMON STOCKS — 98.5% | |||||
| Australia — 2.8% | |||||
| BHP Billiton Ltd. | 332,802 | $ | 8,755,965 | ||
| Commonwealth Bank of Australia | 258,436 | 17,750,589 | |||
| CSL Ltd. | 400,764 | 28,157,209 | |||
| 54,663,763 | |||||
| Belgium — 2.2% | |||||
| Anheuser-Busch InBev NV | 237,122 | 27,851,473 | |||
KBC Groep NV(1) | 259,410 | 14,837,916 | |||
| 42,689,389 | |||||
| Brazil — 0.6% | |||||
| Kroton Educacional SA | 1,748,900 | 12,088,325 | |||
| China — 4.3% | |||||
Alibaba Group Holding Ltd. ADR(1) | 102,366 | 11,428,140 | |||
Baidu, Inc. ADR(1) | 102,788 | 25,194,367 | |||
Ctrip.com International Ltd. ADR(1) | 194,410 | 10,513,693 | |||
| Haier Electronics Group Co. Ltd. | 4,113,000 | 11,482,086 | |||
| Tencent Holdings Ltd. | 1,180,300 | 18,872,016 | |||
Vipshop Holdings Ltd. ADR(1) | 359,600 | 8,220,456 | |||
| 85,710,758 | |||||
| Denmark — 4.3% | |||||
| Coloplast A/S, B Shares | 154,973 | 13,428,732 | |||
| GN Store Nord A/S | 880,696 | 18,809,925 | |||
| Novo Nordisk A/S, B Shares | 303,406 | 13,837,508 | |||
| Pandora A/S | 444,492 | 39,444,700 | |||
| 85,520,865 | |||||
| France — 6.4% | |||||
| Accor SA | 377,030 | 17,784,611 | |||
| Carrefour SA | 380,097 | 12,026,113 | |||
| Cie Generale d'Optique Essilor International SA | 115,145 | 12,928,889 | |||
| Schneider Electric SE | 250,385 | 20,423,986 | |||
| Total SA | 399,760 | 22,363,702 | |||
| Valeo SA | 124,998 | 15,379,678 | |||
| Zodiac Aerospace | 766,362 | 25,395,662 | |||
| 126,302,641 | |||||
| Germany — 4.2% | |||||
| Bayer AG | 241,125 | 36,264,065 | |||
| Continental AG | 59,841 | 12,590,053 | |||
| Daimler AG | 224,885 | 18,959,137 | |||
| Wirecard AG | 378,251 | 16,052,576 | |||
| 83,865,831 | |||||
| Hong Kong — 0.7% | |||||
| Galaxy Entertainment Group Ltd. | 1,927,000 | 13,156,849 | |||
10
| Shares | Value | ||||
| India — 2.7% | |||||
| ICICI Bank Ltd. ADR | 431,740 | $ | 25,425,169 | ||
| Tata Consultancy Services Ltd. | 409,440 | 17,438,561 | |||
| Tata Motors Ltd. ADR | 243,448 | 11,115,836 | |||
| 53,979,566 | |||||
| Indonesia — 0.7% | |||||
| PT Bank Mandiri (Persero) Tbk | 16,448,400 | 14,185,465 | |||
| Ireland — 1.7% | |||||
Bank of Ireland(1) | 50,267,038 | 20,626,503 | |||
Ryanair Holdings plc ADR(1) | 203,421 | 12,793,147 | |||
| 33,419,650 | |||||
| Italy — 2.5% | |||||
| Intesa Sanpaolo SpA | 4,983,220 | 15,354,643 | |||
| Luxottica Group SpA | 388,181 | 20,755,400 | |||
| UniCredit SpA | 1,947,097 | 14,393,547 | |||
| 50,503,590 | |||||
| Japan — 18.0% | |||||
| Daikin Industries Ltd. | 311,000 | 20,630,291 | |||
| Daito Trust Construction Co. Ltd. | 153,100 | 17,281,220 | |||
| FANUC Corp. | 63,500 | 10,708,588 | |||
| Fuji Heavy Industries Ltd. | 822,600 | 29,920,286 | |||
| Japan Tobacco, Inc. | 337,429 | 10,808,017 | |||
| Keyence Corp. | 71,700 | 33,109,498 | |||
| Komatsu Ltd. | 498,900 | 11,813,233 | |||
| Kubota Corp. | 1,189,000 | 18,578,907 | |||
| Mizuho Financial Group, Inc. | 7,177,700 | 12,364,399 | |||
| Murata Manufacturing Co. Ltd. | 174,900 | 18,894,769 | |||
| Nidec Corp. | 543,800 | 36,059,416 | |||
| Nitori Holdings Co. Ltd. | 201,000 | 11,140,799 | |||
| Ono Pharmaceutical Co. Ltd. | 134,600 | 11,519,488 | |||
| ORIX Corp. | 1,627,500 | 21,461,915 | |||
| Panasonic Corp. | 1,562,600 | 20,171,710 | |||
| Rakuten, Inc. | 1,254,604 | 16,898,554 | |||
| Seven & I Holdings Co. Ltd. | 441,500 | 16,465,832 | |||
| Suzuki Motor Corp. | 737,400 | 23,290,075 | |||
| Unicharm Corp. | 651,000 | 14,899,271 | |||
| 356,016,268 | |||||
| Mexico — 1.0% | |||||
Cemex SAB de CV ADR(1) | 1,659,322 | 20,758,118 | |||
| Netherlands — 5.8% | |||||
| Akzo Nobel NV | 323,885 | 22,375,948 | |||
| ASML Holding NV | 336,813 | 35,569,548 | |||
| Boskalis Westminster NV | 285,401 | 16,014,046 | |||
ING Groep NV CVA(1) | 1,715,832 | 25,133,237 | |||
NXP Semiconductor NV(1) | 195,850 | 15,239,088 | |||
| 114,331,867 | |||||
11
| Shares | Value | ||||
| Norway — 0.7% | |||||
| Statoil ASA | 734,269 | $ | 13,868,054 | ||
| Russia — 0.7% | |||||
| Magnit PJSC GDR | 254,822 | 14,741,453 | |||
| Spain — 2.3% | |||||
Bankia SA(1) | 14,260,028 | 25,001,603 | |||
| Inditex SA | 676,250 | 19,689,279 | |||
| 44,690,882 | |||||
| Sweden — 2.5% | |||||
| Electrolux AB | 697,750 | 20,736,319 | |||
| Skandinaviska Enskilda Banken AB, A Shares | 2,218,612 | 29,307,559 | |||
| 50,043,878 | |||||
| Switzerland — 10.9% | |||||
| Adecco SA | 356,509 | 25,034,034 | |||
| Credit Suisse Group AG | 626,680 | 16,746,057 | |||
| Givaudan SA | 11,767 | 20,970,529 | |||
| Nestle SA | 539,114 | 40,478,883 | |||
| Novartis AG | 411,588 | 39,827,662 | |||
| Roche Holding AG | 197,434 | 59,133,143 | |||
| Sika AG | 3,824 | 14,555,935 | |||
| 216,746,243 | |||||
| Taiwan — 0.8% | |||||
| Taiwan Semiconductor Manufacturing Co. Ltd. ADR | 652,451 | 15,313,025 | |||
| Turkey — 0.3% | |||||
| BIM Birlesik Magazalar AS | 232,438 | 5,169,009 | |||
| United Kingdom — 22.4% | |||||
| Ashtead Group plc | 2,132,495 | 35,108,281 | |||
| Associated British Foods plc | 678,165 | 33,929,171 | |||
| Barclays plc | 3,243,300 | 12,419,381 | |||
| BG Group plc | 1,313,841 | 18,474,077 | |||
| BT Group plc | 2,665,648 | 17,079,667 | |||
| Bunzl plc | 518,120 | 14,454,156 | |||
| Burberry Group plc | 826,039 | 21,289,499 | |||
| Carnival plc | 419,440 | 18,475,657 | |||
International Consolidated Airlines Group SA(1) | 3,115,381 | 22,262,975 | |||
| Intertek Group plc | 326,850 | 11,921,100 | |||
| Johnson Matthey plc | 472,403 | 24,542,332 | |||
| Prudential plc | 1,004,590 | 24,290,740 | |||
| Reckitt Benckiser Group plc | 368,756 | 30,268,629 | |||
| Rio Tinto plc | 667,140 | 31,184,018 | |||
Royal Bank of Scotland Group plc(1) | 4,639,094 | 28,644,479 | |||
| Shire plc | 303,780 | 21,623,159 | |||
| Smith & Nephew plc | 1,132,791 | 19,640,553 | |||
| St. James's Place plc | 1,451,711 | 18,004,523 | |||
| Weir Group plc (The) | 487,670 | 14,290,250 | |||
| Whitbread plc | 367,584 | 26,336,999 | |||
| 444,239,646 | |||||
TOTAL COMMON STOCKS (Cost $1,606,034,121) | 1,952,005,135 | ||||
12
| Shares | Value | ||||
| TEMPORARY CASH INVESTMENTS — 0.9% | |||||
State Street Institutional Liquid Reserves Fund, Premier Class (Cost $18,264,039) | 18,264,039 | $ | 18,264,039 | ||
TOTAL INVESTMENT SECURITIES — 99.4% (Cost $1,624,298,160) | 1,970,269,174 | ||||
| OTHER ASSETS AND LIABILITIES — 0.6% | 11,811,815 | ||||
| TOTAL NET ASSETS — 100.0% | $ | 1,982,080,989 | |||
| MARKET SECTOR DIVERSIFICATION | ||
| (as a % of net assets) | ||
| Consumer Discretionary | 20.1 | % |
| Financials | 17.9 | % |
| Industrials | 14.8 | % |
| Health Care | 13.9 | % |
| Information Technology | 10.6 | % |
| Consumer Staples | 10.3 | % |
| Materials | 7.3 | % |
| Energy | 2.7 | % |
| Telecommunication Services | 0.9 | % |
| Cash and Equivalents* | 1.5 | % |
*Includes temporary cash investments and other assets and liabilities.
| NOTES TO SCHEDULE OF INVESTMENTS | ||
| ADR | - | American Depositary Receipt |
| CVA | - | Certificaten Van Aandelen |
| GDR | - | Global Depositary Receipt |
| PJSC | - | Public Joint Stock Company |
| (1) | Non-income producing. |
See Notes to Financial Statements.
13
| Statement of Assets and Liabilities |
| NOVEMBER 30, 2014 | |||
| Assets | |||
| Investment securities, at value (cost of $1,624,298,160) | $ | 1,970,269,174 | |
| Foreign currency holdings, at value (cost of $501,819) | 488,363 | ||
| Receivable for investments sold | 8,046,228 | ||
| Receivable for capital shares sold | 959,050 | ||
| Dividends and interest receivable | 4,446,312 | ||
| Other assets | 419,874 | ||
| 1,984,629,001 | |||
| Liabilities | |||
| Disbursements in excess of demand deposit cash | 88,210 | ||
| Payable for capital shares redeemed | 446,398 | ||
| Accrued management fees | 1,844,325 | ||
| Distribution and service fees payable | 70,064 | ||
| Accrued foreign taxes | 99,015 | ||
| 2,548,012 | |||
| Net Assets | $ | 1,982,080,989 | |
| Net Assets Consist of: | |||
| Capital (par value and paid-in surplus) | $ | 1,531,441,924 | |
| Distributions in excess of net investment income | (4,073,477 | ) | |
| Undistributed net realized gain | 109,202,457 | ||
| Net unrealized appreciation | 345,510,085 | ||
| $ | 1,982,080,989 | ||
| Net Assets | Shares Outstanding | Net Asset Value Per Share | |||
| Investor Class, $0.01 Par Value | $1,521,654,776 | 113,593,734 | $13.40 | ||
| Institutional Class, $0.01 Par Value | $138,527,458 | 10,391,503 | $13.33 | ||
| A Class, $0.01 Par Value | $301,164,065 | 22,345,513 | $13.48* | ||
| C Class, $0.01 Par Value | $10,128,772 | 766,011 | $13.22 | ||
| R Class, $0.01 Par Value | $2,194,568 | 161,478 | $13.59 | ||
| R6 Class, $0.01 Par Value | $8,411,350 | 630,725 | $13.34 | ||
*Maximum offering price $14.30 (net asset value divided by 0.9425).
See Notes to Financial Statements.
14
| Statement of Operations |
| YEAR ENDED NOVEMBER 30, 2014 | |||
| Investment Income (Loss) | |||
| Income: | |||
| Dividends (net of foreign taxes withheld of $4,084,012) | $ | 38,850,897 | |
| Interest | 2,749 | ||
| 38,853,646 | |||
| Expenses: | |||
| Management fees | 23,360,952 | ||
| Distribution and service fees: | |||
| A Class | 737,270 | ||
| C Class | 90,681 | ||
| R Class | 11,294 | ||
| Directors' fees and expenses | 29,379 | ||
| Other expenses | 11,167 | ||
| 24,240,743 | |||
| Net investment income (loss) | 14,612,903 | ||
| Realized and Unrealized Gain (Loss) | |||
| Net realized gain (loss) on: | |||
| Investment transactions (Note 4) (net of foreign tax expenses paid (refunded) of $(36,996)) | 131,149,447 | ||
| Foreign currency transactions | (310,810 | ) | |
| 130,838,637 | |||
| Change in net unrealized appreciation (depreciation) on: | |||
| Investments (includes (increase) decrease in accrued foreign taxes of $187,918) | (133,074,024 | ) | |
| Translation of assets and liabilities in foreign currencies | (733,348 | ) | |
| (133,807,372 | ) | ||
| Net realized and unrealized gain (loss) | (2,968,735 | ) | |
| Net Increase (Decrease) in Net Assets Resulting from Operations | $ | 11,644,168 | |
See Notes to Financial Statements.
15
| Statement of Changes in Net Assets |
| YEARS ENDED NOVEMBER 30, 2014 AND NOVEMBER 30, 2013 | ||||||
| Increase (Decrease) in Net Assets | November 30, 2014 | November 30, 2013 | ||||
| Operations | ||||||
| Net investment income (loss) | $ | 14,612,903 | $ | 14,701,721 | ||
| Net realized gain (loss) | 130,838,637 | 239,243,421 | ||||
| Change in net unrealized appreciation (depreciation) | (133,807,372 | ) | 131,287,150 | |||
| Net increase (decrease) in net assets resulting from operations | 11,644,168 | 385,232,292 | ||||
| Distributions to Shareholders | ||||||
| From net investment income: | ||||||
| Investor Class | (21,533,562 | ) | (20,623,148 | ) | ||
| Institutional Class | (3,156,132 | ) | (2,775,151 | ) | ||
| A Class | (3,096,954 | ) | (2,541,575 | ) | ||
| C Class | (18,143 | ) | (22,786 | ) | ||
| R Class | (18,382 | ) | (23,701 | ) | ||
| R6 Class | (93,071 | ) | — | |||
| From net realized gains: | ||||||
| Investor Class | (30,554,844 | ) | — | |||
| Institutional Class | (3,774,435 | ) | — | |||
| A Class | (5,446,175 | ) | — | |||
| C Class | (105,404 | ) | — | |||
| R Class | (45,597 | ) | — | |||
| R6 Class | (103,783 | ) | — | |||
| Decrease in net assets from distributions | (67,946,482 | ) | (25,986,361 | ) | ||
| Capital Share Transactions | ||||||
| Net increase (decrease) in net assets from capital share transactions (Note 5) | 73,104,964 | (6,050,779 | ) | |||
| Redemption Fees | ||||||
| Increase in net assets from redemption fees | 145,637 | 47,633 | ||||
| Net increase (decrease) in net assets | 16,948,287 | 353,242,785 | ||||
| Net Assets | ||||||
| Beginning of period | 1,965,132,702 | 1,611,889,917 | ||||
| End of period | $ | 1,982,080,989 | $ | 1,965,132,702 | ||
| Undistributed (distributions in excess of) net investment income | $ | (4,073,477 | ) | $ | 8,304,100 | |
See Notes to Financial Statements.
16
| Notes to Financial Statements |
NOVEMBER 30, 2014
1. Organization
American Century World Mutual Funds, Inc. (the corporation) is registered under the Investment Company Act of 1940, as amended (the 1940 Act), as an open-end management investment company and is organized as a Maryland corporation. International Growth Fund (the fund) is one fund in a series issued by the corporation. The fund is diversified as defined under the 1940 Act. The fund's investment objective is to seek capital growth.
The fund offers the Investor Class, the Institutional Class, the A Class, the C Class, the R Class and the R6 Class. The A Class may incur an initial sales charge. The A Class and C Class may be subject to a contingent deferred sales charge. The share classes differ principally in their respective sales charges and distribution and shareholder servicing expenses and arrangements. The Institutional Class and R6 Class shareholders do not require the same level of shareholder and administrative services from American Century Investment Management, Inc. (ACIM) (the investment advisor) as shareholders of other classes. In addition, financial intermediaries do not receive any service, distribution or administrative fees for the R6 Class. As a result, the Institutional Class and R6 Class are charged lower unified management fees. Sale of the R6 Class commenced on July 26, 2013.
2. Significant Accounting Policies
The following is a summary of significant accounting policies consistently followed by the fund in preparation of its financial statements. The fund is an investment company and follows accounting and reporting guidance in accordance with accounting principles generally accepted in the United States of America. This may require management to make certain estimates and assumptions at the date of the financial statements. Actual results could differ from these estimates. Management evaluated the impact of events or transactions occurring through the date the financial statements were issued that would merit recognition or disclosure.
Investment Valuations — The fund determines the fair value of its investments and computes its net asset value per share at the close of regular trading (usually 4 p.m. Eastern time) on the New York Stock Exchange (NYSE) on each day the NYSE is open. The Board of Directors has adopted valuation policies and procedures to guide the investment advisor in the fund’s investment valuation process and to provide methodologies for the oversight of the fund’s pricing function.
Equity securities that are listed or traded on a domestic securities exchange are valued at the last reported sales price or at the official closing price as provided by the exchange. Equity securities traded on foreign securities exchanges are generally valued at the closing price of such securities on the exchange where primarily traded or at the close of the NYSE, if that is earlier. If no last sales price is reported, or if local convention or regulation so provides, the mean of the latest bid and asked prices may be used. Securities traded over-the-counter are valued at the mean of the latest bid and asked prices, the last sales price, or the official closing price. Equity securities initially expressed in local currencies are translated into U.S. dollars at the mean of the appropriate currency exchange rate at the close of the NYSE as provided by an independent pricing service.
Fixed income securities maturing within 60 days at the time of purchase may be valued at cost, plus or minus any amortized discount or premium or at the evaluated mean as provided by an independent pricing service. Evaluated mean prices are commonly derived through utilization of market models, which may consider, among other factors: trade data, quotations from dealers and active market makers, relevant yield curve and spread data, related sector levels, creditworthiness, trade data or market information on comparable securities, and other relevant security specific information.
Open-end management investment companies are valued at the reported net asset value per share. Repurchase agreements are valued at cost, which approximates fair value.
If the fund determines that the market price for an investment is not readily available or the valuation methods mentioned above do not reflect an investment’s fair value, such investment is valued as determined in good faith by the Board of Directors or its delegate, in accordance with policies and procedures adopted by the Board of Directors. In its determination of fair value, the fund may review several factors including, but not limited to, market information regarding the specific investment or comparable investments and correlation
17
with other investment types, futures indices or general market indicators. Circumstances that may cause the fund to use these procedures to value an investment include, but are not limited to: an investment has been declared in default or is distressed; trading in a security has been suspended during the trading day or a security is not actively trading on its principal exchange; prices received from a regular pricing source are deemed unreliable; or there is a foreign market holiday and no trading occurred.
The fund monitors for significant events occurring after the close of an investment’s primary exchange but before the fund’s net asset value per share is determined. Significant events may include, but are not limited to: corporate announcements and transactions; governmental action and political unrest that could impact a specific investment or an investment sector; or armed conflicts, natural disasters and similar events that could affect investments in a specific country or region. The fund also monitors for significant fluctuations between domestic and foreign markets, as evidenced by the U.S. market or such other indicators that the Board of Directors, or its delegate, deems appropriate. If significant fluctuations in foreign markets are identified, the fund may apply a model-derived factor to the closing price of equity securities traded on foreign securities exchanges. The factor is based on observable market data as provided by an independent pricing service.
Security Transactions — Security transactions are accounted for as of the trade date. Net realized gains and losses are determined on the identified cost basis, which is also used for federal income tax purposes. Certain countries impose taxes on realized gains on the sale of securities registered in their country. The fund records the foreign tax expense, if any, on an accrual basis. The foreign tax expense on realized gains and unrealized appreciation reduces the net realized gain (loss) on investment transactions and net unrealized appreciation (depreciation) on investments, respectively.
Investment Income — Dividend income less foreign taxes withheld, if any, is recorded as of the ex-dividend date. Distributions received on securities that represent a return of capital or long-term capital gain are recorded as a reduction of cost of investments and/or as a realized gain. The fund may estimate the components of distributions received that may be considered nontaxable distributions or long-term capital gain distributions for income tax purposes. Interest income is recorded on the accrual basis and includes accretion of discounts and amortization of premiums.
Foreign Currency Translations — All assets and liabilities initially expressed in foreign currencies are translated into U.S. dollars at prevailing exchange rates at period end. The fund may enter into spot foreign currency exchange contracts to facilitate transactions denominated in a foreign currency. Purchases and sales of investment securities, dividend and interest income, spot foreign currency exchange contracts, and expenses are translated at the rates of exchange prevailing on the respective dates of such transactions. Net realized and unrealized foreign currency exchange gains or losses related to investment securities are a component of net realized gain (loss) on investment transactions and change in net unrealized appreciation (depreciation) on investments, respectively.
Repurchase Agreements — The fund may enter into repurchase agreements with institutions that ACIM has determined are creditworthy pursuant to criteria adopted by the Board of Directors. The fund requires that the collateral, represented by securities, received in a repurchase transaction be transferred to the custodian in a manner sufficient to enable the fund to obtain those securities in the event of a default under the repurchase agreement. ACIM monitors, on a daily basis, the securities transferred to ensure the value, including accrued interest, of the securities under each repurchase agreement is equal to or greater than amounts owed to the fund under each repurchase agreement.
Joint Trading Account — Pursuant to an Exemptive Order issued by the Securities and Exchange Commission, the fund, along with certain other funds in the American Century Investments family of funds, may transfer uninvested cash balances into a joint trading account. These balances are invested in one or more repurchase agreements that are collateralized by U.S. Treasury or Agency obligations.
Income Tax Status — It is the fund’s policy to distribute substantially all net investment income and net realized gains to shareholders and to otherwise qualify as a regulated investment company under provisions of the Internal Revenue Code. Accordingly, no provision has been made for income taxes. The fund files U.S. federal, state, local and non-U.S. tax returns as applicable. The fund's tax returns are subject to examination by the relevant taxing authority until expiration of the applicable statute of limitations, which is generally three years from the date of filing but can be longer in certain jurisdictions. At this time, management believes there are no uncertain tax positions which, based on their technical merit, would not be sustained upon examination and for which it is reasonably possible that the total amounts of unrecognized tax benefits will significantly change in the next twelve months.
18
Multiple Class — All shares of the fund represent an equal pro rata interest in the net assets of the class to which such shares belong, and have identical voting, dividend, liquidation and other rights and the same terms and conditions, except for class specific expenses and exclusive rights to vote on matters affecting only individual classes. Income, non-class specific expenses, and realized and unrealized capital gains and losses of the fund are allocated to each class of shares based on their relative net assets.
Distributions to Shareholders — Distributions from net investment income and net realized gains, if any, are generally declared and paid annually. The fund may make distributions on a more frequent basis to comply with the distribution requirements of the Internal Revenue Code, in all events in a manner consistent with provisions of the 1940 Act.
Redemption Fees — The fund may impose a 2.00% redemption fee on shares held less than 60 days. The fee may not be applicable to all classes. The redemption fee is retained by the fund and helps cover transaction costs that long-term investors may bear when the fund sells securities to meet investor redemptions.
Indemnifications — Under the corporation’s organizational documents, its officers and directors are indemnified against certain liabilities arising out of the performance of their duties to the fund. In addition, in the normal course of business, the fund enters into contracts that provide general indemnifications. The maximum exposure under these arrangements is unknown as this would involve future claims that may be made against a fund. The risk of material loss from such claims is considered by management to be remote.
3. Fees and Transactions with Related Parties
Certain officers and directors of the corporation are also officers and/or directors of American Century Companies, Inc. (ACC). The corporation’s investment advisor, ACIM, the corporation's distributor, American Century Investment Services, Inc. (ACIS), and the corporation’s transfer agent, American Century Services, LLC, are wholly owned, directly or indirectly, by ACC. Various funds issued by American Century Asset Allocation Portfolios, Inc. and American Century Strategic Asset Allocations, Inc. own, in aggregate, 20% of the shares of the fund.
Management Fees — The corporation has entered into a management agreement with ACIM, under which ACIM provides the fund with investment advisory and management services in exchange for a single, unified management fee (the fee) per class. The agreement provides that all expenses of managing and operating the fund, except distribution and service fees, brokerage expenses, taxes, interest, fees and expenses of the independent directors (including legal counsel fees), and extraordinary expenses, will be paid by ACIM. The fee is computed and accrued daily based on each class’s daily net assets and paid monthly in arrears. The rate of the fee is determined by applying a fee rate calculation formula. This formula takes into account the fund’s assets as well as certain assets, if any, of other clients of the investment advisor outside the American Century Investments family of funds (such as subadvised funds and separate accounts) that have very similar investment teams and investment strategies (strategy assets). The strategy assets of the fund also include the assets of NT International Growth Fund, one fund in a series issued by the corporation. The annual management fee schedule ranges from 1.050% to 1.500% for the Investor Class, A Class, C Class and R Class. The annual management fee schedule ranges from 0.850% to 1.300% for the Institutional Class and 0.700% to 1.150% for the R6 Class. The effective annual management fee for each class for the year ended November 30, 2014 was 1.18% for the Investor Class, A Class, C Class and R Class, 0.98% for the Institutional Class and 0.83% for the R6 Class.
Distribution and Service Fees — The Board of Directors has adopted a separate Master Distribution and Individual Shareholder Services Plan for each of the A Class, C Class and R Class (collectively the plans), pursuant to Rule 12b-1 of the 1940 Act. The plans provide that the A Class will pay ACIS an annual distribution and service fee of 0.25%. The plans provide that the C Class will pay ACIS an annual distribution and service fee of 1.00%, of which 0.25% is paid for individual shareholder services and 0.75% is paid for distribution services. The plans provide that the R Class will pay ACIS an annual distribution and service fee of 0.50%. The fees are computed and accrued daily based on each class’s daily net assets and paid monthly in arrears. The fees are used to pay financial intermediaries for distribution and individual shareholder services. Fees incurred under the plans during the year ended November 30, 2014 are detailed in the Statement of Operations.
19
Directors' Fees and Expenses — The Board of Directors is responsible for overseeing the investment advisor’s management and operations of the fund. The directors receive detailed information about the fund and its investment advisor regularly throughout the year, and meet at least quarterly with management of the investment advisor to review reports about fund operations. Fees and expenses incurred in conjunction with the directors during the year ended November 30, 2014 are detailed in the Statement of Operations. The fund’s officers do not receive compensation from the fund.
4. Investment Transactions
Purchases and sales of investment securities, excluding short-term investments, for the year ended November 30, 2014 were $1,513,955,735 and $1,515,850,668, respectively.
For the year ended November 30, 2014, the fund incurred net realized gains of $1,950,934 from redemptions in kind. A redemption in kind occurs when a fund delivers securities from its portfolio in lieu of cash as payment to a redeeming shareholder.
5. Capital Share Transactions
Transactions in shares of the fund were as follows:
Year ended November 30, 2014 | Year ended November 30, 2013(1) | |||||||||
| Shares | Amount | Shares | Amount | |||||||
| Investor Class/Shares Authorized | 550,000,000 | 550,000,000 | ||||||||
| Sold | 15,958,940 | $ | 214,636,628 | 9,610,155 | $ | 118,472,050 | ||||
| Issued in reinvestment of distributions | 3,844,330 | 50,247,092 | 1,715,577 | 19,900,407 | ||||||
| Redeemed | (15,010,781 | ) | (201,716,361 | ) | (15,013,406 | ) | (184,392,231 | ) | ||
| 4,792,489 | 63,167,359 | (3,687,674 | ) | (46,019,774 | ) | |||||
| Institutional Class/Shares Authorized | 150,000,000 | 150,000,000 | ||||||||
| Sold | 5,817,010 | 77,728,868 | 3,140,110 | 38,258,142 | ||||||
| Issued in reinvestment of distributions | 529,316 | 6,878,135 | 237,368 | 2,753,024 | ||||||
| Redeemed | (9,456,471 | ) | (124,255,176 | ) | (2,376,498 | ) | (29,848,228 | ) | ||
| (3,110,145 | ) | (39,648,173 | ) | 1,000,980 | 11,162,938 | |||||
| A Class/Shares Authorized | 150,000,000 | 150,000,000 | ||||||||
| Sold | 6,088,353 | 82,628,637 | 5,245,205 | 65,703,449 | ||||||
| Issued in reinvestment of distributions | 637,839 | 8,406,322 | 215,947 | 2,503,930 | ||||||
| Redeemed | (3,720,450 | ) | (50,381,712 | ) | (3,642,714 | ) | (45,205,498 | ) | ||
| 3,005,742 | 40,653,247 | 1,818,438 | 23,001,881 | |||||||
| C Class/Shares Authorized | 10,000,000 | 10,000,000 | ||||||||
| Sold | 530,078 | 7,096,533 | 163,034 | 2,125,390 | ||||||
| Issued in reinvestment of distributions | 7,339 | 95,427 | 1,715 | 19,472 | ||||||
| Redeemed | (129,287 | ) | (1,686,417 | ) | (31,039 | ) | (379,874 | ) | ||
| 408,130 | 5,505,543 | 133,710 | 1,764,988 | |||||||
| R Class/Shares Authorized | 5,000,000 | 5,000,000 | ||||||||
| Sold | 54,480 | 746,769 | 34,725 | 433,114 | ||||||
| Issued in reinvestment of distributions | 4,285 | 57,002 | 1,862 | 21,632 | ||||||
| Redeemed | (59,850 | ) | (810,122 | ) | (72,251 | ) | (914,494 | ) | ||
| (1,085 | ) | (6,351 | ) | (35,664 | ) | (459,748 | ) | |||
| R6 Class/Shares Authorized | 50,000,000 | 50,000,000 | ||||||||
| Sold | 299,887 | 3,963,299 | 384,473 | 4,698,936 | ||||||
| Issued in reinvestment of distributions | 15,166 | 196,854 | — | — | ||||||
| Redeemed | (53,864 | ) | (726,814 | ) | (14,937 | ) | (200,000 | ) | ||
| 261,189 | 3,433,339 | 369,536 | 4,498,936 | |||||||
| Net increase (decrease) | 5,356,320 | $ | 73,104,964 | (400,674 | ) | $ | (6,050,779 | ) | ||
| (1) | July 26, 2013 (commencement of sale) through November 30, 2013 for the R6 Class. |
20
6. Fair Value Measurements
The fund’s investments valuation process is based on several considerations and may use multiple inputs to determine the fair value of the investments held by the fund. In conformity with accounting principles generally accepted in the United States of America, the inputs used to determine a valuation are classified into three broad levels.
| • | Level 1 valuation inputs consist of unadjusted quoted prices in an active market for identical investments. |
| • | Level 2 valuation inputs consist of direct or indirect observable market data (including quoted prices for comparable investments, evaluations of subsequent market events, interest rates, prepayment speeds, credit risk, etc.). These inputs also consist of quoted prices for identical investments initially expressed in local currencies that are adjusted through translation into U.S. dollars. |
| • | Level 3 valuation inputs consist of unobservable data (including a fund’s own assumptions). |
The level classification is based on the lowest level input that is significant to the fair valuation measurement. The valuation inputs are not necessarily an indication of the risks associated with investing in these securities or other financial instruments. There were no significant transfers between levels during the period.
The following is a summary of the level classifications as of period end. The Schedule of Investments provides additional information on the fund’s portfolio holdings.
| Level 1 | Level 2 | Level 3 | ||||||
| Assets | ||||||||
| Investment Securities | ||||||||
| Common Stocks | ||||||||
| China | $ | 55,356,656 | $ | 30,354,102 | — | |||
| India | 36,541,005 | 17,438,561 | — | |||||
| Ireland | 12,793,147 | 20,626,503 | — | |||||
| Mexico | 20,758,118 | — | — | |||||
| Netherlands | 15,239,088 | 99,092,779 | — | |||||
| Taiwan | 15,313,025 | — | — | |||||
| Other Countries | — | 1,628,492,151 | — | |||||
| Temporary Cash Investments | 18,264,039 | — | — | |||||
| $ | 174,265,078 | $ | 1,796,004,096 | — | ||||
7. Risk Factors
There are certain risks involved in investing in foreign securities. These risks include those resulting from future adverse political, social and economic developments, fluctuations in currency exchange rates, the possible imposition of exchange controls, and other foreign laws or restrictions. Investing in emerging markets may accentuate these risks.
8. Federal Tax Information
On December 16, 2014, the fund declared and paid a per-share distribution from net realized gains to shareholders of record on December 15, 2014 of $0.7724 for the Investor Class, Institutional Class, A Class, C Class, R Class and R6 Class.
On December 16, 2014, the fund declared and paid the following per-share distributions from net investment income to shareholders of record on December 15, 2014:
| Investor Class | Institutional Class | A Class | C Class | R Class | R6 Class |
| $0.0817 | $0.1015 | $0.0568 | — | $0.0320 | $0.1164 |
21
The tax character of distributions paid during the years ended November 30, 2014 and November 30, 2013 were as follows:
| 2014 | 2013 | |||||
| Distributions Paid From | ||||||
| Ordinary income | $ | 27,916,244 | $ | 25,986,361 | ||
| Long-term capital gains | $ | 40,030,238 | — | |||
The book-basis character of distributions made during the year from net investment income or net realized gains may differ from their ultimate characterization for federal income tax purposes. These differences reflect the differing character of certain income items and net realized gains and losses for financial statement and tax purposes, and may result in reclassification among certain capital accounts on the financial statements.
As of November 30, 2014, the federal tax cost of investments and the components of distributable earnings on a tax-basis were as follows:
| Federal tax cost of investments | $ | 1,642,228,050 | |
| Gross tax appreciation of investments | $ | 368,686,748 | |
| Gross tax depreciation of investments | (40,645,624 | ) | |
| Net tax appreciation (depreciation) of investments | 328,041,124 | ||
| Net tax appreciation (depreciation) on translation of assets and liabilities in foreign currencies | (460,638 | ) | |
Net tax appreciation (depreciation) | $ | 327,580,486 | |
| Undistributed ordinary income | $ | 6,138,736 | |
Accumulated long-term gains | $ | 116,919,843 | |
The difference between book-basis and tax-basis unrealized appreciation (depreciation) is attributable primarily to the realization to ordinary income for tax purposes of unrealized gains on investments in passive foreign investment companies.
22
| Financial Highlights |
| For a Share Outstanding Throughout the Years Ended November 30 (except as noted) | |||||||||||||||
| Per-Share Data | Ratios and Supplemental Data | ||||||||||||||
| Income From Investment Operations: | Distributions From: | Ratio to Average Net Assets of: | |||||||||||||
Net Asset Value, Beginning of Period | Net Investment Income (Loss)(1) | Net Realized and Unrealized Gain (Loss) | Total From Investment Operations | Net Investment Income | Net Realized Gains | Total Distributions | Net Asset Value, End of Period | Total Return(2) | Operating Expenses | Net Investment Income (Loss) | Portfolio Turnover Rate | Net Assets, End of Period (in thousands) | |||
| Investor Class | |||||||||||||||
| 2014 | $13.78 | 0.10 | —(3) | 0.10 | (0.20) | (0.28) | (0.48) | $13.40 | 0.80% | 1.18% | 0.74% | 75% | $1,521,655 | ||
| 2013 | $11.27 | 0.11 | 2.58 | 2.69 | (0.18) | — | (0.18) | $13.78 | 24.22% | 1.22% | 0.84% | 110% | $1,499,623 | ||
| 2012 | $9.90 | 0.15 | 1.33 | 1.48 | (0.11) | — | (0.11) | $11.27 | 15.10% | 1.29% | 1.41% | 106% | $1,268,251 | ||
| 2011 | $10.30 | 0.10 | (0.35) | (0.25) | (0.15) | — | (0.15) | $9.90 | (2.57)% | 1.32% | 0.95% | 125% | $1,189,245 | ||
| 2010 | $9.75 | 0.09 | 0.61 | 0.70 | (0.15) | — | (0.15) | $10.30 | 7.28% | 1.35% | 0.87% | 130% | $1,320,906 | ||
| Institutional Class | |||||||||||||||
| 2014 | $13.73 | 0.14 | (0.03) | 0.11 | (0.23) | (0.28) | (0.51) | $13.33 | 0.91% | 0.98% | 0.94% | 75% | $138,527 | ||
| 2013 | $11.24 | 0.13 | 2.58 | 2.71 | (0.22) | — | (0.22) | $13.73 | 24.54% | 1.02% | 1.04% | 110% | $185,325 | ||
| 2012 | $9.89 | 0.17 | 1.33 | 1.50 | (0.15) | — | (0.15) | $11.24 | 15.28% | 1.09% | 1.61% | 106% | $140,446 | ||
| 2011 | $10.30 | 0.12 | (0.33) | (0.21) | (0.20) | — | (0.20) | $9.89 | (2.27)% | 1.12% | 1.15% | 125% | $113,741 | ||
| 2010 | $9.78 | 0.10 | 0.61 | 0.71 | (0.19) | — | (0.19) | $10.30 | 7.38% | 1.15% | 1.07% | 130% | $98,610 | ||
23
| For a Share Outstanding Throughout the Years Ended November 30 (except as noted) | |||||||||||||||
| Per-Share Data | Ratios and Supplemental Data | ||||||||||||||
| Income From Investment Operations: | Distributions From: | Ratio to Average Net Assets of: | |||||||||||||
Net Asset Value, Beginning of Period | Net Investment Income (Loss)(1) | Net Realized and Unrealized Gain (Loss) | Total From Investment Operations | Net Investment Income | Net Realized Gains | Total Distributions | Net Asset Value, End of Period | Total Return(2) | Operating Expenses | Net Investment Income (Loss) | Portfolio Turnover Rate | Net Assets, End of Period (in thousands) | |||
| A Class | |||||||||||||||
| 2014 | $13.86 | 0.07 | (0.01) | 0.06 | (0.16) | (0.28) | (0.44) | $13.48 | 0.49% | 1.43% | 0.49% | 75% | $301,164 | ||
| 2013 | $11.33 | 0.07 | 2.61 | 2.68 | (0.15) | — | (0.15) | $13.86 | 23.98% | 1.47% | 0.59% | 110% | $267,979 | ||
| 2012 | $9.92 | 0.12 | 1.35 | 1.47 | (0.06) | — | (0.06) | $11.33 | 14.80% | 1.54% | 1.16% | 106% | $198,434 | ||
| 2011 | $10.29 | 0.08 | (0.35) | (0.27) | (0.10) | — | (0.10) | $9.92 | (2.76)% | 1.57% | 0.70% | 125% | $172,901 | ||
| 2010 | $9.72 | 0.06 | 0.61 | 0.67 | (0.10) | — | (0.10) | $10.29 | 6.98% | 1.60% | 0.62% | 130% | $183,990 | ||
| C Class | |||||||||||||||
| 2014 | $13.58 | (0.03) | (0.02) | (0.05) | (0.03) | (0.28) | (0.31) | $13.22 | (0.29)% | 2.18% | (0.26)% | 75% | $10,129 | ||
| 2013 | $11.14 | (0.03) | 2.57 | 2.54 | (0.10) | — | (0.10) | $13.58 | 23.00% | 2.22% | (0.16)% | 110% | $4,859 | ||
| 2012 | $9.77 | 0.04 | 1.33 | 1.37 | — | — | — | $11.14 | 14.02% | 2.29% | 0.41% | 106% | $2,497 | ||
| 2011 | $10.13 | —(3) | (0.36) | (0.36) | — | — | — | $9.77 | (3.55)% | 2.32% | (0.05)% | 125% | $2,725 | ||
| 2010 | $9.54 | (0.01) | 0.60 | 0.59 | — | — | — | $10.13 | 6.18% | 2.35% | (0.13)% | 130% | $2,691 | ||
24
| For a Share Outstanding Throughout the Years Ended November 30 (except as noted) | |||||||||||||||
| Per-Share Data | Ratios and Supplemental Data | ||||||||||||||
| Income From Investment Operations: | Distributions From: | Ratio to Average Net Assets of: | |||||||||||||
Net Asset Value, Beginning of Period | Net Investment Income (Loss)(1) | Net Realized and Unrealized Gain (Loss) | Total From Investment Operations | Net Investment Income | Net Realized Gains | Total Distributions | Net Asset Value, End of Period | Total Return(2) | Operating Expenses | Net Investment Income (Loss) | Portfolio Turnover Rate | Net Assets, End of Period (in thousands) | |||
| R Class | |||||||||||||||
| 2014 | $13.96 | 0.03 | (0.01) | 0.02 | (0.11) | (0.28) | (0.39) | $13.59 | 0.25% | 1.68% | 0.24% | 75% | $2,195 | ||
| 2013 | $11.41 | 0.05 | 2.62 | 2.67 | (0.12) | — | (0.12) | $13.96 | 23.59% | 1.72% | 0.34% | 110% | $2,270 | ||
| 2012 | $9.97 | 0.10 | 1.35 | 1.45 | (0.01) | — | (0.01) | $11.41 | 14.56% | 1.79% | 0.91% | 106% | $2,262 | ||
| 2011 | $10.32 | 0.05 | (0.36) | (0.31) | (0.04) | — | (0.04) | $9.97 | (3.05)% | 1.82% | 0.45% | 125% | $3,222 | ||
| 2010 | $9.72 | 0.03 | 0.62 | 0.65 | (0.05) | — | (0.05) | $10.32 | 6.75% | 1.85% | 0.37% | 130% | $4,381 | ||
| R6 Class | |||||||||||||||
| 2014 | $13.74 | 0.13 | —(3) | 0.13 | (0.25) | (0.28) | (0.53) | $13.34 | 1.10% | 0.83% | 1.09% | 75% | $8,411 | ||
2013(4) | $12.56 | 0.01 | 1.17 | 1.18 | — | — | — | $13.74 | 9.39% | 0.85%(5) | 0.20%(5) | 110%(6) | $5,076 | ||
| Notes to Financial Highlights | |
| (1) | Computed using average shares outstanding throughout the period. |
| (2) | Total returns are calculated based on the net asset value of the last business day and do not reflect applicable sales charges, if any. Total returns for periods less than one year are not annualized. |
| (3) | Per-share amount was less than $0.005. |
| (4) | July 26, 2013 (commencement of sale) through November 30, 2013. |
| (5) | Annualized. |
| (6) | Portfolio turnover is calculated at the fund level. Percentage indicated was calculated for the year ended November 30, 2013. |
See Notes to Financial Statements.
25
| Report of Independent Registered Public Accounting Firm |
To the Board of Directors and Shareholders of
American Century World Mutual Funds, Inc.:
We have audited the accompanying statement of assets and liabilities, including the schedule of investments, of International Growth Fund (the “Fund”), one of the funds constituting American Century World Mutual Funds, Inc., as of November 30, 2014, and the related statement of operations for the year then ended, the statements of changes in net assets for each of the two years in the period then ended, and the financial highlights for each of the periods presented. These financial statements and financial highlights are the responsibility of the Fund's management. Our responsibility is to express an opinion on these financial statements and financial highlights based on our audits.
We conducted our audits in accordance with the standards of the Public Company Accounting Oversight Board (United States). Those standards require that we plan and perform the audit to obtain reasonable assurance about whether the financial statements and financial highlights are free of material misstatement. The Fund is not required to have, nor were we engaged to perform, an audit of its internal control over financial reporting. Our audits included consideration of internal control over financial reporting as a basis for designing audit procedures that are appropriate in the circumstances, but not for the purpose of expressing an opinion on the effectiveness of the Fund's internal control over financial reporting. Accordingly, we express no such opinion. An audit also includes examining, on a test basis, evidence supporting the amounts and disclosures in the financial statements, assessing the accounting principles used and significant estimates made by management, as well as evaluating the overall financial statement presentation. Our procedures included confirmation of securities owned as of November 30, 2014, by correspondence with the custodian and brokers; where replies were not received from brokers, we performed other auditing procedures. We believe that our audits provide a reasonable basis for our opinion.
In our opinion, the financial statements and financial highlights referred to above present fairly, in all material respects, the financial position of International Growth Fund of American Century World Mutual Funds, Inc. as of November 30, 2014, the results of its operations for the year then ended, the changes in its net assets for each of the two years in the period then ended, and the financial highlights for each of the periods presented, in conformity with accounting principles generally accepted in the United States of America.
DELOITTE & TOUCHE LLP
Kansas City, Missouri
January 16, 2015
26
| Management |
The Board of Directors
The individuals listed below serve as directors of the funds. Each director will continue to serve in this capacity until death, retirement, resignation or removal from office. The board has adopted a mandatory retirement age for directors who are not “interested persons,” as that term is defined in the Investment Company Act (independent directors). Independent directors shall retire by December 31 of the year in which they reach their 75th birthday.
Mr. Thomas is an “interested person” because he currently serves as President and Chief Executive Officer of American Century Companies, Inc. (ACC), the parent company of American Century Investment Management, Inc. (ACIM or the advisor). Mr. Fink is treated as an “interested person” because of his recent employment with ACC and American Century Services, LLC (ACS). The other directors (more than three-fourths of the total number) are independent. They are not employees, directors or officers of, and have no financial interest in, ACC or any of its wholly owned, direct or indirect, subsidiaries, including ACIM, American Century Investment Services, Inc. (ACIS) and ACS, and they do not have any other affiliations, positions or relationships that would cause them to be considered “interested persons” under the Investment Company Act. The directors serve in this capacity for seven (in the case of Mr. Thomas, 15) registered investment companies in the American Century Investments family of funds.
The following table presents additional information about the directors. The mailing address for each director is 4500 Main Street, Kansas City, Missouri 64111.
Name (Year of Birth) | Position(s) Held with Funds | Length of Time Served | Principal Occupation(s) During Past 5 Years | Number of American Century Portfolios Overseen by Director | Other Directorships Held During Past 5 Years |
| Independent Directors | |||||
Thomas A. Brown (1940) | Director | Since 1980 | Managing Member, Associated Investments, LLC (real estate investment company); Brown Cascade Properties, LLC (real estate investment company) (2001 to 2009) | 73 | None |
Andrea C. Hall (1945) | Director | Since 1997 | Retired | 73 | None |
Jan M. Lewis (1957) | Director | Since 2011 | Retired; President and Chief Executive Officer, Catholic Charities of Northeast Kansas (human services organization) (2006 to 2013) | 73 | None |
James A. Olson (1942) | Director and Chairman of the Board | Since 2007 (Chairman since 2014) | Member, Plaza Belmont LLC (private equity fund manager) | 73 | Saia, Inc. (2002 to 2012) and EPR Properties (2003 to 2013) |
27
Name (Year of Birth) | Position(s) Held with Funds | Length of Time Served | Principal Occupation(s) During Past 5 Years | Number of American Century Portfolios Overseen by Director | Other Directorships Held During Past 5 Years |
| Independent Directors | |||||
M. Jeannine Strandjord (1945) | Director | Since 1994 | Retired | 73 | Euronet Worldwide Inc.; MGP Ingredients, Inc.; Charming Shoppes, Inc. (2006 to 2010); and DST Systems Inc. (1996 to 2012) |
John R. Whitten (1946) | Director | Since 2008 | Retired | 73 | Rudolph Technologies, Inc. |
Stephen E. Yates (1948) | Director | Since 2012 | Retired; Executive Vice President, Technology & Operations, KeyCorp. (computer services) (2004 to 2010) | 73 | Applied Industrial Technologies, Inc. (2001 to 2010) |
| Interested Directors | |||||
Barry Fink (1955) | Director | Since 2012 | Retired; Executive Vice President, ACC (September 2007 to February 2013); President, ACS (October 2007 to February 2013); Chief Operating Officer, ACC (September 2007 to November 2012) | 73 | None |
Jonathan S. Thomas (1963) | Director and President | Since 2007 | President and Chief Executive Officer, ACC (March 2007 to present). Also serves as Chief Executive Officer, ACS; Executive Vice President, ACIM; Director, ACC, ACIM and other ACC subsidiaries | 118 | BioMed Valley Discoveries, Inc. |
The Statement of Additional Information has additional information about the fund's directors and is available without charge, upon request, by calling 1-800-345-2021.
28
Officers
The following table presents certain information about the executive officers of the funds. Each officer serves as an officer for each of the 15 investment companies in the American Century family of funds, unless otherwise noted. No officer is compensated for his or her service as an officer of the funds. The listed officers are interested persons of the funds and are appointed or re-appointed on an annual basis. The mailing address for each officer listed below is 4500 Main Street, Kansas City, Missouri 64111.
Name (Year of Birth) | Offices with the Funds | Principal Occupation(s) During the Past Five Years |
Jonathan S. Thomas (1963) | Director and President since 2007 | President and Chief Executive Officer, ACC (March 2007 to present). Also serves as Chief Executive Officer, ACS; Executive Vice President, ACIM; Director, ACC, ACIM and other ACC subsidiaries |
Amy D. Shelton (1964) | Chief Compliance Officer and Vice President since 2014 | Chief Compliance Officer, American Century funds, (March 2014 to present); Chief Compliance Officer, ACIM (February 2014 to present); Chief Compliance Officer, ACIS (October 2009 to present); Vice President, Client Interactions and Marketing, ACIS (February 2013 to January 2014); Director, Client Interactions and Marketing, ACIS (June 2007 to January 2013). Also serves as Vice President, ACIS |
Charles A. Etherington (1957) | General Counsel since 2007 and Senior Vice President since 2006 | Attorney, ACC (February 1994 to present); Vice President, ACC (November 2005 to present); General Counsel, ACC (March 2007 to present). Also serves as General Counsel, ACIM, ACS, ACIS and other ACC subsidiaries; and Senior Vice President, ACIM and ACS |
C. Jean Wade (1964) | Vice President, Treasurer and Chief Financial Officer since 2012 | Vice President, ACS (February 2000 to present) |
Robert J. Leach (1966) | Vice President since 2006 and Assistant Treasurer since 2012 | Vice President, ACS (February 2000 to present) |
David H. Reinmiller (1963) | Vice President since 2000 | Attorney, ACC (January 1994 to present); Associate General Counsel, ACC (January 2001 to present). Also serves as Vice President, ACIM and ACS |
Ward D. Stauffer (1960) | Secretary since 2005 | Attorney, ACC (June 2003 to present) |
29
| Approval of Management Agreement |
At a meeting held on June 18, 2014, the Fund’s Board of Directors unanimously approved the renewal of the management agreement pursuant to which American Century Investment Management, Inc. (the “Advisor”) acts as the investment advisor for the Fund. Under Section 15(c) of the Investment Company Act, contracts for investment advisory services are required to be reviewed, evaluated, and approved by a majority of a fund’s directors (the “Directors”), including a majority of the independent Directors, each year.
Prior to its consideration of the renewal of the management agreement, the Board requested and reviewed extensive data and information compiled by the Advisor and certain independent providers of evaluation data concerning the Fund and the services provided to the Fund by the Advisor. This review was in addition to the oversight and evaluation undertaken by the Board and its committees on a continuous basis and the information received was supplemental to the extensive information that the Board and its committees receive and consider throughout the year.
In connection with its consideration of the renewal of the management agreement, the Board’s review and evaluation of the services provided by the Advisor included, but was not limited to, the following:
| • | the nature, extent, and quality of investment management, shareholder services, and other services provided by the Advisor to the Fund; |
| • | the wide range of other programs and services the Advisor provides to the Fund and its shareholders on a routine and non-routine basis; |
| • | the Fund’s investment performance compared to appropriate benchmarks and/or a peer group of other mutual funds with similar investment objectives and strategies; |
| • | the cost of owning the Fund compared to the cost of owning similar funds; |
| • | the Advisor’s compliance policies, procedures, and regulatory experience; |
| • | financial data showing the cost of services provided to the Fund, the profitability of the Fund to the Advisor, and the overall profitability of the Advisor; |
| • | possible economies of scale associated with the Advisor’s management of the Fund and other accounts under its management; |
| • | the services provided and charges to other investment management clients of the Advisor; |
| • | acquired fund fees and expenses; and |
| • | any collateral benefits derived by the Advisor from the management of the Fund. |
In keeping with its practice, the Board held two in-person meetings and one telephonic meeting to review and discuss the information provided. The independent Directors also had the benefit of the advice of their independent counsel throughout the process.
Factors Considered
The Directors considered all of the information provided by the Advisor, the independent data providers, and independent counsel, and evaluated such information for the Fund. In connection with their review, the Directors did not identify any single factor as being all-important or controlling, and each Director may have attributed different levels of importance to different factors. In deciding to renew the management agreement, the Board based its decision on a number of factors, including the following:
30
Nature, Extent and Quality of Services — Generally. Under the management agreement, the Advisor is responsible for providing or arranging for all services necessary for the operation of the Fund. The Board noted that under the management agreement, the Advisor provides or arranges at its own expense a wide variety of services including:
| • | constructing and designing the Fund |
| • | portfolio research and security selection |
| • | initial capitalization/funding |
| • | securities trading |
| • | Fund administration |
| • | custody of Fund assets |
| • | daily valuation of the Fund’s portfolio |
| • | shareholder servicing and transfer agency, including shareholder confirmations, recordkeeping, and communications |
| • | legal services (except the independent Directors’ counsel) |
| • | regulatory and portfolio compliance |
| • | financial reporting |
| • | marketing and distribution (except Rule 12b-1 plans) |
The Board noted that many of these services have expanded over time both in terms of quantity and complexity in response to shareholder demands, competition in the industry, changing distribution channels, and the changing regulatory environment.
Investment Management Services. The nature of the investment management services provided to the Fund is quite complex and allows Fund shareholders access to professional money management, instant diversification of their investments within an asset class, the opportunity to easily diversify among asset classes by investing in or exchanging among various American Century Investments funds, and liquidity. In evaluating investment performance, the Board expects the Advisor to manage the Fund in accordance with its investment objectives and approved strategies. Further, the Directors recognize that the Advisor has an obligation to monitor trading activities, and in particular to seek the best execution of fund trades, and to evaluate the use of and payment for research. In providing these services, the Advisor utilizes teams of investment professionals (portfolio managers, analysts, research assistants, and securities traders) who require extensive information technology, research, training, compliance and other systems to conduct their business. The Board, directly and through its Fund Performance Review Committee, regularly reviews investment performance information for the Fund, together with comparative information for appropriate benchmarks and/or peer groups of similarly-managed funds, over different time horizons. The Directors also review detailed performance information during the management agreement approval process. If performance concerns are identified, the Fund receives special reviews until performance improves, during which the Board discusses with the Advisor the reasons for such results (e.g., market conditions, security selection) and any efforts being undertaken to improve performance. The Fund’s performance was above its benchmark for the one-, three-, five-, and ten-year periods reviewed by the Board. The Board found the investment management services provided by the Advisor to the Fund to be satisfactory and consistent with the management agreement.
Shareholder and Other Services. Under the management agreement, the Advisor provides the Fund with a comprehensive package of transfer agency, shareholder, and other services. The Board, directly and through various committees of the Board, regularly reviews reports and evaluations of such services at its regular meetings. These reports include, but are not limited to, information regarding the operational efficiency and accuracy of the shareholder and transfer agency services provided, staffing levels, shareholder satisfaction (as measured by external as well as internal sources), technology support, new products and services offered to Fund shareholders, securities trading activities, portfolio valuation services, auditing services, and legal and operational compliance activities. Certain aspects of shareholder and transfer agency service level efficiency and the quality of securities trading activities are measured by independent third party providers and are presented in comparison to other fund groups not managed by the Advisor. The Board
31
found the services provided by the Advisor to the Fund under the management agreement to be competitive and of high quality.
Costs of Services and Profitability. The Advisor provides detailed information concerning its cost of providing various services to the Fund, its profitability in managing the Fund (pre- and post-distribution), its overall profitability, and its financial condition. The Directors have reviewed with the Advisor the methodology used to prepare this financial information. The financial information regarding the Advisor is considered in evaluating the Advisor’s financial condition, its ability to continue to provide services under the management agreement, and the reasonableness of the current management fee. The Board concluded that the Advisor’s profits were reasonable in light of the services provided to the Fund.
Ethics. The Board generally considers the Advisor’s commitment to providing quality services to shareholders and to conducting its business ethically. They noted that the Advisor’s practices generally meet or exceed industry best practices.
Economies of Scale. The Board also reviewed information provided by the Advisor regarding the possible existence of economies of scale in connection with the management of the Fund. The Board concluded that economies of scale are difficult to measure and predict with precision, especially on a fund-by-fund basis. The Board concluded that the Advisor is appropriately sharing economies of scale through its competitive fee structure, offering competitive fees from fund inception, and through reinvestment in its business to provide shareholders additional content and services.
Comparison to Other Funds’ Fees. The management agreement provides that the Fund pays the Advisor a single, all-inclusive (or unified) management fee for providing all services necessary for the management and operation of the Fund, other than brokerage expenses, taxes, interest, extraordinary expenses, and the fees and expenses of the Fund’s independent directors (including their independent legal counsel) and expenses incurred in connection with the provision of shareholder services and distribution services under a plan adopted pursuant to Rule 12b-1 under the 1940 Act. Under the unified fee structure, the Advisor is responsible for providing all investment advisory, custody, audit, administrative, compliance, recordkeeping, marketing and shareholder services, or arranging and supervising third parties to provide such services. By contrast, most other funds are charged a variety of fees, including an investment advisory fee, a transfer agency fee, an administrative fee, distribution charges and other expenses. Other than their investment advisory fees and any applicable Rule 12b-1 distribution fees, all other components of the total fees charged by these other funds may be increased without shareholder approval. The Board believes the unified fee structure is a benefit to Fund shareholders because it clearly discloses to shareholders the cost of owning Fund shares, and, since the unified fee cannot be increased without a vote of Fund shareholders, it shifts to the Advisor the risk of increased costs of operating the Fund and provides a direct incentive to minimize administrative inefficiencies. Part of the Board’s analysis of fee levels involves reviewing certain evaluative data compiled by an independent provider comparing the Fund’s unified fee to the total expense ratios of its peers. The unified fee charged to shareholders of the Fund was slightly above the median of the total expense ratios of the Fund’s peer expense universe and was within the range of its peer expense group. The Board concluded that the management fee paid by the Fund to the Advisor under the management agreement is reasonable in light of the services provided to the Fund.
Comparison to Fees and Services Provided to Other Clients of the Advisor. The Board also requested and received information from the Advisor concerning the nature of the services, fees, costs and profitability of its advisory services to advisory clients other than the Fund. They observed that these varying types of client accounts require different services and involve different regulatory and entrepreneurial risks than the management of the Fund. The Board analyzed this information and concluded that the fees charged and services provided to the Fund were reasonable by comparison.
32
Collateral or “Fall-Out” Benefits Derived by the Advisor. The Board considered the existence of collateral benefits the Advisor may receive as a result of its relationship with the Fund. They concluded that the Advisor’s primary business is managing mutual funds and it generally does not use fund or shareholder information to generate profits in other lines of business, and therefore does not derive any significant collateral benefits from them. The Board noted that the Advisor receives proprietary research from broker-dealers that execute fund portfolio transactions and concluded that this research is likely to benefit Fund shareholders. The Board also determined that the Advisor is able to provide investment management services to certain clients other than the Fund, at least in part, due to its existing infrastructure built to serve the fund complex. The Board concluded, however, that the assets of those other clients are not material to the analysis and, where applicable, may be included with the assets of the Fund to determine breakpoints in the management fee schedule.
Existing Relationship. The Board also considered whether there was any reason for not continuing the existing arrangement with the Advisor. In this regard, the Board was mindful of the potential disruptions of the Fund’s operations and various risks, uncertainties, and other effects that could occur as a result of a decision not to continue such relationship. In particular, the Board recognized that most shareholders have invested in the Fund on the strength of the Advisor’s industry standing and reputation and in the expectation that the Advisor will have a continuing role in providing advisory services to the Fund.
Conclusion of the Directors. As a result of this process, the Board, including all of the independent Directors, taking into account all of the factors discussed above and the information provided by the Advisor and others, concluded that the management agreement between the Fund and the Advisor is fair and reasonable in light of the services provided and should be renewed.
33
| Additional Information |
Retirement Account Information
As required by law, distributions you receive from certain IRAs are subject to federal income tax withholding, unless you elect not to have withholding apply. Tax will be withheld on the total amount withdrawn even though you may be receiving amounts that are not subject to withholding, such as nondeductible contributions. In such case, excess amounts of withholding could occur. You may adjust your withholding election so that a greater or lesser amount will be withheld.
If you don’t want us to withhold on this amount, you must notify us to not withhold the federal income tax. You may notify us in writing or in certain situations by telephone or through other electronic means. For systematic withdrawals, your withholding election will remain in effect until revoked or changed by filing a new election. You have the right to revoke your election at any time.
Remember, even if you elect not to have income tax withheld, you are liable for paying income tax on the taxable portion of your withdrawal. If you elect not to have income tax withheld or you don’t have enough income tax withheld, you may be responsible for payment of estimated tax. You may incur penalties under the estimated tax rules if your withholding and estimated tax payments are not sufficient. You can reduce or defer the income tax on a distribution by directly or indirectly rolling such distribution over to another IRA or eligible plan. You should consult your tax advisor for additional information.
State tax will be withheld if, at the time of your distribution, your address is within one of the mandatory withholding states and you have federal income tax withheld (or as otherwise required by state law). State taxes will be withheld from your distribution in accordance with the respective state rules.
Distributions you receive from 403(b), 457 and qualified plans are subject to special tax and withholding rules. Your plan administrator or plan sponsor is required to provide you with a special tax notice explaining those rules at the time you request a distribution. If applicable, federal and/or state taxes may be withheld from your distribution amount.
Proxy Voting Policies
A description of the policies that the fund's investment advisor uses in exercising the voting rights associated with the securities purchased and/or held by the fund is available without charge, upon request, by calling 1-800-345-2021. It is also available on the "About Us" page of American Century Investments’ website at americancentury.com and on the Securities and Exchange Commission’s website at sec.gov. Information regarding how the investment advisor voted proxies relating to portfolio securities during the most recent 12-month period ended June 30 is available on the "About Us" page at americancentury.com. It is also available at sec.gov.
Quarterly Portfolio Disclosure
The fund files its complete schedule of portfolio holdings with the Securities and Exchange Commission (SEC) for the first and third quarters of each fiscal year on Form N-Q. The fund’s Forms N-Q are available on the SEC’s website at sec.gov, and may be reviewed and copied at the SEC’s Public Reference Room in Washington, DC. Information on the operation of the Public Reference Room may be obtained by calling 1-800-SEC-0330. The fund also makes its complete schedule of portfolio holdings for the most recent quarter of its fiscal year available on its
website at americancentury.com and, upon request, by calling 1-800-345-2021.
34
Other Tax Information
The following information is provided pursuant to provisions of the Internal Revenue Code.
The fund hereby designates up to the maximum amount allowable as qualified dividend income for the fiscal year ended November 30, 2014.
The fund hereby designates $40,030,238, or up to the maximum amount allowable, as long-term capital gain distributions for the fiscal year ended November 30, 2014.
For the fiscal year ended November 30, 2014, the fund intends to pass through to shareholders $4,084,012, or up to the maximum amount allowable, as a foreign tax credit which represents taxes paid on income derived from sources within foreign countries or possessions of the United States. During the fiscal year ended November 30, 2014, the fund earned $42,409,602 from income derived from foreign sources. Foreign source income and foreign tax expense per outstanding share on November 30, 2014 are $0.2868 and $0.0276, respectively.
35
| Notes |
36
| ||
| Contact Us | americancentury.com | |
| Automated Information Line | 1-800-345-8765 | |
| Investor Services Representative | 1-800-345-2021 or 816-531-5575 | |
| Investors Using Advisors | 1-800-378-9878 | |
| Business, Not-For-Profit, Employer-Sponsored Retirement Plans | 1-800-345-3533 | |
| Banks and Trust Companies, Broker-Dealers, Financial Professionals, Insurance Companies | 1-800-345-6488 | |
| Telecommunications Relay Service for the Deaf | 711 | |
| American Century World Mutual Funds, Inc. | ||
Investment Advisor: American Century Investment Management, Inc. Kansas City, Missouri | ||
| This report and the statements it contains are submitted for the general information of our shareholders. The report is not authorized for distribution to prospective investors unless preceded or accompanied by an effective prospectus. | ||
| ©2015 American Century Proprietary Holdings, Inc. All rights reserved. CL-ANN-84128 1501 | ||
ANNUAL REPORT | NOVEMBER 30, 2014 |
International Opportunities Fund
| Table of Contents |
| President’s Letter | |
| Performance | |
| Portfolio Commentary | |
| Fund Characteristics | |
| Shareholder Fee Example | |
| Schedule of Investments | |
| Statement of Assets and Liabilities | |
| Statement of Operations | |
| Statement of Changes in Net Assets | |
| Notes to Financial Statements | |
| Financial Highlights | |
| Report of Independent Registered Public Accounting Firm | |
| Management | |
| Approval of Management Agreement | |
| Additional Information | |
Any opinions expressed in this report reflect those of the author as of the date of the report, and do not necessarily represent the opinions of American Century Investments® or any other person in the American Century Investments organization. Any such opinions are subject to change at any time based upon market or other conditions and American Century Investments disclaims any responsibility to update such opinions. These opinions may not be relied upon as investment advice and, because investment decisions made by American Century Investments funds are based on numerous factors, may not be relied upon as an indication of trading intent on behalf of any American Century Investments fund. Security examples are used for representational purposes only and are not intended as recommendations to purchase or sell securities. Performance information for comparative indices and securities is provided to American Century Investments by third party vendors. To the best of American Century Investments’ knowledge, such information is accurate at the time of printing.
| President’s Letter |
| Dear Investor: Thank you for reviewing this annual report for the 12 months ended November 30, 2014. It provides investment performance and portfolio information for the reporting period, plus longer-term historical performance data. Annual reports remain important vehicles for conveying information about fund returns, including market and economic factors that affected performance during the reporting period. For additional, updated investment and market insights, we encourage you to visit our website, americancentury.com. |
| Jonathan Thomas | |
Favorable Fiscal Year for U.S. Investments, While Non-U.S. Lagged
“Global divergence” between the U.S. and the rest of the world emerged as a prevalent theme during the reporting period. As 2014 approached its conclusion, the U.S. appeared to be on a different economic and monetary policy track than most other nations. This theme covered not only the stronger economic growth enjoyed by the U.S. compared with the rest of the world, but also the related contrast between the U.S. Federal Reserve’s unwinding of monetary stimulus versus the continuation and expansion of monetary stimulus by most other central banks.
Global divergence could also generally describe the broad difference between investment returns for U.S. and non-U.S. markets. The perceived strength, safe-haven qualities, and higher yields of U.S. investments attracted global demand. For the reporting period, the S&P 500 Index, the Barclays U.S. Aggregate Bond Index, and the U.S. Dollar Index returned 16.86%, 5.27%, and 9.34%, respectively. By contrast, for U.S. investors unhedged for currency exposure (the dollar’s strength reduced the returns of non-dollar-denominated securities when they were converted to dollars), the MSCI EAFE Index, the MSCI Emerging Markets Index, and the Barclays Global Aggregate Bond Index (ex-USD, unhedged) returned -0.02%, 1.06%, and -2.53%, respectively.
We expect global divergence in economic growth and monetary policies to continue well into 2015, aligned with expectations that the Federal Reserve might finally start raising short-term U.S. interest rates. However, global economic weakness (reflected in recent commodity price declines) and low inflation might delay the rate hikes until the second half of 2015. In this environment, we continue to believe in a disciplined, diversified, long-term investment approach, using professionally managed stock and bond portfolios to meet financial goals. We appreciate your continued trust in us.
Sincerely,
Jonathan Thomas
President and Chief Executive Officer
American Century Investments
2
| Performance |
| Total Returns as of November 30, 2014 | ||||||
Average Annual Returns | ||||||
Ticker Symbol | 1 year | 5 years | 10 years | Since Inception | Inception Date | |
Investor Class | AIOIX | -2.77%(1) | 10.96%(1) | 9.44%(1) | 12.30% | 6/1/01 |
MSCI All Country World ex-U.S. Small Cap Growth Index | — | -0.73% | 7.73% | 7.04% | 7.48% | — |
| Institutional Class | ACIOX | -2.58%(1) | 11.19%(1) | 9.66%(1) | 14.68%(1) | 1/9/03 |
| A Class | AIVOX | 3/1/10 | ||||
| No sales charge* | -3.06%(1) | — | — | 10.96%(1) | ||
| With sales charge* | -8.64%(1) | — | — | 9.57%(1) | ||
| C Class | AIOCX | -3.75%(1) | — | — | 10.17%(1) | 3/1/10 |
| R Class | AIORX | -3.15%(1) | — | — | 10.72%(1) | 3/1/10 |
* Sales charges include initial sales charges and contingent deferred sales charges (CDSCs), as applicable. A Class shares have a 5.75% maximum initial sales charge and may be subject to a maximum CDSC of 1.00%. C Class shares redeemed within 12 months of purchase are subject to a maximum CDSC of 1.00%. The SEC requires that mutual funds provide performance information net of maximum sales charges in all cases where charges could be applied.
| (1) | Returns would have been lower if a portion of the management fee had not been waived. |
Data presented reflect past performance. Past performance is no guarantee of future results. Current performance may be higher or lower than the performance shown. Investment return and principal value will fluctuate, and redemption value may be more or less than original cost. Data assumes reinvestment of dividends and capital gains, and none of the charts reflect the deduction of taxes that a shareholder would pay on fund distributions or the redemption of fund shares. To obtain performance data current to the most recent month end, please call 1-800-345-2021 or visit americancentury.com. For additional information about the fund, please consult the prospectus.
3
| Growth of $10,000 Over 10 Years |
| $10,000 investment made November 30, 2004 |
| Performance for other share classes will vary due to differences in fee structure. |
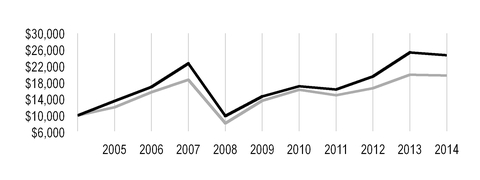
| Value on November 30, 2014 | |
| Investor Class — $24,660* | |
| MSCI All Country World ex-U.S. Small Cap Growth Index — $19,762 | |
*Ending value would have been lower if a portion of the management fee had not been waived.
Total Annual Fund Operating Expenses | ||||
Investor Class | Institutional Class | A Class | C Class | R Class |
| 1.80% | 1.60% | 2.05% | 2.80% | 2.30% |
The total annual fund operating expenses shown is as stated in the fund’s prospectus current as of the date of this report. The prospectus may vary from the expense ratio shown elsewhere in this report because it is based on a different time period, includes acquired fund fees and expenses, and, if applicable, does not include fee waivers or expense reimbursements.
Data presented reflect past performance. Past performance is no guarantee of future results. Current performance may be higher or lower than the performance shown. Investment return and principal value will fluctuate, and redemption value may be more or less than original cost. Data assumes reinvestment of dividends and capital gains, and none of the charts reflect the deduction of taxes that a shareholder would pay on fund distributions or the redemption of fund shares. To obtain performance data current to the most recent month end, please call 1-800-345-2021 or visit americancentury.com. For additional information about the fund, please consult the prospectus.
4
| Portfolio Commentary |
Portfolio Managers: Trevor Gurwich and Federico Laffan
As of September 30, 2014, Mark Kopinski and Indraneel Das left the fund’s management team, and Federico Laffan, who was a senior investment analyst on the Emerging Markets Equity team, was promoted to portfolio manager.
Performance Summary
International Opportunities declined -2.77%* for the 12 months ended November 30, 2014. The portfolio’s benchmark, the MSCI All Country World ex-U.S. Small Cap Growth Index, declined -0.73% for the same period.
Non-U.S. stocks generally struggled during the 12-month period, as geopolitical risks and sluggish global growth triggered uncertainty and market volatility. As the period unfolded, global growth decoupled, with the U.S. leading the way. Stronger relative growth in the U.S. led to a divergence in central bank policy, with the U.S. Federal Reserve scaling back its stimulus efforts as other leading central banks, including the European Central Bank (ECB) and the Bank of Japan (BOJ), maintained aggressive programs in response to weakening growth and low inflation. In Europe, growth stalled during the period, and concerns about deflation prompted the ECB to slash its key interest rates and initiate a selective bond-buying program. In Japan, growth weakened following an April 1 hike in the nation’s consumption tax, and late in the period the nation slipped into another recession. The BOJ responded with additional monetary easing, and the government postponed the next scheduled hike in the nation’s consumption tax. Diverging central bank policies also helped trigger a strong U.S. dollar rally, which served to further reduce non-U.S. stock returns for U.S.-based investors. The dollar’s relative strength, combined with mounting global supply/demand imbalances, also caused commodities prices (particularly oil) to weaken.
Meanwhile, political unrest also contributed to the challenging investment backdrop. In particular, the ongoing Russia-Ukraine conflict, mounting turmoil throughout the Middle East, and pro-democracy protests in Hong Kong pressured non-U.S. stocks.
Overall, emerging market stocks outpaced their developed market counterparts, and within the non-U.S. small cap universe, growth stocks generally outperformed value stocks. Within the fund, stock selection primarily accounted for the underperformance versus the benchmark, particularly within the industrials and financials. An underweight position in telecommunication services also detracted. From a regional perspective, positioning in the U.K., Hong Kong, and Spain weighed on the fund’s relative performance.
Internet-Related Companies Detracted
In the U.K., an overweight position in Blinkx, a video content portal, was among the portfolio’s largest detractors. The company’s stock declined early in the period on negative publicity about the company and its industry. We didn't see a path to positive news flow or significant public efforts by company management to defend its business practices, so we exited the position.
In addition, an overweight position in Japan’s F@N Communications, an internet marketing company, was a main detractor. The stock was weak on lower-than-expected earnings, which were triggered by unexpected costs associated with transitioning to new data servers. We exited the position.
* All fund returns referenced in this commentary are for Investor Class shares. Returns would have been lower if a portion of the management fee had not been waived. Performance for other share classes will vary due to differences in fee structure; when Investor Class performance exceeds that of the fund's benchmark, other share classes may not. See page 3 for returns for all share classes.
5
An overweight position in Norway’s BW LPG, an oil and gas shipping company focused mainly on the transportation of liquefied petroleum gas, also was among the largest detractors. The company’s stock declined due to falling oil and gas prices. We nevertheless remain optimistic toward the company, expecting growing demand and better pricing as the U.S. and other markets increase their exports of refined gas products.
Stocks in Switzerland, India Were Top Performers
Our stock selection efforts in Switzerland, India, and South Korea, along with overweight positions relative to the benchmark in each country, contributed favorably to the fund’s relative performance. In terms of sector exposure, stock selection contributed to performance in the consumer discretionary, information technology, and materials sectors.
An overweight position in India’s Bharat Forge, a steel forge company serving the auto, power, construction, and other industries, was among the fund’s largest individual contributors. The company continued to benefit from industry upgrades, a favorable long-term outlook, and robust demand from the U.S. and Europe.
In addition, an overweight position in Switzerland’s Leonteq, a financial services firm offering derivative platforms and custom payout products, was a leading contributor to performance. The company’s stock advanced after Leonteq announced it had signed on new customers and increased its distribution strength.
An overweight position in Japan’s Seiko Epson also was among the top contributors to performance. The printer maker’s stock price benefited from strong sales of the company’s large-drum printer. In particular, the company’s pricing model, which features a higher price for the unit and lower ongoing costs for ink, has been popular in the emerging markets.
Outlook
Despite the uncertainties in Europe, we continue to rely on our bottom-up stock selection to find companies we believe are demonstrating improving, sustainable growth. Specifically, we remain focused on European-based companies with exposure to the strengthening U.S. economy and those benefiting from company-specific or secular growth stories. In Japan, we favor companies we believe can take advantage of a weak yen and firms advancing due to strong secular growth trends, particularly in the industrials sector. We remain selective in the emerging markets, focusing on companies that benefit from specific trends, such as growing demand for internet services, ecommerce, and logistics in China.
6
| Fund Characteristics |
| NOVEMBER 30, 2014 | |
Top Ten Holdings | % of net assets |
| Wirecard AG | 2.4% |
| Royal UNIBREW A/S | 2.2% |
| CCL Industries, Inc., Class B | 2.0% |
| Caesarstone Sdot-Yam Ltd. | 2.0% |
| Chailease Holding Co. Ltd. | 2.0% |
| Bellway plc | 1.9% |
| Leonteq AG | 1.9% |
| Teleperformance | 1.9% |
| PAX Global Technology Ltd. | 1.8% |
| Element Financial Corp. | 1.7% |
Types of Investments in Portfolio | % of net assets |
| Foreign Common Stocks | 99.2% |
| Exchange-Traded Funds | 0.4% |
Total Equity Exposure | 99.6% |
| Other Assets and Liabilities | 0.4% |
Investments by Country | % of net assets |
| Japan | 19.0% |
| United Kingdom | 9.6% |
| Germany | 9.1% |
| Canada | 8.9% |
| China | 8.0% |
| France | 5.5% |
| Australia | 5.0% |
| Taiwan | 4.3% |
| Switzerland | 4.0% |
| Denmark | 3.9% |
| India | 2.9% |
| Sweden | 2.8% |
| Spain | 2.7% |
| Israel | 2.6% |
| Italy | 2.2% |
| Other Countries | 8.7% |
| Exchange-Traded Funds | 0.4% |
| Other Assets and Liabilities | 0.4% |
7
| Shareholder Fee Example |
Fund shareholders may incur two types of costs: (1) transaction costs, including sales charges (loads) on purchase payments and redemption/exchange fees; and (2) ongoing costs, including management fees; distribution and service (12b-1) fees; and other fund expenses. This example is intended to help you understand your ongoing costs (in dollars) of investing in your fund and to compare these costs with the ongoing cost of investing in other mutual funds.
The example is based on an investment of $1,000 made at the beginning of the period and held for the entire period from June 1, 2014 to November 30, 2014.
Actual Expenses
The table provides information about actual account values and actual expenses for each class. You may use the information, together with the amount you invested, to estimate the expenses that you paid over the period. First, identify the share class you own. Then simply divide your account value by $1,000 (for example, an $8,600 account value divided by $1,000 = 8.6), then multiply the result by the number under the heading “Expenses Paid During Period” to estimate the expenses you paid on your account during this period.
If you hold Investor Class shares of any American Century Investments fund, or Institutional Class shares of the American Century Diversified Bond Fund, in an American Century Investments account (i.e., not a financial intermediary or retirement plan account), American Century Investments may charge you a $12.50 semiannual account maintenance fee if the value of those shares is less than $10,000. We will redeem shares automatically in one of your accounts to pay the $12.50 fee. In determining your total eligible investment amount, we will include your investments in all personal accounts (including American Century Investments Brokerage accounts) registered under your Social Security number. Personal accounts include individual accounts, joint accounts, UGMA/UTMA accounts, personal trusts, Coverdell Education Savings Accounts and IRAs (including traditional, Roth, Rollover, SEP-, SARSEP- and SIMPLE-IRAs), and certain other retirement accounts. If you have only business, business retirement, employer-sponsored or American Century Investments Brokerage accounts, you are currently not subject to this fee. If you are subject to the Account Maintenance Fee, your account value could be reduced by the fee amount.
Hypothetical Example for Comparison Purposes
The table also provides information about hypothetical account values and hypothetical expenses based on the actual expense ratio of each class of your fund and an assumed rate of return of 5% per year before expenses, which is not the actual return of a fund’s share class. The hypothetical account values and expenses may not be used to estimate the actual ending account balance or expenses you paid for the period. You may use this information to compare the ongoing costs of investing in your fund and other funds. To do so, compare this 5% hypothetical example with the 5% hypothetical examples that appear in the shareholder reports of the other funds.
Please note that the expenses shown in the table are meant to highlight your ongoing costs only and do not reflect any transactional costs, such as sales charges (loads) or redemption/exchange fees. Therefore, the table is useful in comparing ongoing costs only, and will not help you determine the relative total costs of owning different funds. In addition, if these transactional costs were included, your costs would have been higher.
8
Beginning Account Value 6/1/14 | Ending Account Value 11/30/14 | Expenses Paid During Period(1) 6/1/14 – 11/30/14 | Annualized Expense Ratio(1) | |
Actual | ||||
| Investor Class (after waiver) | $1,000 | $926.30 | $7.53 | 1.56% |
| Investor Class (before waiver) | $1,000 | $926.30(2) | $8.50 | 1.76% |
| Institutional Class (after waiver) | $1,000 | $928.00 | $6.57 | 1.36% |
| Institutional Class (before waiver) | $1,000 | $928.00(2) | $7.54 | 1.56% |
| A Class (after waiver) | $1,000 | $925.00 | $8.73 | 1.81% |
| A Class (before waiver) | $1,000 | $925.00(2) | $9.70 | 2.01% |
| C Class (after waiver) | $1,000 | $921.90 | $12.33 | 2.56% |
| C Class (before waiver) | $1,000 | $921.90(2) | $13.30 | 2.76% |
| R Class (after waiver) | $1,000 | $924.80 | $9.94 | 2.06% |
| R Class (before waiver) | $1,000 | $924.80(2) | $10.90 | 2.26% |
Hypothetical | ||||
| Investor Class (after waiver) | $1,000 | $1,017.25 | $7.89 | 1.56% |
| Investor Class (before waiver) | $1,000 | $1,016.24 | $8.90 | 1.76% |
| Institutional Class (after waiver) | $1,000 | $1,018.25 | $6.88 | 1.36% |
| Institutional Class (before waiver) | $1,000 | $1,017.25 | $7.89 | 1.56% |
| A Class (after waiver) | $1,000 | $1,015.99 | $9.15 | 1.81% |
| A Class (before waiver) | $1,000 | $1,014.99 | $10.15 | 2.01% |
| C Class (after waiver) | $1,000 | $1,012.23 | $12.91 | 2.56% |
| C Class (before waiver) | $1,000 | $1,011.23 | $13.92 | 2.76% |
| R Class (after waiver) | $1,000 | $1,014.74 | $10.40 | 2.06% |
| R Class (before waiver) | $1,000 | $1,013.74 | $11.41 | 2.26% |
| (1) | Expenses are equal to the class's annualized expense ratio listed in the table above, multiplied by the average account value over the period, multiplied by 183, the number of days in the most recent fiscal half-year, divided by 365, to reflect the one-half year period. |
| (2) | Ending account value assumes the return earned after waiver and would have been lower if a portion of the management fee had not been waived. |
9
| Schedule of Investments |
NOVEMBER 30, 2014
| Shares | Value | ||||
| COMMON STOCKS — 99.2% | |||||
| Australia — 5.0% | |||||
| Aristocrat Leisure Ltd. | 288,410 | $ | 1,597,607 | ||
| G8 Education Ltd. | 494,100 | 1,870,912 | |||
| Magellan Financial Group Ltd. | 120,300 | 1,467,890 | |||
| Slater & Gordon Ltd. | 442,260 | 2,321,889 | |||
| 7,258,298 | |||||
| Brazil — 1.4% | |||||
| GAEC Educacao SA | 133,900 | 1,955,591 | |||
| Canada — 8.9% | |||||
ATS Automation Tooling Systems, Inc.(1) | 62,240 | 785,416 | |||
| CCL Industries, Inc., Class B | 27,034 | 2,855,887 | |||
Descartes Systems Group, Inc. (The)(1) | 80,910 | 1,222,672 | |||
Element Financial Corp.(1) | 194,270 | 2,458,318 | |||
| FirstService Corp. | 46,190 | 2,451,079 | |||
| Linamar Corp. | 15,190 | 893,201 | |||
Raging River Exploration, Inc.(1) | 139,220 | 756,062 | |||
| Stantec, Inc. | 47,600 | 1,382,003 | |||
| 12,804,638 | |||||
| China — 8.0% | |||||
Jumei International Holding Ltd. ADR(1) | 9,245 | 171,033 | |||
| Lijun International Pharmaceutical Holding Co. Ltd. | 4,332,000 | 1,999,750 | |||
Ozner Water International Holding Ltd.(1)(2) | 3,476,000 | 1,909,385 | |||
PAX Global Technology Ltd.(1) | 2,358,000 | 2,593,564 | |||
| Sinotrans Ltd., H Shares | 3,173,000 | 2,393,482 | |||
| Sunac China Holdings Ltd. | 813,000 | 755,840 | |||
| TCL Communication Technology Holdings Ltd. | 818,000 | 795,296 | |||
YY, Inc. ADR(1) | 12,040 | 920,458 | |||
| 11,538,808 | |||||
| Denmark — 3.9% | |||||
| GN Store Nord A/S | 73,940 | 1,579,212 | |||
| Pandora A/S | 9,260 | 821,742 | |||
Royal UNIBREW A/S(1) | 18,410 | 3,168,993 | |||
| 5,569,947 | |||||
| France — 5.5% | |||||
APERAM SA(1) | 56,590 | 1,813,354 | |||
Criteo SA ADR(1) | 24,660 | 995,771 | |||
| Eurofins Scientific | 3,040 | 737,873 | |||
| Gaztransport Et Technigaz | 12,960 | 686,020 | |||
| Korian-Medica | 28,110 | 1,027,280 | |||
| Teleperformance | 38,920 | 2,717,384 | |||
| 7,977,682 | |||||
10
| Shares | Value | ||||
| Germany — 9.1% | |||||
| Aareal Bank AG | 45,940 | $ | 2,006,484 | ||
| Aurelius AG | 20,680 | 767,579 | |||
| CTS Eventim AG & Co. KGaA | 47,990 | 1,485,564 | |||
Grand City Properties SA(1) | 40,250 | 576,563 | |||
| Jungheinrich AG Preference Shares | 6,850 | 410,976 | |||
Morphosys AG(1) | 15,620 | 1,537,694 | |||
| Stroeer Media SE | 28,180 | 799,623 | |||
| Symrise AG | 33,450 | 1,999,187 | |||
| Wirecard AG | 81,820 | 3,472,355 | |||
| 13,056,025 | |||||
| Hong Kong — 1.5% | |||||
| Paradise Entertainment Ltd. | 2,172,000 | 1,257,507 | |||
| Xinyi Solar Holdings Ltd. | 3,118,000 | 896,572 | |||
| 2,154,079 | |||||
| India — 2.9% | |||||
| Apollo Tyres Ltd. | 241,570 | 889,124 | |||
| Bharat Forge Ltd. | 98,200 | 1,527,081 | |||
| IndusInd Bank Ltd. | 95,420 | 1,153,943 | |||
| Oberoi Realty Ltd. | 138,650 | 589,857 | |||
| 4,160,005 | |||||
| Indonesia — 0.8% | |||||
| PT Matahari Department Store Tbk | 972,700 | 1,195,551 | |||
| Israel — 2.6% | |||||
| Caesarstone Sdot-Yam Ltd. | 45,990 | 2,851,380 | |||
| Frutarom Industries Ltd. | 6,915 | 178,352 | |||
Mellanox Technologies Ltd.(1) | 16,970 | 723,770 | |||
| 3,753,502 | |||||
| Italy — 2.2% | |||||
| Banca Generali SpA | 58,710 | 1,555,693 | |||
| Interpump Group SpA | 117,670 | 1,610,948 | |||
| 3,166,641 | |||||
| Japan — 19.0% | |||||
| Aica Kogyo Co. Ltd. | 50,200 | 1,026,708 | |||
| Aida Engineering Ltd. | 40,200 | 361,653 | |||
| Asahi Intecc Co. Ltd. | 15,100 | 742,821 | |||
| Daifuku Co. Ltd. | 70,800 | 749,061 | |||
| Fancl Corp. | 80,200 | 992,409 | |||
| Hoshizaki Electric Co. Ltd. | 32,200 | 1,654,551 | |||
| Hulic Reit, Inc. | 500 | 766,963 | |||
| Iriso Electronics Co. Ltd. | 7,000 | 370,299 | |||
| Japan Aviation Electronics Industry Ltd. | 59,000 | 1,314,535 | |||
| Kanamoto Co. Ltd. | 42,600 | 1,385,132 | |||
| Kureha Corp. | 159,000 | 778,158 | |||
| M3, Inc. | 78,400 | 1,348,547 | |||
| Maeda Corp. | 154,000 | 1,119,505 | |||
| Nifco, Inc. | 24,700 | 843,689 | |||
11
| Shares | Value | ||||
| Nihon Kohden Corp. | 42,500 | $ | 2,137,261 | ||
| Nihon M&A Center, Inc. | 48,700 | 1,489,121 | |||
| NS Solutions Corp. | 34,800 | 916,059 | |||
| Ryohin Keikaku Co. Ltd. | 11,800 | 1,382,622 | |||
| Sanwa Holdings Corp. | 272,800 | 1,923,376 | |||
| SCSK Corp. | 36,900 | 938,702 | |||
| Seiko Epson Corp. | 28,000 | 1,351,472 | |||
| Seria Co. Ltd. | 28,000 | 1,044,855 | |||
| Sohgo Security Services Co. Ltd. | 32,300 | 666,324 | |||
| Zenkoku Hosho Co. Ltd. | 71,800 | 2,150,099 | |||
| 27,453,922 | |||||
| Malaysia — 1.0% | |||||
7-Eleven Malaysia Holdings Bhd(1) | 1,513,600 | 724,917 | |||
| My EG Services Bhd | 601,700 | 756,016 | |||
| 1,480,933 | |||||
| Norway — 0.7% | |||||
BW LPG Ltd.(2) | 104,140 | 757,063 | |||
Hoegh LNG Holdings Ltd.(1) | 25,770 | 305,804 | |||
| 1,062,867 | |||||
| Philippines — 0.5% | |||||
| D&L Industries, Inc. | 2,208,400 | 776,051 | |||
| South Korea — 1.9% | |||||
Cosmax, Inc.(1) | 4,010 | 369,168 | |||
| Hanssem Co. Ltd. | 13,010 | 1,367,990 | |||
| Hotel Shilla Co. Ltd. | 3,410 | 275,459 | |||
Naturalendo Tech Co. Ltd.(1) | 16,360 | 789,982 | |||
| 2,802,599 | |||||
| Spain — 2.7% | |||||
Almirall SA(1) | 21,470 | 370,552 | |||
Gamesa Corp. Tecnologica SA(1) | 231,010 | 2,358,318 | |||
| Melia Hotels International SA | 111,610 | 1,138,008 | |||
| 3,866,878 | |||||
| Sweden — 2.8% | |||||
| Avanza Bank Holding AB | 22,760 | 741,721 | |||
Cloetta AB, B Shares(1) | 171,620 | 499,447 | |||
| Haldex AB | 129,970 | 1,612,304 | |||
| Hexpol AB | 13,130 | 1,155,130 | |||
| 4,008,602 | |||||
| Switzerland — 4.0% | |||||
| ams AG | 42,570 | 1,579,441 | |||
| Leonteq AG | 11,060 | 2,735,669 | |||
| Straumann Holding AG | 5,660 | 1,464,424 | |||
| 5,779,534 | |||||
| Taiwan — 4.3% | |||||
| AirTAC International Group | 83,000 | 749,608 | |||
| Chailease Holding Co. Ltd. | 1,096,900 | 2,817,790 | |||
12
| Shares | Value | ||||
| Chicony Electronics Co. Ltd. | 129,000 | $ | 350,975 | ||
| Eclat Textile Co. Ltd. | 76,000 | 757,606 | |||
| Poya Co. Ltd. | 96,000 | 724,323 | |||
| TPK Holding Co. Ltd. | 125,000 | 803,781 | |||
| 6,204,083 | |||||
| Thailand — 0.9% | |||||
| Supalai PCL | 1,556,300 | 1,279,735 | |||
| United Kingdom — 9.6% | |||||
| Bellway plc | 93,570 | 2,753,585 | |||
| Bodycote plc | 98,180 | 984,553 | |||
BTG plc(1) | 113,360 | 1,428,941 | |||
| Domino's Pizza Group plc | 97,390 | 1,057,256 | |||
| Grafton Group plc | 68,550 | 687,422 | |||
| Halfords Group plc | 94,710 | 707,139 | |||
| Hikma Pharmaceuticals plc | 49,430 | 1,514,081 | |||
Poundland Group plc(1) | 143,550 | 704,066 | |||
| Restaurant Group plc (The) | 100,890 | 1,024,336 | |||
| Rightmove plc | 11,280 | 384,630 | |||
| Stock Spirits Group plc | 275,140 | 1,085,166 | |||
| Telecity Group plc | 115,620 | 1,465,556 | |||
| 13,796,731 | |||||
TOTAL COMMON STOCKS (Cost $125,995,166) | 143,102,702 | ||||
| EXCHANGE-TRADED FUNDS — 0.4% | |||||
Market Vectors Junior Gold Miners ETF(1) (Cost $722,176) | 24,510 | 616,426 | |||
TOTAL INVESTMENT SECURITIES — 99.6% (Cost $126,717,342) | 143,719,128 | ||||
| OTHER ASSETS AND LIABILITIES — 0.4% | 584,379 | ||||
| TOTAL NET ASSETS — 100.0% | $ | 144,303,507 | |||
| MARKET SECTOR DIVERSIFICATION | ||
(as a % of net assets) | ||
| Consumer Discretionary | 22.8 | % |
| Industrials | 18.1 | % |
| Financials | 16.8 | % |
| Information Technology | 14.9 | % |
| Health Care | 11.5 | % |
| Materials | 8.5 | % |
| Consumer Staples | 4.9 | % |
| Energy | 1.7 | % |
| Exchange-Traded Funds | 0.4 | % |
| Other Assets and Liabilities | 0.4 | % |
13
| NOTES TO SCHEDULE OF INVESTMENTS | ||
| ADR | - | American Depositary Receipt |
| (1) | Non-income producing. |
| (2) | Restricted security exempt from registration pursuant to Rule 144A under the Securities Act of 1933. These securities may be sold without restriction to qualified institutional investors and have been deemed liquid under policies approved by the Board of Directors. The aggregate value of these securities at the period end was $2,666,448, which represented 1.8% of total net assets. |
See Notes to Financial Statements.
14
| Statement of Assets and Liabilities |
| NOVEMBER 30, 2014 | |||
| Assets | |||
| Investment securities, at value (cost of $126,717,342) | $ | 143,719,128 | |
| Cash | 24,178 | ||
| Foreign currency holdings, at value (cost of $29,279) | 27,929 | ||
| Receivable for investments sold | 1,622,656 | ||
| Receivable for capital shares sold | 11,996 | ||
| Dividends and interest receivable | 188,683 | ||
| Other assets | 32,482 | ||
| 145,627,052 | |||
| Liabilities | |||
| Payable for investments purchased | 823,678 | ||
| Payable for capital shares redeemed | 166,398 | ||
| Accrued management fees | 187,498 | ||
| Distribution and service fees payable | 3,788 | ||
| Accrued foreign taxes | 142,183 | ||
| 1,323,545 | |||
| Net Assets | $ | 144,303,507 | |
| Net Assets Consist of: | |||
| Capital (par value and paid-in surplus) | $ | 123,488,681 | |
| Distributions in excess of net investment income | (51,024 | ) | |
| Undistributed net realized gain | 4,035,942 | ||
| Net unrealized appreciation | 16,829,908 | ||
| $ | 144,303,507 | ||
| Net Assets | Shares Outstanding | Net Asset Value Per Share | |
| Investor Class, $0.01 Par Value | $123,834,769 | 13,879,116 | $8.92 |
| Institutional Class, $0.01 Par Value | $4,490,755 | 497,958 | $9.02 |
| A Class, $0.01 Par Value | $14,682,667 | 1,652,574 | $8.88* |
| C Class, $0.01 Par Value | $712,640 | 81,638 | $8.73 |
| R Class, $0.01 Par Value | $582,676 | 65,876 | $8.85 |
*Maximum offering price $9.42 (net asset value divided by 0.9425).
See Notes to Financial Statements.
15
| Statement of Operations |
| YEAR ENDED NOVEMBER 30, 2014 | |||
| Investment Income (Loss) | |||
| Income: | |||
| Dividends (net of foreign taxes withheld of $242,201) | $ | 2,625,919 | |
| Interest | 156 | ||
| 2,626,075 | |||
| Expenses: | |||
| Management fees | 2,752,248 | ||
| Distribution and service fees: | |||
| A Class | 30,703 | ||
| C Class | 6,811 | ||
| R Class | 3,128 | ||
| Directors' fees and expenses | 2,968 | ||
| Other expenses | 1,700 | ||
| 2,797,558 | |||
| Fees waived | (316,008 | ) | |
| 2,481,550 | |||
| Net investment income (loss) | 144,525 | ||
| Realized and Unrealized Gain (Loss) | |||
| Net realized gain (loss) on: | |||
| Investment transactions (net of foreign tax expenses paid (refunded) of $13,867) | 9,686,584 | ||
| Foreign currency transactions | (106,997 | ) | |
| 9,579,587 | |||
| Change in net unrealized appreciation (depreciation) on: | |||
| Investments (includes (increase) decrease in accrued foreign taxes of $(136,690)) | (14,455,132 | ) | |
| Translation of assets and liabilities in foreign currencies | (14,815 | ) | |
| (14,469,947 | ) | ||
| Net realized and unrealized gain (loss) | (4,890,360 | ) | |
| Net Increase (Decrease) in Net Assets Resulting from Operations | $ | (4,745,835 | ) |
See Notes to Financial Statements.
16
| Statement of Changes in Net Assets |
| YEARS ENDED NOVEMBER 30, 2014 AND NOVEMBER 30, 2013 | ||||||
| Increase (Decrease) in Net Assets | November 30, 2014 | November 30, 2013 | ||||
| Operations | ||||||
| Net investment income (loss) | $ | 144,525 | $ | (60,956 | ) | |
| Net realized gain (loss) | 9,579,587 | 19,677,913 | ||||
| Change in net unrealized appreciation (depreciation) | (14,469,947 | ) | 12,865,378 | |||
| Net increase (decrease) in net assets resulting from operations | (4,745,835 | ) | 32,482,335 | |||
| Distributions to Shareholders | ||||||
| From net investment income: | ||||||
| Investor Class | (420,466 | ) | (1,124,548 | ) | ||
| Institutional Class | (13,066 | ) | (576 | ) | ||
| A Class | (24,247 | ) | (18,389 | ) | ||
| R Class | (931 | ) | (2,420 | ) | ||
| Decrease in net assets from distributions | (458,710 | ) | (1,145,933 | ) | ||
| Capital Share Transactions | ||||||
| Net increase (decrease) in net assets from capital share transactions (Note 5) | 1,336,793 | 15,147,764 | ||||
| Redemption Fees | ||||||
| Increase in net assets from redemption fees | 15,927 | 18,160 | ||||
| Net increase (decrease) in net assets | (3,851,825 | ) | 46,502,326 | |||
| Net Assets | ||||||
| Beginning of period | 148,155,332 | 101,653,006 | ||||
| End of period | $ | 144,303,507 | $ | 148,155,332 | ||
| Distributions in excess of net investment income | $ | (51,024 | ) | $ | (200,398 | ) |
See Notes to Financial Statements.
17
| Notes to Financial Statements |
NOVEMBER 30, 2014
1. Organization
American Century World Mutual Funds, Inc. (the corporation) is registered under the Investment Company Act of 1940, as amended (the 1940 Act), as an open-end management investment company and is organized as a Maryland corporation. International Opportunities Fund (the fund) is one fund in a series issued by the corporation. The fund is diversified as defined under the 1940 Act. The fund's investment objective is to seek capital growth.
The fund offers the Investor Class, the Institutional Class, the A Class, the C Class and the R Class. The A Class may incur an initial sales charge. The A Class and C Class may be subject to a contingent deferred sales charge. The share classes differ principally in their respective sales charges and distribution and shareholder servicing expenses and arrangements. The Institutional Class is made available to institutional shareholders or through financial intermediaries whose clients do not require the same level of shareholder and administrative services as shareholders of other classes. As a result, the Institutional Class is charged a lower unified management fee.
2. Significant Accounting Policies
The following is a summary of significant accounting policies consistently followed by the fund in preparation of its financial statements. The fund is an investment company and follows accounting and reporting guidance in accordance with accounting principles generally accepted in the United States of America. This may require management to make certain estimates and assumptions at the date of the financial statements. Actual results could differ from these estimates. Management evaluated the impact of events or transactions occurring through the date the financial statements were issued that would merit recognition or disclosure.
Investment Valuations — The fund determines the fair value of its investments and computes its net asset value per share at the close of regular trading (usually 4 p.m. Eastern time) on the New York Stock Exchange (NYSE) on each day the NYSE is open. The Board of Directors has adopted valuation policies and procedures to guide the investment advisor in the fund’s investment valuation process and to provide methodologies for the oversight of the fund’s pricing function.
Equity securities that are listed or traded on a domestic securities exchange are valued at the last reported sales price or at the official closing price as provided by the exchange. Equity securities traded on foreign securities exchanges are generally valued at the closing price of such securities on the exchange where primarily traded or at the close of the NYSE, if that is earlier. If no last sales price is reported, or if local convention or regulation so provides, the mean of the latest bid and asked prices may be used. Securities traded over-the-counter are valued at the mean of the latest bid and asked prices, the last sales price, or the official closing price. Equity securities initially expressed in local currencies are translated into U.S. dollars at the mean of the appropriate currency exchange rate at the close of the NYSE as provided by an independent pricing service.
Fixed income securities maturing within 60 days at the time of purchase may be valued at cost, plus or minus any amortized discount or premium or at the evaluated mean as provided by an independent pricing service. Evaluated mean prices are commonly derived through utilization of market models, which may consider, among other factors: trade data, quotations from dealers and active market makers, relevant yield curve and spread data, related sector levels, creditworthiness, trade data or market information on comparable securities, and other relevant security specific information.
Open-end management investment companies are valued at the reported net asset value per share. Repurchase agreements are valued at cost, which approximates fair value.
If the fund determines that the market price for an investment is not readily available or the valuation methods mentioned above do not reflect an investment’s fair value, such investment is valued as determined in good faith by the Board of Directors or its delegate, in accordance with policies and procedures adopted by the Board of Directors. In its determination of fair value, the fund may review several factors including, but not limited to, market information regarding the specific investment or comparable investments and correlation with other investment types, futures indices or general market indicators. Circumstances that may cause the fund to use these procedures to value an investment include, but are not limited to: an investment has been
18
declared in default or is distressed; trading in a security has been suspended during the trading day or a security is not actively trading on its principal exchange; prices received from a regular pricing source are deemed unreliable; or there is a foreign market holiday and no trading occurred.
The fund monitors for significant events occurring after the close of an investment’s primary exchange but before the fund’s net asset value per share is determined. Significant events may include, but are not limited to: corporate announcements and transactions; governmental action and political unrest that could impact a specific investment or an investment sector; or armed conflicts, natural disasters and similar events that could affect investments in a specific country or region. The fund also monitors for significant fluctuations between domestic and foreign markets, as evidenced by the U.S. market or such other indicators that the Board of Directors, or its delegate, deems appropriate. If significant fluctuations in foreign markets are identified, the fund may apply a model-derived factor to the closing price of equity securities traded on foreign securities exchanges. The factor is based on observable market data as provided by an independent pricing service.
Security Transactions — Security transactions are accounted for as of the trade date. Net realized gains and losses are determined on the identified cost basis, which is also used for federal income tax purposes. Certain countries impose taxes on realized gains on the sale of securities registered in their country. The fund records the foreign tax expense, if any, on an accrual basis. The foreign tax expense on realized gains and unrealized appreciation reduces the net realized gain (loss) on investment transactions and net unrealized appreciation (depreciation) on investments, respectively.
Investment Income — Dividend income less foreign taxes withheld, if any, is recorded as of the ex-dividend date. Distributions received on securities that represent a return of capital or long-term capital gain are recorded as a reduction of cost of investments and/or as a realized gain. The fund may estimate the components of distributions received that may be considered nontaxable distributions or long-term capital gain distributions for income tax purposes. Interest income is recorded on the accrual basis and includes accretion of discounts and amortization of premiums.
Foreign Currency Translations — All assets and liabilities initially expressed in foreign currencies are translated into U.S. dollars at prevailing exchange rates at period end. The fund may enter into spot foreign currency exchange contracts to facilitate transactions denominated in a foreign currency. Purchases and sales of investment securities, dividend and interest income, spot foreign currency exchange contracts, and expenses are translated at the rates of exchange prevailing on the respective dates of such transactions. Net realized and unrealized foreign currency exchange gains or losses related to investment securities are a component of net realized gain (loss) on investment transactions and change in net unrealized appreciation (depreciation) on investments, respectively.
Repurchase Agreements — The fund may enter into repurchase agreements with institutions that American Century Investment Management, Inc. (ACIM) (the investment advisor) has determined are creditworthy pursuant to criteria adopted by the Board of Directors. The fund requires that the collateral, represented by securities, received in a repurchase transaction be transferred to the custodian in a manner sufficient to enable the fund to obtain those securities in the event of a default under the repurchase agreement. ACIM monitors, on a daily basis, the securities transferred to ensure the value, including accrued interest, of the securities under each repurchase agreement is equal to or greater than amounts owed to the fund under each repurchase agreement.
Joint Trading Account — Pursuant to an Exemptive Order issued by the Securities and Exchange Commission, the fund, along with certain other funds in the American Century Investments family of funds, may transfer uninvested cash balances into a joint trading account. These balances are invested in one or more repurchase agreements that are collateralized by U.S. Treasury or Agency obligations.
Income Tax Status — It is the fund’s policy to distribute substantially all net investment income and net realized gains to shareholders and to otherwise qualify as a regulated investment company under provisions of the Internal Revenue Code. Accordingly, no provision has been made for income taxes. The fund files U.S. federal, state, local and non-U.S. tax returns as applicable. The fund's tax returns are subject to examination by the relevant taxing authority until expiration of the applicable statute of limitations, which is generally three years from the date of filing but can be longer in certain jurisdictions. At this time, management believes there are no uncertain tax positions which, based on their technical merit, would not be sustained upon examination and for which it is reasonably possible that the total amounts of unrecognized tax benefits will significantly change in the next twelve months.
19
Multiple Class — All shares of the fund represent an equal pro rata interest in the net assets of the class to which such shares belong, and have identical voting, dividend, liquidation and other rights and the same terms and conditions, except for class specific expenses and exclusive rights to vote on matters affecting only individual classes. Income, non-class specific expenses, and realized and unrealized capital gains and losses of the fund are allocated to each class of shares based on their relative net assets.
Distributions to Shareholders — Distributions from net investment income and net realized gains, if any, are generally declared and paid annually. The fund may make distributions on a more frequent basis to comply with the distribution requirements of the Internal Revenue Code, in all events in a manner consistent with provisions of the 1940 Act.
Redemption Fees — The fund may impose a 2.00% redemption fee on shares held less than 60 days. The fee may not be applicable to all classes. The redemption fee is retained by the fund and helps cover transaction costs that long-term investors may bear when the fund sells securities to meet investor redemptions.
Indemnifications — Under the corporation’s organizational documents, its officers and directors are indemnified against certain liabilities arising out of the performance of their duties to the fund. In addition, in the normal course of business, the fund enters into contracts that provide general indemnifications. The maximum exposure under these arrangements is unknown as this would involve future claims that may be made against a fund. The risk of material loss from such claims is considered by management to be remote.
3. Fees and Transactions with Related Parties
Certain officers and directors of the corporation are also officers and/or directors of American Century Companies, Inc. (ACC). The corporation’s investment advisor, ACIM, the corporation's distributor, American Century Investment Services, Inc. (ACIS), and the corporation’s transfer agent, American Century Services, LLC, are wholly owned, directly or indirectly, by ACC.
Management Fees — The corporation has entered into a management agreement with ACIM, under which ACIM provides the fund with investment advisory and management services in exchange for a single, unified management fee (the fee) per class. The agreement provides that all expenses of managing and operating the fund, except distribution and service fees, brokerage expenses, taxes, interest, fees and expenses of the independent directors (including legal counsel fees), and extraordinary expenses, will be paid by ACIM. The fee is computed and accrued daily based on each class’s daily net assets and paid monthly in arrears. The rate of the fee is determined by applying a fee rate calculation formula. This formula takes into account the fund’s assets as well as certain assets, if any, of other clients of the investment advisor outside the American Century Investments family of funds (such as subadvised funds and separate accounts) that have very similar investment teams and investment strategies (strategy assets). The annual management fee schedule ranges from 1.400% to 2.000% for the Investor Class, A Class, C Class and R Class. The annual management fee schedule ranges from 1.200% to 1.800% for the Institutional Class. During the year ended November 30, 2014, the investment advisor voluntarily agreed to waive 0.200% of its management fee. The investment advisor expects the fee waiver to continue through March 31, 2015, and cannot terminate it without the approval of the Board of Directors. The total amount of the waiver for each class for the year ended November 30, 2014 was $280,919, $7,914, $24,562, $1,362 and $1,251 for the Investor Class, Institutional Class, A Class, C Class and R Class, respectively. The effective annual management fee before waiver for each class for the year ended November 30, 2014 was 1.75% for the Investor Class, A Class, C Class and R Class and 1.55% for the Institutional Class. The effective annual management fee after waiver for each class for the year ended November 30, 2014 was 1.55% for the Investor Class, A Class, C Class and R Class and 1.35% for the Institutional Class.
Distribution and Service Fees — The Board of Directors has adopted a separate Master Distribution and Individual Shareholder Services Plan for each of the A Class, C Class and R Class (collectively the plans), pursuant to Rule 12b-1 of the 1940 Act. The plans provide that the A Class will pay ACIS an annual distribution and service fee of 0.25%. The plans provide that the C Class will pay ACIS an annual distribution and service fee of 1.00%, of which 0.25% is paid for individual shareholder services and 0.75% is paid for distribution services. The plans provide that the R Class will pay ACIS an annual distribution and service fee of 0.50%. The fees are computed and accrued daily based on each class’s daily net assets and paid monthly in arrears. The fees are used to pay financial intermediaries for distribution and individual shareholder services. Fees incurred under the plans during the year ended November 30, 2014 are detailed in the Statement of Operations.
20
Directors' Fees and Expenses — The Board of Directors is responsible for overseeing the investment advisor’s management and operations of the fund. The directors receive detailed information about the fund and its investment advisor regularly throughout the year, and meet at least quarterly with management of the investment advisor to review reports about fund operations. Fees and expenses incurred in conjunction with the directors during the year ended November 30, 2014 are detailed in the Statement of Operations. The fund’s officers do not receive compensation from the fund.
4. Investment Transactions
Purchases and sales of investment securities, excluding short-term investments, for the year ended November 30, 2014 were $202,260,779 and $201,098,342, respectively.
5. Capital Share Transactions
Transactions in shares of the fund were as follows:
Year ended November 30, 2014 | Year ended November 30, 2013 | |||||||||
| Shares | Amount | Shares | Amount | |||||||
| Investor Class/Shares Authorized | 100,000,000 | 100,000,000 | ||||||||
| Sold | 2,685,760 | $ | 25,258,750 | 4,740,316 | $ | 37,564,336 | ||||
| Issued in reinvestment of distributions | 40,854 | 398,738 | 141,042 | 1,093,076 | ||||||
| Redeemed | (3,766,046 | ) | (34,806,024 | ) | (3,886,304 | ) | (31,104,411 | ) | ||
| (1,039,432 | ) | (9,148,536 | ) | 995,054 | 7,553,001 | |||||
| Institutional Class/Shares Authorized | 10,000,000 | 10,000,000 | ||||||||
| Sold | 262,432 | 2,466,869 | 327,546 | 2,997,896 | ||||||
| Issued in reinvestment of distributions | 1,325 | 13,066 | 74 | 576 | ||||||
| Redeemed | (99,633 | ) | (949,489 | ) | — | — | ||||
| 164,124 | 1,530,446 | 327,620 | 2,998,472 | |||||||
| A Class/Shares Authorized | 10,000,000 | 10,000,000 | ||||||||
| Sold | 1,319,086 | 12,391,569 | 533,481 | 4,521,661 | ||||||
| Issued in reinvestment of distributions | 2,490 | 24,247 | 2,339 | 18,101 | ||||||
| Redeemed | (403,650 | ) | (3,771,629 | ) | (72,269 | ) | (585,413 | ) | ||
| 917,926 | 8,644,187 | 463,551 | 3,954,349 | |||||||
| C Class/Shares Authorized | 10,000,000 | 10,000,000 | ||||||||
| Sold | 50,814 | 476,323 | 35,314 | 284,970 | ||||||
| Redeemed | (16,090 | ) | (145,611 | ) | (5,813 | ) | (45,657 | ) | ||
| 34,724 | 330,712 | 29,501 | 239,313 | |||||||
| R Class/Shares Authorized | 10,000,000 | 10,000,000 | ||||||||
| Sold | 4,899 | 45,517 | 59,917 | 458,537 | ||||||
| Issued in reinvestment of distributions | 96 | 931 | 313 | 2,420 | ||||||
| Redeemed | (7,210 | ) | (66,464 | ) | (7,521 | ) | (58,328 | ) | ||
| (2,215 | ) | (20,016 | ) | 52,709 | 402,629 | |||||
| Net increase (decrease) | 75,127 | $ | 1,336,793 | 1,868,435 | $ | 15,147,764 | ||||
21
6. Fair Value Measurements
The fund’s investments valuation process is based on several considerations and may use multiple inputs to determine the fair value of the investments held by the fund. In conformity with accounting principles generally accepted in the United States of America, the inputs used to determine a valuation are classified into three broad levels.
| • | Level 1 valuation inputs consist of unadjusted quoted prices in an active market for identical investments. |
| • | Level 2 valuation inputs consist of direct or indirect observable market data (including quoted prices for comparable investments, evaluations of subsequent market events, interest rates, prepayment speeds, credit risk, etc.). These inputs also consist of quoted prices for identical investments initially expressed in local currencies that are adjusted through translation into U.S. dollars. |
| • | Level 3 valuation inputs consist of unobservable data (including a fund’s own assumptions). |
The level classification is based on the lowest level input that is significant to the fair valuation measurement. The valuation inputs are not necessarily an indication of the risks associated with investing in these securities or other financial instruments. There were no significant transfers between levels during the period.
The following is a summary of the level classifications as of period end. The Schedule of Investments provides additional information on the fund’s portfolio holdings.
| Level 1 | Level 2 | Level 3 | ||||||
| Assets | ||||||||
| Investment Securities | ||||||||
| Common Stocks | $ | 5,662,412 | $ | 137,440,290 | — | |||
| Exchange-Traded Funds | 616,426 | — | — | |||||
| $ | 6,278,838 | $ | 137,440,290 | — | ||||
7. Risk Factors
There are certain risks involved in investing in foreign securities. These risks include those resulting from future adverse political, social and economic developments, fluctuations in currency exchange rates, the possible imposition of exchange controls, and other foreign laws or restrictions. Investing in emerging markets may accentuate these risks.
The fund invests in common stocks of small companies. Because of this, the fund may be subject to greater risk and market fluctuations than a fund investing in larger, more established companies.
The fund’s investment process may result in high portfolio turnover, which could mean high transaction costs, affecting both performance and capital gains tax liabilities to investors.
8. Federal Tax Information
On December 16, 2014, the fund declared and paid a per-share distribution from net realized gains to shareholders of record on December 15, 2014 of $0.3729 for the Investor Class, Institutional Class, A Class, C Class and R Class.
On December 16, 2014, the fund declared and paid the following per-share distributions from net investment income to shareholders of record on December 15, 2014:
| Investor Class | Institutional Class | A Class | C Class | R Class |
| $0.0040 | $0.0176 | — | — | — |
22
The tax character of distributions paid during the years ended November 30, 2014 and November 30, 2013 were as follows:
| 2014 | 2013 | |||||
| Distributions Paid From | ||||||
| Ordinary income | $ | 458,710 | $ | 1,145,933 | ||
| Long-term capital gains | — | — | ||||
The book-basis character of distributions made during the year from net investment income or net realized gains may differ from their ultimate characterization for federal income tax purposes. These differences reflect the differing character of certain income items and net realized gains and losses for financial statement and tax purposes, and may result in reclassification among certain capital accounts on the financial statements.
As of November 30, 2014, the federal tax cost of investments and the components of distributable earnings on a tax-basis were as follows:
| Federal tax cost of investments | $ | 127,847,393 | |
| Gross tax appreciation of investments | $ | 20,381,162 | |
| Gross tax depreciation of investments | (4,509,427 | ) | |
| Net tax appreciation (depreciation) of investments | 15,871,735 | ||
Net tax appreciation (depreciation) on translation of assets and liabilities in foreign currencies | (171,879 | ) | |
Net tax appreciation (depreciation) | $ | 15,699,856 | |
| Undistributed ordinary income | $ | 349,088 | |
Accumulated long-term gains | $ | 4,765,882 | |
The difference between book-basis and tax-basis unrealized appreciation (depreciation) is attributable primarily to the tax deferral of losses on wash sales.
23
| Financial Highlights |
| For a Share Outstanding Throughout the Years Ended November 30 (except as noted) | |||||||||||||||
| Per-Share Data | Ratios and Supplemental Data | ||||||||||||||
| Income From Investment Operations: | Ratio to Average Net Assets of: | ||||||||||||||
Net Asset Value, Beginning of Period | Net Investment Income (Loss)(1) | Net Realized and Unrealized Gain (Loss) | Total From Investment Operations | Distributions From Net Investment Income | Net Asset Value, End of Period | Total Return(2) | Operating Expenses | Operating Expenses (before expense waiver) | Net Investment Income (Loss) | Net Investment Income (Loss) (before expense waiver) | Portfolio Turnover Rate | Net Assets, End of Period (in thousands) | |||
| Investor Class | |||||||||||||||
| 2014 | $9.20 | 0.01 | (0.26) | (0.25) | (0.03) | $8.92 | (2.77)% | 1.55% | 1.75% | 0.11% | (0.09)% | 128% | $123,835 | ||
| 2013 | $7.14 | —(3) | 2.14 | 2.14 | (0.08) | $9.20 | 30.13% | 1.72% | 1.79% | (0.04)% | (0.11)% | 123% | $137,264 | ||
| 2012 | $5.98 | —(3) | 1.16 | 1.16 | — | $7.14 | 19.40% | 1.87% | 1.87% | (0.04)% | (0.04)% | 127% | $99,445 | ||
| 2011 | $6.29 | (0.01) | (0.27) | (0.28) | (0.03) | $5.98 | (4.57)% | 1.83% | 1.83% | (0.17)% | (0.17)% | 146% | $89,708 | ||
| 2010 | $5.49 | (0.03) | 0.94 | 0.91 | (0.11) | $6.29 | 16.72% | 1.89% | 1.89% | (0.52)% | (0.52)% | 209% | $102,739 | ||
| Institutional Class | |||||||||||||||
| 2014 | $9.29 | 0.03 | (0.27) | (0.24) | (0.03) | $9.02 | (2.58)% | 1.35% | 1.55% | 0.31% | 0.11% | 128% | $4,491 | ||
| 2013 | $7.21 | (0.04) | 2.21 | 2.17 | (0.09) | $9.29 | 30.38% | 1.52% | 1.59% | 0.16% | 0.09% | 123% | $3,100 | ||
| 2012 | $6.03 | 0.01 | 1.17 | 1.18 | — | $7.21 | 19.57% | 1.67% | 1.67% | 0.16% | 0.16% | 127% | $45 | ||
| 2011 | $6.34 | —(3) | (0.27) | (0.27) | (0.04) | $6.03 | (4.35)% | 1.63% | 1.63% | 0.03% | 0.03% | 146% | $37 | ||
| 2010 | $5.54 | (0.02) | 0.95 | 0.93 | (0.13) | $6.34 | 17.04% | 1.69% | 1.69% | (0.32)% | (0.32)% | 209% | $39 | ||
24
| For a Share Outstanding Throughout the Years Ended November 30 (except as noted) | |||||||||||||||
| Per-Share Data | Ratios and Supplemental Data | ||||||||||||||
| Income From Investment Operations: | Ratio to Average Net Assets of: | ||||||||||||||
Net Asset Value, Beginning of Period | Net Investment Income (Loss)(1) | Net Realized and Unrealized Gain (Loss) | Total From Investment Operations | Distributions From Net Investment Income | Net Asset Value, End of Period | Total Return(2) | Operating Expenses | Operating Expenses (before expense waiver) | Net Investment Income (Loss) | Net Investment Income (Loss) (before expense waiver) | Portfolio Turnover Rate | Net Assets, End of Period (in thousands) | |||
| A Class | |||||||||||||||
| 2014 | $9.18 | (0.01) | (0.27) | (0.28) | (0.02) | $8.88 | (3.06)% | 1.80% | 2.00% | (0.14)% | (0.34)% | 128% | $14,683 | ||
| 2013 | $7.12 | (0.03) | 2.15 | 2.12 | (0.06) | $9.18 | 29.89% | 1.97% | 2.04% | (0.29)% | (0.36)% | 123% | $6,743 | ||
| 2012 | $5.98 | (0.04) | 1.18 | 1.14 | — | $7.12 | 19.06% | 2.12% | 2.12% | (0.29)% | (0.29)% | 127% | $1,931 | ||
| 2011 | $6.29 | (0.04) | (0.26) | (0.30) | (0.01) | $5.98 | (4.81)% | 2.10% | 2.10% | (0.44)% | (0.44)% | 146% | $5,147 | ||
2010(4) | $5.51 | (0.02) | 0.84 | 0.82 | (0.04) | $6.29 | 14.87% | 2.14%(5) | 2.14%(5) | (0.45)%(5) | (0.45)%(5) | 209%(6) | $92 | ||
| C Class | |||||||||||||||
| 2014 | $9.07 | (0.08) | (0.26) | (0.34) | — | $8.73 | (3.75)% | 2.55% | 2.75% | (0.89)% | (1.09)% | 128% | $713 | ||
| 2013 | $7.04 | (0.09) | 2.12 | 2.03 | — | $9.07 | 29.02% | 2.72% | 2.79% | (1.04)% | (1.11)% | 123% | $425 | ||
| 2012 | $5.95 | (0.06) | 1.15 | 1.09 | — | $7.04 | 18.15% | 2.87% | 2.87% | (1.04)% | (1.04)% | 127% | $123 | ||
| 2011 | $6.30 | (0.06) | (0.29) | (0.35) | — | $5.95 | (5.56)% | 2.83% | 2.83% | (1.17)% | (1.17)% | 146% | $103 | ||
2010(4) | $5.51 | (0.05) | 0.84 | 0.79 | — | $6.30 | 14.34% | 2.89%(5) | 2.89%(5) | (1.19)%(5) | (1.19)%(5) | 209%(6) | $44 | ||
| R Class | |||||||||||||||
| 2014 | $9.15 | (0.04) | (0.25) | (0.29) | (0.01) | $8.85 | (3.15)% | 2.05% | 2.25% | (0.39)% | (0.59)% | 128% | $583 | ||
| 2013 | $7.10 | (0.03) | 2.12 | 2.09 | (0.04) | $9.15 | 29.50% | 2.22% | 2.29% | (0.54)% | (0.61)% | 123% | $623 | ||
| 2012 | $5.98 | (0.03) | 1.15 | 1.12 | — | $7.10 | 18.73% | 2.37% | 2.37% | (0.54)% | (0.54)% | 127% | $109 | ||
| 2011 | $6.30 | (0.04) | (0.28) | (0.32) | — | $5.98 | (5.08)% | 2.33% | 2.33% | (0.67)% | (0.67)% | 146% | $61 | ||
2010(4) | $5.51 | (0.03) | 0.84 | 0.81 | (0.02) | $6.30 | 14.77% | 2.39%(5) | 2.39%(5) | (0.69)%(5) | (0.69)%(5) | 209%(6) | $51 | ||
25
| Notes to Financial Highlights |
| (1) | Computed using average shares outstanding throughout the period. |
| (2) | Total returns are calculated based on the net asset value of the last business day and do not reflect applicable sales charges, if any. Total returns for periods less than one year are not annualized. |
| (3) | Per-share amount was less than $0.005. |
| (4) | March 1, 2010 (commencement of sale) through November 30, 2010. |
| (5) | Annualized. |
| (6) | Portfolio turnover is calculated at the fund level. Percentage indicated was calculated for the year ended November 30, 2010. |
See Notes to Financial Statements.
26
| Report of Independent Registered Public Accounting Firm |
To the Board of Directors and Shareholders of
American Century World Mutual Funds, Inc.:
We have audited the accompanying statement of assets and liabilities, including the schedule of investments, of International Opportunities Fund (the “Fund”), one of the funds constituting American Century World Mutual Funds, Inc., as of November 30, 2014, and the related statement of operations for the year then ended, the statements of changes in net assets for each of the two years in the period then ended, and the financial highlights for each of the periods presented. These financial statements and financial highlights are the responsibility of the Fund's management. Our responsibility is to express an opinion on these financial statements and financial highlights based on our audits.
We conducted our audits in accordance with the standards of the Public Company Accounting Oversight Board (United States). Those standards require that we plan and perform the audit to obtain reasonable assurance about whether the financial statements and financial highlights are free of material misstatement. The Fund is not required to have, nor were we engaged to perform, an audit of its internal control over financial reporting. Our audits included consideration of internal control over financial reporting as a basis for designing audit procedures that are appropriate in the circumstances, but not for the purpose of expressing an opinion on the effectiveness of the Fund's internal control over financial reporting. Accordingly, we express no such opinion. An audit also includes examining, on a test basis, evidence supporting the amounts and disclosures in the financial statements, assessing the accounting principles used and significant estimates made by management, as well as evaluating the overall financial statement presentation. Our procedures included confirmation of securities owned as of November 30, 2014, by correspondence with the custodian and brokers; where replies were not received from brokers, we performed other auditing procedures. We believe that our audits provide a reasonable basis for our opinion.
In our opinion, the financial statements and financial highlights referred to above present fairly, in all material respects, the financial position of International Opportunities Fund of American Century World Mutual Funds, Inc. as of November 30, 2014, the results of its operations for the year then ended, the changes in its net assets for each of the two years in the period then ended, and the financial highlights for each of the periods presented, in conformity with accounting principles generally accepted in the United States of America.
DELOITTE & TOUCHE LLP
Kansas City, Missouri
January 16, 2015
27
| Management |
The Board of Directors
The individuals listed below serve as directors of the funds. Each director will continue to serve in this capacity until death, retirement, resignation or removal from office. The board has adopted a mandatory retirement age for directors who are not “interested persons,” as that term is defined in the Investment Company Act (independent directors). Independent directors shall retire by December 31 of the year in which they reach their 75th birthday.
Mr. Thomas is an “interested person” because he currently serves as President and Chief Executive Officer of American Century Companies, Inc. (ACC), the parent company of American Century Investment Management, Inc. (ACIM or the advisor). Mr. Fink is treated as an “interested person” because of his recent employment with ACC and American Century Services, LLC (ACS). The other directors (more than three-fourths of the total number) are independent. They are not employees, directors or officers of, and have no financial interest in, ACC or any of its wholly owned, direct or indirect, subsidiaries, including ACIM, American Century Investment Services, Inc. (ACIS) and ACS, and they do not have any other affiliations, positions or relationships that would cause them to be considered “interested persons” under the Investment Company Act. The directors serve in this capacity for seven (in the case of Mr. Thomas, 15) registered investment companies in the American Century Investments family of funds.
The following table presents additional information about the directors. The mailing address for each director is 4500 Main Street, Kansas City, Missouri 64111.
Name (Year of Birth) | Position(s) Held with Funds | Length of Time Served | Principal Occupation(s) During Past 5 Years | Number of American Century Portfolios Overseen by Director | Other Directorships Held During Past 5 Years |
| Independent Directors | |||||
Thomas A. Brown (1940) | Director | Since 1980 | Managing Member, Associated Investments, LLC (real estate investment company); Brown Cascade Properties, LLC (real estate investment company) (2001 to 2009) | 73 | None |
Andrea C. Hall (1945) | Director | Since 1997 | Retired | 73 | None |
Jan M. Lewis (1957) | Director | Since 2011 | Retired; President and Chief Executive Officer, Catholic Charities of Northeast Kansas (human services organization) (2006 to 2013) | 73 | None |
James A. Olson (1942) | Director and Chairman of the Board | Since 2007 (Chairman since 2014) | Member, Plaza Belmont LLC (private equity fund manager) | 73 | Saia, Inc. (2002 to 2012) and EPR Properties (2003 to 2013) |
28
Name (Year of Birth) | Position(s) Held with Funds | Length of Time Served | Principal Occupation(s) During Past 5 Years | Number of American Century Portfolios Overseen by Director | Other Directorships Held During Past 5 Years |
| Independent Directors | |||||
M. Jeannine Strandjord (1945) | Director | Since 1994 | Retired | 73 | Euronet Worldwide Inc.; MGP Ingredients, Inc.; Charming Shoppes, Inc. (2006 to 2010); and DST Systems Inc. (1996 to 2012) |
John R. Whitten (1946) | Director | Since 2008 | Retired | 73 | Rudolph Technologies, Inc. |
Stephen E. Yates (1948) | Director | Since 2012 | Retired; Executive Vice President, Technology & Operations, KeyCorp. (computer services) (2004 to 2010) | 73 | Applied Industrial Technologies, Inc. (2001 to 2010) |
| Interested Directors | |||||
Barry Fink (1955) | Director | Since 2012 | Retired; Executive Vice President, ACC (September 2007 to February 2013); President, ACS (October 2007 to February 2013); Chief Operating Officer, ACC (September 2007 to November 2012) | 73 | None |
Jonathan S. Thomas (1963) | Director and President | Since 2007 | President and Chief Executive Officer, ACC (March 2007 to present). Also serves as Chief Executive Officer, ACS; Executive Vice President, ACIM; Director, ACC, ACIM and other ACC subsidiaries | 118 | BioMed Valley Discoveries, Inc. |
The Statement of Additional Information has additional information about the fund's directors and is available without charge, upon request, by calling 1-800-345-2021.
29
Officers
The following table presents certain information about the executive officers of the funds. Each officer serves as an officer for each of the 15 investment companies in the American Century family of funds, unless otherwise noted. No officer is compensated for his or her service as an officer of the funds. The listed officers are interested persons of the funds and are appointed or re-appointed on an annual basis. The mailing address for each officer listed below is 4500 Main Street, Kansas City, Missouri 64111.
Name (Year of Birth) | Offices with the Funds | Principal Occupation(s) During the Past Five Years |
Jonathan S. Thomas (1963) | Director and President since 2007 | President and Chief Executive Officer, ACC (March 2007 to present). Also serves as Chief Executive Officer, ACS; Executive Vice President, ACIM; Director, ACC, ACIM and other ACC subsidiaries |
Amy D. Shelton (1964) | Chief Compliance Officer and Vice President since 2014 | Chief Compliance Officer, American Century funds, (March 2014 to present); Chief Compliance Officer, ACIM (February 2014 to present); Chief Compliance Officer, ACIS (October 2009 to present); Vice President, Client Interactions and Marketing, ACIS (February 2013 to January 2014); Director, Client Interactions and Marketing, ACIS (June 2007 to January 2013). Also serves as Vice President, ACIS |
Charles A. Etherington (1957) | General Counsel since 2007 and Senior Vice President since 2006 | Attorney, ACC (February 1994 to present); Vice President, ACC (November 2005 to present); General Counsel, ACC (March 2007 to present). Also serves as General Counsel, ACIM, ACS, ACIS and other ACC subsidiaries; and Senior Vice President, ACIM and ACS |
C. Jean Wade (1964) | Vice President, Treasurer and Chief Financial Officer since 2012 | Vice President, ACS (February 2000 to present) |
Robert J. Leach (1966) | Vice President since 2006 and Assistant Treasurer since 2012 | Vice President, ACS (February 2000 to present) |
David H. Reinmiller (1963) | Vice President since 2000 | Attorney, ACC (January 1994 to present); Associate General Counsel, ACC (January 2001 to present). Also serves as Vice President, ACIM and ACS |
Ward D. Stauffer (1960) | Secretary since 2005 | Attorney, ACC (June 2003 to present) |
30
| Approval of Management Agreement |
At a meeting held on June 18, 2014, the Fund’s Board of Directors unanimously approved the renewal of the management agreement pursuant to which American Century Investment Management, Inc. (the “Advisor”) acts as the investment advisor for the Fund. Under Section 15(c) of the Investment Company Act, contracts for investment advisory services are required to be reviewed, evaluated, and approved by a majority of a fund’s directors (the “Directors”), including a majority of the independent Directors, each year.
Prior to its consideration of the renewal of the management agreement, the Board requested and reviewed extensive data and information compiled by the Advisor and certain independent providers of evaluation data concerning the Fund and the services provided to the Fund by the Advisor. This review was in addition to the oversight and evaluation undertaken by the Board and its committees on a continuous basis and the information received was supplemental to the extensive information that the Board and its committees receive and consider throughout the year.
In connection with its consideration of the renewal of the management agreement, the Board’s review and evaluation of the services provided by the Advisor included, but was not limited to, the following:
| • | the nature, extent, and quality of investment management, shareholder services, and other services provided by the Advisor to the Fund; |
| • | the wide range of other programs and services the Advisor provides to the Fund and its shareholders on a routine and non-routine basis; |
| • | the Fund’s investment performance compared to appropriate benchmarks and/or a peer group of other mutual funds with similar investment objectives and strategies; |
| • | the cost of owning the Fund compared to the cost of owning similar funds; |
| • | the Advisor’s compliance policies, procedures, and regulatory experience; |
| • | financial data showing the cost of services provided to the Fund, the profitability of the Fund to the Advisor, and the overall profitability of the Advisor; |
| • | possible economies of scale associated with the Advisor’s management of the Fund and other accounts under its management; |
| • | the services provided and charges to other investment management clients of the Advisor; |
| • | acquired fund fees and expenses; and |
| • | any collateral benefits derived by the Advisor from the management of the Fund. |
In keeping with its practice, the Board held two in-person meetings and one telephonic meeting to review and discuss the information provided. The independent Directors also had the benefit of the advice of their independent counsel throughout the process.
Factors Considered
The Directors considered all of the information provided by the Advisor, the independent data providers, and independent counsel, and evaluated such information for the Fund. In connection with their review, the Directors did not identify any single factor as being all-important or controlling, and each Director may have attributed different levels of importance to different factors. In deciding to renew the management agreement, the Board based its decision on a number of factors, including the following:
31
Nature, Extent and Quality of Services — Generally. Under the management agreement, the Advisor is responsible for providing or arranging for all services necessary for the operation of the Fund. The Board noted that under the management agreement, the Advisor provides or arranges at its own expense a wide variety of services including:
| • | constructing and designing the Fund |
| • | portfolio research and security selection |
| • | initial capitalization/funding |
| • | securities trading |
| • | Fund administration |
| • | custody of Fund assets |
| • | daily valuation of the Fund’s portfolio |
| • | shareholder servicing and transfer agency, including shareholder confirmations, recordkeeping, and communications |
| • | legal services (except the independent Directors’ counsel) |
| • | regulatory and portfolio compliance |
| • | financial reporting |
| • | marketing and distribution (except Rule 12b-1 plans) |
The Board noted that many of these services have expanded over time both in terms of quantity and complexity in response to shareholder demands, competition in the industry, changing distribution channels, and the changing regulatory environment.
Investment Management Services. The nature of the investment management services provided to the Fund is quite complex and allows Fund shareholders access to professional money management, instant diversification of their investments within an asset class, the opportunity to easily diversify among asset classes by investing in or exchanging among various American Century Investments funds, and liquidity. In evaluating investment performance, the Board expects the Advisor to manage the Fund in accordance with its investment objectives and approved strategies. Further, the Directors recognize that the Advisor has an obligation to monitor trading activities, and in particular to seek the best execution of fund trades, and to evaluate the use of and payment for research. In providing these services, the Advisor utilizes teams of investment professionals (portfolio managers, analysts, research assistants, and securities traders) who require extensive information technology, research, training, compliance and other systems to conduct their business. The Board, directly and through its Fund Performance Review Committee, regularly reviews investment performance information for the Fund, together with comparative information for appropriate benchmarks and/or peer groups of similarly-managed funds, over different time horizons. The Directors also review detailed performance information during the management agreement approval process. If performance concerns are identified, the Fund receives special reviews until performance improves, during which the Board discusses with the Advisor the reasons for such results (e.g., market conditions, security selection) and any efforts being undertaken to improve performance. The Fund’s performance was above its benchmark for the one-, three-, five-, and ten-year periods reviewed by the Board. The Board found the investment management services provided by the Advisor to the Fund to be satisfactory and consistent with the management agreement.
Shareholder and Other Services. Under the management agreement, the Advisor provides the Fund with a comprehensive package of transfer agency, shareholder, and other services. The Board, directly and through various committees of the Board, regularly reviews reports and evaluations of such services at its regular meetings. These reports include, but are not limited to, information regarding the operational efficiency and accuracy of the shareholder and transfer agency services provided, staffing levels, shareholder satisfaction (as measured by external as well as internal sources), technology support, new products and services offered to Fund shareholders, securities trading activities, portfolio valuation services, auditing services, and legal and operational compliance activities. Certain aspects of shareholder and transfer agency service level efficiency and the quality of securities trading activities are measured by independent third party providers and are presented in comparison to other fund groups not managed by the Advisor. The Board
32
found the services provided by the Advisor to the Fund under the management agreement to be competitive and of high quality.
Costs of Services and Profitability. The Advisor provides detailed information concerning its cost of providing various services to the Fund, its profitability in managing the Fund (pre- and post-distribution), its overall profitability, and its financial condition. The Directors have reviewed with the Advisor the methodology used to prepare this financial information. The financial information regarding the Advisor is considered in evaluating the Advisor’s financial condition, its ability to continue to provide services under the management agreement, and the reasonableness of the current management fee. The Board concluded that the Advisor’s profits were reasonable in light of the services provided to the Fund.
Ethics. The Board generally considers the Advisor’s commitment to providing quality services to shareholders and to conducting its business ethically. They noted that the Advisor’s practices generally meet or exceed industry best practices.
Economies of Scale. The Board also reviewed information provided by the Advisor regarding the possible existence of economies of scale in connection with the management of the Fund. The Board concluded that economies of scale are difficult to measure and predict with precision, especially on a fund-by-fund basis. The Board concluded that the Advisor is appropriately sharing economies of scale through its competitive fee structure, offering competitive fees from fund inception, and through reinvestment in its business to provide shareholders additional content and services.
Comparison to Other Funds’ Fees. The management agreement provides that the Fund pays the Advisor a single, all-inclusive (or unified) management fee for providing all services necessary for the management and operation of the Fund, other than brokerage expenses, taxes, interest, extraordinary expenses, and the fees and expenses of the Fund’s independent directors (including their independent legal counsel) and expenses incurred in connection with the provision of shareholder services and distribution services under a plan adopted pursuant to Rule 12b-1 under the 1940 Act. Under the unified fee structure, the Advisor is responsible for providing all investment advisory, custody, audit, administrative, compliance, recordkeeping, marketing and shareholder services, or arranging and supervising third parties to provide such services. By contrast, most other funds are charged a variety of fees, including an investment advisory fee, a transfer agency fee, an administrative fee, distribution charges and other expenses. Other than their investment advisory fees and any applicable Rule 12b-1 distribution fees, all other components of the total fees charged by these other funds may be increased without shareholder approval. The Board believes the unified fee structure is a benefit to Fund shareholders because it clearly discloses to shareholders the cost of owning Fund shares, and, since the unified fee cannot be increased without a vote of Fund shareholders, it shifts to the Advisor the risk of increased costs of operating the Fund and provides a direct incentive to minimize administrative inefficiencies. Part of the Board’s analysis of fee levels involves reviewing certain evaluative data compiled by an independent provider comparing the Fund’s unified fee to the total expense ratios of its peers. The unified fee charged to shareholders of the Fund was above the median of the total expense ratios of the Fund’s peer expense universe and was within the range of its peer expense group. The Board concluded that the management fee paid by the Fund to the Advisor under the management agreement is reasonable in light of the services provided to the Fund.
Comparison to Fees and Services Provided to Other Clients of the Advisor. The Board also requested and received information from the Advisor concerning the nature of the services, fees, costs and profitability of its advisory services to advisory clients other than the Fund. They observed that these varying types of client accounts require different services and involve different regulatory and entrepreneurial risks than the management of the Fund. The Board analyzed this information and concluded that the fees charged and services provided to the Fund were reasonable by comparison.
33
Collateral or “Fall-Out” Benefits Derived by the Advisor. The Board considered the existence of collateral benefits the Advisor may receive as a result of its relationship with the Fund. They concluded that the Advisor’s primary business is managing mutual funds and it generally does not use fund or shareholder information to generate profits in other lines of business, and therefore does not derive any significant collateral benefits from them. The Board noted that the Advisor receives proprietary research from broker-dealers that execute fund portfolio transactions and concluded that this research is likely to benefit Fund shareholders. The Board also determined that the Advisor is able to provide investment management services to certain clients other than the Fund, at least in part, due to its existing infrastructure built to serve the fund complex. The Board concluded, however, that the assets of those other clients are not material to the analysis and, where applicable, may be included with the assets of the Fund to determine breakpoints in the management fee schedule.
Existing Relationship. The Board also considered whether there was any reason for not continuing the existing arrangement with the Advisor. In this regard, the Board was mindful of the potential disruptions of the Fund’s operations and various risks, uncertainties, and other effects that could occur as a result of a decision not to continue such relationship. In particular, the Board recognized that most shareholders have invested in the Fund on the strength of the Advisor’s industry standing and reputation and in the expectation that the Advisor will have a continuing role in providing advisory services to the Fund.
Conclusion of the Directors. As a result of this process, the Board, including all of the independent Directors, taking into account all of the factors discussed above and the information provided by the Advisor and others, concluded that the management agreement between the Fund and the Advisor is fair and reasonable in light of the services provided and should be renewed.
34
| Additional Information |
Retirement Account Information
As required by law, distributions you receive from certain IRAs are subject to federal income tax withholding, unless you elect not to have withholding apply. Tax will be withheld on the total amount withdrawn even though you may be receiving amounts that are not subject to withholding, such as nondeductible contributions. In such case, excess amounts of withholding could occur. You may adjust your withholding election so that a greater or lesser amount will be withheld.
If you don’t want us to withhold on this amount, you must notify us to not withhold the federal income tax. You may notify us in writing or in certain situations by telephone or through other electronic means. For systematic withdrawals, your withholding election will remain in effect until revoked or changed by filing a new election. You have the right to revoke your election at any time.
Remember, even if you elect not to have income tax withheld, you are liable for paying income tax on the taxable portion of your withdrawal. If you elect not to have income tax withheld or you don’t have enough income tax withheld, you may be responsible for payment of estimated tax. You may incur penalties under the estimated tax rules if your withholding and estimated tax payments are not sufficient. You can reduce or defer the income tax on a distribution by directly or indirectly rolling such distribution over to another IRA or eligible plan. You should consult your tax advisor for additional information.
State tax will be withheld if, at the time of your distribution, your address is within one of the mandatory withholding states and you have federal income tax withheld (or as otherwise required by state law). State taxes will be withheld from your distribution in accordance with the respective state rules.
Distributions you receive from 403(b), 457 and qualified plans are subject to special tax and withholding rules. Your plan administrator or plan sponsor is required to provide you with a special tax notice explaining those rules at the time you request a distribution. If applicable, federal and/or state taxes may be withheld from your distribution amount.
Proxy Voting Policies
A description of the policies that the fund's investment advisor uses in exercising the voting rights associated with the securities purchased and/or held by the fund is available without charge, upon request, by calling 1-800-345-2021. It is also available on the "About Us" page of American Century Investments’ website at americancentury.com and on the Securities and Exchange Commission’s website at sec.gov. Information regarding how the investment advisor voted proxies relating to portfolio securities during the most recent 12-month period ended June 30 is available on the "About Us" page at americancentury.com. It is also available at sec.gov.
Quarterly Portfolio Disclosure
The fund files its complete schedule of portfolio holdings with the Securities and Exchange Commission (SEC) for the first and third quarters of each fiscal year on Form N-Q. The fund’s Forms N-Q are available on the SEC’s website at sec.gov, and may be reviewed and copied at the SEC’s Public Reference Room in Washington, DC. Information on the operation of the Public Reference Room may be obtained by calling 1-800-SEC-0330. The fund also makes its complete schedule of portfolio holdings for the most recent quarter of its fiscal year available on its website at americancentury.com and, upon request, by calling 1-800-345-2021.
35
Other Tax Information
The following information is provided pursuant to provisions of the Internal Revenue Code.
The fund hereby designates up to the maximum amount allowable as qualified dividend income for the fiscal year ended November 30, 2014.
For the fiscal year ended November 30, 2014, the fund intends to pass through to shareholders $241,855, or up to the maximum amount allowable, as a foreign tax credit which represents taxes paid on income derived from sources within foreign countries or possessions of the United States. During the fiscal year ended November 30, 2014, the fund earned $2,868,120 from income derived from foreign sources. Foreign source income and foreign tax expense per outstanding share on November 30, 2014 are $0.1773 and $0.0150, respectively.
36
| ||
| Contact Us | americancentury.com | |
| Automated Information Line | 1-800-345-8765 | |
| Investor Services Representative | 1-800-345-2021 or 816-531-5575 | |
| Investors Using Advisors | 1-800-378-9878 | |
| Business, Not-For-Profit, Employer-Sponsored Retirement Plans | 1-800-345-3533 | |
| Banks and Trust Companies, Broker-Dealers, Financial Professionals, Insurance Companies | 1-800-345-6488 | |
| Telecommunications Relay Service for the Deaf | 711 | |
| American Century World Mutual Funds, Inc. | ||
Investment Advisor: American Century Investment Management, Inc. Kansas City, Missouri | ||
| This report and the statements it contains are submitted for the general information of our shareholders. The report is not authorized for distribution to prospective investors unless preceded or accompanied by an effective prospectus. | ||
| ©2015 American Century Proprietary Holdings, Inc. All rights reserved. CL-ANN-84133 1501 | ||
ANNUAL REPORT | NOVEMBER 30, 2014 |
International Value Fund
| Table of Contents |
| President’s Letter | |
| Performance | |
| Portfolio Commentary | |
| Fund Characteristics | |
| Shareholder Fee Example | |
| Schedule of Investments | |
| Statement of Assets and Liabilities | |
| Statement of Operations | |
| Statement of Changes in Net Assets | |
| Notes to Financial Statements | |
| Financial Highlights | |
| Report of Independent Registered Public Accounting Firm | |
| Management | |
| Approval of Management Agreement | |
| Additional Information | |
Any opinions expressed in this report reflect those of the author as of the date of the report, and do not necessarily represent the opinions of American Century Investments® or any other person in the American Century Investments organization. Any such opinions are subject to change at any time based upon market or other conditions and American Century Investments disclaims any responsibility to update such opinions. These opinions may not be relied upon as investment advice and, because investment decisions made by American Century Investments funds are based on numerous factors, may not be relied upon as an indication of trading intent on behalf of any American Century Investments fund. Security examples are used for representational purposes only and are not intended as recommendations to purchase or sell securities. Performance information for comparative indices and securities is provided to American Century Investments by third party vendors. To the best of American Century Investments’ knowledge, such information is accurate at the time of printing.
| President’s Letter |
| Dear Investor: Thank you for reviewing this annual report for the 12 months ended November 30, 2014. It provides investment performance and portfolio information for the reporting period, plus longer-term historical performance data. Annual reports remain important vehicles for conveying information about fund returns, including market and economic factors that affected performance during the reporting period. For additional, updated investment and market insights, we encourage you to visit our website, americancentury.com. |
| Jonathan Thomas | |
Favorable Fiscal Year for U.S. Investments, While Non-U.S. Lagged
“Global divergence” between the U.S. and the rest of the world emerged as a prevalent theme during the reporting period. As 2014 approached its conclusion, the U.S. appeared to be on a different economic and monetary policy track than most other nations. This theme covered not only the stronger economic growth enjoyed by the U.S. compared with the rest of the world, but also the related contrast between the U.S. Federal Reserve’s unwinding of monetary stimulus versus the continuation and expansion of monetary stimulus by most other central banks.
Global divergence could also generally describe the broad difference between investment returns for U.S. and non-U.S. markets. The perceived strength, safe-haven qualities, and higher yields of U.S. investments attracted global demand. For the reporting period, the S&P 500 Index, the Barclays U.S. Aggregate Bond Index, and the U.S. Dollar Index returned 16.86%, 5.27%, and 9.34%, respectively. By contrast, for U.S. investors unhedged for currency exposure (the dollar’s strength reduced the returns of non-dollar-denominated securities when they were converted to dollars), the MSCI EAFE Index, the MSCI Emerging Markets Index, and the Barclays Global Aggregate Bond Index (ex-USD, unhedged) returned -0.02%, 1.06%, and -2.53%, respectively.
We expect global divergence in economic growth and monetary policies to continue well into 2015, aligned with expectations that the Federal Reserve might finally start raising short-term U.S. interest rates. However, global economic weakness (reflected in recent commodity price declines) and low inflation might delay the rate hikes until the second half of 2015. In this environment, we continue to believe in a disciplined, diversified, long-term investment approach, using professionally managed stock and bond portfolios to meet financial goals. We appreciate your continued trust in us.
Sincerely,
Jonathan Thomas
President and Chief Executive Officer
American Century Investments
2
| Performance |
Total Returns as of November 30, 2014 | ||||||
Average Annual Returns | ||||||
Ticker Symbol | 1 year | 5 years | 10 years | Since Inception | Inception Date | |
| A Class | MEQAX | 3/31/97 | ||||
| No sales charge* | 1.08% | 6.39% | 5.51%(1) | 4.46%(1) | ||
| With sales charge* | -4.74% | 5.13% | 4.89%(1) | 4.11%(1) | ||
MSCI EAFE Value Index | — | -0.70% | 5.33% | 4.71% | 5.83% | — |
| Investor Class | ACEVX | 1.38% | 6.64% | — | 3.71% | 4/3/06 |
| Institutional Class | ACVUX | 1.67% | 6.86% | — | 3.92% | 4/3/06 |
| C Class | ACCOX | 0.41% | 5.58% | — | 2.67% | 4/3/06 |
| R Class | ACVRX | 0.78% | 6.11% | — | 3.18% | 4/3/06 |
| R6 Class | ACVDX | 1.83% | — | — | 8.15% | 7/26/13 |
| * | Sales charges include initial sales charges and contingent deferred sales charges (CDSCs), as applicable. A Class shares have a 5.75% maximum initial sales charge and may be subject to a maximum CDSC of 1.00%. C Class shares redeemed within 12 months of purchase are subject to a maximum CDSC of 1.00%. The SEC requires that mutual funds provide performance information net of maximum sales charges in all cases where charges could be applied. |
International Value acquired all the net assets of the Mason Street International Equity Fund on March 31, 2006, pursuant to a plan of reorganization approved by the acquired fund’s shareholders on March 15, 2006. Performance information prior to April 1, 2006, is that of the Mason Street International Equity Fund.
| (1) | Returns would have been lower if a portion of the fees had not been waived. |
Data presented reflect past performance. Past performance is no guarantee of future results. Current performance may be higher or lower than the performance shown. Investment return and principal value will fluctuate, and redemption value may be more or less than original cost. Data assumes reinvestment of dividends and capital gains, and none of the charts reflect the deduction of taxes that a shareholder would pay on fund distributions or the redemption of fund shares. To obtain performance data current to the most recent month end, please call 1-800-345-2021 or visit americancentury.com. For additional information about the fund, please consult the prospectus.
3
| Growth of $10,000 Over 10 Years |
| $10,000 investment made November 30, 2004* |
| Performance for other share classes will vary due to differences in fee structure. |
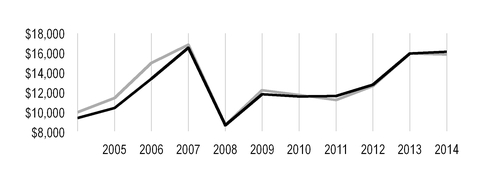
| Value on November 30, 2014 | |
| A Class — $16,124** | |
| MSCI EAFE Value Index — $15,854 | |
* The A Class’s initial investment is $9,425 to reflect the maximum 5.75% initial sales charge.
** Ending value would have been lower if a portion of the fees had not been waived.
Total Annual Fund Operating Expenses | |||||
| Investor Class | Institutional Class | A Class | C Class | R Class | R6 Class |
| 1.32% | 1.12% | 1.57% | 2.32% | 1.82% | 0.97% |
The total annual fund operating expenses shown is as stated in the fund’s prospectus current as of the date of this report. The prospectus may vary from the expense ratio shown elsewhere in this report because it is based on a different time period, includes acquired fund fees and expenses, and, if applicable, does not include fee waivers or expense reimbursements.
Data presented reflect past performance. Past performance is no guarantee of future results. Current performance may be higher or lower than the performance shown. Investment return and principal value will fluctuate, and redemption value may be more or less than original cost. Data assumes reinvestment of dividends and capital gains, and none of the charts reflect the deduction of taxes that a shareholder would pay on fund distributions or the redemption of fund shares. To obtain performance data current to the most recent month end, please call 1-800-345-2021 or visit americancentury.com. For additional information about the fund, please consult the prospectus.
4
| Portfolio Commentary |
Portfolio Managers: Elizabeth Xie, Yulin Long, and Vinod Chandrashekaran
Performance Summary
International Value advanced 1.38%* for the fiscal year ended November 30, 2014, compared with the -0.70% return of its benchmark, the MSCI EAFE Value Index. Fund results reflect management fees, while benchmark returns do not.
International equity markets generally produced declines, particularly during the second half of the reporting period, as persistent geopolitical concerns and subdued economic outlooks around much of the world fueled investor pessimism and drove heightened demand for the U.S. dollar.
The fund’s stock selection process incorporates factors of valuation, quality, and momentum (sentiment) while striving to minimize unintended bets along industries and other risk characteristics. All factors contributed positively to the fund’s returns, with stock selection insights based on valuation and quality contributing the most to outperformance. Sentiment measures also produced positive results.
From a geographical perspective, security selection in Japan, France, and the U.K. was particularly beneficial. Conversely, stock choices in Australia and Hong Kong were detrimental to results. On a sector level, outperformance was driven largely by financials and information technology holdings. The energy sector detracted from returns.
European Banks and Insurers Bolstered Returns
The fund’s European financials stocks, particularly insurers and banks, were among the leading contributors to relative returns during the reporting period. U.K.-based retail insurance service provider Direct Line Insurance Group, among the leading outperformers, surged on news that it planned to divest its German and Italian units following a strategic review of international operations. Outside of financials, returns were bolstered by U.K.-based biopharmaceutical manufacturer AstraZeneca, which soared following a protracted acquisition bid from rival Pfizer. The bid was ultimately rebuffed. Likewise, not owning U.K.-based grocery retailer Tesco, which continued its decline on sinking profits and an accounting overstatement that sent its shares down nearly 50% for the year, also aided results.
Export-driven, Japan-based holdings in the information technology and industrials sectors were also key outperformers, benefiting from a weakening currency, which aided their products’ competitiveness abroad. Seiko Epson, a printer and computer component manufacturer not represented in the benchmark, more than doubled in value, driving results among computer holdings. A portfolio-only position in Fuji Heavy Industries, manufacturer of Subaru cars, also aided the fund’s advance due to rising profits from strong sales bolstered by the weak yen.
Australian Metals and Mining Stocks Pressured Results
A glut in supply coupled with China’s falling demand due to slower economic growth drove iron ore prices down over the course of the year, positioning a number of Australia-based producers as leading underperformers. Fortescue Metals Group was a key detractor, yet we maintain confidence in the company given its attractive valuation and quality profiles. The fund’s exposure to Arrium also weighed on results and we ultimately liquidated the position.
* All fund returns referenced in this commentary are for Investor Class shares. Performance for other share classes will vary due to differences in fee structure; when Investor Class performance exceeds that of the fund's benchmark, other share classes may not. See page 3 for returns for all share classes.
5
Elsewhere, overweight positions in a number of Hong Kong-based financial services stocks pressured gains, including BOC Hong Kong Holdings, which declined on concern of slowing growth and credit exposure in China. Despite uncertainty about future economic growth in China, the holding appears very strong on valuation and above-average on quality- and sentiment-based measures.
Elsewhere in the fund, a portfolio-only position in oil exploration company Soco International negatively impacted performance as the company’s stock fell together with the price of oil. Oil-related holdings were further pressured by OPEC’s decision to maintain current production levels despite a global glut in oil supply, which pushed the price of oil to a four-year low at the end of the reporting period. Despite the short-term industry volatility, the company remains attractive based on strength across insights of valuation and quality.
A Look Ahead
As we move into 2015, worries persist about the global economic recovery. While growth in the U.S. appears to be progressing, albeit at a slower pace than during prior post-recessionary periods, Europe faces possible deflation, Japan has fallen back into a recession (two consecutive quarters of negative economic growth as measured by a country's gross domestic product), and growth in China continues to slow while other emerging markets face debt, currency and political challenges. The ongoing softness in global economic growth is leading to muted inflation and a dramatic drop in oil prices, which appear likely to persist in the near term. On the monetary policy front, while the U.S. and the U.K. prepare for monetary tightening, the rest of the developed world remains in easing mode, which is likely to be stimulative for non-U.S. markets. We believe that our disciplined investment approach is particularly beneficial during periods of likely volatility, and we adhere to our process regardless of the market environment. We believe that this allows us to take advantage of opportunities presented by market inefficiencies.
We believe that stock selection—rather than regional and sector allocation or market timing via the use of cash—is the most efficient means of generating superior risk-adjusted returns. As a result of this approach, the fund’s country and sector weightings are primarily a result of identifying what we believe to be superior individual securities. The funds largest, but modest, overweights are in health care and telecommunication services, while the underweights are led by the industrials and financials sectors. Geographically, the fund’s greatest underweight is in Europe, while exposure to Asia is greater than that of the benchmark.
6
| Fund Characteristics |
| NOVEMBER 30, 2014 | |
Top Ten Holdings | % of net assets |
| Royal Dutch Shell plc, B Shares | 3.1% |
| HSBC Holdings plc | 3.0% |
| Banco Santander SA | 2.7% |
| Allianz SE | 2.3% |
| AstraZeneca plc | 2.3% |
| Australia & New Zealand Banking Group Ltd. | 1.9% |
| Deutsche Telekom AG | 1.8% |
| Rio Tinto plc | 1.8% |
| ENI SpA | 1.8% |
| Imperial Tobacco Group plc | 1.7% |
Types of Investments in Portfolio | % of net assets |
| Foreign Common Stocks | 98.4% |
| Exchange-Traded Funds | 0.8% |
| Rights | —* |
| Total Equity Exposure | 99.2% |
| Temporary Cash Investments | 0.3% |
| Other Assets and Liabilities | 0.5% |
| *Category is less than 0.05% of total net assets. | |
Investments by Country | % of net assets |
| United Kingdom | 23.6% |
| Japan | 20.1% |
| France | 10.0% |
| Germany | 8.4% |
| Australia | 7.5% |
| Spain | 4.5% |
| Hong Kong | 4.2% |
| Switzerland | 4.1% |
| Netherlands | 2.8% |
| Italy | 2.0% |
| Other Countries | 11.2% |
| Exchange-Traded Funds | 0.8% |
| Cash and Equivalents** | 0.8% |
**Includes temporary cash investments and other assets and liabilities.
7
| Shareholder Fee Example |
Fund shareholders may incur two types of costs: (1) transaction costs, including sales charges (loads) on purchase payments and redemption/exchange fees; and (2) ongoing costs, including management fees; distribution and service (12b-1) fees; and other fund expenses. This example is intended to help you understand your ongoing costs (in dollars) of investing in your fund and to compare these costs with the ongoing cost of investing in other mutual funds.
The example is based on an investment of $1,000 made at the beginning of the period and held for the entire period from June 1, 2014 to November 30, 2014.
Actual Expenses
The table provides information about actual account values and actual expenses for each class. You may use the information, together with the amount you invested, to estimate the expenses that you paid over the period. First, identify the share class you own. Then simply divide your account value by $1,000 (for example, an $8,600 account value divided by $1,000 = 8.6), then multiply the result by the number under the heading “Expenses Paid During Period” to estimate the expenses you paid on your account during this period.
If you hold Investor Class shares of any American Century Investments fund, or Institutional Class shares of the American Century Diversified Bond Fund, in an American Century Investments account (i.e., not a financial intermediary or retirement plan account), American Century Investments may charge you a $12.50 semiannual account maintenance fee if the value of those shares is less than $10,000. We will redeem shares automatically in one of your accounts to pay the $12.50 fee. In determining your total eligible investment amount, we will include your investments in all personal accounts (including American Century Investments Brokerage accounts) registered under your Social Security number. Personal accounts include individual accounts, joint accounts, UGMA/UTMA accounts, personal trusts, Coverdell Education Savings Accounts and IRAs (including traditional, Roth, Rollover, SEP-, SARSEP- and SIMPLE-IRAs), and certain other retirement accounts. If you have only business, business retirement, employer-sponsored or American Century Investments Brokerage accounts, you are currently not subject to this fee. If you are subject to the Account Maintenance Fee, your account value could be reduced by the fee amount.
Hypothetical Example for Comparison Purposes
The table also provides information about hypothetical account values and hypothetical expenses based on the actual expense ratio of each class of your fund and an assumed rate of return of 5% per year before expenses, which is not the actual return of a fund’s share class. The hypothetical account values and expenses may not be used to estimate the actual ending account balance or expenses you paid for the period. You may use this information to compare the ongoing costs of investing in your fund and other funds. To do so, compare this 5% hypothetical example with the 5% hypothetical examples that appear in the shareholder reports of the other funds.
Please note that the expenses shown in the table are meant to highlight your ongoing costs only and do not reflect any transactional costs, such as sales charges (loads) or redemption/exchange fees. Therefore, the table is useful in comparing ongoing costs only, and will not help you determine the relative total costs of owning different funds. In addition, if these transactional costs were included, your costs would have been higher.
8
| Beginning Account Value 6/1/14 | Ending Account Value 11/30/14 | Expenses Paid During Period(1) 6/1/14 - 11/30/14 | Annualized Expense Ratio(1) | |
Actual | ||||
| Investor Class | $1,000 | $943.90 | $6.38 | 1.31% |
| Institutional Class | $1,000 | $944.90 | $5.41 | 1.11% |
| A Class | $1,000 | $943.00 | $7.60 | 1.56% |
| C Class | $1,000 | $939.50 | $11.23 | 2.31% |
| R Class | $1,000 | $941.60 | $8.81 | 1.81% |
| R6 Class | $1,000 | $946.00 | $4.68 | 0.96% |
Hypothetical | ||||
| Investor Class | $1,000 | $1,018.50 | $6.63 | 1.31% |
| Institutional Class | $1,000 | $1,019.50 | $5.62 | 1.11% |
| A Class | $1,000 | $1,017.25 | $7.89 | 1.56% |
| C Class | $1,000 | $1,013.49 | $11.66 | 2.31% |
| R Class | $1,000 | $1,015.99 | $9.15 | 1.81% |
| R6 Class | $1,000 | $1,020.26 | $4.86 | 0.96% |
| (1) | Expenses are equal to the class's annualized expense ratio listed in the table above, multiplied by the average account value over the period, multiplied by 183, the number of days in the most recent fiscal half-year, divided by 365, to reflect the one-half year period. |
9
| Schedule of Investments |
NOVEMBER 30, 2014
| Shares | Value | ||||
| COMMON STOCKS — 98.4% | |||||
| Australia — 7.5% | |||||
| Australia & New Zealand Banking Group Ltd. | 26,216 | $ | 712,046 | ||
| Commonwealth Bank of Australia | 3,418 | 234,764 | |||
| Fortescue Metals Group Ltd. | 32,678 | 81,749 | |||
| Insurance Australia Group Ltd. | 85,051 | 460,996 | |||
| Lend Lease Group | 8,750 | 114,138 | |||
| Mineral Resources Ltd. | 12,176 | 79,051 | |||
| National Australia Bank Ltd. | 5,991 | 166,186 | |||
| Telstra Corp. Ltd. | 83,920 | 406,309 | |||
| Westpac Banking Corp. | 5,732 | 158,758 | |||
| Woodside Petroleum Ltd. | 15,156 | 461,041 | |||
| 2,875,038 | |||||
| Belgium — 0.8% | |||||
KBC Groep NV(1) | 5,366 | 306,928 | |||
| China — 0.5% | |||||
| Huaneng Power International, Inc., H Shares | 156,000 | 182,849 | |||
| Denmark — 1.2% | |||||
| AP Moeller - Maersk A/S, B Shares | 198 | 412,962 | |||
| Coloplast A/S, B Shares | 632 | 54,764 | |||
| 467,726 | |||||
| France — 10.0% | |||||
APERAM SA(1) | 9,475 | 303,614 | |||
| AXA SA | 2,843 | 68,635 | |||
| BNP Paribas SA | 95 | 6,091 | |||
| Credit Agricole SA | 33,949 | 477,228 | |||
| GDF Suez | 25,334 | 624,203 | |||
| Metropole Television SA | 11,948 | 226,862 | |||
| Orange SA | 36,569 | 644,107 | |||
| Rallye SA | 6,628 | 258,003 | |||
| Sanofi | 3,795 | 367,413 | |||
Technicolor SA(1) | 45,032 | 268,776 | |||
| Total SA | 9,636 | 539,065 | |||
| Valeo SA | 333 | 40,972 | |||
| 3,824,969 | |||||
| Germany — 8.4% | |||||
| Allianz SE | 5,151 | 886,774 | |||
| BASF SE | 1,232 | 111,846 | |||
| Deutsche Telekom AG | 40,966 | 697,867 | |||
| E.ON AG | 22,488 | 398,608 | |||
| ProSiebenSat.1 Media AG | 11,332 | 484,018 | |||
| RWE AG | 13,756 | 498,266 | |||
| Siemens AG | 1,365 | 161,516 | |||
| 3,238,895 | |||||
| Hong Kong — 4.2% | |||||
| BOC Hong Kong Holdings Ltd. | 136,000 | 480,500 | |||
10
| Shares | Value | ||||
| Cheung Kong Holdings Ltd. | 7,000 | $ | 128,442 | ||
| Hang Seng Bank Ltd. | 27,700 | 461,473 | |||
| Link Real Estate Investment Trust (The) | 86,500 | 550,995 | |||
| 1,621,410 | |||||
| India — 0.8% | |||||
| Rural Electrification Corp. Ltd. | 21,579 | 117,293 | |||
| State Bank of India | 36,460 | 188,836 | |||
| 306,129 | |||||
| Ireland — 0.2% | |||||
| Smurfit Kappa Group plc | 3,446 | 79,828 | |||
| Israel — 1.4% | |||||
| Bank Hapoalim BM | 64,752 | 322,538 | |||
| Bezeq The Israeli Telecommunication Corp. Ltd. | 110,766 | 196,059 | |||
| 518,597 | |||||
| Italy — 2.0% | |||||
| A2A SpA | 30,251 | 31,522 | |||
| ACEA SpA | 3,906 | 44,368 | |||
| ENI SpA | 33,664 | 672,682 | |||
| 748,572 | |||||
| Japan — 20.1% | |||||
| Aeon Delight Co. Ltd. | 6,100 | 137,451 | |||
| Asahi Kasei Corp. | 53,000 | 460,734 | |||
| Bridgestone Corp. | 10,000 | 343,638 | |||
| Calsonic Kansei Corp. | 9,000 | 49,353 | |||
| Canon Marketing Japan, Inc. | 13,200 | 239,393 | |||
| Canon, Inc. | 1,900 | 60,842 | |||
| Central Japan Railway Co. | 3,300 | 480,205 | |||
| Daito Trust Construction Co. Ltd. | 1,500 | 169,313 | |||
| FamilyMart Co. Ltd. | 4,000 | 147,580 | |||
| Fuji Heavy Industries Ltd. | 11,200 | 407,376 | |||
| FUJIFILM Holdings Corp. | 13,200 | 437,591 | |||
| Fukuoka Financial Group, Inc. | 51,000 | 277,951 | |||
| Hachijuni Bank Ltd. (The) | 32,000 | 195,696 | |||
| Heiwa Corp. | 7,400 | 141,935 | |||
| Japan Airlines Co. Ltd. | 16,200 | 476,250 | |||
| JGC Corp. | 8,000 | 172,076 | |||
| KDDI Corp. | 2,500 | 160,131 | |||
| Kobe Steel Ltd. | 94,000 | 149,652 | |||
| Kyowa Exeo Corp. | 22,000 | 249,438 | |||
| Mitsubishi Electric Corp. | 9,000 | 108,146 | |||
| Mitsubishi Motors Corp. | 33,900 | 348,381 | |||
| Mitsubishi UFJ Financial Group, Inc. | 13,100 | 75,743 | |||
| Nippon Telegraph & Telephone Corp. | 8,800 | 470,781 | |||
| NTT DoCoMo, Inc. | 12,100 | 188,714 | |||
| Otsuka Holdings Co. Ltd. | 6,400 | 202,300 | |||
| PanaHome Corp. | 17,000 | 109,548 | |||
| Panasonic Corp. | 27,700 | 357,581 | |||
| Seiko Epson Corp. | 4,200 | 202,721 | |||
| Seven Bank Ltd. | 94,200 | 408,651 | |||
| T&D Holdings, Inc. | 15,400 | 186,541 | |||
11
| Shares | Value | ||||
| Taisei Corp. | 14,000 | $ | 73,116 | ||
| Toyota Motor Corp. | 3,800 | 234,117 | |||
| 7,722,945 | |||||
| Netherlands — 2.8% | |||||
ING Groep NV CVA(1) | 41,655 | 610,156 | |||
| Koninklijke Ahold NV | 21,864 | 386,188 | |||
TomTom NV(1) | 9,124 | 64,033 | |||
| 1,060,377 | |||||
| Norway — 0.8% | |||||
| Statoil ASA | 6,919 | 130,678 | |||
| TGS Nopec Geophysical Co. ASA | 8,048 | 178,961 | |||
| 309,639 | |||||
| Portugal — 1.2% | |||||
| EDP - Energias de Portugal SA | 108,220 | 443,934 | |||
| Singapore — 1.5% | |||||
| Singapore Post Ltd. | 94,000 | 139,110 | |||
| United Overseas Bank Ltd. | 15,000 | 276,042 | |||
| Yangzijiang Shipbuilding Holdings Ltd. | 165,000 | 154,986 | |||
| 570,138 | |||||
| South Korea — 0.7% | |||||
| Samsung Electronics Co. Ltd. | 246 | 285,755 | |||
| Spain — 4.5% | |||||
| Banco Santander SA | 116,777 | 1,052,601 | |||
| Endesa SA | 20,650 | 399,153 | |||
| Mapfre SA | 61,325 | 225,027 | |||
| Telefonica SA | 3,000 | 48,047 | |||
| 1,724,828 | |||||
| Sweden — 1.6% | |||||
| Industrivarden AB, C Shares | 2,190 | 38,710 | |||
| Investor AB, B Shares | 11,310 | 424,852 | |||
| Meda AB, A Shares | 11,150 | 159,851 | |||
| 623,413 | |||||
| Switzerland — 4.1% | |||||
| Nestle SA | 1,602 | 120,285 | |||
| Novartis AG | 4,690 | 453,832 | |||
| Roche Holding AG | 1,251 | 374,685 | |||
| Zurich Financial Services AG | 2,035 | 637,721 | |||
| 1,586,523 | |||||
| Taiwan — 0.5% | |||||
| AU Optronics Corp. | 284,000 | 133,981 | |||
| Innolux Corp. | 126,000 | 60,257 | |||
| 194,238 | |||||
| United Kingdom — 23.6% | |||||
| Amlin plc | 16,212 | 112,739 | |||
| AstraZeneca plc | 11,854 | 885,062 | |||
| BHP Billiton plc | 2,500 | 59,239 | |||
| BP plc | 70,415 | 462,170 | |||
| British Land Co. plc | 13,637 | 163,592 | |||
| BT Group plc | 62,114 | 397,984 | |||
| Catlin Group Ltd. | 45,610 | 392,904 | |||
12
| Shares | Value | ||||
| Centrica plc | 69,907 | $ | 310,768 | ||
| Direct Line Insurance Group plc | 94,785 | 436,019 | |||
| Evraz plc | 95,528 | 222,778 | |||
| HSBC Holdings plc | 114,566 | 1,139,925 | |||
| Imperial Tobacco Group plc | 14,273 | 659,915 | |||
| Investec plc | 32,200 | 297,755 | |||
| Man Group plc | 31,108 | 69,533 | |||
| Rio Tinto plc | 14,454 | 675,621 | |||
| Royal Dutch Shell plc, B Shares | 34,709 | 1,205,209 | |||
| Soco International plc | 58,537 | 258,852 | |||
| Standard Chartered plc | 19,108 | 279,693 | |||
| Standard Life plc | 71,237 | 471,794 | |||
| TUI Travel plc | 9,310 | 64,669 | |||
| Vedanta Resources plc | 28,186 | 321,174 | |||
| Vodafone Group plc | 47,573 | 173,846 | |||
| 9,061,241 | |||||
TOTAL COMMON STOCKS (Cost $34,820,719) | 37,753,972 | ||||
| EXCHANGE-TRADED FUNDS — 0.8% | |||||
iShares MSCI EAFE Value ETF (Cost $310,931) | 5,600 | 301,392 | |||
RIGHTS† | |||||
Sweden† | |||||
Meda AB(1) (Cost $—) | 16,200 | 10,037 | |||
| TEMPORARY CASH INVESTMENTS — 0.3% | |||||
| Repurchase Agreement, Bank of America Merrill Lynch, (collateralized by various U.S. Treasury obligations, 0.875% - 1.50%, 6/30/16 - 12/31/16, valued at $75,089), in a joint trading account at 0.06%, dated 11/28/14, due 12/1/14 (Delivery value $73,579) | 73,579 | ||||
| Repurchase Agreement, Credit Suisse First Boston, Inc., (collateralized by various U.S. Treasury obligations, 3.00%, 9/30/16, valued at $30,025), in a joint trading account at 0.02%, dated 11/28/14, due 12/1/14 (Delivery value $29,432) | 29,432 | ||||
TOTAL TEMPORARY CASH INVESTMENTS (Cost $103,011) | 103,011 | ||||
TOTAL INVESTMENT SECURITIES — 99.5% (Cost $35,234,661) | 38,168,412 | ||||
| OTHER ASSETS AND LIABILITIES — 0.5% | 178,921 | ||||
| TOTAL NET ASSETS — 100.0% | $ | 38,347,333 | |||
13
| MARKET SECTOR DIVERSIFICATION | ||
| (as a % of net assets) | ||
| Financials | 35.8 | % |
| Energy | 10.2 | % |
| Consumer Discretionary | 8.9 | % |
| Telecommunication Services | 8.8 | % |
| Utilities | 7.6 | % |
| Industrials | 7.0 | % |
| Health Care | 6.5 | % |
| Materials | 6.5 | % |
| Consumer Staples | 4.1 | % |
| Information Technology | 3.0 | % |
| Exchange-Traded Funds | 0.8 | % |
| Cash and Equivalents* | 0.8 | % |
*Includes temporary cash investments and other assets and liabilities.
| NOTES TO SCHEDULE OF INVESTMENTS | ||
| CVA | - | Certificaten Van Aandelen |
| † | Category is less than 0.05% of total net assets. |
| (1) | Non-income producing. |
See Notes to Financial Statements.
14
| Statement of Assets and Liabilities |
| NOVEMBER 30, 2014 | |||
| Assets | |||
| Investment securities, at value (cost of $35,234,661) | $ | 38,168,412 | |
| Cash | 67,621 | ||
| Foreign currency holdings, at value (cost of $25,774) | 25,643 | ||
| Receivable for investments sold | 24,255 | ||
| Receivable for capital shares sold | 6,208 | ||
| Dividends and interest receivable | 186,093 | ||
| 38,478,232 | |||
| Liabilities | |||
| Payable for investments purchased | 73,071 | ||
| Payable for capital shares redeemed | 3,702 | ||
| Accrued management fees | 40,309 | ||
| Distribution and service fees payable | 5,154 | ||
| Accrued foreign taxes | 8,663 | ||
| 130,899 | |||
| Net Assets | $ | 38,347,333 | |
| Net Assets Consist of: | |||
| Capital (par value and paid-in surplus) | $ | 36,740,923 | |
| Undistributed net investment income | 1,269,512 | ||
| Accumulated net realized loss | (2,582,675 | ) | |
| Net unrealized appreciation | 2,919,573 | ||
| $ | 38,347,333 | ||
| Net Assets | Shares Outstanding | Net Asset Value Per Share | ||||
| Investor Class, $0.01 Par Value | $19,068,056 | 2,140,426 | $8.91 | |||
| Institutional Class, $0.01 Par Value | $513,391 | 57,576 | $8.92 | |||
| A Class, $0.01 Par Value | $15,423,456 | 1,727,189 | $8.93* | |||
| C Class, $0.01 Par Value | $2,301,248 | 260,044 | $8.85 | |||
| R Class, $0.01 Par Value | $478,924 | 53,964 | $8.87 | |||
| R6 Class, $0.01 Par Value | $562,258 | 62,978 | $8.93 | |||
*Maximum offering price $9.47 (net asset value divided by 0.9425).
See Notes to Financial Statements.
15
| Statement of Operations |
| YEAR ENDED NOVEMBER 30, 2014 | |||
| Investment Income (Loss) | |||
| Income: | |||
| Dividends (net of foreign taxes withheld of $127,355) | $ | 1,853,518 | |
| Interest | 49 | ||
| 1,853,567 | |||
| Expenses: | |||
| Management fees | 493,410 | ||
| Distribution and service fees: | |||
| A Class | 38,978 | ||
| C Class | 21,356 | ||
| R Class | 2,170 | ||
| Directors' fees and expenses | 425 | ||
| Other expenses | 693 | ||
| 557,032 | |||
| Net investment income (loss) | 1,296,535 | ||
| Realized and Unrealized Gain (Loss) | |||
| Net realized gain (loss) on: | |||
| Investment transactions | 1,870,139 | ||
| Foreign currency transactions | (10,387 | ) | |
| 1,859,752 | |||
| Change in net unrealized appreciation (depreciation) on: | |||
| Investments (includes (increase) decrease in accrued foreign taxes of $(8,663)) | (2,829,222 | ) | |
| Translation of assets and liabilities in foreign currencies | (14,941 | ) | |
| (2,844,163 | ) | ||
| Net realized and unrealized gain (loss) | (984,411 | ) | |
| Net Increase (Decrease) in Net Assets Resulting from Operations | $ | 312,124 | |
See Notes to Financial Statements.
16
| Statement of Changes in Net Assets |
| YEARS ENDED NOVEMBER 30, 2014 AND NOVEMBER 30, 2013 | ||||||
| Increase (Decrease) in Net Assets | November 30, 2014 | November 30, 2013 | ||||
| Operations | ||||||
| Net investment income (loss) | $ | 1,296,535 | $ | 739,123 | ||
| Net realized gain (loss) | 1,859,752 | 2,760,410 | ||||
| Change in net unrealized appreciation (depreciation) | (2,844,163 | ) | 3,209,375 | |||
| Net increase (decrease) in net assets resulting from operations | 312,124 | 6,708,908 | ||||
| Distributions to Shareholders | ||||||
| From net investment income: | ||||||
| Investor Class | (338,923 | ) | (355,003 | ) | ||
| Institutional Class | (42,388 | ) | (8,858 | ) | ||
| A Class | (303,879 | ) | (376,552 | ) | ||
| C Class | (35,907 | ) | (32,740 | ) | ||
| R Class | (6,548 | ) | (7,869 | ) | ||
| R6 Class | (593 | ) | — | |||
| Decrease in net assets from distributions | (728,238 | ) | (781,022 | ) | ||
| Capital Share Transactions | ||||||
| Net increase (decrease) in net assets from capital share transactions (Note 5) | 2,180,068 | 4,132,134 | ||||
| Redemption Fees | ||||||
| Increase in net assets from redemption fees | 8,266 | 7,206 | ||||
| Net increase (decrease) in net assets | 1,772,220 | 10,067,226 | ||||
| Net Assets | ||||||
| Beginning of period | 36,575,113 | 26,507,887 | ||||
| End of period | $ | 38,347,333 | $ | 36,575,113 | ||
| Undistributed net investment income | $ | 1,269,512 | $ | 711,666 | ||
See Notes to Financial Statements.
17
| Notes to Financial Statements |
NOVEMBER 30, 2014
1. Organization
American Century World Mutual Funds, Inc. (the corporation) is registered under the Investment Company Act of 1940, as amended (the 1940 Act), as an open-end management investment company and is organized as a Maryland corporation. International Value Fund (the fund) is one fund in a series issued by the corporation. The fund is diversified as defined under the 1940 Act. The fund's investment objective is to seek long-term capital growth.
The fund offers the Investor Class, the Institutional Class, the A Class, the C Class, the R Class and the R6 Class. The A Class may incur an initial sales charge. The A Class and C Class may be subject to a contingent deferred sales charge. The share classes differ principally in their respective sales charges and distribution and shareholder servicing expenses and arrangements. The Institutional Class and R6 Class shareholders do not require the same level of shareholder and administrative services from American Century Investment Management, Inc. (ACIM) (the investment advisor) as shareholders of other classes. In addition, financial intermediaries do not receive any service, distribution or administrative fees for the R6 Class. As a result, the Institutional Class and R6 Class are charged lower unified management fees. Sale of the R6 Class commenced on July 26, 2013.
2. Significant Accounting Policies
The following is a summary of significant accounting policies consistently followed by the fund in preparation of its financial statements. The fund is an investment company and follows accounting and reporting guidance in accordance with accounting principles generally accepted in the United States of America. This may require management to make certain estimates and assumptions at the date of the financial statements. Actual results could differ from these estimates. Management evaluated the impact of events or transactions occurring through the date the financial statements were issued that would merit recognition or disclosure.
Investment Valuations — The fund determines the fair value of its investments and computes its net asset value per share at the close of regular trading (usually 4 p.m. Eastern time) on the New York Stock Exchange (NYSE) on each day the NYSE is open. The Board of Directors has adopted valuation policies and procedures to guide the investment advisor in the fund’s investment valuation process and to provide methodologies for the oversight of the fund’s pricing function.
Equity securities that are listed or traded on a domestic securities exchange are valued at the last reported sales price or at the official closing price as provided by the exchange. Equity securities traded on foreign securities exchanges are generally valued at the closing price of such securities on the exchange where primarily traded or at the close of the NYSE, if that is earlier. If no last sales price is reported, or if local convention or regulation so provides, the mean of the latest bid and asked prices may be used. Securities traded over-the-counter are valued at the mean of the latest bid and asked prices, the last sales price, or the official closing price. Equity securities initially expressed in local currencies are translated into U.S. dollars at the mean of the appropriate currency exchange rate at the close of the NYSE as provided by an independent pricing service.
Fixed income securities maturing within 60 days at the time of purchase may be valued at cost, plus or minus any amortized discount or premium or at the evaluated mean as provided by an independent pricing service. Evaluated mean prices are commonly derived through utilization of market models, which may consider, among other factors: trade data, quotations from dealers and active market makers, relevant yield curve and spread data, related sector levels, creditworthiness, trade data or market information on comparable securities, and other relevant security specific information.
Open-end management investment companies are valued at the reported net asset value per share. Repurchase agreements are valued at cost, which approximates fair value.
If the fund determines that the market price for an investment is not readily available or the valuation methods mentioned above do not reflect an investment’s fair value, such investment is valued as determined in good faith by the Board of Directors or its delegate, in accordance with policies and procedures adopted by the Board of Directors. In its determination of fair value, the fund may review several factors including, but not limited to, market information regarding the specific investment or comparable investments and correlation
18
with other investment types, futures indices or general market indicators. Circumstances that may cause the fund to use these procedures to value an investment include, but are not limited to: an investment has been declared in default or is distressed; trading in a security has been suspended during the trading day or a security is not actively trading on its principal exchange; prices received from a regular pricing source are deemed unreliable; or there is a foreign market holiday and no trading occurred.
The fund monitors for significant events occurring after the close of an investment’s primary exchange but before the fund’s net asset value per share is determined. Significant events may include, but are not limited to: corporate announcements and transactions; governmental action and political unrest that could impact a specific investment or an investment sector; or armed conflicts, natural disasters and similar events that could affect investments in a specific country or region. The fund also monitors for significant fluctuations between domestic and foreign markets, as evidenced by the U.S. market or such other indicators that the Board of Directors, or its delegate, deems appropriate. If significant fluctuations in foreign markets are identified, the fund may apply a model-derived factor to the closing price of equity securities traded on foreign securities exchanges. The factor is based on observable market data as provided by an independent pricing service.
Security Transactions — Security transactions are accounted for as of the trade date. Net realized gains and losses are determined on the identified cost basis, which is also used for federal income tax purposes. Certain countries impose taxes on realized gains on the sale of securities registered in their country. The fund records the foreign tax expense, if any, on an accrual basis. The foreign tax expense on realized gains and unrealized appreciation reduces the net realized gain (loss) on investment transactions and net unrealized appreciation (depreciation) on investments, respectively.
Investment Income — Dividend income less foreign taxes withheld, if any, is recorded as of the ex-dividend date. Distributions received on securities that represent a return of capital or long-term capital gain are recorded as a reduction of cost of investments and/or as a realized gain. The fund may estimate the components of distributions received that may be considered nontaxable distributions or long-term capital gain distributions for income tax purposes. Interest income is recorded on the accrual basis and includes accretion of discounts and amortization of premiums.
Foreign Currency Translations — All assets and liabilities initially expressed in foreign currencies are translated into U.S. dollars at prevailing exchange rates at period end. The fund may enter into spot foreign currency exchange contracts to facilitate transactions denominated in a foreign currency. Purchases and sales of investment securities, dividend and interest income, spot foreign currency exchange contracts, and expenses are translated at the rates of exchange prevailing on the respective dates of such transactions. Net realized and unrealized foreign currency exchange gains or losses related to investment securities are a component of net realized gain (loss) on investment transactions and change in net unrealized appreciation (depreciation) on investments, respectively.
Repurchase Agreements — The fund may enter into repurchase agreements with institutions that ACIM has determined are creditworthy pursuant to criteria adopted by the Board of Directors. The fund requires that the collateral, represented by securities, received in a repurchase transaction be transferred to the custodian in a manner sufficient to enable the fund to obtain those securities in the event of a default under the repurchase agreement. ACIM monitors, on a daily basis, the securities transferred to ensure the value, including accrued interest, of the securities under each repurchase agreement is equal to or greater than amounts owed to the fund under each repurchase agreement.
Joint Trading Account — Pursuant to an Exemptive Order issued by the Securities and Exchange Commission, the fund, along with certain other funds in the American Century Investments family of funds, may transfer uninvested cash balances into a joint trading account. These balances are invested in one or more repurchase agreements that are collateralized by U.S. Treasury or Agency obligations.
Income Tax Status — It is the fund’s policy to distribute substantially all net investment income and net realized gains to shareholders and to otherwise qualify as a regulated investment company under provisions of the Internal Revenue Code. Accordingly, no provision has been made for income taxes. The fund files U.S. federal, state, local and non-U.S. tax returns as applicable. The fund's tax returns are subject to examination by the relevant taxing authority until expiration of the applicable statute of limitations, which is generally three years from the date of filing but can be longer in certain jurisdictions. At this time, management believes there are no uncertain tax positions which, based on their technical merit, would not be sustained upon examination and for which it is reasonably possible that the total amounts of unrecognized tax benefits will significantly change in the next twelve months.
19
Multiple Class — All shares of the fund represent an equal pro rata interest in the net assets of the class to which such shares belong, and have identical voting, dividend, liquidation and other rights and the same terms and conditions, except for class specific expenses and exclusive rights to vote on matters affecting only individual classes. Income, non-class specific expenses, and realized and unrealized capital gains and losses of the fund are allocated to each class of shares based on their relative net assets.
Distributions to Shareholders — Distributions from net investment income and net realized gains, if any, are generally declared and paid annually. The fund may make distributions on a more frequent basis to comply with the distribution requirements of the Internal Revenue Code, in all events in a manner consistent with provisions of the 1940 Act.
Redemption Fees — The fund may impose a 2.00% redemption fee on shares held less than 60 days. The fee may not be applicable to all classes. The redemption fee is retained by the fund and helps cover transaction costs that long-term investors may bear when the fund sells securities to meet investor redemptions.
Indemnifications — Under the corporation’s organizational documents, its officers and directors are indemnified against certain liabilities arising out of the performance of their duties to the fund. In addition, in the normal course of business, the fund enters into contracts that provide general indemnifications. The maximum exposure under these arrangements is unknown as this would involve future claims that may be made against a fund. The risk of material loss from such claims is considered by management to be remote.
3. Fees and Transactions with Related Parties
Certain officers and directors of the corporation are also officers and/or directors of American Century Companies, Inc. (ACC). The corporation’s investment advisor, ACIM, the corporation's distributor, American Century Investment Services, Inc. (ACIS), and the corporation’s transfer agent, American Century Services, LLC, are wholly owned, directly or indirectly, by ACC.
Management Fees — The corporation has entered into a management agreement with ACIM, under which ACIM provides the fund with investment advisory and management services in exchange for a single, unified management fee (the fee) per class. The agreement provides that all expenses of managing and operating the fund, except distribution and service fees, brokerage expenses, taxes, interest, fees and expenses of the independent directors (including legal counsel fees), and extraordinary expenses, will be paid by ACIM. The fee is computed and accrued daily based on each class’s daily net assets and paid monthly in arrears. The rate of the fee is determined by applying a fee rate calculation formula. This formula takes into account the fund’s assets as well as certain assets, if any, of other clients of the investment advisor outside the American Century Investments family of funds (such as subadvised funds and separate accounts) that have very similar investment teams and investment strategies (strategy assets). The annual management fee schedule ranges from 1.100% to 1.300% for the Investor Class, A Class, C Class and R Class. The annual management fee schedule ranges from 0.900% to 1.100% for the Institutional Class and 0.750% to 0.950% for the R6 Class. The effective annual management fee for each class for the year ended November 30, 2014 was 1.30% for the Investor Class, A Class, C Class and R Class, 1.10% for the Institutional Class and 0.95% for the R6 Class.
Distribution and Service Fees — The Board of Directors has adopted a separate Master Distribution and Individual Shareholder Services Plan for each of the A Class, C Class and R Class (collectively the plans), pursuant to Rule 12b-1 of the 1940 Act. The plans provide that the A Class will pay ACIS an annual distribution and service fee of 0.25%. The plans provide that the C Class will pay ACIS an annual distribution and service fee of 1.00%, of which 0.25% is paid for individual shareholder services and 0.75% is paid for distribution services. The plans provide that the R Class will pay ACIS an annual distribution and service fee of 0.50%. The fees are computed and accrued daily based on each class’s daily net assets and paid monthly in arrears. The fees are used to pay financial intermediaries for distribution and individual shareholder services. Fees incurred under the plans during the year ended November 30, 2014 are detailed in the Statement of Operations.
Directors' Fees and Expenses — The Board of Directors is responsible for overseeing the investment advisor’s management and operations of the fund. The directors receive detailed information about the fund and its investment advisor regularly throughout the year, and meet at least quarterly with management of the investment advisor to review reports about fund operations. Fees and expenses incurred in conjunction with the directors during the year ended November 30, 2014 are detailed in the Statement of Operations. The fund’s officers do not receive compensation from the fund.
20
4. Investment Transactions
Purchases and sales of investment securities, excluding short-term investments, for the year ended November 30, 2014 were $36,474,153 and $33,922,544, respectively.
5. Capital Share Transactions
Transactions in shares of the fund were as follows:
Year ended November 30, 2014 | Year ended November 30, 2013(1) | |||||||||
| Shares | Amount | Shares | Amount | |||||||
| Investor Class/Shares Authorized | 20,000,000 | 20,000,000 | ||||||||
| Sold | 986,098 | $ | 9,072,889 | 966,244 | $ | 7,876,534 | ||||
| Issued in reinvestment of distributions | 36,672 | 328,583 | 43,565 | 336,754 | ||||||
| Redeemed | (880,533 | ) | (7,966,252 | ) | (420,477 | ) | (3,411,416 | ) | ||
| 142,237 | 1,435,220 | 589,332 | 4,801,872 | |||||||
| Institutional Class/Shares Authorized | 5,000,000 | 5,000,000 | ||||||||
| Sold | 201,824 | 1,819,795 | 52,897 | 452,810 | ||||||
| Issued in reinvestment of distributions | 4,736 | 42,388 | 1,147 | 8,858 | ||||||
| Redeemed | (234,722 | ) | (2,156,272 | ) | (60 | ) | (487 | ) | ||
| (28,162 | ) | (294,089 | ) | 53,984 | 461,181 | |||||
| A Class/Shares Authorized | 25,000,000 | 25,000,000 | ||||||||
| Sold | 301,668 | 2,766,714 | 354,167 | 2,849,895 | ||||||
| Issued in reinvestment of distributions | 33,692 | 303,228 | 47,564 | 370,051 | ||||||
| Redeemed | (335,290 | ) | (3,076,292 | ) | (580,391 | ) | (4,601,535 | ) | ||
| 70 | (6,350 | ) | (178,660 | ) | (1,381,589 | ) | ||||
| C Class/Shares Authorized | 10,000,000 | 10,000,000 | ||||||||
| Sold | 88,235 | 798,160 | 65,495 | 533,407 | ||||||
| Issued in reinvestment of distributions | 3,916 | 35,093 | 4,183 | 32,584 | ||||||
| Redeemed | (56,011 | ) | (523,901 | ) | (36,560 | ) | (295,562 | ) | ||
| 36,140 | 309,352 | 33,118 | 270,429 | |||||||
| R Class/Shares Authorized | 5,000,000 | 5,000,000 | ||||||||
| Sold | 22,582 | 204,058 | 4,680 | 37,488 | ||||||
| Issued in reinvestment of distributions | 731 | 6,548 | 1,014 | 7,869 | ||||||
| Redeemed | (2,479 | ) | (21,738 | ) | (10,888 | ) | (90,116 | ) | ||
| 20,834 | 188,868 | (5,194 | ) | (44,759 | ) | |||||
| R6 Class/Shares Authorized | 50,000,000 | 50,000,000 | ||||||||
| Sold | 150,184 | 1,387,273 | 3,045 | 25,000 | ||||||
| Issued in reinvestment of distributions | 66 | 593 | — | — | ||||||
| Redeemed | (90,317 | ) | (840,799 | ) | — | — | ||||
| 59,933 | 547,067 | 3,045 | 25,000 | |||||||
| Net increase (decrease) | 231,052 | $ | 2,180,068 | 495,625 | $ | 4,132,134 | ||||
| (1) | July 26, 2013 (commencement of sale) through November 30, 2013 for the R6 Class. |
21
6. Fair Value Measurements
The fund’s investments valuation process is based on several considerations and may use multiple inputs to determine the fair value of the investments held by the fund. In conformity with accounting principles generally accepted in the United States of America, the inputs used to determine a valuation are classified into three broad levels.
| • | Level 1 valuation inputs consist of unadjusted quoted prices in an active market for identical investments. |
| • | Level 2 valuation inputs consist of direct or indirect observable market data (including quoted prices for comparable investments, evaluations of subsequent market events, interest rates, prepayment speeds, credit risk, etc.). These inputs also consist of quoted prices for identical investments initially expressed in local currencies that are adjusted through translation into U.S. dollars. |
| • | Level 3 valuation inputs consist of unobservable data (including a fund’s own assumptions). |
The level classification is based on the lowest level input that is significant to the fair valuation measurement. The valuation inputs are not necessarily an indication of the risks associated with investing in these securities or other financial instruments. There were no significant transfers between levels during the period.
The following is a summary of the level classifications as of period end. The Schedule of Investments provides additional information on the fund’s portfolio holdings.
| Level 1 | Level 2 | Level 3 | ||||||
| Assets | ||||||||
| Investment Securities | ||||||||
| Common Stocks | — | $ | 37,753,972 | — | ||||
| Exchange-Traded Funds | $ | 301,392 | — | — | ||||
| Rights | — | 10,037 | — | |||||
| Temporary Cash Investments | — | 103,011 | — | |||||
| $ | 301,392 | $ | 37,867,020 | — | ||||
7. Risk Factors
There are certain risks involved in investing in foreign securities. These risks include those resulting from future adverse political, social and economic developments, fluctuations in currency exchange rates, the possible imposition of exchange controls, and other foreign laws or restrictions. Investing in emerging markets may accentuate these risks.
8. Federal Tax Information
On December 16, 2014, the fund declared and paid the following per-share distributions from net investment income to shareholders of record on December 15, 2014:
| Investor Class | Institutional Class | A Class | C Class | R Class | R6 Class |
| $0.3174 | $0.3306 | $0.3010 | $0.2516 | $0.2845 | $0.3404 |
The tax character of distributions paid during the years ended November 30, 2014 and November 30, 2013 were as follows:
| 2014 | 2013 | |||||
| Distributions Paid From | ||||||
| Ordinary income | $ | 728,238 | $ | 781,022 | ||
| Long-term capital gains | — | — | ||||
The book-basis character of distributions made during the year from net investment income or net realized gains may differ from their ultimate characterization for federal income tax purposes. These differences reflect the differing character of certain income items and net realized gains and losses for financial statement and tax purposes, and may result in reclassification among certain capital accounts on the financial statements.
22
As of November 30, 2014, the federal tax cost of investments and the components of distributable earnings on a tax-basis were as follows:
| Federal tax cost of investments | $ | 35,566,086 | |
| Gross tax appreciation of investments | $ | 4,021,717 | |
| Gross tax depreciation of investments | (1,419,391 | ) | |
| Net tax appreciation (depreciation) of investments | 2,602,326 | ||
| Net tax appreciation (depreciation) on translation of assets and liabilities in foreign currencies | (14,029 | ) | |
| Net tax appreciation (depreciation) | $ | 2,588,297 | |
| Undistributed ordinary income | $ | 1,465,758 | |
| Accumulated short-term capital losses | $ | (2,258,267 | ) |
| Post-October capital loss deferral | $ | (189,378 | ) |
The difference between book-basis and tax-basis unrealized appreciation (depreciation) is attributable primarily to the realization to ordinary income for tax purposes of unrealized gains on investments in passive foreign investment companies.
Accumulated capital losses represent net capital loss carryovers that may be used to offset future realized capital gains for federal income tax purposes. Future capital loss carryover utilization in any given year may be subject to Internal Revenue Code limitations. Capital loss carryovers expire in 2017.
Loss deferrals represent certain qualified losses that the fund has elected to treat as having been incurred in the following fiscal year for federal income tax purposes.
23
| Financial Highlights |
For a Share Outstanding Throughout the Years Ended November 30 (except as noted) | |||||||||||||
Per-Share Data | Ratios and Supplemental Data | ||||||||||||
Income From Investment Operations: | Ratio to Average Net Assets of: | ||||||||||||
Net Asset Value, Beginning of Period | Net Investment Income (Loss)(1) | Net Realized and Unrealized Gain (Loss) | Total From Investment Operations | Distributions From Net Investment Income | Net Asset Value, End of Period | Total Return(2) | Operating Expenses | Net Investment Income (Loss) | Portfolio Turnover Rate | Net Assets, End of Period (in thousands) | |||
| Investor Class | |||||||||||||
| 2014 | $8.97 | 0.32 | (0.19) | 0.13 | (0.19) | $8.91 | 1.38% | 1.30% | 3.55% | 89% | $19,068 | ||
| 2013 | $7.40 | 0.21 | 1.60 | 1.81 | (0.24) | $8.97 | 24.96% | 1.31% | 2.63% | 83% | $17,920 | ||
| 2012 | $6.84 | 0.20 | 0.49 | 0.69 | (0.13) | $7.40 | 10.25% | 1.31% | 2.95% | 125% | $10,423 | ||
| 2011 | $6.91 | 0.14 | (0.09) | 0.05 | (0.12) | $6.84 | 0.57% | 1.31% | 1.85% | 30% | $9,391 | ||
| 2010 | $7.33 | 0.11 | (0.24) | (0.13) | (0.29) | $6.91 | (1.82)% | 1.32% | 1.66% | 26% | $7,272 | ||
Institutional Class | |||||||||||||
| 2014 | $8.96 | 0.38 | (0.23) | 0.15 | (0.19) | $8.92 | 1.67% | 1.10% | 3.75% | 89% | $513 | ||
| 2013 | $7.39 | 0.23 | 1.59 | 1.82 | (0.25) | $8.96 | 25.24% | 1.11% | 2.83% | 83% | $769 | ||
| 2012 | $6.84 | 0.23 | 0.47 | 0.70 | (0.15) | $7.39 | 10.33% | 1.11% | 3.15% | 125% | $235 | ||
| 2011 | $6.90 | 0.15 | (0.07) | 0.08 | (0.14) | $6.84 | 0.92% | 1.11% | 2.05% | 30% | $244 | ||
| 2010 | $7.34 | 0.13 | (0.25) | (0.12) | (0.32) | $6.90 | (1.69)% | 1.12% | 1.86% | 26% | $1,456 | ||
24
For a Share Outstanding Throughout the Years Ended November 30 (except as noted) | |||||||||||||
Per-Share Data | Ratios and Supplemental Data | ||||||||||||
Income From Investment Operations: | Ratio to Average Net Assets of: | ||||||||||||
Net Asset Value, Beginning of Period | Net Investment Income (Loss)(1) | Net Realized and Unrealized Gain (Loss) | Total From Investment Operations | Distributions From Net Investment Income | Net Asset Value, End of Period | Total Return(2) | Operating Expenses | Net Investment Income (Loss) | Portfolio Turnover Rate | Net Assets, End of Period (in thousands) | |||
A Class | |||||||||||||
| 2014 | $9.01 | 0.30 | (0.20) | 0.10 | (0.18) | $8.93 | 1.08% | 1.55% | 3.30% | 89% | $15,423 | ||
| 2013 | $7.43 | 0.20 | 1.60 | 1.80 | (0.22) | $9.01 | 24.67% | 1.56% | 2.38% | 83% | $15,554 | ||
| 2012 | $6.87 | 0.19 | 0.48 | 0.67 | (0.11) | $7.43 | 9.91% | 1.56% | 2.70% | 125% | $14,155 | ||
| 2011 | $6.93 | 0.12 | (0.08) | 0.04 | (0.10) | $6.87 | 0.45% | 1.56% | 1.60% | 30% | $13,981 | ||
| 2010 | $7.33 | 0.10 | (0.24) | (0.14) | (0.26) | $6.93 | (2.04)% | 1.57% | 1.41% | 26% | $15,783 | ||
C Class | |||||||||||||
| 2014 | $8.97 | 0.23 | (0.19) | 0.04 | (0.16) | $8.85 | 0.41% | 2.30% | 2.55% | 89% | $2,301 | ||
| 2013 | $7.40 | 0.14 | 1.59 | 1.73 | (0.16) | $8.97 | 23.68% | 2.31% | 1.63% | 83% | $2,009 | ||
| 2012 | $6.84 | 0.13 | 0.49 | 0.62 | (0.06) | $7.40 | 9.10% | 2.31% | 1.95% | 125% | $1,412 | ||
| 2011 | $6.90 | 0.06 | (0.08) | (0.02) | (0.04) | $6.84 | (0.31)% | 2.31% | 0.85% | 30% | $1,137 | ||
| 2010 | $7.25 | 0.05 | (0.25) | (0.20) | (0.15) | $6.90 | (2.85)% | 2.32% | 0.66% | 26% | $1,039 | ||
R Class | |||||||||||||
| 2014 | $8.97 | 0.28 | (0.21) | 0.07 | (0.17) | $8.87 | 0.78% | 1.80% | 3.05% | 89% | $479 | ||
| 2013 | $7.40 | 0.18 | 1.59 | 1.77 | (0.20) | $8.97 | 24.32% | 1.81% | 2.13% | 83% | $297 | ||
| 2012 | $6.84 | 0.17 | 0.49 | 0.66 | (0.10) | $7.40 | 9.67% | 1.81% | 2.45% | 125% | $283 | ||
| 2011 | $6.90 | 0.10 | (0.08) | 0.02 | (0.08) | $6.84 | 0.20% | 1.81% | 1.35% | 30% | $234 | ||
| 2010 | $7.28 | 0.09 | (0.25) | (0.16) | (0.22) | $6.90 | (2.27)% | 1.82% | 1.16% | 26% | $273 | ||
25
For a Share Outstanding Throughout the Years Ended November 30 (except as noted) | |||||||||||||
Per-Share Data | Ratios and Supplemental Data | ||||||||||||
Income From Investment Operations: | Ratio to Average Net Assets of: | ||||||||||||
Net Asset Value, Beginning of Period | Net Investment Income (Loss)(1) | Net Realized and Unrealized Gain (Loss) | Total From Investment Operations | Distributions From Net Investment Income | Net Asset Value, End of Period | Total Return(2) | Operating Expenses | Net Investment Income (Loss) | Portfolio Turnover Rate | Net Assets, End of Period (in thousands) | |||
| R6 Class | |||||||||||||
| 2014 | $8.96 | 0.33 | (0.17) | 0.16 | (0.19) | $8.93 | 1.83% | 0.95% | 3.90% | 89% | $562 | ||
2013(3) | $8.21 | 0.06 | 0.69 | 0.75 | — | $8.96 | 9.14% | 0.96%(4) | 2.02%(4) | 83%(5) | $27 | ||
| Notes to Financial Highlights |
| (1) | Computed using average shares outstanding throughout the period. |
| (2) | Total returns are calculated based on the net asset value of the last business day and do not reflect applicable sales charges, if any. Total returns for periods less than one year are not annualized. |
| (3) | July 26, 2013 (commencement of sale) through November 30, 2013. |
| (4) | Annualized. |
| (5) | Portfolio turnover is calculated at the fund level. Percentage indicated was calculated for the year ended November 30, 2013. |
See Notes to Financial Statements.
26
| Report of Independent Registered Public Accounting Firm |
To the Board of Directors and Shareholders of
American Century World Mutual Funds, Inc.:
We have audited the accompanying statement of assets and liabilities, including the schedule of investments, of International Value Fund (the “Fund”), one of the funds constituting American Century World Mutual Funds, Inc., as of November 30, 2014, and the related statement of operations for the year then ended, the statements of changes in net assets for each of the two years in the period then ended, and the financial highlights for each of the periods presented. These financial statements and financial highlights are the responsibility of the Fund's management. Our responsibility is to express an opinion on these financial statements and financial highlights based on our audits.
We conducted our audits in accordance with the standards of the Public Company Accounting Oversight Board (United States). Those standards require that we plan and perform the audit to obtain reasonable assurance about whether the financial statements and financial highlights are free of material misstatement. The Fund is not required to have, nor were we engaged to perform, an audit of its internal control over financial reporting. Our audits included consideration of internal control over financial reporting as a basis for designing audit procedures that are appropriate in the circumstances, but not for the purpose of expressing an opinion on the effectiveness of the Fund's internal control over financial reporting. Accordingly, we express no such opinion. An audit also includes examining, on a test basis, evidence supporting the amounts and disclosures in the financial statements, assessing the accounting principles used and significant estimates made by management, as well as evaluating the overall financial statement presentation. Our procedures included confirmation of securities owned as of November 30, 2014, by correspondence with the custodian and brokers; where replies were not received from brokers, we performed other auditing procedures. We believe that our audits provide a reasonable basis for our opinion.
In our opinion, the financial statements and financial highlights referred to above present fairly, in all material respects, the financial position of International Value Fund of American Century World Mutual Funds, Inc. as of November 30, 2014, the results of its operations for the year then ended, the changes in its net assets for each of the two years in the period then ended, and the financial highlights for each of the periods presented, in conformity with accounting principles generally accepted in the United States of America.
DELOITTE & TOUCHE LLP
Kansas City, Missouri
January 16, 2015
27
| Management |
The Board of Directors
The individuals listed below serve as directors of the funds. Each director will continue to serve in this capacity until death, retirement, resignation or removal from office. The board has adopted a mandatory retirement age for directors who are not “interested persons,” as that term is defined in the Investment Company Act (independent directors). Independent directors shall retire by December 31 of the year in which they reach their 75th birthday.
Mr. Thomas is an “interested person” because he currently serves as President and Chief Executive Officer of American Century Companies, Inc. (ACC), the parent company of American Century Investment Management, Inc. (ACIM or the advisor). Mr. Fink is treated as an “interested person” because of his recent employment with ACC and American Century Services, LLC (ACS). The other directors (more than three-fourths of the total number) are independent. They are not employees, directors or officers of, and have no financial interest in, ACC or any of its wholly owned, direct or indirect, subsidiaries, including ACIM, American Century Investment Services, Inc. (ACIS) and ACS, and they do not have any other affiliations, positions or relationships that would cause them to be considered “interested persons” under the Investment Company Act. The directors serve in this capacity for seven (in the case of Mr. Thomas, 15) registered investment companies in the American Century Investments family of funds.
The following table presents additional information about the directors. The mailing address for each director is 4500 Main Street, Kansas City, Missouri 64111.
Name (Year of Birth) | Position(s) Held with Funds | Length of Time Served | Principal Occupation(s) During Past 5 Years | Number of American Century Portfolios Overseen by Director | Other Directorships Held During Past 5 Years |
| Independent Directors | |||||
Thomas A. Brown (1940) | Director | Since 1980 | Managing Member, Associated Investments, LLC (real estate investment company); Brown Cascade Properties, LLC (real estate investment company) (2001 to 2009) | 73 | None |
Andrea C. Hall (1945) | Director | Since 1997 | Retired | 73 | None |
Jan M. Lewis (1957) | Director | Since 2011 | Retired; President and Chief Executive Officer, Catholic Charities of Northeast Kansas (human services organization) (2006 to 2013) | 73 | None |
James A. Olson (1942) | Director and Chairman of the Board | Since 2007 (Chairman since 2014) | Member, Plaza Belmont LLC (private equity fund manager) | 73 | Saia, Inc. (2002 to 2012) and EPR Properties (2003 to 2013) |
28
Name (Year of Birth) | Position(s) Held with Funds | Length of Time Served | Principal Occupation(s) During Past 5 Years | Number of American Century Portfolios Overseen by Director | Other Directorships Held During Past 5 Years |
| Independent Directors | |||||
M. Jeannine Strandjord (1945) | Director | Since 1994 | Retired | 73 | Euronet Worldwide Inc.; MGP Ingredients, Inc.; Charming Shoppes, Inc. (2006 to 2010); and DST Systems Inc. (1996 to 2012) |
John R. Whitten (1946) | Director | Since 2008 | Retired | 73 | Rudolph Technologies, Inc. |
Stephen E. Yates (1948) | Director | Since 2012 | Retired; Executive Vice President, Technology & Operations, KeyCorp. (computer services) (2004 to 2010) | 73 | Applied Industrial Technologies, Inc. (2001 to 2010) |
| Interested Directors | |||||
Barry Fink (1955) | Director | Since 2012 | Retired; Executive Vice President, ACC (September 2007 to February 2013); President, ACS (October 2007 to February 2013); Chief Operating Officer, ACC (September 2007 to November 2012) | 73 | None |
Jonathan S. Thomas (1963) | Director and President | Since 2007 | President and Chief Executive Officer, ACC (March 2007 to present). Also serves as Chief Executive Officer, ACS; Executive Vice President, ACIM; Director, ACC, ACIM and other ACC subsidiaries | 118 | BioMed Valley Discoveries, Inc. |
The Statement of Additional Information has additional information about the fund's directors and is available without charge, upon request, by calling 1-800-345-2021.
29
Officers
The following table presents certain information about the executive officers of the funds. Each officer serves as an officer for each of the 15 investment companies in the American Century family of funds, unless otherwise noted. No officer is compensated for his or her service as an officer of the funds. The listed officers are interested persons of the funds and are appointed or re-appointed on an annual basis. The mailing address for each officer listed below is 4500 Main Street, Kansas City, Missouri 64111.
Name (Year of Birth) | Offices with the Funds | Principal Occupation(s) During the Past Five Years |
Jonathan S. Thomas (1963) | Director and President since 2007 | President and Chief Executive Officer, ACC (March 2007 to present). Also serves as Chief Executive Officer, ACS; Executive Vice President, ACIM; Director, ACC, ACIM and other ACC subsidiaries |
Amy D. Shelton (1964) | Chief Compliance Officer and Vice President since 2014 | Chief Compliance Officer, American Century funds, (March 2014 to present); Chief Compliance Officer, ACIM (February 2014 to present); Chief Compliance Officer, ACIS (October 2009 to present); Vice President, Client Interactions and Marketing, ACIS (February 2013 to January 2014); Director, Client Interactions and Marketing, ACIS (June 2007 to January 2013). Also serves as Vice President, ACIS |
Charles A. Etherington (1957) | General Counsel since 2007 and Senior Vice President since 2006 | Attorney, ACC (February 1994 to present); Vice President, ACC (November 2005 to present); General Counsel, ACC (March 2007 to present). Also serves as General Counsel, ACIM, ACS, ACIS and other ACC subsidiaries; and Senior Vice President, ACIM and ACS |
C. Jean Wade (1964) | Vice President, Treasurer and Chief Financial Officer since 2012 | Vice President, ACS (February 2000 to present) |
Robert J. Leach (1966) | Vice President since 2006 and Assistant Treasurer since 2012 | Vice President, ACS (February 2000 to present) |
David H. Reinmiller (1963) | Vice President since 2000 | Attorney, ACC (January 1994 to present); Associate General Counsel, ACC (January 2001 to present). Also serves as Vice President, ACIM and ACS |
Ward D. Stauffer (1960) | Secretary since 2005 | Attorney, ACC (June 2003 to present) |
30
| Approval of Management Agreement |
At a meeting held on June 18, 2014, the Fund’s Board of Directors unanimously approved the renewal of the management agreement pursuant to which American Century Investment Management, Inc. (the “Advisor”) acts as the investment advisor for the Fund. Under Section 15(c) of the Investment Company Act, contracts for investment advisory services are required to be reviewed, evaluated, and approved by a majority of a fund’s directors (the “Directors”), including a majority of the independent Directors, each year.
Prior to its consideration of the renewal of the management agreement, the Board requested and reviewed extensive data and information compiled by the Advisor and certain independent providers of evaluation data concerning the Fund and the services provided to the Fund by the Advisor. This review was in addition to the oversight and evaluation undertaken by the Board and its committees on a continuous basis and the information received was supplemental to the extensive information that the Board and its committees receive and consider throughout the year.
In connection with its consideration of the renewal of the management agreement, the Board’s review and evaluation of the services provided by the Advisor included, but was not limited to, the following:
| • | the nature, extent, and quality of investment management, shareholder services, and other services provided by the Advisor to the Fund; |
| • | the wide range of other programs and services the Advisor provides to the Fund and its shareholders on a routine and non-routine basis; |
| • | the Fund’s investment performance compared to appropriate benchmarks and/or a peer group of other mutual funds with similar investment objectives and strategies; |
| • | the cost of owning the Fund compared to the cost of owning similar funds; |
| • | the Advisor’s compliance policies, procedures, and regulatory experience; |
| • | financial data showing the cost of services provided to the Fund, the profitability of the Fund to the Advisor, and the overall profitability of the Advisor; |
| • | possible economies of scale associated with the Advisor’s management of the Fund and other accounts under its management; |
| • | the services provided and charges to other investment management clients of the Advisor; |
| • | acquired fund fees and expenses; and |
| • | any collateral benefits derived by the Advisor from the management of the Fund. |
In keeping with its practice, the Board held two in-person meetings and one telephonic meeting to review and discuss the information provided. The independent Directors also had the benefit of the advice of their independent counsel throughout the process.
Factors Considered
The Directors considered all of the information provided by the Advisor, the independent data providers, and independent counsel, and evaluated such information for the Fund. In connection with their review, the Directors did not identify any single factor as being all-important or controlling, and each Director may have attributed different levels of importance to different factors. In deciding to renew the management agreement, the Board based its decision on a number of factors, including the following:
31
Nature, Extent and Quality of Services — Generally. Under the management agreement, the Advisor is responsible for providing or arranging for all services necessary for the operation of the Fund. The Board noted that under the management agreement, the Advisor provides or arranges at its own expense a wide variety of services including:
| • | constructing and designing the Fund |
| • | portfolio research and security selection |
| • | initial capitalization/funding |
| • | securities trading |
| • | Fund administration |
| • | custody of Fund assets |
| • | daily valuation of the Fund’s portfolio |
| • | shareholder servicing and transfer agency, including shareholder confirmations, recordkeeping, and communications |
| • | legal services (except the independent Directors’ counsel) |
| • | regulatory and portfolio compliance |
| • | financial reporting |
| • | marketing and distribution (except Rule 12b-1 plans) |
The Board noted that many of these services have expanded over time both in terms of quantity and complexity in response to shareholder demands, competition in the industry, changing distribution channels, and the changing regulatory environment.
Investment Management Services. The nature of the investment management services provided to the Fund is quite complex and allows Fund shareholders access to professional money management, instant diversification of their investments within an asset class, the opportunity to easily diversify among asset classes by investing in or exchanging among various American Century Investments funds, and liquidity. In evaluating investment performance, the Board expects the Advisor to manage the Fund in accordance with its investment objectives and approved strategies. Further, the Directors recognize that the Advisor has an obligation to monitor trading activities, and in particular to seek the best execution of fund trades, and to evaluate the use of and payment for research. In providing these services, the Advisor utilizes teams of investment professionals (portfolio managers, analysts, research assistants, and securities traders) who require extensive information technology, research, training, compliance and other systems to conduct their business. The Board, directly and through its Fund Performance Review Committee, regularly reviews investment performance information for the Fund, together with comparative information for appropriate benchmarks and/or peer groups of similarly-managed funds, over different time horizons. The Directors also review detailed performance information during the management agreement approval process. If performance concerns are identified, the Fund receives special reviews until performance improves, during which the Board discusses with the Advisor the reasons for such results (e.g., market conditions, security selection) and any efforts being undertaken to improve performance. The Fund’s performance was above its benchmark for the one-, three-, five-, and ten-year periods reviewed by the Board. The Board found the investment management services provided by the Advisor to the Fund to be satisfactory and consistent with the management agreement.
Shareholder and Other Services. Under the management agreement, the Advisor provides the Fund with a comprehensive package of transfer agency, shareholder, and other services. The Board, directly and through various committees of the Board, regularly reviews reports and evaluations of such services at its regular meetings. These reports include, but are not limited to, information regarding the operational efficiency and accuracy of the shareholder and transfer agency services provided, staffing levels, shareholder satisfaction (as measured by external as well as internal sources), technology support, new products and services offered to Fund shareholders, securities trading activities, portfolio valuation services, auditing services, and legal and operational compliance activities. Certain aspects of shareholder and transfer agency service level efficiency and the quality of securities trading activities are measured by independent third party providers and are presented in comparison to other fund groups not managed by the Advisor. The Board
32
found the services provided by the Advisor to the Fund under the management agreement to be competitive and of high quality.
Costs of Services and Profitability. The Advisor provides detailed information concerning its cost of providing various services to the Fund, its profitability in managing the Fund (pre- and post-distribution), its overall profitability, and its financial condition. The Directors have reviewed with the Advisor the methodology used to prepare this financial information. The financial information regarding the Advisor is considered in evaluating the Advisor’s financial condition, its ability to continue to provide services under the management agreement, and the reasonableness of the current management fee. The Board concluded that the Advisor’s profits were reasonable in light of the services provided to the Fund.
Ethics. The Board generally considers the Advisor’s commitment to providing quality services to shareholders and to conducting its business ethically. They noted that the Advisor’s practices generally meet or exceed industry best practices.
Economies of Scale. The Board also reviewed information provided by the Advisor regarding the possible existence of economies of scale in connection with the management of the Fund. The Board concluded that economies of scale are difficult to measure and predict with precision, especially on a fund-by-fund basis. The Board concluded that the Advisor is appropriately sharing economies of scale through its competitive fee structure, offering competitive fees from fund inception, and through reinvestment in its business to provide shareholders additional content and services.
Comparison to Other Funds’ Fees. The management agreement provides that the Fund pays the Advisor a single, all-inclusive (or unified) management fee for providing all services necessary for the management and operation of the Fund, other than brokerage expenses, taxes, interest, extraordinary expenses, and the fees and expenses of the Fund’s independent directors (including their independent legal counsel) and expenses incurred in connection with the provision of shareholder services and distribution services under a plan adopted pursuant to Rule 12b-1 under the 1940 Act. Under the unified fee structure, the Advisor is responsible for providing all investment advisory, custody, audit, administrative, compliance, recordkeeping, marketing and shareholder services, or arranging and supervising third parties to provide such services. By contrast, most other funds are charged a variety of fees, including an investment advisory fee, a transfer agency fee, an administrative fee, distribution charges and other expenses. Other than their investment advisory fees and any applicable Rule 12b-1 distribution fees, all other components of the total fees charged by these other funds may be increased without shareholder approval. The Board believes the unified fee structure is a benefit to Fund shareholders because it clearly discloses to shareholders the cost of owning Fund shares, and, since the unified fee cannot be increased without a vote of Fund shareholders, it shifts to the Advisor the risk of increased costs of operating the Fund and provides a direct incentive to minimize administrative inefficiencies. Part of the Board’s analysis of fee levels involves reviewing certain evaluative data compiled by an independent provider comparing the Fund’s unified fee to the total expense ratios of its peers. The unified fee charged to shareholders of the Fund was below the median of the total expense ratios of the Fund’s peer expense universe and was within the range of its peer expense group. The Board concluded that the management fee paid by the Fund to the Advisor under the management agreement is reasonable in light of the services provided to the Fund.
Comparison to Fees and Services Provided to Other Clients of the Advisor. The Board also requested and received information from the Advisor concerning the nature of the services, fees, costs and profitability of its advisory services to advisory clients other than the Fund. They observed that these varying types of client accounts require different services and involve different regulatory and entrepreneurial risks than the management of the Fund. The Board analyzed this information and concluded that the fees charged and services provided to the Fund were reasonable by comparison.
33
Collateral or “Fall-Out” Benefits Derived by the Advisor. The Board considered the existence of collateral benefits the Advisor may receive as a result of its relationship with the Fund. They concluded that the Advisor’s primary business is managing mutual funds and it generally does not use fund or shareholder information to generate profits in other lines of business, and therefore does not derive any significant collateral benefits from them. The Board noted that the Advisor receives proprietary research from broker-dealers that execute fund portfolio transactions and concluded that this research is likely to benefit Fund shareholders. The Board also determined that the Advisor is able to provide investment management services to certain clients other than the Fund, at least in part, due to its existing infrastructure built to serve the fund complex. The Board concluded, however, that the assets of those other clients are not material to the analysis and, where applicable, may be included with the assets of the Fund to determine breakpoints in the management fee schedule.
Existing Relationship. The Board also considered whether there was any reason for not continuing the existing arrangement with the Advisor. In this regard, the Board was mindful of the potential disruptions of the Fund’s operations and various risks, uncertainties, and other effects that could occur as a result of a decision not to continue such relationship. In particular, the Board recognized that most shareholders have invested in the Fund on the strength of the Advisor’s industry standing and reputation and in the expectation that the Advisor will have a continuing role in providing advisory services to the Fund.
Conclusion of the Directors. As a result of this process, the Board, including all of the independent Directors, taking into account all of the factors discussed above and the information provided by the Advisor and others, concluded that the management agreement between the Fund and the Advisor is fair and reasonable in light of the services provided and should be renewed.
34
| Additional Information |
Retirement Account Information
As required by law, distributions you receive from certain IRAs are subject to federal income tax withholding, unless you elect not to have withholding apply. Tax will be withheld on the total amount withdrawn even though you may be receiving amounts that are not subject to withholding, such as nondeductible contributions. In such case, excess amounts of withholding could occur. You may adjust your withholding election so that a greater or lesser amount will be withheld.
If you don’t want us to withhold on this amount, you must notify us to not withhold the federal income tax. You may notify us in writing or in certain situations by telephone or through other electronic means. For systematic withdrawals, your withholding election will remain in effect until revoked or changed by filing a new election. You have the right to revoke your election at any time.
Remember, even if you elect not to have income tax withheld, you are liable for paying income tax on the taxable portion of your withdrawal. If you elect not to have income tax withheld or you don’t have enough income tax withheld, you may be responsible for payment of estimated tax. You may incur penalties under the estimated tax rules if your withholding and estimated tax payments are not sufficient. You can reduce or defer the income tax on a distribution by directly or indirectly rolling such distribution over to another IRA or eligible plan. You should consult your tax advisor for additional information.
State tax will be withheld if, at the time of your distribution, your address is within one of the mandatory withholding states and you have federal income tax withheld (or as otherwise required by state law). State taxes will be withheld from your distribution in accordance with the respective state rules.
Distributions you receive from 403(b), 457 and qualified plans are subject to special tax and withholding rules. Your plan administrator or plan sponsor is required to provide you with a special tax notice explaining those rules at the time you request a distribution. If applicable, federal and/or state taxes may be withheld from your distribution amount.
Proxy Voting Policies
A description of the policies that the fund's investment advisor uses in exercising the voting rights associated with the securities purchased and/or held by the fund is available without charge, upon request, by calling 1-800-345-2021. It is also available on the "About Us" page of American Century Investments’ website at americancentury.com and on the Securities and Exchange Commission’s website at sec.gov. Information regarding how the investment advisor voted proxies relating to portfolio securities during the most recent 12-month period ended June 30 is available on the "About Us" page at americancentury.com. It is also available at sec.gov.
Quarterly Portfolio Disclosure
The fund files its complete schedule of portfolio holdings with the Securities and Exchange Commission (SEC) for the first and third quarters of each fiscal year on Form N-Q. The fund’s Forms N-Q are available on the SEC’s website at sec.gov, and may be reviewed and copied at the SEC’s Public Reference Room in Washington, DC. Information on the operation of the Public Reference Room may be obtained by calling 1-800-SEC-0330. The fund also makes its complete schedule of portfolio holdings for the most recent quarter of its fiscal year available on its
website at americancentury.com and, upon request, by calling 1-800-345-2021.
35
Other Tax Information
The following information is provided pursuant to provisions of the Internal Revenue Code.
The fund hereby designates up to the maximum amount allowable as qualified dividend income for the fiscal year ended November 30, 2014.
For the fiscal year ended November 30, 2014, the fund intends to pass through to shareholders $127,355, or up to the maximum amount allowable, as a foreign tax credit which represents taxes paid on income derived from sources within foreign countries or possessions of the United States. During the fiscal year ended November 30, 2014, the fund earned $1,754,162 from income derived from foreign sources. Foreign source income and foreign tax expense per outstanding share on November 30, 2014 are $0.4077 and $0.0296, respectively.
36
| ||
| Contact Us | americancentury.com | |
| Automated Information Line | 1-800-345-8765 | |
| Investor Services Representative | 1-800-345-2021 or 816-531-5575 | |
| Investors Using Advisors | 1-800-378-9878 | |
| Business, Not-For-Profit, Employer-Sponsored Retirement Plans | 1-800-345-3533 | |
| Banks and Trust Companies, Broker-Dealers, Financial Professionals, Insurance Companies | 1-800-345-6488 | |
| Telecommunications Relay Service for the Deaf | 711 | |
| American Century World Mutual Funds, Inc. | ||
Investment Advisor: American Century Investment Management, Inc. Kansas City, Missouri | ||
| This report and the statements it contains are submitted for the general information of our shareholders. The report is not authorized for distribution to prospective investors unless preceded or accompanied by an effective prospectus. | ||
| ©2015 American Century Proprietary Holdings, Inc. All rights reserved. CL-ANN-84130 1501 | ||
ANNUAL REPORT | NOVEMBER 30, 2014 |
NT Emerging Markets Fund
| Table of Contents |
| President’s Letter | |
| Performance | |
| Portfolio Commentary | |
| Fund Characteristics | |
| Shareholder Fee Example | |
| Schedule of Investments | |
| Statement of Assets and Liabilities | |
| Statement of Operations | |
| Statement of Changes in Net Assets | |
| Notes to Financial Statements | |
| Financial Highlights | |
| Report of Independent Registered Public Accounting Firm | |
| Management | |
| Approval of Management Agreement | |
| Additional Information | |
Any opinions expressed in this report reflect those of the author as of the date of the report, and do not necessarily represent the opinions of American Century Investments® or any other person in the American Century Investments organization. Any such opinions are subject to change at any time based upon market or other conditions and American Century Investments disclaims any responsibility to update such opinions. These opinions may not be relied upon as investment advice and, because investment decisions made by American Century Investments funds are based on numerous factors, may not be relied upon as an indication of trading intent on behalf of any American Century Investments fund. Security examples are used for representational purposes only and are not intended as recommendations to purchase or sell securities. Performance information for comparative indices and securities is provided to American Century Investments by third party vendors. To the best of American Century Investments’ knowledge, such information is accurate at the time of printing.
| President’s Letter |
| Dear Investor: Thank you for reviewing this annual report for the 12 months ended November 30, 2014. It provides investment performance and portfolio information for the reporting period, plus longer-term historical performance data. Annual reports remain important vehicles for conveying information about fund returns, including market and economic factors that affected performance during the reporting period. For additional, updated investment and market insights, we encourage you to visit our website, americancentury.com. |
| Jonathan Thomas | |
Favorable Fiscal Year for U.S. Investments, While Non-U.S. Lagged
“Global divergence” between the U.S. and the rest of the world emerged as a prevalent theme during the reporting period. As 2014 approached its conclusion, the U.S. appeared to be on a different economic and monetary policy track than most other nations. This theme covered not only the stronger economic growth enjoyed by the U.S. compared with the rest of the world, but also the related contrast between the U.S. Federal Reserve’s unwinding of monetary stimulus versus the continuation and expansion of monetary stimulus by most other central banks.
Global divergence could also generally describe the broad difference between investment returns for U.S. and non-U.S. markets. The perceived strength, safe-haven qualities, and higher yields of U.S. investments attracted global demand. For the reporting period, the S&P 500 Index, the Barclays U.S. Aggregate Bond Index, and the U.S. Dollar Index returned 16.86%, 5.27%, and 9.34%, respectively. By contrast, for U.S. investors unhedged for currency exposure (the dollar’s strength reduced the returns of non-dollar-denominated securities when they were converted to dollars), the MSCI EAFE Index, the MSCI Emerging Markets Index, and the Barclays Global Aggregate Bond Index (ex-USD, unhedged) returned -0.02%, 1.06%, and -2.53%, respectively.
We expect global divergence in economic growth and monetary policies to continue well into 2015, aligned with expectations that the Federal Reserve might finally start raising short-term U.S. interest rates. However, global economic weakness (reflected in recent commodity price declines) and low inflation might delay the rate hikes until the second half of 2015. In this environment, we continue to believe in a disciplined, diversified, long-term investment approach, using professionally managed stock and bond portfolios to meet financial goals. We appreciate your continued trust in us.
Sincerely,
Jonathan Thomas
President and Chief Executive Officer
American Century Investments
2
| Performance |
| Total Returns as of November 30, 2014 | |||||
Average Annual Returns | |||||
Ticker Symbol | 1 year | 5 years | Since Inception | Inception Date | |
| Institutional Class | ACLKX | 2.02%(1) | 4.34%(1) | 3.50%(1) | 5/12/06 |
MSCI Emerging Markets Index | — | 1.06% | 3.54% | 4.32% | — |
| R6 Class | ACKDX | 2.11%(1) | — | 7.44%(1) | 7/26/13 |
| (1) | Returns would have been lower if a portion of the management fee had not been waived. |
| Growth of $10,000 Over Life of Class |
| $10,000 investment made May 12, 2006 |
| Performance for other share classes will vary due to differences in fee structure. |
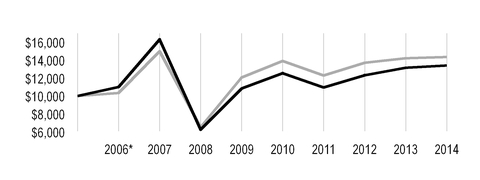
| Value on November 30, 2014 | |
| Institutional Class — $13,426** | |
| MSCI Emerging Markets Index — $14,361 | |
*From May 12, 2006, the Institutional Class’s inception date. Not annualized.
**Ending value would have been lower if a portion of the management fee had not been waived.
Total Annual Fund Operating Expenses | |
| Institutional Class | R6 Class |
| 1.53% | 1.38% |
The total annual fund operating expenses shown is as stated in the fund’s prospectus current as of the date of this report. The prospectus may vary from the expense ratio shown elsewhere in this report because it is based on a different time period, includes acquired fund fees and expenses, and, if applicable, does not include fee waivers or expense reimbursements.
Data presented reflect past performance. Past performance is no guarantee of future results. Current performance may be higher or lower than the performance shown. Investment return and principal value will fluctuate, and redemption value may be more or less than original cost. Data assumes reinvestment of dividends and capital gains, and none of the charts reflect the deduction of taxes that a shareholder would pay on fund distributions or the redemption of fund shares. To obtain performance data current to the most recent month end, please call 1-800-345-2021 or visit americancentury.com. For additional information about the fund, please consult the prospectus.
3
| Portfolio Commentary |
Portfolio Managers: Patricia Ribeiro and Anthony Han
Performance Summary
NT Emerging Markets advanced 2.02%* for the 12 months ended November 30, 2014. The portfolio’s benchmark, the MSCI Emerging Markets Index, advanced 1.06% for the same period.
Emerging markets stocks struggled with sluggish global growth and an overall volatile backdrop, which contributed to weak 12-month performance for the broad benchmark. Early in the period, stocks in developing countries generally slumped on news the U.S. Federal Reserve (the Fed) would gradually unwind its massive bond-buying program, which had helped buoy investments in emerging nations. But, emerging markets investors slowly grew more comfortable with waning quantitative easing from the Fed, as other leading central banks, including the European Central Bank (ECB) and the Bank of Japan (BOJ), maintained aggressive stimulus programs. Optimism about improving U.S. economic growth and continued accommodations from other central banks helped spark a strong rally among emerging market stocks during the second calendar quarter of 2014. That rally was short-lived, though, as concerns about divergence in central bank policy and global economic growth took center stage. A continued slowdown in China’s economic growth outlook also weighed on the broad emerging markets benchmark.
Political unrest also triggered volatility within the emerging markets. In particular, the ongoing Russia-Ukraine conflict; a military coup in Thailand; numerous election-related uncertainties, particularly in Brazil; mounting turmoil throughout the Middle East; and pro-democracy protests in Hong Kong pressured stocks. Not all the political news was negative, though, as voters in India elected a pro-business prime minister. Meanwhile, commodity prices (particularly oil) plunged, driving down stocks in many emerging market nations, and the U.S. dollar soared, stifling currency values throughout much of the developing world.
The fund outperformed its benchmark during the period, primarily due to positioning in the information technology, materials, and financials sectors. Regionally, stock selection and underweight positions in Brazil and South Korea, along with stock selection in South Africa, also contributed to the fund’s outperformance.
Internet Company Was a Top Contributor
Within the top-performing information technology sector, the internet and software services industry was a leading contributor. An overweight position in China’s Tencent Holdings, one of the largest holdings in the portfolio, drove the fund’s performance in that industry. The company, which offers interactive games, instant messaging, videos, and other services, benefited from the growth of internet-related services in China.
In addition, within the South Korean market, an overweight position in CJ Korea Express, a logistics firm, was among the fund’s top contributors. The company experienced strong growth and increasing market share with the recovery in its parcel delivery business, largely stemming from growth in online shopping. The company also reported improving margins due to cost savings. Furthermore, a rival firm’s switch to weekday-only delivery further supported the stock.
* All fund returns referenced in this commentary are for Institutional Class shares. Returns would have been lower if a portion of the management fee had not been waived. Performance for other share classes will vary due to differences in fee structure; when Institutional Class performance exceeds that of the fund's benchmark, other share classes may not. See page 3 for returns for all share classes.
4
Growth in online shopping also boosted China-based Vipshop Holdings. A portfolio-only position in the company was among the fund’s top contributors for the 12-month period. Growing consumer demand for quality goods, insufficient purchasing channels, and lack of promotional discounts for foreign brands in China have led to a rapidly growing online shopping market. As China’s leading online discount retailer for brands through flash sales, Vipshop has benefited from this trend.
India, China, Russia Were Main Detractors
Stock selection and underweight positions in India, China, and Russia detracted from relative results. In terms of sector exposure, stock selection in the energy, industrials, and utilities sectors weighed on the fund’s relative performance. An overweight position in industrials and an underweight in utilities also detracted from results.
An overweight position in China Oilfield Services was among the largest performance detractors. The China-based company, which specializes in deepwater drilling, retreated early in the period, as weak results from Western markets lowered demand and hurt pricing for its services. The company also projected 2014 revenues would grow at a lower rate than in recent quarters. As the period progressed, the company’s stock suffered further due to tumbling oil prices. We exited the position.
A portfolio-only position in Turkey’s Pegasus Hava Tasimaciligi, a low-cost airline, also was among the largest detractors for the period. Competitor Turkish Airlines moved capacity from Istanbul Atatürk International Airport to the smaller airport in Istanbul, Sabiha Gokcen International Airport, which is Pegasus’ main hub. This move created more competition for Pegasus in its domestic routes, affecting yields and driving down the company’s stock price.
A portfolio-only position in Russia’s Mail.ru Group also detracted from fund performance. The company, which provides various online communication products and entertainment services for Russian speakers worldwide, announced a 2014 revenue outlook below analyst expectations given the macroeconomic slowdown. Furthermore, Russia’s actions in Ukraine prompted many investors to exit Russian stocks given heightened geopolitical risks. We sold the fund's position in the company.
Outlook
In managing the fund, our primary emphasis is at the company level, where we invest in firms we believe have considerable earnings acceleration potential. That said, we believe slower growth in China will present challenges for Asia and emerging markets commodity producers more broadly. However, we also believe lower oil prices should support many emerging markets by reducing import prices and restraining inflation. Furthermore, global liquidity received another boost late in the period, as the BOJ, and to a lesser extent the ECB, expanded their stimulus efforts. Growth in the U.S. has held up relatively well without pushing inflation higher, largely due to a stronger dollar and falling oil prices. We believe this presents an ideal combination for emerging markets, as it reduces the pressure on the Fed to aggressively hike rates.
5
| Fund Characteristics |
| NOVEMBER 30, 2014 | |
Top Ten Holdings | % of net assets |
| Taiwan Semiconductor Manufacturing Co. Ltd. | 4.5% |
| Tencent Holdings Ltd. | 3.9% |
| Itau Unibanco Holding SA ADR | 3.2% |
| Samsung Electronics Co. Ltd. | 2.6% |
| China Mobile Ltd. | 2.2% |
| Credicorp Ltd. | 1.8% |
| Cemex SAB de CV ADR | 1.8% |
| Vipshop Holdings Ltd. ADR | 1.7% |
| Ping An Insurance Group Co., H Shares | 1.7% |
| CJ Korea Express Co. Ltd. | 1.6% |
Types of Investments in Portfolio | % of net assets |
| Foreign Common Stocks | 98.2% |
| Temporary Cash Investments | 2.5% |
| Other Assets and Liabilities | (0.7)% |
Investments by Country | % of net assets |
| China | 21.9% |
| South Korea | 11.7% |
| Taiwan | 10.7% |
| Brazil | 10.6% |
| South Africa | 8.3% |
| India | 6.5% |
| Mexico | 5.0% |
| Indonesia | 3.2% |
| Turkey | 3.1% |
| Thailand | 2.8% |
| Russia | 2.2% |
| Poland | 2.0% |
| Other Countries | 10.2% |
| Cash and Equivalents* | 1.8% |
*Includes temporary cash investments and other assets and liabilities.
6
| Shareholder Fee Example |
Fund shareholders may incur two types of costs: (1) transaction costs, including sales charges (loads) on purchase payments and redemption/exchange fees; and (2) ongoing costs, including management fees; distribution and service (12b-1) fees; and other fund expenses. This example is intended to help you understand your ongoing costs (in dollars) of investing in your fund and to compare these costs with the ongoing cost of investing in other mutual funds.
The example is based on an investment of $1,000 made at the beginning of the period and held for the entire period from June 1, 2014 to November 30, 2014.
Actual Expenses
The table provides information about actual account values and actual expenses for each class. You may use the information, together with the amount you invested, to estimate the expenses that you paid over the period. First, identify the share class you own. Then simply divide your account value by $1,000 (for example, an $8,600 account value divided by $1,000 = 8.6), then multiply the result by the number under the heading “Expenses Paid During Period” to estimate the expenses you paid on your account during this period.
If you hold Investor Class shares of any American Century Investments fund, or Institutional Class shares of the American Century Diversified Bond Fund, in an American Century Investments account (i.e., not a financial intermediary or retirement plan account), American Century Investments may charge you a $12.50 semiannual account maintenance fee if the value of those shares is less than $10,000. We will redeem shares automatically in one of your accounts to pay the $12.50 fee. In determining your total eligible investment amount, we will include your investments in all personal accounts (including American Century Investments Brokerage accounts) registered under your Social Security number. Personal accounts include individual accounts, joint accounts, UGMA/UTMA accounts, personal trusts, Coverdell Education Savings Accounts and IRAs (including traditional, Roth, Rollover, SEP-, SARSEP- and SIMPLE-IRAs), and certain other retirement accounts. If you have only business, business retirement, employer-sponsored or American Century Investments Brokerage accounts, you are currently not subject to this fee. If you are subject to the Account Maintenance Fee, your account value could be reduced by the fee amount.
Hypothetical Example for Comparison Purposes
The table also provides information about hypothetical account values and hypothetical expenses based on the actual expense ratio of each class of your fund and an assumed rate of return of 5% per year before expenses, which is not the actual return of a fund’s share class. The hypothetical account values and expenses may not be used to estimate the actual ending account balance or expenses you paid for the period. You may use this information to compare the ongoing costs of investing in your fund and other funds. To do so, compare this 5% hypothetical example with the 5% hypothetical examples that appear in the shareholder reports of the other funds.
Please note that the expenses shown in the table are meant to highlight your ongoing costs only and do not reflect any transactional costs, such as sales charges (loads) or redemption/exchange fees. Therefore, the table is useful in comparing ongoing costs only, and will not help you determine the relative total costs of owning different funds. In addition, if these transactional costs were included, your costs would have been higher.
7
Beginning Account Value 6/1/14 | Ending Account Value 11/30/14 | Expenses Paid During Period(1) 6/1/14 - 11/30/14 | Annualized Expense Ratio(1) | |
Actual | ||||
| Institutional Class (after waiver) | $1,000 | $1,019.80 | $6.33 | 1.25% |
| Institutional Class (before waiver) | $1,000 | $1,019.80(2) | $7.60 | 1.50% |
| R6 Class (after waiver) | $1,000 | $1,019.80 | $5.57 | 1.10% |
| R6 Class (before waiver) | $1,000 | $1,019.80(2) | $6.84 | 1.35% |
Hypothetical | ||||
| Institutional Class (after waiver) | $1,000 | $1,018.80 | $6.33 | 1.25% |
| Institutional Class (before waiver) | $1,000 | $1,017.55 | $7.59 | 1.50% |
| R6 Class (after waiver) | $1,000 | $1,019.55 | $5.57 | 1.10% |
| R6 Class (before waiver) | $1,000 | $1,018.30 | $6.83 | 1.35% |
| (1) | Expenses are equal to the class's annualized expense ratio listed in the table above, multiplied by the average account value over the period, multiplied by 183, the number of days in the most recent fiscal half-year, divided by 365, to reflect the one-half year period. |
| (2) | Ending account value assumes the return earned after waiver and would have been lower if a portion of the management fee had not been waived. |
8
| Schedule of Investments |
NOVEMBER 30, 2014
| Shares | Value | ||||
| COMMON STOCKS — 98.2% | |||||
| Brazil — 10.6% | |||||
| BB Seguridade Participacoes SA | 289,100 | $ | 3,704,452 | ||
| BRF SA ADR | 119,610 | 3,111,056 | |||
| Cia Brasileira de Distribuicao Grupo Pao de Acucar ADR | 38,160 | 1,606,918 | |||
| Cielo SA | 192,000 | 3,231,580 | |||
| Estacio Participacoes SA | 185,000 | 2,022,651 | |||
Hypermarcas SA(1) | 371,600 | 2,515,064 | |||
| Itau Unibanco Holding SA ADR | 705,945 | 10,631,532 | |||
| Kroton Educacional SA | 604,332 | 4,177,118 | |||
| Lojas Americanas SA Preference Shares | 285,200 | 1,869,346 | |||
| Ultrapar Participacoes SA | 122,000 | 2,596,612 | |||
| 35,466,329 | |||||
| Chile — 0.5% | |||||
| SACI Falabella | 204,928 | 1,476,904 | |||
| China — 21.9% | |||||
Alibaba Group Holding Ltd. ADR(1) | 38,047 | 4,247,567 | |||
| Brilliance China Automotive Holdings Ltd. | 2,452,000 | 4,179,806 | |||
| China Mobile Ltd. | 598,000 | 7,367,770 | |||
| China Overseas Land & Investment Ltd. | 1,226,000 | 3,683,414 | |||
| CNOOC Ltd. | 3,086,000 | 4,512,458 | |||
| CSR Corp. Ltd., H Shares | 4,966,000 | 5,052,286 | |||
| ENN Energy Holdings Ltd. | 310,000 | 1,894,716 | |||
| Great Wall Motor Co. Ltd., H Shares | 838,000 | 4,224,983 | |||
| Industrial & Commercial Bank of China Ltd., H Shares | 8,074,095 | 5,476,257 | |||
| Ping An Insurance Group Co., H Shares | 663,000 | 5,561,155 | |||
| Shenzhou International Group Holdings Ltd. | 1,163,000 | 3,869,044 | |||
| Sinotrans Ltd., H Shares | 5,916,000 | 4,462,603 | |||
| Tencent Holdings Ltd. | 811,400 | 12,973,611 | |||
Vipshop Holdings Ltd. ADR(1) | 248,560 | 5,682,082 | |||
| 73,187,752 | |||||
| Colombia — 0.8% | |||||
Cemex Latam Holdings SA(1) | 339,770 | 2,589,623 | |||
| Egypt — 1.1% | |||||
| Commercial International Bank Egypt S.A.E. | 524,110 | 3,621,098 | |||
| Greece — 1.2% | |||||
| OPAP SA | 189,120 | 2,370,426 | |||
| Titan Cement Co. SA | 73,430 | 1,740,302 | |||
| 4,110,728 | |||||
| Hong Kong — 0.8% | |||||
Qihoo 360 Technology Co. Ltd. ADR(1) | 35,760 | 2,658,041 | |||
| India — 6.5% | |||||
| Bharti Infratel Ltd. | 686,038 | 3,318,255 | |||
| HCL Technologies Ltd. | 169,580 | 4,542,766 | |||
| HDFC Bank Ltd. | 340,172 | 5,246,888 | |||
| ICICI Bank Ltd. ADR | 60,410 | 3,557,545 | |||
9
| Shares | Value | ||||
| Larsen & Toubro Ltd. | 87,390 | $ | 2,308,642 | ||
| Tata Motors Ltd. | 327,316 | 2,814,005 | |||
| 21,788,101 | |||||
| Indonesia — 3.2% | |||||
| PT Bank Rakyat Indonesia (Persero) Tbk | 3,758,100 | 3,549,009 | |||
| PT Matahari Department Store Tbk | 2,847,500 | 3,499,877 | |||
| PT Tower Bersama Infrastructure Tbk | 4,753,400 | 3,670,993 | |||
| 10,719,879 | |||||
| Malaysia — 1.7% | |||||
| Axiata Group Bhd | 1,638,100 | 3,419,065 | |||
| Sapurakencana Petroleum Bhd | 2,517,600 | 2,084,044 | |||
| 5,503,109 | |||||
| Mexico — 5.0% | |||||
Alsea SAB de CV(1) | 602,369 | 1,861,636 | |||
Cemex SAB de CV ADR(1) | 482,746 | 6,039,152 | |||
| Grupo Mexico SAB de CV | 887,090 | 2,911,167 | |||
| Infraestructura Energetica Nova SAB de CV | 565,100 | 3,317,046 | |||
Promotora y Operadora de Infraestructura SAB de CV(1) | 200,481 | 2,497,097 | |||
| 16,626,098 | |||||
| Peru — 1.8% | |||||
| Credicorp Ltd. | 36,724 | 6,083,698 | |||
| Philippines — 1.6% | |||||
| Universal Robina Corp. | 1,212,460 | 5,267,809 | |||
| Poland — 2.0% | |||||
Alior Bank SA(1) | 103,690 | 2,434,218 | |||
| Cyfrowy Polsat SA | 129,611 | 951,337 | |||
| Powszechny Zaklad Ubezpieczen SA | 23,348 | 3,330,324 | |||
| 6,715,879 | |||||
| Qatar — 0.7% | |||||
| Qatar National Bank SAQ | 34,150 | 2,145,556 | |||
| Russia — 2.2% | |||||
| Magnit PJSC GDR | 61,732 | 3,571,196 | |||
| MMC Norilsk Nickel OJSC ADR | 97,080 | 1,724,141 | |||
| NovaTek OAO GDR | 20,879 | 1,973,066 | |||
| 7,268,403 | |||||
| South Africa — 8.3% | |||||
| Aspen Pharmacare Holdings Ltd. | 136,716 | 4,937,935 | |||
| Capitec Bank Holdings Ltd. | 137,000 | 3,912,289 | |||
| Discovery Holdings Ltd. | 434,398 | 4,373,496 | |||
| Mr Price Group Ltd. | 212,900 | 4,540,303 | |||
| MTN Group Ltd. | 171,770 | 3,383,829 | |||
| Naspers Ltd., N Shares | 30,982 | 4,011,553 | |||
| Sasol Ltd. | 61,290 | 2,556,529 | |||
| 27,715,934 | |||||
| South Korea — 11.7% | |||||
CJ Korea Express Co. Ltd.(1) | 30,910 | 5,482,030 | |||
| Coway Co. Ltd. | 41,020 | 3,198,816 | |||
| Daewoo International Corp. | 108,800 | 3,358,418 | |||
| Hyundai Development Co-Engineering & Construction | 128,820 | 4,127,542 | |||
LG Display Co. Ltd.(1) | 147,020 | 4,505,013 | |||
10
| Shares | Value | ||||
| LG Household & Health Care Ltd. | 4,600 | $ | 2,586,579 | ||
Naturalendo Tech Co. Ltd.(1) | 46,894 | 2,264,388 | |||
| Samsung Electronics Co. Ltd. | 7,481 | 8,689,965 | |||
| Shinhan Financial Group Co. Ltd. | 72,440 | 3,242,948 | |||
SK Hynix, Inc.(1) | 38,150 | 1,654,504 | |||
| 39,110,203 | |||||
| Taiwan — 10.7% | |||||
| Chailease Holding Co. Ltd. | 1,100,000 | 2,825,753 | |||
| Ginko International Co. Ltd. | 237,000 | 2,630,568 | |||
| Hiwin Technologies Corp. | 193,420 | 1,624,984 | |||
| Hon Hai Precision Industry Co. Ltd. | 767,240 | 2,404,791 | |||
| Hota Industrial Manufacturing Co. Ltd. | 1,205,000 | 2,196,042 | |||
| Largan Precision Co. Ltd. | 49,000 | 3,776,234 | |||
| MediaTek, Inc. | 228,000 | 3,425,802 | |||
| Taiwan Semiconductor Manufacturing Co. Ltd. | 3,314,774 | 15,156,007 | |||
| TPK Holding Co. Ltd. | 266,000 | 1,710,445 | |||
| 35,750,626 | |||||
| Thailand — 2.8% | |||||
| CP ALL PCL | 1,715,600 | 2,298,962 | |||
| Kasikornbank PCL NVDR | 512,100 | 3,852,252 | |||
| Thaicom PCL | 2,783,300 | 3,136,351 | |||
| 9,287,565 | |||||
| Turkey — 3.1% | |||||
| BIM Birlesik Magazalar AS | 106,646 | 2,371,618 | |||
Pegasus Hava Tasimaciligi AS(1) | 122,690 | 1,789,482 | |||
| TAV Havalimanlari Holding AS | 419,268 | 3,586,068 | |||
| Ulker Biskuvi Sanayi AS | 347,010 | 2,608,746 | |||
| 10,355,914 | |||||
TOTAL COMMON STOCKS (Cost $275,348,267) | 327,449,249 | ||||
| TEMPORARY CASH INVESTMENTS — 2.5% | |||||
State Street Institutional Liquid Reserves Fund, Premier Class (Cost $8,437,806) | 8,437,806 | 8,437,806 | |||
TOTAL INVESTMENT SECURITIES — 100.7% (Cost $283,786,073) | 335,887,055 | ||||
| OTHER ASSETS AND LIABILITIES — (0.7)% | (2,252,697 | ) | |||
| TOTAL NET ASSETS — 100.0% | $ | 333,634,358 | |||
11
| MARKET SECTOR DIVERSIFICATION | ||
(as a % of net assets) | ||
| Financials | 23.4 | % |
| Information Technology | 20.5 | % |
| Consumer Discretionary | 15.9 | % |
| Industrials | 10.1 | % |
| Consumer Staples | 7.8 | % |
| Telecommunication Services | 7.3 | % |
| Materials | 4.5 | % |
| Energy | 4.1 | % |
| Health Care | 3.0 | % |
| Utilities | 1.6 | % |
| Cash and Equivalents* | 1.8 | % |
*Includes temporary cash investments and other assets and liabilities.
| NOTES TO SCHEDULE OF INVESTMENTS | ||
| ADR | - | American Depositary Receipt |
| GDR | - | Global Depositary Receipt |
| NVDR | - | Non-Voting Depositary Receipt |
| OJSC | - | Open Joint Stock Company |
| PJSC | - | Public Joint Stock Company |
(1) Non-income producing.
See Notes to Financial Statements.
12
| Statement of Assets and Liabilities |
| NOVEMBER 30, 2014 | |||
| Assets | |||
| Investment securities, at value (cost of $283,786,073) | $ | 335,887,055 | |
| Cash | 6,093 | ||
| Foreign currency holdings, at value (cost of $429,060) | 429,061 | ||
| Receivable for investments sold | 1,200,820 | ||
| Receivable for capital shares sold | 2,401 | ||
| Dividends and interest receivable | 106,109 | ||
| Other assets | 11,624 | ||
| 337,643,163 | |||
| Liabilities | |||
| Payable for investments purchased | 2,263,754 | ||
| Payable for capital shares redeemed | 1,175,260 | ||
| Accrued management fees | 332,678 | ||
| Accrued foreign taxes | 237,113 | ||
| 4,008,805 | |||
| Net Assets | $ | 333,634,358 | |
| Net Assets Consist of: | |||
| Capital (par value and paid-in surplus) | $ | 287,927,780 | |
| Undistributed net investment income | 730,914 | ||
| Accumulated net realized loss | (6,883,049 | ) | |
| Net unrealized appreciation | 51,858,713 | ||
| $ | 333,634,358 | ||
| Net Assets | Shares Outstanding | Net Asset Value Per Share | |||
| Institutional Class, $0.01 Par Value | $323,641,048 | 29,863,322 | $10.84 | ||
| R6 Class, $0.01 Par Value | $9,993,310 | 921,607 | $10.84 | ||
See Notes to Financial Statements.
13
| Statement of Operations |
| YEAR ENDED NOVEMBER 30, 2014 | |||
| Investment Income (Loss) | |||
| Income: | |||
| Dividends (net of foreign taxes withheld of $603,612) | $ | 5,105,392 | |
| Interest | 844 | ||
| 5,106,236 | |||
| Expenses: | |||
| Management fees | 4,495,920 | ||
| Directors' fees and expenses | 7,163 | ||
| Other expenses | 3,303 | ||
| 4,506,386 | |||
| Fees waived | (751,914 | ) | |
| 3,754,472 | |||
| Net investment income (loss) | 1,351,764 | ||
| Realized and Unrealized Gain (Loss) | |||
| Net realized gain (loss) on: | |||
| Investment transactions (net of foreign tax expenses paid (refunded) of $30,281) | 6,473,813 | ||
| Foreign currency transactions | (378,925 | ) | |
| 6,094,888 | |||
| Change in net unrealized appreciation (depreciation) on: | |||
| Investments (includes (increase) decrease in accrued foreign taxes of $(183,093)) | 1,019,987 | ||
| Translation of assets and liabilities in foreign currencies | 1,402 | ||
| 1,021,389 | |||
| Net realized and unrealized gain (loss) | 7,116,277 | ||
| Net Increase (Decrease) in Net Assets Resulting from Operations | $ | 8,468,041 | |
See Notes to Financial Statements.
14
| Statement of Changes in Net Assets |
| YEARS ENDED NOVEMBER 30, 2014 AND NOVEMBER 30, 2013 | ||||||
| Increase (Decrease) in Net Assets | November 30, 2014 | November 30, 2013 | ||||
| Operations | ||||||
| Net investment income (loss) | $ | 1,351,764 | $ | 847,359 | ||
| Net realized gain (loss) | 6,094,888 | (509,010 | ) | |||
| Change in net unrealized appreciation (depreciation) | 1,021,389 | 14,903,031 | ||||
| Net increase (decrease) in net assets resulting from operations | 8,468,041 | 15,241,380 | ||||
| Distributions to Shareholders | ||||||
| From net investment income: | ||||||
| Institutional Class | (1,117,830 | ) | (935,022 | ) | ||
| R6 Class | (15,761 | ) | — | |||
| Decrease in net assets from distributions | (1,133,591 | ) | (935,022 | ) | ||
| Capital Share Transactions | ||||||
| Net increase (decrease) in net assets from capital share transactions (Note 5) | 54,902,713 | 87,813,658 | ||||
| Net increase (decrease) in net assets | 62,237,163 | 102,120,016 | ||||
| Net Assets | ||||||
| Beginning of period | 271,397,195 | 169,277,179 | ||||
| End of period | $ | 333,634,358 | $ | 271,397,195 | ||
| Undistributed net investment income | $ | 730,914 | $ | 379,863 | ||
See Notes to Financial Statements.
15
| Notes to Financial Statements |
NOVEMBER 30, 2014
1. Organization
American Century World Mutual Funds, Inc. (the corporation) is registered under the Investment Company Act of 1940, as amended (the 1940 Act), as an open-end management investment company and is organized as a Maryland corporation. NT Emerging Markets Fund (the fund) is one fund in a series issued by the corporation. The fund is diversified as defined under the 1940 Act. The fund’s investment objective is to seek capital growth. The fund is not permitted to invest in securities issued by companies assigned the Global Industry Classification Standard for the tobacco industry.
The fund offers the Institutional Class and the R6 Class, which have different fees and expenses. The difference in the fee structures between the classes is not the result of any difference in advisory or custodial fees or other expenses related to management of the fund’s assets, which do not vary by class. The fund’s R6 Class shares are available for purchase exclusively by certain American Century Investments funds of funds that are offered only through employer-sponsored retirement plans where a financial intermediary provides retirement recordkeeping services to plan participants. Because financial intermediaries do not receive any service, distribution or administrative fees for offering such funds of funds, American Century Investment Management, Inc. (ACIM) (the investment advisor) is able to charge the R6 Class a lower unified management fee. Sale of the R6 Class commenced on July 26, 2013.
2. Significant Accounting Policies
The following is a summary of significant accounting policies consistently followed by the fund in preparation of its financial statements. The fund is an investment company and follows accounting and reporting guidance in accordance with accounting principles generally accepted in the United States of America. This may require management to make certain estimates and assumptions at the date of the financial statements. Actual results could differ from these estimates. Management evaluated the impact of events or transactions occurring through the date the financial statements were issued that would merit recognition or disclosure.
Investment Valuations — The fund determines the fair value of its investments and computes its net asset value per share at the close of regular trading (usually 4 p.m. Eastern time) on the New York Stock Exchange (NYSE) on each day the NYSE is open. The Board of Directors has adopted valuation policies and procedures to guide the investment advisor in the fund’s investment valuation process and to provide methodologies for the oversight of the fund’s pricing function.
Equity securities that are listed or traded on a domestic securities exchange are valued at the last reported sales price or at the official closing price as provided by the exchange. Equity securities traded on foreign securities exchanges are generally valued at the closing price of such securities on the exchange where primarily traded or at the close of the NYSE, if that is earlier. If no last sales price is reported, or if local convention or regulation so provides, the mean of the latest bid and asked prices may be used. Securities traded over-the-counter are valued at the mean of the latest bid and asked prices, the last sales price, or the official closing price. Equity securities initially expressed in local currencies are translated into U.S. dollars at the mean of the appropriate currency exchange rate at the close of the NYSE as provided by an independent pricing service.
Fixed income securities maturing within 60 days at the time of purchase may be valued at cost, plus or minus any amortized discount or premium or at the evaluated mean as provided by an independent pricing service. Evaluated mean prices are commonly derived through utilization of market models, which may consider, among other factors: trade data, quotations from dealers and active market makers, relevant yield curve and spread data, related sector levels, creditworthiness, trade data or market information on comparable securities, and other relevant security specific information.
Open-end management investment companies are valued at the reported net asset value per share. Repurchase agreements are valued at cost, which approximates fair value.
If the fund determines that the market price for an investment is not readily available or the valuation methods mentioned above do not reflect an investment’s fair value, such investment is valued as determined in good faith by the Board of Directors or its delegate, in accordance with policies and procedures adopted by the Board of Directors. In its determination of fair value, the fund may review several factors including, but not
16
limited to, market information regarding the specific investment or comparable investments and correlation with other investment types, futures indices or general market indicators. Circumstances that may cause the fund to use these procedures to value an investment include, but are not limited to: an investment has been declared in default or is distressed; trading in a security has been suspended during the trading day or a security is not actively trading on its principal exchange; prices received from a regular pricing source are deemed unreliable; or there is a foreign market holiday and no trading occurred.
The fund monitors for significant events occurring after the close of an investment’s primary exchange but before the fund’s net asset value per share is determined. Significant events may include, but are not limited to: corporate announcements and transactions; governmental action and political unrest that could impact a specific investment or an investment sector; or armed conflicts, natural disasters and similar events that could affect investments in a specific country or region. The fund also monitors for significant fluctuations between domestic and foreign markets, as evidenced by the U.S. market or such other indicators that the Board of Directors, or its delegate, deems appropriate. If significant fluctuations in foreign markets are identified, the fund may apply a model-derived factor to the closing price of equity securities traded on foreign securities exchanges. The factor is based on observable market data as provided by an independent pricing service.
Security Transactions — Security transactions are accounted for as of the trade date. Net realized gains and losses are determined on the identified cost basis, which is also used for federal income tax purposes. Certain countries impose taxes on realized gains on the sale of securities registered in their country. The fund records the foreign tax expense, if any, on an accrual basis. The foreign tax expense on realized gains and unrealized appreciation reduces the net realized gain (loss) on investment transactions and net unrealized appreciation (depreciation) on investments, respectively.
Investment Income — Dividend income less foreign taxes withheld, if any, is recorded as of the ex-dividend date. Distributions received on securities that represent a return of capital or long-term capital gain are recorded as a reduction of cost of investments and/or as a realized gain. The fund may estimate the components of distributions received that may be considered nontaxable distributions or long-term capital gain distributions for income tax purposes. Interest income is recorded on the accrual basis and includes accretion of discounts and amortization of premiums.
Foreign Currency Translations — All assets and liabilities initially expressed in foreign currencies are translated into U.S. dollars at prevailing exchange rates at period end. The fund may enter into spot foreign currency exchange contracts to facilitate transactions denominated in a foreign currency. Purchases and sales of investment securities, dividend and interest income, spot foreign currency exchange contracts, and expenses are translated at the rates of exchange prevailing on the respective dates of such transactions. Net realized and unrealized foreign currency exchange gains or losses related to investment securities are a component of net realized gain (loss) on investment transactions and change in net unrealized appreciation (depreciation) on investments, respectively.
Repurchase Agreements — The fund may enter into repurchase agreements with institutions that ACIM has determined are creditworthy pursuant to criteria adopted by the Board of Directors. The fund requires that the collateral, represented by securities, received in a repurchase transaction be transferred to the custodian in a manner sufficient to enable the fund to obtain those securities in the event of a default under the repurchase agreement. ACIM monitors, on a daily basis, the securities transferred to ensure the value, including accrued interest, of the securities under each repurchase agreement is equal to or greater than amounts owed to the fund under each repurchase agreement.
Joint Trading Account — Pursuant to an Exemptive Order issued by the Securities and Exchange Commission, the fund, along with certain other funds in the American Century Investments family of funds, may transfer uninvested cash balances into a joint trading account. These balances are invested in one or more repurchase agreements that are collateralized by U.S. Treasury or Agency obligations.
Income Tax Status — It is the fund’s policy to distribute substantially all net investment income and net realized gains to shareholders and to otherwise qualify as a regulated investment company under provisions of the Internal Revenue Code. Accordingly, no provision has been made for income taxes. The fund files U.S. federal, state, local and non-U.S. tax returns as applicable. The fund's tax returns are subject to examination by the relevant taxing authority until expiration of the applicable statute of limitations, which is generally three years from the date of filing but can be longer in certain jurisdictions. At this time, management believes there are no uncertain tax positions which, based on their technical merit, would not be sustained upon examination and for which it is reasonably possible that the total amounts of unrecognized tax benefits will significantly change in the next twelve months.
17
Multiple Class — All shares of the fund represent an equal pro rata interest in the net assets of the class to which such shares belong, and have identical voting, dividend, liquidation and other rights and the same terms and conditions, except for class specific expenses and exclusive rights to vote on matters affecting only individual classes. Income, non-class specific expenses, and realized and unrealized capital gains and losses of the fund are allocated to each class of shares based on their relative net assets.
Distributions to Shareholders — Distributions from net investment income and net realized gains, if any, are generally declared and paid annually. The fund may make distributions on a more frequent basis to comply with the distribution requirements of the Internal Revenue Code, in all events in a manner consistent with provisions of the 1940 Act.
Indemnifications — Under the corporation’s organizational documents, its officers and directors are indemnified against certain liabilities arising out of the performance of their duties to the fund. In addition, in the normal course of business, the fund enters into contracts that provide general indemnifications. The maximum exposure under these arrangements is unknown as this would involve future claims that may be made against a fund. The risk of material loss from such claims is considered by management to be remote.
3. Fees and Transactions with Related Parties
Certain officers and directors of the corporation are also officers and/or directors of American Century Companies, Inc. (ACC). The corporation’s investment advisor, ACIM, the corporation's distributor, American Century Investment Services, Inc., and the corporation’s transfer agent, American Century Services, LLC, are wholly owned, directly or indirectly, by ACC. Various funds issued by American Century Asset Allocation Portfolios, Inc. own, in aggregate, 100% of the shares of the fund. Related parties do not invest in the fund for the purpose of exercising management or control.
Management Fees — The corporation has entered into a management agreement with ACIM, under which ACIM provides the fund with investment advisory and management services in exchange for a single, unified management fee (the fee) per class. The agreement provides that all expenses of managing and operating the fund, except distribution and service fees, brokerage expenses, taxes, interest, fees and expenses of the independent directors (including legal counsel fees), and extraordinary expenses, will be paid by ACIM. The fee is computed and accrued daily based on each class’s daily net assets and paid monthly in arrears. The rate of the fee is determined by applying a fee rate calculation formula. This formula takes into account the fund’s assets as well as certain assets, if any, of other clients of the investment advisor outside the American Century Investments family of funds (such as subadvised funds and separate accounts) that have very similar investment teams and investment strategies (strategy assets). The strategy assets of the fund also include the assets of Emerging Markets Fund, one fund in a series issued by the corporation. The annual management fee schedule ranges from 1.050% to 1.650% for the Institutional Class and 0.900% to 1.500% for the R6 Class. During the year ended November 30, 2014, the investment advisor voluntarily agreed to waive 0.250% of its management fee. The investment advisor expects the fee waiver to continue through March 31, 2015, and cannot terminate it without the approval of the Board of Directors. The total amount of the waiver for each class for the year ended November 30, 2014 was $736,825 and $15,089 for the Institutional Class and R6 Class, respectively. The effective annual management fee before waiver for each class for the year ended November 30, 2014 was 1.50% for the Institutional Class and 1.35% for the R6 Class. The effective annual management fee after waiver for each class for the year ended November 30, 2014 was 1.25% for the Institutional Class and 1.10% for the R6 Class.
Directors' Fees and Expenses — The Board of Directors is responsible for overseeing the investment advisor’s management and operations of the fund. The directors receive detailed information about the fund and its investment advisor regularly throughout the year, and meet at least quarterly with management of the investment advisor to review reports about fund operations. Fees and expenses incurred in conjunction with the directors during the year ended November 30, 2014 are detailed in the Statement of Operations. The fund’s officers do not receive compensation from the fund.
18
4. Investment Transactions
Purchases and sales of investment securities, excluding short-term investments, for the year ended November 30, 2014 were $299,498,975 and $249,752,558, respectively.
5. Capital Share Transactions
Transactions in shares of the fund were as follows:
Year ended November 30, 2014 | Year ended November 30, 2013(1) | |||||||||
| Shares | Amount | Shares | Amount | |||||||
| Institutional Class/Shares Authorized | 100,000,000 | 100,000,000 | ||||||||
| Sold | 7,570,217 | $ | 79,221,462 | 9,378,494 | $ | 96,078,378 | ||||
| Issued in reinvestment of distributions | 108,942 | 1,117,830 | 90,253 | 935,022 | ||||||
| Redeemed | (3,027,271 | ) | (32,862,933 | ) | (1,106,676 | ) | (11,438,585 | ) | ||
| 4,651,888 | 47,476,359 | 8,362,071 | 85,574,815 | |||||||
| R6 Class/Shares Authorized | 50,000,000 | 50,000,000 | ||||||||
| Sold | 781,648 | 8,202,595 | 223,318 | 2,344,206 | ||||||
| Issued in reinvestment of distributions | 1,539 | 15,761 | — | — | ||||||
| Redeemed | (74,953 | ) | (792,002 | ) | (9,945 | ) | (105,363 | ) | ||
| 708,234 | 7,426,354 | 213,373 | 2,238,843 | |||||||
| Net increase (decrease) | 5,360,122 | $ | 54,902,713 | 8,575,444 | $ | 87,813,658 | ||||
(1) July 26, 2013 (commencement of sale) through November 30, 2013 for the R6 Class.
6. Fair Value Measurements
The fund’s investments valuation process is based on several considerations and may use multiple inputs to determine the fair value of the investments held by the fund. In conformity with accounting principles generally accepted in the United States of America, the inputs used to determine a valuation are classified into three broad levels.
| • | Level 1 valuation inputs consist of unadjusted quoted prices in an active market for identical investments. |
| • | Level 2 valuation inputs consist of direct or indirect observable market data (including quoted prices for comparable investments, evaluations of subsequent market events, interest rates, prepayment speeds, credit risk, etc.). These inputs also consist of quoted prices for identical investments initially expressed in local currencies that are adjusted through translation into U.S. dollars. |
| • | Level 3 valuation inputs consist of unobservable data (including a fund’s own assumptions). |
The level classification is based on the lowest level input that is significant to the fair valuation measurement. The valuation inputs are not necessarily an indication of the risks associated with investing in these securities or other financial instruments. There were no significant transfers between levels during the period.
19
The following is a summary of the level classifications as of period end. The Schedule of Investments provides additional information on the fund’s portfolio holdings.
| Level 1 | Level 2 | Level 3 | ||||||
| Assets | ||||||||
| Investment Securities | ||||||||
| Common Stocks | ||||||||
| Brazil | $ | 15,349,506 | $ | 20,116,823 | — | |||
| China | 9,929,649 | 63,258,103 | — | |||||
| Hong Kong | 2,658,041 | — | — | |||||
| India | 3,557,545 | 18,230,556 | — | |||||
| Mexico | 6,039,152 | 10,586,946 | — | |||||
| Peru | 6,083,698 | — | — | |||||
| Other Countries | — | 171,639,230 | — | |||||
| Temporary Cash Investments | 8,437,806 | — | — | |||||
| $ | 52,055,397 | $ | 283,831,658 | — | ||||
7. Risk Factors
There are certain risks involved in investing in foreign securities. These risks include those resulting from future adverse political, social and economic developments, fluctuations in currency exchange rates, the possible imposition of exchange controls, and other foreign laws or restrictions. Investing in emerging markets may accentuate these risks.
8. Federal Tax Information
The tax character of distributions paid during the years ended November 30, 2014 and November 30, 2013 were as follows:
| 2014 | 2013 | |||||
| Distributions Paid From | ||||||
| Ordinary income | $ | 1,133,591 | $ | 935,022 | ||
| Long-term capital gains | — | — | ||||
The book-basis character of distributions made during the year from net investment income or net realized gains may differ from their ultimate characterization for federal income tax purposes. These differences reflect the differing character of certain income items and net realized gains and losses for financial statement and tax purposes, and may result in reclassification among certain capital accounts on the financial statements.
20
As of November 30, 2014, the federal tax cost of investments and the components of distributable earnings on a tax-basis were as follows:
| Federal tax cost of investments | $ | 285,104,524 | |
| Gross tax appreciation of investments | $ | 59,661,862 | |
| Gross tax depreciation of investments | (8,879,331 | ) | |
| Net tax appreciation (depreciation) of investments | 50,782,531 | ||
| Net tax appreciation (depreciation) on translation of assets and liabilities in foreign currencies | (242,269 | ) | |
| Net tax appreciation (depreciation) | $ | 50,540,262 | |
| Undistributed ordinary income | $ | 753,912 | |
| Accumulated short-term capital losses | $ | (5,587,596 | ) |
The difference between book-basis and tax-basis unrealized appreciation (depreciation) is attributable primarily to the tax deferral of losses on wash sales.
Accumulated capital losses represent net capital loss carryovers that may be used to offset future realized capital gains for federal income tax purposes. Any unlimited losses will be required to be utilized prior to the losses which carry an expiration date. Future capital loss carryover utilization in any given year may be subject to Internal Revenue Code limitations. Capital loss carryovers of $(1,146,451) expire in 2017 and the remaining losses are unlimited.
21
| Financial Highlights |
| For a Share Outstanding Throughout the Years Ended November 30 (except as noted) | |||||||||||||||
| Per-Share Data | Ratios and Supplemental Data | ||||||||||||||
| Income From Investment Operations: | Ratio to Average Net Assets of: | ||||||||||||||
| Net Asset Value, Beginning of Period | Net Investment Income (Loss)(1) | Net Realized and Unrealized Gain (Loss) | Total From Investment Operations | Distributions From Net Investment Income | Net Asset Value, End of Period | Total Return(2) | Operating Expenses | Operating Expenses (before expense waiver) | Net Investment Income (Loss) | Net Investment Income (Loss) (before expense waiver) | Portfolio Turnover Rate | Net Assets, End of Period (in thousands) | |||
| Institutional Class | |||||||||||||||
| 2014 | $10.67 | 0.05 | 0.16 | 0.21 | (0.04) | $10.84 | 2.02% | 1.25% | 1.50% | 0.45% | 0.20% | 84% | $323,641 | ||
| 2013 | $10.05 | 0.04 | 0.63 | 0.67 | (0.05) | $10.67 | 6.66% | 1.42% | 1.52% | 0.38% | 0.28% | 76% | $269,117 | ||
| 2012 | $8.94 | 0.05 | 1.07 | 1.12 | (0.01) | $10.05 | 12.51% | 1.54% | 1.54% | 0.50% | 0.50% | 101% | $169,277 | ||
| 2011 | $10.24 | 0.04 | (1.34) | (1.30) | — | $8.94 | (12.70)% | 1.52% | 1.52% | 0.37% | 0.37% | 87% | $119,682 | ||
| 2010 | $8.86 | 0.02 | 1.37 | 1.39 | (0.01) | $10.24 | 15.73% | 1.52% | 1.52% | 0.19% | 0.19% | 94% | $91,110 | ||
| R6 Class | |||||||||||||||
| 2014 | $10.68 | 0.06 | 0.16 | 0.22 | (0.06) | $10.84 | 2.11% | 1.10% | 1.35% | 0.60% | 0.35% | 84% | $9,993 | ||
2013(3) | $9.90 | (0.01) | 0.79 | 0.78 | — | $10.68 | 7.88% | 1.12%(4) | 1.37%(4) | (0.37)%(4) | (0.62)%(4) | 76%(5) | $2,280 | ||
| Notes to Financial Highlights |
| (1) | Computed using average shares outstanding throughout the period. |
| (2) | Total returns are calculated based on the net asset value of the last business day. Total returns for periods less than one year are not annualized. |
| (3) | July 26, 2013 (commencement of sale) through November 30, 2013. |
| (4) | Annualized. |
| (5) | Portfolio turnover is calculated at the fund level. Percentage indicated was calculated for the year ended November 30, 2013. |
See Notes to Financial Statements.
22
| Report of Independent Registered Public Accounting Firm |
To the Board of Directors and Shareholders of
American Century World Mutual Funds, Inc.:
We have audited the accompanying statement of assets and liabilities, including the schedule of investments, of NT Emerging Markets Fund (the “Fund”), one of the funds constituting American Century World Mutual Funds, Inc., as of November 30, 2014, and the related statement of operations for the year then ended, the statements of changes in net assets for each of the two years in the period then ended, and the financial highlights for each of the periods presented. These financial statements and financial highlights are the responsibility of the Fund's management. Our responsibility is to express an opinion on these financial statements and financial highlights based on our audits.
We conducted our audits in accordance with the standards of the Public Company Accounting Oversight Board (United States). Those standards require that we plan and perform the audit to obtain reasonable assurance about whether the financial statements and financial highlights are free of material misstatement. The Fund is not required to have, nor were we engaged to perform, an audit of its internal control over financial reporting. Our audits included consideration of internal control over financial reporting as a basis for designing audit procedures that are appropriate in the circumstances, but not for the purpose of expressing an opinion on the effectiveness of the Fund's internal control over financial reporting. Accordingly, we express no such opinion. An audit also includes examining, on a test basis, evidence supporting the amounts and disclosures in the financial statements, assessing the accounting principles used and significant estimates made by management, as well as evaluating the overall financial statement presentation. Our procedures included confirmation of securities owned as of November 30, 2014, by correspondence with the custodian and brokers; where replies were not received from brokers, we performed other auditing procedures. We believe that our audits provide a reasonable basis for our opinion.
In our opinion, the financial statements and financial highlights referred to above present fairly, in all material respects, the financial position of NT Emerging Markets Fund of American Century World Mutual Funds, Inc. as of November 30, 2014, the results of its operations for the year then ended, the changes in its net assets for each of the two years in the period then ended, and the financial highlights for each of the periods presented, in conformity with accounting principles generally accepted in the United States of America.
DELOITTE & TOUCHE LLP
Kansas City, Missouri
January 16, 2015
23
| Management |
The Board of Directors
The individuals listed below serve as directors of the funds. Each director will continue to serve in this capacity until death, retirement, resignation or removal from office. The board has adopted a mandatory retirement age for directors who are not “interested persons,” as that term is defined in the Investment Company Act (independent directors). Independent directors shall retire by December 31 of the year in which they reach their 75th birthday.
Mr. Thomas is an “interested person” because he currently serves as President and Chief Executive Officer of American Century Companies, Inc. (ACC), the parent company of American Century Investment Management, Inc. (ACIM or the advisor). Mr. Fink is treated as an “interested person” because of his recent employment with ACC and American Century Services, LLC (ACS). The other directors (more than three-fourths of the total number) are independent. They are not employees, directors or officers of, and have no financial interest in, ACC or any of its wholly owned, direct or indirect, subsidiaries, including ACIM, American Century Investment Services, Inc. (ACIS) and ACS, and they do not have any other affiliations, positions or relationships that would cause them to be considered “interested persons” under the Investment Company Act. The directors serve in this capacity for seven (in the case of Mr. Thomas, 15) registered investment companies in the American Century Investments family of funds.
The following table presents additional information about the directors. The mailing address for each director is 4500 Main Street, Kansas City, Missouri 64111.
Name (Year of Birth) | Position(s) Held with Funds | Length of Time Served | Principal Occupation(s) During Past 5 Years | Number of American Century Portfolios Overseen by Director | Other Directorships Held During Past 5 Years |
| Independent Directors | |||||
Thomas A. Brown (1940) | Director | Since 1980 | Managing Member, Associated Investments, LLC (real estate investment company); Brown Cascade Properties, LLC (real estate investment company) (2001 to 2009) | 73 | None |
Andrea C. Hall (1945) | Director | Since 1997 | Retired | 73 | None |
Jan M. Lewis (1957) | Director | Since 2011 | Retired; President and Chief Executive Officer, Catholic Charities of Northeast Kansas (human services organization) (2006 to 2013) | 73 | None |
James A. Olson (1942) | Director and Chairman of the Board | Since 2007 (Chairman since 2014) | Member, Plaza Belmont LLC (private equity fund manager) | 73 | Saia, Inc. (2002 to 2012) and EPR Properties (2003 to 2013) |
24
Name (Year of Birth) | Position(s) Held with Funds | Length of Time Served | Principal Occupation(s) During Past 5 Years | Number of American Century Portfolios Overseen by Director | Other Directorships Held During Past 5 Years |
| Independent Directors | |||||
M. Jeannine Strandjord (1945) | Director | Since 1994 | Retired | 73 | Euronet Worldwide Inc.; MGP Ingredients, Inc.; Charming Shoppes, Inc. (2006 to 2010); and DST Systems Inc. (1996 to 2012) |
John R. Whitten (1946) | Director | Since 2008 | Retired | 73 | Rudolph Technologies, Inc. |
Stephen E. Yates (1948) | Director | Since 2012 | Retired; Executive Vice President, Technology & Operations, KeyCorp. (computer services) (2004 to 2010) | 73 | Applied Industrial Technologies, Inc. (2001 to 2010) |
| Interested Directors | |||||
Barry Fink (1955) | Director | Since 2012 | Retired; Executive Vice President, ACC (September 2007 to February 2013); President, ACS (October 2007 to February 2013); Chief Operating Officer, ACC (September 2007 to November 2012) | 73 | None |
Jonathan S. Thomas (1963) | Director and President | Since 2007 | President and Chief Executive Officer, ACC (March 2007 to present). Also serves as Chief Executive Officer, ACS; Executive Vice President, ACIM; Director, ACC, ACIM and other ACC subsidiaries | 118 | BioMed Valley Discoveries, Inc. |
The Statement of Additional Information has additional information about the fund's directors and is available without charge, upon request, by calling 1-800-345-2021.
25
Officers
The following table presents certain information about the executive officers of the funds. Each officer serves as an officer for each of the 15 investment companies in the American Century family of funds, unless otherwise noted. No officer is compensated for his or her service as an officer of the funds. The listed officers are interested persons of the funds and are appointed or re-appointed on an annual basis. The mailing address for each officer listed below is 4500 Main Street, Kansas City, Missouri 64111.
Name (Year of Birth) | Offices with the Funds | Principal Occupation(s) During the Past Five Years |
Jonathan S. Thomas (1963) | Director and President since 2007 | President and Chief Executive Officer, ACC (March 2007 to present). Also serves as Chief Executive Officer, ACS; Executive Vice President, ACIM; Director, ACC, ACIM and other ACC subsidiaries |
Amy D. Shelton (1964) | Chief Compliance Officer and Vice President since 2014 | Chief Compliance Officer, American Century funds, (March 2014 to present); Chief Compliance Officer, ACIM (February 2014 to present); Chief Compliance Officer, ACIS (October 2009 to present); Vice President, Client Interactions and Marketing, ACIS (February 2013 to January 2014); Director, Client Interactions and Marketing, ACIS (June 2007 to January 2013). Also serves as Vice President, ACIS |
Charles A. Etherington (1957) | General Counsel since 2007 and Senior Vice President since 2006 | Attorney, ACC (February 1994 to present); Vice President, ACC (November 2005 to present); General Counsel, ACC (March 2007 to present). Also serves as General Counsel, ACIM, ACS, ACIS and other ACC subsidiaries; and Senior Vice President, ACIM and ACS |
C. Jean Wade (1964) | Vice President, Treasurer and Chief Financial Officer since 2012 | Vice President, ACS (February 2000 to present) |
Robert J. Leach (1966) | Vice President since 2006 and Assistant Treasurer since 2012 | Vice President, ACS (February 2000 to present) |
David H. Reinmiller (1963) | Vice President since 2000 | Attorney, ACC (January 1994 to present); Associate General Counsel, ACC (January 2001 to present). Also serves as Vice President, ACIM and ACS |
Ward D. Stauffer (1960) | Secretary since 2005 | Attorney, ACC (June 2003 to present) |
26
| Approval of Management Agreement |
At a meeting held on June 18, 2014, the Fund’s Board of Directors unanimously approved the renewal of the management agreement pursuant to which American Century Investment Management, Inc. (the “Advisor”) acts as the investment advisor for the Fund. Under Section 15(c) of the Investment Company Act, contracts for investment advisory services are required to be reviewed, evaluated, and approved by a majority of a fund’s directors (the “Directors”), including a majority of the independent Directors, each year.
Prior to its consideration of the renewal of the management agreement, the Board requested and reviewed extensive data and information compiled by the Advisor and certain independent providers of evaluation data concerning the Fund and the services provided to the Fund by the Advisor. This review was in addition to the oversight and evaluation undertaken by the Board and its committees on a continuous basis and the information received was supplemental to the extensive information that the Board and its committees receive and consider throughout the year.
In connection with its consideration of the renewal of the management agreement, the Board’s review and evaluation of the services provided by the Advisor included, but was not limited to, the following:
| • | the nature, extent, and quality of investment management, shareholder services, and other services provided by the Advisor to the Fund; |
| • | the wide range of other programs and services the Advisor provides to the Fund and its shareholders on a routine and non-routine basis; |
| • | the Fund’s investment performance compared to appropriate benchmarks and/or a peer group of other mutual funds with similar investment objectives and strategies; |
| • | the cost of owning the Fund compared to the cost of owning similar funds; |
| • | the Advisor’s compliance policies, procedures, and regulatory experience; |
| • | financial data showing the cost of services provided to the Fund, the profitability of the Fund to the Advisor, and the overall profitability of the Advisor; |
| • | possible economies of scale associated with the Advisor’s management of the Fund and other accounts under its management; |
| • | the services provided and charges to other investment management clients of the Advisor; |
| • | acquired fund fees and expenses; and |
| • | any collateral benefits derived by the Advisor from the management of the Fund. |
In keeping with its practice, the Board held two in-person meetings and one telephonic meeting to review and discuss the information provided. The independent Directors also had the benefit of the advice of their independent counsel throughout the process.
Factors Considered
The Directors considered all of the information provided by the Advisor, the independent data providers, and independent counsel, and evaluated such information for the Fund. In connection with their review, the Directors did not identify any single factor as being all-important or controlling, and each Director may have attributed different levels of importance to different factors. In deciding to renew the management agreement, the Board based its decision on a number of factors, including the following:
27
Nature, Extent and Quality of Services — Generally. Under the management agreement, the Advisor is responsible for providing or arranging for all services necessary for the operation of the Fund. The Board noted that under the management agreement, the Advisor provides or arranges at its own expense a wide variety of services including:
| • | constructing and designing the Fund |
| • | portfolio research and security selection |
| • | initial capitalization/funding |
| • | securities trading |
| • | Fund administration |
| • | custody of Fund assets |
| • | daily valuation of the Fund’s portfolio |
| • | shareholder servicing and transfer agency, including shareholder confirmations, recordkeeping, and communications |
| • | legal services (except the independent Directors’ counsel) |
| • | regulatory and portfolio compliance |
| • | financial reporting |
| • | marketing and distribution (except Rule 12b-1 plans) |
The Board noted that many of these services have expanded over time both in terms of quantity and complexity in response to shareholder demands, competition in the industry, changing distribution channels, and the changing regulatory environment.
Investment Management Services. The nature of the investment management services provided to the Fund is quite complex and allows Fund shareholders access to professional money management, instant diversification of their investments within an asset class, the opportunity to easily diversify among asset classes by investing in or exchanging among various American Century Investments funds, and liquidity. In evaluating investment performance, the Board expects the Advisor to manage the Fund in accordance with its investment objectives and approved strategies. Further, the Directors recognize that the Advisor has an obligation to monitor trading activities, and in particular to seek the best execution of fund trades, and to evaluate the use of and payment for research. In providing these services, the Advisor utilizes teams of investment professionals (portfolio managers, analysts, research assistants, and securities traders) who require extensive information technology, research, training, compliance and other systems to conduct their business. The Board, directly and through its Fund Performance Review Committee, regularly reviews investment performance information for the Fund, together with comparative information for appropriate benchmarks and/or peer groups of similarly-managed funds, over different time horizons. The Directors also review detailed performance information during the management agreement approval process. If performance concerns are identified, the Fund receives special reviews until performance improves, during which the Board discusses with the Advisor the reasons for such results (e.g., market conditions, security selection) and any efforts being undertaken to improve performance. The Fund’s performance was above its benchmark for the one-, three-, and five-year periods reviewed by the Board. The Board found the investment management services provided by the Advisor to the Fund to be satisfactory and consistent with the management agreement.
Shareholder and Other Services. Under the management agreement, the Advisor provides the Fund with a comprehensive package of transfer agency, shareholder, and other services. The Board, directly and through various committees of the Board, regularly reviews reports and evaluations of such services at its regular meetings. These reports include, but are not limited to, information regarding the operational efficiency and accuracy of the shareholder and transfer agency services provided, staffing levels, shareholder satisfaction (as measured by external as well as internal sources), technology support, new products and services offered to Fund shareholders, securities trading activities, portfolio valuation services, auditing services, and legal and operational compliance activities. Certain aspects of shareholder and transfer agency service level efficiency and the quality of securities trading activities are measured by independent third party providers and are presented in comparison to other fund groups not managed by the Advisor. The Board
28
found the services provided by the Advisor to the Fund under the management agreement to be competitive and of high quality.
Costs of Services and Profitability. The Advisor provides detailed information concerning its cost of providing various services to the Fund, its profitability in managing the Fund (pre- and post-distribution), its overall profitability, and its financial condition. The Directors have reviewed with the Advisor the methodology used to prepare this financial information. The financial information regarding the Advisor is considered in evaluating the Advisor’s financial condition, its ability to continue to provide services under the management agreement, and the reasonableness of the current management fee. The Board concluded that the Advisor’s profits were reasonable in light of the services provided to the Fund.
Ethics. The Board generally considers the Advisor’s commitment to providing quality services to shareholders and to conducting its business ethically. They noted that the Advisor’s practices generally meet or exceed industry best practices.
Economies of Scale. The Board also reviewed information provided by the Advisor regarding the possible existence of economies of scale in connection with the management of the Fund. The Board concluded that economies of scale are difficult to measure and predict with precision, especially on a fund-by-fund basis. The Board concluded that the Advisor is appropriately sharing economies of scale through its competitive fee structure, offering competitive fees from fund inception, and through reinvestment in its business to provide shareholders additional content and services.
Comparison to Other Funds’ Fees. The management agreement provides that the Fund pays the Advisor a single, all-inclusive (or unified) management fee for providing all services necessary for the management and operation of the Fund, other than brokerage expenses, taxes, interest, extraordinary expenses, and the fees and expenses of the Fund’s independent directors (including their independent legal counsel) and expenses incurred in connection with the provision of shareholder services and distribution services under a plan adopted pursuant to Rule 12b-1 under the 1940 Act. Under the unified fee structure, the Advisor is responsible for providing all investment advisory, custody, audit, administrative, compliance, recordkeeping, marketing and shareholder services, or arranging and supervising third parties to provide such services. By contrast, most other funds are charged a variety of fees, including an investment advisory fee, a transfer agency fee, an administrative fee, distribution charges and other expenses. Other than their investment advisory fees and any applicable Rule 12b-1 distribution fees, all other components of the total fees charged by these other funds may be increased without shareholder approval. The Board believes the unified fee structure is a benefit to Fund shareholders because it clearly discloses to shareholders the cost of owning Fund shares, and, since the unified fee cannot be increased without a vote of Fund shareholders, it shifts to the Advisor the risk of increased costs of operating the Fund and provides a direct incentive to minimize administrative inefficiencies. Part of the Board’s analysis of fee levels involves reviewing certain evaluative data compiled by an independent provider comparing the Fund’s unified fee to the total expense ratios of its peers. The unified fee charged to shareholders of the Fund was above the median of the total expense ratios of the Fund’s peer expense universe and was within the range of its peer expense group. The Board concluded that the management fee paid by the Fund to the Advisor under the management agreement is reasonable in light of the services provided to the Fund.
Comparison to Fees and Services Provided to Other Clients of the Advisor. The Board also requested and received information from the Advisor concerning the nature of the services, fees, costs and profitability of its advisory services to advisory clients other than the Fund. They observed that these varying types of client accounts require different services and involve different regulatory and entrepreneurial risks than the management of the Fund. The Board analyzed this information and concluded that the fees charged and services provided to the Fund were reasonable by comparison.
29
Collateral or “Fall-Out” Benefits Derived by the Advisor. The Board considered the existence of collateral benefits the Advisor may receive as a result of its relationship with the Fund. They concluded that the Advisor’s primary business is managing mutual funds and it generally does not use fund or shareholder information to generate profits in other lines of business, and therefore does not derive any significant collateral benefits from them. The Board noted that the Advisor receives proprietary research from broker-dealers that execute fund portfolio transactions and concluded that this research is likely to benefit Fund shareholders. The Board also determined that the Advisor is able to provide investment management services to certain clients other than the Fund, at least in part, due to its existing infrastructure built to serve the fund complex. The Board concluded, however, that the assets of those other clients are not material to the analysis and, where applicable, may be included with the assets of the Fund to determine breakpoints in the management fee schedule.
Existing Relationship. The Board also considered whether there was any reason for not continuing the existing arrangement with the Advisor. In this regard, the Board was mindful of the potential disruptions of the Fund’s operations and various risks, uncertainties, and other effects that could occur as a result of a decision not to continue such relationship. In particular, the Board recognized that most shareholders have invested in the Fund on the strength of the Advisor’s industry standing and reputation and in the expectation that the Advisor will have a continuing role in providing advisory services to the Fund.
Conclusion of the Directors. As a result of this process, the Board, including all of the independent Directors, taking into account all of the factors discussed above and the information provided by the Advisor and others, concluded that the management agreement between the Fund and the Advisor is fair and reasonable in light of the services provided and should be renewed.
30
| Additional Information |
Retirement Account Information
As required by law, distributions you receive from certain IRAs are subject to federal income tax withholding, unless you elect not to have withholding apply. Tax will be withheld on the total amount withdrawn even though you may be receiving amounts that are not subject to withholding, such as nondeductible contributions. In such case, excess amounts of withholding could occur. You may adjust your withholding election so that a greater or lesser amount will be withheld.
If you don’t want us to withhold on this amount, you must notify us to not withhold the federal income tax. You may notify us in writing or in certain situations by telephone or through other electronic means. For systematic withdrawals, your withholding election will remain in effect until revoked or changed by filing a new election. You have the right to revoke your election at any time.
Remember, even if you elect not to have income tax withheld, you are liable for paying income tax on the taxable portion of your withdrawal. If you elect not to have income tax withheld or you don’t have enough income tax withheld, you may be responsible for payment of estimated tax. You may incur penalties under the estimated tax rules if your withholding and estimated tax payments are not sufficient. You can reduce or defer the income tax on a distribution by directly or indirectly rolling such distribution over to another IRA or eligible plan. You should consult your tax advisor for additional information.
State tax will be withheld if, at the time of your distribution, your address is within one of the mandatory withholding states and you have federal income tax withheld (or as otherwise required by state law). State taxes will be withheld from your distribution in accordance with the respective state rules.
Distributions you receive from 403(b), 457 and qualified plans are subject to special tax and withholding rules. Your plan administrator or plan sponsor is required to provide you with a special tax notice explaining those rules at the time you request a distribution. If applicable, federal and/or state taxes may be withheld from your distribution amount.
Proxy Voting Policies
A description of the policies that the fund's investment advisor uses in exercising the voting rights associated with the securities purchased and/or held by the fund is available without charge, upon request, by calling 1-800-345-2021. It is also available on the "About Us" page of American Century Investments’ website at americancentury.com and on the Securities and Exchange Commission’s website at sec.gov. Information regarding how the investment advisor voted proxies relating to portfolio securities during the most recent 12-month period ended June 30 is available on the "About Us" page at americancentury.com. It is also available at sec.gov.
Quarterly Portfolio Disclosure
The fund files its complete schedule of portfolio holdings with the Securities and Exchange Commission (SEC) for the first and third quarters of each fiscal year on Form N-Q. The fund’s Forms N-Q are available on the SEC’s website at sec.gov, and may be reviewed and copied at the SEC’s Public Reference Room in Washington, DC. Information on the operation of the Public Reference Room may be obtained by calling 1-800-SEC-0330. The fund also makes its complete schedule of portfolio holdings for the most recent quarter of its fiscal year available on its
website at americancentury.com and, upon request, by calling 1-800-345-2021.
31
Other Tax Information
The following information is provided pursuant to provisions of the Internal Revenue Code.
The fund hereby designates up to the maximum amount allowable as qualified dividend income for the fiscal year ended November 30, 2014.
For the fiscal year ended November 30, 2014, the fund intends to pass through to shareholders $603,612, or up to the maximum amount allowable, as a foreign tax credit which represents taxes paid on income derived from sources within foreign countries or possessions of the United States. During the fiscal year ended November 30, 2014, the fund earned $5,701,729 from income derived from foreign sources. Foreign source income and foreign tax expense per outstanding share on November 30, 2014 are $0.1852 and $0.0196, respectively.
32
| ||
| Contact Us | americancentury.com | |
| Automated Information Line | 1-800-345-8765 | |
| Investor Services Representative | 1-800-345-2021 or 816-531-5575 | |
| Investors Using Advisors | 1-800-378-9878 | |
| Business, Not-For-Profit, Employer-Sponsored Retirement Plans | 1-800-345-3533 | |
| Banks and Trust Companies, Broker-Dealers, Financial Professionals, Insurance Companies | 1-800-345-6488 | |
| Telecommunications Relay Service for the Deaf | 711 | |
| American Century World Mutual Funds, Inc. | ||
Investment Advisor: American Century Investment Management, Inc. Kansas City, Missouri | ||
| This report and the statements it contains are submitted for the general information of our shareholders. The report is not authorized for distribution to prospective investors unless preceded or accompanied by an effective prospectus. | ||
| ©2015 American Century Proprietary Holdings, Inc. All rights reserved. CL-ANN-84126 1501 | ||
ANNUAL REPORT | NOVEMBER 30, 2014 |
NT International Growth Fund
| Table of Contents |
| President’s Letter | |
| Performance | |
| Portfolio Commentary | |
| Fund Characteristics | |
| Shareholder Fee Example | |
| Schedule of Investments | |
| Statement of Assets and Liabilities | |
| Statement of Operations | |
| Statement of Changes in Net Assets | |
| Notes to Financial Statements | |
| Financial Highlights | |
| Report of Independent Registered Public Accounting Firm | |
| Management | |
| Approval of Management Agreement | |
| Additional Information | |
Any opinions expressed in this report reflect those of the author as of the date of the report, and do not necessarily represent the opinions of American Century Investments® or any other person in the American Century Investments organization. Any such opinions are subject to change at any time based upon market or other conditions and American Century Investments disclaims any responsibility to update such opinions. These opinions may not be relied upon as investment advice and, because investment decisions made by American Century Investments funds are based on numerous factors, may not be relied upon as an indication of trading intent on behalf of any American Century Investments fund. Security examples are used for representational purposes only and are not intended as recommendations to purchase or sell securities. Performance information for comparative indices and securities is provided to American Century Investments by third party vendors. To the best of American Century Investments’ knowledge, such information is accurate at the time of printing.
| President’s Letter |
| Dear Investor: Thank you for reviewing this annual report for the 12 months ended November 30, 2014. It provides investment performance and portfolio information for the reporting period, plus longer-term historical performance data. Annual reports remain important vehicles for conveying information about fund returns, including market and economic factors that affected performance during the reporting period. For additional, updated investment and market insights, we encourage you to visit our website, americancentury.com. |
| Jonathan Thomas | |
Favorable Fiscal Year for U.S. Investments, While Non-U.S. Lagged
“Global divergence” between the U.S. and the rest of the world emerged as a prevalent theme during the reporting period. As 2014 approached its conclusion, the U.S. appeared to be on a different economic and monetary policy track than most other nations. This theme covered not only the stronger economic growth enjoyed by the U.S. compared with the rest of the world, but also the related contrast between the U.S. Federal Reserve’s unwinding of monetary stimulus versus the continuation and expansion of monetary stimulus by most other central banks.
Global divergence could also generally describe the broad difference between investment returns for U.S. and non-U.S. markets. The perceived strength, safe-haven qualities, and higher yields of U.S. investments attracted global demand. For the reporting period, the S&P 500 Index, the Barclays U.S. Aggregate Bond Index, and the U.S. Dollar Index returned 16.86%, 5.27%, and 9.34%, respectively. By contrast, for U.S. investors unhedged for currency exposure (the dollar’s strength reduced the returns of non-dollar-denominated securities when they were converted to dollars), the MSCI EAFE Index, the MSCI Emerging Markets Index, and the Barclays Global Aggregate Bond Index (ex-USD, unhedged) returned -0.02%, 1.06%, and -2.53%, respectively.
We expect global divergence in economic growth and monetary policies to continue well into 2015, aligned with expectations that the Federal Reserve might finally start raising short-term U.S. interest rates. However, global economic weakness (reflected in recent commodity price declines) and low inflation might delay the rate hikes until the second half of 2015. In this environment, we continue to believe in a disciplined, diversified, long-term investment approach, using professionally managed stock and bond portfolios to meet financial goals. We appreciate your continued trust in us.
Sincerely,
Jonathan Thomas
President and Chief Executive Officer
American Century Investments
2
| Performance |
| Total Returns as of November 30, 2014 | |||||
Average Annual Returns | |||||
Ticker Symbol | 1 year | 5 years | Since Inception | Inception Date | |
Institutional Class | ACLNX | 1.26% | 8.45% | 3.68% | 5/12/06 |
MSCI EAFE Index | — | -0.02% | 6.38% | 2.22% | — |
MSCI EAFE Growth Index | — | 0.65% | 7.36% | 2.85% | — |
| R6 Class | ACDNX | 1.43% | — | 8.05% | 7/26/13 |
| Growth of $10,000 Over Life of Class |
| $10,000 investment made May 12, 2006 |
| Performance for other share classes will vary due to differences in fee structure. |
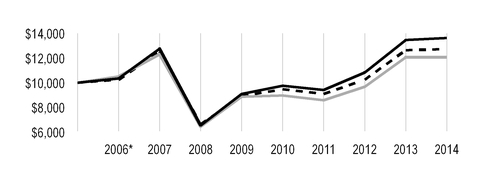
| Value on November 30, 2014 | |
| Institutional Class — $13,630 | |
| MSCI EAFE Index — $12,063 | |
MSCI EAFE Growth Index — $12,718 | |
*From May 12, 2006, the Institutional Class’s inception date. Not annualized.
Total Annual Fund Operating Expenses | |
| Institutional Class | R6 Class |
| 1.02% | 0.87% |
The total annual fund operating expenses shown is as stated in the fund’s prospectus current as of the date of this report. The prospectus may vary from the expense ratio shown elsewhere in this report because it is based on a different time period, includes acquired fund fees and expenses, and, if applicable, does not include fee waivers or expense reimbursements.
Data presented reflect past performance. Past performance is no guarantee of future results. Current performance may be higher or lower than the performance shown. Investment return and principal value will fluctuate, and redemption value may be more or less than original cost. Data assumes reinvestment of dividends and capital gains, and none of the charts reflect the deduction of taxes that a shareholder would pay on fund distributions or the redemption of fund shares. To obtain performance data current to the most recent month end, please call 1-800-345-2021 or visit americancentury.com. For additional information about the fund, please consult the prospectus.
3
| Portfolio Commentary |
Portfolio Manager: Raj Gandhi
As of May 1, Alex Tedder left the fund's management team.
Performance Summary
NT International Growth advanced 1.26%* for the 12 months ended November 30, 2014. The portfolio’s benchmark, the MSCI EAFE Index, declined -0.02% for the same period.
Non-U.S. stocks generally struggled during the 12-month period, as geopolitical risks and sluggish global growth triggered uncertainty and market volatility. As the period unfolded, global growth decoupled, with the U.S. leading the way. Stronger relative growth in the U.S. led to a divergence in central bank policy, with the U.S. Federal Reserve scaling back its stimulus efforts as other leading central banks, including the European Central Bank (ECB) and the Bank of Japan (BOJ), maintained aggressive programs in response to weakening growth and low inflation. In Europe, growth stalled during the period, and concerns about deflation prompted the ECB to slash its key interest rates and initiate a selective bond-buying program. In Japan, growth weakened following an April 1 hike in the nation’s consumption tax, and late in the period the nation slipped into another recession. The BOJ responded with additional monetary easing, and the government postponed the next scheduled hike in the nation’s consumption tax. Diverging central bank policies also helped trigger a strong U.S. dollar rally, which served to further reduce non-U.S. stock returns for U.S.-based investors. The dollar’s relative strength, combined with mounting global supply/demand imbalances, also caused commodities prices (particularly oil) to weaken.
Meanwhile, political unrest also contributed to the challenging investment backdrop. In particular, the ongoing Russia-Ukraine conflict, mounting turmoil throughout the Middle East, and pro-democracy protests in Hong Kong pressured non-U.S. stocks.
Early in the period, investors generally favored value stocks over growth stocks. But this sentiment changed as the period progressed. Fundamentals returned to focus and investors reacted to company-specific events, providing a boost to the growth-oriented stocks the fund favors. Overall, the fund outperformed its benchmark during the period, primarily due to positioning in the information technology, consumer discretionary, and health care sectors. Regionally, an out-of-benchmark position in emerging markets (particularly China), which outpaced non-U.S. developed market stocks during the period, aided relative performance. Stock selection in the U.K. and Denmark, along with an overweight position in Denmark, also contributed to the fund’s outperformance.
Jewelry Retailer Was a Top Contributor
Within the top-performing consumer discretionary sector, the luxury goods industry was a leading contributor. An overweight position in Denmark’s Pandora drove the fund’s performance in that industry and was among the fund’s top overall performers. The jewelry and charm maker and retailer advanced on strong earnings, favorable exposure to U.S. consumers and the improving U.S. economy, expanding store presence (especially in new markets such as China), and successful new product launches.
In addition, within the top-performing U.K. market, an overweight position in Ashtead Group, a construction equipment rental firm, was among the fund’s top contributors. The company benefited
* | All fund returns referenced in this commentary are for Institutional Class shares. Performance for other share classes will vary due to differences in fee structure; when Institutional Class performance exceeds that of the fund's benchmark, other share classes may not. See page 3 for returns for all share classes. |
4
from strong underlying demand and pricing trends, particularly in its key U.S. market. Late in the
period, Ashtead said it expected full-year results to exceed previous projections, driving additional stock gains.
In the health care sector, an overweight position in Shire, a U.K.-based pharmaceutical firm, was a leading contributor to fund performance. Shire’s stock price advanced as the company received—and ultimately rejected—a takeover offer from U.S.-based AbbVie.
Financials Sector Was Main Laggard
Stock selection in the financials, telecommunication services, and utilities sectors, along with underweight positions in telecommunication services and utilities, detracted from relative performance. Regionally, positioning in France, Spain, and Hong Kong weighed on relative results.
An overweight position in Weir Group, a U.K.-based provider of products and services for the minerals, oil and gas, power, and industrial markets, was a main performance detractor, declining primarily due to plunging oil prices. Late in the period, we reduced the fund’s position in Weir Group on concerns about declining capital spending budgets and a reduction in drilling activity.
Similarly, an overweight position in the U.K.’s BG Group, an oil and natural gas producer, was among the fund’s largest detractors. The company’s stock price weakened along with the decline in oil prices.
Within the financials sector, an overweight position in Japan’s ORIX Corp., a diversified financial services company, was a prominent detractor. Early in the period, as the perception grew that Japan’s economy would fade rapidly after the April 1 consumption tax increase, Japan-based stocks broadly sold off—especially within the financials sector.
Outlook
Despite the uncertainties in Europe, we continue to find companies that meet our criteria of demonstrating improving, sustainable growth. Specifically, we remain focused on European-based companies with exposure to the strengthening U.S. economy and those benefiting from company-specific or secular growth stories. We are maintaining a slight underweight position in Japan, favoring companies that can take advantage of a weak yen and firms advancing due to strong secular growth trends. The emerging markets continue to contend with slowing growth and persistent inflationary pressures. We remain selective, focusing on companies we believe are demonstrating sustainable fundamental improvements. We also favor emerging market companies benefiting from strong secular trends, such as the growing demand for internet services in China.
5
| Fund Characteristics |
| NOVEMBER 30, 2014 | |
Top Ten Holdings | % of net assets |
| Roche Holding AG | 3.0% |
| Nestle SA | 2.0% |
| Novartis AG | 2.0% |
| Pandora A/S | 1.9% |
| Bayer AG | 1.8% |
| Nidec Corp. | 1.8% |
| ASML Holding NV | 1.8% |
| Associated British Foods plc | 1.7% |
| Ashtead Group plc | 1.7% |
| Keyence Corp. | 1.6% |
Types of Investments in Portfolio | % of net assets |
| Foreign Common Stocks | 97.1% |
| Temporary Cash Investments | 2.5% |
| Other Assets and Liabilities | 0.4% |
Investments by Country | % of net assets |
| United Kingdom | 22.1% |
| Japan | 17.2% |
| Switzerland | 10.3% |
| France | 6.3% |
| Netherlands | 5.7% |
| Germany | 5.3% |
| China | 4.2% |
| Denmark | 4.2% |
| India | 2.7% |
| Australia | 2.7% |
| Italy | 2.5% |
| Sweden | 2.5% |
| Spain | 2.2% |
| Belgium | 2.1% |
| Other Countries | 7.1% |
| Cash and Equivalents* | 2.9% |
| *Includes temporary cash investments and other assets and liabilities. | |
6
| Shareholder Fee Example |
Fund shareholders may incur two types of costs: (1) transaction costs, including sales charges (loads) on purchase payments and redemption/exchange fees; and (2) ongoing costs, including management fees; distribution and service (12b-1) fees; and other fund expenses. This example is intended to help you understand your ongoing costs (in dollars) of investing in your fund and to compare these costs with the ongoing cost of investing in other mutual funds.
The example is based on an investment of $1,000 made at the beginning of the period and held for the entire period from June 1, 2014 to November 30, 2014.
Actual Expenses
The table provides information about actual account values and actual expenses for each class. You may use the information, together with the amount you invested, to estimate the expenses that you paid over the period. First, identify the share class you own. Then simply divide your account value by $1,000 (for example, an $8,600 account value divided by $1,000 = 8.6), then multiply the result by the number under the heading “Expenses Paid During Period” to estimate the expenses you paid on your account during this period.
If you hold Investor Class shares of any American Century Investments fund, or Institutional Class shares of the American Century Diversified Bond Fund, in an American Century Investments account (i.e., not a financial intermediary or retirement plan account), American Century Investments may charge you a $12.50 semiannual account maintenance fee if the value of those shares is less than $10,000. We will redeem shares automatically in one of your accounts to pay the $12.50 fee. In determining your total eligible investment amount, we will include your investments in all personal accounts (including American Century Investments Brokerage accounts) registered under your Social Security number. Personal accounts include individual accounts, joint accounts, UGMA/UTMA accounts, personal trusts, Coverdell Education Savings Accounts and IRAs (including traditional, Roth, Rollover, SEP-, SARSEP- and SIMPLE-IRAs), and certain other retirement accounts. If you have only business, business retirement, employer-sponsored or American Century Investments Brokerage accounts, you are currently not subject to this fee. If you are subject to the Account Maintenance Fee, your account value could be reduced by the fee amount.
Hypothetical Example for Comparison Purposes
The table also provides information about hypothetical account values and hypothetical expenses based on the actual expense ratio of each class of your fund and an assumed rate of return of 5% per year before expenses, which is not the actual return of a fund’s share class. The hypothetical account values and expenses may not be used to estimate the actual ending account balance or expenses you paid for the period. You may use this information to compare the ongoing costs of investing in your fund and other funds. To do so, compare this 5% hypothetical example with the 5% hypothetical examples that appear in the shareholder reports of the other funds.
Please note that the expenses shown in the table are meant to highlight your ongoing costs only and do not reflect any transactional costs, such as sales charges (loads) or redemption/exchange fees. Therefore, the table is useful in comparing ongoing costs only, and will not help you determine the relative total costs of owning different funds. In addition, if these transactional costs were included, your costs would have been higher.
7
| Beginning Account Value 6/1/14 | Ending Account Value 11/30/14 | Expenses Paid During Period(1) 6/1/14 - 11/30/14 | Annualized Expense Ratio(1) | |
Actual | ||||
| Institutional Class | $1,000 | $978.00 | $4.81 | 0.97% |
| R6 Class | $1,000 | $978.90 | $4.07 | 0.82% |
Hypothetical | ||||
| Institutional Class | $1,000 | $1,020.21 | $4.91 | 0.97% |
| R6 Class | $1,000 | $1,020.96 | $4.15 | 0.82% |
| (1) | Expenses are equal to the class's annualized expense ratio listed in the table above, multiplied by the average account value over the period, multiplied by 183, the number of days in the most recent fiscal half-year, divided by 365, to reflect the one-half year period. |
8
| Schedule of Investments |
NOVEMBER 30, 2014
| Shares | Value | ||||
| COMMON STOCKS — 97.1% | |||||
| Australia — 2.7% | |||||
| BHP Billiton Ltd. | 145,730 | $ | 3,834,132 | ||
| Commonwealth Bank of Australia | 125,194 | 8,598,907 | |||
| CSL Ltd. | 194,265 | 13,648,831 | |||
| 26,081,870 | |||||
| Belgium — 2.1% | |||||
| Anheuser-Busch InBev NV | 110,748 | 13,008,050 | |||
KBC Groep NV(1) | 126,170 | 7,216,761 | |||
| 20,224,811 | |||||
| Brazil — 0.6% | |||||
| Kroton Educacional SA | 850,600 | 5,879,312 | |||
| China — 4.2% | |||||
Alibaba Group Holding Ltd. ADR(1) | 49,293 | 5,503,071 | |||
Baidu, Inc. ADR(1) | 51,170 | 12,542,279 | |||
Ctrip.com International Ltd. ADR(1) | 88,680 | 4,795,814 | |||
| Haier Electronics Group Co. Ltd. | 1,835,000 | 5,122,691 | |||
| Tencent Holdings Ltd. | 568,800 | 9,094,639 | |||
Vipshop Holdings Ltd. ADR(1) | 171,700 | 3,925,062 | |||
| 40,983,556 | |||||
| Denmark — 4.2% | |||||
| Coloplast A/S, B Shares | 67,810 | 5,875,877 | |||
| GN Store Nord A/S | 435,280 | 9,296,720 | |||
| Novo Nordisk A/S, B Shares | 145,420 | 6,632,204 | |||
| Pandora A/S | 211,990 | 18,812,221 | |||
| 40,617,022 | |||||
| France — 6.3% | |||||
| Accor SA | 182,640 | 8,615,180 | |||
| Carrefour SA | 185,616 | 5,872,814 | |||
| Cie Generale d'Optique Essilor International SA | 57,111 | 6,412,626 | |||
| Schneider Electric SE | 116,818 | 9,528,883 | |||
| Total SA | 188,000 | 10,517,250 | |||
| Valeo SA | 58,720 | 7,224,873 | |||
| Zodiac Aerospace | 374,590 | 12,413,143 | |||
| 60,584,769 | |||||
| Germany — 5.3% | |||||
| Bayer AG | 116,810 | 17,567,674 | |||
| Continental AG | 28,781 | 6,055,285 | |||
| Daimler AG | 107,610 | 9,072,160 | |||
| Symrise AG | 178,470 | 10,666,515 | |||
| Wirecard AG | 183,843 | 7,802,105 | |||
| 51,163,739 | |||||
9
| Shares | Value | ||||
| Hong Kong — 0.6% | |||||
| Galaxy Entertainment Group Ltd. | 926,000 | $ | 6,322,388 | ||
| India — 2.7% | |||||
| ICICI Bank Ltd. ADR | 214,460 | 12,629,550 | |||
| Tata Consultancy Services Ltd. | 198,470 | 8,453,085 | |||
| Tata Motors Ltd. ADR | 110,703 | 5,054,699 | |||
| 26,137,334 | |||||
| Indonesia — 0.7% | |||||
| PT Bank Mandiri (Persero) Tbk | 7,544,200 | 6,506,285 | |||
| Ireland — 1.7% | |||||
Bank of Ireland(1) | 24,354,936 | 9,993,769 | |||
Ryanair Holdings plc ADR(1) | 98,822 | 6,214,916 | |||
| 16,208,685 | |||||
| Italy — 2.5% | |||||
| Intesa Sanpaolo SpA | 2,434,660 | 7,501,843 | |||
| Luxottica Group SpA | 193,254 | 10,332,974 | |||
| UniCredit SpA | 937,600 | 6,931,031 | |||
| 24,765,848 | |||||
| Japan — 17.2% | |||||
| Daikin Industries Ltd. | 149,600 | 9,923,767 | |||
| Daito Trust Construction Co. Ltd. | 73,000 | 8,239,902 | |||
| FANUC Corp. | 31,500 | 5,312,134 | |||
| Fuji Heavy Industries Ltd. | 424,000 | 15,422,078 | |||
| Keyence Corp. | 33,500 | 15,469,570 | |||
| Komatsu Ltd. | 244,600 | 5,791,775 | |||
| Kubota Corp. | 577,000 | 9,016,005 | |||
| Mizuho Financial Group, Inc. | 3,286,100 | 5,660,679 | |||
| Murata Manufacturing Co. Ltd. | 85,300 | 9,215,116 | |||
| Nidec Corp. | 263,300 | 17,459,442 | |||
| Nitori Holdings Co. Ltd. | 91,100 | 5,049,387 | |||
| Ono Pharmaceutical Co. Ltd. | 66,900 | 5,725,511 | |||
| ORIX Corp. | 760,800 | 10,032,704 | |||
| Panasonic Corp. | 734,700 | 9,484,292 | |||
| Rakuten, Inc. | 603,327 | 8,126,352 | |||
| Seven & I Holdings Co. Ltd. | 213,800 | 7,973,714 | |||
| Suzuki Motor Corp. | 359,100 | 11,341,831 | |||
| Unicharm Corp. | 298,000 | 6,820,250 | |||
| 166,064,509 | |||||
| Mexico — 1.1% | |||||
Cemex SAB de CV ADR(1) | 822,883 | 10,294,266 | |||
| Netherlands — 5.7% | |||||
| Akzo Nobel NV | 153,051 | 10,573,695 | |||
| ASML Holding NV | 164,614 | 17,384,262 | |||
| Boskalis Westminster NV | 130,510 | 7,323,006 | |||
ING Groep NV CVA(1) | 831,210 | 12,175,433 | |||
NXP Semiconductor NV(1) | 97,210 | 7,563,910 | |||
| 55,020,306 | |||||
10
| Shares | Value | ||||
| Norway — 0.7% | |||||
| Statoil ASA | 362,960 | $ | 6,855,184 | ||
| Russia — 0.7% | |||||
| Magnit PJSC GDR | 119,800 | 6,930,430 | |||
| Spain — 2.2% | |||||
Bankia SA(1) | 6,786,912 | 11,899,253 | |||
| Inditex SA | 328,675 | 9,569,499 | |||
| 21,468,752 | |||||
| Sweden — 2.5% | |||||
| Electrolux AB | 335,580 | 9,973,048 | |||
| Skandinaviska Enskilda Banken AB, A Shares | 1,048,460 | 13,850,012 | |||
| 23,823,060 | |||||
| Switzerland — 10.3% | |||||
| Adecco SA | 174,184 | 12,231,187 | |||
| Chocoladefabriken Lindt & Spruengli AG | 1,190 | 5,994,029 | |||
| Credit Suisse Group AG | 305,990 | 8,176,623 | |||
| Nestle SA | 261,160 | 19,608,960 | |||
| Novartis AG | 197,046 | 19,067,323 | |||
| Roche Holding AG | 95,654 | 28,649,177 | |||
| Sika AG | 1,681 | 6,398,673 | |||
| 100,125,972 | |||||
| Taiwan — 0.8% | |||||
| Taiwan Semiconductor Manufacturing Co. Ltd. ADR | 313,791 | 7,364,675 | |||
| Turkey — 0.2% | |||||
| BIM Birlesik Magazalar AS | 101,399 | 2,254,934 | |||
| United Kingdom — 22.1% | |||||
| Ashtead Group plc | 1,002,523 | 16,505,014 | |||
| Associated British Foods plc | 337,583 | 16,889,564 | |||
| Barclays plc | 1,614,610 | 6,182,733 | |||
| BG Group plc | 617,883 | 8,688,128 | |||
| BT Group plc | 1,244,810 | 7,975,899 | |||
| Bunzl plc | 226,860 | 6,328,785 | |||
| Burberry Group plc | 401,474 | 10,347,187 | |||
| Carnival plc | 202,090 | 8,901,739 | |||
International Consolidated Airlines Group SA(1) | 1,498,330 | 10,707,289 | |||
| Intertek Group plc | 149,730 | 5,461,056 | |||
| Johnson Matthey plc | 230,638 | 11,982,131 | |||
| Prudential plc | 488,260 | 11,806,007 | |||
| Reckitt Benckiser Group plc | 177,630 | 14,580,418 | |||
| Rio Tinto plc | 315,296 | 14,737,831 | |||
Royal Bank of Scotland Group plc(1) | 2,243,740 | 13,854,163 | |||
| Shire plc | 151,080 | 10,753,924 | |||
| Smith & Nephew plc | 540,850 | 9,377,363 | |||
| St. James's Place plc | 709,590 | 8,800,532 | |||
| Weir Group plc (The) | 238,130 | 6,977,950 | |||
| Whitbread plc | 179,668 | 12,873,019 | |||
| 213,730,732 | |||||
TOTAL COMMON STOCKS (Cost $806,634,830) | 939,408,439 | ||||
11
| Shares | Value | ||||
| TEMPORARY CASH INVESTMENTS — 2.5% | |||||
State Street Institutional Liquid Reserves Fund, Premier Class (Cost $23,765,750) | 23,765,750 | $ | 23,765,750 | ||
TOTAL INVESTMENT SECURITIES — 99.6% (Cost $830,400,580) | 963,174,189 | ||||
| OTHER ASSETS AND LIABILITIES — 0.4% | 3,718,426 | ||||
| TOTAL NET ASSETS — 100.0% | $ | 966,892,615 | |||
| MARKET SECTOR DIVERSIFICATION | ||
(as a % of net assets) | ||
| Consumer Discretionary | 19.6 | % |
| Financials | 17.7 | % |
| Industrials | 14.7 | % |
| Health Care | 13.9 | % |
| Information Technology | 10.5 | % |
| Consumer Staples | 10.2 | % |
| Materials | 7.0 | % |
| Energy | 2.7 | % |
| Telecommunication Services | 0.8 | % |
| Cash and Equivalents* | 2.9 | % |
*Includes temporary cash investments and other assets and liabilities.
| NOTES TO SCHEDULE OF INVESTMENTS | ||
| ADR | - | American Depositary Receipt |
| CVA | - | Certificaten Van Aandelen |
| GDR | - | Global Depositary Receipt |
| PJSC | - | Public Joint Stock Company |
| (1) | Non-income producing. |
See Notes to Financial Statements.
12
| Statement of Assets and Liabilities |
| NOVEMBER 30, 2014 | |||
| Assets | |||
| Investment securities, at value (cost of $830,400,580) | $ | 963,174,189 | |
| Cash | 2,550 | ||
| Foreign currency holdings, at value (cost of $187,253) | 183,202 | ||
| Receivable for investments sold | 3,615,089 | ||
| Receivable for capital shares sold | 38,830 | ||
| Dividends and interest receivable | 1,700,402 | ||
| Other assets | 36,665 | ||
| 968,750,927 | |||
| Liabilities | |||
| Payable for capital shares redeemed | 1,039,123 | ||
| Accrued management fees | 746,539 | ||
| Accrued foreign taxes | 72,650 | ||
| 1,858,312 | |||
| Net Assets | $ | 966,892,615 | |
| Net Assets Consist of: | |||
| Capital (par value and paid-in surplus) | $ | 803,175,043 | |
| Undistributed net investment income | 1,241,949 | ||
| Undistributed net realized gain | 29,886,409 | ||
| Net unrealized appreciation | 132,589,214 | ||
| $ | 966,892,615 | ||
| Net Assets | Shares Outstanding | Net Asset Value Per Share | ||||
| Institutional Class, $0.01 Par Value | $938,672,400 | 81,062,267 | $11.58 | |||
| R6 Class, $0.01 Par Value | $28,220,215 | 2,434,936 | $11.59 | |||
See Notes to Financial Statements.
13
| Statement of Operations |
| YEAR ENDED NOVEMBER 30, 2014 | |||
| Investment Income (Loss) | |||
| Income: | |||
| Dividends (net of foreign taxes withheld of $1,715,743) | $ | 15,965,642 | |
| Interest | 3,226 | ||
| 15,968,868 | |||
| Expenses: | |||
| Management fees | 8,433,598 | ||
| Directors' fees and expenses | 20,913 | ||
| Other expenses | 3,179 | ||
| 8,457,690 | |||
| Net investment income (loss) | 7,511,178 | ||
| Realized and Unrealized Gain (Loss) | |||
| Net realized gain (loss) on: | |||
| Investment transactions (net of foreign tax expenses paid (refunded) of $38,514) | 33,985,559 | ||
| Foreign currency transactions | (269,483 | ) | |
| 33,716,076 | |||
| Change in net unrealized appreciation (depreciation) on: | |||
| Investments (includes (increase) decrease in accrued foreign taxes of $128,599) | (29,154,761 | ) | |
| Translation of assets and liabilities in foreign currencies | (150,795 | ) | |
| (29,305,556 | ) | ||
| Net realized and unrealized gain (loss) | 4,410,520 | ||
| Net Increase (Decrease) in Net Assets Resulting from Operations | $ | 11,921,698 | |
See Notes to Financial Statements.
14
| Statement of Changes in Net Assets |
| YEARS ENDED NOVEMBER 30, 2014 AND NOVEMBER 30, 2013 | ||||||
| Increase (Decrease) in Net Assets | November 30, 2014 | November 30, 2013 | ||||
| Operations | ||||||
| Net investment income (loss) | $ | 7,511,178 | $ | 6,369,114 | ||
| Net realized gain (loss) | 33,716,076 | 51,288,405 | ||||
| Change in net unrealized appreciation (depreciation) | (29,305,556 | ) | 79,335,173 | |||
| Net increase (decrease) in net assets resulting from operations | 11,921,698 | 136,992,692 | ||||
| Distributions to Shareholders | ||||||
| From net investment income: | ||||||
| Institutional Class | (10,834,636 | ) | (7,491,880 | ) | ||
| R6 Class | (101,158 | ) | — | |||
| From net realized gains: | ||||||
| Institutional Class | (34,990,441 | ) | — | |||
| R6 Class | (295,487 | ) | — | |||
| Decrease in net assets from distributions | (46,221,722 | ) | (7,491,880 | ) | ||
| Capital Share Transactions | ||||||
| Net increase (decrease) in net assets from capital share transactions (Note 5) | 223,587,166 | 160,140,262 | ||||
| Net increase (decrease) in net assets | 189,287,142 | 289,641,074 | ||||
| Net Assets | ||||||
| Beginning of period | 777,605,473 | 487,964,399 | ||||
| End of period | $ | 966,892,615 | $ | 777,605,473 | ||
| Undistributed net investment income | $ | 1,241,949 | $ | 4,793,999 | ||
See Notes to Financial Statements.
15
| Notes to Financial Statements |
NOVEMBER 30, 2014
1. Organization
American Century World Mutual Funds, Inc. (the corporation) is registered under the Investment Company Act of 1940, as amended (the 1940 Act), as an open-end management investment company and is organized as a Maryland corporation. NT International Growth Fund (the fund) is one fund in a series issued by the corporation. The fund is diversified as defined under the 1940 Act. The fund’s investment objective is to seek capital growth. The fund is not permitted to invest in securities issued by companies assigned the Global Industry Classification Standard for the tobacco industry.
The fund offers the Institutional Class and the R6 Class, which have different fees and expenses. The difference in the fee structures between the classes is not the result of any difference in advisory or custodial fees or other expenses related to management of the fund’s assets, which do not vary by class. The fund’s R6 Class shares are available for purchase exclusively by certain American Century Investments funds of funds that are offered only through employer-sponsored retirement plans where a financial intermediary provides retirement recordkeeping services to plan participants. Because financial intermediaries do not receive any service, distribution or administrative fees for offering such funds of funds, American Century Investment Management, Inc. (ACIM) (the investment advisor) is able to charge the R6 Class a lower unified management fee. Sale of the R6 Class commenced on July 26, 2013.
2. Significant Accounting Policies
The following is a summary of significant accounting policies consistently followed by the fund in preparation of its financial statements. The fund is an investment company and follows accounting and reporting guidance in accordance with accounting principles generally accepted in the United States of America. This may require management to make certain estimates and assumptions at the date of the financial statements. Actual results could differ from these estimates. Management evaluated the impact of events or transactions occurring through the date the financial statements were issued that would merit recognition or disclosure.
Investment Valuations — The fund determines the fair value of its investments and computes its net asset value per share at the close of regular trading (usually 4 p.m. Eastern time) on the New York Stock Exchange (NYSE) on each day the NYSE is open. The Board of Directors has adopted valuation policies and procedures to guide the investment advisor in the fund’s investment valuation process and to provide methodologies for the oversight of the fund’s pricing function.
Equity securities that are listed or traded on a domestic securities exchange are valued at the last reported sales price or at the official closing price as provided by the exchange. Equity securities traded on foreign securities exchanges are generally valued at the closing price of such securities on the exchange where primarily traded or at the close of the NYSE, if that is earlier. If no last sales price is reported, or if local convention or regulation so provides, the mean of the latest bid and asked prices may be used. Securities traded over-the-counter are valued at the mean of the latest bid and asked prices, the last sales price, or the official closing price. Equity securities initially expressed in local currencies are translated into U.S. dollars at the mean of the appropriate currency exchange rate at the close of the NYSE as provided by an independent pricing service.
Fixed income securities maturing within 60 days at the time of purchase may be valued at cost, plus or minus any amortized discount or premium or at the evaluated mean as provided by an independent pricing service. Evaluated mean prices are commonly derived through utilization of market models, which may consider, among other factors: trade data, quotations from dealers and active market makers, relevant yield curve and spread data, related sector levels, creditworthiness, trade data or market information on comparable securities, and other relevant security specific information.
Open-end management investment companies are valued at the reported net asset value per share. Repurchase agreements are valued at cost, which approximates fair value.
16
If the fund determines that the market price for an investment is not readily available or the valuation methods mentioned above do not reflect an investment’s fair value, such investment is valued as determined in good faith by the Board of Directors or its delegate, in accordance with policies and procedures adopted by the Board of Directors. In its determination of fair value, the fund may review several factors including, but not limited to, market information regarding the specific investment or comparable investments and correlation with other investment types, futures indices or general market indicators. Circumstances that may cause the fund to use these procedures to value an investment include, but are not limited to: an investment has been declared in default or is distressed; trading in a security has been suspended during the trading day or a security is not actively trading on its principal exchange; prices received from a regular pricing source are deemed unreliable; or there is a foreign market holiday and no trading occurred.
The fund monitors for significant events occurring after the close of an investment’s primary exchange but before the fund’s net asset value per share is determined. Significant events may include, but are not limited to: corporate announcements and transactions; governmental action and political unrest that could impact a specific investment or an investment sector; or armed conflicts, natural disasters and similar events that could affect investments in a specific country or region. The fund also monitors for significant fluctuations between domestic and foreign markets, as evidenced by the U.S. market or such other indicators that the Board of Directors, or its delegate, deems appropriate. If significant fluctuations in foreign markets are identified, the fund may apply a model-derived factor to the closing price of equity securities traded on foreign securities exchanges. The factor is based on observable market data as provided by an independent pricing service.
Security Transactions — Security transactions are accounted for as of the trade date. Net realized gains and losses are determined on the identified cost basis, which is also used for federal income tax purposes. Certain countries impose taxes on realized gains on the sale of securities registered in their country. The fund records the foreign tax expense, if any, on an accrual basis. The foreign tax expense on realized gains and unrealized appreciation reduces the net realized gain (loss) on investment transactions and net unrealized appreciation (depreciation) on investments, respectively.
Investment Income — Dividend income less foreign taxes withheld, if any, is recorded as of the ex-dividend date. Distributions received on securities that represent a return of capital or long-term capital gain are recorded as a reduction of cost of investments and/or as a realized gain. The fund may estimate the components of distributions received that may be considered nontaxable distributions or long-term capital gain distributions for income tax purposes. Interest income is recorded on the accrual basis and includes accretion of discounts and amortization of premiums.
Foreign Currency Translations — All assets and liabilities initially expressed in foreign currencies are translated into U.S. dollars at prevailing exchange rates at period end. The fund may enter into spot foreign currency exchange contracts to facilitate transactions denominated in a foreign currency. Purchases and sales of investment securities, dividend and interest income, spot foreign currency exchange contracts, and expenses are translated at the rates of exchange prevailing on the respective dates of such transactions. Net realized and unrealized foreign currency exchange gains or losses related to investment securities are a component of net realized gain (loss) on investment transactions and change in net unrealized appreciation (depreciation) on investments, respectively.
Repurchase Agreements — The fund may enter into repurchase agreements with institutions that ACIM has determined are creditworthy pursuant to criteria adopted by the Board of Directors. The fund requires that the collateral, represented by securities, received in a repurchase transaction be transferred to the custodian in a manner sufficient to enable the fund to obtain those securities in the event of a default under the repurchase agreement. ACIM monitors, on a daily basis, the securities transferred to ensure the value, including accrued interest, of the securities under each repurchase agreement is equal to or greater than amounts owed to the fund under each repurchase agreement.
Joint Trading Account — Pursuant to an Exemptive Order issued by the Securities and Exchange Commission, the fund, along with certain other funds in the American Century Investments family of funds, may transfer uninvested cash balances into a joint trading account. These balances are invested in one or more repurchase agreements that are collateralized by U.S. Treasury or Agency obligations.
17
Income Tax Status — It is the fund’s policy to distribute substantially all net investment income and net realized gains to shareholders and to otherwise qualify as a regulated investment company under provisions of the Internal Revenue Code. Accordingly, no provision has been made for income taxes. The fund files U.S. federal, state, local and non-U.S. tax returns as applicable. The fund's tax returns are subject to examination by the relevant taxing authority until expiration of the applicable statute of limitations, which is generally three years from the date of filing but can be longer in certain jurisdictions. At this time, management believes there are no uncertain tax positions which, based on their technical merit, would not be sustained upon examination and for which it is reasonably possible that the total amounts of unrecognized tax benefits will significantly change in the next twelve months.
Multiple Class — All shares of the fund represent an equal pro rata interest in the net assets of the class to which such shares belong, and have identical voting, dividend, liquidation and other rights and the same terms and conditions, except for class specific expenses and exclusive rights to vote on matters affecting only individual classes. Income, non-class specific expenses, and realized and unrealized capital gains and losses of the fund are allocated to each class of shares based on their relative net assets.
Distributions to Shareholders — Distributions from net investment income and net realized gains, if any, are generally declared and paid annually. The fund may make distributions on a more frequent basis to comply with the distribution requirements of the Internal Revenue Code, in all events in a manner consistent with provisions of the 1940 Act.
Indemnifications — Under the corporation’s organizational documents, its officers and directors are indemnified against certain liabilities arising out of the performance of their duties to the fund. In addition, in the normal course of business, the fund enters into contracts that provide general indemnifications. The maximum exposure under these arrangements is unknown as this would involve future claims that may be made against a fund. The risk of material loss from such claims is considered by management to be remote.
3. Fees and Transactions with Related Parties
Certain officers and directors of the corporation are also officers and/or directors of American Century Companies, Inc. (ACC). The corporation’s investment advisor, ACIM, the corporation's distributor, American Century Investment Services, Inc., and the corporation’s transfer agent, American Century Services, LLC, are wholly owned, directly or indirectly, by ACC. Various funds issued by American Century Asset Allocation Portfolios, Inc. own, in aggregate, 100% of the shares of the fund. Related parties do not invest in the fund for the purpose of exercising management or control.
Management Fees —The corporation has entered into a management agreement with ACIM, under which ACIM provides the fund with investment advisory and management services in exchange for a single, unified management fee (the fee) per class. The agreement provides that all expenses of managing and operating the fund, except distribution and service fees, brokerage expenses, taxes, interest, fees and expenses of the independent directors (including legal counsel fees), and extraordinary expenses, will be paid by ACIM. The fee is computed and accrued daily based on each class’s daily net assets and paid monthly in arrears. The rate of the fee is determined by applying a fee rate calculation formula. This formula takes into account the fund’s assets as well as certain assets, if any, of other clients of the investment advisor outside the American Century Investments family of funds (such as subadvised funds and separate accounts) that have very similar investment teams and investment strategies (strategy assets). The strategy assets of the fund also include the assets of International Growth Fund, one fund in a series issued by the corporation. The annual management fee schedule ranges from 0.850% to 1.300% for the Institutional Class and 0.700% to 1.150% for the R6 Class. The effective annual management fee for each class for the year ended November 30, 2014 was 0.98% for the Institutional Class and 0.83% for the R6 Class.
Directors' Fees and Expenses — The Board of Directors is responsible for overseeing the investment advisor’s management and operations of the fund. The directors receive detailed information about the fund and its investment advisor regularly throughout the year, and meet at least quarterly with management of the investment advisor to review reports about fund operations. Fees and expenses incurred in conjunction with the directors during the year ended November 30, 2014 are detailed in the Statement of Operations. The fund’s officers do not receive compensation from the fund.
4. Investment Transactions
Purchases and sales of investment securities, excluding short-term investments, for the year ended November 30, 2014 were $741,842,565 and $576,256,763, respectively.
18
5. Capital Share Transactions
Transactions in shares of the fund were as follows:
Year ended November 30, 2014 | Year ended November 30, 2013(1) | |||||||||
| Shares | Amount | Shares | Amount | |||||||
| Institutional Class/Shares Authorized | 250,000,000 | 250,000,000 | ||||||||
| Sold | 17,236,169 | $ | 198,956,960 | 16,389,161 | $ | 178,466,964 | ||||
| Issued in reinvestment of distributions | 4,106,190 | 45,825,077 | 741,776 | 7,491,880 | ||||||
| Redeemed | (3,650,915 | ) | (42,916,826 | ) | (2,826,607 | ) | (32,253,447 | ) | ||
| 17,691,444 | 201,865,211 | 14,304,330 | 153,705,397 | |||||||
| R6 Class/Shares Authorized | 50,000,000 | 50,000,000 | ||||||||
| Sold | 2,044,961 | 23,470,447 | 559,698 | 6,686,823 | ||||||
| Issued in reinvestment of distributions | 35,574 | 396,645 | — | — | ||||||
| Redeemed | (184,284 | ) | (2,145,137 | ) | (21,013 | ) | (251,958 | ) | ||
| 1,896,251 | 21,721,955 | 538,685 | 6,434,865 | |||||||
| Net increase (decrease) | 19,587,695 | $ | 223,587,166 | 14,843,015 | $ | 160,140,262 | ||||
| (1) | July 26, 2013 (commencement of sale) through November 30, 2013 for the R6 Class. |
6. Fair Value Measurements
The fund’s investments valuation process is based on several considerations and may use multiple inputs to determine the fair value of the investments held by the fund. In conformity with accounting principles generally accepted in the United States of America, the inputs used to determine a valuation are classified into three broad levels.
| • | Level 1 valuation inputs consist of unadjusted quoted prices in an active market for identical investments. |
| • | Level 2 valuation inputs consist of direct or indirect observable market data (including quoted prices for comparable investments, evaluations of subsequent market events, interest rates, prepayment speeds, credit risk, etc.). These inputs also consist of quoted prices for identical investments initially expressed in local currencies that are adjusted through translation into U.S. dollars. |
| • | Level 3 valuation inputs consist of unobservable data (including a fund’s own assumptions). |
The level classification is based on the lowest level input that is significant to the fair valuation measurement. The valuation inputs are not necessarily an indication of the risks associated with investing in these securities or other financial instruments. There were no significant transfers between levels during the period.
The following is a summary of the level classifications as of period end. The Schedule of Investments provides additional information on the fund’s portfolio holdings.
| Level 1 | Level 2 | Level 3 | ||||||
| Assets | ||||||||
| Investment Securities | ||||||||
| Common Stocks | ||||||||
| China | $ | 26,766,226 | $ | 14,217,330 | — | |||
| India | 17,684,249 | 8,453,085 | — | |||||
| Ireland | 6,214,916 | 9,993,769 | — | |||||
| Mexico | 10,294,266 | — | — | |||||
| Netherlands | 7,563,910 | 47,456,396 | — | |||||
| Taiwan | 7,364,675 | — | — | |||||
| Other Countries | — | 783,399,617 | — | |||||
| Temporary Cash Investments | 23,765,750 | — | — | |||||
| $ | 99,653,992 | $ | 863,520,197 | — | ||||
19
7. Risk Factors
There are certain risks involved in investing in foreign securities. These risks include those resulting from future adverse political, social and economic developments, fluctuations in currency exchange rates, the possible imposition of exchange controls, and other foreign laws or restrictions. Investing in emerging markets may accentuate these risks.
8. Federal Tax Information
On December 16, 2014, the fund declared and paid a per-share distribution from net realized gains
to shareholders of record on December 15, 2014 of $0.3963 for the Institutional Class and R6 Class.
On December 16, 2014, the fund declared and paid the following per-share distributions from net investment income to shareholders of record on December 15, 2014:
| Institutional Class | R6 Class |
| $0.0542 | $0.0706 |
The tax character of distributions paid during the years ended November 30, 2014 and November 30, 2013 were as follows:
| 2014 | 2013 | |||||
| Distributions Paid From | ||||||
| Ordinary income | $ | 10,935,794 | $ | 7,491,880 | ||
| Long-term capital gains | $ | 35,285,928 | — | |||
The book-basis character of distributions made during the year from net investment income or net realized gains may differ from their ultimate characterization for federal income tax purposes. These differences reflect the differing character of certain income items and net realized gains and losses for financial statement and tax purposes, and may result in reclassification among certain capital accounts on the financial statements.
As of November 30, 2014, the federal tax cost of investments and the components of distributable earnings on a tax-basis were as follows:
| Federal tax cost of investments | $ | 835,725,046 | |
| Gross tax appreciation of investments | $ | 148,930,361 | |
| Gross tax depreciation of investments | (21,481,218 | ) | |
| Net tax appreciation (depreciation) of investments | 127,449,143 | ||
| Net tax appreciation (depreciation) on translation of assets and liabilities in foreign currencies | (184,268 | ) | |
Net tax appreciation (depreciation) | $ | 127,264,875 | |
| Undistributed ordinary income | $ | 4,072,759 | |
Accumulated long-term gains | $ | 32,379,938 | |
The difference between book-basis and tax-basis unrealized appreciation (depreciation) is attributable primarily to the realization to ordinary income for tax purposes of unrealized gains on investments in passive foreign investment companies.
20
| Financial Highlights |
| For a Share Outstanding Throughout the Years Ended November 30 (except as noted) | |||||||||||||||
| Per-Share Data | Ratios and Supplemental Data | ||||||||||||||
| Income From Investment Operations: | Distributions From: | Ratio to Average Net Assets of: | |||||||||||||
| Net Asset Value, Beginning of Period | Net Investment Income (Loss)(1) | Net Realized and Unrealized Gain (Loss) | Total From Investment Operations | Net Investment Income | Net Realized Gains | Total Distributions | Net Asset Value, End of Period | Total Return(2) | Operating Expenses | Net Investment Income (Loss) | Portfolio Turnover Rate | Net Assets, End of Period (in thousands) | |||
| Institutional Class | |||||||||||||||
| 2014 | $12.17 | 0.10 | 0.03 | 0.13 | (0.17) | (0.55) | (0.72) | $11.58 | 1.26% | 0.98% | 0.86% | 67% | $938,672 | ||
| 2013 | $9.94 | 0.11 | 2.27 | 2.38 | (0.15) | — | (0.15) | $12.17 | 24.27% | 1.02% | 1.01% | 89% | $771,045 | ||
| 2012 | $8.71 | 0.13 | 1.17 | 1.30 | (0.07) | — | (0.07) | $9.94 | 15.13% | 1.08% | 1.47% | 93% | $487,964 | ||
| 2011 | $9.11 | 0.10 | (0.41) | (0.31) | (0.09) | — | (0.09) | $8.71 | (3.47)% | 1.12% | 1.04% | 77% | $345,234 | ||
| 2010 | $8.61 | 0.08 | 0.54 | 0.62 | (0.12) | — | (0.12) | $9.11 | 7.28% | 1.14% | 0.95% | 85% | $250,218 | ||
| R6 Class | |||||||||||||||
| 2014 | $12.18 | 0.11 | 0.04 | 0.15 | (0.19) | (0.55) | (0.74) | $11.59 | 1.43% | 0.83% | 1.01% | 67% | $28,220 | ||
2013(3) | $11.13 | (0.01) | 1.06 | 1.05 | — | — | — | $12.18 | 9.43% | 0.85%(4) | (0.34)%(4) | 89%(5) | $6,561 | ||
| Notes to Financial Highlights |
| (1) | Computed using average shares outstanding throughout the period. |
| (2) | Total returns are calculated based on the net asset value of the last business day. Total returns for periods less than one year are not annualized. |
| (3) | July 26, 2013 (commencement of sale) through November 30, 2013. |
| (4) | Annualized. |
| (5) | Portfolio turnover is calculated at the fund level. Percentage indicated was calculated for the year ended November 30, 2013. |
See Notes to Financial Statements.
21
| Report of Independent Registered Public Accounting Firm |
To the Board of Directors and Shareholders of
American Century World Mutual Funds, Inc.:
We have audited the accompanying statement of assets and liabilities, including the schedule of investments, of NT International Growth Fund (the “Fund”), one of the funds constituting American Century World Mutual Funds, Inc., as of November 30, 2014, and the related statement of operations for the year then ended, the statements of changes in net assets for each of the two years in the period then ended, and the financial highlights for each of the periods presented. These financial statements and financial highlights are the responsibility of the Fund's management. Our responsibility is to express an opinion on these financial statements and financial highlights based on our audits.
We conducted our audits in accordance with the standards of the Public Company Accounting Oversight Board (United States). Those standards require that we plan and perform the audit to obtain reasonable assurance about whether the financial statements and financial highlights are free of material misstatement. The Fund is not required to have, nor were we engaged to perform, an audit of its internal control over financial reporting. Our audits included consideration of internal control over financial reporting as a basis for designing audit procedures that are appropriate in the circumstances, but not for the purpose of expressing an opinion on the effectiveness of the Fund's internal control over financial reporting. Accordingly, we express no such opinion. An audit also includes examining, on a test basis, evidence supporting the amounts and disclosures in the financial statements, assessing the accounting principles used and significant estimates made by management, as well as evaluating the overall financial statement presentation. Our procedures included confirmation of securities owned as of November 30, 2014, by correspondence with the custodian and brokers; where replies were not received from brokers, we performed other auditing procedures. We believe that our audits provide a reasonable basis for our opinion.
In our opinion, the financial statements and financial highlights referred to above present fairly, in all material respects, the financial position of NT International Growth Fund of American Century World Mutual Funds, Inc. as of November 30, 2014, the results of its operations for the year then ended, the changes in its net assets for each of the two years in the period then ended, and the financial highlights for each of the periods presented, in conformity with accounting principles generally accepted in the United States of America.
DELOITTE & TOUCHE LLP
Kansas City, Missouri
January 16, 2015
22
| Management |
The Board of Directors
The individuals listed below serve as directors of the funds. Each director will continue to serve in this capacity until death, retirement, resignation or removal from office. The board has adopted a mandatory retirement age for directors who are not “interested persons,” as that term is defined in the Investment Company Act (independent directors). Independent directors shall retire by December 31 of the year in which they reach their 75th birthday.
Mr. Thomas is an “interested person” because he currently serves as President and Chief Executive Officer of American Century Companies, Inc. (ACC), the parent company of American Century Investment Management, Inc. (ACIM or the advisor). Mr. Fink is treated as an “interested person” because of his recent employment with ACC and American Century Services, LLC (ACS). The other directors (more than three-fourths of the total number) are independent. They are not employees, directors or officers of, and have no financial interest in, ACC or any of its wholly owned, direct or indirect, subsidiaries, including ACIM, American Century Investment Services, Inc. (ACIS) and ACS, and they do not have any other affiliations, positions or relationships that would cause them to be considered “interested persons” under the Investment Company Act. The directors serve in this capacity for seven (in the case of Mr. Thomas, 15) registered investment companies in the American Century Investments family of funds.
The following table presents additional information about the directors. The mailing address for each director is 4500 Main Street, Kansas City, Missouri 64111.
Name (Year of Birth) | Position(s) Held with Funds | Length of Time Served | Principal Occupation(s) During Past 5 Years | Number of American Century Portfolios Overseen by Director | Other Directorships Held During Past 5 Years |
| Independent Directors | |||||
Thomas A. Brown (1940) | Director | Since 1980 | Managing Member, Associated Investments, LLC (real estate investment company); Brown Cascade Properties, LLC (real estate investment company) (2001 to 2009) | 73 | None |
Andrea C. Hall (1945) | Director | Since 1997 | Retired | 73 | None |
Jan M. Lewis (1957) | Director | Since 2011 | Retired; President and Chief Executive Officer, Catholic Charities of Northeast Kansas (human services organization) (2006 to 2013) | 73 | None |
James A. Olson (1942) | Director and Chairman of the Board | Since 2007 (Chairman since 2014) | Member, Plaza Belmont LLC (private equity fund manager) | 73 | Saia, Inc. (2002 to 2012) and EPR Properties (2003 to 2013) |
23
Name (Year of Birth) | Position(s) Held with Funds | Length of Time Served | Principal Occupation(s) During Past 5 Years | Number of American Century Portfolios Overseen by Director | Other Directorships Held During Past 5 Years |
| Independent Directors | |||||
M. Jeannine Strandjord (1945) | Director | Since 1994 | Retired | 73 | Euronet Worldwide Inc.; MGP Ingredients, Inc.; Charming Shoppes, Inc. (2006 to 2010); and DST Systems Inc. (1996 to 2012) |
John R. Whitten (1946) | Director | Since 2008 | Retired | 73 | Rudolph Technologies, Inc. |
Stephen E. Yates (1948) | Director | Since 2012 | Retired; Executive Vice President, Technology & Operations, KeyCorp. (computer services) (2004 to 2010) | 73 | Applied Industrial Technologies, Inc. (2001 to 2010) |
| Interested Directors | |||||
Barry Fink (1955) | Director | Since 2012 | Retired; Executive Vice President, ACC (September 2007 to February 2013); President, ACS (October 2007 to February 2013); Chief Operating Officer, ACC (September 2007 to November 2012) | 73 | None |
Jonathan S. Thomas (1963) | Director and President | Since 2007 | President and Chief Executive Officer, ACC (March 2007 to present). Also serves as Chief Executive Officer, ACS; Executive Vice President, ACIM; Director, ACC, ACIM and other ACC subsidiaries | 118 | BioMed Valley Discoveries, Inc. |
The Statement of Additional Information has additional information about the fund's directors and is available without charge, upon request, by calling 1-800-345-2021.
24
Officers
The following table presents certain information about the executive officers of the funds. Each officer serves as an officer for each of the 15 investment companies in the American Century family of funds, unless otherwise noted. No officer is compensated for his or her service as an officer of the funds. The listed officers are interested persons of the funds and are appointed or re-appointed on an annual basis. The mailing address for each officer listed below is 4500 Main Street, Kansas City, Missouri 64111.
Name (Year of Birth) | Offices with the Funds | Principal Occupation(s) During the Past Five Years |
Jonathan S. Thomas (1963) | Director and President since 2007 | President and Chief Executive Officer, ACC (March 2007 to present). Also serves as Chief Executive Officer, ACS; Executive Vice President, ACIM; Director, ACC, ACIM and other ACC subsidiaries |
Amy D. Shelton (1964) | Chief Compliance Officer and Vice President since 2014 | Chief Compliance Officer, American Century funds, (March 2014 to present); Chief Compliance Officer, ACIM (February 2014 to present); Chief Compliance Officer, ACIS (October 2009 to present); Vice President, Client Interactions and Marketing, ACIS (February 2013 to January 2014); Director, Client Interactions and Marketing, ACIS (June 2007 to January 2013). Also serves as Vice President, ACIS |
Charles A. Etherington (1957) | General Counsel since 2007 and Senior Vice President since 2006 | Attorney, ACC (February 1994 to present); Vice President, ACC (November 2005 to present); General Counsel, ACC (March 2007 to present). Also serves as General Counsel, ACIM, ACS, ACIS and other ACC subsidiaries; and Senior Vice President, ACIM and ACS |
C. Jean Wade (1964) | Vice President, Treasurer and Chief Financial Officer since 2012 | Vice President, ACS (February 2000 to present) |
Robert J. Leach (1966) | Vice President since 2006 and Assistant Treasurer since 2012 | Vice President, ACS (February 2000 to present) |
David H. Reinmiller (1963) | Vice President since 2000 | Attorney, ACC (January 1994 to present); Associate General Counsel, ACC (January 2001 to present). Also serves as Vice President, ACIM and ACS |
Ward D. Stauffer (1960) | Secretary since 2005 | Attorney, ACC (June 2003 to present) |
25
| Approval of Management Agreement |
At a meeting held on June 18, 2014, the Fund’s Board of Directors unanimously approved the renewal of the management agreement pursuant to which American Century Investment Management, Inc. (the “Advisor”) acts as the investment advisor for the Fund. Under Section 15(c) of the Investment Company Act, contracts for investment advisory services are required to be reviewed, evaluated, and approved by a majority of a fund’s directors (the “Directors”), including a majority of the independent Directors, each year.
Prior to its consideration of the renewal of the management agreement, the Board requested and reviewed extensive data and information compiled by the Advisor and certain independent providers of evaluation data concerning the Fund and the services provided to the Fund by the Advisor. This review was in addition to the oversight and evaluation undertaken by the Board and its committees on a continuous basis and the information received was supplemental to the extensive information that the Board and its committees receive and consider throughout the year.
In connection with its consideration of the renewal of the management agreement, the Board’s review and evaluation of the services provided by the Advisor included, but was not limited to, the following:
| • | the nature, extent, and quality of investment management, shareholder services, and other services provided by the Advisor to the Fund; |
| • | the wide range of other programs and services the Advisor provides to the Fund and its shareholders on a routine and non-routine basis; |
| • | the Fund’s investment performance compared to appropriate benchmarks and/or a peer group of other mutual funds with similar investment objectives and strategies; |
| • | the cost of owning the Fund compared to the cost of owning similar funds; |
| • | the Advisor’s compliance policies, procedures, and regulatory experience; |
| • | financial data showing the cost of services provided to the Fund, the profitability of the Fund to the Advisor, and the overall profitability of the Advisor; |
| • | possible economies of scale associated with the Advisor’s management of the Fund and other accounts under its management; |
| • | the services provided and charges to other investment management clients of the Advisor; |
| • | acquired fund fees and expenses; and |
| • | any collateral benefits derived by the Advisor from the management of the Fund. |
In keeping with its practice, the Board held two in-person meetings and one telephonic meeting to review and discuss the information provided. The independent Directors also had the benefit of the advice of their independent counsel throughout the process.
Factors Considered
The Directors considered all of the information provided by the Advisor, the independent data providers, and independent counsel, and evaluated such information for the Fund. In connection with their review, the Directors did not identify any single factor as being all-important or controlling, and each Director may have attributed different levels of importance to different factors. In deciding to renew the management agreement, the Board based its decision on a number of factors, including the following:
26
Nature, Extent and Quality of Services — Generally. Under the management agreement, the Advisor is responsible for providing or arranging for all services necessary for the operation of the Fund. The Board noted that under the management agreement, the Advisor provides or arranges at its own expense a wide variety of services including:
| • | constructing and designing the Fund |
| • | portfolio research and security selection |
| • | initial capitalization/funding |
| • | securities trading |
| • | Fund administration |
| • | custody of Fund assets |
| • | daily valuation of the Fund’s portfolio |
| • | shareholder servicing and transfer agency, including shareholder confirmations, recordkeeping, and communications |
| • | legal services (except the independent Directors’ counsel) |
| • | regulatory and portfolio compliance |
| • | financial reporting |
| • | marketing and distribution (except Rule 12b-1 plans) |
The Board noted that many of these services have expanded over time both in terms of quantity and complexity in response to shareholder demands, competition in the industry, changing distribution channels, and the changing regulatory environment.
Investment Management Services. The nature of the investment management services provided to the Fund is quite complex and allows Fund shareholders access to professional money management, instant diversification of their investments within an asset class, the opportunity to easily diversify among asset classes by investing in or exchanging among various American Century Investments funds, and liquidity. In evaluating investment performance, the Board expects the Advisor to manage the Fund in accordance with its investment objectives and approved strategies. Further, the Directors recognize that the Advisor has an obligation to monitor trading activities, and in particular to seek the best execution of fund trades, and to evaluate the use of and payment for research. In providing these services, the Advisor utilizes teams of investment professionals (portfolio managers, analysts, research assistants, and securities traders) who require extensive information technology, research, training, compliance and other systems to conduct their business. The Board, directly and through its Fund Performance Review Committee, regularly reviews investment performance information for the Fund, together with comparative information for appropriate benchmarks and/or peer groups of similarly-managed funds, over different time horizons. The Directors also review detailed performance information during the management agreement approval process. If performance concerns are identified, the Fund receives special reviews until performance improves, during which the Board discusses with the Advisor the reasons for such results (e.g., market conditions, security selection) and any efforts being undertaken to improve performance. The Fund’s performance was above its benchmark for the one-, three-, and five-year periods reviewed by the Board. The Board found the investment management services provided by the Advisor to the Fund to be satisfactory and consistent with the management agreement.
Shareholder and Other Services. Under the management agreement, the Advisor provides the Fund with a comprehensive package of transfer agency, shareholder, and other services. The Board, directly and through various committees of the Board, regularly reviews reports and evaluations of such services at its regular meetings. These reports include, but are not limited to, information regarding the operational efficiency and accuracy of the shareholder and transfer agency services provided, staffing levels, shareholder satisfaction (as measured by external as well as internal sources), technology support, new products and services offered to Fund shareholders, securities trading activities, portfolio valuation services, auditing services, and legal and operational compliance activities. Certain aspects of shareholder and transfer agency service level efficiency and the quality of securities trading activities are measured by independent third party providers and are presented in comparison to other fund groups not managed by the Advisor. The Board
27
found the services provided by the Advisor to the Fund under the management agreement to be competitive and of high quality.
Costs of Services and Profitability. The Advisor provides detailed information concerning its cost of providing various services to the Fund, its profitability in managing the Fund (pre- and post-distribution), its overall profitability, and its financial condition. The Directors have reviewed with the Advisor the methodology used to prepare this financial information. The financial information regarding the Advisor is considered in evaluating the Advisor’s financial condition, its ability to continue to provide services under the management agreement, and the reasonableness of the current management fee. The Board concluded that the Advisor’s profits were reasonable in light of the services provided to the Fund.
Ethics. The Board generally considers the Advisor’s commitment to providing quality services to shareholders and to conducting its business ethically. They noted that the Advisor’s practices generally meet or exceed industry best practices.
Economies of Scale. The Board also reviewed information provided by the Advisor regarding the possible existence of economies of scale in connection with the management of the Fund. The Board concluded that economies of scale are difficult to measure and predict with precision, especially on a fund-by-fund basis. The Board concluded that the Advisor is appropriately sharing economies of scale through its competitive fee structure, offering competitive fees from fund inception, and through reinvestment in its business to provide shareholders additional content and services.
Comparison to Other Funds’ Fees. The management agreement provides that the Fund pays the Advisor a single, all-inclusive (or unified) management fee for providing all services necessary for the management and operation of the Fund, other than brokerage expenses, taxes, interest, extraordinary expenses, and the fees and expenses of the Fund’s independent directors (including their independent legal counsel) and expenses incurred in connection with the provision of shareholder services and distribution services under a plan adopted pursuant to Rule 12b-1 under the 1940 Act. Under the unified fee structure, the Advisor is responsible for providing all investment advisory, custody, audit, administrative, compliance, recordkeeping, marketing and shareholder services, or arranging and supervising third parties to provide such services. By contrast, most other funds are charged a variety of fees, including an investment advisory fee, a transfer agency fee, an administrative fee, distribution charges and other expenses. Other than their investment advisory fees and any applicable Rule 12b-1 distribution fees, all other components of the total fees charged by these other funds may be increased without shareholder approval. The Board believes the unified fee structure is a benefit to Fund shareholders because it clearly discloses to shareholders the cost of owning Fund shares, and, since the unified fee cannot be increased without a vote of Fund shareholders, it shifts to the Advisor the risk of increased costs of operating the Fund and provides a direct incentive to minimize administrative inefficiencies. Part of the Board’s analysis of fee levels involves reviewing certain evaluative data compiled by an independent provider comparing the Fund’s unified fee to the total expense ratios of its peers. The unified fee charged to shareholders of the Fund was slightly above the median of the total expense ratios of the Fund’s peer expense universe and was within the range of its peer expense group. The Board concluded that the management fee paid by the Fund to the Advisor under the management agreement is reasonable in light of the services provided to the Fund.
Comparison to Fees and Services Provided to Other Clients of the Advisor. The Board also requested and received information from the Advisor concerning the nature of the services, fees, costs and profitability of its advisory services to advisory clients other than the Fund. They observed that these varying types of client accounts require different services and involve different regulatory and entrepreneurial risks than the management of the Fund. The Board analyzed this information and concluded that the fees charged and services provided to the Fund were reasonable by comparison.
28
Collateral or “Fall-Out” Benefits Derived by the Advisor. The Board considered the existence of collateral benefits the Advisor may receive as a result of its relationship with the Fund. They concluded that the Advisor’s primary business is managing mutual funds and it generally does not use fund or shareholder information to generate profits in other lines of business, and therefore does not derive any significant collateral benefits from them. The Board noted that the Advisor receives proprietary research from broker-dealers that execute fund portfolio transactions and concluded that this research is likely to benefit Fund shareholders. The Board also determined that the Advisor is able to provide investment management services to certain clients other than the Fund, at least in part, due to its existing infrastructure built to serve the fund complex. The Board concluded, however, that the assets of those other clients are not material to the analysis and, where applicable, may be included with the assets of the Fund to determine breakpoints in the management fee schedule.
Existing Relationship. The Board also considered whether there was any reason for not continuing the existing arrangement with the Advisor. In this regard, the Board was mindful of the potential disruptions of the Fund’s operations and various risks, uncertainties, and other effects that could occur as a result of a decision not to continue such relationship. In particular, the Board recognized that most shareholders have invested in the Fund on the strength of the Advisor’s industry standing and reputation and in the expectation that the Advisor will have a continuing role in providing advisory services to the Fund.
Conclusion of the Directors. As a result of this process, the Board, including all of the independent Directors, taking into account all of the factors discussed above and the information provided by the Advisor and others, concluded that the management agreement between the Fund and the Advisor is fair and reasonable in light of the services provided and should be renewed.
29
| Additional Information |
Retirement Account Information
As required by law, distributions you receive from certain IRAs are subject to federal income tax withholding, unless you elect not to have withholding apply. Tax will be withheld on the total amount withdrawn even though you may be receiving amounts that are not subject to withholding, such as nondeductible contributions. In such case, excess amounts of withholding could occur. You may adjust your withholding election so that a greater or lesser amount will be withheld.
If you don’t want us to withhold on this amount, you must notify us to not withhold the federal income tax. You may notify us in writing or in certain situations by telephone or through other electronic means. For systematic withdrawals, your withholding election will remain in effect until revoked or changed by filing a new election. You have the right to revoke your election at any time.
Remember, even if you elect not to have income tax withheld, you are liable for paying income tax on the taxable portion of your withdrawal. If you elect not to have income tax withheld or you don’t have enough income tax withheld, you may be responsible for payment of estimated tax. You may incur penalties under the estimated tax rules if your withholding and estimated tax payments are not sufficient. You can reduce or defer the income tax on a distribution by directly or indirectly rolling such distribution over to another IRA or eligible plan. You should consult your tax advisor for additional information.
State tax will be withheld if, at the time of your distribution, your address is within one of the mandatory withholding states and you have federal income tax withheld (or as otherwise required by state law). State taxes will be withheld from your distribution in accordance with the respective state rules.
Distributions you receive from 403(b), 457 and qualified plans are subject to special tax and withholding rules. Your plan administrator or plan sponsor is required to provide you with a special tax notice explaining those rules at the time you request a distribution. If applicable, federal and/or state taxes may be withheld from your distribution amount.
Proxy Voting Policies
A description of the policies that the fund's investment advisor uses in exercising the voting rights associated with the securities purchased and/or held by the fund is available without charge, upon request, by calling 1-800-345-2021. It is also available on the "About Us" page of American Century Investments’ website at americancentury.com and on the Securities and Exchange Commission’s website at sec.gov. Information regarding how the investment advisor voted proxies relating to portfolio securities during the most recent 12-month period ended June 30 is available on the "About Us" page at americancentury.com. It is also available at sec.gov.
Quarterly Portfolio Disclosure
The fund files its complete schedule of portfolio holdings with the Securities and Exchange Commission (SEC) for the first and third quarters of each fiscal year on Form N-Q. The fund’s Forms N-Q are available on the SEC’s website at sec.gov, and may be reviewed and copied at the SEC’s Public Reference Room in Washington, DC. Information on the operation of the Public Reference Room may be obtained by calling 1-800-SEC-0330. The fund also makes its complete schedule of portfolio holdings for the most recent quarter of its fiscal year available on its
website at americancentury.com and, upon request, by calling 1-800-345-2021.
30
Other Tax Information
The following information is provided pursuant to provisions of the Internal Revenue Code.
The fund hereby designates up to the maximum amount allowable as qualified dividend income for the fiscal year ended November 30, 2014.
The fund hereby designates $35,285,928, or up to the maximum amount allowable, as long-term capital gain distributions for the fiscal year ended November 30, 2014.
For the fiscal year ended November 30, 2014, the fund intends to pass through to shareholders $1,715,743, or up to the maximum amount allowable, as a foreign tax credit which represents taxes paid on income derived from sources within foreign countries or possessions of the United States. During the fiscal year ended November 30, 2014, the fund earned $17,675,585 from income derived from foreign sources. Foreign source income and foreign tax expense per outstanding share on November 30, 2014 are $0.2117 and $0.0205, respectively.
31
| Notes |
32
| ||
| Contact Us | americancentury.com | |
| Automated Information Line | 1-800-345-8765 | |
| Investor Services Representative | 1-800-345-2021 or 816-531-5575 | |
| Investors Using Advisors | 1-800-378-9878 | |
| Business, Not-For-Profit, Employer-Sponsored Retirement Plans | 1-800-345-3533 | |
| Banks and Trust Companies, Broker-Dealers, Financial Professionals, Insurance Companies | 1-800-345-6488 | |
| Telecommunications Relay Service for the Deaf | 711 | |
| American Century World Mutual Funds, Inc. | ||
Investment Advisor: American Century Investment Management, Inc. Kansas City, Missouri | ||
| This report and the statements it contains are submitted for the general information of our shareholders. The report is not authorized for distribution to prospective investors unless preceded or accompanied by an effective prospectus. | ||
| ©2015 American Century Proprietary Holdings, Inc. All rights reserved. CL-ANN-84127 1501 | ||
ITEM 2. CODE OF ETHICS.
| (a) | The registrant has adopted a Code of Ethics for Senior Financial Officers that applies to the registrant’s principal executive officer, principal financial officer, principal accounting officer, and persons performing similar functions. |
| (b) | No response required. |
| (c) | None. |
| (d) | None. |
| (e) | Not applicable. |
| (f) | The registrant’s Code of Ethics for Senior Financial Officers was filed as Exhibit 12 (a)(1) to American Century Asset Allocation Portfolios, Inc.’s Annual Certified Shareholder Report on Form N-CSR, File No. 811-21591, on September 29, 2005, and is incorporated herein by reference. |
ITEM 3. AUDIT COMMITTEE FINANCIAL EXPERT.
| (a)(1) | The registrant’s board has determined that the registrant has at least one audit committee financial expert serving on its audit committee. |
| (a)(2) | M. Jeannine Strandjord, Stephen E. Yates, Thomas A. Brown and John R. Whitten are the registrant’s designated audit committee financial experts. They are “independent” as defined in Item 3 of Form N-CSR. |
| (a)(3) | Not applicable. |
| (b) | No response required. |
| (c) | No response required. |
| (d) | No response required. |
ITEM 4. PRINCIPAL ACCOUNTANT FEES AND SERVICES.
| (a) | Audit Fees. |
The aggregate fees billed for each of the last two fiscal years for professional services rendered by the principal accountant for the audit of the registrant’s annual financial statements or services that are normally provided by the accountant in connection with statutory and regulatory filings or engagements for those fiscal years were as follows:
FY 2013: $211,026
FY 2014: $208,287
| (b) | Audit-Related Fees. |
The aggregate fees billed in each of the last two fiscal years for assurance and related services by the principal accountant that are reasonably related to the performance of the audit of the registrant’s financial statements and are not reported under paragraph (a) of this Item were as follows:
For services rendered to the registrant:
FY 2013: $0
FY 2014: $0
Fees required to be approved pursuant to paragraph (c)(7)(ii) of Rule 2-01 of Regulation S-X (relating to certain engagements for non-audit services with the registrant’s investment adviser and its affiliates):
FY 2013: $0
FY 2014: $0
| (c) | Tax Fees. |
The aggregate fees billed in each of the last two fiscal years for professional services rendered by the principal accountant for tax compliance, tax advice, and tax planning were as follows:
For services rendered to the registrant:
FY 2013: $0
FY 2014: $0
Fees required to be approved pursuant to paragraph (c)(7)(ii) of Rule 2-01 of Regulation S-X (relating to certain engagements for non-audit services with the registrant’s investment adviser and its affiliates):
FY 2013: $0
FY 2014: $0
| (d) | All Other Fees. |
The aggregate fees billed in each of the last two fiscal years for products and services provided by the principal accountant, other than the services reported in paragraphs (a) through (c) of this Item were as follows:
For services rendered to the registrant:
FY 2013: $0
FY 2014: $0
Fees required to be approved pursuant to paragraph (c)(7)(ii) of Rule 2-01 of Regulation S-X (relating to certain engagements for non-audit services with the registrant’s investment adviser and its affiliates):
FY 2013: $0
FY 2014: $0
(e)(1)In accordance with paragraph (c)(7)(i)(A) of Rule 2-01 of Regulation S-X, before the accountant is engaged by the registrant to render audit or non-audit services, the engagement is approved by the registrant’s audit committee. Pursuant to paragraph (c)(7)(ii) of Rule 2-01 of Regulation S-X, the registrant’s audit committee also pre-approves its accountant’s engagements for non-audit services with the registrant’s investment adviser, its parent company, and any entity controlled by, or under common control with the investment adviser that provides ongoing services to the registrant, if the engagement relates directly to the operations and financial reporting of the registrant.
| (e)(2) | All services described in each of paragraphs (b) through (d) of this Item were pre-approved before the engagement by the registrant’s audit committee pursuant to paragraph (c)(7)(i)(A) of Rule 2-01 of Regulation S-X. Consequently, none of such services were required to be approved by the audit committee pursuant to paragraph (c)(7)(i)(C). |
| (f) | The percentage of hours expended on the principal accountant’s engagement to audit the registrant’s financial statements for the most recent fiscal year that were attributed to work performed by persons other than the principal accountant’s full-time, permanent employees was less than 50%. |
| (g) | The aggregate non-audit fees billed by the registrant’s accountant for services rendered to the registrant, and rendered to the registrant’s investment adviser (not including any sub-adviser whose role is primarily portfolio management and is subcontracted with or overseen by another investment adviser), and any entity controlling, controlled by, or under common control with the adviser that provides ongoing services to the registrant for each of the last two fiscal years of the registrant were as follows: |
FY 2013: $101,621
FY 2014: $91,808
| (h) | The registrant’s investment adviser and accountant have notified the registrant’s audit committee of all non-audit services that were rendered by the registrant’s accountant to the registrant’s investment adviser, its parent company, and any entity controlled by, or under common control with the investment adviser that provides services to the registrant, which services were not required to be pre-approved pursuant to paragraph (c)(7)(ii) of Rule 2-01 of Regulation S-X. The notification provided to the registrant’s audit committee included sufficient details regarding such services to allow the registrant’s audit committee to consider the continuing independence of its principal accountant. |
ITEM 5. AUDIT COMMITTEE OF LISTED REGISTRANTS.
Not applicable.
ITEM 6. INVESTMENTS.
| (a) | The schedule of investments is included as part of the report to stockholders filed under Item 1 of this Form. |
| (b) | Not applicable. |
ITEM 7. DISCLOSURE OF PROXY VOTING POLICIES AND PROCEDURES FOR CLOSED-END MANAGEMENT INVESTMENT COMPANIES.
Not applicable.
ITEM 8. PORTFOLIO MANAGERS OF CLOSED-END MANAGEMENT INVESTMENT COMPANIES.
Not applicable.
ITEM 9. PURCHASES OF EQUITY SECURITIES BY CLOSED-END MANAGEMENT INVESTMENT COMPANY AND AFFILIATED PURCHASERS.
Not applicable.
ITEM 10. SUBMISSION OF MATTERS TO A VOTE OF SECURITY HOLDERS.
During the reporting period, there were no material changes to the procedures by which shareholders may recommend nominees to the registrant’s board.
ITEM 11. CONTROLS AND PROCEDURES.
| (a) | The registrant's principal executive officer and principal financial officer have concluded that the registrant's disclosure controls and procedures (as defined in Rule 30a-3(c) under the Investment Company Act of 1940) are effective based on their evaluation of these controls and procedures as of a date within 90 days of the filing date of this report. |
| (b) | There were no changes in the registrant's internal control over financial reporting (as defined in Rule 30a-3(d) under the Investment Company Act of 1940) that occurred during the registrant's second fiscal quarter of the period covered by this report that have materially affected, or are reasonably likely to materially affect, the registrant's internal control over financial reporting. |
ITEM 12. EXHIBITS.
| (a)(1) | Registrant’s Code of Ethics for Senior Financial Officers, which is the subject of the disclosure required by Item 2 of Form N-CSR, was filed as Exhibit 12(a)(1) to American Century Asset Allocation Portfolios, Inc.’s Certified Shareholder Report on Form N-CSR, File No. 811-21591, on September 29, 2005. |
| (a)(2) | Separate certifications by the registrant’s principal executive officer and principal financial officer, pursuant to Section 302 of the Sarbanes-Oxley Act of 2002 and Rule 30a-2(a) under the Investment Company Act of 1940, are filed and attached hereto as EX-99.CERT. |
| (a)(3) | Not applicable. |
| (b) | A certification by the registrant’s chief executive officer and chief financial officer, pursuant to Section 906 of the Sarbanes-Oxley Act of 2002, is furnished and attached hereto as EX-99.906CERT. |
SIGNATURES
Pursuant to the requirements of the Securities Exchange Act of 1934 and the Investment Company Act of 1940, the registrant has duly caused this report to be signed on its behalf by the undersigned, thereunto duly authorized.
| Registrant: | American Century World Mutual Funds, Inc. | |||
| By: | /s/ Jonathan S. Thomas | |||
| Name: | Jonathan S. Thomas | |||
| Title: | President | |||
| Date: | January 28, 2015 | |||
Pursuant to the requirements of the Securities Exchange Act of 1934 and the Investment Company Act of 1940, this report has been signed below by the following persons on behalf of the registrant and in the capacities and on the dates indicated.
| By: | /s/ Jonathan S. Thomas | ||
| Name: | Jonathan S. Thomas | ||
| Title: | President | ||
| (principal executive officer) | |||
| Date: | January 28, 2015 | ||
| By: | /s/ C. Jean Wade | ||
| Name: | C. Jean Wade | ||
| Title: | Vice President, Treasurer, and | ||
| Chief Financial Officer | |||
| (principal financial officer) | |||
| Date: | January 28, 2015 | ||