UNITED STATES
SECURITIES AND EXCHANGE COMMISSION
Washington, D.C. 20549
FORM N-CSR
CERTIFIED SHAREHOLDER REPORT OF REGISTERED
MANAGEMENT INVESTMENT COMPANIES
| Investment Company Act file number | 811-06247 | |||||
| AMERICAN CENTURY WORLD MUTUAL FUNDS, INC. | ||||||
| (Exact name of registrant as specified in charter) | ||||||
| 4500 MAIN STREET, KANSAS CITY, MISSOURI | 64111 | |||||
| (Address of principal executive offices) | (Zip Code) | |||||
CHARLES A. ETHERINGTON 4500 MAIN STREET, KANSAS CITY, MISSOURI 64111 | ||||||
| (Name and address of agent for service) | ||||||
| Registrant’s telephone number, including area code: | 816-531-5575 | |||||
| Date of fiscal year end: | 11-30 | |||||
| Date of reporting period: | 11-30-2016 | |||||
ITEM 1. REPORTS TO STOCKHOLDERS.

| Annual Report | |
| November 30, 2016 | |
| Emerging Markets Fund | |
| Table of Contents |
| President’s Letter | 2 | |
| Performance | 3 | |
| Portfolio Commentary | ||
| Fund Characteristics | ||
| Shareholder Fee Example | ||
| Schedule of Investments | ||
| Statement of Assets and Liabilities | ||
| Statement of Operations | ||
| Statement of Changes in Net Assets | ||
| Notes to Financial Statements | ||
| Financial Highlights | ||
| Report of Independent Registered Public Accounting Firm | ||
| Management | ||
| Approval of Management Agreement | ||
| Additional Information | ||
Any opinions expressed in this report reflect those of the author as of the date of the report, and do not necessarily represent the opinions of American Century Investments® or any other person in the American Century Investments organization. Any such opinions are subject to change at any time based upon market or other conditions and American Century Investments disclaims any responsibility to update such opinions. These opinions may not be relied upon as investment advice and, because investment decisions made by American Century Investments funds are based on numerous factors, may not be relied upon as an indication of trading intent on behalf of any American Century Investments fund. Security examples are used for representational purposes only and are not intended as recommendations to purchase or sell securities. Performance information for comparative indices and securities is provided to American Century Investments by third party vendors. To the best of American Century Investments’ knowledge, such information is accurate at the time of printing.
| President’s Letter |
 Jonathan Thomas
Dear Investor:
Thank you for reviewing this annual report for the period ended November 30, 2016. Annual reports help convey important information about fund returns, including market factors that affected performance during the reporting period. For additional, updated investment and market insights, we encourage you to visit our website, americancentury.com.
A Year of Surprises: China, Oil, Brexit, Trump
A year ago, we predicted increased market volatility in 2016. Volatility occurred, but not for the reasons we suggested. We expected the Federal Reserve (the Fed)—which in December 2015 raised its short-term interest rate target for the first time since 2006—to raise it three to four more times in 2016 as U.S. economic growth improved. We thought the shift in rate policy would contribute to unsettled conditions as inflation expectations grew, borrowing costs increased, the U.S. dollar strengthened, and bond prices weakened.
Instead, global and U.S. growth largely languished in the first half of 2016 as concerns about China’s growth and plummeting oil prices affected the global economic outlook. The Fed left its target unchanged for 11 months to avoid putting further stress on the global economy and markets. Meanwhile, years of low interest rates, market globalization, and corporate cost-cutting had benefited some segments of the world’s developed democracies much more than others. The others spoke up in June and November, voting for the U.K. to exit the European Union, then propelling Donald Trump to victory. These unexpected populist political results unsettled the markets.
Despite these challenges, and with the continued support of central bank monetary stimulus, broad market index returns for the full reporting period were mostly positive, though they skewed negative in non-U.S. developed equity markets. Looking ahead, Trump’s win shifted the market outlook, unleashing potentially far-reaching ramifications that are still unfolding. What’s clear is that Trump’s policy proposals and his unpredictable nature make uncertainty more certain, which could trigger further bouts of short-term market volatility. In this unsettled environment, we strongly believe in staying the course and remaining focused on longer-term goals, using disciplined, actively managed, diversified, risk-aware strategies. We appreciate your continued trust in us.
Sincerely,

Jonathan Thomas
President and Chief Executive Officer
American Century Investments
2
| Performance |
| Total Returns as of November 30, 2016 | ||||||
Average Annual Returns | ||||||
Ticker Symbol | 1 year | 5 years | 10 years | Since Inception | Inception Date | |
Investor Class | TWMIX | 5.95% | 3.23% | 1.47% | — | 9/30/97 |
| MSCI Emerging Markets Index | — | 8.47% | 0.99% | 2.26% | — | — |
| Institutional Class | AMKIX | 6.13% | 3.42% | 1.67% | — | 1/28/99 |
| A Class | AEMMX | 5/12/99 | ||||
| No sales charge | 5.63% | 2.98% | 1.25% | — | ||
| With sales charge | -0.48% | 1.76% | 0.65% | — | ||
| C Class | ACECX | 4.81% | 2.22% | 0.48% | — | 12/18/01 |
| R Class | AEMRX | 5.44% | 2.72% | — | -2.72% | 9/28/07 |
| R6 Class | AEDMX | 6.27% | — | — | 1.63% | 7/26/13 |
Average annual returns since inception are presented when ten years of performance history is not available.
Fund returns would have been lower if a portion of the fees had not been waived. Prior to September 4, 2007, the A Class was referred to as the Advisor Class and did not have a front-end sales charge. Performance prior to that date has been adjusted to reflect this charge.
Sales charges include initial sales charges and contingent deferred sales charges (CDSCs), as applicable. A Class shares have a 5.75% maximum initial sales charge and may be subject to a maximum CDSC of 1.00%. C Class shares redeemed within 12 months of purchase are subject to a maximum CDSC of 1.00%. The SEC requires that mutual funds provide performance information net of maximum sales charges in all cases where charges could be applied.
Data presented reflect past performance. Past performance is no guarantee of future results. Current performance may be higher or lower than the performance shown. Total returns for periods less than one year are not annualized. Investment return and principal value will fluctuate, and redemption value may be more or less than original cost. Data assumes reinvestment of dividends and capital gains, and none of the charts reflect the deduction of taxes that a shareholder would pay on fund distributions or the redemption of fund shares. To obtain performance data current to the most recent month end, please call 1-800-345-2021 or visit americancentury.com. For additional information about the fund, please consult the prospectus.
3
| Growth of $10,000 Over 10 Years |
| $10,000 investment made November 30, 2006 |
| Performance for other share classes will vary due to differences in fee structure. |
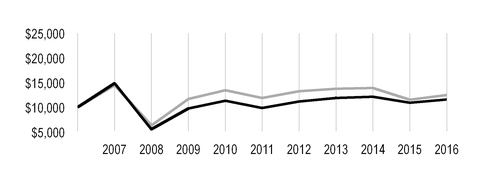
| Value on November 30, 2016 | |
| Investor Class — $11,577 | |
| MSCI Emerging Markets Index — $12,510 | |
Ending value of Investor class would have been lower if a portion of the fees had not been waived.
Total Annual Fund Operating Expenses | |||||
Investor Class | Institutional Class | A Class | C Class | R Class | R6 Class |
| 1.69% | 1.49% | 1.94% | 2.69% | 2.19% | 1.34% |
The total annual fund operating expenses shown is as stated in the fund’s prospectus current as of the date of this report. The prospectus may vary from the expense ratio shown elsewhere in this report because it is based on a different time period, includes acquired fund fees and expenses, and, if applicable, does not include fee waivers or expense reimbursements.
Data presented reflect past performance. Past performance is no guarantee of future results. Current performance may be higher or lower than the performance shown. Total returns for periods less than one year are not annualized. Investment return and principal value will fluctuate, and redemption value may be more or less than original cost. Data assumes reinvestment of dividends and capital gains, and none of the charts reflect the deduction of taxes that a shareholder would pay on fund distributions or the redemption of fund shares. To obtain performance data current to the most recent month end, please call 1-800-345-2021 or visit americancentury.com. For additional information about the fund, please consult the prospectus.
4
| Portfolio Commentary |
Portfolio Managers: Patricia Ribeiro, Anthony Han, and Sherwin Soo
In February 2016, portfolio manager Sherwin Soo joined the Emerging Markets management team.
Performance Summary
Emerging Markets gained 5.95%* for the 12 months ended November 30, 2016. The portfolio’s benchmark, the MSCI Emerging Markets Index, gained 8.47% for the same period.
The fund underperformed its benchmark during the period, primarily due to stock selection in the financials and health care sectors. An underweight position relative to the benchmark in the energy sector also contributed to underperformance. Conversely, investments in the information technology sector and an underweight position in the telecommunication services sector buoyed relative results. Consumer staples holdings also contributed to results. Regionally, stock selection in South Korea and Turkey hindered relative performance, while positioning in Mexico and stock selection in Russia helped.
Stock Selection in the Financials Sector Detracted
Although the financials sector was an area of relative weakness in the fund, no financials holdings were top detractors during the period. Rather, underperformance in this sector was driven by not owning Brazil-based commercial bank Banco Bradesco, which recovered from recent lows on expectations of a macroeconomic recovery. In our opinion, there are other more attractive investment opportunities in the Brazilian banking sector. In the health care sector, underperformance came primarily from two portfolio-only holdings: Medy-Tox, a biopharmaceutical company headquartered in South Korea, and Gingko International, a manufacturer of contact lenses based in Taiwan. Headwinds for Medy-Tox included ongoing conflict and patent issues among domestic manufacturers regarding the origins of the botulinum toxin strain, commonly known as Botox. Weakness in the biotechnology and cosmetic industries due to constrained relations with China also contributed to declines, and we reduced our position. We also sold Gingko International after determining that the adoption of its new, value-added products was slower than expected.
Another area of relative weakness in the fund was the energy sector, where not owning Brazil-based oil and gas company Petroleo Brasileiro weighed on relative results. Petrobras’ stock gained as a result of improving sentiment around the nation’s politics and rising oil prices.
Significant individual detractors also included China-based travel services firm Ctrip.com International. The company’s stock price fluctuates with increased bouts of macroeconomic uncertainty. For example, if economic growth slows, overall travel growth also tends to slow. As such, concerns about economic growth during the period contributed to declines in Ctrip.com’s share price. Increased pricing competition, particularly in the hotel market, also weighed on the stock. Nonetheless, our long-term outlook for the company remains positive and we continue to hold a position in Ctrip.com.
* All fund returns referenced in this commentary are for Investor Class shares. Fund returns would have been lower if a portion of the fees had not been waived. Performance for other share classes will vary due to differences in fee structure; when Investor Class performance exceeds that of the fund's benchmark, other share classes may not. See page 3 for returns for all share classes.
5
Information Technology Holdings Contributed
Leading sector contribution came primarily from the information technology sector, where standout performers included China-based online gaming and social media company Tencent Holdings and Thailand-based electronic circuit manufacturer KCE Electronics, which is a portfolio-only holding. Tencent benefited from rising internet usage and reported higher revenue during the period, with meaningful growth in online games, social networking and online advertising. KCE Electronics, which specializes in making circuit boards for the automobile industry, enjoyed strong earnings growth, driven primarily by improvements in operating efficiency and product mix. The company continues to experience strong demand for its circuit boards due to the increased use of electronics in cars and rising safety regulations.
The same trends contributed to the strong performance of portfolio-only holding Tung Thih Electronic, a Taiwan-based automobile electronic parts and accessories supplier. Consumers are demanding safer cars, and government mandates are incrementally requiring expanded safety features such as rear and side-view cameras, blind spot detection, and automated parking systems. There is a clear trend in auto active safety technologies, and Tung Thih Electronic continues to add new customers and increase its market share among existing customers.
The fund’s outperformance in the consumer staples sector was driven by Brazil-based drugstore operator Raia Drogasil. The company continues to capitalize on the secular growth of the pharmaceutical industry while increasing its market share and driving top-line growth. Furthermore, Raia Drogasil remains focused on enhancing its competitive position through new initiatives that include product management, store openings, and store refurbishment.
Outlook
Emerging markets are reacting to uncertainty after the U.S. presidential election. The potential for higher inflation, a stronger U.S. dollar, and disruption in trade is clouding the near-term outlook for emerging markets’ stocks and currencies. However, we believe growth rate differentials continue to improve versus developed markets. Emerging markets’ central banks still have room to cut interest rates to spur growth, earnings growth is improving, and data, such as Purchasing Managers’ Index (PMI), suggest economic confidence is strengthening. In our view, stock valuations remain attractive relative to developed markets given strong fundamentals. While performance will vary country by country, several markets appear positioned to improve in 2017. Notably, Brazil and Russia are recovering from a recession, and India and China look to be successfully implementing economic reforms.
We expect volatility in emerging markets to continue through the remainder of 2016 and believe asset prices will fluctuate with the path of U.S. interest rates, expectations around China’s economy, the behavior of global commodity prices, and by president-elect Donald Trump’s approach to U.S. trade with the rest of the world. Looking ahead, we remain constructive on emerging markets in 2017 given the prospects of improving global growth and better valuations.
6
| Fund Characteristics |
| NOVEMBER 30, 2016 | |
Top Ten Holdings | % of net assets |
| Samsung Electronics Co. Ltd. | 5.9% |
| Tencent Holdings Ltd. | 5.0% |
| Taiwan Semiconductor Manufacturing Co. Ltd. | 5.0% |
| Alibaba Group Holding Ltd. ADR | 3.4% |
| Vale SA ADR | 2.3% |
| HDFC Bank Ltd. | 2.1% |
| Industrial & Commercial Bank of China Ltd., H Shares | 2.1% |
| Itau Unibanco Holding SA ADR | 1.9% |
| Naspers Ltd., N Shares | 1.8% |
| X5 Retail Group NV GDR | 1.7% |
Types of Investments in Portfolio | % of net assets |
| Common Stocks | 97.0% |
| Temporary Cash Investments | 5.4% |
| Other Assets and Liabilities | (2.4)% |
Investments by Country | % of net assets |
| China | 28.8% |
| South Korea | 11.1% |
| Taiwan | 10.2% |
| Brazil | 8.1% |
| Russia | 7.4% |
| India | 6.4% |
| South Africa | 5.3% |
| Thailand | 4.5% |
| Indonesia | 3.7% |
| Mexico | 3.1% |
| Hungary | 2.3% |
| Other Countries | 6.1% |
| Cash and Equivalents* | 3.0% |
| *Includes temporary cash investments and other assets and liabilities. | |
7
| Shareholder Fee Example |
Fund shareholders may incur two types of costs: (1) transaction costs, including sales charges (loads) on purchase payments and redemption/exchange fees; and (2) ongoing costs, including management fees; distribution and service (12b-1) fees; and other fund expenses. This example is intended to help you understand your ongoing costs (in dollars) of investing in your fund and to compare these costs with the ongoing cost of investing in other mutual funds.
The example is based on an investment of $1,000 made at the beginning of the period and held for the entire period from June 1, 2016 to November 30, 2016.
Actual Expenses
The table provides information about actual account values and actual expenses for each class. You may use the information, together with the amount you invested, to estimate the expenses that you paid over the period. First, identify the share class you own. Then simply divide your account value by $1,000 (for example, an $8,600 account value divided by $1,000 = 8.6), then multiply the result by the number under the heading “Expenses Paid During Period” to estimate the expenses you paid on your account during this period.
If you hold Investor Class shares of any American Century Investments fund, or Institutional Class shares of the American Century Diversified Bond Fund, in an American Century Investments account (i.e., not a financial intermediary or retirement plan account), American Century Investments may charge you a $12.50 semiannual account maintenance fee if the value of those shares is less than $10,000. We will redeem shares automatically in one of your accounts to pay the $12.50 fee. In determining your total eligible investment amount, we will include your investments in all personal accounts (including American Century Investments Brokerage accounts) registered under your Social Security number. Personal accounts include individual accounts, joint accounts, UGMA/UTMA accounts, personal trusts, Coverdell Education Savings Accounts and IRAs (including traditional, Roth, Rollover, SEP-, SARSEP- and SIMPLE-IRAs), and certain other retirement accounts. If you have only business, business retirement, employer-sponsored or American Century Investments Brokerage accounts, you are currently not subject to this fee. If you are subject to the Account Maintenance Fee, your account value could be reduced by the fee amount.
Hypothetical Example for Comparison Purposes
The table also provides information about hypothetical account values and hypothetical expenses based on the actual expense ratio of each class of your fund and an assumed rate of return of 5% per year before expenses, which is not the actual return of a fund’s share class. The hypothetical account values and expenses may not be used to estimate the actual ending account balance or expenses you paid for the period. You may use this information to compare the ongoing costs of investing in your fund and other funds. To do so, compare this 5% hypothetical example with the 5% hypothetical examples that appear in the shareholder reports of the other funds.
Please note that the expenses shown in the table are meant to highlight your ongoing costs only and do not reflect any transactional costs, such as sales charges (loads) or redemption/exchange fees. Therefore, the table is useful in comparing ongoing costs only, and will not help you determine the relative total costs of owning different funds. In addition, if these transactional costs were included, your costs would have been higher.
8
| Beginning Account Value 6/1/16 | Ending Account Value 11/30/16 | Expenses Paid During Period(1) 6/1/16 - 11/30/16 | Annualized Expense Ratio(1) | |
Actual | ||||
| Investor Class (after waiver) | $1,000 | $1,069.90 | $7.04 | 1.36% |
| Investor Class (before waiver) | $1,000 | $1,069.90(2) | $8.33 | 1.61% |
| Institutional Class (after waiver) | $1,000 | $1,069.30 | $6.00 | 1.16% |
| Institutional Class (before waiver) | $1,000 | $1,069.30(2) | $7.29 | 1.41% |
| A Class (after waiver) | $1,000 | $1,068.60 | $8.33 | 1.61% |
| A Class (before waiver) | $1,000 | $1,068.60(2) | $9.62 | 1.86% |
| C Class (after waiver) | $1,000 | $1,064.20 | $12.18 | 2.36% |
| C Class (before waiver) | $1,000 | $1,064.20(2) | $13.47 | 2.61% |
| R Class (after waiver) | $1,000 | $1,066.60 | $9.61 | 1.86% |
| R Class (before waiver) | $1,000 | $1,066.60(2) | $10.90 | 2.11% |
| R6 Class (after waiver) | $1,000 | $1,071.80 | $5.23 | 1.01% |
| R6 Class (before waiver) | $1,000 | $1,071.80(2) | $6.53 | 1.26% |
| Hypothetical | ||||
| Investor Class (after waiver) | $1,000 | $1,018.20 | $6.86 | 1.36% |
| Investor Class (before waiver) | $1,000 | $1,016.95 | $8.12 | 1.61% |
| Institutional Class (after waiver) | $1,000 | $1,019.20 | $5.86 | 1.16% |
| Institutional Class (before waiver) | $1,000 | $1,017.95 | $7.11 | 1.41% |
| A Class (after waiver) | $1,000 | $1,016.95 | $8.12 | 1.61% |
| A Class (before waiver) | $1,000 | $1,015.70 | $9.37 | 1.86% |
| C Class (after waiver) | $1,000 | $1,013.20 | $11.88 | 2.36% |
| C Class (before waiver) | $1,000 | $1,011.95 | $13.13 | 2.61% |
| R Class (after waiver) | $1,000 | $1,015.70 | $9.37 | 1.86% |
| R Class (before waiver) | $1,000 | $1,014.45 | $10.63 | 2.11% |
| R6 Class (after waiver) | $1,000 | $1,019.95 | $5.10 | 1.01% |
| R6 Class (before waiver) | $1,000 | $1,018.70 | $6.36 | 1.26% |
| (1) | Expenses are equal to the class's annualized expense ratio listed in the table above, multiplied by the average account value over the period, multiplied by 183, the number of days in the most recent fiscal half-year, divided by 366, to reflect the one-half year period. |
| (2) | Ending account value assumes the return earned after waiver and would have been lower if a portion of the fees had not been waived. |
9
| Schedule of Investments |
NOVEMBER 30, 2016
| Shares | Value | ||||
| COMMON STOCKS — 97.0% | |||||
| Brazil — 8.1% | |||||
| Itau Unibanco Holding SA ADR | 1,063,132 | $ | 10,992,785 | ||
| Klabin SA | 836,500 | 4,197,278 | |||
| Kroton Educacional SA | 747,800 | 3,195,018 | |||
| Multiplan Empreendimentos Imobiliarios SA | 164,100 | 2,820,518 | |||
| Raia Drogasil SA | 338,200 | 6,448,905 | |||
| Ultrapar Participacoes SA | 307,900 | 6,290,826 | |||
| Vale SA ADR | 1,585,416 | 13,460,182 | |||
| 47,405,512 | |||||
| China — 28.8% | |||||
| AAC Technologies Holdings, Inc. | 712,500 | 6,448,462 | |||
Alibaba Group Holding Ltd. ADR(1) | 209,634 | 19,709,789 | |||
| Anhui Conch Cement Co. Ltd., H Shares | 1,823,000 | 5,276,394 | |||
Beijing Enterprises Water Group Ltd.(1) | 9,932,000 | 7,183,462 | |||
| Brilliance China Automotive Holdings Ltd. | 2,170,000 | 3,038,252 | |||
| China Gas Holdings Ltd. | 3,108,000 | 4,111,143 | |||
| China Lodging Group Ltd. ADR | 100,018 | 5,238,943 | |||
| China Mobile Ltd. | 887,000 | 9,680,210 | |||
| China Overseas Land & Investment Ltd. | 1,188,000 | 3,430,826 | |||
| China Railway Construction Corp. Ltd., H Shares | 4,864,500 | 6,911,209 | |||
| CNOOC Ltd. | 4,644,000 | 5,855,517 | |||
Ctrip.com International Ltd. ADR(1) | 122,318 | 5,532,443 | |||
| Industrial & Commercial Bank of China Ltd., H Shares | 20,047,645 | 12,276,969 | |||
| Minth Group Ltd. | 1,110,000 | 3,634,887 | |||
New Oriental Education & Technology Group, Inc. ADR(1) | 157,120 | 7,882,710 | |||
| Nine Dragons Paper Holdings Ltd. | 3,672,000 | 3,223,918 | |||
| Ping An Insurance Group Co. of China Ltd., H Shares | 1,806,500 | 9,991,472 | |||
| Shenzhou International Group Holdings Ltd. | 1,328,000 | 8,166,776 | |||
| Sunny Optical Technology Group Co. Ltd. | 675,000 | 3,398,279 | |||
TAL Education Group ADR(1) | 69,340 | 5,306,590 | |||
| Tencent Holdings Ltd. | 1,181,200 | 29,497,639 | |||
Weibo Corp. ADR(1) | 68,722 | 3,526,126 | |||
| 169,322,016 | |||||
| Czech — 0.7% | |||||
Moneta Money Bank AS(1) | 1,165,878 | 3,804,969 | |||
| Egypt — 0.4% | |||||
| Commercial International Bank Egypt S.A.E. | 587,884 | 2,270,585 | |||
| Hungary — 2.3% | |||||
| OTP Bank plc | 261,403 | 7,045,752 | |||
| Richter Gedeon Nyrt | 308,034 | 6,151,833 | |||
| 13,197,585 | |||||
| India — 6.4% | |||||
Bharat Financial Inclusion Ltd.(1) | 518,400 | 5,600,624 | |||
| Godrej Consumer Products Ltd. | 282,408 | 6,011,938 | |||
| Havells India Ltd. | 846,277 | 4,257,413 | |||
| HDFC Bank Ltd. | 626,241 | 12,480,182 | |||
10
| Shares | Value | ||||
| Larsen & Toubro Ltd. | 211,433 | $ | 4,271,197 | ||
| Motherson Sumi Systems Ltd. | 1,049,440 | 4,749,766 | |||
| 37,371,120 | |||||
| Indonesia — 3.7% | |||||
| Astra International Tbk PT | 11,528,600 | 6,422,500 | |||
| Bank Rakyat Indonesia Persero Tbk PT | 6,512,800 | 5,238,112 | |||
| Indofood Sukses Makmur Tbk PT | 9,262,600 | 5,177,214 | |||
| Telekomunikasi Indonesia Persero Tbk PT | 18,335,000 | 5,113,913 | |||
| 21,951,739 | |||||
| Malaysia — 0.4% | |||||
| My EG Services Bhd | 4,939,600 | 2,488,603 | |||
| Mexico — 3.1% | |||||
| Alsea SAB de CV | 782,674 | 2,297,507 | |||
Cemex SAB de CV ADR(1) | 838,263 | 6,546,834 | |||
| Gentera SAB de CV | 2,611,130 | 4,131,921 | |||
| Grupo Aeroportuario del Centro Norte SAB de CV | 1,082,933 | 5,104,669 | |||
| 18,080,931 | |||||
| Peru — 1.0% | |||||
| Credicorp Ltd. | 37,277 | 5,840,933 | |||
| Philippines — 0.8% | |||||
| Ayala Land, Inc. | 7,455,800 | 4,930,328 | |||
| Russia — 7.4% | |||||
| MMC Norilsk Nickel PJSC ADR | 274,004 | 4,597,787 | |||
| Moscow Exchange MICEX-RTS PJSC | 3,281,554 | 6,109,192 | |||
| Novatek OJSC GDR | 78,402 | 9,259,276 | |||
| Sberbank of Russia PJSC ADR | 892,621 | 8,948,525 | |||
X5 Retail Group NV GDR(1) | 335,485 | 10,064,550 | |||
Yandex NV, A Shares(1) | 230,353 | 4,379,011 | |||
| 43,358,341 | |||||
| South Africa — 5.3% | |||||
| Aspen Pharmacare Holdings Ltd. | 294,503 | 6,065,371 | |||
| Capitec Bank Holdings Ltd. | 121,651 | 5,619,494 | |||
| Discovery Holdings Ltd. | 384,110 | 3,040,137 | |||
| Naspers Ltd., N Shares | 70,601 | 10,305,464 | |||
Sappi Ltd.(1) | 1,076,709 | 6,371,150 | |||
| 31,401,616 | |||||
| South Korea — 11.1% | |||||
CJ Korea Express Corp.(1) | 29,806 | 4,691,249 | |||
| GS Retail Co. Ltd. | 86,782 | 3,511,217 | |||
| HS Industries Co. Ltd. | 352,220 | 2,786,908 | |||
| Innocean Worldwide, Inc. | 76,986 | 4,096,086 | |||
| Medy-Tox, Inc. | 15,569 | 4,370,853 | |||
| NAVER Corp. | 12,626 | 8,618,578 | |||
| Samsung Electronics Co. Ltd. | 23,022 | 34,383,826 | |||
Wonik Holdings Co. Ltd.(1) | 505,364 | 2,628,299 | |||
| 65,087,016 | |||||
| Taiwan — 10.2% | |||||
| Green Seal Holding Ltd. | 637,000 | 2,877,922 | |||
| Hota Industrial Manufacturing Co. Ltd. | 790,000 | 3,036,269 | |||
| Largan Precision Co. Ltd. | 51,000 | 5,904,370 | |||
| Nien Made Enterprise Co. Ltd. | 285,000 | 3,192,200 | |||
11
| Shares | Value | ||||
| President Chain Store Corp. | 857,000 | $ | 6,439,667 | ||
| Taiwan Paiho Ltd. | 2,236,000 | 6,797,866 | |||
| Taiwan Semiconductor Manufacturing Co. Ltd. | 5,130,939 | 29,459,475 | |||
| Tung Thih Electronic Co. Ltd. | 257,000 | 2,217,394 | |||
| 59,925,163 | |||||
| Thailand — 4.5% | |||||
| Airports of Thailand PCL | 295,000 | 3,323,757 | |||
| CP ALL PCL | 4,624,700 | 7,809,475 | |||
| Kasikornbank PCL | 575,300 | 2,741,098 | |||
| KCE Electronics PCL | 2,007,100 | 6,778,558 | |||
| Minor International PCL | 2,351,600 | 2,471,587 | |||
| Srisawad Power 1979 PCL | 2,976,200 | 3,420,009 | |||
| 26,544,484 | |||||
| Turkey — 1.7% | |||||
| BIM Birlesik Magazalar AS | 226,952 | 3,183,947 | |||
| Tofas Turk Otomobil Fabrikasi AS | 746,899 | 4,660,918 | |||
| Ulker Biskuvi Sanayi AS | 458,706 | 2,303,076 | |||
| 10,147,941 | |||||
| United Kingdom — 1.1% | |||||
Tullow Oil plc(1) | 1,803,552 | 6,720,165 | |||
TOTAL COMMON STOCKS (Cost $486,374,157) | 569,849,047 | ||||
| TEMPORARY CASH INVESTMENTS — 5.4% | |||||
| Repurchase Agreement, Fixed Income Clearing Corp., (collateralized by various U.S. Treasury obligations, 3.625%, 2/15/44, valued at $32,195,644), at 0.08%, dated 11/30/16, due 12/1/16 (Delivery value $31,564,070) | 31,564,000 | ||||
| State Street Institutional U.S. Government Money Market Fund, Premier Class | 5,025 | 5,025 | |||
TOTAL TEMPORARY CASH INVESTMENTS (Cost $31,569,025) | 31,569,025 | ||||
TOTAL INVESTMENT SECURITIES — 102.4% (Cost $517,943,182) | 601,418,072 | ||||
| OTHER ASSETS AND LIABILITIES — (2.4)% | (14,115,177 | ) | |||
| TOTAL NET ASSETS — 100.0% | $ | 587,302,895 | |||
12
| MARKET SECTOR DIVERSIFICATION | ||
(as a % of net assets) | ||
| Information Technology | 26.8 | % |
| Financials | 18.8 | % |
| Consumer Discretionary | 15.5 | % |
| Consumer Staples | 8.6 | % |
| Materials | 8.5 | % |
| Industrials | 5.0 | % |
| Energy | 4.8 | % |
| Health Care | 2.8 | % |
| Telecommunication Services | 2.4 | % |
| Utilities | 1.9 | % |
| Real Estate | 1.9 | % |
| Cash and Equivalents* | 3.0 | % |
*Includes temporary cash investments and other assets and liabilities.
| NOTES TO SCHEDULE OF INVESTMENTS | ||
| ADR | - | American Depositary Receipt |
| GDR | - | Global Depositary Receipt |
(1) Non-income producing.
See Notes to Financial Statements.
13
| Statement of Assets and Liabilities |
| NOVEMBER 30, 2016 | |||
| Assets | |||
| Investment securities, at value (cost of $517,943,182) | $ | 601,418,072 | |
| Foreign currency holdings, at value (cost of $166,759) | 164,842 | ||
| Receivable for capital shares sold | 2,222,090 | ||
| Dividends and interest receivable | 89,151 | ||
| 603,894,155 | |||
| Liabilities | |||
| Payable for investments purchased | 15,408,823 | ||
| Payable for capital shares redeemed | 541,999 | ||
| Accrued management fees | 626,877 | ||
| Distribution and service fees payable | 13,561 | ||
| 16,591,260 | |||
| Net Assets | $ | 587,302,895 | |
| Net Assets Consist of: | |||
| Capital (par value and paid-in surplus) | $ | 571,461,743 | |
| Undistributed net investment income | 1,016,341 | ||
| Accumulated net realized loss | (68,623,493 | ) | |
| Net unrealized appreciation | 83,448,304 | ||
| $ | 587,302,895 | ||
| Net Assets | Shares Outstanding | Net Asset Value Per Share | ||||
| Investor Class, $0.01 Par Value | $470,279,852 | 54,873,075 | $8.57 | |||
| Institutional Class, $0.01 Par Value | $37,035,821 | 4,211,789 | $8.79 | |||
| A Class, $0.01 Par Value | $37,742,515 | 4,570,326 | $8.26* | |||
| C Class, $0.01 Par Value | $5,839,783 | 765,199 | $7.63 | |||
| R Class, $0.01 Par Value | $2,340,112 | 280,947 | $8.33 | |||
| R6 Class, $0.01 Par Value | $34,064,812 | 3,867,015 | $8.81 | |||
*Maximum offering price $8.76 (net asset value divided by 0.9425).
See Notes to Financial Statements.
14
| Statement of Operations |
| YEAR ENDED NOVEMBER 30, 2016 | |||
| Investment Income (Loss) | |||
| Income: | |||
| Dividends (net of foreign taxes withheld of $1,124,954) | $ | 8,855,226 | |
| Interest | 11,849 | ||
| 8,867,075 | |||
| Expenses: | |||
| Management fees | 8,423,961 | ||
| Distribution and service fees: | |||
| A Class | 84,715 | ||
| C Class | 46,517 | ||
| R Class | 9,296 | ||
| Directors' fees and expenses | 17,369 | ||
| Other expenses | 15,620 | ||
| 8,597,478 | |||
| Fees waived | (1,322,805 | ) | |
| 7,274,673 | |||
| Net investment income (loss) | 1,592,402 | ||
| Realized and Unrealized Gain (Loss) | |||
| Net realized gain (loss) on: | |||
| Investment transactions | (6,771,748 | ) | |
| Foreign currency transactions | (1,233,521 | ) | |
| Capital gain distributions received from underlying funds | 780,521 | ||
| (7,224,748 | ) | ||
| Change in net unrealized appreciation (depreciation) on: | |||
| Investments | 37,704,908 | ||
| Translation of assets and liabilities in foreign currencies | (9,409 | ) | |
| 37,695,499 | |||
| Net realized and unrealized gain (loss) | 30,470,751 | ||
| Net Increase (Decrease) in Net Assets Resulting from Operations | $ | 32,063,153 | |
See Notes to Financial Statements.
15
| Statement of Changes in Net Assets |
| YEARS ENDED NOVEMBER 30, 2016 AND NOVEMBER 30, 2015 | ||||||
| Increase (Decrease) in Net Assets | November 30, 2016 | November 30, 2015 | ||||
| Operations | ||||||
| Net investment income (loss) | $ | 1,592,402 | $ | 1,325,214 | ||
| Net realized gain (loss) | (7,224,748 | ) | (3,175,447 | ) | ||
| Change in net unrealized appreciation (depreciation) | 37,695,499 | (44,677,252 | ) | |||
| Net increase (decrease) in net assets resulting from operations | 32,063,153 | (46,527,485 | ) | |||
| Distributions to Shareholders | ||||||
| From net investment income: | ||||||
| Investor Class | (550,390 | ) | (277,848 | ) | ||
| Institutional Class | (88,977 | ) | (40,979 | ) | ||
| R6 Class | (128,912 | ) | (59,777 | ) | ||
| Decrease in net assets from distributions | (768,279 | ) | (378,604 | ) | ||
| Capital Share Transactions | ||||||
| Net increase (decrease) in net assets from capital share transactions (Note 5) | 96,278,777 | 67,583,843 | ||||
| Redemption Fees | ||||||
| Increase in net assets from redemption fees | 66,323 | 34,209 | ||||
| Net increase (decrease) in net assets | 127,639,974 | 20,711,963 | ||||
| Net Assets | ||||||
| Beginning of period | 459,662,921 | 438,950,958 | ||||
| End of period | $ | 587,302,895 | $ | 459,662,921 | ||
| Undistributed net investment income | $ | 1,016,341 | $ | 762,888 | ||
See Notes to Financial Statements.
16
| Notes to Financial Statements |
NOVEMBER 30, 2016
1. Organization
American Century World Mutual Funds, Inc. (the corporation) is registered under the Investment Company Act of 1940, as amended (the 1940 Act), as an open-end management investment company and is organized as a Maryland corporation. Emerging Markets Fund (the fund) is one fund in a series issued by the corporation. The fund’s investment objective is to seek capital growth.
The fund offers the Investor Class, the Institutional Class, the A Class, the C Class, the R Class and the R6 Class. The A Class may incur an initial sales charge. The A Class and C Class may be subject to a contingent deferred sales charge. The share classes differ principally in their respective sales charges and distribution and shareholder servicing expenses and arrangements. The Institutional Class and R6 Class shareholders do not require the same level of shareholder and administrative services from American Century Investment Management, Inc. (ACIM) (the investment advisor) as shareholders of other classes. In addition, financial intermediaries do not receive any fees for the R6 Class. As a result, the Institutional Class and R6 Class are charged lower unified management fees.
2. Significant Accounting Policies
The following is a summary of significant accounting policies consistently followed by the fund in preparation of its financial statements. The fund is an investment company and follows accounting and reporting guidance in accordance with accounting principles generally accepted in the United States of America. This may require management to make certain estimates and assumptions at the date of the financial statements. Actual results could differ from these estimates. Management evaluated the impact of events or transactions occurring through the date the financial statements were issued that would merit recognition or disclosure.
Investment Valuations — The fund determines the fair value of its investments and computes its net asset value per share at the close of regular trading (usually 4 p.m. Eastern time) on the New York Stock Exchange (NYSE) on each day the NYSE is open. The Board of Directors has adopted valuation policies and procedures to guide the investment advisor in the fund’s investment valuation process and to provide methodologies for the oversight of the fund’s pricing function.
Equity securities that are listed or traded on a domestic securities exchange are valued at the last reported sales price or at the official closing price as provided by the exchange. Equity securities traded on foreign securities exchanges are generally valued at the closing price of such securities on the exchange where primarily traded or at the close of the NYSE, if that is earlier. If no last sales price is reported, or if local convention or regulation so provides, the mean of the latest bid and asked prices may be used. Securities traded over-the-counter are valued at the mean of the latest bid and asked prices, the last sales price, or the official closing price. Equity securities initially expressed in local currencies are translated into U.S. dollars at the mean of the appropriate currency exchange rate at the close of the NYSE as provided by an independent pricing service.
Open-end management investment companies are valued at the reported net asset value per share. Repurchase agreements are valued at cost, which approximates fair value.
If the fund determines that the market price for an investment is not readily available or the valuation methods mentioned above do not reflect an investment’s fair value, such investment is valued as determined in good faith by the Board of Directors or its delegate, in accordance with policies and procedures adopted by the Board of Directors. In its determination of fair value, the fund may review several factors including, but not limited to, market information regarding the specific investment or comparable investments and correlation with other investment types, futures indices or general market indicators. Circumstances that may cause the fund to use these procedures to value an investment include, but are not limited to: an investment has been declared in default or is distressed; trading in a security has been suspended during the trading day or a security is not actively trading on its principal exchange; prices received from a regular pricing source are deemed unreliable; or there is a foreign market holiday and no trading occurred.
The fund monitors for significant events occurring after the close of an investment’s primary exchange but before the fund’s net asset value per share is determined. Significant events may include, but are not limited to: corporate announcements and transactions; governmental action and political unrest that could impact a
17
specific investment or an investment sector; or armed conflicts, natural disasters and similar events that could affect investments in a specific country or region. The fund also monitors for significant fluctuations between domestic and foreign markets, as evidenced by the U.S. market or such other indicators that the Board of Directors, or its delegate, deems appropriate. If significant fluctuations in foreign markets are identified, the fund may apply a model-derived factor to the closing price of equity securities traded on foreign securities exchanges. The factor is based on observable market data as provided by an independent pricing service.
Security Transactions — Security transactions are accounted for as of the trade date. Net realized gains and losses are determined on the identified cost basis, which is also used for federal income tax purposes.
Investment Income — Income and capital gain distributions, if any, are recorded as of the ex-dividend date. Long-term capital gain distributions, if any, are a component of net realized gain (loss). Dividend income less foreign taxes withheld, if any, is recorded as of the ex-dividend date. Distributions received on securities that represent a return of capital or long-term capital gain are recorded as a reduction of cost of investments and/or as a realized gain. The fund may estimate the components of distributions received that may be considered nontaxable distributions or long-term capital gain distributions for income tax purposes. Interest income is recorded on the accrual basis and includes accretion of discounts and amortization of premiums.
Foreign Currency Translations — All assets and liabilities initially expressed in foreign currencies are translated into U.S. dollars at prevailing exchange rates at period end. The fund may enter into spot foreign currency exchange contracts to facilitate transactions denominated in a foreign currency. Purchases and sales of investment securities, dividend and interest income, spot foreign currency exchange contracts, and expenses are translated at the rates of exchange prevailing on the respective dates of such transactions. Net realized and unrealized foreign currency exchange gains or losses related to investment securities are a component of net realized gain (loss) on investment transactions and change in net unrealized appreciation (depreciation) on investments, respectively.
Repurchase Agreements — The fund may enter into repurchase agreements with institutions that ACIM has determined are creditworthy pursuant to criteria adopted by the Board of Directors. The fund requires that the collateral, represented by securities, received in a repurchase transaction be transferred to the custodian in a manner sufficient to enable the fund to obtain those securities in the event of a default under the repurchase agreement. ACIM monitors, on a daily basis, the securities transferred to ensure the value, including accrued interest, of the securities under each repurchase agreement is equal to or greater than amounts owed to the fund under each repurchase agreement.
Joint Trading Account — Pursuant to an Exemptive Order issued by the Securities and Exchange Commission, the fund, along with certain other funds in the American Century Investments family of funds, may transfer uninvested cash balances into a joint trading account. These balances are invested in one or more repurchase agreements that are collateralized by U.S. Treasury or Agency obligations.
Income Tax Status — It is the fund’s policy to distribute substantially all net investment income and net realized gains to shareholders and to otherwise qualify as a regulated investment company under provisions of the Internal Revenue Code. Accordingly, no provision has been made for income taxes. The fund files U.S. federal, state, local and non-U.S. tax returns as applicable. The fund's tax returns are subject to examination by the relevant taxing authority until expiration of the applicable statute of limitations, which is generally three years from the date of filing but can be longer in certain jurisdictions. At this time, management believes there are no uncertain tax positions which, based on their technical merit, would not be sustained upon examination and for which it is reasonably possible that the total amounts of unrecognized tax benefits will significantly change in the next twelve months.
Multiple Class — All shares of the fund represent an equal pro rata interest in the net assets of the class to which such shares belong, and have identical voting, dividend, liquidation and other rights and the same terms and conditions, except for class specific expenses and exclusive rights to vote on matters affecting only individual classes. Income, non-class specific expenses, and realized and unrealized capital gains and losses of the fund are allocated to each class of shares based on their relative net assets.
Distributions to Shareholders — Distributions from net investment income and net realized gains, if any, are generally declared and paid annually. The fund may make distributions on a more frequent basis to comply with the distribution requirements of the Internal Revenue Code, in all events in a manner consistent with provisions of the 1940 Act.
Redemption Fees — The fund may impose a 2.00% redemption fee on shares held less than 60 days. The fee may not be applicable to all classes. The redemption fee is retained by the fund and helps cover
18
transaction costs that long-term investors may bear when the fund sells securities to meet investor redemptions.
Indemnifications — Under the corporation’s organizational documents, its officers and directors are indemnified against certain liabilities arising out of the performance of their duties to the fund. In addition, in the normal course of business, the fund enters into contracts that provide general indemnifications. The maximum exposure under these arrangements is unknown as this would involve future claims that may be made against a fund. The risk of material loss from such claims is considered by management to be remote.
3. Fees and Transactions with Related Parties
Certain officers and directors of the corporation are also officers and/or directors of American Century Companies, Inc. (ACC). The corporation’s investment advisor, ACIM, the corporation's distributor, American Century Investment Services, Inc. (ACIS), and the corporation’s transfer agent, American Century Services, LLC, are wholly owned, directly or indirectly, by ACC. Various funds issued by American Century Asset Allocation Portfolios, Inc. and American Century Strategic Asset Allocations, Inc. own, in aggregate, 25% of the shares of the fund. Related parties do not invest in the fund for the purpose of exercising management or control.
Management Fees — The corporation has entered into a management agreement with ACIM, under which ACIM provides the fund with investment advisory and management services in exchange for a single, unified management fee (the fee) per class. The agreement provides that all expenses of managing and operating the fund, except distribution and service fees, brokerage expenses, taxes, interest, fees and expenses of the independent directors (including legal counsel fees), and extraordinary expenses, will be paid by ACIM. The fee is computed and accrued daily based on each class’s daily net assets and paid monthly in arrears. The rate of the fee is determined by applying a fee rate calculation formula. This formula takes into account the fund’s assets as well as certain assets, if any, of other clients of the investment advisor outside the American Century Investments family of funds (such as subadvised funds and separate accounts) that have very similar investment teams and investment strategies (strategy assets). The strategy assets of the fund also include the assets of NT Emerging Markets Fund, one fund in a series issued by the corporation. The annual management fee schedule ranges from 1.250% to 1.850% for the Investor Class, A Class, C Class and R Class. The annual management fee schedule ranges from 1.050% to 1.650% for the Institutional Class and 0.900% to 1.500% for the R6 Class. During the year ended November 30, 2016, the investment advisor agreed to waive 0.250% of the fund's management fee. The investment advisor expects this waiver to continue until July 31, 2017 and cannot terminate it prior to such date without the approval of the Board of Directors. The total amount of the waiver for each class for the year ended November 30, 2016 was $1,077,408, $71,533, $84,715, $11,629, $4,648 and $72,872 for the Investor Class, Institutional Class, A Class, C Class, R Class and R6 Class, respectively. The effective annual management fee before waiver for each class for the year ended November 30, 2016 was 1.62% for the Investor Class, A Class, C Class and R Class, 1.42% for the Institutional Class and 1.27% for the R6 Class. The effective annual management fee after waiver for each class for the year ended November 30, 2016 was 1.37% for the Investor Class, A Class, C Class and R Class, 1.17% for the Institutional Class and 1.02% for the R6 Class.
Distribution and Service Fees — The Board of Directors has adopted a separate Master Distribution and Individual Shareholder Services Plan for each of the A Class, C Class and R Class (collectively the plans), pursuant to Rule 12b-1 of the 1940 Act. The plans provide that the A Class will pay ACIS an annual distribution and service fee of 0.25%. The plans provide that the C Class will pay ACIS an annual distribution and service fee of 1.00%, of which 0.25% is paid for individual shareholder services and 0.75% is paid for distribution services. The plans provide that the R Class will pay ACIS an annual distribution and service fee of 0.50%. The fees are computed and accrued daily based on each class’s daily net assets and paid monthly in arrears. The fees are used to pay financial intermediaries for distribution and individual shareholder services. Fees incurred under the plans during the year ended November 30, 2016 are detailed in the Statement of Operations.
Directors' Fees and Expenses — The Board of Directors is responsible for overseeing the investment advisor’s management and operations of the fund. The directors receive detailed information about the fund and its investment advisor regularly throughout the year, and meet at least quarterly with management of the investment advisor to review reports about fund operations. The fund’s officers do not receive compensation from the fund.
Acquired Fund Fees and Expenses — The fund may invest in mutual funds, exchange-traded funds, and business development companies (the acquired funds). The fund will indirectly realize its pro rata share of the
19
fees and expenses of the acquired funds in which it invests. These indirect fees and expenses are not paid out of the fund's assets but are reflected in the return realized by the fund on its investment in the acquired funds.
Interfund Transactions — The fund may enter into security transactions with other American Century Investments funds and other client accounts of the investment advisor, in accordance with the 1940 Act rules and procedures adopted by the Board of Directors. The rules and procedures require, among other things, that these transactions be effected at the independent current market price of the security. There were no interfund transactions during the period.
4. Investment Transactions
Purchases and sales of investment securities, excluding short-term investments, for the year ended November 30, 2016 were $403,507,358 and $310,329,767, respectively.
5. Capital Share Transactions
Transactions in shares of the fund were as follows:
| Year ended November 30, 2016 | Year ended November 30, 2015 | |||||||||
| Shares | Amount | Shares | Amount | |||||||
| Investor Class/Shares Authorized | 380,000,000 | 400,000,000 | ||||||||
| Sold | 18,596,256 | $ | 153,561,388 | 13,659,639 | $ | 116,335,445 | ||||
| Issued in reinvestment of distributions | 70,047 | 535,859 | 31,378 | 272,985 | ||||||
| Redeemed | (13,125,822 | ) | (108,549,360 | ) | (8,051,549 | ) | (69,730,913 | ) | ||
| 5,540,481 | 45,547,887 | 5,639,468 | 46,877,517 | |||||||
| Institutional Class/Shares Authorized | 35,000,000 | 40,000,000 | ||||||||
| Sold | 4,559,594 | 37,876,044 | 493,583 | 4,194,048 | ||||||
| Issued in reinvestment of distributions | 11,337 | 88,884 | 4,598 | 40,966 | ||||||
| Redeemed | (936,195 | ) | (8,059,380 | ) | (1,685,794 | ) | (15,221,632 | ) | ||
| 3,634,736 | 29,905,548 | (1,187,613 | ) | (10,986,618 | ) | |||||
| A Class/Shares Authorized | 30,000,000 | 30,000,000 | ||||||||
| Sold | 3,099,527 | 24,741,141 | 3,008,091 | 25,809,533 | ||||||
| Redeemed | (1,808,554 | ) | (14,483,730 | ) | (795,069 | ) | (6,632,037 | ) | ||
| �� | 1,290,973 | 10,257,411 | 2,213,022 | 19,177,496 | ||||||
| C Class/Shares Authorized | 30,000,000 | 30,000,000 | ||||||||
| Sold | 446,258 | 3,315,528 | 197,372 | 1,638,348 | ||||||
| Redeemed | (113,764 | ) | (851,314 | ) | (148,454 | ) | (1,145,309 | ) | ||
| 332,494 | 2,464,214 | 48,918 | 493,039 | |||||||
| R Class/Shares Authorized | 30,000,000 | 25,000,000 | ||||||||
| Sold | 158,468 | 1,280,298 | 84,391 | 708,493 | ||||||
| Redeemed | (57,800 | ) | (468,776 | ) | (98,265 | ) | (839,815 | ) | ||
| 100,668 | 811,522 | (13,874 | ) | (131,322 | ) | |||||
| R6 Class/Shares Authorized | 40,000,000 | 30,000,000 | ||||||||
| Sold | 1,486,340 | 12,613,520 | 1,902,631 | 17,049,003 | ||||||
| Issued in reinvestment of distributions | 16,443 | 128,912 | 6,701 | 59,777 | ||||||
| Redeemed | (633,883 | ) | (5,450,237 | ) | (551,800 | ) | (4,955,049 | ) | ||
| 868,900 | 7,292,195 | 1,357,532 | 12,153,731 | |||||||
| Net increase (decrease) | 11,768,252 | $ | 96,278,777 | 8,057,453 | $ | 67,583,843 | ||||
20
6. Fair Value Measurements
The fund’s investments valuation process is based on several considerations and may use multiple inputs to determine the fair value of the investments held by the fund. In conformity with accounting principles generally accepted in the United States of America, the inputs used to determine a valuation are classified into three broad levels.
| • | Level 1 valuation inputs consist of unadjusted quoted prices in an active market for identical investments. |
| • | Level 2 valuation inputs consist of direct or indirect observable market data (including quoted prices for comparable investments, evaluations of subsequent market events, interest rates, prepayment speeds, credit risk, etc.). These inputs also consist of quoted prices for identical investments initially expressed in local currencies that are adjusted through translation into U.S. dollars. |
| • | Level 3 valuation inputs consist of unobservable data (including a fund’s own assumptions). |
The level classification is based on the lowest level input that is significant to the fair valuation measurement. The valuation inputs are not necessarily an indication of the risks associated with investing in these securities or other financial instruments. There were no significant transfers between levels during the period.
The following is a summary of the level classifications as of period end. The Schedule of Investments provides additional information on the fund’s portfolio holdings.
| Level 1 | Level 2 | Level 3 | ||||||
| Assets | ||||||||
| Investment Securities | ||||||||
| Common Stocks | ||||||||
| Brazil | $ | 24,452,967 | $ | 22,952,545 | — | |||
| China | 47,196,601 | 122,125,415 | — | |||||
| Mexico | 6,546,834 | 11,534,097 | — | |||||
| Peru | 5,840,933 | — | — | |||||
| Russia | 4,379,011 | 38,979,330 | — | |||||
| Other Countries | — | 285,841,314 | — | |||||
| Temporary Cash Investments | 5,025 | 31,564,000 | — | |||||
| $ | 88,421,371 | $ | 512,996,701 | — | ||||
7. Risk Factors
There are certain risks involved in investing in foreign securities. These risks include those resulting from future adverse political, social and economic developments, fluctuations in currency exchange rates, the possible imposition of exchange controls, and other foreign laws or restrictions. Investing in emerging markets may accentuate these risks.
8. Federal Tax Information
The tax character of distributions paid during the years ended November 30, 2016 and November 30, 2015 were as follows:
| 2016 | 2015 | |||||
| Distributions Paid From | ||||||
| Ordinary income | $ | 768,279 | $ | 378,604 | ||
| Long-term capital gains | — | — | ||||
The book-basis character of distributions made during the year from net investment income or net realized gains may differ from their ultimate characterization for federal income tax purposes. These differences reflect the differing character of certain income items and net realized gains and losses for financial statement and tax purposes, and may result in reclassification among certain capital accounts on the financial statements.
21
As of November 30, 2016, the federal tax cost of investments and the components of distributable earnings on a tax-basis were as follows:
| Federal tax cost of investments | $ | 519,440,058 | |
| Gross tax appreciation of investments | $ | 101,823,597 | |
| Gross tax depreciation of investments | (19,845,583 | ) | |
| Net tax appreciation (depreciation) of investments | 81,978,014 | ||
| Net tax appreciation (depreciation) on translation of assets and liabilities in foreign currencies | (26,760 | ) | |
| Net tax appreciation (depreciation) | $ | 81,951,254 | |
| Undistributed ordinary income | $ | 2,190,643 | |
| Accumulated short-term capital losses | $ | (66,561,862 | ) |
| Accumulated long-term capital losses | $ | (1,738,883 | ) |
The difference between book-basis and tax-basis unrealized appreciation (depreciation) is attributable primarily to the realization to ordinary income for tax purposes of unrealized gains on investments in passive foreign investment companies.
Accumulated capital losses represent net capital loss carryovers that may be used to offset future realized capital gains for federal income tax purposes. Any unlimited losses will be required to be utilized prior to the losses which carry an expiration date. Future capital loss carryover utilization in any given year may be subject to Internal Revenue Code limitations. Capital loss carryovers of $(57,815,598) expire in 2017 and the remaining losses are unlimited.
9. Recently Issued Accounting Guidance
In October 2016, the Securities and Exchange Commission adopted new rules and forms as well as amendments to its rules and forms to modernize the reporting and disclosure of information by registered investment companies. The amendments to Regulation S-X will require standardized, enhanced disclosure about derivatives in investment company financial statements, as well as other provisions. Compliance with the amendments is effective on August 1, 2017. Management is currently evaluating the impact that adopting the amendments will have on the financial statement disclosures.
22
| Financial Highlights |
| For a Share Outstanding Throughout the Years Ended November 30 (except as noted) | |||||||||||||||
| Per-Share Data | Ratios and Supplemental Data | ||||||||||||||
| Income From Investment Operations: | Ratio to Average Net Assets of: | ||||||||||||||
| Net Asset Value, Beginning of Period | Net Investment Income (Loss)(1) | Net Realized and Unrealized Gain (Loss) | Total From Investment Operations | Distributions From Net Investment Income | Net Asset Value, End of Period | Total Return(2) | Operating Expenses | Operating Expenses (before expense waiver) | Net Investment Income (Loss) | Net Investment Income (Loss) (before expense waiver) | Portfolio Turnover Rate | Net Assets, End of Period (in thousands) | |||
| Investor Class | |||||||||||||||
| 2016 | $8.10 | 0.02 | 0.46 | 0.48 | (0.01) | $8.57 | 5.95% | 1.38% | 1.63% | 0.30% | 0.05% | 59% | $470,280 | ||
| 2015 | $9.00 | 0.03 | (0.92) | (0.89) | (0.01) | $8.10 | (9.93)% | 1.43% | 1.68% | 0.30% | 0.05% | 58% | $399,694 | ||
| 2014 | $8.87 | 0.03 | 0.13 | 0.16 | (0.03) | $9.00 | 1.84% | 1.45% | 1.70% | 0.29% | 0.04% | 74% | $393,357 | ||
| 2013 | $8.36 | 0.01 | 0.53 | 0.54 | (0.03) | $8.87 | 6.48% | 1.63% | 1.72% | 0.17% | 0.08% | 68% | $421,274 | ||
| 2012 | $7.38 | 0.02 | 0.96 | 0.98 | — | $8.36 | 13.28% | 1.74% | 1.74% | 0.29% | 0.29% | 85% | $452,331 | ||
| Institutional Class | |||||||||||||||
| 2016 | $8.31 | 0.04 | 0.47 | 0.51 | (0.03) | $8.79 | 6.13% | 1.18% | 1.43% | 0.50% | 0.25% | 59% | $37,036 | ||
| 2015 | $9.24 | 0.02 | (0.93) | (0.91) | (0.02) | $8.31 | (9.83)% | 1.23% | 1.48% | 0.50% | 0.25% | 58% | $4,797 | ||
| 2014 | $9.09 | 0.05 | 0.14 | 0.19 | (0.04) | $9.24 | 2.07% | 1.25% | 1.50% | 0.49% | 0.24% | 74% | $16,300 | ||
| 2013 | $8.56 | 0.03 | 0.55 | 0.58 | (0.05) | $9.09 | 6.77% | 1.43% | 1.52% | 0.37% | 0.28% | 68% | $32,452 | ||
| 2012 | $7.56 | 0.04 | 0.97 | 1.01 | (0.01) | $8.56 | 13.43% | 1.54% | 1.54% | 0.49% | 0.49% | 85% | $28,536 | ||
| A Class | |||||||||||||||
| 2016 | $7.82 | 0.01 | 0.43 | 0.44 | — | $8.26 | 5.63% | 1.63% | 1.88% | 0.05% | (0.20)% | 59% | $37,743 | ||
| 2015 | $8.70 | 0.01 | (0.89) | (0.88) | — | $7.82 | (10.11)% | 1.68% | 1.93% | 0.05% | (0.20)% | 58% | $25,632 | ||
| 2014 | $8.59 | 0.01 | 0.12 | 0.13 | (0.02) | $8.70 | 1.59% | 1.70% | 1.95% | 0.04% | (0.21)% | 74% | $9,278 | ||
| 2013 | $8.09 | (0.01) | 0.52 | 0.51 | (0.01) | $8.59 | 6.30% | 1.88% | 1.97% | (0.08)% | (0.17)% | 68% | $11,575 | ||
| 2012 | $7.16 | —(3) | 0.93 | 0.93 | — | $8.09 | 12.99% | 1.99% | 1.99% | 0.04% | 0.04% | 85% | $13,745 | ||
| For a Share Outstanding Throughout the Years Ended November 30 (except as noted) | |||||||||||||||
| Per-Share Data | Ratios and Supplemental Data | ||||||||||||||
| Income From Investment Operations: | Ratio to Average Net Assets of: | ||||||||||||||
| Net Asset Value, Beginning of Period | Net Investment Income (Loss)(1) | Net Realized and Unrealized Gain (Loss) | Total From Investment Operations | Distributions From Net Investment Income | Net Asset Value, End of Period | Total Return(2) | Operating Expenses | Operating Expenses (before expense waiver) | Net Investment Income (Loss) | Net Investment Income (Loss) (before expense waiver) | Portfolio Turnover Rate | Net Assets, End of Period (in thousands) | |||
| C Class | |||||||||||||||
| 2016 | $7.28 | (0.05) | 0.40 | 0.35 | — | $7.63 | 4.81% | 2.38% | 2.63% | (0.70)% | (0.95)% | 59% | $5,840 | ||
| 2015 | $8.15 | (0.05) | (0.82) | (0.87) | — | $7.28 | (10.67)% | 2.43% | 2.68% | (0.70)% | (0.95)% | 58% | $3,149 | ||
| 2014 | $8.09 | (0.06) | 0.13 | 0.07 | (0.01) | $8.15 | 0.82% | 2.45% | 2.70% | (0.71)% | (0.96)% | 74% | $3,129 | ||
| 2013 | $7.67 | (0.06) | 0.48 | 0.42 | — | $8.09 | 5.48% | 2.63% | 2.72% | (0.83)% | (0.92)% | 68% | $3,571 | ||
| 2012 | $6.84 | (0.05) | 0.88 | 0.83 | — | $7.67 | 12.13% | 2.74% | 2.74% | (0.71)% | (0.71)% | 85% | $3,376 | ||
| R Class | |||||||||||||||
| 2016 | $7.90 | (0.02) | 0.45 | 0.43 | — | $8.33 | 5.44% | 1.88% | 2.13% | (0.20)% | (0.45)% | 59% | $2,340 | ||
| 2015 | $8.82 | (0.02) | (0.90) | (0.92) | — | $7.90 | (10.43)% | 1.93% | 2.18% | (0.20)% | (0.45)% | 58% | $1,425 | ||
| 2014 | $8.72 | (0.02) | 0.14 | 0.12 | (0.02) | $8.82 | 1.38% | 1.95% | 2.20% | (0.21)% | (0.46)% | 74% | $1,712 | ||
| 2013 | $8.23 | (0.02) | 0.51 | 0.49 | — | $8.72 | 5.95% | 2.13% | 2.22% | (0.33)% | (0.42)% | 68% | $1,133 | ||
| 2012 | $7.30 | (0.02) | 0.95 | 0.93 | — | $8.23 | 12.74% | 2.24% | 2.24% | (0.21)% | (0.21)% | 85% | $824 | ||
| R6 Class | |||||||||||||||
| 2016 | $8.33 | 0.06 | 0.46 | 0.52 | (0.04) | $8.81 | 6.27% | 1.03% | 1.28% | 0.65% | 0.40% | 59% | $34,065 | ||
| 2015 | $9.25 | 0.07 | (0.95) | (0.88) | (0.04) | $8.33 | (9.58)% | 1.08% | 1.33% | 0.65% | 0.40% | 58% | $24,965 | ||
| 2014 | $9.09 | —(3) | 0.20 | 0.20 | (0.04) | $9.25 | 2.23% | 1.10% | 1.35% | 0.64% | 0.39% | 74% | $15,174 | ||
2013(4) | $8.46 | —(3) | 0.63 | 0.63 | — | $9.09 | 7.45% | 1.12%(5) | 1.37%(5) | 0.14%(5) | (0.11)%(5) | 68%(6) | $27 | ||
| Notes to Financial Highlights | |
| (1) | Computed using average shares outstanding throughout the period. |
| (2) | Total returns are calculated based on the net asset value of the last business day and do not reflect applicable sales charges, if any. Total returns for periods less than one year are not annualized. |
| (3) | Per-share amount was less than $0.005. |
| (4) | July 26, 2013 (commencement of sale) through November 30, 2013. |
| (5) | Annualized. |
| (6) | Portfolio turnover is calculated at the fund level. Percentage indicated was calculated for the year ended November 30, 2013. |
See Notes to Financial Statements.
| Report of Independent Registered Public Accounting Firm |
To the Board of Directors and Shareholders of American Century World Mutual Funds, Inc.:
We have audited the accompanying statement of assets and liabilities, including the schedule of investments, of Emerging Markets Fund (the “Fund”), one of the funds constituting American Century World Mutual Funds, Inc., as of November 30, 2016, and the related statement of operations for the year then ended, the statements of changes in net assets for each of the two years in the period then ended, and the financial highlights for each of the periods presented. These financial statements and financial highlights are the responsibility of the Fund’s management. Our responsibility is to express an opinion on these financial statements and financial highlights based on our audits.
We conducted our audits in accordance with the standards of the Public Company Accounting Oversight Board (United States). Those standards require that we plan and perform the audit to obtain reasonable assurance about whether the financial statements and financial highlights are free of material misstatement. The Fund is not required to have, nor were we engaged to perform, an audit of its internal control over financial reporting. Our audits included consideration of internal control over financial reporting as a basis for designing audit procedures that are appropriate in the circumstances, but not for the purpose of expressing an opinion on the effectiveness of the Fund’s internal control over financial reporting. Accordingly, we express no such opinion. An audit also includes examining, on a test basis, evidence supporting the amounts and disclosures in the financial statements, assessing the accounting principles used and significant estimates made by management, as well as evaluating the overall financial statement presentation. Our procedures included confirmation of securities owned as of November 30, 2016, by correspondence with the custodian and brokers; when replies were not received from brokers, we performed other auditing procedures. We believe that our audits provide a reasonable basis for our opinion.
In our opinion, the financial statements and financial highlights referred to above present fairly, in all material respects, the financial position of Emerging Markets Fund of American Century World Mutual Funds, Inc. as of November 30, 2016, the results of its operations for the year then ended, the changes in its net assets for each of the two years in the period then ended, and the financial highlights for each of the periods presented, in conformity with accounting principles generally accepted in the United States of America.
DELOITTE & TOUCHE LLP
Kansas City, Missouri
January 17, 2017
26
| Management |
The Board of Directors
The individuals listed below serve as directors of the funds. Each director will continue to serve in this capacity until death, retirement, resignation or removal from office. The board has adopted a mandatory retirement age for directors who are not “interested persons,” as that term is defined in the Investment Company Act (independent directors). Independent directors shall retire by December 31 of the year in which they reach their 75th birthday.
Mr. Thomas is an “interested person” because he currently serves as President and Chief Executive Officer of American Century Companies, Inc. (ACC), the parent company of American Century Investment Management, Inc. (ACIM or the advisor). The other directors (more than three-fourths of the total number) are independent. They are not employees, directors or officers of, and have no financial interest in, ACC or any of its wholly owned, direct or indirect, subsidiaries, including ACIM, American Century Investment Services, Inc. (ACIS) and American Century Services, LLC (ACS), and they do not have any other affiliations, positions or relationships that would cause them to be considered “interested persons” under the Investment Company Act. The directors serve in this capacity for seven (in the case of Mr. Thomas, 15) registered investment companies in the American Century Investments family of funds.
The following table presents additional information about the directors. The mailing address for each director is 4500 Main Street, Kansas City, Missouri 64111.
| Name (Year of Birth) | Position(s) Held with Funds | Length of Time Served | Principal Occupation(s) During Past 5 Years | Number of American Century Portfolios Overseen by Director | Other Directorships Held During Past 5 Years |
| Independent Directors | |||||
| Barry Fink (1955) | Director | Since 2012 | Retired; Executive Vice President, ACC (September 2007 to February 2013); President, ACS (October 2007 to February 2013); Chief Operating Officer, ACC (September 2007 to November 2012) | 81 | None |
| Andrea C. Hall (1945) | Director | Since 1997 | Retired | 81 | None |
| Jan M. Lewis (1957) | Director | Since 2011 | Retired; President and Chief Executive Officer, Catholic Charities of Northeast Kansas (human services organization) (2006 to 2013) | 81 | None |
| James A. Olson (1942) | Director and Chairman of the Board | Since 2007 (Chairman since 2014) | Member, Plaza Belmont LLC (private equity fund manager) (1999 to present) | 81 | Saia, Inc. (2002 to 2012) and EPR Properties (2003 to 2013) |
| M. Jeannine Strandjord (1945) | Director | Since 1994 | Retired | 81 | Euronet Worldwide Inc.; MGP Ingredients, Inc.; and DST Systems Inc. (1996 to 2012) |
27
| Name (Year of Birth) | Position(s) Held with Funds | Length of Time Served | Principal Occupation(s) During Past 5 Years | Number of American Century Portfolios Overseen by Director | Other Directorships Held During Past 5 Years |
| Independent Directors | |||||
| John R. Whitten (1946) | Director | Since 2008 | Retired | 81 | Rudolph Technologies, Inc. |
| Stephen E. Yates (1948) | Director | Since 2012 | Retired | 81 | None |
| Interested Director | |||||
| Jonathan S. Thomas (1963) | Director and President | Since 2007 | President and Chief Executive Officer, ACC (March 2007 to present). Also serves as Chief Executive Officer, ACS; Executive Vice President, ACIM; Director, ACC, ACIM and other ACC subsidiaries | 126 | BioMed Valley Discoveries, Inc. |
The Statement of Additional Information has additional information about the fund's directors and is available without charge, upon request, by calling 1-800-345-2021.
28
Officers
The following table presents certain information about the executive officers of the funds. Each officer serves as an officer for each of the 15 investment companies in the American Century family of funds, unless otherwise noted. No officer is compensated for his or her service as an officer of the funds. The listed officers are interested persons of the funds and are appointed or re-appointed on an annual basis. The mailing address for each officer listed below is 4500 Main Street, Kansas City, Missouri 64111.
| Name (Year of Birth) | Offices with the Funds | Principal Occupation(s) During the Past Five Years |
| Jonathan S. Thomas (1963) | Director and President since 2007 | President and Chief Executive Officer, ACC (March 2007 to present). Also serves as Chief Executive Officer, ACS; Executive Vice President, ACIM; Director, ACC, ACIM and other ACC subsidiaries |
| Amy D. Shelton (1964) | Chief Compliance Officer and Vice President since 2014 | Chief Compliance Officer, American Century funds, (March 2014 to present); Chief Compliance Officer, ACIM (February 2014 to present); Chief Compliance Officer, ACIS (October 2009 to present); Vice President, Client Interactions and Marketing, ACIS (February 2013 to January 2014); Director, Client Interactions and Marketing, ACIS (June 2007 to January 2013). Also serves as Vice President, ACIS |
| Charles A. Etherington (1957) | General Counsel since 2007 and Senior Vice President since 2006 | Attorney, ACC (February 1994 to present); Vice President, ACC (November 2005 to present); General Counsel, ACC (March 2007 to present). Also serves as General Counsel, ACIM, ACS, ACIS and other ACC subsidiaries; and Senior Vice President, ACIM and ACS |
| C. Jean Wade (1964) | Vice President,Treasurer and Chief Financial Officer since 2012 | Vice President, ACS (February 2000 to present) |
| Robert J. Leach (1966) | Vice President since 2006 and Assistant Treasurer since 2012 | Vice President, ACS (February 2000 to present) |
| David H. Reinmiller (1963) | Vice President since 2000 | Attorney, ACC (January 1994 to present); Associate General Counsel, ACC (January 2001 to present). Also serves as Vice President, ACIM and ACS |
| Ward D. Stauffer (1960) | Secretary since 2005 | Attorney, ACC (June 2003 to present) |
29
| Approval of Management Agreement |
At a meeting held on June 29, 2016, the Fund’s Board of Directors (the "Board") unanimously approved the renewal of the management agreement pursuant to which American Century Investment Management, Inc. (the “Advisor”) acts as the investment advisor for the Fund. Under Section 15(c) of the Investment Company Act, contracts for investment advisory services are required to be reviewed, evaluated, and approved by a majority of a fund’s directors (the “Directors”), including a majority of the independent Directors, each year.
Prior to its consideration of the renewal of the management agreement, the Directors requested and reviewed extensive data and information compiled by the Advisor and certain independent providers of evaluation data concerning the Fund and the services provided to the Fund by the Advisor. This review was in addition to the oversight and evaluation undertaken by the Board and its committees on a continual basis and the information received was supplemental to the extensive information that the Board and its committees receive and consider throughout the year.
In connection with its consideration of the renewal of the management agreement, the Board’s review and evaluation of the services provided by the Advisor included, but was not limited to, the following:
| • | the nature, extent, and quality of investment management, shareholder services, and other services provided and to be provided to the Fund; |
| • | the wide range of other programs and services provided and to be provided to the Fund and its shareholders on a routine and non-routine basis; |
| • | the investment performance of the Fund, including data comparing the Fund's performance to appropriate benchmarks and/or a peer group of other mutual funds with similar investment objectives and strategies; |
| • | the cost of owning the Fund compared to the cost of owning similar funds; |
| • | the compliance policies, procedures, and regulatory experience of the Advisor and the Fund's service providers; |
| • | financial data showing the cost of services provided to the Fund, the profitability of the Fund to the Advisor, and the overall profitability of the Advisor; |
| • | possible economies of scale associated with the Advisor’s management of the Fund and other accounts under its management; |
| • | data comparing services provided and charges to the Advisor's other investment management clients; |
| • | acquired fund fees and expenses; |
| • | payments by the Fund and the Advisor to financial intermediaries and the nature of services provided; and |
| • | any collateral benefits derived by the Advisor from the management of the Fund. |
In keeping with their practice, the Directors held two in-person meetings and one telephonic meeting to review and discuss the information provided. The independent Directors also had the benefit of the advice of their independent counsel throughout the process.
Factors Considered
The Directors considered all of the information provided by the Advisor, the independent data providers, and independent counsel in connection with the approval. They determined that the information was sufficient for them to evaluate the management agreement for the Fund. In connection with their review, the Directors did not identify any single factor as being all-important or controlling, and each Director may have attributed different levels of importance to different factors.
30
In deciding to renew the management agreement, the Board based its decision on a number of factors, including the following:
Nature, Extent and Quality of Services - Generally. Under the management agreement, the Advisor is responsible for providing or arranging for all services necessary for the operation of the Fund. The Board noted that under the management agreement, the Advisor provides or arranges at its own expense a wide variety of services including:
| • | constructing and designing the Fund |
| • | portfolio research and security selection |
| • | initial capitalization/funding |
| • | securities trading |
| • | Fund administration |
| • | custody of Fund assets |
| • | daily valuation of the Fund’s portfolio |
| • | shareholder servicing and transfer agency, including shareholder confirmations, recordkeeping, and communications |
| • | legal services (except the independent Directors’ counsel) |
| • | regulatory and portfolio compliance |
| • | financial reporting |
| • | marketing and distribution (except amounts paid by the Fund under Rule 12b-1 plans) |
The Board noted that many of these services have expanded over time in terms of both quantity and complexity in response to shareholder demands, competition in the industry, changing distribution channels, and the changing regulatory environment. The Board noted specifically the resources the Advisor has committed to enhancing cybersecurity protections for the benefit of shareholders.
Investment Management Services. The nature of the investment management services provided to the Fund is quite complex and allows Fund shareholders access to professional money management, instant diversification of their investments within an asset class, the opportunity to easily diversify among asset classes by investing in or exchanging among various American Century Investments funds, and liquidity. In evaluating investment performance, the Board expects the Advisor to manage the Fund in accordance with its investment objectives and approved strategies. Further, the Directors recognize that the Advisor has an obligation to monitor trading activities, and in particular to seek the best execution of fund trades, and to evaluate the use of and payment for research. In providing these services, the Advisor utilizes teams of investment professionals (portfolio managers, analysts, research assistants, and securities traders) who require extensive information technology, research, training, compliance, and other systems to conduct their business. The Board, directly and through its Fund Performance Review Committee, provides oversight of the investment performance process. It regularly reviews investment performance information for the Fund, together with comparative information for appropriate benchmarks and/or peer groups of similarly-managed funds, over different time horizons. The Directors also review detailed performance information provided by the Advisor during the management agreement approval process. If performance concerns are identified, the Fund receives special reviews until performance improves, during which the Board receives a report from the Advisor regarding the reasons for such results (e.g., market conditions, security selection) and any efforts being undertaken to improve performance. The Fund’s performance was above its benchmark for the one-, three-, five-, and ten-year periods reviewed by the Board. The Board found the investment management services provided by the Advisor to the Fund to be satisfactory and consistent with the management agreement.
Shareholder and Other Services. Under the management agreement, the Advisor provides the Fund with a comprehensive package of transfer agency, shareholder, and other services. The Board, directly and through various committees of the Board, regularly reviews reports and evaluations of such services at its regular meetings. These reports include, but are not limited to,
31
information regarding the operational efficiency and accuracy of the shareholder and transfer agency services provided, staffing levels, shareholder satisfaction (as measured by external as well as internal sources), technology support, new products and services offered to Fund shareholders, securities trading activities, portfolio valuation services, auditing services, and legal and operational compliance activities. The Board particularly noted the Advisor’s continual efforts to maintain effective business continuity plans and to address cybersecurity threats. Certain aspects of shareholder and transfer agency service level efficiency and the quality of securities trading activities are measured by independent third party providers and are presented in comparison to other fund groups not managed by the Advisor. The Board found the services provided by the Advisor to the Fund under the management agreement to be competitive and of high quality.
Costs of Services and Profitability. The Advisor provides detailed information concerning its cost of providing various services to the Fund, its profitability in managing the Fund (pre- and post-distribution), its overall profitability, and its financial condition. The Directors have reviewed with the Advisor the methodology used to prepare this financial information. This information is considered in evaluating the Advisor’s financial condition, its ability to continue to provide services under the management agreement, and the reasonableness of the current management fee. The Board concluded that the Advisor’s profits were reasonable in light of the services provided to the Fund.
Ethics. The Board generally considers the Advisor’s commitment to providing quality services to shareholders and to conducting its business ethically. They noted that the Advisor’s practices generally meet or exceed industry best practices.
Economies of Scale. The Board also reviewed information provided by the Advisor regarding the possible existence of economies of scale in connection with the management of the Fund. The Board concluded that economies of scale are difficult to measure and predict with precision, especially on a fund-by-fund basis. The Board concluded that the Advisor is appropriately sharing economies of scale through its competitive fee structure, offering competitive fees from fund inception, and through reinvestment in its business to provide shareholders additional content and services. The Board also noted that economies of scale are shared with the Fund and its shareholders through management fee breakpoints that serve to reduce the effective management fee as the assets of the Fund grow.
Comparison to Other Funds’ Fees. The management agreement provides that the Fund pays the Advisor a single, all-inclusive (or unified) management fee for providing all services necessary for the management and operation of the Fund, other than brokerage expenses, expenses attributable to short sales, taxes, interest, extraordinary expenses, and the fees and expenses of the Fund’s independent Directors (including their independent legal counsel) and expenses incurred in connection with the provision of shareholder services and distribution services under a plan adopted pursuant to Rule 12b-1 under the 1940 Act. Under the unified fee structure, the Advisor is responsible for providing all investment advisory, custody, audit, administrative, compliance, recordkeeping, marketing and shareholder services, or arranging and supervising third parties to provide such services. By contrast, most other funds are charged a variety of fees, including an investment advisory fee, a transfer agency fee, an administrative fee, distribution charges, and other expenses. Other than their investment advisory fees and any applicable Rule 12b-1 distribution fees, all other components of the total fees charged by these other funds may be increased without shareholder approval. The Board believes the unified fee structure is a benefit to Fund shareholders because it clearly discloses to shareholders the cost of owning Fund shares, and, since the unified fee cannot be increased without a vote of Fund shareholders, it shifts to the Advisor the risk of increased costs of operating the Fund and provides a direct incentive to minimize administrative inefficiencies. Part of the Board’s analysis of fee levels involves reviewing certain evaluative data compiled by an independent provider comparing the Fund’s unified fee to the total expense ratios of its peers. The unified fee charged to shareholders of the Fund was above the median of the total expense ratios of the Fund’s peer expense universe and was within the range of its peer expense group. The Board concluded that the management fee paid by the
32
Fund to the Advisor under the management agreement is reasonable in light of the services provided to the Fund.
Comparison to Fees and Services Provided to Other Clients of the Advisor. The Directors also requested and received information from the Advisor concerning the nature of the services, fees, costs, and profitability of its advisory services to advisory clients other than the Fund. They observed that these varying types of client accounts require different services and involve different regulatory and entrepreneurial risks than the management of the Fund. The Board analyzed this information and concluded that the fees charged and services provided to the Fund were reasonable by comparison.
Payments to Intermediaries. The Directors also requested and received a description of payments made to intermediaries by the Fund and the Advisor. These payments include various payments made by the Fund or the Advisor to different types of intermediaries and recordkeepers for distribution and service activities provided for the Fund. The Board received confirmation from the Advisor that all such payments by the Fund intended for distribution were made pursuant to the Fund's 12b-1 Plan. The Board reviewed such information and found the payments to be reasonable in scope and purpose.
Collateral or “Fall-Out” Benefits Derived by the Advisor. The Board considered the existence of collateral benefits the Advisor may receive as a result of its relationship with the Fund. They concluded that the Advisor’s primary business is managing mutual funds and it generally does not use fund or shareholder information to generate profits in other lines of business, and therefore does not derive any significant collateral benefits from them. The Board noted that additional assets from other clients may offer the Advisor some benefit from increased leverage with service providers and counterparties. Additionally, the Advisor receives proprietary research from broker-dealers that execute fund portfolio transactions, which the Board concluded is likely to benefit other clients of the Advisor, as well as Fund shareholders. The Board also determined that the Advisor is able to provide investment management services to certain clients other than the Fund, at least in part, due to its existing infrastructure built to serve the fund complex. The Board concluded that appropriate allocation methodologies had been employed to assign resources and the cost of those resources to these other clients and, where expressly provided, these other client assets may be included with the assets of the Fund to determine breakpoints in the management fee schedule.
Existing Relationship. The Board also considered whether there was any reason for not continuing the existing arrangement with the Advisor. In this regard, the Board was mindful of the potential disruptions of the Fund’s operations and various risks, uncertainties, and other effects that could occur as a result of a decision not to continue such relationship. In particular, the Board recognized that most shareholders have invested in the Fund on the strength of the Advisor’s industry standing and reputation and in the expectation that the Advisor will have a continuing role in providing advisory services to the Fund.
Conclusion of the Directors. As a result of this process, the Board, including all of the independent Directors, taking into account all of the factors discussed above and the information provided by the Advisor and others in connection with its review and throughout the year, determined that the management fee is fair and reasonable in light of the services provided and that the investment management agreement between the Fund and the Advisor should be renewed.
33
| Additional Information |
Retirement Account Information
As required by law, distributions you receive from certain IRAs are subject to federal income tax withholding, unless you elect not to have withholding apply. Tax will be withheld on the total amount withdrawn even though you may be receiving amounts that are not subject to withholding, such as nondeductible contributions. In such case, excess amounts of withholding could occur. You may adjust your withholding election so that a greater or lesser amount will be withheld.
If you don’t want us to withhold on this amount, you must notify us to not withhold the federal income tax. You may notify us in writing or in certain situations by telephone or through other electronic means. For systematic withdrawals, your withholding election will remain in effect until revoked or changed by filing a new election. You have the right to revoke your election at any time.
Remember, even if you elect not to have income tax withheld, you are liable for paying income tax on the taxable portion of your withdrawal. If you elect not to have income tax withheld or you don’t have enough income tax withheld, you may be responsible for payment of estimated tax. You may incur penalties under the estimated tax rules if your withholding and estimated tax payments are not sufficient. You can reduce or defer the income tax on a distribution by directly or indirectly rolling such distribution over to another IRA or eligible plan. You should consult your tax advisor for additional information.
State tax will be withheld if, at the time of your distribution, your address is within one of the mandatory withholding states and you have federal income tax withheld (or as otherwise required by state law). State taxes will be withheld from your distribution in accordance with the respective state rules.
Distributions you receive from 403(b), 457 and qualified plans are subject to special tax and withholding rules. Your plan administrator or plan sponsor is required to provide you with a special tax notice explaining those rules at the time you request a distribution. If applicable, federal and/or state taxes may be withheld from your distribution amount.
Proxy Voting Policies
A description of the policies that the fund's investment advisor uses in exercising the voting rights associated with the securities purchased and/or held by the fund is available without charge, upon request, by calling 1-800-345-2021. It is also available on the "About Us" page of American Century Investments’ website at americancentury.com and on the Securities and Exchange Commission’s website at sec.gov. Information regarding how the investment advisor voted proxies relating to portfolio securities during the most recent 12-month period ended June 30 is available on the "About Us" page at americancentury.com. It is also available at sec.gov.
Quarterly Portfolio Disclosure
The fund files its complete schedule of portfolio holdings with the Securities and Exchange Commission (SEC) for the first and third quarters of each fiscal year on Form N-Q. The fund’s Forms N-Q are available on the SEC’s website at sec.gov, and may be reviewed and copied at the SEC’s Public Reference Room in Washington, DC. Information on the operation of the Public Reference Room may be obtained by calling 1-800-SEC-0330. The fund also makes its complete schedule of portfolio holdings for the most recent quarter of its fiscal year available on its website at americancentury.com and, upon request, by calling 1-800-345-2021.
34
Other Tax Information
The following information is provided pursuant to provisions of the Internal Revenue Code.
The fund hereby designates up to the maximum amount allowable as qualified dividend income for the fiscal year ended November 30, 2016.
For the fiscal year ended November 30, 2016, the fund intends to pass through to shareholders foreign source income of $9,705,269 and foreign taxes paid of $1,089,807, or up to the maximum amount allowable, as a foreign tax credit. Foreign source income and foreign tax expense per outstanding share on November 30, 2016 are $0.1415 and $0.0159, respectively.
35
| Notes |
36
 | ||
| Contact Us | americancentury.com | |
| Automated Information Line | 1-800-345-8765 | |
| Investor Services Representative | 1-800-345-2021 or 816-531-5575 | |
| Investors Using Advisors | 1-800-378-9878 | |
| Business, Not-For-Profit, Employer-Sponsored Retirement Plans | 1-800-345-3533 | |
| Banks and Trust Companies, Broker-Dealers, Financial Professionals, Insurance Companies | 1-800-345-6488 | |
| Telecommunications Relay Service for the Deaf | 711 | |
| American Century World Mutual Funds, Inc. | ||
Investment Advisor: American Century Investment Management, Inc. Kansas City, Missouri | ||
| This report and the statements it contains are submitted for the general information of our shareholders. The report is not authorized for distribution to prospective investors unless preceded or accompanied by an effective prospectus. | ||
| ©2017 American Century Proprietary Holdings, Inc. All rights reserved. CL-ANN-91030 1701 | ||
| Annual Report | |
| November 30, 2016 | |
| Emerging Markets Small Cap Fund | |
| Table of Contents |
| President’s Letter | |
| Performance | |
| Portfolio Commentary | |
| Fund Characteristics | |
| Shareholder Fee Example | |
| Schedule of Investments | |
| Statement of Assets and Liabilities | |
| Statement of Operations | |
| Statement of Changes in Net Assets | |
| Notes to Financial Statements | |
| Financial Highlights | |
| Report of Independent Registered Public Accounting Firm | |
| Management | |
| Additional Information | |
Any opinions expressed in this report reflect those of the author as of the date of the report, and do not necessarily represent the opinions of American Century Investments® or any other person in the American Century Investments organization. Any such opinions are subject to change at any time based upon market or other conditions and American Century Investments disclaims any responsibility to update such opinions. These opinions may not be relied upon as investment advice and, because investment decisions made by American Century Investments funds are based on numerous factors, may not be relied upon as an indication of trading intent on behalf of any American Century Investments fund. Security examples are used for representational purposes only and are not intended as recommendations to purchase or sell securities. Performance information for comparative indices and securities is provided to American Century Investments by third party vendors. To the best of American Century Investments’ knowledge, such information is accurate at the time of printing.
| President’s Letter |
Jonathan ThomasDear Investor:
Thank you for reviewing this annual report for the approximately eight-month period from the fund’s inception to November 30, 2016. Annual reports help convey important information about fund returns, including market factors that affected performance during the reporting period. For additional, updated investment and market insights, we encourage you to visit our website, americancentury.com.
A Period of Populist, Anti-Globalization Political Surprises
The reporting period produced mixed investment results under unsettled economic and market conditions, triggered in part by Brexit (the U.K.’s unexpected vote to leave the European Union) and Donald Trump’s victory in the U.S. presidential election. These market-moving political events were eye-opening manifestations of populist and anti-globalization political movements influenced partly by lingering economic weakness and extreme central bank monetary stimulus since the world-wide Great Recession nearly a decade ago. Years of low interest rates, market globalization, and corporate cost-cutting had benefited some segments of the world’s developed democracies much more than others. The others spoke up in June and November, voting for Brexit, then propelling Trump to victory.
Meanwhile, the global economy continued to rebound from its setbacks during the first six weeks of 2016, when concerns about China’s growth and plummeting oil prices affected the global economic outlook. China appeared to stabilize, and oil prices retraced some of their losses on signs that the major oil-producing countries might be able to cooperate on restricting crude oil supplies. Furthermore, major central banks, particularly in Europe and Japan, continued to provide massive monetary stimulus, supporting economic growth and investment returns. However, Trump’s win, rising U.S. interest rates, strength in the U.S. dollar, and concerns about proposed immigration restrictions and tariffs under the new Trump administration dampened the mood in non-U.S. markets.
Looking ahead, Trump’s victory unleashed potentially far-reaching ramifications that are still unfolding. What’s clear is that his policy proposals and unpredictable nature make uncertainty more certain, which could trigger bouts of short-term market volatility. In this unsettled environment, we strongly believe in staying the course and remaining focused on longer-term goals, using disciplined, actively managed, diversified, risk-aware strategies. We appreciate your continued trust in us.
Sincerely,
Jonathan Thomas
President and Chief Executive Officer
American Century Investments
2
| Performance |
| Total Returns as of November 30, 2016 | |||
Ticker Symbol | Since Inception | Inception Date | |
| Investor Class | AECVX | 4.50% | 4/7/16 |
| MSCI Emerging Markets Small Cap Index | — | 2.38% | — |
| Institutional Class | AECSX | 4.60% | 4/7/16 |
| A Class | AECLX | 4/7/16 | |
| No sales charge | 4.30% | ||
| With sales charge | -1.70% | ||
| C Class | AECHX | 4/7/16 | |
| No sales charge | 3.80% | ||
| With sales charge | 2.80% | ||
| R Class | AECMX | 4.10% | 4/7/16 |
| R6 Class | AECTX | 4.70% | 4/7/16 |
Sales charges include initial sales charges and contingent deferred sales charges (CDSCs), as applicable. A Class shares have a 5.75% maximum initial sales charge and may be subject to a maximum CDSC of 1.00%. C Class shares redeemed within 12 months of purchase are subject to a maximum CDSC of 1.00%. The SEC requires that mutual funds provide performance information net of maximum sales charges in all cases where charges could be applied.
Data presented reflect past performance. Past performance is no guarantee of future results. Current performance may be higher or lower than the performance shown. Total returns for periods less than one year are not annualized. Investment return and principal value will fluctuate, and redemption value may be more or less than original cost. Data assumes reinvestment of dividends and capital gains, and none of the charts reflect the deduction of taxes that a shareholder would pay on fund distributions or the redemption of fund shares. To obtain performance data current to the most recent month end, please call 1-800-345-2021 or visit americancentury.com. For additional information about the fund, please consult the prospectus.
3
| Growth of $10,000 Over Life of Class |
| $10,000 investment made April 7, 2016 |
| Performance for other share classes will vary due to differences in fee structure. |
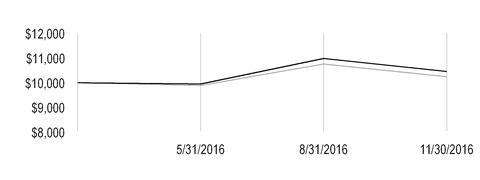
| Value on November 30, 2016 | |
| Investor Class — $10,450 | |
| MSCI Emerging Markets Small Cap Index — $10,238 | |
Total Annual Fund Operating Expenses | |||||
Investor Class | Institutional Class | A Class | C Class | R Class | R6 Class |
| 1.61% | 1.41% | 1.86% | 2.61% | 2.11% | 1.26% |
The total annual fund operating expenses shown is as stated in the fund’s prospectus current as of the date of this report. The prospectus may vary from the expense ratio shown elsewhere in this report because it is based on a different time period, includes acquired fund fees and expenses, and, if applicable, does not include fee waivers or expense reimbursements.
Data presented reflect past performance. Past performance is no guarantee of future results. Current performance may be higher or lower than the performance shown. Total returns for periods less than one year are not annualized. Investment return and principal value will fluctuate, and redemption value may be more or less than original cost. Data assumes reinvestment of dividends and capital gains, and none of the charts reflect the deduction of taxes that a shareholder would pay on fund distributions or the redemption of fund shares. To obtain performance data current to the most recent month end, please call 1-800-345-2021 or visit americancentury.com. For additional information about the fund, please consult the prospectus.
4
| Portfolio Commentary |
Portfolio Managers: Patricia Ribeiro, Anthony Han, and Sherwin Soo
Performance Summary
Emerging Markets Small Cap gained 4.50%* since its inception on April 7, 2016, through November 30, 2016. The portfolio’s benchmark, the MSCI Emerging Markets Small Cap Index, gained 2.38% for the same period.
The fund outperformed its benchmark during the period, primarily due to stock selection in the information technology sector. Holdings in the energy sector also contributed to results. Conversely, relative gains were limited by investments in the consumer discretionary and real estate sectors. Regionally, stock selection in China and an underweight position relative to the fund's benchmark in South Korea contributed to performance while investments in the Philippines and an underweight position in India detracted.
Information Technology Holdings Contributed
Leading sector contribution came primarily from the information technology sector, where standout performers included China-based microblogging website Weibo and Taiwan-based fingerprint sensor manufacturer Egis Technology. Weibo, a portfolio-only holding, benefited from the increasing budget shift among advertisers to mobile/social/video platforms. Strong user engagement and targeted marketing have helped the company capture many of these new advertising dollars, thereby improving the growth outlook for Weibo’s brand ad revenue. Egis Technology’s stock gained as a result of strong fingerprint sensor shipments. Its sensors are used in smartphones, and it is a key supplier to Samsung. The company plans to enter the Chinese market, which we believe will support future growth.
Other holdings that contributed to relative gains included Thailand-based KCE Electronics and Taiwan-based Hermes Microvision. KCE Electronics, an electronic circuit manufacturer specializing in circuit boards for the automobile industry, enjoyed strong earnings growth, driven primarily by improvements in operating efficiency and product mix. The company continued to experience strong demand for its circuit boards due to the increased use of electronics in cars and rising safety regulations. Portfolio-only holding Hermes Microvision, a developer of e-beam inspection tools for semiconductor manufacturing, saw an improvement in sales throughout the year as customers migrated to 10 nanometer and upgraded to DRAM and NAND. We sold the stock in order to lock in gains.
Stock Selection in the Consumer Discretionary Sector Detracted
Leading sector detraction came from the consumer discretionary sector, where poor performers included Taiwan-based Tung Thih Electronic, a manufacturer of electrical equipment for the automobile industry. In October, the company reported lower-than-expected operating profit and a slowdown in U.S. and Chinese automobile sales. Another weak consumer discretionary holding was Taiwan-based Eclat Textile, a manufacturer of knitted fabrics and knitwear. Macroeconomic headwinds contributed to lower-than-expected apparel spending in North America and reduced growth guidance by major U.S. customers, including Under Armour and Nike. Against this challenging backdrop, Eclat Textile’s stock struggled. We exited our positions in both stocks.
*All fund returns referenced in this commentary are for Investor Class shares. Total returns for periods less than one year are not annualized. Performance for other share classes will vary due to differences in fee structure; when Investor Class performance exceeds that of the fund's benchmark, other share classes may not. See page 3 for returns for all share classes.
5
Significant individual detractors also included Poland-based discount warehouse operator Eurocash. A slowdown in the Polish food market weighed heavily on the portfolio-only holding. Further pressuring the stock was increased concern among investors who believe that, given the company’s low organic growth, Eurocash lacks growth catalysts. We became uncomfortable with the company’s low revenue growth and declining margins and consequently liquidated our position in the stock.
Outlook
Emerging markets are reacting to uncertainty after the U.S. presidential election. The potential for higher inflation, a stronger U.S. dollar, and disruption in trade is clouding the near-term outlook for emerging markets’ stocks and currencies. However, we believe growth rate differentials continue to improve versus developed markets. Emerging markets’ central banks still have room to cut interest rates to spur growth, earnings growth is improving, and data, such as Purchasing Managers’ Index (PMI), suggest economic confidence is strengthening. In our view, stock valuations remain attractive relative to developed markets given strong fundamentals. While performance will vary country by country, several markets appear positioned to improve in 2017. Notably, Brazil and Russia are recovering from a recession, and India and China look to be successfully implementing economic reforms.
We expect volatility in emerging markets to continue through the remainder of 2016 and believe asset prices will fluctuate with the path of U.S. interest rates, expectations around China’s economy, the behavior of global commodity prices, and by president-elect Donald Trump’s approach to U.S. trade with the rest of the world. Looking ahead, we remain constructive on emerging markets in 2017 given the prospects of improving global growth and better valuations.
6
| Fund Characteristics |
| NOVEMBER 30, 2016 | |
Top Ten Holdings | % of net assets |
| iShares MSCI India Small-Cap ETF | 5.0% |
| SINA Corp. | 2.4% |
| Weibo Corp. ADR | 2.1% |
| X5 Retail Group NV GDR | 1.9% |
| TAL Education Group ADR | 1.9% |
| KCE Electronics PCL | 1.8% |
| Egis Technology, Inc. | 1.8% |
| Moscow Exchange MICEX-RTS PJSC | 1.7% |
| Sunny Optical Technology Group Co. Ltd. | 1.7% |
| Estacio Participacoes SA | 1.7% |
Types of Investments in Portfolio | % of net assets |
| Common Stocks | 91.6% |
| Exchange-Traded Funds | 5.0% |
| Rights | —* |
| Total Equity Exposure | 96.6% |
| Temporary Cash Investments | 4.8% |
| Other Assets and Liabilities | (1.4)% |
| *Category is less than 0.05% of total net assets. | |
Investments by Country | % of net assets |
| China | 20.6% |
| South Korea | 14.2% |
| Taiwan | 8.6% |
| Thailand | 6.7% |
| South Africa | 6.4% |
| Indonesia | 5.7% |
| Brazil | 5.4% |
| Mexico | 5.0% |
| Russia | 4.6% |
| Philippines | 3.0% |
| India | 2.6% |
| Malaysia | 2.1% |
| Other Countries | 6.7% |
Exchange-Traded Funds(1) | 5.0% |
Cash and Equivalents(2) | 3.4% |
(1) Category may increase exposure to the countries indicated. The Schedule of Investments provides additional information on the fund's portfolio holdings. | |
| (2) Includes temporary cash investments and other assets and liabilities. | |
7
| Shareholder Fee Example |
Fund shareholders may incur two types of costs: (1) transaction costs, including sales charges (loads) on purchase payments and redemption/exchange fees; and (2) ongoing costs, including management fees; distribution and service (12b-1) fees; and other fund expenses. This example is intended to help you understand your ongoing costs (in dollars) of investing in your fund and to compare these costs with the ongoing cost of investing in other mutual funds.
The example is based on an investment of $1,000 made at the beginning of the period and held for the entire period from June 1, 2016 to November 30, 2016.
Actual Expenses
The table provides information about actual account values and actual expenses for each class. You may use the information, together with the amount you invested, to estimate the expenses that you paid over the period. First, identify the share class you own. Then simply divide your account value by $1,000 (for example, an $8,600 account value divided by $1,000 = 8.6), then multiply the result by the number under the heading “Expenses Paid During Period” to estimate the expenses you paid on your account during this period.
If you hold Investor Class shares of any American Century Investments fund, or Institutional Class shares of the American Century Diversified Bond Fund, in an American Century Investments account (i.e., not a financial intermediary or retirement plan account), American Century Investments may charge you a $12.50 semiannual account maintenance fee if the value of those shares is less than $10,000. We will redeem shares automatically in one of your accounts to pay the $12.50 fee. In determining your total eligible investment amount, we will include your investments in all personal accounts (including American Century Investments Brokerage accounts) registered under your Social Security number. Personal accounts include individual accounts, joint accounts, UGMA/UTMA accounts, personal trusts, Coverdell Education Savings Accounts and IRAs (including traditional, Roth, Rollover, SEP-, SARSEP- and SIMPLE-IRAs), and certain other retirement accounts. If you have only business, business retirement, employer-sponsored or American Century Investments Brokerage accounts, you are currently not subject to this fee. If you are subject to the Account Maintenance Fee, your account value could be reduced by the fee amount.
Hypothetical Example for Comparison Purposes
The table also provides information about hypothetical account values and hypothetical expenses based on the actual expense ratio of each class of your fund and an assumed rate of return of 5% per year before expenses, which is not the actual return of a fund’s share class. The hypothetical account values and expenses may not be used to estimate the actual ending account balance or expenses you paid for the period. You may use this information to compare the ongoing costs of investing in your fund and other funds. To do so, compare this 5% hypothetical example with the 5% hypothetical examples that appear in the shareholder reports of the other funds.
Please note that the expenses shown in the table are meant to highlight your ongoing costs only and do not reflect any transactional costs, such as sales charges (loads) or redemption/exchange fees. Therefore, the table is useful in comparing ongoing costs only, and will not help you determine the relative total costs of owning different funds. In addition, if these transactional costs were included, your costs would have been higher.
8
| Beginning Account Value 6/1/16 | Ending Account Value 11/30/16 | Expenses Paid During Period(1) 6/1/16 - 11/30/16 | Annualized Expense Ratio(1) | |
Actual | ||||
| Investor Class | $1,000 | $1,050.30 | $8.20 | 1.60% |
| Institutional Class | $1,000 | $1,051.30 | $7.18 | 1.40% |
| A Class | $1,000 | $1,049.30 | $9.48 | 1.85% |
| C Class | $1,000 | $1,045.30 | $13.29 | 2.60% |
| R Class | $1,000 | $1,047.30 | $10.75 | 2.10% |
| R6 Class | $1,000 | $1,052.30 | $6.41 | 1.25% |
| Hypothetical | ||||
| Investor Class | $1,000 | $1,017.00 | $8.07 | 1.60% |
| Institutional Class | $1,000 | $1,018.00 | $7.06 | 1.40% |
| A Class | $1,000 | $1,015.75 | $9.32 | 1.85% |
| C Class | $1,000 | $1,012.00 | $13.08 | 2.60% |
| R Class | $1,000 | $1,014.50 | $10.58 | 2.10% |
| R6 Class | $1,000 | $1,018.75 | $6.31 | 1.25% |
| (1) | Expenses are equal to the class's annualized expense ratio listed in the table above, multiplied by the average account value over the period, multiplied by 183, the number of days in the most recent fiscal half-year, divided by 366, to reflect the one-half year period. |
9
| Schedule of Investments |
NOVEMBER 30, 2016
| Shares | Value | ||||
| COMMON STOCKS — 91.6% | |||||
| Brazil — 5.4% | |||||
| Estacio Participacoes SA | 18,600 | $ | 92,283 | ||
| Linx SA | 9,200 | 48,012 | |||
Minerva SA(1) | 7,600 | 27,528 | |||
| Multiplan Empreendimentos Imobiliarios SA | 2,800 | 48,126 | |||
| Raia Drogasil SA | 4,300 | 81,994 | |||
| 297,943 | |||||
| China — 20.6% | |||||
| AviChina Industry & Technology Co. Ltd., H Shares | 72,000 | 49,847 | |||
| Beijing Enterprises Water Group Ltd. | 100,000 | 72,326 | |||
| Brilliance China Automotive Holdings Ltd. | 32,000 | 44,804 | |||
China Agri-Industries Holdings Ltd.(1) | 144,000 | 57,923 | |||
| China Lodging Group Ltd. ADR | 1,577 | 82,603 | |||
| China Resources Cement Holdings Ltd. | 212,000 | 91,015 | |||
| Huaneng Renewables Corp. Ltd., H Shares | 180,000 | 58,016 | |||
| Minth Group Ltd. | 18,000 | 58,944 | |||
| Nine Dragons Paper Holdings Ltd. | 64,000 | 56,190 | |||
| Pou Sheng International Holdings Ltd. | 285,000 | 87,082 | |||
SIIC Environment Holdings Ltd.(1) | 63,200 | 27,558 | |||
SINA Corp.(1) | 1,693 | 130,463 | |||
| Sunny Optical Technology Group Co. Ltd. | 19,000 | 95,655 | |||
TAL Education Group ADR(1) | 1,365 | 104,464 | |||
Weibo Corp. ADR(1) | 2,289 | 117,449 | |||
| 1,134,339 | |||||
| Colombia — 0.8% | |||||
| Cementos Argos SA | 12,956 | 46,099 | |||
| Czech — 1.3% | |||||
Moneta Money Bank AS(1) | 22,236 | 72,570 | |||
| Greece — 1.4% | |||||
| JUMBO SA | 5,386 | 76,606 | |||
| Hungary — 1.0% | |||||
| Richter Gedeon Nyrt | 2,630 | 52,524 | |||
| India — 2.6% | |||||
Bharat Financial Inclusion Ltd.(1) | 5,159 | 55,736 | |||
| Havells India Ltd. | 5,727 | 28,811 | |||
| Vakrangee Ltd. | 13,924 | 56,216 | |||
| 140,763 | |||||
| Indonesia — 5.7% | |||||
| Bank Pembangunan Daerah Jawa Barat Dan Banten Tbk PT | 349,500 | 39,972 | |||
| Cikarang Listrindo Tbk PT | 553,600 | 61,273 | |||
| Indofood Sukses Makmur Tbk PT | 139,800 | 78,140 | |||
| Mitra Keluarga Karyasehat Tbk PT | 292,600 | 53,975 | |||
Vale Indonesia Tbk PT(1) | 319,600 | 79,708 | |||
| 313,068 | |||||
| Malaysia — 2.1% | |||||
| Carlsberg Brewery Malaysia Bhd | 15,600 | 48,414 | |||
10
| Shares | Value | ||||
| My EG Services Bhd | 134,500 | $ | 67,762 | ||
| 116,176 | |||||
| Mexico — 5.0% | |||||
| Alsea SAB de CV | 13,767 | 40,412 | |||
| Banregio Grupo Financiero SAB de CV | 14,993 | 80,262 | |||
| Gentera SAB de CV | 39,000 | 61,715 | |||
| Grupo Aeroportuario del Centro Norte SAB de CV | 12,151 | 57,277 | |||
| Grupo Aeroportuario del Pacifico SAB de CV, B Shares | 4,483 | 38,272 | |||
| 277,938 | |||||
| Philippines — 3.0% | |||||
CEMEX Holdings Philippines, Inc.(1) | 342,000 | 73,166 | |||
DoubleDragon Properties Corp.(1) | 41,800 | 36,943 | |||
| Puregold Price Club, Inc. | 67,600 | 52,700 | |||
| 162,809 | |||||
| Russia — 4.6% | |||||
| Moscow Exchange MICEX-RTS PJSC | 51,545 | 95,960 | |||
X5 Retail Group NV GDR(1) | 3,534 | 106,020 | |||
Yandex NV, A Shares(1) | 2,813 | 53,475 | |||
| 255,455 | |||||
| South Africa — 6.4% | |||||
| Capitec Bank Holdings Ltd. | 1,711 | 79,037 | |||
Dis-Chem Pharmacies Ltd.(1) | 37,126 | 54,328 | |||
| Discovery Holdings Ltd. | 6,941 | 54,936 | |||
| Petra Diamonds Ltd. | 43,321 | 89,327 | |||
Sappi Ltd.(1) | 12,298 | 72,770 | |||
| 350,398 | |||||
| South Korea — 14.2% | |||||
CJ Korea Express Corp.(1) | 309 | 48,634 | |||
| Cosmax, Inc. | 433 | 38,520 | |||
Duk San Neolux Co. Ltd.(1) | 2,612 | 66,359 | |||
| GS Retail Co. Ltd. | 1,795 | 72,626 | |||
| HS Industries Co. Ltd. | 6,236 | 49,342 | |||
| Hyundai Marine & Fire Insurance Co. Ltd. | 1,348 | 41,972 | |||
| Innocean Worldwide, Inc. | 1,081 | 57,515 | |||
Jusung Engineering Co. Ltd.(1) | 9,671 | 76,438 | |||
| Kumho Petrochemical Co. Ltd. | 889 | 55,513 | |||
| Medy-Tox, Inc. | 285 | 80,011 | |||
Seegene, Inc.(1) | 2,622 | 72,332 | |||
| SK Materials Co. Ltd. | 433 | 56,669 | |||
Wonik Materials Co. Ltd.(1) | 1,155 | 64,416 | |||
| 780,347 | |||||
| Taiwan — 8.6% | |||||
| Chroma ATE, Inc. | 28,000 | 69,400 | |||
Egis Technology, Inc.(1) | 11,000 | 97,151 | |||
| Green Seal Holding Ltd. | 11,000 | 49,697 | |||
| Hota Industrial Manufacturing Co. Ltd. | 12,000 | 46,121 | |||
| Nien Made Enterprise Co. Ltd. | 5,000 | 56,004 | |||
| Taiwan Paiho Ltd. | 24,000 | 72,965 | |||
| Vanguard International Semiconductor Corp. | 43,000 | 81,081 | |||
| 472,419 | |||||
11
| Shares | Value | ||||
| Thailand — 6.7% | |||||
| CH Karnchang PCL | 87,900 | $ | 77,604 | ||
| Digital Telecommunications Infrastructure Fund | 122,300 | 48,674 | |||
| KCE Electronics PCL | 29,800 | 100,643 | |||
| Minor International PCL | 22,800 | 23,963 | |||
| Sino-Thai Engineering & Construction PCL | 78,700 | 63,967 | |||
| Srisawad Power 1979 PCL | 45,635 | 52,440 | |||
| 367,291 | |||||
| Turkey — 0.9% | |||||
| Tofas Turk Otomobil Fabrikasi AS | 4,774 | 29,791 | |||
| Ulker Biskuvi Sanayi AS | 4,455 | 22,368 | |||
| 52,159 | |||||
| United Kingdom — 1.3% | |||||
Tullow Oil plc(1) | 19,583 | 72,968 | |||
TOTAL COMMON STOCKS (Cost $4,672,937) | 5,041,872 | ||||
| EXCHANGE-TRADED FUNDS — 5.0% | |||||
| iShares MSCI India Small-Cap ETF (Cost $244,801) | 8,248 | 277,298 | |||
RIGHTS† | |||||
| Personal Products | |||||
Cosmax, Inc.(1) (Cost $—) | 40 | 679 | |||
| TEMPORARY CASH INVESTMENTS — 4.8% | |||||
| Repurchase Agreement, Fixed Income Clearing Corp., (collateralized by various U.S. Treasury obligations, 2.875%, 8/15/45, valued at $267,446), at 0.08%, dated 11/30/16, due 12/1/16 (Delivery value $261,001) | 261,000 | ||||
| State Street Institutional U.S. Government Money Market Fund, Premier Class | 223 | 223 | |||
TOTAL TEMPORARY CASH INVESTMENTS (Cost $261,223) | 261,223 | ||||
TOTAL INVESTMENT SECURITIES — 101.4% (Cost $5,178,961) | 5,581,072 | ||||
| OTHER ASSETS AND LIABILITIES — (1.4)% | (77,383 | ) | |||
| TOTAL NET ASSETS — 100.0% | $ | 5,503,689 | |||
12
| MARKET SECTOR DIVERSIFICATION | ||
(as a % of net assets) | ||
| Information Technology | 18.0 | % |
| Consumer Discretionary | 15.7 | % |
| Materials | 15.4 | % |
| Consumer Staples | 11.6 | % |
| Financials | 11.6 | % |
| Industrials | 6.7 | % |
| Health Care | 4.8 | % |
| Utilities | 4.0 | % |
| Real Estate | 1.6 | % |
| Energy | 1.3 | % |
| Telecommunication Services | 0.9 | % |
| Exchange-Traded Funds | 5.0 | % |
| Cash and Equivalents* | 3.4 | % |
*Includes temporary cash investments and other assets and liabilities.
| NOTES TO SCHEDULE OF INVESTMENTS | ||
| ADR | - | American Depositary Receipt |
| GDR | - | Global Depositary Receipt |
| † | Category is less than 0.05% of total net assets. |
| (1) | Non-income producing. |
See Notes to Financial Statements.
13
| Statement of Assets and Liabilities |
| NOVEMBER 30, 2016 | |||
| Assets | |||
| Investment securities, at value (cost of $5,178,961) | $ | 5,581,072 | |
| Foreign currency holdings, at value (cost of $178,018) | 177,674 | ||
| Receivable for investments sold | 25,935 | ||
| Receivable for capital shares sold | 67 | ||
| Dividends and interest receivable | 3,130 | ||
| 5,787,878 | |||
| Liabilities | |||
| Payable for investments purchased | 275,978 | ||
| Accrued management fees | 7,054 | ||
| Distribution and service fees payable | 1,157 | ||
| 284,189 | |||
| Net Assets | $ | 5,503,689 | |
| Net Assets Consist of: | |||
| Capital (par value and paid-in surplus) | $ | 5,285,902 | |
| Undistributed net investment income | 4,335 | ||
| Accumulated net realized loss | (188,223 | ) | |
| Net unrealized appreciation | 401,675 | ||
| $ | 5,503,689 | ||
| Net Assets | Shares Outstanding | Net Asset Value Per Share | ||||
| Investor Class, $0.01 Par Value | $2,373,250 | 227,138 | $10.45 | |||
| Institutional Class, $0.01 Par Value | $627,715 | 60,000 | $10.46 | |||
| A Class, $0.01 Par Value | $1,043,438 | 100,028 | $10.43* | |||
| C Class, $0.01 Par Value | $1,038,087 | 100,000 | $10.38 | |||
| R Class, $0.01 Par Value | $211,758 | 20,333 | $10.41 | |||
| R6 Class, $0.01 Par Value | $209,441 | 20,000 | $10.47 | |||
*Maximum offering price $11.07 (net asset value divided by 0.9425).
See Notes to Financial Statements.
14
| Statement of Operations |
FOR THE PERIOD ENDED NOVEMBER 30, 2016(1) | |||
| Investment Income (Loss) | |||
| Income: | |||
| Dividends (net of foreign taxes withheld of $6,074) | $ | 76,590 | |
| Interest | 235 | ||
| 76,825 | |||
| Expenses: | |||
| Management fees | 54,887 | ||
| Distribution and service fees: | |||
| A Class | 1,705 | ||
| C Class | 6,801 | ||
| R Class | 684 | ||
| Directors' fees and expenses | 101 | ||
| 64,178 | |||
| Net investment income (loss) | 12,647 | ||
| Realized and Unrealized Gain (Loss) | |||
| Net realized gain (loss) on: | |||
| Investment transactions | (188,223 | ) | |
| Foreign currency transactions | (11,613 | ) | |
| (199,836 | ) | ||
| Change in net unrealized appreciation (depreciation) on: | |||
| Investments | 402,111 | ||
| Translation of assets and liabilities in foreign currencies | (436 | ) | |
| 401,675 | |||
| Net realized and unrealized gain (loss) | 201,839 | ||
| Net Increase (Decrease) in Net Assets Resulting from Operations | $ | 214,486 | |
| (1) | April 7, 2016 (fund inception) through November 30, 2016. |
See Notes to Financial Statements.
15
| Statement of Changes in Net Assets |
PERIOD ENDED NOVEMBER 30, 2016(1) | |||
| Increase (Decrease) in Net Assets | |||
| Operations | |||
| Net investment income (loss) | $ | 12,647 | |
| Net realized gain (loss) | (199,836 | ) | |
| Change in net unrealized appreciation (depreciation) | 401,675 | ||
| Net increase (decrease) in net assets resulting from operations | 214,486 | ||
| Capital Share Transactions | |||
| Net increase (decrease) in net assets from capital share transactions (Note 5) | 5,289,203 | ||
| Net increase (decrease) in net assets | 5,503,689 | ||
| Net Assets | |||
| End of period | $ | 5,503,689 | |
| Undistributed net investment income | $ | 4,335 | |
| (1) | April 7, 2016 (fund inception) through November 30, 2016. |
See Notes to Financial Statements.
16
| Notes to Financial Statements |
NOVEMBER 30, 2016
1. Organization
American Century World Mutual Funds, Inc. (the corporation) is registered under the Investment Company Act of 1940, as amended (the 1940 Act), as an open-end management investment company and is organized as a Maryland corporation. Emerging Markets Small Cap Fund (the fund) is one fund in a series issued by the corporation. The fund’s investment objective is to seek capital growth.
The fund offers the Investor Class, the Institutional Class, the A Class, the C Class, the R Class and the R6 Class. The A Class may incur an initial sales charge. The A Class and C Class may be subject to a contingent deferred sales charge. The share classes differ principally in their respective sales charges and distribution and shareholder servicing expenses and arrangements. The Institutional Class and R6 Class shareholders do not require the same level of shareholder and administrative services from American Century Investment Management, Inc. (ACIM) (the investment advisor) as shareholders of other classes. In addition, financial intermediaries do not receive any fees for the R6 Class. As a result, the Institutional Class and R6 Class are charged lower unified management fees. All classes of the fund commenced sale on April 7, 2016, the fund’s inception date.
2. Significant Accounting Policies
The following is a summary of significant accounting policies consistently followed by the fund in preparation of its financial statements. The fund is an investment company and follows accounting and reporting guidance in accordance with accounting principles generally accepted in the United States of America. This may require management to make certain estimates and assumptions at the date of the financial statements. Actual results could differ from these estimates. Management evaluated the impact of events or transactions occurring through the date the financial statements were issued that would merit recognition or disclosure.
Investment Valuations — The fund determines the fair value of its investments and computes its net asset value per share at the close of regular trading (usually 4 p.m. Eastern time) on the New York Stock Exchange (NYSE) on each day the NYSE is open. The Board of Directors has adopted valuation policies and procedures to guide the investment advisor in the fund’s investment valuation process and to provide methodologies for the oversight of the fund’s pricing function.
Equity securities that are listed or traded on a domestic securities exchange are valued at the last reported sales price or at the official closing price as provided by the exchange. Equity securities traded on foreign securities exchanges are generally valued at the closing price of such securities on the exchange where primarily traded or at the close of the NYSE, if that is earlier. If no last sales price is reported, or if local convention or regulation so provides, the mean of the latest bid and asked prices may be used. Securities traded over-the-counter are valued at the mean of the latest bid and asked prices, the last sales price, or the official closing price. Equity securities initially expressed in local currencies are translated into U.S. dollars at the mean of the appropriate currency exchange rate at the close of the NYSE as provided by an independent pricing service.
Open-end management investment companies are valued at the reported net asset value per share. Repurchase agreements are valued at cost, which approximates fair value.
If the fund determines that the market price for an investment is not readily available or the valuation methods mentioned above do not reflect an investment’s fair value, such investment is valued as determined in good faith by the Board of Directors or its delegate, in accordance with policies and procedures adopted by the Board of Directors. In its determination of fair value, the fund may review several factors including, but not limited to, market information regarding the specific investment or comparable investments and correlation with other investment types, futures indices or general market indicators. Circumstances that may cause the fund to use these procedures to value an investment include, but are not limited to: an investment has been declared in default or is distressed; trading in a security has been suspended during the trading day or a security is not actively trading on its principal exchange; prices received from a regular pricing source are deemed unreliable; or there is a foreign market holiday and no trading occurred.
17
The fund monitors for significant events occurring after the close of an investment’s primary exchange but before the fund’s net asset value per share is determined. Significant events may include, but are not limited to: corporate announcements and transactions; governmental action and political unrest that could impact a specific investment or an investment sector; or armed conflicts, natural disasters and similar events that could affect investments in a specific country or region. The fund also monitors for significant fluctuations between domestic and foreign markets, as evidenced by the U.S. market or such other indicators that the Board of Directors, or its delegate, deems appropriate. If significant fluctuations in foreign markets are identified, the fund may apply a model-derived factor to the closing price of equity securities traded on foreign securities exchanges. The factor is based on observable market data as provided by an independent pricing service.
Security Transactions — Security transactions are accounted for as of the trade date. Net realized gains and losses are determined on the identified cost basis, which is also used for federal income tax purposes.
Investment Income — Dividend income less foreign taxes withheld, if any, is recorded as of the ex-dividend date. Distributions received on securities that represent a return of capital or long-term capital gain are recorded as a reduction of cost of investments and/or as a realized gain. The fund may estimate the components of distributions received that may be considered nontaxable distributions or long-term capital gain distributions for income tax purposes. Interest income is recorded on the accrual basis and includes accretion of discounts and amortization of premiums.
Foreign Currency Translations — All assets and liabilities initially expressed in foreign currencies are translated into U.S. dollars at prevailing exchange rates at period end. The fund may enter into spot foreign currency exchange contracts to facilitate transactions denominated in a foreign currency. Purchases and sales of investment securities, dividend and interest income, spot foreign currency exchange contracts, and expenses are translated at the rates of exchange prevailing on the respective dates of such transactions. Net realized and unrealized foreign currency exchange gains or losses related to investment securities are a component of net realized gain (loss) on investment transactions and change in net unrealized appreciation (depreciation) on investments, respectively.
Repurchase Agreements — The fund may enter into repurchase agreements with institutions that ACIM has determined are creditworthy pursuant to criteria adopted by the Board of Directors. The fund requires that the collateral, represented by securities, received in a repurchase transaction be transferred to the custodian in a manner sufficient to enable the fund to obtain those securities in the event of a default under the repurchase agreement. ACIM monitors, on a daily basis, the securities transferred to ensure the value, including accrued interest, of the securities under each repurchase agreement is equal to or greater than amounts owed to the fund under each repurchase agreement.
Joint Trading Account — Pursuant to an Exemptive Order issued by the Securities and Exchange Commission, the fund, along with certain other funds in the American Century Investments family of funds, may transfer uninvested cash balances into a joint trading account. These balances are invested in one or more repurchase agreements that are collateralized by U.S. Treasury or Agency obligations.
Income Tax Status — It is the fund’s policy to distribute substantially all net investment income and net realized gains to shareholders and to otherwise qualify as a regulated investment company under provisions of the Internal Revenue Code. Accordingly, no provision has been made for income taxes. The fund files U.S. federal, state, local and non-U.S. tax returns as applicable. The fund's tax returns are subject to examination by the relevant taxing authority until expiration of the applicable statute of limitations, which is generally three years from the date of filing but can be longer in certain jurisdictions. At this time, management believes there are no uncertain tax positions which, based on their technical merit, would not be sustained upon examination and for which it is reasonably possible that the total amounts of unrecognized tax benefits will significantly change in the next twelve months.
Multiple Class — All shares of the fund represent an equal pro rata interest in the net assets of the class to which such shares belong, and have identical voting, dividend, liquidation and other rights and the same terms and conditions, except for class specific expenses and exclusive rights to vote on matters affecting only individual classes. Income, non-class specific expenses, and realized and unrealized capital gains and losses of the fund are allocated to each class of shares based on their relative net assets.
Distributions to Shareholders — Distributions from net investment income and net realized gains, if any, are generally declared and paid annually. The fund may make distributions on a more frequent basis to comply with the distribution requirements of the Internal Revenue Code, in all events in a manner consistent with provisions of the 1940 Act.
18
Indemnifications — Under the corporation’s organizational documents, its officers and directors are indemnified against certain liabilities arising out of the performance of their duties to the fund. In addition, in the normal course of business, the fund enters into contracts that provide general indemnifications. The maximum exposure under these arrangements is unknown as this would involve future claims that may be made against a fund. The risk of material loss from such claims is considered by management to be remote.
3. Fees and Transactions with Related Parties
Certain officers and directors of the corporation are also officers and/or directors of American Century Companies, Inc. (ACC). The corporation’s investment advisor, ACIM, the corporation's distributor, American Century Investment Services, Inc. (ACIS), and the corporation’s transfer agent, American Century Services, LLC, are wholly owned, directly or indirectly, by ACC. ACIM owns 95% of the shares of the fund. Related parties do not invest in the fund for the purpose of exercising management or control.
Management Fees — The corporation has entered into a management agreement with ACIM, under which ACIM provides the fund with investment advisory and management services in exchange for a single, unified management fee (the fee) per class. The agreement provides that all expenses of managing and operating the fund, except distribution and service fees, brokerage expenses, taxes, interest, fees and expenses of the independent directors (including legal counsel fees), and extraordinary expenses, will be paid by ACIM. The fee is computed and accrued daily based on each class’s daily net assets and paid monthly in arrears. The annual management fee is 1.60% for the Investor Class, A Class, C Class and R Class, 1.40% for the Institutional Class and 1.25% for the R6 Class.
Distribution and Service Fees — The Board of Directors has adopted a separate Master Distribution and Individual Shareholder Services Plan for each of the A Class, C Class and R Class (collectively the plans), pursuant to Rule 12b-1 of the 1940 Act. The plans provide that the A Class will pay ACIS an annual distribution and service fee of 0.25%. The plans provide that the C Class will pay ACIS an annual distribution and service fee of 1.00%, of which 0.25% is paid for individual shareholder services and 0.75% is paid for distribution services. The plans provide that the R Class will pay ACIS an annual distribution and service fee of 0.50%. The fees are computed and accrued daily based on each class’s daily net assets and paid monthly in arrears. The fees are used to pay financial intermediaries for distribution and individual shareholder services. Fees incurred under the plans during the period April 7, 2016 (fund inception) through November 30, 2016 are detailed in the Statement of Operations.
Directors' Fees and Expenses — The Board of Directors is responsible for overseeing the investment advisor’s management and operations of the fund. The directors receive detailed information about the fund and its investment advisor regularly throughout the year, and meet at least quarterly with management of the investment advisor to review reports about fund operations. The fund’s officers do not receive compensation from the fund.
Acquired Fund Fees and Expenses — The fund may invest in mutual funds, exchange-traded funds, and business development companies (the acquired funds). The fund will indirectly realize its pro rata share of the fees and expenses of the acquired funds in which it invests. These indirect fees and expenses are not paid out of the fund's assets but are reflected in the return realized by the fund on its investment in the acquired funds.
4. Investment Transactions
Purchases and sales of investment securities, excluding short-term investments, for the period April 7, 2016 (fund inception) through November 30, 2016 were $7,997,849 and $2,724,093, respectively.
19
5. Capital Share Transactions
Transactions in shares of the fund were as follows:
Period ended November 30, 2016(1) | |||||
| Shares | Amount | ||||
| Investor Class/Shares Authorized | 50,000,000 | ||||
| Sold | 236,567 | $ | 2,387,142 | ||
| Redeemed | (9,429 | ) | (101,758 | ) | |
| 227,138 | 2,285,384 | ||||
| Institutional Class/Shares Authorized | 50,000,000 | ||||
| Sold | 60,000 | 600,000 | |||
| A Class/Shares Authorized | 50,000,000 | ||||
| Sold | 100,028 | 1,000,309 | |||
| C Class/Shares Authorized | 50,000,000 | ||||
| Sold | 100,000 | 1,000,000 | |||
| R Class/Shares Authorized | 50,000,000 | ||||
| Sold | 20,378 | 203,997 | |||
| Redeemed | (45 | ) | (487 | ) | |
| 20,333 | 203,510 | ||||
| R6 Class/Shares Authorized | 50,000,000 | ||||
| Sold | 20,000 | 200,000 | |||
| Net increase (decrease) | 527,499 | $ | 5,289,203 | ||
| (1) | April 7, 2016 (fund inception) through November 30, 2016. |
6. Fair Value Measurements
The fund’s investments valuation process is based on several considerations and may use multiple inputs to determine the fair value of the investments held by the fund. In conformity with accounting principles generally accepted in the United States of America, the inputs used to determine a valuation are classified into three broad levels.
| • | Level 1 valuation inputs consist of unadjusted quoted prices in an active market for identical investments. |
| • | Level 2 valuation inputs consist of direct or indirect observable market data (including quoted prices for comparable investments, evaluations of subsequent market events, interest rates, prepayment speeds, credit risk, etc.). These inputs also consist of quoted prices for identical investments initially expressed in local currencies that are adjusted through translation into U.S. dollars. |
| • | Level 3 valuation inputs consist of unobservable data (including a fund’s own assumptions). |
The level classification is based on the lowest level input that is significant to the fair valuation measurement. The valuation inputs are not necessarily an indication of the risks associated with investing in these securities or other financial instruments. There were no significant transfers between levels during the period.
20
The following is a summary of the level classifications as of period end. The Schedule of Investments provides additional information on the fund’s portfolio holdings.
| Level 1 | Level 2 | Level 3 | ||||||
| Assets | ||||||||
| Investment Securities | ||||||||
| Common Stocks | ||||||||
| China | $ | 434,979 | $ | 699,360 | — | |||
| Russia | 53,475 | 201,980 | — | |||||
| Other Countries | — | 3,652,078 | — | |||||
| Exchange-Traded Funds | 277,298 | — | — | |||||
| Rights | — | 679 | — | |||||
| Temporary Cash Investments | 223 | 261,000 | — | |||||
| $ | 765,975 | $ | 4,815,097 | — | ||||
7. Risk Factors
There are certain risks involved in investing in foreign securities. These risks include those resulting from future adverse political, social and economic developments, fluctuations in currency exchange rates, the possible imposition of exchange controls, and other foreign laws or restrictions. Investing in emerging markets may accentuate these risks.
The fund invests in common stocks of small companies. Because of this, the fund may be subject to greater risk and market fluctuations than a fund investing in larger, more established companies.
8. Federal Tax Information
On December 20, 2016, the fund declared and paid the following per-share distributions from net investment income to shareholders of record on December 19, 2016:
| Investor Class | Institutional Class | A Class | C Class | R Class | R6 Class |
| $0.0876 | $0.1081 | $0.0619 | — | $0.0362 | $0.1236 |
The book-basis character of distributions made during the year from net investment income or net realized gains may differ from their ultimate characterization for federal income tax purposes. These differences reflect the differing character of certain income items and net realized gains and losses for financial statement and tax purposes, and may result in reclassification among certain capital accounts on the financial statements. There were no distributions paid by the fund during the period April 7, 2016 (fund inception) through November 30, 2016.
As of November 30, 2016, the federal tax cost of investments and the components of distributable earnings on a tax-basis were as follows:
| Federal tax cost of investments | $ | 5,212,953 | |
| Gross tax appreciation of investments | $ | 627,420 | |
| Gross tax depreciation of investments | (259,301 | ) | |
| Net tax appreciation (depreciation) of investments | 368,119 | ||
| Net tax appreciation (depreciation) on translation of assets and liabilities in foreign currencies | (438 | ) | |
| Net tax appreciation (depreciation) | $ | 367,681 | |
| Undistributed ordinary income | $ | 38,329 | |
| Accumulated short-term capital losses | $ | (188,223 | ) |
The difference between book-basis and tax-basis unrealized appreciation (depreciation) is attributable primarily to the realization to ordinary income for tax purposes of unrealized gains on investments in passive foreign investment companies.
21
Accumulated capital losses represent net capital loss carryovers that may be used to offset future realized capital gains for federal income tax purposes. The capital loss carryovers may be carried forward for an unlimited period. Future capital loss carryover utilization in any given year may be subject to Internal Revenue Code limitations.
9. Recently Issued Accounting Guidance
In October 2016, the Securities and Exchange Commission adopted new rules and forms as well as amendments to its rules and forms to modernize the reporting and disclosure of information by registered investment companies. The amendments to Regulation S-X will require standardized, enhanced disclosure about derivatives in investment company financial statements, as well as other provisions. Compliance with the amendments is effective on August 1, 2017. Management is currently evaluating the impact that adopting the amendments will have on the financial statement disclosures.
22
| Financial Highlights |
| For a Share Outstanding Throughout the Period Indicated | ||||||||||||
| Per-Share Data | Ratios and Supplemental Data | |||||||||||
| Income From Investment Operations: | Ratio to Average Net Assets of: | |||||||||||
| Net Asset Value, Beginning of Period | Net Investment Income (Loss)(1) | Net Realized and Unrealized Gain (Loss) | Total From Investment Operations | Net Asset Value, End of Period | Total Return(2) | Operating Expenses(3) | Net Investment Income (Loss) | Portfolio Turnover Rate | Net Assets, End of Period (in thousands) | |||
| Investor Class | ||||||||||||
2016(4) | $10.00 | 0.04 | 0.41 | 0.45 | $10.45 | 4.50% | 1.60%(5) | 0.59%(5) | 51% | $2,373 | ||
| Institutional Class | ||||||||||||
2016(4) | $10.00 | 0.05 | 0.41 | 0.46 | $10.46 | 4.60% | 1.40%(5) | 0.79%(5) | 51% | $628 | ||
| A Class | ||||||||||||
2016(4) | $10.00 | 0.02 | 0.41 | 0.43 | $10.43 | 4.30% | 1.85%(5) | 0.34%(5) | 51% | $1,043 | ||
| C Class | ||||||||||||
2016(4) | $10.00 | (0.03) | 0.41 | 0.38 | $10.38 | 3.80% | 2.60%(5) | (0.41)%(5) | 51% | $1,038 | ||
| R Class | ||||||||||||
2016(4) | $10.00 | 0.01 | 0.40 | 0.41 | $10.41 | 4.10% | 2.10%(5) | 0.09%(5) | 51% | $212 | ||
| R6 Class | ||||||||||||
2016(4) | $10.00 | 0.06 | 0.41 | 0.47 | $10.47 | 4.70% | 1.25%(5) | 0.94%(5) | 51% | $209 | ||
| Notes to Financial Highlights | |
| (1) | Computed using average shares outstanding throughout the period. |
| (2) | Total returns are calculated based on the net asset value of the last business day and do not reflect applicable sales charges, if any. Total returns for periods less than one year are not annualized. |
| (3) | Ratio of operating expenses to average net assets does not include any fees and expenses of the acquired funds. |
| (4) | April 7, 2016 (fund inception) through November 30, 2016. |
| (5) | Annualized. |
See Notes to Financial Statements.
| Report of Independent Registered Public Accounting Firm |
To the Board of Directors and Shareholders of American Century World Mutual Funds, Inc.:
We have audited the accompanying statement of assets and liabilities, including the schedule of investments, of Emerging Markets Small Cap Fund (the “Fund”), one of the funds constituting American Century World Mutual Funds, Inc., as of November 30, 2016, and the related statement of operations, changes in net assets, and the financial highlights for the period from April 7, 2016 (commencement date) through November 30, 2016. These financial statements and financial highlights are the responsibility of the Fund’s management. Our responsibility is to express an opinion on these financial statements and financial highlights based on our audits.
We conducted our audits in accordance with the standards of the Public Company Accounting Oversight Board (United States). Those standards require that we plan and perform the audit to obtain reasonable assurance about whether the financial statements and financial highlights are free of material misstatement. The Fund is not required to have, nor were we engaged to perform, an audit of its internal control over financial reporting. Our audits included consideration of internal control over financial reporting as a basis for designing audit procedures that are appropriate in the circumstances, but not for the purpose of expressing an opinion on the effectiveness of the Fund’s internal control over financial reporting. Accordingly, we express no such opinion. An audit also includes examining, on a test basis, evidence supporting the amounts and disclosures in the financial statements, assessing the accounting principles used and significant estimates made by management, as well as evaluating the overall financial statement presentation. Our procedures included confirmation of securities owned as of November 30, 2016, by correspondence with the custodian and brokers; when replies were not received from brokers, we performed other auditing procedures. We believe that our audits provide a reasonable basis for our opinion.
In our opinion, the financial statements and financial highlights referred to above present fairly, in all material respects, the financial position of Emerging Markets Small Cap Fund of American Century World Mutual Funds, Inc. as of November 30, 2016, and the results of its operations, the changes in its net assets, and the financial highlights for the period from April 7, 2016 (commencement date) through November 30, 2016, in conformity with accounting principles generally accepted in the United States of America.
DELOITTE & TOUCHE LLP
Kansas City, Missouri
January 17, 2017
25
| Management |
The Board of Directors
The individuals listed below serve as directors of the funds. Each director will continue to serve in this capacity until death, retirement, resignation or removal from office. The board has adopted a mandatory retirement age for directors who are not “interested persons,” as that term is defined in the Investment Company Act (independent directors). Independent directors shall retire by December 31 of the year in which they reach their 75th birthday.
Mr. Thomas is an “interested person” because he currently serves as President and Chief Executive Officer of American Century Companies, Inc. (ACC), the parent company of American Century Investment Management, Inc. (ACIM or the advisor). The other directors (more than three-fourths of the total number) are independent. They are not employees, directors or officers of, and have no financial interest in, ACC or any of its wholly owned, direct or indirect, subsidiaries, including ACIM, American Century Investment Services, Inc. (ACIS) and American Century Services, LLC (ACS), and they do not have any other affiliations, positions or relationships that would cause them to be considered “interested persons” under the Investment Company Act. The directors serve in this capacity for seven (in the case of Mr. Thomas, 15) registered investment companies in the American Century Investments family of funds.
The following table presents additional information about the directors. The mailing address for each director is 4500 Main Street, Kansas City, Missouri 64111.
| Name (Year of Birth) | Position(s) Held with Funds | Length of Time Served | Principal Occupation(s) During Past 5 Years | Number of American Century Portfolios Overseen by Director | Other Directorships Held During Past 5 Years |
| Independent Directors | |||||
| Barry Fink (1955) | Director | Since 2012 | Retired; Executive Vice President, ACC (September 2007 to February 2013); President, ACS (October 2007 to February 2013); Chief Operating Officer, ACC (September 2007 to November 2012) | 81 | None |
| Andrea C. Hall (1945) | Director | Since 1997 | Retired | 81 | None |
| Jan M. Lewis (1957) | Director | Since 2011 | Retired; President and Chief Executive Officer, Catholic Charities of Northeast Kansas (human services organization) (2006 to 2013) | 81 | None |
| James A. Olson (1942) | Director and Chairman of the Board | Since 2007 (Chairman since 2014) | Member, Plaza Belmont LLC (private equity fund manager) (1999 to present) | 81 | Saia, Inc. (2002 to 2012) and EPR Properties (2003 to 2013) |
| M. Jeannine Strandjord (1945) | Director | Since 1994 | Retired | 81 | Euronet Worldwide Inc.; MGP Ingredients, Inc.; and DST Systems Inc. (1996 to 2012) |
26
| Name (Year of Birth) | Position(s) Held with Funds | Length of Time Served | Principal Occupation(s) During Past 5 Years | Number of American Century Portfolios Overseen by Director | Other Directorships Held During Past 5 Years |
| Independent Directors | |||||
| John R. Whitten (1946) | Director | Since 2008 | Retired | 81 | Rudolph Technologies, Inc. |
| Stephen E. Yates (1948) | Director | Since 2012 | Retired | 81 | None |
| Interested Director | |||||
| Jonathan S. Thomas (1963) | Director and President | Since 2007 | President and Chief Executive Officer, ACC (March 2007 to present). Also serves as Chief Executive Officer, ACS; Executive Vice President, ACIM; Director, ACC, ACIM and other ACC subsidiaries | 126 | BioMed Valley Discoveries, Inc. |
The Statement of Additional Information has additional information about the fund's directors and is available without charge, upon request, by calling 1-800-345-2021.
27
Officers
The following table presents certain information about the executive officers of the funds. Each officer serves as an officer for each of the 15 investment companies in the American Century family of funds, unless otherwise noted. No officer is compensated for his or her service as an officer of the funds. The listed officers are interested persons of the funds and are appointed or re-appointed on an annual basis. The mailing address for each officer listed below is 4500 Main Street, Kansas City, Missouri 64111.
| Name (Year of Birth) | Offices with the Funds | Principal Occupation(s) During the Past Five Years |
| Jonathan S. Thomas (1963) | Director and President since 2007 | President and Chief Executive Officer, ACC (March 2007 to present). Also serves as Chief Executive Officer, ACS; Executive Vice President, ACIM; Director, ACC, ACIM and other ACC subsidiaries |
| Amy D. Shelton (1964) | Chief Compliance Officer and Vice President since 2014 | Chief Compliance Officer, American Century funds, (March 2014 to present); Chief Compliance Officer, ACIM (February 2014 to present); Chief Compliance Officer, ACIS (October 2009 to present); Vice President, Client Interactions and Marketing, ACIS (February 2013 to January 2014); Director, Client Interactions and Marketing, ACIS (June 2007 to January 2013). Also serves as Vice President, ACIS |
| Charles A. Etherington (1957) | General Counsel since 2007 and Senior Vice President since 2006 | Attorney, ACC (February 1994 to present); Vice President, ACC (November 2005 to present); General Counsel, ACC (March 2007 to present). Also serves as General Counsel, ACIM, ACS, ACIS and other ACC subsidiaries; and Senior Vice President, ACIM and ACS |
| C. Jean Wade (1964) | Vice President,Treasurer and Chief Financial Officer since 2012 | Vice President, ACS (February 2000 to present) |
| Robert J. Leach (1966) | Vice President since 2006 and Assistant Treasurer since 2012 | Vice President, ACS (February 2000 to present) |
| David H. Reinmiller (1963) | Vice President since 2000 | Attorney, ACC (January 1994 to present); Associate General Counsel, ACC (January 2001 to present). Also serves as Vice President, ACIM and ACS |
| Ward D. Stauffer (1960) | Secretary since 2005 | Attorney, ACC (June 2003 to present) |
28
| Additional Information |
Retirement Account Information
As required by law, distributions you receive from certain IRAs are subject to federal income tax withholding, unless you elect not to have withholding apply. Tax will be withheld on the total amount withdrawn even though you may be receiving amounts that are not subject to withholding, such as nondeductible contributions. In such case, excess amounts of withholding could occur. You may adjust your withholding election so that a greater or lesser amount will be withheld.
If you don’t want us to withhold on this amount, you must notify us to not withhold the federal income tax. You may notify us in writing or in certain situations by telephone or through other electronic means. For systematic withdrawals, your withholding election will remain in effect until revoked or changed by filing a new election. You have the right to revoke your election at any time.
Remember, even if you elect not to have income tax withheld, you are liable for paying income tax on the taxable portion of your withdrawal. If you elect not to have income tax withheld or you don’t have enough income tax withheld, you may be responsible for payment of estimated tax. You may incur penalties under the estimated tax rules if your withholding and estimated tax payments are not sufficient. You can reduce or defer the income tax on a distribution by directly or indirectly rolling such distribution over to another IRA or eligible plan. You should consult your tax advisor for additional information.
State tax will be withheld if, at the time of your distribution, your address is within one of the mandatory withholding states and you have federal income tax withheld (or as otherwise required by state law). State taxes will be withheld from your distribution in accordance with the respective state rules.
Distributions you receive from 403(b), 457 and qualified plans are subject to special tax and withholding rules. Your plan administrator or plan sponsor is required to provide you with a special tax notice explaining those rules at the time you request a distribution. If applicable, federal and/or state taxes may be withheld from your distribution amount.
Proxy Voting Policies
A description of the policies that the fund's investment advisor uses in exercising the voting rights associated with the securities purchased and/or held by the fund is available without charge, upon request, by calling 1-800-345-2021. It is also available on the "About Us" page of American Century Investments’ website at americancentury.com and on the Securities and Exchange Commission’s website at sec.gov. Information regarding how the investment advisor voted proxies relating to portfolio securities during the most recent 12-month period ended June 30 is available on the "About Us" page at americancentury.com. It is also available at sec.gov.
Quarterly Portfolio Disclosure
The fund files its complete schedule of portfolio holdings with the Securities and Exchange Commission (SEC) for the first and third quarters of each fiscal year on Form N-Q. The fund’s Forms N-Q are available on the SEC’s website at sec.gov, and may be reviewed and copied at the SEC’s Public Reference Room in Washington, DC. Information on the operation of the Public Reference Room may be obtained by calling 1-800-SEC-0330. The fund also makes its complete schedule of portfolio holdings for the most recent quarter of its fiscal year available on its website at americancentury.com and, upon request, by calling 1-800-345-2021.
29
Other Tax Information
The following information is provided pursuant to provisions of the Internal Revenue Code.
The fund hereby designates up to the maximum amount allowable as qualified dividend income for the fiscal year ended November 30, 2016.
For the fiscal year ended November 30, 2016, the fund intends to pass through to shareholders foreign source income of $77,325 and foreign taxes paid of $5,670, or up to the maximum amount allowable, as a foreign tax credit. Foreign source income and foreign tax expense per outstanding shares on November 30, 2016 are $0.1466 and $0.0107, respectively.
30
| Notes |
31
| Notes |
32
| ||
| Contact Us | americancentury.com | |
| Automated Information Line | 1-800-345-8765 | |
| Investor Services Representative | 1-800-345-2021 or 816-531-5575 | |
| Investors Using Advisors | 1-800-378-9878 | |
| Business, Not-For-Profit, Employer-Sponsored Retirement Plans | 1-800-345-3533 | |
| Banks and Trust Companies, Broker-Dealers, Financial Professionals, Insurance Companies | 1-800-345-6488 | |
| Telecommunications Relay Service for the Deaf | 711 | |
| American Century World Mutual Funds, Inc. | ||
Investment Advisor: American Century Investment Management, Inc. Kansas City, Missouri | ||
| This report and the statements it contains are submitted for the general information of our shareholders. The report is not authorized for distribution to prospective investors unless preceded or accompanied by an effective prospectus. | ||
| ©2017 American Century Proprietary Holdings, Inc. All rights reserved. CL-ANN-91033 1701 | ||
| Annual Report | |
| November 30, 2016 | |
| Focused International Growth Fund | |
| Table of Contents |
| President’s Letter | |
| Performance | |
| Portfolio Commentary | |
| Fund Characteristics | |
| Shareholder Fee Example | |
| Schedule of Investments | |
| Statement of Assets and Liabilities | |
| Statement of Operations | |
| Statement of Changes in Net Assets | |
| Notes to Financial Statements | |
| Financial Highlights | |
| Report of Independent Registered Public Accounting Firm | |
| Management | |
| Additional Information | |
Any opinions expressed in this report reflect those of the author as of the date of the report, and do not necessarily represent the opinions of American Century Investments® or any other person in the American Century Investments organization. Any such opinions are subject to change at any time based upon market or other conditions and American Century Investments disclaims any responsibility to update such opinions. These opinions may not be relied upon as investment advice and, because investment decisions made by American Century Investments funds are based on numerous factors, may not be relied upon as an indication of trading intent on behalf of any American Century Investments fund. Security examples are used for representational purposes only and are not intended as recommendations to purchase or sell securities. Performance information for comparative indices and securities is provided to American Century Investments by third party vendors. To the best of American Century Investments’ knowledge, such information is accurate at the time of printing.
| President’s Letter |
Jonathan ThomasDear Investor:
Thank you for reviewing this annual report for the approximately eight-month period from the fund’s inception to November 30, 2016. Annual reports help convey important information about fund returns, including market factors that affected performance during the reporting period. For additional, updated investment and market insights, we encourage you to visit our website, americancentury.com.
A Period of Populist, Anti-Globalization Political Surprises
The reporting period produced mixed investment results under unsettled economic and market conditions, triggered in part by Brexit (the U.K.’s unexpected vote to leave the European Union) and Donald Trump’s victory in the U.S. presidential election. These market-moving political events were eye-opening manifestations of populist and anti-globalization political movements influenced partly by lingering economic weakness and extreme central bank monetary stimulus since the world-wide Great Recession nearly a decade ago. Years of low interest rates, market globalization, and corporate cost-cutting had benefited some segments of the world’s developed democracies much more than others. The others spoke up in June and November, voting for Brexit, then propelling Trump to victory.
Meanwhile, the global economy continued to rebound from its setbacks during the first six weeks of 2016, when concerns about China’s growth and plummeting oil prices affected the global economic outlook. China appeared to stabilize, and oil prices retraced some of their losses on signs that the major oil-producing countries might be able to cooperate on restricting crude oil supplies. Furthermore, major central banks, particularly in Europe and Japan, continued to provide massive monetary stimulus, supporting economic growth and investment returns. However, Trump’s win, rising U.S. interest rates, strength in the U.S. dollar, and concerns about proposed immigration restrictions and tariffs under the new Trump administration dampened the mood in non-U.S. markets.
Looking ahead, Trump’s victory unleashed potentially far-reaching ramifications that are still unfolding. What’s clear is that his policy proposals and unpredictable nature make uncertainty more certain, which could trigger bouts of short-term market volatility. In this unsettled environment, we strongly believe in staying the course and remaining focused on longer-term goals, using disciplined, actively managed, diversified, risk-aware strategies. We appreciate your continued trust in us.
Sincerely,
Jonathan Thomas
President and Chief Executive Officer
American Century Investments
2
| Performance |
| Total Returns as of November 30, 2016 | |||
Ticker Symbol | Since Inception | Inception Date | |
| Investor Class | AFCNX | -2.50% | 3/29/16 |
| MSCI ACWI ex-U.S. Index | — | 4.04% | — |
| Institutional Class | AFCSX | -2.40% | 3/29/16 |
| A Class | AFCLX | 3/29/16 | |
| No sales charge | -2.70% | ||
| With sales charge | -8.29% | ||
| C Class | AFCHX | 3/29/16 | |
| No sales charge | -3.20% | ||
| With sales charge | -4.17% | ||
| R Class | AFCWX | -2.80% | 3/29/16 |
| R6 Class | AFCMX | -2.30% | 3/29/16 |
Sales charges include initial sales charges and contingent deferred sales charges (CDSCs), as applicable. A Class shares have a 5.75% maximum initial sales charge and may be subject to a maximum CDSC of 1.00%. C Class shares redeemed within 12 months of purchase are subject to a maximum CDSC of 1.00%. The SEC requires that mutual funds provide performance information net of maximum sales charges in all cases where charges could be applied.
Data presented reflect past performance. Past performance is no guarantee of future results. Current performance may be higher or lower than the performance shown. Total returns for periods less than one year are not annualized. Investment return and principal value will fluctuate, and redemption value may be more or less than original cost. Data assumes reinvestment of dividends and capital gains, and none of the charts reflect the deduction of taxes that a shareholder would pay on fund distributions or the redemption of fund shares. To obtain performance data current to the most recent month end, please call 1-800-345-2021 or visit americancentury.com. For additional information about the fund, please consult the prospectus.
3
| Growth of $10,000 Over Life of Class |
| $10,000 investment made March 29, 2016 |
| Performance for other share classes will vary due to differences in fee structure. |
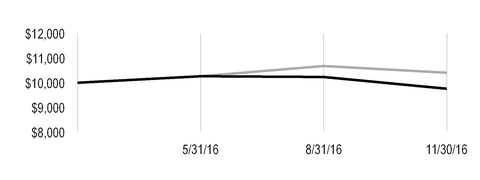
| Value on November 30, 2016 | |
| Investor Class — $9,750 | |
| MSCI ACWI ex-U.S. Index — $10,404 | |
Total Annual Fund Operating Expenses | |||||
Investor Class | Institutional Class | A Class | C Class | R Class | R6 Class |
| 1.24% | 1.04% | 1.49% | 2.24% | 1.74% | 0.89% |
The total annual fund operating expenses shown is as stated in the fund’s prospectus current as of the date of this report. The prospectus may vary from the expense ratio shown elsewhere in this report because it is based on a different time period, includes acquired fund fees and expenses, and, if applicable, does not include fee waivers or expense reimbursements.
Data presented reflect past performance. Past performance is no guarantee of future results. Current performance may be higher or lower than the performance shown. Total returns for periods less than one year are not annualized. Investment return and principal value will fluctuate, and redemption value may be more or less than original cost. Data assumes reinvestment of dividends and capital gains, and none of the charts reflect the deduction of taxes that a shareholder would pay on fund distributions or the redemption of fund shares. To obtain performance data current to the most recent month end, please call 1-800-345-2021 or visit americancentury.com. For additional information about the fund, please consult the prospectus.
4
| Portfolio Commentary |
Portfolio Manager: Raj Gandhi and James Gendelman
Performance Summary
Focused International Growth declined -2.50%* for the period beginning March 29, 2016 (fund inception) through November 30, 2016. The portfolio’s benchmark, the MSCI ACWI ex-U.S. Index, increased 4.04% for the same period.
Non-U.S. developed market stocks increased slightly during the fund’s operating period, sharply lagging returns provided by U.S.-based equities. Among non-U.S. stocks, the Far East region fared the best, and those based in Europe sharply lagged. Returns for emerging markets and Asia Pacific were positive but less robust. Over the last eight months, our process faced a number of headwinds that meaningfully impacted results:
(1) The strongest driver of stock price performance has been dividend yield; current income is not a key consideration in our process;
(2) Value stocks strongly outperformed growth stocks. From the beginning of the fourth quarter to the end of the plan year (September 30, 2016 through November 30, 2016), the MSCI EAFE Value Index returned -0.70% and MSCI EAFE Growth Index returned -7.81%, a difference of 711 basis points. MSCI EAFE Value Index also outperformed MSCI EAFE Growth Index for the since inception period (March 29, 2016-November 30, 2016) by 786 basis points.
(3) The scarcity of growth around the globe has led to a continuation of central bank policy characterized by abnormally low interest rates. This has led to uncertainty and volatility for stocks and helped more defensive securities outperform;
(4) The degree of intra-stock correlation has increased. As a result, the market has not been differentiating among securities based on earnings or fundamentals; and
(5) Currency volatility has been high, causing currency effects to have a larger-than-normal impact on relative returns.
In addition, the uncertainty associated with the U.K.’s late June Brexit vote (the June 23, 2016, referendum whereby British citizens voted to exit the European Union) triggered a sharp market correction that spilled into the beginning of July, with most equity markets continuing to decline. Subsequently, a combination of better-than-expected earnings and the realization that the aftermath of Brexit would not be as bad as originally feared, led to a rerating of stocks and a market turnaround. Markets recovered some of their Brexit-related losses, finishing lower for the year but well above their lowest levels.
Overall, the fund lagged its benchmark primarily due to stock selection in the financials, consumer discretionary, information technology, and materials sectors. Regionally, stock selection in Japan and the U.K. and positioning in Canada also contributed to the fund’s underperformance.
Japanese Firms Are Among Top Detractors
On an individual stock basis, two Japan-based companies were among the fund’s leading detractors. Snack food company Calbee traded lower on concerns over the weather impact on
*All fund returns referenced in this commentary are for Investor Class shares. Total returns for periods less than one year are not annualized. Performance for other share classes will vary due to differences in fee structure; when Investor Class performance exceeds that of the fund's benchmark, other share classes may not. See page 3 for returns for all share classes.
5
potato crops in Japan. After posting strong second-quarter results in October, Ryohin Keikaku, a
retailer of household and consumer goods, detracted in the third calendar quarter. Negatives for the stock included a one-month slowdown in comparable store sales and a weakening yen, which pressured consumer-oriented domestic stocks.
Another detractor was Mexico-based Alsea, a franchiser of Starbucks, Chili’s, and other restaurant chains. After a strong run of performance, the portfolio-only holding was weak due to concerns about Mexico, particularly as it related to U.S. presidential campaign rhetoric on trade policy. The company continues to post strong results, and its business fundamentals remain solid.
A position in Italy-based bank Intesa Sanpaolo, which declined due to concerns over weakness in the Italian banking sector and the fear that regulators may force it to take over a lower-quality bank, also hurt returns. Despite signs of improving fundamentals, we believe uncertainty around the role of healthy banks such as Intesa in the government’s plan to “bail out” unprofitable banks could pressure the stock; we exited the position.
Companies Benefiting from Changing Consumer Behavior Were Main Contributors
Strong stock selection in industrials and health care and having no exposure in telecommunication services benefited performance. Regionally, stock selection in Sweden and the Netherlands and holding no positions in Spain aided results.
Leading individual contributors included companies benefiting from the ongoing shift in consumer behavior from offline to online. Tencent Holdings, a social media and online gaming company headquartered in China, benefited from the continued shift in global advertising spending away from traditional media, such as television and newspapers, to online and mobile. These trends have boosted Tencent’s advertising revenues and enabled it to deliver consistently strong financial results. Tencent is also benefiting from the transition of games from PC to mobile. In addition, Zalando, an online apparel company headquartered in Germany, enjoyed better-than-expected earnings growth and considerable improvement in margins during its third quarter. The company also reported that its investments in new markets are reaping rewards.
Other contributors included U.K.-based Ashtead Group, an international equipment rental company servicing the U.S. and the U.K. U.S. election results improved investor confidence in the U.S. nonresidential construction cycle. The company also continues to report stronger-than-expected revenue and earnings per share growth.
Outlook
Portfolio positioning is determined by bottom-up stock selection. We focused on businesses exhibiting accelerating, sustainable growth where the Street is underestimating the company's earnings power. The complexion of the consumer discretionary sector has changed. We are finding opportunities in companies that have positioned themselves to profit from the continued shift in consumer behavior from offline to online commerce. We also favor those that are benefiting from the proliferation of smartphones and the subsequent expansion of content-driven applications and digital advertising development. We remain underweight financials relative to the fund's benchmark, but have added slightly to our positions as the steepening of the yield curve should lead to improved net interest margins. Our process has identified improvement in the materials sector driven by stabilization of the supply/demand balance, better pricing, and a stronger outlook for residential construction in both Europe and the U.S.
6
| Fund Characteristics |
| NOVEMBER 30, 2016 | |
Top Ten Holdings | % of net assets |
| AIA Group Ltd. | 3.9% |
| TOTAL SA | 3.9% |
| Tencent Holdings Ltd. | 3.6% |
| Shire plc | 3.5% |
| Alibaba Group Holding Ltd. ADR | 3.3% |
| Lundin Petroleum AB | 3.1% |
| Zalando SE | 3.1% |
| Weir Group plc (The) | 3.0% |
| ORIX Corp. | 3.0% |
| Roche Holding AG | 2.9% |
Types of Investments in Portfolio | % of net assets |
| Common Stocks | 97.6% |
| Exchange-Traded Funds | 1.0% |
| Total Equity Exposure | 98.6% |
| Temporary Cash Investments | 1.2% |
| Other Assets and Liabilities | 0.2% |
Investments by Country | % of net assets |
| United Kingdom | 22.4% |
| Japan | 11.1% |
| France | 10.4% |
| Germany | 8.9% |
| China | 6.9% |
| Mexico | 4.6% |
| Hong Kong | 3.9% |
| India | 3.8% |
| Sweden | 3.1% |
| Switzerland | 2.9% |
| Portugal | 2.6% |
| Denmark | 2.5% |
| Belgium | 2.4% |
| Indonesia | 2.3% |
| Austria | 2.3% |
| Other Countries | 7.5% |
| Exchange-Traded Funds | 1.0% |
| Cash and Equivalents* | 1.4% |
*Includes temporary cash investments and other assets and liabilities.
7
| Shareholder Fee Example |
Fund shareholders may incur two types of costs: (1) transaction costs, including sales charges (loads) on purchase payments and redemption/exchange fees; and (2) ongoing costs, including management fees; distribution and service (12b-1) fees; and other fund expenses. This example is intended to help you understand your ongoing costs (in dollars) of investing in your fund and to compare these costs with the ongoing cost of investing in other mutual funds.
The example is based on an investment of $1,000 made at the beginning of the period and held for the entire period from June 1, 2016 to November 30, 2016.
Actual Expenses
The table provides information about actual account values and actual expenses for each class. You may use the information, together with the amount you invested, to estimate the expenses that you paid over the period. First, identify the share class you own. Then simply divide your account value by $1,000 (for example, an $8,600 account value divided by $1,000 = 8.6), then multiply the result by the number under the heading “Expenses Paid During Period” to estimate the expenses you paid on your account during this period.
If you hold Investor Class shares of any American Century Investments fund, or Institutional Class shares of the American Century Diversified Bond Fund, in an American Century Investments account (i.e., not a financial intermediary or retirement plan account), American Century Investments may charge you a $12.50 semiannual account maintenance fee if the value of those shares is less than $10,000. We will redeem shares automatically in one of your accounts to pay the $12.50 fee. In determining your total eligible investment amount, we will include your investments in all personal accounts (including American Century Investments Brokerage accounts) registered under your Social Security number. Personal accounts include individual accounts, joint accounts, UGMA/UTMA accounts, personal trusts, Coverdell Education Savings Accounts and IRAs (including traditional, Roth, Rollover, SEP-, SARSEP- and SIMPLE-IRAs), and certain other retirement accounts. If you have only business, business retirement, employer-sponsored or American Century Investments Brokerage accounts, you are currently not subject to this fee. If you are subject to the Account Maintenance Fee, your account value could be reduced by the fee amount.
Hypothetical Example for Comparison Purposes
The table also provides information about hypothetical account values and hypothetical expenses based on the actual expense ratio of each class of your fund and an assumed rate of return of 5% per year before expenses, which is not the actual return of a fund’s share class. The hypothetical account values and expenses may not be used to estimate the actual ending account balance or expenses you paid for the period. You may use this information to compare the ongoing costs of investing in your fund and other funds. To do so, compare this 5% hypothetical example with the 5% hypothetical examples that appear in the shareholder reports of the other funds.
Please note that the expenses shown in the table are meant to highlight your ongoing costs only and do not reflect any transactional costs, such as sales charges (loads) or redemption/exchange fees. Therefore, the table is useful in comparing ongoing costs only, and will not help you determine the relative total costs of owning different funds. In addition, if these transactional costs were included, your costs would have been higher.
8
| Beginning Account Value 6/1/16 | Ending Account Value 11/30/16 | Expenses Paid During Period(1) 6/1/16 - 11/30/16 | Annualized Expense Ratio(1) | |
Actual | ||||
| Investor Class | $1,000 | $950.30 | $6.05 | 1.24% |
| Institutional Class | $1,000 | $951.30 | $5.07 | 1.04% |
| A Class | $1,000 | $949.30 | $7.26 | 1.49% |
| C Class | $1,000 | $945.30 | $10.89 | 2.24% |
| R Class | $1,000 | $948.30 | $8.48 | 1.74% |
| R6 Class | $1,000 | $952.20 | $4.34 | 0.89% |
Hypothetical | ||||
| Investor Class | $1,000 | $1,018.80 | $6.26 | 1.24% |
| Institutional Class | $1,000 | $1,019.80 | $5.25 | 1.04% |
| A Class | $1,000 | $1,017.55 | $7.52 | 1.49% |
| C Class | $1,000 | $1,013.80 | $11.28 | 2.24% |
| R Class | $1,000 | $1,016.30 | $8.77 | 1.74% |
| R6 Class | $1,000 | $1,020.55 | $4.50 | 0.89% |
| (1) | Expenses are equal to the class's annualized expense ratio listed in the table above, multiplied by the average account value over the period, multiplied by 183, the number of days in the most recent fiscal half-year, divided by 366, to reflect the one-half year period. |
9
| Schedule of Investments |
NOVEMBER 30, 2016
| Shares | Value | ||||
| COMMON STOCKS — 97.6% | |||||
| Australia — 1.7% | |||||
| Fortescue Metals Group Ltd. | 19,720 | $ | 85,480 | ||
| Austria — 2.3% | |||||
| Erste Group Bank AG | 4,060 | 112,911 | |||
| Belgium — 2.4% | |||||
| KBC Group NV | 1,980 | 118,733 | |||
| Brazil — 1.3% | |||||
| BM&FBovespa SA - Bolsa de Valores Mercadorias e Futuros | 13,300 | 65,319 | |||
| China — 6.9% | |||||
Alibaba Group Holding Ltd. ADR(1) | 1,780 | 167,355 | |||
| Tencent Holdings Ltd. | 7,200 | 179,803 | |||
| 347,158 | |||||
| Denmark — 2.5% | |||||
| Pandora A/S | 1,030 | 122,582 | |||
| France — 10.4% | |||||
| Kering | 490 | 106,462 | |||
| TOTAL SA | 4,110 | 195,823 | |||
| Valeo SA | 1,760 | 98,135 | |||
| Vivendi SA | 6,230 | 118,786 | |||
| 519,206 | |||||
| Germany — 8.9% | |||||
| adidas AG | 710 | 104,596 | |||
| Fresenius Medical Care AG & Co. KGaA | 1,130 | 88,146 | |||
| Infineon Technologies AG | 3,640 | 60,877 | |||
| Symrise AG | 676 | 40,917 | |||
Zalando SE(1) | 4,100 | 152,805 | |||
| 447,341 | |||||
| Hong Kong — 3.9% | |||||
| AIA Group Ltd. | 32,200 | 196,359 | |||
| India — 3.8% | |||||
| HDFC Bank Ltd. ADR | 1,360 | 87,747 | |||
| Tata Motors Ltd. ADR | 3,080 | 101,856 | |||
| 189,603 | |||||
| Indonesia — 2.3% | |||||
| Bank Mandiri Persero Tbk PT | 150,800 | 116,835 | |||
| Ireland — 1.6% | |||||
Ryanair Holdings plc ADR(1) | 980 | 78,243 | |||
| Japan — 11.1% | |||||
| Calbee, Inc. | 3,100 | 96,600 | |||
| Komatsu Ltd. | 3,900 | 89,774 | |||
LINE Corp.(1) | 2,100 | 80,949 | |||
| ORIX Corp. | 9,600 | 149,490 | |||
| Ryohin Keikaku Co. Ltd. | 700 | 137,241 | |||
| 554,054 | |||||
| Mexico — 4.6% | |||||
| Alsea SAB de CV | 38,370 | 112,634 | |||
10
| Shares | Value | ||||
Cemex SAB de CV ADR(1) | 15,003 | $ | 117,173 | ||
| 229,807 | |||||
| Portugal — 2.6% | |||||
| Jeronimo Martins SGPS SA | 8,160 | 128,947 | |||
| Russia — 1.8% | |||||
X5 Retail Group NV GDR(1) | 3,030 | 90,900 | |||
| South Korea — 1.1% | |||||
| Amorepacific Corp. | 200 | 56,114 | |||
| Sweden — 3.1% | |||||
Lundin Petroleum AB(1) | 8,230 | 155,091 | |||
| Switzerland — 2.9% | |||||
| Roche Holding AG | 650 | 144,935 | |||
| United Kingdom — 22.4% | |||||
| Admiral Group plc | 1,133 | 26,949 | |||
| Ashtead Group plc | 6,930 | 135,872 | |||
| Auto Trader Group plc | 16,220 | 81,117 | |||
| London Stock Exchange Group plc | 3,420 | 117,590 | |||
| Reckitt Benckiser Group plc | 1,260 | 106,619 | |||
| Shire plc | 2,960 | 172,585 | |||
| St. James's Place plc | 7,290 | 85,740 | |||
| Weir Group plc (The) | 6,660 | 150,660 | |||
| Wolseley plc | 2,280 | 132,510 | |||
| Worldpay Group plc | 32,260 | 108,659 | |||
| 1,118,301 | |||||
TOTAL COMMON STOCKS (Cost $4,874,916) | 4,877,919 | ||||
| EXCHANGE-TRADED FUNDS — 1.0% | |||||
| iShares MSCI ACWI ex US ETF (Cost $53,082) | 1,300 | 51,896 | |||
| TEMPORARY CASH INVESTMENTS — 1.2% | |||||
| State Street Institutional U.S. Government Money Market Fund, Premier Class (Cost $58,586) | 58,586 | 58,586 | |||
TOTAL INVESTMENT SECURITIES — 99.8% (Cost $4,986,584) | 4,988,401 | ||||
| OTHER ASSETS AND LIABILITIES — 0.2% | 9,759 | ||||
| TOTAL NET ASSETS — 100.0% | $ | 4,998,160 | |||
11
| MARKET SECTOR DIVERSIFICATION | ||
(as a % of net assets) | ||
| Financials | 21.6 | % |
| Consumer Discretionary | 21.2 | % |
| Information Technology | 13.5 | % |
| Industrials | 11.8 | % |
| Consumer Staples | 9.5 | % |
| Health Care | 8.2 | % |
| Energy | 7.0 | % |
| Materials | 4.8 | % |
| Exchange-Traded Funds | 1.0 | % |
| Cash and Equivalents* | 1.4 | % |
*Includes temporary cash investments and other assets and liabilities.
| NOTES TO SCHEDULE OF INVESTMENTS | ||
| ADR | - | American Depositary Receipt |
| GDR | - | Global Depositary Receipt |
| (1) | Non-income producing. |
See Notes to Financial Statements.
12
| Statement of Assets and Liabilities |
| NOVEMBER 30, 2016 | |||
| Assets | |||
| Investment securities, at value (cost of $4,986,584) | $ | 4,988,401 | |
| Foreign currency holdings, at value (cost of $9) | 9 | ||
| Receivable for investments sold | 8,601 | ||
| Receivable for capital shares sold | 13 | ||
| Dividends and interest receivable | 7,191 | ||
| 5,004,215 | |||
| Liabilities | |||
| Accrued management fees | 4,966 | ||
| Distribution and service fees payable | 1,089 | ||
| 6,055 | |||
| Net Assets | $ | 4,998,160 | |
| Net Assets Consist of: | |||
| Capital (par value and paid-in surplus) | $ | 5,132,655 | |
| Undistributed net investment income | 16,781 | ||
| Accumulated net realized loss | (152,744 | ) | |
| Net unrealized appreciation | 1,468 | ||
| $ | 4,998,160 | ||
| Net Assets | Shares Outstanding | Net Asset Value Per Share | ||||
| Investor Class, $0.01 Par Value | $2,074,057 | 212,715 | $9.75 | |||
| Institutional Class, $0.01 Par Value | $585,809 | 60,000 | $9.76 | |||
| A Class, $0.01 Par Value | $978,174 | 100,491 | $9.73* | |||
| C Class, $0.01 Par Value | $968,495 | 100,000 | $9.68 | |||
| R Class, $0.01 Par Value | $196,159 | 20,186 | $9.72 | |||
| R6 Class, $0.01 Par Value | $195,466 | 20,000 | $9.77 | |||
*Maximum offering price $10.32 (net asset value divided by 0.9425).
See Notes to Financial Statements.
13
| Statement of Operations |
FOR THE PERIOD ENDED NOVEMBER 30, 2016(1) | |||
| Investment Income (Loss) | |||
| Income: | |||
| Dividends (net of foreign taxes withheld of $6,146) | $ | 62,098 | |
| Interest | 205 | ||
| 62,303 | |||
| Expenses: | |||
| Management fees | 41,473 | ||
| Distribution and service fees: | |||
| A Class | 1,709 | ||
| C Class | 6,800 | ||
| R Class | 684 | ||
| Directors' fees and expenses | 111 | ||
| 50,777 | |||
| Net investment income (loss) | 11,526 | ||
| Realized and Unrealized Gain (Loss) | |||
| Net realized gain (loss) on: | |||
| Investment transactions | (152,744 | ) | |
| Foreign currency transactions | 1,930 | ||
| (150,814 | ) | ||
| Change in net unrealized appreciation (depreciation) on: | |||
| Investments | 1,817 | ||
| Translation of assets and liabilities in foreign currencies | (349 | ) | |
| 1,468 | |||
| Net realized and unrealized gain (loss) | (149,346 | ) | |
| Net Increase (Decrease) in Net Assets Resulting from Operations | $ | (137,820 | ) |
| (1) | March 29, 2016 (fund inception) through November 30, 2016. |
See Notes to Financial Statements.
14
| Statement of Changes in Net Assets |
PERIOD ENDED NOVEMBER 30, 2016(1) | |||
| Increase (Decrease) in Net Assets | |||
| Operations | |||
| Net investment income (loss) | $ | 11,526 | |
| Net realized gain (loss) | (150,814 | ) | |
| Change in net unrealized appreciation (depreciation) | 1,468 | ||
| Net increase (decrease) in net assets resulting from operations | (137,820 | ) | |
| Capital Share Transactions | |||
| Net increase (decrease) in net assets from capital share transactions (Note 5) | 5,135,980 | ||
| Net increase (decrease) in net assets | 4,998,160 | ||
| Net Assets | |||
| End of period | $ | 4,998,160 | |
| Undistributed net investment income | $ | 16,781 | |
| (1) | March 29, 2016 (fund inception) through November 30, 2016. |
See Notes to Financial Statements.
15
| Notes to Financial Statements |
NOVEMBER 30, 2016
1. Organization
American Century World Mutual Funds, Inc. (the corporation) is registered under the Investment Company Act of 1940, as amended (the 1940 Act), as an open-end management investment company and is organized as a Maryland corporation. Focused International Growth Fund (the fund) is one fund in a series issued by the corporation. The fund's investment objective is to seek capital growth.
The fund offers the Investor Class, the Institutional Class, the A Class, the C Class, the R Class and the R6 Class. The A Class may incur an initial sales charge. The A Class and C Class may be subject to a contingent deferred sales charge. The share classes differ principally in their respective sales charges and distribution and shareholder servicing expenses and arrangements. The Institutional Class and R6 Class shareholders do not require the same level of shareholder and administrative services from American Century Investment Management, Inc. (ACIM) (the investment advisor) as shareholders of other classes. In addition, financial intermediaries do not receive any fees for the R6 Class. As a result, the Institutional Class and R6 Class are charged lower unified management fees. All classes of the fund commenced sale on March 29, 2016, the fund's inception date.
2. Significant Accounting Policies
The following is a summary of significant accounting policies consistently followed by the fund in preparation of its financial statements. The fund is an investment company and follows accounting and reporting guidance in accordance with accounting principles generally accepted in the United States of America. This may require management to make certain estimates and assumptions at the date of the financial statements. Actual results could differ from these estimates. Management evaluated the impact of events or transactions occurring through the date the financial statements were issued that would merit recognition or disclosure.
Investment Valuations — The fund determines the fair value of its investments and computes its net asset value per share at the close of regular trading (usually 4 p.m. Eastern time) on the New York Stock Exchange (NYSE) on each day the NYSE is open. The Board of Directors has adopted valuation policies and procedures to guide the investment advisor in the fund’s investment valuation process and to provide methodologies for the oversight of the fund’s pricing function.
Equity securities that are listed or traded on a domestic securities exchange are valued at the last reported sales price or at the official closing price as provided by the exchange. Equity securities traded on foreign securities exchanges are generally valued at the closing price of such securities on the exchange where primarily traded or at the close of the NYSE, if that is earlier. If no last sales price is reported, or if local convention or regulation so provides, the mean of the latest bid and asked prices may be used. Securities traded over-the-counter are valued at the mean of the latest bid and asked prices, the last sales price, or the official closing price. Equity securities initially expressed in local currencies are translated into U.S. dollars at the mean of the appropriate currency exchange rate at the close of the NYSE as provided by an independent pricing service.
Open-end management investment companies are valued at the reported net asset value per share. Repurchase agreements are valued at cost, which approximates fair value.
If the fund determines that the market price for an investment is not readily available or the valuation methods mentioned above do not reflect an investment’s fair value, such investment is valued as determined in good faith by the Board of Directors or its delegate, in accordance with policies and procedures adopted by the Board of Directors. In its determination of fair value, the fund may review several factors including, but not limited to, market information regarding the specific investment or comparable investments and correlation with other investment types, futures indices or general market indicators. Circumstances that may cause the fund to use these procedures to value an investment include, but are not limited to: an investment has been declared in default or is distressed; trading in a security has been suspended during the trading day or a security is not actively trading on its principal exchange; prices received from a regular pricing source are deemed unreliable; or there is a foreign market holiday and no trading occurred.
16
The fund monitors for significant events occurring after the close of an investment’s primary exchange but before the fund’s net asset value per share is determined. Significant events may include, but are not limited to: corporate announcements and transactions; governmental action and political unrest that could impact a specific investment or an investment sector; or armed conflicts, natural disasters and similar events that could affect investments in a specific country or region. The fund also monitors for significant fluctuations between domestic and foreign markets, as evidenced by the U.S. market or such other indicators that the Board of Directors, or its delegate, deems appropriate. If significant fluctuations in foreign markets are identified, the fund may apply a model-derived factor to the closing price of equity securities traded on foreign securities exchanges. The factor is based on observable market data as provided by an independent pricing service.
Security Transactions — Security transactions are accounted for as of the trade date. Net realized gains and losses are determined on the identified cost basis, which is also used for federal income tax purposes.
Investment Income — Dividend income less foreign taxes withheld, if any, is recorded as of the ex-dividend date. Distributions received on securities that represent a return of capital or long-term capital gain are recorded as a reduction of cost of investments and/or as a realized gain. The fund may estimate the components of distributions received that may be considered nontaxable distributions or long-term capital gain distributions for income tax purposes. Interest income is recorded on the accrual basis and includes accretion of discounts and amortization of premiums.
Foreign Currency Translations — All assets and liabilities initially expressed in foreign currencies are translated into U.S. dollars at prevailing exchange rates at period end. The fund may enter into spot foreign currency exchange contracts to facilitate transactions denominated in a foreign currency. Purchases and sales of investment securities, dividend and interest income, spot foreign currency exchange contracts, and expenses are translated at the rates of exchange prevailing on the respective dates of such transactions. Net realized and unrealized foreign currency exchange gains or losses related to investment securities are a component of net realized gain (loss) on investment transactions and change in net unrealized appreciation (depreciation) on investments, respectively.
Repurchase Agreements — The fund may enter into repurchase agreements with institutions that ACIM has determined are creditworthy pursuant to criteria adopted by the Board of Directors. The fund requires that the collateral, represented by securities, received in a repurchase transaction be transferred to the custodian in a manner sufficient to enable the fund to obtain those securities in the event of a default under the repurchase agreement. ACIM monitors, on a daily basis, the securities transferred to ensure the value, including accrued interest, of the securities under each repurchase agreement is equal to or greater than amounts owed to the fund under each repurchase agreement.
Joint Trading Account — Pursuant to an Exemptive Order issued by the Securities and Exchange Commission, the fund, along with certain other funds in the American Century Investments family of funds, may transfer uninvested cash balances into a joint trading account. These balances are invested in one or more repurchase agreements that are collateralized by U.S. Treasury or Agency obligations.
Income Tax Status — It is the fund’s policy to distribute substantially all net investment income and net realized gains to shareholders and to otherwise qualify as a regulated investment company under provisions of the Internal Revenue Code. Accordingly, no provision has been made for income taxes. The fund files U.S. federal, state, local and non-U.S. tax returns as applicable. The fund's tax returns are subject to examination by the relevant taxing authority until expiration of the applicable statute of limitations, which is generally three years from the date of filing but can be longer in certain jurisdictions. At this time, management believes there are no uncertain tax positions which, based on their technical merit, would not be sustained upon examination and for which it is reasonably possible that the total amounts of unrecognized tax benefits will significantly change in the next twelve months.
Multiple Class — All shares of the fund represent an equal pro rata interest in the net assets of the class to which such shares belong, and have identical voting, dividend, liquidation and other rights and the same terms and conditions, except for class specific expenses and exclusive rights to vote on matters affecting only individual classes. Income, non-class specific expenses, and realized and unrealized capital gains and losses of the fund are allocated to each class of shares based on their relative net assets.
Distributions to Shareholders — Distributions from net investment income and net realized gains, if any, are generally declared and paid annually. The fund may make distributions on a more frequent basis to comply with the distribution requirements of the Internal Revenue Code, in all events in a manner consistent with provisions of the 1940 Act.
17
Indemnifications — Under the corporation’s organizational documents, its officers and directors are indemnified against certain liabilities arising out of the performance of their duties to the fund. In addition, in the normal course of business, the fund enters into contracts that provide general indemnifications. The maximum exposure under these arrangements is unknown as this would involve future claims that may be made against a fund. The risk of material loss from such claims is considered by management to be remote.
3. Fees and Transactions with Related Parties
Certain officers and directors of the corporation are also officers and/or directors of American Century Companies, Inc. (ACC). The corporation’s investment advisor, ACIM, the corporation's distributor, American Century Investment Services, Inc. (ACIS), and the corporation’s transfer agent, American Century Services, LLC, are wholly owned, directly or indirectly, by ACC. ACIM owns 97% of the shares of the fund. Related parties do not invest in the fund for the purpose of exercising management or control.
Management Fees — The corporation has entered into a management agreement with ACIM, under which ACIM provides the fund with investment advisory and management services in exchange for a single, unified management fee (the fee) per class. The agreement provides that all expenses of managing and operating the fund, except distribution and service fees, brokerage expenses, taxes, interest, fees and expenses of the independent directors (including legal counsel fees), and extraordinary expenses, will be paid by ACIM. The fee is computed and accrued daily based on each class’s daily net assets and paid monthly in arrears. The annual management fee is 1.23% for the Investor Class, A Class, C Class and R Class, 1.03% for the Institutional Class and 0.88% for the R6 Class.
Distribution and Service Fees — The Board of Directors has adopted a separate Master Distribution and Individual Shareholder Services Plan for each of the A Class, C Class and R Class (collectively the plans), pursuant to Rule 12b-1 of the 1940 Act. The plans provide that the A Class will pay ACIS an annual distribution and service fee of 0.25%. The plans provide that the C Class will pay ACIS an annual distribution and service fee of 1.00%, of which 0.25% is paid for individual shareholder services and 0.75% is paid for distribution services. The plans provide that the R Class will pay ACIS an annual distribution and service fee of 0.50%. The fees are computed and accrued daily based on each class’s daily net assets and paid monthly in arrears. The fees are used to pay financial intermediaries for distribution and individual shareholder services. Fees incurred under the plans during the period March 29, 2016 (fund inception) through November 30, 2016 are detailed in the Statement of Operations.
Directors' Fees and Expenses — The Board of Directors is responsible for overseeing the investment advisor’s management and operations of the fund. The directors receive detailed information about the fund and its investment advisor regularly throughout the year, and meet at least quarterly with management of the investment advisor to review reports about fund operations. The fund’s officers do not receive compensation from the fund.
Acquired Fund Fees and Expenses — The fund may invest in mutual funds, exchange-traded funds, and business development companies (the acquired funds). The fund will indirectly realize its pro rata share of the
fees and expenses of the acquired funds in which it invests. These indirect fees and expenses are not paid out of the fund's assets but are reflected in the return realized by the fund on its investment in the acquired funds.
4. Investment Transactions
Purchases and sales of investment securities, excluding short-term investments, for the period March 29, 2016 (fund inception) through November 30, 2016 were $7,488,528 and $2,407,786, respectively.
18
5. Capital Share Transactions
Transactions in shares of the fund were as follows:
Period ended November 30, 2016(1) | |||||
| Shares | Amount | ||||
| Investor Class/Shares Authorized | 50,000,000 | ||||
| Sold | 220,924 | $ | 2,212,252 | ||
| Redeemed | (8,209 | ) | (83,202 | ) | |
| 212,715 | 2,129,050 | ||||
| Institutional Class/Shares Authorized | 50,000,000 | ||||
| Sold | 60,000 | 600,000 | |||
| A Class/Shares Authorized | 50,000,000 | ||||
| Sold | 100,491 | 1,005,000 | |||
| C Class/Shares Authorized | 50,000,000 | ||||
| Sold | 100,000 | 1,000,000 | |||
| R Class/Shares Authorized | 50,000,000 | ||||
| Sold | 20,203 | 202,104 | |||
| Redeemed | (17 | ) | (174 | ) | |
| 20,186 | 201,930 | ||||
| R6 Class/Shares Authorized | 50,000,000 | ||||
| Sold | 20,000 | 200,000 | |||
| Net increase (decrease) | 513,392 | $ | 5,135,980 | ||
| (1) | March 29, 2016 (fund inception) through November 30, 2016. |
6. Fair Value Measurements
The fund’s investments valuation process is based on several considerations and may use multiple inputs to determine the fair value of the investments held by the fund. In conformity with accounting principles generally accepted in the United States of America, the inputs used to determine a valuation are classified into three broad levels.
| • | Level 1 valuation inputs consist of unadjusted quoted prices in an active market for identical investments. |
| • | Level 2 valuation inputs consist of direct or indirect observable market data (including quoted prices for comparable investments, evaluations of subsequent market events, interest rates, prepayment speeds, credit risk, etc.). These inputs also consist of quoted prices for identical investments initially expressed in local currencies that are adjusted through translation into U.S. dollars. |
| • | Level 3 valuation inputs consist of unobservable data (including a fund’s own assumptions). |
The level classification is based on the lowest level input that is significant to the fair valuation measurement. The valuation inputs are not necessarily an indication of the risks associated with investing in these securities or other financial instruments. There were no significant transfers between levels during the period.
19
The following is a summary of the level classifications as of period end. The Schedule of Investments provides additional information on the fund’s portfolio holdings.
| Level 1 | Level 2 | Level 3 | ||||||
| Assets | ||||||||
| Investment Securities | ||||||||
| Common Stocks | ||||||||
| China | $ | 167,355 | $ | 179,803 | — | |||
| India | 189,603 | — | — | |||||
| Ireland | 78,243 | — | — | |||||
| Mexico | 117,173 | 112,634 | — | |||||
| Other Countries | — | 4,033,108 | — | |||||
| Exchange-Traded Funds | 51,896 | — | — | |||||
| Temporary Cash Investments | 58,586 | — | — | |||||
| $ | 662,856 | $ | 4,325,545 | — | ||||
7. Risk Factors
There are certain risks involved in investing in foreign securities. These risks include those resulting from future adverse political, social and economic developments, fluctuations in currency exchange rates, the possible imposition of exchange controls, and other foreign laws or restrictions. Investing in emerging markets may accentuate these risks.
8. Federal Tax Information
On December 20, 2016, the fund declared and paid the following per-share distributions from net investment income to shareholders of record on December 19, 2016:
| Investor Class | Institutional Class | A Class | C Class | R Class | R6 Class |
| $0.0750 | $0.0946 | $0.0506 | — | $0.0262 | $0.1092 |
The book-basis character of distributions made during the year from net investment income or net realized gains may differ from their ultimate characterization for federal income tax purposes. These differences reflect the differing character of certain income items and net realized gains and losses for financial statement and tax purposes, and may result in reclassification among certain capital accounts on the financial statements. There were no distributions paid by the fund during the period March 29, 2016 (fund inception) through November 30, 2016.
20
As of November 30, 2016, the federal tax cost of investments and the components of distributable earnings on a tax-basis were as follows:
| Federal tax cost of investments | $ | 4,998,167 | |
| Gross tax appreciation of investments | $ | 246,591 | |
| Gross tax depreciation of investments | (256,357 | ) | |
| Net tax appreciation (depreciation) of investments | (9,766 | ) | |
| Net tax appreciation (depreciation) on translation of assets and liabilities in foreign currencies | (349 | ) | |
| Net tax appreciation (depreciation) | $ | (10,115 | ) |
| Undistributed ordinary income | $ | 26,012 | |
Accumulated short-term capital losses | $ | (150,392 | ) |
The difference between book-basis and tax-basis unrealized appreciation (depreciation) is attributable primarily to the realization to ordinary income for tax purposes of unrealized gains on investments in passive foreign investment companies.
Accumulated capital losses represent net capital loss carryovers that may be used to offset future realized capital gains for federal income tax purposes. The capital loss carryovers may be carried forward for an unlimited period. Future capital loss carryover utilization in any given year may be subject to Internal Revenue Code limitations.
9. Recently Issued Accounting Guidance
In October 2016, the Securities and Exchange Commission adopted new rules and forms as well as amendments to its rules and forms to modernize the reporting and disclosure of information by registered investment companies. The amendments to Regulation S-X will require standardized, enhanced disclosure about derivatives in investment company financial statements, as well as other provisions. Compliance with the amendments is effective on August 1, 2017. Management is currently evaluating the impact that adopting the amendments will have on the financial statement disclosures.
21
| Financial Highlights |
| For a Share Outstanding Throughout the Period Indicated | ||||||||||||
| Per-Share Data | Ratios and Supplemental Data | |||||||||||
| Income From Investment Operations: | Ratio to Average Net Assets of: | |||||||||||
| Net Asset Value, Beginning of Period | Net Investment Income (Loss)(1) | Net Realized and Unrealized Gain (Loss) | Total From Investment Operations | Net Asset Value, End of Period | Total Return(2) | Operating Expenses | Net Investment Income (Loss) | Portfolio Turnover Rate | Net Assets, End of Period (in thousands) | |||
| Investor Class | ||||||||||||
2016(3) | $10.00 | 0.04 | (0.29) | (0.25) | $9.75 | (2.50)% | 1.23%(4) | 0.56%(4) | 47% | $2,074 | ||
| Institutional Class | ||||||||||||
2016(3) | $10.00 | 0.05 | (0.29) | (0.24) | $9.76 | (2.40)% | 1.03%(4) | 0.76%(4) | 47% | $586 | ||
| A Class | ||||||||||||
2016(3) | $10.00 | 0.02 | (0.29) | (0.27) | $9.73 | (2.70)% | 1.48%(4) | 0.31%(4) | 47% | $978 | ||
| C Class | ||||||||||||
2016(3) | $10.00 | (0.03) | (0.29) | (0.32) | $9.68 | (3.20)% | 2.23%(4) | (0.44)%(4) | 47% | $968 | ||
| R Class | ||||||||||||
2016(3) | $10.00 | —(5) | (0.28) | (0.28) | $9.72 | (2.80)% | 1.73%(4) | 0.06%(4) | 47% | $196 | ||
| R6 Class | ||||||||||||
2016(3) | $10.00 | 0.06 | (0.29) | (0.23) | $9.77 | (2.30)% | 0.88%(4) | 0.91%(4) | 47% | $195 | ||
| Notes to Financial Highlights | |
| (1) | Computed using average shares outstanding throughout the period. |
| (2) | Total returns are calculated based on the net asset value of the last business day and do not reflect applicable sales charges, if any. Total returns for periods less than one year are not annualized. |
| (3) | March 29, 2016 (fund inception) through November 30, 2016. |
| (4) | Annualized. |
| (5) | Per-share amount was less than $0.005. |
See Notes to Financial Statements.
| Report of Independent Registered Public Accounting Firm |
To the Board of Directors and Shareholders of American Century World Mutual Funds, Inc.:
We have audited the accompanying statement of assets and liabilities, including the schedule of investments, of Focused International Growth Fund (the “Fund”), one of the funds constituting American Century World Mutual Funds, Inc., as of November 30, 2016, and the related statement of operations, changes in net assets, and the financial highlights for the period from March 29, 2016 (commencement date) through November 30, 2016. These financial statements and financial highlights are the responsibility of the Fund’s management. Our responsibility is to express an opinion on these financial statements and financial highlights based on our audits.
We conducted our audits in accordance with the standards of the Public Company Accounting Oversight Board (United States). Those standards require that we plan and perform the audit to obtain reasonable assurance about whether the financial statements and financial highlights are free of material misstatement. The Fund is not required to have, nor were we engaged to perform, an audit of its internal control over financial reporting. Our audits included consideration of internal control over financial reporting as a basis for designing audit procedures that are appropriate in the circumstances, but not for the purpose of expressing an opinion on the effectiveness of the Fund’s internal control over financial reporting. Accordingly, we express no such opinion. An audit also includes examining, on a test basis, evidence supporting the amounts and disclosures in the financial statements, assessing the accounting principles used and significant estimates made by management, as well as evaluating the overall financial statement presentation. Our procedures included confirmation of securities owned as of November 30, 2016, by correspondence with the custodian and brokers; when replies were not received from brokers, we performed other auditing procedures. We believe that our audits provide a reasonable basis for our opinion.
In our opinion, the financial statements and financial highlights referred to above present fairly, in all material respects, the financial position of Focused International Growth Fund of American Century World Mutual Funds, Inc. as of November 30, 2016, and the results of its operations, the changes in its net assets, and the financial highlights for the period from March 29, 2016 (commencement date) through November 30, 2016, in conformity with accounting principles generally accepted in the United States of America.
DELOITTE & TOUCHE LLP
Kansas City, Missouri
January 17, 2017
23
| Management |
The Board of Directors
The individuals listed below serve as directors of the funds. Each director will continue to serve in this capacity until death, retirement, resignation or removal from office. The board has adopted a mandatory retirement age for directors who are not “interested persons,” as that term is defined in the Investment Company Act (independent directors). Independent directors shall retire by December 31 of the year in which they reach their 75th birthday.
Mr. Thomas is an “interested person” because he currently serves as President and Chief Executive Officer of American Century Companies, Inc. (ACC), the parent company of American Century Investment Management, Inc. (ACIM or the advisor). The other directors (more than three-fourths of the total number) are independent. They are not employees, directors or officers of, and have no financial interest in, ACC or any of its wholly owned, direct or indirect, subsidiaries, including ACIM, American Century Investment Services, Inc. (ACIS) and American Century Services, LLC (ACS), and they do not have any other affiliations, positions or relationships that would cause them to be considered “interested persons” under the Investment Company Act. The directors serve in this capacity for seven (in the case of Mr. Thomas, 15) registered investment companies in the American Century Investments family of funds.
The following table presents additional information about the directors. The mailing address for each director is 4500 Main Street, Kansas City, Missouri 64111.
| Name (Year of Birth) | Position(s) Held with Funds | Length of Time Served | Principal Occupation(s) During Past 5 Years | Number of American Century Portfolios Overseen by Director | Other Directorships Held During Past 5 Years |
| Independent Directors | |||||
| Barry Fink (1955) | Director | Since 2012 | Retired; Executive Vice President, ACC (September 2007 to February 2013); President, ACS (October 2007 to February 2013); Chief Operating Officer, ACC (September 2007 to November 2012) | 81 | None |
| Andrea C. Hall (1945) | Director | Since 1997 | Retired | 81 | None |
| Jan M. Lewis (1957) | Director | Since 2011 | Retired; President and Chief Executive Officer, Catholic Charities of Northeast Kansas (human services organization) (2006 to 2013) | 81 | None |
| James A. Olson (1942) | Director and Chairman of the Board | Since 2007 (Chairman since 2014) | Member, Plaza Belmont LLC (private equity fund manager) (1999 to present) | 81 | Saia, Inc. (2002 to 2012) and EPR Properties (2003 to 2013) |
| M. Jeannine Strandjord (1945) | Director | Since 1994 | Retired | 81 | Euronet Worldwide Inc.; MGP Ingredients, Inc.; and DST Systems Inc. (1996 to 2012) |
24
| Name (Year of Birth) | Position(s) Held with Funds | Length of Time Served | Principal Occupation(s) During Past 5 Years | Number of American Century Portfolios Overseen by Director | Other Directorships Held During Past 5 Years |
| Independent Directors | |||||
| John R. Whitten (1946) | Director | Since 2008 | Retired | 81 | Rudolph Technologies, Inc. |
| Stephen E. Yates (1948) | Director | Since 2012 | Retired | 81 | None |
| Interested Director | |||||
| Jonathan S. Thomas (1963) | Director and President | Since 2007 | President and Chief Executive Officer, ACC (March 2007 to present). Also serves as Chief Executive Officer, ACS; Executive Vice President, ACIM; Director, ACC, ACIM and other ACC subsidiaries | 126 | BioMed Valley Discoveries, Inc. |
The Statement of Additional Information has additional information about the fund's directors and is available without charge, upon request, by calling 1-800-345-2021.
25
Officers
The following table presents certain information about the executive officers of the funds. Each officer serves as an officer for each of the 15 investment companies in the American Century family of funds, unless otherwise noted. No officer is compensated for his or her service as an officer of the funds. The listed officers are interested persons of the funds and are appointed or re-appointed on an annual basis. The mailing address for each officer listed below is 4500 Main Street, Kansas City, Missouri 64111.
| Name (Year of Birth) | Offices with the Funds | Principal Occupation(s) During the Past Five Years |
| Jonathan S. Thomas (1963) | Director and President since 2007 | President and Chief Executive Officer, ACC (March 2007 to present). Also serves as Chief Executive Officer, ACS; Executive Vice President, ACIM; Director, ACC, ACIM and other ACC subsidiaries |
| Amy D. Shelton (1964) | Chief Compliance Officer and Vice President since 2014 | Chief Compliance Officer, American Century funds, (March 2014 to present); Chief Compliance Officer, ACIM (February 2014 to present); Chief Compliance Officer, ACIS (October 2009 to present); Vice President, Client Interactions and Marketing, ACIS (February 2013 to January 2014); Director, Client Interactions and Marketing, ACIS (June 2007 to January 2013). Also serves as Vice President, ACIS |
| Charles A. Etherington (1957) | General Counsel since 2007 and Senior Vice President since 2006 | Attorney, ACC (February 1994 to present); Vice President, ACC (November 2005 to present); General Counsel, ACC (March 2007 to present). Also serves as General Counsel, ACIM, ACS, ACIS and other ACC subsidiaries; and Senior Vice President, ACIM and ACS |
| C. Jean Wade (1964) | Vice President,Treasurer and Chief Financial Officer since 2012 | Vice President, ACS (February 2000 to present) |
| Robert J. Leach (1966) | Vice President since 2006 and Assistant Treasurer since 2012 | Vice President, ACS (February 2000 to present) |
| David H. Reinmiller (1963) | Vice President since 2000 | Attorney, ACC (January 1994 to present); Associate General Counsel, ACC (January 2001 to present). Also serves as Vice President, ACIM and ACS |
| Ward D. Stauffer (1960) | Secretary since 2005 | Attorney, ACC (June 2003 to present) |
26
| Additional Information |
Retirement Account Information
As required by law, distributions you receive from certain IRAs are subject to federal income tax withholding, unless you elect not to have withholding apply. Tax will be withheld on the total amount withdrawn even though you may be receiving amounts that are not subject to withholding, such as nondeductible contributions. In such case, excess amounts of withholding could occur. You may adjust your withholding election so that a greater or lesser amount will be withheld.
If you don’t want us to withhold on this amount, you must notify us to not withhold the federal income tax. You may notify us in writing or in certain situations by telephone or through other electronic means. For systematic withdrawals, your withholding election will remain in effect until revoked or changed by filing a new election. You have the right to revoke your election at any time.
Remember, even if you elect not to have income tax withheld, you are liable for paying income tax on the taxable portion of your withdrawal. If you elect not to have income tax withheld or you don’t have enough income tax withheld, you may be responsible for payment of estimated tax. You may incur penalties under the estimated tax rules if your withholding and estimated tax payments are not sufficient. You can reduce or defer the income tax on a distribution by directly or indirectly rolling such distribution over to another IRA or eligible plan. You should consult your tax advisor for additional information.
State tax will be withheld if, at the time of your distribution, your address is within one of the mandatory withholding states and you have federal income tax withheld (or as otherwise required by state law). State taxes will be withheld from your distribution in accordance with the respective state rules.
Distributions you receive from 403(b), 457 and qualified plans are subject to special tax and withholding rules. Your plan administrator or plan sponsor is required to provide you with a special tax notice explaining those rules at the time you request a distribution. If applicable, federal and/or state taxes may be withheld from your distribution amount.
Proxy Voting Policies
A description of the policies that the fund's investment advisor uses in exercising the voting rights associated with the securities purchased and/or held by the fund is available without charge, upon request, by calling 1-800-345-2021. It is also available on the "About Us" page of American Century Investments’ website at americancentury.com and on the Securities and Exchange Commission’s website at sec.gov. Information regarding how the investment advisor voted proxies relating to portfolio securities during the most recent 12-month period ended June 30 is available on the "About Us" page at americancentury.com. It is also available at sec.gov.
Quarterly Portfolio Disclosure
The fund files its complete schedule of portfolio holdings with the Securities and Exchange Commission (SEC) for the first and third quarters of each fiscal year on Form N-Q. The fund’s Forms N-Q are available on the SEC’s website at sec.gov, and may be reviewed and copied at the SEC’s Public Reference Room in Washington, DC. Information on the operation of the Public Reference Room may be obtained by calling 1-800-SEC-0330. The fund also makes its complete schedule of portfolio holdings for the most recent quarter of its fiscal year available on its website at americancentury.com and, upon request, by calling 1-800-345-2021.
27
Other Tax Information
The following information is provided pursuant to provisions of the Internal Revenue Code.
The fund hereby designates up to the maximum amount allowable as qualified dividend income for the fiscal year ended November 30, 2016.
For the fiscal year ended November 30, 2016, the fund intends to pass through to shareholders foreign source income of $68,244 and foreign taxes paid of $6,097, or up to the maximum amount allowable, as a foreign tax credit. Foreign source income and foreign tax expense per outstanding share on November 30, 2016 are $0.1329 and $0.0119, respectively.
28
| ||
| Contact Us | americancentury.com | |
| Automated Information Line | 1-800-345-8765 | |
| Investor Services Representative | 1-800-345-2021 or 816-531-5575 | |
| Investors Using Advisors | 1-800-378-9878 | |
| Business, Not-For-Profit, Employer-Sponsored Retirement Plans | 1-800-345-3533 | |
| Banks and Trust Companies, Broker-Dealers, Financial Professionals, Insurance Companies | 1-800-345-6488 | |
| Telecommunications Relay Service for the Deaf | 711 | |
| American Century World Mutual Funds, Inc. | ||
Investment Advisor: American Century Investment Management, Inc. Kansas City, Missouri | ||
| This report and the statements it contains are submitted for the general information of our shareholders. The report is not authorized for distribution to prospective investors unless preceded or accompanied by an effective prospectus. | ||
| ©2017 American Century Proprietary Holdings, Inc. All rights reserved. CL-ANN-91034 1701 | ||
| Annual Report | |
| November 30, 2016 | |
| Global Growth Fund | |
| Table of Contents |
| President’s Letter | 2 | |
| Performance | 3 | |
| Portfolio Commentary | ||
| Fund Characteristics | ||
| Shareholder Fee Example | ||
| Schedule of Investments | ||
| Statement of Assets and Liabilities | ||
| Statement of Operations | ||
| Statement of Changes in Net Assets | ||
| Notes to Financial Statements | ||
| Financial Highlights | ||
| Report of Independent Registered Public Accounting Firm | ||
| Management | ||
| Approval of Management Agreement | ||
| Additional Information | ||
Any opinions expressed in this report reflect those of the author as of the date of the report, and do not necessarily represent the opinions of American Century Investments® or any other person in the American Century Investments organization. Any such opinions are subject to change at any time based upon market or other conditions and American Century Investments disclaims any responsibility to update such opinions. These opinions may not be relied upon as investment advice and, because investment decisions made by American Century Investments funds are based on numerous factors, may not be relied upon as an indication of trading intent on behalf of any American Century Investments fund. Security examples are used for representational purposes only and are not intended as recommendations to purchase or sell securities. Performance information for comparative indices and securities is provided to American Century Investments by third party vendors. To the best of American Century Investments’ knowledge, such information is accurate at the time of printing.
| President’s Letter |
Jonathan ThomasDear Investor:
Thank you for reviewing this annual report for the period ended November 30, 2016. Annual reports help convey important information about fund returns, including market factors that affected performance during the reporting period. For additional, updated investment and market insights, we encourage you to visit our website, americancentury.com.
A Year of Surprises: China, Oil, Brexit, Trump
A year ago, we predicted increased market volatility in 2016. Volatility occurred, but not for the reasons we suggested. We expected the Federal Reserve (the Fed)—which in December 2015 raised its short-term interest rate target for the first time since 2006—to raise it three to four more times in 2016 as U.S. economic growth improved. We thought the shift in rate policy would contribute to unsettled conditions as inflation expectations grew, borrowing costs increased, the U.S. dollar strengthened, and bond prices weakened.
Instead, global and U.S. growth largely languished in the first half of 2016 as concerns about China’s growth and plummeting oil prices affected the global economic outlook. The Fed left its target unchanged for 11 months to avoid putting further stress on the global economy and markets. Meanwhile, years of low interest rates, market globalization, and corporate cost-cutting had benefited some segments of the world’s developed democracies much more than others. The others spoke up in June and November, voting for the U.K. to exit the European Union, then propelling Donald Trump to victory. These unexpected populist political results unsettled the markets.
Despite these challenges, and with the continued support of central bank monetary stimulus, broad market index returns for the full reporting period were mostly positive, though they skewed negative in non-U.S. developed equity markets. Looking ahead, Trump’s win shifted the market outlook, unleashing potentially far-reaching ramifications that are still unfolding. What’s clear is that Trump’s policy proposals and his unpredictable nature make uncertainty more certain, which could trigger further bouts of short-term market volatility. In this unsettled environment, we strongly believe in staying the course and remaining focused on longer-term goals, using disciplined, actively managed, diversified, risk-aware strategies. We appreciate your continued trust in us.
Sincerely,
Jonathan Thomas
President and Chief Executive Officer
American Century Investments
2
| Performance |
| Total Returns as of November 30, 2016 | ||||||
Average Annual Returns | ||||||
Ticker Symbol | 1 year | 5 years | 10 years | Since Inception | Inception Date | |
| Investor Class | TWGGX | -3.24% | 9.07% | 4.57% | — | 12/1/98 |
| MSCI World Index | — | 3.15% | 9.87% | 3.79% | — | — |
| Institutional Class | AGGIX | -3.07% | 9.30% | 4.78% | — | 8/1/00 |
| A Class | AGGRX | 2/5/99 | ||||
| No sales charge | -3.52% | 8.80% | 4.31% | — | ||
| With sales charge | -9.08% | 7.53% | 3.69% | — | ||
| C Class | AGLCX | -4.23% | 7.98% | 3.53% | — | 3/1/02 |
| R Class | AGORX | -3.73% | 8.55% | 4.05% | — | 7/29/05 |
| R6 Class | AGGDX | -2.91% | — | — | 5.32% | 7/26/13 |
Average annual returns since inception are presented when ten years of performance history is not available.
Prior to September 4, 2007, the A Class was referred to as the Advisor Class and did not have a front-end sales charge. Performance prior to that date has been adjusted to reflect this charge.
Sales charges include initial sales charges and contingent deferred sales charges (CDSCs), as applicable. A Class shares have a 5.75% maximum initial sales charge and may be subject to a maximum CDSC of 1.00%. C Class shares redeemed within 12 months of purchase are subject to a maximum CDSC of 1.00%. The SEC requires that mutual funds provide performance information net of maximum sales charges in all cases where charges could be applied.
Data presented reflect past performance. Past performance is no guarantee of future results. Current performance may be higher or lower than the performance shown. Total returns for periods less than one year are not annualized. Investment return and principal value will fluctuate, and redemption value may be more or less than original cost. Data assumes reinvestment of dividends and capital gains, and none of the charts reflect the deduction of taxes that a shareholder would pay on fund distributions or the redemption of fund shares. To obtain performance data current to the most recent month end, please call 1-800-345-2021 or visit americancentury.com. For additional information about the fund, please consult the prospectus.
3
| Growth of $10,000 Over 10 Years |
| $10,000 investment made November 30, 2006 |
| Performance for other share classes will vary due to differences in fee structure. |
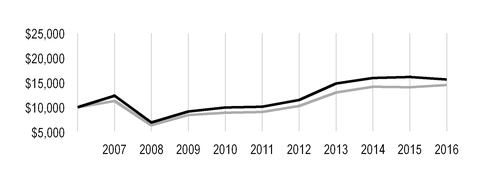
| Value on November 30, 2016 | |
| Investor Class — $15,644 | |
| MSCI World Index — $14,505 | |
Total Annual Fund Operating Expenses | |||||
Investor Class | Institutional Class | A Class | C Class | R Class | R6 Class |
| 1.08% | 0.88% | 1.33% | 2.08% | 1.58% | 0.73% |
The total annual fund operating expenses shown is as stated in the fund’s prospectus current as of the date of this report. The prospectus may vary from the expense ratio shown elsewhere in this report because it is based on a different time period, includes acquired fund fees and expenses, and, if applicable, does not include fee waivers or expense reimbursements.
Data presented reflect past performance. Past performance is no guarantee of future results. Current performance may be higher or lower than the performance shown. Total returns for periods less than one year are not annualized. Investment return and principal value will fluctuate, and redemption value may be more or less than original cost. Data assumes reinvestment of dividends and capital gains, and none of the charts reflect the deduction of taxes that a shareholder would pay on fund distributions or the redemption of fund shares. To obtain performance data current to the most recent month end, please call 1-800-345-2021 or visit americancentury.com. For additional information about the fund, please consult the prospectus.
4
| Portfolio Commentary |
Portfolio Managers: Keith Creveling, Brent Puff, and Ted Harlan
Performance Summary
Global Growth declined -3.24%* for the 12 months ended November 30, 2016, underperforming its benchmark, the MSCI World Index, which returned 3.15%. During the majority of this year, stock market performance was dominated by exogenous events such as monetary policy and political risk rather than the direction and change in corporate earnings. Such a market environment, which runs contrary to our approach, combined with some disappointing stock selection to drive underperformance this year. In addition, the underperformance of growth stocks compared with value stocks added to headwinds on a relative basis.
On a sector basis, security selection in the financials and consumer discretionary sectors weighed on relative results, while materials and real estate sector investments contributed favorably to performance. Geographically, the fund’s underperformance was driven primarily by stock selection in the U.S. and the U.K. Positioning in Italy also dampened results. Conversely, positioning in select emerging markets countries not represented in the benchmark helped to bolster relative performance.
Financial Services Sector Drove Underperformance
Leading sector detraction came primarily from the financials sector. Our underweight to U.S. banks such as JPMorgan Chase & Co. and Bank of America negatively impacted relative returns. Those banks performed strongly, especially in November, as investors weighed the impact of the U.S. elections on the future trajectory of U.S. interest rates. The portfolio was also negatively impacted by the weak performance of two European banks: Royal Bank of Scotland and Intesa Sanpaolo. The stock of U.K.-based Royal Bank of Scotland declined on growing concern about the impact of slowing U.K. economic growth on its earnings. In addition, the bank’s profits remain pressured by higher-than-expected costs associated with ongoing restructuring of the investment banking division and repayment of debt from the 2008 financial crisis. Negative interest rates and uncertainty around the health of the entire Italian banking sector also weighed heavily on Italy-based Intesa Sanpaolo’s stock price. We have liquidated our positions in both stocks. We also exited our position in U.S.-based peer-to-peer lender LendingClub. The stock declined following a breakdown in corporate governance.
Another area of relative weakness was the consumer discretionary sector, where U.S.-based Harman International Industries led declines. Shares were weaker after the company reported earnings that missed consensus expectations. Earnings have been negatively impacted by the strong U.S. dollar and weak demand at Harman’s professional division. We have since exited this position.
Materials Holdings Contributed to Relative Gains
The fund’s outperformance in the materials sector was driven by U.S.-based Martin Marietta Materials. The manufacturer of cement and aggregates continued to benefit from volume and pricing growth, as construction activity in the U.S. remains robust. U.S. president-elect Donald Trump’s promise of increased infrastructure spending in the U.S. further lifted the stock. Mr. Trump has pledged to upgrade roads, bridges, tunnels, and other key infrastructure throughout the U.S.
*All fund returns referenced in this commentary are for Investor Class shares. Performance for other share classes will vary due to differences in fee structure; when Investor Class performance exceeds that of the fund's benchmark, other share classes may not. See page 3 for returns for all share classes.
5
Top performers also included U.S.-based Ulta Salon, Cosmetics & Fragrance, a chain of beauty stores. Gains in the stock were fueled by strong quarter-over-quarter increases in comparable store sales and earnings per share. Ulta currently has approximately 950 stores and plans to expand to 1,400-1,700 stores in the U.S.
Other significant contributors to relative performance included energy company Pioneer Natural Resources, which rallied with improving oil prices. The U.S.-based oil and gas exploration and production firm also benefited from strong financial results. Other positives for the stock included declining production costs and slightly better-than-expected production volumes.
U.S.-based WhiteWave Foods also contributed substantially to the fund’s results. The consumer packaged food and beverage company’s stock rallied after France-based dairy food giant Danone announced its acquisition of the natural and organic foods manufacturer. We sold our position in the stock to lock in gains.
Outlook
We will continue to focus on companies we believe demonstrate improving, sustainable earnings growth. A number of these companies are in the information technology sector, which ended the period as the fund’s largest overweight. Key holdings in this sector included U.S.-based Alphabet and Facebook, and other companies we think are well positioned to benefit from the transition from offline and traditional advertising to online advertising. Other sector overweights included consumer discretionary, where we remain focused on companies that are benefiting from secular growth trends and long-lasting and durable growth drivers. Examples include Ulta Salon, Cosmetics & Fragrance and U.S.-based The Home Depot. Our overweight position in the health care sector was driven largely by U.S.-based Celgene and other companies we believe will benefit from the accelerating pace of drug innovation. Conversely, we continued to underweight the consumer staples sector based on fewer sector companies that fit our earnings acceleration model in the current uncertain investment environment. Regionally, we maintained overweight positions in the U.S. and Europe based on our ability to identify companies we believe are positioned for ongoing profit acceleration. Exposure to Japan remained limited due to fewer investment opportunities in that market that fit our process. Elsewhere, we remain selective toward emerging markets stocks. Our investments in companies such as Tencent Holdings of China, should continue to deliver revenue and earnings growth despite the perceived potential risk presented by a Trump presidency.
6
| Fund Characteristics |
| NOVEMBER 30, 2016 | |
Top Ten Holdings | % of net assets |
Alphabet, Inc.(1) | 3.8% |
| Facebook, Inc., Class A | 3.1% |
| Pioneer Natural Resources Co. | 2.5% |
| Martin Marietta Materials, Inc. | 2.5% |
| Adobe Systems, Inc. | 2.4% |
| Home Depot, Inc. (The) | 2.2% |
| EQT Corp. | 2.1% |
| Celgene Corp. | 2.1% |
| Intercontinental Exchange, Inc. | 2.1% |
| Tencent Holdings Ltd. | 2.0% |
(1)Includes all classes of the issuer held by the fund. | |
Types of Investments in Portfolio | % of net assets |
| Domestic Common Stocks | 61.2% |
| Foreign Common Stocks | 38.5% |
| Total Common Stocks | 99.7% |
| Temporary Cash Investments | 0.3% |
| Other Assets and Liabilities | —(2) |
(2)Category is less than 0.05% of total net assets. | |
Investments by Country | % of net assets |
| United States | 61.2% |
| France | 8.7% |
| United Kingdom | 5.1% |
| China | 3.6% |
| Hong Kong | 3.1% |
| Japan | 2.9% |
| Switzerland | 2.5% |
| Germany | 2.1% |
| Other Countries | 10.5% |
Cash and Equivalents(3) | 0.3% |
(3)Includes temporary cash investments and other assets and liabilities.
7
| Shareholder Fee Example |
Fund shareholders may incur two types of costs: (1) transaction costs, including sales charges (loads) on purchase payments and redemption/exchange fees; and (2) ongoing costs, including management fees; distribution and service (12b-1) fees; and other fund expenses. This example is intended to help you understand your ongoing costs (in dollars) of investing in your fund and to compare these costs with the ongoing cost of investing in other mutual funds.
The example is based on an investment of $1,000 made at the beginning of the period and held for the entire period from June 1, 2016 to November 30, 2016.
Actual Expenses
The table provides information about actual account values and actual expenses for each class. You may use the information, together with the amount you invested, to estimate the expenses that you paid over the period. First, identify the share class you own. Then simply divide your account value by $1,000 (for example, an $8,600 account value divided by $1,000 = 8.6), then multiply the result by the number under the heading “Expenses Paid During Period” to estimate the expenses you paid on your account during this period.
If you hold Investor Class shares of any American Century Investments fund, or Institutional Class shares of the American Century Diversified Bond Fund, in an American Century Investments account (i.e., not a financial intermediary or retirement plan account), American Century Investments may charge you a $12.50 semiannual account maintenance fee if the value of those shares is less than $10,000. We will redeem shares automatically in one of your accounts to pay the $12.50 fee. In determining your total eligible investment amount, we will include your investments in all personal accounts (including American Century Investments Brokerage accounts) registered under your Social Security number. Personal accounts include individual accounts, joint accounts, UGMA/UTMA accounts, personal trusts, Coverdell Education Savings Accounts and IRAs (including traditional, Roth, Rollover, SEP-, SARSEP- and SIMPLE-IRAs), and certain other retirement accounts. If you have only business, business retirement, employer-sponsored or American Century Investments Brokerage accounts, you are currently not subject to this fee. If you are subject to the Account Maintenance Fee, your account value could be reduced by the fee amount.
Hypothetical Example for Comparison Purposes
The table also provides information about hypothetical account values and hypothetical expenses based on the actual expense ratio of each class of your fund and an assumed rate of return of 5% per year before expenses, which is not the actual return of a fund’s share class. The hypothetical account values and expenses may not be used to estimate the actual ending account balance or expenses you paid for the period. You may use this information to compare the ongoing costs of investing in your fund and other funds. To do so, compare this 5% hypothetical example with the 5% hypothetical examples that appear in the shareholder reports of the other funds.
Please note that the expenses shown in the table are meant to highlight your ongoing costs only and do not reflect any transactional costs, such as sales charges (loads) or redemption/exchange fees. Therefore, the table is useful in comparing ongoing costs only, and will not help you determine the relative total costs of owning different funds. In addition, if these transactional costs were included, your costs would have been higher.
8
| Beginning Account Value 6/1/16 | Ending Account Value 11/30/16 | Expenses Paid During Period(1) 6/1/16 - 11/30/16 | Annualized Expense Ratio(1) | |
Actual | ||||
| Investor Class | $1,000 | $985.50 | $5.36 | 1.08% |
| Institutional Class | $1,000 | $986.60 | $4.37 | 0.88% |
| A Class | $1,000 | $984.20 | $6.60 | 1.33% |
| C Class | $1,000 | $980.20 | $10.30 | 2.08% |
| R Class | $1,000 | $983.10 | $7.83 | 1.58% |
| R6 Class | $1,000 | $987.50 | $3.63 | 0.73% |
Hypothetical | ||||
| Investor Class | $1,000 | $1,019.60 | $5.45 | 1.08% |
| Institutional Class | $1,000 | $1,020.60 | $4.45 | 0.88% |
| A Class | $1,000 | $1,018.35 | $6.71 | 1.33% |
| C Class | $1,000 | $1,014.60 | $10.48 | 2.08% |
| R Class | $1,000 | $1,017.10 | $7.97 | 1.58% |
| R6 Class | $1,000 | $1,021.35 | $3.69 | 0.73% |
| (1) | Expenses are equal to the class's annualized expense ratio listed in the table above, multiplied by the average account value over the period, multiplied by 183, the number of days in the most recent fiscal half-year, divided by 366, to reflect the one-half year period. |
9
| Schedule of Investments |
NOVEMBER 30, 2016
| Shares | Value | ||||
| COMMON STOCKS — 99.7% | |||||
| Austria — 0.5% | |||||
| Erste Group Bank AG | 88,880 | $ | 2,471,793 | ||
| Belgium — 0.6% | |||||
| UCB SA | 48,290 | 3,106,635 | |||
| Brazil — 0.5% | |||||
| BM&FBovespa SA - Bolsa de Valores Mercadorias e Futuros | 235,300 | 1,155,611 | |||
| CCR SA | 281,800 | 1,225,670 | |||
| 2,381,281 | |||||
| China — 3.6% | |||||
Alibaba Group Holding Ltd. ADR(1) | 66,430 | 6,245,749 | |||
| China Mobile Ltd. | 117,500 | 1,282,328 | |||
| Tencent Holdings Ltd. | 398,500 | 9,951,582 | |||
| 17,479,659 | |||||
| Denmark — 1.0% | |||||
| Pandora A/S | 43,586 | 5,187,220 | |||
| France — 8.7% | |||||
ArcelorMittal(1) | 389,580 | 2,943,124 | |||
| Danone SA | 57,570 | 3,621,883 | |||
| Engie SA | 104,150 | 1,285,966 | |||
| Kering | 23,340 | 5,071,063 | |||
| Legrand SA | 61,460 | 3,436,049 | |||
| Sodexo SA | 44,690 | 4,888,035 | |||
| Thales SA | 33,190 | 3,240,803 | |||
| TOTAL SA | 174,968 | 8,336,445 | |||
| Valeo SA | 80,580 | 4,493,036 | |||
| Veolia Environnement SA | 85,490 | 1,477,340 | |||
| Vivendi SA | 198,190 | 3,778,829 | |||
| 42,572,573 | |||||
| Germany — 2.1% | |||||
| Fresenius Medical Care AG & Co. KGaA | 66,273 | 5,169,621 | |||
| Symrise AG | 49,290 | 2,983,426 | |||
Zalando SE(1) | 53,720 | 2,002,124 | |||
| 10,155,171 | |||||
| Hong Kong — 3.1% | |||||
| AIA Group Ltd. | 1,450,800 | 8,847,140 | |||
| Hang Seng Bank Ltd. | 125,000 | 2,368,981 | |||
| Melco Crown Entertainment Ltd. ADR | 111,790 | 2,197,791 | |||
| Sands China Ltd. | 380,000 | 1,871,463 | |||
| 15,285,375 | |||||
| Hungary — 0.2% | |||||
| OTP Bank plc | 43,320 | 1,167,630 | |||
| India — 1.7% | |||||
| HDFC Bank Ltd. | 255,050 | 5,082,820 | |||
| Tata Motors Ltd. ADR | 93,280 | 3,084,770 | |||
| 8,167,590 | |||||
10
| Shares | Value | ||||
| Indonesia — 1.6% | |||||
| Astra International Tbk PT | 5,940,300 | $ | 3,309,298 | ||
| Bank Central Asia Tbk PT | 2,652,700 | 2,799,012 | |||
| Bank Mandiri Persero Tbk PT | 1,189,800 | 921,815 | |||
| Bank Rakyat Indonesia Persero Tbk PT | 861,700 | 693,048 | |||
| 7,723,173 | |||||
| Ireland — 1.9% | |||||
| CRH plc | 286,145 | 9,551,511 | |||
| Israel — 0.6% | |||||
Mobileye NV(1) | 80,791 | 3,007,849 | |||
| Japan — 2.9% | |||||
| Keyence Corp. | 4,300 | 2,940,335 | |||
| NTT DOCOMO, Inc. | 151,400 | 3,472,520 | |||
| ORIX Corp. | 362,400 | 5,643,246 | |||
| Seven & i Holdings Co. Ltd. | 18,300 | 709,414 | |||
| Sohgo Security Services Co. Ltd. | 41,400 | 1,684,515 | |||
| 14,450,030 | |||||
| Mexico — 0.4% | |||||
| Fomento Economico Mexicano SAB de CV ADR | 27,569 | 2,151,760 | |||
| Netherlands — 0.5% | |||||
| ASML Holding NV | 24,020 | 2,485,170 | |||
| Portugal — 0.8% | |||||
| Jeronimo Martins SGPS SA | 236,760 | 3,741,367 | |||
| Russia — 0.2% | |||||
| Magnit PJSC GDR | 22,610 | 910,731 | |||
| Switzerland — 2.5% | |||||
| Julius Baer Group Ltd. | 90,180 | 3,985,234 | |||
| Roche Holding AG | 36,931 | 8,234,737 | |||
| 12,219,971 | |||||
| United Kingdom — 5.1% | |||||
| Admiral Group plc | 83,123 | 1,977,106 | |||
| Ashtead Group plc | 309,178 | 6,061,836 | |||
Liberty Global plc, Class A(1) | 94,290 | 2,953,163 | |||
| Rio Tinto plc | 78,210 | 2,925,904 | |||
| Shire plc | 132,230 | 7,709,789 | |||
| Weir Group plc (The) | 142,990 | 3,234,675 | |||
| 24,862,473 | |||||
| United States — 61.2% | |||||
Acadia Healthcare Co., Inc.(1) | 52,940 | 2,012,249 | |||
Adobe Systems, Inc.(1) | 116,270 | 11,953,719 | |||
| Agilent Technologies, Inc. | 90,240 | 3,968,755 | |||
Alexion Pharmaceuticals, Inc.(1) | 30,054 | 3,684,320 | |||
| Allegion plc | 51,986 | 3,478,383 | |||
Allergan plc(1) | 31,700 | 6,159,310 | |||
| Alliance Data Systems Corp. | 34,672 | 7,932,260 | |||
Alphabet, Inc., Class A(1) | 13,185 | 10,229,978 | |||
Alphabet, Inc., Class C(1) | 11,244 | 8,523,402 | |||
Amazon.com, Inc.(1) | 4,300 | 3,227,451 | |||
| American Express Co. | 80,320 | 5,786,253 | |||
| American Tower Corp. | 40,960 | 4,188,979 | |||
Autodesk, Inc.(1) | 34,920 | 2,535,541 | |||
11
| Shares | Value | ||||
| Becton Dickinson and Co. | 52,960 | $ | 8,955,536 | ||
Boston Scientific Corp.(1) | 249,270 | 5,100,064 | |||
| Caterpillar, Inc. | 26,318 | 2,514,948 | |||
Celgene Corp.(1) | 85,798 | 10,167,921 | |||
Chipotle Mexican Grill, Inc.(1) | 5,910 | 2,342,310 | |||
| Citizens Financial Group, Inc. | 123,860 | 4,150,549 | |||
Cognizant Technology Solutions Corp., Class A(1) | 55,510 | 3,057,491 | |||
| Comerica, Inc. | 44,570 | 2,841,338 | |||
| EOG Resources, Inc. | 83,870 | 8,598,352 | |||
| EQT Corp. | 145,230 | 10,177,718 | |||
| Equinix, Inc. | 22,636 | 7,668,171 | |||
| Estee Lauder Cos., Inc. (The), Class A | 50,195 | 3,900,152 | |||
Facebook, Inc., Class A(1) | 128,661 | 15,236,036 | |||
| Fidelity National Information Services, Inc. | 49,540 | 3,823,993 | |||
| Fortune Brands Home & Security, Inc. | 104,783 | 5,778,782 | |||
HD Supply Holdings, Inc.(1) | 142,210 | 5,580,320 | |||
| Home Depot, Inc. (The) | 85,034 | 11,003,400 | |||
| Ingersoll-Rand plc | 25,175 | 1,876,545 | |||
| Interactive Brokers Group, Inc., Class A | 116,370 | 4,273,106 | |||
| Intercontinental Exchange, Inc. | 181,780 | 10,070,612 | |||
| Lennox International, Inc. | 21,990 | 3,269,253 | |||
| MarketAxess Holdings, Inc. | 14,293 | 2,369,351 | |||
| Martin Marietta Materials, Inc. | 55,370 | 12,150,946 | |||
| Mastercard, Inc., Class A | 62,420 | 6,379,324 | |||
| Mondelez International, Inc., Class A | 149,830 | 6,178,989 | |||
| MSCI, Inc., Class A | 56,430 | 4,446,684 | |||
| Newell Brands, Inc. | 165,100 | 7,761,351 | |||
PayPal Holdings, Inc.(1) | 99,240 | 3,898,147 | |||
| Pioneer Natural Resources Co. | 64,018 | 12,229,999 | |||
| Roper Technologies, Inc. | 37,600 | 6,809,736 | |||
| Sirius XM Holdings, Inc. | 1,458,550 | 6,665,573 | |||
Ulta Salon, Cosmetics & Fragrance, Inc.(1) | 24,340 | 6,316,230 | |||
VCA, Inc.(1) | 44,600 | 2,791,960 | |||
| Visa, Inc., Class A | 91,752 | 7,094,265 | |||
| Vulcan Materials Co. | 13,530 | 1,700,045 | |||
| Zions Bancorp | 148,429 | 5,905,990 | |||
| Zoetis, Inc. | 70,098 | 3,531,537 | |||
| 300,297,324 | |||||
TOTAL COMMON STOCKS (Cost $380,302,040) | 489,376,286 | ||||
| TEMPORARY CASH INVESTMENTS — 0.3% | |||||
| Repurchase Agreement, Fixed Income Clearing Corp., (collateralized by various U.S. Treasury obligations, 2.875%, 8/15/45, valued at $1,698,776), at 0.08%, dated 11/30/16, due 12/1/16 (Delivery value $1,661,004) (Cost $1,661,000) | 1,661,000 | ||||
TOTAL INVESTMENT SECURITIES — 100.0% (Cost $381,963,040) | 491,037,286 | ||||
OTHER ASSETS AND LIABILITIES† | (85,370 | ) | |||
| TOTAL NET ASSETS — 100.0% | $ | 490,951,916 | |||
12
| MARKET SECTOR DIVERSIFICATION | ||
(as a % of net assets) | ||
| Information Technology | 21.3 | % |
| Financials | 15.7 | % |
| Consumer Discretionary | 15.5 | % |
| Health Care | 14.4 | % |
| Industrials | 9.9 | % |
| Energy | 8.0 | % |
| Materials | 6.5 | % |
| Consumer Staples | 4.3 | % |
| Real Estate | 2.5 | % |
| Telecommunication Services | 1.0 | % |
| Utilities | 0.6 | % |
| Cash and Equivalents* | 0.3 | % |
*Includes temporary cash investments and other assets and liabilities.
| NOTES TO SCHEDULE OF INVESTMENTS | ||
| ADR | - | American Depositary Receipt |
| GDR | - | Global Depositary Receipt |
| † | Category is less than 0.05% of total net assets. |
| (1) | Non-income producing. |
See Notes to Financial Statements.
13
| Statement of Assets and Liabilities |
| NOVEMBER 30, 2016 | |||
| Assets | |||
| Investment securities, at value (cost of $381,963,040) | $ | 491,037,286 | |
| Foreign currency holdings, at value (cost of $73,738) | 67,368 | ||
| Receivable for investments sold | 33,109 | ||
| Receivable for capital shares sold | 44,575 | ||
| Dividends and interest receivable | 789,970 | ||
| Other assets | 16,484 | ||
| 491,988,792 | |||
| Liabilities | |||
| Payable for investments purchased | 219,730 | ||
| Payable for capital shares redeemed | 377,689 | ||
| Accrued management fees | 423,406 | ||
| Distribution and service fees payable | 16,051 | ||
| 1,036,876 | |||
| Net Assets | $ | 490,951,916 | |
| Net Assets Consist of: | |||
| Capital (par value and paid-in surplus) | $ | 379,058,978 | |
| Distributions in excess of net investment income | (1,600,589 | ) | |
| Undistributed net realized gain | 4,440,289 | ||
| Net unrealized appreciation | 109,053,238 | ||
| $ | 490,951,916 | ||
| Net Assets | Shares Outstanding | Net Asset Value Per Share | ||||
| Investor Class, $0.01 Par Value | $387,154,906 | 35,718,902 | $10.84 | |||
| Institutional Class, $0.01 Par Value | $37,028,302 | 3,363,101 | $11.01 | |||
| A Class, $0.01 Par Value | $36,382,367 | 3,438,330 | $10.58* | |||
| C Class, $0.01 Par Value | $6,871,862 | 729,376 | $9.42 | |||
| R Class, $0.01 Par Value | $7,006,520 | 669,459 | $10.47 | |||
| R6 Class, $0.01 Par Value | $16,507,959 | 1,494,131 | $11.05 | |||
*Maximum offering price $11.23 (net asset value divided by 0.9425).
See Notes to Financial Statements.
14
| Statement of Operations |
| YEAR ENDED NOVEMBER 30, 2016 | |||
| Investment Income (Loss) | |||
| Income: | |||
| Dividends (net of foreign taxes withheld of $444,392) | $ | 6,873,841 | |
| Interest | 5,462 | ||
| 6,879,303 | |||
| Expenses: | |||
| Management fees | 5,362,861 | ||
| Distribution and service fees: | |||
| A Class | 102,358 | ||
| C Class | 79,444 | ||
| R Class | 33,138 | ||
| Directors' fees and expenses | 17,126 | ||
| Other expenses | 15,279 | ||
| 5,610,206 | |||
| Net investment income (loss) | 1,269,097 | ||
| Realized and Unrealized Gain (Loss) | |||
| Net realized gain (loss) on: | |||
| Investment transactions | 5,243,856 | ||
| Foreign currency transactions | (72,412 | ) | |
| 5,171,444 | |||
| Change in net unrealized appreciation (depreciation) on: | |||
| Investments | (24,812,529 | ) | |
| Translation of assets and liabilities in foreign currencies | (7,211 | ) | |
| (24,819,740 | ) | ||
| Net realized and unrealized gain (loss) | (19,648,296 | ) | |
| Net Increase (Decrease) in Net Assets Resulting from Operations | $ | (18,379,199 | ) |
See Notes to Financial Statements.
15
| Statement of Changes in Net Assets |
| YEARS ENDED NOVEMBER 30, 2016 AND NOVEMBER 30, 2015 | ||||||
| Increase (Decrease) in Net Assets | November 30, 2016 | November 30, 2015 | ||||
| Operations | ||||||
| Net investment income (loss) | $ | 1,269,097 | $ | 155,693 | ||
| Net realized gain (loss) | 5,171,444 | 39,068,403 | ||||
| Change in net unrealized appreciation (depreciation) | (24,819,740 | ) | (30,761,290 | ) | ||
| Net increase (decrease) in net assets resulting from operations | (18,379,199 | ) | 8,462,806 | |||
| Distributions to Shareholders | ||||||
| From net investment income: | ||||||
| Investor Class | (479,702 | ) | — | |||
| Institutional Class | (98,254 | ) | — | |||
| R6 Class | (70,054 | ) | — | |||
| From net realized gains: | ||||||
| Investor Class | (28,545,970 | ) | (37,785,567 | ) | ||
| Institutional Class | (2,099,704 | ) | (6,379,960 | ) | ||
| A Class | (3,017,077 | ) | (4,516,949 | ) | ||
| C Class | (622,424 | ) | (670,176 | ) | ||
| R Class | (412,601 | ) | (478,017 | ) | ||
| R6 Class | (1,009,189 | ) | (1,376,962 | ) | ||
| Decrease in net assets from distributions | (36,354,975 | ) | (51,207,631 | ) | ||
| Capital Share Transactions | ||||||
| Net increase (decrease) in net assets from capital share transactions (Note 5) | (7,759,236 | ) | (29,475,736 | ) | ||
| Redemption Fees | ||||||
| Increase in net assets from redemption fees | 16,755 | 9,942 | ||||
| Net increase (decrease) in net assets | (62,476,655 | ) | (72,210,619 | ) | ||
| Net Assets | ||||||
| Beginning of period | 553,428,571 | 625,639,190 | ||||
| End of period | $ | 490,951,916 | $ | 553,428,571 | ||
| Distributions in excess of net investment income | $ | (1,600,589 | ) | $ | (2,134,173 | ) |
See Notes to Financial Statements.
16
| Notes to Financial Statements |
NOVEMBER 30, 2016
1. Organization
American Century World Mutual Funds, Inc. (the corporation) is registered under the Investment Company Act of 1940, as amended (the 1940 Act), as an open-end management investment company and is organized as a Maryland corporation. Global Growth Fund (the fund) is one fund in a series issued by the corporation. The fund's investment objective is to seek capital growth.
The fund offers the Investor Class, the Institutional Class, the A Class, the C Class, the R Class and the R6 Class. The A Class may incur an initial sales charge. The A Class and C Class may be subject to a contingent deferred sales charge. The share classes differ principally in their respective sales charges and distribution and shareholder servicing expenses and arrangements. The Institutional Class and R6 Class shareholders do not require the same level of shareholder and administrative services from American Century Investment Management, Inc. (ACIM) (the investment advisor) as shareholders of other classes. In addition, financial intermediaries do not receive any fees for the R6 Class. As a result, the Institutional Class and R6 Class are charged lower unified management fees.
2. Significant Accounting Policies
The following is a summary of significant accounting policies consistently followed by the fund in preparation of its financial statements. The fund is an investment company and follows accounting and reporting guidance in accordance with accounting principles generally accepted in the United States of America. This may require management to make certain estimates and assumptions at the date of the financial statements. Actual results could differ from these estimates. Management evaluated the impact of events or transactions occurring through the date the financial statements were issued that would merit recognition or disclosure.
Investment Valuations — The fund determines the fair value of its investments and computes its net asset value per share at the close of regular trading (usually 4 p.m. Eastern time) on the New York Stock Exchange (NYSE) on each day the NYSE is open. The Board of Directors has adopted valuation policies and procedures to guide the investment advisor in the fund’s investment valuation process and to provide methodologies for the oversight of the fund’s pricing function.
Equity securities that are listed or traded on a domestic securities exchange are valued at the last reported sales price or at the official closing price as provided by the exchange. Equity securities traded on foreign securities exchanges are generally valued at the closing price of such securities on the exchange where primarily traded or at the close of the NYSE, if that is earlier. If no last sales price is reported, or if local convention or regulation so provides, the mean of the latest bid and asked prices may be used. Securities traded over-the-counter are valued at the mean of the latest bid and asked prices, the last sales price, or the official closing price. Equity securities initially expressed in local currencies are translated into U.S. dollars at the mean of the appropriate currency exchange rate at the close of the NYSE as provided by an independent pricing service.
Open-end management investment companies are valued at the reported net asset value per share. Repurchase agreements are valued at cost, which approximates fair value.
If the fund determines that the market price for an investment is not readily available or the valuation methods mentioned above do not reflect an investment’s fair value, such investment is valued as determined in good faith by the Board of Directors or its delegate, in accordance with policies and procedures adopted by the Board of Directors. In its determination of fair value, the fund may review several factors including, but not limited to, market information regarding the specific investment or comparable investments and correlation with other investment types, futures indices or general market indicators. Circumstances that may cause the fund to use these procedures to value an investment include, but are not limited to: an investment has been declared in default or is distressed; trading in a security has been suspended during the trading day or a security is not actively trading on its principal exchange; prices received from a regular pricing source are deemed unreliable; or there is a foreign market holiday and no trading occurred.
The fund monitors for significant events occurring after the close of an investment’s primary exchange but before the fund’s net asset value per share is determined. Significant events may include, but are not limited
17
to: corporate announcements and transactions; governmental action and political unrest that could impact a specific investment or an investment sector; or armed conflicts, natural disasters and similar events that could affect investments in a specific country or region. The fund also monitors for significant fluctuations between domestic and foreign markets, as evidenced by the U.S. market or such other indicators that the Board of Directors, or its delegate, deems appropriate. If significant fluctuations in foreign markets are identified, the fund may apply a model-derived factor to the closing price of equity securities traded on foreign securities exchanges. The factor is based on observable market data as provided by an independent pricing service.
Security Transactions — Security transactions are accounted for as of the trade date. Net realized gains and losses are determined on the identified cost basis, which is also used for federal income tax purposes.
Investment Income — Dividend income less foreign taxes withheld, if any, is recorded as of the ex-dividend date. Distributions received on securities that represent a return of capital or long-term capital gain are recorded as a reduction of cost of investments and/or as a realized gain. The fund may estimate the components of distributions received that may be considered nontaxable distributions or long-term capital gain distributions for income tax purposes. Interest income is recorded on the accrual basis and includes accretion of discounts and amortization of premiums.
Foreign Currency Translations — All assets and liabilities initially expressed in foreign currencies are translated into U.S. dollars at prevailing exchange rates at period end. The fund may enter into spot foreign currency exchange contracts to facilitate transactions denominated in a foreign currency. Purchases and sales of investment securities, dividend and interest income, spot foreign currency exchange contracts, and expenses are translated at the rates of exchange prevailing on the respective dates of such transactions. Net realized and unrealized foreign currency exchange gains or losses related to investment securities are a component of net realized gain (loss) on investment transactions and change in net unrealized appreciation (depreciation) on investments, respectively.
Repurchase Agreements — The fund may enter into repurchase agreements with institutions that ACIM has determined are creditworthy pursuant to criteria adopted by the Board of Directors. The fund requires that the collateral, represented by securities, received in a repurchase transaction be transferred to the custodian in a manner sufficient to enable the fund to obtain those securities in the event of a default under the repurchase agreement. ACIM monitors, on a daily basis, the securities transferred to ensure the value, including accrued interest, of the securities under each repurchase agreement is equal to or greater than amounts owed to the fund under each repurchase agreement.
Joint Trading Account — Pursuant to an Exemptive Order issued by the Securities and Exchange Commission, the fund, along with certain other funds in the American Century Investments family of funds, may transfer uninvested cash balances into a joint trading account. These balances are invested in one or more repurchase agreements that are collateralized by U.S. Treasury or Agency obligations.
Income Tax Status — It is the fund’s policy to distribute substantially all net investment income and net realized gains to shareholders and to otherwise qualify as a regulated investment company under provisions of the Internal Revenue Code. Accordingly, no provision has been made for income taxes. The fund files U.S. federal, state, local and non-U.S. tax returns as applicable. The fund's tax returns are subject to examination by the relevant taxing authority until expiration of the applicable statute of limitations, which is generally three years from the date of filing but can be longer in certain jurisdictions. At this time, management believes there are no uncertain tax positions which, based on their technical merit, would not be sustained upon examination and for which it is reasonably possible that the total amounts of unrecognized tax benefits will significantly change in the next twelve months.
Multiple Class — All shares of the fund represent an equal pro rata interest in the net assets of the class to which such shares belong, and have identical voting, dividend, liquidation and other rights and the same terms and conditions, except for class specific expenses and exclusive rights to vote on matters affecting only individual classes. Income, non-class specific expenses, and realized and unrealized capital gains and losses of the fund are allocated to each class of shares based on their relative net assets.
Distributions to Shareholders — Distributions from net investment income and net realized gains, if any, are generally declared and paid annually. The fund may make distributions on a more frequent basis to comply with the distribution requirements of the Internal Revenue Code, in all events in a manner consistent with provisions of the 1940 Act.
18
Redemption Fees — The fund may impose a 2.00% redemption fee on shares held less than 60 days. The fee may not be applicable to all classes. The redemption fee is retained by the fund and helps cover transaction costs that long-term investors may bear when the fund sells securities to meet investor redemptions.
Indemnifications — Under the corporation’s organizational documents, its officers and directors are indemnified against certain liabilities arising out of the performance of their duties to the fund. In addition, in the normal course of business, the fund enters into contracts that provide general indemnifications. The maximum exposure under these arrangements is unknown as this would involve future claims that may be made against a fund. The risk of material loss from such claims is considered by management to be remote.
3. Fees and Transactions with Related Parties
Certain officers and directors of the corporation are also officers and/or directors of American Century Companies, Inc. (ACC). The corporation’s investment advisor, ACIM, the corporation's distributor, American Century Investment Services, Inc. (ACIS), and the corporation’s transfer agent, American Century Services, LLC, are wholly owned, directly or indirectly, by ACC.
Management Fees — The corporation has entered into a management agreement with ACIM, under which ACIM provides the fund with investment advisory and management services in exchange for a single, unified management fee (the fee) per class. The agreement provides that all expenses of managing and operating the fund, except distribution and service fees, brokerage expenses, taxes, interest, fees and expenses of the independent directors (including legal counsel fees), and extraordinary expenses, will be paid by ACIM. The fee is computed and accrued daily based on each class’s daily net assets and paid monthly in arrears. The rate of the fee is determined by applying a fee rate calculation formula. This formula takes into account the fund’s assets as well as certain assets, if any, of other clients of the investment advisor outside the American Century Investments family of funds (such as subadvised funds and separate accounts) that have very similar investment teams and investment strategies (strategy assets). The annual management fee schedule ranges from 1.050% to 1.300% for the Investor Class, A Class, C Class and R Class. The annual management fee schedule ranges from 0.850% to 1.100% for the Institutional Class and 0.700% to 0.950% for the R6 Class. The effective annual management fee for each class for the year ended November 30, 2016 was 1.07% for the Investor Class, A Class, C Class and R Class, 0.87% for the Institutional Class and 0.72% for the R6 Class.
Distribution and Service Fees — The Board of Directors has adopted a separate Master Distribution and Individual Shareholder Services Plan for each of the A Class, C Class and R Class (collectively the plans), pursuant to Rule 12b-1 of the 1940 Act. The plans provide that the A Class will pay ACIS an annual distribution and service fee of 0.25%. The plans provide that the C Class will pay ACIS an annual distribution and service fee of 1.00%, of which 0.25% is paid for individual shareholder services and 0.75% is paid for distribution services. The plans provide that the R Class will pay ACIS an annual distribution and service fee of 0.50%. The fees are computed and accrued daily based on each class’s daily net assets and paid monthly in arrears. The fees are used to pay financial intermediaries for distribution and individual shareholder services. Fees incurred under the plans during the year ended November 30, 2016 are detailed in the Statement of Operations.
Directors' Fees and Expenses — The Board of Directors is responsible for overseeing the investment advisor’s management and operations of the fund. The directors receive detailed information about the fund and its investment advisor regularly throughout the year, and meet at least quarterly with management of the investment advisor to review reports about fund operations. The fund’s officers do not receive compensation from the fund.
Interfund Transactions — The fund may enter into security transactions with other American Century Investments funds and other client accounts of the investment advisor, in accordance with the 1940 Act rules and procedures adopted by the Board of Directors. The rules and procedures require, among other things, that these transactions be effected at the independent current market price of the security. During the period, the interfund purchases and sales were $879,214 and $1,367,812, respectively. The effect of interfund transactions on the Statement of Operations was $(62,287) in net realized gain (loss) on investment transactions.
4. Investment Transactions
Purchases and sales of investment securities, excluding short-term investments, for the year ended November 30, 2016 were $288,996,444 and $331,068,464, respectively.
19
5. Capital Share Transactions
Transactions in shares of the fund were as follows:
| Year ended November 30, 2016 | Year ended November 30, 2015 | |||||||||
| Shares | Amount | Shares | Amount | |||||||
| Investor Class/Shares Authorized | 300,000,000 | 310,000,000 | ||||||||
| Sold | 2,727,985 | $ | 29,305,976 | 3,089,165 | $ | 37,049,796 | ||||
| Issued in reinvestment of distributions | 2,586,515 | 28,244,747 | 3,197,823 | 36,927,269 | ||||||
| Redeemed | (6,568,047 | ) | (70,685,855 | ) | (5,095,303 | ) | (61,226,074 | ) | ||
| (1,253,547 | ) | (13,135,132 | ) | 1,191,685 | 12,750,991 | |||||
| Institutional Class/Shares Authorized | 40,000,000 | 40,000,000 | ||||||||
| Sold | 1,238,720 | 13,699,629 | 344,330 | 4,207,103 | ||||||
| Issued in reinvestment of distributions | 198,510 | 2,197,504 | 511,275 | 5,962,760 | ||||||
| Redeemed | (799,663 | ) | (8,646,207 | ) | (4,150,252 | ) | (51,025,377 | ) | ||
| 637,567 | 7,250,926 | (3,294,647 | ) | (40,855,514 | ) | |||||
| A Class/Shares Authorized | 40,000,000 | 40,000,000 | ||||||||
| Sold | 629,395 | 6,620,405 | 1,031,144 | 12,115,263 | ||||||
| Issued in reinvestment of distributions | 272,105 | 2,906,077 | 392,995 | 4,454,209 | ||||||
| Redeemed | (1,363,917 | ) | (14,333,551 | ) | (1,776,564 | ) | (20,780,515 | ) | ||
| (462,417 | ) | (4,807,069 | ) | (352,425 | ) | (4,211,043 | ) | |||
| C Class/Shares Authorized | 30,000,000 | 30,000,000 | ||||||||
| Sold | 148,416 | 1,403,670 | 265,307 | 2,849,458 | ||||||
| Issued in reinvestment of distributions | 44,341 | 424,787 | 44,246 | 457,296 | ||||||
| Redeemed | (265,093 | ) | (2,518,810 | ) | (127,055 | ) | (1,364,173 | ) | ||
| (72,336 | ) | (690,353 | ) | 182,498 | 1,942,581 | |||||
| R Class/Shares Authorized | 30,000,000 | 30,000,000 | ||||||||
| Sold | 261,294 | 2,727,028 | 196,169 | 2,307,770 | ||||||
| Issued in reinvestment of distributions | 38,905 | 412,005 | 42,408 | 478,017 | ||||||
| Redeemed | (148,521 | ) | (1,562,953 | ) | (165,733 | ) | (1,933,558 | ) | ||
| 151,678 | 1,576,080 | 72,844 | 852,229 | |||||||
| R6 Class/Shares Authorized | 40,000,000 | 30,000,000 | ||||||||
| Sold | 470,512 | 5,062,149 | 225,533 | 2,791,939 | ||||||
| Issued in reinvestment of distributions | 97,317 | 1,079,243 | 117,575 | 1,376,962 | ||||||
| Redeemed | (373,215 | ) | (4,095,080 | ) | (339,633 | ) | (4,123,881 | ) | ||
| 194,614 | 2,046,312 | 3,475 | 45,020 | |||||||
| Net increase (decrease) | (804,441 | ) | $ | (7,759,236 | ) | (2,196,570 | ) | $ | (29,475,736 | ) |
6. Fair Value Measurements
The fund’s investments valuation process is based on several considerations and may use multiple inputs to determine the fair value of the investments held by the fund. In conformity with accounting principles generally accepted in the United States of America, the inputs used to determine a valuation are classified into three broad levels.
| • | Level 1 valuation inputs consist of unadjusted quoted prices in an active market for identical investments. |
| • | Level 2 valuation inputs consist of direct or indirect observable market data (including quoted prices for comparable investments, evaluations of subsequent market events, interest rates, prepayment speeds, credit risk, etc.). These inputs also consist of quoted prices for identical investments initially expressed in local currencies that are adjusted through translation into U.S. dollars. |
20
| • | Level 3 valuation inputs consist of unobservable data (including a fund’s own assumptions). |
The level classification is based on the lowest level input that is significant to the fair valuation measurement. The valuation inputs are not necessarily an indication of the risks associated with investing in these securities or other financial instruments. There were no significant transfers between levels during the period.
The following is a summary of the level classifications as of period end. The Schedule of Investments provides additional information on the fund’s portfolio holdings.
| Level 1 | Level 2 | Level 3 | ||||||
| Assets | ||||||||
| Investment Securities | ||||||||
| Common Stocks | ||||||||
| Austria | — | $ | 2,471,793 | — | ||||
| Belgium | — | 3,106,635 | — | |||||
| Brazil | — | 2,381,281 | — | |||||
| China | $ | 6,245,749 | 11,233,910 | — | ||||
| Denmark | — | 5,187,220 | — | |||||
| France | — | 42,572,573 | — | |||||
| Germany | — | 10,155,171 | — | |||||
| Hong Kong | 2,197,791 | 13,087,584 | — | |||||
| Hungary | — | 1,167,630 | — | |||||
| India | 3,084,770 | 5,082,820 | — | |||||
| Indonesia | — | 7,723,173 | — | |||||
| Ireland | — | 9,551,511 | — | |||||
| Japan | — | 14,450,030 | — | |||||
| Netherlands | — | 2,485,170 | — | |||||
| Portugal | — | 3,741,367 | — | |||||
| Russia | — | 910,731 | — | |||||
| Switzerland | — | 12,219,971 | — | |||||
| United Kingdom | 2,953,163 | 21,909,310 | — | |||||
| Other Countries | 305,456,933 | — | — | |||||
| Temporary Cash Investments | — | 1,661,000 | — | |||||
| $ | 319,938,406 | $ | 171,098,880 | — | ||||
7. Risk Factors
There are certain risks involved in investing in foreign securities. These risks include those resulting from future adverse political, social and economic developments, fluctuations in currency exchange rates, the possible imposition of exchange controls, and other foreign laws or restrictions. Investing in emerging markets may accentuate these risks.
8. Federal Tax Information
On December 20, 2016, the fund declared and paid a per-share distribution from net realized gains to shareholders of record on December 19, 2016 of $0.0630 for the Investor Class, Institutional Class, A Class, C Class, R Class and R6 Class.
21
The tax character of distributions paid during the years ended November 30, 2016 and November 30, 2015 were as follows:
| 2016 | 2015 | |||||
| Distributions Paid From | ||||||
| Ordinary income | $ | 648,010 | — | |||
| Long-term capital gains | $ | 35,706,965 | $ | 51,207,631 | ||
The book-basis character of distributions made during the year from net investment income or net realized gains may differ from their ultimate characterization for federal income tax purposes. These differences reflect the differing character of certain income items and net realized gains and losses for financial statement and tax purposes, and may result in reclassification among certain capital accounts on the financial statements.
As of November 30, 2016, the federal tax cost of investments and the components of distributable earnings on a tax-basis were as follows:
| Federal tax cost of investments | $ | 386,384,463 | |
| Gross tax appreciation of investments | $ | 115,036,932 | |
| Gross tax depreciation of investments | (10,384,109 | ) | |
| Net tax appreciation (depreciation) of investments | 104,652,823 | ||
| Net tax appreciation (depreciation) on translation of assets and liabilities in foreign currencies | (21,008 | ) | |
| Net tax appreciation (depreciation) | $ | 104,631,815 | |
| Undistributed ordinary income | $ | 1,484,738 | |
Accumulated long-term gains | $ | 5,776,385 | |
The difference between book-basis and tax-basis unrealized appreciation (depreciation) is attributable primarily to the realization to ordinary income for tax purposes of unrealized gains on investments in passive foreign investment companies.
9. Recently Issued Accounting Guidance
In October 2016, the Securities and Exchange Commission adopted new rules and forms as well as amendments to its rules and forms to modernize the reporting and disclosure of information by registered investment companies. The amendments to Regulation S-X will require standardized, enhanced disclosure about derivatives in investment company financial statements, as well as other provisions. Compliance with the amendments is effective on August 1, 2017. Management is currently evaluating the impact that adopting the amendments will have on the financial statement disclosures.
22
| Financial Highlights |
| For a Share Outstanding Throughout the Years Ended November 30 (except as noted) | |||||||||||||||
| Per-Share Data | Ratios and Supplemental Data | ||||||||||||||
| Income From Investment Operations: | Distributions From: | Ratio to Average Net Assets of: | |||||||||||||
Net Asset Value, Beginning of Period | Net Investment Income (Loss)(1) | Net Realized and Unrealized Gain (Loss) | Total From Investment Operations | Net Investment Income | Net Realized Gains | Total Distributions | Net Asset Value, End of Period | Total Return(2) | Operating Expenses | Net Investment Income (Loss) | Portfolio Turnover Rate | Net Assets, End of Period (in thousands) | |||
| Investor Class | |||||||||||||||
| 2016 | $12.01 | 0.03 | (0.42) | (0.39) | (0.01) | (0.77) | (0.78) | $10.84 | (3.24)% | 1.08% | 0.27% | 57% | $387,155 | ||
| 2015 | $12.94 | —(3) | 0.12 | 0.12 | — | (1.05) | (1.05) | $12.01 | 1.37% | 1.08% | 0.04% | 50% | $443,915 | ||
| 2014 | $12.39 | —(3) | 0.91 | 0.91 | (0.08) | (0.28) | (0.36) | $12.94 | 7.53% | 1.08% | 0.03% | 46% | $462,889 | ||
| 2013 | $9.63 | 0.01 | 2.79 | 2.80 | (0.04) | — | (0.04) | $12.39 | 29.15% | 1.09% | 0.11% | 64% | $437,599 | ||
| 2012 | $8.52 | 0.03 | 1.11 | 1.14 | (0.03) | — | (0.03) | $9.63 | 13.37% | 1.10% | 0.28% | 54% | $373,887 | ||
| Institutional Class | |||||||||||||||
| 2016 | $12.19 | 0.05 | (0.42) | (0.37) | (0.04) | (0.77) | (0.81) | $11.01 | (3.07)% | 0.88% | 0.47% | 57% | $37,028 | ||
| 2015 | $13.09 | 0.03 | 0.12 | 0.15 | — | (1.05) | (1.05) | $12.19 | 1.60% | 0.88% | 0.24% | 50% | $33,211 | ||
| 2014 | $12.52 | 0.03 | 0.91 | 0.94 | (0.09) | (0.28) | (0.37) | $13.09 | 7.68% | 0.88% | 0.23% | 46% | $78,802 | ||
| 2013 | $9.73 | 0.03 | 2.82 | 2.85 | (0.06) | — | (0.06) | $12.52 | 29.42% | 0.89% | 0.31% | 64% | $80,968 | ||
| 2012 | $8.60 | 0.05 | 1.13 | 1.18 | (0.05) | — | (0.05) | $9.73 | 13.71% | 0.90% | 0.48% | 54% | $47,203 | ||
| A Class | |||||||||||||||
| 2016 | $11.76 | —(3) | (0.41) | (0.41) | — | (0.77) | (0.77) | $10.58 | (3.52)% | 1.33% | 0.02% | 57% | $36,382 | ||
| 2015 | $12.72 | (0.02) | 0.11 | 0.09 | — | (1.05) | (1.05) | $11.76 | 1.14% | 1.33% | (0.21)% | 50% | $45,855 | ||
| 2014 | $12.21 | (0.03) | 0.89 | 0.86 | (0.07) | (0.28) | (0.35) | $12.72 | 7.23% | 1.33% | (0.22)% | 46% | $54,091 | ||
| 2013 | $9.49 | (0.02) | 2.75 | 2.73 | (0.01) | — | (0.01) | $12.21 | 28.83% | 1.34% | (0.14)% | 64% | $51,351 | ||
| 2012 | $8.39 | —(3) | 1.10 | 1.10 | —(3) | — | —(3) | $9.49 | 13.16% | 1.35% | 0.03% | 54% | $33,938 | ||
| For a Share Outstanding Throughout the Years Ended November 30 (except as noted) | |||||||||||||||
| Per-Share Data | Ratios and Supplemental Data | ||||||||||||||
| Income From Investment Operations: | Distributions From: | Ratio to Average Net Assets of: | |||||||||||||
Net Asset Value, Beginning of Period | Net Investment Income (Loss)(1) | Net Realized and Unrealized Gain (Loss) | Total From Investment Operations | Net Investment Income | Net Realized Gains | Total Distributions | Net Asset Value, End of Period | Total Return(2) | Operating Expenses | Net Investment Income (Loss) | Portfolio Turnover Rate | Net Assets, End of Period (in thousands) | |||
| C Class | |||||||||||||||
| 2016 | $10.63 | (0.07) | (0.37) | (0.44) | — | (0.77) | (0.77) | $9.42 | (4.23)% | 2.08% | (0.73)% | 57% | $6,872 | ||
| 2015 | $11.68 | (0.10) | 0.10 | —(3) | — | (1.05) | (1.05) | $10.63 | 0.40% | 2.08% | (0.96)% | 50% | $8,520 | ||
| 2014 | $11.30 | (0.11) | 0.81 | 0.70 | (0.04) | (0.28) | (0.32) | $11.68 | 6.39% | 2.08% | (0.97)% | 46% | $7,234 | ||
| 2013 | $8.84 | (0.09) | 2.55 | 2.46 | — | — | — | $11.30 | 27.97% | 2.09% | (0.89)% | 64% | $5,615 | ||
| 2012 | $7.87 | (0.06) | 1.03 | 0.97 | — | — | — | $8.84 | 12.20% | 2.10% | (0.72)% | 54% | $4,098 | ||
| R Class | |||||||||||||||
| 2016 | $11.67 | (0.03) | (0.40) | (0.43) | — | (0.77) | (0.77) | $10.47 | (3.73)% | 1.58% | (0.23)% | 57% | $7,007 | ||
| 2015 | $12.66 | (0.05) | 0.11 | 0.06 | — | (1.05) | (1.05) | $11.67 | 0.89% | 1.58% | (0.46)% | 50% | $6,040 | ||
| 2014 | $12.18 | (0.06) | 0.88 | 0.82 | (0.06) | (0.28) | (0.34) | $12.66 | 7.00% | 1.58% | (0.47)% | 46% | $5,632 | ||
| 2013 | $9.47 | (0.04) | 2.75 | 2.71 | — | — | — | $12.18 | 28.51% | 1.59% | (0.39)% | 64% | $4,489 | ||
| 2012 | $8.39 | (0.02) | 1.10 | 1.08 | — | — | — | $9.47 | 12.87% | 1.60% | (0.22)% | 54% | $1,587 | ||
| R6 Class | |||||||||||||||
| 2016 | $12.23 | 0.07 | (0.43) | (0.36) | (0.05) | (0.77) | (0.82) | $11.05 | (2.91)% | 0.73% | 0.62% | 57% | $16,508 | ||
| 2015 | $13.11 | 0.05 | 0.12 | 0.17 | — | (1.05) | (1.05) | $12.23 | 1.76% | 0.73% | 0.39% | 50% | $15,887 | ||
| 2014 | $12.53 | 0.02 | 0.93 | 0.95 | (0.09) | (0.28) | (0.37) | $13.11 | 7.80% | 0.73% | 0.38% | 46% | $16,992 | ||
2013(4) | $11.22 | —(3) | 1.31 | 1.31 | — | — | — | $12.53 | 11.68% | 0.74%(5) | 0.00%(5)(6) | 64%(7) | $28 | ||
| Notes to Financial Highlights |
| (1) | Computed using average shares outstanding throughout the period. |
| (2) | Total returns are calculated based on the net asset value of the last business day and do not reflect applicable sales charges, if any. Total returns for periods less than one year are not annualized. |
| (3) | Per-share amount was less than $0.005. |
| (4) | July 26, 2013 (commencement of sale) through November 30, 2013. |
| (5) | Annualized. |
| (6) | Ratio was less than 0.005%. |
| (7) | Portfolio turnover is calculated at the fund level. Percentage indicated was calculated for the year ended November 30, 2013. |
See Notes to Financial Statements.
| Report of Independent Registered Public Accounting Firm |
To the Board of Directors and Shareholders of American Century World Mutual Funds, Inc.:
We have audited the accompanying statement of assets and liabilities, including the schedule of investments, of Global Growth Fund (the “Fund”), one of the funds constituting American Century World Mutual Funds, Inc., as of November 30, 2016, and the related statement of operations for the year then ended, the statements of changes in net assets for each of the two years in the period then ended, and the financial highlights for each of the periods presented. These financial statements and financial highlights are the responsibility of the Fund’s management. Our responsibility is to express an opinion on these financial statements and financial highlights based on our audits.
We conducted our audits in accordance with the standards of the Public Company Accounting Oversight Board (United States). Those standards require that we plan and perform the audit to obtain reasonable assurance about whether the financial statements and financial highlights are free of material misstatement. The Fund is not required to have, nor were we engaged to perform, an audit of its internal control over financial reporting. Our audits included consideration of internal control over financial reporting as a basis for designing audit procedures that are appropriate in the circumstances, but not for the purpose of expressing an opinion on the effectiveness of the Fund’s internal control over financial reporting. Accordingly, we express no such opinion. An audit also includes examining, on a test basis, evidence supporting the amounts and disclosures in the financial statements, assessing the accounting principles used and significant estimates made by management, as well as evaluating the overall financial statement presentation. Our procedures included confirmation of securities owned as of November 30, 2016, by correspondence with the custodian and brokers; when replies were not received from brokers, we performed other auditing procedures. We believe that our audits provide a reasonable basis for our opinion.
In our opinion, the financial statements and financial highlights referred to above present fairly, in all material respects, the financial position of Global Growth Fund of American Century World Mutual Funds, Inc. as of November 30, 2016, the results of its operations for the year then ended, the changes in its net assets for each of the two years in the period then ended, and the financial highlights for each of the periods presented, in conformity with accounting principles generally accepted in the United States of America.
DELOITTE & TOUCHE LLP
Kansas City, Missouri
January 17, 2017
26
| Management |
The Board of Directors
The individuals listed below serve as directors of the funds. Each director will continue to serve in this capacity until death, retirement, resignation or removal from office. The board has adopted a mandatory retirement age for directors who are not “interested persons,” as that term is defined in the Investment Company Act (independent directors). Independent directors shall retire by December 31 of the year in which they reach their 75th birthday.
Mr. Thomas is an “interested person” because he currently serves as President and Chief Executive Officer of American Century Companies, Inc. (ACC), the parent company of American Century Investment Management, Inc. (ACIM or the advisor). The other directors (more than three-fourths of the total number) are independent. They are not employees, directors or officers of, and have no financial interest in, ACC or any of its wholly owned, direct or indirect, subsidiaries, including ACIM, American Century Investment Services, Inc. (ACIS) and American Century Services, LLC (ACS), and they do not have any other affiliations, positions or relationships that would cause them to be considered “interested persons” under the Investment Company Act. The directors serve in this capacity for seven (in the case of Mr. Thomas, 15) registered investment companies in the American Century Investments family of funds.
The following table presents additional information about the directors. The mailing address for each director is 4500 Main Street, Kansas City, Missouri 64111.
| Name (Year of Birth) | Position(s) Held with Funds | Length of Time Served | Principal Occupation(s) During Past 5 Years | Number of American Century Portfolios Overseen by Director | Other Directorships Held During Past 5 Years |
| Independent Directors | |||||
| Barry Fink (1955) | Director | Since 2012 | Retired; Executive Vice President, ACC (September 2007 to February 2013); President, ACS (October 2007 to February 2013); Chief Operating Officer, ACC (September 2007 to November 2012) | 81 | None |
| Andrea C. Hall (1945) | Director | Since 1997 | Retired | 81 | None |
| Jan M. Lewis (1957) | Director | Since 2011 | Retired; President and Chief Executive Officer, Catholic Charities of Northeast Kansas (human services organization) (2006 to 2013) | 81 | None |
| James A. Olson (1942) | Director and Chairman of the Board | Since 2007 (Chairman since 2014) | Member, Plaza Belmont LLC (private equity fund manager) (1999 to present) | 81 | Saia, Inc. (2002 to 2012) and EPR Properties (2003 to 2013) |
| M. Jeannine Strandjord (1945) | Director | Since 1994 | Retired | 81 | Euronet Worldwide Inc.; MGP Ingredients, Inc.; and DST Systems Inc. (1996 to 2012) |
27
| Name (Year of Birth) | Position(s) Held with Funds | Length of Time Served | Principal Occupation(s) During Past 5 Years | Number of American Century Portfolios Overseen by Director | Other Directorships Held During Past 5 Years |
| Independent Directors | |||||
| John R. Whitten (1946) | Director | Since 2008 | Retired | 81 | Rudolph Technologies, Inc. |
| Stephen E. Yates (1948) | Director | Since 2012 | Retired | 81 | None |
| Interested Director | |||||
| Jonathan S. Thomas (1963) | Director and President | Since 2007 | President and Chief Executive Officer, ACC (March 2007 to present). Also serves as Chief Executive Officer, ACS; Executive Vice President, ACIM; Director, ACC, ACIM and other ACC subsidiaries | 126 | BioMed Valley Discoveries, Inc. |
The Statement of Additional Information has additional information about the fund's directors and is available without charge, upon request, by calling 1-800-345-2021.
28
Officers
The following table presents certain information about the executive officers of the funds. Each officer serves as an officer for each of the 15 investment companies in the American Century family of funds, unless otherwise noted. No officer is compensated for his or her service as an officer of the funds. The listed officers are interested persons of the funds and are appointed or re-appointed on an annual basis. The mailing address for each officer listed below is 4500 Main Street, Kansas City, Missouri 64111.
| Name (Year of Birth) | Offices with the Funds | Principal Occupation(s) During the Past Five Years |
| Jonathan S. Thomas (1963) | Director and President since 2007 | President and Chief Executive Officer, ACC (March 2007 to present). Also serves as Chief Executive Officer, ACS; Executive Vice President, ACIM; Director, ACC, ACIM and other ACC subsidiaries |
| Amy D. Shelton (1964) | Chief Compliance Officer and Vice President since 2014 | Chief Compliance Officer, American Century funds, (March 2014 to present); Chief Compliance Officer, ACIM (February 2014 to present); Chief Compliance Officer, ACIS (October 2009 to present); Vice President, Client Interactions and Marketing, ACIS (February 2013 to January 2014); Director, Client Interactions and Marketing, ACIS (June 2007 to January 2013). Also serves as Vice President, ACIS |
| Charles A. Etherington (1957) | General Counsel since 2007 and Senior Vice President since 2006 | Attorney, ACC (February 1994 to present); Vice President, ACC (November 2005 to present); General Counsel, ACC (March 2007 to present). Also serves as General Counsel, ACIM, ACS, ACIS and other ACC subsidiaries; and Senior Vice President, ACIM and ACS |
| C. Jean Wade (1964) | Vice President,Treasurer and Chief Financial Officer since 2012 | Vice President, ACS (February 2000 to present) |
| Robert J. Leach (1966) | Vice President since 2006 and Assistant Treasurer since 2012 | Vice President, ACS (February 2000 to present) |
| David H. Reinmiller (1963) | Vice President since 2000 | Attorney, ACC (January 1994 to present); Associate General Counsel, ACC (January 2001 to present). Also serves as Vice President, ACIM and ACS |
| Ward D. Stauffer (1960) | Secretary since 2005 | Attorney, ACC (June 2003 to present) |
29
| Approval of Management Agreement |
At a meeting held on June 29, 2016, the Fund’s Board of Directors (the "Board") unanimously approved the renewal of the management agreement pursuant to which American Century Investment Management, Inc. (the “Advisor”) acts as the investment advisor for the Fund. Under Section 15(c) of the Investment Company Act, contracts for investment advisory services are required to be reviewed, evaluated, and approved by a majority of a fund’s directors (the “Directors”), including a majority of the independent Directors, each year.
Prior to its consideration of the renewal of the management agreement, the Directors requested and reviewed extensive data and information compiled by the Advisor and certain independent providers of evaluation data concerning the Fund and the services provided to the Fund by the Advisor. This review was in addition to the oversight and evaluation undertaken by the Board and its committees on a continual basis and the information received was supplemental to the extensive information that the Board and its committees receive and consider throughout the year.
In connection with its consideration of the renewal of the management agreement, the Board’s review and evaluation of the services provided by the Advisor included, but was not limited to, the following:
| • | the nature, extent, and quality of investment management, shareholder services, and other services provided and to be provided to the Fund; |
| • | the wide range of other programs and services provided and to be provided to the Fund and its shareholders on a routine and non-routine basis; |
| • | the investment performance of the Fund, including data comparing the Fund's performance to appropriate benchmarks and/or a peer group of other mutual funds with similar investment objectives and strategies; |
| • | the cost of owning the Fund compared to the cost of owning similar funds; |
| • | the compliance policies, procedures, and regulatory experience of the Advisor and the Fund's service providers; |
| • | financial data showing the cost of services provided to the Fund, the profitability of the Fund to the Advisor, and the overall profitability of the Advisor; |
| • | possible economies of scale associated with the Advisor’s management of the Fund and other accounts under its management; |
| • | data comparing services provided and charges to the Advisor's other investment management clients; |
| • | acquired fund fees and expenses; |
| • | payments by the Fund and the Advisor to financial intermediaries and the nature of services provided; and |
| • | any collateral benefits derived by the Advisor from the management of the Fund. |
In keeping with their practice, the Directors held two in-person meetings and one telephonic meeting to review and discuss the information provided. The independent Directors also had the benefit of the advice of their independent counsel throughout the process.
Factors Considered
The Directors considered all of the information provided by the Advisor, the independent data providers, and independent counsel in connection with the approval. They determined that the information was sufficient for them to evaluate the management agreement for the Fund. In connection with their review, the Directors did not identify any single factor as being all-important or controlling, and each Director may have attributed different levels of importance to different factors.
30
In deciding to renew the management agreement, the Board based its decision on a number of factors, including the following:
Nature, Extent and Quality of Services - Generally. Under the management agreement, the Advisor is responsible for providing or arranging for all services necessary for the operation of the Fund. The Board noted that under the management agreement, the Advisor provides or arranges at its own expense a wide variety of services including:
| • | constructing and designing the Fund |
| • | portfolio research and security selection |
| • | initial capitalization/funding |
| • | securities trading |
| • | Fund administration |
| • | custody of Fund assets |
| • | daily valuation of the Fund’s portfolio |
| • | shareholder servicing and transfer agency, including shareholder confirmations, recordkeeping, and communications |
| • | legal services (except the independent Directors’ counsel) |
| • | regulatory and portfolio compliance |
| • | financial reporting |
| • | marketing and distribution (except amounts paid by the Fund under Rule 12b-1 plans) |
The Board noted that many of these services have expanded over time in terms of both quantity and complexity in response to shareholder demands, competition in the industry, changing distribution channels, and the changing regulatory environment. The Board noted specifically the resources the Advisor has committed to enhancing cybersecurity protections for the benefit of shareholders.
Investment Management Services. The nature of the investment management services provided to the Fund is quite complex and allows Fund shareholders access to professional money management, instant diversification of their investments within an asset class, the opportunity to easily diversify among asset classes by investing in or exchanging among various American Century Investments funds, and liquidity. In evaluating investment performance, the Board expects the Advisor to manage the Fund in accordance with its investment objectives and approved strategies. Further, the Directors recognize that the Advisor has an obligation to monitor trading activities, and in particular to seek the best execution of fund trades, and to evaluate the use of and payment for research. In providing these services, the Advisor utilizes teams of investment professionals (portfolio managers, analysts, research assistants, and securities traders) who require extensive information technology, research, training, compliance, and other systems to conduct their business. The Board, directly and through its Fund Performance Review Committee, provides oversight of the investment performance process. It regularly reviews investment performance information for the Fund, together with comparative information for appropriate benchmarks and/or peer groups of similarly-managed funds, over different time horizons. The Directors also review detailed performance information provided by the Advisor during the management agreement approval process. If performance concerns are identified, the Fund receives special reviews until performance improves, during which the Board receives a report from the Advisor regarding the reasons for such results (e.g., market conditions, security selection) and any efforts being undertaken to improve performance. The Fund’s performance was above its benchmark for the one-, three-, five-, and ten-year periods reviewed by the Board. The Board found the investment management services provided by the Advisor to the Fund to be satisfactory and consistent with the management agreement.
Shareholder and Other Services. Under the management agreement, the Advisor provides the Fund with a comprehensive package of transfer agency, shareholder, and other services. The Board, directly and through various committees of the Board, regularly reviews reports and evaluations of such services at its regular meetings. These reports include, but are not limited to,
31
information regarding the operational efficiency and accuracy of the shareholder and transfer agency services provided, staffing levels, shareholder satisfaction (as measured by external as well as internal sources), technology support, new products and services offered to Fund shareholders, securities trading activities, portfolio valuation services, auditing services, and legal and operational compliance activities. The Board particularly noted the Advisor’s continual efforts to maintain effective business continuity plans and to address cybersecurity threats. Certain aspects of shareholder and transfer agency service level efficiency and the quality of securities trading activities are measured by independent third party providers and are presented in comparison to other fund groups not managed by the Advisor. The Board found the services provided by the Advisor to the Fund under the management agreement to be competitive and of high quality.
Costs of Services and Profitability. The Advisor provides detailed information concerning its cost of providing various services to the Fund, its profitability in managing the Fund (pre- and post-distribution), its overall profitability, and its financial condition. The Directors have reviewed with the Advisor the methodology used to prepare this financial information. This information is considered in evaluating the Advisor’s financial condition, its ability to continue to provide services under the management agreement, and the reasonableness of the current management fee. The Board concluded that the Advisor’s profits were reasonable in light of the services provided to the Fund.
Ethics. The Board generally considers the Advisor’s commitment to providing quality services to shareholders and to conducting its business ethically. They noted that the Advisor’s practices generally meet or exceed industry best practices.
Economies of Scale. The Board also reviewed information provided by the Advisor regarding the possible existence of economies of scale in connection with the management of the Fund. The Board concluded that economies of scale are difficult to measure and predict with precision, especially on a fund-by-fund basis. The Board concluded that the Advisor is appropriately sharing economies of scale through its competitive fee structure, offering competitive fees from fund inception, and through reinvestment in its business to provide shareholders additional content and services. The Board also noted that economies of scale are shared with the Fund and its shareholders through management fee breakpoints that serve to reduce the effective management fee as the assets of the Fund grow.
Comparison to Other Funds’ Fees. The management agreement provides that the Fund pays the Advisor a single, all-inclusive (or unified) management fee for providing all services necessary for the management and operation of the Fund, other than brokerage expenses, expenses attributable to short sales, taxes, interest, extraordinary expenses, and the fees and expenses of the Fund’s independent Directors (including their independent legal counsel) and expenses incurred in connection with the provision of shareholder services and distribution services under a plan adopted pursuant to Rule 12b-1 under the 1940 Act. Under the unified fee structure, the Advisor is responsible for providing all investment advisory, custody, audit, administrative, compliance, recordkeeping, marketing and shareholder services, or arranging and supervising third parties to provide such services. By contrast, most other funds are charged a variety of fees, including an investment advisory fee, a transfer agency fee, an administrative fee, distribution charges, and other expenses. Other than their investment advisory fees and any applicable Rule 12b-1 distribution fees, all other components of the total fees charged by these other funds may be increased without shareholder approval. The Board believes the unified fee structure is a benefit to Fund shareholders because it clearly discloses to shareholders the cost of owning Fund shares, and, since the unified fee cannot be increased without a vote of Fund shareholders, it shifts to the Advisor the risk of increased costs of operating the Fund and provides a direct incentive to minimize administrative inefficiencies. Part of the Board’s analysis of fee levels involves reviewing certain evaluative data compiled by an independent provider comparing the Fund’s unified fee to the total expense ratios of its peers. The unified fee charged to shareholders of the Fund was below the median of the total expense ratios of the Fund’s peer expense universe and was within the range of its peer expense group. The Board concluded that the management fee paid by the
32
Fund to the Advisor under the management agreement is reasonable in light of the services provided to the Fund.
Comparison to Fees and Services Provided to Other Clients of the Advisor. The Directors also requested and received information from the Advisor concerning the nature of the services, fees, costs, and profitability of its advisory services to advisory clients other than the Fund. They observed that these varying types of client accounts require different services and involve different regulatory and entrepreneurial risks than the management of the Fund. The Board analyzed this information and concluded that the fees charged and services provided to the Fund were reasonable by comparison.
Payments to Intermediaries. The Directors also requested and received a description of payments made to intermediaries by the Fund and the Advisor. These payments include various payments made by the Fund or the Advisor to different types of intermediaries and recordkeepers for distribution and service activities provided for the Fund. The Board received confirmation from the Advisor that all such payments by the Fund intended for distribution were made pursuant to the Fund's 12b-1 Plan. The Board reviewed such information and found the payments to be reasonable in scope and purpose.
Collateral or “Fall-Out” Benefits Derived by the Advisor. The Board considered the existence of collateral benefits the Advisor may receive as a result of its relationship with the Fund. They concluded that the Advisor’s primary business is managing mutual funds and it generally does not use fund or shareholder information to generate profits in other lines of business, and therefore does not derive any significant collateral benefits from them. The Board noted that additional assets from other clients may offer the Advisor some benefit from increased leverage with service providers and counterparties. Additionally, the Advisor receives proprietary research from broker-dealers that execute fund portfolio transactions, which the Board concluded is likely to benefit other clients of the Advisor, as well as Fund shareholders. The Board also determined that the Advisor is able to provide investment management services to certain clients other than the Fund, at least in part, due to its existing infrastructure built to serve the fund complex. The Board concluded that appropriate allocation methodologies had been employed to assign resources and the cost of those resources to these other clients and, where expressly provided, these other client assets may be included with the assets of the Fund to determine breakpoints in the management fee schedule.
Existing Relationship. The Board also considered whether there was any reason for not continuing the existing arrangement with the Advisor. In this regard, the Board was mindful of the potential disruptions of the Fund’s operations and various risks, uncertainties, and other effects that could occur as a result of a decision not to continue such relationship. In particular, the Board recognized that most shareholders have invested in the Fund on the strength of the Advisor’s industry standing and reputation and in the expectation that the Advisor will have a continuing role in providing advisory services to the Fund.
Conclusion of the Directors. As a result of this process, the Board, including all of the independent Directors, taking into account all of the factors discussed above and the information provided by the Advisor and others in connection with its review and throughout the year, determined that the management fee is fair and reasonable in light of the services provided and that the investment management agreement between the Fund and the Advisor should be renewed.
33
| Additional Information |
Retirement Account Information
As required by law, distributions you receive from certain IRAs are subject to federal income tax withholding, unless you elect not to have withholding apply. Tax will be withheld on the total amount withdrawn even though you may be receiving amounts that are not subject to withholding, such as nondeductible contributions. In such case, excess amounts of withholding could occur. You may adjust your withholding election so that a greater or lesser amount will be withheld.
If you don’t want us to withhold on this amount, you must notify us to not withhold the federal income tax. You may notify us in writing or in certain situations by telephone or through other electronic means. For systematic withdrawals, your withholding election will remain in effect until revoked or changed by filing a new election. You have the right to revoke your election at any time.
Remember, even if you elect not to have income tax withheld, you are liable for paying income tax on the taxable portion of your withdrawal. If you elect not to have income tax withheld or you don’t have enough income tax withheld, you may be responsible for payment of estimated tax. You may incur penalties under the estimated tax rules if your withholding and estimated tax payments are not sufficient. You can reduce or defer the income tax on a distribution by directly or indirectly rolling such distribution over to another IRA or eligible plan. You should consult your tax advisor for additional information.
State tax will be withheld if, at the time of your distribution, your address is within one of the mandatory withholding states and you have federal income tax withheld (or as otherwise required by state law). State taxes will be withheld from your distribution in accordance with the respective state rules.
Distributions you receive from 403(b), 457 and qualified plans are subject to special tax and withholding rules. Your plan administrator or plan sponsor is required to provide you with a special tax notice explaining those rules at the time you request a distribution. If applicable, federal and/or state taxes may be withheld from your distribution amount.
Proxy Voting Policies
A description of the policies that the fund's investment advisor uses in exercising the voting rights associated with the securities purchased and/or held by the fund is available without charge, upon request, by calling 1-800-345-2021. It is also available on the "About Us" page of American Century Investments’ website at americancentury.com and on the Securities and Exchange Commission’s website at sec.gov. Information regarding how the investment advisor voted proxies relating to portfolio securities during the most recent 12-month period ended June 30 is available on the "About Us" page at americancentury.com. It is also available at sec.gov.
Quarterly Portfolio Disclosure
The fund files its complete schedule of portfolio holdings with the Securities and Exchange Commission (SEC) for the first and third quarters of each fiscal year on Form N-Q. The fund’s Forms N-Q are available on the SEC’s website at sec.gov, and may be reviewed and copied at the SEC’s Public Reference Room in Washington, DC. Information on the operation of the Public Reference Room may be obtained by calling 1-800-SEC-0330. The fund also makes its complete schedule of portfolio holdings for the most recent quarter of its fiscal year available on its website at americancentury.com and, upon request, by calling 1-800-345-2021.
34
Other Tax Information
The following information is provided pursuant to provisions of the Internal Revenue Code.
The fund hereby designates up to the maximum amount allowable as qualified dividend income for the fiscal year ended November 30, 2016.
For corporate taxpayers, the fund hereby designates $648,010, or up to the maximum amount allowable, of ordinary income distributions paid during the fiscal year ended November 30, 2016 as qualified for the corporate dividends received deduction.
The fund hereby designates $35,706,965, or up to the maximum amount allowable, as long-term capital gain distributions (20% rate gain distributions) for the fiscal year ended November 30, 2016.
35
| Notes |
36
| ||
| Contact Us | americancentury.com | |
| Automated Information Line | 1-800-345-8765 | |
| Investor Services Representative | 1-800-345-2021 or 816-531-5575 | |
| Investors Using Advisors | 1-800-378-9878 | |
| Business, Not-For-Profit, Employer-Sponsored Retirement Plans | 1-800-345-3533 | |
| Banks and Trust Companies, Broker-Dealers, Financial Professionals, Insurance Companies | 1-800-345-6488 | |
| Telecommunications Relay Service for the Deaf | 711 | |
| American Century World Mutual Funds, Inc. | ||
Investment Advisor: American Century Investment Management, Inc. Kansas City, Missouri | ||
| This report and the statements it contains are submitted for the general information of our shareholders. The report is not authorized for distribution to prospective investors unless preceded or accompanied by an effective prospectus. | ||
| ©2017 American Century Proprietary Holdings, Inc. All rights reserved. CL-ANN-91028 1701 | ||
| Annual Report | |
| November 30, 2016 | |
| Global Small Cap Fund | |
| Table of Contents |
| President’s Letter | |
| Performance | |
| Portfolio Commentary | |
| Fund Characteristics | |
| Shareholder Fee Example | |
| Schedule of Investments | |
| Statement of Assets and Liabilities | |
| Statement of Operations | |
| Statement of Changes in Net Assets | |
| Notes to Financial Statements | |
| Financial Highlights | |
| Report of Independent Registered Public Accounting Firm | |
| Management | |
| Additional Information | |
Any opinions expressed in this report reflect those of the author as of the date of the report, and do not necessarily represent the opinions of American Century Investments® or any other person in the American Century Investments organization. Any such opinions are subject to change at any time based upon market or other conditions and American Century Investments disclaims any responsibility to update such opinions. These opinions may not be relied upon as investment advice and, because investment decisions made by American Century Investments funds are based on numerous factors, may not be relied upon as an indication of trading intent on behalf of any American Century Investments fund. Security examples are used for representational purposes only and are not intended as recommendations to purchase or sell securities. Performance information for comparative indices and securities is provided to American Century Investments by third party vendors. To the best of American Century Investments’ knowledge, such information is accurate at the time of printing.
| President’s Letter |
Jonathan ThomasDear Investor:
Thank you for reviewing this annual report for the approximately eight-month period from the fund’s inception to November 30, 2016. Annual reports help convey important information about fund returns, including market factors that affected performance during the reporting period. For additional, updated investment and market insights, we encourage you to visit our website, americancentury.com.
A Period of Populist, Anti-Globalization Political Surprises
The reporting period produced mixed investment results under unsettled economic and market conditions, triggered in part by Brexit (the U.K.’s unexpected vote to leave the European Union) and Donald Trump’s victory in the U.S. presidential election. These market-moving political events were eye-opening manifestations of populist and anti-globalization political movements influenced partly by lingering economic weakness and extreme central bank monetary stimulus since the world-wide Great Recession nearly a decade ago. Years of low interest rates, market globalization, and corporate cost-cutting had benefited some segments of the world’s developed democracies much more than others. The others spoke up in June and November, voting for Brexit, then propelling Trump to victory.
Meanwhile, the global economy continued to rebound from its setbacks during the first six weeks of 2016, when concerns about China’s growth and plummeting oil prices affected the global economic outlook. China appeared to stabilize, and oil prices retraced some of their losses on signs that the major oil-producing countries might be able to cooperate on restricting crude oil supplies. Furthermore, major central banks, particularly in Europe and Japan, continued to provide massive monetary stimulus, supporting economic growth and investment returns. However, Trump’s win, rising U.S. interest rates, strength in the U.S. dollar, and concerns about proposed immigration restrictions and tariffs under the new Trump administration dampened the mood in non-U.S. markets.
Looking ahead, Trump’s victory unleashed potentially far-reaching ramifications that are still unfolding. What’s clear is that his policy proposals and unpredictable nature make uncertainty more certain, which could trigger bouts of short-term market volatility. In this unsettled environment, we strongly believe in staying the course and remaining focused on longer-term goals, using disciplined, actively managed, diversified, risk-aware strategies. We appreciate your continued trust in us.
Sincerely,
Jonathan Thomas
President and Chief Executive Officer
American Century Investments
2
| Performance |
| Total Returns as of November 30, 2016 | |||
Ticker Symbol | Since Inception | Inception Date | |
| Investor Class | AGCVX | 8.50% | 3/29/16 |
| MSCI ACWI Small Cap Index | — | 9.74% | — |
| Institutional Class | AGCSX | 8.60% | 3/29/16 |
| A Class | AGCLX | 3/29/16 | |
| No sales charge | 8.30% | ||
| With sales charge | 2.07% | ||
| C Class | AGCHX | 3/29/16 | |
| No sales charge | 7.80% | ||
| With sales charge | 6.80% | ||
| R Class | AGCWX | 8.10% | 3/29/16 |
| R6 Class | AGCTX | 8.80% | 3/29/16 |
Sales charges include initial sales charges and contingent deferred sales charges (CDSCs), as applicable. A Class shares have a 5.75% maximum initial sales charge and may be subject to a maximum CDSC of 1.00%. C Class shares redeemed within 12 months of purchase are subject to a maximum CDSC of 1.00%. The SEC requires that mutual funds provide performance information net of maximum sales charges in all cases where charges could be applied.
Data presented reflect past performance. Past performance is no guarantee of future results. Current performance may be higher or lower than the performance shown. Total returns for periods less than one year are not annualized. Investment return and principal value will fluctuate, and redemption value may be more or less than original cost. Data assumes reinvestment of dividends and capital gains, and none of the charts reflect the deduction of taxes that a shareholder would pay on fund distributions or the redemption of fund shares. To obtain performance data current to the most recent month end, please call 1-800-345-2021 or visit americancentury.com. For additional information about the fund, please consult the prospectus.
3
| Growth of $10,000 Over Life of Class |
| $10,000 investment made March 29, 2016 |
| Performance for other share classes will vary due to differences in fee structure. |
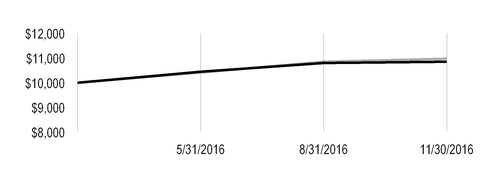
| Value on November 30, 2016 | |
| Investor Class — $10,850 | |
| MSCI ACWI Small Cap Index — $10,974 | |
Total Annual Fund Operating Expenses | |||||
Investor Class | Institutional Class | A Class | C Class | R Class | R6 Class |
| 1.51% | 1.31% | 1.76% | 2.51% | 2.01% | 1.16% |
The total annual fund operating expenses shown is as stated in the fund’s prospectus current as of the date of this report. The prospectus may vary from the expense ratio shown elsewhere in this report because it is based on a different time period, includes acquired fund fees and expenses, and, if applicable, does not include fee waivers or expense reimbursements.
Data presented reflect past performance. Past performance is no guarantee of future results. Current performance may be higher or lower than the performance shown. Total returns for periods less than one year are not annualized. Investment return and principal value will fluctuate, and redemption value may be more or less than original cost. Data assumes reinvestment of dividends and capital gains, and none of the charts reflect the deduction of taxes that a shareholder would pay on fund distributions or the redemption of fund shares. To obtain performance data current to the most recent month end, please call 1-800-345-2021 or visit americancentury.com. For additional information about the fund, please consult the prospectus.
4
| Portfolio Commentary |
Portfolio Managers: Trevor Gurwich and Federico Laffan
Performance Summary
Global Small Cap advanced 8.50%* for the period from March 29, 2016 (the fund’s inception), through November 30, 2016. The portfolio’s benchmark, the MSCI ACWI Small Cap Index, advanced 9.74% for the same period.
Small-cap stocks generally posted solid gains for the period, but growth stocks within the asset class underperformed value stocks. The continued low interest rate environment prompted a worldwide search for yield—a dynamic generally supportive of dividend-paying and yield-oriented investments rather than strategies focused on corporate profits and sustainable earnings growth.
Overall, stock selection primarily accounted for the fund’s underperformance versus the benchmark, particularly in the industrials, information technology, and consumer staples sectors. Regionally, stock selection and positioning relative to the benchmark in the U.S. (underweight), Japan (underweight), and Mexico (where the portfolio held one position, which was an overweight) detracted from fund performance.
U.S.-based Health Care Supplier Was a Main Detractor
In addition to the sectors noted above, the portfolio’s exposure to the health care sector detracted from performance, largely due to stock selection within the health care equipment and supplies industry. In particular, a portfolio-only position in iRadimed, a maker of non-magnetic IVs for MRIs, was among the largest detractors. The stock price of the U.S.-based company suffered after iRadimed announced weak third-quarter 2016 results and lowered its earnings guidance for the fourth quarter and entire year. We exited the position.
Slowing consumer trends during the third quarter of 2016 led to a reduced weighting in the portfolio’s consumer discretionary exposure. In particular, we sold certain advertising companies that experienced disappointing results amid a slight slowdown in global growth and the reluctance among some corporations to increase spending on advertising. In particular, we sold the portfolio’s overweight position in MDC Partners, a U.S.-based advertising and marketing company, which was a main detractor. The company’s stock price declined after MDC reported weak first-quarter results and lowered its full-year guidance.
We also sold the portfolio’s overweight position in Japan-based W-Scope. The maker of plastic separator sheets for lithium-ion batteries struggled despite generating strong performance early in 2016. In particular, concerns about growing competition from China-based companies with similar, less-expensive products pressured the stock.
Energy Companies Were Top Contributors
Stock selection and an overweight position in the energy sector, stock selection and an underweight position in the utilities sector, and an underweight position in the real estate sector were the main contributors to the fund’s relative performance. In addition, our stock selection efforts in Norway, Switzerland, and Australia, along with an overweight position in Australia, aided relative performance.
*All fund returns referenced in this commentary are for Investor Class shares. Total returns for periods less than one year are not annualized. Performance for other share classes will vary due to differences in fee structure; when Investor Class performance exceeds that of the fund's benchmark, other share classes may not. See page 3 for returns for all share classes.
5
An overweight position in Norway-based Aker BP (formerly Det Norske Oljeselskap), an oil exploration and development company focused on petroleum resources in the North Sea, was a top contributor to portfolio performance. Rising oil prices along with announcements in September 2016 and November 2016 from OPEC regarding its intent to cut production helped drive the company’s stock price higher. In addition, the company benefited from its low cost profile and from its production of the largest offshore oil field Norway has developed in 30 years.
Similarly, an overweight position in Parsley Energy, a U.S.-based oil and gas exploration and production company focused on the Permian Basin, was a main contributor. The company’s stock price advanced throughout the period along with rising oil prices. Stock price gains were particularly strong in November, when early in the month the company announced strong third-quarter results and increased its full-year production guidance. Additionally, Permian Basin-focused producers issued robust production growth reports in November, boosting Parsley’s outlook for 2017. Furthermore, OPEC’s late-November decision to cut production sent the company’s stock price soaring on the last day of the month.
In the consumer staples sector, an overweight position in Nutrisystem, a U.S.-based provider of weight-loss products and services, was a top contributor. The company’s stock price rallied early in the period, after Nutrisystem reported better-than-expected first-quarter revenue and earnings and raised its revenue estimates for 2016.
Outlook
We have built a fundamentally driven, risk-managed portfolio that invests in global small-cap companies we believe are demonstrating early and sustainable accelerating growth. Using a proprietary investment process, we look for companies with the potential to exhibit faster growth rates than their peers. Although macroeconomic conditions, broad sector trends, and industry-specific events do not drive the investment process, we consider these factors when evaluating a company’s earnings growth potential.
From a positioning perspective, we increased the portfolio’s weighting to the industrials sector as the period progressed, and industrials ended November as an overweight position and the portfolio’s largest sector. In particular, we expect several companies to experience solid earnings growth as the global economic expansion cycle progresses and improves. In addition, as commodity prices have continued to stabilize and supply/demand imbalances move toward equilibrium, we have been finding attractive growth opportunities in the energy sector, which also ended the period as an overweight. Meanwhile, we have been selectively adding to the portfolio’s position in the financials sector, which remained an underweight. We prefer holdings with company-specific growth drivers, but rising interest rates and potentially lower governmental regulation would provide an extra tailwind to our thesis. Although certain areas of the portfolio have underperformed (particularly in the technology and health care sectors), we believe the revenue and earnings growth opportunities in these companies remain unparalleled globally, and we expect to opportunistically add exposure on short-term weakness. Elsewhere, we remain selective toward emerging markets, particularly in the wake of Donald Trump’s victory in the U.S. presidential election. Trump administration policies likely will lead to higher U.S. interest rates, a stronger U.S. dollar, and trade policy uncertainty—all of which represent formidable challenges for emerging markets.
6
| Fund Characteristics |
| NOVEMBER 30, 2016 | |
Top Ten Holdings | % of net assets |
| Hostess Brands, Inc. | 2.4% |
| Home BancShares, Inc. | 1.8% |
| Aker BP ASA | 1.6% |
| MarketAxess Holdings, Inc. | 1.5% |
| FCB Financial Holdings, Inc., Class A | 1.5% |
| Western Alliance Bancorp | 1.5% |
| SSAB AB, A Shares | 1.4% |
| Nutrisystem, Inc. | 1.4% |
| Parex Resources, Inc. | 1.4% |
| Sensient Technologies Corp. | 1.3% |
Types of Investments in Portfolio | % of net assets |
| Foreign Common Stocks | 51.5% |
| Domestic Common Stocks | 47.3% |
| Exchange-Traded Funds | 0.7% |
| Total Equity Exposure | 99.5% |
| Temporary Cash Investments | 0.6% |
| Other Assets and Liabilities | (0.1)% |
Investments by Country | % of net assets |
| United States | 47.3% |
| Japan | 11.8% |
| United Kingdom | 7.0% |
| Canada | 5.9% |
| Sweden | 3.7% |
| Switzerland | 3.1% |
| Italy | 2.3% |
| Australia | 2.2% |
| Germany | 2.2% |
| China | 2.1% |
| Norway | 2.0% |
| Other Countries | 9.2% |
| Exchange-Traded Funds* | 0.7% |
| Cash and Equivalents** | 0.5% |
| * | Category may increase exposure to the countries indicated. The Schedule of Investments provides additional information on the fund's portfolio holdings. |
**Includes temporary cash investments and other assets and liabilities.
7
| Shareholder Fee Example |
Fund shareholders may incur two types of costs: (1) transaction costs, including sales charges (loads) on purchase payments and redemption/exchange fees; and (2) ongoing costs, including management fees; distribution and service (12b-1) fees; and other fund expenses. This example is intended to help you understand your ongoing costs (in dollars) of investing in your fund and to compare these costs with the ongoing cost of investing in other mutual funds.
The example is based on an investment of $1,000 made at the beginning of the period and held for the entire period from June 1, 2016 to November 30, 2016.
Actual Expenses
The table provides information about actual account values and actual expenses for each class. You may use the information, together with the amount you invested, to estimate the expenses that you paid over the period. First, identify the share class you own. Then simply divide your account value by $1,000 (for example, an $8,600 account value divided by $1,000 = 8.6), then multiply the result by the number under the heading “Expenses Paid During Period” to estimate the expenses you paid on your account during this period.
If you hold Investor Class shares of any American Century Investments fund, or Institutional Class shares of the American Century Diversified Bond Fund, in an American Century Investments account (i.e., not a financial intermediary or retirement plan account), American Century Investments may charge you a $12.50 semiannual account maintenance fee if the value of those shares is less than $10,000. We will redeem shares automatically in one of your accounts to pay the $12.50 fee. In determining your total eligible investment amount, we will include your investments in all personal accounts (including American Century Investments Brokerage accounts) registered under your Social Security number. Personal accounts include individual accounts, joint accounts, UGMA/UTMA accounts, personal trusts, Coverdell Education Savings Accounts and IRAs (including traditional, Roth, Rollover, SEP-, SARSEP- and SIMPLE-IRAs), and certain other retirement accounts. If you have only business, business retirement, employer-sponsored or American Century Investments Brokerage accounts, you are currently not subject to this fee. If you are subject to the Account Maintenance Fee, your account value could be reduced by the fee amount.
Hypothetical Example for Comparison Purposes
The table also provides information about hypothetical account values and hypothetical expenses based on the actual expense ratio of each class of your fund and an assumed rate of return of 5% per year before expenses, which is not the actual return of a fund’s share class. The hypothetical account values and expenses may not be used to estimate the actual ending account balance or expenses you paid for the period. You may use this information to compare the ongoing costs of investing in your fund and other funds. To do so, compare this 5% hypothetical example with the 5% hypothetical examples that appear in the shareholder reports of the other funds.
Please note that the expenses shown in the table are meant to highlight your ongoing costs only and do not reflect any transactional costs, such as sales charges (loads) or redemption/exchange fees. Therefore, the table is useful in comparing ongoing costs only, and will not help you determine the relative total costs of owning different funds. In addition, if these transactional costs were included, your costs would have been higher.
8
| Beginning Account Value 6/1/16 | Ending Account Value 11/30/16 | Expenses Paid During Period(1) 6/1/16 - 11/30/16 | Annualized Expense Ratio(1) | |
Actual | ||||
| Investor Class | $1,000 | $1,039.30 | $7.65 | 1.50% |
| Institutional Class | $1,000 | $1,040.20 | $6.63 | 1.30% |
| A Class | $1,000 | $1,038.40 | $8.92 | 1.75% |
| C Class | $1,000 | $1,034.50 | $12.72 | 2.50% |
| R Class | $1,000 | $1,036.40 | $10.18 | 2.00% |
| R6 Class | $1,000 | $1,042.10 | $5.87 | 1.15% |
Hypothetical | ||||
| Investor Class | $1,000 | $1,017.50 | $7.57 | 1.50% |
| Institutional Class | $1,000 | $1,018.50 | $6.56 | 1.30% |
| A Class | $1,000 | $1,016.25 | $8.82 | 1.75% |
| C Class | $1,000 | $1,012.50 | $12.58 | 2.50% |
| R Class | $1,000 | $1,015.00 | $10.07 | 2.00% |
| R6 Class | $1,000 | $1,019.25 | $5.81 | 1.15% |
| (1) | Expenses are equal to the class's annualized expense ratio listed in the table above, multiplied by the average account value over the period, multiplied by 183, the number of days in the most recent fiscal half-year, divided by 366, to reflect the one-half year period. |
9
| Schedule of Investments |
NOVEMBER 30, 2016
| Shares | Value | ||||
| COMMON STOCKS — 98.8% | |||||
| Australia — 2.2% | |||||
| BlueScope Steel Ltd. | 6,507 | $ | 43,342 | ||
| Domino's Pizza Enterprises Ltd. | 1,083 | 54,206 | |||
| Pact Group Holdings Ltd. | 5,612 | 26,979 | |||
| 124,527 | |||||
| Belgium — 0.7% | |||||
Galapagos NV(1) | 690 | 41,004 | |||
| Brazil — 0.5% | |||||
| CVC Brasil Operadora e Agencia de Viagens SA | 3,600 | 25,323 | |||
| Canada — 5.9% | |||||
| Aecon Group, Inc. | 2,136 | 24,853 | |||
| Canadian Energy Services & Technology Corp. | 6,814 | 35,457 | |||
| Enerflex Ltd. | 4,371 | 55,512 | |||
| FirstService Corp. | 661 | 28,703 | |||
| HudBay Minerals, Inc. | 4,733 | 31,922 | |||
Parex Resources, Inc.(1) | 6,026 | 78,684 | |||
Raging River Exploration, Inc.(1) | 3,461 | 27,388 | |||
Shopify, Inc., Class A(1) | 1,122 | 47,092 | |||
| 329,611 | |||||
| China — 2.1% | |||||
Bitauto Holdings Ltd. ADR(1) | 778 | 17,544 | |||
Kingdee International Software Group Co. Ltd.(1) | 94,000 | 40,719 | |||
| Tongda Group Holdings Ltd. | 200,000 | 58,790 | |||
| 117,053 | |||||
| Denmark — 0.5% | |||||
| Rockwool International A/S, B Shares | 164 | 26,444 | |||
| Finland — 1.5% | |||||
| Konecranes Oyj | 810 | 27,935 | |||
Outokumpu Oyj(1) | 7,033 | 54,339 | |||
| 82,274 | |||||
| France — 1.8% | |||||
| Eurofins Scientific SE | 117 | 51,207 | |||
Nexans SA(1) | 906 | 47,300 | |||
| 98,507 | |||||
| Germany — 2.2% | |||||
| CTS Eventim AG & Co. KGaA | 830 | 24,728 | |||
| Grammer AG | 465 | 23,062 | |||
| Sartorius AG Preference Shares | 535 | 39,748 | |||
Stabilus SA(1) | 718 | 35,613 | |||
| 123,151 | |||||
| Hong Kong — 1.6% | |||||
| Melco International Development Ltd. | 35,000 | 56,314 | |||
| Sa Sa International Holdings Ltd. | 78,000 | 34,995 | |||
| 91,309 | |||||
| Italy — 2.3% | |||||
| Amplifon SpA | 7,106 | 68,158 | |||
10
| Shares | Value | ||||
| Davide Campari-Milano SpA | 6,298 | $ | 60,742 | ||
| 128,900 | |||||
| Japan — 11.8% | |||||
| BML, Inc. | 1,500 | 34,535 | |||
| Dip Corp. | 1,600 | 33,607 | |||
| eRex Co. Ltd. | 2,000 | 51,256 | |||
| GMO Payment Gateway, Inc. | 600 | 24,702 | |||
| Harmonic Drive Systems, Inc. | 1,400 | 36,895 | |||
| Hirata Corp. | 700 | 45,951 | |||
| Itochu Techno-Solutions Corp. | 900 | 24,230 | |||
| JAC Recruitment Co. Ltd. | 1,900 | 21,839 | |||
Kyushu Railway Co.(1) | 100 | 2,589 | |||
| MISUMI Group, Inc. | 1,900 | 33,979 | |||
| Nifco, Inc. | 700 | 38,425 | |||
| Nihon M&A Center, Inc. | 1,500 | 40,907 | |||
| Osaki Electric Co. Ltd. | 5,000 | 50,304 | |||
| SMS Co. Ltd. | 1,300 | 32,476 | |||
| Topcon Corp. | 3,400 | 50,493 | |||
| Ulvac, Inc. | 1,700 | 51,042 | |||
| Vector, Inc. | 3,900 | 41,112 | |||
| Yumeshin Holdings Co. Ltd. | 7,200 | 47,012 | |||
| 661,354 | |||||
| Mexico — 0.4% | |||||
| Alsea SAB de CV | 7,609 | 22,336 | |||
| Netherlands — 0.4% | |||||
InterXion Holding NV(1) | 729 | 24,903 | |||
| Norway — 2.0% | |||||
| Aker BP ASA | 5,351 | 86,987 | |||
| TGS Nopec Geophysical Co. ASA | 1,357 | 26,666 | |||
| 113,653 | |||||
| Sweden — 3.7% | |||||
Dometic Group AB(1) | 7,702 | 54,908 | |||
| Saab AB, B Shares | 1,959 | 72,729 | |||
SSAB AB, A Shares(1) | 20,981 | 81,100 | |||
| 208,737 | |||||
| Switzerland — 3.1% | |||||
| Logitech International SA | 2,198 | 54,156 | |||
| Straumann Holding AG | 71 | 25,454 | |||
| Temenos Group AG | 928 | 64,258 | |||
VAT Group AG(1) | 363 | 28,384 | |||
| 172,252 | |||||
| Taiwan — 1.3% | |||||
| AirTAC International Group | 5,000 | 37,885 | |||
| Gourmet Master Co. Ltd. | 4,200 | 34,985 | |||
| 72,870 | |||||
| Thailand — 0.5% | |||||
| Taokaenoi Food & Marketing PCL | 40,200 | 30,421 | |||
| United Kingdom — 7.0% | |||||
ASOS plc(1) | 1,136 | 71,736 | |||
| BBA Aviation plc | 8,694 | 28,533 | |||
| Bellway plc | 2,062 | 63,003 | |||
11
| Shares | Value | ||||
| Rentokil Initial plc | 25,749 | $ | 69,074 | ||
| RPC Group plc | 4,640 | 62,526 | |||
Tullow Oil plc(1) | 7,902 | 29,443 | |||
| UDG Healthcare plc | 8,320 | 68,446 | |||
| 392,761 | |||||
| United States — 47.3% | |||||
Aratana Therapeutics, Inc.(1) | 5,494 | 39,172 | |||
| Astec Industries, Inc. | 720 | 47,736 | |||
| Bank of Hawaii Corp. | 865 | 72,115 | |||
Barracuda Networks, Inc.(1) | 1,736 | 38,261 | |||
| BWX Technologies, Inc. | 1,005 | 39,356 | |||
Collegium Pharmaceutical, Inc.(1) | 2,755 | 45,623 | |||
Copart, Inc.(1) | 1,058 | 57,894 | |||
| Drew Industries, Inc. | 409 | 42,986 | |||
| EastGroup Properties, Inc. | 618 | 42,216 | |||
Euronet Worldwide, Inc.(1) | 869 | 62,325 | |||
| Fair Isaac Corp. | 303 | 34,448 | |||
FCB Financial Holdings, Inc., Class A(1) | 1,933 | 85,535 | |||
| First Industrial Realty Trust, Inc. | 1,623 | 42,928 | |||
Flexion Therapeutics, Inc.(1) | 2,559 | 42,223 | |||
| Granite Construction, Inc. | 592 | 34,922 | |||
| Harsco Corp. | 4,347 | 60,858 | |||
| Healthcare Services Group, Inc. | 769 | 29,953 | |||
| HEICO Corp. | 420 | 32,970 | |||
| Home BancShares, Inc. | 3,845 | 99,470 | |||
Hostess Brands, Inc.(1) | 10,382 | 134,447 | |||
INC Research Holdings, Inc., Class A(1) | 1,250 | 61,875 | |||
| James River Group Holdings Ltd. | 1,443 | 56,248 | |||
| John Bean Technologies Corp. | 433 | 39,057 | |||
| Kennametal, Inc. | 1,700 | 58,633 | |||
| Lincoln Electric Holdings, Inc. | 610 | 47,891 | |||
Lumber Liquidators Holdings, Inc.(1) | 2,851 | 50,320 | |||
| MarketAxess Holdings, Inc. | 522 | 86,532 | |||
Medpace Holdings, Inc.(1) | 1,684 | 60,085 | |||
| Monolithic Power Systems, Inc. | 812 | 66,616 | |||
Nanometrics, Inc.(1) | 1,160 | 27,736 | |||
| Nutrisystem, Inc. | 2,160 | 79,380 | |||
Parsley Energy, Inc., Class A(1) | 1,643 | 62,680 | |||
| Power Integrations, Inc. | 624 | 41,995 | |||
| ProAssurance Corp. | 992 | 55,602 | |||
PTC, Inc.(1) | 903 | 43,985 | |||
| RenaissanceRe Holdings Ltd. | 453 | 59,144 | |||
| Scotts Miracle-Gro Co. (The), Class A | 485 | 44,266 | |||
| Sensient Technologies Corp. | 939 | 73,327 | |||
SiteOne Landscape Supply, Inc.(1) | 755 | 25,293 | |||
| Six Flags Entertainment Corp. | 807 | 46,515 | |||
Square, Inc.(1) | 2,173 | 28,119 | |||
Summit Materials, Inc., Class A(1) | 2,065 | 49,085 | |||
SVB Financial Group(1) | 391 | 61,790 | |||
Trupanion, Inc.(1) | 3,280 | 54,612 | |||
US Concrete, Inc.(1) | 490 | 27,856 | |||
12
| Shares | Value | ||||
| US Silica Holdings, Inc. | 1,204 | $ | 60,934 | ||
| Vail Resorts, Inc. | 352 | 55,757 | |||
Vocera Communications, Inc.(1) | 2,975 | 54,145 | |||
Western Alliance Bancorp(1) | 1,814 | 84,750 | |||
| 2,649,666 | |||||
TOTAL COMMON STOCKS (Cost $4,953,349) | 5,537,056 | ||||
| EXCHANGE-TRADED FUNDS — 0.7% | |||||
| VanEck Vectors India Small-Cap Index ETF, Class C (Cost $35,952) | 958 | 40,600 | |||
| TEMPORARY CASH INVESTMENTS — 0.6% | |||||
| State Street Institutional U.S. Government Money Market Fund, Premier Class (Cost $31,716) | 31,716 | 31,716 | |||
TOTAL INVESTMENT SECURITIES — 100.1% (Cost $5,021,017) | 5,609,372 | ||||
| OTHER ASSETS AND LIABILITIES — (0.1)% | (4,282 | ) | |||
| TOTAL NET ASSETS — 100.0% | $ | 5,605,090 | |||
| MARKET SECTOR DIVERSIFICATION | ||
(as a % of net assets) | ||
| Industrials | 19.0 | % |
| Information Technology | 16.3 | % |
| Financials | 15.9 | % |
| Consumer Discretionary | 14.6 | % |
| Health Care | 11.3 | % |
| Materials | 8.9 | % |
| Energy | 8.2 | % |
| Real Estate | 2.1 | % |
| Consumer Staples | 1.6 | % |
| Utilities | 0.9 | % |
| Exchange-Traded Funds | 0.7 | % |
| Cash and Equivalents* | 0.5 | % |
*Includes temporary cash investments and other assets and liabilities.
| NOTES TO SCHEDULE OF INVESTMENTS | ||
| ADR | - | American Depositary Receipt |
| (1) | Non-income producing. |
See Notes to Financial Statements.
13
| Statement of Assets and Liabilities |
| NOVEMBER 30, 2016 | |||
| Assets | |||
| Investment securities, at value (cost of $5,021,017) | $ | 5,609,372 | |
| Foreign currency holdings, at value (cost of $648) | 646 | ||
| Receivable for investments sold | 102,452 | ||
| Receivable for capital shares sold | 83 | ||
| Dividends and interest receivable | 5,492 | ||
| 5,718,045 | |||
| Liabilities | |||
| Payable for investments purchased | 94,465 | ||
| Payable for capital shares redeemed | 10,704 | ||
| Accrued management fees | 6,611 | ||
| Distribution and service fees payable | 1,175 | ||
| 112,955 | |||
| Net Assets | $ | 5,605,090 | |
| Net Assets Consist of: | |||
| Capital (par value and paid-in surplus) | $ | 5,179,717 | |
| Accumulated net investment loss | (16,565 | ) | |
| Accumulated net realized loss | (146,129 | ) | |
| Net unrealized appreciation | 588,067 | ||
| $ | 5,605,090 | ||
| Net Assets | Shares Outstanding | Net Asset Value Per Share | ||||
| Investor Class, $0.01 Par Value | $2,357,333 | 217,289 | $10.85 | |||
| Institutional Class, $0.01 Par Value | $651,806 | 60,000 | $10.86 | |||
| A Class, $0.01 Par Value | $1,083,061 | 100,000 | $10.83* | |||
| C Class, $0.01 Par Value | $1,077,615 | 100,000 | $10.78 | |||
| R Class, $0.01 Par Value | $217,788 | 20,142 | $10.81 | |||
| R6 Class, $0.01 Par Value | $217,487 | 20,000 | $10.87 | |||
*Maximum offering price $11.49 (net asset value divided by 0.9425).
See Notes to Financial Statements.
14
| Statement of Operations |
FOR THE PERIOD ENDED NOVEMBER 30, 2016(1) | |||
| Investment Income (Loss) | |||
| Income: | |||
| Dividends (net of foreign taxes withheld of $2,997) | $ | 39,724 | |
| Interest | 155 | ||
| 39,879 | |||
| Expenses: | |||
| Management fees | 52,864 | ||
| Distribution and service fees: | |||
| A Class | 1,775 | ||
| C Class | 7,084 | ||
| R Class | 711 | ||
| Directors' fees and expenses | 115 | ||
| 62,549 | |||
| Net investment income (loss) | (22,670 | ) | |
| Realized and Unrealized Gain (Loss) | |||
| Net realized gain (loss) on: | |||
| Investment transactions | (146,515 | ) | |
| Foreign currency transactions | 3,132 | ||
| (143,383 | ) | ||
| Change in net unrealized appreciation (depreciation) on: | |||
| Investments | 588,355 | ||
| Translation of assets and liabilities in foreign currencies | (288 | ) | |
| 588,067 | |||
| Net realized and unrealized gain (loss) | 444,684 | ||
| Net Increase (Decrease) in Net Assets Resulting from Operations | $ | 422,014 | |
| (1) | March 29, 2016 (fund inception) through November 30, 2016. |
See Notes to Financial Statements.
15
| Statement of Changes in Net Assets |
PERIOD ENDED NOVEMBER 30, 2016(1) | |||
| Increase (Decrease) in Net Assets | |||
| Operations | |||
| Net investment income (loss) | $ | (22,670 | ) |
| Net realized gain (loss) | (143,383 | ) | |
| Change in net unrealized appreciation (depreciation) | 588,067 | ||
| Net increase (decrease) in net assets resulting from operations | 422,014 | ||
| Capital Share Transactions | |||
| Net increase (decrease) in net assets from capital share transactions (Note 5) | 5,183,076 | ||
| Net increase (decrease) in net assets | 5,605,090 | ||
| Net Assets | |||
| End of period | $ | 5,605,090 | |
| Accumulated net investment loss | $ | (16,565 | ) |
| (1) | March 29, 2016 (fund inception) through November 30, 2016. |
See Notes to Financial Statements.
16
| Notes to Financial Statements |
NOVEMBER 30, 2016
1. Organization
American Century World Mutual Funds, Inc. (the corporation) is registered under the Investment Company Act of 1940, as amended (the 1940 Act), as an open-end management investment company and is organized as a Maryland corporation. Global Small Cap Fund (the fund) is one fund in a series issued by the corporation. The fund’s investment objective is to seek capital growth.
The fund offers the Investor Class, the Institutional Class, the A Class, the C Class, the R Class and the R6 Class. The A Class may incur an initial sales charge. The A Class and C Class may be subject to a contingent deferred sales charge. The share classes differ principally in their respective sales charges and distribution and shareholder servicing expenses and arrangements. The Institutional Class and R6 Class shareholders do not require the same level of shareholder and administrative services from American Century Investment Management, Inc. (ACIM) (the investment advisor) as shareholders of other classes. In addition, financial intermediaries do not receive any fees for the R6 Class. As a result, the Institutional Class and R6 Class are charged lower unified management fees. All classes of the fund commenced sale on March 29, 2016, the fund's inception date.
2. Significant Accounting Policies
The following is a summary of significant accounting policies consistently followed by the fund in preparation of its financial statements. The fund is an investment company and follows accounting and reporting guidance in accordance with accounting principles generally accepted in the United States of America. This may require management to make certain estimates and assumptions at the date of the financial statements. Actual results could differ from these estimates. Management evaluated the impact of events or transactions occurring through the date the financial statements were issued that would merit recognition or disclosure.
Investment Valuations — The fund determines the fair value of its investments and computes its net asset value per share at the close of regular trading (usually 4 p.m. Eastern time) on the New York Stock Exchange (NYSE) on each day the NYSE is open. The Board of Directors has adopted valuation policies and procedures to guide the investment advisor in the fund’s investment valuation process and to provide methodologies for the oversight of the fund’s pricing function.
Equity securities that are listed or traded on a domestic securities exchange are valued at the last reported sales price or at the official closing price as provided by the exchange. Equity securities traded on foreign securities exchanges are generally valued at the closing price of such securities on the exchange where primarily traded or at the close of the NYSE, if that is earlier. If no last sales price is reported, or if local convention or regulation so provides, the mean of the latest bid and asked prices may be used. Securities traded over-the-counter are valued at the mean of the latest bid and asked prices, the last sales price, or the official closing price. Equity securities initially expressed in local currencies are translated into U.S. dollars at the mean of the appropriate currency exchange rate at the close of the NYSE as provided by an independent pricing service.
Open-end management investment companies are valued at the reported net asset value per share. Repurchase agreements are valued at cost, which approximates fair value.
If the fund determines that the market price for an investment is not readily available or the valuation methods mentioned above do not reflect an investment’s fair value, such investment is valued as determined in good faith by the Board of Directors or its delegate, in accordance with policies and procedures adopted by the Board of Directors. In its determination of fair value, the fund may review several factors including, but not limited to, market information regarding the specific investment or comparable investments and correlation with other investment types, futures indices or general market indicators. Circumstances that may cause the fund to use these procedures to value an investment include, but are not limited to: an investment has been declared in default or is distressed; trading in a security has been suspended during the trading day or a security is not actively trading on its principal exchange; prices received from a regular pricing source are deemed unreliable; or there is a foreign market holiday and no trading occurred.
17
The fund monitors for significant events occurring after the close of an investment’s primary exchange but before the fund’s net asset value per share is determined. Significant events may include, but are not limited to: corporate announcements and transactions; governmental action and political unrest that could impact a specific investment or an investment sector; or armed conflicts, natural disasters and similar events that could affect investments in a specific country or region. The fund also monitors for significant fluctuations between domestic and foreign markets, as evidenced by the U.S. market or such other indicators that the Board of Directors, or its delegate, deems appropriate. If significant fluctuations in foreign markets are identified, the fund may apply a model-derived factor to the closing price of equity securities traded on foreign securities exchanges. The factor is based on observable market data as provided by an independent pricing service.
Security Transactions — Security transactions are accounted for as of the trade date. Net realized gains and losses are determined on the identified cost basis, which is also used for federal income tax purposes.
Investment Income — Dividend income less foreign taxes withheld, if any, is recorded as of the ex-dividend date. Distributions received on securities that represent a return of capital or long-term capital gain are recorded as a reduction of cost of investments and/or as a realized gain. The fund may estimate the components of distributions received that may be considered nontaxable distributions or long-term capital gain distributions for income tax purposes. Interest income is recorded on the accrual basis and includes accretion of discounts and amortization of premiums.
Foreign Currency Translations — All assets and liabilities initially expressed in foreign currencies are translated into U.S. dollars at prevailing exchange rates at period end. The fund may enter into spot foreign currency exchange contracts to facilitate transactions denominated in a foreign currency. Purchases and sales of investment securities, dividend and interest income, spot foreign currency exchange contracts, and expenses are translated at the rates of exchange prevailing on the respective dates of such transactions. Net realized and unrealized foreign currency exchange gains or losses related to investment securities are a component of net realized gain (loss) on investment transactions and change in net unrealized appreciation (depreciation) on investments, respectively.
Repurchase Agreements — The fund may enter into repurchase agreements with institutions that ACIM has determined are creditworthy pursuant to criteria adopted by the Board of Directors. The fund requires that the collateral, represented by securities, received in a repurchase transaction be transferred to the custodian in a manner sufficient to enable the fund to obtain those securities in the event of a default under the repurchase agreement. ACIM monitors, on a daily basis, the securities transferred to ensure the value, including accrued interest, of the securities under each repurchase agreement is equal to or greater than amounts owed to the fund under each repurchase agreement.
Joint Trading Account — Pursuant to an Exemptive Order issued by the Securities and Exchange Commission, the fund, along with certain other funds in the American Century Investments family of funds, may transfer uninvested cash balances into a joint trading account. These balances are invested in one or more repurchase agreements that are collateralized by U.S. Treasury or Agency obligations.
Income Tax Status — It is the fund’s policy to distribute substantially all net investment income and net realized gains to shareholders and to otherwise qualify as a regulated investment company under provisions of the Internal Revenue Code. Accordingly, no provision has been made for income taxes. The fund files U.S. federal, state, local and non-U.S. tax returns as applicable. The fund's tax returns are subject to examination by the relevant taxing authority until expiration of the applicable statute of limitations, which is generally three years from the date of filing but can be longer in certain jurisdictions. At this time, management believes there are no uncertain tax positions which, based on their technical merit, would not be sustained upon examination and for which it is reasonably possible that the total amounts of unrecognized tax benefits will significantly change in the next twelve months.
Multiple Class — All shares of the fund represent an equal pro rata interest in the net assets of the class to which such shares belong, and have identical voting, dividend, liquidation and other rights and the same terms and conditions, except for class specific expenses and exclusive rights to vote on matters affecting only individual classes. Income, non-class specific expenses, and realized and unrealized capital gains and losses of the fund are allocated to each class of shares based on their relative net assets.
Distributions to Shareholders — Distributions from net investment income and net realized gains, if any, are generally declared and paid annually. The fund may make distributions on a more frequent basis to comply with the distribution requirements of the Internal Revenue Code, in all events in a manner consistent with provisions of the 1940 Act.
18
Indemnifications — Under the corporation’s organizational documents, its officers and directors are indemnified against certain liabilities arising out of the performance of their duties to the fund. In addition, in the normal course of business, the fund enters into contracts that provide general indemnifications. The maximum exposure under these arrangements is unknown as this would involve future claims that may be made against a fund. The risk of material loss from such claims is considered by management to be remote.
3. Fees and Transactions with Related Parties
Certain officers and directors of the corporation are also officers and/or directors of American Century Companies, Inc. (ACC). The corporation’s investment advisor, ACIM, the corporation's distributor, American Century Investment Services, Inc. (ACIS), and the corporation’s transfer agent, American Century Services, LLC, are wholly owned, directly or indirectly, by ACC. ACIM owns 97% of the shares of the fund. Related parties do not invest in the fund for the purpose of exercising management or control.
Management Fees — The corporation has entered into a management agreement with ACIM, under which ACIM provides the fund with investment advisory and management services in exchange for a single, unified management fee (the fee) per class. The agreement provides that all expenses of managing and operating the fund, except distribution and service fees, brokerage expenses, taxes, interest, fees and expenses of the independent directors (including legal counsel fees), and extraordinary expenses, will be paid by ACIM. The fee is computed and accrued daily based on each class’s daily net assets and paid monthly in arrears. The annual management fee is 1.50% for the Investor Class, A Class, C Class and R Class, 1.30% for the Institutional Class and 1.15% for the R6 Class.
Distribution and Service Fees — The Board of Directors has adopted a separate Master Distribution and Individual Shareholder Services Plan for each of the A Class, C Class and R Class (collectively the plans), pursuant to Rule 12b-1 of the 1940 Act. The plans provide that the A Class will pay ACIS an annual distribution and service fee of 0.25%. The plans provide that the C Class will pay ACIS an annual distribution and service fee of 1.00%, of which 0.25% is paid for individual shareholder services and 0.75% is paid for distribution services. The plans provide that the R Class will pay ACIS an annual distribution and service fee of 0.50%. The fees are computed and accrued daily based on each class’s daily net assets and paid monthly in arrears. The fees are used to pay financial intermediaries for distribution and individual shareholder services. Fees incurred under the plans during the period March 29, 2016 (fund inception) through November 30, 2016 are detailed in the Statement of Operations.
Directors' Fees and Expenses — The Board of Directors is responsible for overseeing the investment advisor’s management and operations of the fund. The directors receive detailed information about the fund and its investment advisor regularly throughout the year, and meet at least quarterly with management of the investment advisor to review reports about fund operations. The fund’s officers do not receive compensation from the fund.
Acquired Fund Fees and Expenses — The fund may invest in mutual funds, exchange-traded funds, and business development companies (the acquired funds). The fund will indirectly realize its pro rata share of the fees and expenses of the acquired funds in which it invests. These indirect fees and expenses are not paid out of the fund's assets but are reflected in the return realized by the fund on its investment in the acquired funds.
4. Investment Transactions
Purchases and sales of investment securities, excluding short-term investments, for the period March 29, 2016 (fund inception) through November 30, 2016 were $10,188,143 and $5,052,327, respectively.
19
5. Capital Share Transactions
Transactions in shares of the fund were as follows:
Period ended November 30, 2016(1) | |||||
| Shares | Amount | ||||
| Investor Class/Shares Authorized | 50,000,000 | ||||
| Sold | 222,420 | $ | 2,237,196 | ||
| Redeemed | (5,131 | ) | (55,668 | ) | |
| 217,289 | 2,181,528 | ||||
| Institutional Class/Shares Authorized | 50,000,000 | ||||
| Sold | 60,000 | 600,000 | |||
| A Class/Shares Authorized | 50,000,000 | ||||
| Sold | 100,000 | 1,000,000 | |||
| C Class/Shares Authorized | 50,000,000 | ||||
| Sold | 100,000 | 1,000,000 | |||
| R Class/Shares Authorized | 50,000,000 | ||||
| Sold | 20,190 | 202,067 | |||
| Redeemed | (48 | ) | (519 | ) | |
| 20,142 | 201,548 | ||||
| R6 Class/Shares Authorized | 50,000,000 | ||||
| Sold | 20,000 | 200,000 | |||
| Net increase (decrease) | 517,431 | $ | 5,183,076 | ||
| (1) | March 29, 2016 (fund inception) through November 30, 2016. |
6. Fair Value Measurements
The fund’s investments valuation process is based on several considerations and may use multiple inputs to determine the fair value of the investments held by the fund. In conformity with accounting principles generally accepted in the United States of America, the inputs used to determine a valuation are classified into three broad levels.
| • | Level 1 valuation inputs consist of unadjusted quoted prices in an active market for identical investments. |
| • | Level 2 valuation inputs consist of direct or indirect observable market data (including quoted prices for comparable investments, evaluations of subsequent market events, interest rates, prepayment speeds, credit risk, etc.). These inputs also consist of quoted prices for identical investments initially expressed in local currencies that are adjusted through translation into U.S. dollars. |
| • | Level 3 valuation inputs consist of unobservable data (including a fund’s own assumptions). |
The level classification is based on the lowest level input that is significant to the fair valuation measurement. The valuation inputs are not necessarily an indication of the risks associated with investing in these securities or other financial instruments. There were no significant transfers between levels during the period.
20
The following is a summary of the level classifications as of period end. The Schedule of Investments provides additional information on the fund’s portfolio holdings.
| Level 1 | Level 2 | Level 3 | ||||||
| Assets | ||||||||
| Investment Securities | ||||||||
| Common Stocks | ||||||||
| China | $ | 17,544 | $ | 99,509 | — | |||
| Netherlands | 24,903 | — | — | |||||
| United States | 2,649,666 | — | — | |||||
| Other Countries | — | 2,745,434 | — | |||||
| Exchange-Traded Funds | 40,600 | — | — | |||||
| Temporary Cash Investments | 31,716 | — | — | |||||
| $ | 2,764,429 | $ | 2,844,943 | — | ||||
7. Risk Factors
There are certain risks involved in investing in foreign securities. These risks include those resulting from future adverse political, social and economic developments, fluctuations in currency exchange rates, the possible imposition of exchange controls, and other foreign laws or restrictions. Investing in emerging markets may accentuate these risks.
The fund invests in common stocks of small companies. Because of this, the fund may be subject to greater risk and market fluctuations than a fund investing in larger, more established companies.
The fund’s investment process may result in high portfolio turnover, which could mean high transaction costs, affecting both performance and capital gains tax liabilities to investors.
8. Federal Tax Information
The book-basis character of distributions made during the year from net investment income or net realized gains may differ from their ultimate characterization for federal income tax purposes. These differences reflect the differing character of certain income items and net realized gains and losses for financial statement and tax purposes, and may result in reclassification among certain capital accounts on the financial statements. There were no distributions paid by the fund during the period March 29, 2016 (fund inception) through November 30, 2016.
As of November 30, 2016, the federal tax cost of investments and the components of distributable earnings on a tax-basis were as follows:
| Federal tax cost of investments | $ | 5,026,567 | |
| Gross tax appreciation of investments | $ | 689,338 | |
| Gross tax depreciation of investments | (106,533 | ) | |
| Net tax appreciation (depreciation) of investments | 582,805 | ||
| Net tax appreciation (depreciation) on translation of assets and liabilities in foreign currencies | (288 | ) | |
| Net tax appreciation (depreciation) | $ | 582,517 | |
| Undistributed ordinary income | — | ||
| Accumulated short-term capital losses | $ | (140,579 | ) |
| Late-year ordinary loss deferral | $ | (16,565 | ) |
The difference between book-basis and tax-basis unrealized appreciation (depreciation) is attributable primarily to the tax deferral of losses on wash sales.
Accumulated capital losses represent net capital loss carryovers that may be used to offset future realized capital gains for federal income tax purposes. The capital loss carryovers may be carried forward for an unlimited period. Future capital loss carryover utilization in any given year may be subject to Internal Revenue Code limitations.
21
Loss deferrals represent certain qualified losses that the fund has elected to treat as having been incurred in the following fiscal year for federal income tax purposes.
9. Recently Issued Accounting Guidance
In October 2016, the Securities and Exchange Commission adopted new rules and forms as well as amendments to its rules and forms to modernize the reporting and disclosure of information by registered investment companies. The amendments to Regulation S-X will require standardized, enhanced disclosure about derivatives in investment company financial statements, as well as other provisions. Compliance with the amendments is effective on August 1, 2017. Management is currently evaluating the impact that adopting the amendments will have on the financial statement disclosures.
22
| Financial Highlights |
| For a Share Outstanding Throughout the Period Indicated | ||||||||||||
| Per-Share Data | Ratios and Supplemental Data | |||||||||||
| Income From Investment Operations: | Ratio to Average Net Assets of: | |||||||||||
| Net Asset Value, Beginning of Period | Net Investment Income (Loss)(1) | Net Realized and Unrealized Gain (Loss) | Total From Investment Operations | Net Asset Value, End of Period | Total Return(2) | Operating Expenses | Net Investment Income (Loss) | Portfolio Turnover Rate | Net Assets, End of Period (in thousands) | |||
| Investor Class | ||||||||||||
2016(3) | $10.00 | (0.03) | 0.88 | 0.85 | $10.85 | 8.50% | 1.50%(4) | (0.40)%(4) | 95% | $2,357 | ||
| Institutional Class | ||||||||||||
2016(3) | $10.00 | (0.01) | 0.87 | 0.86 | $10.86 | 8.60% | 1.30%(4) | (0.20)%(4) | 95% | $652 | ||
| A Class | ||||||||||||
2016(3) | $10.00 | (0.05) | 0.88 | 0.83 | $10.83 | 8.30% | 1.75%(4) | (0.65)%(4) | 95% | $1,083 | ||
| C Class | ||||||||||||
2016(3) | $10.00 | (0.10) | 0.88 | 0.78 | $10.78 | 7.80% | 2.50%(4) | (1.40)%(4) | 95% | $1,078 | ||
| R Class | ||||||||||||
2016(3) | $10.00 | (0.06) | 0.87 | 0.81 | $10.81 | 8.10% | 2.00%(4) | (0.90)%(4) | 95% | $218 | ||
| R6 Class | ||||||||||||
2016(3) | $10.00 | —(5) | 0.87 | 0.87 | $10.87 | 8.80% | 1.15%(4) | (0.05)%(4) | 95% | $217 | ||
| Notes to Financial Highlights | |
| (1) | Computed using average shares outstanding throughout the period. |
| (2) | Total returns are calculated based on the net asset value of the last business day and do not reflect applicable sales charges, if any. Total returns for periods less than one year are not annualized. |
| (3) | March 29, 2016 (fund inception) through November 30, 2016. |
| (4) | Annualized. |
| (5) | Per-share amount was less than $0.005. |
See Notes to Financial Statements.
| Report of Independent Registered Public Accounting Firm |
To the Board of Directors and Shareholders of American Century World Mutual Funds, Inc.:
We have audited the accompanying statement of assets and liabilities, including the schedule of investments, of Global Small Cap Fund (the “Fund”), one of the funds constituting American Century World Mutual Funds, Inc., as of November 30, 2016, and the related statement of operations, changes in net assets, and the financial highlights for the period from March 29, 2016 (commencement date) through November 30, 2016. These financial statements and financial highlights are the responsibility of the Fund’s management. Our responsibility is to express an opinion on these financial statements and financial highlights based on our audits.
We conducted our audits in accordance with the standards of the Public Company Accounting Oversight Board (United States). Those standards require that we plan and perform the audit to obtain reasonable assurance about whether the financial statements and financial highlights are free of material misstatement. The Fund is not required to have, nor were we engaged to perform, an audit of its internal control over financial reporting. Our audits included consideration of internal control over financial reporting as a basis for designing audit procedures that are appropriate in the circumstances, but not for the purpose of expressing an opinion on the effectiveness of the Fund’s internal control over financial reporting. Accordingly, we express no such opinion. An audit also includes examining, on a test basis, evidence supporting the amounts and disclosures in the financial statements, assessing the accounting principles used and significant estimates made by management, as well as evaluating the overall financial statement presentation. Our procedures included confirmation of securities owned as of November 30, 2016, by correspondence with the custodian and brokers; when replies were not received from brokers, we performed other auditing procedures. We believe that our audits provide a reasonable basis for our opinion.
In our opinion, the financial statements and financial highlights referred to above present fairly, in all material respects, the financial position of Global Small Cap Fund of American Century World Mutual Funds, Inc. as of November 30, 2016, and the results of its operations, the changes in its net assets, and the financial highlights for the period from March 29, 2016 (commencement date) through November 30, 2016, in conformity with accounting principles generally accepted in the United States of America.
DELOITTE & TOUCHE LLP
Kansas City, Missouri
January 17, 2017
25
| Management |
The Board of Directors
The individuals listed below serve as directors of the funds. Each director will continue to serve in this capacity until death, retirement, resignation or removal from office. The board has adopted a mandatory retirement age for directors who are not “interested persons,” as that term is defined in the Investment Company Act (independent directors). Independent directors shall retire by December 31 of the year in which they reach their 75th birthday.
Mr. Thomas is an “interested person” because he currently serves as President and Chief Executive Officer of American Century Companies, Inc. (ACC), the parent company of American Century Investment Management, Inc. (ACIM or the advisor). The other directors (more than three-fourths of the total number) are independent. They are not employees, directors or officers of, and have no financial interest in, ACC or any of its wholly owned, direct or indirect, subsidiaries, including ACIM, American Century Investment Services, Inc. (ACIS) and American Century Services, LLC (ACS), and they do not have any other affiliations, positions or relationships that would cause them to be considered “interested persons” under the Investment Company Act. The directors serve in this capacity for seven (in the case of Mr. Thomas, 15) registered investment companies in the American Century Investments family of funds.
The following table presents additional information about the directors. The mailing address for each director is 4500 Main Street, Kansas City, Missouri 64111.
| Name (Year of Birth) | Position(s) Held with Funds | Length of Time Served | Principal Occupation(s) During Past 5 Years | Number of American Century Portfolios Overseen by Director | Other Directorships Held During Past 5 Years |
| Independent Directors | |||||
| Barry Fink (1955) | Director | Since 2012 | Retired; Executive Vice President, ACC (September 2007 to February 2013); President, ACS (October 2007 to February 2013); Chief Operating Officer, ACC (September 2007 to November 2012) | 81 | None |
| Andrea C. Hall (1945) | Director | Since 1997 | Retired | 81 | None |
| Jan M. Lewis (1957) | Director | Since 2011 | Retired; President and Chief Executive Officer, Catholic Charities of Northeast Kansas (human services organization) (2006 to 2013) | 81 | None |
| James A. Olson (1942) | Director and Chairman of the Board | Since 2007 (Chairman since 2014) | Member, Plaza Belmont LLC (private equity fund manager) (1999 to present) | 81 | Saia, Inc. (2002 to 2012) and EPR Properties (2003 to 2013) |
| M. Jeannine Strandjord (1945) | Director | Since 1994 | Retired | 81 | Euronet Worldwide Inc.; MGP Ingredients, Inc.; and DST Systems Inc. (1996 to 2012) |
26
| Name (Year of Birth) | Position(s) Held with Funds | Length of Time Served | Principal Occupation(s) During Past 5 Years | Number of American Century Portfolios Overseen by Director | Other Directorships Held During Past 5 Years |
| Independent Directors | |||||
| John R. Whitten (1946) | Director | Since 2008 | Retired | 81 | Rudolph Technologies, Inc. |
| Stephen E. Yates (1948) | Director | Since 2012 | Retired | 81 | None |
| Interested Director | |||||
| Jonathan S. Thomas (1963) | Director and President | Since 2007 | President and Chief Executive Officer, ACC (March 2007 to present). Also serves as Chief Executive Officer, ACS; Executive Vice President, ACIM; Director, ACC, ACIM and other ACC subsidiaries | 126 | BioMed Valley Discoveries, Inc. |
The Statement of Additional Information has additional information about the fund's directors and is available without charge, upon request, by calling 1-800-345-2021.
27
Officers
The following table presents certain information about the executive officers of the funds. Each officer serves as an officer for each of the 15 investment companies in the American Century family of funds, unless otherwise noted. No officer is compensated for his or her service as an officer of the funds. The listed officers are interested persons of the funds and are appointed or re-appointed on an annual basis. The mailing address for each officer listed below is 4500 Main Street, Kansas City, Missouri 64111.
| Name (Year of Birth) | Offices with the Funds | Principal Occupation(s) During the Past Five Years |
| Jonathan S. Thomas (1963) | Director and President since 2007 | President and Chief Executive Officer, ACC (March 2007 to present). Also serves as Chief Executive Officer, ACS; Executive Vice President, ACIM; Director, ACC, ACIM and other ACC subsidiaries |
| Amy D. Shelton (1964) | Chief Compliance Officer and Vice President since 2014 | Chief Compliance Officer, American Century funds, (March 2014 to present); Chief Compliance Officer, ACIM (February 2014 to present); Chief Compliance Officer, ACIS (October 2009 to present); Vice President, Client Interactions and Marketing, ACIS (February 2013 to January 2014); Director, Client Interactions and Marketing, ACIS (June 2007 to January 2013). Also serves as Vice President, ACIS |
| Charles A. Etherington (1957) | General Counsel since 2007 and Senior Vice President since 2006 | Attorney, ACC (February 1994 to present); Vice President, ACC (November 2005 to present); General Counsel, ACC (March 2007 to present). Also serves as General Counsel, ACIM, ACS, ACIS and other ACC subsidiaries; and Senior Vice President, ACIM and ACS |
| C. Jean Wade (1964) | Vice President,Treasurer and Chief Financial Officer since 2012 | Vice President, ACS (February 2000 to present) |
| Robert J. Leach (1966) | Vice President since 2006 and Assistant Treasurer since 2012 | Vice President, ACS (February 2000 to present) |
| David H. Reinmiller (1963) | Vice President since 2000 | Attorney, ACC (January 1994 to present); Associate General Counsel, ACC (January 2001 to present). Also serves as Vice President, ACIM and ACS |
| Ward D. Stauffer (1960) | Secretary since 2005 | Attorney, ACC (June 2003 to present) |
28
| Additional Information |
Retirement Account Information
As required by law, distributions you receive from certain IRAs are subject to federal income tax withholding, unless you elect not to have withholding apply. Tax will be withheld on the total amount withdrawn even though you may be receiving amounts that are not subject to withholding, such as nondeductible contributions. In such case, excess amounts of withholding could occur. You may adjust your withholding election so that a greater or lesser amount will be withheld.
If you don’t want us to withhold on this amount, you must notify us to not withhold the federal income tax. You may notify us in writing or in certain situations by telephone or through other electronic means. For systematic withdrawals, your withholding election will remain in effect until revoked or changed by filing a new election. You have the right to revoke your election at any time.
Remember, even if you elect not to have income tax withheld, you are liable for paying income tax on the taxable portion of your withdrawal. If you elect not to have income tax withheld or you don’t have enough income tax withheld, you may be responsible for payment of estimated tax. You may incur penalties under the estimated tax rules if your withholding and estimated tax payments are not sufficient. You can reduce or defer the income tax on a distribution by directly or indirectly rolling such distribution over to another IRA or eligible plan. You should consult your tax advisor for additional information.
State tax will be withheld if, at the time of your distribution, your address is within one of the mandatory withholding states and you have federal income tax withheld (or as otherwise required by state law). State taxes will be withheld from your distribution in accordance with the respective state rules.
Distributions you receive from 403(b), 457 and qualified plans are subject to special tax and withholding rules. Your plan administrator or plan sponsor is required to provide you with a special tax notice explaining those rules at the time you request a distribution. If applicable, federal and/or state taxes may be withheld from your distribution amount.
Proxy Voting Policies
A description of the policies that the fund's investment advisor uses in exercising the voting rights associated with the securities purchased and/or held by the fund is available without charge, upon request, by calling 1-800-345-2021. It is also available on the "About Us" page of American Century Investments’ website at americancentury.com and on the Securities and Exchange Commission’s website at sec.gov. Information regarding how the investment advisor voted proxies relating to portfolio securities during the most recent 12-month period ended June 30 is available on the "About Us" page at americancentury.com. It is also available at sec.gov.
Quarterly Portfolio Disclosure
The fund files its complete schedule of portfolio holdings with the Securities and Exchange Commission (SEC) for the first and third quarters of each fiscal year on Form N-Q. The fund’s Forms N-Q are available on the SEC’s website at sec.gov, and may be reviewed and copied at the SEC’s Public Reference Room in Washington, DC. Information on the operation of the Public Reference Room may be obtained by calling 1-800-SEC-0330. The fund also makes its complete schedule of portfolio holdings for the most recent quarter of its fiscal year available on its website at americancentury.com and, upon request, by calling 1-800-345-2021.
29
| Notes |
30
| Notes |
31
| Notes |
32
| ||
| Contact Us | americancentury.com | |
| Automated Information Line | 1-800-345-8765 | |
| Investor Services Representative | 1-800-345-2021 or 816-531-5575 | |
| Investors Using Advisors | 1-800-378-9878 | |
| Business, Not-For-Profit, Employer-Sponsored Retirement Plans | 1-800-345-3533 | |
| Banks and Trust Companies, Broker-Dealers, Financial Professionals, Insurance Companies | 1-800-345-6488 | |
| Telecommunications Relay Service for the Deaf | 711 | |
| American Century World Mutual Funds, Inc. | ||
Investment Advisor: American Century Investment Management, Inc. Kansas City, Missouri | ||
| This report and the statements it contains are submitted for the general information of our shareholders. The report is not authorized for distribution to prospective investors unless preceded or accompanied by an effective prospectus. | ||
| ©2017 American Century Proprietary Holdings, Inc. All rights reserved. CL-ANN-91035 1701 | ||
| Annual Report | |
| November 30, 2016 | |
| International Discovery Fund | |
| Table of Contents |
| President’s Letter | 2 | |
| Performance | 3 | |
| Portfolio Commentary | ||
| Fund Characteristics | ||
| Shareholder Fee Example | ||
| Schedule of Investments | ||
| Statement of Assets and Liabilities | ||
| Statement of Operations | ||
| Statement of Changes in Net Assets | ||
| Notes to Financial Statements | ||
| Financial Highlights | ||
| Report of Independent Registered Public Accounting Firm | ||
| Management | ||
| Approval of Management Agreement | ||
| Additional Information | ||
Any opinions expressed in this report reflect those of the author as of the date of the report, and do not necessarily represent the opinions of American Century Investments® or any other person in the American Century Investments organization. Any such opinions are subject to change at any time based upon market or other conditions and American Century Investments disclaims any responsibility to update such opinions. These opinions may not be relied upon as investment advice and, because investment decisions made by American Century Investments funds are based on numerous factors, may not be relied upon as an indication of trading intent on behalf of any American Century Investments fund. Security examples are used for representational purposes only and are not intended as recommendations to purchase or sell securities. Performance information for comparative indices and securities is provided to American Century Investments by third party vendors. To the best of American Century Investments’ knowledge, such information is accurate at the time of printing.
| President’s Letter |
Jonathan ThomasDear Investor:
Thank you for reviewing this annual report for the period ended November 30, 2016. Annual reports help convey important information about fund returns, including market factors that affected performance during the reporting period. For additional, updated investment and market insights, we encourage you to visit our website, americancentury.com.
A Year of Surprises: China, Oil, Brexit, Trump
A year ago, we predicted increased market volatility in 2016. Volatility occurred, but not for the reasons we suggested. We expected the Federal Reserve (the Fed)—which in December 2015 raised its short-term interest rate target for the first time since 2006—to raise it three to four more times in 2016 as U.S. economic growth improved. We thought the shift in rate policy would contribute to unsettled conditions as inflation expectations grew, borrowing costs increased, the U.S. dollar strengthened, and bond prices weakened.
Instead, global and U.S. growth largely languished in the first half of 2016 as concerns about China’s growth and plummeting oil prices affected the global economic outlook. The Fed left its target unchanged for 11 months to avoid putting further stress on the global economy and markets. Meanwhile, years of low interest rates, market globalization, and corporate cost-cutting had benefited some segments of the world’s developed democracies much more than others. The others spoke up in June and November, voting for the U.K. to exit the European Union, then propelling Donald Trump to victory. These unexpected populist political results unsettled the markets.
Despite these challenges, and with the continued support of central bank monetary stimulus, broad market index returns for the full reporting period were mostly positive, though they skewed negative in non-U.S. developed equity markets. Looking ahead, Trump’s win shifted the market outlook, unleashing potentially far-reaching ramifications that are still unfolding. What’s clear is that Trump’s policy proposals and his unpredictable nature make uncertainty more certain, which could trigger further bouts of short-term market volatility. In this unsettled environment, we strongly believe in staying the course and remaining focused on longer-term goals, using disciplined, actively managed, diversified, risk-aware strategies. We appreciate your continued trust in us.
Sincerely,
Jonathan Thomas
President and Chief Executive Officer
American Century Investments
2
| Performance |
| Total Returns as of November 30, 2016 | ||||||
Average Annual Returns | ||||||
Ticker Symbol | 1 year | 5 years | 10 years | Since Inception | Inception Date | |
| Investor Class | TWEGX | -5.21% | 6.37% | 1.81% | — | 4/1/94 |
| MSCI ACWI ex-U.S. Mid Cap Growth Index | — | -1.71% | 5.39% | 1.12% | — | — |
| Institutional Class | TIDIX | -5.03% | 6.57% | 2.02% | — | 1/2/98 |
| A Class | ACIDX | 4/28/98 | ||||
| No sales charge | -5.44% | 6.10% | 1.57% | — | ||
| With sales charge | -10.90% | 4.85% | 0.97% | — | ||
| C Class | TWECX | -6.19% | 5.31% | — | 4.94% | 3/1/10 |
| R Class | TWERX | -5.69% | 5.86% | — | 5.47% | 3/1/10 |
Average annual returns since inception are presented when ten years of performance history is not available.
Prior to March 1, 2010, the A Class was referred to as the Advisor Class and did not have a front-end sales charge. Performance prior to that date has been adjusted to reflect this charge.
Sales charges include initial sales charges and contingent deferred sales charges (CDSCs), as applicable. A Class shares have a 5.75% maximum initial sales charge and may be subject to a maximum CDSC of 1.00%. C Class shares redeemed within 12 months of purchase are subject to a maximum CDSC of 1.00%. The SEC requires that mutual funds provide performance information net of maximum sales charges in all cases where charges could be applied.
Data presented reflect past performance. Past performance is no guarantee of future results. Current performance may be higher or lower than the performance shown. Total returns for periods less than one year are not annualized. Investment return and principal value will fluctuate, and redemption value may be more or less than original cost. Data assumes reinvestment of dividends and capital gains, and none of the charts reflect the deduction of taxes that a shareholder would pay on fund distributions or the redemption of fund shares. To obtain performance data current to the most recent month end, please call 1-800-345-2021 or visit americancentury.com. For additional information about the fund, please consult the prospectus.
3
| Growth of $10,000 Over 10 Years |
| $10,000 investment made November 30, 2006 |
| Performance for other share classes will vary due to differences in fee structure. |
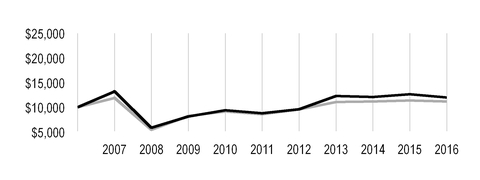
| Value on November 30, 2016 | |
| Investor Class — $11,972 | |
| MSCI ACWI ex-U.S. Mid Cap Growth Index — $11,178 | |
Total Annual Fund Operating Expenses | ||||
Investor Class | Institutional Class | A Class | C Class | R Class |
| 1.62% | 1.42% | 1.87% | 2.62% | 2.12% |
The total annual fund operating expenses shown is as stated in the fund’s prospectus current as of the date of this report. The prospectus may vary from the expense ratio shown elsewhere in this report because it is based on a different time period, includes acquired fund fees and expenses, and, if applicable, does not include fee waivers or expense reimbursements.
Data presented reflect past performance. Past performance is no guarantee of future results. Current performance may be higher or lower than the performance shown. Total returns for periods less than one year are not annualized. Investment return and principal value will fluctuate, and redemption value may be more or less than original cost. Data assumes reinvestment of dividends and capital gains, and none of the charts reflect the deduction of taxes that a shareholder would pay on fund distributions or the redemption of fund shares. To obtain performance data current to the most recent month end, please call 1-800-345-2021 or visit americancentury.com. For additional information about the fund, please consult the prospectus.
4
| Portfolio Commentary |
Portfolio Managers: Brian Brady and Pratik Patel
Performance Summary
International Discovery declined -5.21%* for the 12 months ended November 30, 2016. The portfolio’s benchmark, the MSCI ACWI ex-U.S. Mid Cap Growth Index, declined -1.71% for the same period.
Familiar themes continued to dominate the landscape and challenge non-U.S. stocks. In particular, economic growth remained weak, inflation remained muted, and major central banks continued to implement aggressive stimulus plans amid signs they were losing their effectiveness. In addition, global divergence remained a prominent factor, as the U.S. continued to outpace other developed markets in terms of economic growth, currency strength, and the removal of central bank stimulus.
Overall, non-U.S. small- and mid-cap stocks outperformed large-cap stocks. Within the small-mid universe, value stocks significantly outperformed growth stocks, which provided a headwind to fund performance. Within the portfolio, stock selection primarily accounted for the relative underperformance, particularly in the materials, financials, and real estate sectors. In addition, underweight positions relative to the benchmark in the materials and financials sectors detracted from results. Regionally, stock selection in Canada, Japan, and Germany, along with an underweight in Canada and an overweight in Germany, detracted from portfolio performance.
Brexit Vote Pressured Financials Stocks
An overweight position in Provident Financial, a U.K.-based consumer financial services provider, was among the fund’s primary detractors, declining in the wake of the Brexit vote. Investors worried the Brexit fallout would slow the British economy and weaken consumer confidence, which pressured companies in the financials sector. Additionally, investors worried the U.K.’s departure from the European Union (EU) would threaten London’s position as Europe’s financial hub. We exited the position.
We also sold our portfolio-only position in Japan-based W-Scope, a main detractor for the period. The maker of plastic separator sheets for lithium-ion batteries struggled despite generating strong performance early in 2016. In particular, concerns about growing competition from China-based companies with similar, less-expensive products pressured the stock.
Elsewhere in Japan, a portfolio-only position in Mazda Motor was a primary detractor. Early in the period, the Japan-based automotive manufacturer faced headwinds that included negative interest rates in Japan and an increase in the yen’s value. The company has significant exposure outside Japan, particularly in the U.S., and the currency move had a direct effect on Mazda’s earnings. We exited the portfolio’s position in the stock.
Health Care Stocks Were Top Contributors
The health care, consumer staples, and energy sectors were the top sector contributors to portfolio performance, primarily due to stock selection. Regionally, stock selection in France, China, and Denmark, along with overweight positions in China and Denmark, aided relative results.
*All fund returns referenced in this commentary are for Investor Class shares. Performance for other share
classes will vary due to differences in fee structure; when Investor Class performance exceeds that of the
fund's benchmark, other share classes may not. See page 3 for returns for all share classes.
5
Within the health care sector, a portfolio-only position in Ono Pharmaceutical was a top contributor to performance. Throughout the first half of the period, the Japan-based drug company continued to advance on improving earnings estimates, largely stemming from strong sales of Opdivo, a lung cancer-fighting immune-oncology therapy developed jointly with Bristol-Myers Squibb. Ono owns the rights to Opdivo in Japan, where sales had been increasing. Later in the period, changing drug pricing and reimbursement policies in Japan, along with a slowdown in patient use of Opdivo, weighed on the outlook for the drug maker. We took profits and exited the position.
Elsewhere in Japan, a portfolio-only position in DeNA, a Japan-based provider of mobile gaming, social media, and e-commerce websites, was a top contributor. The company reported better-than-expected revenue and profits for the quarter ended June 30, 2016, which led to stock-price gains. In particular, the company benefited from its partnership with Nintendo on the successful Pokémon Go game.
In addition, a portfolio-only position in China-based Sunny Optical Technology Group was a main contributor. Stock in the company, which designs and manufactures optical products and scientific instruments, including components for automobile cameras, advanced after Sunny Optical reported strong results for the first half of 2016. The company is benefiting from the move toward autonomous and semi-autonomous vehicles.
Outlook
We will continue to focus on those non-U.S. companies our disciplined, bottom-up fundamental analysis identifies as opportunities with improving, sustainable earnings growth. At the end of the period, the portfolio’s largest sector overweights included information technology and energy, where we found several companies meeting those criteria. Conversely, the real estate and utilities sectors represented the largest sector underweights, due to fewer companies in these industries offering the earnings growth criteria we prefer. In particular, we remain concerned that rising interest rates will stifle the previously robust earnings outlooks for real estate companies.
Regionally, the U.K. was among the largest country underweights. We remain concerned about Brexit’s long-term effects on the U.K. economy, particularly if companies decide they do not want to have operations in a non-EU country. Within continental Europe, we continued to find companies with improving earnings growth outlooks stemming from modestly improving economic trends in Europe, which remained the portfolio’s largest regional overweight. We remain cautious and selective toward emerging markets. Overall, the stabilization in commodity prices has been beneficial for emerging markets, and we are noting some improvement in relative earnings revisions despite the massive reversal in performance driven by the strengthening U.S. dollar.
6
| Fund Characteristics |
| NOVEMBER 30, 2016 | |
Top Ten Holdings | % of net assets |
| Partners Group Holding AG | 2.3% |
| Genmab A/S | 2.2% |
| DSV A/S | 2.2% |
| Treasury Wine Estates Ltd. | 2.1% |
| Thales SA | 2.0% |
| Teleperformance | 2.0% |
| Lonza Group AG | 1.8% |
| RPC Group plc | 1.8% |
| Geberit AG | 1.6% |
| Drillisch AG | 1.6% |
Types of Investments in Portfolio | % of net assets |
| Common Stocks | 98.0% |
| Temporary Cash Investments | 1.5% |
| Other Assets and Liabilities | 0.5% |
Investments by Country | % of net assets |
| Japan | 20.0% |
| United Kingdom | 10.0% |
| France | 7.9% |
| Switzerland | 7.4% |
| Canada | 6.4% |
| China | 6.0% |
| Denmark | 5.8% |
| Germany | 4.5% |
| Australia | 4.2% |
| Norway | 3.0% |
| South Korea | 2.8% |
| Russia | 2.8% |
| Spain | 2.5% |
| Taiwan | 2.0% |
| Other Countries | 12.7% |
| Cash and Equivalents* | 2.0% |
*Includes temporary cash investments and other assets and liabilities.
7
| Shareholder Fee Example |
Fund shareholders may incur two types of costs: (1) transaction costs, including sales charges (loads) on purchase payments and redemption/exchange fees; and (2) ongoing costs, including management fees; distribution and service (12b-1) fees; and other fund expenses. This example is intended to help you understand your ongoing costs (in dollars) of investing in your fund and to compare these costs with the ongoing cost of investing in other mutual funds.
The example is based on an investment of $1,000 made at the beginning of the period and held for the entire period from June 1, 2016 to November 30, 2016.
Actual Expenses
The table provides information about actual account values and actual expenses for each class. You may use the information, together with the amount you invested, to estimate the expenses that you paid over the period. First, identify the share class you own. Then simply divide your account value by $1,000 (for example, an $8,600 account value divided by $1,000 = 8.6), then multiply the result by the number under the heading “Expenses Paid During Period” to estimate the expenses you paid on your account during this period.
If you hold Investor Class shares of any American Century Investments fund, or Institutional Class shares of the American Century Diversified Bond Fund, in an American Century Investments account (i.e., not a financial intermediary or retirement plan account), American Century Investments may charge you a $12.50 semiannual account maintenance fee if the value of those shares is less than $10,000. We will redeem shares automatically in one of your accounts to pay the $12.50 fee. In determining your total eligible investment amount, we will include your investments in all personal accounts (including American Century Investments Brokerage accounts) registered under your Social Security number. Personal accounts include individual accounts, joint accounts, UGMA/UTMA accounts, personal trusts, Coverdell Education Savings Accounts and IRAs (including traditional, Roth, Rollover, SEP-, SARSEP- and SIMPLE-IRAs), and certain other retirement accounts. If you have only business, business retirement, employer-sponsored or American Century Investments Brokerage accounts, you are currently not subject to this fee. If you are subject to the Account Maintenance Fee, your account value could be reduced by the fee amount.
Hypothetical Example for Comparison Purposes
The table also provides information about hypothetical account values and hypothetical expenses based on the actual expense ratio of each class of your fund and an assumed rate of return of 5% per year before expenses, which is not the actual return of a fund’s share class. The hypothetical account values and expenses may not be used to estimate the actual ending account balance or expenses you paid for the period. You may use this information to compare the ongoing costs of investing in your fund and other funds. To do so, compare this 5% hypothetical example with the 5% hypothetical examples that appear in the shareholder reports of the other funds.
Please note that the expenses shown in the table are meant to highlight your ongoing costs only and do not reflect any transactional costs, such as sales charges (loads) or redemption/exchange fees. Therefore, the table is useful in comparing ongoing costs only, and will not help you determine the relative total costs of owning different funds. In addition, if these transactional costs were included, your costs would have been higher.
8
| Beginning Account Value 6/1/16 | Ending Account Value 11/30/16 | Expenses Paid During Period(1) 6/1/16 - 11/30/16 | Annualized Expense Ratio(1) | |
Actual | ||||
| Investor Class | $1,000 | $943.30 | $8.02 | 1.65% |
| Institutional Class | $1,000 | $944.00 | $7.05 | 1.45% |
| A Class | $1,000 | $941.90 | $9.22 | 1.90% |
| C Class | $1,000 | $938.10 | $12.84 | 2.65% |
| R Class | $1,000 | $941.10 | $10.43 | 2.15% |
Hypothetical | ||||
| Investor Class | $1,000 | $1,016.75 | $8.32 | 1.65% |
| Institutional Class | $1,000 | $1,017.75 | $7.31 | 1.45% |
| A Class | $1,000 | $1,015.50 | $9.57 | 1.90% |
| C Class | $1,000 | $1,011.75 | $13.33 | 2.65% |
| R Class | $1,000 | $1,014.25 | $10.83 | 2.15% |
| (1) | Expenses are equal to the class's annualized expense ratio listed in the table above, multiplied by the average account value over the period, multiplied by 183, the number of days in the most recent fiscal half-year, divided by 366, to reflect the one-half year period. |
9
| Schedule of Investments |
NOVEMBER 30, 2016
| Shares | Value | ||||
| COMMON STOCKS — 98.0% | |||||
| Australia — 4.2% | |||||
| APN Outdoor Group Ltd. | 968,990 | $ | 3,821,040 | ||
| Domino's Pizza Enterprises Ltd. | 44,000 | 2,202,294 | |||
| Fortescue Metals Group Ltd. | 796,570 | 3,452,893 | |||
| Treasury Wine Estates Ltd. | 1,175,460 | 9,365,917 | |||
| 18,842,144 | |||||
| Belgium — 1.0% | |||||
Galapagos NV(1) | 72,820 | 4,327,385 | |||
| Brazil — 0.9% | |||||
| Raia Drogasil SA | 216,600 | 4,130,197 | |||
| Canada — 6.4% | |||||
| Agnico Eagle Mines Ltd. New York Shares | 57,130 | 2,345,187 | |||
| Canadian Energy Services & Technology Corp. | 61,500 | 320,022 | |||
| CCL Industries, Inc., Class B | 33,350 | 5,803,292 | |||
| Dollarama, Inc. | 78,550 | 5,842,277 | |||
| Maple Leaf Foods, Inc. | 219,760 | 4,786,851 | |||
Seven Generations Energy Ltd.(1) | 290,440 | 6,689,655 | |||
| Sleep Country Canada Holdings, Inc. | 118,720 | 2,600,121 | |||
| 28,387,405 | |||||
| China — 6.0% | |||||
| Brilliance China Automotive Holdings Ltd. | 1,052,000 | 1,472,922 | |||
| Geely Automobile Holdings Ltd. | 1,495,000 | 1,545,787 | |||
| Minth Group Ltd. | 668,000 | 2,187,481 | |||
New Oriental Education & Technology Group, Inc. ADR(1) | 100,380 | 5,036,065 | |||
| Shenzhou International Group Holdings Ltd. | 726,000 | 4,464,668 | |||
| Sunny Optical Technology Group Co. Ltd. | 1,040,000 | 5,235,867 | |||
Weibo Corp. ADR(1) | 65,940 | 3,383,381 | |||
| Weichai Power Co. Ltd., H Shares | 2,258,000 | 3,638,884 | |||
| 26,965,055 | |||||
| Denmark — 5.8% | |||||
| DSV A/S | 215,540 | 9,698,816 | |||
Genmab A/S(1) | 57,530 | 9,964,814 | |||
| Pandora A/S | 50,550 | 6,016,014 | |||
| 25,679,644 | |||||
| Finland — 0.7% | |||||
| Konecranes Oyj | 91,770 | 3,164,919 | |||
| France — 7.9% | |||||
| Arkema SA | 36,220 | 3,469,485 | |||
| BioMerieux | 32,200 | 4,475,777 | |||
Nexans SA(1) | 91,420 | 4,772,873 | |||
| SEB SA | 35,940 | 4,826,130 | |||
| Teleperformance | 90,910 | 8,877,775 | |||
| Thales SA | 92,950 | 9,076,006 | |||
| 35,498,046 | |||||
| Germany — 4.5% | |||||
| Drillisch AG | 183,500 | 7,068,464 | |||
10
| Shares | Value | ||||
| HUGO BOSS AG | 47,860 | $ | 2,744,190 | ||
| KION Group AG | 108,880 | 6,171,402 | |||
| Salzgitter AG | 128,560 | 4,200,719 | |||
| 20,184,775 | |||||
| Hong Kong — 0.7% | |||||
| PRADA SpA | 860,700 | 3,051,537 | |||
| India — 1.4% | |||||
| Petronet LNG Ltd. | 551,230 | 3,130,262 | |||
| Vakrangee Ltd. | 824,090 | 3,327,111 | |||
| 6,457,373 | |||||
| Ireland — 0.6% | |||||
Bank of Ireland(1) | 12,602,260 | 2,684,657 | |||
| Israel — 0.8% | |||||
Mobileye NV(1) | 95,370 | 3,550,625 | |||
| Italy — 1.8% | |||||
| Buzzi Unicem SpA | 280,640 | 5,963,596 | |||
| Industria Macchine Automatiche SpA | 36,740 | 2,275,978 | |||
| 8,239,574 | |||||
| Japan — 20.0% | |||||
| Alps Electric Co. Ltd. | 216,100 | 5,426,820 | |||
| CyberAgent, Inc. | 115,000 | 2,795,464 | |||
| Daito Trust Construction Co. Ltd. | 29,800 | 4,629,999 | |||
| Daiwa Securities Group, Inc. | 784,000 | 4,710,647 | |||
| DeNA Co. Ltd. | 151,400 | 4,611,940 | |||
| Disco Corp. | 33,600 | 3,982,483 | |||
| Don Quijote Holdings Co. Ltd. | 98,100 | 3,751,475 | |||
| Koito Manufacturing Co. Ltd. | 96,300 | 5,016,809 | |||
Kyushu Railway Co.(1) | 27,400 | 709,399 | |||
LINE Corp. ADR(1) | 75,422 | 2,918,077 | |||
| Mabuchi Motor Co. Ltd. | 100,000 | 5,567,938 | |||
| MonotaRO Co. Ltd. | 148,700 | 3,175,334 | |||
| Nabtesco Corp. | 34,600 | 879,479 | |||
| NGK Spark Plug Co. Ltd. | 226,500 | 4,644,631 | |||
| Nippon Shinyaku Co. Ltd. | 118,600 | 5,515,074 | |||
| Nitori Holdings Co. Ltd. | 40,100 | 4,185,079 | |||
| Omron Corp. | 117,700 | 4,341,541 | |||
| Seria Co. Ltd. | 66,000 | 4,742,100 | |||
| SMS Co. Ltd. | 112,800 | 2,817,905 | |||
| Sony Financial Holdings, Inc. | 76,000 | 1,096,106 | |||
| Start Today Co. Ltd. | 171,000 | 2,626,170 | |||
| Sumco Corp. | 232,500 | 2,546,414 | |||
| Sundrug Co. Ltd. | 22,500 | 1,565,491 | |||
| Temp Holdings Co. Ltd. | 206,300 | 3,177,314 | |||
| Topcon Corp. | 269,000 | 3,994,852 | |||
| 89,428,541 | |||||
| Mexico — 0.7% | |||||
Cemex SAB de CV ADR(1) | 420,650 | 3,285,277 | |||
| Netherlands — 1.4% | |||||
| Koninklijke DSM NV | 103,790 | 6,294,303 | |||
| New Zealand — 0.9% | |||||
a2 Milk Co. Ltd.(1) | 1,868,860 | 3,284,541 | |||
11
| Shares | Value | ||||
| Fisher & Paykel Healthcare Corp. Ltd. | 115,180 | $ | 667,247 | ||
| 3,951,788 | |||||
| Norway — 3.0% | |||||
| Aker BP ASA | 243,730 | 3,962,112 | |||
| Marine Harvest ASA | 271,320 | 4,879,088 | |||
Storebrand ASA(1) | 288,550 | 1,508,213 | |||
| TGS Nopec Geophysical Co. ASA | 143,730 | 2,824,393 | |||
| 13,173,806 | |||||
| Russia — 2.8% | |||||
X5 Retail Group NV GDR(1) | 217,622 | 6,528,660 | |||
Yandex NV, A Shares(1) | 302,300 | 5,746,723 | |||
| 12,275,383 | |||||
| South Korea — 2.8% | |||||
| BGF retail Co. Ltd. | 49,260 | 3,665,900 | |||
| Hanssem Co. Ltd. | 17,330 | 3,061,156 | |||
Hugel, Inc.(1) | 6,350 | 1,506,227 | |||
| Korea Zinc Co. Ltd. | 4,140 | 1,671,511 | |||
| SK Materials Co. Ltd. | 18,220 | 2,384,552 | |||
| 12,289,346 | |||||
| Spain — 2.5% | |||||
| Acerinox SA | 335,140 | 4,209,097 | |||
| Bankia SA | 5,071,430 | 4,520,336 | |||
| Gamesa Corp. Tecnologica SA | 125,120 | 2,598,461 | |||
| 11,327,894 | |||||
| Sweden — 1.8% | |||||
| Boliden AB | 180,040 | 4,649,947 | |||
Dometic Group AB(1) | 210,779 | 1,502,658 | |||
Lundin Petroleum AB(1) | 103,220 | 1,945,140 | |||
| 8,097,745 | |||||
| Switzerland — 7.4% | |||||
| dormakaba Holding AG | 3,780 | 2,730,806 | |||
| Geberit AG | 17,900 | 7,086,407 | |||
| Logitech International SA | 193,487 | 4,767,236 | |||
| Lonza Group AG | 44,770 | 7,996,687 | |||
| Partners Group Holding AG | 21,290 | 10,344,507 | |||
| 32,925,643 | |||||
| Taiwan — 2.0% | |||||
| AirTAC International Group | 569,000 | 4,311,282 | |||
| Nien Made Enterprise Co. Ltd. | 217,000 | 2,430,553 | |||
| Tung Thih Electronic Co. Ltd. | 270,000 | 2,329,558 | |||
| 9,071,393 | |||||
| United Kingdom — 10.0% | |||||
| Ashtead Group plc | 160,520 | 3,147,203 | |||
ASOS plc(1) | 89,830 | 5,672,589 | |||
| Auto Trader Group plc | 681,750 | 3,409,462 | |||
| DCC plc | 81,860 | 6,278,542 | |||
Just Eat plc(1) | 381,300 | 2,793,317 | |||
| Melrose Industries plc | 2,038,560 | 4,674,058 | |||
| Persimmon plc | 103,110 | 2,193,190 | |||
| RPC Group plc | 587,760 | 7,920,313 | |||
Tullow Oil plc(1) | 906,300 | 3,376,939 | |||
12
| Shares | Value | ||||
| Weir Group plc (The) | 222,220 | $ | 5,026,992 | ||
| 44,492,605 | |||||
TOTAL COMMON STOCKS (Cost $409,954,962) | 437,777,060 | ||||
| TEMPORARY CASH INVESTMENTS — 1.5% | |||||
| Repurchase Agreement, Fixed Income Clearing Corp., (collateralized by various U.S. Treasury obligations, 3.625%, 2/15/44, valued at $7,095,881), at 0.08%, dated 11/30/16, due 12/1/16 (Delivery value $6,952,015) | 6,952,000 | ||||
| State Street Institutional U.S. Government Money Market Fund, Premier Class | 1,537 | 1,537 | |||
TOTAL TEMPORARY CASH INVESTMENTS (Cost $6,953,537) | 6,953,537 | ||||
TOTAL INVESTMENT SECURITIES — 99.5% (Cost $416,908,499) | 444,730,597 | ||||
| OTHER ASSETS AND LIABILITIES — 0.5% | 2,026,333 | ||||
| TOTAL NET ASSETS — 100.0% | $ | 446,756,930 | |||
| MARKET SECTOR DIVERSIFICATION | ||
(as a % of net assets) | ||
| Industrials | 21.7 | % |
| Consumer Discretionary | 20.1 | % |
| Information Technology | 14.2 | % |
| Materials | 12.4 | % |
| Consumer Staples | 8.6 | % |
| Health Care | 7.8 | % |
| Financials | 5.6 | % |
| Energy | 5.0 | % |
| Telecommunication Services | 1.6 | % |
| Real Estate | 1.0 | % |
| Cash and Equivalents* | 2.0 | % |
*Includes temporary cash investments and other assets and liabilities.
| NOTES TO SCHEDULE OF INVESTMENTS | ||
| ADR | - | American Depositary Receipt |
| GDR | - | Global Depositary Receipt |
| (1) | Non-income producing. |
See Notes to Financial Statements.
13
| Statement of Assets and Liabilities |
| NOVEMBER 30, 2016 | |||
| Assets | |||
| Investment securities, at value (cost of $416,908,499) | $ | 444,730,597 | |
| Foreign currency holdings, at value (cost of $156,112) | 151,003 | ||
| Receivable for investments sold | 8,105,429 | ||
| Receivable for capital shares sold | 33,703 | ||
| Dividends and interest receivable | 592,284 | ||
| Other assets | 113,230 | ||
| 453,726,246 | |||
| Liabilities | |||
| Payable for investments purchased | 6,018,107 | ||
| Payable for capital shares redeemed | 338,473 | ||
| Accrued management fees | 610,866 | ||
| Distribution and service fees payable | 1,870 | ||
| 6,969,316 | |||
| Net Assets | $ | 446,756,930 | |
| Net Assets Consist of: | |||
| Capital (par value and paid-in surplus) | $ | 552,440,800 | |
| Accumulated net investment loss | (860,832 | ) | |
| Accumulated net realized loss | (132,524,940 | ) | |
| Net unrealized appreciation | 27,701,902 | ||
| $ | 446,756,930 | ||
| Net Assets | Shares Outstanding | Net Asset Value Per Share | ||||
| Investor Class, $0.01 Par Value | $421,313,560 | 34,673,188 | $12.15 | |||
| Institutional Class, $0.01 Par Value | $19,216,903 | 1,562,009 | $12.30 | |||
| A Class, $0.01 Par Value | $5,192,682 | 438,965 | $11.83* | |||
| C Class, $0.01 Par Value | $872,343 | 74,731 | $11.67 | |||
| R Class, $0.01 Par Value | $161,442 | 13,471 | $11.98 | |||
*Maximum offering price $12.55 (net asset value divided by 0.9425).
See Notes to Financial Statements.
14
| Statement of Operations |
| YEAR ENDED NOVEMBER 30, 2016 | |||
| Investment Income (Loss) | |||
| Income: | |||
| Dividends (net of foreign taxes withheld of $708,020) | $ | 6,838,726 | |
| Interest | 9,560 | ||
| 6,848,286 | |||
| Expenses: | |||
| Management fees | 8,012,084 | ||
| Distribution and service fees: | |||
| A Class | 14,641 | ||
| C Class | 9,607 | ||
| R Class | 769 | ||
| Directors' fees and expenses | 16,533 | ||
| Other expenses | 23,215 | ||
| 8,076,849 | |||
| Net investment income (loss) | (1,228,563 | ) | |
| Realized and Unrealized Gain (Loss) | |||
| Net realized gain (loss) on: | |||
| Investment transactions | (15,974,841 | ) | |
| Foreign currency transactions | (165,991 | ) | |
| (16,140,832 | ) | ||
| Change in net unrealized appreciation (depreciation) on: | |||
| Investments | (9,172,257 | ) | |
| Translation of assets and liabilities in foreign currencies | 3,803 | ||
| (9,168,454 | ) | ||
| Net realized and unrealized gain (loss) | (25,309,286 | ) | |
| Net Increase (Decrease) in Net Assets Resulting from Operations | $ | (26,537,849 | ) |
See Notes to Financial Statements.
15
| Statement of Changes in Net Assets |
| YEARS ENDED NOVEMBER 30, 2016 AND NOVEMBER 30, 2015 | ||||||
| Increase (Decrease) in Net Assets | November 30, 2016 | November 30, 2015 | ||||
| Operations | ||||||
| Net investment income (loss) | $ | (1,228,563 | ) | $ | 4,307 | |
| Net realized gain (loss) | (16,140,832 | ) | 52,138,255 | |||
| Change in net unrealized appreciation (depreciation) | (9,168,454 | ) | (26,938,339 | ) | ||
| Net increase (decrease) in net assets resulting from operations | (26,537,849 | ) | 25,204,223 | |||
| Distributions to Shareholders | ||||||
| From net investment income: | ||||||
| Investor Class | (2,556,611 | ) | (1,194,380 | ) | ||
| Institutional Class | (154,815 | ) | (96,309 | ) | ||
| A Class | (18,092 | ) | — | |||
| R Class | (75 | ) | — | |||
| Decrease in net assets from distributions | (2,729,593 | ) | (1,290,689 | ) | ||
| Capital Share Transactions | ||||||
| Net increase (decrease) in net assets from capital share transactions (Note 5) | (60,707,535 | ) | (57,317,465 | ) | ||
| Redemption Fees | ||||||
| Increase in net assets from redemption fees | 4,955 | 11,710 | ||||
| Net increase (decrease) in net assets | (89,970,022 | ) | (33,392,221 | ) | ||
| Net Assets | ||||||
| Beginning of period | 536,726,952 | 570,119,173 | ||||
| End of period | $ | 446,756,930 | $ | 536,726,952 | ||
| Accumulated undistributed net investment income (loss) | $ | (860,832 | ) | $ | 1,655,698 | |
See Notes to Financial Statements.
16
| Notes to Financial Statements |
NOVEMBER 30, 2016
1. Organization
American Century World Mutual Funds, Inc. (the corporation) is registered under the Investment Company
Act of 1940, as amended (the 1940 Act), as an open-end management investment company and is organized as a Maryland corporation. International Discovery Fund (the fund) is one fund in a series issued by the corporation. The fund's investment objective is to seek capital growth.
The fund offers the Investor Class, the Institutional Class, the A Class, the C Class and the R Class. The A Class may incur an initial sales charge. The A Class and C Class may be subject to a contingent deferred sales charge. The share classes differ principally in their respective sales charges and distribution and shareholder servicing expenses and arrangements. The Institutional Class is made available to institutional shareholders or through financial intermediaries whose clients do not require the same level of shareholder and administrative services as shareholders of other classes. As a result, the Institutional Class is charged a lower unified management fee.
2. Significant Accounting Policies
The following is a summary of significant accounting policies consistently followed by the fund in preparation of its financial statements. The fund is an investment company and follows accounting and reporting guidance in accordance with accounting principles generally accepted in the United States of America. This may require management to make certain estimates and assumptions at the date of the financial statements. Actual results could differ from these estimates. Management evaluated the impact of events or transactions occurring through the date the financial statements were issued that would merit recognition or disclosure.
Investment Valuations — The fund determines the fair value of its investments and computes its net asset value per share at the close of regular trading (usually 4 p.m. Eastern time) on the New York Stock Exchange (NYSE) on each day the NYSE is open. The Board of Directors has adopted valuation policies and procedures to guide the investment advisor in the fund’s investment valuation process and to provide methodologies for the oversight of the fund’s pricing function.
Equity securities that are listed or traded on a domestic securities exchange are valued at the last reported sales price or at the official closing price as provided by the exchange. Equity securities traded on foreign securities exchanges are generally valued at the closing price of such securities on the exchange where primarily traded or at the close of the NYSE, if that is earlier. If no last sales price is reported, or if local convention or regulation so provides, the mean of the latest bid and asked prices may be used. Securities traded over-the-counter are valued at the mean of the latest bid and asked prices, the last sales price, or the official closing price. Equity securities initially expressed in local currencies are translated into U.S. dollars at the mean of the appropriate currency exchange rate at the close of the NYSE as provided by an independent pricing service.
Open-end management investment companies are valued at the reported net asset value per share. Repurchase agreements are valued at cost, which approximates fair value.
If the fund determines that the market price for an investment is not readily available or the valuation methods mentioned above do not reflect an investment’s fair value, such investment is valued as determined in good faith by the Board of Directors or its delegate, in accordance with policies and procedures adopted by the Board of Directors. In its determination of fair value, the fund may review several factors including, but not limited to, market information regarding the specific investment or comparable investments and correlation with other investment types, futures indices or general market indicators. Circumstances that may cause the fund to use these procedures to value an investment include, but are not limited to: an investment has been declared in default or is distressed; trading in a security has been suspended during the trading day or a security is not actively trading on its principal exchange; prices received from a regular pricing source are deemed unreliable; or there is a foreign market holiday and no trading occurred.
The fund monitors for significant events occurring after the close of an investment’s primary exchange but before the fund’s net asset value per share is determined. Significant events may include, but are not limited to: corporate announcements and transactions; governmental action and political unrest that could impact a specific investment or an investment sector; or armed conflicts, natural disasters and similar events that could
17
affect investments in a specific country or region. The fund also monitors for significant fluctuations between domestic and foreign markets, as evidenced by the U.S. market or such other indicators that the Board of Directors, or its delegate, deems appropriate. If significant fluctuations in foreign markets are identified, the fund may apply a model-derived factor to the closing price of equity securities traded on foreign securities exchanges. The factor is based on observable market data as provided by an independent pricing service.
Security Transactions — Security transactions are accounted for as of the trade date. Net realized gains and losses are determined on the identified cost basis, which is also used for federal income tax purposes.
Investment Income — Dividend income less foreign taxes withheld, if any, is recorded as of the ex-dividend date. Distributions received on securities that represent a return of capital or long-term capital gain are recorded as a reduction of cost of investments and/or as a realized gain. The fund may estimate the components of distributions received that may be considered nontaxable distributions or long-term capital gain distributions for income tax purposes. Interest income is recorded on the accrual basis and includes accretion of discounts and amortization of premiums.
Foreign Currency Translations — All assets and liabilities initially expressed in foreign currencies are translated into U.S. dollars at prevailing exchange rates at period end. The fund may enter into spot foreign currency exchange contracts to facilitate transactions denominated in a foreign currency. Purchases and sales of investment securities, dividend and interest income, spot foreign currency exchange contracts, and expenses are translated at the rates of exchange prevailing on the respective dates of such transactions. Net realized and unrealized foreign currency exchange gains or losses related to investment securities are a component of net realized gain (loss) on investment transactions and change in net unrealized appreciation (depreciation) on investments, respectively.
Repurchase Agreements — The fund may enter into repurchase agreements with institutions that American Century Investment Management, Inc. (ACIM) (the investment advisor) has determined are creditworthy pursuant to criteria adopted by the Board of Directors. The fund requires that the collateral, represented by securities, received in a repurchase transaction be transferred to the custodian in a manner sufficient to enable the fund to obtain those securities in the event of a default under the repurchase agreement. ACIM monitors, on a daily basis, the securities transferred to ensure the value, including accrued interest, of the securities under each repurchase agreement is equal to or greater than amounts owed to the fund under each repurchase agreement.
Joint Trading Account — Pursuant to an Exemptive Order issued by the Securities and Exchange Commission, the fund, along with certain other funds in the American Century Investments family of funds, may transfer uninvested cash balances into a joint trading account. These balances are invested in one or more repurchase agreements that are collateralized by U.S. Treasury or Agency obligations.
Income Tax Status — It is the fund’s policy to distribute substantially all net investment income and net realized gains to shareholders and to otherwise qualify as a regulated investment company under provisions of the Internal Revenue Code. Accordingly, no provision has been made for income taxes. The fund files U.S. federal, state, local and non-U.S. tax returns as applicable. The fund's tax returns are subject to examination by the relevant taxing authority until expiration of the applicable statute of limitations, which is generally three years from the date of filing but can be longer in certain jurisdictions. At this time, management believes there are no uncertain tax positions which, based on their technical merit, would not be sustained upon examination and for which it is reasonably possible that the total amounts of unrecognized tax benefits will significantly change in the next twelve months.
Multiple Class — All shares of the fund represent an equal pro rata interest in the net assets of the class to which such shares belong, and have identical voting, dividend, liquidation and other rights and the same terms and conditions, except for class specific expenses and exclusive rights to vote on matters affecting only individual classes. Income, non-class specific expenses, and realized and unrealized capital gains and losses of the fund are allocated to each class of shares based on their relative net assets.
Distributions to Shareholders — Distributions from net investment income and net realized gains, if any, are generally declared and paid annually. The fund may make distributions on a more frequent basis to comply with the distribution requirements of the Internal Revenue Code, in all events in a manner consistent with provisions of the 1940 Act.
18
Redemption Fees — The fund may impose a 2.00% redemption fee on shares held less than 60 days. The fee may not be applicable to all classes. The redemption fee is retained by the fund and helps cover transaction costs that long-term investors may bear when the fund sells securities to meet investor redemptions.
Indemnifications — Under the corporation’s organizational documents, its officers and directors are indemnified against certain liabilities arising out of the performance of their duties to the fund. In addition, in the normal course of business, the fund enters into contracts that provide general indemnifications. The maximum exposure under these arrangements is unknown as this would involve future claims that may be made against a fund. The risk of material loss from such claims is considered by management to be remote.
3. Fees and Transactions with Related Parties
Certain officers and directors of the corporation are also officers and/or directors of American Century Companies, Inc. (ACC). The corporation’s investment advisor, ACIM, the corporation's distributor, American Century Investment Services, Inc. (ACIS), and the corporation’s transfer agent, American Century Services, LLC, are wholly owned, directly or indirectly, by ACC.
Management Fees — The corporation has entered into a management agreement with ACIM, under which ACIM provides the fund with investment advisory and management services in exchange for a single, unified management fee (the fee) per class. The agreement provides that all expenses of managing and operating the fund, except distribution and service fees, brokerage expenses, taxes, interest, fees and expenses of the independent directors (including legal counsel fees), and extraordinary expenses, will be paid by ACIM. The fee is computed and accrued daily based on each class’s daily net assets and paid monthly in arrears. The rate of the fee is determined by applying a fee rate calculation formula. This formula takes into account the fund’s assets as well as certain assets, if any, of other clients of the investment advisor outside the American Century Investments family of funds (such as subadvised funds and separate accounts) that have very similar investment teams and investment strategies (strategy assets). The annual management fee schedule ranges from 1.200% to 1.750% for the Investor Class, A Class, C Class and R Class. The annual management fee schedule ranges from 1.000% to 1.550% for the Institutional Class. The effective annual management fee for each class for the year ended November 30, 2016 was 1.63% for the Investor Class, A Class, C Class and R Class and 1.43% for the Institutional Class.
Distribution and Service Fees — The Board of Directors has adopted a separate Master Distribution and Individual Shareholder Services Plan for each of the A Class, C Class and R Class (collectively the plans), pursuant to Rule 12b-1 of the 1940 Act. The plans provide that the A Class will pay ACIS an annual distribution and service fee of 0.25%. The plans provide that the C Class will pay ACIS an annual distribution and service fee of 1.00%, of which 0.25% is paid for individual shareholder services and 0.75% is paid for distribution services. The plans provide that the R Class will pay ACIS an annual distribution and service fee of 0.50%. The fees are computed and accrued daily based on each class’s daily net assets and paid monthly in arrears. The fees are used to pay financial intermediaries for distribution and individual shareholder services. Fees incurred under the plans during the year ended November 30, 2016 are detailed in the Statement of Operations.
Directors' Fees and Expenses — The Board of Directors is responsible for overseeing the investment advisor’s management and operations of the fund. The directors receive detailed information about the fund and its investment advisor regularly throughout the year, and meet at least quarterly with management of the investment advisor to review reports about fund operations. The fund’s officers do not receive compensation from the fund.
Acquired Fund Fees and Expenses — The fund may invest in mutual funds, exchange-traded funds, and business development companies (the acquired funds). The fund will indirectly realize its pro rata share of the fees and expenses of the acquired funds in which it invests. These indirect fees and expenses are not paid out of the fund's assets but are reflected in the return realized by the fund on its investment in the acquired funds.
Interfund Transactions — The fund may enter into security transactions with other American Century Investments funds and other client accounts of the investment advisor, in accordance with the 1940 Act rules and procedures adopted by the Board of Directors. The rules and procedures require, among other things, that these transactions be effected at the independent current market price of the security. During the period, the interfund purchases and sales were $1,003,167 and $895,502, respectively. The effect of interfund transactions on the Statement of Operations was $371,410 in net realized gain (loss) on investment transactions.
19
4. Investment Transactions
Purchases and sales of investment securities, excluding short-term investments, for the year ended November 30, 2016 were $678,016,235 and $749,420,359, respectively.
5. Capital Share Transactions
Transactions in shares of the fund were as follows:
| Year ended November 30, 2016 | Year ended November 30, 2015 | |||||||||
| Shares | Amount | Shares | Amount | |||||||
| Investor Class/Shares Authorized | 380,000,000 | 400,000,000 | ||||||||
| Sold | 596,121 | $ | 7,445,535 | 1,973,067 | $ | 26,172,142 | ||||
| Issued in reinvestment of distributions | 204,271 | 2,418,572 | 89,395 | 1,141,578 | ||||||
| Redeemed | (5,416,519 | ) | (67,763,718 | ) | (6,612,888 | ) | (84,604,777 | ) | ||
| (4,616,127 | ) | (57,899,611 | ) | (4,550,426 | ) | (57,291,057 | ) | |||
| Institutional Class/Shares Authorized | 40,000,000 | 40,000,000 | ||||||||
| Sold | 159,528 | 2,008,154 | 207,249 | 2,735,825 | ||||||
| Issued in reinvestment of distributions | 12,934 | 154,815 | 7,460 | 96,309 | ||||||
| Redeemed | (326,816 | ) | (4,131,076 | ) | (282,242 | ) | (3,687,250 | ) | ||
| (154,354 | ) | (1,968,107 | ) | (67,533 | ) | (855,116 | ) | |||
| A Class/Shares Authorized | 30,000,000 | 30,000,000 | ||||||||
| Sold | 68,647 | 841,403 | 226,922 | 2,883,104 | ||||||
| Issued in reinvestment of distributions | 1,566 | 18,092 | — | — | ||||||
| Redeemed | (156,499 | ) | (1,909,517 | ) | (165,320 | ) | (2,093,362 | ) | ||
| (86,286 | ) | (1,050,022 | ) | 61,602 | 789,742 | |||||
| C Class/Shares Authorized | 30,000,000 | 20,000,000 | ||||||||
| Sold | 55,435 | 678,052 | 38,351 | 487,665 | ||||||
| Redeemed | (38,509 | ) | (459,546 | ) | (18,489 | ) | (226,895 | ) | ||
| 16,926 | 218,506 | 19,862 | 260,770 | |||||||
| R Class/Shares Authorized | 30,000,000 | 20,000,000 | ||||||||
| Sold | 2,380 | 29,452 | 2,256 | 28,656 | ||||||
| Issued in reinvestment of distributions | 6 | 75 | — | — | ||||||
| Redeemed | (3,003 | ) | (37,828 | ) | (18,745 | ) | (250,460 | ) | ||
| (617 | ) | (8,301 | ) | (16,489 | ) | (221,804 | ) | |||
| Net increase (decrease) | (4,840,458 | ) | $ | (60,707,535 | ) | (4,552,984 | ) | $ | (57,317,465 | ) |
6. Fair Value Measurements
The fund’s investments valuation process is based on several considerations and may use multiple inputs to determine the fair value of the investments held by the fund. In conformity with accounting principles generally accepted in the United States of America, the inputs used to determine a valuation are classified into three broad levels.
| • | Level 1 valuation inputs consist of unadjusted quoted prices in an active market for identical investments. |
| • | Level 2 valuation inputs consist of direct or indirect observable market data (including quoted prices for comparable investments, evaluations of subsequent market events, interest rates, prepayment speeds, credit risk, etc.). These inputs also consist of quoted prices for identical investments initially expressed in local currencies that are adjusted through translation into U.S. dollars. |
| • | Level 3 valuation inputs consist of unobservable data (including a fund’s own assumptions). |
20
The level classification is based on the lowest level input that is significant to the fair valuation measurement. The valuation inputs are not necessarily an indication of the risks associated with investing in these securities or other financial instruments. There were no significant transfers between levels during the period.
The following is a summary of the level classifications as of period end. The Schedule of Investments provides additional information on the fund’s portfolio holdings.
| Level 1 | Level 2 | Level 3 | ||||||
| Assets | ||||||||
| Investment Securities | ||||||||
| Common Stocks | ||||||||
| Canada | $ | 2,345,187 | $ | 26,042,218 | — | |||
| China | 8,419,446 | 18,545,609 | — | |||||
| Israel | 3,550,625 | — | — | |||||
| Japan | 2,918,077 | 86,510,464 | — | |||||
| Mexico | 3,285,277 | — | — | |||||
| Russia | 5,746,723 | 6,528,660 | — | |||||
| Other Countries | — | 273,884,774 | — | |||||
| Temporary Cash Investments | 1,537 | 6,952,000 | — | |||||
| $ | 26,266,872 | $ | 418,463,725 | — | ||||
7. Risk Factors
There are certain risks involved in investing in foreign securities. These risks include those resulting from future adverse political, social and economic developments, fluctuations in currency exchange rates, the possible imposition of exchange controls, and other foreign laws or restrictions. Investing in emerging markets may accentuate these risks.
The fund invests in common stocks of small companies. Because of this, the fund may be subject to greater risk and market fluctuations than a fund investing in larger, more established companies.
The fund’s investment process may result in high portfolio turnover, which could mean high transaction costs, affecting both performance and capital gains tax liabilities to investors.
8. Federal Tax Information
The tax character of distributions paid during the years ended November 30, 2016 and November 30, 2015 were as follows:
| 2016 | 2015 | |||||
| Distributions Paid From | ||||||
| Ordinary income | $ | 2,729,593 | $ | 1,290,689 | ||
| Long-term capital gains | — | — | ||||
The book-basis character of distributions made during the year from net investment income or net realized gains may differ from their ultimate characterization for federal income tax purposes. These differences reflect the differing character of certain income items and net realized gains and losses for financial statement and tax purposes, and may result in reclassification among certain capital accounts on the financial statements.
21
As of November 30, 2016, the federal tax cost of investments and the components of distributable earnings on a tax-basis were as follows:
| Federal tax cost of investments | $ | 416,913,814 | |
| Gross tax appreciation of investments | $ | 42,784,806 | |
| Gross tax depreciation of investments | (14,968,023 | ) | |
| Net tax appreciation (depreciation) of investments | 27,816,783 | ||
| Net tax appreciation (depreciation) on translation of assets and liabilities in foreign currencies | (121,764 | ) | |
| Net tax appreciation (depreciation) | $ | 27,695,019 | |
| Undistributed ordinary income | — | ||
| Accumulated short-term capital losses | $ | (132,519,625 | ) |
| Late-year ordinary loss deferral | $ | (859,264 | ) |
The difference between book-basis and tax-basis unrealized appreciation (depreciation) is attributable primarily to the tax deferral of losses on wash sales.
Accumulated capital losses represent net capital loss carryovers that may be used to offset future realized capital gains for federal income tax purposes. Any unlimited losses will be required to be utilized prior to the losses which carry an expiration date. Future capital loss carryover utilization in any given year may be subject to Internal Revenue Code limitations. Capital loss carryovers of $(114,127,606) expire in 2017 and the remaining losses are unlimited.
Loss deferrals represent certain qualified losses that the fund has elected to treat as having been incurred in the following fiscal year for federal income tax purposes.
9. Recently Issued Accounting Guidance
In October 2016, the Securities and Exchange Commission adopted new rules and forms as well as amendments to its rules and forms to modernize the reporting and disclosure of information by registered investment companies. The amendments to Regulation S-X will require standardized, enhanced disclosure about derivatives in investment company financial statements, as well as other provisions. Compliance with the amendments is effective on August 1, 2017. Management is currently evaluating the impact that adopting the amendments will have on the financial statement disclosures.
| Financial Highlights |
| For a Share Outstanding Throughout the Years Ended November 30 (except as noted) | |||||||||||||
| Per-Share Data | Ratios and Supplemental Data | ||||||||||||
| Income From Investment Operations: | Ratio to Average Net Assets of: | ||||||||||||
Net Asset Value, Beginning of Period | Net Investment Income (Loss)(1) | Net Realized and Unrealized Gain (Loss) | Total From Investment Operations | Distributions From Net Investment Income | Net Asset Value, End of Period | Total Return(2) | Operating Expenses | Net Investment Income (Loss) | Portfolio Turnover Rate | Net Assets, End of Period (in thousands) | |||
| Investor Class | |||||||||||||
| 2016 | $12.90 | (0.03) | (0.65) | (0.68) | (0.07) | $12.15 | (5.21)% | 1.64% | (0.25)% | 139% | $421,314 | ||
| 2015 | $12.35 | —(3) | 0.58 | 0.58 | (0.03) | $12.90 | 4.61% | 1.67% | 0.00%(4) | 171% | $506,817 | ||
| 2014 | $12.70 | 0.03 | (0.24) | (0.21) | (0.14) | $12.35 | (1.73)% | 1.61% | 0.20% | 134% | $541,410 | ||
| 2013 | $10.08 | —(3) | 2.79 | 2.79 | (0.17) | $12.70 | 27.97% | 1.56% | 0.03% | 157% | $620,359 | ||
| 2012 | $9.22 | 0.04 | 0.82 | 0.86 | —(3) | $10.08 | 9.23% | 1.50% | 0.42% | 154% | $582,331 | ||
| Institutional Class | |||||||||||||
| 2016 | $13.06 | (0.01) | (0.66) | (0.67) | (0.09) | $12.30 | (5.03)% | 1.44% | (0.05)% | 139% | $19,217 | ||
| 2015 | $12.50 | 0.03 | 0.58 | 0.61 | (0.05) | $13.06 | 4.84% | 1.47% | 0.20% | 171% | $22,415 | ||
| 2014 | $12.86 | 0.06 | (0.25) | (0.19) | (0.17) | $12.50 | (1.55)% | 1.41% | 0.40% | 134% | $22,304 | ||
| 2013 | $10.20 | 0.05 | 2.80 | 2.85 | (0.19) | $12.86 | 28.16% | 1.36% | 0.23% | 157% | $27,341 | ||
| 2012 | $9.34 | 0.05 | 0.83 | 0.88 | (0.02) | $10.20 | 9.44% | 1.30% | 0.62% | 154% | $48,794 | ||
| A Class | |||||||||||||
| 2016 | $12.56 | (0.06) | (0.63) | (0.69) | (0.04) | $11.83 | (5.44)% | 1.89% | (0.50)% | 139% | $5,193 | ||
| 2015 | $12.03 | (0.03) | 0.56 | 0.53 | — | $12.56 | 4.32% | 1.92% | (0.25)% | 171% | $6,596 | ||
| 2014 | $12.36 | (0.01) | (0.22) | (0.23) | (0.10) | $12.03 | (1.92)% | 1.86% | (0.05)% | 134% | $5,576 | ||
| 2013 | $9.81 | (0.03) | 2.72 | 2.69 | (0.14) | $12.36 | 27.69% | 1.81% | (0.22)% | 157% | $3,585 | ||
| 2012 | $9.00 | 0.01 | 0.80 | 0.81 | — | $9.81 | 8.88% | 1.75% | 0.17% | 154% | $2,838 | ||
22
| For a Share Outstanding Throughout the Years Ended November 30 (except as noted) | |||||||||||||
| Per-Share Data | Ratios and Supplemental Data | ||||||||||||
| Income From Investment Operations: | Ratio to Average Net Assets of: | ||||||||||||
Net Asset Value, Beginning of Period | Net Investment Income (Loss)(1) | Net Realized and Unrealized Gain (Loss) | Total From Investment Operations | Distributions From Net Investment Income | Net Asset Value, End of Period | Total Return(2) | Operating Expenses | Net Investment Income (Loss) | Portfolio Turnover Rate | Net Assets, End of Period (in thousands) | |||
| C Class | |||||||||||||
| 2016 | $12.45 | (0.15) | (0.63) | (0.78) | — | $11.67 | (6.19)% | 2.64% | (1.25)% | 139% | $872 | ||
| 2015 | $12.01 | (0.12) | 0.56 | 0.44 | — | $12.45 | 3.58% | 2.67% | (1.00)% | 171% | $720 | ||
| 2014 | $12.39 | (0.10) | (0.23) | (0.33) | (0.05) | $12.01 | (2.74)% | 2.61% | (0.80)% | 134% | $456 | ||
| 2013 | $9.83 | (0.14) | 2.76 | 2.62 | (0.06) | $12.39 | 26.75% | 2.56% | (0.97)% | 157% | $342 | ||
| 2012 | $9.08 | (0.05) | 0.80 | 0.75 | — | $9.83 | 8.14% | 2.50% | (0.58)% | 154% | $93 | ||
| R Class | |||||||||||||
| 2016 | $12.73 | (0.10) | (0.64) | (0.74) | (0.01) | $11.98 | (5.69)% | 2.14% | (0.75)% | 139% | $161 | ||
| 2015 | $12.22 | (0.08) | 0.59 | 0.51 | — | $12.73 | 4.09% | 2.17% | (0.50)% | 171% | $179 | ||
| 2014 | $12.55 | (0.05) | (0.22) | (0.27) | (0.06) | $12.22 | (2.19)% | 2.11% | (0.30)% | 134% | $374 | ||
| 2013 | $9.96 | (0.06) | 2.76 | 2.70 | (0.11) | $12.55 | 27.35% | 2.06% | (0.47)% | 157% | $388 | ||
| 2012 | $9.15 | —(3) | 0.81 | 0.81 | — | $9.96 | 8.73% | 2.00% | (0.08)% | 154% | $290 | ||
| Notes to Financial Highlights |
| (1) | Computed using average shares outstanding throughout the period. |
| (2) | Total returns are calculated based on the net asset value of the last business day and do not reflect applicable sales charges, if any. Total returns for periods less than one year are not annualized. |
| (3) | Per-share amount was less than $0.005. |
| (4) | Ratio was less than 0.005%. |
See Notes to Financial Statements.
| Report of Independent Registered Public Accounting Firm |
To the Board of Directors and Shareholders of American Century World Mutual Funds, Inc.:
We have audited the accompanying statement of assets and liabilities, including the schedule of investments, of International Discovery Fund (the “Fund”), one of the funds constituting American Century World Mutual Funds, Inc., as of November 30, 2016, and the related statement of operations for the year then ended, the statements of changes in net assets for each of the two years in the period then ended, and the financial highlights for each of the five years in the period then ended. These financial statements and financial highlights are the responsibility of the Fund’s management. Our responsibility is to express an opinion on these financial statements and financial highlights based on our audits.
We conducted our audits in accordance with the standards of the Public Company Accounting Oversight Board (United States). Those standards require that we plan and perform the audit to obtain reasonable assurance about whether the financial statements and financial highlights are free of material misstatement. The Fund is not required to have, nor were we engaged to perform, an audit of its internal control over financial reporting. Our audits included consideration of internal control over financial reporting as a basis for designing audit procedures that are appropriate in the circumstances, but not for the purpose of expressing an opinion on the effectiveness of the Fund’s internal control over financial reporting. Accordingly, we express no such opinion. An audit also includes examining, on a test basis, evidence supporting the amounts and disclosures in the financial statements, assessing the accounting principles used and significant estimates made by management, as well as evaluating the overall financial statement presentation. Our procedures included confirmation of securities owned as of November 30, 2016, by correspondence with the custodian and brokers; when replies were not received from brokers, we performed other auditing procedures. We believe that our audits provide a reasonable basis for our opinion.
In our opinion, the financial statements and financial highlights referred to above present fairly, in all material respects, the financial position of International Discovery Fund of American Century World Mutual Funds, Inc. as of November 30, 2016, the results of its operations for the year then ended, the changes in its net assets for each of the two years in the period then ended, and the financial highlights for each of the five years in the period then ended, in conformity with accounting principles generally accepted in the United States of America.
DELOITTE & TOUCHE LLP
Kansas City, Missouri
January 17, 2017
24
| Management |
The Board of Directors
The individuals listed below serve as directors of the funds. Each director will continue to serve in this capacity until death, retirement, resignation or removal from office. The board has adopted a mandatory retirement age for directors who are not “interested persons,” as that term is defined in the Investment Company Act (independent directors). Independent directors shall retire by December 31 of the year in which they reach their 75th birthday.
Mr. Thomas is an “interested person” because he currently serves as President and Chief Executive Officer of American Century Companies, Inc. (ACC), the parent company of American Century Investment Management, Inc. (ACIM or the advisor). The other directors (more than three-fourths of the total number) are independent. They are not employees, directors or officers of, and have no financial interest in, ACC or any of its wholly owned, direct or indirect, subsidiaries, including ACIM, American Century Investment Services, Inc. (ACIS) and American Century Services, LLC (ACS), and they do not have any other affiliations, positions or relationships that would cause them to be considered “interested persons” under the Investment Company Act. The directors serve in this capacity for seven (in the case of Mr. Thomas, 15) registered investment companies in the American Century Investments family of funds.
The following table presents additional information about the directors. The mailing address for each director is 4500 Main Street, Kansas City, Missouri 64111.
| Name (Year of Birth) | Position(s) Held with Funds | Length of Time Served | Principal Occupation(s) During Past 5 Years | Number of American Century Portfolios Overseen by Director | Other Directorships Held During Past 5 Years |
| Independent Directors | |||||
| Barry Fink (1955) | Director | Since 2012 | Retired; Executive Vice President, ACC (September 2007 to February 2013); President, ACS (October 2007 to February 2013); Chief Operating Officer, ACC (September 2007 to November 2012) | 81 | None |
| Andrea C. Hall (1945) | Director | Since 1997 | Retired | 81 | None |
| Jan M. Lewis (1957) | Director | Since 2011 | Retired; President and Chief Executive Officer, Catholic Charities of Northeast Kansas (human services organization) (2006 to 2013) | 81 | None |
| James A. Olson (1942) | Director and Chairman of the Board | Since 2007 (Chairman since 2014) | Member, Plaza Belmont LLC (private equity fund manager) (1999 to present) | 81 | Saia, Inc. (2002 to 2012) and EPR Properties (2003 to 2013) |
| M. Jeannine Strandjord (1945) | Director | Since 1994 | Retired | 81 | Euronet Worldwide Inc.; MGP Ingredients, Inc.; and DST Systems Inc. (1996 to 2012) |
25
| Name (Year of Birth) | Position(s) Held with Funds | Length of Time Served | Principal Occupation(s) During Past 5 Years | Number of American Century Portfolios Overseen by Director | Other Directorships Held During Past 5 Years |
| Independent Directors | |||||
| John R. Whitten (1946) | Director | Since 2008 | Retired | 81 | Rudolph Technologies, Inc. |
| Stephen E. Yates (1948) | Director | Since 2012 | Retired | 81 | None |
| Interested Director | |||||
| Jonathan S. Thomas (1963) | Director and President | Since 2007 | President and Chief Executive Officer, ACC (March 2007 to present). Also serves as Chief Executive Officer, ACS; Executive Vice President, ACIM; Director, ACC, ACIM and other ACC subsidiaries | 126 | BioMed Valley Discoveries, Inc. |
The Statement of Additional Information has additional information about the fund's directors and is available without charge, upon request, by calling 1-800-345-2021.
26
Officers
The following table presents certain information about the executive officers of the funds. Each officer serves as an officer for each of the 15 investment companies in the American Century family of funds, unless otherwise noted. No officer is compensated for his or her service as an officer of the funds. The listed officers are interested persons of the funds and are appointed or re-appointed on an annual basis. The mailing address for each officer listed below is 4500 Main Street, Kansas City, Missouri 64111.
| Name (Year of Birth) | Offices with the Funds | Principal Occupation(s) During the Past Five Years |
| Jonathan S. Thomas (1963) | Director and President since 2007 | President and Chief Executive Officer, ACC (March 2007 to present). Also serves as Chief Executive Officer, ACS; Executive Vice President, ACIM; Director, ACC, ACIM and other ACC subsidiaries |
| Amy D. Shelton (1964) | Chief Compliance Officer and Vice President since 2014 | Chief Compliance Officer, American Century funds, (March 2014 to present); Chief Compliance Officer, ACIM (February 2014 to present); Chief Compliance Officer, ACIS (October 2009 to present); Vice President, Client Interactions and Marketing, ACIS (February 2013 to January 2014); Director, Client Interactions and Marketing, ACIS (June 2007 to January 2013). Also serves as Vice President, ACIS |
| Charles A. Etherington (1957) | General Counsel since 2007 and Senior Vice President since 2006 | Attorney, ACC (February 1994 to present); Vice President, ACC (November 2005 to present); General Counsel, ACC (March 2007 to present). Also serves as General Counsel, ACIM, ACS, ACIS and other ACC subsidiaries; and Senior Vice President, ACIM and ACS |
| C. Jean Wade (1964) | Vice President,Treasurer and Chief Financial Officer since 2012 | Vice President, ACS (February 2000 to present) |
| Robert J. Leach (1966) | Vice President since 2006 and Assistant Treasurer since 2012 | Vice President, ACS (February 2000 to present) |
| David H. Reinmiller (1963) | Vice President since 2000 | Attorney, ACC (January 1994 to present); Associate General Counsel, ACC (January 2001 to present). Also serves as Vice President, ACIM and ACS |
| Ward D. Stauffer (1960) | Secretary since 2005 | Attorney, ACC (June 2003 to present) |
27
| Approval of Management Agreement |
At a meeting held on June 29, 2016, the Fund’s Board of Directors (the "Board") unanimously approved the renewal of the management agreement pursuant to which American Century Investment Management, Inc. (the “Advisor”) acts as the investment advisor for the Fund. Under Section 15(c) of the Investment Company Act, contracts for investment advisory services are required to be reviewed, evaluated, and approved by a majority of a fund’s directors (the “Directors”), including a majority of the independent Directors, each year.
Prior to its consideration of the renewal of the management agreement, the Directors requested and reviewed extensive data and information compiled by the Advisor and certain independent providers of evaluation data concerning the Fund and the services provided to the Fund by the Advisor. This review was in addition to the oversight and evaluation undertaken by the Board and its committees on a continual basis and the information received was supplemental to the extensive information that the Board and its committees receive and consider throughout the year.
In connection with its consideration of the renewal of the management agreement, the Board’s review and evaluation of the services provided by the Advisor included, but was not limited to, the following:
| • | the nature, extent, and quality of investment management, shareholder services, and other services provided and to be provided to the Fund; |
| • | the wide range of other programs and services provided and to be provided to the Fund and its shareholders on a routine and non-routine basis; |
| • | the investment performance of the Fund, including data comparing the Fund's performance to appropriate benchmarks and/or a peer group of other mutual funds with similar investment objectives and strategies; |
| • | the cost of owning the Fund compared to the cost of owning similar funds; |
| • | the compliance policies, procedures, and regulatory experience of the Advisor and the Fund's service providers; |
| • | financial data showing the cost of services provided to the Fund, the profitability of the Fund to the Advisor, and the overall profitability of the Advisor; |
| • | possible economies of scale associated with the Advisor’s management of the Fund and other accounts under its management; |
| • | data comparing services provided and charges to the Advisor's other investment management clients; |
| • | acquired fund fees and expenses; |
| • | payments by the Fund and the Advisor to financial intermediaries and the nature of services provided; and |
| • | any collateral benefits derived by the Advisor from the management of the Fund. |
In keeping with their practice, the Directors held two in-person meetings and one telephonic meeting to review and discuss the information provided. The independent Directors also had the benefit of the advice of their independent counsel throughout the process.
Factors Considered
The Directors considered all of the information provided by the Advisor, the independent data providers, and independent counsel in connection with the approval. They determined that the information was sufficient for them to evaluate the management agreement for the Fund. In connection with their review, the Directors did not identify any single factor as being all-important or controlling, and each Director may have attributed different levels of importance to different factors.
28
In deciding to renew the management agreement, the Board based its decision on a number of factors, including the following:
Nature, Extent and Quality of Services - Generally. Under the management agreement, the Advisor is responsible for providing or arranging for all services necessary for the operation of the Fund. The Board noted that under the management agreement, the Advisor provides or arranges at its own expense a wide variety of services including:
| • | constructing and designing the Fund |
| • | portfolio research and security selection |
| • | initial capitalization/funding |
| • | securities trading |
| • | Fund administration |
| • | custody of Fund assets |
| • | daily valuation of the Fund’s portfolio |
| • | shareholder servicing and transfer agency, including shareholder confirmations, recordkeeping, and communications |
| • | legal services (except the independent Directors’ counsel) |
| • | regulatory and portfolio compliance |
| • | financial reporting |
| • | marketing and distribution (except amounts paid by the Fund under Rule 12b-1 plans) |
The Board noted that many of these services have expanded over time in terms of both quantity and complexity in response to shareholder demands, competition in the industry, changing distribution channels, and the changing regulatory environment. The Board noted specifically the resources the Advisor has committed to enhancing cybersecurity protections for the benefit of shareholders.
Investment Management Services. The nature of the investment management services provided to the Fund is quite complex and allows Fund shareholders access to professional money management, instant diversification of their investments within an asset class, the opportunity to easily diversify among asset classes by investing in or exchanging among various American Century Investments funds, and liquidity. In evaluating investment performance, the Board expects the Advisor to manage the Fund in accordance with its investment objectives and approved strategies. Further, the Directors recognize that the Advisor has an obligation to monitor trading activities, and in particular to seek the best execution of fund trades, and to evaluate the use of and payment for research. In providing these services, the Advisor utilizes teams of investment professionals (portfolio managers, analysts, research assistants, and securities traders) who require extensive information technology, research, training, compliance, and other systems to conduct their business. The Board, directly and through its Fund Performance Review Committee, provides oversight of the investment performance process. It regularly reviews investment performance information for the Fund, together with comparative information for appropriate benchmarks and/or peer groups of similarly-managed funds, over different time horizons. The Directors also review detailed performance information provided by the Advisor during the management agreement approval process. If performance concerns are identified, the Fund receives special reviews until performance improves, during which the Board receives a report from the Advisor regarding the reasons for such results (e.g., market conditions, security selection) and any efforts being undertaken to improve performance. The Fund’s performance was above its benchmark for the one-, three-, five-, and ten-year periods reviewed by the Board. The Board found the investment management services provided by the Advisor to the Fund to be satisfactory and consistent with the management agreement.
Shareholder and Other Services. Under the management agreement, the Advisor provides the Fund with a comprehensive package of transfer agency, shareholder, and other services. The Board, directly and through various committees of the Board, regularly reviews reports and evaluations of such services at its regular meetings. These reports include, but are not limited to,
29
information regarding the operational efficiency and accuracy of the shareholder and transfer agency services provided, staffing levels, shareholder satisfaction (as measured by external as well as internal sources), technology support, new products and services offered to Fund shareholders, securities trading activities, portfolio valuation services, auditing services, and legal and operational compliance activities. The Board particularly noted the Advisor’s continual efforts to maintain effective business continuity plans and to address cybersecurity threats. Certain aspects of shareholder and transfer agency service level efficiency and the quality of securities trading activities are measured by independent third party providers and are presented in comparison to other fund groups not managed by the Advisor. The Board found the services provided by the Advisor to the Fund under the management agreement to be competitive and of high quality.
Costs of Services and Profitability. The Advisor provides detailed information concerning its cost of providing various services to the Fund, its profitability in managing the Fund (pre- and post-distribution), its overall profitability, and its financial condition. The Directors have reviewed with the Advisor the methodology used to prepare this financial information. This information is considered in evaluating the Advisor’s financial condition, its ability to continue to provide services under the management agreement, and the reasonableness of the current management fee. The Board concluded that the Advisor’s profits were reasonable in light of the services provided to the Fund.
Ethics. The Board generally considers the Advisor’s commitment to providing quality services to shareholders and to conducting its business ethically. They noted that the Advisor’s practices generally meet or exceed industry best practices.
Economies of Scale. The Board also reviewed information provided by the Advisor regarding the possible existence of economies of scale in connection with the management of the Fund. The Board concluded that economies of scale are difficult to measure and predict with precision, especially on a fund-by-fund basis. The Board concluded that the Advisor is appropriately sharing economies of scale through its competitive fee structure, offering competitive fees from fund inception, and through reinvestment in its business to provide shareholders additional content and services. The Board also noted that economies of scale are shared with the Fund and its shareholders through management fee breakpoints that serve to reduce the effective management fee as the assets of the Fund grow.
Comparison to Other Funds’ Fees. The management agreement provides that the Fund pays the Advisor a single, all-inclusive (or unified) management fee for providing all services necessary for the management and operation of the Fund, other than brokerage expenses, expenses attributable to short sales, taxes, interest, extraordinary expenses, and the fees and expenses of the Fund’s independent Directors (including their independent legal counsel) and expenses incurred in connection with the provision of shareholder services and distribution services under a plan adopted pursuant to Rule 12b-1 under the 1940 Act. Under the unified fee structure, the Advisor is responsible for providing all investment advisory, custody, audit, administrative, compliance, recordkeeping, marketing and shareholder services, or arranging and supervising third parties to provide such services. By contrast, most other funds are charged a variety of fees, including an investment advisory fee, a transfer agency fee, an administrative fee, distribution charges, and other expenses. Other than their investment advisory fees and any applicable Rule 12b-1 distribution fees, all other components of the total fees charged by these other funds may be increased without shareholder approval. The Board believes the unified fee structure is a benefit to Fund shareholders because it clearly discloses to shareholders the cost of owning Fund shares, and, since the unified fee cannot be increased without a vote of Fund shareholders, it shifts to the Advisor the risk of increased costs of operating the Fund and provides a direct incentive to minimize administrative inefficiencies. Part of the Board’s analysis of fee levels involves reviewing certain evaluative data compiled by an independent provider comparing the Fund’s unified fee to the total expense ratios of its peers. The unified fee charged to shareholders of the Fund was above the median of the total expense ratios of the Fund’s peer expense universe and was within the range of its peer expense group. The Board concluded that the management fee paid by the
30
Fund to the Advisor under the management agreement is reasonable in light of the services provided to the Fund.
Comparison to Fees and Services Provided to Other Clients of the Advisor. The Directors also requested and received information from the Advisor concerning the nature of the services, fees, costs, and profitability of its advisory services to advisory clients other than the Fund. They observed that these varying types of client accounts require different services and involve different regulatory and entrepreneurial risks than the management of the Fund. The Board analyzed this information and concluded that the fees charged and services provided to the Fund were reasonable by comparison.
Payments to Intermediaries. The Directors also requested and received a description of payments made to intermediaries by the Fund and the Advisor. These payments include various payments made by the Fund or the Advisor to different types of intermediaries and recordkeepers for distribution and service activities provided for the Fund. The Board received confirmation from the Advisor that all such payments by the Fund intended for distribution were made pursuant to the Fund's 12b-1 Plan. The Board reviewed such information and found the payments to be reasonable in scope and purpose.
Collateral or “Fall-Out” Benefits Derived by the Advisor. The Board considered the existence of collateral benefits the Advisor may receive as a result of its relationship with the Fund. They concluded that the Advisor’s primary business is managing mutual funds and it generally does not use fund or shareholder information to generate profits in other lines of business, and therefore does not derive any significant collateral benefits from them. The Board noted that additional assets from other clients may offer the Advisor some benefit from increased leverage with service providers and counterparties. Additionally, the Advisor receives proprietary research from broker-dealers that execute fund portfolio transactions, which the Board concluded is likely to benefit other clients of the Advisor, as well as Fund shareholders. The Board also determined that the Advisor is able to provide investment management services to certain clients other than the Fund, at least in part, due to its existing infrastructure built to serve the fund complex. The Board concluded that appropriate allocation methodologies had been employed to assign resources and the cost of those resources to these other clients and, where expressly provided, these other client assets may be included with the assets of the Fund to determine breakpoints in the management fee schedule.
Existing Relationship. The Board also considered whether there was any reason for not continuing the existing arrangement with the Advisor. In this regard, the Board was mindful of the potential disruptions of the Fund’s operations and various risks, uncertainties, and other effects that could occur as a result of a decision not to continue such relationship. In particular, the Board recognized that most shareholders have invested in the Fund on the strength of the Advisor’s industry standing and reputation and in the expectation that the Advisor will have a continuing role in providing advisory services to the Fund.
Conclusion of the Directors. As a result of this process, the Board, including all of the independent Directors, taking into account all of the factors discussed above and the information provided by the Advisor and others in connection with its review and throughout the year, determined that the management fee is fair and reasonable in light of the services provided and that the investment management agreement between the Fund and the Advisor should be renewed.
31
| Additional Information |
Retirement Account Information
As required by law, distributions you receive from certain IRAs are subject to federal income tax withholding, unless you elect not to have withholding apply. Tax will be withheld on the total amount withdrawn even though you may be receiving amounts that are not subject to withholding, such as nondeductible contributions. In such case, excess amounts of withholding could occur. You may adjust your withholding election so that a greater or lesser amount will be withheld.
If you don’t want us to withhold on this amount, you must notify us to not withhold the federal income tax. You may notify us in writing or in certain situations by telephone or through other electronic means. For systematic withdrawals, your withholding election will remain in effect until revoked or changed by filing a new election. You have the right to revoke your election at any time.
Remember, even if you elect not to have income tax withheld, you are liable for paying income tax on the taxable portion of your withdrawal. If you elect not to have income tax withheld or you don’t have enough income tax withheld, you may be responsible for payment of estimated tax. You may incur penalties under the estimated tax rules if your withholding and estimated tax payments are not sufficient. You can reduce or defer the income tax on a distribution by directly or indirectly rolling such distribution over to another IRA or eligible plan. You should consult your tax advisor for additional information.
State tax will be withheld if, at the time of your distribution, your address is within one of the mandatory withholding states and you have federal income tax withheld (or as otherwise required by state law). State taxes will be withheld from your distribution in accordance with the respective state rules.
Distributions you receive from 403(b), 457 and qualified plans are subject to special tax and withholding rules. Your plan administrator or plan sponsor is required to provide you with a special tax notice explaining those rules at the time you request a distribution. If applicable, federal and/or state taxes may be withheld from your distribution amount.
Proxy Voting Policies
A description of the policies that the fund's investment advisor uses in exercising the voting rights associated with the securities purchased and/or held by the fund is available without charge, upon request, by calling 1-800-345-2021. It is also available on the "About Us" page of American Century Investments’ website at americancentury.com and on the Securities and Exchange Commission’s website at sec.gov. Information regarding how the investment advisor voted proxies relating to portfolio securities during the most recent 12-month period ended June 30 is available on the "About Us" page at americancentury.com. It is also available at sec.gov.
Quarterly Portfolio Disclosure
The fund files its complete schedule of portfolio holdings with the Securities and Exchange Commission (SEC) for the first and third quarters of each fiscal year on Form N-Q. The fund’s Forms N-Q are available on the SEC’s website at sec.gov, and may be reviewed and copied at the SEC’s Public Reference Room in Washington, DC. Information on the operation of the Public Reference Room may be obtained by calling 1-800-SEC-0330. The fund also makes its complete schedule of portfolio holdings for the most recent quarter of its fiscal year available on its website at americancentury.com and, upon request, by calling 1-800-345-2021.
32
Other Tax Information
The following information is provided pursuant to provisions of the Internal Revenue Code.
The fund hereby designates up to the maximum amount allowable as qualified dividend income for the fiscal year ended November 30, 2016.
For the fiscal year ended November 30, 2016, the fund intends to pass through to shareholders foreign source income of $7,362,769 and foreign taxes paid of $634,765, or up to the maximum amount allowable, as a foreign tax credit. Foreign source income and foreign tax expense per outstanding share on November 30, 2016 are $0.2003 and $0.0173, respectively.
33
| Notes |
34
| Notes |
35
| ||
| Contact Us | americancentury.com | |
| Automated Information Line | 1-800-345-8765 | |
| Investor Services Representative | 1-800-345-2021 or 816-531-5575 | |
| Investors Using Advisors | 1-800-378-9878 | |
| Business, Not-For-Profit, Employer-Sponsored Retirement Plans | 1-800-345-3533 | |
| Banks and Trust Companies, Broker-Dealers, Financial Professionals, Insurance Companies | 1-800-345-6488 | |
| Telecommunications Relay Service for the Deaf | 711 | |
| American Century World Mutual Funds, Inc. | ||
Investment Advisor: American Century Investment Management, Inc. Kansas City, Missouri | ||
| This report and the statements it contains are submitted for the general information of our shareholders. The report is not authorized for distribution to prospective investors unless preceded or accompanied by an effective prospectus. | ||
| ©2017 American Century Proprietary Holdings, Inc. All rights reserved. CL-ANN-91031 1701 | ||
| Annual Report | |
| November 30, 2016 | |
| International Growth Fund | |
| Table of Contents |
| President’s Letter | 2 | |
| Performance | 3 | |
| Portfolio Commentary | ||
| Fund Characteristics | ||
| Shareholder Fee Example | ||
| Schedule of Investments | ||
| Statement of Assets and Liabilities | ||
| Statement of Operations | ||
| Statement of Changes in Net Assets | ||
| Notes to Financial Statements | ||
| Financial Highlights | ||
| Report of Independent Registered Public Accounting Firm | ||
| Management | ||
| Approval of Management Agreement | ||
| Additional Information | ||
Any opinions expressed in this report reflect those of the author as of the date of the report, and do not necessarily represent the opinions of American Century Investments® or any other person in the American Century Investments organization. Any such opinions are subject to change at any time based upon market or other conditions and American Century Investments disclaims any responsibility to update such opinions. These opinions may not be relied upon as investment advice and, because investment decisions made by American Century Investments funds are based on numerous factors, may not be relied upon as an indication of trading intent on behalf of any American Century Investments fund. Security examples are used for representational purposes only and are not intended as recommendations to purchase or sell securities. Performance information for comparative indices and securities is provided to American Century Investments by third party vendors. To the best of American Century Investments’ knowledge, such information is accurate at the time of printing.
| President’s Letter |
Jonathan ThomasDear Investor:
Thank you for reviewing this annual report for the period ended November 30, 2016. Annual reports help convey important information about fund returns, including market factors that affected performance during the reporting period. For additional, updated investment and market insights, we encourage you to visit our website, americancentury.com.
A Year of Surprises: China, Oil, Brexit, Trump
A year ago, we predicted increased market volatility in 2016. Volatility occurred, but not for the reasons we suggested. We expected the Federal Reserve (the Fed)—which in December 2015 raised its short-term interest rate target for the first time since 2006—to raise it three to four more times in 2016 as U.S. economic growth improved. We thought the shift in rate policy would contribute to unsettled conditions as inflation expectations grew, borrowing costs increased, the U.S. dollar strengthened, and bond prices weakened.
Instead, global and U.S. growth largely languished in the first half of 2016 as concerns about China’s growth and plummeting oil prices affected the global economic outlook. The Fed left its target unchanged for 11 months to avoid putting further stress on the global economy and markets. Meanwhile, years of low interest rates, market globalization, and corporate cost-cutting had benefited some segments of the world’s developed democracies much more than others. The others spoke up in June and November, voting for the U.K. to exit the European Union, then propelling Donald Trump to victory. These unexpected populist political results unsettled the markets.
Despite these challenges, and with the continued support of central bank monetary stimulus, broad market index returns for the full reporting period were mostly positive, though they skewed negative in non-U.S. developed equity markets. Looking ahead, Trump’s win shifted the market outlook, unleashing potentially far-reaching ramifications that are still unfolding. What’s clear is that Trump’s policy proposals and his unpredictable nature make uncertainty more certain, which could trigger further bouts of short-term market volatility. In this unsettled environment, we strongly believe in staying the course and remaining focused on longer-term goals, using disciplined, actively managed, diversified, risk-aware strategies. We appreciate your continued trust in us.
Sincerely,
Jonathan Thomas
President and Chief Executive Officer
American Century Investments
2
| Performance |
| Total Returns as of November 30, 2016 | ||||||
Average Annual Returns | ||||||
Ticker Symbol | 1 year | 5 years | 10 years | Since Inception | Inception Date | |
| Investor Class | TWIEX | -8.59% | 5.27% | 1.70% | — | 5/9/91 |
| MSCI EAFE Index | — | -3.66% | 5.61% | 0.72% | — | — |
| MSCI EAFE Growth Index | — | -5.88% | 5.92% | 1.69% | — | — |
| Institutional Class | TGRIX | -8.40% | 5.47% | 1.91% | — | 11/20/97 |
| A Class | TWGAX | 10/2/96 | ||||
| No sales charge | -8.73% | 5.02% | 1.46% | — | ||
| With sales charge | -13.97% | 3.77% | 0.86% | — | ||
| C Class | AIWCX | -9.43% | 4.24% | 0.70% | — | 6/4/01 |
| R Class | ATGRX | -9.00% | 4.75% | 1.20% | — | 8/29/03 |
| R6 Class | ATGDX | -8.19% | — | — | 0.01% | 7/26/13 |
Average annual returns since inception are presented when ten years of performance history is not available.
Prior to December 3, 2007, the A Class was referred to as the Advisor Class and did not have a front-end sales charge. Performance prior to that date has been adjusted to reflect this charge.
Sales charges include initial sales charges and contingent deferred sales charges (CDSCs), as applicable. A Class shares have a 5.75% maximum initial sales charge and may be subject to a maximum CDSC of 1.00%. C Class shares redeemed within 12 months of purchase are subject to a maximum CDSC of 1.00%. The SEC requires that mutual funds provide performance information net of maximum sales charges in all cases where charges could be applied.
Data presented reflect past performance. Past performance is no guarantee of future results. Current performance may be higher or lower than the performance shown. Total returns for periods less than one year are not annualized. Investment return and principal value will fluctuate, and redemption value may be more or less than original cost. Data assumes reinvestment of dividends and capital gains, and none of the charts reflect the deduction of taxes that a shareholder would pay on fund distributions or the redemption of fund shares. To obtain performance data current to the most recent month end, please call 1-800-345-2021 or visit americancentury.com. For additional information about the fund, please consult the prospectus.
3
| Growth of $10,000 Over 10 Years |
| $10,000 investment made November 30, 2006 |
| Performance for other share classes will vary due to differences in fee structure. |
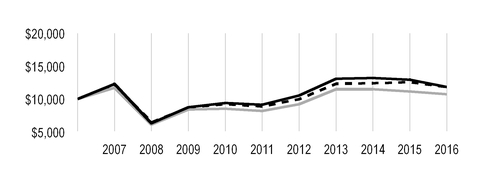
| Value on November 30, 2016 | |
| Investor Class — $11,841 | |
| MSCI EAFE Index — $10,746 | |
MSCI EAFE Growth Index — $11,831 | |
Total Annual Fund Operating Expenses | |||||
| Investor Class | Institutional Class | A Class | C Class | R Class | R6 Class |
| 1.17% | 0.97% | 1.42% | 2.17% | 1.67% | 0.82% |
The total annual fund operating expenses shown is as stated in the fund’s prospectus current as of the date of this report. The prospectus may vary from the expense ratio shown elsewhere in this report because it is based on a different time period, includes acquired fund fees and expenses, and, if applicable, does not include fee waivers or expense reimbursements.
Data presented reflect past performance. Past performance is no guarantee of future results. Current performance may be higher or lower than the performance shown. Total returns for periods less than one year are not annualized. Investment return and principal value will fluctuate, and redemption value may be more or less than original cost. Data assumes reinvestment of dividends and capital gains, and none of the charts reflect the deduction of taxes that a shareholder would pay on fund distributions or the redemption of fund shares. To obtain performance data current to the most recent month end, please call 1-800-345-2021 or visit americancentury.com. For additional information about the fund, please consult the prospectus.
4
| Portfolio Commentary |
Portfolio Manager: Raj Gandhi and James Gendelman
Performance Summary
International Growth declined -8.59%* for the 12 months ended November 30, 2016. The portfolio’s benchmark, the MSCI EAFE Index, declined -3.66% for the same period.
Non-U.S. developed market stocks declined during the 12-month period, sharply lagging returns provided by U.S.-based equities. Among non-U.S. developed market stocks, the Asia Pacific region fared the best, delivering a small gain, equities based in the Far East posted modest losses, and those based in Europe sharply lagged. Over the last 12 months, our process faced a number of headwinds that meaningfully impacted results:
(1) The strongest driver of stock price performance has been dividend yield; current income is not a key consideration in our process;
(2) The scarcity of growth around the globe has led to a continuation of central bank policy characterized by abnormally low interest rates. This has led to uncertainty and volatility for stocks and helped more defensive securities outperform;
(3) The degree of intra-stock correlation has increased. As a result, the market has not been differentiating among securities based on earnings or fundamentals; and
(4) Currency volatility has been high, causing currency effects to have a larger-than-normal impact on relative returns.
In addition, the uncertainty associated with the U.K.’s late June Brexit vote triggered a sharp market correction that spilled into the beginning of the third quarter, with most equity markets continuing to decline. Subsequently, a combination of better-than-expected earnings and the realization that the aftermath of Brexit would not be as bad as originally feared, led to a rerating of stocks and a market turnaround. Markets recovered some of their Brexit-related losses, finishing lower for the year but well above their lowest levels.
Overall, the fund lagged its benchmark, primarily due to stock selection in the financials, information technology, consumer staples, and health care sectors. Regionally, stock selection in Japan and the U.K. and positioning in Australia also contributed to the fund’s underperformance.
Italian Bank was a Top Detractor
Among individual detractors to performance Italy-based bank Intesa Sanpaolo, which declined due to concerns over weakness in the Italian banking sector and the fear that regulators may force it to take over a lower-quality bank. Ongoing concerns about the negative interest rate environment in Europe on net interest margins also weighed heavily on the stock. Although we continue to view Intesa Sanpaolo as one of the highest-quality banks in Italy, with strong capital ratio and continued strong loan growth, persistent pressure on the stock due to worries over Italian banks in general convinced us to sell the position.
*All fund returns referenced in this commentary are for Investor Class shares. Performance for other share
classes will vary due to differences in fee structure; when Investor Class performance exceeds that of the
fund's benchmark, other share classes may not. See page 3 for returns for all share classes.
5
In the health care sector, Denmark-based pharmaceutical company Novo Nordisk weighed on returns. Renewed concern over pricing pressure on insulin products in the U.S. and a competitive threat resulting from the patent expiration of Sanofi’s insulin treatment, Lantus, triggered a sharp decline in the stock in the third quarter. As a result, we exited the position.
Consumer Discretionary Sector was Main Contributor
Strong stock selection in consumer discretionary benefited performance. Regionally, stock selection in Germany and Portugal and portfolio-only positions in China aided results.
Germany-based adidas added value, as the shares delivered strong returns in the second and third quarters. Resurgent strength in the adidas brand in both sports and fashion contributed to better-than-expected financial results in May. The athletic shoe and apparel manufacturer is seeing positive results from restructuring efforts put in place by its new CEO. In particular, margins have improved. The company is also benefiting from soccer’s increased popularity.
Another standout performer was portfolio-only holding Tencent, a social media and online gaming company headquartered in China. A continued shift in global advertising spending away from traditional media, such as television and newspapers, to online and mobile has boosted Tencent’s advertising revenues and enabled it to deliver consistently strong financial results. The company has more than 1.5 billion active users and continues to attract more. Another positive trend for Tencent is the transition of games from PC to mobile.
Outlook
Portfolio positioning remains a function of bottom-up stock selection. Selection of stocks exhibiting improving and strong, sustainable growth that, based on inflecting earnings, is not well represented in either consensus or the stock price helps the investment team identify market trends. The complexion of the consumer discretionary sector has changed. We are finding opportunities in companies that have positioned themselves to profit from the continued shift in consumer behavior from offline to online commerce. We also favor those that are benefiting from the proliferation of smartphones and the subsequent expansion of content-driven applications and digital advertising development. We remain underweight financials but have added slightly to our positions as the steepening of the yield curve should lead to improved net interest margins. Our process has identified improvement in the materials sector driven by stabilization of the supply/demand balance, better pricing, and a stronger outlook for residential construction in both Europe and the U.S.
6
| Fund Characteristics |
| NOVEMBER 30, 2016 | |
Top Ten Holdings | % of net assets |
| Roche Holding AG | 2.9% |
| AIA Group Ltd. | 2.1% |
| Shire plc | 1.9% |
| CRH plc | 1.8% |
| British American Tobacco plc | 1.7% |
| Rio Tinto plc | 1.7% |
| Tencent Holdings Ltd. | 1.6% |
| TOTAL SA | 1.6% |
| Kering | 1.6% |
| SAP SE | 1.5% |
Types of Investments in Portfolio | % of net assets |
| Common Stocks | 99.6% |
| Temporary Cash Investments | 0.1% |
| Other Assets and Liabilities | 0.3% |
Investments by Country | % of net assets |
| United Kingdom | 21.1% |
| France | 16.9% |
| Japan | 13.8% |
| Germany | 8.3% |
| Switzerland | 5.0% |
| Hong Kong | 3.1% |
| China | 3.1% |
| Ireland | 2.8% |
| Netherlands | 2.4% |
| Australia | 2.3% |
| Belgium | 2.2% |
| Denmark | 2.2% |
| Sweden | 2.1% |
| Spain | 2.1% |
| Other Countries | 12.2% |
| Cash and Equivalents* | 0.4% |
*Includes temporary cash investments and other assets and liabilities.
7
| Shareholder Fee Example |
Fund shareholders may incur two types of costs: (1) transaction costs, including sales charges (loads) on purchase payments and redemption/exchange fees; and (2) ongoing costs, including management fees; distribution and service (12b-1) fees; and other fund expenses. This example is intended to help you understand your ongoing costs (in dollars) of investing in your fund and to compare these costs with the ongoing cost of investing in other mutual funds.
The example is based on an investment of $1,000 made at the beginning of the period and held for the entire period from June 1, 2016 to November 30, 2016.
Actual Expenses
The table provides information about actual account values and actual expenses for each class. You may use the information, together with the amount you invested, to estimate the expenses that you paid over the period. First, identify the share class you own. Then simply divide your account value by $1,000 (for example, an $8,600 account value divided by $1,000 = 8.6), then multiply the result by the number under the heading “Expenses Paid During Period” to estimate the expenses you paid on your account during this period.
If you hold Investor Class shares of any American Century Investments fund, or Institutional Class shares of the American Century Diversified Bond Fund, in an American Century Investments account (i.e., not a financial intermediary or retirement plan account), American Century Investments may charge you a $12.50 semiannual account maintenance fee if the value of those shares is less than $10,000. We will redeem shares automatically in one of your accounts to pay the $12.50 fee. In determining your total eligible investment amount, we will include your investments in all personal accounts (including American Century Investments Brokerage accounts) registered under your Social Security number. Personal accounts include individual accounts, joint accounts, UGMA/UTMA accounts, personal trusts, Coverdell Education Savings Accounts and IRAs (including traditional, Roth, Rollover, SEP-, SARSEP- and SIMPLE-IRAs), and certain other retirement accounts. If you have only business, business retirement, employer-sponsored or American Century Investments Brokerage accounts, you are currently not subject to this fee. If you are subject to the Account Maintenance Fee, your account value could be reduced by the fee amount.
Hypothetical Example for Comparison Purposes
The table also provides information about hypothetical account values and hypothetical expenses based on the actual expense ratio of each class of your fund and an assumed rate of return of 5% per year before expenses, which is not the actual return of a fund’s share class. The hypothetical account values and expenses may not be used to estimate the actual ending account balance or expenses you paid for the period. You may use this information to compare the ongoing costs of investing in your fund and other funds. To do so, compare this 5% hypothetical example with the 5% hypothetical examples that appear in the shareholder reports of the other funds.
Please note that the expenses shown in the table are meant to highlight your ongoing costs only and do not reflect any transactional costs, such as sales charges (loads) or redemption/exchange fees. Therefore, the table is useful in comparing ongoing costs only, and will not help you determine the relative total costs of owning different funds. In addition, if these transactional costs were included, your costs would have been higher.
8
| Beginning Account Value 6/1/16 | Ending Account Value 11/30/16 | Expenses Paid During Period(1) 6/1/16 - 11/30/16 | Annualized Expense Ratio(1) | |
Actual | ||||
| Investor Class | $1,000 | $947.10 | $5.74 | 1.18% |
| Institutional Class | $1,000 | $947.70 | $4.77 | 0.98% |
| A Class | $1,000 | $946.60 | $6.96 | 1.43% |
| C Class | $1,000 | $943.40 | $10.59 | 2.18% |
| R Class | $1,000 | $945.30 | $8.17 | 1.68% |
| R6 Class | $1,000 | $949.50 | $4.05 | 0.83% |
| Hypothetical | ||||
| Investor Class | $1,000 | $1,019.10 | $5.96 | 1.18% |
| Institutional Class | $1,000 | $1,020.10 | $4.95 | 0.98% |
| A Class | $1,000 | $1,017.85 | $7.21 | 1.43% |
| C Class | $1,000 | $1,014.10 | $10.98 | 2.18% |
| R Class | $1,000 | $1,016.60 | $8.47 | 1.68% |
| R6 Class | $1,000 | $1,020.85 | $4.19 | 0.83% |
| (1) | Expenses are equal to the class's annualized expense ratio listed in the table above, multiplied by the average account value over the period, multiplied by 183, the number of days in the most recent fiscal half-year, divided by 366, to reflect the one-half year period. |
9
| Schedule of Investments |
NOVEMBER 30, 2016
| Shares | Value | ||||
| COMMON STOCKS — 99.6% | |||||
| Australia — 2.3% | |||||
| CSL Ltd. | 109,530 | $ | 7,926,477 | ||
| Fortescue Metals Group Ltd. | 2,839,300 | 12,307,517 | |||
| Treasury Wine Estates Ltd. | 1,556,790 | 12,404,307 | |||
| 32,638,301 | |||||
| Austria — 1.0% | |||||
| Erste Group Bank AG | 508,740 | 14,148,292 | |||
| Belgium — 2.2% | |||||
| KBC Group NV | 366,750 | 21,992,639 | |||
| UCB SA | 152,490 | 9,810,121 | |||
| 31,802,760 | |||||
| Brazil — 0.5% | |||||
| BM&FBovespa SA - Bolsa de Valores Mercadorias e Futuros | 1,384,300 | 6,798,605 | |||
| Canada — 1.1% | |||||
| Alimentation Couche-Tard, Inc., B Shares | 339,060 | 15,646,787 | |||
| China — 3.1% | |||||
Alibaba Group Holding Ltd. ADR(1) | 230,740 | 21,694,175 | |||
| Tencent Holdings Ltd. | 944,500 | 23,586,624 | |||
| 45,280,799 | |||||
| Denmark — 2.2% | |||||
| DSV A/S | 331,890 | 14,934,305 | |||
| Pandora A/S | 140,282 | 16,695,124 | |||
| 31,629,429 | |||||
| France — 16.9% | |||||
ArcelorMittal(1) | 2,569,250 | 19,409,678 | |||
| Arkema SA | 164,170 | 15,725,716 | |||
| BNP Paribas SA | 341,530 | 19,828,742 | |||
Criteo SA ADR(1) | 260,680 | 10,758,264 | |||
| Danone SA | 192,750 | 12,126,419 | |||
| Essilor International SA | 159,305 | 16,900,820 | |||
| Kering | 103,810 | 22,554,715 | |||
| L'Oreal SA | 59,510 | 10,157,690 | |||
| Legrand SA | 104,730 | 5,855,148 | |||
| Publicis Groupe SA | 228,660 | 14,838,799 | |||
| Rexel SA | 535,400 | 8,279,001 | |||
| Thales SA | 181,600 | 17,732,142 | |||
| TOTAL SA | 482,160 | 22,972,775 | |||
| Valeo SA | 305,784 | 17,050,116 | |||
| Vinci SA | 189,230 | 12,280,005 | |||
| Vivendi SA | 898,610 | 17,133,524 | |||
| 243,603,554 | |||||
| Germany — 8.3% | |||||
| adidas AG | 123,380 | 18,176,232 | |||
Deutsche Boerse AG(1) | 160,770 | 12,992,393 | |||
| Fresenius Medical Care AG & Co. KGaA | 165,770 | 12,930,879 | |||
| HeidelbergCement AG | 212,630 | 19,067,358 | |||
10
| Shares | Value | ||||
| Infineon Technologies AG | 626,070 | $ | 10,470,663 | ||
| SAP SE | 263,640 | 22,040,553 | |||
| Symrise AG | 73,256 | 4,434,040 | |||
Zalando SE(1) | 550,160 | 20,504,252 | |||
| 120,616,370 | |||||
| Hong Kong — 3.1% | |||||
| AIA Group Ltd. | 5,059,200 | 30,851,565 | |||
| Sands China Ltd. | 2,980,800 | 14,680,147 | |||
| 45,531,712 | |||||
| India — 1.5% | |||||
| HDFC Bank Ltd. | 348,520 | 6,945,558 | |||
| Tata Motors Ltd. | 2,172,290 | 14,576,305 | |||
| 21,521,863 | |||||
| Indonesia — 1.7% | |||||
| Astra International Tbk PT | 24,527,600 | 13,664,149 | |||
| Bank Mandiri Persero Tbk PT | 14,741,000 | 11,420,808 | |||
| 25,084,957 | |||||
| Ireland — 2.8% | |||||
| CRH plc | 765,080 | 25,538,345 | |||
Ryanair Holdings plc ADR(1) | 193,491 | 15,448,321 | |||
| 40,986,666 | |||||
| Israel — 0.7% | |||||
Mobileye NV(1) | 278,110 | 10,354,035 | |||
| Italy — 0.3% | |||||
| Azimut Holding SpA | 334,950 | 4,998,353 | |||
| Japan — 13.8% | |||||
| Calbee, Inc. | 411,800 | 12,832,193 | |||
| CyberAgent, Inc. | 212,000 | 5,153,376 | |||
| Daikin Industries Ltd. | 186,000 | 17,420,480 | |||
| Daito Trust Construction Co. Ltd. | 107,900 | 16,764,324 | |||
| FANUC CORP. | 40,900 | 6,901,573 | |||
| Fast Retailing Co. Ltd. | 32,900 | 11,379,336 | |||
| Fuji Heavy Industries Ltd. | 108,300 | 4,397,129 | |||
| Isuzu Motors Ltd. | 305,300 | 3,599,927 | |||
| Keyence Corp. | 23,300 | 15,932,512 | |||
| Komatsu Ltd. | 696,000 | 16,021,293 | |||
LINE Corp.(1) | 286,200 | 11,032,227 | |||
| Nitori Holdings Co. Ltd. | 145,300 | 15,164,390 | |||
| NTT DOCOMO, Inc. | 481,000 | 11,032,245 | |||
| ORIX Corp. | 1,140,000 | 17,751,934 | |||
| Ryohin Keikaku Co. Ltd. | 77,100 | 15,116,061 | |||
| Start Today Co. Ltd. | 653,700 | 10,039,342 | |||
| Sysmex Corp. | 144,100 | 8,678,371 | |||
| 199,216,713 | |||||
| Mexico — 1.2% | |||||
Cemex SAB de CV ADR(1) | 1,731,963 | 13,526,631 | |||
| Fomento Economico Mexicano SAB de CV ADR | 52,010 | 4,059,381 | |||
| 17,586,012 | |||||
| Netherlands — 2.4% | |||||
| ASML Holding NV | 113,690 | 11,762,655 | |||
| Koninklijke DSM NV | 223,670 | 13,564,378 | |||
11
| Shares | Value | ||||
| Koninklijke Vopak NV | 209,780 | $ | 9,804,985 | ||
| 35,132,018 | |||||
| Norway — 1.8% | |||||
| DNB ASA | 801,980 | 11,812,525 | |||
| Statoil ASA | 812,599 | 13,925,578 | |||
| 25,738,103 | |||||
| Portugal — 1.2% | |||||
| Jeronimo Martins SGPS SA | 1,057,641 | 16,713,223 | |||
| Russia — 0.5% | |||||
| Magnit PJSC GDR | 174,420 | 7,025,638 | |||
| South Korea — 0.7% | |||||
| Amorepacific Corp. | 19,440 | 5,454,275 | |||
| BGF retail Co. Ltd. | 72,100 | 5,365,639 | |||
| 10,819,914 | |||||
| Spain — 2.1% | |||||
| Cellnex Telecom SA | 576,605 | 8,078,935 | |||
| Industria de Diseno Textil SA | 632,960 | 21,651,441 | |||
| 29,730,376 | |||||
| Sweden — 2.1% | |||||
| Hexagon AB, B Shares | 453,080 | 16,049,490 | |||
Lundin Petroleum AB(1) | 767,880 | 14,470,393 | |||
| 30,519,883 | |||||
| Switzerland — 5.0% | |||||
| Cie Financiere Richemont SA | 108,520 | 7,092,706 | |||
| Julius Baer Group Ltd. | 405,840 | 17,934,879 | |||
| Roche Holding AG | 191,004 | 42,589,364 | |||
| Zurich Insurance Group AG | 16,330 | 4,280,461 | |||
| 71,897,410 | |||||
| United Kingdom — 21.1% | |||||
| Admiral Group plc | 316,209 | 7,521,127 | |||
| Ashtead Group plc | 1,060,275 | 20,788,067 | |||
ASOS plc(1) | 243,396 | 15,369,981 | |||
| Auto Trader Group plc | 2,302,870 | 11,516,756 | |||
| Aviva plc | 3,682,495 | 20,595,687 | |||
| British American Tobacco plc | 449,390 | 24,703,622 | |||
| Bunzl plc | 419,600 | 10,815,069 | |||
| Compass Group plc | 618,180 | 10,604,226 | |||
| London Stock Exchange Group plc | 458,230 | 15,755,306 | |||
| Reckitt Benckiser Group plc | 258,056 | 21,836,345 | |||
| RELX plc | 255,570 | 4,396,825 | |||
| Rio Tinto plc | 651,050 | 24,356,345 | |||
| Royal Dutch Shell plc, A Shares | 559,640 | 14,223,360 | |||
| Shire plc | 467,050 | 27,231,771 | |||
| St. James's Place plc | 1,041,351 | 12,247,617 | |||
Tullow Oil plc(1) | 2,150,620 | 8,013,366 | |||
| Weir Group plc (The) | 948,870 | 21,465,042 | |||
| Wolseley plc | 334,390 | 19,434,152 | |||
| Worldpay Group plc | 4,196,786 | 14,135,737 | |||
| 305,010,401 | |||||
TOTAL COMMON STOCKS (Cost $1,339,984,449) | 1,440,032,174 | ||||
12
| Shares | Value | ||||
| TEMPORARY CASH INVESTMENTS — 0.1% | |||||
| Repurchase Agreement, Fixed Income Clearing Corp., (collateralized by various U.S. Treasury obligations, 2.875%, 8/15/45, valued at $757,763), at 0.08%, dated 11/30/16, due 12/1/16 (Delivery value $739,002) | $ | 739,000 | |||
| State Street Institutional U.S. Government Money Market Fund, Premier Class | 270 | 270 | |||
TOTAL TEMPORARY CASH INVESTMENTS (Cost $739,270) | 739,270 | ||||
TOTAL INVESTMENT SECURITIES — 99.7% (Cost $1,340,723,719) | 1,440,771,444 | ||||
| OTHER ASSETS AND LIABILITIES — 0.3% | 4,580,888 | ||||
| TOTAL NET ASSETS — 100.0% | $ | 1,445,352,332 | |||
| MARKET SECTOR DIVERSIFICATION | ||
| (as a % of net assets) | ||
| Consumer Discretionary | 20.0 | % |
| Financials | 16.3 | % |
| Industrials | 13.3 | % |
| Information Technology | 12.3 | % |
| Consumer Staples | 10.3 | % |
| Materials | 10.1 | % |
| Health Care | 8.8 | % |
| Energy | 5.9 | % |
| Telecommunication Services | 1.4 | % |
| Real Estate | 1.2 | % |
| Cash and Equivalents* | 0.4 | % |
*Includes temporary cash investments and other assets and liabilities.
| NOTES TO SCHEDULE OF INVESTMENTS | ||
| ADR | - | American Depositary Receipt |
| GDR | - | Global Depositary Receipt |
| (1) | Non-income producing. |
See Notes to Financial Statements.
13
| Statement of Assets and Liabilities |
| NOVEMBER 30, 2016 | |||
| Assets | |||
| Investment securities, at value (cost of $1,340,723,719) | $ | 1,440,771,444 | |
| Receivable for investments sold | 1,634,791 | ||
| Receivable for capital shares sold | 1,497,600 | ||
| Dividends and interest receivable | 3,360,178 | ||
| Other assets | 311,699 | ||
| 1,447,575,712 | |||
| Liabilities | |||
| Foreign currency overdraft payable, at value (cost of $85,585) | 128,485 | ||
| Payable for investments purchased | 1,916 | ||
| Payable for capital shares redeemed | 677,954 | ||
| Accrued management fees | 1,384,978 | ||
| Distribution and service fees payable | 30,047 | ||
| 2,223,380 | |||
| Net Assets | $ | 1,445,352,332 | |
| Net Assets Consist of: | |||
| Capital (par value and paid-in surplus) | $ | 1,393,958,245 | |
| Distributions in excess of net investment income | (5,717,742 | ) | |
| Accumulated net realized loss | (42,686,460 | ) | |
| Net unrealized appreciation | 99,798,289 | ||
| $ | 1,445,352,332 | ||
| Net Assets | Shares Outstanding | Net Asset Value Per Share | ||||
| Investor Class, $0.01 Par Value | $1,229,531,389 | 116,383,300 | $10.56 | |||
| Institutional Class, $0.01 Par Value | $59,236,291 | 5,634,188 | $10.51 | |||
| A Class, $0.01 Par Value | $108,847,492 | 10,241,060 | $10.63* | |||
| C Class, $0.01 Par Value | $6,743,494 | 652,906 | $10.33 | |||
| R Class, $0.01 Par Value | $3,090,469 | 288,331 | $10.72 | |||
| R6 Class, $0.01 Par Value | $37,903,197 | 3,600,620 | $10.53 | |||
See Notes to Financial Statements.
14
| Statement of Operations |
| YEAR ENDED NOVEMBER 30, 2016 | |||
| Investment Income (Loss) | |||
| Income: | |||
| Dividends (net of foreign taxes withheld of $3,397,917) | $ | 31,362,360 | |
| Interest (net of foreign taxes withheld of $6,016) | 24,287 | ||
| 31,386,647 | |||
| Expenses: | |||
| Management fees | 18,048,113 | ||
| Distribution and service fees: | |||
| A Class | 312,961 | ||
| C Class | 86,088 | ||
| R Class | 16,761 | ||
| Directors' fees and expenses | 52,409 | ||
| Other expenses | 57,995 | ||
| 18,574,327 | |||
| Net investment income (loss) | 12,812,320 | ||
| Realized and Unrealized Gain (Loss) | |||
| Net realized gain (loss) on: | |||
| Investment transactions (net of foreign tax expenses paid (refunded) of $24,297) | (35,297,625 | ) | |
| Foreign currency transactions | (300,069 | ) | |
| (35,597,694 | ) | ||
| Change in net unrealized appreciation (depreciation) on: | |||
| Investments | (116,021,392 | ) | |
| Translation of assets and liabilities in foreign currencies | 80,359 | ||
| (115,941,033 | ) | ||
| Net realized and unrealized gain (loss) | (151,538,727 | ) | |
| Net Increase (Decrease) in Net Assets Resulting from Operations | $ | (138,726,407 | ) |
See Notes to Financial Statements.
15
| Statement of Changes in Net Assets |
| YEARS ENDED NOVEMBER 30, 2016 AND NOVEMBER 30, 2015 | ||||||
| Increase (Decrease) in Net Assets | November 30, 2016 | November 30, 2015 | ||||
| Operations | ||||||
| Net investment income (loss) | $ | 12,812,320 | $ | 10,786,685 | ||
| Net realized gain (loss) | (35,597,694 | ) | 87,356,870 | |||
| Change in net unrealized appreciation (depreciation) | (115,941,033 | ) | (129,770,763 | ) | ||
| Net increase (decrease) in net assets resulting from operations | (138,726,407 | ) | (31,627,208 | ) | ||
| Distributions to Shareholders | ||||||
| From net investment income: | ||||||
| Investor Class | (7,144,126 | ) | (9,233,796 | ) | ||
| Institutional Class | (467,296 | ) | (974,176 | ) | ||
| A Class | (436,078 | ) | (1,277,492 | ) | ||
| R Class | (4,047 | ) | (5,076 | ) | ||
| R6 Class | (376,203 | ) | (72,931 | ) | ||
| From net realized gains: | ||||||
| Investor Class | (71,718,645 | ) | (90,129,091 | ) | ||
| Institutional Class | (3,592,483 | ) | (7,644,959 | ) | ||
| A Class | (7,082,263 | ) | (17,916,622 | ) | ||
| C Class | (530,306 | ) | (608,755 | ) | ||
| R Class | (173,171 | ) | (127,609 | ) | ||
| R6 Class | (2,461,989 | ) | (499,554 | ) | ||
| Decrease in net assets from distributions | (93,986,607 | ) | (128,490,061 | ) | ||
| Capital Share Transactions | ||||||
| Net increase (decrease) in net assets from capital share transactions (Note 5) | (28,937,016 | ) | (115,044,232 | ) | ||
| Redemption Fees | ||||||
| Increase in net assets from redemption fees | 19,316 | 63,558 | ||||
| Net increase (decrease) in net assets | (261,630,714 | ) | (275,097,943 | ) | ||
| Net Assets | ||||||
| Beginning of period | 1,706,983,046 | 1,982,080,989 | ||||
| End of period | $ | 1,445,352,332 | $ | 1,706,983,046 | ||
| Distributions in excess of net investment income | $ | (5,717,742 | ) | $ | (6,403,309 | ) |
See Notes to Financial Statements.
16
| Notes to Financial Statements |
NOVEMBER 30, 2016
1. Organization
American Century World Mutual Funds, Inc. (the corporation) is registered under the Investment Company Act of 1940, as amended (the 1940 Act), as an open-end management investment company and is organized as a Maryland corporation. International Growth Fund (the fund) is one fund in a series issued by the corporation. The fund's investment objective is to seek capital growth.
The fund offers the Investor Class, the Institutional Class, the A Class, the C Class, the R Class and the R6 Class. The A Class may incur an initial sales charge. The A Class and C Class may be subject to a contingent deferred sales charge. The share classes differ principally in their respective sales charges and distribution and shareholder servicing expenses and arrangements. The Institutional Class and R6 Class shareholders do not require the same level of shareholder and administrative services from American Century Investment Management, Inc. (ACIM) (the investment advisor) as shareholders of other classes. In addition, financial intermediaries do not receive any fees for the R6 Class. As a result, the Institutional Class and R6 Class are charged lower unified management fees.
2. Significant Accounting Policies
The following is a summary of significant accounting policies consistently followed by the fund in preparation of its financial statements. The fund is an investment company and follows accounting and reporting guidance in accordance with accounting principles generally accepted in the United States of America. This may require management to make certain estimates and assumptions at the date of the financial statements. Actual results could differ from these estimates. Management evaluated the impact of events or transactions occurring through the date the financial statements were issued that would merit recognition or disclosure.
Investment Valuations — The fund determines the fair value of its investments and computes its net asset value per share at the close of regular trading (usually 4 p.m. Eastern time) on the New York Stock Exchange (NYSE) on each day the NYSE is open. The Board of Directors has adopted valuation policies and procedures to guide the investment advisor in the fund’s investment valuation process and to provide methodologies for the oversight of the fund’s pricing function.
Equity securities that are listed or traded on a domestic securities exchange are valued at the last reported sales price or at the official closing price as provided by the exchange. Equity securities traded on foreign securities exchanges are generally valued at the closing price of such securities on the exchange where primarily traded or at the close of the NYSE, if that is earlier. If no last sales price is reported, or if local convention or regulation so provides, the mean of the latest bid and asked prices may be used. Securities traded over-the-counter are valued at the mean of the latest bid and asked prices, the last sales price, or the official closing price. Equity securities initially expressed in local currencies are translated into U.S. dollars at the mean of the appropriate currency exchange rate at the close of the NYSE as provided by an independent pricing service.
Open-end management investment companies are valued at the reported net asset value per share. Repurchase agreements are valued at cost, which approximates fair value.
If the fund determines that the market price for an investment is not readily available or the valuation methods mentioned above do not reflect an investment’s fair value, such investment is valued as determined in good faith by the Board of Directors or its delegate, in accordance with policies and procedures adopted by the Board of Directors. In its determination of fair value, the fund may review several factors including, but not limited to, market information regarding the specific investment or comparable investments and correlation with other investment types, futures indices or general market indicators. Circumstances that may cause the fund to use these procedures to value an investment include, but are not limited to: an investment has been declared in default or is distressed; trading in a security has been suspended during the trading day or a security is not actively trading on its principal exchange; prices received from a regular pricing source are deemed unreliable; or there is a foreign market holiday and no trading occurred.
17
The fund monitors for significant events occurring after the close of an investment’s primary exchange but before the fund’s net asset value per share is determined. Significant events may include, but are not limited to: corporate announcements and transactions; governmental action and political unrest that could impact a specific investment or an investment sector; or armed conflicts, natural disasters and similar events that could affect investments in a specific country or region. The fund also monitors for significant fluctuations between domestic and foreign markets, as evidenced by the U.S. market or such other indicators that the Board of Directors, or its delegate, deems appropriate. If significant fluctuations in foreign markets are identified, the fund may apply a model-derived factor to the closing price of equity securities traded on foreign securities exchanges. The factor is based on observable market data as provided by an independent pricing service.
Security Transactions — Security transactions are accounted for as of the trade date. Net realized gains and losses are determined on the identified cost basis, which is also used for federal income tax purposes. Certain countries impose taxes on realized gains on the sale of securities registered in their country. The fund records the foreign tax expense, if any, on an accrual basis. The foreign tax expense on realized gains and unrealized appreciation reduces the net realized gain (loss) on investment transactions and net unrealized appreciation (depreciation) on investments, respectively.
Investment Income — Dividend income less foreign taxes withheld, if any, is recorded as of the ex-dividend date. Distributions received on securities that represent a return of capital or long-term capital gain are recorded as a reduction of cost of investments and/or as a realized gain. The fund may estimate the components of distributions received that may be considered nontaxable distributions or long-term capital gain distributions for income tax purposes. Interest income less foreign taxes withheld, if any, is recorded on the accrual basis and includes accretion of discounts and amortization of premiums.
Foreign Currency Translations — All assets and liabilities initially expressed in foreign currencies are translated into U.S. dollars at prevailing exchange rates at period end. The fund may enter into spot foreign currency exchange contracts to facilitate transactions denominated in a foreign currency. Purchases and sales of investment securities, dividend and interest income, spot foreign currency exchange contracts, and expenses are translated at the rates of exchange prevailing on the respective dates of such transactions. Net realized and unrealized foreign currency exchange gains or losses related to investment securities are a component of net realized gain (loss) on investment transactions and change in net unrealized appreciation (depreciation) on investments, respectively.
Repurchase Agreements — The fund may enter into repurchase agreements with institutions that ACIM has determined are creditworthy pursuant to criteria adopted by the Board of Directors. The fund requires that the collateral, represented by securities, received in a repurchase transaction be transferred to the custodian in a manner sufficient to enable the fund to obtain those securities in the event of a default under the repurchase agreement. ACIM monitors, on a daily basis, the securities transferred to ensure the value, including accrued interest, of the securities under each repurchase agreement is equal to or greater than amounts owed to the fund under each repurchase agreement.
Joint Trading Account — Pursuant to an Exemptive Order issued by the Securities and Exchange Commission, the fund, along with certain other funds in the American Century Investments family of funds, may transfer uninvested cash balances into a joint trading account. These balances are invested in one or more repurchase agreements that are collateralized by U.S. Treasury or Agency obligations.
Income Tax Status — It is the fund’s policy to distribute substantially all net investment income and net realized gains to shareholders and to otherwise qualify as a regulated investment company under provisions of the Internal Revenue Code. Accordingly, no provision has been made for income taxes. The fund files U.S. federal, state, local and non-U.S. tax returns as applicable. The fund's tax returns are subject to examination by the relevant taxing authority until expiration of the applicable statute of limitations, which is generally three years from the date of filing but can be longer in certain jurisdictions. At this time, management believes there are no uncertain tax positions which, based on their technical merit, would not be sustained upon examination and for which it is reasonably possible that the total amounts of unrecognized tax benefits will significantly change in the next twelve months.
Multiple Class — All shares of the fund represent an equal pro rata interest in the net assets of the class to which such shares belong, and have identical voting, dividend, liquidation and other rights and the same terms and conditions, except for class specific expenses and exclusive rights to vote on matters affecting only individual classes. Income, non-class specific expenses, and realized and unrealized capital gains and losses of the fund are allocated to each class of shares based on their relative net assets.
18
Distributions to Shareholders — Distributions from net investment income and net realized gains, if any, are generally declared and paid annually. The fund may make distributions on a more frequent basis to comply with the distribution requirements of the Internal Revenue Code, in all events in a manner consistent with provisions of the 1940 Act.
Redemption Fees — The fund may impose a 2.00% redemption fee on shares held less than 60 days. The fee may not be applicable to all classes. The redemption fee is retained by the fund and helps cover transaction costs that long-term investors may bear when the fund sells securities to meet investor redemptions.
Indemnifications — Under the corporation’s organizational documents, its officers and directors are indemnified against certain liabilities arising out of the performance of their duties to the fund. In addition, in the normal course of business, the fund enters into contracts that provide general indemnifications. The maximum exposure under these arrangements is unknown as this would involve future claims that may be made against a fund. The risk of material loss from such claims is considered by management to be remote.
3. Fees and Transactions with Related Parties
Certain officers and directors of the corporation are also officers and/or directors of American Century Companies, Inc. (ACC). The corporation’s investment advisor, ACIM, the corporation's distributor, American Century Investment Services, Inc. (ACIS), and the corporation’s transfer agent, American Century Services, LLC, are wholly owned, directly or indirectly, by ACC. Various funds issued by American Century Asset Allocation Portfolios, Inc. and American Century Strategic Asset Allocations, Inc. own, in aggregate, 19% of the shares of the fund.
Management Fees — The corporation has entered into a management agreement with ACIM, under which ACIM provides the fund with investment advisory and management services in exchange for a single, unified management fee (the fee) per class. The agreement provides that all expenses of managing and operating the fund, except distribution and service fees, brokerage expenses, taxes, interest, fees and expenses of the independent directors (including legal counsel fees), and extraordinary expenses, will be paid by ACIM. The fee is computed and accrued daily based on each class’s daily net assets and paid monthly in arrears. The rate of the fee is determined by applying a fee rate calculation formula. This formula takes into account the fund’s assets as well as certain assets, if any, of other clients of the investment advisor outside the American Century Investments family of funds (such as subadvised funds and separate accounts) that have very similar investment teams and investment strategies (strategy assets). The strategy assets of the fund also include the assets of NT International Growth Fund, one fund in a series issued by the corporation. The annual management fee schedule ranges from 1.050% to 1.500% for the Investor Class, A Class, C Class and R Class. The annual management fee schedule ranges from 0.850% to 1.300% for the Institutional Class and 0.700% to 1.150% for the R6 Class. The effective annual management fee for each class for the year ended November 30, 2016 was 1.17% for the Investor Class, A Class, C Class and R Class, 0.97% for the Institutional Class and 0.82% for the R6 Class.
Distribution and Service Fees — The Board of Directors has adopted a separate Master Distribution and Individual Shareholder Services Plan for each of the A Class, C Class and R Class (collectively the plans), pursuant to Rule 12b-1 of the 1940 Act. The plans provide that the A Class will pay ACIS an annual distribution and service fee of 0.25%. The plans provide that the C Class will pay ACIS an annual distribution and service fee of 1.00%, of which 0.25% is paid for individual shareholder services and 0.75% is paid for distribution services. The plans provide that the R Class will pay ACIS an annual distribution and service fee of 0.50%. The fees are computed and accrued daily based on each class’s daily net assets and paid monthly in arrears. The fees are used to pay financial intermediaries for distribution and individual shareholder services. Fees incurred under the plans during the year ended November 30, 2016 are detailed in the Statement of Operations.
Directors' Fees and Expenses — The Board of Directors is responsible for overseeing the investment advisor’s management and operations of the fund. The directors receive detailed information about the fund and its investment advisor regularly throughout the year, and meet at least quarterly with management of the investment advisor to review reports about fund operations. The fund’s officers do not receive compensation from the fund.
19
Interfund Transactions — The fund may enter into security transactions with other American Century Investments funds and other client accounts of the investment advisor, in accordance with the 1940 Act rules and procedures adopted by the Board of Directors. The rules and procedures require, among other things, that these transactions be effected at the independent current market price of the security. During the period, the interfund purchases and sales were $572,313 and $15,147,868, respectively. The effect of interfund transactions on the Statement of Operations was $272,249 in net realized gain (loss) on investment transactions.
4. Investment Transactions
Purchases and sales of investment securities, excluding short-term investments, for the year ended November 30, 2016 were $1,081,368,424 and $1,174,240,872, respectively.
5. Capital Share Transactions
Transactions in shares of the fund were as follows:
| Year ended November 30, 2016 | Year ended November 30, 2015 | |||||||||
| Shares | Amount | Shares | Amount | |||||||
| Investor Class/Shares Authorized | 875,000,000 | 840,000,000 | ||||||||
| Sold | 10,482,368 | $ | 113,487,463 | 21,692,103 | $ | 276,534,085 | ||||
| Issued in reinvestment of distributions | 6,787,008 | 76,693,189 | 8,081,634 | 96,692,769 | ||||||
| Redeemed | (17,865,264 | ) | (197,712,746 | ) | (26,388,283 | ) | (331,250,886 | ) | ||
| (595,888 | ) | (7,532,094 | ) | 3,385,454 | 41,975,968 | |||||
| Institutional Class/Shares Authorized | 70,000,000 | 70,000,000 | ||||||||
| Sold | 1,251,989 | 13,630,649 | 1,172,500 | 14,465,900 | ||||||
| Issued in reinvestment of distributions | 361,512 | 4,059,779 | 719,790 | 8,553,736 | ||||||
| Redeemed | (1,756,602 | ) | (19,107,397 | ) | (6,506,504 | ) | (81,525,313 | ) | ||
| (143,101 | ) | (1,416,969 | ) | (4,614,214 | ) | (58,505,677 | ) | |||
| A Class/Shares Authorized | 185,000,000 | 200,000,000 | ||||||||
| Sold | 1,831,048 | 20,171,236 | 3,435,801 | 43,328,728 | ||||||
| Issued in reinvestment of distributions | 646,908 | 7,374,750 | 1,574,958 | 19,000,956 | ||||||
| Redeemed | (3,693,064 | ) | (40,701,226 | ) | (15,900,104 | ) | (205,207,226 | ) | ||
| (1,215,108 | ) | (13,155,240 | ) | (10,889,345 | ) | (142,877,542 | ) | |||
| C Class/Shares Authorized | 30,000,000 | 30,000,000 | ||||||||
| Sold | 70,768 | 760,067 | 281,983 | 3,505,108 | ||||||
| Issued in reinvestment of distributions | 39,978 | 445,758 | 38,595 | 458,326 | ||||||
| Redeemed | (321,709 | ) | (3,439,340 | ) | (222,720 | ) | (2,723,550 | ) | ||
| (210,963 | ) | (2,233,515 | ) | 97,858 | 1,239,884 | |||||
| R Class/Shares Authorized | 30,000,000 | 25,000,000 | ||||||||
| Sold | 101,622 | 1,141,480 | 168,277 | 2,106,267 | ||||||
| Issued in reinvestment of distributions | 13,640 | 157,129 | 9,545 | 116,453 | ||||||
| Redeemed | (93,508 | ) | (1,040,020 | ) | (72,723 | ) | (935,167 | ) | ||
| 21,754 | 258,589 | 105,099 | 1,287,553 | |||||||
| R6 Class/Shares Authorized | 40,000,000 | 30,000,000 | ||||||||
| Sold | 1,828,729 | 19,554,531 | 5,097,139 | 63,522,566 | ||||||
| Issued in reinvestment of distributions | 252,958 | 2,838,192 | 48,186 | 572,156 | ||||||
| Redeemed | (2,488,738 | ) | (27,250,510 | ) | (1,768,379 | ) | (22,259,140 | ) | ||
| (407,051 | ) | (4,857,787 | ) | 3,376,946 | 41,835,582 | |||||
| Net increase (decrease) | (2,550,357 | ) | $ | (28,937,016 | ) | (8,538,202 | ) | $ | (115,044,232 | ) |
20
6. Fair Value Measurements
The fund’s investments valuation process is based on several considerations and may use multiple inputs to determine the fair value of the investments held by the fund. In conformity with accounting principles generally accepted in the United States of America, the inputs used to determine a valuation are classified into three broad levels.
| • | Level 1 valuation inputs consist of unadjusted quoted prices in an active market for identical investments. |
| • | Level 2 valuation inputs consist of direct or indirect observable market data (including quoted prices for comparable investments, evaluations of subsequent market events, interest rates, prepayment speeds, credit risk, etc.). These inputs also consist of quoted prices for identical investments initially expressed in local currencies that are adjusted through translation into U.S. dollars. |
| • | Level 3 valuation inputs consist of unobservable data (including a fund’s own assumptions). |
The level classification is based on the lowest level input that is significant to the fair valuation measurement. The valuation inputs are not necessarily an indication of the risks associated with investing in these securities or other financial instruments. There were no significant transfers between levels during the period.
The following is a summary of the level classifications as of period end. The Schedule of Investments provides additional information on the fund’s portfolio holdings.
| Level 1 | Level 2 | Level 3 | ||||||
| Assets | ||||||||
| Investment Securities | ||||||||
| Common Stocks | ||||||||
| China | $ | 21,694,175 | $ | 23,586,624 | — | |||
| France | 10,758,264 | 232,845,290 | — | |||||
| Ireland | 15,448,321 | 25,538,345 | — | |||||
| Israel | 10,354,035 | — | — | |||||
| Mexico | 17,586,012 | — | — | |||||
| Other Countries | — | 1,082,221,108 | — | |||||
| Temporary Cash Investments | 270 | 739,000 | — | |||||
| $ | 75,841,077 | $ | 1,364,930,367 | — | ||||
7. Risk Factors
There are certain risks involved in investing in foreign securities. These risks include those resulting from future adverse political, social and economic developments, fluctuations in currency exchange rates, the possible imposition of exchange controls, and other foreign laws or restrictions. Investing in emerging markets may accentuate these risks.
8. Federal Tax Information
On December 20, 2016, the fund declared and paid the following per-share distributions from net investment income to shareholders of record on December 19, 2016:
| Investor Class | Institutional Class | A Class | C Class | R Class | R6 Class |
| $0.0518 | $0.0730 | $0.0253 | — | — | $0.0889 |
21
The tax character of distributions paid during the years ended November 30, 2016 and November 30, 2015 were as follows:
| 2016 | 2015 | |||||
| Distributions Paid From | ||||||
| Ordinary income | $ | 13,905,466 | $ | 11,563,471 | ||
| Long-term capital gains | $ | 80,081,141 | $ | 116,926,590 | ||
The book-basis character of distributions made during the year from net investment income or net realized gains may differ from their ultimate characterization for federal income tax purposes. These differences reflect the differing character of certain income items and net realized gains and losses for financial statement and tax purposes, and may result in reclassification among certain capital accounts on the financial statements.
As of November 30, 2016, the federal tax cost of investments and the components of distributable earnings on a tax-basis were as follows:
| Federal tax cost of investments | $ | 1,357,111,861 | |
| Gross tax appreciation of investments | $ | 145,721,746 | |
| Gross tax depreciation of investments | (62,062,163 | ) | |
| Net tax appreciation (depreciation) of investments | 83,659,583 | ||
| Net tax appreciation (depreciation) on translation of assets and liabilities in foreign currencies | (249,436 | ) | |
| Net tax appreciation (depreciation) | $ | 83,410,147 | |
| Undistributed ordinary income | $ | 5,315,812 | |
| Accumulated short-term capital losses | $ | (37,331,872 | ) |
The difference between book-basis and tax-basis unrealized appreciation (depreciation) is attributable primarily to the realization to ordinary income for tax purposes of unrealized gains on investments in passive foreign investment companies.
Accumulated capital losses represent net capital loss carryovers that may be used to offset future realized capital gains for federal income tax purposes. The capital loss carryovers may be carried forward for an unlimited period. Future capital loss carryover utilization in any given year may be subject to Internal Revenue Code limitations.
9. Recently Issued Accounting Guidance
In October 2016, the Securities and Exchange Commission adopted new rules and forms as well as amendments to its rules and forms to modernize the reporting and disclosure of information by registered investment companies. The amendments to Regulation S-X will require standardized, enhanced disclosure about derivatives in investment company financial statements, as well as other provisions. Compliance with the amendments is effective on August 1, 2017. Management is currently evaluating the impact that adopting the amendments will have on the financial statement disclosures.
22
| Financial Highlights |
| For a Share Outstanding Throughout the Years Ended November 30 (except as noted) | |||||||||||||||
| Per-Share Data | Ratios and Supplemental Data | ||||||||||||||
| Income From Investment Operations: | Distributions From: | Ratio to Average Net Assets of: | |||||||||||||
Net Asset Value, Beginning of Period | Net Investment Income (Loss)(1) | Net Realized and Unrealized Gain (Loss) | Total From Investment Operations | Net Investment Income | Net Realized Gains | Total Distributions | Net Asset Value, End of Period | Total Return(2) | Operating Expenses | Net Investment Income (Loss) | Portfolio Turnover Rate | Net Assets, End of Period (in thousands) | |||
| Investor Class | |||||||||||||||
| 2016 | $12.25 | 0.09 | (1.10) | (1.01) | (0.06) | (0.62) | (0.68) | $10.56 | (8.59)% | 1.18% | 0.83% | 70% | $1,229,531 | ||
| 2015 | $13.40 | 0.07 | (0.34) | (0.27) | (0.08) | (0.80) | (0.88) | $12.25 | (1.86)% | 1.17% | 0.62% | 62% | $1,432,784 | ||
| 2014 | $13.78 | 0.10 | —(3) | 0.10 | (0.20) | (0.28) | (0.48) | $13.40 | 0.80% | 1.18% | 0.74% | 75% | $1,521,655 | ||
| 2013 | $11.27 | 0.11 | 2.58 | 2.69 | (0.18) | — | (0.18) | $13.78 | 24.22% | 1.22% | 0.84% | 110% | $1,499,623 | ||
| 2012 | $9.90 | 0.15 | 1.33 | 1.48 | (0.11) | — | (0.11) | $11.27 | 15.10% | 1.29% | 1.41% | 106% | $1,268,251 | ||
| Institutional Class | |||||||||||||||
| 2016 | $12.19 | 0.11 | (1.09) | (0.98) | (0.08) | (0.62) | (0.70) | $10.51 | (8.40)% | 0.98% | 1.03% | 70% | $59,236 | ||
| 2015 | $13.33 | 0.10 | (0.34) | (0.24) | (0.10) | (0.80) | (0.90) | $12.19 | (1.63)% | 0.97% | 0.82% | 62% | $70,422 | ||
| 2014 | $13.73 | 0.14 | (0.03) | 0.11 | (0.23) | (0.28) | (0.51) | $13.33 | 0.91% | 0.98% | 0.94% | 75% | $138,527 | ||
| 2013 | $11.24 | 0.13 | 2.58 | 2.71 | (0.22) | — | (0.22) | $13.73 | 24.54% | 1.02% | 1.04% | 110% | $185,325 | ||
| 2012 | $9.89 | 0.17 | 1.33 | 1.50 | (0.15) | — | (0.15) | $11.24 | 15.28% | 1.09% | 1.61% | 106% | $140,446 | ||
| For a Share Outstanding Throughout the Years Ended November 30 (except as noted) | |||||||||||||||
| Per-Share Data | Ratios and Supplemental Data | ||||||||||||||
| Income From Investment Operations: | Distributions From: | Ratio to Average Net Assets of: | |||||||||||||
Net Asset Value, Beginning of Period | Net Investment Income (Loss)(1) | Net Realized and Unrealized Gain (Loss) | Total From Investment Operations | Net Investment Income | Net Realized Gains | Total Distributions | Net Asset Value, End of Period | Total Return(2) | Operating Expenses | Net Investment Income (Loss) | Portfolio Turnover Rate | Net Assets, End of Period (in thousands) | |||
| A Class | |||||||||||||||
| 2016 | $12.32 | 0.06 | (1.09) | (1.03) | (0.04) | (0.62) | (0.66) | $10.63 | (8.73)% | 1.43% | 0.58% | 70% | $108,847 | ||
| 2015 | $13.48 | 0.07 | (0.37) | (0.30) | (0.06) | (0.80) | (0.86) | $12.32 | (2.13)% | 1.42% | 0.37% | 62% | $141,175 | ||
| 2014 | $13.86 | 0.07 | (0.01) | 0.06 | (0.16) | (0.28) | (0.44) | $13.48 | 0.49% | 1.43% | 0.49% | 75% | $301,164 | ||
| 2013 | $11.33 | 0.07 | 2.61 | 2.68 | (0.15) | — | (0.15) | $13.86 | 23.98% | 1.47% | 0.59% | 110% | $267,979 | ||
| 2012 | $9.92 | 0.12 | 1.35 | 1.47 | (0.06) | — | (0.06) | $11.33 | 14.80% | 1.54% | 1.16% | 106% | $198,434 | ||
| C Class | |||||||||||||||
| 2016 | $12.04 | (0.02) | (1.07) | (1.09) | — | (0.62) | (0.62) | $10.33 | (9.43)% | 2.18% | (0.17)% | 70% | $6,743 | ||
| 2015 | $13.22 | (0.05) | (0.33) | (0.38) | — | (0.80) | (0.80) | $12.04 | (2.81)% | 2.17% | (0.38)% | 62% | $10,402 | ||
| 2014 | $13.58 | (0.03) | (0.02) | (0.05) | (0.03) | (0.28) | (0.31) | $13.22 | (0.29)% | 2.18% | (0.26)% | 75% | $10,129 | ||
| 2013 | $11.14 | (0.03) | 2.57 | 2.54 | (0.10) | — | (0.10) | $13.58 | 23.00% | 2.22% | (0.16)% | 110% | $4,859 | ||
| 2012 | $9.77 | 0.04 | 1.33 | 1.37 | — | — | — | $11.14 | 14.02% | 2.29% | 0.41% | 106% | $2,497 | ||
| R Class | |||||||||||||||
| 2016 | $12.43 | 0.04 | (1.12) | (1.08) | (0.01) | (0.62) | (0.63) | $10.72 | (9.00)% | 1.68% | 0.33% | 70% | $3,090 | ||
| 2015 | $13.59 | 0.02 | (0.35) | (0.33) | (0.03) | (0.80) | (0.83) | $12.43 | (2.31)% | 1.67% | 0.12% | 62% | $3,313 | ||
| 2014 | $13.96 | 0.03 | (0.01) | 0.02 | (0.11) | (0.28) | (0.39) | $13.59 | 0.25% | 1.68% | 0.24% | 75% | $2,195 | ||
| 2013 | $11.41 | 0.05 | 2.62 | 2.67 | (0.12) | — | (0.12) | $13.96 | 23.59% | 1.72% | 0.34% | 110% | $2,270 | ||
| 2012 | $9.97 | 0.10 | 1.35 | 1.45 | (0.01) | — | (0.01) | $11.41 | 14.56% | 1.79% | 0.91% | 106% | $2,262 | ||
| For a Share Outstanding Throughout the Years Ended November 30 (except as noted) | |||||||||||||||
| Per-Share Data | Ratios and Supplemental Data | ||||||||||||||
| Income From Investment Operations: | Distributions From: | Ratio to Average Net Assets of: | |||||||||||||
Net Asset Value, Beginning of Period | Net Investment Income (Loss)(1) | Net Realized and Unrealized Gain (Loss) | Total From Investment Operations | Net Investment Income | Net Realized Gains | Total Distributions | Net Asset Value, End of Period | Total Return(2) | Operating Expenses | Net Investment Income (Loss) | Portfolio Turnover Rate | Net Assets, End of Period (in thousands) | |||
| R6 Class | |||||||||||||||
| 2016 | $12.20 | 0.14 | (1.10) | (0.96) | (0.09) | (0.62) | (0.71) | $10.53 | (8.19)% | 0.83% | 1.18% | 70% | $37,903 | ||
| 2015 | $13.34 | 0.11 | (0.33) | (0.22) | (0.12) | (0.80) | (0.92) | $12.20 | (1.50)% | 0.82% | 0.97% | 62% | $48,887 | ||
| 2014 | $13.74 | 0.13 | —(3) | 0.13 | (0.25) | (0.28) | (0.53) | $13.34 | 1.10% | 0.83% | 1.09% | 75% | $8,411 | ||
2013(4) | $12.56 | 0.01 | 1.17 | 1.18 | — | — | — | $13.74 | 9.39% | 0.85%(5) | 0.20%(5) | 110%(6) | $5,076 | ||
| Notes to Financial Highlights | |
| (1) | Computed using average shares outstanding throughout the period. |
| (2) | Total returns are calculated based on the net asset value of the last business day and do not reflect applicable sales charges, if any. Total returns for periods less than one year are not annualized. |
| (3) | Per-share amount was less than $0.005. |
| (4) | July 26, 2013 (commencement of sale) through November 30, 2013. |
| (5) | Annualized. |
| (6) | Portfolio turnover is calculated at the fund level. Percentage indicated was calculated for the year ended November 30, 2013. |
See Notes to Financial Statements.
| Report of Independent Registered Public Accounting Firm |
To the Board of Directors and Shareholders of American Century World Mutual Funds, Inc.:
We have audited the accompanying statement of assets and liabilities, including the schedule of investments, of International Growth Fund (the “Fund”), one of the funds constituting American Century World Mutual Funds, Inc., as of November 30, 2016, and the related statement of operations for the year then ended, the statements of changes in net assets for each of the two years in the period then ended, and the financial highlights for each of the periods presented. These financial statements and financial highlights are the responsibility of the Fund’s management. Our responsibility is to express an opinion on these financial statements and financial highlights based on our audits.
We conducted our audits in accordance with the standards of the Public Company Accounting Oversight Board (United States). Those standards require that we plan and perform the audit to obtain reasonable assurance about whether the financial statements and financial highlights are free of material misstatement. The Fund is not required to have, nor were we engaged to perform, an audit of its internal control over financial reporting. Our audits included consideration of internal control over financial reporting as a basis for designing audit procedures that are appropriate in the circumstances, but not for the purpose of expressing an opinion on the effectiveness of the Fund’s internal control over financial reporting. Accordingly, we express no such opinion. An audit also includes examining, on a test basis, evidence supporting the amounts and disclosures in the financial statements, assessing the accounting principles used and significant estimates made by management, as well as evaluating the overall financial statement presentation. Our procedures included confirmation of securities owned as of November 30, 2016, by correspondence with the custodian and brokers; when replies were not received from brokers, we performed other auditing procedures. We believe that our audits provide a reasonable basis for our opinion.
In our opinion, the financial statements and financial highlights referred to above present fairly, in all material respects, the financial position of International Growth Fund of American Century World Mutual Funds, Inc. as of November 30, 2016, the results of its operations for the year then ended, the changes in its net assets for each of the two years in the period then ended, and the financial highlights for each of the periods presented, in conformity with accounting principles generally accepted in the United States of America.
DELOITTE & TOUCHE LLP
Kansas City, Missouri
January 17, 2017
26
| Management |
The Board of Directors
The individuals listed below serve as directors of the funds. Each director will continue to serve in this capacity until death, retirement, resignation or removal from office. The board has adopted a mandatory retirement age for directors who are not “interested persons,” as that term is defined in the Investment Company Act (independent directors). Independent directors shall retire by December 31 of the year in which they reach their 75th birthday.
Mr. Thomas is an “interested person” because he currently serves as President and Chief Executive Officer of American Century Companies, Inc. (ACC), the parent company of American Century Investment Management, Inc. (ACIM or the advisor). The other directors (more than three-fourths of the total number) are independent. They are not employees, directors or officers of, and have no financial interest in, ACC or any of its wholly owned, direct or indirect, subsidiaries, including ACIM, American Century Investment Services, Inc. (ACIS) and American Century Services, LLC (ACS), and they do not have any other affiliations, positions or relationships that would cause them to be considered “interested persons” under the Investment Company Act. The directors serve in this capacity for seven (in the case of Mr. Thomas, 15) registered investment companies in the American Century Investments family of funds.
The following table presents additional information about the directors. The mailing address for each director is 4500 Main Street, Kansas City, Missouri 64111.
| Name (Year of Birth) | Position(s) Held with Funds | Length of Time Served | Principal Occupation(s) During Past 5 Years | Number of American Century Portfolios Overseen by Director | Other Directorships Held During Past 5 Years |
| Independent Directors | |||||
| Barry Fink (1955) | Director | Since 2012 | Retired; Executive Vice President, ACC (September 2007 to February 2013); President, ACS (October 2007 to February 2013); Chief Operating Officer, ACC (September 2007 to November 2012) | 81 | None |
| Andrea C. Hall (1945) | Director | Since 1997 | Retired | 81 | None |
| Jan M. Lewis (1957) | Director | Since 2011 | Retired; President and Chief Executive Officer, Catholic Charities of Northeast Kansas (human services organization) (2006 to 2013) | 81 | None |
| James A. Olson (1942) | Director and Chairman of the Board | Since 2007 (Chairman since 2014) | Member, Plaza Belmont LLC (private equity fund manager) (1999 to present) | 81 | Saia, Inc. (2002 to 2012) and EPR Properties (2003 to 2013) |
| M. Jeannine Strandjord (1945) | Director | Since 1994 | Retired | 81 | Euronet Worldwide Inc.; MGP Ingredients, Inc.; and DST Systems Inc. (1996 to 2012) |
27
| Name (Year of Birth) | Position(s) Held with Funds | Length of Time Served | Principal Occupation(s) During Past 5 Years | Number of American Century Portfolios Overseen by Director | Other Directorships Held During Past 5 Years |
| Independent Directors | |||||
| John R. Whitten (1946) | Director | Since 2008 | Retired | 81 | Rudolph Technologies, Inc. |
| Stephen E. Yates (1948) | Director | Since 2012 | Retired | 81 | None |
| Interested Director | |||||
| Jonathan S. Thomas (1963) | Director and President | Since 2007 | President and Chief Executive Officer, ACC (March 2007 to present). Also serves as Chief Executive Officer, ACS; Executive Vice President, ACIM; Director, ACC, ACIM and other ACC subsidiaries | 126 | BioMed Valley Discoveries, Inc. |
The Statement of Additional Information has additional information about the fund's directors and is available without charge, upon request, by calling 1-800-345-2021.
28
Officers
The following table presents certain information about the executive officers of the funds. Each officer serves as an officer for each of the 15 investment companies in the American Century family of funds, unless otherwise noted. No officer is compensated for his or her service as an officer of the funds. The listed officers are interested persons of the funds and are appointed or re-appointed on an annual basis. The mailing address for each officer listed below is 4500 Main Street, Kansas City, Missouri 64111.
| Name (Year of Birth) | Offices with the Funds | Principal Occupation(s) During the Past Five Years |
| Jonathan S. Thomas (1963) | Director and President since 2007 | President and Chief Executive Officer, ACC (March 2007 to present). Also serves as Chief Executive Officer, ACS; Executive Vice President, ACIM; Director, ACC, ACIM and other ACC subsidiaries |
| Amy D. Shelton (1964) | Chief Compliance Officer and Vice President since 2014 | Chief Compliance Officer, American Century funds, (March 2014 to present); Chief Compliance Officer, ACIM (February 2014 to present); Chief Compliance Officer, ACIS (October 2009 to present); Vice President, Client Interactions and Marketing, ACIS (February 2013 to January 2014); Director, Client Interactions and Marketing, ACIS (June 2007 to January 2013). Also serves as Vice President, ACIS |
| Charles A. Etherington (1957) | General Counsel since 2007 and Senior Vice President since 2006 | Attorney, ACC (February 1994 to present); Vice President, ACC (November 2005 to present); General Counsel, ACC (March 2007 to present). Also serves as General Counsel, ACIM, ACS, ACIS and other ACC subsidiaries; and Senior Vice President, ACIM and ACS |
| C. Jean Wade (1964) | Vice President,Treasurer and Chief Financial Officer since 2012 | Vice President, ACS (February 2000 to present) |
| Robert J. Leach (1966) | Vice President since 2006 and Assistant Treasurer since 2012 | Vice President, ACS (February 2000 to present) |
| David H. Reinmiller (1963) | Vice President since 2000 | Attorney, ACC (January 1994 to present); Associate General Counsel, ACC (January 2001 to present). Also serves as Vice President, ACIM and ACS |
| Ward D. Stauffer (1960) | Secretary since 2005 | Attorney, ACC (June 2003 to present) |
29
| Approval of Management Agreement |
At a meeting held on June 29, 2016, the Fund’s Board of Directors (the "Board") unanimously approved the renewal of the management agreement pursuant to which American Century Investment Management, Inc. (the “Advisor”) acts as the investment advisor for the Fund. Under Section 15(c) of the Investment Company Act, contracts for investment advisory services are required to be reviewed, evaluated, and approved by a majority of a fund’s directors (the “Directors”), including a majority of the independent Directors, each year.
Prior to its consideration of the renewal of the management agreement, the Directors requested and reviewed extensive data and information compiled by the Advisor and certain independent providers of evaluation data concerning the Fund and the services provided to the Fund by the Advisor. This review was in addition to the oversight and evaluation undertaken by the Board and its committees on a continual basis and the information received was supplemental to the extensive information that the Board and its committees receive and consider throughout the year.
In connection with its consideration of the renewal of the management agreement, the Board’s review and evaluation of the services provided by the Advisor included, but was not limited to, the following:
| • | the nature, extent, and quality of investment management, shareholder services, and other services provided and to be provided to the Fund; |
| • | the wide range of other programs and services provided and to be provided to the Fund and its shareholders on a routine and non-routine basis; |
| • | the investment performance of the Fund, including data comparing the Fund's performance to appropriate benchmarks and/or a peer group of other mutual funds with similar investment objectives and strategies; |
| • | the cost of owning the Fund compared to the cost of owning similar funds; |
| • | the compliance policies, procedures, and regulatory experience of the Advisor and the Fund's service providers; |
| • | financial data showing the cost of services provided to the Fund, the profitability of the Fund to the Advisor, and the overall profitability of the Advisor; |
| • | possible economies of scale associated with the Advisor’s management of the Fund and other accounts under its management; |
| • | data comparing services provided and charges to the Advisor's other investment management clients; |
| • | acquired fund fees and expenses; |
| • | payments by the Fund and the Advisor to financial intermediaries and the nature of services provided; and |
| • | any collateral benefits derived by the Advisor from the management of the Fund. |
In keeping with their practice, the Directors held two in-person meetings and one telephonic meeting to review and discuss the information provided. The independent Directors also had the benefit of the advice of their independent counsel throughout the process.
Factors Considered
The Directors considered all of the information provided by the Advisor, the independent data providers, and independent counsel in connection with the approval. They determined that the information was sufficient for them to evaluate the management agreement for the Fund. In connection with their review, the Directors did not identify any single factor as being all-important or controlling, and each Director may have attributed different levels of importance to different factors.
30
In deciding to renew the management agreement, the Board based its decision on a number of factors, including the following:
Nature, Extent and Quality of Services - Generally. Under the management agreement, the Advisor is responsible for providing or arranging for all services necessary for the operation of the Fund. The Board noted that under the management agreement, the Advisor provides or arranges at its own expense a wide variety of services including:
| • | constructing and designing the Fund |
| • | portfolio research and security selection |
| • | initial capitalization/funding |
| • | securities trading |
| • | Fund administration |
| • | custody of Fund assets |
| • | daily valuation of the Fund’s portfolio |
| • | shareholder servicing and transfer agency, including shareholder confirmations, recordkeeping, and communications |
| • | legal services (except the independent Directors’ counsel) |
| • | regulatory and portfolio compliance |
| • | financial reporting |
| • | marketing and distribution (except amounts paid by the Fund under Rule 12b-1 plans) |
The Board noted that many of these services have expanded over time in terms of both quantity and complexity in response to shareholder demands, competition in the industry, changing distribution channels, and the changing regulatory environment. The Board noted specifically the resources the Advisor has committed to enhancing cybersecurity protections for the benefit of shareholders.
Investment Management Services. The nature of the investment management services provided to the Fund is quite complex and allows Fund shareholders access to professional money management, instant diversification of their investments within an asset class, the opportunity to easily diversify among asset classes by investing in or exchanging among various American Century Investments funds, and liquidity. In evaluating investment performance, the Board expects the Advisor to manage the Fund in accordance with its investment objectives and approved strategies. Further, the Directors recognize that the Advisor has an obligation to monitor trading activities, and in particular to seek the best execution of fund trades, and to evaluate the use of and payment for research. In providing these services, the Advisor utilizes teams of investment professionals (portfolio managers, analysts, research assistants, and securities traders) who require extensive information technology, research, training, compliance, and other systems to conduct their business. The Board, directly and through its Fund Performance Review Committee, provides oversight of the investment performance process. It regularly reviews investment performance information for the Fund, together with comparative information for appropriate benchmarks and/or peer groups of similarly-managed funds, over different time horizons. The Directors also review detailed performance information provided by the Advisor during the management agreement approval process. If performance concerns are identified, the Fund receives special reviews until performance improves, during which the Board receives a report from the Advisor regarding the reasons for such results (e.g., market conditions, security selection) and any efforts being undertaken to improve performance. The Fund’s performance was above its benchmark for the one-, three-, five-, and ten-year periods reviewed by the Board. The Board found the investment management services provided by the Advisor to the Fund to be satisfactory and consistent with the management agreement.
Shareholder and Other Services. Under the management agreement, the Advisor provides the Fund with a comprehensive package of transfer agency, shareholder, and other services. The Board, directly and through various committees of the Board, regularly reviews reports and evaluations of such services at its regular meetings. These reports include, but are not limited to,
31
information regarding the operational efficiency and accuracy of the shareholder and transfer agency services provided, staffing levels, shareholder satisfaction (as measured by external as well as internal sources), technology support, new products and services offered to Fund shareholders, securities trading activities, portfolio valuation services, auditing services, and legal and operational compliance activities. The Board particularly noted the Advisor’s continual efforts to maintain effective business continuity plans and to address cybersecurity threats. Certain aspects of shareholder and transfer agency service level efficiency and the quality of securities trading activities are measured by independent third party providers and are presented in comparison to other fund groups not managed by the Advisor. The Board found the services provided by the Advisor to the Fund under the management agreement to be competitive and of high quality.
Costs of Services and Profitability. The Advisor provides detailed information concerning its cost of providing various services to the Fund, its profitability in managing the Fund (pre- and post-distribution), its overall profitability, and its financial condition. The Directors have reviewed with the Advisor the methodology used to prepare this financial information. This information is considered in evaluating the Advisor’s financial condition, its ability to continue to provide services under the management agreement, and the reasonableness of the current management fee. The Board concluded that the Advisor’s profits were reasonable in light of the services provided to the Fund.
Ethics. The Board generally considers the Advisor’s commitment to providing quality services to shareholders and to conducting its business ethically. They noted that the Advisor’s practices generally meet or exceed industry best practices.
Economies of Scale. The Board also reviewed information provided by the Advisor regarding the possible existence of economies of scale in connection with the management of the Fund. The Board concluded that economies of scale are difficult to measure and predict with precision, especially on a fund-by-fund basis. The Board concluded that the Advisor is appropriately sharing economies of scale through its competitive fee structure, offering competitive fees from fund inception, and through reinvestment in its business to provide shareholders additional content and services. The Board also noted that economies of scale are shared with the Fund and its shareholders through management fee breakpoints that serve to reduce the effective management fee as the assets of the Fund grow.
Comparison to Other Funds’ Fees. The management agreement provides that the Fund pays the Advisor a single, all-inclusive (or unified) management fee for providing all services necessary for the management and operation of the Fund, other than brokerage expenses, expenses attributable to short sales, taxes, interest, extraordinary expenses, and the fees and expenses of the Fund’s independent Directors (including their independent legal counsel) and expenses incurred in connection with the provision of shareholder services and distribution services under a plan adopted pursuant to Rule 12b-1 under the 1940 Act. Under the unified fee structure, the Advisor is responsible for providing all investment advisory, custody, audit, administrative, compliance, recordkeeping, marketing and shareholder services, or arranging and supervising third parties to provide such services. By contrast, most other funds are charged a variety of fees, including an investment advisory fee, a transfer agency fee, an administrative fee, distribution charges, and other expenses. Other than their investment advisory fees and any applicable Rule 12b-1 distribution fees, all other components of the total fees charged by these other funds may be increased without shareholder approval. The Board believes the unified fee structure is a benefit to Fund shareholders because it clearly discloses to shareholders the cost of owning Fund shares, and, since the unified fee cannot be increased without a vote of Fund shareholders, it shifts to the Advisor the risk of increased costs of operating the Fund and provides a direct incentive to minimize administrative inefficiencies. Part of the Board’s analysis of fee levels involves reviewing certain evaluative data compiled by an independent provider comparing the Fund’s unified fee to the total expense ratios of its peers. The unified fee charged to shareholders of the Fund was above the median of the total expense ratios of the Fund’s peer expense universe and was within the range of its peer expense group. The Board concluded that the management fee paid by the
32
Fund to the Advisor under the management agreement is reasonable in light of the services provided to the Fund.
Comparison to Fees and Services Provided to Other Clients of the Advisor. The Directors also requested and received information from the Advisor concerning the nature of the services, fees, costs, and profitability of its advisory services to advisory clients other than the Fund. They observed that these varying types of client accounts require different services and involve different regulatory and entrepreneurial risks than the management of the Fund. The Board analyzed this information and concluded that the fees charged and services provided to the Fund were reasonable by comparison.
Payments to Intermediaries. The Directors also requested and received a description of payments made to intermediaries by the Fund and the Advisor. These payments include various payments made by the Fund or the Advisor to different types of intermediaries and recordkeepers for distribution and service activities provided for the Fund. The Board received confirmation from the Advisor that all such payments by the Fund intended for distribution were made pursuant to the Fund's 12b-1 Plan. The Board reviewed such information and found the payments to be reasonable in scope and purpose.
Collateral or “Fall-Out” Benefits Derived by the Advisor. The Board considered the existence of collateral benefits the Advisor may receive as a result of its relationship with the Fund. They concluded that the Advisor’s primary business is managing mutual funds and it generally does not use fund or shareholder information to generate profits in other lines of business, and therefore does not derive any significant collateral benefits from them. The Board noted that additional assets from other clients may offer the Advisor some benefit from increased leverage with service providers and counterparties. Additionally, the Advisor receives proprietary research from broker-dealers that execute fund portfolio transactions, which the Board concluded is likely to benefit other clients of the Advisor, as well as Fund shareholders. The Board also determined that the Advisor is able to provide investment management services to certain clients other than the Fund, at least in part, due to its existing infrastructure built to serve the fund complex. The Board concluded that appropriate allocation methodologies had been employed to assign resources and the cost of those resources to these other clients and, where expressly provided, these other client assets may be included with the assets of the Fund to determine breakpoints in the management fee schedule.
Existing Relationship. The Board also considered whether there was any reason for not continuing the existing arrangement with the Advisor. In this regard, the Board was mindful of the potential disruptions of the Fund’s operations and various risks, uncertainties, and other effects that could occur as a result of a decision not to continue such relationship. In particular, the Board recognized that most shareholders have invested in the Fund on the strength of the Advisor’s industry standing and reputation and in the expectation that the Advisor will have a continuing role in providing advisory services to the Fund.
Conclusion of the Directors. As a result of this process, the Board, including all of the independent Directors, taking into account all of the factors discussed above and the information provided by the Advisor and others in connection with its review and throughout the year, determined that the management fee is fair and reasonable in light of the services provided and that the investment management agreement between the Fund and the Advisor should be renewed.
33
| Additional Information |
Retirement Account Information
As required by law, distributions you receive from certain IRAs are subject to federal income tax withholding, unless you elect not to have withholding apply. Tax will be withheld on the total amount withdrawn even though you may be receiving amounts that are not subject to withholding, such as nondeductible contributions. In such case, excess amounts of withholding could occur. You may adjust your withholding election so that a greater or lesser amount will be withheld.
If you don’t want us to withhold on this amount, you must notify us to not withhold the federal income tax. You may notify us in writing or in certain situations by telephone or through other electronic means. For systematic withdrawals, your withholding election will remain in effect until revoked or changed by filing a new election. You have the right to revoke your election at any time.
Remember, even if you elect not to have income tax withheld, you are liable for paying income tax on the taxable portion of your withdrawal. If you elect not to have income tax withheld or you don’t have enough income tax withheld, you may be responsible for payment of estimated tax. You may incur penalties under the estimated tax rules if your withholding and estimated tax payments are not sufficient. You can reduce or defer the income tax on a distribution by directly or indirectly rolling such distribution over to another IRA or eligible plan. You should consult your tax advisor for additional information.
State tax will be withheld if, at the time of your distribution, your address is within one of the mandatory withholding states and you have federal income tax withheld (or as otherwise required by state law). State taxes will be withheld from your distribution in accordance with the respective state rules.
Distributions you receive from 403(b), 457 and qualified plans are subject to special tax and withholding rules. Your plan administrator or plan sponsor is required to provide you with a special tax notice explaining those rules at the time you request a distribution. If applicable, federal and/or state taxes may be withheld from your distribution amount.
Proxy Voting Policies
A description of the policies that the fund's investment advisor uses in exercising the voting rights associated with the securities purchased and/or held by the fund is available without charge, upon request, by calling 1-800-345-2021. It is also available on the "About Us" page of American Century Investments’ website at americancentury.com and on the Securities and Exchange Commission’s website at sec.gov. Information regarding how the investment advisor voted proxies relating to portfolio securities during the most recent 12-month period ended June 30 is available on the "About Us" page at americancentury.com. It is also available at sec.gov.
Quarterly Portfolio Disclosure
The fund files its complete schedule of portfolio holdings with the Securities and Exchange Commission (SEC) for the first and third quarters of each fiscal year on Form N-Q. The fund’s Forms N-Q are available on the SEC’s website at sec.gov, and may be reviewed and copied at the SEC’s Public Reference Room in Washington, DC. Information on the operation of the Public Reference Room may be obtained by calling 1-800-SEC-0330. The fund also makes its complete schedule of portfolio holdings for the most recent quarter of its fiscal year available on its website at americancentury.com and, upon request, by calling 1-800-345-2021.
34
Other Tax Information
The following information is provided pursuant to provisions of the Internal Revenue Code.
The funds hereby designates up to the maximum amount allowable as qualified dividend income for the fiscal year ended November 30, 2016.
The fund hereby designates $80,081,141, or up to the maximum amount allowable, as long-term capital gain distributions (20% rate gain distributions) for the fiscal year ended November 30, 2016.
For the fiscal year ended November 30, 2016, the fund intends to pass through to shareholders foreign source income of $34,610,888 and foreign taxes paid of $3,233,786, or up to the maximum amount allowable, as a foreign tax credit. Foreign source income and foreign tax expense per outstanding share on November 30, 2016 are $0.2530 and $0.0236, respectively.
35
| Notes |
36
| ||
| Contact Us | americancentury.com | |
| Automated Information Line | 1-800-345-8765 | |
| Investor Services Representative | 1-800-345-2021 or 816-531-5575 | |
| Investors Using Advisors | 1-800-378-9878 | |
| Business, Not-For-Profit, Employer-Sponsored Retirement Plans | 1-800-345-3533 | |
| Banks and Trust Companies, Broker-Dealers, Financial Professionals, Insurance Companies | 1-800-345-6488 | |
| Telecommunications Relay Service for the Deaf | 711 | |
| American Century World Mutual Funds, Inc. | ||
Investment Advisor: American Century Investment Management, Inc. Kansas City, Missouri | ||
| This report and the statements it contains are submitted for the general information of our shareholders. The report is not authorized for distribution to prospective investors unless preceded or accompanied by an effective prospectus. | ||
| ©2017 American Century Proprietary Holdings, Inc. All rights reserved. CL-ANN-91027 1701 | ||
| Annual Report | |
| November 30, 2016 | |
| International Opportunities Fund | |
| Table of Contents |
| President’s Letter | 2 | |
| Performance | 3 | |
| Portfolio Commentary | ||
| Fund Characteristics | ||
| Shareholder Fee Example | ||
| Schedule of Investments | ||
| Statement of Assets and Liabilities | ||
| Statement of Operations | ||
| Statement of Changes in Net Assets | ||
| Notes to Financial Statements | ||
| Financial Highlights | ||
| Report of Independent Registered Public Accounting Firm | ||
| Management | ||
| Approval of Management Agreement | ||
| Additional Information | ||
Any opinions expressed in this report reflect those of the author as of the date of the report, and do not necessarily represent the opinions of American Century Investments® or any other person in the American Century Investments organization. Any such opinions are subject to change at any time based upon market or other conditions and American Century Investments disclaims any responsibility to update such opinions. These opinions may not be relied upon as investment advice and, because investment decisions made by American Century Investments funds are based on numerous factors, may not be relied upon as an indication of trading intent on behalf of any American Century Investments fund. Security examples are used for representational purposes only and are not intended as recommendations to purchase or sell securities. Performance information for comparative indices and securities is provided to American Century Investments by third party vendors. To the best of American Century Investments’ knowledge, such information is accurate at the time of printing.
| President’s Letter |
Jonathan ThomasDear Investor:
Thank you for reviewing this annual report for the period ended November 30, 2016. Annual reports help convey important information about fund returns, including market factors that affected performance during the reporting period. For additional, updated investment and market insights, we encourage you to visit our website, americancentury.com.
A Year of Surprises: China, Oil, Brexit, Trump
A year ago, we predicted increased market volatility in 2016. Volatility occurred, but not for the reasons we suggested. We expected the Federal Reserve (the Fed)—which in December 2015 raised its short-term interest rate target for the first time since 2006—to raise it three to four more times in 2016 as U.S. economic growth improved. We thought the shift in rate policy would contribute to unsettled conditions as inflation expectations grew, borrowing costs increased, the U.S. dollar strengthened, and bond prices weakened.
Instead, global and U.S. growth largely languished in the first half of 2016 as concerns about China’s growth and plummeting oil prices affected the global economic outlook. The Fed left its target unchanged for 11 months to avoid putting further stress on the global economy and markets. Meanwhile, years of low interest rates, market globalization, and corporate cost-cutting had benefited some segments of the world’s developed democracies much more than others. The others spoke up in June and November, voting for the U.K. to exit the European Union, then propelling Donald Trump to victory. These unexpected populist political results unsettled the markets.
Despite these challenges, and with the continued support of central bank monetary stimulus, broad market index returns for the full reporting period were mostly positive, though they skewed negative in non-U.S. developed equity markets. Looking ahead, Trump’s win shifted the market outlook, unleashing potentially far-reaching ramifications that are still unfolding. What’s clear is that Trump’s policy proposals and his unpredictable nature make uncertainty more certain, which could trigger further bouts of short-term market volatility. In this unsettled environment, we strongly believe in staying the course and remaining focused on longer-term goals, using disciplined, actively managed, diversified, risk-aware strategies. We appreciate your continued trust in us.
Sincerely,
Jonathan Thomas
President and Chief Executive Officer
American Century Investments
2
| Performance |
| Total Returns as of November 30, 2016 | ||||||
Average Annual Returns | ||||||
Ticker Symbol | 1 year | 5 years | 10 years | Since Inception | Inception Date | |
Investor Class | AIOIX | -4.14% | 9.08% | 4.04% | — | 6/1/01 |
MSCI ACWI ex-U.S. Small Cap Growth Index | — | -1.37% | 6.44% | 2.69% | — | — |
| Institutional Class | ACIOX | -4.05% | 9.24% | 4.23% | — | 1/9/03 |
| A Class | AIVOX | 3/1/10 | ||||
| No sales charge | -4.47% | 8.79% | — | 7.86% | ||
| With sales charge | -9.95% | 7.53% | — | 6.91% | ||
| C Class | AIOCX | -5.17% | 7.99% | — | 7.07% | 3/1/10 |
| R Class | AIORX | -4.69% | 8.52% | — | 7.60% | 3/1/10 |
Average annual returns since inception are presented when ten years of performance history is not available.
Fund returns would have been lower if a portion of the fees had not been waived.
Sales charges include initial sales charges and contingent deferred sales charges (CDSCs), as applicable. A Class shares have a 5.75% maximum initial sales charge and may be subject to a maximum CDSC of 1.00%. C Class shares redeemed within 12 months of purchase are subject to a maximum CDSC of 1.00%. The SEC requires that mutual funds provide performance information net of maximum sales charges in all cases where charges could be applied.
Data presented reflect past performance. Past performance is no guarantee of future results. Current performance may be higher or lower than the performance shown. Total returns for periods less than one year are not annualized. Investment return and principal value will fluctuate, and redemption value may be more or less than original cost. Data assumes reinvestment of dividends and capital gains, and none of the charts reflect the deduction of taxes that a shareholder would pay on fund distributions or the redemption of fund shares. To obtain performance data current to the most recent month end, please call 1-800-345-2021 or visit americancentury.com. For additional information about the fund, please consult the prospectus.
3
| Growth of $10,000 Over 10 Years |
| $10,000 investment made November 30, 2006 |
| Performance for other share classes will vary due to differences in fee structure. |
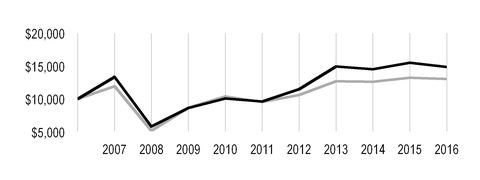
| Value on November 30, 2016 | |
| Investor Class — $14,869 | |
| MSCI ACWI ex-U.S. Small Cap Growth Index — $13,049 | |
Ending value of Investor Class would have been lower if a portion of the fees had not been waived.
Total Annual Fund Operating Expenses | ||||
Investor Class | Institutional Class | A Class | C Class | R Class |
| 1.71% | 1.51% | 1.96% | 2.71% | 2.21% |
The total annual fund operating expenses shown is as stated in the fund’s prospectus current as of the date of this report. The prospectus may vary from the expense ratio shown elsewhere in this report because it is based on a different time period, includes acquired fund fees and expenses, and, if applicable, does not include fee waivers or expense reimbursements.
Data presented reflect past performance. Past performance is no guarantee of future results. Current performance may be higher or lower than the performance shown. Total returns for periods less than one year are not annualized. Investment return and principal value will fluctuate, and redemption value may be more or less than original cost. Data assumes reinvestment of dividends and capital gains, and none of the charts reflect the deduction of taxes that a shareholder would pay on fund distributions or the redemption of fund shares. To obtain performance data current to the most recent month end, please call 1-800-345-2021 or visit americancentury.com. For additional information about the fund, please consult the prospectus.
4
| Portfolio Commentary |
Portfolio Managers: Trevor Gurwich and Federico Laffan
Performance Summary
International Opportunities declined -4.14%* for the 12 months ended November 30, 2016. The portfolio’s benchmark, the MSCI ACWI ex-U.S. Small Cap Growth Index, declined -1.37% for the same period.
Non-U.S. small-cap stocks generally posted modest gains during the 12-month period, but growth stocks within the asset class struggled. The continued low interest rate environment prompted a worldwide search for yield—a dynamic generally supportive of dividend-paying and yield-oriented investments rather than strategies focused on corporate profits and sustainable earnings growth.
Within the portfolio, stock selection primarily accounted for the underperformance versus the benchmark, particularly in the information technology, consumer staples, and consumer discretionary sectors. Underweight positions relative to the benchmark in information technology and consumer staples and an overweight in consumer discretionary also weighed on relative results. Regionally, stock selection and underweight positions in Japan, China, and the U.K. detracted from portfolio performance.
U.K.-based Property Developer Was a Main Detractor
An overweight position in U.K.-based Bellway was among the portfolio’s main detractors. The residential property developer struggled on fears that Brexit and a weaker pound would trigger economic uncertainty and perhaps a recession, derailing the multi-year boom in U.K. property prices. However, we believe Bellway should continue to deliver attractive growth as management makes progress with its strategic objectives of growing volumes at strong margins.
An overweight position in Leonteq also was a prominent detractor. The Switzerland-based company, which designs structured notes for private banks, experienced stock-price weakness after it lost one of its largest customers, Singapore-based DBS Group, due to diverging interest regarding business models and exclusivity. We exited the position.
In addition, a portfolio-only position in Wasion Group Holdings, a China-based developer of automated metering systems for electricity, water, and gas usage for utilities in China, weighed on relative results. Order delays stemming from uncertainty surrounding anti-corruption initiatives led to stock-price weakness, and we exited the position.
Norway-based Energy Company Was a Top Contributor
Stock selection in the energy and materials sectors, along with an overweight position in energy and an underweight position in the real estate sector, were the main contributors to the fund’s relative performance. In addition, our stock selection efforts in Australia, Norway, and Sweden, along with overweight positions in Australia and Norway, aided relative performance.
* All fund returns referenced in this commentary are for Investor Class shares. Fund returns would have been lower if a portion of the fees had not been waived. Performance for other share classes will vary due to differences in fee structure; when Investor Class performance exceeds that of the fund's benchmark, other share classes may not. See page 3 for returns for all share classes.
5
An overweight position in Norway-based Aker BP (formerly Det Norske Oljeselskap), an oil exploration and development company focused on petroleum resources in the North Sea, was a top contributor. Rising oil prices along with announcements in September 2016 and November 2016 from OPEC regarding its intent to cut production helped drive the company’s stock price higher. In addition, the company benefited from its low cost profile and from its production of the largest offshore oil field Norway has developed in 30 years.
In addition, a portfolio-only position in Aristocrat Leisure, an Australia-based gaming company, was a main contributor, benefiting from continued strong revenue and earnings. In addition, expectations for strong growth in Aristocrat’s recurring revenues and continued gains in the company’s digital gaming business aided stock performance.
A portfolio-only position in SSAB, a Sweden-based steel company, also was a main contributor. The company’s stock price rallied along with higher steel prices.
Outlook
We will continue to focus on non-U.S. companies we believe demonstrate improving, sustainable earnings growth. As commodity prices have continued to stabilize and supply/demand imbalances approach equilibrium, we have been finding such companies in the energy sector, which ended the period as the portfolio’s largest overweight. In addition, we continue to uncover opportunities in the industrials sector, where we expect select companies to experience solid earnings growth as the global economic expansion cycle progresses and improves. Conversely, we continued to underweight the real estate sector, due to concerns that rising interest rates will stifle earnings outlooks for real estate companies.
Regionally, we maintained an overweight position in Canada, where we are finding companies meeting our investment criteria in several sectors, including energy. The U.K. was among the largest underweights, largely due to concerns about Brexit’s long-term effects on the U.K. economy, particularly if companies decide they do not want to have operations in a non-European Union country. Elsewhere, we remain selective toward emerging markets stocks. Overall, the stabilization in commodity prices has been beneficial for emerging markets, and we are noting some improvement in relative earnings revisions despite the massive reversal in performance driven by the strengthening U.S. dollar.
6
| Fund Characteristics |
| NOVEMBER 30, 2016 | |
Top Ten Holdings | % of net assets |
| RPC Group plc | 2.2% |
| Teleperformance | 2.0% |
| Rentokil Initial plc | 1.8% |
| Sartorius AG Preference Shares | 1.7% |
| Aker BP ASA | 1.6% |
| SSAB AB, A Shares | 1.6% |
| Davide Campari-Milano SpA | 1.6% |
| Saab AB, B Shares | 1.5% |
| Parex Resources, Inc. | 1.5% |
| ASOS plc | 1.5% |
Types of Investments in Portfolio | % of net assets |
| Common Stocks | 98.9% |
| Temporary Cash Investments | 1.1% |
| Other Assets and Liabilities | —* |
| *Category is less than 0.05% of total net assets. | |
Investments by Country | % of net assets |
| Japan | 22.2% |
| Canada | 10.8% |
| United Kingdom | 9.6% |
| France | 6.6% |
| Sweden | 5.1% |
| Germany | 4.9% |
| Italy | 4.7% |
| Australia | 4.3% |
| Taiwan | 4.2% |
| Switzerland | 3.8% |
| China | 3.6% |
| Finland | 2.9% |
| India | 2.8% |
| Norway | 2.2% |
| Other Countries | 11.2% |
| Cash and Equivalents** | 1.1% |
** Includes temporary cash investments and other assets and liabilities.
7
| Shareholder Fee Example |
Fund shareholders may incur two types of costs: (1) transaction costs, including sales charges (loads) on purchase payments and redemption/exchange fees; and (2) ongoing costs, including management fees; distribution and service (12b-1) fees; and other fund expenses. This example is intended to help you understand your ongoing costs (in dollars) of investing in your fund and to compare these costs with the ongoing cost of investing in other mutual funds.
The example is based on an investment of $1,000 made at the beginning of the period and held for the entire period from June 1, 2016 to November 30, 2016.
Actual Expenses
The table provides information about actual account values and actual expenses for each class. You may use the information, together with the amount you invested, to estimate the expenses that you paid over the period. First, identify the share class you own. Then simply divide your account value by $1,000 (for example, an $8,600 account value divided by $1,000 = 8.6), then multiply the result by the number under the heading “Expenses Paid During Period” to estimate the expenses you paid on your account during this period.
If you hold Investor Class shares of any American Century Investments fund, or Institutional Class shares of the American Century Diversified Bond Fund, in an American Century Investments account (i.e., not a financial intermediary or retirement plan account), American Century Investments may charge you a $12.50 semiannual account maintenance fee if the value of those shares is less than $10,000. We will redeem shares automatically in one of your accounts to pay the $12.50 fee. In determining your total eligible investment amount, we will include your investments in all personal accounts (including American Century Investments Brokerage accounts) registered under your Social Security number. Personal accounts include individual accounts, joint accounts, UGMA/UTMA accounts, personal trusts, Coverdell Education Savings Accounts and IRAs (including traditional, Roth, Rollover, SEP-, SARSEP- and SIMPLE-IRAs), and certain other retirement accounts. If you have only business, business retirement, employer-sponsored or American Century Investments Brokerage accounts, you are currently not subject to this fee. If you are subject to the Account Maintenance Fee, your account value could be reduced by the fee amount.
Hypothetical Example for Comparison Purposes
The table also provides information about hypothetical account values and hypothetical expenses based on the actual expense ratio of each class of your fund and an assumed rate of return of 5% per year before expenses, which is not the actual return of a fund’s share class. The hypothetical account values and expenses may not be used to estimate the actual ending account balance or expenses you paid for the period. You may use this information to compare the ongoing costs of investing in your fund and other funds. To do so, compare this 5% hypothetical example with the 5% hypothetical examples that appear in the shareholder reports of the other funds.
Please note that the expenses shown in the table are meant to highlight your ongoing costs only and do not reflect any transactional costs, such as sales charges (loads) or redemption/exchange fees. Therefore, the table is useful in comparing ongoing costs only, and will not help you determine the relative total costs of owning different funds. In addition, if these transactional costs were included, your costs would have been higher.
8
| Beginning Account Value 6/1/16 | Ending Account Value 11/30/16 | Expenses Paid During Period(1) 6/1/16 - 11/30/16 | Annualized Expense Ratio(1) | |
Actual | ||||
| Investor Class (after waiver) | $1,000 | $968.10 | $7.63 | 1.55% |
| Investor Class (before waiver) | $1,000 | $968.10(2) | $8.61 | 1.75% |
| Institutional Class (after waiver) | $1,000 | $969.50 | $6.65 | 1.35% |
| Institutional Class (before waiver) | $1,000 | $969.50(2) | $7.63 | 1.55% |
| A Class (after waiver) | $1,000 | $966.70 | $8.85 | 1.80% |
| A Class (before waiver) | $1,000 | $966.70(2) | $9.83 | 2.00% |
| C Class (after waiver) | $1,000 | $962.50 | $12.51 | 2.55% |
| C Class (before waiver) | $1,000 | $962.50(2) | $13.49 | 2.75% |
| R Class (after waiver) | $1,000 | $965.40 | $10.07 | 2.05% |
| R Class (before waiver) | $1,000 | $965.40(2) | $11.06 | 2.25% |
| Hypothetical | ||||
| Investor Class (after waiver) | $1,000 | $1,017.25 | $7.82 | 1.55% |
| Investor Class (before waiver) | $1,000 | $1,016.25 | $8.82 | 1.75% |
| Institutional Class (after waiver) | $1,000 | $1,018.25 | $6.81 | 1.35% |
| Institutional Class (before waiver) | $1,000 | $1,017.25 | $7.82 | 1.55% |
| A Class (after waiver) | $1,000 | $1,016.00 | $9.07 | 1.80% |
| A Class (before waiver) | $1,000 | $1,015.00 | $10.07 | 2.00% |
| C Class (after waiver) | $1,000 | $1,012.25 | $12.83 | 2.55% |
| C Class (before waiver) | $1,000 | $1,011.25 | $13.83 | 2.75% |
| R Class (after waiver) | $1,000 | $1,014.75 | $10.33 | 2.05% |
| R Class (before waiver) | $1,000 | $1,013.75 | $11.33 | 2.25% |
| (1) | Expenses are equal to the class's annualized expense ratio listed in the table above, multiplied by the average account value over the period, multiplied by 183, the number of days in the most recent fiscal half-year, divided by 366, to reflect the one-half year period. |
| (2) | Ending account value assumes the return earned after waiver and would have been lower if a portion of the fees had not been waived. |
9
| Schedule of Investments |
NOVEMBER 30, 2016
| Shares | Value | ||||
| COMMON STOCKS — 98.9% | |||||
| Australia — 4.3% | |||||
| Aristocrat Leisure Ltd. | 89,940 | $ | 996,243 | ||
| Bapcor Ltd. | 169,140 | 620,760 | |||
| BlueScope Steel Ltd. | 239,770 | 1,597,064 | |||
| Domino's Pizza Enterprises Ltd. | 27,270 | 1,364,922 | |||
| Northern Star Resources Ltd. | 70,220 | 186,156 | |||
| Pact Group Holdings Ltd. | 141,790 | 681,628 | |||
| Regis Resources Ltd. | 92,260 | 194,169 | |||
| 5,640,942 | |||||
| Austria — 0.8% | |||||
| Lenzing AG | 7,876 | 1,005,859 | |||
| Belgium — 0.7% | |||||
Galapagos NV(1) | 16,260 | 966,263 | |||
| Brazil — 1.8% | |||||
| CVC Brasil Operadora e Agencia de Viagens SA | 91,200 | 641,519 | |||
| EcoRodovias Infraestrutura e Logistica SA | 306,000 | 714,773 | |||
| Iguatemi Empresa de Shopping Centers SA | 91,200 | 736,169 | |||
| Smiles SA | 19,500 | 275,890 | |||
| 2,368,351 | |||||
| Canada — 10.8% | |||||
| Aecon Group, Inc. | 71,610 | 833,220 | |||
| Canadian Energy Services & Technology Corp. | 349,460 | 1,818,451 | |||
Descartes Systems Group, Inc. (The)(1) | 67,360 | 1,495,830 | |||
| Enerflex Ltd. | 101,830 | 1,293,248 | |||
| FirstService Corp. | 27,340 | 1,187,182 | |||
| HudBay Minerals, Inc. | 111,869 | 754,510 | |||
| New Flyer Industries, Inc. | 42,570 | 1,340,830 | |||
Parex Resources, Inc.(1) | 147,950 | 1,931,842 | |||
| Premium Brands Holdings Corp. | 25,020 | 1,314,793 | |||
Raging River Exploration, Inc.(1) | 132,530 | 1,048,756 | |||
Shopify, Inc., Class A(1) | 28,730 | 1,197,179 | |||
| 14,215,841 | |||||
| China — 3.6% | |||||
Bitauto Holdings Ltd. ADR(1) | 34,753 | 783,680 | |||
| CT Environmental Group Ltd. | 2,614,000 | 630,204 | |||
Kingdee International Software Group Co. Ltd.(1) | 2,344,000 | 1,015,386 | |||
| Minth Group Ltd. | 234,000 | 766,273 | |||
| Tongda Group Holdings Ltd. | 5,310,000 | 1,560,859 | |||
| 4,756,402 | |||||
| Denmark — 0.5% | |||||
| Rockwool International A/S, B Shares | 4,150 | 669,169 | |||
| Finland — 2.9% | |||||
| Cramo Oyj | 31,110 | 779,786 | |||
| Konecranes Oyj | 32,680 | 1,127,052 | |||
Outokumpu Oyj(1) | 246,870 | 1,907,393 | |||
| 3,814,231 | |||||
10
| Shares | Value | ||||
| France — 6.6% | |||||
| Eurofins Scientific SE | 3,830 | $ | 1,676,257 | ||
Nexans SA(1) | 27,970 | 1,460,263 | |||
| Rubis SCA | 22,730 | 1,856,887 | |||
| Teleperformance | 26,400 | 2,578,080 | |||
Worldline SA(1) | 43,000 | 1,116,552 | |||
| 8,688,039 | |||||
| Germany — 4.9% | |||||
| AURELIUS Equity Opportunities SE & Co. KGaA | 13,380 | 771,435 | |||
| CTS Eventim AG & Co. KGaA | 19,650 | 585,420 | |||
| Duerr AG | 18,590 | 1,484,198 | |||
| Grammer AG | 11,970 | 593,660 | |||
| Jungheinrich AG Preference Shares | 29,730 | 779,068 | |||
| Sartorius AG Preference Shares | 29,310 | 2,177,600 | |||
| 6,391,381 | |||||
| Hong Kong — 1.7% | |||||
| Melco International Development Ltd. | 836,000 | 1,345,102 | |||
| Sa Sa International Holdings Ltd. | 1,976,000 | 886,544 | |||
| 2,231,646 | |||||
| India — 2.8% | |||||
| Amara Raja Batteries Ltd. | 48,750 | 668,800 | |||
| Indiabulls Housing Finance Ltd. | 119,340 | 1,333,856 | |||
| Multi Commodity Exchange of India Ltd. | 36,850 | 654,616 | |||
| Vakrangee Ltd. | 246,520 | 995,279 | |||
| 3,652,551 | |||||
| Indonesia — 1.2% | |||||
| Bank Tabungan Negara Persero Tbk PT | 4,674,300 | 569,090 | |||
| Pembangunan Perumahan Persero Tbk PT | 2,189,200 | 686,523 | |||
| Waskita Karya Persero Tbk PT | 1,881,900 | 354,093 | |||
| 1,609,706 | |||||
| Italy — 4.7% | |||||
| Amplifon SpA | 179,760 | 1,724,193 | |||
| Buzzi Unicem SpA | 75,340 | 1,600,974 | |||
| Davide Campari-Milano SpA | 219,510 | 2,117,093 | |||
| FinecoBank Banca Fineco SpA | 131,740 | 681,368 | |||
| 6,123,628 | |||||
| Japan — 22.2% | |||||
| Anicom Holdings, Inc. | 29,800 | 703,291 | |||
| Benefit One, Inc. | 36,300 | 853,203 | |||
| Dip Corp. | 39,600 | 831,771 | |||
| eRex Co. Ltd. | 48,200 | 1,235,282 | |||
| GMO Payment Gateway, Inc. | 14,400 | 592,841 | |||
| Harmonic Drive Systems, Inc. | 36,400 | 959,276 | |||
| Hirata Corp. | 17,800 | 1,168,463 | |||
| Istyle, Inc. | 118,900 | 775,311 | |||
| Itochu Techno-Solutions Corp. | 24,600 | 662,279 | |||
| JAC Recruitment Co. Ltd. | 49,700 | 571,264 | |||
| Kanto Denka Kogyo Co. Ltd. | 84,000 | 697,522 | |||
| Kewpie Corp. | 13,200 | 311,871 | |||
| Kyudenko Corp. | 12,200 | 342,310 | |||
Kyushu Railway Co.(1) | 8,000 | 207,124 | |||
11
| Shares | Value | ||||
| Lion Corp. | 48,000 | $ | 780,386 | ||
| Makino Milling Machine Co. Ltd. | 93,000 | 656,824 | |||
| MISUMI Group, Inc. | 71,200 | 1,273,329 | |||
| Nifco, Inc. | 19,800 | 1,086,876 | |||
| Nihon M&A Center, Inc. | 32,900 | 897,234 | |||
| North Pacific Bank Ltd. | 79,600 | 311,707 | |||
| Osaki Electric Co. Ltd. | 146,000 | 1,468,869 | |||
| Penta-Ocean Construction Co. Ltd. | 238,500 | 1,169,516 | |||
| Pigeon Corp. | 47,900 | 1,207,078 | |||
| Ryohin Keikaku Co. Ltd. | 7,000 | 1,372,405 | |||
| SMS Co. Ltd. | 35,000 | 874,350 | |||
| Sumco Corp. | 82,500 | 903,566 | |||
| Tadano Ltd. | 67,600 | 719,696 | |||
| Tokai Tokyo Financial Holdings, Inc. | 122,100 | 630,751 | |||
| Topcon Corp. | 87,000 | 1,292,015 | |||
| Ulvac, Inc. | 41,800 | 1,255,041 | |||
| Vector, Inc. | 91,700 | 966,655 | |||
| Yumeshin Holdings Co. Ltd. | 185,000 | 1,207,946 | |||
| Zenkoku Hosho Co. Ltd. | 33,800 | 1,144,836 | |||
| 29,130,888 | |||||
| Mexico — 1.2% | |||||
| Alsea SAB de CV | 195,560 | 574,059 | |||
| Banregio Grupo Financiero SAB de CV | 185,230 | 991,596 | |||
| 1,565,655 | |||||
| Norway — 2.2% | |||||
| Aker BP ASA | 132,410 | 2,152,477 | |||
| TGS Nopec Geophysical Co. ASA | 34,320 | 674,411 | |||
| 2,826,888 | |||||
| South Korea — 1.5% | |||||
Loen Entertainment, Inc.(1) | 10,360 | 659,325 | |||
| Vieworks Co. Ltd. | 26,260 | 1,307,328 | |||
| 1,966,653 | |||||
| Spain — 1.2% | |||||
| Prosegur Cia de Seguridad SA | 262,470 | 1,630,128 | |||
| Sweden — 5.1% | |||||
Dometic Group AB(1) | 238,980 | 1,703,705 | |||
| Oriflame Holding AG | 34,310 | 873,486 | |||
| Saab AB, B Shares | 53,260 | 1,977,298 | |||
SSAB AB, A Shares(1) | 551,950 | 2,133,519 | |||
| 6,688,008 | |||||
| Switzerland — 3.8% | |||||
| Logitech International SA | 55,230 | 1,360,787 | |||
| Straumann Holding AG | 3,640 | 1,304,987 | |||
| Temenos Group AG | 22,950 | 1,589,141 | |||
| Ypsomed Holding AG | 3,570 | 666,456 | |||
| 4,921,371 | |||||
| Taiwan — 4.2% | |||||
| AirTAC International Group | 135,000 | 1,022,888 | |||
| Basso Industry Corp. | 366,000 | 849,747 | |||
| Eclat Textile Co. Ltd. | 85,000 | 880,055 | |||
| Gourmet Master Co. Ltd. | 111,300 | 927,122 | |||
12
| Shares | Value | ||||
| Hota Industrial Manufacturing Co. Ltd. | 171,000 | $ | 657,218 | ||
| Nien Made Enterprise Co. Ltd. | 106,000 | 1,187,274 | |||
| 5,524,304 | |||||
| Thailand — 0.6% | |||||
| Taokaenoi Food & Marketing PCL | 1,023,200 | 774,293 | |||
| United Kingdom — 9.6% | |||||
| Ashmore Group plc | 181,600 | 622,804 | |||
ASOS plc(1) | 30,370 | 1,917,806 | |||
| BBA Aviation plc | 278,480 | 913,943 | |||
| Bellway plc | 54,260 | 1,657,876 | |||
| Rentokil Initial plc | 893,830 | 2,397,763 | |||
| RPC Group plc | 211,280 | 2,847,087 | |||
Serco Group plc(1) | 437,530 | 728,092 | |||
| Spectris plc | 28,840 | 737,208 | |||
Tullow Oil plc(1) | 199,980 | 745,140 | |||
| 12,567,719 | |||||
TOTAL COMMON STOCKS (Cost $114,885,372) | 129,729,916 | ||||
| TEMPORARY CASH INVESTMENTS — 1.1% | |||||
| Repurchase Agreement, Fixed Income Clearing Corp., (collateralized by various U.S. Treasury obligations, 2.875%, 8/15/45, valued at $1,530,384), at 0.08%, dated 11/30/16, due 12/1/16 (Delivery value $1,496,003) | 1,496,000 | ||||
| State Street Institutional U.S. Government Money Market Fund, Premier Class | 565 | 565 | |||
TOTAL TEMPORARY CASH INVESTMENTS (Cost $1,496,565) | 1,496,565 | ||||
TOTAL INVESTMENT SECURITIES — 100.0% (Cost $116,381,937) | 131,226,481 | ||||
OTHER ASSETS AND LIABILITIES† | 24,430 | ||||
| TOTAL NET ASSETS — 100.0% | $ | 131,250,911 | |||
| MARKET SECTOR DIVERSIFICATION | ||
(as a % of net assets) | ||
| Industrials | 23.8 | % |
| Consumer Discretionary | 17.0 | % |
| Information Technology | 15.7 | % |
| Materials | 10.4 | % |
| Health Care | 7.5 | % |
| Energy | 7.5 | % |
| Financials | 7.1 | % |
| Consumer Staples | 5.6 | % |
| Utilities | 2.8 | % |
| Real Estate | 1.5 | % |
| Cash and Equivalents* | 1.1 | % |
* Includes temporary cash investments and other assets and liabilities.
13
| NOTES TO SCHEDULE OF INVESTMENTS | ||
| ADR | - | American Depositary Receipt |
| † | Category is less than 0.05% of total net assets. |
| (1) | Non-income producing. |
See Notes to Financial Statements.
14
| Statement of Assets and Liabilities |
| NOVEMBER 30, 2016 | |||
| Assets | |||
| Investment securities, at value (cost of $116,381,937) | $ | 131,226,481 | |
| Foreign currency holdings, at value (cost of $39,780) | 37,383 | ||
| Receivable for investments sold | 734,346 | ||
| Receivable for capital shares sold | 51,205 | ||
| Dividends and interest receivable | 205,261 | ||
| Other assets | 54,082 | ||
| 132,308,758 | |||
| Liabilities | |||
| Payable for investments purchased | 732,379 | ||
| Payable for capital shares redeemed | 152,361 | ||
| Accrued management fees | 168,734 | ||
| Distribution and service fees payable | 4,373 | ||
| 1,057,847 | |||
| Net Assets | $ | 131,250,911 | |
| Net Assets Consist of: | |||
| Capital (par value and paid-in surplus) | $ | 117,362,277 | |
| Accumulated net investment loss | (381,933 | ) | |
| Accumulated net realized loss | (537,238 | ) | |
| Net unrealized appreciation | 14,807,805 | ||
| $ | 131,250,911 | ||
| Net Assets | Shares Outstanding | Net Asset Value Per Share | ||||
| Investor Class, $0.01 Par Value | $108,183,555 | 12,746,433 | $8.49 | |||
| Institutional Class, $0.01 Par Value | $6,674,102 | 777,963 | $8.58 | |||
| A Class, $0.01 Par Value | $14,156,218 | 1,679,151 | $8.43* | |||
| C Class, $0.01 Par Value | $1,578,801 | 192,263 | $8.21 | |||
| R Class, $0.01 Par Value | $658,235 | 78,648 | $8.37 | |||
*Maximum offering price $8.94 (net asset value divided by 0.9425).
See Notes to Financial Statements.
15
| Statement of Operations |
| YEAR ENDED NOVEMBER 30, 2016 | |||
| Investment Income (Loss) | |||
| Income: | |||
| Dividends (net of foreign taxes withheld of $194,481) | $ | 2,139,301 | |
| Interest | 943 | ||
| 2,140,244 | |||
| Expenses: | |||
| Management fees | 2,505,566 | ||
| Distribution and service fees: | |||
| A Class | 46,307 | ||
| C Class | 15,031 | ||
| R Class | 3,343 | ||
| Directors' fees and expenses | 4,881 | ||
| Other expenses | 6,780 | ||
| 2,581,908 | |||
| Fees waived | (290,690 | ) | |
| 2,291,218 | |||
| Net investment income (loss) | (150,974 | ) | |
| Realized and Unrealized Gain (Loss) | |||
| Net realized gain (loss) on: | |||
| Investment transactions (net of foreign tax expenses paid (refunded) of $(24,090)) | 1,305,704 | ||
| Foreign currency transactions | (60,412 | ) | |
| 1,245,292 | |||
| Change in net unrealized appreciation (depreciation) on: | |||
| Investments | (7,277,830 | ) | |
| Translation of assets and liabilities in foreign currencies | (6,417 | ) | |
| (7,284,247 | ) | ||
| Net realized and unrealized gain (loss) | (6,038,955 | ) | |
| Net Increase (Decrease) in Net Assets Resulting from Operations | $ | (6,189,929 | ) |
See Notes to Financial Statements.
16
| Statement of Changes in Net Assets |
| YEARS ENDED NOVEMBER 30, 2016 AND NOVEMBER 30, 2015 | ||||||
| Increase (Decrease) in Net Assets | November 30, 2016 | November 30, 2015 | ||||
| Operations | ||||||
| Net investment income (loss) | $ | (150,974 | ) | $ | (531,867 | ) |
| Net realized gain (loss) | 1,245,292 | 3,535,227 | ||||
| Change in net unrealized appreciation (depreciation) | (7,284,247 | ) | 5,262,144 | |||
| Net increase (decrease) in net assets resulting from operations | (6,189,929 | ) | 8,265,504 | |||
| Distributions to Shareholders | ||||||
| From net investment income: | ||||||
| Investor Class | (1,126,676 | ) | (310,451 | ) | ||
| Institutional Class | (65,585 | ) | (10,868 | ) | ||
| A Class | (135,676 | ) | (28,281 | ) | ||
| C Class | (1,467 | ) | (75 | ) | ||
| R Class | (3,245 | ) | (690 | ) | ||
| From net realized gains: | ||||||
| Investor Class | (2,032,554 | ) | (5,094,004 | ) | ||
| Institutional Class | (100,298 | ) | (186,683 | ) | ||
| A Class | (315,770 | ) | (623,812 | ) | ||
| C Class | (25,684 | ) | (30,823 | ) | ||
| R Class | (10,615 | ) | (24,603 | ) | ||
| Decrease in net assets from distributions | (3,817,570 | ) | (6,310,290 | ) | ||
| Capital Share Transactions | ||||||
| Net increase (decrease) in net assets from capital share transactions (Note 5) | (15,817,396 | ) | 10,796,697 | |||
| Redemption Fees | ||||||
| Increase in net assets from redemption fees | 11,338 | 9,050 | ||||
| Net increase (decrease) in net assets | (25,813,557 | ) | 12,760,961 | |||
| Net Assets | ||||||
| Beginning of period | 157,064,468 | 144,303,507 | ||||
| End of period | $ | 131,250,911 | $ | 157,064,468 | ||
| Accumulated net investment loss | $ | (381,933 | ) | $ | (426,288 | ) |
See Notes to Financial Statements.
17
| Notes to Financial Statements |
NOVEMBER 30, 2016
1. Organization
American Century World Mutual Funds, Inc. (the corporation) is registered under the Investment Company Act of 1940, as amended (the 1940 Act), as an open-end management investment company and is organized as a Maryland corporation. International Opportunities Fund (the fund) is one fund in a series issued by the corporation. The fund's investment objective is to seek capital growth.
The fund offers the Investor Class, the Institutional Class, the A Class, the C Class and the R Class. The A Class may incur an initial sales charge. The A Class and C Class may be subject to a contingent deferred sales charge. The share classes differ principally in their respective sales charges and distribution and shareholder servicing expenses and arrangements. The Institutional Class is made available to institutional shareholders or through financial intermediaries whose clients do not require the same level of shareholder and administrative services as shareholders of other classes. As a result, the Institutional Class is charged a lower unified management fee.
2. Significant Accounting Policies
The following is a summary of significant accounting policies consistently followed by the fund in preparation of its financial statements. The fund is an investment company and follows accounting and reporting guidance in accordance with accounting principles generally accepted in the United States of America. This may require management to make certain estimates and assumptions at the date of the financial statements. Actual results could differ from these estimates. Management evaluated the impact of events or transactions occurring through the date the financial statements were issued that would merit recognition or disclosure.
Investment Valuations — The fund determines the fair value of its investments and computes its net asset value per share at the close of regular trading (usually 4 p.m. Eastern time) on the New York Stock Exchange (NYSE) on each day the NYSE is open. The Board of Directors has adopted valuation policies and procedures to guide the investment advisor in the fund’s investment valuation process and to provide methodologies for the oversight of the fund’s pricing function.
Equity securities that are listed or traded on a domestic securities exchange are valued at the last reported sales price or at the official closing price as provided by the exchange. Equity securities traded on foreign securities exchanges are generally valued at the closing price of such securities on the exchange where primarily traded or at the close of the NYSE, if that is earlier. If no last sales price is reported, or if local convention or regulation so provides, the mean of the latest bid and asked prices may be used. Securities traded over-the-counter are valued at the mean of the latest bid and asked prices, the last sales price, or the official closing price. Equity securities initially expressed in local currencies are translated into U.S. dollars at the mean of the appropriate currency exchange rate at the close of the NYSE as provided by an independent pricing service.
Open-end management investment companies are valued at the reported net asset value per share. Repurchase agreements are valued at cost, which approximates fair value.
If the fund determines that the market price for an investment is not readily available or the valuation methods mentioned above do not reflect an investment’s fair value, such investment is valued as determined in good faith by the Board of Directors or its delegate, in accordance with policies and procedures adopted by the Board of Directors. In its determination of fair value, the fund may review several factors including, but not limited to, market information regarding the specific investment or comparable investments and correlation with other investment types, futures indices or general market indicators. Circumstances that may cause the fund to use these procedures to value an investment include, but are not limited to: an investment has been declared in default or is distressed; trading in a security has been suspended during the trading day or a security is not actively trading on its principal exchange; prices received from a regular pricing source are deemed unreliable; or there is a foreign market holiday and no trading occurred.
The fund monitors for significant events occurring after the close of an investment’s primary exchange but before the fund’s net asset value per share is determined. Significant events may include, but are not limited to: corporate announcements and transactions; governmental action and political unrest that could impact a specific investment or an investment sector; or armed conflicts, natural disasters and similar events that could
18
affect investments in a specific country or region. The fund also monitors for significant fluctuations between domestic and foreign markets, as evidenced by the U.S. market or such other indicators that the Board of Directors, or its delegate, deems appropriate. If significant fluctuations in foreign markets are identified, the fund may apply a model-derived factor to the closing price of equity securities traded on foreign securities exchanges. The factor is based on observable market data as provided by an independent pricing service.
Security Transactions — Security transactions are accounted for as of the trade date. Net realized gains and losses are determined on the identified cost basis, which is also used for federal income tax purposes. Certain countries impose taxes on realized gains on the sale of securities registered in their country. The fund records the foreign tax expense, if any, on an accrual basis. The foreign tax expense on realized gains and unrealized appreciation reduces the net realized gain (loss) on investment transactions and net unrealized appreciation (depreciation) on investments, respectively.
Investment Income — Dividend income less foreign taxes withheld, if any, is recorded as of the ex-dividend date. Distributions received on securities that represent a return of capital or long-term capital gain are recorded as a reduction of cost of investments and/or as a realized gain. The fund may estimate the components of distributions received that may be considered nontaxable distributions or long-term capital gain distributions for income tax purposes. Interest income is recorded on the accrual basis and includes accretion of discounts and amortization of premiums.
Foreign Currency Translations — All assets and liabilities initially expressed in foreign currencies are translated into U.S. dollars at prevailing exchange rates at period end. The fund may enter into spot foreign currency exchange contracts to facilitate transactions denominated in a foreign currency. Purchases and sales of investment securities, dividend and interest income, spot foreign currency exchange contracts, and expenses are translated at the rates of exchange prevailing on the respective dates of such transactions. Net realized and unrealized foreign currency exchange gains or losses related to investment securities are a component of net realized gain (loss) on investment transactions and change in net unrealized appreciation (depreciation) on investments, respectively.
Repurchase Agreements — The fund may enter into repurchase agreements with institutions that American Century Investment Management, Inc. (ACIM) (the investment advisor) has determined are creditworthy pursuant to criteria adopted by the Board of Directors. The fund requires that the collateral, represented by securities, received in a repurchase transaction be transferred to the custodian in a manner sufficient to enable the fund to obtain those securities in the event of a default under the repurchase agreement. ACIM monitors, on a daily basis, the securities transferred to ensure the value, including accrued interest, of the securities under each repurchase agreement is equal to or greater than amounts owed to the fund under each repurchase agreement.
Joint Trading Account — Pursuant to an Exemptive Order issued by the Securities and Exchange Commission, the fund, along with certain other funds in the American Century Investments family of funds, may transfer uninvested cash balances into a joint trading account. These balances are invested in one or more repurchase agreements that are collateralized by U.S. Treasury or Agency obligations.
Income Tax Status — It is the fund’s policy to distribute substantially all net investment income and net realized gains to shareholders and to otherwise qualify as a regulated investment company under provisions of the Internal Revenue Code. Accordingly, no provision has been made for income taxes. The fund files U.S. federal, state, local and non-U.S. tax returns as applicable. The fund's tax returns are subject to examination by the relevant taxing authority until expiration of the applicable statute of limitations, which is generally three years from the date of filing but can be longer in certain jurisdictions. At this time, management believes there are no uncertain tax positions which, based on their technical merit, would not be sustained upon examination and for which it is reasonably possible that the total amounts of unrecognized tax benefits will significantly change in the next twelve months.
Multiple Class — All shares of the fund represent an equal pro rata interest in the net assets of the class to which such shares belong, and have identical voting, dividend, liquidation and other rights and the same terms and conditions, except for class specific expenses and exclusive rights to vote on matters affecting only individual classes. Income, non-class specific expenses, and realized and unrealized capital gains and losses of the fund are allocated to each class of shares based on their relative net assets.
Distributions to Shareholders — Distributions from net investment income and net realized gains, if any, are generally declared and paid annually. The fund may make distributions on a more frequent basis to comply with the distribution requirements of the Internal Revenue Code, in all events in a manner consistent with provisions of the 1940 Act.
19
Redemption Fees — The fund may impose a 2.00% redemption fee on shares held less than 60 days. The fee may not be applicable to all classes. The redemption fee is retained by the fund and helps cover transaction costs that long-term investors may bear when the fund sells securities to meet investor redemptions.
Indemnifications — Under the corporation’s organizational documents, its officers and directors are indemnified against certain liabilities arising out of the performance of their duties to the fund. In addition, in the normal course of business, the fund enters into contracts that provide general indemnifications. The maximum exposure under these arrangements is unknown as this would involve future claims that may be made against a fund. The risk of material loss from such claims is considered by management to be remote.
3. Fees and Transactions with Related Parties
Certain officers and directors of the corporation are also officers and/or directors of American Century Companies, Inc. (ACC). The corporation’s investment advisor, ACIM, the corporation's distributor, American Century Investment Services, Inc. (ACIS), and the corporation’s transfer agent, American Century Services, LLC, are wholly owned, directly or indirectly, by ACC.
Management Fees — The corporation has entered into a management agreement with ACIM, under which ACIM provides the fund with investment advisory and management services in exchange for a single, unified management fee (the fee) per class. The agreement provides that all expenses of managing and operating the fund, except distribution and service fees, brokerage expenses, taxes, interest, fees and expenses of the independent directors (including legal counsel fees), and extraordinary expenses, will be paid by ACIM. The fee is computed and accrued daily based on each class’s daily net assets and paid monthly in arrears. The rate of the fee is determined by applying a fee rate calculation formula. This formula takes into account the fund’s assets as well as certain assets, if any, of other clients of the investment advisor outside the American Century Investments family of funds (such as subadvised funds and separate accounts) that have very similar investment teams and investment strategies (strategy assets). The annual management fee schedule ranges from 1.400% to 2.000% for the Investor Class, A Class, C Class and R Class. The annual management fee schedule ranges from 1.200% to 1.800% for the Institutional Class. During the year ended November 30, 2016, the investment advisor agreed to waive 0.200% of the fund's management fee. The investment advisor expects this waiver to continue until July 31, 2017 and cannot terminate it prior to such date without the approval of the Board of Directors. The total amount of the waiver for each class for the year ended November 30, 2016 was $236,678, $12,624, $37,045, $3,006 and $1,337 for the Investor Class, Institutional Class, A Class, C Class, and R Class, respectively. The effective annual management fee before waiver for each class for the year ended November 30, 2016 was 1.73% for the Investor Class, A Class, C Class and R Class and 1.53% for the Institutional Class. The effective annual management fee after waiver for each class for the year ended November 30, 2016 was 1.53% for the Investor Class, A Class, C Class and R Class and 1.33% for the Institutional Class.
Distribution and Service Fees — The Board of Directors has adopted a separate Master Distribution and Individual Shareholder Services Plan for each of the A Class, C Class and R Class (collectively the plans), pursuant to Rule 12b-1 of the 1940 Act. The plans provide that the A Class will pay ACIS an annual distribution and service fee of 0.25%. The plans provide that the C Class will pay ACIS an annual distribution and service fee of 1.00%, of which 0.25% is paid for individual shareholder services and 0.75% is paid for distribution services. The plans provide that the R Class will pay ACIS an annual distribution and service fee of 0.50%. The fees are computed and accrued daily based on each class’s daily net assets and paid monthly in arrears. The fees are used to pay financial intermediaries for distribution and individual shareholder services. Fees incurred under the plans during the year ended November 30, 2016 are detailed in the Statement of Operations.
Directors' Fees and Expenses — The Board of Directors is responsible for overseeing the investment advisor’s management and operations of the fund. The directors receive detailed information about the fund and its investment advisor regularly throughout the year, and meet at least quarterly with management of the investment advisor to review reports about fund operations. The fund’s officers do not receive compensation from the fund.
Interfund Transactions — The fund may enter into security transactions with other American Century Investments funds and other client accounts of the investment advisor, in accordance with the 1940 Act rules and procedures adopted by the Board of Directors. The rules and procedures require, among other things, that these transactions be effected at the independent current market price of the security. There were no interfund transactions during the period.
20
4. Investment Transactions
Purchases and sales of investment securities, excluding short-term investments, for the year ended November 30, 2016 were $188,081,676 and $207,341,653, respectively.
5. Capital Share Transactions
Transactions in shares of the fund were as follows:
| Year ended November 30, 2016 | Year ended November 30, 2015 | |||||||||
| Shares | Amount | Shares | Amount | |||||||
| Investor Class/Shares Authorized | 120,000,000 | 110,000,000 | ||||||||
| Sold | 2,324,522 | $ | 20,183,544 | 2,966,146 | $ | 26,732,584 | ||||
| Issued in reinvestment of distributions | 343,807 | 3,039,251 | 628,862 | 5,205,836 | ||||||
| Redeemed | (4,064,261 | ) | (35,125,896 | ) | (3,331,759 | ) | (28,971,648 | ) | ||
| (1,395,932 | ) | (11,903,101 | ) | 263,249 | 2,966,772 | |||||
| Institutional Class/Shares Authorized | 35,000,000 | 40,000,000 | ||||||||
| Sold | 144,305 | 1,241,192 | 736,174 | 6,598,320 | ||||||
| Issued in reinvestment of distributions | 18,597 | 165,883 | 23,676 | 197,551 | ||||||
| Redeemed | (113,497 | ) | (1,004,870 | ) | (529,250 | ) | (4,527,913 | ) | ||
| 49,405 | 402,205 | 230,600 | 2,267,958 | |||||||
| A Class/Shares Authorized | 30,000,000 | 30,000,000 | ||||||||
| Sold | 793,313 | 6,858,283 | 1,261,101 | 11,178,064 | ||||||
| Issued in reinvestment of distributions | 51,180 | 450,388 | 79,078 | 652,093 | ||||||
| Redeemed | (1,357,678 | ) | (11,880,126 | ) | (800,417 | ) | (7,101,223 | ) | ||
| (513,185 | ) | (4,571,455 | ) | 539,762 | 4,728,934 | |||||
| C Class/Shares Authorized | 30,000,000 | 20,000,000 | ||||||||
| Sold | 71,416 | 602,250 | 92,172 | 824,061 | ||||||
| Issued in reinvestment of distributions | 2,651 | 22,907 | 3,828 | 30,898 | ||||||
| Redeemed | (49,685 | ) | (418,768 | ) | (9,757 | ) | (83,153 | ) | ||
| 24,382 | 206,389 | 86,243 | 771,806 | |||||||
| R Class/Shares Authorized | 30,000,000 | 20,000,000 | ||||||||
| Sold | 16,014 | 138,491 | 5,465 | 48,213 | ||||||
| Issued in reinvestment of distributions | 1,582 | 13,860 | 3,084 | 25,293 | ||||||
| Redeemed | (11,891 | ) | (103,785 | ) | (1,482 | ) | (12,279 | ) | ||
| 5,705 | 48,566 | 7,067 | 61,227 | |||||||
| Net increase (decrease) | (1,829,625 | ) | $ | (15,817,396 | ) | 1,126,921 | $ | 10,796,697 | ||
6. Fair Value Measurements
The fund’s investments valuation process is based on several considerations and may use multiple inputs to determine the fair value of the investments held by the fund. In conformity with accounting principles generally accepted in the United States of America, the inputs used to determine a valuation are classified into three broad levels.
| • | Level 1 valuation inputs consist of unadjusted quoted prices in an active market for identical investments. |
| • | Level 2 valuation inputs consist of direct or indirect observable market data (including quoted prices for comparable investments, evaluations of subsequent market events, interest rates, prepayment speeds, credit risk, etc.). These inputs also consist of quoted prices for identical investments initially expressed in local currencies that are adjusted through translation into U.S. dollars. |
21
| • | Level 3 valuation inputs consist of unobservable data (including a fund’s own assumptions). |
The level classification is based on the lowest level input that is significant to the fair valuation measurement. The valuation inputs are not necessarily an indication of the risks associated with investing in these securities or other financial instruments. There were no significant transfers between levels during the period.
The following is a summary of the level classifications as of period end. The Schedule of Investments provides additional information on the fund’s portfolio holdings.
| Level 1 | Level 2 | Level 3 | ||||||
| Assets | ||||||||
| Investment Securities | ||||||||
| Common Stocks | $ | 1,980,859 | $ | 127,749,057 | — | |||
| Temporary Cash Investments | 565 | 1,496,000 | — | |||||
| $ | 1,981,424 | $ | 129,245,057 | — | ||||
7. Risk Factors
There are certain risks involved in investing in foreign securities. These risks include those resulting from future adverse political, social and economic developments, fluctuations in currency exchange rates, the possible imposition of exchange controls, and other foreign laws or restrictions. Investing in emerging markets may accentuate these risks.
The fund invests in common stocks of small companies. Because of this, the fund may be subject to greater risk and market fluctuations than a fund investing in larger, more established companies.
The fund’s investment process may result in high portfolio turnover, which could mean high transaction costs, affecting both performance and capital gains tax liabilities to investors.
8. Federal Tax Information
On December 20, 2016, the fund declared and paid the following per-share distributions from net investment income to shareholders of record on December 19, 2016:
| Investor Class | Institutional Class | A Class | C Class | R Class |
| $0.0034 | $0.0201 | — | — | — |
The tax character of distributions paid during the years ended November 30, 2016 and November 30, 2015 were as follows:
| 2016 | 2015 | |||||
| Distributions Paid From | ||||||
| Ordinary income | $ | 1,266,919 | $ | 350,365 | ||
| Long-term capital gains | $ | 2,550,651 | $ | 5,959,925 | ||
The book-basis character of distributions made during the year from net investment income or net realized gains may differ from their ultimate characterization for federal income tax purposes. These differences reflect the differing character of certain income items and net realized gains and losses for financial statement and tax purposes, and may result in reclassification among certain capital accounts on the financial statements.
The reclassifications, which are primarily due to net operating losses and distributions in excess of current earnings, were made to accumulated net investment loss $1,527,978, accumulated net realized loss $(401,885) and capital $(1,126,093).
22
As of November 30, 2016, the federal tax cost of investments and the components of distributable earnings on a tax-basis were as follows:
| Federal tax cost of investments | $ | 116,909,063 | |
| Gross tax appreciation of investments | $ | 18,484,741 | |
| Gross tax depreciation of investments | (4,167,323 | ) | |
| Net tax appreciation (depreciation) of investments | 14,317,418 | ||
Net tax appreciation (depreciation) on translation of assets and liabilities in foreign currencies | (36,739 | ) | |
Net tax appreciation (depreciation) | $ | 14,280,679 | |
| Late-year ordinary loss deferral | $ | (191,433 | ) |
| Post-October capital loss deferral | $ | (200,612 | ) |
The difference between book-basis and tax-basis unrealized appreciation (depreciation) is attributable primarily to the tax deferral of losses on wash sales.
Loss deferrals represent certain qualified losses that the fund has elected to treat as having been incurred in the following fiscal year for federal income tax purposes.
9. Recently Issued Accounting Guidance
In October 2016, the Securities and Exchange Commission adopted new rules and forms as well as amendments to its rules and forms to modernize the reporting and disclosure of information by registered investment companies. The amendments to Regulation S-X will require standardized, enhanced disclosure about derivatives in investment company financial statements, as well as other provisions. Compliance with the amendments is effective on August 1, 2017. Management is currently evaluating the impact that adopting the amendments will have on the financial statement disclosures.
23
| Financial Highlights |
| For a Share Outstanding Throughout the Years Ended November 30 (except as noted) | |||||||||||||||||
| Per-Share Data | Ratios and Supplemental Data | ||||||||||||||||
| Income From Investment Operations: | Distributions From: | Ratio to Average Net Assets of: | |||||||||||||||
Net Asset Value, Beginning of Period | Net Investment Income (Loss)(1) | Net Realized and Unrealized Gain (Loss) | Total From Investment Operations | Net Investment Income | Net Realized Gains | Total Distributions | Net Asset Value, End of Period | Total Return(2) | Operating Expenses | Operating Expenses (before expense waiver) | Net Investment Income (Loss) | Net Investment Income (Loss) (before expense waiver) | Portfolio Turnover Rate | Net Assets, End of Period (in thousands) | |||
| Investor Class | |||||||||||||||||
| 2016 | $9.08 | (0.01) | (0.36) | (0.37) | (0.08) | (0.14) | (0.22) | $8.49 | (4.14)% | 1.54% | 1.74% | (0.07)% | (0.27)% | 130% | $108,184 | ||
| 2015 | $8.92 | (0.03) | 0.58 | 0.55 | (0.02) | (0.37) | (0.39) | $9.08 | 6.67% | 1.51% | 1.71% | (0.33)% | (0.53)% | 152% | $128,450 | ||
| 2014 | $9.20 | 0.01 | (0.26) | (0.25) | (0.03) | — | (0.03) | $8.92 | (2.77)% | 1.55% | 1.75% | 0.11% | (0.09)% | 128% | $123,835 | ||
| 2013 | $7.14 | —(3) | 2.14 | 2.14 | (0.08) | — | (0.08) | $9.20 | 30.13% | 1.72% | 1.79% | (0.04)% | (0.11)% | 123% | $137,264 | ||
| 2012 | $5.98 | —(3) | 1.16 | 1.16 | — | — | — | $7.14 | 19.40% | 1.87% | 1.87% | (0.04)% | (0.04)% | 127% | $99,445 | ||
| Institutional Class | |||||||||||||||||
| 2016 | $9.18 | 0.01 | (0.38) | (0.37) | (0.09) | (0.14) | (0.23) | $8.58 | (4.05)% | 1.34% | 1.54% | 0.13% | (0.07)% | 130% | $6,674 | ||
| 2015 | $9.02 | (0.01) | 0.58 | 0.57 | (0.04) | (0.37) | (0.41) | $9.18 | 6.82% | 1.31% | 1.51% | (0.13)% | (0.33)% | 152% | $6,685 | ||
| 2014 | $9.29 | 0.03 | (0.27) | (0.24) | (0.03) | — | (0.03) | $9.02 | (2.58)% | 1.35% | 1.55% | 0.31% | 0.11% | 128% | $4,491 | ||
| 2013 | $7.21 | (0.04) | 2.21 | 2.17 | (0.09) | — | (0.09) | $9.29 | 30.38% | 1.52% | 1.59% | 0.16% | 0.09% | 123% | $3,100 | ||
| 2012 | $6.03 | 0.01 | 1.17 | 1.18 | — | — | — | $7.21 | 19.57% | 1.67% | 1.67% | 0.16% | 0.16% | 127% | $45 | ||
| For a Share Outstanding Throughout the Years Ended November 30 (except as noted) | |||||||||||||||||
| Per-Share Data | Ratios and Supplemental Data | ||||||||||||||||
| Income From Investment Operations: | Distributions From: | Ratio to Average Net Assets of: | |||||||||||||||
Net Asset Value, Beginning of Period | Net Investment Income (Loss)(1) | Net Realized and Unrealized Gain (Loss) | Total From Investment Operations | Net Investment Income | Net Realized Gains | Total Distributions | Net Asset Value, End of Period | Total Return(2) | Operating Expenses | Operating Expenses (before expense waiver) | Net Investment Income (Loss) | Net Investment Income (Loss) (before expense waiver) | Portfolio Turnover Rate | Net Assets, End of Period (in thousands) | |||
| A Class | |||||||||||||||||
| 2016 | $9.03 | (0.03) | (0.37) | (0.40) | (0.06) | (0.14) | (0.20) | $8.43 | (4.47)% | 1.79% | 1.99% | (0.32)% | (0.52)% | 130% | $14,156 | ||
| 2015 | $8.88 | (0.05) | 0.58 | 0.53 | (0.01) | (0.37) | (0.38) | $9.03 | 6.48% | 1.76% | 1.96% | (0.58)% | (0.78)% | 152% | $19,796 | ||
| 2014 | $9.18 | (0.01) | (0.27) | (0.28) | (0.02) | — | (0.02) | $8.88 | (3.06)% | 1.80% | 2.00% | (0.14)% | (0.34)% | 128% | $14,683 | ||
| 2013 | $7.12 | (0.03) | 2.15 | 2.12 | (0.06) | — | (0.06) | $9.18 | 29.89% | 1.97% | 2.04% | (0.29)% | (0.36)% | 123% | $6,743 | ||
| 2012 | $5.98 | (0.04) | 1.18 | 1.14 | — | — | — | $7.12 | 19.06% | 2.12% | 2.12% | (0.29)% | (0.29)% | 127% | $1,931 | ||
| C Class | |||||||||||||||||
| 2016 | $8.81 | (0.09) | (0.36) | (0.45) | (0.01) | (0.14) | (0.15) | $8.21 | (5.17)% | 2.54% | 2.74% | (1.07)% | (1.27)% | 130% | $1,579 | ||
| 2015 | $8.73 | (0.12) | 0.57 | 0.45 | —(3) | (0.37) | (0.37) | $8.81 | 5.59% | 2.51% | 2.71% | (1.33)% | (1.53)% | 152% | $1,479 | ||
| 2014 | $9.07 | (0.08) | (0.26) | (0.34) | — | — | — | $8.73 | (3.75)% | 2.55% | 2.75% | (0.89)% | (1.09)% | 128% | $713 | ||
| 2013 | $7.04 | (0.09) | 2.12 | 2.03 | — | — | — | $9.07 | 29.02% | 2.72% | 2.79% | (1.04)% | (1.11)% | 123% | $425 | ||
| 2012 | $5.95 | (0.06) | 1.15 | 1.09 | — | — | — | $7.04 | 18.15% | 2.87% | 2.87% | (1.04)% | (1.04)% | 127% | $123 | ||
| R Class | |||||||||||||||||
| 2016 | $8.97 | (0.05) | (0.37) | (0.42) | (0.04) | (0.14) | (0.18) | $8.37 | (4.69)% | 2.04% | 2.24% | (0.57)% | (0.77)% | 130% | $658 | ||
| 2015 | $8.85 | (0.07) | 0.57 | 0.50 | (0.01) | (0.37) | (0.38) | $8.97 | 6.09% | 2.01% | 2.21% | (0.83)% | (1.03)% | 152% | $654 | ||
| 2014 | $9.15 | (0.04) | (0.25) | (0.29) | (0.01) | — | (0.01) | $8.85 | (3.15)% | 2.05% | 2.25% | (0.39)% | (0.59)% | 128% | $583 | ||
| 2013 | $7.10 | (0.03) | 2.12 | 2.09 | (0.04) | — | (0.04) | $9.15 | 29.50% | 2.22% | 2.29% | (0.54)% | (0.61)% | 123% | $623 | ||
| 2012 | $5.98 | (0.03) | 1.15 | 1.12 | — | — | — | $7.10 | 18.73% | 2.37% | 2.37% | (0.54)% | (0.54)% | 127% | $109 | ||
| Notes to Financial Highlights | |
| (1) | Computed using average shares outstanding throughout the period. |
| (2) | Total returns are calculated based on the net asset value of the last business day and do not reflect applicable sales charges, if any. Total returns for periods less than one year are not annualized. |
| (3) | Per-share amount was less than $0.005. |
See Notes to Financial Statements.
| Report of Independent Registered Public Accounting Firm |
To the Board of Directors and Shareholders of American Century World Mutual Funds, Inc.:
We have audited the accompanying statement of assets and liabilities, including the schedule of investments, of International Opportunities Fund (the “Fund”), one of the funds constituting American Century World Mutual Funds, Inc., as of November 30, 2016, and the related statement of operations for the year then ended, the statements of changes in net assets for each of the two years in the period then ended, and the financial highlights for each of the five years in the period then ended. These financial statements and financial highlights are the responsibility of the Fund’s management. Our responsibility is to express an opinion on these financial statements and financial highlights based on our audits.
We conducted our audits in accordance with the standards of the Public Company Accounting Oversight Board (United States). Those standards require that we plan and perform the audit to obtain reasonable assurance about whether the financial statements and financial highlights are free of material misstatement. The Fund is not required to have, nor were we engaged to perform, an audit of its internal control over financial reporting. Our audits included consideration of internal control over financial reporting as a basis for designing audit procedures that are appropriate in the circumstances, but not for the purpose of expressing an opinion on the effectiveness of the Fund’s internal control over financial reporting. Accordingly, we express no such opinion. An audit also includes examining, on a test basis, evidence supporting the amounts and disclosures in the financial statements, assessing the accounting principles used and significant estimates made by management, as well as evaluating the overall financial statement presentation. Our procedures included confirmation of securities owned as of November 30, 2016, by correspondence with the custodian and brokers; when replies were not received from brokers, we performed other auditing procedures. We believe that our audits provide a reasonable basis for our opinion.
In our opinion, the financial statements and financial highlights referred to above present fairly, in all material respects, the financial position of International Opportunities Fund of American Century World Mutual Funds, Inc. as of November 30, 2016, the results of its operations for the year then ended, the changes in its net assets for each of the two years in the period then ended, and the financial highlights for each of the five years in the period then ended, in conformity with accounting principles generally accepted in the United States of America.
DELOITTE & TOUCHE LLP
Kansas City, Missouri
January 17, 2017
27
| Management |
The Board of Directors
The individuals listed below serve as directors of the funds. Each director will continue to serve in this capacity until death, retirement, resignation or removal from office. The board has adopted a mandatory retirement age for directors who are not “interested persons,” as that term is defined in the Investment Company Act (independent directors). Independent directors shall retire by December 31 of the year in which they reach their 75th birthday.
Mr. Thomas is an “interested person” because he currently serves as President and Chief Executive Officer of American Century Companies, Inc. (ACC), the parent company of American Century Investment Management, Inc. (ACIM or the advisor). The other directors (more than three-fourths of the total number) are independent. They are not employees, directors or officers of, and have no financial interest in, ACC or any of its wholly owned, direct or indirect, subsidiaries, including ACIM, American Century Investment Services, Inc. (ACIS) and American Century Services, LLC (ACS), and they do not have any other affiliations, positions or relationships that would cause them to be considered “interested persons” under the Investment Company Act. The directors serve in this capacity for seven (in the case of Mr. Thomas, 15) registered investment companies in the American Century Investments family of funds.
The following table presents additional information about the directors. The mailing address for each director is 4500 Main Street, Kansas City, Missouri 64111.
| Name (Year of Birth) | Position(s) Held with Funds | Length of Time Served | Principal Occupation(s) During Past 5 Years | Number of American Century Portfolios Overseen by Director | Other Directorships Held During Past 5 Years |
| Independent Directors | |||||
| Barry Fink (1955) | Director | Since 2012 | Retired; Executive Vice President, ACC (September 2007 to February 2013); President, ACS (October 2007 to February 2013); Chief Operating Officer, ACC (September 2007 to November 2012) | 81 | None |
| Andrea C. Hall (1945) | Director | Since 1997 | Retired | 81 | None |
| Jan M. Lewis (1957) | Director | Since 2011 | Retired; President and Chief Executive Officer, Catholic Charities of Northeast Kansas (human services organization) (2006 to 2013) | 81 | None |
| James A. Olson (1942) | Director and Chairman of the Board | Since 2007 (Chairman since 2014) | Member, Plaza Belmont LLC (private equity fund manager) (1999 to present) | 81 | Saia, Inc. (2002 to 2012) and EPR Properties (2003 to 2013) |
| M. Jeannine Strandjord (1945) | Director | Since 1994 | Retired | 81 | Euronet Worldwide Inc.; MGP Ingredients, Inc.; and DST Systems Inc. (1996 to 2012) |
28
| Name (Year of Birth) | Position(s) Held with Funds | Length of Time Served | Principal Occupation(s) During Past 5 Years | Number of American Century Portfolios Overseen by Director | Other Directorships Held During Past 5 Years |
| Independent Directors | |||||
| John R. Whitten (1946) | Director | Since 2008 | Retired | 81 | Rudolph Technologies, Inc. |
| Stephen E. Yates (1948) | Director | Since 2012 | Retired | 81 | None |
| Interested Director | |||||
| Jonathan S. Thomas (1963) | Director and President | Since 2007 | President and Chief Executive Officer, ACC (March 2007 to present). Also serves as Chief Executive Officer, ACS; Executive Vice President, ACIM; Director, ACC, ACIM and other ACC subsidiaries | 126 | BioMed Valley Discoveries, Inc. |
The Statement of Additional Information has additional information about the fund's directors and is available without charge, upon request, by calling 1-800-345-2021.
29
Officers
The following table presents certain information about the executive officers of the funds. Each officer serves as an officer for each of the 15 investment companies in the American Century family of funds, unless otherwise noted. No officer is compensated for his or her service as an officer of the funds. The listed officers are interested persons of the funds and are appointed or re-appointed on an annual basis. The mailing address for each officer listed below is 4500 Main Street, Kansas City, Missouri 64111.
| Name (Year of Birth) | Offices with the Funds | Principal Occupation(s) During the Past Five Years |
| Jonathan S. Thomas (1963) | Director and President since 2007 | President and Chief Executive Officer, ACC (March 2007 to present). Also serves as Chief Executive Officer, ACS; Executive Vice President, ACIM; Director, ACC, ACIM and other ACC subsidiaries |
| Amy D. Shelton (1964) | Chief Compliance Officer and Vice President since 2014 | Chief Compliance Officer, American Century funds, (March 2014 to present); Chief Compliance Officer, ACIM (February 2014 to present); Chief Compliance Officer, ACIS (October 2009 to present); Vice President, Client Interactions and Marketing, ACIS (February 2013 to January 2014); Director, Client Interactions and Marketing, ACIS (June 2007 to January 2013). Also serves as Vice President, ACIS |
| Charles A. Etherington (1957) | General Counsel since 2007 and Senior Vice President since 2006 | Attorney, ACC (February 1994 to present); Vice President, ACC (November 2005 to present); General Counsel, ACC (March 2007 to present). Also serves as General Counsel, ACIM, ACS, ACIS and other ACC subsidiaries; and Senior Vice President, ACIM and ACS |
| C. Jean Wade (1964) | Vice President,Treasurer and Chief Financial Officer since 2012 | Vice President, ACS (February 2000 to present) |
| Robert J. Leach (1966) | Vice President since 2006 and Assistant Treasurer since 2012 | Vice President, ACS (February 2000 to present) |
| David H. Reinmiller (1963) | Vice President since 2000 | Attorney, ACC (January 1994 to present); Associate General Counsel, ACC (January 2001 to present). Also serves as Vice President, ACIM and ACS |
| Ward D. Stauffer (1960) | Secretary since 2005 | Attorney, ACC (June 2003 to present) |
30
| Approval of Management Agreement |
At a meeting held on June 29, 2016, the Fund’s Board of Directors (the "Board") unanimously approved the renewal of the management agreement pursuant to which American Century Investment Management, Inc. (the “Advisor”) acts as the investment advisor for the Fund. Under Section 15(c) of the Investment Company Act, contracts for investment advisory services are required to be reviewed, evaluated, and approved by a majority of a fund’s directors (the “Directors”), including a majority of the independent Directors, each year.
Prior to its consideration of the renewal of the management agreement, the Directors requested and reviewed extensive data and information compiled by the Advisor and certain independent providers of evaluation data concerning the Fund and the services provided to the Fund by the Advisor. This review was in addition to the oversight and evaluation undertaken by the Board and its committees on a continual basis and the information received was supplemental to the extensive information that the Board and its committees receive and consider throughout the year.
In connection with its consideration of the renewal of the management agreement, the Board’s review and evaluation of the services provided by the Advisor included, but was not limited to, the following:
| • | the nature, extent, and quality of investment management, shareholder services, and other services provided and to be provided to the Fund; |
| • | the wide range of other programs and services provided and to be provided to the Fund and its shareholders on a routine and non-routine basis; |
| • | the investment performance of the Fund, including data comparing the Fund's performance to appropriate benchmarks and/or a peer group of other mutual funds with similar investment objectives and strategies; |
| • | the cost of owning the Fund compared to the cost of owning similar funds; |
| • | the compliance policies, procedures, and regulatory experience of the Advisor and the Fund's service providers; |
| • | financial data showing the cost of services provided to the Fund, the profitability of the Fund to the Advisor, and the overall profitability of the Advisor; |
| • | possible economies of scale associated with the Advisor’s management of the Fund and other accounts under its management; |
| • | data comparing services provided and charges to the Advisor's other investment management clients; |
| • | acquired fund fees and expenses; |
| • | payments by the Fund and the Advisor to financial intermediaries and the nature of services provided; and |
| • | any collateral benefits derived by the Advisor from the management of the Fund. |
In keeping with their practice, the Directors held two in-person meetings and one telephonic meeting to review and discuss the information provided. The independent Directors also had the benefit of the advice of their independent counsel throughout the process.
Factors Considered
The Directors considered all of the information provided by the Advisor, the independent data providers, and independent counsel in connection with the approval. They determined that the information was sufficient for them to evaluate the management agreement for the Fund. In connection with their review, the Directors did not identify any single factor as being all-important or controlling, and each Director may have attributed different levels of importance to different factors.
31
In deciding to renew the management agreement, the Board based its decision on a number of factors, including the following:
Nature, Extent and Quality of Services - Generally. Under the management agreement, the Advisor is responsible for providing or arranging for all services necessary for the operation of the Fund. The Board noted that under the management agreement, the Advisor provides or arranges at its own expense a wide variety of services including:
| • | constructing and designing the Fund |
| • | portfolio research and security selection |
| • | initial capitalization/funding |
| • | securities trading |
| • | Fund administration |
| • | custody of Fund assets |
| • | daily valuation of the Fund’s portfolio |
| • | shareholder servicing and transfer agency, including shareholder confirmations, recordkeeping, and communications |
| • | legal services (except the independent Directors’ counsel) |
| • | regulatory and portfolio compliance |
| • | financial reporting |
| • | marketing and distribution (except amounts paid by the Fund under Rule 12b-1 plans) |
The Board noted that many of these services have expanded over time in terms of both quantity and complexity in response to shareholder demands, competition in the industry, changing distribution channels, and the changing regulatory environment. The Board noted specifically the resources the Advisor has committed to enhancing cybersecurity protections for the benefit of shareholders.
Investment Management Services. The nature of the investment management services provided to the Fund is quite complex and allows Fund shareholders access to professional money management, instant diversification of their investments within an asset class, the opportunity to easily diversify among asset classes by investing in or exchanging among various American Century Investments funds, and liquidity. In evaluating investment performance, the Board expects the Advisor to manage the Fund in accordance with its investment objectives and approved strategies. Further, the Directors recognize that the Advisor has an obligation to monitor trading activities, and in particular to seek the best execution of fund trades, and to evaluate the use of and payment for research. In providing these services, the Advisor utilizes teams of investment professionals (portfolio managers, analysts, research assistants, and securities traders) who require extensive information technology, research, training, compliance, and other systems to conduct their business. The Board, directly and through its Fund Performance Review Committee, provides oversight of the investment performance process. It regularly reviews investment performance information for the Fund, together with comparative information for appropriate benchmarks and/or peer groups of similarly-managed funds, over different time horizons. The Directors also review detailed performance information provided by the Advisor during the management agreement approval process. If performance concerns are identified, the Fund receives special reviews until performance improves, during which the Board receives a report from the Advisor regarding the reasons for such results (e.g., market conditions, security selection) and any efforts being undertaken to improve performance. The Fund’s performance was above its benchmark for the one-, three-, five-, and ten-year periods reviewed by the Board. The Board found the investment management services provided by the Advisor to the Fund to be satisfactory and consistent with the management agreement.
Shareholder and Other Services. Under the management agreement, the Advisor provides the Fund with a comprehensive package of transfer agency, shareholder, and other services. The Board, directly and through various committees of the Board, regularly reviews reports and evaluations of such services at its regular meetings. These reports include, but are not limited to,
32
information regarding the operational efficiency and accuracy of the shareholder and transfer agency services provided, staffing levels, shareholder satisfaction (as measured by external as well as internal sources), technology support, new products and services offered to Fund shareholders, securities trading activities, portfolio valuation services, auditing services, and legal and operational compliance activities. The Board particularly noted the Advisor’s continual efforts to maintain effective business continuity plans and to address cybersecurity threats. Certain aspects of shareholder and transfer agency service level efficiency and the quality of securities trading activities are measured by independent third party providers and are presented in comparison to other fund groups not managed by the Advisor. The Board found the services provided by the Advisor to the Fund under the management agreement to be competitive and of high quality.
Costs of Services and Profitability. The Advisor provides detailed information concerning its cost of providing various services to the Fund, its profitability in managing the Fund (pre- and post-distribution), its overall profitability, and its financial condition. The Directors have reviewed with the Advisor the methodology used to prepare this financial information. This information is considered in evaluating the Advisor’s financial condition, its ability to continue to provide services under the management agreement, and the reasonableness of the current management fee. The Board concluded that the Advisor’s profits were reasonable in light of the services provided to the Fund.
Ethics. The Board generally considers the Advisor’s commitment to providing quality services to shareholders and to conducting its business ethically. They noted that the Advisor’s practices generally meet or exceed industry best practices.
Economies of Scale. The Board also reviewed information provided by the Advisor regarding the possible existence of economies of scale in connection with the management of the Fund. The Board concluded that economies of scale are difficult to measure and predict with precision, especially on a fund-by-fund basis. The Board concluded that the Advisor is appropriately sharing economies of scale through its competitive fee structure, offering competitive fees from fund inception, and through reinvestment in its business to provide shareholders additional content and services. The Board also noted that economies of scale are shared with the Fund and its shareholders through management fee breakpoints that serve to reduce the effective management fee as the assets of the Fund grow.
Comparison to Other Funds’ Fees. The management agreement provides that the Fund pays the Advisor a single, all-inclusive (or unified) management fee for providing all services necessary for the management and operation of the Fund, other than brokerage expenses, expenses attributable to short sales, taxes, interest, extraordinary expenses, and the fees and expenses of the Fund’s independent Directors (including their independent legal counsel) and expenses incurred in connection with the provision of shareholder services and distribution services under a plan adopted pursuant to Rule 12b-1 under the 1940 Act. Under the unified fee structure, the Advisor is responsible for providing all investment advisory, custody, audit, administrative, compliance, recordkeeping, marketing and shareholder services, or arranging and supervising third parties to provide such services. By contrast, most other funds are charged a variety of fees, including an investment advisory fee, a transfer agency fee, an administrative fee, distribution charges, and other expenses. Other than their investment advisory fees and any applicable Rule 12b-1 distribution fees, all other components of the total fees charged by these other funds may be increased without shareholder approval. The Board believes the unified fee structure is a benefit to Fund shareholders because it clearly discloses to shareholders the cost of owning Fund shares, and, since the unified fee cannot be increased without a vote of Fund shareholders, it shifts to the Advisor the risk of increased costs of operating the Fund and provides a direct incentive to minimize administrative inefficiencies. Part of the Board’s analysis of fee levels involves reviewing certain evaluative data compiled by an independent provider comparing the Fund’s unified fee to the total expense ratios of its peers. The unified fee charged to shareholders of the Fund was above the median of the total expense ratios of the Fund’s peer expense universe and was within the range of its peer expense group. The Board concluded that the management fee paid by the
33
Fund to the Advisor under the management agreement is reasonable in light of the services provided to the Fund.
Comparison to Fees and Services Provided to Other Clients of the Advisor. The Directors also requested and received information from the Advisor concerning the nature of the services, fees, costs, and profitability of its advisory services to advisory clients other than the Fund. They observed that these varying types of client accounts require different services and involve different regulatory and entrepreneurial risks than the management of the Fund. The Board analyzed this information and concluded that the fees charged and services provided to the Fund were reasonable by comparison.
Payments to Intermediaries. The Directors also requested and received a description of payments made to intermediaries by the Fund and the Advisor. These payments include various payments made by the Fund or the Advisor to different types of intermediaries and recordkeepers for distribution and service activities provided for the Fund. The Board received confirmation from the Advisor that all such payments by the Fund intended for distribution were made pursuant to the Fund's 12b-1 Plan. The Board reviewed such information and found the payments to be reasonable in scope and purpose.
Collateral or “Fall-Out” Benefits Derived by the Advisor. The Board considered the existence of collateral benefits the Advisor may receive as a result of its relationship with the Fund. They concluded that the Advisor’s primary business is managing mutual funds and it generally does not use fund or shareholder information to generate profits in other lines of business, and therefore does not derive any significant collateral benefits from them. The Board noted that additional assets from other clients may offer the Advisor some benefit from increased leverage with service providers and counterparties. Additionally, the Advisor receives proprietary research from broker-dealers that execute fund portfolio transactions, which the Board concluded is likely to benefit other clients of the Advisor, as well as Fund shareholders. The Board also determined that the Advisor is able to provide investment management services to certain clients other than the Fund, at least in part, due to its existing infrastructure built to serve the fund complex. The Board concluded that appropriate allocation methodologies had been employed to assign resources and the cost of those resources to these other clients and, where expressly provided, these other client assets may be included with the assets of the Fund to determine breakpoints in the management fee schedule.
Existing Relationship. The Board also considered whether there was any reason for not continuing the existing arrangement with the Advisor. In this regard, the Board was mindful of the potential disruptions of the Fund’s operations and various risks, uncertainties, and other effects that could occur as a result of a decision not to continue such relationship. In particular, the Board recognized that most shareholders have invested in the Fund on the strength of the Advisor’s industry standing and reputation and in the expectation that the Advisor will have a continuing role in providing advisory services to the Fund.
Conclusion of the Directors. As a result of this process, the Board, including all of the independent Directors, taking into account all of the factors discussed above and the information provided by the Advisor and others in connection with its review and throughout the year, determined that the management fee is fair and reasonable in light of the services provided and that the investment management agreement between the Fund and the Advisor should be renewed.
34
| Additional Information |
Retirement Account Information
As required by law, distributions you receive from certain IRAs are subject to federal income tax withholding, unless you elect not to have withholding apply. Tax will be withheld on the total amount withdrawn even though you may be receiving amounts that are not subject to withholding, such as nondeductible contributions. In such case, excess amounts of withholding could occur. You may adjust your withholding election so that a greater or lesser amount will be withheld.
If you don’t want us to withhold on this amount, you must notify us to not withhold the federal income tax. You may notify us in writing or in certain situations by telephone or through other electronic means. For systematic withdrawals, your withholding election will remain in effect until revoked or changed by filing a new election. You have the right to revoke your election at any time.
Remember, even if you elect not to have income tax withheld, you are liable for paying income tax on the taxable portion of your withdrawal. If you elect not to have income tax withheld or you don’t have enough income tax withheld, you may be responsible for payment of estimated tax. You may incur penalties under the estimated tax rules if your withholding and estimated tax payments are not sufficient. You can reduce or defer the income tax on a distribution by directly or indirectly rolling such distribution over to another IRA or eligible plan. You should consult your tax advisor for additional information.
State tax will be withheld if, at the time of your distribution, your address is within one of the mandatory withholding states and you have federal income tax withheld (or as otherwise required by state law). State taxes will be withheld from your distribution in accordance with the respective state rules.
Distributions you receive from 403(b), 457 and qualified plans are subject to special tax and withholding rules. Your plan administrator or plan sponsor is required to provide you with a special tax notice explaining those rules at the time you request a distribution. If applicable, federal and/or state taxes may be withheld from your distribution amount.
Proxy Voting Policies
A description of the policies that the fund's investment advisor uses in exercising the voting rights associated with the securities purchased and/or held by the fund is available without charge, upon request, by calling 1-800-345-2021. It is also available on the "About Us" page of American Century Investments’ website at americancentury.com and on the Securities and Exchange Commission’s website at sec.gov. Information regarding how the investment advisor voted proxies relating to portfolio securities during the most recent 12-month period ended June 30 is available on the "About Us" page at americancentury.com. It is also available at sec.gov.
Quarterly Portfolio Disclosure
The fund files its complete schedule of portfolio holdings with the Securities and Exchange Commission (SEC) for the first and third quarters of each fiscal year on Form N-Q. The fund’s Forms N-Q are available on the SEC’s website at sec.gov, and may be reviewed and copied at the SEC’s Public Reference Room in Washington, DC. Information on the operation of the Public Reference Room may be obtained by calling 1-800-SEC-0330. The fund also makes its complete schedule of portfolio holdings for the most recent quarter of its fiscal year available on its website at americancentury.com and, upon request, by calling 1-800-345-2021.
35
Other Tax Information
The following information is provided pursuant to provisions of the Internal Revenue Code.
The fund hereby designates up to the maximum amount allowable as qualified dividend income for the fiscal year ended November 30, 2016.
The fund hereby designates $2,550,651, or up to the maximum amount allowable, as long-term capital gain distributions (20% rate gain distributions) for the fiscal year ended November 30, 2016.
For the fiscal year ended November 30, 2016, the fund intends to pass through to shareholders foreign source income of $2,331,183 and foreign taxes paid of $192,734, or up to the maximum amount allowable, as a foreign tax credit. Foreign source income and foreign tax expense per outstanding share on November 30, 2016 are $0.1506 and $0.0125, respectively.
36
| ||
| Contact Us | americancentury.com | |
| Automated Information Line | 1-800-345-8765 | |
| Investor Services Representative | 1-800-345-2021 or 816-531-5575 | |
| Investors Using Advisors | 1-800-378-9878 | |
| Business, Not-For-Profit, Employer-Sponsored Retirement Plans | 1-800-345-3533 | |
| Banks and Trust Companies, Broker-Dealers, Financial Professionals, Insurance Companies | 1-800-345-6488 | |
| Telecommunications Relay Service for the Deaf | 711 | |
| American Century World Mutual Funds, Inc. | ||
Investment Advisor: American Century Investment Management, Inc. Kansas City, Missouri | ||
| This report and the statements it contains are submitted for the general information of our shareholders. The report is not authorized for distribution to prospective investors unless preceded or accompanied by an effective prospectus. | ||
| ©2017 American Century Proprietary Holdings, Inc. All rights reserved. CL-ANN-91032 1701 | ||
| Annual Report | |
| November 30, 2016 | |
| International Value Fund | |
| Table of Contents |
| President’s Letter | 2 | |
| Performance | 3 | |
| Portfolio Commentary | ||
| Fund Characteristics | ||
| Shareholder Fee Example | ||
| Schedule of Investments | ||
| Statement of Assets and Liabilities | ||
| Statement of Operations | ||
| Statement of Changes in Net Assets | ||
| Notes to Financial Statements | ||
| Financial Highlights | ||
| Report of Independent Registered Public Accounting Firm | ||
| Management | ||
| Approval of Management Agreement | ||
| Additional Information | ||
Any opinions expressed in this report reflect those of the author as of the date of the report, and do not necessarily represent the opinions of American Century Investments® or any other person in the American Century Investments organization. Any such opinions are subject to change at any time based upon market or other conditions and American Century Investments disclaims any responsibility to update such opinions. These opinions may not be relied upon as investment advice and, because investment decisions made by American Century Investments funds are based on numerous factors, may not be relied upon as an indication of trading intent on behalf of any American Century Investments fund. Security examples are used for representational purposes only and are not intended as recommendations to purchase or sell securities. Performance information for comparative indices and securities is provided to American Century Investments by third party vendors. To the best of American Century Investments’ knowledge, such information is accurate at the time of printing.
| President’s Letter |
Jonathan ThomasDear Investor:
Thank you for reviewing this annual report for the period ended November 30, 2016. Annual reports help convey important information about fund returns, including market factors that affected performance during the reporting period. For additional, updated investment and market insights, we encourage you to visit our website, americancentury.com.
A Year of Surprises: China, Oil, Brexit, Trump
A year ago, we predicted increased market volatility in 2016. Volatility occurred, but not for the reasons we suggested. We expected the Federal Reserve (the Fed)—which in December 2015 raised its short-term interest rate target for the first time since 2006—to raise it three to four more times in 2016 as U.S. economic growth improved. We thought the shift in rate policy would contribute to unsettled conditions as inflation expectations grew, borrowing costs increased, the U.S. dollar strengthened, and bond prices weakened.
Instead, global and U.S. growth largely languished in the first half of 2016 as concerns about China’s growth and plummeting oil prices affected the global economic outlook. The Fed left its target unchanged for 11 months to avoid putting further stress on the global economy and markets. Meanwhile, years of low interest rates, market globalization, and corporate cost-cutting had benefited some segments of the world’s developed democracies much more than others. The others spoke up in June and November, voting for the U.K. to exit the European Union, then propelling Donald Trump to victory. These unexpected populist political results unsettled the markets.
Despite these challenges, and with the continued support of central bank monetary stimulus, broad market index returns for the full reporting period were mostly positive, though they skewed negative in non-U.S. developed equity markets. Looking ahead, Trump’s win shifted the market outlook, unleashing potentially far-reaching ramifications that are still unfolding. What’s clear is that Trump’s policy proposals and his unpredictable nature make uncertainty more certain, which could trigger further bouts of short-term market volatility. In this unsettled environment, we strongly believe in staying the course and remaining focused on longer-term goals, using disciplined, actively managed, diversified, risk-aware strategies. We appreciate your continued trust in us.
Sincerely,
Jonathan Thomas
President and Chief Executive Officer
American Century Investments
2
| Performance |
| Total Returns as of November 30, 2016 | ||||||
Average Annual Returns | ||||||
Ticker Symbol | 1 year | 5 years | 10 years | Since Inception | Inception Date | |
| A Class | MEQAX | 3/31/97 | ||||
| No sales charge | -3.46% | 4.05% | 0.59% | — | ||
| With sales charge | -9.03% | 2.82% | -0.01% | — | ||
| MSCI EAFE Value Index | — | -1.51% | 5.20% | -0.33% | — | — |
| Investor Class | ACEVX | -3.15% | 4.34% | 0.83% | — | 4/3/06 |
| Institutional Class | ACVUX | -2.99% | 4.54% | 1.03% | — | 4/3/06 |
| C Class | ACCOX | -4.21% | 3.29% | -0.18% | — | 4/3/06 |
| R Class | ACVRX | -3.68% | 3.80% | 0.32% | — | 4/3/06 |
| R6 Class | ACVDX | -2.87% | — | — | -0.28% | 7/26/13 |
Average annual returns since inception are presented when ten years of performance history is not available.
Fund returns would have been lower if a portion of the fees had not been waived.
Sales charges include initial sales charges and contingent deferred sales charges (CDSCs), as applicable. A Class shares have a 5.75% maximum initial sales charge and may be subject to a maximum CDSC of 1.00%. C Class shares redeemed within 12 months of purchase are subject to a maximum CDSC of 1.00%. The SEC requires that mutual funds provide performance information net of maximum sales charges in all cases where charges could be applied.
Data presented reflect past performance. Past performance is no guarantee of future results. Current performance may be higher or lower than the performance shown. Total returns for periods less than one year are not annualized. Investment return and principal value will fluctuate, and redemption value may be more or less than original cost. Data assumes reinvestment of dividends and capital gains, and none of the charts reflect the deduction of taxes that a shareholder would pay on fund distributions or the redemption of fund shares. To obtain performance data current to the most recent month end, please call 1-800-345-2021 or visit americancentury.com. For additional information about the fund, please consult the prospectus.
3
| Growth of $10,000 Over 10 Years |
| $10,000 investment made November 30, 2006 |
| Performance for other share classes will vary due to differences in fee structure. |
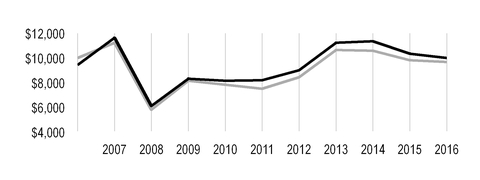
| Value on November 30, 2016 | |
| A Class — $9,995 | |
| MSCI EAFE Value Index — $9,675 | |
The A Class’s initial investment is $9,425 to reflect the maximum 5.75% initial sales charge.
Ending value of A Class would have been lower if a portion of the fees had not been waived.
Total Annual Fund Operating Expenses | |||||
| Investor Class | Institutional Class | A Class | C Class | R Class | R6 Class |
| 1.32% | 1.12% | 1.57% | 2.32% | 1.82% | 0.97% |
The total annual fund operating expenses shown is as stated in the fund’s prospectus current as of the date of this report. The prospectus may vary from the expense ratio shown elsewhere in this report because it is based on a different time period, includes acquired fund fees and expenses, and, if applicable, does not include fee waivers or expense reimbursements.
Data presented reflect past performance. Past performance is no guarantee of future results. Current performance may be higher or lower than the performance shown. Total returns for periods less than one year are not annualized. Investment return and principal value will fluctuate, and redemption value may be more or less than original cost. Data assumes reinvestment of dividends and capital gains, and none of the charts reflect the deduction of taxes that a shareholder would pay on fund distributions or the redemption of fund shares. To obtain performance data current to the most recent month end, please call 1-800-345-2021 or visit americancentury.com. For additional information about the fund, please consult the prospectus.
4
| Portfolio Commentary |
Portfolio Managers: Elizabeth Xie and Vinod Chandrashekaran
In September 2016, portfolio manager Yulin Long left the fund's management team.
Performance Summary
International Value declined -3.15%* for the fiscal year ended November 30, 2016, compared with the -1.51% return of its benchmark, the MSCI EAFE Value Index. Fund results reflect operating expenses, while benchmark returns do not.
From late December to mid-February, stock market indices declined sharply on a confluence of factors that carried over from last summer’s similar sell-off, including China-related concerns and an energy price collapse. The markets were recovering until the U.K.’s late June Brexit vote triggered a sharp market correction that spilled into the beginning of the third quarter, with most equity markets continuing to decline. Non-U.S. markets ultimately recovered some of their Brexit-related losses, finishing lower for the year but well above their lowest levels. Non-U.S. developed market stocks declined during the 12-month period, sharply lagging returns provided by U.S.-based equities. Among non-U.S. developed market stocks, the Asia-Pacific region fared the best, delivering a small gain, equities based in the Far East posted modest losses, and those domiciled in Europe sharply lagged.
The fund’s stock selection process incorporates factors of valuation, quality, and sentiment while minimizing unintended risks among industries and other risk characteristics. Stock selection insights based on valuation were most beneficial to relative returns, while sentiment and quality contributed to a lesser extent. Difficult stock selection among real estate, utilities, consumer discretionary, and energy led to underperformance. Conversely, stock selection in telecommunication services, financials and information technology holdings contributed favorably to relative returns. From a geographical perspective, investments in Japan, and to a lesser extent, France and Germany weighed on the fund’s results, while stock selection in Sweden and Australia and investments in Spain were beneficial.
Japan-Based Holdings Detracted from Performance
In Japan, an overweight in Japan-based electric utility Tokyo Electric Power and a portfolio-only allocation to Seven Bank hurt the fund’s relative returns. Tokyo Electric’s first-quarter operating profit plummeted 37% as sales declined amid faltering demand and new entrants into Japan’s power market. Investors also were concerned by its opaque sales and cost outlooks after it reported those results. Seven Bank reported weaker-than-expected quarterly results during the period. We subsequently eliminated our position in both companies as their profiles declined markedly across all measures.
Among U.K.-based financials, a portfolio-only holding in publicly-traded hedge fund Man Group and an overweight in asset manager Legal & General Group hampered performance. The two firms were hurt by concerns about Brexit’s potential impact on their businesses. Earlier in the year, a weaker outlook for Man Group’s performance fees also contributed to the share’s weakness.
Elsewhere in the fund, a portfolio-only position in Germany-based ProSiebenSat.1 Media was detrimental amid investor concerns that the digital entertainment firm is spending too much on the acquisitions it is using to fuel growth and diversify its business away from mature media to e-commerce and online.
*All fund returns referenced in this commentary are for Investor Class shares. Performance for other share classes will vary due to differences in fee structure; when Investor Class performance exceeds that of the fund's benchmark, other share classes may not. See page 3 for returns for all share classes.
5
Stock Selection in Metals and Mining Benefited Results
Security selection in a number of natural resource companies helped to somewhat limit the fund’s losses. Shares of Australia-based Fortescue Metals Group, an iron ore exporter, generally moved higher throughout the period, as iron ore and steel markets remain supported by better infrastructure and housing activity in China. The company also was aided by its efforts to cut cash costs. An allocation to U.K.-based mining company Rio Tinto also added value. Rio Tinto benefited from higher metals and diamond prices as well as increased optimism that infrastructure spending would increase following the U.S. election results. A portfolio-only holding of India-based metals producer Vedanta Resources aided returns. After falling to their low for the year in early February, the shares moved steadily higher, benefiting from the positive impact of management’s cost optimization strategy on earnings before interest, taxes, depreciation, and amortization (EBITDA) margins.
Outside of metals and mining, a portfolio-only allocation to Norway-based oilfield services firm Subsea 7 helped performance. An improved oil-price environment along with strong project execution and more efficient vessel scheduling continues to outweigh the negative impact of revenue pressures. Management also raised its EBITDA margin guidance.
A Look Ahead
As we approach 2017, we believe there is potential for stronger growth in the developed world in the coming year. Growth expectations have improved in the U.S., the U.K., and the Eurozone, which has been reflected in recent market performance. At the same time, post-election risks remain. The U.K.’s exit from the European Union (Brexit) has been delayed and president-elect Trump’s proposals are still just talk. How they, and other changes from populist movements, actually play out remains to be seen. The combination of a stronger dollar, weaker commodities, and Trump’s trade policy proposals makes the environment more challenging for emerging markets. This potentially signals a shift in growth leadership from emerging markets to developed markets. However, that assumes the ultimate impact of populist movement-driven changes won’t derail developed market growth. We believe our disciplined investment approach is particularly beneficial during periods of likely volatility, and we adhere to our process regardless of the market environment. We believe that this allows us to take advantage of opportunities presented by market inefficiencies.
We believe that stock selection—rather than regional and sector allocation or market timing via the use of cash—is the most efficient means of generating superior risk-adjusted returns. As a result of this approach, the fund’s country and sector weightings are primarily a result of identifying what we believe to be superior individual securities.
6
| Fund Characteristics |
| NOVEMBER 30, 2016 | |
Top Ten Holdings | % of net assets |
| HSBC Holdings plc | 3.5% |
| Royal Dutch Shell plc, B Shares | 3.2% |
| GlaxoSmithKline plc | 2.4% |
| Toyota Motor Corp. | 2.1% |
| Allianz SE | 2.1% |
| Australia & New Zealand Banking Group Ltd. | 2.0% |
| ING Groep NV | 1.8% |
| TOTAL SA | 1.8% |
| BNP Paribas SA | 1.8% |
| Rio Tinto plc | 1.5% |
Types of Investments in Portfolio | % of net assets |
| Common Stocks | 96.8% |
| Exchange-Traded Funds | 1.2% |
| Total Equity Exposure | 98.0% |
| Temporary Cash Investments | 3.2% |
| Other Assets and Liabilities | (1.2)% |
Investments by Country | % of net assets |
| Japan | 24.5% |
| United Kingdom | 19.7% |
| France | 11.7% |
| Germany | 7.5% |
| Australia | 6.8% |
| Spain | 4.9% |
| Hong Kong | 4.2% |
| Switzerland | 3.2% |
| Netherlands | 2.5% |
| Italy | 2.3% |
| Other Countries | 9.5% |
| Exchange-Traded Funds* | 1.2% |
| Cash and Equivalents** | 2.0% |
*Category may increase exposure to the countries indicated. The Schedule of Investments provides additional information on the fund's portfolio holdings. | |
| **Includes temporary cash investments and other assets and liabilities. | |
7
| Shareholder Fee Example |
Fund shareholders may incur two types of costs: (1) transaction costs, including sales charges (loads) on purchase payments and redemption/exchange fees; and (2) ongoing costs, including management fees; distribution and service (12b-1) fees; and other fund expenses. This example is intended to help you understand your ongoing costs (in dollars) of investing in your fund and to compare these costs with the ongoing cost of investing in other mutual funds.
The example is based on an investment of $1,000 made at the beginning of the period and held for the entire period from June 1, 2016 to November 30, 2016.
Actual Expenses
The table provides information about actual account values and actual expenses for each class. You may use the information, together with the amount you invested, to estimate the expenses that you paid over the period. First, identify the share class you own. Then simply divide your account value by $1,000 (for example, an $8,600 account value divided by $1,000 = 8.6), then multiply the result by the number under the heading “Expenses Paid During Period” to estimate the expenses you paid on your account during this period.
If you hold Investor Class shares of any American Century Investments fund, or Institutional Class shares of the American Century Diversified Bond Fund, in an American Century Investments account (i.e., not a financial intermediary or retirement plan account), American Century Investments may charge you a $12.50 semiannual account maintenance fee if the value of those shares is less than $10,000. We will redeem shares automatically in one of your accounts to pay the $12.50 fee. In determining your total eligible investment amount, we will include your investments in all personal accounts (including American Century Investments Brokerage accounts) registered under your Social Security number. Personal accounts include individual accounts, joint accounts, UGMA/UTMA accounts, personal trusts, Coverdell Education Savings Accounts and IRAs (including traditional, Roth, Rollover, SEP-, SARSEP- and SIMPLE-IRAs), and certain other retirement accounts. If you have only business, business retirement, employer-sponsored or American Century Investments Brokerage accounts, you are currently not subject to this fee. If you are subject to the Account Maintenance Fee, your account value could be reduced by the fee amount.
Hypothetical Example for Comparison Purposes
The table also provides information about hypothetical account values and hypothetical expenses based on the actual expense ratio of each class of your fund and an assumed rate of return of 5% per year before expenses, which is not the actual return of a fund’s share class. The hypothetical account values and expenses may not be used to estimate the actual ending account balance or expenses you paid for the period. You may use this information to compare the ongoing costs of investing in your fund and other funds. To do so, compare this 5% hypothetical example with the 5% hypothetical examples that appear in the shareholder reports of the other funds.
Please note that the expenses shown in the table are meant to highlight your ongoing costs only and do not reflect any transactional costs, such as sales charges (loads) or redemption/exchange fees. Therefore, the table is useful in comparing ongoing costs only, and will not help you determine the relative total costs of owning different funds. In addition, if these transactional costs were included, your costs would have been higher.
8
| Beginning Account Value 6/1/16 | Ending Account Value 11/30/16 | Expenses Paid During Period(1) 6/1/16 - 11/30/16 | Annualized Expense Ratio(1) | |
Actual | ||||
| Investor Class | $1,000 | $1,012.30 | $6.64 | 1.32% |
| Institutional Class | $1,000 | $1,012.30 | $5.63 | 1.12% |
| A Class | $1,000 | $1,009.50 | $7.89 | 1.57% |
| C Class | $1,000 | $1,006.90 | $11.64 | 2.32% |
| R Class | $1,000 | $1,008.20 | $9.14 | 1.82% |
| R6 Class | $1,000 | $1,013.70 | $4.88 | 0.97% |
Hypothetical | ||||
| Investor Class | $1,000 | $1,018.40 | $6.66 | 1.32% |
| Institutional Class | $1,000 | $1,019.40 | $5.65 | 1.12% |
| A Class | $1,000 | $1,017.15 | $7.92 | 1.57% |
| C Class | $1,000 | $1,013.40 | $11.68 | 2.32% |
| R Class | $1,000 | $1,015.90 | $9.17 | 1.82% |
| R6 Class | $1,000 | $1,020.15 | $4.90 | 0.97% |
| (1) | Expenses are equal to the class's annualized expense ratio listed in the table above, multiplied by the average account value over the period, multiplied by 183, the number of days in the most recent fiscal half-year, divided by 366, to reflect the one-half year period. |
9
| Schedule of Investments |
NOVEMBER 30, 2016
| Shares | Value | ||||
| COMMON STOCKS — 96.8% | |||||
| Australia — 6.8% | |||||
| Australia & New Zealand Banking Group Ltd. | 55,966 | $ | 1,174,131 | ||
| BlueScope Steel Ltd. | 24,163 | 160,945 | |||
| BWP Trust | 36,047 | 77,461 | |||
| CIMIC Group Ltd. | 7,896 | 179,705 | |||
| Dexus Property Group | 16,789 | 113,068 | |||
| Downer EDI Ltd. | 83,507 | 349,645 | |||
| Flight Centre Travel Group Ltd. | 5,006 | 123,469 | |||
| Fortescue Metals Group Ltd. | 82,478 | 357,518 | |||
| Mineral Resources Ltd. | 14,609 | 135,605 | |||
| Mirvac Group | 22,101 | 33,457 | |||
| OZ Minerals Ltd. | 13,789 | 80,136 | |||
| Regis Resources Ltd. | 25,649 | 53,981 | |||
| Scentre Group | 33,269 | 104,166 | |||
| Telstra Corp. Ltd. | 101,480 | 378,436 | |||
| Westpac Banking Corp. | 31,344 | 723,775 | |||
| 4,045,498 | |||||
| Belgium — 1.5% | |||||
| Bekaert SA | 3,519 | 146,779 | |||
| KBC Group NV | 12,241 | 734,047 | |||
| 880,826 | |||||
| China — 0.7% | |||||
| China Construction Bank Corp., H Shares | 274,000 | 204,180 | |||
| China Galaxy Securities Co. Ltd., H Shares | 37,000 | 36,730 | |||
| Industrial & Commercial Bank of China Ltd., H Shares | 280,000 | 171,469 | |||
| 412,379 | |||||
| Denmark — 0.6% | |||||
| Vestas Wind Systems A/S | 5,438 | 358,797 | |||
| Finland — 0.4% | |||||
| UPM-Kymmene Oyj | 10,161 | 232,613 | |||
| France — 11.7% | |||||
| AXA SA | 38,963 | 917,986 | |||
| BNP Paribas SA | 18,132 | 1,052,718 | |||
| Cie Generale des Etablissements Michelin, Class B | 717 | 76,751 | |||
| CNP Assurances | 2,432 | 42,710 | |||
| Engie SA | 50,342 | 621,585 | |||
| Faurecia | 8,726 | 312,776 | |||
| Metropole Television SA | 3,637 | 62,060 | |||
| Orange SA | 28,409 | 414,153 | |||
Peugeot SA(1) | 42,973 | 633,985 | |||
| Safran SA | 2,952 | 202,644 | |||
| Sanofi | 3,825 | 308,544 | |||
| Schneider Electric SE | 2,710 | 180,431 | |||
| SCOR SE | 2,415 | 76,697 | |||
| Societe Generale SA | 17,342 | 745,949 | |||
| TOTAL SA | 22,927 | 1,092,370 | |||
10
| Shares | Value | ||||
| Valeo SA | 3,960 | $ | 220,805 | ||
| 6,962,164 | |||||
| Germany — 7.5% | |||||
| Allianz SE | 7,926 | 1,258,375 | |||
| BASF SE | 2,077 | 178,284 | |||
| Continental AG | 889 | 157,725 | |||
| Daimler AG | 2,043 | 135,893 | |||
| Deutsche Wohnen AG | 4,726 | 145,557 | |||
| E.ON SE | 13,028 | 85,981 | |||
| Evonik Industries AG | 4,092 | 114,104 | |||
| Hannover Rueck SE | 5,965 | 633,149 | |||
| METRO AG | 15,754 | 470,768 | |||
| Muenchener Rueckversicherungs-Gesellschaft AG | 1,050 | 191,242 | |||
| ProSiebenSat.1 Media SE | 3,242 | 111,104 | |||
| RTL Group SA | 1,336 | 90,777 | |||
| Siemens AG | 5,877 | 663,983 | |||
| STADA Arzneimittel AG | 3,708 | 181,130 | |||
Uniper SE(1) | 5,859 | 72,995 | |||
| 4,491,067 | |||||
| Hong Kong — 4.2% | |||||
| BOC Hong Kong Holdings Ltd. | 180,000 | 675,305 | |||
| Hang Seng Bank Ltd. | 31,600 | 598,878 | |||
| HK Electric Investments & HK Electric Investments Ltd. | 155,000 | 136,685 | |||
| Kerry Properties Ltd. | 22,500 | 64,398 | |||
| Link REIT | 28,500 | 196,210 | |||
| New World Development Co. Ltd. | 105,000 | 116,960 | |||
| PCCW Ltd. | 211,000 | 122,685 | |||
| Sands China Ltd. | 11,200 | 55,159 | |||
| Television Broadcasts Ltd. | 13,900 | 49,550 | |||
| WH Group Ltd. | 362,000 | 301,025 | |||
| Wharf Holdings Ltd. (The) | 9,000 | 66,718 | |||
| Wheelock & Co. Ltd. | 22,000 | 130,755 | |||
| 2,514,328 | |||||
| India — 1.1% | |||||
| Tata Power Co. Ltd. | 117,918 | 127,567 | |||
| Vedanta Resources plc | 36,942 | 389,650 | |||
| Yes Bank Ltd. | 9,445 | 161,975 | |||
| 679,192 | |||||
| Israel — 0.1% | |||||
Tower Semiconductor Ltd.(1) | 2,428 | 43,917 | |||
| Italy — 2.3% | |||||
| Enel SpA | 184,257 | 744,816 | |||
| Eni SpA | 45,005 | 626,759 | |||
| 1,371,575 | |||||
| Japan — 24.5% | |||||
| Asahi Kasei Corp. | 19,000 | 168,983 | |||
| Bridgestone Corp. | 18,000 | 687,085 | |||
| Canon, Inc. | 10,000 | 285,040 | |||
| Central Japan Railway Co. | 3,000 | 489,839 | |||
| Dai-ichi Life Holdings, Inc. | 7,000 | 112,185 | |||
| Daiichi Sankyo Co. Ltd. | 6,700 | 139,499 | |||
11
| Shares | Value | ||||
| Daito Trust Construction Co. Ltd. | 1,300 | $ | 201,980 | ||
| Daiwa House Industry Co. Ltd. | 5,200 | 147,812 | |||
| Daiwa Securities Group, Inc. | 57,000 | 342,483 | |||
| FANUC Corp. | 600 | 101,246 | |||
| Fuji Heavy Industries Ltd. | 10,100 | 410,074 | |||
| Fujitsu Ltd. | 24,000 | 141,560 | |||
| Hitachi Chemical Co. Ltd. | 12,600 | 276,439 | |||
| Hitachi Construction Machinery Co. Ltd. | 21,300 | 438,269 | |||
| Honda Motor Co. Ltd. | 26,000 | 757,240 | |||
| Japan Airlines Co. Ltd. | 17,400 | 514,829 | |||
| Komatsu Ltd. | 23,000 | 529,439 | |||
| Konami Holdings Corp. | 2,300 | 77,803 | |||
| Leopalace21 Corp. | 61,900 | 335,998 | |||
| Mazda Motor Corp. | 3,700 | 59,314 | |||
| Miraca Holdings, Inc. | 4,800 | 214,816 | |||
| Mitsubishi Chemical Holdings Corp. | 72,200 | 454,070 | |||
| Mitsubishi Corp. | 5,200 | 112,336 | |||
| Mitsubishi UFJ Financial Group, Inc. | 112,100 | 656,305 | |||
| Mitsui Chemicals, Inc. | 34,000 | 157,213 | |||
| Mixi, Inc. | 3,300 | 114,947 | |||
| Mizuho Financial Group, Inc. | 252,000 | 446,267 | |||
| MS&AD Insurance Group Holdings, Inc. | 1,400 | 43,430 | |||
| Nippon Telegraph & Telephone Corp. | 12,600 | 509,375 | |||
| NSK Ltd. | 24,200 | 263,565 | |||
| NTT DOCOMO, Inc. | 24,100 | 552,759 | |||
| OKUMA Corp. | 8,000 | 69,997 | |||
| Oracle Corp. Japan | 1,300 | 64,770 | |||
| ORIX Corp. | 30,400 | 473,385 | |||
| Osaka Gas Co. Ltd. | 107,000 | 404,599 | |||
| Penta-Ocean Construction Co. Ltd. | 9,300 | 45,604 | |||
| SBI Holdings, Inc. | 22,700 | 284,134 | |||
| Sega Sammy Holdings, Inc. | 21,200 | 316,874 | |||
| Seiko Epson Corp. | 12,900 | 258,553 | |||
| Sompo Holdings, Inc. | 1,700 | 55,396 | |||
| Sumitomo Mitsui Financial Group, Inc. | 13,300 | 488,963 | |||
| Suzuki Motor Corp. | 7,800 | 250,898 | |||
| TonenGeneral Sekiyu KK | 3,000 | 28,556 | |||
| Toshiba Plant Systems & Services Corp. | 9,500 | 142,328 | |||
| Tosoh Corp. | 19,000 | 127,547 | |||
| Toyota Boshoku Corp. | 11,600 | 263,726 | |||
| Toyota Motor Corp. | 21,700 | 1,261,163 | |||
| Toyota Tsusho Corp. | 4,700 | 117,454 | |||
| TS Tech Co. Ltd. | 9,300 | 245,090 | |||
| 14,641,237 | |||||
| Netherlands — 2.5% | |||||
| BE Semiconductor Industries NV | 1,047 | 34,738 | |||
| ING Groep NV | 80,822 | 1,100,720 | |||
| Koninklijke Ahold Delhaize NV | 3,282 | 64,734 | |||
| NN Group NV | 5,057 | 162,558 | |||
| Unilever NV CVA | 3,228 | 129,578 | |||
| 1,492,328 | |||||
12
| Shares | Value | ||||
| New Zealand — 0.2% | |||||
| Meridian Energy Ltd. | 53,716 | $ | 97,767 | ||
| Norway — 0.8% | |||||
Subsea 7 SA(1) | 43,630 | 509,393 | |||
| Singapore — 0.8% | |||||
| Jardine Cycle & Carriage Ltd. | 7,604 | 212,998 | |||
| Mapletree Greater China Commercial Trust | 51,200 | 34,470 | |||
| StarHub Ltd. | 39,100 | 78,563 | |||
| United Overseas Bank Ltd. | 11,600 | 165,177 | |||
| 491,208 | |||||
| South Korea — 1.2% | |||||
| Hyosung Corp. | 1,193 | 141,848 | |||
| Hyundai Development Co-Engineering & Construction | 3,382 | 119,479 | |||
| Lotte Chemical Corp. | 350 | 96,253 | |||
| Samsung Electronics Co. Ltd. | 138 | 206,106 | |||
| SK Innovation Co. Ltd. | 1,216 | 158,624 | |||
| 722,310 | |||||
| Spain — 4.9% | |||||
| ACS Actividades de Construccion y Servicios SA | 7,691 | 226,484 | |||
| Banco Santander SA | 172,541 | 788,708 | |||
| Endesa SA | 25,089 | 518,649 | |||
Indra Sistemas SA(1) | 7,998 | 82,648 | |||
| Mapfre SA | 56,853 | 170,523 | |||
| Repsol SA | 32,666 | 436,225 | |||
| Telefonica SA | 83,193 | 692,327 | |||
| 2,915,564 | |||||
| Sweden — 1.2% | |||||
| Hufvudstaden AB, A Shares | 2,154 | 32,791 | |||
| Peab AB | 16,786 | 129,588 | |||
| Skanska AB, B Shares | 25,284 | 581,191 | |||
| 743,570 | |||||
| Switzerland — 3.2% | |||||
dormakaba Holding AG(1) | 110 | 79,468 | |||
| Nestle SA | 4,210 | 283,234 | |||
| Roche Holding AG | 2,330 | 519,535 | |||
| Swiss Re AG | 9,621 | 885,734 | |||
| UBS Group AG | 8,026 | 127,648 | |||
| 1,895,619 | |||||
| Taiwan — 0.9% | |||||
| China Life Insurance Co. Ltd. | 49,000 | 52,270 | |||
| Fubon Financial Holding Co. Ltd. | 48,000 | 74,471 | |||
| Lite-On Technology Corp. | 51,000 | 80,485 | |||
| Quanta Computer, Inc. | 91,000 | 169,592 | |||
| Taiwan Semiconductor Manufacturing Co. Ltd. ADR | 5,900 | 175,171 | |||
| 551,989 | |||||
| United Kingdom — 19.7% | |||||
| 3i Group plc | 14,149 | 121,975 | |||
| AA plc | 24,267 | 80,674 | |||
Anglo American plc(1) | 20,108 | 298,136 | |||
| AstraZeneca plc | 5,895 | 306,060 | |||
| BHP Billiton plc | 22,697 | 373,014 | |||
13
| Shares | Value | ||||
| BP plc | 138,156 | $ | 794,209 | ||
| Capita plc | 7,522 | 49,363 | |||
| Centamin plc | 35,940 | 58,414 | |||
| Centrica plc | 199,551 | 525,073 | |||
Evraz plc(1) | 104,266 | 312,837 | |||
| GlaxoSmithKline plc | 76,206 | 1,425,943 | |||
Glencore plc(1) | 117,691 | 411,283 | |||
| Go-Ahead Group plc | 3,476 | 90,419 | |||
| HSBC Holdings plc | 266,399 | 2,117,238 | |||
| Imperial Brands plc | 9,175 | 394,100 | |||
| Indivior plc | 11,084 | 44,739 | |||
| Investec plc | 65,491 | 426,100 | |||
| Legal & General Group plc | 37,062 | 109,345 | |||
| Man Group plc | 23,410 | 33,216 | |||
| Marks & Spencer Group plc | 41,165 | 169,299 | |||
| Petrofac Ltd. | 19,145 | 190,316 | |||
| Rio Tinto plc | 24,548 | 918,362 | |||
| Royal Dutch Shell plc, B Shares | 72,228 | 1,914,523 | |||
| Royal Mail plc | 70,811 | 415,174 | |||
| Vodafone Group plc | 74,776 | 181,412 | |||
| 11,761,224 | |||||
TOTAL COMMON STOCKS (Cost $61,714,889) | 57,814,565 | ||||
| EXCHANGE-TRADED FUNDS — 1.2% | |||||
| iShares MSCI Japan ETF | 6,183 | 308,470 | |||
| iShares MSCI EAFE ETF | 4,000 | 227,160 | |||
| iShares MSCI EAFE Value ETF | 4,000 | 183,800 | |||
TOTAL EXCHANGE-TRADED FUNDS (Cost $694,298) | 719,430 | ||||
| TEMPORARY CASH INVESTMENTS — 3.2% | |||||
| Repurchase Agreement, Fixed Income Clearing Corp., (collateralized by various U.S. Treasury obligations, 2.875%, 8/15/45, valued at $1,976,127), at 0.08%, dated 11/30/16, due 12/1/16 (Delivery value $1,937,004) | 1,937,000 | ||||
| State Street Institutional U.S. Government Money Market Fund, Premier Class | 813 | 813 | |||
TOTAL TEMPORARY CASH INVESTMENTS (Cost $1,937,813) | 1,937,813 | ||||
TOTAL INVESTMENT SECURITIES — 101.2% (Cost $64,347,000) | 60,471,808 | ||||
| OTHER ASSETS AND LIABILITIES — (1.2)% | (732,934 | ) | |||
| TOTAL NET ASSETS — 100.0% | $ | 59,738,874 | |||
14
| MARKET SECTOR DIVERSIFICATION | ||
| (as a % of net assets) | ||
| Financials | 31.4 | % |
| Consumer Discretionary | 11.3 | % |
| Industrials | 10.9 | % |
| Energy | 9.5 | % |
| Materials | 9.3 | % |
| Utilities | 5.6 | % |
| Health Care | 5.3 | % |
| Telecommunication Services | 4.9 | % |
| Real Estate | 3.0 | % |
| Information Technology | 2.8 | % |
| Consumer Staples | 2.8 | % |
| Exchange-Traded Funds | 1.2 | % |
| Cash and Equivalents* | 2.0 | % |
*Includes temporary cash investments and other assets and liabilities.
| NOTES TO SCHEDULE OF INVESTMENTS | ||
| ADR | - | American Depositary Receipt |
| CVA | - | Certificaten Van Aandelen |
| (1) | Non-income producing. |
See Notes to Financial Statements.
15
| Statement of Assets and Liabilities |
| NOVEMBER 30, 2016 | |||
| Assets | |||
| Investment securities, at value (cost of $64,347,000) | $ | 60,471,808 | |
| Foreign currency holdings, at value (cost of $64,412) | 63,680 | ||
| Receivable for investments sold | 52,681 | ||
| Receivable for capital shares sold | 107,707 | ||
| Dividends and interest receivable | 337,876 | ||
| 61,033,752 | |||
| Liabilities | |||
| Payable for investments purchased | 1,183,548 | ||
| Payable for capital shares redeemed | 51,108 | ||
| Accrued management fees | 54,694 | ||
| Distribution and service fees payable | 5,528 | ||
| 1,294,878 | |||
| Net Assets | $ | 59,738,874 | |
| Net Assets Consist of: | |||
| Capital (par value and paid-in surplus) | $ | 72,038,837 | |
| Undistributed net investment income | 1,985,809 | ||
| Accumulated net realized loss | (10,391,068 | ) | |
| Net unrealized depreciation | (3,894,704 | ) | |
| $ | 59,738,874 | ||
| Net Assets | Shares Outstanding | Net Asset Value Per Share | ||||
| Investor Class, $0.01 Par Value | $13,809,793 | 1,867,119 | $7.40 | |||
| Institutional Class, $0.01 Par Value | $7,299,870 | 985,732 | $7.41 | |||
| A Class, $0.01 Par Value | $11,029,143 | 1,487,976 | $7.41* | |||
| C Class, $0.01 Par Value | $3,774,401 | 515,075 | $7.33 | |||
| R Class, $0.01 Par Value | $447,704 | 60,825 | $7.36 | |||
| R6 Class, $0.01 Par Value | $23,377,963 | 3,152,098 | $7.42 | |||
*Maximum offering price $7.86 (net asset value divided by 0.9425).
See Notes to Financial Statements.
16
| Statement of Operations |
| YEAR ENDED NOVEMBER 30, 2016 | |||
| Investment Income (Loss) | |||
| Income: | |||
| Dividends (net of foreign taxes withheld of $217,534) | $ | 2,799,925 | |
| Interest | 543 | ||
| 2,800,468 | |||
| Expenses: | |||
| Management fees | 762,853 | ||
| Distribution and service fees: | |||
| A Class | 30,779 | ||
| C Class | 35,515 | ||
| R Class | 1,742 | ||
| Directors' fees and expenses | 2,286 | ||
| Other expenses | 5,842 | ||
| 839,017 | |||
| Net investment income (loss) | 1,961,451 | ||
| Realized and Unrealized Gain (Loss) | |||
| Net realized gain (loss) on: | |||
| Investment transactions | (4,124,932 | ) | |
| Foreign currency transactions | (9,344 | ) | |
| (4,134,276 | ) | ||
| Change in net unrealized appreciation (depreciation) on: | |||
| Investments | (576,282 | ) | |
| Translation of assets and liabilities in foreign currencies | (10,984 | ) | |
| (587,266 | ) | ||
| Net realized and unrealized gain (loss) | (4,721,542 | ) | |
| Net Increase (Decrease) in Net Assets Resulting from Operations | $ | (2,760,091 | ) |
See Notes to Financial Statements.
17
| Statement of Changes in Net Assets |
| YEARS ENDED NOVEMBER 30, 2016 AND NOVEMBER 30, 2015 | ||||||
| Increase (Decrease) in Net Assets | November 30, 2016 | November 30, 2015 | ||||
| Operations | ||||||
| Net investment income (loss) | $ | 1,961,451 | $ | 1,870,284 | ||
| Net realized gain (loss) | (4,134,276 | ) | (3,498,434 | ) | ||
| Change in net unrealized appreciation (depreciation) | (587,266 | ) | (6,227,011 | ) | ||
| Net increase (decrease) in net assets resulting from operations | (2,760,091 | ) | (7,855,161 | ) | ||
| Distributions to Shareholders | ||||||
| From net investment income: | ||||||
| Investor Class | (460,998 | ) | (717,239 | ) | ||
| Institutional Class | (145,691 | ) | (39,683 | ) | ||
| A Class | (329,220 | ) | (541,676 | ) | ||
| C Class | (57,981 | ) | (67,359 | ) | ||
| R Class | (7,725 | ) | (15,630 | ) | ||
| R6 Class | (823,525 | ) | (84,394 | ) | ||
| Decrease in net assets from distributions | (1,825,140 | ) | (1,465,981 | ) | ||
| Capital Share Transactions | ||||||
| Net increase (decrease) in net assets from capital share transactions (Note 5) | (14,577,219 | ) | 49,861,719 | |||
| Redemption Fees | ||||||
| Increase in net assets from redemption fees | 12,179 | 1,235 | ||||
| Net increase (decrease) in net assets | (19,150,271 | ) | 40,541,812 | |||
| Net Assets | ||||||
| Beginning of period | 78,889,145 | 38,347,333 | ||||
| End of period | $ | 59,738,874 | $ | 78,889,145 | ||
| Undistributed net investment income | $ | 1,985,809 | $ | 1,719,770 | ||
See Notes to Financial Statements.
18
| Notes to Financial Statements |
NOVEMBER 30, 2016
1. Organization
American Century World Mutual Funds, Inc. (the corporation) is registered under the Investment Company Act of 1940, as amended (the 1940 Act), as an open-end management investment company and is organized as a Maryland corporation. International Value Fund (the fund) is one fund in a series issued by the corporation. The fund's investment objective is to seek long-term capital growth.
The fund offers the Investor Class, the Institutional Class, the A Class, the C Class, the R Class and the R6 Class. The A Class may incur an initial sales charge. The A Class and C Class may be subject to a contingent deferred sales charge. The share classes differ principally in their respective sales charges and distribution and shareholder servicing expenses and arrangements. The Institutional Class and R6 Class shareholders do not require the same level of shareholder and administrative services from American Century Investment Management, Inc. (ACIM) (the investment advisor) as shareholders of other classes. In addition, financial intermediaries do not receive any fees for the R6 Class. As a result, the Institutional Class and R6 Class are charged lower unified management fees.
2. Significant Accounting Policies
The following is a summary of significant accounting policies consistently followed by the fund in preparation of its financial statements. The fund is an investment company and follows accounting and reporting guidance in accordance with accounting principles generally accepted in the United States of America. This may require management to make certain estimates and assumptions at the date of the financial statements. Actual results could differ from these estimates. Management evaluated the impact of events or transactions occurring through the date the financial statements were issued that would merit recognition or disclosure.
Investment Valuations — The fund determines the fair value of its investments and computes its net asset value per share at the close of regular trading (usually 4 p.m. Eastern time) on the New York Stock Exchange (NYSE) on each day the NYSE is open. The Board of Directors has adopted valuation policies and procedures to guide the investment advisor in the fund’s investment valuation process and to provide methodologies for the oversight of the fund’s pricing function.
Equity securities that are listed or traded on a domestic securities exchange are valued at the last reported sales price or at the official closing price as provided by the exchange. Equity securities traded on foreign securities exchanges are generally valued at the closing price of such securities on the exchange where primarily traded or at the close of the NYSE, if that is earlier. If no last sales price is reported, or if local convention or regulation so provides, the mean of the latest bid and asked prices may be used. Securities traded over-the-counter are valued at the mean of the latest bid and asked prices, the last sales price, or the official closing price. Equity securities initially expressed in local currencies are translated into U.S. dollars at the mean of the appropriate currency exchange rate at the close of the NYSE as provided by an independent pricing service.
Open-end management investment companies are valued at the reported net asset value per share. Repurchase agreements are valued at cost, which approximates fair value.
If the fund determines that the market price for an investment is not readily available or the valuation methods mentioned above do not reflect an investment’s fair value, such investment is valued as determined in good faith by the Board of Directors or its delegate, in accordance with policies and procedures adopted by the Board of Directors. In its determination of fair value, the fund may review several factors including, but not limited to, market information regarding the specific investment or comparable investments and correlation with other investment types, futures indices or general market indicators. Circumstances that may cause the fund to use these procedures to value an investment include, but are not limited to: an investment has been declared in default or is distressed; trading in a security has been suspended during the trading day or a security is not actively trading on its principal exchange; prices received from a regular pricing source are deemed unreliable; or there is a foreign market holiday and no trading occurred.
19
The fund monitors for significant events occurring after the close of an investment’s primary exchange but before the fund’s net asset value per share is determined. Significant events may include, but are not limited to: corporate announcements and transactions; governmental action and political unrest that could impact a specific investment or an investment sector; or armed conflicts, natural disasters and similar events that could affect investments in a specific country or region. The fund also monitors for significant fluctuations between domestic and foreign markets, as evidenced by the U.S. market or such other indicators that the Board of Directors, or its delegate, deems appropriate. If significant fluctuations in foreign markets are identified, the fund may apply a model-derived factor to the closing price of equity securities traded on foreign securities exchanges. The factor is based on observable market data as provided by an independent pricing service.
Security Transactions — Security transactions are accounted for as of the trade date. Net realized gains and losses are determined on the identified cost basis, which is also used for federal income tax purposes.
Investment Income — Dividend income less foreign taxes withheld, if any, is recorded as of the ex-dividend date. Distributions received on securities that represent a return of capital or long-term capital gain are recorded as a reduction of cost of investments and/or as a realized gain. The fund may estimate the components of distributions received that may be considered nontaxable distributions or long-term capital gain distributions for income tax purposes. Interest income is recorded on the accrual basis and includes accretion of discounts and amortization of premiums.
Foreign Currency Translations — All assets and liabilities initially expressed in foreign currencies are translated into U.S. dollars at prevailing exchange rates at period end. The fund may enter into spot foreign currency exchange contracts to facilitate transactions denominated in a foreign currency. Purchases and sales of investment securities, dividend and interest income, spot foreign currency exchange contracts, and expenses are translated at the rates of exchange prevailing on the respective dates of such transactions. Net realized and unrealized foreign currency exchange gains or losses related to investment securities are a component of net realized gain (loss) on investment transactions and change in net unrealized appreciation (depreciation) on investments, respectively.
Repurchase Agreements — The fund may enter into repurchase agreements with institutions that ACIM has determined are creditworthy pursuant to criteria adopted by the Board of Directors. The fund requires that the collateral, represented by securities, received in a repurchase transaction be transferred to the custodian in a manner sufficient to enable the fund to obtain those securities in the event of a default under the repurchase agreement. ACIM monitors, on a daily basis, the securities transferred to ensure the value, including accrued interest, of the securities under each repurchase agreement is equal to or greater than amounts owed to the fund under each repurchase agreement.
Joint Trading Account — Pursuant to an Exemptive Order issued by the Securities and Exchange Commission, the fund, along with certain other funds in the American Century Investments family of funds, may transfer uninvested cash balances into a joint trading account. These balances are invested in one or more repurchase agreements that are collateralized by U.S. Treasury or Agency obligations.
Income Tax Status — It is the fund’s policy to distribute substantially all net investment income and net realized gains to shareholders and to otherwise qualify as a regulated investment company under provisions of the Internal Revenue Code. Accordingly, no provision has been made for income taxes. The fund files U.S. federal, state, local and non-U.S. tax returns as applicable. The fund's tax returns are subject to examination by the relevant taxing authority until expiration of the applicable statute of limitations, which is generally three years from the date of filing but can be longer in certain jurisdictions. At this time, management believes there are no uncertain tax positions which, based on their technical merit, would not be sustained upon examination and for which it is reasonably possible that the total amounts of unrecognized tax benefits will significantly change in the next twelve months.
Multiple Class — All shares of the fund represent an equal pro rata interest in the net assets of the class to which such shares belong, and have identical voting, dividend, liquidation and other rights and the same terms and conditions, except for class specific expenses and exclusive rights to vote on matters affecting only individual classes. Income, non-class specific expenses, and realized and unrealized capital gains and losses of the fund are allocated to each class of shares based on their relative net assets.
Distributions to Shareholders — Distributions from net investment income and net realized gains, if any, are generally declared and paid annually. The fund may make distributions on a more frequent basis to comply with the distribution requirements of the Internal Revenue Code, in all events in a manner consistent with provisions of the 1940 Act.
20
Redemption Fees — The fund may impose a 2.00% redemption fee on shares held less than 60 days. The fee may not be applicable to all classes. The redemption fee is retained by the fund and helps cover transaction costs that long-term investors may bear when the fund sells securities to meet investor redemptions.
Indemnifications — Under the corporation’s organizational documents, its officers and directors are indemnified against certain liabilities arising out of the performance of their duties to the fund. In addition, in the normal course of business, the fund enters into contracts that provide general indemnifications. The maximum exposure under these arrangements is unknown as this would involve future claims that may be made against a fund. The risk of material loss from such claims is considered by management to be remote.
3. Fees and Transactions with Related Parties
Certain officers and directors of the corporation are also officers and/or directors of American Century Companies, Inc. (ACC). The corporation’s investment advisor, ACIM, the corporation's distributor, American Century Investment Services, Inc. (ACIS), and the corporation’s transfer agent, American Century Services, LLC, are wholly owned, directly or indirectly, by ACC. Various funds issued by American Century Strategic Asset Allocations, Inc. own, in aggregate, 7% of the shares of the fund.
Management Fees — The corporation has entered into a management agreement with ACIM, under which ACIM provides the fund with investment advisory and management services in exchange for a single, unified management fee (the fee) per class. The agreement provides that all expenses of managing and operating the fund, except distribution and service fees, brokerage expenses, taxes, interest, fees and expenses of the independent directors (including legal counsel fees), and extraordinary expenses, will be paid by ACIM. The fee is computed and accrued daily based on each class’s daily net assets and paid monthly in arrears. The rate of the fee is determined by applying a fee rate calculation formula. This formula takes into account the fund’s assets as well as certain assets, if any, of other clients of the investment advisor outside the American Century Investments family of funds (such as subadvised funds and separate accounts) that have very similar investment teams and investment strategies (strategy assets). The strategy assets of the fund also include the assets of NT International Value Fund, one fund in a series issued by the corporation. The annual management fee schedule ranges from 1.100% to 1.300% for the Investor Class, A Class, C Class and R Class. The annual management fee schedule ranges from 0.900% to 1.100% for the Institutional Class and 0.750% to 0.950% for the R6 Class. The effective annual management fee for each class for the year ended November 30, 2016 was 1.30% for the Investor Class, A Class, C Class and R Class, 1.10% for the Institutional Class and 0.95% for the R6 Class.
Distribution and Service Fees — The Board of Directors has adopted a separate Master Distribution and Individual Shareholder Services Plan for each of the A Class, C Class and R Class (collectively the plans), pursuant to Rule 12b-1 of the 1940 Act. The plans provide that the A Class will pay ACIS an annual distribution and service fee of 0.25%. The plans provide that the C Class will pay ACIS an annual distribution and service fee of 1.00%, of which 0.25% is paid for individual shareholder services and 0.75% is paid for distribution services. The plans provide that the R Class will pay ACIS an annual distribution and service fee of 0.50%. The fees are computed and accrued daily based on each class’s daily net assets and paid monthly in arrears. The fees are used to pay financial intermediaries for distribution and individual shareholder services. Fees incurred under the plans during the year ended November 30, 2016 are detailed in the Statement of Operations.
Directors' Fees and Expenses — The Board of Directors is responsible for overseeing the investment advisor’s management and operations of the fund. The directors receive detailed information about the fund and its investment advisor regularly throughout the year, and meet at least quarterly with management of the investment advisor to review reports about fund operations. The fund’s officers do not receive compensation from the fund.
Acquired Fund Fees and Expenses — The fund may invest in mutual funds, exchange-traded funds, and business development companies (the acquired funds). The fund will indirectly realize its pro rata share of the
fees and expenses of the acquired funds in which it invests. These indirect fees and expenses are not paid out of the fund's assets but are reflected in the return realized by the fund on its investment in the acquired funds.
Interfund Transactions — The fund may enter into security transactions with other American Century Investments funds and other client accounts of the investment advisor, in accordance with the 1940 Act rules and procedures adopted by the Board of Directors. The rules and procedures require, among other things, that these transactions be effected at the independent current market price of the security. There were no interfund transactions during the period.
21
4. Investment Transactions
Purchases and sales of investment securities, excluding short-term investments, for the year ended November 30, 2016 were $51,112,842 and $66,373,670, respectively.
5. Capital Share Transactions
Transactions in shares of the fund were as follows:
| Year ended November 30, 2016 | Year ended November 30, 2015 | |||||||||
| Shares | Amount | Shares | Amount | |||||||
| Investor Class/Shares Authorized | 40,000,000 | 40,000,000 | ||||||||
| Sold | 401,530 | $ | 2,846,272 | 1,194,072 | $ | 10,050,047 | ||||
| Issued in reinvestment of distributions | 60,843 | 452,063 | 85,418 | 699,499 | ||||||
| Redeemed | (1,269,793 | ) | (9,218,798 | ) | (745,377 | ) | (6,071,118 | ) | ||
| (807,420 | ) | (5,920,463 | ) | 534,113 | 4,678,428 | |||||
| Institutional Class/Shares Authorized | 40,000,000 | 40,000,000 | ||||||||
| Sold | 781,879 | 5,594,122 | 2,680,128 | 23,061,474 | ||||||
| Issued in reinvestment of distributions | 19,608 | 145,691 | 4,791 | 39,683 | ||||||
| Redeemed | (810,595 | ) | (5,951,079 | ) | (1,747,655 | ) | (14,212,748 | ) | ||
| (9,108 | ) | (211,266 | ) | 937,264 | 8,888,409 | |||||
| A Class/Shares Authorized | 30,000,000 | 30,000,000 | ||||||||
| Sold | 213,147 | 1,608,740 | 591,514 | 5,007,397 | ||||||
| Issued in reinvestment of distributions | 43,886 | 327,831 | 65,172 | 536,132 | ||||||
| Redeemed | (659,017 | ) | (4,756,597 | ) | (493,915 | ) | (4,062,546 | ) | ||
| (401,984 | ) | (2,820,026 | ) | 162,771 | 1,480,983 | |||||
| C Class/Shares Authorized | 30,000,000 | 30,000,000 | ||||||||
| Sold | 104,947 | 761,997 | 214,569 | 1,747,541 | ||||||
| Issued in reinvestment of distributions | 7,683 | 57,085 | 8,092 | 66,273 | ||||||
| Redeemed | (47,991 | ) | (345,801 | ) | (32,269 | ) | (262,759 | ) | ||
| 64,639 | 473,281 | 190,392 | 1,551,055 | |||||||
| R Class/Shares Authorized | 30,000,000 | 20,000,000 | ||||||||
| Sold | 49,496 | 360,384 | 14,753 | 122,942 | ||||||
| Issued in reinvestment of distributions | 1,035 | 7,694 | 1,903 | 15,570 | ||||||
| Redeemed | (39,342 | ) | (286,029 | ) | (20,984 | ) | (160,604 | ) | ||
| 11,189 | 82,049 | (4,328 | ) | (22,092 | ) | |||||
| R6 Class/Shares Authorized | 40,000,000 | 30,000,000 | ||||||||
| Sold | 1,603,014 | 11,465,579 | 4,631,460 | 38,859,690 | ||||||
| Issued in reinvestment of distributions | 110,838 | 823,525 | 10,298 | 84,394 | ||||||
| Redeemed | (2,565,732 | ) | (18,469,898 | ) | (700,758 | ) | (5,659,148 | ) | ||
| (851,880 | ) | (6,180,794 | ) | 3,941,000 | 33,284,936 | |||||
| Net increase (decrease) | (1,994,564 | ) | $ | (14,577,219 | ) | 5,761,212 | $ | 49,861,719 | ||
22
6. Fair Value Measurements
The fund’s investments valuation process is based on several considerations and may use multiple inputs to determine the fair value of the investments held by the fund. In conformity with accounting principles generally accepted in the United States of America, the inputs used to determine a valuation are classified into three broad levels.
| • | Level 1 valuation inputs consist of unadjusted quoted prices in an active market for identical investments. |
| • | Level 2 valuation inputs consist of direct or indirect observable market data (including quoted prices for comparable investments, evaluations of subsequent market events, interest rates, prepayment speeds, credit risk, etc.). These inputs also consist of quoted prices for identical investments initially expressed in local currencies that are adjusted through translation into U.S. dollars. |
| • | Level 3 valuation inputs consist of unobservable data (including a fund’s own assumptions). |
The level classification is based on the lowest level input that is significant to the fair valuation measurement. The valuation inputs are not necessarily an indication of the risks associated with investing in these securities or other financial instruments. There were no significant transfers between levels during the period.
The following is a summary of the level classifications as of period end. The Schedule of Investments provides additional information on the fund’s portfolio holdings.
| Level 1 | Level 2 | Level 3 | ||||||
| Assets | ||||||||
| Investment Securities | ||||||||
| Common Stocks | $ | 175,171 | $ | 57,639,394 | — | |||
| Exchange-Traded Funds | 719,430 | — | — | |||||
| Temporary Cash Investments | 813 | 1,937,000 | — | |||||
| $ | 895,414 | $ | 59,576,394 | — | ||||
7. Risk Factors
There are certain risks involved in investing in foreign securities. These risks include those resulting from future adverse political, social and economic developments, fluctuations in currency exchange rates, the possible imposition of exchange controls, and other foreign laws or restrictions. Investing in emerging markets may accentuate these risks.
The fund invests in common stocks of small companies. Because of this, the fund may be subject to greater risk and market fluctuations than a fund investing in larger, more established companies.
8. Federal Tax Information
On December 20, 2016, the fund declared and paid the following per-share distributions from net investment income to shareholders of record on December 19, 2016:
| Investor Class | Institutional Class | A Class | C Class | R Class | R6 Class |
| $0.0516 | $0.0668 | $0.0326 | — | $0.0137 | $0.0782 |
The tax character of distributions paid during the years ended November 30, 2016 and November 30, 2015 were as follows:
| 2016 | 2015 | |||||
| Distributions Paid From | ||||||
| Ordinary income | $ | 1,825,140 | $ | 1,465,981 | ||
| Long-term capital gains | — | — | ||||
The book-basis character of distributions made during the year from net investment income or net realized gains may differ from their ultimate characterization for federal income tax purposes. These differences reflect the differing character of certain income items and net realized gains and losses for financial statement and tax purposes, and may result in reclassification among certain capital accounts on the financial statements.
23
As of November 30, 2016, the federal tax cost of investments and the components of distributable earnings on a tax-basis were as follows:
| Federal tax cost of investments | $ | 64,447,254 | |
| Gross tax appreciation of investments | $ | 2,325,740 | |
| Gross tax depreciation of investments | (6,301,186 | ) | |
| Net tax appreciation (depreciation) of investments | (3,975,446 | ) | |
| Net tax appreciation (depreciation) on translation of assets and liabilities in foreign currencies | (17,088 | ) | |
| Net tax appreciation (depreciation) | $ | (3,992,534 | ) |
| Undistributed ordinary income | $ | 2,020,347 | |
| Accumulated short-term capital losses | $ | (8,530,912 | ) |
| Accumulated long-term capital losses | $ | (1,796,864 | ) |
The difference between book-basis and tax-basis unrealized appreciation (depreciation) is attributable primarily to the tax deferral of losses on wash sales.
Accumulated capital losses represent net capital loss carryovers that may be used to offset future realized capital gains for federal income tax purposes. Any unlimited losses will be required to be utilized prior to the losses which carry an expiration date. Future capital loss carryover utilization in any given year may be subject to Internal Revenue Code limitations. Capital loss carryovers of $(2,258,267) expire in 2017 and the remaining losses are unlimited.
9. Recently Issued Accounting Guidance
In October 2016, the Securities and Exchange Commission adopted new rules and forms as well as amendments to its rules and forms to modernize the reporting and disclosure of information by registered investment companies. The amendments to Regulation S-X will require standardized, enhanced disclosure about derivatives in investment company financial statements, as well as other provisions. Compliance with the amendments is effective on August 1, 2017. Management is currently evaluating the impact that adopting the amendments will have on the financial statement disclosures.
24
| Financial Highlights |
For a Share Outstanding Throughout the Years Ended November 30 (except as noted) | |||||||||||||
Per-Share Data | Ratios and Supplemental Data | ||||||||||||
Income From Investment Operations: | Ratio to Average Net Assets of: | ||||||||||||
Net Asset Value, Beginning of Period | Net Investment Income (Loss)(1) | Net Realized and Unrealized Gain (Loss) | Total From Investment Operations | Distributions From Net Investment Income | Net Asset Value, End of Period | Total Return(2) | Operating Expenses | Net Investment Income (Loss) | Portfolio Turnover Rate | Net Assets, End of Period (in thousands) | |||
| Investor Class | |||||||||||||
| 2016 | $7.83 | 0.20 | (0.45) | (0.25) | (0.18) | $7.40 | (3.15)% | 1.31% | 2.86% | 76% | $13,810 | ||
| 2015 | $8.91 | 0.22 | (0.97) | (0.75) | (0.33) | $7.83 | (8.56)% | 1.31% | 2.70% | 77% | $20,945 | ||
| 2014 | $8.97 | 0.32 | (0.19) | 0.13 | (0.19) | $8.91 | 1.38% | 1.30% | 3.55% | 89% | $19,068 | ||
| 2013 | $7.40 | 0.21 | 1.60 | 1.81 | (0.24) | $8.97 | 24.96% | 1.31% | 2.63% | 83% | $17,920 | ||
| 2012 | $6.84 | 0.20 | 0.49 | 0.69 | (0.13) | $7.40 | 10.25% | 1.31% | 2.95% | 125% | $10,423 | ||
Institutional Class | |||||||||||||
| 2016 | $7.84 | 0.22 | (0.45) | (0.23) | (0.20) | $7.41 | (2.99)% | 1.11% | 3.06% | 76% | $7,300 | ||
| 2015 | $8.92 | 0.28 | (1.01) | (0.73) | (0.35) | $7.84 | (8.37)% | 1.11% | 2.90% | 77% | $7,798 | ||
| 2014 | $8.96 | 0.38 | (0.23) | 0.15 | (0.19) | $8.92 | 1.67% | 1.10% | 3.75% | 89% | $513 | ||
| 2013 | $7.39 | 0.23 | 1.59 | 1.82 | (0.25) | $8.96 | 25.24% | 1.11% | 2.83% | 83% | $769 | ||
| 2012 | $6.84 | 0.23 | 0.47 | 0.70 | (0.15) | $7.39 | 10.33% | 1.11% | 3.15% | 125% | $235 | ||
A Class | |||||||||||||
| 2016 | $7.85 | 0.18 | (0.45) | (0.27) | (0.17) | $7.41 | (3.46)% | 1.56% | 2.61% | 76% | $11,029 | ||
| 2015 | $8.93 | 0.20 | (0.97) | (0.77) | (0.31) | $7.85 | (8.77)% | 1.56% | 2.45% | 77% | $14,838 | ||
| 2014 | $9.01 | 0.30 | (0.20) | 0.10 | (0.18) | $8.93 | 1.08% | 1.55% | 3.30% | 89% | $15,423 | ||
| 2013 | $7.43 | 0.20 | 1.60 | 1.80 | (0.22) | $9.01 | 24.67% | 1.56% | 2.38% | 83% | $15,554 | ||
| 2012 | $6.87 | 0.19 | 0.48 | 0.67 | (0.11) | $7.43 | 9.91% | 1.56% | 2.70% | 125% | $14,155 | ||
For a Share Outstanding Throughout the Years Ended November 30 (except as noted) | |||||||||||||
Per-Share Data | Ratios and Supplemental Data | ||||||||||||
Income From Investment Operations: | Ratio to Average Net Assets of: | ||||||||||||
Net Asset Value, Beginning of Period | Net Investment Income (Loss)(1) | Net Realized and Unrealized Gain (Loss) | Total From Investment Operations | Distributions From Net Investment Income | Net Asset Value, End of Period | Total Return(2) | Operating Expenses | Net Investment Income (Loss) | Portfolio Turnover Rate | Net Assets, End of Period (in thousands) | |||
C Class | |||||||||||||
| 2016 | $7.78 | 0.13 | (0.46) | (0.33) | (0.12) | $7.33 | (4.21)% | 2.31% | 1.86% | 76% | $3,774 | ||
| 2015 | $8.85 | 0.13 | (0.95) | (0.82) | (0.25) | $7.78 | (9.39)% | 2.31% | 1.70% | 77% | $3,502 | ||
| 2014 | $8.97 | 0.23 | (0.19) | 0.04 | (0.16) | $8.85 | 0.41% | 2.30% | 2.55% | 89% | $2,301 | ||
| 2013 | $7.40 | 0.14 | 1.59 | 1.73 | (0.16) | $8.97 | 23.68% | 2.31% | 1.63% | 83% | $2,009 | ||
| 2012 | $6.84 | 0.13 | 0.49 | 0.62 | (0.06) | $7.40 | 9.10% | 2.31% | 1.95% | 125% | $1,412 | ||
R Class | |||||||||||||
| 2016 | $7.80 | 0.18 | (0.47) | (0.29) | (0.15) | $7.36 | (3.68)% | 1.81% | 2.36% | 76% | $448 | ||
| 2015 | $8.87 | 0.18 | (0.96) | (0.78) | (0.29) | $7.80 | (8.95)% | 1.81% | 2.20% | 77% | $387 | ||
| 2014 | $8.97 | 0.28 | (0.21) | 0.07 | (0.17) | $8.87 | 0.78% | 1.80% | 3.05% | 89% | $479 | ||
| 2013 | $7.40 | 0.18 | 1.59 | 1.77 | (0.20) | $8.97 | 24.32% | 1.81% | 2.13% | 83% | $297 | ||
| 2012 | $6.84 | 0.17 | 0.49 | 0.66 | (0.10) | $7.40 | 9.67% | 1.81% | 2.45% | 125% | $283 | ||
| R6 Class | |||||||||||||
| 2016 | $7.85 | 0.23 | (0.45) | (0.22) | (0.21) | $7.42 | (2.87)% | 0.96% | 3.21% | 76% | $23,378 | ||
| 2015 | $8.93 | 0.23 | (0.95) | (0.72) | (0.36) | $7.85 | (8.22)% | 0.96% | 3.05% | 77% | $31,418 | ||
| 2014 | $8.96 | 0.33 | (0.17) | 0.16 | (0.19) | $8.93 | 1.83% | 0.95% | 3.90% | 89% | $562 | ||
2013(3) | $8.21 | 0.06 | 0.69 | 0.75 | — | $8.96 | 9.14% | 0.96%(4) | 2.02%(4) | 83%(5) | $27 | ||
| Notes to Financial Highlights |
| (1) | Computed using average shares outstanding throughout the period. |
| (2) | Total returns are calculated based on the net asset value of the last business day and do not reflect applicable sales charges, if any. Total returns for periods less than one year are not annualized. |
| (3) | July 26, 2013 (commencement of sale) through November 30, 2013. |
| (4) | Annualized. |
| (5) | Portfolio turnover is calculated at the fund level. Percentage indicated was calculated for the year ended November 30, 2013. |
See Notes to Financial Statements.
| Report of Independent Registered Public Accounting Firm |
To the Board of Directors and Shareholders of American Century World Mutual Funds, Inc.:
We have audited the accompanying statement of assets and liabilities, including the schedule of investments, of International Value Fund (the “Fund”), one of the funds constituting American Century World Mutual Funds, Inc., as of November 30, 2016, and the related statement of operations for the year then ended, the statements of changes in net assets for each of the two years in the period then ended, and the financial highlights for each of the periods presented. These financial statements and financial highlights are the responsibility of the Fund’s management. Our responsibility is to express an opinion on these financial statements and financial highlights based on our audits.
We conducted our audits in accordance with the standards of the Public Company Accounting Oversight Board (United States). Those standards require that we plan and perform the audit to obtain reasonable assurance about whether the financial statements and financial highlights are free of material misstatement. The Fund is not required to have, nor were we engaged to perform, an audit of its internal control over financial reporting. Our audits included consideration of internal control over financial reporting as a basis for designing audit procedures that are appropriate in the circumstances, but not for the purpose of expressing an opinion on the effectiveness of the Fund’s internal control over financial reporting. Accordingly, we express no such opinion. An audit also includes examining, on a test basis, evidence supporting the amounts and disclosures in the financial statements, assessing the accounting principles used and significant estimates made by management, as well as evaluating the overall financial statement presentation. Our procedures included confirmation of securities owned as of November 30, 2016, by correspondence with the custodian and brokers; when replies were not received from brokers, we performed other auditing procedures. We believe that our audits provide a reasonable basis for our opinion.
In our opinion, the financial statements and financial highlights referred to above present fairly, in all material respects, the financial position of International Value Fund of American Century World Mutual Funds, Inc. as of November 30, 2016, the results of its operations for the year then ended, the changes in its net assets for each of the two years in the period then ended, and the financial highlights for each of the periods presented, in conformity with accounting principles generally accepted in the United States of America.
DELOITTE & TOUCHE LLP
Kansas City, Missouri
January 17, 2017
28
| Management |
The Board of Directors
The individuals listed below serve as directors of the funds. Each director will continue to serve in this capacity until death, retirement, resignation or removal from office. The board has adopted a mandatory retirement age for directors who are not “interested persons,” as that term is defined in the Investment Company Act (independent directors). Independent directors shall retire by December 31 of the year in which they reach their 75th birthday.
Mr. Thomas is an “interested person” because he currently serves as President and Chief Executive Officer of American Century Companies, Inc. (ACC), the parent company of American Century Investment Management, Inc. (ACIM or the advisor). The other directors (more than three-fourths of the total number) are independent. They are not employees, directors or officers of, and have no financial interest in, ACC or any of its wholly owned, direct or indirect, subsidiaries, including ACIM, American Century Investment Services, Inc. (ACIS) and American Century Services, LLC (ACS), and they do not have any other affiliations, positions or relationships that would cause them to be considered “interested persons” under the Investment Company Act. The directors serve in this capacity for seven (in the case of Mr. Thomas, 15) registered investment companies in the American Century Investments family of funds.
The following table presents additional information about the directors. The mailing address for each director is 4500 Main Street, Kansas City, Missouri 64111.
| Name (Year of Birth) | Position(s) Held with Funds | Length of Time Served | Principal Occupation(s) During Past 5 Years | Number of American Century Portfolios Overseen by Director | Other Directorships Held During Past 5 Years |
| Independent Directors | |||||
| Barry Fink (1955) | Director | Since 2012 | Retired; Executive Vice President, ACC (September 2007 to February 2013); President, ACS (October 2007 to February 2013); Chief Operating Officer, ACC (September 2007 to November 2012) | 81 | None |
| Andrea C. Hall (1945) | Director | Since 1997 | Retired | 81 | None |
| Jan M. Lewis (1957) | Director | Since 2011 | Retired; President and Chief Executive Officer, Catholic Charities of Northeast Kansas (human services organization) (2006 to 2013) | 81 | None |
| James A. Olson (1942) | Director and Chairman of the Board | Since 2007 (Chairman since 2014) | Member, Plaza Belmont LLC (private equity fund manager) (1999 to present) | 81 | Saia, Inc. (2002 to 2012) and EPR Properties (2003 to 2013) |
| M. Jeannine Strandjord (1945) | Director | Since 1994 | Retired | 81 | Euronet Worldwide Inc.; MGP Ingredients, Inc.; and DST Systems Inc. (1996 to 2012) |
29
| Name (Year of Birth) | Position(s) Held with Funds | Length of Time Served | Principal Occupation(s) During Past 5 Years | Number of American Century Portfolios Overseen by Director | Other Directorships Held During Past 5 Years |
| Independent Directors | |||||
| John R. Whitten (1946) | Director | Since 2008 | Retired | 81 | Rudolph Technologies, Inc. |
| Stephen E. Yates (1948) | Director | Since 2012 | Retired | 81 | None |
| Interested Director | |||||
| Jonathan S. Thomas (1963) | Director and President | Since 2007 | President and Chief Executive Officer, ACC (March 2007 to present). Also serves as Chief Executive Officer, ACS; Executive Vice President, ACIM; Director, ACC, ACIM and other ACC subsidiaries | 126 | BioMed Valley Discoveries, Inc. |
The Statement of Additional Information has additional information about the fund's directors and is available without charge, upon request, by calling 1-800-345-2021.
30
Officers
The following table presents certain information about the executive officers of the funds. Each officer serves as an officer for each of the 15 investment companies in the American Century family of funds, unless otherwise noted. No officer is compensated for his or her service as an officer of the funds. The listed officers are interested persons of the funds and are appointed or re-appointed on an annual basis. The mailing address for each officer listed below is 4500 Main Street, Kansas City, Missouri 64111.
| Name (Year of Birth) | Offices with the Funds | Principal Occupation(s) During the Past Five Years |
| Jonathan S. Thomas (1963) | Director and President since 2007 | President and Chief Executive Officer, ACC (March 2007 to present). Also serves as Chief Executive Officer, ACS; Executive Vice President, ACIM; Director, ACC, ACIM and other ACC subsidiaries |
| Amy D. Shelton (1964) | Chief Compliance Officer and Vice President since 2014 | Chief Compliance Officer, American Century funds, (March 2014 to present); Chief Compliance Officer, ACIM (February 2014 to present); Chief Compliance Officer, ACIS (October 2009 to present); Vice President, Client Interactions and Marketing, ACIS (February 2013 to January 2014); Director, Client Interactions and Marketing, ACIS (June 2007 to January 2013). Also serves as Vice President, ACIS |
| Charles A. Etherington (1957) | General Counsel since 2007 and Senior Vice President since 2006 | Attorney, ACC (February 1994 to present); Vice President, ACC (November 2005 to present); General Counsel, ACC (March 2007 to present). Also serves as General Counsel, ACIM, ACS, ACIS and other ACC subsidiaries; and Senior Vice President, ACIM and ACS |
| C. Jean Wade (1964) | Vice President,Treasurer and Chief Financial Officer since 2012 | Vice President, ACS (February 2000 to present) |
| Robert J. Leach (1966) | Vice President since 2006 and Assistant Treasurer since 2012 | Vice President, ACS (February 2000 to present) |
| David H. Reinmiller (1963) | Vice President since 2000 | Attorney, ACC (January 1994 to present); Associate General Counsel, ACC (January 2001 to present). Also serves as Vice President, ACIM and ACS |
| Ward D. Stauffer (1960) | Secretary since 2005 | Attorney, ACC (June 2003 to present) |
31
| Approval of Management Agreement |
At a meeting held on June 29, 2016, the Fund’s Board of Directors (the "Board") unanimously approved the renewal of the management agreement pursuant to which American Century Investment Management, Inc. (the “Advisor”) acts as the investment advisor for the Fund. Under Section 15(c) of the Investment Company Act, contracts for investment advisory services are required to be reviewed, evaluated, and approved by a majority of a fund’s directors (the “Directors”), including a majority of the independent Directors, each year.
Prior to its consideration of the renewal of the management agreement, the Directors requested and reviewed extensive data and information compiled by the Advisor and certain independent providers of evaluation data concerning the Fund and the services provided to the Fund by the Advisor. This review was in addition to the oversight and evaluation undertaken by the Board and its committees on a continual basis and the information received was supplemental to the extensive information that the Board and its committees receive and consider throughout the year.
In connection with its consideration of the renewal of the management agreement, the Board’s review and evaluation of the services provided by the Advisor included, but was not limited to, the following:
| • | the nature, extent, and quality of investment management, shareholder services, and other services provided and to be provided to the Fund; |
| • | the wide range of other programs and services provided and to be provided to the Fund and its shareholders on a routine and non-routine basis; |
| • | the investment performance of the Fund, including data comparing the Fund's performance to appropriate benchmarks and/or a peer group of other mutual funds with similar investment objectives and strategies; |
| • | the cost of owning the Fund compared to the cost of owning similar funds; |
| • | the compliance policies, procedures, and regulatory experience of the Advisor and the Fund's service providers; |
| • | financial data showing the cost of services provided to the Fund, the profitability of the Fund to the Advisor, and the overall profitability of the Advisor; |
| • | possible economies of scale associated with the Advisor’s management of the Fund and other accounts under its management; |
| • | data comparing services provided and charges to the Advisor's other investment management clients; |
| • | acquired fund fees and expenses; |
| • | payments by the Fund and the Advisor to financial intermediaries and the nature of services provided; and |
| • | any collateral benefits derived by the Advisor from the management of the Fund. |
In keeping with their practice, the Directors held two in-person meetings and one telephonic meeting to review and discuss the information provided. The independent Directors also had the benefit of the advice of their independent counsel throughout the process.
Factors Considered
The Directors considered all of the information provided by the Advisor, the independent data providers, and independent counsel in connection with the approval. They determined that the information was sufficient for them to evaluate the management agreement for the Fund. In connection with their review, the Directors did not identify any single factor as being all-important or controlling, and each Director may have attributed different levels of importance to different factors.
32
In deciding to renew the management agreement, the Board based its decision on a number of factors, including the following:
Nature, Extent and Quality of Services - Generally. Under the management agreement, the Advisor is responsible for providing or arranging for all services necessary for the operation of the Fund. The Board noted that under the management agreement, the Advisor provides or arranges at its own expense a wide variety of services including:
| • | constructing and designing the Fund |
| • | portfolio research and security selection |
| • | initial capitalization/funding |
| • | securities trading |
| • | Fund administration |
| • | custody of Fund assets |
| • | daily valuation of the Fund’s portfolio |
| • | shareholder servicing and transfer agency, including shareholder confirmations, recordkeeping, and communications |
| • | legal services (except the independent Directors’ counsel) |
| • | regulatory and portfolio compliance |
| • | financial reporting |
| • | marketing and distribution (except amounts paid by the Fund under Rule 12b-1 plans) |
The Board noted that many of these services have expanded over time in terms of both quantity and complexity in response to shareholder demands, competition in the industry, changing distribution channels, and the changing regulatory environment. The Board noted specifically the resources the Advisor has committed to enhancing cybersecurity protections for the benefit of shareholders.
Investment Management Services. The nature of the investment management services provided to the Fund is quite complex and allows Fund shareholders access to professional money management, instant diversification of their investments within an asset class, the opportunity to easily diversify among asset classes by investing in or exchanging among various American Century Investments funds, and liquidity. In evaluating investment performance, the Board expects the Advisor to manage the Fund in accordance with its investment objectives and approved strategies. Further, the Directors recognize that the Advisor has an obligation to monitor trading activities, and in particular to seek the best execution of fund trades, and to evaluate the use of and payment for research. In providing these services, the Advisor utilizes teams of investment professionals (portfolio managers, analysts, research assistants, and securities traders) who require extensive information technology, research, training, compliance, and other systems to conduct their business. The Board, directly and through its Fund Performance Review Committee, provides oversight of the investment performance process. It regularly reviews investment performance information for the Fund, together with comparative information for appropriate benchmarks and/or peer groups of similarly-managed funds, over different time horizons. The Directors also review detailed performance information provided by the Advisor during the management agreement approval process. If performance concerns are identified, the Fund receives special reviews until performance improves, during which the Board receives a report from the Advisor regarding the reasons for such results (e.g., market conditions, security selection) and any efforts being undertaken to improve performance. The Fund’s performance was above its benchmark for the three-, five-, and ten-year periods and slightly below its benchmark for the one-year period reviewed by the Board. The Board found the investment management services provided by the Advisor to the Fund to be satisfactory and consistent with the management agreement.
Shareholder and Other Services. Under the management agreement, the Advisor provides the Fund with a comprehensive package of transfer agency, shareholder, and other services. The Board, directly and through various committees of the Board, regularly reviews reports and
33
evaluations of such services at its regular meetings. These reports include, but are not limited to, information regarding the operational efficiency and accuracy of the shareholder and transfer agency services provided, staffing levels, shareholder satisfaction (as measured by external as well as internal sources), technology support, new products and services offered to Fund shareholders, securities trading activities, portfolio valuation services, auditing services, and legal and operational compliance activities. The Board particularly noted the Advisor’s continual efforts to maintain effective business continuity plans and to address cybersecurity threats. Certain aspects of shareholder and transfer agency service level efficiency and the quality of securities trading activities are measured by independent third party providers and are presented in comparison to other fund groups not managed by the Advisor. The Board found the services provided by the Advisor to the Fund under the management agreement to be competitive and of high quality.
Costs of Services and Profitability. The Advisor provides detailed information concerning its cost of providing various services to the Fund, its profitability in managing the Fund (pre- and post-distribution), its overall profitability, and its financial condition. The Directors have reviewed with the Advisor the methodology used to prepare this financial information. This information is considered in evaluating the Advisor’s financial condition, its ability to continue to provide services under the management agreement, and the reasonableness of the current management fee. The Board concluded that the Advisor’s profits were reasonable in light of the services provided to the Fund.
Ethics. The Board generally considers the Advisor’s commitment to providing quality services to shareholders and to conducting its business ethically. They noted that the Advisor’s practices generally meet or exceed industry best practices.
Economies of Scale. The Board also reviewed information provided by the Advisor regarding the possible existence of economies of scale in connection with the management of the Fund. The Board concluded that economies of scale are difficult to measure and predict with precision, especially on a fund-by-fund basis. The Board concluded that the Advisor is appropriately sharing economies of scale through its competitive fee structure, offering competitive fees from fund inception, and through reinvestment in its business to provide shareholders additional content and services. The Board also noted that economies of scale are shared with the Fund and its shareholders through management fee breakpoints that serve to reduce the effective management fee as the assets of the Fund grow.
Comparison to Other Funds’ Fees. The management agreement provides that the Fund pays the Advisor a single, all-inclusive (or unified) management fee for providing all services necessary for the management and operation of the Fund, other than brokerage expenses, expenses attributable to short sales, taxes, interest, extraordinary expenses, and the fees and expenses of the Fund’s independent Directors (including their independent legal counsel) and expenses incurred in connection with the provision of shareholder services and distribution services under a plan adopted pursuant to Rule 12b-1 under the 1940 Act. Under the unified fee structure, the Advisor is responsible for providing all investment advisory, custody, audit, administrative, compliance, recordkeeping, marketing and shareholder services, or arranging and supervising third parties to provide such services. By contrast, most other funds are charged a variety of fees, including an investment advisory fee, a transfer agency fee, an administrative fee, distribution charges, and other expenses. Other than their investment advisory fees and any applicable Rule 12b-1 distribution fees, all other components of the total fees charged by these other funds may be increased without shareholder approval. The Board believes the unified fee structure is a benefit to Fund shareholders because it clearly discloses to shareholders the cost of owning Fund shares, and, since the unified fee cannot be increased without a vote of Fund shareholders, it shifts to the Advisor the risk of increased costs of operating the Fund and provides a direct incentive to minimize administrative inefficiencies. Part of the Board’s analysis of fee levels involves reviewing certain evaluative data compiled by an independent provider comparing the Fund’s unified fee to the total expense ratios of its peers. The unified fee charged to shareholders of the Fund was below the median of the total expense ratios of the Fund’s peer expense universe and was within the range of its peer expense group. The Board concluded that the management fee paid by the
34
Fund to the Advisor under the management agreement is reasonable in light of the services provided to the Fund.
Comparison to Fees and Services Provided to Other Clients of the Advisor. The Directors also requested and received information from the Advisor concerning the nature of the services, fees, costs, and profitability of its advisory services to advisory clients other than the Fund. They observed that these varying types of client accounts require different services and involve different regulatory and entrepreneurial risks than the management of the Fund. The Board analyzed this information and concluded that the fees charged and services provided to the Fund were reasonable by comparison.
Payments to Intermediaries. The Directors also requested and received a description of payments made to intermediaries by the Fund and the Advisor. These payments include various payments made by the Fund or the Advisor to different types of intermediaries and recordkeepers for distribution and service activities provided for the Fund. The Board received confirmation from the Advisor that all such payments by the Fund intended for distribution were made pursuant to the Fund's 12b-1 Plan. The Board reviewed such information and found the payments to be reasonable in scope and purpose.
Collateral or “Fall-Out” Benefits Derived by the Advisor. The Board considered the existence of collateral benefits the Advisor may receive as a result of its relationship with the Fund. They concluded that the Advisor’s primary business is managing mutual funds and it generally does not use fund or shareholder information to generate profits in other lines of business, and therefore does not derive any significant collateral benefits from them. The Board noted that additional assets from other clients may offer the Advisor some benefit from increased leverage with service providers and counterparties. Additionally, the Advisor receives proprietary research from broker-dealers that execute fund portfolio transactions, which the Board concluded is likely to benefit other clients of the Advisor, as well as Fund shareholders. The Board also determined that the Advisor is able to provide investment management services to certain clients other than the Fund, at least in part, due to its existing infrastructure built to serve the fund complex. The Board concluded that appropriate allocation methodologies had been employed to assign resources and the cost of those resources to these other clients and, where expressly provided, these other client assets may be included with the assets of the Fund to determine breakpoints in the management fee schedule.
Existing Relationship. The Board also considered whether there was any reason for not continuing the existing arrangement with the Advisor. In this regard, the Board was mindful of the potential disruptions of the Fund’s operations and various risks, uncertainties, and other effects that could occur as a result of a decision not to continue such relationship. In particular, the Board recognized that most shareholders have invested in the Fund on the strength of the Advisor’s industry standing and reputation and in the expectation that the Advisor will have a continuing role in providing advisory services to the Fund.
Conclusion of the Directors. As a result of this process, the Board, including all of the independent Directors, taking into account all of the factors discussed above and the information provided by the Advisor and others in connection with its review and throughout the year, determined that the management fee is fair and reasonable in light of the services provided and that the investment management agreement between the Fund and the Advisor should be renewed.
35
| Additional Information |
Retirement Account Information
As required by law, distributions you receive from certain IRAs are subject to federal income tax withholding, unless you elect not to have withholding apply. Tax will be withheld on the total amount withdrawn even though you may be receiving amounts that are not subject to withholding, such as nondeductible contributions. In such case, excess amounts of withholding could occur. You may adjust your withholding election so that a greater or lesser amount will be withheld.
If you don’t want us to withhold on this amount, you must notify us to not withhold the federal income tax. You may notify us in writing or in certain situations by telephone or through other electronic means. For systematic withdrawals, your withholding election will remain in effect until revoked or changed by filing a new election. You have the right to revoke your election at any time.
Remember, even if you elect not to have income tax withheld, you are liable for paying income tax on the taxable portion of your withdrawal. If you elect not to have income tax withheld or you don’t have enough income tax withheld, you may be responsible for payment of estimated tax. You may incur penalties under the estimated tax rules if your withholding and estimated tax payments are not sufficient. You can reduce or defer the income tax on a distribution by directly or indirectly rolling such distribution over to another IRA or eligible plan. You should consult your tax advisor for additional information.
State tax will be withheld if, at the time of your distribution, your address is within one of the mandatory withholding states and you have federal income tax withheld (or as otherwise required by state law). State taxes will be withheld from your distribution in accordance with the respective state rules.
Distributions you receive from 403(b), 457 and qualified plans are subject to special tax and withholding rules. Your plan administrator or plan sponsor is required to provide you with a special tax notice explaining those rules at the time you request a distribution. If applicable, federal and/or state taxes may be withheld from your distribution amount.
Proxy Voting Policies
A description of the policies that the fund's investment advisor uses in exercising the voting rights associated with the securities purchased and/or held by the fund is available without charge, upon request, by calling 1-800-345-2021. It is also available on the "About Us" page of American Century Investments’ website at americancentury.com and on the Securities and Exchange Commission’s website at sec.gov. Information regarding how the investment advisor voted proxies relating to portfolio securities during the most recent 12-month period ended June 30 is available on the "About Us" page at americancentury.com. It is also available at sec.gov.
Quarterly Portfolio Disclosure
The fund files its complete schedule of portfolio holdings with the Securities and Exchange Commission (SEC) for the first and third quarters of each fiscal year on Form N-Q. The fund’s Forms N-Q are available on the SEC’s website at sec.gov, and may be reviewed and copied at the SEC’s Public Reference Room in Washington, DC. Information on the operation of the Public Reference Room may be obtained by calling 1-800-SEC-0330. The fund also makes its complete schedule of portfolio holdings for the most recent quarter of its fiscal year available on its website at americancentury.com and, upon request, by calling 1-800-345-2021.
36
Other Tax Information
The following information is provided pursuant to provisions of the Internal Revenue Code.
The fund hereby designates up to the maximum amount allowable as qualified dividend income for the fiscal year ended November 30, 2016.
For the fiscal year ended November 30, 2016, the fund intends to pass through to shareholders foreign source income of $3,006,305 and foreign taxes paid of $211,293, or up to the maximum amount allowable, as a foreign tax credit. Foreign source income and foreign tax expense per outstanding share on November 30, 2016 are $0.3726 and $0.0262, respectively.
37
| Notes |
38
| Notes |
39
| Notes |
40
| ||
| Contact Us | americancentury.com | |
| Automated Information Line | 1-800-345-8765 | |
| Investor Services Representative | 1-800-345-2021 or 816-531-5575 | |
| Investors Using Advisors | 1-800-378-9878 | |
| Business, Not-For-Profit, Employer-Sponsored Retirement Plans | 1-800-345-3533 | |
| Banks and Trust Companies, Broker-Dealers, Financial Professionals, Insurance Companies | 1-800-345-6488 | |
| Telecommunications Relay Service for the Deaf | 711 | |
| American Century World Mutual Funds, Inc. | ||
Investment Advisor: American Century Investment Management, Inc. Kansas City, Missouri | ||
| This report and the statements it contains are submitted for the general information of our shareholders. The report is not authorized for distribution to prospective investors unless preceded or accompanied by an effective prospectus. | ||
| ©2017 American Century Proprietary Holdings, Inc. All rights reserved. CL-ANN-91029 1701 | ||
| Annual Report | |
| November 30, 2016 | |
| NT Emerging Markets Fund | |
| Table of Contents |
| Performance | 2 | |
| Portfolio Commentary | ||
| Fund Characteristics | ||
| Shareholder Fee Example | ||
| Schedule of Investments | ||
| Statement of Assets and Liabilities | ||
| Statement of Operations | ||
| Statement of Changes in Net Assets | ||
| Notes to Financial Statements | ||
| Financial Highlights | ||
| Report of Independent Registered Public Accounting Firm | ||
| Management | ||
| Approval of Management Agreement | ||
| Additional Information | ||
Any opinions expressed in this report reflect those of the author as of the date of the report, and do not necessarily represent the opinions of American Century Investments® or any other person in the American Century Investments organization. Any such opinions are subject to change at any time based upon market or other conditions and American Century Investments disclaims any responsibility to update such opinions. These opinions may not be relied upon as investment advice and, because investment decisions made by American Century Investments funds are based on numerous factors, may not be relied upon as an indication of trading intent on behalf of any American Century Investments fund. Security examples are used for representational purposes only and are not intended as recommendations to purchase or sell securities. Performance information for comparative indices and securities is provided to American Century Investments by third party vendors. To the best of American Century Investments’ knowledge, such information is accurate at the time of printing.
| Performance |
| Total Returns as of November 30, 2016 | ||||||
Average Annual Returns | ||||||
Ticker Symbol | 1 year | 5 years | 10 years | Since Inception | Inception Date | |
| Institutional Class | ACLKX | 5.68% | 3.12% | 1.51% | — | 5/12/06 |
MSCI Emerging Markets Index | — | 8.47% | 0.99% | 2.26% | — | — |
| R6 Class | ACKDX | 5.94% | — | — | 1.56% | 7/26/13 |
Average annual returns since inception are presented when ten years of performance history is not available.
Fund returns would have been lower if a portion of the fees had not been waived.
| Growth of $10,000 Over 10 Years |
| $10,000 investment made November 30, 2006 |
| Performance for other share classes will vary due to differences in fee structure. |
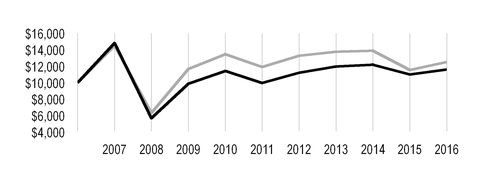
| Value on November 30, 2016 | |
Institutional Class — $11,614 | |
MSCI Emerging Markets Index — $12,510 | |
Ending value of Institutional class would have been lower if a portion of the fees had not been waived.
Total Annual Fund Operating Expenses | |
| Institutional Class | R6 Class |
| 1.49% | 1.34% |
The total annual fund operating expenses shown is as stated in the fund’s prospectus current as of the date of this report. The prospectus may vary from the expense ratio shown elsewhere in this report because it is based on a different time period, includes acquired fund fees and expenses, and, if applicable, does not include fee waivers or expense reimbursements.
Data presented reflect past performance. Past performance is no guarantee of future results. Current performance may be higher or lower than the performance shown. Total returns for periods less than one year are not annualized. Investment return and principal value will fluctuate, and redemption value may be more or less than original cost. Data assumes reinvestment of dividends and capital gains, and none of the charts reflect the deduction of taxes that a shareholder would pay on fund distributions or the redemption of fund shares. To obtain performance data current to the most recent month end, please call 1-800-345-2021 or visit americancentury.com. For additional information about the fund, please consult the prospectus.
2
| Portfolio Commentary |
Portfolio Managers: Patricia Ribeiro, Anthony Han, and Sherwin Soo
In February 2016, portfolio manager Sherwin Soo joined the NT Emerging Markets management team.
Performance Summary
NT Emerging Markets gained 5.68%* for the 12 months ended November 30, 2016. The portfolio’s benchmark, the MSCI Emerging Markets Index, gained 8.47% for the same period.
The fund underperformed its benchmark during the period, primarily due to stock selection in the financials and health care sectors. An underweight position relative to the benchmark in the energy sector also contributed to underperformance. Conversely, investments in the information technology sector and an underweight position in the telecommunication services sector buoyed relative results. Industrials holdings also contributed to performance. Regionally, stock selection in South Korea and Turkey hindered relative results, while investments in Mexico and Russia helped.
Stock Selection in the Financials Sector Detracted
Areas of weakness in the fund included the financials sector, where not owning Brazil-based commercial bank Banco Bradesco weighed on relative performance, as expectations of a macroeconomic recovery enabled the stock to rally from recent lows. In our opinion, there are other more attractive investment opportunities in the Brazilian banking sector. As such, we chose not to invest in Banco Bradesco. Also contributing to sector underperformance was the fund’s investment in South Africa-based insurance company Discovery Holdings, which suffered amidst volatility in the South African stock market. Further pressuring the stock were weak financial results, particularly at its U.K. operations, where low interest rates and high operating costs contributed to a challenging environment for the company.
In the health care sector underperformance came primarily from portfolio-only holding Medy-Tox, a biopharmaceutical company headquartered in South Korea. Headwinds for Medy-Tox included ongoing conflict and patent issues among domestic manufacturers regarding the origins of the botulinum toxin strain, commonly known as Botox. Weakness in the biotechnology and cosmetic industries due to constrained relations with China also contributed to declines, and we reduced our position.
Another area of relative weakness was the energy sector, where not owning Brazil-based oil and gas company Petroleo Brasileiro hindered relative performance. Petrobras’ stock gained as a result of improving sentiment around the nation’s politics and rising oil prices.
Significant individual detractors also included China-based travel services firm Ctrip.com International. The company’s stock price fluctuates with increased bouts of macroeconomic uncertainty. For example, if economic growth slows, overall travel growth also tends to slow. As such, concerns about economic growth during the period contributed to declines in Ctrip.com’s share price. Increased pricing competition, particularly in the hotel market, also weighed on the stock. Nonetheless, our long-term outlook for the company remains positive and we continue to hold a position in Ctrip.com.
* All fund returns referenced in this commentary are for Institutional Class shares. Fund returns would have been lower if a portion of the fees had not been waived. Performance for other share classes will vary due to differences in fee structure; when Institutional Class performance exceeds that of the fund's benchmark, other share classes may not. See page 2 for returns for all share classes.
3
Information Technology Holdings Contributed
Leading sector contribution came primarily from the information technology sector, where standout performers included China-based online gaming and social media company Tencent Holdings and Thailand-based electronic circuit manufacturer KCE Electronics, which is a portfolio-only holding. Tencent benefited from rising internet usage and reported higher revenue during the period, with meaningful growth in online games, social networking and online advertising. KCE Electronics, which specializes in making circuit boards for the automobile industry, enjoyed strong earnings growth, driven primarily by improvements in operating efficiency and product mix. The company continues to experience strong demand for its circuit boards due to the increased use of electronics in cars and rising safety regulations.
The same trends contributed to the strong performance of portfolio-only holding Tung Thih Electronic, a Taiwan-based automobile electronic parts and accessories supplier. Consumers are demanding safer cars, and government mandates are incrementally requiring expanded safety features such as rear and side-view cameras, blind spot detection, and automated parking systems. There is a clear trend in auto active safety technologies, and Tung Thih Electronic continues to add new customers and increase its market share among existing customers.
The fund’s outperformance in the consumer staples sector was driven by Brazil-based drugstore operator Raia Drogasil. The company continues to capitalize on the secular growth of the pharmaceutical industry while increasing its market share and driving top-line growth. Furthermore, Raia Drogasil remains focused on enhancing its competitive position through new initiatives that include product management, store openings, and store refurbishment.
Outlook
Emerging markets are reacting to uncertainty after the U.S. presidential election. The potential for higher inflation, a stronger U.S. dollar, and disruption in trade is clouding the near-term outlook for emerging markets’ stocks and currencies. However, we believe growth rate differentials continue to improve versus developed markets. Emerging markets’ central banks still have room to cut interest rates to spur growth, earnings growth is improving, and data, such as Purchasing Managers’ Index (PMI), suggest economic confidence is strengthening. In our view, stock valuations remain attractive relative to developed markets given strong fundamentals. While performance will vary country by country, several markets appear positioned to improve in 2017. Notably, Brazil and Russia are recovering from a recession, and India and China look to be successfully implementing economic reforms.
We expect volatility in emerging markets to continue through the remainder of 2016 and believe asset prices will fluctuate with the path of U.S. interest rates, expectations around China’s economy, the behavior of global commodity prices, and by president-elect Donald Trump’s approach to U.S. trade with the rest of the world. Looking ahead, we remain constructive on emerging markets in 2017 given the prospects of improving global growth and better valuations.
4
| Fund Characteristics |
| NOVEMBER 30, 2016 | |
Top Ten Holdings | % of net assets |
| Samsung Electronics Co. Ltd. | 6.1% |
| Tencent Holdings Ltd. | 5.2% |
| Taiwan Semiconductor Manufacturing Co. Ltd. | 5.0% |
| Alibaba Group Holding Ltd. ADR | 3.4% |
| Vale SA ADR | 2.3% |
| HDFC Bank Ltd. | 2.2% |
| Industrial & Commercial Bank of China Ltd., H Shares | 2.2% |
| Itau Unibanco Holding SA ADR | 1.9% |
| Naspers Ltd., N Shares | 1.8% |
| Ping An Insurance Group Co. of China Ltd., H Shares | 1.7% |
Types of Investments in Portfolio | % of net assets |
| Common Stocks | 96.7% |
| Temporary Cash Investments | 6.3% |
| Other Assets and Liabilities | (3.0)% |
Investments by Country | % of net assets |
| China | 29.0% |
| South Korea | 11.2% |
| Taiwan | 10.1% |
| Brazil | 7.8% |
| Russia | 7.3% |
| India | 6.5% |
| South Africa | 5.3% |
| Thailand | 4.5% |
| Indonesia | 3.8% |
| Mexico | 3.0% |
| Hungary | 2.3% |
| Other Countries | 5.9% |
| Cash and Equivalents* | 3.3% |
| *Includes temporary cash investments and other assets and liabilities. | |
5
| Shareholder Fee Example |
Fund shareholders may incur two types of costs: (1) transaction costs, including sales charges (loads) on purchase payments and redemption/exchange fees; and (2) ongoing costs, including management fees; distribution and service (12b-1) fees; and other fund expenses. This example is intended to help you understand your ongoing costs (in dollars) of investing in your fund and to compare these costs with the ongoing cost of investing in other mutual funds.
The example is based on an investment of $1,000 made at the beginning of the period and held for the entire period from June 1, 2016 to November 30, 2016.
Actual Expenses
The table provides information about actual account values and actual expenses for each class. You may use the information, together with the amount you invested, to estimate the expenses that you paid over the period. First, identify the share class you own. Then simply divide your account value by $1,000 (for example, an $8,600 account value divided by $1,000 = 8.6), then multiply the result by the number under the heading “Expenses Paid During Period” to estimate the expenses you paid on your account during this period.
Hypothetical Example for Comparison Purposes
The table also provides information about hypothetical account values and hypothetical expenses based on the actual expense ratio of each class of your fund and an assumed rate of return of 5% per year before expenses, which is not the actual return of a fund’s share class. The hypothetical account values and expenses may not be used to estimate the actual ending account balance or expenses you paid for the period. You may use this information to compare the ongoing costs of investing in your fund and other funds. To do so, compare this 5% hypothetical example with the 5% hypothetical examples that appear in the shareholder reports of the other funds.
Please note that the expenses shown in the table are meant to highlight your ongoing costs only and do not reflect any transactional costs, such as sales charges (loads) or redemption/exchange fees. Therefore, the table is useful in comparing ongoing costs only, and will not help you determine the relative total costs of owning different funds. In addition, if these transactional costs were included, your costs would have been higher
| Beginning Account Value 6/1/16 | Ending Account Value 11/30/16 | Expenses Paid During Period(1) 6/1/16 - 11/30/16 | Annualized Expense Ratio(1) | |
Actual | ||||
| Institutional Class (after waiver) | $1,000 | $1,068.70 | $6.00 | 1.16% |
| Institutional Class (before waiver) | $1,000 | $1,068.70(2) | $7.29 | 1.41% |
| R6 Class (after waiver) | $1,000 | $1,069.70 | $5.23 | 1.01% |
| R6 Class (before waiver) | $1,000 | $1,069.70(2) | $6.52 | 1.26% |
| Hypothetical | ||||
| Institutional Class (after waiver) | $1,000 | $1,019.20 | $5.86 | 1.16% |
| Institutional Class (before waiver) | $1,000 | $1,017.95 | $7.11 | 1.41% |
| R6 Class (after waiver) | $1,000 | $1,019.95 | $5.10 | 1.01% |
| R6 Class (before waiver) | $1,000 | $1,018.70 | $6.36 | 1.26% |
| (1) | Expenses are equal to the class's annualized expense ratio listed in the table above, multiplied by the average account value over the period, multiplied by 183, the number of days in the most recent fiscal half-year, divided by 366, to reflect the one-half year period. |
| (2) | Ending account value assumes the return earned after waiver and would have been lower if a portion of the fees had not been waived. |
6
| Schedule of Investments |
NOVEMBER 30, 2016
| Shares | Value | ||||
| COMMON STOCKS — 96.7% | |||||
| Brazil — 7.8% | |||||
| Itau Unibanco Holding SA ADR | 791,603 | $ | 8,185,175 | ||
| Klabin SA | 612,900 | 3,075,328 | |||
| Kroton Educacional SA | 459,600 | 1,963,667 | |||
| Multiplan Empreendimentos Imobiliarios SA | 121,100 | 2,081,443 | |||
| Raia Drogasil SA | 213,000 | 4,061,551 | |||
| Ultrapar Participacoes SA | 219,400 | 4,482,648 | |||
| Vale SA ADR | 1,160,077 | 9,849,054 | |||
| 33,698,866 | |||||
| China — 29.0% | |||||
| AAC Technologies Holdings, Inc. | 547,000 | 4,950,609 | |||
Alibaba Group Holding Ltd. ADR(1) | 155,580 | 14,627,631 | |||
| Anhui Conch Cement Co. Ltd., H Shares | 1,329,000 | 3,846,587 | |||
| Beijing Enterprises Water Group Ltd. | 7,826,000 | 5,660,267 | |||
| Brilliance China Automotive Holdings Ltd. | 1,056,000 | 1,478,522 | |||
| China Gas Holdings Ltd. | 2,274,000 | 3,007,960 | |||
| China Lodging Group Ltd. ADR | 73,774 | 3,864,282 | |||
| China Mobile Ltd. | 673,000 | 7,344,737 | |||
| China Overseas Land & Investment Ltd. | 898,000 | 2,593,335 | |||
| China Railway Construction Corp. Ltd., H Shares | 3,832,000 | 5,444,290 | |||
| CNOOC Ltd. | 3,373,000 | 4,252,941 | |||
Ctrip.com International Ltd. ADR(1) | 94,978 | 4,295,855 | |||
| Industrial & Commercial Bank of China Ltd., H Shares | 15,476,095 | 9,477,400 | |||
| Minth Group Ltd. | 816,000 | 2,672,133 | |||
New Oriental Education & Technology Group, Inc. ADR(1) | 115,682 | 5,803,766 | |||
| Nine Dragons Paper Holdings Ltd. | 2,711,000 | 2,380,186 | |||
| Ping An Insurance Group Co. of China Ltd., H Shares | 1,361,500 | 7,530,245 | |||
| Shenzhou International Group Holdings Ltd. | 982,000 | 6,038,987 | |||
| Sunny Optical Technology Group Co. Ltd. | 500,000 | 2,517,244 | |||
TAL Education Group ADR(1) | 40,357 | 3,088,521 | |||
| Tencent Holdings Ltd. | 900,200 | 22,480,338 | |||
Weibo Corp. ADR(1) | 50,341 | 2,582,997 | |||
| 125,938,833 | |||||
| Czech — 0.6% | |||||
Moneta Money Bank AS(1) | 867,977 | 2,832,737 | |||
| Egypt — 0.4% | |||||
| Commercial International Bank Egypt S.A.E. | 448,568 | 1,732,505 | |||
| Hungary — 2.3% | |||||
| OTP Bank plc | 202,197 | 5,449,937 | |||
| Richter Gedeon Nyrt | 224,959 | 4,492,719 | |||
| 9,942,656 | |||||
| India — 6.5% | |||||
Bharat Financial Inclusion Ltd.(1) | 378,592 | 4,090,184 | |||
| Godrej Consumer Products Ltd. | 207,152 | 4,409,878 | |||
| Havells India Ltd. | 617,030 | 3,104,127 | |||
| HDFC Bank Ltd. | 486,021 | 9,685,777 | |||
7
| Shares | Value | ||||
| Larsen & Toubro Ltd. | 161,715 | $ | 3,266,835 | ||
| Motherson Sumi Systems Ltd. | 766,107 | 3,467,401 | |||
| 28,024,202 | |||||
| Indonesia — 3.8% | |||||
| Astra International Tbk PT | 8,917,400 | 4,967,819 | |||
| Bank Rakyat Indonesia Persero Tbk PT | 4,808,400 | 3,867,298 | |||
| Indofood Sukses Makmur Tbk PT | 6,755,300 | 3,775,790 | |||
| Telekomunikasi Indonesia Persero Tbk PT | 13,317,900 | 3,714,567 | |||
| 16,325,474 | |||||
| Malaysia — 0.3% | |||||
| My EG Services Bhd | 2,358,000 | 1,187,976 | |||
| Mexico — 3.0% | |||||
| Alsea SAB de CV | 572,019 | 1,679,138 | |||
Cemex SAB de CV ADR(1) | 617,461 | 4,822,370 | |||
| Gentera SAB de CV | 1,943,943 | 3,076,146 | |||
| Grupo Aeroportuario del Centro Norte SAB de CV | 772,821 | 3,642,881 | |||
| 13,220,535 | |||||
| Peru — 1.0% | |||||
| Credicorp Ltd. | 27,583 | 4,321,980 | |||
| Philippines — 0.8% | |||||
| Ayala Land, Inc. | 5,491,900 | 3,631,651 | |||
| Russia — 7.3% | |||||
| MMC Norilsk Nickel PJSC ADR | 201,526 | 3,381,606 | |||
| Moscow Exchange MICEX-RTS PJSC | 2,471,425 | 4,600,994 | |||
| Novatek OJSC GDR | 56,341 | 6,653,872 | |||
| Sberbank of Russia PJSC ADR | 64,847 | 653,982 | |||
| Sberbank of Russia PJSC ADR (London) | 589,166 | 5,906,389 | |||
X5 Retail Group NV GDR(1) | 238,433 | 7,152,990 | |||
Yandex NV, A Shares(1) | 167,319 | 3,180,734 | |||
| 31,530,567 | |||||
| South Africa — 5.3% | |||||
| Aspen Pharmacare Holdings Ltd. | 211,634 | 4,358,661 | |||
| Capitec Bank Holdings Ltd. | 93,395 | 4,314,248 | |||
| Discovery Holdings Ltd. | 279,002 | 2,208,233 | |||
| Naspers Ltd., N Shares | 52,132 | 7,609,587 | |||
Sappi Ltd.(1) | 793,903 | 4,697,718 | |||
| 23,188,447 | |||||
| South Korea — 11.2% | |||||
CJ Korea Express Corp.(1) | 22,406 | 3,526,542 | |||
| GS Retail Co. Ltd. | 63,915 | 2,586,014 | |||
| HS Industries Co. Ltd. | 259,183 | 2,050,761 | |||
| Innocean Worldwide, Inc. | 57,901 | 3,080,657 | |||
| Medy-Tox, Inc. | 9,710 | 2,725,993 | |||
| NAVER Corp. | 9,469 | 6,463,592 | |||
| Samsung Electronics Co. Ltd. | 17,660 | 26,375,570 | |||
Wonik Holdings Co. Ltd.(1) | 378,870 | 1,970,429 | |||
| 48,779,558 | |||||
| Taiwan — 10.1% | |||||
| Green Seal Holding Ltd. | 332,000 | 1,499,953 | |||
| Hota Industrial Manufacturing Co. Ltd. | 582,000 | 2,236,846 | |||
| Largan Precision Co. Ltd. | 37,000 | 4,283,563 | |||
8
| Shares | Value | ||||
| Nien Made Enterprise Co. Ltd. | 209,000 | $ | 2,340,947 | ||
| President Chain Store Corp. | 619,000 | 4,651,288 | |||
| Taiwan Paiho Ltd. | 1,728,000 | 5,253,450 | |||
| Taiwan Semiconductor Manufacturing Co. Ltd. | 3,795,774 | 21,793,576 | |||
| Tung Thih Electronic Co. Ltd. | 187,000 | 1,613,434 | |||
| 43,673,057 | |||||
| Thailand — 4.5% | |||||
| Airports of Thailand PCL | 180,100 | 2,029,182 | |||
| CP ALL PCL | 3,439,500 | 5,808,094 | |||
| Kasikornbank PCL | 401,000 | 1,910,621 | |||
| KCE Electronics PCL | 1,565,400 | 5,286,809 | |||
| Minor International PCL | 1,735,200 | 1,823,736 | |||
| Srisawad Power 1979 PCL | 2,209,817 | 2,539,343 | |||
| 19,397,785 | |||||
| Turkey — 1.7% | |||||
| BIM Birlesik Magazalar AS | 166,920 | 2,341,748 | |||
| Tofas Turk Otomobil Fabrikasi AS | 537,727 | 3,355,610 | |||
| Ulker Biskuvi Sanayi AS | 335,800 | 1,685,988 | |||
| 7,383,346 | |||||
| United Kingdom — 1.1% | |||||
Tullow Oil plc(1) | 1,310,025 | 4,881,248 | |||
TOTAL COMMON STOCKS (Cost $381,136,591) | 419,691,423 | ||||
| TEMPORARY CASH INVESTMENTS — 6.3% | |||||
| Repurchase Agreement, Fixed Income Clearing Corp., (collateralized by various U.S. Treasury obligations, 3.625%, 2/15/44, valued at $27,639,281), at 0.08%, dated 11/30/16, due 12/1/16 (Delivery value $27,094,060) | 27,094,000 | ||||
| State Street Institutional U.S. Government Money Market Fund, Premier Class | 5,222 | 5,222 | |||
TOTAL TEMPORARY CASH INVESTMENTS (Cost $27,099,222) | 27,099,222 | ||||
TOTAL INVESTMENT SECURITIES — 103.0% (Cost $408,235,813) | 446,790,645 | ||||
| OTHER ASSETS AND LIABILITIES — (3.0)% | (12,974,193 | ) | |||
| TOTAL NET ASSETS — 100.0% | $ | 433,816,452 | |||
9
| MARKET SECTOR DIVERSIFICATION | ||
(as a % of net assets) | ||
| Information Technology | 27.1 | % |
| Financials | 19.2 | % |
| Consumer Discretionary | 15.2 | % |
| Consumer Staples | 8.3 | % |
| Materials | 8.3 | % |
| Industrials | 4.9 | % |
| Energy | 4.6 | % |
| Health Care | 2.6 | % |
| Telecommunication Services | 2.6 | % |
| Utilities | 2.0 | % |
| Real Estate | 1.9 | % |
| Cash and Equivalents* | 3.3 | % |
* Includes temporary cash investments and other assets and liabilities.
| NOTES TO SCHEDULE OF INVESTMENTS | ||
| ADR | - | American Depositary Receipt |
| GDR | - | Global Depositary Receipt |
| (1) | Non-income producing. |
See Notes to Financial Statements.
10
| Statement of Assets and Liabilities |
| NOVEMBER 30, 2016 | |||
| Assets | |||
| Investment securities, at value (cost of $408,235,813) | $ | 446,790,645 | |
| Foreign currency holdings, at value (cost of $297,372) | 210,338 | ||
| Receivable for capital shares sold | 76,851 | ||
| Dividends and interest receivable | 51,395 | ||
| Other assets | 38,333 | ||
| 447,167,562 | |||
| Liabilities | |||
| Payable for investments purchased | 12,953,043 | ||
| Accrued management fees | 398,067 | ||
| 13,351,110 | |||
| Net Assets | $ | 433,816,452 | |
| Net Assets Consist of: | |||
| Capital (par value and paid-in surplus) | $ | 398,065,455 | |
| Undistributed net investment income | 1,838,101 | ||
| Accumulated net realized loss | (4,544,399 | ) | |
| Net unrealized appreciation | 38,457,295 | ||
| $ | 433,816,452 | ||
| Net Assets | Shares Outstanding | Net Asset Value Per Share | ||||
| Institutional Class, $0.01 Par Value | $394,433,414 | 38,397,969 | $10.27 | |||
| R6 Class, $0.01 Par Value | $39,383,038 | 3,831,485 | $10.28 | |||
See Notes to Financial Statements.
11
| Statement of Operations |
| YEAR ENDED NOVEMBER 30, 2016 | |||
| Investment Income (Loss) | |||
| Income: | |||
| Dividends (net of foreign taxes withheld of $920,138) | $ | 7,185,001 | |
| Interest | 7,553 | ||
| 7,192,554 | |||
| Expenses: | |||
| Management fees | 5,952,940 | ||
| Directors' fees and expenses | 13,979 | ||
| Other expenses | 24,423 | ||
| 5,991,342 | |||
| Fees waived | (1,053,848 | ) | |
| 4,937,494 | |||
| Net investment income (loss) | 2,255,060 | ||
| Realized and Unrealized Gain (Loss) | |||
| Net realized gain (loss) on: | |||
| Investment transactions (net of foreign tax expenses paid (refunded) of $84,574) | 7,366,308 | ||
| Foreign currency transactions | (1,136,904 | ) | |
| Capital gain distributions received from underlying funds | 673,363 | ||
| 6,902,767 | |||
| Change in net unrealized appreciation (depreciation) on: | |||
| Investments (includes (increase) decrease in accrued foreign taxes of $140,750) | 20,947,447 | ||
| Translation of assets and liabilities in foreign currencies | (92,234 | ) | |
| 20,855,213 | |||
| Net realized and unrealized gain (loss) | 27,757,980 | ||
| Net Increase (Decrease) in Net Assets Resulting from Operations | $ | 30,013,040 | |
See Notes to Financial Statements.
12
| Statement of Changes in Net Assets |
| YEARS ENDED NOVEMBER 30, 2016 AND NOVEMBER 30, 2015 | ||||||
| Increase (Decrease) in Net Assets | November 30, 2016 | November 30, 2015 | ||||
| Operations | ||||||
| Net investment income (loss) | $ | 2,255,060 | $ | 1,883,408 | ||
| Net realized gain (loss) | 6,902,767 | (5,520,167 | ) | |||
| Change in net unrealized appreciation (depreciation) | 20,855,213 | (34,256,631 | ) | |||
| Net increase (decrease) in net assets resulting from operations | 30,013,040 | (37,893,390 | ) | |||
| Distributions to Shareholders | ||||||
| From net investment income: | ||||||
| Institutional Class | (1,209,292 | ) | (700,610 | ) | ||
| R6 Class | (111,666 | ) | (53,663 | ) | ||
| Decrease in net assets from distributions | (1,320,958 | ) | (754,273 | ) | ||
| Capital Share Transactions | ||||||
| Net increase (decrease) in net assets from capital share transactions (Note 5) | 10,227,920 | 99,909,755 | ||||
| Net increase (decrease) in net assets | 38,920,002 | 61,262,092 | ||||
| Net Assets | ||||||
| Beginning of period | 394,896,450 | 333,634,358 | ||||
| End of period | $ | 433,816,452 | $ | 394,896,450 | ||
| Undistributed net investment income | $ | 1,838,101 | $ | 1,320,696 | ||
See Notes to Financial Statements.
13
| Notes to Financial Statements |
NOVEMBER 30, 2016
1. Organization
American Century World Mutual Funds, Inc. (the corporation) is registered under the Investment Company Act of 1940, as amended (the 1940 Act), as an open-end management investment company and is organized as a Maryland corporation. NT Emerging Markets Fund (the fund) is one fund in a series issued by the corporation. The fund’s investment objective is to seek capital growth. The fund is not permitted to invest in securities issued by companies assigned the Global Industry Classification Standard for the tobacco industry.
The fund offers the Institutional Class and the R6 Class, which have different fees and expenses. The difference in the fee structures between the classes is the result of their separate arrangements for shareholder and distribution services, which may be provided indirectly through another American Century Investments mutual fund. As a result, the investment advisor is able to charge the R6 Class a lower unified management fee.
2. Significant Accounting Policies
The following is a summary of significant accounting policies consistently followed by the fund in preparation of its financial statements. The fund is an investment company and follows accounting and reporting guidance in accordance with accounting principles generally accepted in the United States of America. This may require management to make certain estimates and assumptions at the date of the financial statements. Actual results could differ from these estimates. Management evaluated the impact of events or transactions occurring through the date the financial statements were issued that would merit recognition or disclosure.
Investment Valuations — The fund determines the fair value of its investments and computes its net asset value per share at the close of regular trading (usually 4 p.m. Eastern time) on the New York Stock Exchange (NYSE) on each day the NYSE is open. The Board of Directors has adopted valuation policies and procedures to guide the investment advisor in the fund’s investment valuation process and to provide methodologies for the oversight of the fund’s pricing function.
Equity securities that are listed or traded on a domestic securities exchange are valued at the last reported sales price or at the official closing price as provided by the exchange. Equity securities traded on foreign securities exchanges are generally valued at the closing price of such securities on the exchange where primarily traded or at the close of the NYSE, if that is earlier. If no last sales price is reported, or if local convention or regulation so provides, the mean of the latest bid and asked prices may be used. Securities traded over-the-counter are valued at the mean of the latest bid and asked prices, the last sales price, or the official closing price. Equity securities initially expressed in local currencies are translated into U.S. dollars at the mean of the appropriate currency exchange rate at the close of the NYSE as provided by an independent pricing service.
Open-end management investment companies are valued at the reported net asset value per share. Repurchase agreements are valued at cost, which approximates fair value.
If the fund determines that the market price for an investment is not readily available or the valuation methods mentioned above do not reflect an investment’s fair value, such investment is valued as determined in good faith by the Board of Directors or its delegate, in accordance with policies and procedures adopted by the Board of Directors. In its determination of fair value, the fund may review several factors including, but not limited to, market information regarding the specific investment or comparable investments and correlation with other investment types, futures indices or general market indicators. Circumstances that may cause the fund to use these procedures to value an investment include, but are not limited to: an investment has been declared in default or is distressed; trading in a security has been suspended during the trading day or a security is not actively trading on its principal exchange; prices received from a regular pricing source are deemed unreliable; or there is a foreign market holiday and no trading occurred.
The fund monitors for significant events occurring after the close of an investment’s primary exchange but before the fund’s net asset value per share is determined. Significant events may include, but are not limited to: corporate announcements and transactions; governmental action and political unrest that could impact a specific investment or an investment sector; or armed conflicts, natural disasters and similar events that could affect investments in a specific country or region. The fund also monitors for significant fluctuations between
14
domestic and foreign markets, as evidenced by the U.S. market or such other indicators that the Board of Directors, or its delegate, deems appropriate. If significant fluctuations in foreign markets are identified, the fund may apply a model-derived factor to the closing price of equity securities traded on foreign securities exchanges. The factor is based on observable market data as provided by an independent pricing service.
Security Transactions — Security transactions are accounted for as of the trade date. Net realized gains and losses are determined on the identified cost basis, which is also used for federal income tax purposes. Certain countries impose taxes on realized gains on the sale of securities registered in their country. The fund records the foreign tax expense, if any, on an accrual basis. The foreign tax expense on realized gains and unrealized appreciation reduces the net realized gain (loss) on investment transactions and net unrealized appreciation (depreciation) on investments, respectively.
Investment Income — Income and capital gain distributions, if any, are recorded as of the ex-dividend date. Long-term capital gain distributions, if any, are a component of net realized gain (loss). Dividend income less foreign taxes withheld, if any, is recorded as of the ex-dividend date. Distributions received on securities that represent a return of capital or long-term capital gain are recorded as a reduction of cost of investments and/or as a realized gain. The fund may estimate the components of distributions received that may be considered nontaxable distributions or long-term capital gain distributions for income tax purposes. Interest income is recorded on the accrual basis and includes accretion of discounts and amortization of premiums.
Foreign Currency Translations — All assets and liabilities initially expressed in foreign currencies are translated into U.S. dollars at prevailing exchange rates at period end. The fund may enter into spot foreign currency exchange contracts to facilitate transactions denominated in a foreign currency. Purchases and sales of investment securities, dividend and interest income, spot foreign currency exchange contracts, and expenses are translated at the rates of exchange prevailing on the respective dates of such transactions. Net realized and unrealized foreign currency exchange gains or losses related to investment securities are a component of net realized gain (loss) on investment transactions and change in net unrealized appreciation (depreciation) on investments, respectively.
Repurchase Agreements — The fund may enter into repurchase agreements with institutions that American Century Investment Management, Inc. (ACIM) (the investment advisor) has determined are creditworthy pursuant to criteria adopted by the Board of Directors. The fund requires that the collateral, represented by securities, received in a repurchase transaction be transferred to the custodian in a manner sufficient to enable the fund to obtain those securities in the event of a default under the repurchase agreement. ACIM monitors, on a daily basis, the securities transferred to ensure the value, including accrued interest, of the securities under each repurchase agreement is equal to or greater than amounts owed to the fund under each repurchase agreement.
Joint Trading Account — Pursuant to an Exemptive Order issued by the Securities and Exchange Commission, the fund, along with certain other funds in the American Century Investments family of funds, may transfer uninvested cash balances into a joint trading account. These balances are invested in one or more repurchase agreements that are collateralized by U.S. Treasury or Agency obligations.
Income Tax Status — It is the fund’s policy to distribute substantially all net investment income and net realized gains to shareholders and to otherwise qualify as a regulated investment company under provisions of the Internal Revenue Code. Accordingly, no provision has been made for income taxes. The fund files U.S. federal, state, local and non-U.S. tax returns as applicable. The fund's tax returns are subject to examination by the relevant taxing authority until expiration of the applicable statute of limitations, which is generally three years from the date of filing but can be longer in certain jurisdictions. At this time, management believes there are no uncertain tax positions which, based on their technical merit, would not be sustained upon examination and for which it is reasonably possible that the total amounts of unrecognized tax benefits will significantly change in the next twelve months.
Multiple Class — All shares of the fund represent an equal pro rata interest in the net assets of the class to which such shares belong, and have identical voting, dividend, liquidation and other rights and the same terms and conditions, except for class specific expenses and exclusive rights to vote on matters affecting only individual classes. Income, non-class specific expenses, and realized and unrealized capital gains and losses of the fund are allocated to each class of shares based on their relative net assets.
Distributions to Shareholders — Distributions from net investment income and net realized gains, if any, are generally declared and paid annually. The fund may make distributions on a more frequent basis to comply with the distribution requirements of the Internal Revenue Code, in all events in a manner consistent with provisions of the 1940 Act.
15
Indemnifications — Under the corporation’s organizational documents, its officers and directors are indemnified against certain liabilities arising out of the performance of their duties to the fund. In addition, in the normal course of business, the fund enters into contracts that provide general indemnifications. The maximum exposure under these arrangements is unknown as this would involve future claims that may be made against a fund. The risk of material loss from such claims is considered by management to be remote.
3. Fees and Transactions with Related Parties
Certain officers and directors of the corporation are also officers and/or directors of American Century Companies, Inc. (ACC). The corporation’s investment advisor, ACIM, the corporation's distributor, American Century Investment Services, Inc., and the corporation’s transfer agent, American Century Services, LLC, are wholly owned, directly or indirectly, by ACC. Various funds issued by American Century Asset Allocation Portfolios, Inc. own, in aggregate, 100% of the shares of the fund. Related parties do not invest in the fund for the purpose of exercising management or control.
Management Fees — The corporation has entered into a management agreement with ACIM, under which ACIM provides the fund with investment advisory and management services in exchange for a single, unified management fee (the fee) per class. The agreement provides that all expenses of managing and operating the fund, except distribution and service fees, brokerage expenses, taxes, interest, fees and expenses of the independent directors (including legal counsel fees), and extraordinary expenses, will be paid by ACIM. The fee is computed and accrued daily based on each class’s daily net assets and paid monthly in arrears. The rate of the fee is determined by applying a fee rate calculation formula. This formula takes into account the fund’s assets as well as certain assets, if any, of other clients of the investment advisor outside the American Century Investments family of funds (such as subadvised funds and separate accounts) that have very similar investment teams and investment strategies (strategy assets). The strategy assets of the fund also include the assets of Emerging Markets Fund, one fund in a series issued by the corporation. The annual management fee schedule ranges from 1.050% to 1.650% for the Institutional Class and 0.900% to 1.500% for the R6 Class. During the year ended November 30, 2016, the investment advisor agreed to waive 0.250% of the fund's management fee. The investment advisor expects this waiver to continue until July 31, 2017 and cannot terminate it prior to such date without the approval of the Board of Directors. The total amount of the waiver for each class for the year ended November 30, 2016 was $976,142 and $77,706 for the Institutional Class and R6 Class, respectively. The effective annual management fee before waiver for each class for the year ended November 30, 2016 was 1.42% for the Institutional Class and 1.27% for the R6 Class. The effective annual management fee after waiver for each class for the year ended November 30, 2016 was 1.17% for the Institutional Class and 1.02% for the R6 Class.
Directors' Fees and Expenses — The Board of Directors is responsible for overseeing the investment advisor’s management and operations of the fund. The directors receive detailed information about the fund and its investment advisor regularly throughout the year, and meet at least quarterly with management of the investment advisor to review reports about fund operations. The fund’s officers do not receive compensation from the fund.
Acquired Fund Fees and Expenses — The fund may invest in mutual funds, exchange-traded funds, and business development companies (the acquired funds). The fund will indirectly realize its pro rata share of the
fees and expenses of the acquired funds in which it invests. These indirect fees and expenses are not paid out of the fund's assets but are reflected in the return realized by the fund on its investment in the acquired funds.
Interfund Transactions — The fund may enter into security transactions with other American Century Investments funds and other client accounts of the investment advisor, in accordance with the 1940 Act rules and procedures adopted by the Board of Directors. The rules and procedures require, among other things, that these transactions be effected at the independent current market price of the security. There were no interfund transactions during the period.
4. Investment Transactions
Purchases and sales of investment securities, excluding short-term investments, for the year ended November 30, 2016 were $323,163,696 and $314,801,010, respectively.
16
5. Capital Share Transactions
Transactions in shares of the fund were as follows:
| Year ended November 30, 2016 | Year ended November 30, 2015 | |||||||||
| Shares | Amount | Shares | Amount | |||||||
| Institutional Class/Shares Authorized | 300,000,000 | 300,000,000 | ||||||||
| Sold | 8,207,796 | $ | 77,497,490 | 11,739,797 | $ | 121,732,892 | ||||
| Issued in reinvestment of distributions | 127,027 | 1,209,292 | 67,044 | 700,610 | ||||||
| Redeemed | (8,182,457 | ) | (83,579,731 | ) | (3,424,560 | ) | (36,763,331 | ) | ||
| 152,366 | (4,872,949 | ) | 8,382,281 | 85,670,171 | ||||||
| R6 Class/Shares Authorized | 40,000,000 | 40,000,000 | ||||||||
| Sold | 1,966,054 | 19,216,804 | 1,656,279 | 17,340,728 | ||||||
| Issued in reinvestment of distributions | 11,730 | 111,666 | 5,140 | 53,663 | ||||||
| Redeemed | (411,611 | ) | (4,227,601 | ) | (317,714 | ) | (3,154,807 | ) | ||
| 1,566,173 | 15,100,869 | 1,343,705 | 14,239,584 | |||||||
| Net increase (decrease) | 1,718,539 | $ | 10,227,920 | 9,725,986 | $ | 99,909,755 | ||||
6. Fair Value Measurements
The fund’s investments valuation process is based on several considerations and may use multiple inputs to determine the fair value of the investments held by the fund. In conformity with accounting principles generally accepted in the United States of America, the inputs used to determine a valuation are classified into three broad levels.
| • | Level 1 valuation inputs consist of unadjusted quoted prices in an active market for identical investments. |
| • | Level 2 valuation inputs consist of direct or indirect observable market data (including quoted prices for comparable investments, evaluations of subsequent market events, interest rates, prepayment speeds, credit risk, etc.). These inputs also consist of quoted prices for identical investments initially expressed in local currencies that are adjusted through translation into U.S. dollars. |
| • | Level 3 valuation inputs consist of unobservable data (including a fund’s own assumptions). |
The level classification is based on the lowest level input that is significant to the fair valuation measurement. The valuation inputs are not necessarily an indication of the risks associated with investing in these securities or other financial instruments. There were no significant transfers between levels during the period.
The following is a summary of the level classifications as of period end. The Schedule of Investments provides additional information on the fund’s portfolio holdings.
| Level 1 | Level 2 | Level 3 | ||||||
| Assets | ||||||||
| Investment Securities | ||||||||
| Common Stocks | ||||||||
| Brazil | $ | 18,034,229 | $ | 15,664,637 | — | |||
| China | 34,263,052 | 91,675,781 | — | |||||
| Mexico | 4,822,370 | 8,398,165 | — | |||||
| Peru | 4,321,980 | — | — | |||||
| Russia | 3,834,716 | 27,695,851 | — | |||||
| Other Countries | — | 210,980,642 | — | |||||
| Temporary Cash Investments | 5,222 | 27,094,000 | — | |||||
| $ | 65,281,569 | $ | 381,509,076 | — | ||||
17
7. Risk Factors
There are certain risks involved in investing in foreign securities. These risks include those resulting from future adverse political, social and economic developments, fluctuations in currency exchange rates, the possible imposition of exchange controls, and other foreign laws or restrictions. Investing in emerging markets may accentuate these risks.
8. Federal Tax Information
On December 20, 2016, the fund declared and paid the following per-share distributions from net investment income to shareholders of record on December 19, 2016:
| Institutional Class | R6 Class |
| $0.0823 | $0.0973 |
The tax character of distributions paid during the years ended November 30, 2016 and November 30, 2015 were as follows:
| 2016 | 2015 | |||||
| Distributions Paid From | ||||||
| Ordinary income | $ | 1,320,958 | $ | 754,273 | ||
| Long-term capital gains | — | — | ||||
The book-basis character of distributions made during the year from net investment income or net realized gains may differ from their ultimate characterization for federal income tax purposes. These differences reflect the differing character of certain income items and net realized gains and losses for financial statement and tax purposes, and may result in reclassification among certain capital accounts on the financial statements.
As of November 30, 2016, the federal tax cost of investments and the components of distributable earnings on a tax-basis were as follows:
| Federal tax cost of investments | $ | 410,113,575 | |
| Gross tax appreciation of investments | $ | 56,112,502 | |
| Gross tax depreciation of investments | (19,435,432 | ) | |
| Net tax appreciation (depreciation) of investments | 36,677,070 | ||
| Net tax appreciation (depreciation) on translation of assets and liabilities in foreign currencies | (97,697 | ) | |
| Net tax appreciation (depreciation) | $ | 36,579,373 | |
| Undistributed ordinary income | $ | 2,645,438 | |
| Accumulated short-term capital losses | $ | (3,473,814 | ) |
The difference between book-basis and tax-basis unrealized appreciation (depreciation) is attributable primarily to the tax deferral of losses on wash sales.
Accumulated capital losses represent net capital loss carryovers that may be used to offset future realized capital gains for federal income tax purposes. Any unlimited losses will be required to be utilized prior to the losses which carry an expiration date. Future capital loss carryover utilization in any given year may be subject to Internal Revenue Code limitations. Capital loss carryovers of $(1,146,451) expire in 2017 and the remaining losses are unlimited.
9. Recently Issued Accounting Guidance
In October 2016, the Securities and Exchange Commission adopted new rules and forms as well as amendments to its rules and forms to modernize the reporting and disclosure of information by registered investment companies. The amendments to Regulation S-X will require standardized, enhanced disclosure about derivatives in investment company financial statements, as well as other provisions. Compliance with the amendments is effective on August 1, 2017. Management is currently evaluating the impact that adopting the amendments will have on the financial statement disclosures.
18
| Financial Highlights |
| For a Share Outstanding Throughout the Years Ended November 30 (except as noted) | |||||||||||||||
| Per-Share Data | Ratios and Supplemental Data | ||||||||||||||
| Income From Investment Operations: | Ratio to Average Net Assets of: | ||||||||||||||
Net Asset Value, Beginning of Period | Net Investment Income (Loss)(1) | Net Realized and Unrealized Gain (Loss) | Total From Investment Operations | Distributions From Net Investment Income | Net Asset Value, End of Period | Total Return(2) | Operating Expenses | Operating Expenses (before expense waiver) | Net Investment Income (Loss) | Net Investment Income (Loss) (before expense waiver) | Portfolio Turnover Rate | Net Assets, End of Period (in thousands) | |||
| Institutional Class | |||||||||||||||
| 2016 | $9.75 | 0.05 | 0.50 | 0.55 | (0.03) | $10.27 | 5.68% | 1.18% | 1.43% | 0.53% | 0.28% | 75% | $394,433 | ||
| 2015 | $10.84 | 0.05 | (1.12) | (1.07) | (0.02) | $9.75 | (9.88)% | 1.24% | 1.49% | 0.49% | 0.24% | 61% | $372,802 | ||
| 2014 | $10.67 | 0.05 | 0.16 | 0.21 | (0.04) | $10.84 | 2.02% | 1.25% | 1.50% | 0.45% | 0.20% | 84% | $323,641 | ||
| 2013 | $10.05 | 0.04 | 0.63 | 0.67 | (0.05) | $10.67 | 6.66% | 1.42% | 1.52% | 0.38% | 0.28% | 76% | $269,117 | ||
| 2012 | $8.94 | 0.05 | 1.07 | 1.12 | (0.01) | $10.05 | 12.51% | 1.54% | 1.54% | 0.50% | 0.50% | 101% | $169,277 | ||
| R6 Class | |||||||||||||||
| 2016 | $9.75 | 0.06 | 0.52 | 0.58 | (0.05) | $10.28 | 5.94% | 1.03% | 1.28% | 0.68% | 0.43% | 75% | $39,383 | ||
| 2015 | $10.84 | 0.07 | (1.12) | (1.05) | (0.04) | $9.75 | (9.74)% | 1.09% | 1.34% | 0.64% | 0.39% | 61% | $22,095 | ||
| 2014 | $10.68 | 0.06 | 0.16 | 0.22 | (0.06) | $10.84 | 2.11% | 1.10% | 1.35% | 0.60% | 0.35% | 84% | $9,993 | ||
2013(3) | $9.90 | (0.01) | 0.79 | 0.78 | — | $10.68 | 7.88% | 1.12%(4) | 1.37%(4) | (0.37)%(4) | (0.62)%(4) | 76%(5) | $2,280 | ||
| Notes to Financial Highlights |
| (1) | Computed using average shares outstanding throughout the period. |
| (2) | Total returns are calculated based on the net asset value of the last business day. Total returns for periods less than one year are not annualized. |
| (3) | July 26, 2013 (commencement of sale) through November 30, 2013. |
| (4) | Annualized. |
| (5) | Portfolio turnover is calculated at the fund level. Percentage indicated was calculated for the year ended November 30, 2013. |
See Notes to Financial Statements.
| Report of Independent Registered Public Accounting Firm |
To the Board of Directors and Shareholders of American Century World Mutual Funds, Inc.:
We have audited the accompanying statement of assets and liabilities, including the schedule of investments, of NT Emerging Markets Fund (the “Fund”), one of the funds constituting American Century World Mutual Funds, Inc., as of November 30, 2016, and the related statement of operations for the year then ended, the statements of changes in net assets for each of the two years in the period then ended, and the financial highlights for each of the periods presented. These financial statements and financial highlights are the responsibility of the Fund’s management. Our responsibility is to express an opinion on these financial statements and financial highlights based on our audits.
We conducted our audits in accordance with the standards of the Public Company Accounting Oversight Board (United States). Those standards require that we plan and perform the audit to obtain reasonable assurance about whether the financial statements and financial highlights are free of material misstatement. The Fund is not required to have, nor were we engaged to perform, an audit of its internal control over financial reporting. Our audits included consideration of internal control over financial reporting as a basis for designing audit procedures that are appropriate in the circumstances, but not for the purpose of expressing an opinion on the effectiveness of the Fund’s internal control over financial reporting. Accordingly, we express no such opinion. An audit also includes examining, on a test basis, evidence supporting the amounts and disclosures in the financial statements, assessing the accounting principles used and significant estimates made by management, as well as evaluating the overall financial statement presentation. Our procedures included confirmation of securities owned as of November 30, 2016, by correspondence with the custodian and brokers; when replies were not received from brokers, we performed other auditing procedures. We believe that our audits provide a reasonable basis for our opinion.
In our opinion, the financial statements and financial highlights referred to above present fairly, in all material respects, the financial position of NT Emerging Markets Fund of American Century World Mutual Funds, Inc. as of November 30, 2016, the results of its operations for the year then ended, the changes in its net assets for each of the two years in the period then ended, and the financial highlights for each of the periods presented, in conformity with accounting principles generally accepted in the United States of America.
DELOITTE & TOUCHE LLP
Kansas City, Missouri
January 17, 2017
20
| Management |
The Board of Directors
The individuals listed below serve as directors of the funds. Each director will continue to serve in this capacity until death, retirement, resignation or removal from office. The board has adopted a mandatory retirement age for directors who are not “interested persons,” as that term is defined in the Investment Company Act (independent directors). Independent directors shall retire by December 31 of the year in which they reach their 75th birthday.
Mr. Thomas is an “interested person” because he currently serves as President and Chief Executive Officer of American Century Companies, Inc. (ACC), the parent company of American Century Investment Management, Inc. (ACIM or the advisor). The other directors (more than three-fourths of the total number) are independent. They are not employees, directors or officers of, and have no financial interest in, ACC or any of its wholly owned, direct or indirect, subsidiaries, including ACIM, American Century Investment Services, Inc. (ACIS) and American Century Services, LLC (ACS), and they do not have any other affiliations, positions or relationships that would cause them to be considered “interested persons” under the Investment Company Act. The directors serve in this capacity for seven (in the case of Mr. Thomas, 15) registered investment companies in the American Century Investments family of funds.
The following table presents additional information about the directors. The mailing address for each director is 4500 Main Street, Kansas City, Missouri 64111.
| Name (Year of Birth) | Position(s) Held with Funds | Length of Time Served | Principal Occupation(s) During Past 5 Years | Number of American Century Portfolios Overseen by Director | Other Directorships Held During Past 5 Years |
| Independent Directors | |||||
| Barry Fink (1955) | Director | Since 2012 | Retired; Executive Vice President, ACC (September 2007 to February 2013); President, ACS (October 2007 to February 2013); Chief Operating Officer, ACC (September 2007 to November 2012) | 81 | None |
| Andrea C. Hall (1945) | Director | Since 1997 | Retired | 81 | None |
| Jan M. Lewis (1957) | Director | Since 2011 | Retired; President and Chief Executive Officer, Catholic Charities of Northeast Kansas (human services organization) (2006 to 2013) | 81 | None |
| James A. Olson (1942) | Director and Chairman of the Board | Since 2007 (Chairman since 2014) | Member, Plaza Belmont LLC (private equity fund manager) (1999 to present) | 81 | Saia, Inc. (2002 to 2012) and EPR Properties (2003 to 2013) |
| M. Jeannine Strandjord (1945) | Director | Since 1994 | Retired | 81 | Euronet Worldwide Inc.; MGP Ingredients, Inc.; and DST Systems Inc. (1996 to 2012) |
21
| Name (Year of Birth) | Position(s) Held with Funds | Length of Time Served | Principal Occupation(s) During Past 5 Years | Number of American Century Portfolios Overseen by Director | Other Directorships Held During Past 5 Years |
| Independent Directors | |||||
| John R. Whitten (1946) | Director | Since 2008 | Retired | 81 | Rudolph Technologies, Inc. |
| Stephen E. Yates (1948) | Director | Since 2012 | Retired | 81 | None |
| Interested Director | |||||
| Jonathan S. Thomas (1963) | Director and President | Since 2007 | President and Chief Executive Officer, ACC (March 2007 to present). Also serves as Chief Executive Officer, ACS; Executive Vice President, ACIM; Director, ACC, ACIM and other ACC subsidiaries | 126 | BioMed Valley Discoveries, Inc. |
The Statement of Additional Information has additional information about the fund's directors and is available without charge, upon request, by calling 1-800-345-2021.
22
Officers
The following table presents certain information about the executive officers of the funds. Each officer serves as an officer for each of the 15 investment companies in the American Century family of funds, unless otherwise noted. No officer is compensated for his or her service as an officer of the funds. The listed officers are interested persons of the funds and are appointed or re-appointed on an annual basis. The mailing address for each officer listed below is 4500 Main Street, Kansas City, Missouri 64111.
| Name (Year of Birth) | Offices with the Funds | Principal Occupation(s) During the Past Five Years |
| Jonathan S. Thomas (1963) | Director and President since 2007 | President and Chief Executive Officer, ACC (March 2007 to present). Also serves as Chief Executive Officer, ACS; Executive Vice President, ACIM; Director, ACC, ACIM and other ACC subsidiaries |
| Amy D. Shelton (1964) | Chief Compliance Officer and Vice President since 2014 | Chief Compliance Officer, American Century funds, (March 2014 to present); Chief Compliance Officer, ACIM (February 2014 to present); Chief Compliance Officer, ACIS (October 2009 to present); Vice President, Client Interactions and Marketing, ACIS (February 2013 to January 2014); Director, Client Interactions and Marketing, ACIS (June 2007 to January 2013). Also serves as Vice President, ACIS |
| Charles A. Etherington (1957) | General Counsel since 2007 and Senior Vice President since 2006 | Attorney, ACC (February 1994 to present); Vice President, ACC (November 2005 to present); General Counsel, ACC (March 2007 to present). Also serves as General Counsel, ACIM, ACS, ACIS and other ACC subsidiaries; and Senior Vice President, ACIM and ACS |
| C. Jean Wade (1964) | Vice President,Treasurer and Chief Financial Officer since 2012 | Vice President, ACS (February 2000 to present) |
| Robert J. Leach (1966) | Vice President since 2006 and Assistant Treasurer since 2012 | Vice President, ACS (February 2000 to present) |
| David H. Reinmiller (1963) | Vice President since 2000 | Attorney, ACC (January 1994 to present); Associate General Counsel, ACC (January 2001 to present). Also serves as Vice President, ACIM and ACS |
| Ward D. Stauffer (1960) | Secretary since 2005 | Attorney, ACC (June 2003 to present) |
23
| Approval of Management Agreement |
At a meeting held on June 29, 2016, the Fund’s Board of Directors (the "Board") unanimously approved the renewal of the management agreement pursuant to which American Century Investment Management, Inc. (the “Advisor”) acts as the investment advisor for the Fund. Under Section 15(c) of the Investment Company Act, contracts for investment advisory services are required to be reviewed, evaluated, and approved by a majority of a fund’s directors (the “Directors”), including a majority of the independent Directors, each year.
Prior to its consideration of the renewal of the management agreement, the Directors requested and reviewed extensive data and information compiled by the Advisor and certain independent providers of evaluation data concerning the Fund and the services provided to the Fund by the Advisor. This review was in addition to the oversight and evaluation undertaken by the Board and its committees on a continual basis and the information received was supplemental to the extensive information that the Board and its committees receive and consider throughout the year.
In connection with its consideration of the renewal of the management agreement, the Board’s review and evaluation of the services provided by the Advisor included, but was not limited to, the following:
| • | the nature, extent, and quality of investment management, shareholder services, and other services provided and to be provided to the Fund; |
| • | the wide range of other programs and services provided and to be provided to the Fund and its shareholders on a routine and non-routine basis; |
| • | the investment performance of the Fund, including data comparing the Fund's performance to appropriate benchmarks and/or a peer group of other mutual funds with similar investment objectives and strategies; |
| • | the cost of owning the Fund compared to the cost of owning similar funds; |
| • | the compliance policies, procedures, and regulatory experience of the Advisor and the Fund's service providers; |
| • | financial data showing the cost of services provided to the Fund, the profitability of the Fund to the Advisor, and the overall profitability of the Advisor; |
| • | possible economies of scale associated with the Advisor’s management of the Fund and other accounts under its management; |
| • | data comparing services provided and charges to the Advisor's other investment management clients; |
| • | acquired fund fees and expenses; |
| • | payments by the Fund and the Advisor to financial intermediaries and the nature of services provided; and |
| • | any collateral benefits derived by the Advisor from the management of the Fund. |
In keeping with their practice, the Directors held two in-person meetings and one telephonic meeting to review and discuss the information provided. The independent Directors also had the benefit of the advice of their independent counsel throughout the process.
Factors Considered
The Directors considered all of the information provided by the Advisor, the independent data providers, and independent counsel in connection with the approval. They determined that the information was sufficient for them to evaluate the management agreement for the Fund. In connection with their review, the Directors did not identify any single factor as being all-important or controlling, and each Director may have attributed different levels of importance to different factors.
24
In deciding to renew the management agreement, the Board based its decision on a number of factors, including the following:
Nature, Extent and Quality of Services - Generally. Under the management agreement, the Advisor is responsible for providing or arranging for all services necessary for the operation of the Fund. The Board noted that under the management agreement, the Advisor provides or arranges at its own expense a wide variety of services including:
| • | constructing and designing the Fund |
| • | portfolio research and security selection |
| • | initial capitalization/funding |
| • | securities trading |
| • | Fund administration |
| • | custody of Fund assets |
| • | daily valuation of the Fund’s portfolio |
| • | shareholder servicing and transfer agency, including shareholder confirmations, recordkeeping, and communications |
| • | legal services (except the independent Directors’ counsel) |
| • | regulatory and portfolio compliance |
| • | financial reporting |
| • | marketing and distribution (except amounts paid by the Fund under Rule 12b-1 plans) |
The Board noted that many of these services have expanded over time in terms of both quantity and complexity in response to shareholder demands, competition in the industry, changing distribution channels, and the changing regulatory environment. The Board noted specifically the resources the Advisor has committed to enhancing cybersecurity protections for the benefit of shareholders.
Investment Management Services. The nature of the investment management services provided to the Fund is quite complex and allows Fund shareholders access to professional money management, instant diversification of their investments within an asset class, the opportunity to easily diversify among asset classes by investing in or exchanging among various American Century Investments funds, and liquidity. In evaluating investment performance, the Board expects the Advisor to manage the Fund in accordance with its investment objectives and approved strategies. Further, the Directors recognize that the Advisor has an obligation to monitor trading activities, and in particular to seek the best execution of fund trades, and to evaluate the use of and payment for research. In providing these services, the Advisor utilizes teams of investment professionals (portfolio managers, analysts, research assistants, and securities traders) who require extensive information technology, research, training, compliance, and other systems to conduct their business. The Board, directly and through its Fund Performance Review Committee, provides oversight of the investment performance process. It regularly reviews investment performance information for the Fund, together with comparative information for appropriate benchmarks and/or peer groups of similarly-managed funds, over different time horizons. The Directors also review detailed performance information provided by the Advisor during the management agreement approval process. If performance concerns are identified, the Fund receives special reviews until performance improves, during which the Board receives a report from the Advisor regarding the reasons for such results (e.g., market conditions, security selection) and any efforts being undertaken to improve performance. The Fund’s performance was above its benchmark for the one-, three-, and five-year periods reviewed by the Board. The Board found the investment management services provided by the Advisor to the Fund to be satisfactory and consistent with the management agreement.
Shareholder and Other Services. Under the management agreement, the Advisor provides the Fund with a comprehensive package of transfer agency, shareholder, and other services. The Board, directly and through various committees of the Board, regularly reviews reports and evaluations of such services at its regular meetings. These reports include, but are not limited to,
25
information regarding the operational efficiency and accuracy of the shareholder and transfer agency services provided, staffing levels, shareholder satisfaction (as measured by external as well as internal sources), technology support, new products and services offered to Fund shareholders, securities trading activities, portfolio valuation services, auditing services, and legal and operational compliance activities. The Board particularly noted the Advisor’s continual efforts to maintain effective business continuity plans and to address cybersecurity threats. Certain aspects of shareholder and transfer agency service level efficiency and the quality of securities trading activities are measured by independent third party providers and are presented in comparison to other fund groups not managed by the Advisor. The Board found the services provided by the Advisor to the Fund under the management agreement to be competitive and of high quality.
Costs of Services and Profitability. The Advisor provides detailed information concerning its cost of providing various services to the Fund, its profitability in managing the Fund (pre- and post-distribution), its overall profitability, and its financial condition. The Directors have reviewed with the Advisor the methodology used to prepare this financial information. This information is considered in evaluating the Advisor’s financial condition, its ability to continue to provide services under the management agreement, and the reasonableness of the current management fee. The Board concluded that the Advisor’s profits were reasonable in light of the services provided to the Fund.
Ethics. The Board generally considers the Advisor’s commitment to providing quality services to shareholders and to conducting its business ethically. They noted that the Advisor’s practices generally meet or exceed industry best practices.
Economies of Scale. The Board also reviewed information provided by the Advisor regarding the possible existence of economies of scale in connection with the management of the Fund. The Board concluded that economies of scale are difficult to measure and predict with precision, especially on a fund-by-fund basis. The Board concluded that the Advisor is appropriately sharing economies of scale through its competitive fee structure, offering competitive fees from fund inception, and through reinvestment in its business to provide shareholders additional content and services. The Board also noted that economies of scale are shared with the Fund and its shareholders through management fee breakpoints that serve to reduce the effective management fee as the assets of the Fund grow.
Comparison to Other Funds’ Fees. The management agreement provides that the Fund pays the Advisor a single, all-inclusive (or unified) management fee for providing all services necessary for the management and operation of the Fund, other than brokerage expenses, expenses attributable to short sales, taxes, interest, extraordinary expenses, and the fees and expenses of the Fund’s independent Directors (including their independent legal counsel) and expenses incurred in connection with the provision of shareholder services and distribution services under a plan adopted pursuant to Rule 12b-1 under the 1940 Act. Under the unified fee structure, the Advisor is responsible for providing all investment advisory, custody, audit, administrative, compliance, recordkeeping, marketing and shareholder services, or arranging and supervising third parties to provide such services. By contrast, most other funds are charged a variety of fees, including an investment advisory fee, a transfer agency fee, an administrative fee, distribution charges, and other expenses. Other than their investment advisory fees and any applicable Rule 12b-1 distribution fees, all other components of the total fees charged by these other funds may be increased without shareholder approval. The Board believes the unified fee structure is a benefit to Fund shareholders because it clearly discloses to shareholders the cost of owning Fund shares, and, since the unified fee cannot be increased without a vote of Fund shareholders, it shifts to the Advisor the risk of increased costs of operating the Fund and provides a direct incentive to minimize administrative inefficiencies. Part of the Board’s analysis of fee levels involves reviewing certain evaluative data compiled by an independent provider comparing the Fund’s unified fee to the total expense ratios of its peers. The unified fee charged to shareholders of the Fund was above the median of the total expense ratios of the Fund’s peer expense universe and was within the range of its peer expense group. The Board concluded that the management fee paid by the
26
Fund to the Advisor under the management agreement is reasonable in light of the services provided to the Fund.
Comparison to Fees and Services Provided to Other Clients of the Advisor. The Directors also requested and received information from the Advisor concerning the nature of the services, fees, costs, and profitability of its advisory services to advisory clients other than the Fund. They observed that these varying types of client accounts require different services and involve different regulatory and entrepreneurial risks than the management of the Fund. The Board analyzed this information and concluded that the fees charged and services provided to the Fund were reasonable by comparison.
Payments to Intermediaries. The Directors also requested and received a description of payments made to intermediaries by the Fund and the Advisor. These payments include various payments made by the Fund or the Advisor to different types of intermediaries and recordkeepers for distribution and service activities provided for the Fund. The Board received confirmation from the Advisor that all such payments by the Fund intended for distribution were made pursuant to the Fund's 12b-1 Plan. The Board reviewed such information and found the payments to be reasonable in scope and purpose.
Collateral or “Fall-Out” Benefits Derived by the Advisor. The Board considered the existence of collateral benefits the Advisor may receive as a result of its relationship with the Fund. They concluded that the Advisor’s primary business is managing mutual funds and it generally does not use fund or shareholder information to generate profits in other lines of business, and therefore does not derive any significant collateral benefits from them. The Board noted that additional assets from other clients may offer the Advisor some benefit from increased leverage with service providers and counterparties. Additionally, the Advisor receives proprietary research from broker-dealers that execute fund portfolio transactions, which the Board concluded is likely to benefit other clients of the Advisor, as well as Fund shareholders. The Board also determined that the Advisor is able to provide investment management services to certain clients other than the Fund, at least in part, due to its existing infrastructure built to serve the fund complex. The Board concluded that appropriate allocation methodologies had been employed to assign resources and the cost of those resources to these other clients and, where expressly provided, these other client assets may be included with the assets of the Fund to determine breakpoints in the management fee schedule.
Existing Relationship. The Board also considered whether there was any reason for not continuing the existing arrangement with the Advisor. In this regard, the Board was mindful of the potential disruptions of the Fund’s operations and various risks, uncertainties, and other effects that could occur as a result of a decision not to continue such relationship. In particular, the Board recognized that most shareholders have invested in the Fund on the strength of the Advisor’s industry standing and reputation and in the expectation that the Advisor will have a continuing role in providing advisory services to the Fund.
Conclusion of the Directors. As a result of this process, the Board, including all of the independent Directors, taking into account all of the factors discussed above and the information provided by the Advisor and others in connection with its review and throughout the year, determined that the management fee is fair and reasonable in light of the services provided and that the investment management agreement between the Fund and the Advisor should be renewed.
27
| Additional Information |
Retirement Account Information
As required by law, distributions you receive from certain IRAs are subject to federal income tax withholding, unless you elect not to have withholding apply. Tax will be withheld on the total amount withdrawn even though you may be receiving amounts that are not subject to withholding, such as nondeductible contributions. In such case, excess amounts of withholding could occur. You may adjust your withholding election so that a greater or lesser amount will be withheld.
If you don’t want us to withhold on this amount, you must notify us to not withhold the federal income tax. You may notify us in writing or in certain situations by telephone or through other electronic means. For systematic withdrawals, your withholding election will remain in effect until revoked or changed by filing a new election. You have the right to revoke your election at any time.
Remember, even if you elect not to have income tax withheld, you are liable for paying income tax on the taxable portion of your withdrawal. If you elect not to have income tax withheld or you don’t have enough income tax withheld, you may be responsible for payment of estimated tax. You may incur penalties under the estimated tax rules if your withholding and estimated tax payments are not sufficient. You can reduce or defer the income tax on a distribution by directly or indirectly rolling such distribution over to another IRA or eligible plan. You should consult your tax advisor for additional information.
State tax will be withheld if, at the time of your distribution, your address is within one of the mandatory withholding states and you have federal income tax withheld (or as otherwise required by state law). State taxes will be withheld from your distribution in accordance with the respective state rules.
Distributions you receive from 403(b), 457 and qualified plans are subject to special tax and withholding rules. Your plan administrator or plan sponsor is required to provide you with a special tax notice explaining those rules at the time you request a distribution. If applicable, federal and/or state taxes may be withheld from your distribution amount.
Proxy Voting Policies
A description of the policies that the fund's investment advisor uses in exercising the voting rights associated with the securities purchased and/or held by the fund is available without charge, upon request, by calling 1-800-345-2021. It is also available on the "About Us" page of American Century Investments’ website at americancentury.com and on the Securities and Exchange Commission’s website at sec.gov. Information regarding how the investment advisor voted proxies relating to portfolio securities during the most recent 12-month period ended June 30 is available on the "About Us" page at americancentury.com. It is also available at sec.gov.
Quarterly Portfolio Disclosure
The fund files its complete schedule of portfolio holdings with the Securities and Exchange Commission (SEC) for the first and third quarters of each fiscal year on Form N-Q. The fund’s Forms N-Q are available on the SEC’s website at sec.gov, and may be reviewed and copied at the SEC’s Public Reference Room in Washington, DC. Information on the operation of the Public Reference Room may be obtained by calling 1-800-SEC-0330. The fund also makes its complete schedule of portfolio holdings for the most recent quarter of its fiscal year available on its website at americancentury.com and, upon request, by calling 1-800-345-2021.
28
Other Tax Information
The following information is provided pursuant to provisions of the Internal Revenue Code.
The fund hereby designates up to the maximum amount allowable as qualified dividend income for the fiscal year ended November 30, 2016.
For the fiscal year ended November 30, 2016, the fund intends to pass through to shareholders foreign source income of $7,876,762 and foreign taxes paid of $895,135, or up to the maximum amount allowable, as a foreign tax credit. Foreign source income and foreign tax expense per outstanding share on November 30, 2016 are $0.1865 and $0.0212, respectively.
29
| Notes |
30
| Notes |
31
| Notes |
32
| ||
| Contact Us | americancentury.com | |
| Automated Information Line | 1-800-345-8765 | |
| Investor Services Representative | 1-800-345-2021 or 816-531-5575 | |
| Investors Using Advisors | 1-800-378-9878 | |
| Business, Not-For-Profit, Employer-Sponsored Retirement Plans | 1-800-345-3533 | |
| Banks and Trust Companies, Broker-Dealers, Financial Professionals, Insurance Companies | 1-800-345-6488 | |
| Telecommunications Relay Service for the Deaf | 711 | |
| American Century World Mutual Funds, Inc. | ||
Investment Advisor: American Century Investment Management, Inc. Kansas City, Missouri | ||
| This report and the statements it contains are submitted for the general information of our shareholders. The report is not authorized for distribution to prospective investors unless preceded or accompanied by an effective prospectus. | ||
| ©2017 American Century Proprietary Holdings, Inc. All rights reserved. CL-ANN-91023 1701 | ||
| Annual Report | |
| November 30, 2016 | |
| NT International Growth Fund | |
| Table of Contents |
| Performance | 2 | |
| Portfolio Commentary | ||
| Fund Characteristics | ||
| Shareholder Fee Example | ||
| Schedule of Investments | ||
| Statement of Assets and Liabilities | ||
| Statement of Operations | ||
| Statement of Changes in Net Assets | ||
| Notes to Financial Statements | ||
| Financial Highlights | ||
| Report of Independent Registered Public Accounting Firm | ||
| Management | ||
| Approval of Management Agreement | ||
| Additional Information | ||
Any opinions expressed in this report reflect those of the author as of the date of the report, and do not necessarily represent the opinions of American Century Investments® or any other person in the American Century Investments organization. Any such opinions are subject to change at any time based upon market or other conditions and American Century Investments disclaims any responsibility to update such opinions. These opinions may not be relied upon as investment advice and, because investment decisions made by American Century Investments funds are based on numerous factors, may not be relied upon as an indication of trading intent on behalf of any American Century Investments fund. Security examples are used for representational purposes only and are not intended as recommendations to purchase or sell securities. Performance information for comparative indices and securities is provided to American Century Investments by third party vendors. To the best of American Century Investments’ knowledge, such information is accurate at the time of printing.
| Performance |
| Total Returns as of November 30, 2016 | ||||||
Average Annual Returns | ||||||
Ticker Symbol | 1 year | 5 years | 10 years | Since Inception | Inception Date | |
Institutional Class | ACLNX | -8.69% | 5.45% | 1.72% | — | 5/12/06 |
MSCI EAFE Index | — | -3.66% | 5.61% | 0.72% | — | — |
MSCI EAFE Growth Index | — | -5.88% | 5.92% | 1.69% | — | — |
| R6 Class | ACDNX | -8.46% | — | — | 0.06% | 7/26/13 |
Average annual returns since inception are presented when ten years of performance history is not available.
| Growth of $10,000 Over 10 Years |
| $10,000 investment made November 30, 2006 |
| Performance for other share classes will vary due to differences in fee structure. |
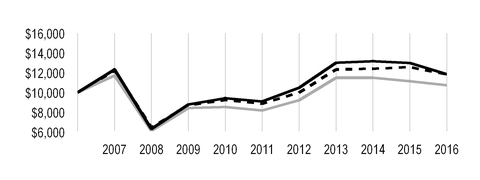
| Value on November 30, 2016 | |
| Institutional Class — $11,863 | |
| MSCI EAFE Index — $10,746 | |
MSCI EAFE Growth Index — $11,831 | |
Total Annual Fund Operating Expenses | |
| Institutional Class | R6 Class |
| 0.98% | 0.83% |
The total annual fund operating expenses shown is as stated in the fund’s prospectus current as of the date of this report. The prospectus may vary from the expense ratio shown elsewhere in this report because it is based on a different time period, includes acquired fund fees and expenses, and, if applicable, does not include fee waivers or expense reimbursements.
Data presented reflect past performance. Past performance is no guarantee of future results. Current performance may be higher or lower than the performance shown. Total returns for periods less than one year are not annualized. Investment return and principal value will fluctuate, and redemption value may be more or less than original cost. Data assumes reinvestment of dividends and capital gains, and none of the charts reflect the deduction of taxes that a shareholder would pay on fund distributions or the redemption of fund shares. To obtain performance data current to the most recent month end, please call 1-800-345-2021 or visit americancentury.com. For additional information about the fund, please consult the prospectus.
2
| Portfolio Commentary |
Portfolio Manager: Raj Gandhi and James Gendelman
Performance Summary
NT International Growth declined -8.69%* for the 12 months ended November 30, 2016. The portfolio’s benchmark, the MSCI EAFE Index, declined -3.66% for the same period.
Non-U.S. developed market stocks declined during the 12-month period, sharply lagging returns provided by U.S.-based equities. Among non-U.S. developed market stocks, the Asia Pacific region fared the best, delivering a small gain, equities based in the Far East posted modest losses, and those based in Europe sharply lagged. Over the last 12 months, our process faced a number of headwinds that meaningfully impacted results:
(1) The strongest driver of stock price performance has been dividend yield; current income is not a key consideration in our process;
(2) The scarcity of growth around the globe has led to a continuation of central bank policy characterized by abnormally low interest rates. This has led to uncertainty and volatility for stocks and helped more defensive securities outperform;
(3) The degree of intra-stock correlation has increased. As a result, the market has not been differentiating among securities based on earnings or fundamentals; and
(4) Currency volatility has been high, causing currency effects to have a larger-than-normal impact on relative returns.
In addition, the uncertainty associated with the U.K.’s late June Brexit vote triggered a sharp market correction that spilled into the beginning of the third quarter, with most equity markets continuing to decline. Subsequently, a combination of better-than-expected earnings and the realization that the aftermath of Brexit would not be as bad as originally feared, led to a rerating of stocks and a market turnaround. Markets recovered some of their Brexit-related losses, finishing lower for the year but well above their lowest levels.
Overall, the fund lagged its benchmark, primarily due to stock selection in the financials, information technology, consumer staples, and health care sectors. Regionally, stock selection in Japan and the U.K. and positioning in Australia also contributed to the fund’s underperformance.
Italian Bank was a Top Detractor
Among individual detractors to performance Italy-based bank Intesa Sanpaolo, which declined due to concerns over weakness in the Italian banking sector and the fear that regulators may force it to take over a lower-quality bank. Ongoing concerns about the negative interest rate environment in Europe on net interest margins also weighed heavily on the stock. Although we continue to view Intesa Sanpaolo as one of the highest-quality banks in Italy, with strong capital ratio and continued strong loan growth, persistent pressure on the stock due to worries over Italian banks in general convinced us to sell the position.
*All fund returns referenced in this commentary are for Institutional Class shares. Performance for other share
classes will vary due to differences in fee structure; when Institutional Class performance exceeds that of the
fund's benchmark, other share classes may not. See page 2 for returns for all share classes.
3
In the health care sector, Denmark-based pharmaceutical company Novo Nordisk weighed on returns. Renewed concern over pricing pressure on insulin products in the U.S. and a competitive threat resulting from the patent expiration of Sanofi’s insulin treatment, Lantus, triggered a sharp decline in the stock in the third quarter. As a result, we eliminated the position.
Consumer Discretionary Sector was Main Contributor
Strong stock selection in consumer discretionary benefited performance. Regionally, stock selection in Germany and Portugal and portfolio-only positions in China aided results.
Germany-based adidas added value, as the shares delivered strong returns in the second and third quarters. Resurgent strength in the adidas brand in both sports and fashion contributed to better-than-expected financial results in May. The athletic shoe and apparel manufacturer is seeing positive results from restructuring efforts put in place by its new CEO. In particular, margins have improved. The company is also benefiting from soccer’s increased popularity.
Another standout performer was portfolio-only holding Tencent, a social media and online gaming company headquartered in China. A continued shift in global advertising spending away from traditional media, such as television and newspapers, to online and mobile has boosted Tencent’s advertising revenues and enabled it to deliver consistently strong financial results. The company has more than 1.5 billion active users and continues to attract more. Another positive trend for Tencent is the transition of games from PC to mobile.
Outlook
Portfolio positioning remains a function of bottom-up stock selection. Selection of stocks exhibiting improving and strong, sustainable growth that, based on inflecting earnings, is not well represented in either consensus or the stock price helps the investment team identify market trends. The complexion of the consumer discretionary sector has changed. We are finding opportunities in companies that have positioned themselves to profit from the continued shift in consumer behavior from offline to online commerce. We also favor those that are benefiting from the proliferation of smartphones and the subsequent expansion of content-driven applications and digital advertising development. We remain underweight financials but have added slightly to our positions as the steepening of the yield curve should lead to improved net interest margins. Our process has identified improvement in the materials sector driven by stabilization of the supply/demand balance, better pricing, and a stronger outlook for residential construction in both Europe and the U.S.
4
| Fund Characteristics |
| NOVEMBER 30, 2016 | |
Top Ten Holdings | % of net assets |
| Roche Holding AG | 2.9% |
| AIA Group Ltd. | 2.1% |
| Shire plc | 1.9% |
| CRH plc | 1.7% |
| Rio Tinto plc | 1.7% |
| Tencent Holdings Ltd. | 1.6% |
| Kering | 1.5% |
| TOTAL SA | 1.5% |
| Reckitt Benckiser Group plc | 1.5% |
| SAP SE | 1.5% |
Types of Investments in Portfolio | % of net assets |
| Common Stocks | 96.6% |
| Exchange-Traded Funds | 1.2% |
| Total Equity Exposure | 97.8% |
| Temporary Cash Investments | 2.0% |
| Other Assets and Liabilities | 0.2% |
Investments by Country | % of net assets |
| United Kingdom | 19.2% |
| France | 16.5% |
| Japan | 13.7% |
| Germany | 8.2% |
| Switzerland | 5.4% |
| Hong Kong | 3.1% |
| China | 3.1% |
| Ireland | 2.8% |
| Netherlands | 2.4% |
| Australia | 2.2% |
| Denmark | 2.2% |
| Belgium | 2.2% |
| Sweden | 2.0% |
| Other Countries | 13.6% |
| Exchange-Traded Funds | 1.2% |
| Cash and Equivalents* | 2.2% |
*Includes temporary cash investments and other assets and liabilities.
5
| Shareholder Fee Example |
Fund shareholders may incur two types of costs: (1) transaction costs, including sales charges (loads) on purchase payments and redemption/exchange fees; and (2) ongoing costs, including management fees; distribution and service (12b-1) fees; and other fund expenses. This example is intended to help you understand your ongoing costs (in dollars) of investing in your fund and to compare these costs with the ongoing cost of investing in other mutual funds.
The example is based on an investment of $1,000 made at the beginning of the period and held for the entire period from June 1, 2016 to November 30, 2016.
Actual Expenses
The table provides information about actual account values and actual expenses for each class. You may use the information, together with the amount you invested, to estimate the expenses that you paid over the period. First, identify the share class you own. Then simply divide your account value by $1,000 (for example, an $8,600 account value divided by $1,000 = 8.6), then multiply the result by the number under the heading “Expenses Paid During Period” to estimate the expenses you paid on your account during this period.
Hypothetical Example for Comparison Purposes
The table also provides information about hypothetical account values and hypothetical expenses based on the actual expense ratio of each class of your fund and an assumed rate of return of 5% per year before expenses, which is not the actual return of a fund’s share class. The hypothetical account values and expenses may not be used to estimate the actual ending account balance or expenses you paid for the period. You may use this information to compare the ongoing costs of investing in your fund and other funds. To do so, compare this 5% hypothetical example with the 5% hypothetical examples that appear in the shareholder reports of the other funds.
Please note that the expenses shown in the table are meant to highlight your ongoing costs only and do not reflect any transactional costs, such as sales charges (loads) or redemption/exchange fees. Therefore, the table is useful in comparing ongoing costs only, and will not help you determine the relative total costs of owning different funds. In addition, if these transactional costs were included, your costs would have been higher.
| Beginning Account Value 6/1/16 | Ending Account Value 11/30/16 | Expenses Paid During Period(1) 6/1/16 - 11/30/16 | Annualized Expense Ratio(1) | |
Actual | ||||
| Institutional Class | $1,000 | $947.70 | $4.77 | 0.98% |
| R6 Class | $1,000 | $948.70 | $4.04 | 0.83% |
Hypothetical | ||||
| Institutional Class | $1,000 | $1,020.10 | $4.95 | 0.98% |
| R6 Class | $1,000 | $1,020.85 | $4.19 | 0.83% |
| (1) | Expenses are equal to the class's annualized expense ratio listed in the table above, multiplied by the average account value over the period, multiplied by 183, the number of days in the most recent fiscal half-year, divided by 366, to reflect the one-half year period. |
6
| Schedule of Investments |
NOVEMBER 30, 2016
| Shares | Value | ||||
| COMMON STOCKS — 96.6% | |||||
| Australia — 2.2% | |||||
| CSL Ltd. | 67,080 | $ | 4,854,451 | ||
| Fortescue Metals Group Ltd. | 1,792,840 | 7,771,425 | |||
| Treasury Wine Estates Ltd. | 1,000,520 | 7,972,018 | |||
| 20,597,894 | |||||
| Austria — 1.0% | |||||
| Erste Group Bank AG | 326,690 | 9,085,398 | |||
| Belgium — 2.2% | |||||
| KBC Group NV | 231,480 | 13,880,998 | |||
| UCB SA | 96,300 | 6,195,256 | |||
| 20,076,254 | |||||
| Brazil — 0.4% | |||||
| BM&FBovespa SA - Bolsa de Valores Mercadorias e Futuros | 828,400 | 4,068,457 | |||
| Canada — 1.1% | |||||
| Alimentation Couche-Tard, Inc., B Shares | 214,260 | 9,887,573 | |||
| China — 3.1% | |||||
Alibaba Group Holding Ltd. ADR(1) | 145,540 | 13,683,671 | |||
| Tencent Holdings Ltd. | 596,400 | 14,893,661 | |||
| 28,577,332 | |||||
| Denmark — 2.2% | |||||
| DSV A/S | 215,150 | 9,681,267 | |||
| Pandora A/S | 88,670 | 10,552,720 | |||
| 20,233,987 | |||||
| France — 16.5% | |||||
ArcelorMittal(1) | 1,621,010 | 12,246,096 | |||
| Arkema SA | 99,550 | 9,535,817 | |||
| BNP Paribas SA | 218,150 | 12,665,476 | |||
Criteo SA ADR(1) | 169,710 | 7,003,932 | |||
| Danone SA | 118,730 | 7,469,622 | |||
| Essilor International SA | 101,911 | 10,811,835 | |||
| Kering | 65,970 | 14,333,249 | |||
| L'Oreal SA | 38,050 | 6,494,709 | |||
| Legrand SA | 66,960 | 3,743,538 | |||
| Publicis Groupe SA | 144,300 | 9,364,290 | |||
| Rexel SA | 312,770 | 4,836,427 | |||
| Thales SA | 115,700 | 11,297,406 | |||
| TOTAL SA | 299,571 | 14,273,223 | |||
| Valeo SA | 190,430 | 10,618,128 | |||
| Vinci SA | 120,480 | 7,818,501 | |||
| Vivendi SA | 567,360 | 10,817,681 | |||
| 153,329,930 | |||||
| Germany — 8.2% | |||||
| adidas AG | 79,490 | 11,710,396 | |||
Deutsche Boerse AG(1) | 94,530 | 7,639,304 | |||
| Fresenius Medical Care AG & Co. KGaA | 106,450 | 8,303,626 | |||
| HeidelbergCement AG | 135,620 | 12,161,572 | |||
7
| Shares | Value | ||||
| Infineon Technologies AG | 403,060 | $ | 6,740,948 | ||
| SAP SE | 166,400 | 13,911,197 | |||
| Symrise AG | 46,795 | 2,832,409 | |||
Zalando SE(1) | 345,620 | 12,881,124 | |||
| 76,180,576 | |||||
| Hong Kong — 3.1% | |||||
| AIA Group Ltd. | 3,170,400 | 19,333,452 | |||
| Sands China Ltd. | 1,903,600 | 9,375,043 | |||
| 28,708,495 | |||||
| India — 1.4% | |||||
| HDFC Bank Ltd. | 208,860 | 4,162,313 | |||
| Tata Motors Ltd. | 1,383,060 | 9,280,485 | |||
| 13,442,798 | |||||
| Indonesia — 1.7% | |||||
| Astra International Tbk PT | 15,470,400 | 8,618,448 | |||
| Bank Mandiri Persero Tbk PT | 9,496,800 | 7,357,787 | |||
| 15,976,235 | |||||
| Ireland — 2.8% | |||||
| CRH plc | 487,110 | 16,259,716 | |||
Ryanair Holdings plc ADR(1) | 117,354 | 9,369,543 | |||
| 25,629,259 | |||||
| Israel — 0.6% | |||||
Mobileye NV(1) | 162,860 | 6,063,278 | |||
| Italy — 0.3% | |||||
| Azimut Holding SpA | 208,410 | 3,110,037 | |||
| Japan — 13.7% | |||||
| Calbee, Inc. | 270,100 | 8,416,647 | |||
| CyberAgent, Inc. | 129,700 | 3,152,797 | |||
| Daikin Industries Ltd. | 118,900 | 11,135,995 | |||
| Daito Trust Construction Co. Ltd. | 70,600 | 10,969,057 | |||
| FANUC CORP. | 25,500 | 4,302,937 | |||
| Fast Retailing Co. Ltd. | 20,700 | 7,159,644 | |||
| Fuji Heavy Industries Ltd. | 69,200 | 2,809,615 | |||
| Isuzu Motors Ltd. | 176,200 | 2,077,652 | |||
| Keyence Corp. | 14,900 | 10,188,602 | |||
| Komatsu Ltd. | 439,400 | 10,114,592 | |||
LINE Corp.(1) | 186,400 | 7,185,211 | |||
| Nitori Holdings Co. Ltd. | 91,500 | 9,549,495 | |||
| NTT DOCOMO, Inc. | 310,400 | 7,119,353 | |||
| ORIX Corp. | 748,000 | 11,647,760 | |||
| Ryohin Keikaku Co. Ltd. | 49,300 | 9,665,653 | |||
| Start Today Co. Ltd. | 421,900 | 6,479,422 | |||
| Sysmex Corp. | 90,800 | 5,468,397 | |||
| 127,442,829 | |||||
| Mexico — 1.2% | |||||
Cemex SAB de CV ADR(1) | 1,075,028 | 8,395,969 | |||
| Fomento Economico Mexicano SAB de CV ADR | 30,610 | 2,389,110 | |||
| 10,785,079 | |||||
| Netherlands — 2.4% | |||||
| ASML Holding NV | 69,460 | 7,186,507 | |||
| Koninklijke DSM NV | 143,080 | 8,677,030 | |||
8
| Shares | Value | ||||
| Koninklijke Vopak NV | 128,490 | $ | 6,005,542 | ||
| 21,869,079 | |||||
| Norway — 1.7% | |||||
| DNB ASA | 506,400 | 7,458,867 | |||
| Statoil ASA | 495,750 | 8,495,710 | |||
| 15,954,577 | |||||
| Portugal — 1.1% | |||||
| Jeronimo Martins SGPS SA | 668,370 | 10,561,823 | |||
| Russia — 0.5% | |||||
| Magnit PJSC GDR | 104,530 | 4,210,468 | |||
| South Korea — 0.7% | |||||
| Amorepacific Corp. | 12,380 | 3,473,453 | |||
| BGF retail Co. Ltd. | 44,060 | 3,278,919 | |||
| 6,752,372 | |||||
| Spain — 1.9% | |||||
| Cellnex Telecom SA | 310,625 | 4,352,233 | |||
| Industria de Diseno Textil SA | 390,765 | 13,366,761 | |||
| 17,718,994 | |||||
| Sweden — 2.0% | |||||
| Hexagon AB, B Shares | 286,920 | 10,163,591 | |||
Lundin Petroleum AB(1) | 458,290 | 8,636,293 | |||
| 18,799,884 | |||||
| Switzerland — 5.4% | |||||
| Chocoladefabriken Lindt & Spruengli AG | 1,020 | 5,026,261 | |||
| Cie Financiere Richemont SA | 68,480 | 4,475,751 | |||
| Julius Baer Group Ltd. | 259,230 | 11,455,891 | |||
| Roche Holding AG | 120,554 | 26,880,684 | |||
| Zurich Insurance Group AG | 10,430 | 2,733,938 | |||
| 50,572,525 | |||||
| United Kingdom — 19.2% | |||||
| Admiral Group plc | 198,275 | 4,716,031 | |||
| Ashtead Group plc | 677,933 | 13,291,756 | |||
ASOS plc(1) | 154,961 | 9,785,484 | |||
| Auto Trader Group plc | 1,481,776 | 7,410,428 | |||
| Aviva plc | 2,322,661 | 12,990,323 | |||
| Bunzl plc | 264,830 | 6,825,917 | |||
| Compass Group plc | 390,160 | 6,692,784 | |||
| London Stock Exchange Group plc | 292,150 | 10,044,983 | |||
| Reckitt Benckiser Group plc | 165,710 | 14,022,153 | |||
| RELX plc | 163,250 | 2,808,552 | |||
| Rio Tinto plc | 410,916 | 15,372,724 | |||
| Royal Dutch Shell plc, A Shares | 356,260 | 9,054,418 | |||
| Shire plc | 306,530 | 17,872,508 | |||
| St. James's Place plc | 638,430 | 7,508,751 | |||
Tullow Oil plc(1) | 1,310,470 | 4,882,906 | |||
| Weir Group plc (The) | 599,670 | 13,565,548 | |||
| Wolseley plc | 214,900 | 12,489,605 | |||
| Worldpay Group plc | 2,613,537 | 8,802,992 | |||
| 178,137,863 | |||||
TOTAL COMMON STOCKS (Cost $844,668,605) | 897,772,996 | ||||
9
| Shares | Value | ||||
| EXCHANGE-TRADED FUNDS — 1.2% | |||||
| iShares MSCI EAFE ETF (Cost $11,353,637) | 194,600 | $ | 11,051,334 | ||
| TEMPORARY CASH INVESTMENTS — 2.0% | |||||
| Repurchase Agreement, Fixed Income Clearing Corp., (collateralized by various U.S. Treasury obligations, 3.75%, 11/15/43, valued at $18,635,925), at 0.08%, dated 11/30/16, due 12/1/16 (Delivery value $18,266,041) | 18,266,000 | ||||
| State Street Institutional U.S. Government Money Market Fund, Premier Class | 3,379 | 3,379 | |||
TOTAL TEMPORARY CASH INVESTMENTS (Cost $18,269,379) | 18,269,379 | ||||
TOTAL INVESTMENT SECURITIES — 99.8% (Cost $874,291,621) | 927,093,709 | ||||
| OTHER ASSETS AND LIABILITIES — 0.2% | 2,277,895 | ||||
| TOTAL NET ASSETS — 100.0% | $ | 929,371,604 | |||
| MARKET SECTOR DIVERSIFICATION | ||
(as a % of net assets) | ||
| Consumer Discretionary | 19.6 | % |
| Financials | 16.0 | % |
| Industrials | 13.0 | % |
| Information Technology | 12.3 | % |
| Materials | 10.0 | % |
| Consumer Staples | 9.0 | % |
| Health Care | 8.7 | % |
| Energy | 5.5 | % |
| Telecommunication Services | 1.3 | % |
| Real Estate | 1.2 | % |
| Exchange-Traded Funds | 1.2 | % |
| Cash and Equivalents* | 2.2 | % |
*Includes temporary cash investments and other assets and liabilities.
| NOTES TO SCHEDULE OF INVESTMENTS | ||
| ADR | - | American Depositary Receipt |
| GDR | - | Global Depositary Receipt |
| (1) | Non-income producing. |
See Notes to Financial Statements.
10
| Statement of Assets and Liabilities |
| NOVEMBER 30, 2016 | |||
| Assets | |||
| Investment securities, at value (cost of $874,291,621) | $ | 927,093,709 | |
| Receivable for investments sold | 760,676 | ||
| Receivable for capital shares sold | 52,588 | ||
| Dividends and interest receivable | 2,338,574 | ||
| Other assets | 12,929 | ||
| 930,258,476 | |||
| Liabilities | |||
| Foreign currency overdraft payable, at value (cost of $135,966) | 154,514 | ||
| Payable for investments purchased | 892 | ||
| Payable for capital shares redeemed | 1,411 | ||
| Accrued management fees | 730,055 | ||
| 886,872 | |||
| Net Assets | $ | 929,371,604 | |
| Net Assets Consist of: | |||
| Capital (par value and paid-in surplus) | $ | 910,343,764 | |
| Undistributed net investment income | 4,398,902 | ||
| Accumulated net realized loss | (38,010,750 | ) | |
| Net unrealized appreciation | 52,639,688 | ||
| $ | 929,371,604 | ||
| Net Assets | Shares Outstanding | Net Asset Value Per Share | ||||
| Institutional Class, $0.01 Par Value | $845,423,283 | 87,954,447 | $9.61 | |||
| R6 Class, $0.01 Par Value | $83,948,321 | 8,726,666 | $9.62 | |||
See Notes to Financial Statements.
11
| Statement of Operations |
| YEAR ENDED NOVEMBER 30, 2016 | |||
| Investment Income (Loss) | |||
| Income: | |||
| Dividends (net of foreign taxes withheld of $1,852,382) | $ | 17,286,454 | |
| Interest (net of foreign taxes withheld of $1,425) | 24,935 | ||
| 17,311,389 | |||
| Expenses: | |||
| Management fees | 8,494,314 | ||
| Directors' fees and expenses | 29,218 | ||
| Other expenses | 37,969 | ||
| 8,561,501 | |||
| Net investment income (loss) | 8,749,888 | ||
| Realized and Unrealized Gain (Loss) | |||
| Net realized gain (loss) on: | |||
| Investment transactions (net of foreign tax expenses paid (refunded) of $1,196) | (34,510,221 | ) | |
| Foreign currency transactions | (241,586 | ) | |
| (34,751,807 | ) | ||
| Change in net unrealized appreciation (depreciation) on: | |||
| Investments | (43,616,807 | ) | |
| Translation of assets and liabilities in foreign currencies | (25,773 | ) | |
| (43,642,580 | ) | ||
| Net realized and unrealized gain (loss) | (78,394,387 | ) | |
| Net Increase (Decrease) in Net Assets Resulting from Operations | $ | (69,644,499 | ) |
See Notes to Financial Statements.
12
| Statement of Changes in Net Assets |
| YEARS ENDED NOVEMBER 30, 2016 AND NOVEMBER 30, 2015 | ||||||
| Increase (Decrease) in Net Assets | November 30, 2016 | November 30, 2015 | ||||
| Operations | ||||||
| Net investment income (loss) | $ | 8,749,888 | $ | 6,033,670 | ||
| Net realized gain (loss) | (34,751,807 | ) | 25,543,145 | |||
| Change in net unrealized appreciation (depreciation) | (43,642,580 | ) | (36,306,946 | ) | ||
| Net increase (decrease) in net assets resulting from operations | (69,644,499 | ) | (4,730,131 | ) | ||
| Distributions to Shareholders | ||||||
| From net investment income: | ||||||
| Institutional Class | (5,713,153 | ) | (4,445,815 | ) | ||
| R6 Class | (434,699 | ) | (177,103 | ) | ||
| From net realized gains: | ||||||
| Institutional Class | (23,995,241 | ) | (32,506,946 | ) | ||
| R6 Class | (1,521,449 | ) | (994,137 | ) | ||
| Decrease in net assets from distributions | (31,664,542 | ) | (38,124,001 | ) | ||
| Capital Share Transactions | ||||||
| Net increase (decrease) in net assets from capital share transactions (Note 5) | 188,346,075 | (81,703,913 | ) | |||
| Net increase (decrease) in net assets | 87,037,034 | (124,558,045 | ) | |||
| Net Assets | ||||||
| Beginning of period | 842,334,570 | 966,892,615 | ||||
| End of period | $ | 929,371,604 | $ | 842,334,570 | ||
| Undistributed net investment income | $ | 4,398,902 | $ | 2,418,163 | ||
See Notes to Financial Statements.
13
| Notes to Financial Statements |
NOVEMBER 30, 2016
1. Organization
American Century World Mutual Funds, Inc. (the corporation) is registered under the Investment Company Act of 1940, as amended (the 1940 Act), as an open-end management investment company and is organized as a Maryland corporation. NT International Growth Fund (the fund) is one fund in a series issued by the corporation. The fund’s investment objective is to seek capital growth. The fund is not permitted to invest in securities issued by companies assigned the Global Industry Classification Standard for the tobacco industry.
The fund offers the Institutional Class and the R6 Class, which have different fees and expenses. The difference in the fee structures between the classes is the result of their separate arrangements for shareholder and distribution services, which may be provided indirectly through another American Century Investments mutual fund. As a result, the investment advisor is able to charge the R6 Class a lower unified management fee.
2. Significant Accounting Policies
The following is a summary of significant accounting policies consistently followed by the fund in preparation of its financial statements. The fund is an investment company and follows accounting and reporting guidance in accordance with accounting principles generally accepted in the United States of America. This may require management to make certain estimates and assumptions at the date of the financial statements. Actual results could differ from these estimates. Management evaluated the impact of events or transactions occurring through the date the financial statements were issued that would merit recognition or disclosure.
Investment Valuations — The fund determines the fair value of its investments and computes its net asset value per share at the close of regular trading (usually 4 p.m. Eastern time) on the New York Stock Exchange (NYSE) on each day the NYSE is open. The Board of Directors has adopted valuation policies and procedures to guide the investment advisor in the fund’s investment valuation process and to provide methodologies for the oversight of the fund’s pricing function.
Equity securities that are listed or traded on a domestic securities exchange are valued at the last reported sales price or at the official closing price as provided by the exchange. Equity securities traded on foreign securities exchanges are generally valued at the closing price of such securities on the exchange where primarily traded or at the close of the NYSE, if that is earlier. If no last sales price is reported, or if local convention or regulation so provides, the mean of the latest bid and asked prices may be used. Securities traded over-the-counter are valued at the mean of the latest bid and asked prices, the last sales price, or the official closing price. Equity securities initially expressed in local currencies are translated into U.S. dollars at the mean of the appropriate currency exchange rate at the close of the NYSE as provided by an independent pricing service.
Open-end management investment companies are valued at the reported net asset value per share. Repurchase agreements are valued at cost, which approximates fair value.
If the fund determines that the market price for an investment is not readily available or the valuation methods mentioned above do not reflect an investment’s fair value, such investment is valued as determined in good faith by the Board of Directors or its delegate, in accordance with policies and procedures adopted by the Board of Directors. In its determination of fair value, the fund may review several factors including, but not limited to, market information regarding the specific investment or comparable investments and correlation with other investment types, futures indices or general market indicators. Circumstances that may cause the fund to use these procedures to value an investment include, but are not limited to: an investment has been declared in default or is distressed; trading in a security has been suspended during the trading day or a security is not actively trading on its principal exchange; prices received from a regular pricing source are deemed unreliable; or there is a foreign market holiday and no trading occurred.
The fund monitors for significant events occurring after the close of an investment’s primary exchange but before the fund’s net asset value per share is determined. Significant events may include, but are not limited to: corporate announcements and transactions; governmental action and political unrest that could impact a specific investment or an investment sector; or armed conflicts, natural disasters and similar events that could
14
affect investments in a specific country or region. The fund also monitors for significant fluctuations between domestic and foreign markets, as evidenced by the U.S. market or such other indicators that the Board of Directors, or its delegate, deems appropriate. If significant fluctuations in foreign markets are identified, the fund may apply a model-derived factor to the closing price of equity securities traded on foreign securities exchanges. The factor is based on observable market data as provided by an independent pricing service.
Security Transactions — Security transactions are accounted for as of the trade date. Net realized gains and losses are determined on the identified cost basis, which is also used for federal income tax purposes. Certain countries impose taxes on realized gains on the sale of securities registered in their country. The fund records the foreign tax expense, if any, on an accrual basis. The foreign tax expense on realized gains and unrealized appreciation reduces the net realized gain (loss) on investment transactions and net unrealized appreciation (depreciation) on investments, respectively.
Investment Income — Dividend income less foreign taxes withheld, if any, is recorded as of the ex-dividend date. Distributions received on securities that represent a return of capital or long-term capital gain are recorded as a reduction of cost of investments and/or as a realized gain. The fund may estimate the components of distributions received that may be considered nontaxable distributions or long-term capital gain distributions for income tax purposes. Interest income less foreign taxes withheld, if any, is recorded on the accrual basis and includes accretion of discounts and amortization of premiums.
Foreign Currency Translations — All assets and liabilities initially expressed in foreign currencies are translated into U.S. dollars at prevailing exchange rates at period end. The fund may enter into spot foreign currency exchange contracts to facilitate transactions denominated in a foreign currency. Purchases and sales of investment securities, dividend and interest income, spot foreign currency exchange contracts, and expenses are translated at the rates of exchange prevailing on the respective dates of such transactions. Net realized and unrealized foreign currency exchange gains or losses related to investment securities are a component of net realized gain (loss) on investment transactions and change in net unrealized appreciation (depreciation) on investments, respectively.
Repurchase Agreements — The fund may enter into repurchase agreements with institutions that American Century Investment Management, Inc. (ACIM) (the investment advisor) has determined are creditworthy pursuant to criteria adopted by the Board of Directors. The fund requires that the collateral, represented by securities, received in a repurchase transaction be transferred to the custodian in a manner sufficient to enable the fund to obtain those securities in the event of a default under the repurchase agreement. ACIM monitors, on a daily basis, the securities transferred to ensure the value, including accrued interest, of the securities under each repurchase agreement is equal to or greater than amounts owed to the fund under each repurchase agreement.
Joint Trading Account — Pursuant to an Exemptive Order issued by the Securities and Exchange Commission, the fund, along with certain other funds in the American Century Investments family of funds, may transfer uninvested cash balances into a joint trading account. These balances are invested in one or more repurchase agreements that are collateralized by U.S. Treasury or Agency obligations.
Income Tax Status — It is the fund’s policy to distribute substantially all net investment income and net realized gains to shareholders and to otherwise qualify as a regulated investment company under provisions of the Internal Revenue Code. Accordingly, no provision has been made for income taxes. The fund files U.S. federal, state, local and non-U.S. tax returns as applicable. The fund's tax returns are subject to examination by the relevant taxing authority until expiration of the applicable statute of limitations, which is generally three years from the date of filing but can be longer in certain jurisdictions. At this time, management believes there are no uncertain tax positions which, based on their technical merit, would not be sustained upon examination and for which it is reasonably possible that the total amounts of unrecognized tax benefits will significantly change in the next twelve months.
Multiple Class — All shares of the fund represent an equal pro rata interest in the net assets of the class to which such shares belong, and have identical voting, dividend, liquidation and other rights and the same terms and conditions, except for class specific expenses and exclusive rights to vote on matters affecting only individual classes. Income, non-class specific expenses, and realized and unrealized capital gains and losses of the fund are allocated to each class of shares based on their relative net assets.
Distributions to Shareholders — Distributions from net investment income and net realized gains, if any, are generally declared and paid annually. The fund may make distributions on a more frequent basis to comply with the distribution requirements of the Internal Revenue Code, in all events in a manner consistent with provisions of the 1940 Act.
15
Indemnifications — Under the corporation’s organizational documents, its officers and directors are indemnified against certain liabilities arising out of the performance of their duties to the fund. In addition, in the normal course of business, the fund enters into contracts that provide general indemnifications. The maximum exposure under these arrangements is unknown as this would involve future claims that may be made against a fund. The risk of material loss from such claims is considered by management to be remote.
3. Fees and Transactions with Related Parties
Certain officers and directors of the corporation are also officers and/or directors of American Century Companies, Inc. (ACC). The corporation’s investment advisor, ACIM, the corporation's distributor, American Century Investment Services, Inc., and the corporation’s transfer agent, American Century Services, LLC, are wholly owned, directly or indirectly, by ACC. Various funds issued by American Century Asset Allocation Portfolios, Inc. own, in aggregate, 100% of the shares of the fund. Related parties do not invest in the fund for the purpose of exercising management or control.
Management Fees — The corporation has entered into a management agreement with ACIM, under which ACIM provides the fund with investment advisory and management services in exchange for a single, unified management fee (the fee) per class. The agreement provides that all expenses of managing and operating the fund, except distribution and service fees, brokerage expenses, taxes, interest, fees and expenses of the independent directors (including legal counsel fees), and extraordinary expenses, will be paid by ACIM. The fee is computed and accrued daily based on each class’s daily net assets and paid monthly in arrears. The rate of the fee is determined by applying a fee rate calculation formula. This formula takes into account the fund’s assets as well as certain assets, if any, of other clients of the investment advisor outside the American Century Investments family of funds (such as subadvised funds and separate accounts) that have very similar investment teams and investment strategies (strategy assets). The strategy assets of the fund also include the assets of International Growth Fund, one fund in a series issued by the corporation. The annual management fee schedule ranges from 0.850% to 1.300% for the Institutional Class and 0.700% to 1.150% for the R6 Class. The effective annual management fee for each class for the year ended November 30, 2016 was 0.97% for the Institutional Class and 0.82% for the R6 Class.
Directors' Fees and Expenses — The Board of Directors is responsible for overseeing the investment advisor’s management and operations of the fund. The directors receive detailed information about the fund and its investment advisor regularly throughout the year, and meet at least quarterly with management of the investment advisor to review reports about fund operations. The fund’s officers do not receive compensation from the fund.
Interfund Transactions — The fund may enter into security transactions with other American Century Investments funds and other client accounts of the investment advisor, in accordance with the 1940 Act rules and procedures adopted by the Board of Directors. The rules and procedures require, among other things, that these transactions be effected at the independent current market price of the security. During the period, the interfund purchases and sales were $18,325,510 and $90,696, respectively. The effect of interfund transactions on the Statement of Operations was $(26,425) in net realized gain (loss) on investment transactions.
4. Investment Transactions
Purchases and sales of investment securities, excluding short-term investments, for the year ended November 30, 2016 were $784,435,096 and $600,183,792, respectively.
16
5. Capital Share Transactions
Transactions in shares of the fund were as follows:
| Year ended November 30, 2016 | Year ended November 30, 2015 | |||||||||
| Shares | Amount | Shares | Amount | |||||||
| Institutional Class/Shares Authorized | 560,000,000 | 520,000,000 | ||||||||
| Sold | 21,881,050 | $ | 212,057,635 | 20,052,758 | $ | 221,419,288 | ||||
| Issued in reinvestment of distributions | 2,887,113 | 29,708,394 | 3,473,004 | 36,952,761 | ||||||
| Redeemed | (9,532,690 | ) | (97,969,015 | ) | (31,869,055 | ) | (359,661,904 | ) | ||
| 15,235,473 | 143,797,014 | (8,343,293 | ) | (101,289,855 | ) | |||||
| R6 Class/Shares Authorized | 40,000,000 | 40,000,000 | ||||||||
| Sold | 5,047,460 | 50,034,983 | 3,382,368 | 37,379,941 | ||||||
| Issued in reinvestment of distributions | 190,102 | 1,956,148 | 110,183 | 1,171,240 | ||||||
| Redeemed | (742,018 | ) | (7,442,070 | ) | (1,696,365 | ) | (18,965,239 | ) | ||
| 4,495,544 | 44,549,061 | 1,796,186 | 19,585,942 | |||||||
| Net increase (decrease) | 19,731,017 | $ | 188,346,075 | (6,547,107 | ) | $ | (81,703,913 | ) | ||
6. Fair Value Measurements
The fund’s investments valuation process is based on several considerations and may use multiple inputs to determine the fair value of the investments held by the fund. In conformity with accounting principles generally accepted in the United States of America, the inputs used to determine a valuation are classified into three broad levels.
| • | Level 1 valuation inputs consist of unadjusted quoted prices in an active market for identical investments. |
| • | Level 2 valuation inputs consist of direct or indirect observable market data (including quoted prices for comparable investments, evaluations of subsequent market events, interest rates, prepayment speeds, credit risk, etc.). These inputs also consist of quoted prices for identical investments initially expressed in local currencies that are adjusted through translation into U.S. dollars. |
| • | Level 3 valuation inputs consist of unobservable data (including a fund’s own assumptions). |
The level classification is based on the lowest level input that is significant to the fair valuation measurement. The valuation inputs are not necessarily an indication of the risks associated with investing in these securities or other financial instruments. There were no significant transfers between levels during the period.
The following is a summary of the level classifications as of period end. The Schedule of Investments provides additional information on the fund’s portfolio holdings.
| Level 1 | Level 2 | Level 3 | ||||||
| Assets | ||||||||
| Investment Securities | ||||||||
| Common Stocks | ||||||||
| China | $ | 13,683,671 | $ | 14,893,661 | — | |||
| France | 7,003,932 | 146,325,998 | — | |||||
| Ireland | 9,369,543 | 16,259,716 | — | |||||
| Israel | 6,063,278 | — | — | |||||
| Mexico | 10,785,079 | — | — | |||||
| Other Countries | — | 673,388,118 | — | |||||
| Exchange-Traded Funds | 11,051,334 | — | — | |||||
| Temporary Cash Investments | 3,379 | 18,266,000 | — | |||||
| $ | 57,960,216 | $ | 869,133,493 | — | ||||
17
7. Risk Factors
There are certain risks involved in investing in foreign securities. These risks include those resulting from future adverse political, social and economic developments, fluctuations in currency exchange rates, the possible imposition of exchange controls, and other foreign laws or restrictions. Investing in emerging markets may accentuate these risks.
8. Federal Tax Information
On December 20, 2016, the fund declared and paid the following per-share distributions from net investment income to shareholders of record on December 19, 2016:
| Institutional Class | R6 Class |
| $0.0893 | $0.1037 |
The tax character of distributions paid during the years ended November 30, 2016 and November 30, 2015 were as follows:
| 2016 | 2015 | |||||
| Distributions Paid From | ||||||
| Ordinary income | $ | 6,524,309 | $ | 4,622,918 | ||
| Long-term capital gains | $ | 25,140,233 | $ | 33,501,083 | ||
The book-basis character of distributions made during the year from net investment income or net realized gains may differ from their ultimate characterization for federal income tax purposes. These differences reflect the differing character of certain income items and net realized gains and losses for financial statement and tax purposes, and may result in reclassification among certain capital accounts on the financial statements.
As of November 30, 2016, the federal tax cost of investments and the components of distributable earnings on a tax-basis were as follows:
| Federal tax cost of investments | $ | 884,606,031 | |
| Gross tax appreciation of investments | $ | 76,758,742 | |
| Gross tax depreciation of investments | (34,271,064 | ) | |
| Net tax appreciation (depreciation) of investments | 42,487,678 | ||
| Net tax appreciation (depreciation) on translation of assets and liabilities in foreign currencies | (162,400 | ) | |
| Net tax appreciation (depreciation) | $ | 42,325,278 | |
| Undistributed ordinary income | $ | 8,906,575 | |
| Accumulated short-term capital losses | $ | (32,204,013 | ) |
The difference between book-basis and tax-basis unrealized appreciation (depreciation) is attributable primarily to the tax deferral of losses on wash sales.
Accumulated capital losses represent net capital loss carryovers that may be used to offset future realized capital gains for federal income tax purposes. The capital loss carryovers may be carried forward for an unlimited period. Future capital loss carryover utilization in any given year may be subject to Internal Revenue Code limitations.
9. Recently Issued Accounting Guidance
In October 2016, the Securities and Exchange Commission adopted new rules and forms as well as amendments to its rules and forms to modernize the reporting and disclosure of information by registered investment companies. The amendments to Regulation S-X will require standardized, enhanced disclosure about derivatives in investment company financial statements, as well as other provisions. Compliance with the amendments is effective on August 1, 2017. Management is currently evaluating the impact that adopting the amendments will have on the financial statement disclosures.
18
| Financial Highlights |
| For a Share Outstanding Throughout the Years Ended November 30 (except as noted) | |||||||||||||||
| Per-Share Data | Ratios and Supplemental Data | ||||||||||||||
| Income From Investment Operations: | Distributions From: | Ratio to Average Net Assets of: | |||||||||||||
Net Asset Value, Beginning of Period | Net Investment Income (Loss)(1) | Net Realized and Unrealized Gain (Loss) | Total From Investment Operations | Net Investment Income | Net Realized Gains | Total Distributions | Net Asset Value, End of Period | Total Return(2) | Operating Expenses | Net Investment Income (Loss) | Portfolio Turnover Rate | Net Assets, End of Period (in thousands) | |||
| Institutional Class | |||||||||||||||
| 2016 | $10.95 | 0.10 | (1.02) | (0.92) | (0.08) | (0.34) | (0.42) | $9.61 | (8.69)% | 0.98% | 0.98% | 69% | $845,423 | ||
| 2015 | $11.58 | 0.08 | (0.26) | (0.18) | (0.05) | (0.40) | (0.45) | $10.95 | (1.44)% | 0.97% | 0.69% | 83% | $795,985 | ||
| 2014 | $12.17 | 0.10 | 0.03 | 0.13 | (0.17) | (0.55) | (0.72) | $11.58 | 1.26% | 0.98% | 0.86% | 67% | $938,672 | ||
| 2013 | $9.94 | 0.11 | 2.27 | 2.38 | (0.15) | — | (0.15) | $12.17 | 24.27% | 1.02% | 1.01% | 89% | $771,045 | ||
| 2012 | $8.71 | 0.13 | 1.17 | 1.30 | (0.07) | — | (0.07) | $9.94 | 15.13% | 1.08% | 1.47% | 93% | $487,964 | ||
| R6 Class | |||||||||||||||
| 2016 | $10.95 | 0.11 | (1.00) | (0.89) | (0.10) | (0.34) | (0.44) | $9.62 | (8.46)% | 0.83% | 1.13% | 69% | $83,948 | ||
| 2015 | $11.59 | 0.10 | (0.27) | (0.17) | (0.07) | (0.40) | (0.47) | $10.95 | (1.37)% | 0.82% | 0.84% | 83% | $46,349 | ||
| 2014 | $12.18 | 0.11 | 0.04 | 0.15 | (0.19) | (0.55) | (0.74) | $11.59 | 1.43% | 0.83% | 1.01% | 67% | $28,220 | ||
2013(3) | $11.13 | (0.01) | 1.06 | 1.05 | — | — | — | $12.18 | 9.43% | 0.85%(4) | (0.34)%(4) | 89%(5) | $6,561 | ||
| Notes to Financial Highlights |
| (1) | Computed using average shares outstanding throughout the period. |
| (2) | Total returns are calculated based on the net asset value of the last business day. Total returns for periods less than one year are not annualized. |
| (3) | July 26, 2013 (commencement of sale) through November 30, 2013. |
| (4) | Annualized. |
| (5) | Portfolio turnover is calculated at the fund level. Percentage indicated was calculated for the year ended November 30, 2013. |
See Notes to Financial Statements.
| Report of Independent Registered Public Accounting Firm |
To the Board of Directors and Shareholders of American Century World Mutual Funds, Inc.:
We have audited the accompanying statement of assets and liabilities, including the schedule of investments, of NT International Growth Fund (the “Fund”), one of the funds constituting American Century World Mutual Funds, Inc., as of November 30, 2016, and the related statement of operations for the year then ended, the statements of changes in net assets for each of the two years in the period then ended, and the financial highlights for each of the periods presented. These financial statements and financial highlights are the responsibility of the Fund’s management. Our responsibility is to express an opinion on these financial statements and financial highlights based on our audits.
We conducted our audits in accordance with the standards of the Public Company Accounting Oversight Board (United States). Those standards require that we plan and perform the audit to obtain reasonable assurance about whether the financial statements and financial highlights are free of material misstatement. The Fund is not required to have, nor were we engaged to perform, an audit of its internal control over financial reporting. Our audits included consideration of internal control over financial reporting as a basis for designing audit procedures that are appropriate in the circumstances, but not for the purpose of expressing an opinion on the effectiveness of the Fund’s internal control over financial reporting. Accordingly, we express no such opinion. An audit also includes examining, on a test basis, evidence supporting the amounts and disclosures in the financial statements, assessing the accounting principles used and significant estimates made by management, as well as evaluating the overall financial statement presentation. Our procedures included confirmation of securities owned as of November 30, 2016, by correspondence with the custodian and brokers; when replies were not received from brokers, we performed other auditing procedures. We believe that our audits provide a reasonable basis for our opinion.
In our opinion, the financial statements and financial highlights referred to above present fairly, in all material respects, the financial position of NT International Growth Fund of American Century World Mutual Funds, Inc. as of November 30, 2016, the results of its operations for the year then ended, the changes in its net assets for each of the two years in the period then ended, and the financial highlights for each of the periods presented, in conformity with accounting principles generally accepted in the United States of America.
DELOITTE & TOUCHE LLP
Kansas City, Missouri
January 17, 2017
20
| Management |
The Board of Directors
The individuals listed below serve as directors of the funds. Each director will continue to serve in this capacity until death, retirement, resignation or removal from office. The board has adopted a mandatory retirement age for directors who are not “interested persons,” as that term is defined in the Investment Company Act (independent directors). Independent directors shall retire by December 31 of the year in which they reach their 75th birthday.
Mr. Thomas is an “interested person” because he currently serves as President and Chief Executive Officer of American Century Companies, Inc. (ACC), the parent company of American Century Investment Management, Inc. (ACIM or the advisor). The other directors (more than three-fourths of the total number) are independent. They are not employees, directors or officers of, and have no financial interest in, ACC or any of its wholly owned, direct or indirect, subsidiaries, including ACIM, American Century Investment Services, Inc. (ACIS) and American Century Services, LLC (ACS), and they do not have any other affiliations, positions or relationships that would cause them to be considered “interested persons” under the Investment Company Act. The directors serve in this capacity for seven (in the case of Mr. Thomas, 15) registered investment companies in the American Century Investments family of funds.
The following table presents additional information about the directors. The mailing address for each director is 4500 Main Street, Kansas City, Missouri 64111.
| Name (Year of Birth) | Position(s) Held with Funds | Length of Time Served | Principal Occupation(s) During Past 5 Years | Number of American Century Portfolios Overseen by Director | Other Directorships Held During Past 5 Years |
| Independent Directors | |||||
| Barry Fink (1955) | Director | Since 2012 | Retired; Executive Vice President, ACC (September 2007 to February 2013); President, ACS (October 2007 to February 2013); Chief Operating Officer, ACC (September 2007 to November 2012) | 81 | None |
| Andrea C. Hall (1945) | Director | Since 1997 | Retired | 81 | None |
| Jan M. Lewis (1957) | Director | Since 2011 | Retired; President and Chief Executive Officer, Catholic Charities of Northeast Kansas (human services organization) (2006 to 2013) | 81 | None |
| James A. Olson (1942) | Director and Chairman of the Board | Since 2007 (Chairman since 2014) | Member, Plaza Belmont LLC (private equity fund manager) (1999 to present) | 81 | Saia, Inc. (2002 to 2012) and EPR Properties (2003 to 2013) |
| M. Jeannine Strandjord (1945) | Director | Since 1994 | Retired | 81 | Euronet Worldwide Inc.; MGP Ingredients, Inc.; and DST Systems Inc. (1996 to 2012) |
21
| Name (Year of Birth) | Position(s) Held with Funds | Length of Time Served | Principal Occupation(s) During Past 5 Years | Number of American Century Portfolios Overseen by Director | Other Directorships Held During Past 5 Years |
| Independent Directors | |||||
| John R. Whitten (1946) | Director | Since 2008 | Retired | 81 | Rudolph Technologies, Inc. |
| Stephen E. Yates (1948) | Director | Since 2012 | Retired | 81 | None |
| Interested Director | |||||
| Jonathan S. Thomas (1963) | Director and President | Since 2007 | President and Chief Executive Officer, ACC (March 2007 to present). Also serves as Chief Executive Officer, ACS; Executive Vice President, ACIM; Director, ACC, ACIM and other ACC subsidiaries | 126 | BioMed Valley Discoveries, Inc. |
The Statement of Additional Information has additional information about the fund's directors and is available without charge, upon request, by calling 1-800-345-2021.
22
Officers
The following table presents certain information about the executive officers of the funds. Each officer serves as an officer for each of the 15 investment companies in the American Century family of funds, unless otherwise noted. No officer is compensated for his or her service as an officer of the funds. The listed officers are interested persons of the funds and are appointed or re-appointed on an annual basis. The mailing address for each officer listed below is 4500 Main Street, Kansas City, Missouri 64111.
| Name (Year of Birth) | Offices with the Funds | Principal Occupation(s) During the Past Five Years |
| Jonathan S. Thomas (1963) | Director and President since 2007 | President and Chief Executive Officer, ACC (March 2007 to present). Also serves as Chief Executive Officer, ACS; Executive Vice President, ACIM; Director, ACC, ACIM and other ACC subsidiaries |
| Amy D. Shelton (1964) | Chief Compliance Officer and Vice President since 2014 | Chief Compliance Officer, American Century funds, (March 2014 to present); Chief Compliance Officer, ACIM (February 2014 to present); Chief Compliance Officer, ACIS (October 2009 to present); Vice President, Client Interactions and Marketing, ACIS (February 2013 to January 2014); Director, Client Interactions and Marketing, ACIS (June 2007 to January 2013). Also serves as Vice President, ACIS |
| Charles A. Etherington (1957) | General Counsel since 2007 and Senior Vice President since 2006 | Attorney, ACC (February 1994 to present); Vice President, ACC (November 2005 to present); General Counsel, ACC (March 2007 to present). Also serves as General Counsel, ACIM, ACS, ACIS and other ACC subsidiaries; and Senior Vice President, ACIM and ACS |
| C. Jean Wade (1964) | Vice President,Treasurer and Chief Financial Officer since 2012 | Vice President, ACS (February 2000 to present) |
| Robert J. Leach (1966) | Vice President since 2006 and Assistant Treasurer since 2012 | Vice President, ACS (February 2000 to present) |
| David H. Reinmiller (1963) | Vice President since 2000 | Attorney, ACC (January 1994 to present); Associate General Counsel, ACC (January 2001 to present). Also serves as Vice President, ACIM and ACS |
| Ward D. Stauffer (1960) | Secretary since 2005 | Attorney, ACC (June 2003 to present) |
23
| Approval of Management Agreement |
At a meeting held on June 29, 2016, the Fund’s Board of Directors (the "Board") unanimously approved the renewal of the management agreement pursuant to which American Century Investment Management, Inc. (the “Advisor”) acts as the investment advisor for the Fund. Under Section 15(c) of the Investment Company Act, contracts for investment advisory services are required to be reviewed, evaluated, and approved by a majority of a fund’s directors (the “Directors”), including a majority of the independent Directors, each year.
Prior to its consideration of the renewal of the management agreement, the Directors requested and reviewed extensive data and information compiled by the Advisor and certain independent providers of evaluation data concerning the Fund and the services provided to the Fund by the Advisor. This review was in addition to the oversight and evaluation undertaken by the Board and its committees on a continual basis and the information received was supplemental to the extensive information that the Board and its committees receive and consider throughout the year.
In connection with its consideration of the renewal of the management agreement, the Board’s review and evaluation of the services provided by the Advisor included, but was not limited to, the following:
| • | the nature, extent, and quality of investment management, shareholder services, and other services provided and to be provided to the Fund; |
| • | the wide range of other programs and services provided and to be provided to the Fund and its shareholders on a routine and non-routine basis; |
| • | the investment performance of the Fund, including data comparing the Fund's performance to appropriate benchmarks and/or a peer group of other mutual funds with similar investment objectives and strategies; |
| • | the cost of owning the Fund compared to the cost of owning similar funds; |
| • | the compliance policies, procedures, and regulatory experience of the Advisor and the Fund's service providers; |
| • | financial data showing the cost of services provided to the Fund, the profitability of the Fund to the Advisor, and the overall profitability of the Advisor; |
| • | possible economies of scale associated with the Advisor’s management of the Fund and other accounts under its management; |
| • | data comparing services provided and charges to the Advisor's other investment management clients; |
| • | acquired fund fees and expenses; |
| • | payments by the Fund and the Advisor to financial intermediaries and the nature of services provided; and |
| • | any collateral benefits derived by the Advisor from the management of the Fund. |
In keeping with their practice, the Directors held two in-person meetings and one telephonic meeting to review and discuss the information provided. The independent Directors also had the benefit of the advice of their independent counsel throughout the process.
Factors Considered
The Directors considered all of the information provided by the Advisor, the independent data providers, and independent counsel in connection with the approval. They determined that the information was sufficient for them to evaluate the management agreement for the Fund. In connection with their review, the Directors did not identify any single factor as being all-important or controlling, and each Director may have attributed different levels of importance to different factors.
24
In deciding to renew the management agreement, the Board based its decision on a number of factors, including the following:
Nature, Extent and Quality of Services - Generally. Under the management agreement, the Advisor is responsible for providing or arranging for all services necessary for the operation of the Fund. The Board noted that under the management agreement, the Advisor provides or arranges at its own expense a wide variety of services including:
| • | constructing and designing the Fund |
| • | portfolio research and security selection |
| • | initial capitalization/funding |
| • | securities trading |
| • | Fund administration |
| • | custody of Fund assets |
| • | daily valuation of the Fund’s portfolio |
| • | shareholder servicing and transfer agency, including shareholder confirmations, recordkeeping, and communications |
| • | legal services (except the independent Directors’ counsel) |
| • | regulatory and portfolio compliance |
| • | financial reporting |
| • | marketing and distribution (except amounts paid by the Fund under Rule 12b-1 plans) |
The Board noted that many of these services have expanded over time in terms of both quantity and complexity in response to shareholder demands, competition in the industry, changing distribution channels, and the changing regulatory environment. The Board noted specifically the resources the Advisor has committed to enhancing cybersecurity protections for the benefit of shareholders.
Investment Management Services. The nature of the investment management services provided to the Fund is quite complex and allows Fund shareholders access to professional money management, instant diversification of their investments within an asset class, the opportunity to easily diversify among asset classes by investing in or exchanging among various American Century Investments funds, and liquidity. In evaluating investment performance, the Board expects the Advisor to manage the Fund in accordance with its investment objectives and approved strategies. Further, the Directors recognize that the Advisor has an obligation to monitor trading activities, and in particular to seek the best execution of fund trades, and to evaluate the use of and payment for research. In providing these services, the Advisor utilizes teams of investment professionals (portfolio managers, analysts, research assistants, and securities traders) who require extensive information technology, research, training, compliance, and other systems to conduct their business. The Board, directly and through its Fund Performance Review Committee, provides oversight of the investment performance process. It regularly reviews investment performance information for the Fund, together with comparative information for appropriate benchmarks and/or peer groups of similarly-managed funds, over different time horizons. The Directors also review detailed performance information provided by the Advisor during the management agreement approval process. If performance concerns are identified, the Fund receives special reviews until performance improves, during which the Board receives a report from the Advisor regarding the reasons for such results (e.g., market conditions, security selection) and any efforts being undertaken to improve performance. The Fund’s performance was above its benchmark for the one-, three-, and five-year periods reviewed by the Board. The Board found the investment management services provided by the Advisor to the Fund to be satisfactory and consistent with the management agreement.
Shareholder and Other Services. Under the management agreement, the Advisor provides the Fund with a comprehensive package of transfer agency, shareholder, and other services. The Board, directly and through various committees of the Board, regularly reviews reports and evaluations of such services at its regular meetings. These reports include, but are not limited to,
25
information regarding the operational efficiency and accuracy of the shareholder and transfer agency services provided, staffing levels, shareholder satisfaction (as measured by external as well as internal sources), technology support, new products and services offered to Fund shareholders, securities trading activities, portfolio valuation services, auditing services, and legal and operational compliance activities. The Board particularly noted the Advisor’s continual efforts to maintain effective business continuity plans and to address cybersecurity threats. Certain aspects of shareholder and transfer agency service level efficiency and the quality of securities trading activities are measured by independent third party providers and are presented in comparison to other fund groups not managed by the Advisor. The Board found the services provided by the Advisor to the Fund under the management agreement to be competitive and of high quality.
Costs of Services and Profitability. The Advisor provides detailed information concerning its cost of providing various services to the Fund, its profitability in managing the Fund (pre- and post-distribution), its overall profitability, and its financial condition. The Directors have reviewed with the Advisor the methodology used to prepare this financial information. This information is considered in evaluating the Advisor’s financial condition, its ability to continue to provide services under the management agreement, and the reasonableness of the current management fee. The Board concluded that the Advisor’s profits were reasonable in light of the services provided to the Fund.
Ethics. The Board generally considers the Advisor’s commitment to providing quality services to shareholders and to conducting its business ethically. They noted that the Advisor’s practices generally meet or exceed industry best practices.
Economies of Scale. The Board also reviewed information provided by the Advisor regarding the possible existence of economies of scale in connection with the management of the Fund. The Board concluded that economies of scale are difficult to measure and predict with precision, especially on a fund-by-fund basis. The Board concluded that the Advisor is appropriately sharing economies of scale through its competitive fee structure, offering competitive fees from fund inception, and through reinvestment in its business to provide shareholders additional content and services. The Board also noted that economies of scale are shared with the Fund and its shareholders through management fee breakpoints that serve to reduce the effective management fee as the assets of the Fund grow.
Comparison to Other Funds’ Fees. The management agreement provides that the Fund pays the Advisor a single, all-inclusive (or unified) management fee for providing all services necessary for the management and operation of the Fund, other than brokerage expenses, expenses attributable to short sales, taxes, interest, extraordinary expenses, and the fees and expenses of the Fund’s independent Directors (including their independent legal counsel) and expenses incurred in connection with the provision of shareholder services and distribution services under a plan adopted pursuant to Rule 12b-1 under the 1940 Act. Under the unified fee structure, the Advisor is responsible for providing all investment advisory, custody, audit, administrative, compliance, recordkeeping, marketing and shareholder services, or arranging and supervising third parties to provide such services. By contrast, most other funds are charged a variety of fees, including an investment advisory fee, a transfer agency fee, an administrative fee, distribution charges, and other expenses. Other than their investment advisory fees and any applicable Rule 12b-1 distribution fees, all other components of the total fees charged by these other funds may be increased without shareholder approval. The Board believes the unified fee structure is a benefit to Fund shareholders because it clearly discloses to shareholders the cost of owning Fund shares, and, since the unified fee cannot be increased without a vote of Fund shareholders, it shifts to the Advisor the risk of increased costs of operating the Fund and provides a direct incentive to minimize administrative inefficiencies. Part of the Board’s analysis of fee levels involves reviewing certain evaluative data compiled by an independent provider comparing the Fund’s unified fee to the total expense ratios of its peers. The unified fee charged to shareholders of the Fund was above the median of the total expense ratios of the Fund’s peer expense universe and was within the range of its peer expense group. The Board concluded that the management fee paid by the
26
Fund to the Advisor under the management agreement is reasonable in light of the services provided to the Fund.
Comparison to Fees and Services Provided to Other Clients of the Advisor. The Directors also requested and received information from the Advisor concerning the nature of the services, fees, costs, and profitability of its advisory services to advisory clients other than the Fund. They observed that these varying types of client accounts require different services and involve different regulatory and entrepreneurial risks than the management of the Fund. The Board analyzed this information and concluded that the fees charged and services provided to the Fund were reasonable by comparison.
Payments to Intermediaries. The Directors also requested and received a description of payments made to intermediaries by the Fund and the Advisor. These payments include various payments made by the Fund or the Advisor to different types of intermediaries and recordkeepers for distribution and service activities provided for the Fund. The Board received confirmation from the Advisor that all such payments by the Fund intended for distribution were made pursuant to the Fund's 12b-1 Plan. The Board reviewed such information and found the payments to be reasonable in scope and purpose.
Collateral or “Fall-Out” Benefits Derived by the Advisor. The Board considered the existence of collateral benefits the Advisor may receive as a result of its relationship with the Fund. They concluded that the Advisor’s primary business is managing mutual funds and it generally does not use fund or shareholder information to generate profits in other lines of business, and therefore does not derive any significant collateral benefits from them. The Board noted that additional assets from other clients may offer the Advisor some benefit from increased leverage with service providers and counterparties. Additionally, the Advisor receives proprietary research from broker-dealers that execute fund portfolio transactions, which the Board concluded is likely to benefit other clients of the Advisor, as well as Fund shareholders. The Board also determined that the Advisor is able to provide investment management services to certain clients other than the Fund, at least in part, due to its existing infrastructure built to serve the fund complex. The Board concluded that appropriate allocation methodologies had been employed to assign resources and the cost of those resources to these other clients and, where expressly provided, these other client assets may be included with the assets of the Fund to determine breakpoints in the management fee schedule.
Existing Relationship. The Board also considered whether there was any reason for not continuing the existing arrangement with the Advisor. In this regard, the Board was mindful of the potential disruptions of the Fund’s operations and various risks, uncertainties, and other effects that could occur as a result of a decision not to continue such relationship. In particular, the Board recognized that most shareholders have invested in the Fund on the strength of the Advisor’s industry standing and reputation and in the expectation that the Advisor will have a continuing role in providing advisory services to the Fund.
Conclusion of the Directors. As a result of this process, the Board, including all of the independent Directors, taking into account all of the factors discussed above and the information provided by the Advisor and others in connection with its review and throughout the year, determined that the management fee is fair and reasonable in light of the services provided and that the investment management agreement between the Fund and the Advisor should be renewed.
27
| Additional Information |
Retirement Account Information
As required by law, distributions you receive from certain IRAs are subject to federal income tax withholding, unless you elect not to have withholding apply. Tax will be withheld on the total amount withdrawn even though you may be receiving amounts that are not subject to withholding, such as nondeductible contributions. In such case, excess amounts of withholding could occur. You may adjust your withholding election so that a greater or lesser amount will be withheld.
If you don’t want us to withhold on this amount, you must notify us to not withhold the federal income tax. You may notify us in writing or in certain situations by telephone or through other electronic means. For systematic withdrawals, your withholding election will remain in effect until revoked or changed by filing a new election. You have the right to revoke your election at any time.
Remember, even if you elect not to have income tax withheld, you are liable for paying income tax on the taxable portion of your withdrawal. If you elect not to have income tax withheld or you don’t have enough income tax withheld, you may be responsible for payment of estimated tax. You may incur penalties under the estimated tax rules if your withholding and estimated tax payments are not sufficient. You can reduce or defer the income tax on a distribution by directly or indirectly rolling such distribution over to another IRA or eligible plan. You should consult your tax advisor for additional information.
State tax will be withheld if, at the time of your distribution, your address is within one of the mandatory withholding states and you have federal income tax withheld (or as otherwise required by state law). State taxes will be withheld from your distribution in accordance with the respective state rules.
Distributions you receive from 403(b), 457 and qualified plans are subject to special tax and withholding rules. Your plan administrator or plan sponsor is required to provide you with a special tax notice explaining those rules at the time you request a distribution. If applicable, federal and/or state taxes may be withheld from your distribution amount.
Proxy Voting Policies
A description of the policies that the fund's investment advisor uses in exercising the voting rights associated with the securities purchased and/or held by the fund is available without charge, upon request, by calling 1-800-345-2021. It is also available on the "About Us" page of American Century Investments’ website at americancentury.com and on the Securities and Exchange Commission’s website at sec.gov. Information regarding how the investment advisor voted proxies relating to portfolio securities during the most recent 12-month period ended June 30 is available on the "About Us" page at americancentury.com. It is also available at sec.gov.
Quarterly Portfolio Disclosure
The fund files its complete schedule of portfolio holdings with the Securities and Exchange Commission (SEC) for the first and third quarters of each fiscal year on Form N-Q. The fund’s Forms N-Q are available on the SEC’s website at sec.gov, and may be reviewed and copied at the SEC’s Public Reference Room in Washington, DC. Information on the operation of the Public Reference Room may be obtained by calling 1-800-SEC-0330. The fund also makes its complete schedule of portfolio holdings for the most recent quarter of its fiscal year available on its website at americancentury.com and, upon request, by calling 1-800-345-2021.
28
Other Tax Information
The following information is provided pursuant to provisions of the Internal Revenue Code.
The fund hereby designates up to the maximum amount allowable as qualified dividend income for the fiscal year ended November 30, 2016.
The fund hereby designates $25,140,233, or up to the maximum amount allowable, as long-term capital gain distributions (20% rate gain distributions) for the fiscal year ended November 30, 2016.
For the fiscal year ended November 30, 2016, the fund intends to pass through to shareholders foreign source income of $18,931,039 and foreign taxes paid of $1,803,839, or up to the maximum amount allowable, as a foreign tax credit. Foreign source income and foreign tax expense per outstanding share on November 30, 2016 are $0.1958 and $0.0187, respectively.
29
| Notes |
30
| Notes |
31
| Notes |
32
| ||
| Contact Us | americancentury.com | |
| Automated Information Line | 1-800-345-8765 | |
| Investor Services Representative | 1-800-345-2021 or 816-531-5575 | |
| Investors Using Advisors | 1-800-378-9878 | |
| Business, Not-For-Profit, Employer-Sponsored Retirement Plans | 1-800-345-3533 | |
| Banks and Trust Companies, Broker-Dealers, Financial Professionals, Insurance Companies | 1-800-345-6488 | |
| Telecommunications Relay Service for the Deaf | 711 | |
| American Century World Mutual Funds, Inc. | ||
Investment Advisor: American Century Investment Management, Inc. Kansas City, Missouri | ||
| This report and the statements it contains are submitted for the general information of our shareholders. The report is not authorized for distribution to prospective investors unless preceded or accompanied by an effective prospectus. | ||
| ©2017 American Century Proprietary Holdings, Inc. All rights reserved. CL-ANN-91024 1701 | ||
| Annual Report | |
| November 30, 2016 | |
| NT International Small-Mid Cap Fund | |
| Table of Contents |
| Performance | 2 | |
| Portfolio Commentary | ||
| Fund Characteristics | ||
| Shareholder Fee Example | ||
| Schedule of Investments | ||
| Statement of Assets and Liabilities | ||
| Statement of Operations | ||
| Statement of Changes in Net Assets | ||
| Notes to Financial Statements | ||
| Financial Highlights | ||
| Report of Independent Registered Public Accounting Firm | ||
| Management | ||
| Approval of Management Agreement | ||
| Additional Information | ||
Any opinions expressed in this report reflect those of the author as of the date of the report, and do not necessarily represent the opinions of American Century Investments® or any other person in the American Century Investments organization. Any such opinions are subject to change at any time based upon market or other conditions and American Century Investments disclaims any responsibility to update such opinions. These opinions may not be relied upon as investment advice and, because investment decisions made by American Century Investments funds are based on numerous factors, may not be relied upon as an indication of trading intent on behalf of any American Century Investments fund. Security examples are used for representational purposes only and are not intended as recommendations to purchase or sell securities. Performance information for comparative indices and securities is provided to American Century Investments by third party vendors. To the best of American Century Investments’ knowledge, such information is accurate at the time of printing.
| Performance |
| Total Returns as of November 30, 2016 | ||||
Average Annual Returns | ||||
Ticker Symbol | 1 year | Since Inception | Inception Date | |
| Investor Class | ANTSX | -3.12% | -0.30% | 3/19/15 |
| MSCI EAFE Small Cap Index | — | 0.06% | 2.36% | — |
| Institutional Class | ANTMX | -2.97% | -0.15% | 3/19/15 |
| R6 Class | ANTFX | -2.75% | 0.04% | 3/19/15 |
| Growth of $10,000 Over Life of Class |
| $10,000 investment made March 19, 2015 |
| Performance for other share classes will vary due to differences in fee structure. |
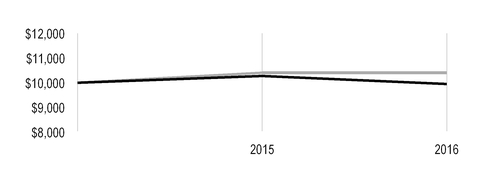
| Value on November 30, 2016 | |
| Investor Class — $9,949 | |
| MSCI EAFE Small Cap Index — $10,405 | |
Total Annual Fund Operating Expenses | ||
| Investor Class | Institutional Class | R6 Class |
| 1.47% | 1.27% | 1.12% |
The total annual fund operating expenses shown is as stated in the fund’s prospectus current as of the date of this report. The prospectus may vary from the expense ratio shown elsewhere in this report because it is based on a different time period, includes acquired fund fees and expenses, and, if applicable, does not include fee waivers or expense reimbursements.
Data presented reflect past performance. Past performance is no guarantee of future results. Current performance may be higher or lower than the performance shown. Total returns for periods less than one year are not annualized. Investment return and principal value will fluctuate, and redemption value may be more or less than original cost. Data assumes reinvestment of dividends and capital gains, and none of the charts reflect the deduction of taxes that a shareholder would pay on fund distributions or the redemption of fund shares. To obtain performance data current to the most recent month end, please call 1-800-345-2021 or visit americancentury.com. For additional information about the fund, please consult the prospectus.
2
| Portfolio Commentary |
Portfolio Managers: Brian Brady and Pratik Patel
Performance Summary
NT International Small-Mid Cap declined -2.97%* for the 12 months ended November 30, 2016. The portfolio’s benchmark, the MSCI EAFE Small Cap Index, advanced 0.06% for the same period.
Against a volatile backdrop, non-U.S. stocks were generally flat for the 12-month period. Familiar themes continued to dominate the landscape—economic growth remained weak, inflation remained muted, and major central banks continued to implement aggressive stimulus plans amid signs they were losing their effectiveness. In addition, global divergence remained a prominent factor, as the U.S. continued to outpace other developed markets in terms of economic growth, currency strength, and the removal of central bank stimulus.
Stock selection primarily accounted for the fund’s underperformance versus the benchmark, particularly within the consumer discretionary, materials, and information technology sectors. An overweight position relative to the benchmark in the consumer discretionary sector, underweights in the materials and information technology sectors, and exposure in the industrials sector also detracted. From a regional perspective, stock selection in Japan, Australia, and Germany, along with an overweight position in Germany, detracted from relative performance.
Brexit Vote Pressured Financials Stocks
A portfolio-only position in Provident Financial, a U.K.-based consumer financial services provider, was among the fund’s primary detractors, declining in the wake of the Brexit vote. Investors worried the Brexit fallout would slow the British economy and weaken consumer confidence, which pressured companies in the financials sector. Additionally, investors worried the U.K.’s departure from the EU would threaten London’s position as Europe’s financial hub. We exited the position.
In addition, an overweight position in Stroeer was a main detractor. In the second quarter of 2016, the Germany-based advertising/media company came under pressure from a short seller, which questioned the company’s accounting practices. Stroeer’s management denounced the accusations, but investors drove down the company’s stock price. We exited the position.
A portfolio-only position in Canada-based Concordia International (formerly Concordia Healthcare), a specialty pharmaceutical company, also was among the fund’s largest detractors. Similar to other companies in the drug industry, Concordia was affected by the negative sentiment surrounding Canada-based pharmaceutical company Valeant Pharmaceuticals International, which was battered by pricing, balance sheet, and leveraging issues and a Securities and Exchange Commission investigation in the U.S. In addition, ongoing political rhetoric surrounding drug pricing weighed on the pharmaceuticals industry. Against this backdrop, we exited the position.
Health Care Stocks Were Top Contributors
From a sector standpoint, stock selection in the health care sector, an underweight position in the real estate sector, and an overweight position in energy were among the top contributors to relative performance. Regionally, stock selection in Sweden, Denmark, and China, along with overweight positions in Sweden and Denmark, contributed to relative performance.
*All fund returns referenced in this commentary are for Institutional Class shares. Performance for other share classes will vary due to differences in fee structure; when Institutional Class performance exceeds that of the fund's benchmark, other share classes may not. See page 2 for returns for all share classes.
3
Within the health care sector, a portfolio-only position in Ono Pharmaceutical and an overweight position in RaySearch Laboratories were top contributors to performance. Throughout the first half of the period, Japan-based Ono Pharmaceutical continued to advance on improving earnings estimates, largely stemming from strong sales of Opdivo, a lung cancer-fighting immune-oncology therapy developed jointly with Bristol-Myers Squibb. Ono owns the rights to Opdivo in Japan, where sales had been increasing. Later in the period, changing drug pricing and reimbursement policies in Japan, along with a slowdown in patient use of Opdivo, weighed on the outlook for the drug maker. We took profits in Ono and exited the position.
Meanwhile, RaySearch Laboratories, a Sweden-based developer of software for radiation therapy for cancer, advanced after reporting strong revenues and an upbeat outlook. In particular, the company announced growing orders from and collaboration with leading cancer-treatment centers throughout the world.
In addition, an overweight position in DeNA, a Japan-based provider of mobile gaming, social media, and e-commerce websites, was a top contributor. The company reported better-than-expected revenue and profits for the quarter ended June 30, 2016, which led to stock-price gains. In particular, the company benefited from its partnership with Nintendo on the successful Pokémon Go game.
Outlook
We will continue to focus on those non-U.S. companies that our disciplined, bottom-up fundamental analysis identifies as opportunities with improving, sustainable earnings growth. At the end of the period, the portfolio’s largest sector overweights were health care and consumer discretionary, where we found several companies meeting these criteria. Conversely, the real estate and financials sectors represented the largest underweights. In particular, the low interest rate environment continues to create a challenging environment for many financial companies.
Regionally, we maintained an out-of-benchmark position in Canada, where we are finding companies meeting our investment criteria in several sectors, including energy. The U.K. and Japan were among the largest underweights. We remain concerned about the long-term effects on the U.K. economy if companies decide they do not want to have operations in a non-EU country. In Japan, we believe escaping the deflationary environment that has gripped the nation for years represents a formidable challenge for the government. We maintained a small, out-of-benchmark position in emerging markets, where we remain selective. Overall, the stabilization in commodity prices has been beneficial for emerging markets, and we are noting some improvement in relative earnings revisions despite the massive reversal in performance driven by the strengthening U.S. dollar.
4
| Fund Characteristics |
| NOVEMBER 30, 2016 | |
Top Ten Holdings | % of net assets |
| Treasury Wine Estates Ltd. | 2.0% |
| DSV A/S | 2.0% |
| Teleperformance | 2.0% |
| Genmab A/S | 1.8% |
| RPC Group plc | 1.8% |
| Partners Group Holding AG | 1.6% |
| Drillisch AG | 1.5% |
| Seven Generations Energy Ltd. | 1.5% |
| Eurofins Scientific SE | 1.5% |
| KION Group AG | 1.4% |
Types of Investments in Portfolio | % of net assets |
| Common Stocks | 97.6% |
| Temporary Cash Investments | 2.0% |
| Other Assets and Liabilities | 0.4% |
Investments by Country | % of net assets |
| Japan | 26.0% |
| United Kingdom | 12.9% |
| France | 9.7% |
| Canada | 6.0% |
| Switzerland | 5.7% |
| Denmark | 5.4% |
| Germany | 5.3% |
| Australia | 5.2% |
| Sweden | 3.7% |
| Norway | 3.4% |
| Spain | 2.4% |
| Italy | 2.4% |
| Other Countries | 9.5% |
| Cash and Equivalents* | 2.4% |
| *Includes temporary cash investments and other assets and liabilities. | |
5
| Shareholder Fee Example |
Fund shareholders may incur two types of costs: (1) transaction costs, including sales charges (loads) on purchase payments and redemption/exchange fees; and (2) ongoing costs, including management fees; distribution and service (12b-1) fees; and other fund expenses. This example is intended to help you understand your ongoing costs (in dollars) of investing in your fund and to compare these costs with the ongoing cost of investing in other mutual funds.
The example is based on an investment of $1,000 made at the beginning of the period and held for the entire period from June 1, 2016 to November 30, 2016.
Actual Expenses
The table provides information about actual account values and actual expenses for each class. You may use the information, together with the amount you invested, to estimate the expenses that you paid over the period. First, identify the share class you own. Then simply divide your account value by $1,000 (for example, an $8,600 account value divided by $1,000 = 8.6), then multiply the result by the number under the heading “Expenses Paid During Period” to estimate the expenses you paid on your account during this period.
Hypothetical Example for Comparison Purposes
The table also provides information about hypothetical account values and hypothetical expenses based on the actual expense ratio of each class of your fund and an assumed rate of return of 5% per year before expenses, which is not the actual return of a fund’s share class. The hypothetical account values and expenses may not be used to estimate the actual ending account balance or expenses you paid for the period. You may use this information to compare the ongoing costs of investing in your fund and other funds. To do so, compare this 5% hypothetical example with the 5% hypothetical examples that appear in the shareholder reports of the other funds.
Please note that the expenses shown in the table are meant to highlight your ongoing costs only and do not reflect any transactional costs, such as sales charges (loads) or redemption/exchange fees. Therefore, the table is useful in comparing ongoing costs only, and will not help you determine the relative total costs of owning different funds. In addition, if these transactional costs were included, your costs would have been higher.
| Beginning Account Value 6/1/16 | Ending Account Value 11/30/16 | Expenses Paid During Period(1) 6/1/16 - 11/30/16 | Annualized Expense Ratio(1) | |
Actual | ||||
| Investor Class | $1,000 | $937.40 | $7.17 | 1.48% |
| Institutional Class | $1,000 | $938.30 | $6.20 | 1.28% |
| R6 Class | $1,000 | $939.30 | $5.48 | 1.13% |
| Hypothetical | ||||
| Investor Class | $1,000 | $1,017.60 | $7.47 | 1.48% |
| Institutional Class | $1,000 | $1,018.60 | $6.46 | 1.28% |
| R6 Class | $1,000 | $1,019.35 | $5.70 | 1.13% |
| (1) | Expenses are equal to the class's annualized expense ratio listed in the table above, multiplied by the average account value over the period, multiplied by 183, the number of days in the most recent fiscal half-year, divided by 366, to reflect the one-half year period. |
6
| Schedule of Investments |
NOVEMBER 30, 2016
| Shares | Value | ||||
| COMMON STOCKS — 97.6% | |||||
| Australia — 5.2% | |||||
| APN Outdoor Group Ltd. | 486,599 | $ | 1,918,817 | ||
| Bapcor Ltd. | 677,311 | 2,485,796 | |||
| Domino's Pizza Enterprises Ltd. | 20,080 | 1,005,047 | |||
| Pact Group Holdings Ltd. | 272,373 | 1,309,381 | |||
| Treasury Wine Estates Ltd. | 530,469 | 4,226,711 | |||
| 10,945,752 | |||||
| Austria — 0.9% | |||||
| Lenzing AG | 14,450 | 1,845,437 | |||
| Belgium — 1.8% | |||||
Galapagos NV(1) | 30,859 | 1,833,820 | |||
| Ion Beam Applications | 45,689 | 1,963,330 | |||
| 3,797,150 | |||||
| Canada — 6.0% | |||||
| Agnico Eagle Mines Ltd. New York Shares | 22,816 | 936,597 | |||
| Canadian Energy Services & Technology Corp. | 29,100 | 151,425 | |||
| CCL Industries, Inc., Class B | 13,280 | 2,310,876 | |||
| Maple Leaf Foods, Inc. | 100,610 | 2,191,505 | |||
| Premium Brands Holdings Corp. | 24,680 | 1,296,926 | |||
Seven Generations Energy Ltd.(1) | 136,894 | 3,153,056 | |||
| Sleep Country Canada Holdings, Inc. | 122,710 | 2,687,507 | |||
| 12,727,892 | |||||
| China — 1.7% | |||||
| Brilliance China Automotive Holdings Ltd. | 496,000 | 694,457 | |||
| Tongda Group Holdings Ltd. | 9,570,000 | 2,813,073 | |||
| 3,507,530 | |||||
| Denmark — 5.4% | |||||
| Ambu A/S, B Shares | 14,370 | 555,735 | |||
| Dfds A/S | 36,959 | 1,521,456 | |||
| DSV A/S | 92,774 | 4,174,622 | |||
Genmab A/S(1) | 22,129 | 3,832,980 | |||
| Pandora A/S | 11,024 | 1,311,979 | |||
| 11,396,772 | |||||
| Finland — 0.9% | |||||
| Konecranes Oyj | 54,330 | 1,873,706 | |||
| France — 9.7% | |||||
| Arkema SA | 17,480 | 1,674,396 | |||
| Aroundtown Property Holdings plc | 284,892 | 1,268,159 | |||
| BioMerieux | 12,940 | 1,798,651 | |||
| Eurofins Scientific SE | 7,189 | 3,146,373 | |||
Maisons du Monde SA(1) | 60,764 | 1,581,038 | |||
Nexans SA(1) | 40,035 | 2,090,155 | |||
| Nexity SA | 12,629 | 583,780 | |||
| Rubis SCA | 24,435 | 1,996,174 | |||
| SEB SA | 16,000 | 2,148,527 | |||
7
| Shares | Value | ||||
| Teleperformance | 42,567 | $ | 4,156,861 | ||
| 20,444,114 | |||||
| Germany — 5.3% | |||||
| CompuGroup Medical SE | 51,627 | 2,035,741 | |||
| Drillisch AG | 82,545 | 3,179,653 | |||
| HUGO BOSS AG | 21,980 | 1,260,286 | |||
| KION Group AG | 50,819 | 2,880,460 | |||
| Salzgitter AG | 58,370 | 1,907,249 | |||
| 11,263,389 | |||||
| Hong Kong — 0.6% | |||||
| PRADA SpA | 392,000 | 1,389,802 | |||
| Ireland — 0.6% | |||||
Bank of Ireland(1) | 5,918,780 | 1,260,876 | |||
| Israel — 0.7% | |||||
Mobileye NV(1) | 42,760 | 1,591,955 | |||
| Italy — 2.4% | |||||
| Amplifon SpA | 143,731 | 1,378,616 | |||
| Buzzi Unicem SpA | 112,670 | 2,394,236 | |||
| Industria Macchine Automatiche SpA | 20,950 | 1,297,815 | |||
| 5,070,667 | |||||
| Japan — 26.0% | |||||
| Alps Electric Co. Ltd. | 94,600 | 2,375,646 | |||
| Anicom Holdings, Inc. | 44,400 | 1,047,856 | |||
| Asahi Intecc Co. Ltd. | 21,400 | 831,459 | |||
| BML, Inc. | 41,200 | 948,567 | |||
| CyberAgent, Inc. | 58,600 | 1,424,471 | |||
| Daito Trust Construction Co. Ltd. | 13,100 | 2,035,335 | |||
| Daiwa Securities Group, Inc. | 399,000 | 2,397,383 | |||
| DeNA Co. Ltd. | 68,500 | 2,086,644 | |||
| Dip Corp. | 33,700 | 707,846 | |||
| Disco Corp. | 18,000 | 2,133,473 | |||
| Don Quijote Holdings Co. Ltd. | 54,800 | 2,095,625 | |||
| eRex Co. Ltd. | 44,100 | 1,130,206 | |||
| Ezaki Glico Co. Ltd. | 38,700 | 1,809,755 | |||
| Koito Manufacturing Co. Ltd. | 45,300 | 2,359,932 | |||
Kyushu Railway Co.(1) | 12,300 | 318,453 | |||
LINE Corp. ADR(1) | 35,057 | 1,356,355 | |||
| Mabuchi Motor Co. Ltd. | 49,800 | 2,772,833 | |||
| MonotaRO Co. Ltd. | 66,900 | 1,428,580 | |||
| Nabtesco Corp. | 16,200 | 411,779 | |||
| NGK Spark Plug Co. Ltd. | 127,000 | 2,604,274 | |||
| Nippon Shinyaku Co. Ltd. | 54,100 | 2,515,729 | |||
| Nitori Holdings Co. Ltd. | 17,500 | 1,826,406 | |||
| Omron Corp. | 60,000 | 2,213,190 | |||
| Seria Co. Ltd. | 36,100 | 2,593,785 | |||
| SMS Co. Ltd. | 50,800 | 1,269,057 | |||
| Sony Financial Holdings, Inc. | 57,200 | 824,964 | |||
| Start Today Co. Ltd. | 79,300 | 1,217,867 | |||
| Sumco Corp. | 118,800 | 1,301,136 | |||
| Sundrug Co. Ltd. | 5,400 | 375,718 | |||
| Takeuchi Manufacturing Co. Ltd. | 117,200 | 2,497,562 | |||
8
| Shares | Value | ||||
| Temp Holdings Co. Ltd. | 119,600 | $ | 1,842,010 | ||
| Topcon Corp. | 192,200 | 2,854,314 | |||
| Yumeshin Holdings Co. Ltd. | 204,000 | 1,332,005 | |||
| 54,940,215 | |||||
| Netherlands — 1.2% | |||||
| Koninklijke DSM NV | 40,490 | 2,455,500 | |||
| New Zealand — 1.1% | |||||
a2 Milk Co. Ltd.(1) | 1,174,840 | 2,064,794 | |||
| Fisher & Paykel Healthcare Corp. Ltd. | 46,480 | 269,262 | |||
| 2,334,056 | |||||
| Norway — 3.4% | |||||
| Aker BP ASA | 109,893 | 1,786,437 | |||
| Marine Harvest ASA | 127,415 | 2,291,276 | |||
Storebrand ASA(1) | 316,040 | 1,651,900 | |||
| TGS Nopec Geophysical Co. ASA | 69,520 | 1,366,116 | |||
| 7,095,729 | |||||
| Spain — 2.4% | |||||
| Acerinox SA | 146,820 | 1,843,945 | |||
| Bankia SA | 2,408,010 | 2,146,340 | |||
| Gamesa Corp. Tecnologica SA | 54,781 | 1,137,678 | |||
| 5,127,963 | |||||
| Sweden — 3.7% | |||||
AcadeMedia AB(1) | 204,844 | 1,132,741 | |||
| Boliden AB | 93,196 | 2,407,001 | |||
Dometic Group AB(1) | 97,341 | 693,951 | |||
| Loomis AB, B Shares | 53,300 | 1,410,114 | |||
Lundin Petroleum AB(1) | 36,004 | 678,481 | |||
| RaySearch Laboratories AB | 76,044 | 1,533,611 | |||
| 7,855,899 | |||||
| Switzerland — 5.7% | |||||
| dormakaba Holding AG | 1,686 | 1,218,026 | |||
| Geberit AG | 5,470 | 2,165,511 | |||
| Logitech International SA | 98,530 | 2,427,635 | |||
| Lonza Group AG | 15,798 | 2,821,793 | |||
| Partners Group Holding AG | 6,880 | 3,342,894 | |||
| 11,975,859 | |||||
| United Kingdom — 12.9% | |||||
| Ashtead Group plc | 75,620 | 1,482,628 | |||
ASOS plc(1) | 42,279 | 2,669,836 | |||
| Auto Trader Group plc | 305,825 | 1,529,444 | |||
| CVS Group plc | 97,120 | 1,294,151 | |||
| DCC plc | 36,482 | 2,798,116 | |||
Just Eat plc(1) | 173,070 | 1,267,872 | |||
| Melrose Industries plc | 1,021,087 | 2,341,172 | |||
| Persimmon plc | 48,924 | 1,040,633 | |||
| Rentokil Initial plc | 799,360 | 2,144,341 | |||
| RPC Group plc | 284,126 | 3,828,717 | |||
Serco Group plc(1) | 636,500 | 1,059,197 | |||
Tullow Oil plc(1) | 474,940 | 1,769,661 | |||
| UDG Healthcare plc | 243,930 | 2,006,723 | |||
9
| Shares | Value | ||||
| Weir Group plc (The) | 90,220 | $ | 2,040,929 | ||
| 27,273,420 | |||||
TOTAL COMMON STOCKS (Cost $190,735,017) | 206,173,683 | ||||
| TEMPORARY CASH INVESTMENTS — 2.0% | |||||
| Repurchase Agreement, Fixed Income Clearing Corp., (collateralized by various U.S. Treasury obligations, 2.875%, 8/15/45, valued at $4,318,754), at 0.08%, dated 11/30/16, due 12/1/16 (Delivery value $4,234,009) | 4,234,000 | ||||
| State Street Institutional U.S. Government Money Market Fund, Premier Class | 1,444 | 1,444 | |||
TOTAL TEMPORARY CASH INVESTMENTS (Cost $4,235,444) | 4,235,444 | ||||
TOTAL INVESTMENT SECURITIES — 99.6% (Cost $194,970,461) | 210,409,127 | ||||
| OTHER ASSETS AND LIABILITIES — 0.4% | 906,413 | ||||
| TOTAL NET ASSETS — 100.0% | $ | 211,315,540 | |||
| MARKET SECTOR DIVERSIFICATION | ||
(as a % of net assets) | ||
| Industrials | 22.0 | % |
| Consumer Discretionary | 17.0 | % |
| Health Care | 13.7 | % |
| Information Technology | 12.2 | % |
| Materials | 10.9 | % |
| Consumer Staples | 6.8 | % |
| Financials | 6.0 | % |
| Energy | 4.2 | % |
| Real Estate | 1.9 | % |
| Telecommunication Services | 1.5 | % |
| Utilities | 1.4 | % |
| Cash and Equivalents* | 2.4 | % |
*Includes temporary cash investments and other assets and liabilities.
| NOTES TO SCHEDULE OF INVESTMENTS | ||
| ADR | - | American Depositary Receipt |
| (1) | Non-income producing. |
See Notes to Financial Statements.
10
| Statement of Assets and Liabilities |
| NOVEMBER 30, 2016 | |||
| Assets | |||
| Investment securities, at value (cost of $194,970,461) | $ | 210,409,127 | |
| Foreign currency holdings, at value (cost of $27,730) | 27,562 | ||
| Receivable for investments sold | 3,275,418 | ||
| Receivable for capital shares sold | 52,267 | ||
| Dividends and interest receivable | 353,956 | ||
| 214,118,330 | |||
| Liabilities | |||
| Payable for investments purchased | 2,573,708 | ||
| Accrued management fees | 229,082 | ||
| 2,802,790 | |||
| Net Assets | $ | 211,315,540 | |
| Net Assets Consist of: | |||
| Capital (par value and paid-in surplus) | $ | 212,248,770 | |
| Undistributed net investment income | 267,811 | ||
| Accumulated net realized loss | (16,615,501 | ) | |
| Net unrealized appreciation | 15,414,460 | ||
| $ | 211,315,540 | ||
| Net Assets | Shares Outstanding | Net Asset Value Per Share | ||||
| Investor Class, $0.01 Par Value | $62,161,833 | 6,294,394 | $9.88 | |||
| Institutional Class, $0.01 Par Value | $135,376,663 | 13,683,072 | $9.89 | |||
| R6 Class, $0.01 Par Value | $13,777,044 | 1,390,620 | $9.91 | |||
See Notes to Financial Statements.
11
| Statement of Operations |
| YEAR ENDED NOVEMBER 30, 2016 | |||
| Investment Income (Loss) | |||
| Income: | |||
| Dividends (net of foreign taxes withheld of $254,264) | $ | 2,886,865 | |
| Interest | 5,528 | ||
| 2,892,393 | |||
| Expenses: | |||
| Management fees | 2,740,594 | ||
| Directors' fees and expenses | 6,875 | ||
| Other expenses | 1,917 | ||
| 2,749,386 | |||
| Net investment income (loss) | 143,007 | ||
| Realized and Unrealized Gain (Loss) | |||
| Net realized gain (loss) on: | |||
| Investment transactions | (7,308,514 | ) | |
| Foreign currency transactions | (4,425 | ) | |
| (7,312,939 | ) | ||
| Change in net unrealized appreciation (depreciation) on: | |||
| Investments | 1,700,121 | ||
| Translation of assets and liabilities in foreign currencies | (17,196 | ) | |
| 1,682,925 | |||
| Net realized and unrealized gain (loss) | (5,630,014 | ) | |
| Net Increase (Decrease) in Net Assets Resulting from Operations | $ | (5,487,007 | ) |
See Notes to Financial Statements.
12
| Statement of Changes in Net Assets |
| YEAR ENDED NOVEMBER 30, 2016 AND PERIOD ENDED NOVEMBER 30, 2015 | ||||||
| Increase (Decrease) in Net Assets | November 30, 2016 | November 30, 2015(1) | ||||
| Operations | ||||||
| Net investment income (loss) | $ | 143,007 | $ | 649,860 | ||
| Net realized gain (loss) | (7,312,939 | ) | (8,218,545 | ) | ||
| Change in net unrealized appreciation (depreciation) | 1,682,925 | 13,731,535 | ||||
| Net increase (decrease) in net assets resulting from operations | (5,487,007 | ) | 6,162,850 | |||
| Distributions to Shareholders | ||||||
| From net investment income: | ||||||
| Investor Class | (438,707 | ) | — | |||
| Institutional Class | (1,087,818 | ) | — | |||
| R6 Class | (82,548 | ) | — | |||
| Decrease in net assets from distributions | (1,609,073 | ) | — | |||
| Capital Share Transactions | ||||||
| Net increase (decrease) in net assets from capital share transactions (Note 5) | 11,295,936 | 200,952,834 | ||||
| Net increase (decrease) in net assets | 4,199,856 | 207,115,684 | ||||
| Net Assets | ||||||
| Beginning of period | 207,115,684 | — | ||||
| End of period | $ | 211,315,540 | $ | 207,115,684 | ||
| Undistributed net investment income | $ | 267,811 | $ | 1,002,127 | ||
| (1) | March 19, 2015 (fund inception) through November 30, 2015. |
See Notes to Financial Statements.
13
| Notes to Financial Statements |
NOVEMBER 30, 2016
1. Organization
American Century World Mutual Funds, Inc. (the corporation) is registered under the Investment Company Act of 1940, as amended (the 1940 Act), as an open-end management investment company and is organized as a Maryland corporation. NT International Small-Mid Cap Fund (the fund) is one fund in a series issued by the corporation. The fund’s investment objective is to seek capital growth. The fund is not permitted to invest in securities issued by companies assigned the Global Industry Classification Standard for the tobacco industry.
The fund offers the Investor Class, the Institutional Class and the R6 Class, which have different fees and expenses. The difference in the fee structures between the classes is the result of their separate arrangements for shareholder and distribution services, which may be provided indirectly through another American Century Investments mutual fund. As a result, the investment advisor is able to charge the Institutional Class and R6 Class lower unified management fees. All classes of the fund commenced sale on March 19, 2015, the fund’s inception date.
2. Significant Accounting Policies
The following is a summary of significant accounting policies consistently followed by the fund in preparation of its financial statements. The fund is an investment company and follows accounting and reporting guidance in accordance with accounting principles generally accepted in the United States of America. This may require management to make certain estimates and assumptions at the date of the financial statements. Actual results could differ from these estimates. Management evaluated the impact of events or transactions occurring through the date the financial statements were issued that would merit recognition or disclosure.
Investment Valuations — The fund determines the fair value of its investments and computes its net asset value per share at the close of regular trading (usually 4 p.m. Eastern time) on the New York Stock Exchange (NYSE) on each day the NYSE is open. The Board of Directors has adopted valuation policies and procedures to guide the investment advisor in the fund’s investment valuation process and to provide methodologies for the oversight of the fund’s pricing function.
Equity securities that are listed or traded on a domestic securities exchange are valued at the last reported sales price or at the official closing price as provided by the exchange. Equity securities traded on foreign securities exchanges are generally valued at the closing price of such securities on the exchange where primarily traded or at the close of the NYSE, if that is earlier. If no last sales price is reported, or if local convention or regulation so provides, the mean of the latest bid and asked prices may be used. Securities traded over-the-counter are valued at the mean of the latest bid and asked prices, the last sales price, or the official closing price. Equity securities initially expressed in local currencies are translated into U.S. dollars at the mean of the appropriate currency exchange rate at the close of the NYSE as provided by an independent pricing service.
Open-end management investment companies are valued at the reported net asset value per share. Repurchase agreements are valued at cost, which approximates fair value.
If the fund determines that the market price for an investment is not readily available or the valuation methods mentioned above do not reflect an investment’s fair value, such investment is valued as determined in good faith by the Board of Directors or its delegate, in accordance with policies and procedures adopted by the Board of Directors. In its determination of fair value, the fund may review several factors including, but not limited to, market information regarding the specific investment or comparable investments and correlation with other investment types, futures indices or general market indicators. Circumstances that may cause the fund to use these procedures to value an investment include, but are not limited to: an investment has been declared in default or is distressed; trading in a security has been suspended during the trading day or a security is not actively trading on its principal exchange; prices received from a regular pricing source are deemed unreliable; or there is a foreign market holiday and no trading occurred.
The fund monitors for significant events occurring after the close of an investment’s primary exchange but before the fund’s net asset value per share is determined. Significant events may include, but are not limited to: corporate announcements and transactions; governmental action and political unrest that could impact a
14
specific investment or an investment sector; or armed conflicts, natural disasters and similar events that could affect investments in a specific country or region. The fund also monitors for significant fluctuations between domestic and foreign markets, as evidenced by the U.S. market or such other indicators that the Board of Directors, or its delegate, deems appropriate. If significant fluctuations in foreign markets are identified, the fund may apply a model-derived factor to the closing price of equity securities traded on foreign securities exchanges. The factor is based on observable market data as provided by an independent pricing service.
Security Transactions — Security transactions are accounted for as of the trade date. Net realized gains and losses are determined on the identified cost basis, which is also used for federal income tax purposes.
Investment Income — Dividend income less foreign taxes withheld, if any, is recorded as of the ex-dividend date. Distributions received on securities that represent a return of capital or long-term capital gain are recorded as a reduction of cost of investments and/or as a realized gain. The fund may estimate the components of distributions received that may be considered nontaxable distributions or long-term capital gain distributions for income tax purposes. Interest income is recorded on the accrual basis and includes accretion of discounts and amortization of premiums.
Foreign Currency Translations — All assets and liabilities initially expressed in foreign currencies are translated into U.S. dollars at prevailing exchange rates at period end. The fund may enter into spot foreign currency exchange contracts to facilitate transactions denominated in a foreign currency. Purchases and sales of investment securities, dividend and interest income, spot foreign currency exchange contracts, and expenses are translated at the rates of exchange prevailing on the respective dates of such transactions. Net realized and unrealized foreign currency exchange gains or losses related to investment securities are a component of net realized gain (loss) on investment transactions and change in net unrealized appreciation (depreciation) on investments, respectively.
Repurchase Agreements — The fund may enter into repurchase agreements with institutions that American Century Investment Management, Inc. (ACIM) (the investment advisor) has determined are creditworthy pursuant to criteria adopted by the Board of Directors. The fund requires that the collateral, represented by securities, received in a repurchase transaction be transferred to the custodian in a manner sufficient to enable the fund to obtain those securities in the event of a default under the repurchase agreement. ACIM monitors, on a daily basis, the securities transferred to ensure the value, including accrued interest, of the securities under each repurchase agreement is equal to or greater than amounts owed to the fund under each repurchase agreement.
Joint Trading Account — Pursuant to an Exemptive Order issued by the Securities and Exchange Commission, the fund, along with certain other funds in the American Century Investments family of funds, may transfer uninvested cash balances into a joint trading account. These balances are invested in one or more repurchase agreements that are collateralized by U.S. Treasury or Agency obligations.
Income Tax Status — It is the fund’s policy to distribute substantially all net investment income and net realized gains to shareholders and to otherwise qualify as a regulated investment company under provisions of the Internal Revenue Code. Accordingly, no provision has been made for income taxes. The fund files U.S. federal, state, local and non-U.S. tax returns as applicable. The fund's tax returns are subject to examination by the relevant taxing authority until expiration of the applicable statute of limitations, which is generally three years from the date of filing but can be longer in certain jurisdictions. At this time, management believes there are no uncertain tax positions which, based on their technical merit, would not be sustained upon examination and for which it is reasonably possible that the total amounts of unrecognized tax benefits will significantly change in the next twelve months.
Multiple Class — All shares of the fund represent an equal pro rata interest in the net assets of the class to which such shares belong, and have identical voting, dividend, liquidation and other rights and the same terms and conditions, except for class specific expenses and exclusive rights to vote on matters affecting only individual classes. Income, non-class specific expenses, and realized and unrealized capital gains and losses of the fund are allocated to each class of shares based on their relative net assets.
Distributions to Shareholders — Distributions from net investment income and net realized gains, if any, are generally declared and paid annually. The fund may make distributions on a more frequent basis to comply with the distribution requirements of the Internal Revenue Code, in all events in a manner consistent with provisions of the 1940 Act.
15
Indemnifications — Under the corporation’s organizational documents, its officers and directors are indemnified against certain liabilities arising out of the performance of their duties to the fund. In addition, in the normal course of business, the fund enters into contracts that provide general indemnifications. The maximum exposure under these arrangements is unknown as this would involve future claims that may be made against a fund. The risk of material loss from such claims is considered by management to be remote.
3. Fees and Transactions with Related Parties
Certain officers and directors of the corporation are also officers and/or directors of American Century Companies, Inc. (ACC). The corporation’s investment advisor, ACIM, the corporation's distributor, American Century Investment Services, Inc., and the corporation’s transfer agent, American Century Services, LLC, are wholly owned, directly or indirectly, by ACC. Various funds issued by American Century Asset Allocation Portfolios, Inc. and American Century Strategic Asset Allocations, Inc. own, in aggregate, 100% of the shares of the fund. Related parties do not invest in the fund for the purpose of exercising management or control.
Management Fees — The corporation has entered into a management agreement with ACIM, under which ACIM provides the fund with investment advisory and management services in exchange for a single, unified management fee (the fee) per class. The agreement provides that all expenses of managing and operating the fund, except distribution and service fees, brokerage expenses, taxes, interest, fees and expenses of the independent directors (including legal counsel fees), and extraordinary expenses, will be paid by ACIM. The fee is computed and accrued daily based on each class’s daily net assets and paid monthly in arrears. The annual management fee is 1.47% for the Investor Class, 1.27% for the Institutional Class and 1.12% for the R6 Class.
Directors' Fees and Expenses — The Board of Directors is responsible for overseeing the investment advisor’s management and operations of the fund. The directors receive detailed information about the fund and its investment advisor regularly throughout the year, and meet at least quarterly with management of the investment advisor to review reports about fund operations. The fund’s officers do not receive compensation from the fund.
Interfund Transactions — The fund may enter into security transactions with other American Century Investments funds and other client accounts of the investment advisor, in accordance with the 1940 Act rules and procedures adopted by the Board of Directors. The rules and procedures require, among other things, that these transactions be effected at the independent current market price of the security. During the period, the interfund purchases and sales were $174,384 and $700,784, respectively. The effect of interfund transactions on the Statement of Operations was $87,994 in net realized gain (loss) on investment transactions.
4. Investment Transactions
Purchases and sales of investment securities, excluding short-term investments, for the year ended November 30, 2016 were $293,115,839 and $282,569,714, respectively.
16
5. Capital Share Transactions
Transactions in shares of the fund were as follows:
| Year ended November 30, 2016 | Period ended November 30, 2015(1) | |||||||||
| Shares | Amount | Shares | Amount | |||||||
| Investor Class/Shares Authorized | 80,000,000 | 100,000,000 | ||||||||
| Sold | 251,243 | $ | 2,516,289 | 6,624,685 | $ | 66,247,282 | ||||
| Issued in reinvestment of distributions | 43,010 | 438,707 | — | — | ||||||
| Redeemed | (360,077 | ) | (3,719,805 | ) | (264,467 | ) | (2,771,716 | ) | ||
| (65,824 | ) | (764,809 | ) | 6,360,218 | 63,475,566 | |||||
| Institutional Class/Shares Authorized | 130,000,000 | 150,000,000 | ||||||||
| Sold | 2,158,137 | 21,060,150 | 13,245,884 | 132,504,598 | ||||||
| Issued in reinvestment of distributions | 106,649 | 1,087,818 | — | — | ||||||
| Redeemed | (1,517,409 | ) | (15,850,337 | ) | (310,189 | ) | (3,259,552 | ) | ||
| 747,377 | 6,297,631 | 12,935,695 | 129,245,046 | |||||||
| R6 Class/Shares Authorized | 40,000,000 | 40,000,000 | ||||||||
| Sold | 646,960 | 6,528,039 | 910,428 | 9,164,580 | ||||||
| Issued in reinvestment of distributions | 8,093 | 82,548 | — | — | ||||||
| Redeemed | (82,231 | ) | (847,473 | ) | (92,630 | ) | (932,358 | ) | ||
| 572,822 | 5,763,114 | 817,798 | 8,232,222 | |||||||
| Net increase (decrease) | 1,254,375 | $ | 11,295,936 | 20,113,711 | $ | 200,952,834 | ||||
| (1) | March 19, 2015 (fund inception) through November 30, 2015. |
6. Fair Value Measurements
The fund’s investments valuation process is based on several considerations and may use multiple inputs to determine the fair value of the investments held by the fund. In conformity with accounting principles generally accepted in the United States of America, the inputs used to determine a valuation are classified into three broad levels.
| • | Level 1 valuation inputs consist of unadjusted quoted prices in an active market for identical investments. |
| • | Level 2 valuation inputs consist of direct or indirect observable market data (including quoted prices for comparable investments, evaluations of subsequent market events, interest rates, prepayment speeds, credit risk, etc.). These inputs also consist of quoted prices for identical investments initially expressed in local currencies that are adjusted through translation into U.S. dollars. |
| • | Level 3 valuation inputs consist of unobservable data (including a fund’s own assumptions). |
The level classification is based on the lowest level input that is significant to the fair valuation measurement. The valuation inputs are not necessarily an indication of the risks associated with investing in these securities or other financial instruments. There were no significant transfers between levels during the period.
The following is a summary of the level classifications as of period end. The Schedule of Investments provides additional information on the fund’s portfolio holdings.
| Level 1 | Level 2 | Level 3 | ||||||
| Assets | ||||||||
| Investment Securities | ||||||||
| Common Stocks | $ | 3,884,907 | $ | 202,288,776 | — | |||
| Temporary Cash Investments | 1,444 | 4,234,000 | — | |||||
| $ | 3,886,351 | $ | 206,522,776 | — | ||||
17
7. Risk Factors
There are certain risks involved in investing in foreign securities. These risks include those resulting from future adverse political, social and economic developments, fluctuations in currency exchange rates, the possible imposition of exchange controls, and other foreign laws or restrictions.
The fund invests in common stocks of small companies. Because of this, the fund may be subject to greater risk and market fluctuations than a fund investing in larger, more established companies.
The fund’s investment process may result in high portfolio turnover, which could mean high transaction costs, affecting both performance and capital gains tax liabilities to investors.
8. Federal Tax Information
On December 20, 2016, the fund declared and paid the following per-share distributions from net investment income to shareholders of record on December 19, 2016:
| Investor Class | Institutional Class | R6 Class |
| — | $0.0166 | $0.0313 |
The tax character of distributions paid during the year ended November 30, 2016 and the period March 19, 2015 (fund inception) through November 30, 2015 were as follows:
| 2016 | 2015 | ||||
| Distributions Paid From | |||||
| Ordinary income | $ | 1,609,073 | — | ||
| Long-term capital gains | — | — | |||
The book-basis character of distributions made during the year from net investment income or net realized gains may differ from their ultimate characterization for federal income tax purposes. These differences reflect the differing character of certain income items and net realized gains and losses for financial statement and tax purposes, and may result in reclassification among certain capital accounts on the financial statements.
As of November 30, 2016, the federal tax cost of investments and the components of distributable earnings on a tax-basis were as follows:
| Federal tax cost of investments | $ | 195,212,352 | |
| Gross tax appreciation of investments | $ | 20,540,928 | |
| Gross tax depreciation of investments | (5,344,153 | ) | |
| Net tax appreciation (depreciation) of investments | 15,196,775 | ||
| Net tax appreciation (depreciation) on translation of assets and liabilities in foreign currencies | (24,618 | ) | |
| Net tax appreciation (depreciation) | $ | 15,172,157 | |
| Undistributed ordinary income | $ | 268,222 | |
Accumulated short-term capital losses | $ | (16,373,609 | ) |
The difference between book-basis and tax-basis unrealized appreciation (depreciation) is attributable primarily to the tax deferral of losses on wash sales.
Accumulated capital losses represent net capital loss carryovers that may be used to offset future realized capital gains for federal income tax purposes. The capital loss carryovers may be carried forward for an unlimited period. Future capital loss carryover utilization in any given year may be subject to Internal Revenue Code limitations.
9. Recently Issued Accounting Guidance
In October 2016, the Securities and Exchange Commission adopted new rules and forms as well as amendments to its rules and forms to modernize the reporting and disclosure of information by registered investment companies. The amendments to Regulation S-X will require standardized, enhanced disclosure about derivatives in investment company financial statements, as well as other provisions. Compliance with the amendments is effective on August 1, 2017. Management is currently evaluating the impact that adopting the amendments will have on the financial statement disclosures.
18
| Financial Highlights |
| For a Share Outstanding Throughout the Years Ended November 30 (except as noted) | |||||||||||||
| Per-Share Data | Ratios and Supplemental Data | ||||||||||||
| Income From Investment Operations: | Ratio to Average Net Assets of: | ||||||||||||
Net Asset Value, Beginning of Period | Net Investment Income (Loss)(1) | Net Realized and Unrealized Gain (Loss) | Total From Investment Operations | Distributions From Net Investment Income | Net Asset Value, End of Period | Total Return(2) | Operating Expenses | Net Investment Income (Loss) | Portfolio Turnover Rate | Net Assets, End of Period (in thousands) | |||
| Investor Class | |||||||||||||
| 2016 | $10.29 | (0.01) | (0.33) | (0.34) | (0.07) | $9.88 | (3.12)% | 1.47% | (0.07)% | 138% | $62,162 | ||
2015(3) | $10.00 | 0.02 | 0.27 | 0.29 | — | $10.29 | 2.70% | 1.47%(4) | 0.32%(4) | 118% | $65,428 | ||
| Institutional Class | |||||||||||||
| 2016 | $10.30 | 0.01 | (0.33) | (0.32) | (0.09) | $9.89 | (2.97)% | 1.27% | 0.13% | 138% | $135,377 | ||
2015(3) | $10.00 | 0.04 | 0.26 | 0.30 | — | $10.30 | 2.80% | 1.27%(4) | 0.52%(4) | 118% | $133,255 | ||
| R6 Class | |||||||||||||
| 2016 | $10.31 | 0.02 | (0.32) | (0.30) | (0.10) | $9.91 | (2.75)% | 1.12% | 0.28% | 138% | $13,777 | ||
2015(3) | $10.00 | 0.05 | 0.26 | 0.31 | — | $10.31 | 2.90% | 1.12%(4) | 0.67%(4) | 118% | $8,433 | ||
| Notes to Financial Highlights |
| (1) | Computed using average shares outstanding throughout the period. |
| (2) | Total returns are calculated based on the net asset value of the last business day. Total returns for periods less than one year are not annualized. |
| (3) | March 19, 2015 (fund inception) through November 30, 2015. |
| (4) | Annualized. |
See Notes to Financial Statements.
| Report of Independent Registered Public Accounting Firm |
To the Board of Directors and Shareholders of American Century World Mutual Funds, Inc.:
We have audited the accompanying statement of assets and liabilities, including the schedule of investments, of NT International Small-Mid Cap Fund (the “Fund”), one of the funds constituting American Century World Mutual Funds, Inc., as of November 30, 2016, and the related statement of operations for the year then ended, and the statements of changes in net assets and the financial highlights for year then ended and for the period from March 19, 2015 (commencement date) through November 30, 2015. These financial statements and financial highlights are the responsibility of the Fund’s management. Our responsibility is to express an opinion on these financial statements and financial highlights based on our audits.
We conducted our audits in accordance with the standards of the Public Company Accounting Oversight Board (United States). Those standards require that we plan and perform the audit to obtain reasonable assurance about whether the financial statements and financial highlights are free of material misstatement. The Fund is not required to have, nor were we engaged to perform, an audit of its internal control over financial reporting. Our audits included consideration of internal control over financial reporting as a basis for designing audit procedures that are appropriate in the circumstances, but not for the purpose of expressing an opinion on the effectiveness of the Fund’s internal control over financial reporting. Accordingly, we express no such opinion. An audit also includes examining, on a test basis, evidence supporting the amounts and disclosures in the financial statements, assessing the accounting principles used and significant estimates made by management, as well as evaluating the overall financial statement presentation. Our procedures included confirmation of securities owned as of November 30, 2016, by correspondence with the custodian and brokers; when replies were not received from brokers, we performed other auditing procedures. We believe that our audits provide a reasonable basis for our opinion.
In our opinion, the financial statements and financial highlights referred to above present fairly, in all material respects, the financial position of NT International Small-Mid Cap Fund of American Century World Mutual Funds, Inc. as of November 30, 2016, the results of its operations for the year then ended, and the changes in its net assets and the financial highlights for the year then ended and for the period from March 19, 2015 (commencement date) through November 30, 2015, in conformity with accounting principles generally accepted in the United States of America.
DELOITTE & TOUCHE LLP
Kansas City, Missouri
January 17, 2017
20
| Management |
The Board of Directors
The individuals listed below serve as directors of the funds. Each director will continue to serve in this capacity until death, retirement, resignation or removal from office. The board has adopted a mandatory retirement age for directors who are not “interested persons,” as that term is defined in the Investment Company Act (independent directors). Independent directors shall retire by December 31 of the year in which they reach their 75th birthday.
Mr. Thomas is an “interested person” because he currently serves as President and Chief Executive Officer of American Century Companies, Inc. (ACC), the parent company of American Century Investment Management, Inc. (ACIM or the advisor). The other directors (more than three-fourths of the total number) are independent. They are not employees, directors or officers of, and have no financial interest in, ACC or any of its wholly owned, direct or indirect, subsidiaries, including ACIM, American Century Investment Services, Inc. (ACIS) and American Century Services, LLC (ACS), and they do not have any other affiliations, positions or relationships that would cause them to be considered “interested persons” under the Investment Company Act. The directors serve in this capacity for seven (in the case of Mr. Thomas, 15) registered investment companies in the American Century Investments family of funds.
The following table presents additional information about the directors. The mailing address for each director is 4500 Main Street, Kansas City, Missouri 64111.
| Name (Year of Birth) | Position(s) Held with Funds | Length of Time Served | Principal Occupation(s) During Past 5 Years | Number of American Century Portfolios Overseen by Director | Other Directorships Held During Past 5 Years |
| Independent Directors | |||||
| Barry Fink (1955) | Director | Since 2012 | Retired; Executive Vice President, ACC (September 2007 to February 2013); President, ACS (October 2007 to February 2013); Chief Operating Officer, ACC (September 2007 to November 2012) | 81 | None |
| Andrea C. Hall (1945) | Director | Since 1997 | Retired | 81 | None |
| Jan M. Lewis (1957) | Director | Since 2011 | Retired; President and Chief Executive Officer, Catholic Charities of Northeast Kansas (human services organization) (2006 to 2013) | 81 | None |
| James A. Olson (1942) | Director and Chairman of the Board | Since 2007 (Chairman since 2014) | Member, Plaza Belmont LLC (private equity fund manager) (1999 to present) | 81 | Saia, Inc. (2002 to 2012) and EPR Properties (2003 to 2013) |
| M. Jeannine Strandjord (1945) | Director | Since 1994 | Retired | 81 | Euronet Worldwide Inc.; MGP Ingredients, Inc.; and DST Systems Inc. (1996 to 2012) |
21
| Name (Year of Birth) | Position(s) Held with Funds | Length of Time Served | Principal Occupation(s) During Past 5 Years | Number of American Century Portfolios Overseen by Director | Other Directorships Held During Past 5 Years |
| Independent Directors | |||||
| John R. Whitten (1946) | Director | Since 2008 | Retired | 81 | Rudolph Technologies, Inc. |
| Stephen E. Yates (1948) | Director | Since 2012 | Retired | 81 | None |
| Interested Director | |||||
| Jonathan S. Thomas (1963) | Director and President | Since 2007 | President and Chief Executive Officer, ACC (March 2007 to present). Also serves as Chief Executive Officer, ACS; Executive Vice President, ACIM; Director, ACC, ACIM and other ACC subsidiaries | 126 | BioMed Valley Discoveries, Inc. |
The Statement of Additional Information has additional information about the fund's directors and is available without charge, upon request, by calling 1-800-345-2021.
22
Officers
The following table presents certain information about the executive officers of the funds. Each officer serves as an officer for each of the 15 investment companies in the American Century family of funds, unless otherwise noted. No officer is compensated for his or her service as an officer of the funds. The listed officers are interested persons of the funds and are appointed or re-appointed on an annual basis. The mailing address for each officer listed below is 4500 Main Street, Kansas City, Missouri 64111.
| Name (Year of Birth) | Offices with the Funds | Principal Occupation(s) During the Past Five Years |
| Jonathan S. Thomas (1963) | Director and President since 2007 | President and Chief Executive Officer, ACC (March 2007 to present). Also serves as Chief Executive Officer, ACS; Executive Vice President, ACIM; Director, ACC, ACIM and other ACC subsidiaries |
| Amy D. Shelton (1964) | Chief Compliance Officer and Vice President since 2014 | Chief Compliance Officer, American Century funds, (March 2014 to present); Chief Compliance Officer, ACIM (February 2014 to present); Chief Compliance Officer, ACIS (October 2009 to present); Vice President, Client Interactions and Marketing, ACIS (February 2013 to January 2014); Director, Client Interactions and Marketing, ACIS (June 2007 to January 2013). Also serves as Vice President, ACIS |
| Charles A. Etherington (1957) | General Counsel since 2007 and Senior Vice President since 2006 | Attorney, ACC (February 1994 to present); Vice President, ACC (November 2005 to present); General Counsel, ACC (March 2007 to present). Also serves as General Counsel, ACIM, ACS, ACIS and other ACC subsidiaries; and Senior Vice President, ACIM and ACS |
| C. Jean Wade (1964) | Vice President,Treasurer and Chief Financial Officer since 2012 | Vice President, ACS (February 2000 to present) |
| Robert J. Leach (1966) | Vice President since 2006 and Assistant Treasurer since 2012 | Vice President, ACS (February 2000 to present) |
| David H. Reinmiller (1963) | Vice President since 2000 | Attorney, ACC (January 1994 to present); Associate General Counsel, ACC (January 2001 to present). Also serves as Vice President, ACIM and ACS |
| Ward D. Stauffer (1960) | Secretary since 2005 | Attorney, ACC (June 2003 to present) |
23
| Approval of Management Agreement |
At a meeting held on June 29, 2016, the Fund’s Board of Directors (the "Board") unanimously approved the renewal of the management agreement pursuant to which American Century Investment Management, Inc. (the “Advisor”) acts as the investment advisor for the Fund. Under Section 15(c) of the Investment Company Act, contracts for investment advisory services are required to be reviewed, evaluated, and approved by a majority of a fund’s directors (the “Directors”), including a majority of the independent Directors, each year.
Prior to its consideration of the renewal of the management agreement, the Directors requested and reviewed extensive data and information compiled by the Advisor and certain independent providers of evaluation data concerning the Fund and the services provided to the Fund by the Advisor. This review was in addition to the oversight and evaluation undertaken by the Board and its committees on a continual basis and the information received was supplemental to the extensive information that the Board and its committees receive and consider throughout the year.
In connection with its consideration of the renewal of the management agreement, the Board’s review and evaluation of the services provided by the Advisor included, but was not limited to, the following:
| • | the nature, extent, and quality of investment management, shareholder services, and other services provided and to be provided to the Fund; |
| • | the wide range of other programs and services provided and to be provided to the Fund and its shareholders on a routine and non-routine basis; |
| • | the investment performance of the Fund, including data comparing the Fund's performance to appropriate benchmarks and/or a peer group of other mutual funds with similar investment objectives and strategies; |
| • | the cost of owning the Fund compared to the cost of owning similar funds; |
| • | the compliance policies, procedures, and regulatory experience of the Advisor and the Fund's service providers; |
| • | financial data showing the cost of services provided to the Fund, the profitability of the Fund to the Advisor, and the overall profitability of the Advisor; |
| • | possible economies of scale associated with the Advisor’s management of the Fund and other accounts under its management; |
| • | data comparing services provided and charges to the Advisor's other investment management clients; |
| • | acquired fund fees and expenses; |
| • | payments by the Fund and the Advisor to financial intermediaries and the nature of services provided; and |
| • | any collateral benefits derived by the Advisor from the management of the Fund. |
In keeping with their practice, the Directors held two in-person meetings and one telephonic meeting to review and discuss the information provided. The independent Directors also had the benefit of the advice of their independent counsel throughout the process.
Factors Considered
The Directors considered all of the information provided by the Advisor, the independent data providers, and independent counsel in connection with the approval. They determined that the information was sufficient for them to evaluate the management agreement for the Fund. In connection with their review, the Directors did not identify any single factor as being all-important or controlling, and each Director may have attributed different levels of importance to different factors.
24
In deciding to renew the management agreement, the Board based its decision on a number of factors, including the following:
Nature, Extent and Quality of Services - Generally. Under the management agreement, the Advisor is responsible for providing or arranging for all services necessary for the operation of the Fund. The Board noted that under the management agreement, the Advisor provides or arranges at its own expense a wide variety of services including:
| • | constructing and designing the Fund |
| • | portfolio research and security selection |
| • | initial capitalization/funding |
| • | securities trading |
| • | Fund administration |
| • | custody of Fund assets |
| • | daily valuation of the Fund’s portfolio |
| • | shareholder servicing and transfer agency, including shareholder confirmations, recordkeeping, and communications |
| • | legal services (except the independent Directors’ counsel) |
| • | regulatory and portfolio compliance |
| • | financial reporting |
| • | marketing and distribution (except amounts paid by the Fund under Rule 12b-1 plans) |
The Board noted that many of these services have expanded over time in terms of both quantity and complexity in response to shareholder demands, competition in the industry, changing distribution channels, and the changing regulatory environment. The Board noted specifically the resources the Advisor has committed to enhancing cybersecurity protections for the benefit of shareholders.
Investment Management Services. The nature of the investment management services provided to the Fund is quite complex and allows Fund shareholders access to professional money management, instant diversification of their investments within an asset class, the opportunity to easily diversify among asset classes by investing in or exchanging among various American Century Investments funds, and liquidity. In evaluating investment performance, the Board expects the Advisor to manage the Fund in accordance with its investment objectives and approved strategies. Further, the Directors recognize that the Advisor has an obligation to monitor trading activities, and in particular to seek the best execution of fund trades, and to evaluate the use of and payment for research. In providing these services, the Advisor utilizes teams of investment professionals (portfolio managers, analysts, research assistants, and securities traders) who require extensive information technology, research, training, compliance, and other systems to conduct their business. The Board, directly and through its Fund Performance Review Committee, provides oversight of the investment performance process. It regularly reviews investment performance information for the Fund, together with comparative information for appropriate benchmarks and/or peer groups of similarly-managed funds, over different time horizons. The Directors also review detailed performance information provided by the Advisor during the management agreement approval process. If performance concerns are identified, the Fund receives special reviews until performance improves, during which the Board receives a report from the Advisor regarding the reasons for such results (e.g., market conditions, security selection) and any efforts being undertaken to improve performance. The Fund had less than one year of performance history at the time of the Board's review. The Board found the investment management services provided by the Advisor to the Fund to be satisfactory and consistent with the management agreement.
Shareholder and Other Services. Under the management agreement, the Advisor provides the Fund with a comprehensive package of transfer agency, shareholder, and other services. The Board, directly and through various committees of the Board, regularly reviews reports and evaluations of such services at its regular meetings. These reports include, but are not limited to,
25
information regarding the operational efficiency and accuracy of the shareholder and transfer agency services provided, staffing levels, shareholder satisfaction (as measured by external as well as internal sources), technology support, new products and services offered to Fund shareholders, securities trading activities, portfolio valuation services, auditing services, and legal and operational compliance activities. The Board particularly noted the Advisor’s continual efforts to maintain effective business continuity plans and to address cybersecurity threats. Certain aspects of shareholder and transfer agency service level efficiency and the quality of securities trading activities are measured by independent third party providers and are presented in comparison to other fund groups not managed by the Advisor. The Board found the services provided by the Advisor to the Fund under the management agreement to be competitive and of high quality.
Costs of Services and Profitability. The Advisor provides detailed information concerning its cost of providing various services to the Fund, its profitability in managing the Fund (pre- and post-distribution), its overall profitability, and its financial condition. The Directors have reviewed with the Advisor the methodology used to prepare this financial information. This information is considered in evaluating the Advisor’s financial condition, its ability to continue to provide services under the management agreement, and the reasonableness of the current management fee. The Board concluded that the Advisor’s profits were reasonable in light of the services provided to the Fund.
Ethics. The Board generally considers the Advisor’s commitment to providing quality services to shareholders and to conducting its business ethically. They noted that the Advisor’s practices generally meet or exceed industry best practices.
Economies of Scale. The Board also reviewed information provided by the Advisor regarding the possible existence of economies of scale in connection with the management of the Fund. The Board concluded that economies of scale are difficult to measure and predict with precision, especially on a fund-by-fund basis. The Board concluded that the Advisor is appropriately sharing economies of scale through its competitive fee structure, offering competitive fees from fund inception, and through reinvestment in its business to provide shareholders additional content and services.
Comparison to Other Funds’ Fees. The management agreement provides that the Fund pays the Advisor a single, all-inclusive (or unified) management fee for providing all services necessary for the management and operation of the Fund, other than brokerage expenses, expenses attributable to short sales, taxes, interest, extraordinary expenses, and the fees and expenses of the Fund’s independent Directors (including their independent legal counsel) and expenses incurred in connection with the provision of shareholder services and distribution services under a plan adopted pursuant to Rule 12b-1 under the 1940 Act. Under the unified fee structure, the Advisor is responsible for providing all investment advisory, custody, audit, administrative, compliance, recordkeeping, marketing and shareholder services, or arranging and supervising third parties to provide such services. By contrast, most other funds are charged a variety of fees, including an investment advisory fee, a transfer agency fee, an administrative fee, distribution charges, and other expenses. Other than their investment advisory fees and any applicable Rule 12b-1 distribution fees, all other components of the total fees charged by these other funds may be increased without shareholder approval. The Board believes the unified fee structure is a benefit to Fund shareholders because it clearly discloses to shareholders the cost of owning Fund shares, and, since the unified fee cannot be increased without a vote of Fund shareholders, it shifts to the Advisor the risk of increased costs of operating the Fund and provides a direct incentive to minimize administrative inefficiencies. Part of the Board’s analysis of fee levels involves reviewing certain evaluative data compiled by an independent provider comparing the Fund’s unified fee to the total expense ratios of its peers. The unified fee charged to shareholders of the Fund was below the median of the total expense ratios of the Fund’s peer expense universe and was within the range of its peer expense group. The Board concluded that the management fee paid by the Fund to the Advisor under the management agreement is reasonable in light of the services provided to the Fund.
26
Comparison to Fees and Services Provided to Other Clients of the Advisor. The Directors also requested and received information from the Advisor concerning the nature of the services, fees, costs, and profitability of its advisory services to advisory clients other than the Fund. They observed that these varying types of client accounts require different services and involve different regulatory and entrepreneurial risks than the management of the Fund. The Board analyzed this information and concluded that the fees charged and services provided to the Fund were reasonable by comparison.
Payments to Intermediaries. The Directors also requested and received a description of payments made to intermediaries by the Fund and the Advisor. These payments include various payments made by the Fund or the Advisor to different types of intermediaries and recordkeepers for distribution and service activities provided for the Fund. The Board received confirmation from the Advisor that all such payments by the Fund intended for distribution were made pursuant to the Fund's 12b-1 Plan. The Board reviewed such information and found the payments to be reasonable in scope and purpose.
Collateral or “Fall-Out” Benefits Derived by the Advisor. The Board considered the existence of collateral benefits the Advisor may receive as a result of its relationship with the Fund. They concluded that the Advisor’s primary business is managing mutual funds and it generally does not use fund or shareholder information to generate profits in other lines of business, and therefore does not derive any significant collateral benefits from them. The Board noted that additional assets from other clients may offer the Advisor some benefit from increased leverage with service providers and counterparties. Additionally, the Advisor receives proprietary research from broker-dealers that execute fund portfolio transactions, which the Board concluded is likely to benefit other clients of the Advisor, as well as Fund shareholders. The Board also determined that the Advisor is able to provide investment management services to certain clients other than the Fund, at least in part, due to its existing infrastructure built to serve the fund complex. The Board concluded that appropriate allocation methodologies had been employed to assign resources and the cost of those resources to these other clients and, where expressly provided, these other client assets may be included with the assets of the Fund to determine breakpoints in the management fee schedule.
Existing Relationship. The Board also considered whether there was any reason for not continuing the existing arrangement with the Advisor. In this regard, the Board was mindful of the potential disruptions of the Fund’s operations and various risks, uncertainties, and other effects that could occur as a result of a decision not to continue such relationship. In particular, the Board recognized that most shareholders have invested in the Fund on the strength of the Advisor’s industry standing and reputation and in the expectation that the Advisor will have a continuing role in providing advisory services to the Fund.
Conclusion of the Directors. As a result of this process, the Board, including all of the independent Directors, taking into account all of the factors discussed above and the information provided by the Advisor and others in connection with its review and throughout the year, determined that the management fee is fair and reasonable in light of the services provided and that the investment management agreement between the Fund and the Advisor should be renewed.
27
| Additional Information |
Retirement Account Information
As required by law, distributions you receive from certain IRAs are subject to federal income tax withholding, unless you elect not to have withholding apply. Tax will be withheld on the total amount withdrawn even though you may be receiving amounts that are not subject to withholding, such as nondeductible contributions. In such case, excess amounts of withholding could occur. You may adjust your withholding election so that a greater or lesser amount will be withheld.
If you don’t want us to withhold on this amount, you must notify us to not withhold the federal income tax. You may notify us in writing or in certain situations by telephone or through other electronic means. For systematic withdrawals, your withholding election will remain in effect until revoked or changed by filing a new election. You have the right to revoke your election at any time.
Remember, even if you elect not to have income tax withheld, you are liable for paying income tax on the taxable portion of your withdrawal. If you elect not to have income tax withheld or you don’t have enough income tax withheld, you may be responsible for payment of estimated tax. You may incur penalties under the estimated tax rules if your withholding and estimated tax payments are not sufficient. You can reduce or defer the income tax on a distribution by directly or indirectly rolling such distribution over to another IRA or eligible plan. You should consult your tax advisor for additional information.
State tax will be withheld if, at the time of your distribution, your address is within one of the mandatory withholding states and you have federal income tax withheld (or as otherwise required by state law). State taxes will be withheld from your distribution in accordance with the respective state rules.
Distributions you receive from 403(b), 457 and qualified plans are subject to special tax and withholding rules. Your plan administrator or plan sponsor is required to provide you with a special tax notice explaining those rules at the time you request a distribution. If applicable, federal and/or state taxes may be withheld from your distribution amount.
Proxy Voting Policies
A description of the policies that the fund's investment advisor uses in exercising the voting rights associated with the securities purchased and/or held by the fund is available without charge, upon request, by calling 1-800-345-2021. It is also available on the "About Us" page of American Century Investments’ website at americancentury.com and on the Securities and Exchange Commission’s website at sec.gov. Information regarding how the investment advisor voted proxies relating to portfolio securities during the most recent 12-month period ended June 30 is available on the "About Us" page at americancentury.com. It is also available at sec.gov.
Quarterly Portfolio Disclosure
The fund files its complete schedule of portfolio holdings with the Securities and Exchange Commission (SEC) for the first and third quarters of each fiscal year on Form N-Q. The fund’s Forms N-Q are available on the SEC’s website at sec.gov, and may be reviewed and copied at the SEC’s Public Reference Room in Washington, DC. Information on the operation of the Public Reference Room may be obtained by calling 1-800-SEC-0330. The fund also makes its complete schedule of portfolio holdings for the most recent quarter of its fiscal year available on its website at americancentury.com and, upon request, by calling 1-800-345-2021.
28
Other Tax Information
The following information is provided pursuant to provisions of the Internal Revenue Code.
The fund hereby designates up to the maximum amount allowable as qualified dividend income for the fiscal year ended November 30, 2016.
For the fiscal year ended November 30, 2016, the fund intends to pass through to shareholders foreign source income of $3,141,129 and foreign taxes paid of $254,264, or up to the maximum amount allowable, as a foreign tax credit. Foreign source income and foreign tax expense per outstanding share on November 30, 2016 are $0.1470 and $0.0119, respectively.
29
| Notes |
30
| Notes |
31
| Notes |
32
| ||
| Contact Us | americancentury.com | |
| Automated Information Line | 1-800-345-8765 | |
| Investor Services Representative | 1-800-345-2021 or 816-531-5575 | |
| Investors Using Advisors | 1-800-378-9878 | |
| Business, Not-For-Profit, Employer-Sponsored Retirement Plans | 1-800-345-3533 | |
| Banks and Trust Companies, Broker-Dealers, Financial Professionals, Insurance Companies | 1-800-345-6488 | |
| Telecommunications Relay Service for the Deaf | 711 | |
| American Century World Mutual Funds, Inc. | ||
Investment Advisor: American Century Investment Management, Inc. Kansas City, Missouri | ||
| This report and the statements it contains are submitted for the general information of our shareholders. The report is not authorized for distribution to prospective investors unless preceded or accompanied by an effective prospectus. | ||
| ©2017 American Century Proprietary Holdings, Inc. All rights reserved. CL-ANN-91025 1701 | ||
| Annual Report | |
| November 30, 2016 | |
| NT International Value Fund | |
| Table of Contents |
| Performance | 2 | |
| Portfolio Commentary | ||
| Fund Characteristics | ||
| Shareholder Fee Example | ||
| Schedule of Investments | ||
| Statement of Assets and Liabilities | ||
| Statement of Operations | ||
| Statement of Changes in Net Assets | ||
| Notes to Financial Statements | ||
| Financial Highlights | ||
| Report of Independent Registered Public Accounting Firm | ||
| Management | ||
| Approval of Management Agreement | ||
| Additional Information | ||
Any opinions expressed in this report reflect those of the author as of the date of the report, and do not necessarily represent the opinions of American Century Investments® or any other person in the American Century Investments organization. Any such opinions are subject to change at any time based upon market or other conditions and American Century Investments disclaims any responsibility to update such opinions. These opinions may not be relied upon as investment advice and, because investment decisions made by American Century Investments funds are based on numerous factors, may not be relied upon as an indication of trading intent on behalf of any American Century Investments fund. Security examples are used for representational purposes only and are not intended as recommendations to purchase or sell securities. Performance information for comparative indices and securities is provided to American Century Investments by third party vendors. To the best of American Century Investments’ knowledge, such information is accurate at the time of printing.
| Performance |
| Total Returns as of November 30, 2016 | ||||
| Average Annual Returns | ||||
Ticker Symbol | 1 year | Since Inception | Inception Date | |
| Investor Class | ANTVX | -3.42% | -6.46% | 3/19/15 |
| MSCI EAFE Value Index | — | -1.51% | -5.09% | — |
| Institutional Class | ANTYX | -3.16% | -6.25% | 3/19/15 |
| R6 Class | ANTWX | -3.04% | -6.13% | 3/19/15 |
| Growth of $10,000 Over Life of Class |
| $10,000 investment made March 19, 2015 |
| Performance for other share classes will vary due to differences in fee structure. |
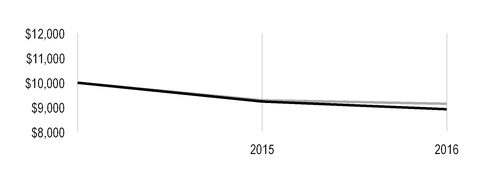
| Value on November 30, 2016 | |
| Investor Class — $8,924 | |
| MSCI EAFE Value Index — $9,148 | |
Total Annual Fund Operating Expenses | ||
| Investor Class | Institutional Class | R6 Class |
| 1.31% | 1.11% | 0.96% |
The total annual fund operating expenses shown is as stated in the fund’s prospectus current as of the date of this report. The prospectus may vary from the expense ratio shown elsewhere in this report because it is based on a different time period, includes acquired fund fees and expenses, and, if applicable, does not include fee waivers or expense reimbursements.
Data presented reflect past performance. Past performance is no guarantee of future results. Current performance may be higher or lower than the performance shown. Total returns for periods less than one year are not annualized. Investment return and principal value will fluctuate, and redemption value may be more or less than original cost. Data assumes reinvestment of dividends and capital gains, and none of the charts reflect the deduction of taxes that a shareholder would pay on fund distributions or the redemption of fund shares. To obtain performance data current to the most recent month end, please call 1-800-345-2021 or visit americancentury.com. For additional information about the fund, please consult the prospectus.
2
| Portfolio Commentary |
Portfolio Managers: Elizabeth Xie and Vinod Chandrashekaran
In September 2016, portfolio manager Yulin Long left the fund's management team.
Performance Summary
NT International Value declined -3.16%* for the fiscal year ended November 30, 2016, compared with the -1.51% return of its benchmark, the MSCI EAFE Value Index. Fund results reflect operating expenses, while benchmark returns do not.
From late December to mid-February, stock market indices declined sharply on a confluence of factors that carried over from last summer’s similar sell-off, including China-related concerns and an energy price collapse. The markets were recovering until the U.K.’s late June Brexit vote triggered a sharp market correction that spilled into the beginning of the third quarter, with most equity markets continuing to decline. Non-U.S. markets ultimately recovered some of their Brexit-related losses, finishing lower for the year but well above their lowest levels. Non-U.S. developed market stocks declined during the 12-month period, sharply lagging returns provided by U.S.-based equities. Among non-U.S. developed market stocks, the Asia-Pacific region fared the best, delivering a small gain, equities based in the Far East posted modest losses, and those domiciled in Europe sharply lagged.
The fund’s stock selection process incorporates factors of valuation, quality, and sentiment while minimizing unintended risks among industries and other risk characteristics. Stock selection insights based on valuation were most beneficial to relative returns, while sentiment and quality contributed to a lesser extent. Difficult stock selection among real estate, utilities, consumer discretionary, and energy led to underperformance. Conversely, stock selection in telecommunication services, financials and information technology holdings contributed favorably to relative returns. From a geographical perspective, investments in Japan, and to a lesser extent, France and Germany weighed on the fund’s results, while stock selection in Sweden and Australia and investments in Spain were beneficial.
Japan-Based Holdings Detracted from Performance
In Japan, an overweight in Japan-based electric utility Tokyo Electric Power and a portfolio-only allocation to Seven Bank hurt the fund’s relative returns. Tokyo Electric’s first-quarter operating profit plummeted 37% as sales declined amid faltering demand and new entrants into Japan’s power market. Investors also were concerned by its opaque sales and cost outlooks after it reported those results. Seven Bank reported weaker-than-expected quarterly results during the period. We subsequently eliminated our position in both companies as their profiles declined markedly across all measures.
Among U.K.-based financials, a portfolio-only holding in publicly-traded hedge fund Man Group and an overweight in asset manager Legal & General Group hampered performance. The two firms were hurt by concerns about Brexit’s potential impact on their businesses. Earlier in the year, a weaker outlook for Man Group’s performance fees also contributed to the share’s weakness.
Elsewhere in the fund, a portfolio-only position in Germany-based ProSiebenSat.1 Media was detrimental amid investor concerns that the digital entertainment firm is spending too much on the acquisitions it is using to fuel growth and diversify its business away from mature media to e-commerce and online.
*All fund returns referenced in this commentary are for Institutional Class shares. Performance for other share classes will vary due to differences in fee structure; when Institutional Class performance exceeds that of the fund's benchmark, other share classes may not. See page 2 for returns for all share classes.
3
Stock Selection in Metals and Mining Benefited Results
Security selection in a number of natural resource companies helped to somewhat limit the fund’s losses. Shares of Australia-based Fortescue Metals Group, an iron ore exporter, generally moved higher throughout the period, as iron ore and steel markets remain supported by better infrastructure and housing activity in China. The company also was aided by its efforts to cut cash costs. An allocation to U.K.-based mining company Rio Tinto also added value. Rio Tinto benefited from higher metals and diamond prices as well as increased optimism that infrastructure spending would increase following the U.S. election results. A portfolio-only holding of India-based metals producer Vedanta Resources aided returns. After falling to their low for the year in early February, the shares moved steadily higher, benefiting from the positive impact of management’s cost optimization strategy on earnings before interest, taxes, depreciation, and amortization (EBITDA) margins.
Outside of metals and mining, a portfolio-only allocation to Norway-based oilfield services firm Subsea 7 helped performance. An improved oil-price environment along with strong project execution and more efficient vessel scheduling continues to outweigh the negative impact of revenue pressures. Management also raised its EBITDA margin guidance.
A Look Ahead
As we approach 2017, we believe there is potential for stronger growth in the developed world in the coming year. Growth expectations have improved in the U.S., the U.K., and the Eurozone, which has been reflected in recent market performance. At the same time, post-election risks remain. The U.K.’s exit from the European Union (Brexit) has been delayed and president-elect Trump’s proposals are still just talk. How they, and other changes from populist movements, actually play out remains to be seen. The combination of a stronger dollar, weaker commodities, and Trump’s trade policy proposals makes the environment more challenging for emerging markets. This potentially signals a shift in growth leadership from emerging markets to developed markets. However, that assumes the ultimate impact of populist movement-driven changes won’t derail developed market growth. We believe our disciplined investment approach is particularly beneficial during periods of likely volatility, and we adhere to our process regardless of the market environment. We believe that this allows us to take advantage of opportunities presented by market inefficiencies.
We believe that stock selection—rather than regional and sector allocation or market timing via the use of cash—is the most efficient means of generating superior risk-adjusted returns. As a result of this approach, the fund’s country and sector weightings are primarily a result of identifying what we believe to be superior individual securities.
4
| Fund Characteristics |
| NOVEMBER 30, 2016 | |
Top Ten Holdings | % of net assets |
| HSBC Holdings plc | 3.4% |
| Royal Dutch Shell plc, B Shares | 3.2% |
| GlaxoSmithKline plc | 2.4% |
| Allianz SE | 2.2% |
| Toyota Motor Corp. | 2.2% |
| Australia & New Zealand Banking Group Ltd. | 1.9% |
| ING Groep NV | 1.9% |
| TOTAL SA | 1.8% |
| BNP Paribas SA | 1.8% |
| Rio Tinto plc | 1.6% |
Types of Investments in Portfolio | % of net assets |
| Common Stocks | 97.1% |
| Exchange-Traded Funds | 1.1% |
| Total Equity Exposure | 98.2% |
| Temporary Cash Investments | 2.0% |
| Other Assets and Liabilities | (0.2)% |
Investments by Country | % of net assets |
| Japan | 24.7% |
| United Kingdom | 19.4% |
| France | 11.7% |
| Germany | 7.6% |
| Australia | 6.8% |
| Spain | 4.8% |
| Hong Kong | 4.2% |
| Switzerland | 3.2% |
| Netherlands | 2.6% |
| Italy | 2.4% |
| Other Countries | 9.7% |
| Exchange-Traded Funds* | 1.1% |
| Cash and Equivalents** | 1.8% |
| *Category may increase exposure to the countries indicated. The Schedule of Investments provides | |
| additional information on the fund's portfolio holdings. | |
| **Includes temporary cash investments and other assets and liabilities. | |
5
| Shareholder Fee Example |
Fund shareholders may incur two types of costs: (1) transaction costs, including sales charges (loads) on purchase payments and redemption/exchange fees; and (2) ongoing costs, including management fees; distribution and service (12b-1) fees; and other fund expenses. This example is intended to help you understand your ongoing costs (in dollars) of investing in your fund and to compare these costs with the ongoing cost of investing in other mutual funds.
The example is based on an investment of $1,000 made at the beginning of the period and held for the entire period from June 1, 2016 to November 30, 2016.
Actual Expenses
The table provides information about actual account values and actual expenses for each class. You may use the information, together with the amount you invested, to estimate the expenses that you paid over the period. First, identify the share class you own. Then simply divide your account value by $1,000 (for example, an $8,600 account value divided by $1,000 = 8.6), then multiply the result by the number under the heading “Expenses Paid During Period” to estimate the expenses you paid on your account during this period.
Hypothetical Example for Comparison Purposes
The table also provides information about hypothetical account values and hypothetical expenses based on the actual expense ratio of each class of your fund and an assumed rate of return of 5% per year before expenses, which is not the actual return of a fund’s share class. The hypothetical account values and expenses may not be used to estimate the actual ending account balance or expenses you paid for the period. You may use this information to compare the ongoing costs of investing in your fund and other funds. To do so, compare this 5% hypothetical example with the 5% hypothetical examples that appear in the shareholder reports of the other funds.
Please note that the expenses shown in the table are meant to highlight your ongoing costs only and do not reflect any transactional costs, such as sales charges (loads) or redemption/exchange fees. Therefore, the table is useful in comparing ongoing costs only, and will not help you determine the relative total costs of owning different funds. In addition, if these transactional costs were included, your costs would have been higher.
| Beginning Account Value 6/1/16 | Ending Account Value 11/30/16 | Expenses Paid During Period(1) 6/1/16 - 11/30/16 | Annualized Expense Ratio(1) | |
Actual | ||||
| Investor Class | $1,000 | $1,009.20 | $6.58 | 1.31% |
| Institutional Class | $1,000 | $1,010.40 | $5.58 | 1.11% |
| R6 Class | $1,000 | $1,011.50 | $4.83 | 0.96% |
| Hypothetical | ||||
| Investor Class | $1,000 | $1,018.45 | $6.61 | 1.31% |
| Institutional Class | $1,000 | $1,019.45 | $5.60 | 1.11% |
| R6 Class | $1,000 | $1,020.20 | $4.85 | 0.96% |
| (1) | Expenses are equal to the class's annualized expense ratio listed in the table above, multiplied by the average account value over the period, multiplied by 183, the number of days in the most recent fiscal half-year, divided by 366, to reflect the one-half year period. |
6
| Schedule of Investments |
NOVEMBER 30, 2016
| Shares | Value | ||||
| COMMON STOCKS — 97.1% | |||||
| Australia — 6.8% | |||||
| Australia & New Zealand Banking Group Ltd. | 784,733 | $ | 16,463,198 | ||
| BlueScope Steel Ltd. | 331,020 | 2,204,864 | |||
| BWP Trust | 482,936 | 1,037,776 | |||
| CIMIC Group Ltd. | 128,419 | 2,922,691 | |||
| Dexus Property Group | 228,581 | 1,539,416 | |||
| Downer EDI Ltd. | 1,239,518 | 5,189,876 | |||
| Flight Centre Travel Group Ltd. | 68,700 | 1,694,432 | |||
| Fortescue Metals Group Ltd. | 1,193,597 | 5,173,886 | |||
| Mineral Resources Ltd. | 199,585 | 1,852,611 | |||
| OZ Minerals Ltd. | 224,572 | 1,305,123 | |||
| Regis Resources Ltd. | 395,099 | 831,518 | |||
| Scentre Group | 434,979 | 1,361,931 | |||
| Telstra Corp. Ltd. | 1,372,314 | 5,117,595 | |||
| Westpac Banking Corp. | 486,911 | 11,243,422 | |||
| 57,938,339 | |||||
| Belgium — 1.5% | |||||
| Bekaert SA | 45,009 | 1,877,343 | |||
| KBC Group NV | 181,501 | 10,883,943 | |||
| 12,761,286 | |||||
| China — 0.6% | |||||
| China Construction Bank Corp., H Shares | 3,505,000 | 2,611,861 | |||
| China Galaxy Securities Co. Ltd., H Shares | 674,500 | 669,587 | |||
| Industrial & Commercial Bank of China Ltd., H Shares | 3,564,000 | 2,182,557 | |||
| 5,464,005 | |||||
| Denmark — 0.7% | |||||
| Vestas Wind Systems A/S | 89,731 | 5,920,417 | |||
| Finland — 0.4% | |||||
| UPM-Kymmene Oyj | 148,356 | 3,396,277 | |||
| France — 11.7% | |||||
| AXA SA | 569,025 | 13,406,490 | |||
| BNP Paribas SA | 267,566 | 15,534,499 | |||
| Cie Generale des Etablissements Michelin, Class B | 8,966 | 959,764 | |||
| CNP Assurances | 48,050 | 843,840 | |||
| Engie SA | 685,455 | 8,463,484 | |||
| Faurecia | 119,457 | 4,281,831 | |||
| Metropole Television SA | 58,022 | 990,063 | |||
| Orange SA | 434,725 | 6,337,522 | |||
Peugeot SA(1) | 602,724 | 8,892,052 | |||
| Safran SA | 46,531 | 3,194,189 | |||
| Sanofi | 58,419 | 4,712,378 | |||
| Schneider Electric SE | 11,537 | 768,131 | |||
| SCOR SE | 36,591 | 1,162,071 | |||
| Societe Generale SA | 251,436 | 10,815,268 | |||
| TOTAL SA | 328,354 | 15,644,605 | |||
7
| Shares | Value | ||||
| Valeo SA | 50,116 | $ | 2,794,403 | ||
| 98,800,590 | |||||
| Germany — 7.6% | |||||
| Allianz SE | 116,980 | 18,572,387 | |||
| BASF SE | 37,147 | 3,188,596 | |||
| Continental AG | 11,430 | 2,027,897 | |||
| Daimler AG | 15,264 | 1,015,303 | |||
| Deutsche Wohnen AG | 64,032 | 1,972,136 | |||
| E.ON SE | 237,184 | 1,565,339 | |||
| Evonik Industries AG | 64,812 | 1,807,260 | |||
| Hannover Rueck SE | 85,369 | 9,061,403 | |||
| METRO AG | 227,661 | 6,803,071 | |||
| Muenchener Rueckversicherungs-Gesellschaft AG | 15,729 | 2,864,804 | |||
| ProSiebenSat.1 Media SE | 70,633 | 2,420,610 | |||
| Siemens AG | 84,085 | 9,499,922 | |||
| STADA Arzneimittel AG | 48,432 | 2,365,829 | |||
Uniper SE(1) | 95,097 | 1,184,769 | |||
| 64,349,326 | |||||
| Hong Kong — 4.2% | |||||
| BOC Hong Kong Holdings Ltd. | 2,384,000 | 8,944,034 | |||
| Hang Seng Bank Ltd. | 453,400 | 8,592,767 | |||
| HK Electric Investments & HK Electric Investments Ltd. | 1,857,500 | 1,638,020 | |||
| Kerry Properties Ltd. | 261,000 | 747,012 | |||
| Link REIT | 560,000 | 3,855,347 | |||
| New World Development Co. Ltd. | 1,564,000 | 1,742,147 | |||
| PCCW Ltd. | 2,855,000 | 1,660,034 | |||
| Sands China Ltd. | 238,000 | 1,172,127 | |||
| Television Broadcasts Ltd. | 157,900 | 562,874 | |||
| WH Group Ltd. | 5,767,500 | 4,796,026 | |||
| Wharf Holdings Ltd. (The) | 89,000 | 659,769 | |||
| Wheelock & Co. Ltd. | 272,000 | 1,616,605 | |||
| 35,986,762 | |||||
| India — 1.1% | |||||
| Tata Power Co. Ltd. | 1,636,147 | 1,770,030 | |||
| Vedanta Resources plc | 523,114 | 5,517,604 | |||
| Yes Bank Ltd. | 138,452 | 2,374,351 | |||
| 9,661,985 | |||||
| Israel — 0.1% | |||||
Tower Semiconductor Ltd.(1) | 33,402 | 604,171 | |||
| Italy — 2.4% | |||||
| Enel SpA | 2,743,494 | 11,089,935 | |||
| Eni SpA | 653,665 | 9,103,217 | |||
| 20,193,152 | |||||
| Japan — 24.7% | |||||
| Asahi Kasei Corp. | 322,000 | 2,863,817 | |||
| Bridgestone Corp. | 273,200 | 10,428,429 | |||
| Canon, Inc. | 141,700 | 4,039,017 | |||
| Central Japan Railway Co. | 43,900 | 7,167,973 | |||
| Dai-ichi Life Holdings, Inc. | 58,500 | 937,544 | |||
| Daiichi Sankyo Co. Ltd. | 93,600 | 1,948,824 | |||
| Daito Trust Construction Co. Ltd. | 18,100 | 2,812,180 | |||
8
| Shares | Value | ||||
| Daiwa House Industry Co. Ltd. | 84,100 | $ | 2,390,570 | ||
| Daiwa Securities Group, Inc. | 747,000 | 4,488,334 | |||
| FANUC Corp. | 6,200 | 1,046,204 | |||
| Fuji Heavy Industries Ltd. | 145,200 | 5,895,319 | |||
| Fujitsu Ltd. | 327,000 | 1,928,758 | |||
| Hitachi Chemical Co. Ltd. | 171,700 | 3,767,029 | |||
| Hitachi Construction Machinery Co. Ltd. | 294,500 | 6,059,639 | |||
| Honda Motor Co. Ltd. | 371,600 | 10,822,702 | |||
| Japan Airlines Co. Ltd. | 259,800 | 7,686,928 | |||
| Komatsu Ltd. | 322,900 | 7,432,867 | |||
| Konami Holdings Corp. | 29,200 | 987,754 | |||
| Leopalace21 Corp. | 877,300 | 4,762,059 | |||
| Mazda Motor Corp. | 70,700 | 1,133,375 | |||
| Miraca Holdings, Inc. | 66,800 | 2,989,520 | |||
| Mitsubishi Chemical Holdings Corp. | 1,016,900 | 6,395,346 | |||
| Mitsubishi Corp. | 65,500 | 1,415,002 | |||
| Mitsubishi UFJ Financial Group, Inc. | 1,546,200 | 9,052,443 | |||
| Mitsui Chemicals, Inc. | 472,000 | 2,182,492 | |||
| Mixi, Inc. | 52,800 | 1,839,150 | |||
| Mizuho Financial Group, Inc. | 3,441,000 | 6,093,673 | |||
| MS&AD Insurance Group Holdings, Inc. | 20,500 | 635,938 | |||
| Nippon Telegraph & Telephone Corp. | 200,000 | 8,085,311 | |||
| NSK Ltd. | 321,400 | 3,500,410 | |||
| NTT DOCOMO, Inc. | 341,200 | 7,825,784 | |||
| OKUMA Corp. | 135,000 | 1,181,198 | |||
| Oracle Corp. Japan | 22,300 | 1,111,053 | |||
| ORIX Corp. | 459,600 | 7,156,832 | |||
| Osaka Gas Co. Ltd. | 1,513,000 | 5,721,112 | |||
| Penta-Ocean Construction Co. Ltd. | 124,600 | 610,993 | |||
| SBI Holdings, Inc. | 289,900 | 3,628,660 | |||
| Sega Sammy Holdings, Inc. | 279,300 | 4,174,669 | |||
| Seiko Epson Corp. | 199,200 | 3,992,532 | |||
| Sompo Holdings, Inc. | 17,100 | 557,220 | |||
| Sumitomo Mitsui Financial Group, Inc. | 199,300 | 7,327,091 | |||
| Suzuki Motor Corp. | 105,400 | 3,390,341 | |||
| TonenGeneral Sekiyu KK | 95,000 | 904,287 | |||
| Toshiba Plant Systems & Services Corp. | 113,200 | 1,695,947 | |||
| Tosoh Corp. | 247,000 | 1,658,109 | |||
| Toyota Boshoku Corp. | 170,800 | 3,883,142 | |||
| Toyota Motor Corp. | 318,100 | 18,487,364 | |||
| Toyota Tsusho Corp. | 57,300 | 1,431,937 | |||
| TS Tech Co. Ltd. | 125,600 | 3,310,030 | |||
| 208,836,908 | |||||
| Netherlands — 2.6% | |||||
| BE Semiconductor Industries NV | 12,377 | 410,652 | |||
| ING Groep NV | 1,179,699 | 16,066,402 | |||
| Koninklijke Ahold Delhaize NV | 91,481 | 1,804,353 | |||
| NN Group NV | 79,429 | 2,553,264 | |||
| Unilever NV CVA | 36,218 | 1,453,856 | |||
| 22,288,527 | |||||
9
| Shares | Value | ||||
| New Zealand — 0.2% | |||||
| Meridian Energy Ltd. | 799,091 | $ | 1,454,405 | ||
| Norway — 0.9% | |||||
Subsea 7 SA(1) | 630,678 | 7,363,355 | |||
| Singapore — 0.8% | |||||
| Jardine Cycle & Carriage Ltd. | 107,948 | 3,023,764 | |||
| Mapletree Greater China Commercial Trust | 775,900 | 522,373 | |||
| StarHub Ltd. | 502,800 | 1,010,266 | |||
| United Overseas Bank Ltd. | 158,100 | 2,251,244 | |||
| 6,807,647 | |||||
| South Korea — 1.2% | |||||
| Hyosung Corp. | 16,698 | 1,985,391 | |||
| Hyundai Development Co-Engineering & Construction | 47,249 | 1,669,205 | |||
| Lotte Chemical Corp. | 4,789 | 1,317,021 | |||
| Samsung Electronics Co. Ltd. | 1,953 | 2,916,845 | |||
| SK Innovation Co. Ltd. | 16,634 | 2,169,869 | |||
| 10,058,331 | |||||
| Spain — 4.8% | |||||
| ACS Actividades de Construccion y Servicios SA | 129,204 | 3,804,790 | |||
| Banco Santander SA | 2,459,775 | 11,243,956 | |||
| Endesa SA | 356,924 | 7,378,464 | |||
Indra Sistemas SA(1) | 96,883 | 1,001,144 | |||
| Mapfre SA | 722,386 | 2,166,706 | |||
| Repsol SA | 432,672 | 5,777,948 | |||
| Telefonica SA | 1,145,242 | 9,530,635 | |||
| 40,903,643 | |||||
| Sweden — 1.3% | |||||
| Hufvudstaden AB, A Shares | 40,727 | 619,993 | |||
| Peab AB | 273,233 | 2,109,358 | |||
| Skanska AB, B Shares | 343,701 | 7,900,487 | |||
| 10,629,838 | |||||
| Switzerland — 3.2% | |||||
| dormakaba Holding AG | 1,263 | 912,436 | |||
| Nestle SA | 60,284 | 4,055,695 | |||
| Roche Holding AG | 36,153 | 8,061,262 | |||
| Swiss Re AG | 139,275 | 12,822,012 | |||
| UBS Group AG | 62,649 | 996,395 | |||
| 26,847,800 | |||||
| Taiwan — 0.9% | |||||
| China Life Insurance Co. Ltd. | 704,000 | 750,980 | |||
| Fubon Financial Holding Co. Ltd. | 562,000 | 871,926 | |||
| Lite-On Technology Corp. | 728,000 | 1,148,885 | |||
| Quanta Computer, Inc. | 1,237,000 | 2,305,330 | |||
| Taiwan Semiconductor Manufacturing Co. Ltd. ADR | 80,427 | 2,387,878 | |||
| 7,464,999 | |||||
| United Kingdom — 19.4% | |||||
| 3i Group plc | 212,559 | 1,832,421 | |||
| AA plc | 339,853 | 1,129,820 | |||
Anglo American plc(1) | 275,711 | 4,087,888 | |||
| AstraZeneca plc | 96,872 | 5,029,452 | |||
| BHP Billiton plc | 290,270 | 4,770,444 | |||
10
| Shares | Value | ||||
| BP plc | 1,948,164 | $ | 11,199,287 | ||
| Capita plc | 100,786 | 661,412 | |||
| Centamin plc | 499,723 | 812,204 | |||
| Centrica plc | 2,906,411 | 7,647,560 | |||
Evraz plc(1) | 1,488,631 | 4,466,454 | |||
| GlaxoSmithKline plc | 1,091,046 | 20,415,314 | |||
Glencore plc(1) | 1,693,742 | 5,918,952 | |||
| Go-Ahead Group plc | 52,852 | 1,374,809 | |||
| HSBC Holdings plc | 3,665,731 | 29,133,836 | |||
| Indivior plc | 162,680 | 656,637 | |||
| Investec plc | 996,492 | 6,483,414 | |||
| Legal & General Group plc | 735,612 | 2,170,297 | |||
| Man Group plc | 625,060 | 886,873 | |||
| Marks & Spencer Group plc | 622,433 | 2,559,876 | |||
| Petrofac Ltd. | 278,359 | 2,767,106 | |||
| Rio Tinto plc | 364,834 | 13,648,756 | |||
| Royal Dutch Shell plc, B Shares | 1,022,873 | 27,112,950 | |||
| Royal Mail plc | 1,069,934 | 6,273,153 | |||
| Vodafone Group plc | 1,230,754 | 2,985,903 | |||
| 164,024,818 | |||||
TOTAL COMMON STOCKS (Cost $818,925,694) | 821,756,581 | ||||
| EXCHANGE-TRADED FUNDS — 1.1% | |||||
| iShares MSCI Japan ETF | 87,146 | 4,347,714 | |||
| iShares MSCI EAFE Value ETF | 36,000 | 1,654,200 | |||
| iShares MSCI EAFE ETF | 57,000 | 3,237,030 | |||
TOTAL EXCHANGE-TRADED FUNDS (Cost $9,143,004) | 9,238,944 | ||||
| TEMPORARY CASH INVESTMENTS — 2.0% | |||||
| Repurchase Agreement, Fixed Income Clearing Corp., (collateralized by various U.S. Treasury obligations, 3.625%, 2/15/44, valued at $16,947,169), at 0.08%, dated 11/30/16, due 12/1/16 (Delivery value $16,614,037) | 16,614,000 | ||||
| State Street Institutional U.S. Government Money Market Fund, Premier Class | 3,454 | 3,454 | |||
TOTAL TEMPORARY CASH INVESTMENTS (Cost $16,617,454) | 16,617,454 | ||||
TOTAL INVESTMENT SECURITIES — 100.2% (Cost $844,686,152) | 847,612,979 | ||||
| OTHER ASSETS AND LIABILITIES — (0.2)% | (1,443,842 | ) | |||
| TOTAL NET ASSETS — 100.0% | $ | 846,169,137 | |||
11
| MARKET SECTOR DIVERSIFICATION | ||
(as a % of net assets) | ||
| Financials | 31.3 | % |
| Consumer Discretionary | 11.1 | % |
| Industrials | 10.9 | % |
| Energy | 9.7 | % |
| Materials | 9.4 | % |
| Utilities | 5.8 | % |
| Health Care | 5.6 | % |
| Telecommunication Services | 5.1 | % |
| Real Estate | 3.1 | % |
| Information Technology | 2.8 | % |
| Consumer Staples | 2.3 | % |
| Exchange-Traded Funds | 1.1 | % |
| Cash and Equivalents* | 1.8 | % |
*Includes temporary cash investments and other assets and liabilities.
| NOTES TO SCHEDULE OF INVESTMENTS | ||
| ADR | - | American Depositary Receipt |
| CVA | - | Certificaten Van Aandelen |
| (1) | Non-income producing. |
See Notes to Financial Statements.
12
| Statement of Assets and Liabilities |
| NOVEMBER 30, 2016 | |||
| Assets | |||
| Investment securities, at value (cost of $844,686,152) | $ | 847,612,979 | |
| Foreign currency holdings, at value (cost of $857,902) | 849,076 | ||
| Receivable for investments sold | 573,432 | ||
| Receivable for capital shares sold | 50,083 | ||
| Dividends and interest receivable | 4,863,763 | ||
| 853,949,333 | |||
| Liabilities | |||
| Payable for investments purchased | 6,994,233 | ||
| Accrued management fees | 785,963 | ||
| 7,780,196 | |||
| Net Assets | $ | 846,169,137 | |
| Net Assets Consist of: | |||
| Capital (par value and paid-in surplus) | $ | 937,465,428 | |
| Undistributed net investment income | 24,685,992 | ||
| Accumulated net realized loss | (118,682,250 | ) | |
| Net unrealized appreciation | 2,699,967 | ||
| $ | 846,169,137 | ||
| Net Assets | Shares Outstanding | Net Asset Value Per Share | ||||
| Investor Class, $0.01 Par Value | $201,137,858 | 23,040,490 | $8.73 | |||
| Institutional Class, $0.01 Par Value | $586,173,092 | 67,020,281 | $8.75 | |||
| R6 Class, $0.01 Par Value | $58,858,187 | 6,719,890 | $8.76 | |||
See Notes to Financial Statements.
13
| Statement of Operations |
| YEAR ENDED NOVEMBER 30, 2016 | |||
| Investment Income (Loss) | |||
| Income: | |||
| Dividends (net of foreign taxes withheld of $2,512,264) | $ | 33,314,916 | |
| Interest | 12,127 | ||
| 33,327,043 | |||
| Expenses: | |||
| Management fees | 9,088,436 | ||
| Directors' fees and expenses | 26,380 | ||
| Other expenses | 5,841 | ||
| 9,120,657 | |||
| Net investment income (loss) | 24,206,386 | ||
| Realized and Unrealized Gain (Loss) | |||
| Net realized gain (loss) on: | |||
| Investment transactions | (84,030,283 | ) | |
| Foreign currency transactions | 58,696 | ||
| (83,971,587 | ) | ||
| Change in net unrealized appreciation (depreciation) on: | |||
| Investments | 45,379,323 | ||
| Translation of assets and liabilities in foreign currencies | (160,917 | ) | |
| 45,218,406 | |||
| Net realized and unrealized gain (loss) | (38,753,181 | ) | |
| Net Increase (Decrease) in Net Assets Resulting from Operations | $ | (14,546,795 | ) |
See Notes to Financial Statements.
14
| Statement of Changes in Net Assets |
| YEAR ENDED NOVEMBER 30, 2016 AND PERIOD ENDED NOVEMBER 30, 2015 | ||||||
| Increase (Decrease) in Net Assets | November 30, 2016 | November 30, 2015(1) | ||||
| Operations | ||||||
| Net investment income (loss) | $ | 24,206,386 | $ | 16,712,379 | ||
| Net realized gain (loss) | (83,971,587 | ) | (33,907,997 | ) | ||
| Change in net unrealized appreciation (depreciation) | 45,218,406 | (42,518,439 | ) | |||
| Net increase (decrease) in net assets resulting from operations | (14,546,795 | ) | (59,714,057 | ) | ||
| Distributions to Shareholders | ||||||
| From net investment income: | ||||||
| Investor Class | (3,816,917 | ) | — | |||
| Institutional Class | (12,359,341 | ) | — | |||
| R6 Class | (859,181 | ) | — | |||
| Decrease in net assets from distributions | (17,035,439 | ) | — | |||
| Capital Share Transactions | ||||||
| Net increase (decrease) in net assets from capital share transactions (Note 5) | 105,894,458 | 831,570,970 | ||||
| Net increase (decrease) in net assets | 74,312,224 | 771,856,913 | ||||
| Net Assets | ||||||
| Beginning of period | 771,856,913 | — | ||||
| End of period | $ | 846,169,137 | $ | 771,856,913 | ||
| Undistributed net investment income | $ | 24,685,992 | $ | 16,633,942 | ||
| (1) | March 19, 2015 (fund inception) through November 30, 2015. |
See Notes to Financial Statements.
15
| Notes to Financial Statements |
NOVEMBER 30, 2016
1. Organization
American Century World Mutual Funds, Inc. (the corporation) is registered under the Investment Company Act of 1940, as amended (the 1940 Act), as an open-end management investment company and is organized as a Maryland corporation. NT International Value Fund (the fund) is one fund in a series issued by the corporation. The fund's investment objective is to seek long-term capital growth. The fund is not permitted to invest in securities issued by companies assigned the Global Industry Classification Standard for the tobacco industry.
The fund offers the Investor Class, the Institutional Class and the R6 Class, which have different fees and expenses. The difference in the fee structures between the classes is the result of their separate arrangements for shareholder and distribution services, which may be provided indirectly through another American Century Investments mutual fund. As a result, the investment advisor is able to charge the Institutional Class and R6 Class lower unified management fees. All classes of the fund commenced sale on March 19, 2015, the fund’s inception date.
2. Significant Accounting Policies
The following is a summary of significant accounting policies consistently followed by the fund in preparation of its financial statements. The fund is an investment company and follows accounting and reporting guidance in accordance with accounting principles generally accepted in the United States of America. This may require management to make certain estimates and assumptions at the date of the financial statements. Actual results could differ from these estimates. Management evaluated the impact of events or transactions occurring through the date the financial statements were issued that would merit recognition or disclosure.
Investment Valuations — The fund determines the fair value of its investments and computes its net asset value per share at the close of regular trading (usually 4 p.m. Eastern time) on the New York Stock Exchange (NYSE) on each day the NYSE is open. The Board of Directors has adopted valuation policies and procedures to guide the investment advisor in the fund’s investment valuation process and to provide methodologies for the oversight of the fund’s pricing function.
Equity securities that are listed or traded on a domestic securities exchange are valued at the last reported sales price or at the official closing price as provided by the exchange. Equity securities traded on foreign securities exchanges are generally valued at the closing price of such securities on the exchange where primarily traded or at the close of the NYSE, if that is earlier. If no last sales price is reported, or if local convention or regulation so provides, the mean of the latest bid and asked prices may be used. Securities traded over-the-counter are valued at the mean of the latest bid and asked prices, the last sales price, or the official closing price. Equity securities initially expressed in local currencies are translated into U.S. dollars at the mean of the appropriate currency exchange rate at the close of the NYSE as provided by an independent pricing service.
Open-end management investment companies are valued at the reported net asset value per share. Repurchase agreements are valued at cost, which approximates fair value.
If the fund determines that the market price for an investment is not readily available or the valuation methods mentioned above do not reflect an investment’s fair value, such investment is valued as determined in good faith by the Board of Directors or its delegate, in accordance with policies and procedures adopted by the Board of Directors. In its determination of fair value, the fund may review several factors including, but not limited to, market information regarding the specific investment or comparable investments and correlation with other investment types, futures indices or general market indicators. Circumstances that may cause the fund to use these procedures to value an investment include, but are not limited to: an investment has been declared in default or is distressed; trading in a security has been suspended during the trading day or a security is not actively trading on its principal exchange; prices received from a regular pricing source are deemed unreliable; or there is a foreign market holiday and no trading occurred.
The fund monitors for significant events occurring after the close of an investment’s primary exchange but before the fund’s net asset value per share is determined. Significant events may include, but are not limited to: corporate announcements and transactions; governmental action and political unrest that could impact a
16
specific investment or an investment sector; or armed conflicts, natural disasters and similar events that could affect investments in a specific country or region. The fund also monitors for significant fluctuations between domestic and foreign markets, as evidenced by the U.S. market or such other indicators that the Board of Directors, or its delegate, deems appropriate. If significant fluctuations in foreign markets are identified, the fund may apply a model-derived factor to the closing price of equity securities traded on foreign securities exchanges. The factor is based on observable market data as provided by an independent pricing service.
Security Transactions — Security transactions are accounted for as of the trade date. Net realized gains and losses are determined on the identified cost basis, which is also used for federal income tax purposes.
Investment Income — Dividend income less foreign taxes withheld, if any, is recorded as of the ex-dividend date. Distributions received on securities that represent a return of capital or long-term capital gain are recorded as a reduction of cost of investments and/or as a realized gain. The fund may estimate the components of distributions received that may be considered nontaxable distributions or long-term capital gain distributions for income tax purposes. Interest income is recorded on the accrual basis and includes accretion of discounts and amortization of premiums.
Foreign Currency Translations — All assets and liabilities initially expressed in foreign currencies are translated into U.S. dollars at prevailing exchange rates at period end. The fund may enter into spot foreign currency exchange contracts to facilitate transactions denominated in a foreign currency. Purchases and sales of investment securities, dividend and interest income, spot foreign currency exchange contracts, and expenses are translated at the rates of exchange prevailing on the respective dates of such transactions. Net realized and unrealized foreign currency exchange gains or losses related to investment securities are a component of net realized gain (loss) on investment transactions and change in net unrealized appreciation (depreciation) on investments, respectively.
Repurchase Agreements — The fund may enter into repurchase agreements with institutions that American Century Investment Management, Inc. (ACIM) (the investment advisor) has determined are creditworthy pursuant to criteria adopted by the Board of Directors. The fund requires that the collateral, represented by securities, received in a repurchase transaction be transferred to the custodian in a manner sufficient to enable the fund to obtain those securities in the event of a default under the repurchase agreement. ACIM monitors, on a daily basis, the securities transferred to ensure the value, including accrued interest, of the securities under each repurchase agreement is equal to or greater than amounts owed to the fund under each repurchase agreement.
Joint Trading Account — Pursuant to an Exemptive Order issued by the Securities and Exchange Commission, the fund, along with certain other funds in the American Century Investments family of funds, may transfer uninvested cash balances into a joint trading account. These balances are invested in one or more repurchase agreements that are collateralized by U.S. Treasury or Agency obligations.
Income Tax Status — It is the fund’s policy to distribute substantially all net investment income and net realized gains to shareholders and to otherwise qualify as a regulated investment company under provisions of the Internal Revenue Code. Accordingly, no provision has been made for income taxes. The fund files U.S. federal, state, local and non-U.S. tax returns as applicable. The fund's tax returns are subject to examination by the relevant taxing authority until expiration of the applicable statute of limitations, which is generally three years from the date of filing but can be longer in certain jurisdictions. At this time, management believes there are no uncertain tax positions which, based on their technical merit, would not be sustained upon examination and for which it is reasonably possible that the total amounts of unrecognized tax benefits will significantly change in the next twelve months.
Multiple Class — All shares of the fund represent an equal pro rata interest in the net assets of the class to which such shares belong, and have identical voting, dividend, liquidation and other rights and the same terms and conditions, except for class specific expenses and exclusive rights to vote on matters affecting only individual classes. Income, non-class specific expenses, and realized and unrealized capital gains and losses of the fund are allocated to each class of shares based on their relative net assets.
Distributions to Shareholders — Distributions from net investment income and net realized gains, if any, are generally declared and paid annually. The fund may make distributions on a more frequent basis to comply with the distribution requirements of the Internal Revenue Code, in all events in a manner consistent with provisions of the 1940 Act.
17
Indemnifications — Under the corporation’s organizational documents, its officers and directors are indemnified against certain liabilities arising out of the performance of their duties to the fund. In addition, in the normal course of business, the fund enters into contracts that provide general indemnifications. The maximum exposure under these arrangements is unknown as this would involve future claims that may be made against a fund. The risk of material loss from such claims is considered by management to be remote.
3. Fees and Transactions with Related Parties
Certain officers and directors of the corporation are also officers and/or directors of American Century Companies, Inc. (ACC). The corporation’s investment advisor, ACIM, the corporation's distributor, American Century Investment Services, Inc., and the corporation’s transfer agent, American Century Services, LLC, are wholly owned, directly or indirectly, by ACC. Various funds issued by American Century Asset Allocation Portfolios, Inc. and American Century Strategic Asset Allocations, Inc. own, in aggregate, 100% of the shares of the fund. Related parties do not invest in the fund for the purpose of exercising management or control.
Management Fees — The corporation has entered into a management agreement with ACIM, under which ACIM provides the fund with investment advisory and management services in exchange for a single, unified management fee (the fee) per class. The agreement provides that all expenses of managing and operating the fund, except distribution and service fees, brokerage expenses, taxes, interest, fees and expenses of the independent directors (including legal counsel fees), and extraordinary expenses, will be paid by ACIM. The fee is computed and accrued daily based on each class’s daily net assets and paid monthly in arrears. The rate of the fee is determined by applying a fee rate calculation formula. This formula takes into account the fund’s assets as well as certain assets, if any, of other clients of the investment advisor outside the American Century Investments family of funds (such as subadvised funds and separate accounts) that have very similar investment teams and investment strategies (strategy assets). The strategy assets of the fund also include the assets of International Value Fund, one fund in a series issued by the corporation. The annual management fee schedule ranges from 1.100% to 1.300% for the Investor Class, 0.900% to 1.100% for the Institutional Class and 0.750% to 0.950% for the R6 Class. The effective annual management fee for each class for the year ended November 30, 2016 was 1.30% for the Investor Class, 1.10% for the Institutional Class and 0.95% for the R6 Class.
Directors' Fees and Expenses — The Board of Directors is responsible for overseeing the investment advisor’s management and operations of the fund. The directors receive detailed information about the fund and its investment advisor regularly throughout the year, and meet at least quarterly with management of the investment advisor to review reports about fund operations. The fund’s officers do not receive compensation from the fund.
Interfund Transactions — The fund may enter into security transactions with other American Century Investments funds and other client accounts of the investment advisor, in accordance with the 1940 Act rules and procedures adopted by the Board of Directors. The rules and procedures require, among other things, that these transactions be effected at the independent current market price of the security. During the period, the interfund purchases were $886,040 and there were no interfund sales. The interfund transactions had no effect on the Statement of Operations in net realized gain (loss) on investment transactions.
4. Investment Transactions
Purchases and sales of investment securities, excluding short-term investments, for the year ended November 30, 2016 were $756,837,221 and $641,493,554, respectively.
18
5. Capital Share Transactions
Transactions in shares of the fund were as follows:
| Year ended November 30, 2016 | Period ended November 30, 2015(1) | |||||||||
| Shares | Amount | Shares | Amount | |||||||
| Investor Class/Shares Authorized | 200,000,000 | 200,000,000 | ||||||||
| Sold | 3,132,613 | $ | 26,218,987 | 22,561,269 | $ | 225,871,525 | ||||
| Issued in reinvestment of distributions | 434,234 | 3,816,917 | — | — | ||||||
| Redeemed | (1,552,422 | ) | (14,447,913 | ) | (1,535,204 | ) | (14,572,591 | ) | ||
| 2,014,425 | 15,587,991 | 21,026,065 | 211,298,934 | |||||||
| Institutional Class/Shares Authorized | 450,000,000 | 420,000,000 | ||||||||
| Sold | 15,155,157 | 124,940,633 | 62,418,999 | 619,721,716 | ||||||
| Issued in reinvestment of distributions | 1,406,068 | 12,359,341 | — | — | ||||||
| Redeemed | (8,401,524 | ) | (73,318,382 | ) | (3,558,419 | ) | (35,213,173 | ) | ||
| 8,159,701 | 63,981,592 | 58,860,580 | 584,508,543 | |||||||
| R6 Class/Shares Authorized | 40,000,000 | 40,000,000 | ||||||||
| Sold | 3,801,362 | 32,137,412 | 4,132,581 | 40,891,450 | ||||||
| Issued in reinvestment of distributions | 97,746 | 859,181 | — | — | ||||||
| Redeemed | (776,551 | ) | (6,671,718 | ) | (535,248 | ) | (5,127,957 | ) | ||
| 3,122,557 | 26,324,875 | 3,597,333 | 35,763,493 | |||||||
| Net increase (decrease) | 13,296,683 | $ | 105,894,458 | 83,483,978 | $ | 831,570,970 | ||||
| (1) | March 19, 2015 (fund inception) through November 30, 2015. |
6. Fair Value Measurements
The fund’s investments valuation process is based on several considerations and may use multiple inputs to determine the fair value of the investments held by the fund. In conformity with accounting principles generally accepted in the United States of America, the inputs used to determine a valuation are classified into three broad levels.
| • | Level 1 valuation inputs consist of unadjusted quoted prices in an active market for identical investments. |
| • | Level 2 valuation inputs consist of direct or indirect observable market data (including quoted prices for comparable investments, evaluations of subsequent market events, interest rates, prepayment speeds, credit risk, etc.). These inputs also consist of quoted prices for identical investments initially expressed in local currencies that are adjusted through translation into U.S. dollars. |
| • | Level 3 valuation inputs consist of unobservable data (including a fund’s own assumptions). |
The level classification is based on the lowest level input that is significant to the fair valuation measurement. The valuation inputs are not necessarily an indication of the risks associated with investing in these securities or other financial instruments. There were no significant transfers between levels during the period.
The following is a summary of the level classifications as of period end. The Schedule of Investments provides additional information on the fund’s portfolio holdings.
| Level 1 | Level 2 | Level 3 | ||||||
| Assets | ||||||||
| Investment Securities | ||||||||
| Common Stocks | $ | 2,387,878 | $ | 819,368,703 | — | |||
| Exchange-Traded Funds | 9,238,944 | — | — | |||||
| Temporary Cash Investments | 3,454 | 16,614,000 | — | |||||
| $ | 11,630,276 | $ | 835,982,703 | — | ||||
19
7. Risk Factors
There are certain risks involved in investing in foreign securities. These risks include those resulting from future adverse political, social and economic developments, fluctuations in currency exchange rates, the possible imposition of exchange controls, and other foreign laws or restrictions. Investing in emerging markets may accentuate these risks.
The fund invests in common stocks of small companies. Because of this, the fund may be subject to greater risk and market fluctuations than a fund investing in larger, more established companies.
8. Federal Tax Information
On December 20, 2016, the fund declared and paid the following per-share distributions from net investment income to shareholders of record on December 19, 2016:
| Investor Class | Institutional Class | R6 Class |
| $0.2684 | $0.2864 | $0.2999 |
The tax character of distributions paid during the year ended November 30, 2016 and the period March 19, 2015 (fund inception) through November 30, 2015 were as follows:
| 2016 | 2015 | ||||
| Distributions Paid From | |||||
| Ordinary income | $ | 17,035,439 | — | ||
| Long-term capital gains | — | — | |||
The book-basis character of distributions made during the year from net investment income or net realized gains may differ from their ultimate characterization for federal income tax purposes. These differences reflect the differing character of certain income items and net realized gains and losses for financial statement and tax purposes, and may result in reclassification among certain capital accounts on the financial statements.
As of November 30, 2016, the federal tax cost of investments and the components of distributable earnings on a tax-basis were as follows:
| Federal tax cost of investments | $ | 851,466,772 | |
| Gross tax appreciation of investments | $ | 40,120,578 | |
| Gross tax depreciation of investments | (43,974,371 | ) | |
| Net tax appreciation (depreciation) of investments | (3,853,793 | ) | |
| Net tax appreciation (depreciation) on translation of assets and liabilities in foreign currencies | (206,076 | ) | |
| Net tax appreciation (depreciation) | $ | (4,059,869 | ) |
| Undistributed ordinary income | $ | 25,982,417 | |
| Accumulated short-term capital losses | $ | (75,398,882 | ) |
| Accumulated long-term capital losses | $ | (37,819,957 | ) |
The difference between book-basis and tax-basis unrealized appreciation (depreciation) is attributable primarily to the tax deferral of losses on wash sales.
Accumulated capital losses represent net capital loss carryovers that may be used to offset future realized capital gains for federal income tax purposes. The capital loss carryovers may be carried forward for an unlimited period. Future capital loss carryover utilization in any given year may be subject to Internal Revenue Code limitations.
9. Recently Issued Accounting Guidance
In October 2016, the Securities and Exchange Commission adopted new rules and forms as well as amendments to its rules and forms to modernize the reporting and disclosure of information by registered investment companies. The amendments to Regulation S-X will require standardized, enhanced disclosure about derivatives in investment company financial statements, as well as other provisions. Compliance with the amendments is effective on August 1, 2017. Management is currently evaluating the impact that adopting the amendments will have on the financial statement disclosures.
20
| Financial Highlights |
| For a Share Outstanding Throughout the Years Ended November 30 (except as noted) | |||||||||||||
| Per-Share Data | Ratios and Supplemental Data | ||||||||||||
| Income From Investment Operations: | Ratio to Average Net Assets of: | ||||||||||||
| Net Asset Value, Beginning of Period | Net Investment Income (Loss)(1) | Net Realized and Unrealized Gain (Loss) | Total From Investment Operations | Distributions From Net Investment Income | Net Asset Value, End of Period | Total Return(2) | Operating Expenses | Net Investment Income (Loss) | Portfolio Turnover Rate | Net Assets, End of Period (in thousands) | |||
| Investor Class | |||||||||||||
| 2016 | $9.24 | 0.25 | (0.56) | (0.31) | (0.20) | $8.73 | (3.42)% | 1.30% | 2.88% | 81% | $201,138 | ||
2015(3) | $10.00 | 0.20 | (0.96) | (0.76) | — | $9.24 | (7.60)% | 1.30%(4) | 2.95%(4) | 55% | $194,181 | ||
| Institutional Class | |||||||||||||
| 2016 | $9.25 | 0.26 | (0.55) | (0.29) | (0.21) | $8.75 | (3.16)% | 1.10% | 3.08% | 81% | $586,173 | ||
2015(3) | $10.00 | 0.21 | (0.96) | (0.75) | — | $9.25 | (7.50)% | 1.10%(4) | 3.15%(4) | 55% | $544,369 | ||
| R6 Class | |||||||||||||
| 2016 | $9.26 | 0.27 | (0.55) | (0.28) | (0.22) | $8.76 | (3.04)% | 0.95% | 3.23% | 81% | $58,858 | ||
2015(3) | $10.00 | 0.22 | (0.96) | (0.74) | — | $9.26 | (7.40)% | 0.95%(4) | 3.30%(4) | 55% | $33,307 | ||
| Notes to Financial Highlights |
| (1) | Computed using average shares outstanding throughout the period. |
| (2) | Total returns are calculated based on the net asset value of the last business day. Total returns for periods less than one year are not annualized. |
| (3) | March 19, 2015 (fund inception) through November 30, 2015. |
| (4) | Annualized. |
See Notes to Financial Statements.
| Report of Independent Registered Public Accounting Firm |
To the Board of Directors and Shareholders of American Century World Mutual Funds, Inc.:
We have audited the accompanying statement of assets and liabilities, including the schedule of investments, of NT International Value Fund (the “Fund”), one of the funds constituting American Century World Mutual Funds, Inc., as of November 30, 2016, and the related statement of operations for the year then ended, and the statements of changes in net assets and the financial highlights for year then ended and for the period from March 19, 2015 (commencement date) through November 30, 2015. These financial statements and financial highlights are the responsibility of the Fund’s management. Our responsibility is to express an opinion on these financial statements and financial highlights based on our audits.
We conducted our audits in accordance with the standards of the Public Company Accounting Oversight Board (United States). Those standards require that we plan and perform the audit to obtain reasonable assurance about whether the financial statements and financial highlights are free of material misstatement. The Fund is not required to have, nor were we engaged to perform, an audit of its internal control over financial reporting. Our audits included consideration of internal control over financial reporting as a basis for designing audit procedures that are appropriate in the circumstances, but not for the purpose of expressing an opinion on the effectiveness of the Fund’s internal control over financial reporting. Accordingly, we express no such opinion. An audit also includes examining, on a test basis, evidence supporting the amounts and disclosures in the financial statements, assessing the accounting principles used and significant estimates made by management, as well as evaluating the overall financial statement presentation. Our procedures included confirmation of securities owned as of November 30, 2016, by correspondence with the custodian and brokers; when replies were not received from brokers, we performed other auditing procedures. We believe that our audits provide a reasonable basis for our opinion.
In our opinion, the financial statements and financial highlights referred to above present fairly, in all material respects, the financial position of NT International Value Fund of American Century World Mutual Funds, Inc. as of November 30, 2016, the results of its operations for the year then ended, and the changes in its net assets and the financial highlights for the year then ended and for the period from March 19, 2015 (commencement date) through November 30, 2015, in conformity with accounting principles generally accepted in the United States of America.
DELOITTE & TOUCHE LLP
Kansas City, Missouri
January 17, 2017
22
| Management |
The Board of Directors
The individuals listed below serve as directors of the funds. Each director will continue to serve in this capacity until death, retirement, resignation or removal from office. The board has adopted a mandatory retirement age for directors who are not “interested persons,” as that term is defined in the Investment Company Act (independent directors). Independent directors shall retire by December 31 of the year in which they reach their 75th birthday.
Mr. Thomas is an “interested person” because he currently serves as President and Chief Executive Officer of American Century Companies, Inc. (ACC), the parent company of American Century Investment Management, Inc. (ACIM or the advisor). The other directors (more than three-fourths of the total number) are independent. They are not employees, directors or officers of, and have no financial interest in, ACC or any of its wholly owned, direct or indirect, subsidiaries, including ACIM, American Century Investment Services, Inc. (ACIS) and American Century Services, LLC (ACS), and they do not have any other affiliations, positions or relationships that would cause them to be considered “interested persons” under the Investment Company Act. The directors serve in this capacity for seven (in the case of Mr. Thomas, 15) registered investment companies in the American Century Investments family of funds.
The following table presents additional information about the directors. The mailing address for each director is 4500 Main Street, Kansas City, Missouri 64111.
| Name (Year of Birth) | Position(s) Held with Funds | Length of Time Served | Principal Occupation(s) During Past 5 Years | Number of American Century Portfolios Overseen by Director | Other Directorships Held During Past 5 Years |
| Independent Directors | |||||
| Barry Fink (1955) | Director | Since 2012 | Retired; Executive Vice President, ACC (September 2007 to February 2013); President, ACS (October 2007 to February 2013); Chief Operating Officer, ACC (September 2007 to November 2012) | 81 | None |
| Andrea C. Hall (1945) | Director | Since 1997 | Retired | 81 | None |
| Jan M. Lewis (1957) | Director | Since 2011 | Retired; President and Chief Executive Officer, Catholic Charities of Northeast Kansas (human services organization) (2006 to 2013) | 81 | None |
| James A. Olson (1942) | Director and Chairman of the Board | Since 2007 (Chairman since 2014) | Member, Plaza Belmont LLC (private equity fund manager) (1999 to present) | 81 | Saia, Inc. (2002 to 2012) and EPR Properties (2003 to 2013) |
| M. Jeannine Strandjord (1945) | Director | Since 1994 | Retired | 81 | Euronet Worldwide Inc.; MGP Ingredients, Inc.; and DST Systems Inc. (1996 to 2012) |
23
| Name (Year of Birth) | Position(s) Held with Funds | Length of Time Served | Principal Occupation(s) During Past 5 Years | Number of American Century Portfolios Overseen by Director | Other Directorships Held During Past 5 Years |
| Independent Directors | |||||
| John R. Whitten (1946) | Director | Since 2008 | Retired | 81 | Rudolph Technologies, Inc. |
| Stephen E. Yates (1948) | Director | Since 2012 | Retired | 81 | None |
| Interested Director | |||||
| Jonathan S. Thomas (1963) | Director and President | Since 2007 | President and Chief Executive Officer, ACC (March 2007 to present). Also serves as Chief Executive Officer, ACS; Executive Vice President, ACIM; Director, ACC, ACIM and other ACC subsidiaries | 126 | BioMed Valley Discoveries, Inc. |
The Statement of Additional Information has additional information about the fund's directors and is available without charge, upon request, by calling 1-800-345-2021.
24
Officers
The following table presents certain information about the executive officers of the funds. Each officer serves as an officer for each of the 15 investment companies in the American Century family of funds, unless otherwise noted. No officer is compensated for his or her service as an officer of the funds. The listed officers are interested persons of the funds and are appointed or re-appointed on an annual basis. The mailing address for each officer listed below is 4500 Main Street, Kansas City, Missouri 64111.
| Name (Year of Birth) | Offices with the Funds | Principal Occupation(s) During the Past Five Years |
| Jonathan S. Thomas (1963) | Director and President since 2007 | President and Chief Executive Officer, ACC (March 2007 to present). Also serves as Chief Executive Officer, ACS; Executive Vice President, ACIM; Director, ACC, ACIM and other ACC subsidiaries |
| Amy D. Shelton (1964) | Chief Compliance Officer and Vice President since 2014 | Chief Compliance Officer, American Century funds, (March 2014 to present); Chief Compliance Officer, ACIM (February 2014 to present); Chief Compliance Officer, ACIS (October 2009 to present); Vice President, Client Interactions and Marketing, ACIS (February 2013 to January 2014); Director, Client Interactions and Marketing, ACIS (June 2007 to January 2013). Also serves as Vice President, ACIS |
| Charles A. Etherington (1957) | General Counsel since 2007 and Senior Vice President since 2006 | Attorney, ACC (February 1994 to present); Vice President, ACC (November 2005 to present); General Counsel, ACC (March 2007 to present). Also serves as General Counsel, ACIM, ACS, ACIS and other ACC subsidiaries; and Senior Vice President, ACIM and ACS |
| C. Jean Wade (1964) | Vice President,Treasurer and Chief Financial Officer since 2012 | Vice President, ACS (February 2000 to present) |
| Robert J. Leach (1966) | Vice President since 2006 and Assistant Treasurer since 2012 | Vice President, ACS (February 2000 to present) |
| David H. Reinmiller (1963) | Vice President since 2000 | Attorney, ACC (January 1994 to present); Associate General Counsel, ACC (January 2001 to present). Also serves as Vice President, ACIM and ACS |
| Ward D. Stauffer (1960) | Secretary since 2005 | Attorney, ACC (June 2003 to present) |
25
| Approval of Management Agreement |
At a meeting held on June 29, 2016, the Fund’s Board of Directors (the "Board") unanimously approved the renewal of the management agreement pursuant to which American Century Investment Management, Inc. (the “Advisor”) acts as the investment advisor for the Fund. Under Section 15(c) of the Investment Company Act, contracts for investment advisory services are required to be reviewed, evaluated, and approved by a majority of a fund’s directors (the “Directors”), including a majority of the independent Directors, each year.
Prior to its consideration of the renewal of the management agreement, the Directors requested and reviewed extensive data and information compiled by the Advisor and certain independent providers of evaluation data concerning the Fund and the services provided to the Fund by the Advisor. This review was in addition to the oversight and evaluation undertaken by the Board and its committees on a continual basis and the information received was supplemental to the extensive information that the Board and its committees receive and consider throughout the year.
In connection with its consideration of the renewal of the management agreement, the Board’s review and evaluation of the services provided by the Advisor included, but was not limited to, the following:
| • | the nature, extent, and quality of investment management, shareholder services, and other services provided and to be provided to the Fund; |
| • | the wide range of other programs and services provided and to be provided to the Fund and its shareholders on a routine and non-routine basis; |
| • | the investment performance of the Fund, including data comparing the Fund's performance to appropriate benchmarks and/or a peer group of other mutual funds with similar investment objectives and strategies; |
| • | the cost of owning the Fund compared to the cost of owning similar funds; |
| • | the compliance policies, procedures, and regulatory experience of the Advisor and the Fund's service providers; |
| • | financial data showing the cost of services provided to the Fund, the profitability of the Fund to the Advisor, and the overall profitability of the Advisor; |
| • | possible economies of scale associated with the Advisor’s management of the Fund and other accounts under its management; |
| • | data comparing services provided and charges to the Advisor's other investment management clients; |
| • | acquired fund fees and expenses; |
| • | payments by the Fund and the Advisor to financial intermediaries and the nature of services provided; and |
| • | any collateral benefits derived by the Advisor from the management of the Fund. |
In keeping with their practice, the Directors held two in-person meetings and one telephonic meeting to review and discuss the information provided. The independent Directors also had the benefit of the advice of their independent counsel throughout the process.
Factors Considered
The Directors considered all of the information provided by the Advisor, the independent data providers, and independent counsel in connection with the approval. They determined that the information was sufficient for them to evaluate the management agreement for the Fund. In connection with their review, the Directors did not identify any single factor as being all-important or controlling, and each Director may have attributed different levels of importance to different factors.
26
In deciding to renew the management agreement, the Board based its decision on a number of factors, including the following:
Nature, Extent and Quality of Services - Generally. Under the management agreement, the Advisor is responsible for providing or arranging for all services necessary for the operation of the Fund. The Board noted that under the management agreement, the Advisor provides or arranges at its own expense a wide variety of services including:
| • | constructing and designing the Fund |
| • | portfolio research and security selection |
| • | initial capitalization/funding |
| • | securities trading |
| • | Fund administration |
| • | custody of Fund assets |
| • | daily valuation of the Fund’s portfolio |
| • | shareholder servicing and transfer agency, including shareholder confirmations, recordkeeping, and communications |
| • | legal services (except the independent Directors’ counsel) |
| • | regulatory and portfolio compliance |
| • | financial reporting |
| • | marketing and distribution (except amounts paid by the Fund under Rule 12b-1 plans) |
The Board noted that many of these services have expanded over time in terms of both quantity and complexity in response to shareholder demands, competition in the industry, changing distribution channels, and the changing regulatory environment. The Board noted specifically the resources the Advisor has committed to enhancing cybersecurity protections for the benefit of shareholders.
Investment Management Services. The nature of the investment management services provided to the Fund is quite complex and allows Fund shareholders access to professional money management, instant diversification of their investments within an asset class, the opportunity to easily diversify among asset classes by investing in or exchanging among various American Century Investments funds, and liquidity. In evaluating investment performance, the Board expects the Advisor to manage the Fund in accordance with its investment objectives and approved strategies. Further, the Directors recognize that the Advisor has an obligation to monitor trading activities, and in particular to seek the best execution of fund trades, and to evaluate the use of and payment for research. In providing these services, the Advisor utilizes teams of investment professionals (portfolio managers, analysts, research assistants, and securities traders) who require extensive information technology, research, training, compliance, and other systems to conduct their business. The Board, directly and through its Fund Performance Review Committee, provides oversight of the investment performance process. It regularly reviews investment performance information for the Fund, together with comparative information for appropriate benchmarks and/or peer groups of similarly-managed funds, over different time horizons. The Directors also review detailed performance information provided by the Advisor during the management agreement approval process. If performance concerns are identified, the Fund receives special reviews until performance improves, during which the Board receives a report from the Advisor regarding the reasons for such results (e.g., market conditions, security selection) and any efforts being undertaken to improve performance. The Fund had less than one year of performance history at the time of the Board's review. The Board found the investment management services provided by the Advisor to the Fund to be satisfactory and consistent with the management agreement.
Shareholder and Other Services. Under the management agreement, the Advisor provides the Fund with a comprehensive package of transfer agency, shareholder, and other services. The Board, directly and through various committees of the Board, regularly reviews reports and evaluations of such services at its regular meetings. These reports include, but are not limited to,
27
information regarding the operational efficiency and accuracy of the shareholder and transfer agency services provided, staffing levels, shareholder satisfaction (as measured by external as well as internal sources), technology support, new products and services offered to Fund shareholders, securities trading activities, portfolio valuation services, auditing services, and legal and operational compliance activities. The Board particularly noted the Advisor’s continual efforts to maintain effective business continuity plans and to address cybersecurity threats. Certain aspects of shareholder and transfer agency service level efficiency and the quality of securities trading activities are measured by independent third party providers and are presented in comparison to other fund groups not managed by the Advisor. The Board found the services provided by the Advisor to the Fund under the management agreement to be competitive and of high quality.
Costs of Services and Profitability. The Advisor provides detailed information concerning its cost of providing various services to the Fund, its profitability in managing the Fund (pre- and post-distribution), its overall profitability, and its financial condition. The Directors have reviewed with the Advisor the methodology used to prepare this financial information. This information is considered in evaluating the Advisor’s financial condition, its ability to continue to provide services under the management agreement, and the reasonableness of the current management fee. The Board concluded that the Advisor’s profits were reasonable in light of the services provided to the Fund.
Ethics. The Board generally considers the Advisor’s commitment to providing quality services to shareholders and to conducting its business ethically. They noted that the Advisor’s practices generally meet or exceed industry best practices.
Economies of Scale. The Board also reviewed information provided by the Advisor regarding the possible existence of economies of scale in connection with the management of the Fund. The Board concluded that economies of scale are difficult to measure and predict with precision, especially on a fund-by-fund basis. The Board concluded that the Advisor is appropriately sharing economies of scale through its competitive fee structure, offering competitive fees from fund inception, and through reinvestment in its business to provide shareholders additional content and services. The Board also noted that economies of scale are shared with the Fund and its shareholders through management fee breakpoints that serve to reduce the effective management fee as the assets of the Fund grow.
Comparison to Other Funds’ Fees. The management agreement provides that the Fund pays the Advisor a single, all-inclusive (or unified) management fee for providing all services necessary for the management and operation of the Fund, other than brokerage expenses, expenses attributable to short sales, taxes, interest, extraordinary expenses, and the fees and expenses of the Fund’s independent Directors (including their independent legal counsel) and expenses incurred in connection with the provision of shareholder services and distribution services under a plan adopted pursuant to Rule 12b-1 under the 1940 Act. Under the unified fee structure, the Advisor is responsible for providing all investment advisory, custody, audit, administrative, compliance, recordkeeping, marketing and shareholder services, or arranging and supervising third parties to provide such services. By contrast, most other funds are charged a variety of fees, including an investment advisory fee, a transfer agency fee, an administrative fee, distribution charges, and other expenses. Other than their investment advisory fees and any applicable Rule 12b-1 distribution fees, all other components of the total fees charged by these other funds may be increased without shareholder approval. The Board believes the unified fee structure is a benefit to Fund shareholders because it clearly discloses to shareholders the cost of owning Fund shares, and, since the unified fee cannot be increased without a vote of Fund shareholders, it shifts to the Advisor the risk of increased costs of operating the Fund and provides a direct incentive to minimize administrative inefficiencies. Part of the Board’s analysis of fee levels involves reviewing certain evaluative data compiled by an independent provider comparing the Fund’s unified fee to the total expense ratios of its peers. The unified fee charged to shareholders of the Fund was below the median of the total expense ratios of the Fund’s peer expense universe and was within the range of its peer expense group. The Board concluded that the management fee paid by the
28
Fund to the Advisor under the management agreement is reasonable in light of the services provided to the Fund.
Comparison to Fees and Services Provided to Other Clients of the Advisor. The Directors also requested and received information from the Advisor concerning the nature of the services, fees, costs, and profitability of its advisory services to advisory clients other than the Fund. They observed that these varying types of client accounts require different services and involve different regulatory and entrepreneurial risks than the management of the Fund. The Board analyzed this information and concluded that the fees charged and services provided to the Fund were reasonable by comparison.
Payments to Intermediaries. The Directors also requested and received a description of payments made to intermediaries by the Fund and the Advisor. These payments include various payments made by the Fund or the Advisor to different types of intermediaries and recordkeepers for distribution and service activities provided for the Fund. The Board received confirmation from the Advisor that all such payments by the Fund intended for distribution were made pursuant to the Fund's 12b-1 Plan. The Board reviewed such information and found the payments to be reasonable in scope and purpose.
Collateral or “Fall-Out” Benefits Derived by the Advisor. The Board considered the existence of collateral benefits the Advisor may receive as a result of its relationship with the Fund. They concluded that the Advisor’s primary business is managing mutual funds and it generally does not use fund or shareholder information to generate profits in other lines of business, and therefore does not derive any significant collateral benefits from them. The Board noted that additional assets from other clients may offer the Advisor some benefit from increased leverage with service providers and counterparties. Additionally, the Advisor receives proprietary research from broker-dealers that execute fund portfolio transactions, which the Board concluded is likely to benefit other clients of the Advisor, as well as Fund shareholders. The Board also determined that the Advisor is able to provide investment management services to certain clients other than the Fund, at least in part, due to its existing infrastructure built to serve the fund complex. The Board concluded that appropriate allocation methodologies had been employed to assign resources and the cost of those resources to these other clients and, where expressly provided, these other client assets may be included with the assets of the Fund to determine breakpoints in the management fee schedule.
Existing Relationship. The Board also considered whether there was any reason for not continuing the existing arrangement with the Advisor. In this regard, the Board was mindful of the potential disruptions of the Fund’s operations and various risks, uncertainties, and other effects that could occur as a result of a decision not to continue such relationship. In particular, the Board recognized that most shareholders have invested in the Fund on the strength of the Advisor’s industry standing and reputation and in the expectation that the Advisor will have a continuing role in providing advisory services to the Fund.
Conclusion of the Directors. As a result of this process, the Board, including all of the independent Directors, taking into account all of the factors discussed above and the information provided by the Advisor and others in connection with its review and throughout the year, determined that the management fee is fair and reasonable in light of the services provided and that the investment management agreement between the Fund and the Advisor should be renewed.
29
| Additional Information |
Retirement Account Information
As required by law, distributions you receive from certain IRAs are subject to federal income tax withholding, unless you elect not to have withholding apply. Tax will be withheld on the total amount withdrawn even though you may be receiving amounts that are not subject to withholding, such as nondeductible contributions. In such case, excess amounts of withholding could occur. You may adjust your withholding election so that a greater or lesser amount will be withheld.
If you don’t want us to withhold on this amount, you must notify us to not withhold the federal income tax. You may notify us in writing or in certain situations by telephone or through other electronic means. For systematic withdrawals, your withholding election will remain in effect until revoked or changed by filing a new election. You have the right to revoke your election at any time.
Remember, even if you elect not to have income tax withheld, you are liable for paying income tax on the taxable portion of your withdrawal. If you elect not to have income tax withheld or you don’t have enough income tax withheld, you may be responsible for payment of estimated tax. You may incur penalties under the estimated tax rules if your withholding and estimated tax payments are not sufficient. You can reduce or defer the income tax on a distribution by directly or indirectly rolling such distribution over to another IRA or eligible plan. You should consult your tax advisor for additional information.
State tax will be withheld if, at the time of your distribution, your address is within one of the mandatory withholding states and you have federal income tax withheld (or as otherwise required by state law). State taxes will be withheld from your distribution in accordance with the respective state rules.
Distributions you receive from 403(b), 457 and qualified plans are subject to special tax and withholding rules. Your plan administrator or plan sponsor is required to provide you with a special tax notice explaining those rules at the time you request a distribution. If applicable, federal and/or state taxes may be withheld from your distribution amount.
Proxy Voting Policies
A description of the policies that the fund's investment advisor uses in exercising the voting rights associated with the securities purchased and/or held by the fund is available without charge, upon request, by calling 1-800-345-2021. It is also available on the "About Us" page of American Century Investments’ website at americancentury.com and on the Securities and Exchange Commission’s website at sec.gov. Information regarding how the investment advisor voted proxies relating to portfolio securities during the most recent 12-month period ended June 30 is available on the "About Us" page at americancentury.com. It is also available at sec.gov.
Quarterly Portfolio Disclosure
The fund files its complete schedule of portfolio holdings with the Securities and Exchange Commission (SEC) for the first and third quarters of each fiscal year on Form N-Q. The fund’s Forms N-Q are available on the SEC’s website at sec.gov, and may be reviewed and copied at the SEC’s Public Reference Room in Washington, DC. Information on the operation of the Public Reference Room may be obtained by calling 1-800-SEC-0330. The fund also makes its complete schedule of portfolio holdings for the most recent quarter of its fiscal year available on its website at americancentury.com and, upon request, by calling 1-800-345-2021.
30
Other Tax Information
The following information is provided pursuant to provisions of the Internal Revenue Code.
The fund hereby designates up to the maximum amount allowable as qualified dividend income for the fiscal year ended November 30, 2016.
For the fiscal year ended November 30, 2016, the fund intends to pass through to shareholders foreign source income of $35,748,975 and foreign taxes paid of $2,481,589, or up to the maximum amount allowable, as a foreign tax credit. Foreign source income and foreign tax expense per outstanding share on November 30, 2016 are $0.3694 and $0.0256, respectively.
31
| Notes |
32
| ||
| Contact Us | americancentury.com | |
| Automated Information Line | 1-800-345-8765 | |
| Investor Services Representative | 1-800-345-2021 or 816-531-5575 | |
| Investors Using Advisors | 1-800-378-9878 | |
| Business, Not-For-Profit, Employer-Sponsored Retirement Plans | 1-800-345-3533 | |
| Banks and Trust Companies, Broker-Dealers, Financial Professionals, Insurance Companies | 1-800-345-6488 | |
| Telecommunications Relay Service for the Deaf | 711 | |
| American Century World Mutual Funds, Inc. | ||
Investment Advisor: American Century Investment Management, Inc. Kansas City, Missouri | ||
| This report and the statements it contains are submitted for the general information of our shareholders. The report is not authorized for distribution to prospective investors unless preceded or accompanied by an effective prospectus. | ||
| ©2017 American Century Proprietary Holdings, Inc. All rights reserved. CL-ANN-91026 1701 | ||
ITEM 2. CODE OF ETHICS.
| (a) | The registrant has adopted a Code of Ethics for Senior Financial Officers that applies to the registrant’s principal executive officer, principal financial officer, principal accounting officer, and persons performing similar functions. |
| (b) | No response required. |
| (c) | None. |
| (d) | None. |
| (e) | Not applicable. |
| (f) | The registrant’s Code of Ethics for Senior Financial Officers was filed as Exhibit 12 (a)(1) to American Century Asset Allocation Portfolios, Inc.’s Annual Certified Shareholder Report on Form N-CSR, File No. 811-21591, on September 29, 2005, and is incorporated herein by reference. |
ITEM 3. AUDIT COMMITTEE FINANCIAL EXPERT.
| (a)(1) | The registrant’s board has determined that the registrant has at least one audit committee financial expert serving on its audit committee. |
| (a)(2) | John R. Whitten is the registrant’s designated audit committee financial expert. He is “independent” as defined in Item 3 of Form N-CSR. |
| (a)(3) | Not applicable. |
| (b) | No response required. |
| (c) | No response required. |
| (d) | No response required. |
ITEM 4. PRINCIPAL ACCOUNTANT FEES AND SERVICES.
| (a) | Audit Fees. |
The aggregate fees billed for each of the last two fiscal years for professional services rendered by the principal accountant for the audit of the registrant’s annual financial statements or services that are normally provided by the accountant in connection with statutory and regulatory filings or engagements for those fiscal years were as follows:
FY 2015: $245,006
FY 2016: $308,958
| (b) | Audit-Related Fees. |
The aggregate fees billed in each of the last two fiscal years for assurance and related services by the principal accountant that are reasonably related to the performance of the audit of the registrant’s financial statements and are not reported under paragraph (a) of this Item were as follows:
For services rendered to the registrant:
FY 2015: $0
FY 2016: $0
Fees required to be approved pursuant to paragraph (c)(7)(ii) of Rule 2-01 of Regulation S-X (relating to certain engagements for non-audit services with the registrant’s investment adviser and its affiliates):
FY 2015: $0
FY 2016: $0
| (c) | Tax Fees. |
The aggregate fees billed in each of the last two fiscal years for professional services rendered by the principal accountant for tax compliance, tax advice, and tax planning were as follows:
For services rendered to the registrant:
FY 2015: $0
FY 2016: $0
Fees required to be approved pursuant to paragraph (c)(7)(ii) of Rule 2-01 of Regulation S-X (relating to certain engagements for non-audit services with the registrant’s investment adviser and its affiliates):
FY 2015: $0
FY 2016: $0
| (d) | All Other Fees. |
The aggregate fees billed in each of the last two fiscal years for products and services provided by the principal accountant, other than the services reported in paragraphs (a) through (c) of this Item were as follows:
For services rendered to the registrant:
FY 2015: $0
FY 2016: $0
Fees required to be approved pursuant to paragraph (c)(7)(ii) of Rule 2-01 of Regulation S-X (relating to certain engagements for non-audit services with the registrant’s investment adviser and its affiliates):
FY 2015: $0
FY 2016: $0
| (e)(1) | In accordance with paragraph (c)(7)(i)(A) of Rule 2-01 of Regulation S-X, before the accountant is engaged by the registrant to render audit or non-audit services, the engagement is approved by the registrant’s audit committee. Pursuant to paragraph (c)(7)(ii) of Rule 2-01 of Regulation S-X, the registrant’s audit committee also pre-approves its accountant’s engagements for non-audit services with the registrant’s investment adviser, its parent company, and any entity controlled by, or under common control with the investment adviser that provides ongoing services to the registrant, if the engagement relates directly to the operations and financial reporting of the registrant. |
| (e)(2) | All services described in each of paragraphs (b) through (d) of this Item were pre-approved before the engagement by the registrant’s audit committee pursuant to paragraph (c)(7)(i)(A) of Rule 2-01 of Regulation S-X. Consequently, none of such services were required to be approved by the audit committee pursuant to paragraph (c)(7)(i)(C). |
| (f) | The percentage of hours expended on the principal accountant’s engagement to audit the registrant’s financial statements for the most recent fiscal year that were attributed to work performed by persons other than the principal accountant’s full-time, permanent employees was less than 50%. |
| (g) | The aggregate non-audit fees billed by the registrant’s accountant for services rendered to the registrant, and rendered to the registrant’s investment adviser (not including any sub-adviser whose role is primarily portfolio management and is subcontracted with or overseen by another investment adviser), and any entity controlling, controlled by, or under common control with the adviser that provides ongoing services to the registrant for each of the last two fiscal years of the registrant were as follows: |
FY 2015: $86,000
FY 2016: $829,350
| (h) | The registrant’s investment adviser and accountant have notified the registrant’s audit committee of all non-audit services that were rendered by the registrant’s accountant to the registrant’s investment adviser, its parent company, and any entity controlled by, or under common control with the investment adviser that provides services to the registrant, which services were not required to be pre-approved pursuant to paragraph (c)(7)(ii) of Rule 2-01 of Regulation S-X. The notification provided to the registrant’s audit committee included sufficient details regarding such services to allow the registrant’s audit committee to consider the continuing independence of its principal accountant. |
ITEM 5. AUDIT COMMITTEE OF LISTED REGISTRANTS.
Not applicable.
ITEM 6. INVESTMENTS.
| (a) | The schedule of investments is included as part of the report to stockholders filed under Item 1 of this Form. |
| (b) | Not applicable. |
ITEM 7. DISCLOSURE OF PROXY VOTING POLICIES AND PROCEDURES FOR CLOSED-END MANAGEMENT INVESTMENT COMPANIES.
Not applicable.
ITEM 8. PORTFOLIO MANAGERS OF CLOSED-END MANAGEMENT INVESTMENT COMPANIES.
Not applicable.
ITEM 9. PURCHASES OF EQUITY SECURITIES BY CLOSED-END MANAGEMENT INVESTMENT COMPANY AND AFFILIATED PURCHASERS.
Not applicable.
ITEM 10. SUBMISSION OF MATTERS TO A VOTE OF SECURITY HOLDERS.
During the reporting period, there were no material changes to the procedures by which shareholders may recommend nominees to the registrant’s board.
ITEM 11. CONTROLS AND PROCEDURES.
| (a) | The registrant's principal executive officer and principal financial officer have concluded that the registrant's disclosure controls and procedures (as defined in Rule 30a-3(c) under the Investment Company Act of 1940) are effective based on their evaluation of these controls and procedures as of a date within 90 days of the filing date of this report. |
| (b) | There were no changes in the registrant's internal control over financial reporting (as defined in Rule 30a-3(d) under the Investment Company Act of 1940) that occurred during the registrant's second fiscal quarter of the period covered by this report that have materially affected, or are reasonably likely to materially affect, the registrant's internal control over financial reporting. |
ITEM 12. EXHIBITS.
| (a)(1) | Registrant’s Code of Ethics for Senior Financial Officers, which is the subject of the disclosure required by Item 2 of Form N-CSR, was filed as Exhibit 12(a)(1) to American Century Asset Allocation Portfolios, Inc.’s Certified Shareholder Report on Form N-CSR, File No. 811-21591, on September 29, 2005. |
| (a)(2) | Separate certifications by the registrant’s principal executive officer and principal financial officer, pursuant to Section 302 of the Sarbanes-Oxley Act of 2002 and Rule 30a-2(a) under the Investment Company Act of 1940, are filed and attached hereto as EX-99.CERT. |
| (a)(3) | Not applicable. |
| (b) | A certification by the registrant’s chief executive officer and chief financial officer, pursuant to Section 906 of the Sarbanes-Oxley Act of 2002, is furnished and attached hereto as EX-99.906CERT. |
SIGNATURES
Pursuant to the requirements of the Securities Exchange Act of 1934 and the Investment Company Act of 1940, the registrant has duly caused this report to be signed on its behalf by the undersigned, thereunto duly authorized.
| Registrant: | American Century World Mutual Funds, Inc. | |||
| By: | /s/ Jonathan S. Thomas | |||
| Name: | Jonathan S. Thomas | |||
| Title: | President | |||
| Date: | January 26, 2017 | |||
Pursuant to the requirements of the Securities Exchange Act of 1934 and the Investment Company Act of 1940, this report has been signed below by the following persons on behalf of the registrant and in the capacities and on the dates indicated.
| By: | /s/ Jonathan S. Thomas | ||
| Name: Jonathan S. Thomas | |||
| Title: President | |||
| (principal executive officer) | |||
| Date: | January 26, 2017 | ||
| By: | /s/ C. Jean Wade | ||
| Name: C. Jean Wade | |||
| Title: Vice President, Treasurer, and | |||
| Chief Financial Officer | |||
| (principal financial officer) | |||
| Date: | January 26, 2017 | ||