UNITED STATES
SECURITIES AND EXCHANGE COMMISSION
Washington, D.C. 20549
FORM N-CSR
CERTIFIED SHAREHOLDER REPORT OF REGISTERED
MANAGEMENT INVESTMENT COMPANIES
| Investment Company Act file number | 811-06247 | |||||
| AMERICAN CENTURY WORLD MUTUAL FUNDS, INC. | ||||||
| (Exact name of registrant as specified in charter) | ||||||
| 4500 MAIN STREET, KANSAS CITY, MISSOURI | 64111 | |||||
| (Address of principal executive offices) | (Zip Code) | |||||
CHARLES A. ETHERINGTON 4500 MAIN STREET, KANSAS CITY, MISSOURI 64111 | ||||||
| (Name and address of agent for service) | ||||||
| Registrant’s telephone number, including area code: | 816-531-5575 | |||||
| Date of fiscal year end: | 11-30 | |||||
| Date of reporting period: | 11-30-2018 | |||||
ITEM 1. REPORTS TO STOCKHOLDERS.

| Annual Report | |
| November 30, 2018 | |
| Emerging Markets Fund | |
| Investor Class (TWMIX) | |
| I Class (AMKIX) | |
| Y Class (AEYMX) | |
| A Class (AEMMX) | |
| C Class (ACECX) | |
| R Class (AEMRX) | |
| R5 Class (AEGMX) | |
| R6 Class (AEDMX) | |
Beginning on January 1, 2021, as permitted by regulations adopted by the Securities and Exchange Commission, paper copies of the fund’s shareholder reports like this one will no longer be sent by mail, unless you specifically request paper copies of the reports from the fund or from your financial intermediary, such as a broker-dealer or bank. Instead, the reports will be made available on a website, and you will be notified by mail each time a report is posted and provided with a website link to access the report.
If you already elected to receive shareholder reports electronically, you will not be affected by this change and you need not take any action. You may elect to receive shareholder reports and other communications from the fund or your financial intermediary electronically by calling or sending an email request to your appropriate contacts as listed on the back cover of this report.
You may elect to receive all future reports in paper free of charge. You can inform the fund or your financial intermediary that you wish to continue receiving paper copies of your shareholder reports by calling or sending an email request to your appropriate contacts as listed on the back cover of this report. Your election to receive reports in paper will apply to all funds held with the fund complex/your financial intermediary.
| Table of Contents |
| President’s Letter | 2 | |
| Performance | 3 | |
| Portfolio Commentary | ||
| Fund Characteristics | ||
| Shareholder Fee Example | ||
| Schedule of Investments | ||
| Statement of Assets and Liabilities | ||
| Statement of Operations | ||
| Statement of Changes in Net Assets | ||
| Notes to Financial Statements | ||
| Financial Highlights | ||
| Report of Independent Registered Public Accounting Firm | ||
| Management | ||
| Approval of Management Agreement | ||
| Additional Information | ||
Any opinions expressed in this report reflect those of the author as of the date of the report, and do not necessarily represent the opinions of American Century Investments® or any other person in the American Century Investments organization. Any such opinions are subject to change at any time based upon market or other conditions and American Century Investments disclaims any responsibility to update such opinions. These opinions may not be relied upon as investment advice and, because investment decisions made by American Century Investments funds are based on numerous factors, may not be relied upon as an indication of trading intent on behalf of any American Century Investments fund. Security examples are used for representational purposes only and are not intended as recommendations to purchase or sell securities. Performance information for comparative indices and securities is provided to American Century Investments by third party vendors. To the best of American Century Investments’ knowledge, such information is accurate at the time of printing.
| President’s Letter |
 Jonathan Thomas
Dear Investor:
Thank you for reviewing this annual report for the 12 months ended November 30, 2018. Annual reports help convey important information about fund returns, including market factors that affected performance during the reporting period. For additional investment and market insights, please visit our website, americancentury.com.
Global Growth Divergence Drives Disparity in Stock Returns
The synchronization of global economic growth, which helped deliver robust gains for global stocks in 2017, unraveled as the 12-month period unfolded. The U.S. economy continued to expand at a healthy pace, but other regions experienced notable slowdowns. Similarly, stocks advanced in the U.S. but generally declined elsewhere.
In Europe, the threat of global tariffs from the U.S. dampened business sentiment and corporate earnings growth. In addition, uncertainties surrounding Brexit negotiations, Italy’s fiscal woes, and civil unrest in France weighed on economic and earnings growth outlooks and stock performance. Meanwhile, Japan’s economy contracted late in the period, largely due to the effects of several natural disasters, which curtailed personal and business spending. Global trade tensions also pressured Japan’s growth outlook.
After starting strong, emerging markets stocks quickly reversed course. The key culprits included rising U.S. interest rates, U.S.-China tariffs, and global trade-policy uncertainty. In addition, a strong U.S. dollar, falling oil prices, and several country-specific events weighed on the asset class. Late in the period, prospects for a tariff truce between the U.S. and China, along with dovish comments from the Federal Reserve, sparked a November rally among emerging markets stocks.
Overall, U.S. stocks, as measured by the S&P 500 Index, returned 6.27% for the 12 months. Non-U.S. developed markets stocks, as measured by the MSCI EAFE Index, declined 7.94%. Emerging markets stocks, as measured by the MSCI Emerging Markets Index, fell 9.09%.
Looking ahead, investors face a backdrop of uneven global growth, heightened market volatility, and lingering geopolitical uncertainties. But it’s often these challenging markets that produce the most compelling investment opportunities. We believe this scenario underscores the importance of using professionally managed portfolios in pursuit of investment goals. We appreciate your continued trust and confidence in us.
Sincerely,

Jonathan Thomas
President and Chief Executive Officer
American Century Investments
2
| Performance |
| Total Returns as of November 30, 2018 | ||||||
Average Annual Returns | ||||||
Ticker Symbol | 1 year | 5 years | 10 years | Since Inception | Inception Date | |
| Investor Class | TWMIX | -14.57% | 3.12% | 9.59% | — | 9/30/97 |
| MCSI Emerging Markets Index | — | -9.09% | 1.90% | 9.12% | — | — |
| I Class | AMKIX | -14.35% | 3.34% | 9.83% | — | 1/28/99 |
| Y Class | AEYMX | -14.23% | — | — | 4.87% | 4/10/17 |
| A Class | AEMMX | 5/12/99 | ||||
| No sales charge | -14.80% | 2.87% | 9.35% | — | ||
| With sales charge | -19.73% | 1.66% | 8.70% | — | ||
| C Class | ACECX | -15.39% | 2.12% | 8.53% | — | 12/18/01 |
| R Class | AEMRX | -14.97% | 2.61% | 9.07% | — | 9/28/07 |
| R5 Class | AEGMX | -14.33% | — | — | 4.76% | 4/10/17 |
| R6 Class | AEDMX | -14.28% | 3.49% | — | 4.65% | 7/26/13 |
Average annual returns since inception are presented when ten years of performance history is not available. Fund returns would have been lower if a portion of the fees had not been waived.
Sales charges include initial sales charges and contingent deferred sales charges (CDSCs), as applicable. A Class shares have a 5.75% maximum initial sales charge and may be subject to a maximum CDSC of 1.00%. C Class shares redeemed within 12 months of purchase are subject to a maximum CDSC of 1.00%. The SEC requires that mutual funds provide performance information net of maximum sales charges in all cases where charges could be applied.
Data presented reflect past performance. Past performance is no guarantee of future results. Current performance may be higher or lower than the performance shown. Total returns for periods less than one year are not annualized. Investment return and principal value will fluctuate, and redemption value may be more or less than original cost. Data assumes reinvestment of dividends and capital gains, and none of the charts reflect the deduction of taxes that a shareholder would pay on fund distributions or the redemption of fund shares. To obtain performance data current to the most recent month end, please call 1-800-345-2021 or visit americancentury.com. For additional information about the fund, please consult the prospectus.
3
| Growth of $10,000 Over 10 Years |
| $10,000 investment made November 30, 2008 |
| Performance for other share classes will vary due to differences in fee structure. |

| Value on November 30, 2018 | |
| Investor Class — $25,005 | |
| MSCI Emerging Markets Index — $23,953 | |
Ending value of Investor Class would have been lower if a portion of the fees had not been waived.
Total Annual Fund Operating Expenses | |||||||
| Investor Class | I Class | Y Class | A Class | C Class | R Class | R5 Class | R6 Class |
| 1.26% | 1.06% | 0.91% | 1.51% | 2.26% | 1.76% | 1.06% | 0.91% |
The total annual fund operating expenses shown is as stated in the fund’s prospectus current as of the date of this report. The prospectus may vary from the expense ratio shown elsewhere in this report because it is based on a different time period, includes acquired fund fees and expenses, and, if applicable, does not include fee waivers or expense reimbursements.
Data presented reflect past performance. Past performance is no guarantee of future results. Current performance may be higher or lower than the performance shown. Total returns for periods less than one year are not annualized. Investment return and principal value will fluctuate, and redemption value may be more or less than original cost. Data assumes reinvestment of dividends and capital gains, and none of the charts reflect the deduction of taxes that a shareholder would pay on fund distributions or the redemption of fund shares. To obtain performance data current to the most recent month end, please call 1-800-345-2021 or visit americancentury.com. For additional information about the fund, please consult the prospectus.
4
| Portfolio Commentary |
Portfolio Managers: Patricia Ribeiro and Sherwin Soo
Performance Summary
Emerging Markets returned -14.57%* for the 12 months ended November 30, 2018. The portfolio’s benchmark, the MSCI Emerging Markets Index, returned -9.09% for the same period.
The fund underperformed its benchmark during the period, primarily due to negative stock selection in the information technology sector, as well as stock selection and an underweight in financials for most of the year. Conversely, holdings in the consumer discretionary sector had a positive relative impact. Regionally, stock selection in China and Taiwan weighed on relative performance, while stock selection and an underweight in South Africa aided results.
Information Technology Holdings Detracted
Holdings in the information technology sector were the primary drivers of the fund’s underperformance over the 12-month period, where notable detractors included flexible printed circuit manufacturer Career Technology MFG, optical components manufacturer Sunny Optical Technology Group, and communications equipment manufacturer Yangtze Optical Fibre and Cable Joint Stock.
Asian equities suffered a brutal sell-off earlier this year amid negative headlines on deteriorating U.S.-China trade negotiations, a spike in global yields, and a strong U.S. dollar. Shares of Taiwan-based Career Technology MFG fell during the period due primarily to sluggish new product sales from Apple (sales of Apple’s newest phones have been lower than expected) coupled with intensifying competition. Sunny Optical Technology Group’s stock price declined after reporting disappointing midyear results. The China-based company’s net profit margin declined on decreased gross profit margins of handset camera modules and lower vehicle lens shipments. Increased competition also weighed on investor sentiment. China-based Yangtze Optical Fibre and Cable Joint Stock also posted negative results. The company’s share price corrected mainly due to uncertainty on 5G network build-out as Chinese telecommunication operators scaled down their capital expenditure spending. Uncertainty surrounding demand and fiber prices put additional pressure on the stock.
The fund’s underperformance in the financials sector was driven primarily by South Korea-based Hana Financial Group. Despite posting strong earnings results, Hana Financial Group’s stock price declined on uncertain macroeconomic indicators, including rising global interest rates. Additionally, the fund’s lack of exposure to Qatar National Bank and Banco Bradesco in Brazil weighed on relative results.
Investments in the Consumer Discretionary Sector Contributed
The fund’s consumer discretionary holdings aided relative results, led by retailer Magazine Luiza, textile manufacturer Shenzhou International Group Holdings, and multibrand hotel operator Huazhu Group. Magazine Luiza rallied on solid results driven by robust top-line growth. The company’s stock price was also supported by accelerated growth in online volume. Rising
consumption in China and a consumer shift to foreign brands supported stock gains for Shenzhou International Group. Other positives for the stock included an acceleration in revenue growth due to
* All fund returns referenced in this commentary are for Investor Class shares. Fund returns would have been lower if a portion of the fees had not been waived. Performance for other share classes will vary due to differences in fee structure; when Investor Class performance exceeds that of the fund's benchmark, other share classes may not. See page 3 for returns for all share classes.
5
market share gains, cost savings from new fabric and garment facilities, and margin improvement through automation. Huazhu Group, formerly known as China Lodging Group, rallied after exceeding expectations for revenue and earnings growth.
On an individual stock basis, Russian independent gas producer Novatek and China-based CNOOC, which engages in the exploration, development, production, and sale of crude oil, natural gas, and other petroleum products, boosted relative performance. Novatek benefited from ramped-up production driven by the launch of several major projects this year. Meanwhile, rising oil prices combined with better-than-expected production in China, volume growth driven by overseas projects, and cost control measures supported shares of oil producer CNOOC.
Other notable contributors included India-based HDFC Bank, Indonesia-based Bank Rakyat Indonesia Parsero, and South Africa-based Capitec Bank Holdings. HDFC showed steady performance with stable asset quality and strong profit and loan growth, while Bank Rakyat benefited from steady microloan growth, cost efficiencies, and expected lower provisions. Capitec’s profits jumped as the bank continues to consistently gain active clients.
Outlook
We continue to believe the long-term case for emerging markets stocks remains strong. The recent cooling of expectations for future U.S. interest rate hikes and de-escalation of trade tensions between the U.S. and China are expected to provide support for emerging markets stock prices.
The fund continues to invest in companies where fundamentals are strong and improving but share price performance does not fully reflect these factors. Our process is based on individual security selection, but broad themes have emerged.
Geographically, we remain overweight Brazil. We believe the 2018 elections provided a meaningful change in the direction of the country’s macroeconomic policy. Moving forward, we expect the Brazilian economy to accelerate without excessive inflation pressure and are positioned primarily in the private sector to benefit from the expected recovery in domestic demand.
Although we reduced our exposure to China, the country remains an important position on an absolute basis. We expect continued fiscal stimulus measures such as tax cuts and infrastructure spending to support a recovery in China’s economic growth, and as such, are positioned in the domestic market to benefit from rising household consumption.
Consumer discretionary is the largest relative sector position as of period-end. While we reduced our exposure during the period, we remain positive on companies positioned for strengthening consumer demand for luxury, education, and higher standard of living purchases. We continue to maintain our energy underweight as we see few names that fit our investment process. Our holdings in the sector represent companies that have earnings catalysts outside commodity prices.
Finally, we meaningfully increased our financials position over the last year, shifting from a relative underweight to an overweight versus the benchmark. We are finding opportunities in banks and diversified financial services firms positioned to benefit from the increasing demand for banking, investment, and insurance services, which remain at low penetration levels relative to developed markets.
6
| Fund Characteristics |
| NOVEMBER 30, 2018 | |
Top Ten Holdings | % of net assets |
| Tencent Holdings Ltd. | 5.3% |
| Taiwan Semiconductor Manufacturing Co. Ltd. | 4.6% |
| Alibaba Group Holding Ltd. ADR | 4.5% |
| Samsung Electronics Co. Ltd. | 3.7% |
| CNOOC Ltd. | 2.7% |
| Novatek PJSC GDR | 2.2% |
| China Construction Bank Corp., H Shares | 2.1% |
| HDFC Bank Ltd. | 2.0% |
| Naspers Ltd., N Shares | 2.0% |
| Industrial & Commercial Bank of China Ltd., H Shares | 2.0% |
Types of Investments in Portfolio | % of net assets |
| Common Stocks | 99.5% |
| Temporary Cash Investments | 0.2% |
| Other Assets and Liabilities | 0.3% |
Investments by Country | % of net assets |
| China | 29.1% |
| South Korea | 13.7% |
| Taiwan | 10.2% |
| India | 10.1% |
| Brazil | 8.3% |
| South Africa | 4.5% |
| Russia | 4.3% |
| Indonesia | 3.4% |
| Mexico | 3.2% |
| Thailand | 3.0% |
| Other Countries | 9.7% |
| Cash and Equivalents* | 0.5% |
| *Includes temporary cash investments and other assets and liabilities. | |
7
| Shareholder Fee Example |
Fund shareholders may incur two types of costs: (1) transaction costs, including sales charges (loads) on purchase payments and redemption/exchange fees; and (2) ongoing costs, including management fees; distribution and service (12b-1) fees; and other fund expenses. This example is intended to help you understand your ongoing costs (in dollars) of investing in your fund and to compare these costs with the ongoing cost of investing in other mutual funds.
The example is based on an investment of $1,000 made at the beginning of the period and held for the entire period from June 1, 2018 to November 30, 2018.
Actual Expenses
The table provides information about actual account values and actual expenses for each class. You may use the information, together with the amount you invested, to estimate the expenses that you paid over the period. First, identify the share class you own. Then simply divide your account value by $1,000 (for example, an $8,600 account value divided by $1,000 = 8.6), then multiply the result by the number under the heading “Expenses Paid During Period” to estimate the expenses you paid on your account during this period.
If you hold Investor Class shares of any American Century Investments fund, or I Class shares of the American Century Diversified Bond Fund, in an American Century Investments account (i.e., not a financial intermediary or retirement plan account), American Century Investments may charge you a $12.50 semiannual account maintenance fee if the value of those shares is less than $10,000. We will redeem shares automatically in one of your accounts to pay the $12.50 fee. In determining your total eligible investment amount, we will include your investments in all personal accounts (including American Century Investments Brokerage accounts) registered under your Social Security number. Personal accounts include individual accounts, joint accounts, UGMA/UTMA accounts, personal trusts, Coverdell Education Savings Accounts and IRAs (including traditional, Roth, Rollover, SEP-, SARSEP- and SIMPLE-IRAs), and certain other retirement accounts. If you have only business, business retirement, employer-sponsored or American Century Investments Brokerage accounts, you are currently not subject to this fee. If you are subject to the Account Maintenance Fee, your account value could be reduced by the fee amount.
Hypothetical Example for Comparison Purposes
The table also provides information about hypothetical account values and hypothetical expenses based on the actual expense ratio of each class of your fund and an assumed rate of return of 5% per year before expenses, which is not the actual return of a fund’s share class. The hypothetical account values and expenses may not be used to estimate the actual ending account balance or expenses you paid for the period. You may use this information to compare the ongoing costs of investing in your fund and other funds. To do so, compare this 5% hypothetical example with the 5% hypothetical examples that appear in the shareholder reports of the other funds.
Please note that the expenses shown in the table are meant to highlight your ongoing costs only and do not reflect any transactional costs, such as sales charges (loads) or redemption/exchange fees. Therefore, the table is useful in comparing ongoing costs only, and will not help you determine the relative total costs of owning different funds. In addition, if these transactional costs were included, your costs would have been higher.
8
| Beginning Account Value 6/1/18 | Ending Account Value 11/30/18 | Expenses Paid During Period(1) 6/1/18 - 11/30/18 | Annualized Expense Ratio(1) | |
Actual | ||||
| Investor Class | $1,000 | $856.90 | $5.82 | 1.25% |
| I Class | $1,000 | $858.10 | $4.89 | 1.05% |
| Y Class | $1,000 | $858.40 | $4.19 | 0.90% |
| A Class | $1,000 | $856.00 | $6.98 | 1.50% |
| C Class | $1,000 | $852.90 | $10.45 | 2.25% |
| R Class | $1,000 | $855.00 | $8.14 | 1.75% |
| R5 Class | $1,000 | $858.20 | $4.89 | 1.05% |
| R6 Class | $1,000 | $858.20 | $4.19 | 0.90% |
| Hypothetical | ||||
| Investor Class | $1,000 | $1,018.80 | $6.33 | 1.25% |
| I Class | $1,000 | $1,019.80 | $5.32 | 1.05% |
| Y Class | $1,000 | $1,020.56 | $4.56 | 0.90% |
| A Class | $1,000 | $1,017.55 | $7.59 | 1.50% |
| C Class | $1,000 | $1,013.79 | $11.36 | 2.25% |
| R Class | $1,000 | $1,016.30 | $8.85 | 1.75% |
| R5 Class | $1,000 | $1,019.80 | $5.32 | 1.05% |
| R6 Class | $1,000 | $1,020.56 | $4.56 | 0.90% |
| (1) | Expenses are equal to the class's annualized expense ratio listed in the table above, multiplied by the average account value over the period, multiplied by 183, the number of days in the most recent fiscal half-year, divided by 365, to reflect the one-half year period. Annualized expense ratio reflects actual expenses, including any applicable fee waivers or expense reimbursements and excluding any acquired fund fees and expenses. |
9
| Schedule of Investments |
NOVEMBER 30, 2018
| Shares | Value | ||||
| COMMON STOCKS — 99.5% | |||||
| Brazil — 8.3% | |||||
| Ambev SA ADR | 1,278,613 | $ | 5,459,678 | ||
| B3 SA - Brasil Bolsa Balcao | 2,806,900 | 20,469,247 | |||
| Duratex SA | 2,122,700 | 6,718,864 | |||
| Itau Unibanco Holding SA ADR | 4,331,523 | 40,413,110 | |||
| Localiza Rent a Car SA | 3,057,300 | 21,275,393 | |||
| Lojas Renner SA | 2,363,600 | 23,898,826 | |||
| Magazine Luiza SA | 693,100 | 29,507,384 | |||
Pagseguro Digital Ltd., Class A(1) | 680,323 | 16,327,752 | |||
| Vale SA ADR | 1,525,062 | 20,893,349 | |||
| 184,963,603 | |||||
| China — 29.1% | |||||
Alibaba Group Holding Ltd. ADR(1) | 621,069 | 99,905,159 | |||
| Anhui Conch Cement Co. Ltd., H Shares | 5,098,500 | 26,613,384 | |||
Baozun, Inc. ADR(1) | 351,634 | 12,402,131 | |||
| Brilliance China Automotive Holdings Ltd. | 12,702,000 | 11,321,857 | |||
| China Construction Bank Corp., H Shares | 54,801,000 | 46,861,740 | |||
| China Gas Holdings Ltd. | 4,351,600 | 14,983,012 | |||
| China Resources Beer Holdings Co. Ltd. | 7,178,000 | 24,307,807 | |||
| CNOOC Ltd. | 36,345,000 | 61,308,473 | |||
| Geely Automobile Holdings Ltd. | 6,162,000 | 12,129,385 | |||
Haier Electronics Group Co. Ltd.(1) | 4,186,000 | 9,746,045 | |||
| Huazhu Group Ltd. ADR | 409,982 | 12,930,832 | |||
| Industrial & Commercial Bank of China Ltd., H Shares | 61,285,645 | 43,674,905 | |||
| KWG Group Holdings Ltd. | 20,377,000 | 18,122,701 | |||
New Oriental Education & Technology Group, Inc. ADR(1) | 354,815 | 20,281,225 | |||
| Ping An Insurance Group Co. of China Ltd., H Shares | 4,103,500 | 39,818,049 | |||
| Shenzhou International Group Holdings Ltd. | 2,988,000 | 36,403,521 | |||
| Sunny Optical Technology Group Co. Ltd. | 1,085,600 | 10,574,436 | |||
TAL Education Group ADR(1) | 727,774 | 20,428,616 | |||
| Tencent Holdings Ltd. | 2,978,100 | 119,455,108 | |||
| Yangtze Optical Fibre and Cable Joint Stock Ltd. Co., H Shares | 3,875,000 | 10,505,614 | |||
| 651,774,000 | |||||
| Czech Republic — 1.0% | |||||
| Moneta Money Bank AS | 6,485,383 | 22,343,583 | |||
| Egypt — 0.6% | |||||
| Commercial International Bank Egypt S.A.E. | 1,772,166 | 7,382,541 | |||
| Commercial International Bank Egypt S.A.E. GDR | 1,344,881 | 5,707,969 | |||
| 13,090,510 | |||||
| Hungary — 1.6% | |||||
| OTP Bank Nyrt | 928,260 | 37,157,610 | |||
10
| Shares | Value | ||||
| India — 10.1% | |||||
| Ashok Leyland Ltd. | 8,914,168 | $ | 14,377,913 | ||
| Balkrishna Industries Ltd. | 1,093,382 | 15,075,679 | |||
| Bata India Ltd. | 899,355 | 13,509,270 | |||
Bharat Financial Inclusion Ltd.(1) | 1,725,979 | 25,348,318 | |||
Future Retail Ltd.(1) | 2,117,692 | 15,984,864 | |||
| Godrej Consumer Products Ltd. | 3,090,145 | 33,286,372 | |||
| HDFC Bank Ltd. | 1,480,753 | 45,180,431 | |||
| Jubilant Foodworks Ltd. | 601,962 | 10,905,008 | |||
| Larsen & Toubro Ltd. | 1,544,494 | 31,756,872 | |||
| Tata Consultancy Services Ltd. | 731,236 | 20,639,843 | |||
| 226,064,570 | |||||
| Indonesia — 3.4% | |||||
| Bank Rakyat Indonesia Persero Tbk PT | 153,037,300 | 38,913,865 | |||
| Telekomunikasi Indonesia Persero Tbk PT | 94,525,200 | 24,435,594 | |||
| United Tractors Tbk PT | 6,693,300 | 12,882,775 | |||
| 76,232,234 | |||||
| Malaysia — 0.7% | |||||
| CIMB Group Holdings Bhd | 10,983,715 | 15,157,608 | |||
| Mexico — 3.2% | |||||
| America Movil SAB de CV, Class L ADR | 1,590,846 | 21,396,879 | |||
| Grupo Aeroportuario del Centro Norte SAB de CV | 1,770,917 | 7,928,940 | |||
| Mexichem SAB de CV | 6,920,762 | 16,151,136 | |||
| Wal-Mart de Mexico SAB de CV | 10,651,408 | 26,385,506 | |||
| 71,862,461 | |||||
| Peru — 1.2% | |||||
| Credicorp Ltd. | 119,977 | 26,309,756 | |||
| Philippines — 1.1% | |||||
| Ayala Land, Inc. | 30,099,800 | 23,958,546 | |||
| Russia — 4.3% | |||||
| Novatek PJSC GDR | 289,907 | 49,523,797 | |||
| Sberbank of Russia PJSC ADR (London) | 1,761,672 | 20,906,028 | |||
Yandex NV, A Shares(1) | 849,422 | 25,057,949 | |||
| 95,487,774 | |||||
| South Africa — 4.5% | |||||
| Capitec Bank Holdings Ltd. | 332,868 | 26,428,668 | |||
| Discovery Ltd. | 1,386,093 | 15,466,366 | |||
| Foschini Group Ltd. (The) | 1,172,446 | 14,864,769 | |||
| Naspers Ltd., N Shares | 224,033 | 45,006,617 | |||
| 101,766,420 | |||||
| South Korea — 13.7% | |||||
CJ Logistics Corp.(1) | 175,474 | 24,969,104 | |||
| Cosmax, Inc. | 161,493 | 19,697,422 | |||
Doosan Infracore Co. Ltd.(1) | 2,846,717 | 21,682,468 | |||
| Fila Korea Ltd. | 795,539 | 36,138,818 | |||
| Hana Financial Group, Inc. | 569,402 | 19,164,415 | |||
| Hotel Shilla Co. Ltd. | 169,346 | 13,037,655 | |||
11
| Shares | Value | ||||
Hyundai Heavy Industries Co. Ltd.(1) | 243,839 | $ | 28,879,750 | ||
| Medy-Tox, Inc. | 25,968 | 13,072,983 | |||
| Orion Corp/Republic of Korea | 169,558 | 16,878,802 | |||
| POSCO Chemtech Co. Ltd. | 262,120 | 15,927,389 | |||
| Samsung Electro-Mechanics Co. Ltd. | 134,114 | 14,524,782 | |||
| Samsung Electronics Co. Ltd. | 2,184,207 | 82,003,295 | |||
| 305,976,883 | |||||
| Taiwan — 10.2% | |||||
| Career Technology MFG. Co. Ltd. | 9,217,000 | 9,093,293 | |||
| Chailease Holding Co. Ltd. | 8,561,880 | 26,686,965 | |||
| Chroma ATE, Inc. | 2,486,000 | 9,692,135 | |||
| Globalwafers Co. Ltd. | 1,423,000 | 16,861,913 | |||
| Powertech Technology, Inc. | 2,030,000 | 4,758,605 | |||
| President Chain Store Corp. | 2,823,000 | 29,248,400 | |||
| Taiwan Cement Corp. | 26,173,300 | 29,453,882 | |||
| Taiwan Semiconductor Manufacturing Co. Ltd. | 13,982,939 | 102,219,620 | |||
| 228,014,813 | |||||
| Thailand — 3.0% | |||||
| Airports of Thailand PCL | 7,873,600 | 15,431,830 | |||
| CP ALL PCL | 5,923,900 | 12,275,834 | |||
| Kasikornbank PCL | 1,222,800 | 7,214,568 | |||
| Kasikornbank PCL NVDR | 2,520,300 | 14,871,545 | |||
| Minor International PCL | 14,960,900 | 16,557,837 | |||
| 66,351,614 | |||||
| Turkey — 1.1% | |||||
| BIM Birlesik Magazalar AS | 879,731 | 14,267,794 | |||
| Ford Otomotiv Sanayi AS | 980,439 | 10,144,073 | |||
| 24,411,867 | |||||
| United Arab Emirates — 1.1% | |||||
| First Abu Dhabi Bank PJSC | 6,616,881 | 24,515,658 | |||
| United Kingdom — 1.3% | |||||
| NMC Health plc | 705,685 | 29,810,679 | |||
TOTAL COMMON STOCKS (Cost $2,251,406,552) | 2,225,250,189 | ||||
| TEMPORARY CASH INVESTMENTS — 0.2% | |||||
| Repurchase Agreement, BMO Capital Markets Corp., (collateralized by various U.S. Treasury obligations, 1.125% - 3.125%, 5/31/19 - 11/15/28, valued at $3,703,953), in a joint trading account at 2.00%, dated 11/30/18, due 12/3/18 (Delivery value $3,631,752) | 3,631,147 | ||||
| Repurchase Agreement, Fixed Income Clearing Corp., (collateralized by various U.S. Treasury obligations, 3.375%, 11/15/48, valued at $828,387), at 1.05%, dated 11/30/18, due 12/3/18 (Delivery value $808,071) | 808,000 | ||||
| State Street Institutional U.S. Government Money Market Fund, Premier Class | 34,035 | 34,035 | |||
TOTAL TEMPORARY CASH INVESTMENTS (Cost $4,473,182) | 4,473,182 | ||||
TOTAL INVESTMENT SECURITIES — 99.7% (Cost $2,255,879,734) | 2,229,723,371 | ||||
| OTHER ASSETS AND LIABILITIES — 0.3% | 7,061,407 | ||||
| TOTAL NET ASSETS — 100.0% | $ | 2,236,784,778 | |||
12
| MARKET SECTOR DIVERSIFICATION | ||
(as a % of net assets) | ||
| Financials | 25.5 | % |
| Consumer Discretionary | 18.7 | % |
| Information Technology | 13.3 | % |
| Communication Services | 10.5 | % |
| Consumer Staples | 8.9 | % |
| Industrials | 7.5 | % |
| Energy | 5.5 | % |
| Materials | 5.1 | % |
| Health Care | 1.9 | % |
| Real Estate | 1.9 | % |
| Utilities | 0.7 | % |
| Cash and Equivalents* | 0.5 | % |
*Includes temporary cash investments and other assets and liabilities.
| NOTES TO SCHEDULE OF INVESTMENTS | ||
| ADR | - | American Depositary Receipt |
| GDR | - | Global Depositary Receipt |
| NVDR | - | Non-Voting Depositary Receipt |
(1) Non-income producing.
See Notes to Financial Statements.
13
| Statement of Assets and Liabilities |
| NOVEMBER 30, 2018 | |||
| Assets | |||
| Investment securities, at value (cost of $2,255,879,734) | $ | 2,229,723,371 | |
| Foreign currency holdings, at value (cost of $915,336) | 915,789 | ||
| Receivable for investments sold | 4,225,025 | ||
| Receivable for capital shares sold | 8,783,845 | ||
| Dividends and interest receivable | 873,113 | ||
| Other assets | 29,015 | ||
| 2,244,550,158 | |||
| Liabilities | |||
| Payable for capital shares redeemed | 5,654,249 | ||
| Accrued management fees | 2,067,922 | ||
| Distribution and service fees payable | 43,209 | ||
| 7,765,380 | |||
| Net Assets | $ | 2,236,784,778 | |
| Net Assets Consist of: | |||
| Capital (par value and paid-in surplus) | $ | 2,395,880,252 | |
| Distributable earnings | (159,095,474 | ) | |
| $ | 2,236,784,778 | ||
| Net Assets | Shares Outstanding | Net Asset Value Per Share | ||||
| Investor Class, $0.01 Par Value | $980,764,991 | 96,289,173 | $10.19 | |||
| I Class, $0.01 Par Value | $897,336,216 | 85,809,876 | $10.46 | |||
| Y Class, $0.01 Par Value | $4,724,364 | 450,242 | $10.49 | |||
| A Class, $0.01 Par Value | $72,711,196 | 7,408,397 | $9.81* | |||
| C Class, $0.01 Par Value | $31,871,096 | 3,567,274 | $8.93 | |||
| R Class, $0.01 Par Value | $5,825,440 | 591,250 | $9.85 | |||
| R5 Class, $0.01 Par Value | $4,520,814 | 431,923 | $10.47 | |||
| R6 Class, $0.01 Par Value | $239,030,661 | 22,818,673 | $10.48 | |||
*Maximum offering price $10.41 (net asset value divided by 0.9425).
See Notes to Financial Statements.
14
| Statement of Operations |
| YEAR ENDED NOVEMBER 30, 2018 | |||
| Investment Income (Loss) | |||
| Income: | |||
| Dividends (net of foreign taxes withheld of $5,618,677) | $ | 43,272,600 | |
| Interest | 617,315 | ||
| 43,889,915 | |||
| Expenses: | |||
| Management fees | 27,396,351 | ||
| Distribution and service fees: | |||
| A Class | 184,669 | ||
| C Class | 353,416 | ||
| R Class | 30,484 | ||
| Directors' fees and expenses | 63,166 | ||
| Other expenses | 30,812 | ||
| 28,058,898 | |||
Fees waived(1) | (2,372,370 | ) | |
| 25,686,528 | |||
| Net investment income (loss) | 18,203,387 | ||
| Realized and Unrealized Gain (Loss) | |||
| Net realized gain (loss) on: | |||
| Investment transactions (net of foreign tax expenses paid (refunded) of $360,205) | (143,552,774 | ) | |
| Foreign currency translation transactions | (2,347,383 | ) | |
| (145,900,157 | ) | ||
| Change in net unrealized appreciation (depreciation) on: | |||
| Investments (includes (increase) decrease in accrued foreign taxes of $2,982,829) | (316,427,752 | ) | |
| Translation of assets and liabilities in foreign currencies | (18,070 | ) | |
| (316,445,822 | ) | ||
| Net realized and unrealized gain (loss) | (462,345,979 | ) | |
| Net Increase (Decrease) in Net Assets Resulting from Operations | $ | (444,142,592 | ) |
| (1) | Amount consists of $1,260,678, $824,771, $90, $83,433, $38,072, $6,896, $2,497 and $155,933 for Investor Class, I Class, Y Class, A Class, C Class, R Class, R5 Class and R6 Class, respectively. |
See Notes to Financial Statements.
15
| Statement of Changes in Net Assets |
| YEARS ENDED NOVEMBER 30, 2018 AND NOVEMBER 30, 2017 | ||||||
| Increase (Decrease) in Net Assets | November 30, 2018 | November 30, 2017 | ||||
| Operations | ||||||
| Net investment income (loss) | $ | 18,203,387 | $ | 2,216,425 | ||
| Net realized gain (loss) | (145,900,157 | ) | 81,483,504 | |||
| Change in net unrealized appreciation (depreciation) | (316,445,822 | ) | 206,829,821 | |||
| Net increase (decrease) in net assets resulting from operations | (444,142,592 | ) | 290,529,750 | |||
| Distributions to Shareholders | ||||||
| From earnings: | ||||||
| Investor Class | (8,646,208 | ) | (1,705,705 | ) | ||
| I Class | (7,994,063 | ) | (210,725 | ) | ||
| Y Class | (1,759 | ) | — | |||
| A Class | (390,371 | ) | (23,887 | ) | ||
| C Class | (207,089 | ) | — | |||
| R Class | (30,409 | ) | — | |||
| R5 Class | (41,149 | ) | — | |||
| R6 Class | (1,815,971 | ) | (256,448 | ) | ||
| Decrease in net assets from distributions | (19,127,019 | ) | (2,196,765 | ) | ||
| Capital Share Transactions | ||||||
| Net increase (decrease) in net assets from capital share transactions (Note 5) | 1,127,728,674 | 696,574,962 | ||||
| Redemption Fees | ||||||
| Increase in net assets from redemption fees | — | 114,873 | ||||
| Net increase (decrease) in net assets | 664,459,063 | 985,022,820 | ||||
| Net Assets | ||||||
| Beginning of period | 1,572,325,715 | 587,302,895 | ||||
| End of period | $ | 2,236,784,778 | $ | 1,572,325,715 | ||
See Notes to Financial Statements.
16
| Notes to Financial Statements |
NOVEMBER 30, 2018
1. Organization
American Century World Mutual Funds, Inc. (the corporation) is registered under the Investment Company Act of 1940, as amended (the 1940 Act), as an open-end management investment company and is organized as a Maryland corporation. Emerging Markets Fund (the fund) is one fund in a series issued by the corporation. The fund’s investment objective is to seek capital growth.
The fund offers the Investor Class, I Class, Y Class, A Class, C Class, R Class, R5 Class and R6 Class. The A Class may incur an initial sales charge. The A Class and C Class may be subject to a contingent deferred sales charge. Sale of the Y Class and R5 Class commenced on April 10, 2017.
2. Significant Accounting Policies
The following is a summary of significant accounting policies consistently followed by the fund in preparation of its financial statements. The fund is an investment company and follows accounting and reporting guidance in accordance with accounting principles generally accepted in the United States of America. This may require management to make certain estimates and assumptions at the date of the financial statements. Actual results could differ from these estimates. Management evaluated the impact of events or transactions occurring through the date the financial statements were issued that would merit recognition or disclosure.
Investment Valuations — The fund determines the fair value of its investments and computes its net asset value per share at the close of regular trading (usually 4 p.m. Eastern time) on the New York Stock Exchange (NYSE) on each day the NYSE is open. The Board of Directors has adopted valuation policies and procedures to guide the investment advisor in the fund’s investment valuation process and to provide methodologies for the oversight of the fund’s pricing function.
Equity securities that are listed or traded on a domestic securities exchange are valued at the last reported sales price or at the official closing price as provided by the exchange. Equity securities traded on foreign securities exchanges are generally valued at the closing price of such securities on the exchange where primarily traded or at the close of the NYSE, if that is earlier. If no last sales price is reported, or if local convention or regulation so provides, the mean of the latest bid and asked prices may be used. Securities traded over-the-counter are valued at the mean of the latest bid and asked prices, the last sales price, or the official closing price. Equity securities initially expressed in local currencies are translated into U.S. dollars at the mean of the appropriate currency exchange rate at the close of the NYSE as provided by an independent pricing service.
Open-end management investment companies are valued at the reported net asset value per share. Repurchase agreements are valued at cost, which approximates fair value.
If the fund determines that the market price for an investment is not readily available or the valuation methods mentioned above do not reflect an investment’s fair value, such investment is valued as determined in good faith by the Board of Directors or its delegate, in accordance with policies and procedures adopted by the Board of Directors. In its determination of fair value, the fund may review several factors including, but not limited to, market information regarding the specific investment or comparable investments and correlation with other investment types, futures indices or general market indicators. Circumstances that may cause the fund to use these procedures to value an investment include, but are not limited to: an investment has been declared in default or is distressed; trading in a security has been suspended during the trading day or a security is not actively trading on its principal exchange; prices received from a regular pricing source are deemed unreliable; or there is a foreign market holiday and no trading occurred.
The fund monitors for significant events occurring after the close of an investment’s primary exchange but before the fund’s net asset value per share is determined. Significant events may include, but are not limited to: corporate announcements and transactions; governmental action and political unrest that could impact a specific investment or an investment sector; or armed conflicts, natural disasters and similar events that could affect investments in a specific country or region. The fund also monitors for significant fluctuations between domestic and foreign markets, as evidenced by the U.S. market or such other indicators that the Board of Directors, or its delegate, deems appropriate. If significant fluctuations in foreign markets are identified, the
17
fund may apply a model-derived factor to the closing price of equity securities traded on foreign securities exchanges. The factor is based on observable market data as provided by an independent pricing service.
Security Transactions — Security transactions are accounted for as of the trade date. Net realized gains and losses are determined on the identified cost basis, which is also used for federal income tax purposes. Certain countries impose taxes on realized gains on the sale of securities registered in their country. The fund records the foreign tax expense, if any, on an accrual basis. The foreign tax expense on realized gains and unrealized appreciation reduces the net realized gain (loss) on investment transactions and net unrealized appreciation (depreciation) on investments, respectively.
Investment Income — Dividend income less foreign taxes withheld, if any, is recorded as of the ex-dividend date. Distributions received on securities that represent a return of capital or long-term capital gain are recorded as a reduction of cost of investments and/or as a realized gain. The fund may estimate the components of distributions received that may be considered nontaxable distributions or long-term capital gain distributions for income tax purposes. Interest income is recorded on the accrual basis and includes accretion of discounts and amortization of premiums.
Foreign Currency Translations — All assets and liabilities initially expressed in foreign currencies are translated into U.S. dollars at prevailing exchange rates at period end. The fund may enter into spot foreign currency exchange contracts to facilitate transactions denominated in a foreign currency. Purchases and sales of investment securities, dividend and interest income, spot foreign currency exchange contracts, and expenses are translated at the rates of exchange prevailing on the respective dates of such transactions. Net realized and unrealized foreign currency exchange gains or losses related to investment securities are a component of net realized gain (loss) on investment transactions and change in net unrealized appreciation (depreciation) on investments, respectively.
Repurchase Agreements — The fund may enter into repurchase agreements with institutions that American Century Investment Management, Inc. (ACIM) (the investment advisor) has determined are creditworthy pursuant to criteria adopted by the Board of Directors. The fund requires that the collateral, represented by securities, received in a repurchase transaction be transferred to the custodian in a manner sufficient to enable the fund to obtain those securities in the event of a default under the repurchase agreement. ACIM monitors, on a daily basis, the securities transferred to ensure the value, including accrued interest, of the securities under each repurchase agreement is equal to or greater than amounts owed to the fund under each repurchase agreement.
Joint Trading Account — Pursuant to an Exemptive Order issued by the Securities and Exchange Commission, the fund, along with certain other funds in the American Century Investments family of funds, may transfer uninvested cash balances into a joint trading account. These balances are invested in one or more repurchase agreements that are collateralized by U.S. Treasury or Agency obligations.
Income Tax Status — It is the fund’s policy to distribute substantially all net investment income and net realized gains to shareholders and to otherwise qualify as a regulated investment company under provisions of the Internal Revenue Code. Accordingly, no provision has been made for income taxes. The fund files U.S. federal, state, local and non-U.S. tax returns as applicable. The fund's tax returns are subject to examination by the relevant taxing authority until expiration of the applicable statute of limitations, which is generally three years from the date of filing but can be longer in certain jurisdictions. At this time, management believes there are no uncertain tax positions which, based on their technical merit, would not be sustained upon examination and for which it is reasonably possible that the total amounts of unrecognized tax benefits will significantly change in the next twelve months.
Multiple Class — All shares of the fund represent an equal pro rata interest in the net assets of the class to which such shares belong, and have identical voting, dividend, liquidation and other rights and the same terms and conditions, except for class specific expenses and exclusive rights to vote on matters affecting only individual classes. Income, non-class specific expenses, and realized and unrealized capital gains and losses of the fund are allocated to each class of shares based on their relative net assets.
Distributions to Shareholders — Distributions from net investment income and net realized gains, if any, are generally declared and paid annually. The fund may make distributions on a more frequent basis to comply with the distribution requirements of the Internal Revenue Code, in all events in a manner consistent with provisions of the 1940 Act.
Redemption Fees — Prior to October 9, 2017, the fund may have imposed a 2.00% redemption fee on shares held less than 60 days. The fee was not applicable to all classes. The redemption fee was retained by
18
the fund to help cover transaction costs that long-term investors may bear when the fund sells securities to meet investor redemptions.
Indemnifications — Under the corporation’s organizational documents, its officers and directors are indemnified against certain liabilities arising out of the performance of their duties to the fund. In addition, in the normal course of business, the fund enters into contracts that provide general indemnifications. The maximum exposure under these arrangements is unknown as this would involve future claims that may be made against a fund. The risk of material loss from such claims is considered by management to be remote.
3. Fees and Transactions with Related Parties
Certain officers and directors of the corporation are also officers and/or directors of American Century Companies, Inc. (ACC). The corporation’s investment advisor, ACIM, the corporation's distributor, American Century Investment Services, Inc. (ACIS), and the corporation’s transfer agent, American Century Services, LLC, are wholly owned, directly or indirectly, by ACC. Various funds issued by American Century Asset Allocation Portfolios, Inc. own, in aggregate, 8% of the shares of the fund.
Management Fees — The corporation has entered into a management agreement with ACIM, under which ACIM provides the fund with investment advisory and management services in exchange for a single, unified management fee (the fee) per class. The agreement provides that all expenses of managing and operating the fund, except distribution and service fees, brokerage expenses, taxes, interest, fees and expenses of the independent directors (including legal counsel fees), and extraordinary expenses, will be paid by ACIM. The fee is computed and accrued daily based on each class's daily net assets and paid monthly in arrears. The difference in the fee among the classes is a result of their separate arrangements for non-Rule 12b-1 shareholder services. It is not the result of any difference in advisory or custodial fees or other expenses related to the management of the fund’s assets, which do not vary by class. From December 1, 2017 through March 31, 2018, the rate of the fee was determined by applying a fee rate calculation formula. This formula took into account the fund’s assets as well as certain assets, if any, of other clients of the investment advisor outside the American Century Investments family of funds (such as subadvised funds and separate accounts) that use very similar investment teams and strategies (strategy assets). The strategy assets of the fund also included the assets of NT Emerging Markets Fund, one fund in a series issued by the corporation. The annual management fee schedule ranged from 1.250% to 1.850% for the Investor Class, A Class, C Class and R Class. The annual management fee schedule ranged from 1.050% to 1.650% for the I Class and R5 Class and 0.900% to 1.500% for the Y Class and R6 Class. From December 1, 2017 through March 31, 2018, the investment advisor agreed to waive 0.350% of the fund’s management fee. Effective April 1, 2018, the stepped annual management fee schedule and the waiver were terminated. The annual management fee is 1.25% for the Investor Class, A Class, C Class and R Class, 1.05% for the I Class and R5 Class and 0.90% for the Y Class and R6 Class.
The effective annual management fee before and after waiver for each class for the period ended November 30, 2018 are as follows:
| Effective Annual Management Fee | ||
| Before Waiver | After Waiver | |
| Investor Class | 1.29% | 1.18% |
| I Class | 1.09% | 0.98% |
| Y Class | 0.94% | 0.83% |
| A Class | 1.29% | 1.18% |
| C Class | 1.29% | 1.18% |
| R Class | 1.29% | 1.18% |
| R5 Class | 1.09% | 0.98% |
| R6 Class | 0.94% | 0.83% |
19
Distribution and Service Fees — The Board of Directors has adopted a separate Master Distribution and Individual Shareholder Services Plan for each of the A Class, C Class and R Class (collectively the plans), pursuant to Rule 12b-1 of the 1940 Act. The plans provide that the A Class will pay ACIS an annual distribution and service fee of 0.25%. The plans provide that the C Class will pay ACIS an annual distribution and service fee of 1.00%, of which 0.25% is paid for individual shareholder services and 0.75% is paid for distribution services. The plans provide that the R Class will pay ACIS an annual distribution and service fee of 0.50%. The fees are computed and accrued daily based on each class’s daily net assets and paid monthly in arrears. The fees are used to pay financial intermediaries for distribution and individual shareholder services. Fees incurred under the plans during the period ended November 30, 2018 are detailed in the Statement of Operations.
Directors' Fees and Expenses — The Board of Directors is responsible for overseeing the investment advisor’s management and operations of the fund. The directors receive detailed information about the fund and its investment advisor regularly throughout the year, and meet at least quarterly with management of the investment advisor to review reports about fund operations. The fund’s officers do not receive compensation from the fund.
Interfund Transactions — The fund may enter into security transactions with other American Century Investments funds and other client accounts of the investment advisor, in accordance with the 1940 Act rules and procedures adopted by the Board of Directors. The rules and procedures require, among other things, that these transactions be effected at the independent current market price of the security. During the period, the interfund purchases and sales were $993,456 and $27,274, respectively. The effect of interfund transactions on the Statement of Operations was $(13,926) in net realized gain (loss) on investment transactions.
4. Investment Transactions
Purchases and sales of investment securities, excluding short-term investments, for the period ended November 30, 2018 were $1,970,993,096 and $808,419,511, respectively.
20
5. Capital Share Transactions
Transactions in shares of the fund were as follows:
| Year ended November 30, 2018 | Year ended November 30, 2017(1) | |||||||||
| Shares | Amount | Shares | Amount | |||||||
| Investor Class/Shares Authorized | 1,150,000,000 | 500,000,000 | ||||||||
| Sold | 64,760,949 | $ | 771,018,077 | 51,102,270 | $ | 545,843,887 | ||||
| Issued in reinvestment of distributions | 651,370 | 8,389,638 | 170,927 | 1,625,512 | ||||||
| Redeemed | (42,737,959 | ) | (476,726,066 | ) | (32,531,459 | ) | (341,641,540 | ) | ||
| 22,674,360 | 302,681,649 | 18,741,738 | 205,827,859 | |||||||
| I Class/Shares Authorized | 1,100,000,000 | 210,000,000 | ||||||||
| Sold | 84,346,072 | 1,028,660,971 | 40,142,662 | 459,185,069 | ||||||
| Issued in reinvestment of distributions | 520,633 | 6,877,558 | 21,610 | 210,697 | ||||||
| Redeemed | (40,057,350 | ) | (447,621,773 | ) | (3,375,540 | ) | (38,606,224 | ) | ||
| 44,809,355 | 587,916,756 | 36,788,732 | 420,789,542 | |||||||
| Y Class/Shares Authorized | 25,000,000 | 50,000,000 | ||||||||
| Sold | 484,086 | 5,451,640 | 511 | 5,000 | ||||||
| Issued in reinvestment of distributions | 133 | 1,759 | — | — | ||||||
| Redeemed | (34,488 | ) | (368,913 | ) | — | — | ||||
| 449,731 | 5,084,486 | 511 | 5,000 | |||||||
| A Class/Shares Authorized | 80,000,000 | 50,000,000 | ||||||||
| Sold | 5,501,637 | 61,911,723 | 5,641,981 | 58,277,889 | ||||||
| Issued in reinvestment of distributions | 27,068 | 336,722 | 2,219 | 20,367 | ||||||
| Redeemed | (3,444,674 | ) | (38,074,936 | ) | (4,890,160 | ) | (47,362,727 | ) | ||
| 2,084,031 | 24,173,509 | 754,040 | 10,935,529 | |||||||
| C Class/Shares Authorized | 45,000,000 | 30,000,000 | ||||||||
| Sold | 2,206,474 | 23,600,751 | 1,827,106 | 17,797,424 | ||||||
| Issued in reinvestment of distributions | 15,833 | 180,175 | — | — | ||||||
| Redeemed | (1,007,861 | ) | (9,742,868 | ) | (239,477 | ) | (2,152,216 | ) | ||
| 1,214,446 | 14,038,058 | 1,587,629 | 15,645,208 | |||||||
| R Class/Shares Authorized | 30,000,000 | 30,000,000 | ||||||||
| Sold | 492,151 | 5,468,250 | 296,970 | 3,157,947 | ||||||
| Issued in reinvestment of distributions | 2,430 | 30,398 | — | — | ||||||
| Redeemed | (316,573 | ) | (3,426,412 | ) | (164,675 | ) | (1,695,228 | ) | ||
| 178,008 | 2,072,236 | 132,295 | 1,462,719 | |||||||
| R5 Class/Shares Authorized | 30,000,000 | 50,000,000 | ||||||||
| Sold | 590,313 | 7,280,374 | 3,703 | 44,866 | ||||||
| Issued in reinvestment of distributions | 3,113 | 41,149 | — | — | ||||||
| Redeemed | (165,206 | ) | (1,808,015 | ) | — | — | ||||
| 428,220 | 5,513,508 | 3,703 | 44,866 | |||||||
| R6 Class/Shares Authorized | 190,000,000 | 50,000,000 | ||||||||
| Sold | 19,923,599 | 239,430,383 | 5,856,775 | 66,206,392 | ||||||
| Issued in reinvestment of distributions | 136,929 | 1,810,200 | 26,302 | 256,448 | ||||||
| Redeemed | (4,736,641 | ) | (54,992,111 | ) | (2,255,306 | ) | (24,598,601 | ) | ||
| 15,323,887 | 186,248,472 | 3,627,771 | 41,864,239 | |||||||
| Net increase (decrease) | 87,162,038 | $ | 1,127,728,674 | 61,636,419 | $ | 696,574,962 | ||||
| (1) | April 10, 2017 (commencement of sale) through November 30, 2017 for the Y Class and R5 Class. |
21
6. Fair Value Measurements
The fund’s investments valuation process is based on several considerations and may use multiple inputs to determine the fair value of the investments held by the fund. In conformity with accounting principles generally accepted in the United States of America, the inputs used to determine a valuation are classified into three broad levels.
| • | Level 1 valuation inputs consist of unadjusted quoted prices in an active market for identical investments. |
| • | Level 2 valuation inputs consist of direct or indirect observable market data (including quoted prices for comparable investments, evaluations of subsequent market events, interest rates, prepayment speeds, credit risk, etc.). These inputs also consist of quoted prices for identical investments initially expressed in local currencies that are adjusted through translation into U.S. dollars. |
| • | Level 3 valuation inputs consist of unobservable data (including a fund’s own assumptions). |
The level classification is based on the lowest level input that is significant to the fair valuation measurement. The valuation inputs are not necessarily an indication of the risks associated with investing in these securities or other financial instruments.
The following is a summary of the level classifications as of period end. The Schedule of Investments provides additional information on the fund’s portfolio holdings.
| Level 1 | Level 2 | Level 3 | ||||||
| Assets | ||||||||
| Investment Securities | ||||||||
| Common Stocks | ||||||||
| Brazil | $ | 83,093,889 | $ | 101,869,714 | — | |||
| China | 165,947,963 | 485,826,037 | — | |||||
| Mexico | 21,396,879 | 50,465,582 | — | |||||
| Peru | 26,309,756 | — | — | |||||
| Russia | 25,057,949 | 70,429,825 | — | |||||
| Other Countries | — | 1,194,852,595 | — | |||||
| Temporary Cash Investments | 34,035 | 4,439,147 | — | |||||
| $ | 321,840,471 | $ | 1,907,882,900 | — | ||||
7. Risk Factors
There are certain risks involved in investing in foreign securities. These risks include those resulting from future adverse political, social and economic developments, fluctuations in currency exchange rates, the possible imposition of exchange controls, and other foreign laws or restrictions. Investing in emerging markets may accentuate these risks.
Investing a significant portion of assets in one country or region makes the fund more dependent upon the political and economic circumstances of that particular country or region than a fund that is more widely diversified.
22
8. Federal Tax Information
The tax character of distributions paid during the years ended November 30, 2018 and November 30, 2017 were as follows:
| 2018 | 2017 | |||||
| Distributions Paid From | ||||||
| Ordinary income | $ | 7,757,413 | $ | 2,196,765 | ||
| Long-term capital gains | $ | 11,369,606 | — | |||
The book-basis character of distributions made during the year from net investment income or net realized gains may differ from their ultimate characterization for federal income tax purposes. These differences reflect the differing character of certain income items and net realized gains and losses for financial statement and tax purposes, and may result in reclassification among certain capital accounts on the financial statements.
As of period end, the federal tax cost of investments and the components of distributable earnings on a tax-basis were as follows:
| Federal tax cost of investments | $ | 2,263,644,486 | |
| Gross tax appreciation of investments | $ | 183,725,096 | |
| Gross tax depreciation of investments | (217,646,211 | ) | |
| Net tax appreciation (depreciation) of investments | (33,921,115 | ) | |
| Net tax appreciation (depreciation) on translation of assets and liabilities in foreign currencies | (11,334 | ) | |
| Net tax appreciation (depreciation) | $ | (33,932,449 | ) |
| Undistributed ordinary income | $ | 13,038,877 | |
| Accumulated short-term capital losses | $ | (138,201,902 | ) |
The difference between book-basis and tax-basis unrealized appreciation (depreciation) is attributable
primarily to the tax deferral of losses on wash sales.
Accumulated capital losses represent net capital loss carryovers that may be used to offset future realized
capital gains for federal income tax purposes. The capital loss carryovers may be carried forward for an
unlimited period. Future capital loss carryover utilization in any given year may be subject to Internal Revenue
Code limitations.
23
| Financial Highlights |
| For a Share Outstanding Throughout the Years Ended November 30 (except as noted) | |||||||||||||||||
| Per-Share Data | Ratios and Supplemental Data | ||||||||||||||||
| Income From Investment Operations: | Distributions From: | Ratio to Average Net Assets of: | |||||||||||||||
| Net Asset Value, Beginning of Period | Net Investment Income (Loss)(1) | Net Realized and Unrealized Gain (Loss) | Total From Investment Operations | Net Investment Income | Net Realized Gains | Total Distributions | Net Asset Value, End of Period | Total Return(2) | Operating Expenses | Operating Expenses (before expense waiver) | Net Investment Income (Loss) | Net Investment Income (Loss) (before expense waiver) | Portfolio Turnover Rate | Net Assets, End of Period (in thousands) | |||
| Investor Class | |||||||||||||||||
| 2018 | $12.00 | 0.08 | (1.80) | (1.72) | (0.03) | (0.06) | (0.09) | $10.19 | (14.57)% | 1.18% | 1.29% | 0.71% | 0.60% | 36% | $980,765 | ||
| 2017 | $8.57 | 0.02 | 3.44 | 3.46 | (0.03) | — | (0.03) | $12.00 | 40.46% | 1.18% | 1.50% | 0.19% | (0.13)% | 47% | $883,436 | ||
| 2016 | $8.10 | 0.02 | 0.46 | 0.48 | (0.01) | — | (0.01) | $8.57 | 5.95% | 1.38% | 1.63% | 0.30% | 0.05% | 59% | $470,280 | ||
| 2015 | $9.00 | 0.03 | (0.92) | (0.89) | (0.01) | — | (0.01) | $8.10 | (9.93)% | 1.43% | 1.68% | 0.30% | 0.05% | 58% | $399,694 | ||
| 2014 | $8.87 | 0.03 | 0.13 | 0.16 | (0.03) | — | (0.03) | $9.00 | 1.84% | 1.45% | 1.70% | 0.29% | 0.04% | 74% | $393,357 | ||
| I Class | |||||||||||||||||
| 2018 | $12.32 | 0.11 | (1.85) | (1.74) | (0.06) | (0.06) | (0.12) | $10.46 | (14.35)% | 0.98% | 1.09% | 0.91% | 0.80% | 36% | $897,336 | ||
| 2017 | $8.79 | 0.04 | 3.54 | 3.58 | (0.05) | — | (0.05) | $12.32 | 40.86% | 0.94% | 1.26% | 0.43% | 0.11% | 47% | $505,000 | ||
| 2016 | $8.31 | 0.04 | 0.47 | 0.51 | (0.03) | — | (0.03) | $8.79 | 6.13% | 1.18% | 1.43% | 0.50% | 0.25% | 59% | $37,036 | ||
| 2015 | $9.24 | 0.02 | (0.93) | (0.91) | (0.02) | — | (0.02) | $8.31 | (9.83)% | 1.23% | 1.48% | 0.50% | 0.25% | 58% | $4,797 | ||
| 2014 | $9.09 | 0.05 | 0.14 | 0.19 | (0.04) | — | (0.04) | $9.24 | 2.07% | 1.25% | 1.50% | 0.49% | 0.24% | 74% | $16,300 | ||
| Y Class | |||||||||||||||||
| 2018 | $12.34 | 0.08 | (1.81) | (1.73) | (0.06) | (0.06) | (0.12) | $10.49 | (14.23)% | 0.83% | 0.94% | 1.06% | 0.95% | 36% | $4,724 | ||
2017(3) | $9.79 | 0.07 | 2.48 | 2.55 | — | — | — | $12.34 | 26.05% | 0.77%(4) | 1.12%(4) | 0.91%(4) | 0.56%(4) | 47%(5) | $6 | ||
| For a Share Outstanding Throughout the Years Ended November 30 (except as noted) | |||||||||||||||||
| Per-Share Data | Ratios and Supplemental Data | ||||||||||||||||
| Income From Investment Operations: | Distributions From: | Ratio to Average Net Assets of: | |||||||||||||||
| Net Asset Value, Beginning of Period | Net Investment Income (Loss)(1) | Net Realized and Unrealized Gain (Loss) | Total From Investment Operations | Net Investment Income | Net Realized Gains | Total Distributions | Net Asset Value, End of Period | Total Return(2) | Operating Expenses | Operating Expenses (before expense waiver) | Net Investment Income (Loss) | Net Investment Income (Loss) (before expense waiver) | Portfolio Turnover Rate | Net Assets, End of Period (in thousands) | |||
| A Class | |||||||||||||||||
| 2018 | $11.57 | 0.05 | (1.75) | (1.70) | — | (0.06) | (0.06) | $9.81 | (14.80)% | 1.43% | 1.54% | 0.46% | 0.35% | 36% | $72,711 | ||
| 2017 | $8.26 | —(6) | 3.32 | 3.32 | (0.01) | — | (0.01) | $11.57 | 40.16% | 1.43% | 1.75% | (0.06)% | (0.38)% | 47% | $61,586 | ||
| 2016 | $7.82 | 0.01 | 0.43 | 0.44 | — | — | — | $8.26 | 5.63% | 1.63% | 1.88% | 0.05% | (0.20)% | 59% | $37,743 | ||
| 2015 | $8.70 | 0.01 | (0.89) | (0.88) | — | — | — | $7.82 | (10.11)% | 1.68% | 1.93% | 0.05% | (0.20)% | 58% | $25,632 | ||
| 2014 | $8.59 | 0.01 | 0.12 | 0.13 | (0.02) | — | (0.02) | $8.70 | 1.59% | 1.70% | 1.95% | 0.04% | (0.21)% | 74% | $9,278 | ||
| C Class | |||||||||||||||||
| 2018 | $10.61 | (0.03) | (1.59) | (1.62) | — | (0.06) | (0.06) | $8.93 | (15.39)% | 2.18% | 2.29% | (0.29)% | (0.40)% | 36% | $31,871 | ||
| 2017 | $7.63 | (0.08) | 3.06 | 2.98 | — | — | — | $10.61 | 39.06% | 2.16% | 2.48% | (0.79)% | (1.11)% | 47% | $24,972 | ||
| 2016 | $7.28 | (0.05) | 0.40 | 0.35 | — | — | — | $7.63 | 4.81% | 2.38% | 2.63% | (0.70)% | (0.95)% | 59% | $5,840 | ||
| 2015 | $8.15 | (0.05) | (0.82) | (0.87) | — | — | — | $7.28 | (10.67)% | 2.43% | 2.68% | (0.70)% | (0.95)% | 58% | $3,149 | ||
| 2014 | $8.09 | (0.06) | 0.13 | 0.07 | (0.01) | — | (0.01) | $8.15 | 0.82% | 2.45% | 2.70% | (0.71)% | (0.96)% | 74% | $3,129 | ||
| For a Share Outstanding Throughout the Years Ended November 30 (except as noted) | |||||||||||||||||
| Per-Share Data | Ratios and Supplemental Data | ||||||||||||||||
| Income From Investment Operations: | Distributions From: | Ratio to Average Net Assets of: | |||||||||||||||
| Net Asset Value, Beginning of Period | Net Investment Income (Loss)(1) | Net Realized and Unrealized Gain (Loss) | Total From Investment Operations | Net Investment Income | Net Realized Gains | Total Distributions | Net Asset Value, End of Period | Total Return(2) | Operating Expenses | Operating Expenses (before expense waiver) | Net Investment Income (Loss) | Net Investment Income (Loss) (before expense waiver) | Portfolio Turnover Rate | Net Assets, End of Period (in thousands) | |||
| R Class | |||||||||||||||||
| 2018 | $11.64 | 0.02 | (1.75) | (1.73) | — | (0.06) | (0.06) | $9.85 | (14.97)% | 1.68% | 1.79% | 0.21% | 0.10% | 36% | $5,825 | ||
| 2017 | $8.33 | (0.02) | 3.33 | 3.31 | — | — | — | $11.64 | 39.74% | 1.68% | 2.00% | (0.31)% | (0.63)% | 47% | $4,811 | ||
| 2016 | $7.90 | (0.02) | 0.45 | 0.43 | — | — | — | $8.33 | 5.44% | 1.88% | 2.13% | (0.20)% | (0.45)% | 59% | $2,340 | ||
| 2015 | $8.82 | (0.02) | (0.90) | (0.92) | — | — | — | $7.90 | (10.43)% | 1.93% | 2.18% | (0.20)% | (0.45)% | 58% | $1,425 | ||
| 2014 | $8.72 | (0.02) | 0.14 | 0.12 | (0.02) | — | (0.02) | $8.82 | 1.38% | 1.95% | 2.20% | (0.21)% | (0.46)% | 74% | $1,712 | ||
| R5 Class | |||||||||||||||||
| 2018 | $12.32 | 0.12 | (1.86) | (1.74) | (0.05) | (0.06) | (0.11) | $10.47 | (14.33)% | 0.98% | 1.09% | 0.91% | 0.80% | 36% | $4,521 | ||
2017(3) | $9.78 | 0.03 | 2.51 | 2.54 | — | — | — | $12.32 | 25.97% | 0.92%(4) | 1.27%(4) | 0.78%(4) | 0.43%(4) | 47%(5) | $46 | ||
| R6 Class | |||||||||||||||||
| 2018 | $12.34 | 0.12 | (1.84) | (1.72) | (0.08) | (0.06) | (0.14) | $10.48 | (14.28)% | 0.83% | 0.94% | 1.06% | 0.95% | 36% | $239,031 | ||
| 2017 | $8.81 | 0.06 | 3.53 | 3.59 | (0.06) | — | (0.06) | $12.34 | 40.98% | 0.83% | 1.15% | 0.54% | 0.22% | 47% | $92,470 | ||
| 2016 | $8.33 | 0.06 | 0.46 | 0.52 | (0.04) | — | (0.04) | $8.81 | 6.27% | 1.03% | 1.28% | 0.65% | 0.40% | 59% | $34,065 | ||
| 2015 | $9.25 | 0.07 | (0.95) | (0.88) | (0.04) | — | (0.04) | $8.33 | (9.58)% | 1.08% | 1.33% | 0.65% | 0.40% | 58% | $24,965 | ||
| 2014 | $9.09 | —(6) | 0.20 | 0.20 | (0.04) | — | (0.04) | $9.25 | 2.23% | 1.10% | 1.35% | 0.64% | 0.39% | 74% | $15,174 | ||
| Notes to Financial Highlights | |
| (1) | Computed using average shares outstanding throughout the period. |
| (2) | Total returns are calculated based on the net asset value of the last business day and do not reflect applicable sales charges, if any. Total returns for periods less than one year are not annualized. |
| (3) | April 10, 2017 (commencement of sale) through November 30, 2017. |
| (4) | Annualized. |
| (5) | Portfolio turnover is calculated at the fund level. Percentage indicated was calculated for the year ended November 30, 2017. |
| (6) | Per-share amount was less than $0.005. |
See Notes to Financial Statements.
| Report of Independent Registered Public Accounting Firm |
To the Shareholders and the Board of Directors of American Century World Mutual Funds, Inc.:
Opinion on the Financial Statements and Financial Highlights
We have audited the accompanying statement of assets and liabilities, including the schedule of investments, of Emerging Markets Fund, one of the funds constituting the American Century World Mutual Funds, Inc. (the “Fund”), as of November 30, 2018, the related statement of operations for the year then ended, the statements of changes in net assets for each of the two years in the period then ended, the financial highlights for each of the five years in the period then ended, and the related notes. In our opinion, the financial statements and financial highlights present fairly, in all material respects, the financial position of Emerging Markets Fund of the American Century World Mutual Funds, Inc. as of November 30, 2018, the results of its operations for the year then ended, the changes in its net assets for each of the two years in the period then ended, and the financial highlights for each of the five years in the period then ended, in conformity with accounting principles generally accepted in the United States of America.
Basis for Opinion
These financial statements and financial highlights are the responsibility of the Fund's management. Our responsibility is to express an opinion on the Fund’s financial statements and financial highlights based on our audits. We are a public accounting firm registered with the Public Company Accounting Oversight Board (United States) (PCAOB) and are required to be independent with respect to the Fund in accordance with the U.S. federal securities laws and the applicable rules and regulations of the Securities and Exchange Commission and the PCAOB.
We conducted our audits in accordance with the standards of the PCAOB. Those standards require that we plan and perform the audit to obtain reasonable assurance about whether the financial statements and financial highlights are free of material misstatement, whether due to error or fraud. The Fund is not required to have, nor were we engaged to perform, an audit of its internal control over financial reporting. As part of our audits we are required to obtain an understanding of internal control over financial reporting but not for the purpose of expressing an opinion on the effectiveness of the Fund’s internal control over financial reporting. Accordingly, we express no such opinion.
Our audits included performing procedures to assess the risks of material misstatement of the financial statements and financial highlights, whether due to error or fraud, and performing procedures that respond to those risks. Such procedures included examining, on a test basis, evidence regarding the amounts and disclosures in the financial statements and financial highlights. Our audits also included evaluating the accounting principles used and significant estimates made by management, as well as evaluating the overall presentation of the financial statements and financial highlights. Our procedures included confirmation of securities owned as of November 30, 2018, by correspondence with the custodian and brokers; when replies were not received from brokers, we performed other auditing procedures. We believe that our audits provide a reasonable basis for our opinion.
DELOITTE & TOUCHE LLP
Kansas City, Missouri
January 17, 2019
We have served as the auditor of one or more American Century investment companies since 1997.
28
| Management |
The Board of Directors
The individuals listed below serve as directors of the funds. Each director will continue to serve in this capacity until death, retirement, resignation or removal from office. The board has adopted a mandatory retirement age for directors who are not “interested persons,” as that term is defined in the Investment Company Act (independent directors). Independent directors shall retire by December 31 of the year in which they reach their 75th birthday.
Mr. Thomas is an “interested person” because he currently serves as President and Chief Executive Officer of American Century Companies, Inc. (ACC), the parent company of American Century Investment Management, Inc. (ACIM or the advisor). The other directors (more than three-fourths of the total number) are independent. They are not employees, directors or officers of, and have no financial interest in, ACC or any of its wholly owned, direct or indirect, subsidiaries, including ACIM, American Century Investment Services, Inc. (ACIS) and American Century Services, LLC (ACS), and they do not have any other affiliations, positions or relationships that would cause them to be considered “interested persons” under the Investment Company Act. The directors serve in this capacity for seven (in the case of Jonathan S. Thomas, 16; and Stephen E. Yates, 8) registered investment companies in the American Century Investments family of funds.
The following table presents additional information about the directors. The mailing address for each director is 4500 Main Street, Kansas City, Missouri 64111.
| Name (Year of Birth) | Position(s) Held with Funds | Length of Time Served | Principal Occupation(s) During Past 5 Years | Number of American Century Portfolios Overseen by Director | Other Directorships Held During Past 5 Years |
| Independent Directors | |||||
| Thomas W. Bunn (1953) | Director | Since 2017 | Retired | 68 | SquareTwo Financial; Barings (formerly Babson Capital Funds Trust) (2013 to 2016) |
| Barry Fink (1955) | Director | Since 2012 (independent since 2016) | Retired; Executive Vice President, ACC (2007 to 2013); President, ACS (2007 to 2013) | 68 | None |
| Jan M. Lewis (1957) | Director | Since 2011 | Retired; President and Chief Executive Officer, Catholic Charities of Northeast Kansas (human services organization) (2006 to 2013) | 68 | None |
M. Jeannine Strandjord(1) (1945) | Director | Since 1994 | Self-employed Consultant | 68 | Euronet Worldwide Inc. and MGP Ingredients, Inc. |
29
| Name (Year of Birth) | Position(s) Held with Funds | Length of Time Served | Principal Occupation(s) During Past 5 Years | Number of American Century Portfolios Overseen by Director | Other Directorships Held During Past 5 Years |
| Independent Directors | |||||
| John R. Whitten (1946) | Director | Since 2008 | Retired | 68 | Rudolph Technologies, Inc. |
| Stephen E. Yates (1948) | Director and Chairman of the Board | Since 2012 (Chairman since 2018) | Retired | 73 | None |
| Interested Director | |||||
| Jonathan S. Thomas (1963) | Director and President | Since 2007 | President and Chief Executive Officer, ACC (2007 to present). Also serves as Chief Executive Officer, ACS; Executive Vice President, ACIM; Director, ACC, ACIM and other ACC subsidiaries | 118 | BioMed Valley Discoveries, Inc. |
(1) Effective December 31, 2018, M. Jeannine Strandjord retired from the Board of Directors.
The Statement of Additional Information has additional information about the fund's directors and is available without charge, upon request, by calling 1-800-345-2021.
30
Officers
The following table presents certain information about the executive officers of the funds. Each officer serves as an officer for each of the 16 (in the case of Robert J. Leach, 15) investment companies in the American Century family of funds. No officer is compensated for his or her service as an officer of the funds. The listed officers are interested persons of the funds and are appointed or re-appointed on an annual basis. The mailing address for each officer listed below is 4500 Main Street, Kansas City, Missouri 64111.
| Name (Year of Birth) | Offices with the Funds | Principal Occupation(s) During the Past Five Years |
| Jonathan S. Thomas (1963) | Director and President since 2007 | President and Chief Executive Officer, ACC (2007 to present). Also serves as Chief Executive Officer, ACS; Executive Vice President, ACIM; Director, ACC, ACIM and other ACC subsidiaries |
| R. Wes Campbell (1974) | Chief Financial Officer and Treasurer since 2018 | Investment Operations and Investment Accounting, ACS (2000 to present) |
| Amy D. Shelton (1964) | Chief Compliance Officer and Vice President since 2014 | Chief Compliance Officer, American Century funds, (2014 to present); Chief Compliance Officer, ACIM (2014 to present); Chief Compliance Officer, ACIS (2009 to present); Vice President, Client Interactions and Marketing, ACIS (2013 to 2014). Also serves as Vice President, ACIS |
| Charles A. Etherington (1957) | General Counsel since 2007 and Senior Vice President since 2006 | Attorney, ACC (1994 to present); Vice President, ACC (2005 to present); General Counsel, ACC (2007 to present). Also serves as General Counsel, ACIM, ACS, ACIS and other ACC subsidiaries; and Senior Vice President, ACIM and ACS |
| C. Jean Wade (1964) | Vice President since 2012 | Senior Vice President, ACS (2017 to present); Vice President, ACS (2000 to 2017) |
| Robert J. Leach (1966) | Vice President since 2006 | Vice President, ACS (2000 to present) |
| David H. Reinmiller (1963) | Vice President since 2000 | Attorney, ACC (1994 to present). Also serves as Vice President, ACIM and ACS |
| Ward D. Stauffer (1960) | Secretary since 2005 | Attorney, ACC (2003 to present) |
31
| Approval of Management Agreement |
At a meeting held on June 28, 2018, the Fund’s Board of Directors (the "Board") unanimously approved the renewal of the management agreement pursuant to which American Century Investment Management, Inc. (the “Advisor”) acts as the investment advisor for the Fund. Under Section 15(c) of the Investment Company Act, contracts for investment advisory services are required to be reviewed, evaluated, and approved by a majority of a fund’s directors (the “Directors”), including a majority of the independent Directors, each year.
Prior to its consideration of the renewal of the management agreement, the Directors requested and reviewed extensive data and information compiled by the Advisor and certain independent providers of evaluation data concerning the Fund and the services provided to the Fund by the Advisor. This review was in addition to the oversight and evaluation undertaken by the Board and its committees on a continual basis and the information received was supplemental to the extensive information that the Board and its committees receive and consider throughout the year. The Directors also conducted a review of the process by which the Board considers the renewal of the management agreements. The Board consulted with industry experts and reviewed industry best practices and recent judicial precedent. The Directors believe that the enhancements resulting from their review resulted in increased dialogue with the Advisor and an improved process for fund shareholders.
In connection with its consideration of the renewal of the management agreement, the Board’s review and evaluation of the services provided by the Advisor included, but was not limited to, the following:
| • | the nature, extent, and quality of investment management, shareholder services, and other services provided and to be provided to the Fund; |
| • | the wide range of other programs and services provided and to be provided to the Fund and its shareholders on a routine and non-routine basis; |
| • | the investment performance of the Fund, including data comparing the Fund's performance to appropriate benchmarks and/or a peer group of other mutual funds with similar investment objectives and strategies; |
| • | the cost of owning the Fund compared to the cost of owning similar funds; |
| • | the compliance policies, procedures, and regulatory experience of the Advisor and the Fund's service providers; |
| • | financial data showing the cost of services provided to the Fund, the profitability of the Fund to the Advisor, and the overall profitability of the Advisor |
| • | strategic plans of the Advisor; |
| • | any economies of scale associated with the Advisor’s management of the Fund and other accounts; |
| • | services provided and charges to the Advisor's other investment management clients; |
| • | acquired fund fees and expenses; |
| • | payments and practices in connection with financial intermediaries holding shares of the Fund and the services provided by intermediaries in connection therewith; and |
| • | any collateral benefits derived by the Advisor from the management of the Fund. |
The Directors held two in-person meetings and one telephonic meeting to review and discuss the information provided. The independent Directors also reviewed responses to supplemental information requests provided by the Directors to the Advisor and held active discussions with the Advisor regarding the renewal of the management agreement. The independent Directors had the benefit of the advice of their independent counsel throughout the process.
32
Factors Considered
The Directors considered all of the information provided by the Advisor, the independent data providers, and independent counsel in connection with the approval. They determined that the information was sufficient for them to evaluate the management agreement for the Fund. In connection with their review, the Directors did not identify any single factor as being all-important or controlling, and each Director may have attributed different levels of importance to different factors. In deciding to renew the management agreement, the Board based its decision on a number of factors, including without limitation the following:
Nature, Extent and Quality of Services - Generally. Under the management agreement, the Advisor is responsible for providing or arranging for all services necessary for the operation of the Fund. The Board noted that the Advisor provides or arranges at its own expense a wide variety of services including without limitation the following:
| • | portfolio research and security selection |
| • | securities trading |
| • | Fund administration |
| • | custody of Fund assets |
| • | daily valuation of the Fund’s portfolio |
| • | shareholder servicing and transfer agency, including shareholder confirmations, recordkeeping, and communications |
| • | legal services (except the independent Directors’ counsel) |
| • | regulatory and portfolio compliance |
| • | financial reporting |
| • | marketing and distribution (except amounts paid by the Fund under Rule 12b-1 plans) |
The Board noted that many of these services have expanded over time in terms of both quantity and complexity in response to shareholder demands, competition in the industry, changing distribution channels, and the changing regulatory environment.
Investment Management Services. The nature of the investment management services provided to the Fund is quite complex and allows Fund shareholders access to professional money management, instant diversification of their investments within an asset class, the opportunity to easily diversify among asset classes by investing in or exchanging among various American Century Investments funds, and liquidity. In evaluating investment performance, the Board expects the Advisor to manage the Fund in accordance with its investment objectives and approved strategies. Further, the Directors recognize that the Advisor has an obligation to monitor trading activities, and in particular to seek the best execution of fund trades, and to evaluate the use of and payment for research. In providing these services, the Advisor utilizes teams of investment professionals (portfolio managers, analysts, research assistants, and securities traders) who require extensive information technology, research, training, compliance, and other systems to conduct their business. The Board, directly and through its Fund Performance Review Committee, provides oversight of the investment performance process. It regularly reviews investment performance information for the Fund, together with comparative information for appropriate benchmarks and/or peer groups of similarly-managed funds, over different time horizons. The Directors also review detailed performance information provided by the Advisor during the management agreement renewal process. If performance concerns are identified, the Fund receives special reviews until performance improves, during which the Board receives a report from the Advisor regarding the reasons for such results (e.g., market conditions, security selection) and any efforts being undertaken to improve performance. The Fund’s performance was above its benchmark for the one-, three-, five-, and ten-year periods reviewed by the Board. The Board found the investment management services provided by the Advisor to the Fund to be satisfactory and consistent with the management agreement.
33
Shareholder and Other Services. Under the management agreement, the Advisor provides the Fund with a comprehensive package of transfer agency, shareholder, and other services. The Board, directly and through various committees of the Board, regularly reviews reports and evaluations of such services at its regular meetings. These reports include, but are not limited to, information regarding the operational efficiency and accuracy of the shareholder and transfer agency services provided, staffing levels, shareholder satisfaction (as measured by external as well as internal sources), technology support, new products and services offered to Fund shareholders, securities trading activities, portfolio valuation services, auditing services, and legal and operational compliance activities. The Board found the services provided by the Advisor to the Fund under the management agreement to be competitive and of high quality.
Costs of Services and Profitability. The Advisor provides detailed information concerning its cost of providing various services to the Fund, its profitability in managing the Fund (pre- and post-distribution), its overall profitability, and its financial condition. The Directors have reviewed with the Advisor the methodology used to prepare this financial information. This information is considered in evaluating the Advisor’s financial condition, its ability to continue to provide services under the management agreement, and the reasonableness of the current management fee. The Board concluded that the Advisor’s profits were reasonable in light of the services provided to the Fund.
Ethics. The Board generally considers the Advisor’s commitment to providing quality services to shareholders and to conducting its business ethically. They noted that the Advisor’s practices generally meet or exceed industry best practices.
Economies of Scale. The Board also reviewed information provided by the Advisor regarding the possible existence of economies of scale in connection with the management of the Fund. The Board concluded that economies of scale are difficult to measure and predict with precision, especially on a fund-by-fund basis. The Board concluded that the Advisor is appropriately sharing economies of scale through its competitive fee structure, offering competitive fees from fund inception, and through reinvestment in its business to provide shareholders additional content and services.
Comparison to Other Funds’ Fees. The management agreement provides that the Fund pays the Advisor a single, all-inclusive (or unified) management fee for providing all services necessary for the management and operation of the Fund, other than brokerage expenses, expenses attributable to short sales, taxes, interest, extraordinary expenses, and the fees and expenses of the Fund’s independent Directors (including their independent legal counsel) and expenses incurred in connection with the provision of shareholder services and distribution services under a plan adopted pursuant to Rule 12b-1 under the 1940 Act. Under the unified fee structure, the Advisor is responsible for providing all investment advisory, custody, audit, administrative, compliance, recordkeeping, marketing and shareholder services, or arranging and supervising third parties to provide such services. By contrast, most other funds are charged a variety of fees, including an investment advisory fee, a transfer agency fee, an administrative fee, distribution charges, and other expenses. Other than their investment advisory fees and any applicable Rule 12b-1 distribution fees, all other components of the total fees charged by these other funds may be increased without shareholder approval. The Board believes the unified fee structure is a benefit to Fund shareholders because it clearly discloses to shareholders the cost of owning Fund shares, and, since the unified fee cannot be increased without a vote of Fund shareholders, it shifts to the Advisor the risk of increased costs of operating the Fund and provides a direct incentive to minimize administrative inefficiencies. Part of the Board’s analysis of fee levels involves reviewing certain evaluative data compiled by an independent provider comparing the Fund’s unified fee to the total expense ratios of its peers. The unified fee charged to shareholders of the Fund was below the median of the total expense ratios of the Fund’s peer expense universe. The Board concluded that the management fee paid by the Fund to the Advisor under the management agreement is reasonable in light of the services provided to the Fund.
34
Comparison to Fees and Services Provided to Other Clients of the Advisor. The Directors also requested and received information from the Advisor concerning the nature of the services, fees, costs, and profitability of its advisory services to advisory clients other than the Fund. They observed that these varying types of client accounts require different services and involve different regulatory and entrepreneurial risks than the management of the Fund. The Board analyzed this information and concluded that the fees charged and services provided to the Fund were reasonable by comparison.
Payments to Intermediaries. The Directors also requested and received a description of payments made to intermediaries by the Fund and the Advisor and services provided in response thereto. These payments include various payments made by the Fund or the Advisor to different types of intermediaries and recordkeepers for distribution and service activities provided for the Fund. The Board reviewed such information and received representations from the Advisor that all such payments by the Fund were made pursuant to the Fund's Rule 12b-1 Plan and that all such payments by the Advisor were made from the Advisor’s resources and reasonable profits. The Board found the payments to be reasonable in scope and purpose.
Collateral or “Fall-Out” Benefits Derived by the Advisor. The Board considered the existence of collateral benefits the Advisor may receive as a result of its relationship with the Fund. They concluded that the Advisor’s primary business is managing mutual funds and it generally does not use fund or shareholder information to generate profits in other lines of business, and therefore does not derive any significant collateral benefits from them. The Board noted that additional assets from other clients may offer the Advisor some benefit from increased leverage with service providers and counterparties. Additionally, the Advisor may receive proprietary research from broker-dealers that execute fund portfolio transactions, which the Board concluded is likely to benefit other clients of the Advisor, as well as Fund shareholders. The Board also determined that the Advisor is able to provide investment management services to certain clients other than the Fund, at least in part, due to its existing infrastructure built to serve the fund complex. The Board concluded that appropriate allocation methodologies had been employed to assign resources and the cost of those resources to these other clients and, where expressly provided, these other client assets may be included with the assets of the Fund to determine breakpoints in the management fee schedule.
Existing Relationship. The Board also considered whether there was any reason for not continuing the existing arrangement with the Advisor. In this regard, the Board was mindful of the potential disruptions of the Fund’s operations and various risks, uncertainties, and other effects that could occur as a result of a decision not to continue such relationship. In particular, the Board recognized that most shareholders have invested in the Fund on the strength of the Advisor’s industry standing and reputation and in the expectation that the Advisor will have a continuing role in providing advisory services to the Fund.
Conclusion of the Directors. As a result of this process, the Board, including all of the independent Directors, taking into account all of the factors discussed above and the information provided by the Advisor and others in connection with its review and throughout the year, determined that the management fee is fair and reasonable in light of the services provided and that the investment management agreement between the Fund and the Advisor should be renewed.
35
| Additional Information |
Retirement Account Information
As required by law, distributions you receive from certain retirement accounts are subject to federal income tax withholding, unless you elect not to have withholding apply*. Tax will be withheld on the total amount withdrawn even though you may be receiving amounts that are not subject to withholding, such as nondeductible contributions. In such case, excess amounts of withholding could occur. You may adjust your withholding election so that a greater or lesser amount will be withheld.
If you don’t want us to withhold on this amount, you must notify us to not withhold the federal income tax. You may notify us in writing or in certain situations by telephone or through other electronic means. For systematic withdrawals, your withholding election will remain in effect until revoked or changed by filing a new election. You have the right to revoke your election at any time and change your withholding percentage for future distributions.
Remember, even if you elect not to have income tax withheld, you are liable for paying income tax on the taxable portion of your withdrawal. If you elect not to have income tax withheld or you don’t have enough income tax withheld, you may be responsible for payment of estimated tax. You may incur penalties under the estimated tax rules if your withholding and estimated tax payments are not sufficient. You can reduce or defer the income tax on a distribution by directly or indirectly rolling such distribution over to another IRA or eligible plan. You should consult your tax advisor for additional information.
State tax will be withheld if, at the time of your distribution, your address is within one of the mandatory withholding states and you have federal income tax withheld (or as otherwise required by state law). State taxes will be withheld from your distribution in accordance with the respective state rules.
*Some 403(b), 457 and qualified retirement plan distributions may be subject to 20% mandatory withholding, as they are subject to special tax and withholding rules. Your plan administrator or plan sponsor is required to provide you with a special tax notice explaining those rules at the time you request a distribution. If applicable, federal and/or state taxes may be withheld from your distribution amount.
Proxy Voting Policies
A description of the policies that the fund's investment advisor uses in exercising the voting rights associated with the securities purchased and/or held by the fund is available without charge, upon request, by calling 1-800-345-2021. It is also available on the "About Us" page of American Century Investments’ website at americancentury.com and on the Securities and Exchange Commission’s website at sec.gov. Information regarding how the investment advisor voted proxies relating to portfolio securities during the most recent 12-month period ended June 30 is available on the "About Us" page at americancentury.com. It is also available at sec.gov.
Quarterly Portfolio Disclosure
The fund files its complete schedule of portfolio holdings with the Securities and Exchange Commission (SEC) for the first and third quarters of each fiscal year on Form N-Q. The fund’s Forms N-Q are available on the SEC’s website at sec.gov. The fund also makes its complete schedule of portfolio holdings for the most recent quarter of its fiscal year available on its website at americancentury.com and, upon request, by calling 1-800-345-2021.
36
Other Tax Information
The following information is provided pursuant to provisions of the Internal Revenue Code.
The fund hereby designates up to the maximum amount allowable as qualified dividend income for the fiscal year ended November 30, 2018.
The fund hereby designates $11,369,606, or up to the maximum amount allowable, as long-term
capital gain distributions (20% rate gain distributions) for the fiscal year ended November 30, 2018.
For the fiscal year ended November 30, 2018, the fund intends to pass through to shareholders foreign source income of $48,471,629 and foreign taxes paid of $5,564,788, or up to the maximum amount allowable, as a foreign tax credit. Foreign source income and foreign tax expense per outstanding share on November 30, 2018 are $0.2230 and $0.0256, respectively.
37
| Notes |
38
| Notes |
39
| Notes |
40
 | ||
| Contact Us | americancentury.com | |
| Automated Information Line | 1-800-345-8765 | |
| Investor Services Representative | 1-800-345-2021 or 816-531-5575 | |
| Investors Using Advisors | 1-800-378-9878 | |
| Business, Not-For-Profit, Employer-Sponsored Retirement Plans | 1-800-345-3533 | |
| Banks and Trust Companies, Broker-Dealers, Financial Professionals, Insurance Companies | 1-800-345-6488 | |
| Telecommunications Relay Service for the Deaf | 711 | |
| American Century World Mutual Funds, Inc. | ||
Investment Advisor: American Century Investment Management, Inc. Kansas City, Missouri | ||
| This report and the statements it contains are submitted for the general information of our shareholders. The report is not authorized for distribution to prospective investors unless preceded or accompanied by an effective prospectus. | ||
| ©2019 American Century Proprietary Holdings, Inc. All rights reserved. CL-ANN-91030 1901 | ||
| Annual Report | |
| November 30, 2018 | |
| Emerging Markets Small Cap Fund | |
| Investor Class (AECVX) | |
| I Class (AECSX) | |
| A Class (AECLX) | |
| C Class (AECHX) | |
| R Class (AECMX) | |
| R6 Class (AECTX) | |
Beginning on January 1, 2021, as permitted by regulations adopted by the Securities and Exchange Commission, paper copies of the fund’s shareholder reports like this one will no longer be sent by mail, unless you specifically request paper copies of the reports from the fund or from your financial intermediary, such as a broker-dealer or bank. Instead, the reports will be made available on a website, and you will be notified by mail each time a report is posted and provided with a website link to access the report.
If you already elected to receive shareholder reports electronically, you will not be affected by this change and you need not take any action. You may elect to receive shareholder reports and other communications from the fund or your financial intermediary electronically by calling or sending an email request to your appropriate contacts as listed on the back cover of this report.
You may elect to receive all future reports in paper free of charge. You can inform the fund or your financial intermediary that you wish to continue receiving paper copies of your shareholder reports by calling or sending an email request to your appropriate contacts as listed on the back cover of this report. Your election to receive reports in paper will apply to all funds held with the fund complex/your financial intermediary.
| Table of Contents |
| President’s Letter | |
| Performance | |
| Portfolio Commentary | |
| Fund Characteristics | |
| Shareholder Fee Example | |
| Schedule of Investments | |
| Statement of Assets and Liabilities | |
| Statement of Operations | |
| Statement of Changes in Net Assets | |
| Notes to Financial Statements | |
| Financial Highlights | |
| Report of Independent Registered Public Accounting Firm | |
| Management | |
| Approval of Management Agreement | |
| Additional Information | |
Any opinions expressed in this report reflect those of the author as of the date of the report, and do not necessarily represent the opinions of American Century Investments® or any other person in the American Century Investments organization. Any such opinions are subject to change at any time based upon market or other conditions and American Century Investments disclaims any responsibility to update such opinions. These opinions may not be relied upon as investment advice and, because investment decisions made by American Century Investments funds are based on numerous factors, may not be relied upon as an indication of trading intent on behalf of any American Century Investments fund. Security examples are used for representational purposes only and are not intended as recommendations to purchase or sell securities. Performance information for comparative indices and securities is provided to American Century Investments by third party vendors. To the best of American Century Investments’ knowledge, such information is accurate at the time of printing.
| President’s Letter |
Jonathan ThomasDear Investor:
Thank you for reviewing this annual report for the 12 months ended November 30, 2018. Annual reports help convey important information about fund returns, including market factors that affected performance during the reporting period. For additional investment and market insights, please visit our website, americancentury.com.
Global Growth Divergence Drives Disparity in Stock Returns
The synchronization of global economic growth, which helped deliver robust gains for global stocks in 2017, unraveled as the 12-month period unfolded. The U.S. economy continued to expand at a healthy pace, but other regions experienced notable slowdowns. Similarly, stocks advanced in the U.S. but generally declined elsewhere.
In Europe, the threat of global tariffs from the U.S. dampened business sentiment and corporate earnings growth. In addition, uncertainties surrounding Brexit negotiations, Italy’s fiscal woes, and civil unrest in France weighed on economic and earnings growth outlooks and stock performance. Meanwhile, Japan’s economy contracted late in the period, largely due to the effects of several natural disasters, which curtailed personal and business spending. Global trade tensions also pressured Japan’s growth outlook.
After starting strong, emerging markets stocks quickly reversed course. The key culprits included rising U.S. interest rates, U.S.-China tariffs, and global trade-policy uncertainty. In addition, a strong U.S. dollar, falling oil prices, and several country-specific events weighed on the asset class. Late in the period, prospects for a tariff truce between the U.S. and China, along with dovish comments from the Federal Reserve, sparked a November rally among emerging markets stocks.
Overall, U.S. stocks, as measured by the S&P 500 Index, returned 6.27% for the 12 months. Non-U.S. developed markets stocks, as measured by the MSCI EAFE Index, declined 7.94%. Emerging markets stocks, as measured by the MSCI Emerging Markets Index, fell 9.09%.
Looking ahead, investors face a backdrop of uneven global growth, heightened market volatility, and lingering geopolitical uncertainties. But it’s often these challenging markets that produce the most compelling investment opportunities. We believe this scenario underscores the importance of using professionally managed portfolios in pursuit of investment goals. We appreciate your continued trust and confidence in us.
Sincerely,
Jonathan Thomas
President and Chief Executive Officer
American Century Investments
2
| Performance |
| Total Returns as of November 30, 2018 | ||||
| Average Annual Returns | ||||
Ticker Symbol | 1 year | Since Inception | Inception Date | |
| Investor Class | AECVX | -13.59% | 6.81% | 4/7/16 |
| MSCI Emerging Markets Small Cap Index | — | -14.20% | 4.79% | — |
| I Class | AECSX | -13.39% | 7.04% | 4/7/16 |
| A Class | AECLX | 4/7/16 | ||
| No sales charge | -13.82% | 6.54% | ||
| With sales charge | -18.77% | 4.18% | ||
| C Class | AECHX | -14.41% | 5.75% | 4/7/16 |
| R Class | AECMX | -13.98% | 6.30% | 4/7/16 |
| R6 Class | AECTX | -13.25% | 7.19% | 4/7/16 |
Sales charges include initial sales charges and contingent deferred sales charges (CDSCs), as applicable. A Class shares have a 5.75% maximum initial sales charge and may be subject to a maximum CDSC of 1.00%. C Class shares redeemed within 12 months of purchase are subject to a maximum CDSC of 1.00%. The SEC requires that mutual funds provide performance information net of maximum sales charges in all cases where charges could be applied.
Data presented reflect past performance. Past performance is no guarantee of future results. Current performance may be higher or lower than the performance shown. Total returns for periods less than one year are not annualized. Investment return and principal value will fluctuate, and redemption value may be more or less than original cost. Data assumes reinvestment of dividends and capital gains, and none of the charts reflect the deduction of taxes that a shareholder would pay on fund distributions or the redemption of fund shares. To obtain performance data current to the most recent month end, please call 1-800-345-2021 or visit americancentury.com. For additional information about the fund, please consult the prospectus.
3
| Growth of $10,000 Over Life of Class |
| $10,000 investment made April 7, 2016 |
| Performance for other share classes will vary due to differences in fee structure. |
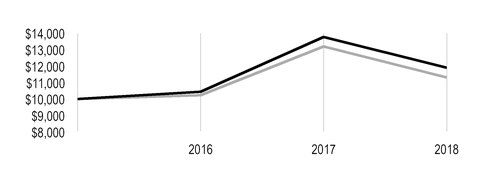
| Value on November 30, 2018 | |
| Investor Class — $11,906 | |
| MSCI Emerging Markets Small Cap Index — $11,319 | |
Total Annual Fund Operating Expenses | |||||
Investor Class | I Class | A Class | C Class | R Class | R6 Class |
| 1.64% | 1.44% | 1.89% | 2.64% | 2.14% | 1.29% |
The total annual fund operating expenses shown is as stated in the fund’s prospectus current as of the date of this report. The prospectus may vary from the expense ratio shown elsewhere in this report because it is based on a different time period, includes acquired fund fees and expenses, and, if applicable, does not include fee waivers or expense reimbursements.
Data presented reflect past performance. Past performance is no guarantee of future results. Current performance may be higher or lower than the performance shown. Total returns for periods less than one year are not annualized. Investment return and principal value will fluctuate, and redemption value may be more or less than original cost. Data assumes reinvestment of dividends and capital gains, and none of the charts reflect the deduction of taxes that a shareholder would pay on fund distributions or the redemption of fund shares. To obtain performance data current to the most recent month end, please call 1-800-345-2021 or visit americancentury.com. For additional information about the fund, please consult the prospectus.
4
| Portfolio Commentary |
Portfolio Managers: Patricia Ribeiro and Sherwin Soo
Performance Summary
Emerging Markets Small Cap returned -13.59%* for the 12 months ended November 30, 2018. The portfolio’s benchmark, the MSCI Emerging Markets Small Cap Index, returned -14.20% for the same period.
The fund outperformed its benchmark during the period, primarily due to positive stock selection in the consumer staples and financials sectors. Above-benchmark positions in both sectors also aided results. Conversely, investments in information technology limited relative gains, as did stock selection and an underweight exposure in utilities. Regionally, stock selection and underweight positions in South Korea and India lifted relative performance, while stock selection and an overweight in China hindered results. Holdings in Taiwan also detracted.
Consumer Staples Holdings Contributed
Consumer staples drove relative outperformance on a sector basis, due primarily to TCI Company, a manufacturer of dietary supplements and skincare products, and beverage and instant noodle manufacturer Uni-President China Holdings. We sold our position in TCI.
Shares of TCI rallied on new product development and capacity expansion. The company has benefited from strong consumer demand for health supplement products, especially in the drink segment. Uni-President China Holdings advanced on stronger-than-expected sales and earnings. Highlights included a surge in operating profits and margin expansion due to an improved product mix and higher selling prices.
The fund’s strong performance in the financials sector was driven by Capitec Bank Holdings and Itau CorpBanca. South Africa-based bank Capitec saw a jump in profits as the bank continues to consistently gain active clients. Itau posted strong year-over-year earnings due to higher revenues, lower provisions, and a solid balance-sheet position.
Notable individual contributors in the consumer discretionary sector included Fila Korea and Magazine Luiza. South Korea-based sporting goods company Fila Korea benefited from better-than-expected second-quarter operating profit results. Sales growth in the company’s high margin product lines contributed to margin gains, as did improving profitability in its domestic operations. The company reported an upbeat earnings outlook as operating profits and the company’s brand recognition continue to rise. Brazil-based retailer Magazine Luiza rallied on solid results driven by robust top-line growth. The company’s stock price was also supported by accelerated growth in online volume.
Stock Selection in the Information Technology Sector Detracted
Areas of relative weakness included the information technology sector, where integrated circuit manufacturer Macronix International, flexible printed circuit maker Career Technology MFG, and optical components manufacturer Sunny Optical Technology Group weighed on performance. We exited our positions in Macronix International and Sunny Optical Technology.
Asian equities suffered a brutal sell-off earlier this year amid negative headlines on deteriorating U.S.-China trade negotiations, a spike in global yields, and a strong U.S. dollar. Reported revenue
and sales results for Taiwan-based Macronix International came in below expectations in the third
*All fund returns referenced in this commentary are for Investor Class shares. Performance for other share classes will vary due to differences in fee structure; when Investor Class performance exceeds that of the fund's benchmark, other share classes may not. See page 3 for returns for all share classes.
5
quarter. We sold the position based on our expectations of continued margin compression due to decelerating pricing power and potential loss of market share. Shares of Taiwan-based Career Technology MFG fell during the period due primarily to sluggish new product sales from Apple (sales of Apple’s newest phones have been lower than expected) coupled with intensifying competition. Sunny Optical Technology Group’s stock price declined after reporting disappointing midyear results. The China-based company’s net profit margin declined on decreased gross profit margins of handset camera modules and lower vehicle lens shipments. Increased competition also weighed on investor sentiment.
The fund’s underperformance in the utilities sector was due primarily to Chinese sewage and reclaimed water treatment services conglomerate Beijing Enterprises Water Group, which missed earnings consensus earlier this year on slower new product development amid tightened government policies. We sold our position.
Notable individual detractors included Grupo Aeroportuario del Centro Norte, Brilliance China Automotive Holdings, and Wisdom Education International Holdings. Shares of Grupo Aeroportuario declined following the election of Mexico’s new president, Andres Manuel Lopez Obrador, over worries that the new government’s policies will disrupt operations. Brilliance China Automotive’s stock price sank after it agreed to give BMW control of their joint venture, weakening the Chinese carmaker’s exposure to future growth in the world’s largest automotive market. Meanwhile, shares of China-based educational service provider Wisdom Education International declined on increased regulatory risk. Unexpected updates to government regulations added uncertainty to the for-profit education sector in the second half of the year.
Outlook
We continue to believe the long-term case for emerging markets stocks remains strong. The recent cooling of expectations for future U.S. interest rate hikes and de-escalation of trade tensions between the U.S. and China are expected to provide support for emerging markets stock prices.
The fund continues to invest in companies where fundamentals are strong and improving but share price performance does not fully reflect these factors. Our process is based on individual security selection, but broad themes have emerged.
Geographically, China remains our largest overweight. We expect continued fiscal stimulus measures such as tax cuts and infrastructure spending to support a recovery in China’s economic growth, and as such, are positioned in the domestic market to benefit from rising household consumption.
Additionally, we remain overweight Brazil. We believe the 2018 elections provided a meaningful change in the direction of the country’s macroeconomic policy. Moving forward, we expect the Brazilian economy to accelerate without excessive inflation pressure and are positioned primarily in the private sector to benefit from the expected recovery in domestic demand.
Consumer discretionary is the largest relative sector position as of period-end. We remain positive on companies positioned for strengthening consumer demand for luxury, education, and higher standard of living purchases. The fund’s largest relative underweight positions as of the end of the period were real estate and utilities.
Finally, we meaningfully increased our financials position over the last year, shifting from a relative underweight to an overweight versus the benchmark. We are finding opportunities in banks and diversified financial services firms positioned to benefit from the increasing demand for banking, investment, and insurance services, which remain at low penetration levels relative to developed markets.
6
| Fund Characteristics |
| NOVEMBER 30, 2018 | |
Top Ten Holdings | % of net assets |
| Fila Korea Ltd. | 2.9% |
| Bangkok Chain Hospital PCL | 2.2% |
| Koh Young Technology, Inc. | 2.0% |
| Bata India Ltd. | 2.0% |
| Chailease Holding Co. Ltd. | 2.0% |
| Hyundai Mipo Dockyard Co. Ltd. | 2.0% |
| Bharat Financial Inclusion Ltd. | 1.8% |
| Capitec Bank Holdings Ltd. | 1.7% |
| Graphite India Ltd. | 1.7% |
| Mitra Adiperkasa Tbk PT | 1.7% |
Types of Investments in Portfolio | % of net assets |
| Common Stocks | 97.5% |
| Temporary Cash Investments | 2.5% |
| Other Assets and Liabilities | —* |
| * Category is less than 0.05% of total net assets. | |
Investments by Country | % of net assets |
| South Korea | 20.5% |
| China | 15.0% |
| India | 14.8% |
| Taiwan | 12.2% |
| Brazil | 7.1% |
| South Africa | 4.8% |
| Thailand | 4.7% |
| Indonesia | 3.7% |
| Philippines | 3.0% |
| Mexico | 2.9% |
| Chile | 2.1% |
| Other Countries | 6.7% |
| Cash and Equivalents* | 2.5% |
* Includes temporary cash investments and other assets and liabilities. | |
7
| Shareholder Fee Example |
Fund shareholders may incur two types of costs: (1) transaction costs, including sales charges (loads) on purchase payments and redemption/exchange fees; and (2) ongoing costs, including management fees; distribution and service (12b-1) fees; and other fund expenses. This example is intended to help you understand your ongoing costs (in dollars) of investing in your fund and to compare these costs with the ongoing cost of investing in other mutual funds.
The example is based on an investment of $1,000 made at the beginning of the period and held for the entire period from June 1, 2018 to November 30, 2018.
Actual Expenses
The table provides information about actual account values and actual expenses for each class. You may use the information, together with the amount you invested, to estimate the expenses that you paid over the period. First, identify the share class you own. Then simply divide your account value by $1,000 (for example, an $8,600 account value divided by $1,000 = 8.6), then multiply the result by the number under the heading “Expenses Paid During Period” to estimate the expenses you paid on your account during this period.
If you hold Investor Class shares of any American Century Investments fund, or I Class shares of the American Century Diversified Bond Fund, in an American Century Investments account (i.e., not a financial intermediary or retirement plan account), American Century Investments may charge you a $12.50 semiannual account maintenance fee if the value of those shares is less than $10,000. We will redeem shares automatically in one of your accounts to pay the $12.50 fee. In determining your total eligible investment amount, we will include your investments in all personal accounts (including American Century Investments Brokerage accounts) registered under your Social Security number. Personal accounts include individual accounts, joint accounts, UGMA/UTMA accounts, personal trusts, Coverdell Education Savings Accounts and IRAs (including traditional, Roth, Rollover, SEP-, SARSEP- and SIMPLE-IRAs), and certain other retirement accounts. If you have only business, business retirement, employer-sponsored or American Century Investments Brokerage accounts, you are currently not subject to this fee. If you are subject to the Account Maintenance Fee, your account value could be reduced by the fee amount.
Hypothetical Example for Comparison Purposes
The table also provides information about hypothetical account values and hypothetical expenses based on the actual expense ratio of each class of your fund and an assumed rate of return of 5% per year before expenses, which is not the actual return of a fund’s share class. The hypothetical account values and expenses may not be used to estimate the actual ending account balance or expenses you paid for the period. You may use this information to compare the ongoing costs of investing in your fund and other funds. To do so, compare this 5% hypothetical example with the 5% hypothetical examples that appear in the shareholder reports of the other funds.
Please note that the expenses shown in the table are meant to highlight your ongoing costs only and do not reflect any transactional costs, such as sales charges (loads) or redemption/exchange fees. Therefore, the table is useful in comparing ongoing costs only, and will not help you determine the relative total costs of owning different funds. In addition, if these transactional costs were included, your costs would have been higher.
8
| Beginning Account Value 6/1/18 | Ending Account Value 11/30/18 | Expenses Paid During Period(1) 6/1/18 - 11/30/18 | Annualized Expense Ratio(1) | |
Actual | ||||
| Investor Class | $1,000 | $829.40 | $7.34 | 1.60% |
| I Class | $1,000 | $830.80 | $6.43 | 1.40% |
| A Class | $1,000 | $828.60 | $8.48 | 1.85% |
| C Class | $1,000 | $825.40 | $11.90 | 2.60% |
| R Class | $1,000 | $827.90 | $9.62 | 2.10% |
| R6 Class | $1,000 | $831.00 | $5.74 | 1.25% |
| Hypothetical | ||||
| Investor Class | $1,000 | $1,017.05 | $8.09 | 1.60% |
| I Class | $1,000 | $1,018.05 | $7.08 | 1.40% |
| A Class | $1,000 | $1,015.79 | $9.35 | 1.85% |
| C Class | $1,000 | $1,012.03 | $13.11 | 2.60% |
| R Class | $1,000 | $1,014.54 | $10.61 | 2.10% |
| R6 Class | $1,000 | $1,018.80 | $6.33 | 1.25% |
| (1) | Expenses are equal to the class's annualized expense ratio listed in the table above, multiplied by the average account value over the period, multiplied by 183, the number of days in the most recent fiscal half-year, divided by 365, to reflect the one-half year period. Annualized expense ratio reflects actual expenses, including any applicable fee waivers or expense reimbursements and excluding any acquired fund fees and expenses. |
9
| Schedule of Investments |
NOVEMBER 30, 2018
| Shares | Value | ||||
| COMMON STOCKS — 97.5% | |||||
| Brazil — 7.1% | |||||
| Banco ABC Brasil SA Preference Shares | 24,776 | $ | 105,524 | ||
| Bradespar SA Preference Shares | 17,400 | 142,997 | |||
| Duratex SA | 31,800 | 100,655 | |||
| Fleury SA | 15,500 | 86,579 | |||
| Localiza Rent a Car SA | 19,000 | 132,219 | |||
| Magazine Luiza SA | 3,600 | 153,263 | |||
| 721,237 | |||||
| Chile — 2.1% | |||||
Geopark Ltd.(1) | 7,448 | 114,476 | |||
| Itau CorpBanca | 10,253,248 | 97,093 | |||
| 211,569 | |||||
| China — 15.0% | |||||
Anton Oilfield Services Group(1) | 902,000 | 112,955 | |||
Baozun, Inc. ADR(1) | 3,498 | 123,374 | |||
| Brilliance China Automotive Holdings Ltd. | 44,000 | 39,219 | |||
| China Agri-Industries Holdings Ltd. | 180,000 | 68,089 | |||
| China Everbright Greentech Ltd. | 177,000 | 133,768 | |||
| China Foods Ltd. | 168,000 | 74,302 | |||
| China Resources Cement Holdings Ltd. | 96,000 | 93,714 | |||
| Far East Horizon Ltd. | 139,000 | 138,781 | |||
GDS Holdings Ltd. ADR(1) | 4,273 | 126,011 | |||
KWG Group Holdings Ltd.(1) | 58,500 | 52,028 | |||
Li Ning Co. Ltd.(1) | 128,500 | 138,314 | |||
TAL Education Group ADR(1) | 3,357 | 94,231 | |||
| Uni-President China Holdings Ltd. | 165,000 | 150,787 | |||
| West China Cement Ltd. | 390,000 | 61,303 | |||
| Wisdom Education International Holdings Co. Ltd. | 178,000 | 72,660 | |||
| Yangtze Optical Fibre and Cable Joint Stock Ltd. Co., H Shares | 20,000 | 54,222 | |||
| 1,533,758 | |||||
| Czech Republic — 1.5% | |||||
| Moneta Money Bank AS | 45,630 | 157,206 | |||
| Greece — 0.8% | |||||
| JUMBO SA | 5,387 | 81,968 | |||
| India — 14.8% | |||||
| Balkrishna Industries Ltd. | 8,706 | 120,039 | |||
| Bata India Ltd. | 13,559 | 203,671 | |||
Bharat Financial Inclusion Ltd.(1) | 12,836 | 188,514 | |||
| Crompton Greaves Consumer Electricals Ltd. | 31,320 | 97,490 | |||
Future Retail Ltd.(1) | 22,907 | 172,908 | |||
| Future Supply Chain Solutions Ltd. | 8,659 | 81,110 | |||
| Graphite India Ltd. | 12,985 | 174,193 | |||
10
| Shares | Value | ||||
| Jubilant Foodworks Ltd. | 7,512 | $ | 136,086 | ||
| Larsen & Toubro Infotech Ltd. | 4,395 | 99,011 | |||
| Torrent Pharmaceuticals Ltd. | 4,702 | 120,062 | |||
| Zydus Wellness Ltd. | 6,994 | 121,922 | |||
| 1,515,006 | |||||
| Indonesia — 3.7% | |||||
| Ace Hardware Indonesia Tbk PT | 1,460,300 | 164,985 | |||
| Mitra Adiperkasa Tbk PT | 2,827,000 | 173,047 | |||
| Waskita Karya Persero Tbk PT | 409,200 | 44,906 | |||
| 382,938 | |||||
| Malaysia — 0.7% | |||||
| Carlsberg Brewery Malaysia Bhd | 14,500 | 68,454 | |||
| Mexico — 2.9% | |||||
| Alsea SAB de CV | 36,499 | 91,473 | |||
| Grupo Aeroportuario del Centro Norte SAB de CV | 21,509 | 96,303 | |||
| Regional SAB de CV | 24,162 | 104,251 | |||
| 292,027 | |||||
| Philippines — 3.0% | |||||
| Bloomberry Resorts Corp. | 702,600 | 111,878 | |||
| International Container Terminal Services, Inc. | 57,730 | 102,965 | |||
| MacroAsia Corp. | 153,200 | 42,395 | |||
| Wilcon Depot, Inc. | 237,800 | 54,766 | |||
| 312,004 | |||||
| Russia — 1.8% | |||||
| TCS Group Holding plc GDR | 6,116 | 106,250 | |||
Yandex NV, A Shares(1) | 2,813 | 82,983 | |||
| 189,233 | |||||
| South Africa — 4.8% | |||||
| Capitec Bank Holdings Ltd. | 2,231 | 177,134 | |||
| Dis-Chem Pharmacies Ltd. | 44,598 | 103,922 | |||
| Discovery Ltd. | 7,362 | 82,147 | |||
| Foschini Group Ltd. (The) | 4,839 | 61,351 | |||
| JSE Ltd. | 5,179 | 61,878 | |||
| 486,432 | |||||
| South Korea — 20.5% | |||||
Cafe24 Corp.(1) | 1,037 | 94,759 | |||
CJ Logistics Corp.(1) | 1,157 | 164,636 | |||
| Cosmax, Inc. | 1,338 | 163,197 | |||
| Dentium Co. Ltd. | 1,655 | 103,367 | |||
Doosan Infracore Co. Ltd.(1) | 15,768 | 120,099 | |||
| Fila Korea Ltd. | 6,448 | 292,912 | |||
| Han Kuk Carbon Co. Ltd. | 18,336 | 115,321 | |||
| Hotel Shilla Co. Ltd. | 1,449 | 111,556 | |||
Hyundai Mipo Dockyard Co. Ltd.(1) | 2,049 | 200,263 | |||
| Koh Young Technology, Inc. | 2,860 | 205,899 | |||
| Kumho Petrochemical Co. Ltd. | 1,543 | 127,295 | |||
| Medy-Tox, Inc. | 239 | 120,319 | |||
11
| Shares | Value | ||||
| POSCO Chemtech Co. Ltd. | 2,722 | $ | 165,399 | ||
| SKCKOLONPI, Inc. | 1,678 | 50,622 | |||
Studio Dragon Corp.(1) | 560 | 54,602 | |||
| 2,090,246 | |||||
| Taiwan — 12.2% | |||||
| Asia Cement Corp. | 152,000 | 166,942 | |||
| Career Technology MFG. Co. Ltd. | 78,000 | 76,953 | |||
| Chailease Holding Co. Ltd. | 65,280 | 203,475 | |||
| Chroma ATE, Inc. | 26,000 | 101,366 | |||
| Globalwafers Co. Ltd. | 12,000 | 142,195 | |||
| Machvision, Inc. | 5,000 | 66,170 | |||
| Merida Industry Co. Ltd. | 30,000 | 127,473 | |||
| Powertech Technology, Inc. | 17,000 | 39,850 | |||
| Taiwan Union Technology Corp. | 17,000 | 53,599 | |||
| TCI Co. Ltd. | 7,712 | 125,034 | |||
| Vanguard International Semiconductor Corp. | 67,000 | 140,612 | |||
| 1,243,669 | |||||
| Thailand — 4.7% | |||||
| Bangkok Chain Hospital PCL | 395,400 | 220,504 | |||
| Digital Telecommunications Infrastructure Fund | 358,800 | 159,285 | |||
| Minor International PCL | 90,400 | 100,049 | |||
| 479,838 | |||||
| Turkey — 1.6% | |||||
| Mavi Giyim Sanayi Ve Ticaret AS, B Shares | 9,430 | 68,195 | |||
| TAV Havalimanlari Holding AS | 20,289 | 90,973 | |||
| 159,168 | |||||
| United Kingdom — 0.3% | |||||
DP Eurasia NV(1) | 22,943 | 34,046 | |||
TOTAL COMMON STOCKS (Cost $9,917,627) | 9,958,799 | ||||
| TEMPORARY CASH INVESTMENTS — 2.5% | |||||
| Repurchase Agreement, BMO Capital Markets Corp., (collateralized by various U.S. Treasury obligations, 1.125% - 3.125%, 5/31/19 - 11/15/28, valued at $207,296), in a joint trading account at 2.00%, dated 11/30/18, due 12/3/18 (Delivery value $203,255) | 203,221 | ||||
| State Street Institutional U.S. Government Money Market Fund, Premier Class | 45,293 | 45,293 | |||
TOTAL TEMPORARY CASH INVESTMENTS (Cost $248,514) | 248,514 | ||||
TOTAL INVESTMENT SECURITIES — 100.0% (Cost $10,166,141) | 10,207,313 | ||||
OTHER ASSETS AND LIABILITIES† | 4,685 | ||||
| TOTAL NET ASSETS — 100.0% | $ | 10,211,998 | |||
12
| MARKET SECTOR DIVERSIFICATION | ||
(as a % of net assets) | ||
| Consumer Discretionary | 26.0 | % |
| Financials | 13.9 | % |
| Industrials | 12.3 | % |
| Information Technology | 11.7 | % |
| Consumer Staples | 10.3 | % |
| Materials | 10.0 | % |
| Health Care | 6.4 | % |
| Communication Services | 2.9 | % |
| Energy | 2.2 | % |
| Utilities | 1.3 | % |
| Real Estate | 0.5 | % |
| Cash and Equivalents* | 2.5 | % |
*Includes temporary cash investments and other assets and liabilities.
| NOTES TO SCHEDULE OF INVESTMENTS | ||
| ADR | - | American Depositary Receipt |
| GDR | - | Global Depositary Receipt |
| † | Category is less than 0.05% of total net assets. |
| (1) | Non-income producing. |
See Notes to Financial Statements.
13
| Statement of Assets and Liabilities |
| NOVEMBER 30, 2018 | |||
| Assets | |||
| Investment securities, at value (cost of $10,166,141) | $ | 10,207,313 | |
| Receivable for investments sold | 11,887 | ||
| Receivable for capital shares sold | 250 | ||
| Dividends and interest receivable | 6,364 | ||
| Other assets | 402 | ||
| 10,226,216 | |||
| Liabilities | |||
| Accrued management fees | 12,892 | ||
| Distribution and service fees payable | 1,326 | ||
| 14,218 | |||
| Net Assets | $ | 10,211,998 | |
| Net Assets Consist of: | |||
| Capital (par value and paid-in surplus) | $ | 9,870,890 | |
| Distributable earnings | 341,108 | ||
| $ | 10,211,998 | ||
| Net Assets | Shares Outstanding | Net Asset Value Per Share | ||||
| Investor Class, $0.01 Par Value | $5,923,556 | 507,358 | $11.68 | |||
| I Class, $0.01 Par Value | $1,303,934 | 111,537 | $11.69 | |||
| A Class, $0.01 Par Value | $1,209,077 | 103,728 | $11.66* | |||
| C Class, $0.01 Par Value | $1,160,048 | 100,145 | $11.58 | |||
| R Class, $0.01 Par Value | $374,934 | 32,216 | $11.64 | |||
| R6 Class, $0.01 Par Value | $240,449 | 20,548 | $11.70 | |||
*Maximum offering price $12.37 (net asset value divided by 0.9425).
See Notes to Financial Statements.
14
| Statement of Operations |
| YEAR ENDED NOVEMBER 30, 2018 | |||
| Investment Income (Loss) | |||
| Income: | |||
| Dividends (net of foreign taxes withheld of $25,273) | $ | 235,810 | |
| Interest | 2,754 | ||
| 238,564 | |||
| Expenses: | |||
| Management fees | 197,251 | ||
| Distribution and service fees: | |||
| A Class | 4,786 | ||
| C Class | 13,461 | ||
| R Class | 1,855 | ||
| Directors' fees and expenses | 347 | ||
| Other expenses | 196 | ||
| 217,896 | |||
| Net investment income (loss) | 20,668 | ||
| Realized and Unrealized Gain (Loss) | |||
| Net realized gain (loss) on: | |||
| Investment transactions (net of foreign tax expenses paid (refunded) of $6,590) | 525,858 | ||
| Foreign currency translation transactions | (8,656 | ) | |
| 517,202 | |||
| Change in net unrealized appreciation (depreciation) on: | |||
| Investments (includes (increase) decrease in accrued foreign taxes of $29,970) | (2,372,140 | ) | |
| Translation of assets and liabilities in foreign currencies | 20 | ||
| (2,372,120 | ) | ||
| Net realized and unrealized gain (loss) | (1,854,918 | ) | |
| Net Increase (Decrease) in Net Assets Resulting from Operations | $ | (1,834,250 | ) |
See Notes to Financial Statements.
15
| Statement of Changes in Net Assets |
| YEARS ENDED NOVEMBER 30, 2018 AND NOVEMBER 30, 2017 | ||||||
| Increase (Decrease) in Net Assets | November 30, 2018 | November 30, 2017 | ||||
| Operations | ||||||
| Net investment income (loss) | $ | 20,668 | $ | (28,257 | ) | |
| Net realized gain (loss) | 517,202 | 233,726 | ||||
| Change in net unrealized appreciation (depreciation) | (2,372,120 | ) | 2,011,612 | |||
| Net increase (decrease) in net assets resulting from operations | (1,834,250 | ) | 2,217,081 | |||
| Distributions to Shareholders | ||||||
| From earnings: | ||||||
| Investor Class | (78,924 | ) | (20,088 | ) | ||
| I Class | (11,182 | ) | (6,486 | ) | ||
| A Class | (17,599 | ) | (8,573 | ) | ||
| C Class | (1,980 | ) | — | |||
| R Class | (2,168 | ) | (737 | ) | ||
| R6 Class | (4,150 | ) | (2,472 | ) | ||
| Decrease in net assets from distributions | (116,003 | ) | (38,356 | ) | ||
| Capital Share Transactions | ||||||
| Net increase (decrease) in net assets from capital share transactions (Note 5) | 529,189 | 3,950,648 | ||||
| Net increase (decrease) in net assets | (1,421,064 | ) | 6,129,373 | |||
| Net Assets | ||||||
| Beginning of period | 11,633,062 | 5,503,689 | ||||
| End of period | $ | 10,211,998 | $ | 11,633,062 | ||
See Notes to Financial Statements.
16
| Notes to Financial Statements |
NOVEMBER 30, 2018
1. Organization
American Century World Mutual Funds, Inc. (the corporation) is registered under the Investment Company Act of 1940, as amended (the 1940 Act), as an open-end management investment company and is organized as a Maryland corporation. Emerging Markets Small Cap Fund (the fund) is one fund in a series issued by the corporation. The fund’s investment objective is to seek capital growth.
The fund offers the Investor Class, I Class, A Class, C Class, R Class and R6 Class. The A Class may incur an initial sales charge. The A Class and C Class may be subject to a contingent deferred sales charge.
2. Significant Accounting Policies
The following is a summary of significant accounting policies consistently followed by the fund in preparation of its financial statements. The fund is an investment company and follows accounting and reporting guidance in accordance with accounting principles generally accepted in the United States of America. This may require management to make certain estimates and assumptions at the date of the financial statements. Actual results could differ from these estimates. Management evaluated the impact of events or transactions occurring through the date the financial statements were issued that would merit recognition or disclosure.
Investment Valuations — The fund determines the fair value of its investments and computes its net asset value per share at the close of regular trading (usually 4 p.m. Eastern time) on the New York Stock Exchange (NYSE) on each day the NYSE is open. The Board of Directors has adopted valuation policies and procedures to guide the investment advisor in the fund’s investment valuation process and to provide methodologies for the oversight of the fund’s pricing function.
Equity securities that are listed or traded on a domestic securities exchange are valued at the last reported sales price or at the official closing price as provided by the exchange. Equity securities traded on foreign securities exchanges are generally valued at the closing price of such securities on the exchange where primarily traded or at the close of the NYSE, if that is earlier. If no last sales price is reported, or if local convention or regulation so provides, the mean of the latest bid and asked prices may be used. Securities traded over-the-counter are valued at the mean of the latest bid and asked prices, the last sales price, or the official closing price. Equity securities initially expressed in local currencies are translated into U.S. dollars at the mean of the appropriate currency exchange rate at the close of the NYSE as provided by an independent pricing service.
Open-end management investment companies are valued at the reported net asset value per share. Repurchase agreements are valued at cost, which approximates fair value.
If the fund determines that the market price for an investment is not readily available or the valuation methods mentioned above do not reflect an investment’s fair value, such investment is valued as determined in good faith by the Board of Directors or its delegate, in accordance with policies and procedures adopted by the Board of Directors. In its determination of fair value, the fund may review several factors including, but not limited to, market information regarding the specific investment or comparable investments and correlation with other investment types, futures indices or general market indicators. Circumstances that may cause the fund to use these procedures to value an investment include, but are not limited to: an investment has been declared in default or is distressed; trading in a security has been suspended during the trading day or a security is not actively trading on its principal exchange; prices received from a regular pricing source are deemed unreliable; or there is a foreign market holiday and no trading occurred.
The fund monitors for significant events occurring after the close of an investment’s primary exchange but before the fund’s net asset value per share is determined. Significant events may include, but are not limited to: corporate announcements and transactions; governmental action and political unrest that could impact a specific investment or an investment sector; or armed conflicts, natural disasters and similar events that could affect investments in a specific country or region. The fund also monitors for significant fluctuations between domestic and foreign markets, as evidenced by the U.S. market or such other indicators that the Board of Directors, or its delegate, deems appropriate. If significant fluctuations in foreign markets are identified, the
17
fund may apply a model-derived factor to the closing price of equity securities traded on foreign securities exchanges. The factor is based on observable market data as provided by an independent pricing service.
Security Transactions — Security transactions are accounted for as of the trade date. Net realized gains and losses are determined on the identified cost basis, which is also used for federal income tax purposes. Certain countries impose taxes on realized gains on the sale of securities registered in their country. The fund records the foreign tax expense, if any, on an accrual basis. The foreign tax expense on realized gains and unrealized appreciation reduces the net realized gain (loss) on investment transactions and net unrealized appreciation (depreciation) on investments, respectively.
Investment Income — Dividend income less foreign taxes withheld, if any, is recorded as of the ex-dividend date. Distributions received on securities that represent a return of capital or long-term capital gain are recorded as a reduction of cost of investments and/or as a realized gain. The fund may estimate the components of distributions received that may be considered nontaxable distributions or long-term capital gain distributions for income tax purposes. Interest income is recorded on the accrual basis and includes accretion of discounts and amortization of premiums.
Foreign Currency Translations — All assets and liabilities initially expressed in foreign currencies are translated into U.S. dollars at prevailing exchange rates at period end. The fund may enter into spot foreign currency exchange contracts to facilitate transactions denominated in a foreign currency. Purchases and sales of investment securities, dividend and interest income, spot foreign currency exchange contracts, and expenses are translated at the rates of exchange prevailing on the respective dates of such transactions. Net realized and unrealized foreign currency exchange gains or losses related to investment securities are a component of net realized gain (loss) on investment transactions and change in net unrealized appreciation (depreciation) on investments, respectively.
Repurchase Agreements — The fund may enter into repurchase agreements with institutions that American Century Investment Management, Inc. (ACIM) (the investment advisor) has determined are creditworthy pursuant to criteria adopted by the Board of Directors. The fund requires that the collateral, represented by securities, received in a repurchase transaction be transferred to the custodian in a manner sufficient to enable the fund to obtain those securities in the event of a default under the repurchase agreement. ACIM monitors, on a daily basis, the securities transferred to ensure the value, including accrued interest, of the securities under each repurchase agreement is equal to or greater than amounts owed to the fund under each repurchase agreement.
Joint Trading Account — Pursuant to an Exemptive Order issued by the Securities and Exchange Commission, the fund, along with certain other funds in the American Century Investments family of funds, may transfer uninvested cash balances into a joint trading account. These balances are invested in one or more repurchase agreements that are collateralized by U.S. Treasury or Agency obligations.
Income Tax Status — It is the fund’s policy to distribute substantially all net investment income and net realized gains to shareholders and to otherwise qualify as a regulated investment company under provisions of the Internal Revenue Code. Accordingly, no provision has been made for income taxes. The fund files U.S. federal, state, local and non-U.S. tax returns as applicable. The fund's tax returns are subject to examination by the relevant taxing authority until expiration of the applicable statute of limitations, which is generally three years from the date of filing but can be longer in certain jurisdictions. At this time, management believes there are no uncertain tax positions which, based on their technical merit, would not be sustained upon examination and for which it is reasonably possible that the total amounts of unrecognized tax benefits will significantly change in the next twelve months.
Multiple Class — All shares of the fund represent an equal pro rata interest in the net assets of the class to which such shares belong, and have identical voting, dividend, liquidation and other rights and the same terms and conditions, except for class specific expenses and exclusive rights to vote on matters affecting only individual classes. Income, non-class specific expenses, and realized and unrealized capital gains and losses of the fund are allocated to each class of shares based on their relative net assets.
Distributions to Shareholders — Distributions from net investment income and net realized gains, if any, are generally declared and paid annually. The fund may make distributions on a more frequent basis to comply with the distribution requirements of the Internal Revenue Code, in all events in a manner consistent with provisions of the 1940 Act. The fund may elect to treat a portion of its payment to a redeeming shareholder, which represents the pro rata share of undistributed net investment income and net realized gains, as a distribution for federal income tax purposes (tax equalization).
18
Indemnifications — Under the corporation’s organizational documents, its officers and directors are indemnified against certain liabilities arising out of the performance of their duties to the fund. In addition, in the normal course of business, the fund enters into contracts that provide general indemnifications. The maximum exposure under these arrangements is unknown as this would involve future claims that may be made against a fund. The risk of material loss from such claims is considered by management to be remote.
3. Fees and Transactions with Related Parties
Certain officers and directors of the corporation are also officers and/or directors of American Century Companies, Inc. (ACC). The corporation’s investment advisor, ACIM, the corporation's distributor, American Century Investment Services, Inc. (ACIS), and the corporation’s transfer agent, American Century Services, LLC, are wholly owned, directly or indirectly, by ACC. ACIM owns 58% of the shares of the fund. Related parties do not invest in the fund for the purpose of exercising management or control.
Management Fees — The corporation has entered into a management agreement with ACIM, under which ACIM provides the fund with investment advisory and management services in exchange for a single, unified management fee (the fee) per class. The agreement provides that all expenses of managing and operating the fund, except distribution and service fees, brokerage expenses, taxes, interest, fees and expenses of the independent directors (including legal counsel fees), and extraordinary expenses, will be paid by ACIM. The fee is computed and accrued daily based on each class's daily net assets and paid monthly in arrears. The difference in the fee among the classes is a result of their separate arrangements for non-Rule 12b-1 shareholder services. It is not the result of any difference in advisory or custodial fees or other expenses related to the management of the fund’s assets, which do not vary by class.
The annual management fee for each class is as follows:
| Investor Class | I Class | A Class | C Class | R Class | R6 Class |
| 1.60% | 1.40% | 1.60% | 1.60% | 1.60% | 1.25% |
Distribution and Service Fees — The Board of Directors has adopted a separate Master Distribution and Individual Shareholder Services Plan for each of the A Class, C Class and R Class (collectively the plans), pursuant to Rule 12b-1 of the 1940 Act. The plans provide that the A Class will pay ACIS an annual distribution and service fee of 0.25%. The plans provide that the C Class will pay ACIS an annual distribution and service fee of 1.00%, of which 0.25% is paid for individual shareholder services and 0.75% is paid for distribution services. The plans provide that the R Class will pay ACIS an annual distribution and service fee of 0.50%. The fees are computed and accrued daily based on each class’s daily net assets and paid monthly in arrears. The fees are used to pay financial intermediaries for distribution and individual shareholder services. Fees incurred under the plans during the period ended November 30, 2018 are detailed in the Statement of Operations.
Directors' Fees and Expenses — The Board of Directors is responsible for overseeing the investment advisor’s management and operations of the fund. The directors receive detailed information about the fund and its investment advisor regularly throughout the year, and meet at least quarterly with management of the investment advisor to review reports about fund operations. The fund’s officers do not receive compensation from the fund.
4. Investment Transactions
Purchases and sales of investment securities, excluding short-term investments, for the period ended November 30, 2018 were $9,543,786 and $9,200,819, respectively.
19
5. Capital Share Transactions
Transactions in shares of the fund were as follows:
| Year ended November 30, 2018 | Year ended November 30, 2017 | |||||||||
| Shares | Amount | Shares | Amount | |||||||
| Investor Class/Shares Authorized | 50,000,000 | 50,000,000 | ||||||||
| Sold | 385,055 | $ | 5,438,357 | 426,322 | $ | 5,355,178 | ||||
| Issued in reinvestment of distributions | 5,727 | 78,175 | 1,979 | 20,088 | ||||||
| Redeemed | (387,314 | ) | (5,315,103 | ) | (151,549 | ) | (1,951,627 | ) | ||
| 3,468 | 201,429 | 276,752 | 3,423,639 | |||||||
| I Class/Shares Authorized | 30,000,000 | 50,000,000 | ||||||||
| Sold | 54,211 | 695,641 | — | — | ||||||
| Issued in reinvestment of distributions | 820 | 11,182 | 639 | 6,486 | ||||||
| Redeemed | (4,133 | ) | (52,760 | ) | — | — | ||||
| 50,898 | 654,063 | 639 | 6,486 | |||||||
| A Class/Shares Authorized | 30,000,000 | 40,000,000 | ||||||||
| Sold | 581 | 8,802 | 42,584 | 460,431 | ||||||
| Issued in reinvestment of distributions | 1,288 | 17,599 | 844 | 8,573 | ||||||
| Redeemed | (41,571 | ) | (462,502 | ) | (26 | ) | (328 | ) | ||
| (39,702 | ) | (436,101 | ) | 43,402 | 468,676 | |||||
| C Class/Shares Authorized | 30,000,000 | 30,000,000 | ||||||||
| Issued in reinvestment of distributions | 145 | 1,980 | — | — | ||||||
| R Class/Shares Authorized | 30,000,000 | 30,000,000 | ||||||||
| Sold | 13,676 | 173,754 | 4,209 | 52,231 | ||||||
| Issued in reinvestment of distributions | 159 | 2,168 | 73 | 737 | ||||||
| Redeemed | (5,947 | ) | (72,254 | ) | (287 | ) | (3,593 | ) | ||
| 7,888 | 103,668 | 3,995 | 49,375 | |||||||
| R6 Class/Shares Authorized | 30,000,000 | 50,000,000 | ||||||||
| Issued in reinvestment of distributions | 304 | 4,150 | 244 | 2,472 | ||||||
| Net increase (decrease) | 23,001 | $ | 529,189 | 325,032 | $ | 3,950,648 | ||||
6. Fair Value Measurements
The fund’s investments valuation process is based on several considerations and may use multiple inputs to determine the fair value of the investments held by the fund. In conformity with accounting principles generally accepted in the United States of America, the inputs used to determine a valuation are classified into three broad levels.
| • | Level 1 valuation inputs consist of unadjusted quoted prices in an active market for identical investments. |
| • | Level 2 valuation inputs consist of direct or indirect observable market data (including quoted prices for comparable investments, evaluations of subsequent market events, interest rates, prepayment speeds, credit risk, etc.). These inputs also consist of quoted prices for identical investments initially expressed in local currencies that are adjusted through translation into U.S. dollars. |
| • | Level 3 valuation inputs consist of unobservable data (including a fund’s own assumptions). |
The level classification is based on the lowest level input that is significant to the fair valuation measurement. The valuation inputs are not necessarily an indication of the risks associated with investing in these securities or other financial instruments.
20
The following is a summary of the level classifications as of period end. The Schedule of Investments provides additional information on the fund’s portfolio holdings.
| Level 1 | Level 2 | Level 3 | ||||||
| Assets | ||||||||
| Investment Securities | ||||||||
| Common Stocks | ||||||||
| Chile | $ | 114,476 | $ | 97,093 | — | |||
| China | 343,616 | 1,190,142 | — | |||||
| Russia | 82,983 | 106,250 | — | |||||
| Other Countries | — | 8,024,239 | — | |||||
| Temporary Cash Investments | 45,293 | 203,221 | — | |||||
| $ | 586,368 | $ | 9,620,945 | — | ||||
7. Risk Factors
There are certain risks involved in investing in foreign securities. These risks include those resulting from future adverse political, social and economic developments, fluctuations in currency exchange rates, the possible imposition of exchange controls, and other foreign laws or restrictions. Investing in emerging markets may accentuate these risks.
The fund invests in common stocks of small companies. Because of this, the fund may be subject to greater risk and market fluctuations than a fund investing in larger, more established companies.
8. Federal Tax Information
On December 18, 2018, the fund declared and paid a per-share distribution from net realized gains to shareholders of record on December 17, 2018 of $0.4140 for the Investor Class, I Class, A Class, C Class, R Class, and R6 Class.
The tax character of distributions paid during the years ended November 30, 2018 and November 30, 2017 were as follows:
| 2018 | 2017 | |||||
| Distributions Paid From | ||||||
| Ordinary income | $ | 100,312 | $ | 38,356 | ||
| Long-term capital gains | $ | 15,691 | — | |||
The book-basis character of distributions made during the year from net investment income or net realized gains may differ from their ultimate characterization for federal income tax purposes. These differences reflect the differing character of certain income items and net realized gains and losses for financial statement and tax purposes, and may result in reclassification among certain capital accounts on the financial statements.
The reclassifications, which are primarily due to tax equalization, were made to capital $105,151 and
distributable earnings $(105,151).
21
As of period end, the federal tax cost of investments and the components of distributable earnings on a tax-basis were as follows:
| Federal tax cost of investments | $ | 10,231,058 | |
| Gross tax appreciation of investments | $ | 1,094,719 | |
| Gross tax depreciation of investments | (1,118,464 | ) | |
| Net tax appreciation (depreciation) of investments | (23,745 | ) | |
Net tax appreciation (depreciation) on translation of assets and liabilities in foreign currencies | (5 | ) | |
Net tax appreciation (depreciation) | $ | (23,750 | ) |
| Undistributed ordinary income | — | ||
| Accumulated long-term gains | $ | 364,858 | |
The difference between book-basis and tax-basis unrealized appreciation (depreciation) is attributable primarily to the realization to ordinary income for tax purposes of unrealized gains on investments in passive foreign investment companies.
22
| Financial Highlights |
| For a Share Outstanding Throughout the Years Ended November 30 (except as noted) | |||||||||||||
| Per-Share Data | Ratios and Supplemental Data | ||||||||||||
| Income From Investment Operations: | Distributions From: | Ratio to Average Net Assets of: | |||||||||||
| Net Asset Value, Beginning of Period | Net Investment Income (Loss)(1) | Net Realized and Unrealized Gain (Loss) | Total From Investment Operations | Net Investment Income | Net Realized Gains | Total Distributions | Net Asset Value, End of Period | Total Return(2) | Operating Expenses | Net Investment Income (Loss) | Portfolio Turnover Rate | Net Assets, End of Period (in thousands) | |
| Investor Class | |||||||||||||
| 2018 | $13.66 | 0.04 | (1.86) | (1.82) | (0.14) | (0.02) | (0.16) | $11.68 | (13.59)% | 1.60% | 0.31% | 75% | $5,924 |
| 2017 | $10.45 | (0.03) | 3.33 | 3.30 | (0.09) | — | (0.09) | $13.66 | 31.85% | 1.61% | (0.16)% | 49% | $6,884 |
2016(3) | $10.00 | 0.04 | 0.41 | 0.45 | — | — | — | $10.45 | 4.50% | 1.60%(4) | 0.59%(4) | 51% | $2,373 |
| I Class | |||||||||||||
| 2018 | $13.68 | 0.06 | (1.86) | (1.80) | (0.17) | (0.02) | (0.19) | $11.69 | (13.39)% | 1.40% | 0.51% | 75% | $1,304 |
| 2017 | $10.46 | 0.01 | 3.32 | 3.33 | (0.11) | — | (0.11) | $13.68 | 32.18% | 1.41% | 0.04% | 49% | $829 |
2016(3) | $10.00 | 0.05 | 0.41 | 0.46 | — | — | — | $10.46 | 4.60% | 1.40%(4) | 0.79%(4) | 51% | $628 |
| A Class | |||||||||||||
| 2018 | $13.64 | 0.01 | (1.86) | (1.85) | (0.11) | (0.02) | (0.13) | $11.66 | (13.82)% | 1.85% | 0.06% | 75% | $1,209 |
| 2017 | $10.43 | (0.04) | 3.31 | 3.27 | (0.06) | — | (0.06) | $13.64 | 31.57% | 1.86% | (0.41)% | 49% | $1,956 |
2016(3) | $10.00 | 0.02 | 0.41 | 0.43 | — | — | — | $10.43 | 4.30% | 1.85%(4) | 0.34%(4) | 51% | $1,043 |
| C Class | |||||||||||||
| 2018 | $13.55 | (0.10) | (1.85) | (1.95) | —(5) | (0.02) | (0.02) | $11.58 | (14.41)% | 2.60% | (0.69)% | 75% | $1,160 |
| 2017 | $10.38 | (0.13) | 3.30 | 3.17 | — | — | — | $13.55 | 30.54% | 2.61% | (1.16)% | 49% | $1,355 |
2016(3) | $10.00 | (0.03) | 0.41 | 0.38 | — | — | — | $10.38 | 3.80% | 2.60%(4) | (0.41)%(4) | 51% | $1,038 |
| For a Share Outstanding Throughout the Years Ended November 30 (except as noted) | |||||||||||||
| Per-Share Data | Ratios and Supplemental Data | ||||||||||||
| Income From Investment Operations: | Distributions From: | Ratio to Average Net Assets of: | |||||||||||
| Net Asset Value, Beginning of Period | Net Investment Income (Loss)(1) | Net Realized and Unrealized Gain (Loss) | Total From Investment Operations | Net Investment Income | Net Realized Gains | Total Distributions | Net Asset Value, End of Period | Total Return(2) | Operating Expenses | Net Investment Income (Loss) | Portfolio Turnover Rate | Net Assets, End of Period (in thousands) | |
| R Class | |||||||||||||
| 2018 | $13.62 | (0.03) | (1.86) | (1.89) | (0.07) | (0.02) | (0.09) | $11.64 | (13.98)% | 2.10% | (0.19)% | 75% | $375 |
| 2017 | $10.41 | (0.07) | 3.32 | 3.25 | (0.04) | — | (0.04) | $13.62 | 31.30% | 2.11% | (0.66)% | 49% | $331 |
2016(3) | $10.00 | 0.01 | 0.40 | 0.41 | — | — | — | $10.41 | 4.10% | 2.10%(4) | 0.09%(4) | 51% | $212 |
| R6 Class | |||||||||||||
| 2018 | $13.69 | 0.08 | (1.86) | (1.78) | (0.19) | (0.02) | (0.21) | $11.70 | (13.25)% | 1.25% | 0.66% | 75% | $240 |
| 2017 | $10.47 | 0.03 | 3.31 | 3.34 | (0.12) | — | (0.12) | $13.69 | 32.35% | 1.26% | 0.19% | 49% | $277 |
2016(3) | $10.00 | 0.06 | 0.41 | 0.47 | — | — | — | $10.47 | 4.70% | 1.25%(4) | 0.94%(4) | 51% | $209 |
| Notes to Financial Highlights | |
| (1) | Computed using average shares outstanding throughout the period. |
| (2) | Total returns are calculated based on the net asset value of the last business day and do not reflect applicable sales charges, if any. Total returns for periods less than one year are not annualized. |
| (3) | April 7, 2016 (fund inception) through November 30, 2016. |
| (4) | Annualized. |
| (5) | Per share amount was less than $0.005. |
See Notes to Financial Statements.
| Report of Independent Registered Public Accounting Firm |
To the Shareholders and the Board of Directors of American Century World Mutual Funds, Inc.:
Opinion on the Financial Statements and Financial Highlights
We have audited the accompanying statement of assets and liabilities, including the schedule of investments, of Emerging Markets Small Cap Fund, one of the funds constituting the American Century World Mutual Funds, Inc. (the “Fund”), as of November 30, 2018, the related statement of operations for the year then ended, the statements of changes in net assets for each of the two years in the period then ended, the financial highlights for the years ended November 30, 2018, November 30, 2017, and for the period April 7, 2016 (fund inception) through November 30, 2016, and the related notes. In our opinion, the financial statements and financial highlights present fairly, in all material respects, the financial position of Emerging Markets Small Cap Fund of the American Century World Mutual Funds, Inc. as of November 30, 2018, the results of its operations for the year then ended, the changes in its net assets for each of the two years in the period then ended, and the financial highlights for the years ended November 30, 2018, November 30, 2017, and for the period April 7, 2016 (fund inception) through November 30, 2016, in conformity with accounting principles generally accepted in the United States of America.
Basis for Opinion
These financial statements and financial highlights are the responsibility of the Fund's management. Our responsibility is to express an opinion on the Fund’s financial statements and financial highlights based on our audits. We are a public accounting firm registered with the Public Company Accounting Oversight Board (United States) (PCAOB) and are required to be independent with respect to the Fund in accordance with the U.S. federal securities laws and the applicable rules and regulations of the Securities and Exchange Commission and the PCAOB.
We conducted our audits in accordance with the standards of the PCAOB. Those standards require that we plan and perform the audit to obtain reasonable assurance about whether the financial statements and financial highlights are free of material misstatement, whether due to error or fraud. The Fund is not required to have, nor were we engaged to perform, an audit of its internal control over financial reporting. As part of our audits we are required to obtain an understanding of internal control over financial reporting but not for the purpose of expressing an opinion on the effectiveness of the Fund’s internal control over financial reporting. Accordingly, we express no such opinion.
Our audits included performing procedures to assess the risks of material misstatement of the financial statements and financial highlights, whether due to error or fraud, and performing procedures that respond to those risks. Such procedures included examining, on a test basis, evidence regarding the amounts and disclosures in the financial statements and financial highlights. Our audits also included evaluating the accounting principles used and significant estimates made by management, as well as evaluating the overall presentation of the financial statements and financial highlights. Our procedures included confirmation of securities owned as of November 30, 2018, by correspondence with the custodian and brokers; when replies were not received from brokers, we performed other auditing procedures. We believe that our audits provide a reasonable basis for our opinion.
DELOITTE & TOUCHE LLP
Kansas City, Missouri
January 17, 2019
We have served as the auditor of one or more American Century investment companies since 1997.
25
| Management |
The Board of Directors
The individuals listed below serve as directors of the funds. Each director will continue to serve in this capacity until death, retirement, resignation or removal from office. The board has adopted a mandatory retirement age for directors who are not “interested persons,” as that term is defined in the Investment Company Act (independent directors). Independent directors shall retire by December 31 of the year in which they reach their 75th birthday.
Mr. Thomas is an “interested person” because he currently serves as President and Chief Executive Officer of American Century Companies, Inc. (ACC), the parent company of American Century Investment Management, Inc. (ACIM or the advisor). The other directors (more than three-fourths of the total number) are independent. They are not employees, directors or officers of, and have no financial interest in, ACC or any of its wholly owned, direct or indirect, subsidiaries, including ACIM, American Century Investment Services, Inc. (ACIS) and American Century Services, LLC (ACS), and they do not have any other affiliations, positions or relationships that would cause them to be considered “interested persons” under the Investment Company Act. The directors serve in this capacity for seven (in the case of Jonathan S. Thomas, 16; and Stephen E. Yates, 8) registered investment companies in the American Century Investments family of funds.
The following table presents additional information about the directors. The mailing address for each director is 4500 Main Street, Kansas City, Missouri 64111.
| Name (Year of Birth) | Position(s) Held with Funds | Length of Time Served | Principal Occupation(s) During Past 5 Years | Number of American Century Portfolios Overseen by Director | Other Directorships Held During Past 5 Years |
| Independent Directors | |||||
| Thomas W. Bunn (1953) | Director | Since 2017 | Retired | 68 | SquareTwo Financial; Barings (formerly Babson Capital Funds Trust) (2013 to 2016) |
| Barry Fink (1955) | Director | Since 2012 (independent since 2016) | Retired; Executive Vice President, ACC (2007 to 2013); President, ACS (2007 to 2013) | 68 | None |
| Jan M. Lewis (1957) | Director | Since 2011 | Retired; President and Chief Executive Officer, Catholic Charities of Northeast Kansas (human services organization) (2006 to 2013) | 68 | None |
M. Jeannine Strandjord(1) (1945) | Director | Since 1994 | Self-employed Consultant | 68 | Euronet Worldwide Inc. and MGP Ingredients, Inc. |
26
| Name (Year of Birth) | Position(s) Held with Funds | Length of Time Served | Principal Occupation(s) During Past 5 Years | Number of American Century Portfolios Overseen by Director | Other Directorships Held During Past 5 Years |
| Independent Directors | |||||
| John R. Whitten (1946) | Director | Since 2008 | Retired | 68 | Rudolph Technologies, Inc. |
| Stephen E. Yates (1948) | Director and Chairman of the Board | Since 2012 (Chairman since 2018) | Retired | 73 | None |
| Interested Director | |||||
| Jonathan S. Thomas (1963) | Director and President | Since 2007 | President and Chief Executive Officer, ACC (2007 to present). Also serves as Chief Executive Officer, ACS; Executive Vice President, ACIM; Director, ACC, ACIM and other ACC subsidiaries | 118 | BioMed Valley Discoveries, Inc. |
(1) Effective December 31, 2018, M. Jeannine Strandjord retired from the Board of Directors.
The Statement of Additional Information has additional information about the fund's directors and is available without charge, upon request, by calling 1-800-345-2021.
27
Officers
The following table presents certain information about the executive officers of the funds. Each officer serves as an officer for each of the 16 (in the case of Robert J. Leach, 15) investment companies in the American Century family of funds. No officer is compensated for his or her service as an officer of the funds. The listed officers are interested persons of the funds and are appointed or re-appointed on an annual basis. The mailing address for each officer listed below is 4500 Main Street, Kansas City, Missouri 64111.
| Name (Year of Birth) | Offices with the Funds | Principal Occupation(s) During the Past Five Years |
| Jonathan S. Thomas (1963) | Director and President since 2007 | President and Chief Executive Officer, ACC (2007 to present). Also serves as Chief Executive Officer, ACS; Executive Vice President, ACIM; Director, ACC, ACIM and other ACC subsidiaries |
| R. Wes Campbell (1974) | Chief Financial Officer and Treasurer since 2018 | Investment Operations and Investment Accounting, ACS (2000 to present) |
| Amy D. Shelton (1964) | Chief Compliance Officer and Vice President since 2014 | Chief Compliance Officer, American Century funds, (2014 to present); Chief Compliance Officer, ACIM (2014 to present); Chief Compliance Officer, ACIS (2009 to present); Vice President, Client Interactions and Marketing, ACIS (2013 to 2014). Also serves as Vice President, ACIS |
| Charles A. Etherington (1957) | General Counsel since 2007 and Senior Vice President since 2006 | Attorney, ACC (1994 to present); Vice President, ACC (2005 to present); General Counsel, ACC (2007 to present). Also serves as General Counsel, ACIM, ACS, ACIS and other ACC subsidiaries; and Senior Vice President, ACIM and ACS |
| C. Jean Wade (1964) | Vice President since 2012 | Senior Vice President, ACS (2017 to present); Vice President, ACS (2000 to 2017) |
| Robert J. Leach (1966) | Vice President since 2006 | Vice President, ACS (2000 to present) |
| David H. Reinmiller (1963) | Vice President since 2000 | Attorney, ACC (1994 to present). Also serves as Vice President, ACIM and ACS |
| Ward D. Stauffer (1960) | Secretary since 2005 | Attorney, ACC (2003 to present) |
28
| Approval of Management Agreement |
At a meeting held on June 28, 2018, the Fund’s Board of Directors (the "Board") unanimously approved the renewal of the management agreement pursuant to which American Century Investment Management, Inc. (the “Advisor”) acts as the investment advisor for the Fund. Under Section 15(c) of the Investment Company Act, contracts for investment advisory services are required to be reviewed, evaluated, and approved by a majority of a fund’s directors (the “Directors”), including a majority of the independent Directors, each year.
Prior to its consideration of the renewal of the management agreement, the Directors requested and reviewed extensive data and information compiled by the Advisor and certain independent providers of evaluation data concerning the Fund and the services provided to the Fund by the Advisor. This review was in addition to the oversight and evaluation undertaken by the Board and its committees on a continual basis and the information received was supplemental to the extensive information that the Board and its committees receive and consider throughout the year. The Directors also conducted a review of the process by which the Board considers the renewal of the management agreements. The Board consulted with industry experts and reviewed industry best practices and recent judicial precedent. The Directors believe that the enhancements resulting from their review resulted in increased dialogue with the Advisor and an improved process for fund shareholders.
In connection with its consideration of the renewal of the management agreement, the Board’s review and evaluation of the services provided by the Advisor included, but was not limited to, the following:
| • | the nature, extent, and quality of investment management, shareholder services, and other services provided and to be provided to the Fund; |
| • | the wide range of other programs and services provided and to be provided to the Fund and its shareholders on a routine and non-routine basis; |
| • | the investment performance of the Fund, including data comparing the Fund's performance to appropriate benchmarks and/or a peer group of other mutual funds with similar investment objectives and strategies; |
| • | the cost of owning the Fund compared to the cost of owning similar funds; |
| • | the compliance policies, procedures, and regulatory experience of the Advisor and the Fund's service providers; |
| • | financial data showing the cost of services provided to the Fund, the profitability of the Fund to the Advisor, and the overall profitability of the Advisor |
| • | strategic plans of the Advisor; |
| • | any economies of scale associated with the Advisor’s management of the Fund and other accounts; |
| • | services provided and charges to the Advisor's other investment management clients; |
| • | acquired fund fees and expenses; |
| • | payments and practices in connection with financial intermediaries holding shares of the Fund and the services provided by intermediaries in connection therewith; and |
| • | any collateral benefits derived by the Advisor from the management of the Fund. |
The Directors held two in-person meetings and one telephonic meeting to review and discuss the information provided. The independent Directors also reviewed responses to supplemental information requests provided by the Directors to the Advisor and held active discussions with the Advisor regarding the renewal of the management agreement. The independent Directors had the benefit of the advice of their independent counsel throughout the process.
29
Factors Considered
The Directors considered all of the information provided by the Advisor, the independent data providers, and independent counsel in connection with the approval. They determined that the information was sufficient for them to evaluate the management agreement for the Fund. In connection with their review, the Directors did not identify any single factor as being all-important or controlling, and each Director may have attributed different levels of importance to different factors. In deciding to renew the management agreement, the Board based its decision on a number of factors, including without limitation the following:
Nature, Extent and Quality of Services - Generally. Under the management agreement, the Advisor is responsible for providing or arranging for all services necessary for the operation of the Fund. The Board noted that the Advisor provides or arranges at its own expense a wide variety of services including without limitation the following:
| • | portfolio research and security selection |
| • | securities trading |
| • | Fund administration |
| • | custody of Fund assets |
| • | daily valuation of the Fund’s portfolio |
| • | shareholder servicing and transfer agency, including shareholder confirmations, recordkeeping, and communications |
| • | legal services (except the independent Directors’ counsel) |
| • | regulatory and portfolio compliance |
| • | financial reporting |
| • | marketing and distribution (except amounts paid by the Fund under Rule 12b-1 plans) |
The Board noted that many of these services have expanded over time in terms of both quantity and complexity in response to shareholder demands, competition in the industry, changing distribution channels, and the changing regulatory environment.
Investment Management Services. The nature of the investment management services provided to the Fund is quite complex and allows Fund shareholders access to professional money management, instant diversification of their investments within an asset class, the opportunity to easily diversify among asset classes by investing in or exchanging among various American Century Investments funds, and liquidity. In evaluating investment performance, the Board expects the Advisor to manage the Fund in accordance with its investment objectives and approved strategies. Further, the Directors recognize that the Advisor has an obligation to monitor trading activities, and in particular to seek the best execution of fund trades, and to evaluate the use of and payment for research. In providing these services, the Advisor utilizes teams of investment professionals (portfolio managers, analysts, research assistants, and securities traders) who require extensive information technology, research, training, compliance, and other systems to conduct their business. The Board, directly and through its Fund Performance Review Committee, provides oversight of the investment performance process. It regularly reviews investment performance information for the Fund, together with comparative information for appropriate benchmarks and/or peer groups of similarly-managed funds, over different time horizons. The Directors also review detailed performance information provided by the Advisor during the management agreement renewal process. If performance concerns are identified, the Fund receives special reviews until performance improves, during which the Board receives a report from the Advisor regarding the reasons for such results (e.g., market conditions, security selection) and any efforts being undertaken to improve performance. The Fund’s performance was above its benchmark for the one-year period reviewed by the Board. The Board found the investment management services provided by the Advisor to the Fund to be satisfactory and consistent with the management agreement.
30
Shareholder and Other Services. Under the management agreement, the Advisor provides the Fund with a comprehensive package of transfer agency, shareholder, and other services. The Board, directly and through various committees of the Board, regularly reviews reports and evaluations of such services at its regular meetings. These reports include, but are not limited to, information regarding the operational efficiency and accuracy of the shareholder and transfer agency services provided, staffing levels, shareholder satisfaction (as measured by external as well as internal sources), technology support, new products and services offered to Fund shareholders, securities trading activities, portfolio valuation services, auditing services, and legal and operational compliance activities. The Board found the services provided by the Advisor to the Fund under the management agreement to be competitive and of high quality.
Costs of Services and Profitability. The Advisor provides detailed information concerning its cost of providing various services to the Fund, its profitability in managing the Fund (pre- and post-distribution), its overall profitability, and its financial condition. The Directors have reviewed with the Advisor the methodology used to prepare this financial information. This information is considered in evaluating the Advisor’s financial condition, its ability to continue to provide services under the management agreement, and the reasonableness of the current management fee. The Board concluded that the Advisor’s profits were reasonable in light of the services provided to the Fund.
Ethics. The Board generally considers the Advisor’s commitment to providing quality services to shareholders and to conducting its business ethically. They noted that the Advisor’s practices generally meet or exceed industry best practices.
Economies of Scale. The Board also reviewed information provided by the Advisor regarding the possible existence of economies of scale in connection with the management of the Fund. The Board concluded that economies of scale are difficult to measure and predict with precision, especially on a fund-by-fund basis. The Board concluded that the Advisor is appropriately sharing economies of scale through its competitive fee structure, offering competitive fees from fund inception, and through reinvestment in its business to provide shareholders additional content and services.
Comparison to Other Funds’ Fees. The management agreement provides that the Fund pays the Advisor a single, all-inclusive (or unified) management fee for providing all services necessary for the management and operation of the Fund, other than brokerage expenses, expenses attributable to short sales, taxes, interest, extraordinary expenses, and the fees and expenses of the Fund’s independent Directors (including their independent legal counsel) and expenses incurred in connection with the provision of shareholder services and distribution services under a plan adopted pursuant to Rule 12b-1 under the 1940 Act. Under the unified fee structure, the Advisor is responsible for providing all investment advisory, custody, audit, administrative, compliance, recordkeeping, marketing and shareholder services, or arranging and supervising third parties to provide such services. By contrast, most other funds are charged a variety of fees, including an investment advisory fee, a transfer agency fee, an administrative fee, distribution charges, and other expenses. Other than their investment advisory fees and any applicable Rule 12b-1 distribution fees, all other components of the total fees charged by these other funds may be increased without shareholder approval. The Board believes the unified fee structure is a benefit to Fund shareholders because it clearly discloses to shareholders the cost of owning Fund shares, and, since the unified fee cannot be increased without a vote of Fund shareholders, it shifts to the Advisor the risk of increased costs of operating the Fund and provides a direct incentive to minimize administrative inefficiencies. Part of the Board’s analysis of fee levels involves reviewing certain evaluative data compiled by an independent provider comparing the Fund’s unified fee to the total expense ratios of its peers. The unified fee charged to shareholders of the Fund was above the median of the total expense ratios of the Fund’s peer expense universe and was within the range of its peer expense group. The Board concluded that the management fee paid by the Fund to the Advisor under the management agreement is reasonable in light of the services provided to the Fund.
31
Comparison to Fees and Services Provided to Other Clients of the Advisor. The Directors also requested and received information from the Advisor concerning the nature of the services, fees, costs, and profitability of its advisory services to advisory clients other than the Fund. They observed that these varying types of client accounts require different services and involve different regulatory and entrepreneurial risks than the management of the Fund. The Board analyzed this information and concluded that the fees charged and services provided to the Fund were reasonable by comparison.
Payments to Intermediaries. The Directors also requested and received a description of payments made to intermediaries by the Fund and the Advisor and services provided in response thereto. These payments include various payments made by the Fund or the Advisor to different types of intermediaries and recordkeepers for distribution and service activities provided for the Fund. The Board reviewed such information and received representations from the Advisor that all such payments by the Fund were made pursuant to the Fund's Rule 12b-1 Plan and that all such payments by the Advisor were made from the Advisor’s resources and reasonable profits. The Board found the payments to be reasonable in scope and purpose.
Collateral or “Fall-Out” Benefits Derived by the Advisor. The Board considered the existence of collateral benefits the Advisor may receive as a result of its relationship with the Fund. They concluded that the Advisor’s primary business is managing mutual funds and it generally does not use fund or shareholder information to generate profits in other lines of business, and therefore does not derive any significant collateral benefits from them. The Board noted that additional assets from other clients may offer the Advisor some benefit from increased leverage with service providers and counterparties. Additionally, the Advisor may receive proprietary research from broker-dealers that execute fund portfolio transactions, which the Board concluded is likely to benefit other clients of the Advisor, as well as Fund shareholders. The Board also determined that the Advisor is able to provide investment management services to certain clients other than the Fund, at least in part, due to its existing infrastructure built to serve the fund complex. The Board concluded that appropriate allocation methodologies had been employed to assign resources and the cost of those resources to these other clients and, where expressly provided, these other client assets may be included with the assets of the Fund to determine breakpoints in the management fee schedule.
Existing Relationship. The Board also considered whether there was any reason for not continuing the existing arrangement with the Advisor. In this regard, the Board was mindful of the potential disruptions of the Fund’s operations and various risks, uncertainties, and other effects that could occur as a result of a decision not to continue such relationship. In particular, the Board recognized that most shareholders have invested in the Fund on the strength of the Advisor’s industry standing and reputation and in the expectation that the Advisor will have a continuing role in providing advisory services to the Fund.
Conclusion of the Directors. As a result of this process, the Board, including all of the independent Directors, taking into account all of the factors discussed above and the information provided by the Advisor and others in connection with its review and throughout the year, determined that the management fee is fair and reasonable in light of the services provided and that the investment management agreement between the Fund and the Advisor should be renewed.
32
| Additional Information |
Retirement Account Information
As required by law, distributions you receive from certain retirement accounts are subject to federal income tax withholding, unless you elect not to have withholding apply*. Tax will be withheld on the total amount withdrawn even though you may be receiving amounts that are not subject to withholding, such as nondeductible contributions. In such case, excess amounts of withholding could occur. You may adjust your withholding election so that a greater or lesser amount will be withheld.
If you don’t want us to withhold on this amount, you must notify us to not withhold the federal income tax. You may notify us in writing or in certain situations by telephone or through other electronic means. For systematic withdrawals, your withholding election will remain in effect until revoked or changed by filing a new election. You have the right to revoke your election at any time and change your withholding percentage for future distributions.
Remember, even if you elect not to have income tax withheld, you are liable for paying income tax on the taxable portion of your withdrawal. If you elect not to have income tax withheld or you don’t have enough income tax withheld, you may be responsible for payment of estimated tax. You may incur penalties under the estimated tax rules if your withholding and estimated tax payments are not sufficient. You can reduce or defer the income tax on a distribution by directly or indirectly rolling such distribution over to another IRA or eligible plan. You should consult your tax advisor for additional information.
State tax will be withheld if, at the time of your distribution, your address is within one of the mandatory withholding states and you have federal income tax withheld (or as otherwise required by state law). State taxes will be withheld from your distribution in accordance with the respective state rules.
*Some 403(b), 457 and qualified retirement plan distributions may be subject to 20% mandatory withholding, as they are subject to special tax and withholding rules. Your plan administrator or plan sponsor is required to provide you with a special tax notice explaining those rules at the time you request a distribution. If applicable, federal and/or state taxes may be withheld from your distribution amount.
Proxy Voting Policies
A description of the policies that the fund's investment advisor uses in exercising the voting rights associated with the securities purchased and/or held by the fund is available without charge, upon request, by calling 1-800-345-2021. It is also available on the "About Us" page of American Century Investments’ website at americancentury.com and on the Securities and Exchange Commission’s website at sec.gov. Information regarding how the investment advisor voted proxies relating to portfolio securities during the most recent 12-month period ended June 30 is available on the "About Us" page at americancentury.com. It is also available at sec.gov.
Quarterly Portfolio Disclosure
The fund files its complete schedule of portfolio holdings with the Securities and Exchange Commission (SEC) for the first and third quarters of each fiscal year on Form N-Q. The fund’s Forms N-Q are available on the SEC’s website at sec.gov. The fund also makes its complete schedule of portfolio holdings for the most recent quarter of its fiscal year available on its website at americancentury.com and, upon request, by calling 1-800-345-2021.
33
Other Tax Information
The following information is provided pursuant to provisions of the Internal Revenue Code.
The fund hereby designates up to the maximum amount allowable as qualified dividend income for the fiscal year ended November 30, 2018.
The fund hereby designates $118,594, or up to the maximum amount allowable, as long-term
capital gain distributions (20% rate gain distributions) for the fiscal year ended November 30, 2018.
The fund utilized earnings and profits of $105,151 distributed to shareholders on redemption of shares as part of the dividends paid deduction (tax equalization).
34
| Notes |
35
| Notes |
36
| ||
| Contact Us | americancentury.com | |
| Automated Information Line | 1-800-345-8765 | |
| Investor Services Representative | 1-800-345-2021 or 816-531-5575 | |
| Investors Using Advisors | 1-800-378-9878 | |
| Business, Not-For-Profit, Employer-Sponsored Retirement Plans | 1-800-345-3533 | |
| Banks and Trust Companies, Broker-Dealers, Financial Professionals, Insurance Companies | 1-800-345-6488 | |
| Telecommunications Relay Service for the Deaf | 711 | |
| American Century World Mutual Funds, Inc. | ||
Investment Advisor: American Century Investment Management, Inc. Kansas City, Missouri | ||
| This report and the statements it contains are submitted for the general information of our shareholders. The report is not authorized for distribution to prospective investors unless preceded or accompanied by an effective prospectus. | ||
| ©2019 American Century Proprietary Holdings, Inc. All rights reserved. CL-ANN-91033 1901 | ||
| Annual Report | |
| November 30, 2018 | |
| Focused International Growth Fund | |
| Investor Class (AFCNX) | |
| I Class (AFCSX) | |
| A Class (AFCLX) | |
| C Class (AFCHX) | |
| R Class (AFCWX) | |
| R6 Class (AFCMX) | |
Beginning on January 1, 2021, as permitted by regulations adopted by the Securities and Exchange Commission, paper copies of the fund’s shareholder reports like this one will no longer be sent by mail, unless you specifically request paper copies of the reports from the fund or from your financial intermediary, such as a broker-dealer or bank. Instead, the reports will be made available on a website, and you will be notified by mail each time a report is posted and provided with a website link to access the report.
If you already elected to receive shareholder reports electronically, you will not be affected by this change and you need not take any action. You may elect to receive shareholder reports and other communications from the fund or your financial intermediary electronically by calling or sending an email request to your appropriate contacts as listed on the back cover of this report.
You may elect to receive all future reports in paper free of charge. You can inform the fund or your financial intermediary that you wish to continue receiving paper copies of your shareholder reports by calling or sending an email request to your appropriate contacts as listed on the back cover of this report. Your election to receive reports in paper will apply to all funds held with the fund complex/your financial intermediary.
| Table of Contents |
| President’s Letter | |
| Performance | |
| Portfolio Commentary | |
| Fund Characteristics | |
| Shareholder Fee Example | |
| Schedule of Investments | |
| Statement of Assets and Liabilities | |
| Statement of Operations | |
| Statement of Changes in Net Assets | |
| Notes to Financial Statements | |
| Financial Highlights | |
| Report of Independent Registered Public Accounting Firm | |
| Management | |
| Approval of Management Agreement | |
| Additional Information | |
Any opinions expressed in this report reflect those of the author as of the date of the report, and do not necessarily represent the opinions of American Century Investments® or any other person in the American Century Investments organization. Any such opinions are subject to change at any time based upon market or other conditions and American Century Investments disclaims any responsibility to update such opinions. These opinions may not be relied upon as investment advice and, because investment decisions made by American Century Investments funds are based on numerous factors, may not be relied upon as an indication of trading intent on behalf of any American Century Investments fund. Security examples are used for representational purposes only and are not intended as recommendations to purchase or sell securities. Performance information for comparative indices and securities is provided to American Century Investments by third party vendors. To the best of American Century Investments’ knowledge, such information is accurate at the time of printing.
| President’s Letter |
Jonathan ThomasDear Investor:
Thank you for reviewing this annual report for the 12 months ended November 30, 2018. Annual reports help convey important information about fund returns, including market factors that affected performance during the reporting period. For additional investment and market insights, please visit our website, americancentury.com.
Global Growth Divergence Drives Disparity in Stock Returns
The synchronization of global economic growth, which helped deliver robust gains for global stocks in 2017, unraveled as the 12-month period unfolded. The U.S. economy continued to expand at a healthy pace, but other regions experienced notable slowdowns. Similarly, stocks advanced in the U.S. but generally declined elsewhere.
In Europe, the threat of global tariffs from the U.S. dampened business sentiment and corporate earnings growth. In addition, uncertainties surrounding Brexit negotiations, Italy’s fiscal woes, and civil unrest in France weighed on economic and earnings growth outlooks and stock performance. Meanwhile, Japan’s economy contracted late in the period, largely due to the effects of several natural disasters, which curtailed personal and business spending. Global trade tensions also pressured Japan’s growth outlook.
After starting strong, emerging markets stocks quickly reversed course. The key culprits included rising U.S. interest rates, U.S.-China tariffs, and global trade-policy uncertainty. In addition, a strong U.S. dollar, falling oil prices, and several country-specific events weighed on the asset class. Late in the period, prospects for a tariff truce between the U.S. and China, along with dovish comments from the Federal Reserve, sparked a November rally among emerging markets stocks.
Overall, U.S. stocks, as measured by the S&P 500 Index, returned 6.27% for the 12 months. Non-U.S. developed markets stocks, as measured by the MSCI EAFE Index, declined 7.94%. Emerging markets stocks, as measured by the MSCI Emerging Markets Index, fell 9.09%.
Looking ahead, investors face a backdrop of uneven global growth, heightened market volatility, and lingering geopolitical uncertainties. But it’s often these challenging markets that produce the most compelling investment opportunities. We believe this scenario underscores the importance of using professionally managed portfolios in pursuit of investment goals. We appreciate your continued trust and confidence in us.
Sincerely,
Jonathan Thomas
President and Chief Executive Officer
American Century Investments
2
| Performance |
| Total Returns as of November 30, 2018 | ||||
| Average Annual Returns | ||||
Ticker Symbol | 1 year | Since Inception | Inception Date | |
| Investor Class | AFCNX | -6.95% | 7.10% | 3/29/16 |
| MSCI ACWI ex-U.S. Index | — | -8.12% | 7.71% | — |
| I Class | AFCSX | -6.78% | 7.31% | 3/29/16 |
| A Class | AFCLX | 3/29/16 | ||
| No sales charge | -7.19% | 6.83% | ||
| With sales charge | -12.53% | 4.49% | ||
| C Class | AFCHX | -7.95% | 6.01% | 3/29/16 |
| R Class | AFCWX | -7.44% | 6.56% | 3/29/16 |
| R6 Class | AFCMX | -6.62% | 7.47% | 3/29/16 |
Sales charges include initial sales charges and contingent deferred sales charges (CDSCs), as applicable. A Class shares have a 5.75% maximum initial sales charge and may be subject to a maximum CDSC of 1.00%. C Class shares redeemed within 12 months of purchase are subject to a maximum CDSC of 1.00%. The SEC requires that mutual funds provide performance information net of maximum sales charges in all cases where charges could be applied.
Data presented reflect past performance. Past performance is no guarantee of future results. Current performance may be higher or lower than the performance shown. Total returns for periods less than one year are not annualized. Investment return and principal value will fluctuate, and redemption value may be more or less than original cost. Data assumes reinvestment of dividends and capital gains, and none of the charts reflect the deduction of taxes that a shareholder would pay on fund distributions or the redemption of fund shares. To obtain performance data current to the most recent month end, please call 1-800-345-2021 or visit americancentury.com. For additional information about the fund, please consult the prospectus.
3
| Growth of $10,000 Over Life of Class |
| $10,000 investment made March 29, 2016 |
| Performance for other share classes will vary due to differences in fee structure. |
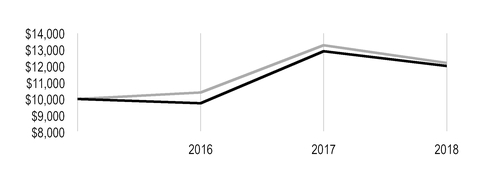
| Value on November 30, 2018 | |
| Investor Class — $12,012 | |
| MSCI ACWI ex-U.S. Index — $12,197 | |
Total Annual Fund Operating Expenses | |||||
Investor Class | I Class | A Class | C Class | R Class | R6 Class |
| 1.24% | 1.04% | 1.49% | 2.24% | 1.74% | 0.89% |
The total annual fund operating expenses shown is as stated in the fund’s prospectus current as of the date of this report. The prospectus may vary from the expense ratio shown elsewhere in this report because it is based on a different time period, includes acquired fund fees and expenses, and, if applicable, does not include fee waivers or expense reimbursements.
Data presented reflect past performance. Past performance is no guarantee of future results. Current performance may be higher or lower than the performance shown. Total returns for periods less than one year are not annualized. Investment return and principal value will fluctuate, and redemption value may be more or less than original cost. Data assumes reinvestment of dividends and capital gains, and none of the charts reflect the deduction of taxes that a shareholder would pay on fund distributions or the redemption of fund shares. To obtain performance data current to the most recent month end, please call 1-800-345-2021 or visit americancentury.com. For additional information about the fund, please consult the prospectus.
4
| Portfolio Commentary |
Portfolio Manager: Raj Gandhi and Jim Zhao
In September 2018, portfolio manager James Gendelman left the International Growth management team.
Performance Summary
Focused International Growth returned -6.95%* for the fiscal year ended November 30, 2018, compared with the -8.12% return of its benchmark, the MSCI ACWI ex-U.S. Index.
Focused International Growth declined during the fiscal year, but outperformed its benchmark. Security selection in the health care and consumer discretionary sectors contributed to relative performance, while holdings in the materials sector detracted. From a geographic perspective, stock selection in Japan lifted returns, whereas Canada-based holdings weighed on performance.
Non-U.S. equities, pressured by several global macroeconomic trends, significantly underperformed U.S. equities for the period. Rising concerns about decelerating earnings growth, Brexit uncertainty, potential trade war escalation, and slowing growth in China weighed on investor sentiment. In the last three months of the period, we saw the market rotate into low-volatility defensive stocks at the expense of cyclicals and high-growth stocks. The sell-off, which did not spare companies with good fundamentals and strong quarterly earnings, erased the year’s earlier gains. Although the shift to perceived safe havens has created a headwind, we remain confident in our bottom-up process, which focuses on identifying companies with accelerating, sustainable growth.
Earnings-Driven Stock Choices Boosted Relative Returns
Stock selection in the health care sector aided the fund’s relative returns. Lonza Group’s stock rose after it reported ahead-of-expectations results, beating both revenue and earnings estimates. This contract manufacturer and producer of biologics has benefited from increased outsourcing by the pharmaceutical industry. In addition, Lonza has begun to realize strong synergies from its Capsugel acquisition. Management raised full-year revenue guidance and margin targets. Stock of blood plasma company CSL advanced due to robust end demand for the firm’s plasma products and flu vaccine, new product launches, and a competitive supply position.
Within the consumer discretionary sector, two retailers made notable contributions. Don Quijote Holdings’ stock posted gains on improved revenue growth and margins as the discount retailer began to integrate its acquisition of Uny stores. The company plans to remodel all Uny stores to the Don Quijote format. Magazine Luiza’s stock advanced on strong quarterly results, exceeding expectations. The company continued to gain share as an improved customer experience drove strong comparable-store sales growth and increases in average ticket size.
MonotaRO, the online industrial product distributor, further lifted returns. The company reported better-than-expected second-quarter results followed by several better-than-expected monthly sales reports. MonotaRO also reported strong growth in new customer acquisition as it continues to lead the industry transition to online in Japan.
*All fund returns referenced in this commentary are for Investor Class shares. Performance for other share classes will vary due to differences in fee structure; when Investor Class performance exceeds that of the fund's benchmark, other share classes may not. See page 3 for returns for all share classes.
5
Stocks Heavily Exposed to Cyclical Industries Led Detractors
Materials holdings weighed on the fund’s performance. Mining company First Quantum Minerals’ stock weakened as concerns about the global growth slowdown weighed on the price of copper. We exited the position as more evidence of weakening demand became apparent. Umicore, a firm that makes materials used in electric vehicle batteries, and cement and aggregates firm HeidelbergCement were also among the top detractors. We sold our position in HeidelbergCement after continued disappointment in volume growth and increasing cost pressures gave us concern about the potential for downward earnings revisions.
Bombardier’s stock fell significantly after the airplane and train manufacturer’s free cash flow forecasts disappointed. Our thesis was that improvements in business jet demand and the commercial aircraft division would drive free cash flow growth, but our confidence in this outcome diminished, and we sold our position.
Banco do Brasil also detracted from returns. The bank reported disappointing earnings as its net interest margin came in below expectations. We exited the position due to risk of continued disruption to earnings improvement.
Outlook
Despite the challenging market environment, we continue to focus on our disciplined process of identifying companies with accelerating, sustainable growth, where we see upside to consensus estimates. Our process has led us to focus on companies with intrinsic growth drivers that are not dependent on economic improvement. At period-end, the fund’s largest overweight position relative to the benchmark was in the consumer discretionary sector. The shift to e-commerce combined with consumers’ desire for lifestyle improvement and wellness helped drive the consumer discretionary overweight. Athletic wear retailers are among those companies benefiting from these trends. Growth drivers affecting our position in the information technology sector include the advent of 5G, increased capital expenditure in automation, data, and data management, and the shift to online solutions in multiple industries. Already the fund's largest underweight relative to the benchmark, our financials position shrank further with the sale of two emerging markets banks. The fund's industrials weighting also decreased as we see mounting evidence of peaking revenue growth and margins in multiple cyclical areas such as automobiles, semiconductors, and construction. These data points have increased our concerns about decelerating earnings growth and possible negative earnings revisions.
The fund’s largest regional overweight remains Europe. The emerging markets region has replaced North America as the fund's largest regional underweight.
6
| Fund Characteristics |
| NOVEMBER 30, 2018 | |
Top Ten Holdings | % of net assets |
| Lonza Group AG | 4.0% |
| AIA Group Ltd. | 3.8% |
| AstraZeneca plc | 3.7% |
| London Stock Exchange Group plc | 3.6% |
| Diageo plc | 3.6% |
| Novartis AG | 3.5% |
| CSL Ltd. | 3.4% |
| Shiseido Co. Ltd. | 3.4% |
| Recruit Holdings Co. Ltd. | 3.1% |
| Localiza Rent a Car SA | 3.0% |
Types of Investments in Portfolio | % of net assets |
| Common Stocks | 98.6% |
| Temporary Cash Investments | 1.3% |
| Other Assets and Liabilities | 0.1% |
Investments by Country | % of net assets |
| Japan | 18.0% |
| United Kingdom | 15.7% |
| France | 8.6% |
| Switzerland | 7.5% |
| China | 6.8% |
| Australia | 5.9% |
| Sweden | 5.6% |
| Brazil | 5.3% |
| Germany | 4.9% |
| Belgium | 4.9% |
| Hong Kong | 3.8% |
| Austria | 2.8% |
| Canada | 2.2% |
| India | 2.1% |
| Finland | 2.1% |
| Other Countries | 2.4% |
| Cash and Equivalents* | 1.4% |
*Includes temporary cash investments and other assets and liabilities.
7
| Shareholder Fee Example |
Fund shareholders may incur two types of costs: (1) transaction costs, including sales charges (loads) on purchase payments and redemption/exchange fees; and (2) ongoing costs, including management fees; distribution and service (12b-1) fees; and other fund expenses. This example is intended to help you understand your ongoing costs (in dollars) of investing in your fund and to compare these costs with the ongoing cost of investing in other mutual funds.
The example is based on an investment of $1,000 made at the beginning of the period and held for the entire period from June 1, 2018 to November 30, 2018.
Actual Expenses
The table provides information about actual account values and actual expenses for each class. You may use the information, together with the amount you invested, to estimate the expenses that you paid over the period. First, identify the share class you own. Then simply divide your account value by $1,000 (for example, an $8,600 account value divided by $1,000 = 8.6), then multiply the result by the number under the heading “Expenses Paid During Period” to estimate the expenses you paid on your account during this period.
If you hold Investor Class shares of any American Century Investments fund, or I Class shares of the American Century Diversified Bond Fund, in an American Century Investments account (i.e., not a financial intermediary or retirement plan account), American Century Investments may charge you a $12.50 semiannual account maintenance fee if the value of those shares is less than $10,000. We will redeem shares automatically in one of your accounts to pay the $12.50 fee. In determining your total eligible investment amount, we will include your investments in all personal accounts (including American Century Investments Brokerage accounts) registered under your Social Security number. Personal accounts include individual accounts, joint accounts, UGMA/UTMA accounts, personal trusts, Coverdell Education Savings Accounts and IRAs (including traditional, Roth, Rollover, SEP-, SARSEP- and SIMPLE-IRAs), and certain other retirement accounts. If you have only business, business retirement, employer-sponsored or American Century Investments Brokerage accounts, you are currently not subject to this fee. If you are subject to the Account Maintenance Fee, your account value could be reduced by the fee amount.
Hypothetical Example for Comparison Purposes
The table also provides information about hypothetical account values and hypothetical expenses based on the actual expense ratio of each class of your fund and an assumed rate of return of 5% per year before expenses, which is not the actual return of a fund’s share class. The hypothetical account values and expenses may not be used to estimate the actual ending account balance or expenses you paid for the period. You may use this information to compare the ongoing costs of investing in your fund and other funds. To do so, compare this 5% hypothetical example with the 5% hypothetical examples that appear in the shareholder reports of the other funds.
Please note that the expenses shown in the table are meant to highlight your ongoing costs only and do not reflect any transactional costs, such as sales charges (loads) or redemption/exchange fees. Therefore, the table is useful in comparing ongoing costs only, and will not help you determine the relative total costs of owning different funds. In addition, if these transactional costs were included, your costs would have been higher.
8
| Beginning Account Value 6/1/18 | Ending Account Value 11/30/18 | Expenses Paid During Period(1) 6/1/18 - 11/30/18 | Annualized Expense Ratio(1) | |
Actual | ||||
| Investor Class | $1,000 | $872.60 | $5.77 | 1.23% |
| I Class | $1,000 | $873.60 | $4.84 | 1.03% |
| A Class | $1,000 | $871.50 | $6.94 | 1.48% |
| C Class | $1,000 | $867.90 | $10.44 | 2.23% |
| R Class | $1,000 | $870.40 | $8.11 | 1.73% |
| R6 Class | $1,000 | $873.90 | $4.13 | 0.88% |
| Hypothetical | ||||
| Investor Class | $1,000 | $1,018.90 | $6.23 | 1.23% |
| I Class | $1,000 | $1,019.90 | $5.22 | 1.03% |
| A Class | $1,000 | $1,017.65 | $7.49 | 1.48% |
| C Class | $1,000 | $1,013.89 | $11.26 | 2.23% |
| R Class | $1,000 | $1,016.40 | $8.74 | 1.73% |
| R6 Class | $1,000 | $1,020.66 | $4.46 | 0.88% |
| (1) | Expenses are equal to the class's annualized expense ratio listed in the table above, multiplied by the average account value over the period, multiplied by 183, the number of days in the most recent fiscal half-year, divided by 365, to reflect the one-half year period. Annualized expense ratio reflects actual expenses, including any applicable fee waivers or expense reimbursements and excluding any acquired fund fees and expenses. |
9
| Schedule of Investments |
NOVEMBER 30, 2018
| Shares | Value | ||||
| COMMON STOCKS — 98.6% | |||||
| Australia — 5.9% | |||||
| CSL Ltd. | 2,630 | $ | 342,477 | ||
| Treasury Wine Estates Ltd. | 23,620 | 246,165 | |||
| 588,642 | |||||
| Austria — 2.8% | |||||
Erste Group Bank AG(1) | 7,170 | 283,012 | |||
| Belgium — 4.9% | |||||
| KBC Group NV | 3,310 | 238,213 | |||
| Umicore SA | 5,690 | 247,058 | |||
| 485,271 | |||||
| Brazil — 5.3% | |||||
| Localiza Rent a Car SA | 43,700 | 304,103 | |||
| Magazine Luiza SA | 5,300 | 225,637 | |||
| 529,740 | |||||
| Canada — 2.2% | |||||
Canada Goose Holdings, Inc.(1) | 3,180 | 214,173 | |||
| China — 6.8% | |||||
Alibaba Group Holding Ltd. ADR(1) | 1,630 | 262,202 | |||
| ANTA Sports Products Ltd. | 40,000 | 182,538 | |||
| Tencent Holdings Ltd. | 5,900 | 236,656 | |||
| 681,396 | |||||
| Denmark — 0.8% | |||||
| DSV A/S | 1,100 | 84,190 | |||
| Finland — 2.1% | |||||
| Neste Oyj | 2,660 | 208,111 | |||
| France — 8.6% | |||||
| Danone SA | 2,210 | 165,400 | |||
| Kering SA | 430 | 188,328 | |||
| Thales SA | 2,280 | 280,564 | |||
Ubisoft Entertainment SA(1) | 2,800 | 229,306 | |||
| 863,598 | |||||
| Germany — 4.9% | |||||
| adidas AG | 960 | 211,739 | |||
| Symrise AG | 3,480 | 280,762 | |||
| 492,501 | |||||
| Hong Kong — 3.8% | |||||
| AIA Group Ltd. | 46,000 | 377,301 | |||
| India — 2.1% | |||||
| HDFC Bank Ltd. ADR | 2,080 | 210,954 | |||
| Japan — 18.0% | |||||
| Don Quijote Holdings Co. Ltd. | 3,300 | 200,303 | |||
| Komatsu Ltd. | 3,100 | 82,829 | |||
10
| Shares | Value | ||||
| MonotaRO Co. Ltd. | 9,400 | $ | 254,906 | ||
| Recruit Holdings Co. Ltd. | 11,300 | 311,175 | |||
| Shiseido Co. Ltd. | 5,300 | 337,618 | |||
| TDK Corp. | 2,400 | 191,379 | |||
| Terumo Corp. | 3,800 | 223,785 | |||
| ZOZO, Inc. | 9,000 | 200,391 | |||
| 1,802,386 | |||||
| Russia — 1.6% | |||||
Yandex NV, A Shares(1) | 5,310 | 156,645 | |||
| Sweden — 5.6% | |||||
| Lundin Petroleum AB | 8,350 | 220,489 | |||
Spotify Technology SA(1) | 870 | 118,651 | |||
| Telefonaktiebolaget LM Ericsson, B Shares | 25,950 | 216,937 | |||
| 556,077 | |||||
| Switzerland — 7.5% | |||||
Lonza Group AG(1) | 1,240 | 402,093 | |||
| Novartis AG | 3,830 | 349,628 | |||
| 751,721 | |||||
| United Kingdom — 15.7% | |||||
| AstraZeneca plc | 4,750 | 371,291 | |||
| B&M European Value Retail SA | 49,596 | 220,830 | |||
| Diageo plc | 9,850 | 354,871 | |||
| Intertek Group plc | 4,440 | 266,436 | |||
| London Stock Exchange Group plc | 6,960 | 357,890 | |||
| 1,571,318 | |||||
TOTAL COMMON STOCKS (Cost $8,900,153) | 9,857,036 | ||||
| TEMPORARY CASH INVESTMENTS — 1.3% | |||||
| Repurchase Agreement, BMO Capital Markets Corp., (collateralized by various U.S. Treasury obligations, 1.125% - 3.125%, 5/31/19 - 11/15/28, valued at $105,185), in a joint trading account at 2.00%, dated 11/30/18, due 12/3/18 (Delivery value $103,134) | 103,117 | ||||
| State Street Institutional U.S. Government Money Market Fund, Premier Class | 22,983 | 22,983 | |||
TOTAL TEMPORARY CASH INVESTMENTS (Cost $126,100) | 126,100 | ||||
TOTAL INVESTMENT SECURITIES — 99.9% (Cost $9,026,253) | 9,983,136 | ||||
| OTHER ASSETS AND LIABILITIES — 0.1% | 8,445 | ||||
| TOTAL NET ASSETS — 100.0% | $ | 9,991,581 | |||
11
| MARKET SECTOR DIVERSIFICATION | ||
(as a % of net assets) | ||
| Consumer Discretionary | 19.1 | % |
| Health Care | 16.8 | % |
| Industrials | 15.8 | % |
| Financials | 14.7 | % |
| Consumer Staples | 11.0 | % |
| Communication Services | 7.5 | % |
| Materials | 5.3 | % |
| Energy | 4.3 | % |
| Information Technology | 4.1 | % |
| Cash and Equivalents* | 1.4 | % |
*Includes temporary cash investments and other assets and liabilities.
| NOTES TO SCHEDULE OF INVESTMENTS | ||
| ADR | - | American Depositary Receipt |
| (1) | Non-income producing. |
See Notes to Financial Statements.
12
| Statement of Assets and Liabilities |
| NOVEMBER 30, 2018 | |||
| Assets | |||
| Investment securities, at value (cost of $9,026,253) | $ | 9,983,136 | |
| Foreign currency holdings, at value (cost of $383) | 382 | ||
| Receivable for investments sold | 64,805 | ||
| Receivable for capital shares sold | 641 | ||
| Dividends and interest receivable | 14,862 | ||
| 10,063,826 | |||
| Liabilities | |||
| Payable for investments purchased | 50,688 | ||
| Payable for capital shares redeemed | 10,307 | ||
| Accrued management fees | 9,866 | ||
| Distribution and service fees payable | 1,384 | ||
| 72,245 | |||
| Net Assets | $ | 9,991,581 | |
| Net Assets Consist of: | |||
| Capital (par value and paid-in surplus) | $ | 9,188,692 | |
| Distributable earnings | 802,889 | ||
| $ | 9,991,581 | ||
| Net Assets | Shares Outstanding | Net Asset Value Per Share | ||||
| Investor Class, $0.01 Par Value | $6,179,938 | 518,434 | $11.92 | |||
| I Class, $0.01 Par Value | $776,300 | 64,910 | $11.96 | |||
| A Class, $0.01 Par Value | $1,217,015 | 102,530 | $11.87* | |||
| C Class, $0.01 Par Value | $1,169,686 | 100,015 | $11.70 | |||
| R Class, $0.01 Par Value | $406,150 | 34,363 | $11.82 | |||
| R6 Class, $0.01 Par Value | $242,492 | 20,225 | $11.99 | |||
*Maximum offering price $12.59 (net asset value divided by 0.9425).
See Notes to Financial Statements.
13
| Statement of Operations |
| YEAR ENDED NOVEMBER 30, 2018 | |||
| Investment Income (Loss) | |||
| Income: | |||
| Dividends (net of foreign taxes withheld of $18,870) | $ | 212,385 | |
| Interest | 3,465 | ||
| 215,850 | |||
| Expenses: | |||
| Management fees | 143,330 | ||
| Distribution and service fees: | |||
| A Class | 3,369 | ||
| C Class | 13,102 | ||
| R Class | 1,981 | ||
| Directors' fees and expenses | 330 | ||
| 162,112 | |||
| Net investment income (loss) | 53,738 | ||
| Realized and Unrealized Gain (Loss) | |||
| Net realized gain (loss) on: | |||
| Investment transactions | (64,172 | ) | |
| Foreign currency translation transactions | (10,674 | ) | |
| (74,846 | ) | ||
| Change in net unrealized appreciation (depreciation) on: | |||
| Investments | (884,839 | ) | |
| Translation of assets and liabilities in foreign currencies | (370 | ) | |
| (885,209 | ) | ||
| Net realized and unrealized gain (loss) | (960,055 | ) | |
| Net Increase (Decrease) in Net Assets Resulting from Operations | $ | (906,317 | ) |
See Notes to Financial Statements.
14
| Statement of Changes in Net Assets |
| YEARS ENDED NOVEMBER 30, 2018 AND NOVEMBER 30, 2017 | ||||||
| Increase (Decrease) in Net Assets | November 30, 2018 | November 30, 2017 | ||||
| Operations | ||||||
| Net investment income (loss) | $ | 53,738 | $ | (3,393 | ) | |
| Net realized gain (loss) | (74,846 | ) | 28,896 | |||
| Change in net unrealized appreciation (depreciation) | (885,209 | ) | 1,840,641 | |||
| Net increase (decrease) in net assets resulting from operations | (906,317 | ) | 1,866,144 | |||
| Distributions to Shareholders | ||||||
| From earnings: | ||||||
| Investor Class | — | (15,998 | ) | |||
| I Class | — | (5,676 | ) | |||
| A Class | — | (5,085 | ) | |||
| R Class | — | (529 | ) | |||
| R6 Class | — | (2,184 | ) | |||
| Decrease in net assets from distributions | — | (29,472 | ) | |||
| Capital Share Transactions | ||||||
| Net increase (decrease) in net assets from capital share transactions (Note 5) | 1,116,468 | 2,946,598 | ||||
| Net increase (decrease) in net assets | 210,151 | 4,783,270 | ||||
| Net Assets | ||||||
| Beginning of period | 9,781,430 | 4,998,160 | ||||
| End of period | $ | 9,991,581 | $ | 9,781,430 | ||
See Notes to Financial Statements.
15
| Notes to Financial Statements |
NOVEMBER 30, 2018
1. Organization
American Century World Mutual Funds, Inc. (the corporation) is registered under the Investment Company Act of 1940, as amended (the 1940 Act), as an open-end management investment company and is organized as a Maryland corporation. Focused International Growth Fund (the fund) is one fund in a series issued by the corporation. The fund's investment objective is to seek capital growth.
The fund offers the Investor Class, I Class, A Class, C Class, R Class and R6 Class. The A Class may incur an initial sales charge. The A Class and C Class may be subject to a contingent deferred sales charge.
2. Significant Accounting Policies
The following is a summary of significant accounting policies consistently followed by the fund in preparation of its financial statements. The fund is an investment company and follows accounting and reporting guidance in accordance with accounting principles generally accepted in the United States of America. This may require management to make certain estimates and assumptions at the date of the financial statements. Actual results could differ from these estimates. Management evaluated the impact of events or transactions occurring through the date the financial statements were issued that would merit recognition or disclosure.
Investment Valuations — The fund determines the fair value of its investments and computes its net asset value per share at the close of regular trading (usually 4 p.m. Eastern time) on the New York Stock Exchange (NYSE) on each day the NYSE is open. The Board of Directors has adopted valuation policies and procedures to guide the investment advisor in the fund’s investment valuation process and to provide methodologies for the oversight of the fund’s pricing function.
Equity securities that are listed or traded on a domestic securities exchange are valued at the last reported sales price or at the official closing price as provided by the exchange. Equity securities traded on foreign securities exchanges are generally valued at the closing price of such securities on the exchange where primarily traded or at the close of the NYSE, if that is earlier. If no last sales price is reported, or if local convention or regulation so provides, the mean of the latest bid and asked prices may be used. Securities traded over-the-counter are valued at the mean of the latest bid and asked prices, the last sales price, or the official closing price. Equity securities initially expressed in local currencies are translated into U.S. dollars at the mean of the appropriate currency exchange rate at the close of the NYSE as provided by an independent pricing service.
Open-end management investment companies are valued at the reported net asset value per share. Repurchase agreements are valued at cost, which approximates fair value.
If the fund determines that the market price for an investment is not readily available or the valuation methods mentioned above do not reflect an investment’s fair value, such investment is valued as determined in good faith by the Board of Directors or its delegate, in accordance with policies and procedures adopted by the Board of Directors. In its determination of fair value, the fund may review several factors including, but not limited to, market information regarding the specific investment or comparable investments and correlation with other investment types, futures indices or general market indicators. Circumstances that may cause the fund to use these procedures to value an investment include, but are not limited to: an investment has been declared in default or is distressed; trading in a security has been suspended during the trading day or a security is not actively trading on its principal exchange; prices received from a regular pricing source are deemed unreliable; or there is a foreign market holiday and no trading occurred.
16
The fund monitors for significant events occurring after the close of an investment’s primary exchange but before the fund’s net asset value per share is determined. Significant events may include, but are not limited to: corporate announcements and transactions; governmental action and political unrest that could impact a specific investment or an investment sector; or armed conflicts, natural disasters and similar events that could affect investments in a specific country or region. The fund also monitors for significant fluctuations between domestic and foreign markets, as evidenced by the U.S. market or such other indicators that the Board of Directors, or its delegate, deems appropriate. If significant fluctuations in foreign markets are identified, the fund may apply a model-derived factor to the closing price of equity securities traded on foreign securities exchanges. The factor is based on observable market data as provided by an independent pricing service.
Security Transactions — Security transactions are accounted for as of the trade date. Net realized gains and losses are determined on the identified cost basis, which is also used for federal income tax purposes.
Investment Income — Dividend income less foreign taxes withheld, if any, is recorded as of the ex-dividend date. Distributions received on securities that represent a return of capital or long-term capital gain are recorded as a reduction of cost of investments and/or as a realized gain. The fund may estimate the components of distributions received that may be considered nontaxable distributions or long-term capital gain distributions for income tax purposes. Interest income is recorded on the accrual basis and includes accretion of discounts and amortization of premiums.
Foreign Currency Translations — All assets and liabilities initially expressed in foreign currencies are translated into U.S. dollars at prevailing exchange rates at period end. The fund may enter into spot foreign currency exchange contracts to facilitate transactions denominated in a foreign currency. Purchases and sales of investment securities, dividend and interest income, spot foreign currency exchange contracts, and expenses are translated at the rates of exchange prevailing on the respective dates of such transactions. Net realized and unrealized foreign currency exchange gains or losses related to investment securities are a component of net realized gain (loss) on investment transactions and change in net unrealized appreciation (depreciation) on investments, respectively.
Repurchase Agreements — The fund may enter into repurchase agreements with institutions that American Century Investment Management, Inc. (ACIM) (the investment advisor) has determined are creditworthy pursuant to criteria adopted by the Board of Directors. The fund requires that the collateral, represented by securities, received in a repurchase transaction be transferred to the custodian in a manner sufficient to enable the fund to obtain those securities in the event of a default under the repurchase agreement. ACIM monitors, on a daily basis, the securities transferred to ensure the value, including accrued interest, of the securities under each repurchase agreement is equal to or greater than amounts owed to the fund under each repurchase agreement.
Joint Trading Account — Pursuant to an Exemptive Order issued by the Securities and Exchange Commission, the fund, along with certain other funds in the American Century Investments family of funds, may transfer uninvested cash balances into a joint trading account. These balances are invested in one or more repurchase agreements that are collateralized by U.S. Treasury or Agency obligations.
Income Tax Status — It is the fund’s policy to distribute substantially all net investment income and net realized gains to shareholders and to otherwise qualify as a regulated investment company under provisions of the Internal Revenue Code. Accordingly, no provision has been made for income taxes. The fund files U.S. federal, state, local and non-U.S. tax returns as applicable. The fund's tax returns are subject to examination by the relevant taxing authority until expiration of the applicable statute of limitations, which is generally three years from the date of filing but can be longer in certain jurisdictions. At this time, management believes there are no uncertain tax positions which, based on their technical merit, would not be sustained upon examination and for which it is reasonably possible that the total amounts of unrecognized tax benefits will significantly change in the next twelve months.
Multiple Class — All shares of the fund represent an equal pro rata interest in the net assets of the class to which such shares belong, and have identical voting, dividend, liquidation and other rights and the same terms and conditions, except for class specific expenses and exclusive rights to vote on matters affecting only individual classes. Income, non-class specific expenses, and realized and unrealized capital gains and losses of the fund are allocated to each class of shares based on their relative net assets.
Distributions to Shareholders — Distributions from net investment income and net realized gains, if any, are generally declared and paid annually. The fund may make distributions on a more frequent basis to comply with the distribution requirements of the Internal Revenue Code, in all events in a manner consistent with provisions of the 1940 Act.
17
Indemnifications — Under the corporation’s organizational documents, its officers and directors are indemnified against certain liabilities arising out of the performance of their duties to the fund. In addition, in the normal course of business, the fund enters into contracts that provide general indemnifications. The maximum exposure under these arrangements is unknown as this would involve future claims that may be made against a fund. The risk of material loss from such claims is considered by management to be remote.
3. Fees and Transactions with Related Parties
Certain officers and directors of the corporation are also officers and/or directors of American Century Companies, Inc. (ACC). The corporation’s investment advisor, ACIM, the corporation's distributor, American Century Investment Services, Inc. (ACIS), and the corporation’s transfer agent, American Century Services, LLC, are wholly owned, directly or indirectly, by ACC. ACIM owns 60% of the shares of the fund. Related parties do not invest in the fund for the purpose of exercising management or control.
Management Fees — The corporation has entered into a management agreement with ACIM, under which ACIM provides the fund with investment advisory and management services in exchange for a single, unified management fee (the fee) per class. The agreement provides that all expenses of managing and operating the fund, except distribution and service fees, brokerage expenses, taxes, interest, fees and expenses of the independent directors (including legal counsel fees), and extraordinary expenses, will be paid by ACIM. The fee is computed and accrued daily based on each class's daily net assets and paid monthly in arrears. The difference in the fee among the classes is a result of their separate arrangements for non-Rule 12b-1 shareholder services. It is not the result of any difference in advisory or custodial fees or other expenses related to the management of the fund’s assets, which do not vary by class.
The annual management fee for each class is as follows:
| Investor Class | I Class | A Class | C Class | R Class | R6 Class |
| 1.23% | 1.03% | 1.23% | 1.23% | 1.23% | 0.88% |
Distribution and Service Fees — The Board of Directors has adopted a separate Master Distribution and Individual Shareholder Services Plan for each of the A Class, C Class and R Class (collectively the plans), pursuant to Rule 12b-1 of the 1940 Act. The plans provide that the A Class will pay ACIS an annual distribution and service fee of 0.25%. The plans provide that the C Class will pay ACIS an annual distribution and service fee of 1.00%, of which 0.25% is paid for individual shareholder services and 0.75% is paid for distribution services. The plans provide that the R Class will pay ACIS an annual distribution and service fee of 0.50%. The fees are computed and accrued daily based on each class’s daily net assets and paid monthly in arrears. The fees are used to pay financial intermediaries for distribution and individual shareholder services. Fees incurred under the plans during the period ended November 30, 2018 are detailed in the Statement of Operations.
Directors' Fees and Expenses — The Board of Directors is responsible for overseeing the investment advisor’s management and operations of the fund. The directors receive detailed information about the fund and its investment advisor regularly throughout the year, and meet at least quarterly with management of the investment advisor to review reports about fund operations. The fund’s officers do not receive compensation from the fund.
4. Investment Transactions
Purchases and sales of investment securities, excluding short-term investments, for the period ended November 30, 2018 were $10,924,484 and $9,408,954, respectively.
18
5. Capital Share Transactions
Transactions in shares of the fund were as follows:
| Year ended November 30, 2018 | Year ended November 30, 2017 | |||||||||
| Shares | Amount | Shares | Amount | |||||||
| Investor Class/Shares Authorized | 50,000,000 | 50,000,000 | ||||||||
| Sold | 528,514 | $ | 7,140,621 | 312,694 | $ | 3,673,401 | ||||
| Issued in reinvestment of distributions | — | — | 1,649 | 15,998 | ||||||
| Redeemed | (469,257 | ) | (6,238,274 | ) | (67,881 | ) | (795,766 | ) | ||
| 59,257 | 902,347 | 246,462 | 2,893,633 | |||||||
| I Class/Shares Authorized | 35,000,000 | 50,000,000 | ||||||||
| Sold | 4,325 | 50,773 | — | — | ||||||
| Issued in reinvestment of distributions | — | — | 585 | 5,676 | ||||||
| 4,325 | 50,773 | 585 | 5,676 | |||||||
| A Class/Shares Authorized | 30,000,000 | 40,000,000 | ||||||||
| Sold | 1,672 | 22,494 | 201 | 2,367 | ||||||
| Issued in reinvestment of distributions | — | — | 524 | 5,085 | ||||||
| Redeemed | (358 | ) | (5,089 | ) | — | — | ||||
| 1,314 | 17,405 | 725 | 7,452 | |||||||
| C Class/Shares Authorized | 30,000,000 | 30,000,000 | ||||||||
| Sold | 3 | 35 | 12 | 147 | ||||||
| R Class/Shares Authorized | 30,000,000 | 30,000,000 | ||||||||
| Sold | 14,078 | 184,615 | 3,495 | 42,262 | ||||||
| Issued in reinvestment of distributions | — | — | 54 | 529 | ||||||
| Redeemed | (3,020 | ) | (38,707 | ) | (430 | ) | (5,285 | ) | ||
| 11,058 | 145,908 | 3,119 | 37,506 | |||||||
| R6 Class/Shares Authorized | 30,000,000 | 50,000,000 | ||||||||
| Issued in reinvestment of distributions | — | — | 225 | 2,184 | ||||||
| Net increase (decrease) | 75,957 | $ | 1,116,468 | 251,128 | $ | 2,946,598 | ||||
6. Fair Value Measurements
The fund’s investments valuation process is based on several considerations and may use multiple inputs to determine the fair value of the investments held by the fund. In conformity with accounting principles generally accepted in the United States of America, the inputs used to determine a valuation are classified into three broad levels.
| • | Level 1 valuation inputs consist of unadjusted quoted prices in an active market for identical investments. |
| • | Level 2 valuation inputs consist of direct or indirect observable market data (including quoted prices for comparable investments, evaluations of subsequent market events, interest rates, prepayment speeds, credit risk, etc.). These inputs also consist of quoted prices for identical investments initially expressed in local currencies that are adjusted through translation into U.S. dollars. |
| • | Level 3 valuation inputs consist of unobservable data (including a fund’s own assumptions). |
The level classification is based on the lowest level input that is significant to the fair valuation measurement. The valuation inputs are not necessarily an indication of the risks associated with investing in these securities or other financial instruments.
19
The following is a summary of the level classifications as of period end. The Schedule of Investments provides additional information on the fund’s portfolio holdings.
| Level 1 | Level 2 | Level 3 | ||||||
| Assets | ||||||||
| Investment Securities | ||||||||
| Common Stocks | ||||||||
| Canada | $ | 214,173 | — | — | ||||
| China | 262,202 | $ | 419,194 | — | ||||
| India | 210,954 | — | — | |||||
| Russia | 156,645 | — | — | |||||
| Sweden | 118,651 | 437,426 | — | |||||
| Other Countries | — | 8,037,791 | — | |||||
| Temporary Cash Investments | 22,983 | 103,117 | — | |||||
| $ | 985,608 | $ | 8,997,528 | — | ||||
7. Risk Factors
There are certain risks involved in investing in foreign securities. These risks include those resulting from future adverse political, social and economic developments, fluctuations in currency exchange rates, the possible imposition of exchange controls, and other foreign laws or restrictions. Investing in emerging markets may accentuate these risks.
8. Federal Tax Information
On December 18, 2018, the fund declared and paid the following per-share distributions from net investment income to shareholders of record on December 17, 2018:
| Investor Class | I Class | A Class | C Class | R Class | R6 Class |
| $0.0616 | $0.0843 | $0.0332 | — | $0.0048 | $0.1014 |
The tax character of distributions paid during the years ended November 30, 2018 and November 30, 2017 were as follows:
| 2018 | 2017 | ||||
| Distributions Paid From | |||||
| Ordinary income | — | $ | 29,472 | ||
| Long-term capital gains | — | — | |||
The book-basis character of distributions made during the year from net investment income or net realized gains may differ from their ultimate characterization for federal income tax purposes. These differences reflect the differing character of certain income items and net realized gains and losses for financial statement and tax purposes, and may result in reclassification among certain capital accounts on the financial statements.
20
As of period end, the federal tax cost of investments and the components of distributable earnings on a tax-basis were as follows:
| Federal tax cost of investments | $ | 9,045,183 | |
| Gross tax appreciation of investments | $ | 1,339,579 | |
| Gross tax depreciation of investments | (401,626 | ) | |
| Net tax appreciation (depreciation) of investments | 937,953 | ||
| Net tax appreciation (depreciation) on translation of assets and liabilities in foreign currencies | (112 | ) | |
| Net tax appreciation (depreciation) | $ | 937,841 | |
| Undistributed ordinary income | $ | 43,193 | |
| Accumulated short-term capital losses | $ | (178,145 | ) |
The difference between book-basis and tax-basis unrealized appreciation (depreciation) is attributable primarily to the tax deferral of losses on wash sales.
Accumulated capital losses represent net capital loss carryovers that may be used to offset future realized capital gains for federal income tax purposes. The capital loss carryovers may be carried forward for an unlimited period. Future capital loss carryover utilization in any given year may be subject to Internal Revenue Code limitations.
21
| Financial Highlights |
| For a Share Outstanding Throughout the Years Ended November 30 (except as noted) | |||||||||||||
| Per-Share Data | Ratios and Supplemental Data | ||||||||||||
| Income From Investment Operations: | Ratio to Average Net Assets of: | ||||||||||||
| Net Asset Value, Beginning of Period | Net Investment Income (Loss)(1) | Net Realized and Unrealized Gain (Loss) | Total From Investment Operations | Distributions From Net Investment Income | Net Asset Value, End of Period | Total Return(2) | Operating Expenses | Net Investment Income (Loss) | Portfolio Turnover Rate | Net Assets, End of Period (in thousands) | |||
| Investor Class | |||||||||||||
| 2018 | $12.81 | 0.08 | (0.97) | (0.89) | — | $11.92 | (6.95)% | 1.23% | 0.59% | 82% | $6,180 | ||
| 2017 | $9.75 | 0.01 | 3.13 | 3.14 | (0.08) | $12.81 | 32.40% | 1.24% | 0.14% | 76% | $5,882 | ||
2016(3) | $10.00 | 0.04 | (0.29) | (0.25) | — | $9.75 | (2.50)% | 1.23%(4) | 0.56%(4) | 47% | $2,074 | ||
| I Class | |||||||||||||
| 2018 | $12.83 | 0.09 | (0.96) | (0.87) | — | $11.96 | (6.78)% | 1.03% | 0.79% | 82% | $776 | ||
| 2017 | $9.76 | 0.05 | 3.11 | 3.16 | (0.09) | $12.83 | 32.74% | 1.04% | 0.34% | 76% | $777 | ||
2016(3) | $10.00 | 0.05 | (0.29) | (0.24) | — | $9.76 | (2.40)% | 1.03%(4) | 0.76%(4) | 47% | $586 | ||
| A Class | |||||||||||||
| 2018 | $12.79 | 0.03 | (0.95) | (0.92) | — | $11.87 | (7.19)% | 1.48% | 0.34% | 82% | $1,217 | ||
| 2017 | $9.73 | (0.01) | 3.12 | 3.11 | (0.05) | $12.79 | 32.13% | 1.49% | (0.11)% | 76% | $1,295 | ||
2016(3) | $10.00 | 0.02 | (0.29) | (0.27) | — | $9.73 | (2.70)% | 1.48%(4) | 0.31%(4) | 47% | $978 | ||
| C Class | |||||||||||||
| 2018 | $12.70 | (0.07) | (0.93) | (1.00) | — | $11.70 | (7.95)% | 2.23% | (0.41)% | 82% | $1,170 | ||
| 2017 | $9.68 | (0.09) | 3.11 | 3.02 | — | $12.70 | 31.20% | 2.24% | (0.86)% | 76% | $1,270 | ||
2016(3) | $10.00 | (0.03) | (0.29) | (0.32) | — | $9.68 | (3.20)% | 2.23%(4) | (0.44)%(4) | 47% | $968 | ||
| For a Share Outstanding Throughout the Years Ended November 30 (except as noted) | |||||||||||||
| Per-Share Data | Ratios and Supplemental Data | ||||||||||||
| Income From Investment Operations: | Ratio to Average Net Assets of: | ||||||||||||
| Net Asset Value, Beginning of Period | Net Investment Income (Loss)(1) | Net Realized and Unrealized Gain (Loss) | Total From Investment Operations | Distributions From Net Investment Income | Net Asset Value, End of Period | Total Return(2) | Operating Expenses | Net Investment Income (Loss) | Portfolio Turnover Rate | Net Assets, End of Period (in thousands) | |||
| R Class | |||||||||||||
| 2018 | $12.77 | —(5) | (0.95) | (0.95) | — | $11.82 | (7.44)% | 1.73% | 0.09% | 82% | $406 | ||
| 2017 | $9.72 | (0.04) | 3.12 | 3.08 | (0.03) | $12.77 | 31.73% | 1.74% | (0.36)% | 76% | $298 | ||
2016(3) | $10.00 | —(5) | (0.28) | (0.28) | — | $9.72 | (2.80)% | 1.73%(4) | 0.06%(4) | 47% | $196 | ||
| R6 Class | |||||||||||||
| 2018 | $12.84 | 0.11 | (0.96) | (0.85) | — | $11.99 | (6.62)% | 0.88% | 0.94% | 82% | $242 | ||
| 2017 | $9.77 | 0.06 | 3.12 | 3.18 | (0.11) | $12.84 | 32.90% | 0.89% | 0.49% | 76% | $260 | ||
2016(3) | $10.00 | 0.06 | (0.29) | (0.23) | — | $9.77 | (2.30)% | 0.88%(4) | 0.91%(4) | 47% | $195 | ||
| Notes to Financial Highlights | |
| (1) | Computed using average shares outstanding throughout the period. |
| (2) | Total returns are calculated based on the net asset value of the last business day and do not reflect applicable sales charges, if any. Total returns for periods less than one year are not annualized. |
| (3) | March 29, 2016 (fund inception) through November 30, 2016. |
| (4) | Annualized. |
| (5) | Per-share amount was less than $0.005. |
See Notes to Financial Statements.
| Report of Independent Registered Public Accounting Firm |
To the Shareholders and the Board of Directors of American Century World Mutual Funds, Inc.:
Opinion on the Financial Statements and Financial Highlights
We have audited the accompanying statement of assets and liabilities, including the schedule of investments, of Focused International Growth Fund, one of the funds constituting the American Century World Mutual Funds, Inc. (the “Fund”), as of November 30, 2018, the related statement of operations for the year then ended, the statements of changes in net assets for each of the two years in the period then ended, the financial highlights for the years ended November 30, 2018, November 30, 2017, and for the period March 29, 2016 (fund inception) through November 30, 2016, and the related notes. In our opinion, the financial statements and financial highlights present fairly, in all material respects, the financial position of Focused International Growth Fund of the American Century World Mutual Funds, Inc. as of November 30, 2018, the results of its operations for the year then ended, the changes in its net assets for each of the two years in the period then ended, and the financial highlights for the years ended November 30, 2018, November 30, 2017, and for the period March 29, 2016 (fund inception) through November 30, 2016, in conformity with accounting principles generally accepted in the United States of America.
Basis for Opinion
These financial statements and financial highlights are the responsibility of the Fund's management. Our responsibility is to express an opinion on the Fund’s financial statements and financial highlights based on our audits. We are a public accounting firm registered with the Public Company Accounting Oversight Board (United States) (PCAOB) and are required to be independent with respect to the Fund in accordance with the U.S. federal securities laws and the applicable rules and regulations of the Securities and Exchange Commission and the PCAOB.
We conducted our audits in accordance with the standards of the PCAOB. Those standards require that we plan and perform the audit to obtain reasonable assurance about whether the financial statements and financial highlights are free of material misstatement, whether due to error or fraud. The Fund is not required to have, nor were we engaged to perform, an audit of its internal control over financial reporting. As part of our audits we are required to obtain an understanding of internal control over financial reporting but not for the purpose of expressing an opinion on the effectiveness of the Fund’s internal control over financial reporting. Accordingly, we express no such opinion.
Our audits included performing procedures to assess the risks of material misstatement of the financial statements and financial highlights, whether due to error or fraud, and performing procedures that respond to those risks. Such procedures included examining, on a test basis, evidence regarding the amounts and disclosures in the financial statements and financial highlights. Our audits also included evaluating the accounting principles used and significant estimates made by management, as well as evaluating the overall presentation of the financial statements and financial highlights. Our procedures included confirmation of securities owned as of November 30, 2018, by correspondence with the custodian and brokers; when replies were not received from brokers, we performed other auditing procedures. We believe that our audits provide a reasonable basis for our opinion.
DELOITTE & TOUCHE LLP
Kansas City, Missouri
January 17, 2019
We have served as the auditor of one or more American Century investment companies since 1997.
24
| Management |
The Board of Directors
The individuals listed below serve as directors of the funds. Each director will continue to serve in this capacity until death, retirement, resignation or removal from office. The board has adopted a mandatory retirement age for directors who are not “interested persons,” as that term is defined in the Investment Company Act (independent directors). Independent directors shall retire by December 31 of the year in which they reach their 75th birthday.
Mr. Thomas is an “interested person” because he currently serves as President and Chief Executive Officer of American Century Companies, Inc. (ACC), the parent company of American Century Investment Management, Inc. (ACIM or the advisor). The other directors (more than three-fourths of the total number) are independent. They are not employees, directors or officers of, and have no financial interest in, ACC or any of its wholly owned, direct or indirect, subsidiaries, including ACIM, American Century Investment Services, Inc. (ACIS) and American Century Services, LLC (ACS), and they do not have any other affiliations, positions or relationships that would cause them to be considered “interested persons” under the Investment Company Act. The directors serve in this capacity for seven (in the case of Jonathan S. Thomas, 16; and Stephen E. Yates, 8) registered investment companies in the American Century Investments family of funds.
The following table presents additional information about the directors. The mailing address for each director is 4500 Main Street, Kansas City, Missouri 64111.
| Name (Year of Birth) | Position(s) Held with Funds | Length of Time Served | Principal Occupation(s) During Past 5 Years | Number of American Century Portfolios Overseen by Director | Other Directorships Held During Past 5 Years |
| Independent Directors | |||||
| Thomas W. Bunn (1953) | Director | Since 2017 | Retired | 68 | SquareTwo Financial; Barings (formerly Babson Capital Funds Trust) (2013 to 2016) |
| Barry Fink (1955) | Director | Since 2012 (independent since 2016) | Retired; Executive Vice President, ACC (2007 to 2013); President, ACS (2007 to 2013) | 68 | None |
| Jan M. Lewis (1957) | Director | Since 2011 | Retired; President and Chief Executive Officer, Catholic Charities of Northeast Kansas (human services organization) (2006 to 2013) | 68 | None |
M. Jeannine Strandjord(1) (1945) | Director | Since 1994 | Self-employed Consultant | 68 | Euronet Worldwide Inc. and MGP Ingredients, Inc. |
25
| Name (Year of Birth) | Position(s) Held with Funds | Length of Time Served | Principal Occupation(s) During Past 5 Years | Number of American Century Portfolios Overseen by Director | Other Directorships Held During Past 5 Years |
| Independent Directors | |||||
| John R. Whitten (1946) | Director | Since 2008 | Retired | 68 | Rudolph Technologies, Inc. |
| Stephen E. Yates (1948) | Director and Chairman of the Board | Since 2012 (Chairman since 2018) | Retired | 73 | None |
| Interested Director | |||||
| Jonathan S. Thomas (1963) | Director and President | Since 2007 | President and Chief Executive Officer, ACC (2007 to present). Also serves as Chief Executive Officer, ACS; Executive Vice President, ACIM; Director, ACC, ACIM and other ACC subsidiaries | 118 | BioMed Valley Discoveries, Inc. |
(1) Effective December 31, 2018, M. Jeannine Strandjord retired from the Board of Directors.
The Statement of Additional Information has additional information about the fund's directors and is available without charge, upon request, by calling 1-800-345-2021.
26
Officers
The following table presents certain information about the executive officers of the funds. Each officer serves as an officer for each of the 16 (in the case of Robert J. Leach, 15) investment companies in the American Century family of funds. No officer is compensated for his or her service as an officer of the funds. The listed officers are interested persons of the funds and are appointed or re-appointed on an annual basis. The mailing address for each officer listed below is 4500 Main Street, Kansas City, Missouri 64111.
| Name (Year of Birth) | Offices with the Funds | Principal Occupation(s) During the Past Five Years |
| Jonathan S. Thomas (1963) | Director and President since 2007 | President and Chief Executive Officer, ACC (2007 to present). Also serves as Chief Executive Officer, ACS; Executive Vice President, ACIM; Director, ACC, ACIM and other ACC subsidiaries |
| R. Wes Campbell (1974) | Chief Financial Officer and Treasurer since 2018 | Investment Operations and Investment Accounting, ACS (2000 to present) |
| Amy D. Shelton (1964) | Chief Compliance Officer and Vice President since 2014 | Chief Compliance Officer, American Century funds, (2014 to present); Chief Compliance Officer, ACIM (2014 to present); Chief Compliance Officer, ACIS (2009 to present); Vice President, Client Interactions and Marketing, ACIS (2013 to 2014). Also serves as Vice President, ACIS |
| Charles A. Etherington (1957) | General Counsel since 2007 and Senior Vice President since 2006 | Attorney, ACC (1994 to present); Vice President, ACC (2005 to present); General Counsel, ACC (2007 to present). Also serves as General Counsel, ACIM, ACS, ACIS and other ACC subsidiaries; and Senior Vice President, ACIM and ACS |
| C. Jean Wade (1964) | Vice President since 2012 | Senior Vice President, ACS (2017 to present); Vice President, ACS (2000 to 2017) |
| Robert J. Leach (1966) | Vice President since 2006 | Vice President, ACS (2000 to present) |
| David H. Reinmiller (1963) | Vice President since 2000 | Attorney, ACC (1994 to present). Also serves as Vice President, ACIM and ACS |
| Ward D. Stauffer (1960) | Secretary since 2005 | Attorney, ACC (2003 to present) |
27
| Approval of Management Agreement |
At a meeting held on June 28, 2018, the Fund’s Board of Directors (the "Board") unanimously approved the renewal of the management agreement pursuant to which American Century Investment Management, Inc. (the “Advisor”) acts as the investment advisor for the Fund. Under Section 15(c) of the Investment Company Act, contracts for investment advisory services are required to be reviewed, evaluated, and approved by a majority of a fund’s directors (the “Directors”), including a majority of the independent Directors, each year.
Prior to its consideration of the renewal of the management agreement, the Directors requested and reviewed extensive data and information compiled by the Advisor and certain independent providers of evaluation data concerning the Fund and the services provided to the Fund by the Advisor. This review was in addition to the oversight and evaluation undertaken by the Board and its committees on a continual basis and the information received was supplemental to the extensive information that the Board and its committees receive and consider throughout the year. The Directors also conducted a review of the process by which the Board considers the renewal of the management agreements. The Board consulted with industry experts and reviewed industry best practices and recent judicial precedent. The Directors believe that the enhancements resulting from their review resulted in increased dialogue with the Advisor and an improved process for fund shareholders.
In connection with its consideration of the renewal of the management agreement, the Board’s review and evaluation of the services provided by the Advisor included, but was not limited to, the following:
| • | the nature, extent, and quality of investment management, shareholder services, and other services provided and to be provided to the Fund; |
| • | the wide range of other programs and services provided and to be provided to the Fund and its shareholders on a routine and non-routine basis; |
| • | the investment performance of the Fund, including data comparing the Fund's performance to appropriate benchmarks and/or a peer group of other mutual funds with similar investment objectives and strategies; |
| • | the cost of owning the Fund compared to the cost of owning similar funds; |
| • | the compliance policies, procedures, and regulatory experience of the Advisor and the Fund's service providers; |
| • | financial data showing the cost of services provided to the Fund, the profitability of the Fund to the Advisor, and the overall profitability of the Advisor |
| • | strategic plans of the Advisor; |
| • | any economies of scale associated with the Advisor’s management of the Fund and other accounts; |
| • | services provided and charges to the Advisor's other investment management clients; |
| • | acquired fund fees and expenses; |
| • | payments and practices in connection with financial intermediaries holding shares of the Fund and the services provided by intermediaries in connection therewith; and |
| • | any collateral benefits derived by the Advisor from the management of the Fund. |
The Directors held two in-person meetings and one telephonic meeting to review and discuss the information provided. The independent Directors also reviewed responses to supplemental information requests provided by the Directors to the Advisor and held active discussions with the Advisor regarding the renewal of the management agreement. The independent Directors had the benefit of the advice of their independent counsel throughout the process.
28
Factors Considered
The Directors considered all of the information provided by the Advisor, the independent data providers, and independent counsel in connection with the approval. They determined that the information was sufficient for them to evaluate the management agreement for the Fund. In connection with their review, the Directors did not identify any single factor as being all-important or controlling, and each Director may have attributed different levels of importance to different factors. In deciding to renew the management agreement, the Board based its decision on a number of factors, including without limitation the following:
Nature, Extent and Quality of Services - Generally. Under the management agreement, the Advisor is responsible for providing or arranging for all services necessary for the operation of the Fund. The Board noted that the Advisor provides or arranges at its own expense a wide variety of services including without limitation the following:
| • | portfolio research and security selection |
| • | securities trading |
| • | Fund administration |
| • | custody of Fund assets |
| • | daily valuation of the Fund’s portfolio |
| • | shareholder servicing and transfer agency, including shareholder confirmations, recordkeeping, and communications |
| • | legal services (except the independent Directors’ counsel) |
| • | regulatory and portfolio compliance |
| • | financial reporting |
| • | marketing and distribution (except amounts paid by the Fund under Rule 12b-1 plans) |
The Board noted that many of these services have expanded over time in terms of both quantity and complexity in response to shareholder demands, competition in the industry, changing distribution channels, and the changing regulatory environment.
Investment Management Services. The nature of the investment management services provided to the Fund is quite complex and allows Fund shareholders access to professional money management, instant diversification of their investments within an asset class, the opportunity to easily diversify among asset classes by investing in or exchanging among various American Century Investments funds, and liquidity. In evaluating investment performance, the Board expects the Advisor to manage the Fund in accordance with its investment objectives and approved strategies. Further, the Directors recognize that the Advisor has an obligation to monitor trading activities, and in particular to seek the best execution of fund trades, and to evaluate the use of and payment for research. In providing these services, the Advisor utilizes teams of investment professionals (portfolio managers, analysts, research assistants, and securities traders) who require extensive information technology, research, training, compliance, and other systems to conduct their business. The Board, directly and through its Fund Performance Review Committee, provides oversight of the investment performance process. It regularly reviews investment performance information for the Fund, together with comparative information for appropriate benchmarks and/or peer groups of similarly-managed funds, over different time horizons. The Directors also review detailed performance information provided by the Advisor during the management agreement renewal process. If performance concerns are identified, the Fund receives special reviews until performance improves, during which the Board receives a report from the Advisor regarding the reasons for such results (e.g., market conditions, security selection) and any efforts being undertaken to improve performance. The Fund’s performance was above its benchmark for the one-year period reviewed by the Board. The Board found the investment management services provided by the Advisor to the Fund to be satisfactory and consistent with the management agreement.
29
Shareholder and Other Services. Under the management agreement, the Advisor provides the Fund with a comprehensive package of transfer agency, shareholder, and other services. The Board, directly and through various committees of the Board, regularly reviews reports and evaluations of such services at its regular meetings. These reports include, but are not limited to, information regarding the operational efficiency and accuracy of the shareholder and transfer agency services provided, staffing levels, shareholder satisfaction (as measured by external as well as internal sources), technology support, new products and services offered to Fund shareholders, securities trading activities, portfolio valuation services, auditing services, and legal and operational compliance activities. The Board found the services provided by the Advisor to the Fund under the management agreement to be competitive and of high quality.
Costs of Services and Profitability. The Advisor provides detailed information concerning its cost of providing various services to the Fund, its profitability in managing the Fund (pre- and post-distribution), its overall profitability, and its financial condition. The Directors have reviewed with the Advisor the methodology used to prepare this financial information. This information is considered in evaluating the Advisor’s financial condition, its ability to continue to provide services under the management agreement, and the reasonableness of the current management fee. The Board concluded that the Advisor’s profits were reasonable in light of the services provided to the Fund.
Ethics. The Board generally considers the Advisor’s commitment to providing quality services to shareholders and to conducting its business ethically. They noted that the Advisor’s practices generally meet or exceed industry best practices.
Economies of Scale. The Board also reviewed information provided by the Advisor regarding the possible existence of economies of scale in connection with the management of the Fund. The Board concluded that economies of scale are difficult to measure and predict with precision, especially on a fund-by-fund basis. The Board concluded that the Advisor is appropriately sharing economies of scale through its competitive fee structure, offering competitive fees from fund inception, and through reinvestment in its business to provide shareholders additional content and services.
Comparison to Other Funds’ Fees. The management agreement provides that the Fund pays the Advisor a single, all-inclusive (or unified) management fee for providing all services necessary for the management and operation of the Fund, other than brokerage expenses, expenses attributable to short sales, taxes, interest, extraordinary expenses, and the fees and expenses of the Fund’s independent Directors (including their independent legal counsel) and expenses incurred in connection with the provision of shareholder services and distribution services under a plan adopted pursuant to Rule 12b-1 under the 1940 Act. Under the unified fee structure, the Advisor is responsible for providing all investment advisory, custody, audit, administrative, compliance, recordkeeping, marketing and shareholder services, or arranging and supervising third parties to provide such services. By contrast, most other funds are charged a variety of fees, including an investment advisory fee, a transfer agency fee, an administrative fee, distribution charges, and other expenses. Other than their investment advisory fees and any applicable Rule 12b-1 distribution fees, all other components of the total fees charged by these other funds may be increased without shareholder approval. The Board believes the unified fee structure is a benefit to Fund shareholders because it clearly discloses to shareholders the cost of owning Fund shares, and, since the unified fee cannot be increased without a vote of Fund shareholders, it shifts to the Advisor the risk of increased costs of operating the Fund and provides a direct incentive to minimize administrative inefficiencies. Part of the Board’s analysis of fee levels involves reviewing certain evaluative data compiled by an independent provider comparing the Fund’s unified fee to the total expense ratios of its peers. The unified fee charged to shareholders of the Fund was above the median of the total expense ratios of the Fund’s peer expense universe and was within the range of its peer expense group. The Board concluded that the management fee paid by the Fund to the Advisor under the management agreement is reasonable in light of the services provided to the Fund.
30
Comparison to Fees and Services Provided to Other Clients of the Advisor. The Directors also requested and received information from the Advisor concerning the nature of the services, fees, costs, and profitability of its advisory services to advisory clients other than the Fund. They observed that these varying types of client accounts require different services and involve different regulatory and entrepreneurial risks than the management of the Fund. The Board analyzed this information and concluded that the fees charged and services provided to the Fund were reasonable by comparison.
Payments to Intermediaries. The Directors also requested and received a description of payments made to intermediaries by the Fund and the Advisor and services provided in response thereto. These payments include various payments made by the Fund or the Advisor to different types of intermediaries and recordkeepers for distribution and service activities provided for the Fund. The Board reviewed such information and received representations from the Advisor that all such payments by the Fund were made pursuant to the Fund's Rule 12b-1 Plan and that all such payments by the Advisor were made from the Advisor’s resources and reasonable profits. The Board found the payments to be reasonable in scope and purpose.
Collateral or “Fall-Out” Benefits Derived by the Advisor. The Board considered the existence of collateral benefits the Advisor may receive as a result of its relationship with the Fund. They concluded that the Advisor’s primary business is managing mutual funds and it generally does not use fund or shareholder information to generate profits in other lines of business, and therefore does not derive any significant collateral benefits from them. The Board noted that additional assets from other clients may offer the Advisor some benefit from increased leverage with service providers and counterparties. Additionally, the Advisor may receive proprietary research from broker-dealers that execute fund portfolio transactions, which the Board concluded is likely to benefit other clients of the Advisor, as well as Fund shareholders. The Board also determined that the Advisor is able to provide investment management services to certain clients other than the Fund, at least in part, due to its existing infrastructure built to serve the fund complex. The Board concluded that appropriate allocation methodologies had been employed to assign resources and the cost of those resources to these other clients and, where expressly provided, these other client assets may be included with the assets of the Fund to determine breakpoints in the management fee schedule.
Existing Relationship. The Board also considered whether there was any reason for not continuing the existing arrangement with the Advisor. In this regard, the Board was mindful of the potential disruptions of the Fund’s operations and various risks, uncertainties, and other effects that could occur as a result of a decision not to continue such relationship. In particular, the Board recognized that most shareholders have invested in the Fund on the strength of the Advisor’s industry standing and reputation and in the expectation that the Advisor will have a continuing role in providing advisory services to the Fund.
Conclusion of the Directors. As a result of this process, the Board, including all of the independent Directors, taking into account all of the factors discussed above and the information provided by the Advisor and others in connection with its review and throughout the year, determined that the management fee is fair and reasonable in light of the services provided and that the investment management agreement between the Fund and the Advisor should be renewed.
31
| Additional Information |
Retirement Account Information
As required by law, distributions you receive from certain retirement accounts are subject to federal income tax withholding, unless you elect not to have withholding apply*. Tax will be withheld on the total amount withdrawn even though you may be receiving amounts that are not subject to withholding, such as nondeductible contributions. In such case, excess amounts of withholding could occur. You may adjust your withholding election so that a greater or lesser amount will be withheld.
If you don’t want us to withhold on this amount, you must notify us to not withhold the federal income tax. You may notify us in writing or in certain situations by telephone or through other electronic means. For systematic withdrawals, your withholding election will remain in effect until revoked or changed by filing a new election. You have the right to revoke your election at any time and change your withholding percentage for future distributions.
Remember, even if you elect not to have income tax withheld, you are liable for paying income tax on the taxable portion of your withdrawal. If you elect not to have income tax withheld or you don’t have enough income tax withheld, you may be responsible for payment of estimated tax. You may incur penalties under the estimated tax rules if your withholding and estimated tax payments are not sufficient. You can reduce or defer the income tax on a distribution by directly or indirectly rolling such distribution over to another IRA or eligible plan. You should consult your tax advisor for additional information.
State tax will be withheld if, at the time of your distribution, your address is within one of the mandatory withholding states and you have federal income tax withheld (or as otherwise required by state law). State taxes will be withheld from your distribution in accordance with the respective state rules.
*Some 403(b), 457 and qualified retirement plan distributions may be subject to 20% mandatory withholding, as they are subject to special tax and withholding rules. Your plan administrator or plan sponsor is required to provide you with a special tax notice explaining those rules at the time you request a distribution. If applicable, federal and/or state taxes may be withheld from your distribution amount.
Proxy Voting Policies
A description of the policies that the fund's investment advisor uses in exercising the voting rights associated with the securities purchased and/or held by the fund is available without charge, upon request, by calling 1-800-345-2021. It is also available on the "About Us" page of American Century Investments’ website at americancentury.com and on the Securities and Exchange Commission’s website at sec.gov. Information regarding how the investment advisor voted proxies relating to portfolio securities during the most recent 12-month period ended June 30 is available on the "About Us" page at americancentury.com. It is also available at sec.gov.
Quarterly Portfolio Disclosure
The fund files its complete schedule of portfolio holdings with the Securities and Exchange Commission (SEC) for the first and third quarters of each fiscal year on Form N-Q. The fund’s Forms N-Q are available on the SEC’s website at sec.gov. The fund also makes its complete schedule of portfolio holdings for the most recent quarter of its fiscal year available on its website at americancentury.com and, upon request, by calling 1-800-345-2021.
32
Other Tax Information
The following information is provided pursuant to provisions of the Internal Revenue Code.
The fund hereby designates up to the maximum amount allowable as qualified dividend income for the fiscal year ended November 30, 2018.
For the fiscal year ended November 30, 2018, the fund intends to pass through to shareholders foreign source income of $231,255 and foreign taxes paid of $18,822, or up to the maximum amount allowable, as a foreign tax credit. Foreign source income and foreign tax expense per outstanding share on November 30, 2018 are $0.2751 and $0.0224 respectively.
33
| Notes |
34
| Notes |
35
| Notes |
36
| ||
| Contact Us | americancentury.com | |
| Automated Information Line | 1-800-345-8765 | |
| Investor Services Representative | 1-800-345-2021 or 816-531-5575 | |
| Investors Using Advisors | 1-800-378-9878 | |
| Business, Not-For-Profit, Employer-Sponsored Retirement Plans | 1-800-345-3533 | |
| Banks and Trust Companies, Broker-Dealers, Financial Professionals, Insurance Companies | 1-800-345-6488 | |
| Telecommunications Relay Service for the Deaf | 711 | |
| American Century World Mutual Funds, Inc. | ||
Investment Advisor: American Century Investment Management, Inc. Kansas City, Missouri | ||
| This report and the statements it contains are submitted for the general information of our shareholders. The report is not authorized for distribution to prospective investors unless preceded or accompanied by an effective prospectus. | ||
| ©2019 American Century Proprietary Holdings, Inc. All rights reserved. CL-ANN-91034 1901 | ||
| Annual Report | |
| November 30, 2018 | |
| Global Growth Fund | |
| Investor Class (TWGGX) | |
| I Class (AGGIX) | |
| Y Class (AGYGX) | |
| A Class (AGGRX) | |
| C Class (AGLCX) | |
| R Class (AGORX) | |
| R5 Class (AGFGX) | |
| R6 Class (AGGDX) | |
Beginning on January 1, 2021, as permitted by regulations adopted by the Securities and Exchange Commission, paper copies of the fund’s shareholder reports like this one will no longer be sent by mail, unless you specifically request paper copies of the reports from the fund or from your financial intermediary, such as a broker-dealer or bank. Instead, the reports will be made available on a website, and you will be notified by mail each time a report is posted and provided with a website link to access the report.
If you already elected to receive shareholder reports electronically, you will not be affected by this change and you need not take any action. You may elect to receive shareholder reports and other communications from the fund or your financial intermediary electronically by calling or sending an email request to your appropriate contacts as listed on the back cover of this report.
You may elect to receive all future reports in paper free of charge. You can inform the fund or your financial intermediary that you wish to continue receiving paper copies of your shareholder reports by calling or sending an email request to your appropriate contacts as listed on the back cover of this report. Your election to receive reports in paper will apply to all funds held with the fund complex/your financial intermediary.
| Table of Contents |
| President’s Letter | 2 | |
| Performance | 3 | |
| Portfolio Commentary | ||
| Fund Characteristics | ||
| Shareholder Fee Example | ||
| Schedule of Investments | ||
| Statement of Assets and Liabilities | ||
| Statement of Operations | ||
| Statement of Changes in Net Assets | ||
| Notes to Financial Statements | ||
| Financial Highlights | ||
| Report of Independent Registered Public Accounting Firm | ||
| Management | ||
| Approval of Management Agreement | ||
| Additional Information | ||
Any opinions expressed in this report reflect those of the author as of the date of the report, and do not necessarily represent the opinions of American Century Investments® or any other person in the American Century Investments organization. Any such opinions are subject to change at any time based upon market or other conditions and American Century Investments disclaims any responsibility to update such opinions. These opinions may not be relied upon as investment advice and, because investment decisions made by American Century Investments funds are based on numerous factors, may not be relied upon as an indication of trading intent on behalf of any American Century Investments fund. Security examples are used for representational purposes only and are not intended as recommendations to purchase or sell securities. Performance information for comparative indices and securities is provided to American Century Investments by third party vendors. To the best of American Century Investments’ knowledge, such information is accurate at the time of printing.
| President’s Letter |
Jonathan ThomasDear Investor:
Thank you for reviewing this annual report for the 12 months ended November 30, 2018. Annual reports help convey important information about fund returns, including market factors that affected performance during the reporting period. For additional investment and market insights, please visit our website, americancentury.com.
Global Growth Divergence Drives Disparity in Stock Returns
The synchronization of global economic growth, which helped deliver robust gains for global stocks in 2017, unraveled as the 12-month period unfolded. The U.S. economy continued to expand at a healthy pace, but other regions experienced notable slowdowns. Similarly, stocks advanced in the U.S. but generally declined elsewhere.
In Europe, the threat of global tariffs from the U.S. dampened business sentiment and corporate earnings growth. In addition, uncertainties surrounding Brexit negotiations, Italy’s fiscal woes, and civil unrest in France weighed on economic and earnings growth outlooks and stock performance. Meanwhile, Japan’s economy contracted late in the period, largely due to the effects of several natural disasters, which curtailed personal and business spending. Global trade tensions also pressured Japan’s growth outlook.
After starting strong, emerging markets stocks quickly reversed course. The key culprits included rising U.S. interest rates, U.S.-China tariffs, and global trade-policy uncertainty. In addition, a strong U.S. dollar, falling oil prices, and several country-specific events weighed on the asset class. Late in the period, prospects for a tariff truce between the U.S. and China, along with dovish comments from the Federal Reserve, sparked a November rally among emerging markets stocks.
Overall, U.S. stocks, as measured by the S&P 500 Index, returned 6.27% for the 12 months. Non-U.S. developed markets stocks, as measured by the MSCI EAFE Index, declined 7.94%. Emerging markets stocks, as measured by the MSCI Emerging Markets Index, fell 9.09%.
Looking ahead, investors face a backdrop of uneven global growth, heightened market volatility, and lingering geopolitical uncertainties. But it’s often these challenging markets that produce the most compelling investment opportunities. We believe this scenario underscores the importance of using professionally managed portfolios in pursuit of investment goals. We appreciate your continued trust and confidence in us.
Sincerely,
Jonathan Thomas
President and Chief Executive Officer
American Century Investments
2
| Performance |
| Total Returns as of November 30, 2018 | ||||||
Average Annual Returns | ||||||
Symbol | 1 year | 5 years | 10 years | Inception | Date | |
| Investor Class | TWGGX | 1.27% | 6.45% | 11.33% | — | 12/1/98 |
| MSCI World Index | — | 0.14% | 6.67% | 10.88% | — | — |
| I Class | AGGIX | 1.52% | 6.66% | 11.56% | — | 8/1/00 |
| Y Class | AGYGX | 1.62% | — | — | 11.11% | 4/10/17 |
| A Class | AGGRX | 2/5/99 | ||||
| No sales charge | 1.08% | 6.18% | 11.06% | — | ||
| With sales charge | -4.72% | 4.94% | 10.41% | — | ||
| C Class | AGLCX | 0.27% | 5.39% | 10.24% | — | 3/1/02 |
| R Class | AGORX | 0.75% | 5.91% | 10.79% | — | 7/29/05 |
| R5 Class | AGFGX | 1.52% | — | — | 10.95% | 4/10/17 |
| R6 Class | AGGDX | 1.58% | 6.80% | — | 8.56% | 7/26/13 |
Average annual returns since inception are presented when ten years of performance history is not available.
Sales charges include initial sales charges and contingent deferred sales charges (CDSCs), as applicable. A Class shares have a 5.75% maximum initial sales charge and may be subject to a maximum CDSC of 1.00%. C Class shares redeemed within 12 months of purchase are subject to a maximum CDSC of 1.00%. The SEC requires that mutual funds provide performance information net of maximum sales charges in all cases where charges could be applied.
Data presented reflect past performance. Past performance is no guarantee of future results. Current performance may be higher or lower than the performance shown. Total returns for periods less than one year are not annualized. Investment return and principal value will fluctuate, and redemption value may be more or less than original cost. Data assumes reinvestment of dividends and capital gains, and none of the charts reflect the deduction of taxes that a shareholder would pay on fund distributions or the redemption of fund shares. To obtain performance data current to the most recent month end, please call 1-800-345-2021 or visit americancentury.com. For additional information about the fund, please consult the prospectus.
3
| Growth of $10,000 Over 10 Years |
| $10,000 investment made November 30, 2008 |
| Performance for other share classes will vary due to differences in fee structure. |
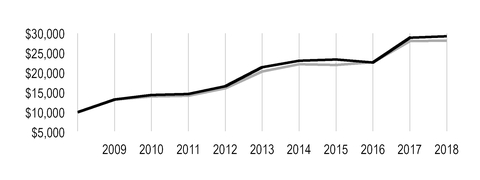
| Value on November 30, 2018 | |
| Investor Class — $29,270 | |
| MSCI World Index — $28,105 | |
Total Annual Fund Operating Expenses | |||||||
| Investor Class | I Class | Y Class | A Class | C Class | R Class | R5 Class | R6 Class |
| 1.08% | 0.88% | 0.73% | 1.33% | 2.08% | 1.58% | 0.88% | 0.73% |
The total annual fund operating expenses shown is as stated in the fund’s prospectus current as of the date of this report. The prospectus may vary from the expense ratio shown elsewhere in this report because it is based on a different time period, includes acquired fund fees and expenses, and, if applicable, does not include fee waivers or expense reimbursements.
Data presented reflect past performance. Past performance is no guarantee of future results. Current performance may be higher or lower than the performance shown. Total returns for periods less than one year are not annualized. Investment return and principal value will fluctuate, and redemption value may be more or less than original cost. Data assumes reinvestment of dividends and capital gains, and none of the charts reflect the deduction of taxes that a shareholder would pay on fund distributions or the redemption of fund shares. To obtain performance data current to the most recent month end, please call 1-800-345-2021 or visit americancentury.com. For additional information about the fund, please consult the prospectus.
4
| Portfolio Commentary |
Portfolio Managers: Keith Creveling, Brent Puff, and Ted Harlan
Performance Summary
Global Growth returned 1.27%* for the 12 months ended November 30, 2018, outperforming its benchmark, the MSCI World Index, which returned 0.14%.
The fund’s outperformance was driven by strong stock selection in the information technology and health care sectors. Conversely, gains were limited by the weak results of our investments in the consumer discretionary and communication services sectors. Geographically, investments in the U.S. and a smaller-than-benchmark stake in Germany lifted fund returns. Meanwhile, the fund's exposure in China and Mexico, two countries not represented in the benchmark, weighed on relative performance. Notably, our exposure in Mexico was limited to only two holdings: financial services firm Grupo Financiero Banorte and mining company Grupo Mexico.
Information Technology Holdings Contributed
Strong individual contributors to fund performance came primarily from the information technology sector, where software firm Adobe, payments technology company Visa, and cloud-computing company ServiceNow delivered solid returns. Adobe’s decision to increase prices for its software and its transition to a cloud-based/subscription business model supported stock gains. Visa’s stock benefited from an expanding U.S. economy and strong consumer spending, while new customer wins and strong growth in subscription revenues lifted ServiceNow’s share price.
Key contributors also included health care holding ABIOMED. During the period, the medical implant device company received U.S. Food and Drug Administration approval for expanded use of its Impella 2.5 and CP heart pumps. Adoption of ABIOMED’s heart pumps continues to rise among physicians. We sold our position and took profits in the medical device manufacturer, as we believe the potential upside in earnings from its product is fully priced into its current stock price.
Another notable performer was discount department store operator Burlington Stores. Stock gains were supported by a strong labor market and higher consumer confidence, which soared to its highest level in 18 years in September. Given the retailer’s broad array of branded goods and low prices, we believe it is well positioned to continue to gain market share from incumbent department store operators.
Consumer Discretionary Holdings Detracted
Key detractors included consumer discretionary holdings Valeo, which manufactures automobile components, and e-commerce company Amazon.com. Valeo’s share price declined in response to slowing automobile sales. We sold the stock due to greater uncertainty around global demand, particularly in key markets such as the U.S. and China, and concerns about the effect a slowdown will have on Valeo’s order trends. Shares in Amazon.com continued to rise on the strength of its core business as well as from expectations around new opportunities related to advertising and private-label products. However, because our position in Amazon.com was smaller than that of the benchmark, it was a relative detractor to fund performance.
*All fund returns referenced in this commentary are for Investor Class shares. Performance for other share classes will vary due to differences in fee structure; when Investor Class performance exceeds that of the fund's benchmark, other share classes may not. See page 3 for returns for all share classes.
5
Relative results also were hindered by not owning Microsoft, a company that does not fit our investment process. The software maker continued to report strong financial results during the period.
Other key detractors included Equinix and Stanley Black & Decker. Equinix is a real estate investment trust (REIT) providing carrier-neutral data centers and internet exchanges. A sensitivity to higher interest rates and the weak performance of REITs in general pressured the stock. We believe earnings will continue to be driven by the growing need for corporations to outsource the operation and maintenance of their computer servers. We also believe Equinix is well positioned to benefit from the rising shift to digitization and cloud computing. A sharp downturn in the stock of tool and hardware manufacturer Stanley Black & Decker occurred after management provided soft guidance for the full year 2018. Higher commodity and tariff-related costs as well as foreign exchange pressure reduced the company’s profit view.
Outlook
The fund continues to invest in companies where we believe the fundamentals are strong and improving but share price performance does not fully reflect these factors. Our process is based on individual security selection, but broad themes have emerged.
Within the financials sector, we are invested in companies that we believe will benefit from the rising penetration of financial products and services in emerging markets. Likewise, we have identified opportunities in several nonbank financial companies that provide mission-critical data and analytics to their respective customers. Finally, we remain invested in several U.S. banks that we expect to benefit from the gradual rise in U.S. interest rates and a strengthening economy.
In health care, the portfolio is more exposed to investment opportunities in medical devices and diagnostic tools and less on drug discoveries and compounds. These companies benefit from rising research and development spending, while minimizing the risk associated with drug approvals and controversies around drug pricing.
Our investments within the information technology and communication services sectors represent companies that benefit from long-lasting, multiyear trends and opportunities, such as the shift of advertising budgets to the online space, online retail, electronic payment, cloud computing, and the rollout of 5G technologies.
Within the industrials sector, our focus is on companies with pricing power and clear earnings inflection. Investments in the sector generally are high-margin names we believe have the pricing power to pass through rising input and raw material costs.
Fundamentals for most consumer staples names remain challenged. Many global consumer goods companies remain pressured by slowing demand and competitive pricing pressure. The secular shift toward healthier products and private-label products has pressured many packaged-food companies. Meanwhile, muted demand from emerging markets weighs on top-line growth for many fast-moving consumer goods companies.
We have identified opportunities in emerging markets despite recent challenges. While acknowledging weakness in the space, we remain constructive on several emerging markets-based companies.
6
| Fund Characteristics |
| NOVEMBER 30, 2018 | |
Top Ten Holdings | % of net assets |
| Alphabet, Inc.* | 3.7% |
| Amazon.com, Inc. | 2.6% |
| Visa, Inc., Class A | 2.3% |
| UnitedHealth Group, Inc. | 2.2% |
| Adobe, Inc. | 2.0% |
| Danaher Corp. | 2.0% |
| American Express Co. | 1.9% |
| Equinix, Inc. | 1.8% |
| Home Depot, Inc. (The) | 1.8% |
| Worldpay, Inc., Class A | 1.7% |
| *Includes all classes of the issuer held by the fund. | |
Types of Investments in Portfolio | % of net assets |
| Domestic Common Stocks | 69.5% |
| Foreign Common Stocks | 29.7% |
| Total Common Stocks | 99.2% |
| Temporary Cash Investments | 0.5% |
| Other Assets and Liabilities | 0.3% |
Investments by Country | % of net assets |
| United States | 69.5% |
| United Kingdom | 4.7% |
| Japan | 3.8% |
| China | 3.4% |
| Hong Kong | 3.0% |
| France | 2.1% |
| Other Countries | 12.7% |
| Cash and Equivalents** | 0.8% |
**Includes temporary cash investments and other assets and liabilities.
7
| Shareholder Fee Example |
Fund shareholders may incur two types of costs: (1) transaction costs, including sales charges (loads) on purchase payments and redemption/exchange fees; and (2) ongoing costs, including management fees; distribution and service (12b-1) fees; and other fund expenses. This example is intended to help you understand your ongoing costs (in dollars) of investing in your fund and to compare these costs with the ongoing cost of investing in other mutual funds.
The example is based on an investment of $1,000 made at the beginning of the period and held for the entire period from June 1, 2018 to November 30, 2018.
Actual Expenses
The table provides information about actual account values and actual expenses for each class. You may use the information, together with the amount you invested, to estimate the expenses that you paid over the period. First, identify the share class you own. Then simply divide your account value by $1,000 (for example, an $8,600 account value divided by $1,000 = 8.6), then multiply the result by the number under the heading “Expenses Paid During Period” to estimate the expenses you paid on your account during this period.
If you hold Investor Class shares of any American Century Investments fund, or I Class shares of the American Century Diversified Bond Fund, in an American Century Investments account (i.e., not a financial intermediary or retirement plan account), American Century Investments may charge you a $12.50 semiannual account maintenance fee if the value of those shares is less than $10,000. We will redeem shares automatically in one of your accounts to pay the $12.50 fee. In determining your total eligible investment amount, we will include your investments in all personal accounts (including American Century Investments Brokerage accounts) registered under your Social Security number. Personal accounts include individual accounts, joint accounts, UGMA/UTMA accounts, personal trusts, Coverdell Education Savings Accounts and IRAs (including traditional, Roth, Rollover, SEP-, SARSEP- and SIMPLE-IRAs), and certain other retirement accounts. If you have only business, business retirement, employer-sponsored or American Century Investments Brokerage accounts, you are currently not subject to this fee. If you are subject to the Account Maintenance Fee, your account value could be reduced by the fee amount.
Hypothetical Example for Comparison Purposes
The table also provides information about hypothetical account values and hypothetical expenses based on the actual expense ratio of each class of your fund and an assumed rate of return of 5% per year before expenses, which is not the actual return of a fund’s share class. The hypothetical account values and expenses may not be used to estimate the actual ending account balance or expenses you paid for the period. You may use this information to compare the ongoing costs of investing in your fund and other funds. To do so, compare this 5% hypothetical example with the 5% hypothetical examples that appear in the shareholder reports of the other funds.
Please note that the expenses shown in the table are meant to highlight your ongoing costs only and do not reflect any transactional costs, such as sales charges (loads) or redemption/exchange fees. Therefore, the table is useful in comparing ongoing costs only, and will not help you determine the relative total costs of owning different funds. In addition, if these transactional costs were included, your costs would have been higher.
8
| Beginning Account Value 6/1/18 | Ending Account Value 11/30/18 | Expenses Paid During Period(1) 6/1/18 - 11/30/18 | Annualized Expense Ratio(1) | |
Actual | ||||
| Investor Class | $1,000 | $962.50 | $5.26 | 1.07% |
| I Class | $1,000 | $964.00 | $4.28 | 0.87% |
| Y Class | $1,000 | $964.20 | $3.55 | 0.72% |
| A Class | $1,000 | $961.40 | $6.49 | 1.32% |
| C Class | $1,000 | $958.20 | $10.16 | 2.07% |
| R Class | $1,000 | $960.00 | $7.71 | 1.57% |
| R5 Class | $1,000 | $964.00 | $4.28 | 0.87% |
| R6 Class | $1,000 | $964.10 | $3.55 | 0.72% |
| Hypothetical | ||||
| Investor Class | $1,000 | $1,019.70 | $5.42 | 1.07% |
| I Class | $1,000 | $1,020.71 | $4.41 | 0.87% |
| Y Class | $1,000 | $1,021.46 | $3.65 | 0.72% |
| A Class | $1,000 | $1,018.45 | $6.68 | 1.32% |
| C Class | $1,000 | $1,014.69 | $10.46 | 2.07% |
| R Class | $1,000 | $1,017.20 | $7.94 | 1.57% |
| R5 Class | $1,000 | $1,020.71 | $4.41 | 0.87% |
| R6 Class | $1,000 | $1,021.46 | $3.65 | 0.72% |
| (1) | Expenses are equal to the class's annualized expense ratio listed in the table above, multiplied by the average account value over the period, multiplied by 183, the number of days in the most recent fiscal half-year, divided by 365, to reflect the one-half year period. Annualized expense ratio reflects actual expenses, including any applicable fee waivers or expense reimbursements and excluding any acquired fund fees and expenses. |
9
| Schedule of Investments |
NOVEMBER 30, 2018
| Shares | Value | ||||
| COMMON STOCKS — 99.2% | |||||
| Austria — 0.9% | |||||
Erste Group Bank AG(1) | 115,270 | $ | 4,549,905 | ||
| Brazil — 1.1% | |||||
| B3 SA - Brasil Bolsa Balcao | 748,300 | 5,456,959 | |||
| Canada — 1.0% | |||||
Canada Goose Holdings, Inc.(1) | 29,880 | 2,012,418 | |||
| Dollarama, Inc. | 79,250 | 2,094,803 | |||
| First Quantum Minerals Ltd. | 84,873 | 779,325 | |||
| 4,886,546 | |||||
| China — 3.4% | |||||
Alibaba Group Holding Ltd. ADR(1) | 40,230 | 6,471,398 | |||
GDS Holdings Ltd. ADR(1) | 69,280 | 2,043,067 | |||
| Tencent Holdings Ltd. | 164,400 | 6,594,278 | |||
| ZTO Express Cayman, Inc. ADR | 132,550 | 2,274,558 | |||
| 17,383,301 | |||||
| France — 2.1% | |||||
| Kering SA | 9,970 | 4,366,570 | |||
| TOTAL SA | 117,702 | 6,552,248 | |||
| 10,918,818 | |||||
| Hong Kong — 3.0% | |||||
| AIA Group Ltd. | 922,600 | 7,567,353 | |||
| Hang Seng Bank Ltd. | 148,100 | 3,428,203 | |||
| Hong Kong Exchanges & Clearing Ltd. | 153,200 | 4,486,833 | |||
| 15,482,389 | |||||
| Hungary — 0.9% | |||||
| OTP Bank Nyrt | 114,623 | 4,588,280 | |||
| India — 1.1% | |||||
| HDFC Bank Ltd. | 185,410 | 5,657,192 | |||
| Indonesia — 0.7% | |||||
| Bank Central Asia Tbk PT | 1,945,700 | 3,551,907 | |||
| Ireland — 1.2% | |||||
| CRH plc | 218,985 | 6,051,964 | |||
| Italy — 0.6% | |||||
| UniCredit SpA | 223,348 | 2,881,490 | |||
| Japan — 3.8% | |||||
| Don Quijote Holdings Co. Ltd. | 21,500 | 1,305,003 | |||
| Keyence Corp. | 6,000 | 3,255,957 | |||
| ORIX Corp. | 405,700 | 6,569,321 | |||
| Shiseido Co. Ltd. | 65,500 | 4,172,446 | |||
| Unicharm Corp. | 111,800 | 3,502,357 | |||
| ZOZO, Inc. | 35,700 | 794,883 | |||
| 19,599,967 | |||||
10
| Shares | Value | ||||
| Mexico — 0.8% | |||||
| Grupo Financiero Banorte SAB de CV | 667,530 | $ | 3,059,906 | ||
| Grupo Mexico SAB de CV, Series B | 463,480 | 955,253 | |||
| 4,015,159 | |||||
| Netherlands — 1.9% | |||||
| ASML Holding NV | 20,190 | 3,433,005 | |||
InterXion Holding NV(1) | 29,540 | 1,839,456 | |||
| Unilever NV CVA | 78,460 | 4,357,202 | |||
| 9,629,663 | |||||
| Peru — 0.6% | |||||
| Credicorp Ltd. | 13,460 | 2,951,643 | |||
| Sweden — 0.4% | |||||
Epiroc AB, A Shares(1) | 262,130 | 2,151,236 | |||
| Switzerland — 1.5% | |||||
Lonza Group AG(1) | 24,260 | 7,866,761 | |||
| United Kingdom — 4.7% | |||||
| AstraZeneca plc | 98,550 | 7,703,308 | |||
| B&M European Value Retail SA | 642,550 | 2,861,003 | |||
| Diageo plc | 162,410 | 5,851,233 | |||
| London Stock Exchange Group plc | 103,410 | 5,317,440 | |||
| RPC Group plc | 259,270 | 2,375,746 | |||
| 24,108,730 | |||||
| United States — 69.5% | |||||
| Abbott Laboratories | 101,850 | 7,541,992 | |||
| Activision Blizzard, Inc. | 52,350 | 2,611,218 | |||
Adobe, Inc.(1) | 41,027 | 10,293,264 | |||
Advanced Micro Devices, Inc.(1) | 80,620 | 1,717,206 | |||
| Agilent Technologies, Inc. | 86,770 | 6,277,809 | |||
Alphabet, Inc., Class A(1) | 13,865 | 15,385,297 | |||
Alphabet, Inc., Class C(1) | 3,054 | 3,342,389 | |||
Amazon.com, Inc.(1) | 7,768 | 13,129,241 | |||
| American Express Co. | 84,190 | 9,452,011 | |||
| American Tower Corp. | 43,850 | 7,212,886 | |||
| AMETEK, Inc. | 82,450 | 6,054,304 | |||
| Bank of America Corp. | 272,950 | 7,751,780 | |||
| Becton Dickinson and Co. | 32,100 | 8,113,275 | |||
Bio-Rad Laboratories, Inc., Class A(1) | 24,274 | 6,662,242 | |||
| Booz Allen Hamilton Holding Corp. | 74,620 | 3,828,752 | |||
Burlington Stores, Inc.(1) | 49,980 | 8,284,685 | |||
Cheniere Energy, Inc.(1) | 80,080 | 4,894,490 | |||
| Cintas Corp. | 36,090 | 6,762,544 | |||
CoStar Group, Inc.(1) | 10,590 | 3,911,840 | |||
| Danaher Corp. | 93,020 | 10,189,411 | |||
| EOG Resources, Inc. | 58,360 | 6,029,172 | |||
| Equinix, Inc. | 24,266 | 9,349,204 | |||
| Harris Corp. | 28,410 | 4,061,210 | |||
| Home Depot, Inc. (The) | 50,464 | 9,099,668 | |||
11
| Shares | Value | ||||
| Honeywell International, Inc. | 34,927 | $ | 5,125,537 | ||
IHS Markit Ltd.(1) | 145,750 | 7,778,677 | |||
| Intercontinental Exchange, Inc. | 86,290 | 7,051,619 | |||
Keysight Technologies, Inc.(1) | 92,783 | 5,735,845 | |||
Liberty Media Corp-Liberty Formula One, Class C(1) | 113,787 | 3,393,128 | |||
lululemon athletica, Inc.(1) | 13,450 | 1,782,798 | |||
| MarketAxess Holdings, Inc. | 24,613 | 5,358,988 | |||
| MasterCard, Inc., Class A | 36,810 | 7,401,387 | |||
Medidata Solutions, Inc.(1) | 57,490 | 4,438,803 | |||
MongoDB, Inc.(1) | 23,710 | 1,965,559 | |||
Monster Beverage Corp.(1) | 97,550 | 5,821,784 | |||
| Mosaic Co. (The) | 91,330 | 3,287,880 | |||
| MSCI, Inc. | 24,700 | 3,880,123 | |||
| Nordson Corp. | 12,200 | 1,469,002 | |||
PayPal Holdings, Inc.(1) | 81,070 | 6,956,617 | |||
| Pioneer Natural Resources Co. | 42,398 | 6,264,304 | |||
RealPage, Inc.(1) | 2,813 | 145,095 | |||
| Roper Technologies, Inc. | 22,030 | 6,555,908 | |||
ServiceNow, Inc.(1) | 30,440 | 5,639,619 | |||
| Sherwin-Williams Co. (The) | 17,190 | 7,289,763 | |||
| Stanley Black & Decker, Inc. | 31,370 | 4,104,765 | |||
| Sysco Corp. | 73,010 | 4,920,874 | |||
| Teleflex, Inc. | 30,118 | 8,295,100 | |||
| Texas Instruments, Inc. | 28,840 | 2,879,674 | |||
| Union Pacific Corp. | 28,480 | 4,379,654 | |||
| UnitedHealth Group, Inc. | 40,566 | 11,413,650 | |||
VeriSign, Inc.(1) | 26,800 | 4,182,408 | |||
| Visa, Inc., Class A | 81,602 | 11,563,819 | |||
| Webster Financial Corp. | 80,340 | 4,834,058 | |||
| Wells Fargo & Co. | 142,629 | 7,741,902 | |||
Worldpay, Inc., Class A(1) | 98,538 | 8,455,546 | |||
| Zions Bancorp N.A. | 121,869 | 5,930,146 | |||
| Zoetis, Inc. | 72,958 | 6,848,567 | |||
| 354,848,489 | |||||
TOTAL COMMON STOCKS (Cost $373,558,262) | 506,580,399 | ||||
| TEMPORARY CASH INVESTMENTS — 0.5% | |||||
| Repurchase Agreement, BMO Capital Markets Corp., (collateralized by various U.S. Treasury obligations, 1.125% - 3.125%, 5/31/19 - 11/15/28, valued at $2,341,813), in a joint trading account at 2.00%, dated 11/30/18, due 12/3/18 (Delivery value $2,296,164) | 2,295,781 | ||||
| Repurchase Agreement, Fixed Income Clearing Corp., (collateralized by various U.S. Treasury obligations, 3.375%, 11/15/48, valued at $520,267), at 1.05%, dated 11/30/18, due 12/3/18 (Delivery value $510,045) | 510,000 | ||||
12
| Shares | Value | ||||
| State Street Institutional U.S. Government Money Market Fund, Premier Class | 13,879 | $ | 13,879 | ||
TOTAL TEMPORARY CASH INVESTMENTS (Cost $2,819,660) | 2,819,660 | ||||
TOTAL INVESTMENT SECURITIES — 99.7% (Cost $376,377,922) | 509,400,059 | ||||
| OTHER ASSETS AND LIABILITIES — 0.3% | 1,444,151 | ||||
| TOTAL NET ASSETS — 100.0% | $ | 510,844,210 | |||
| MARKET SECTOR DIVERSIFICATION | ||
(as a % of net assets) | ||
| Financials | 22.0 | % |
| Health Care | 16.6 | % |
| Information Technology | 16.0 | % |
| Industrials | 10.7 | % |
| Consumer Discretionary | 10.2 | % |
| Communication Services | 6.2 | % |
| Consumer Staples | 5.5 | % |
| Energy | 4.7 | % |
| Materials | 4.1 | % |
| Real Estate | 3.2 | % |
| Cash and Equivalents* | 0.8 | % |
*Includes temporary cash investments and other assets and liabilities.
| NOTES TO SCHEDULE OF INVESTMENTS | ||
| ADR | - | American Depositary Receipt |
| CVA | - | Certificaten Van Aandelen |
| (1) | Non-income producing. |
See Notes to Financial Statements.
13
| Statement of Assets and Liabilities |
| NOVEMBER 30, 2018 | |||
| Assets | |||
| Investment securities, at value (cost of $376,377,922) | $ | 509,400,059 | |
| Receivable for investments sold | 1,796,385 | ||
| Receivable for capital shares sold | 94,690 | ||
| Dividends and interest receivable | 902,018 | ||
| Other assets | 1,239 | ||
| 512,194,391 | |||
| Liabilities | |||
| Foreign currency overdraft payable, at value (cost of $12,863) | 12,842 | ||
| Payable for investments purchased | 255,419 | ||
| Payable for capital shares redeemed | 611,208 | ||
| Accrued management fees | 426,821 | ||
| Distribution and service fees payable | 12,088 | ||
| Accrued foreign taxes | 31,803 | ||
| 1,350,181 | |||
| Net Assets | $ | 510,844,210 | |
| Net Assets Consist of: | |||
| Capital (par value and paid-in surplus) | $ | 337,025,096 | |
| Distributable earnings | 173,819,114 | ||
| $ | 510,844,210 | ||
| Net Assets | Shares Outstanding | Net Asset Value Per Share | ||||
| Investor Class, $0.01 Par Value | $408,561,686 | 33,161,031 | $12.32 | |||
| I Class, $0.01 Par Value | $16,209,937 | 1,289,857 | $12.57 | |||
| Y Class, $0.01 Par Value | $7,061 | 558 | $12.65 | |||
| A Class, $0.01 Par Value | $26,256,233 | 2,195,695 | $11.96* | |||
| C Class, $0.01 Par Value | $4,661,643 | 451,775 | $10.32 | |||
| R Class, $0.01 Par Value | $6,994,674 | 595,102 | $11.75 | |||
| R5 Class, $0.01 Par Value | $5,931 | 472 | $12.57 | |||
| R6 Class, $0.01 Par Value | $48,147,045 | 3,810,980 | $12.63 | |||
*Maximum offering price $12.69 (net asset value divided by 0.9425).
See Notes to Financial Statements.
14
| Statement of Operations |
| YEAR ENDED NOVEMBER 30, 2018 | |||
| Investment Income (Loss) | |||
| Income: | |||
| Dividends (net of foreign taxes withheld of $406,374) | $ | 7,442,814 | |
| Interest | 44,784 | ||
| 7,487,598 | |||
| Expenses: | |||
| Management fees | 5,682,958 | ||
| Distribution and service fees: | |||
| A Class | 71,516 | ||
| C Class | 57,243 | ||
| R Class | 37,567 | ||
| Directors' fees and expenses | 15,285 | ||
| Other expenses | 6,233 | ||
| 5,870,802 | |||
| Net investment income (loss) | 1,616,796 | ||
| Realized and Unrealized Gain (Loss) | |||
| Net realized gain (loss) on: | |||
| Investment transactions | 49,289,397 | ||
| Foreign currency translation transactions | (77,469 | ) | |
| 49,211,928 | |||
| Change in net unrealized appreciation (depreciation) on: | |||
| Investments (includes (increase) decrease in accrued foreign taxes of $(31,803)) | (42,434,787 | ) | |
| Translation of assets and liabilities in foreign currencies | (9,537 | ) | |
| (42,444,324 | ) | ||
| Net realized and unrealized gain (loss) | 6,767,604 | ||
| Net Increase (Decrease) in Net Assets Resulting from Operations | $ | 8,384,400 | |
See Notes to Financial Statements.
15
| Statement of Changes in Net Assets |
| YEARS ENDED NOVEMBER 30, 2018 AND NOVEMBER 30, 2017 | ||||||
| Increase (Decrease) in Net Assets | November 30, 2018 | November 30, 2017 | ||||
| Operations | ||||||
| Net investment income (loss) | $ | 1,616,796 | $ | 711,727 | ||
| Net realized gain (loss) | 49,211,928 | 59,921,989 | ||||
| Change in net unrealized appreciation (depreciation) | (42,444,324 | ) | 66,377,675 | |||
| Net increase (decrease) in net assets resulting from operations | 8,384,400 | 127,011,391 | ||||
| Distributions to Shareholders | ||||||
From earnings:(1) | ||||||
| Investor Class | (48,031,985 | ) | (5,688,718 | ) | ||
| I Class | (3,592,399 | ) | (592,586 | ) | ||
| Y Class | (642 | ) | — | |||
| A Class | (3,350,308 | ) | (519,159 | ) | ||
| C Class | (752,010 | ) | (91,202 | ) | ||
| R Class | (892,252 | ) | (107,831 | ) | ||
| R5 Class | (639 | ) | — | |||
| R6 Class | (4,170,767 | ) | (266,625 | ) | ||
| Decrease in net assets from distributions | (60,791,002 | ) | (7,266,121 | ) | ||
| Capital Share Transactions | ||||||
| Net increase (decrease) in net assets from capital share transactions (Note 5) | 11,146,331 | (58,600,370 | ) | |||
| Redemption Fees | ||||||
| Increase in net assets from redemption fees | — | 7,665 | ||||
| Net increase (decrease) in net assets | (41,260,271 | ) | 61,152,565 | |||
| Net Assets | ||||||
| Beginning of period | 552,104,481 | 490,951,916 | ||||
| End of period | $ | 510,844,210 | $ | 552,104,481 | ||
| (1) | Prior period presentation has been updated to reflect the current period combination of distributions to shareholders from net investment income and net realized gains. Distributions from net investment income were $(1,172,124), $(138,636), $(88,871), $(5,519), $(15,751) and $(66,880) for Investor Class, I Class, A Class, C Class, R Class and R6 Class, respectively. Distributions from net realized gains were $(4,516,594), $(453,950), $(430,288), $(85,683), $(92,080) and $(199,745) for Investor Class, I Class, A Class, C Class, R Class and R6 Class, respectively. |
See Notes to Financial Statements.
16
| Notes to Financial Statements |
NOVEMBER 30, 2018
1. Organization
American Century World Mutual Funds, Inc. (the corporation) is registered under the Investment Company Act of 1940, as amended (the 1940 Act), as an open-end management investment company and is organized as a Maryland corporation. Global Growth Fund (the fund) is one fund in a series issued by the corporation. The fund's investment objective is to seek capital growth.
The fund offers the Investor Class, I Class, Y Class, A Class, C Class, R Class, R5 Class and R6 Class. The A Class may incur an initial sales charge. The A Class and C Class may be subject to a contingent deferred sales charge. Sale of the Y Class and R5 Class commenced on April 10, 2017.
2. Significant Accounting Policies
The following is a summary of significant accounting policies consistently followed by the fund in preparation of its financial statements. The fund is an investment company and follows accounting and reporting guidance in accordance with accounting principles generally accepted in the United States of America. This may require management to make certain estimates and assumptions at the date of the financial statements. Actual results could differ from these estimates. Management evaluated the impact of events or transactions occurring through the date the financial statements were issued that would merit recognition or disclosure.
Investment Valuations — The fund determines the fair value of its investments and computes its net asset value per share at the close of regular trading (usually 4 p.m. Eastern time) on the New York Stock Exchange (NYSE) on each day the NYSE is open. The Board of Directors has adopted valuation policies and procedures to guide the investment advisor in the fund’s investment valuation process and to provide methodologies for the oversight of the fund’s pricing function.
Equity securities that are listed or traded on a domestic securities exchange are valued at the last reported sales price or at the official closing price as provided by the exchange. Equity securities traded on foreign securities exchanges are generally valued at the closing price of such securities on the exchange where primarily traded or at the close of the NYSE, if that is earlier. If no last sales price is reported, or if local convention or regulation so provides, the mean of the latest bid and asked prices may be used. Securities traded over-the-counter are valued at the mean of the latest bid and asked prices, the last sales price, or the official closing price. Equity securities initially expressed in local currencies are translated into U.S. dollars at the mean of the appropriate currency exchange rate at the close of the NYSE as provided by an independent pricing service.
Open-end management investment companies are valued at the reported net asset value per share. Repurchase agreements are valued at cost, which approximates fair value.
If the fund determines that the market price for an investment is not readily available or the valuation methods mentioned above do not reflect an investment’s fair value, such investment is valued as determined in good faith by the Board of Directors or its delegate, in accordance with policies and procedures adopted by the Board of Directors. In its determination of fair value, the fund may review several factors including, but not limited to, market information regarding the specific investment or comparable investments and correlation with other investment types, futures indices or general market indicators. Circumstances that may cause the fund to use these procedures to value an investment include, but are not limited to: an investment has been declared in default or is distressed; trading in a security has been suspended during the trading day or a security is not actively trading on its principal exchange; prices received from a regular pricing source are deemed unreliable; or there is a foreign market holiday and no trading occurred.
17
The fund monitors for significant events occurring after the close of an investment’s primary exchange but before the fund’s net asset value per share is determined. Significant events may include, but are not limited to: corporate announcements and transactions; governmental action and political unrest that could impact a specific investment or an investment sector; or armed conflicts, natural disasters and similar events that could affect investments in a specific country or region. The fund also monitors for significant fluctuations between domestic and foreign markets, as evidenced by the U.S. market or such other indicators that the Board of Directors, or its delegate, deems appropriate. If significant fluctuations in foreign markets are identified, the fund may apply a model-derived factor to the closing price of equity securities traded on foreign securities exchanges. The factor is based on observable market data as provided by an independent pricing service.
Security Transactions — Security transactions are accounted for as of the trade date. Net realized gains and losses are determined on the identified cost basis, which is also used for federal income tax purposes. Certain countries impose taxes on realized gains on the sale of securities registered in their country. The fund records the foreign tax expense, if any, on an accrual basis. The foreign tax expense on realized gains and unrealized appreciation reduces the net realized gain (loss) on investment transactions and net unrealized appreciation (depreciation) on investments, respectively.
Investment Income — Dividend income less foreign taxes withheld, if any, is recorded as of the ex-dividend date. Distributions received on securities that represent a return of capital or long-term capital gain are recorded as a reduction of cost of investments and/or as a realized gain. The fund may estimate the components of distributions received that may be considered nontaxable distributions or long-term capital gain distributions for income tax purposes. Interest income is recorded on the accrual basis and includes accretion of discounts and amortization of premiums.
Foreign Currency Translations — All assets and liabilities initially expressed in foreign currencies are translated into U.S. dollars at prevailing exchange rates at period end. The fund may enter into spot foreign currency exchange contracts to facilitate transactions denominated in a foreign currency. Purchases and sales of investment securities, dividend and interest income, spot foreign currency exchange contracts, and expenses are translated at the rates of exchange prevailing on the respective dates of such transactions. Net realized and unrealized foreign currency exchange gains or losses related to investment securities are a component of net realized gain (loss) on investment transactions and change in net unrealized appreciation (depreciation) on investments, respectively.
Repurchase Agreements — The fund may enter into repurchase agreements with institutions that American Century Investment Management, Inc. (ACIM) (the investment advisor) has determined are creditworthy pursuant to criteria adopted by the Board of Directors. The fund requires that the collateral, represented by securities, received in a repurchase transaction be transferred to the custodian in a manner sufficient to enable the fund to obtain those securities in the event of a default under the repurchase agreement. ACIM monitors, on a daily basis, the securities transferred to ensure the value, including accrued interest, of the securities under each repurchase agreement is equal to or greater than amounts owed to the fund under each repurchase agreement.
Joint Trading Account — Pursuant to an Exemptive Order issued by the Securities and Exchange Commission, the fund, along with certain other funds in the American Century Investments family of funds, may transfer uninvested cash balances into a joint trading account. These balances are invested in one or more repurchase agreements that are collateralized by U.S. Treasury or Agency obligations.
Income Tax Status — It is the fund’s policy to distribute substantially all net investment income and net realized gains to shareholders and to otherwise qualify as a regulated investment company under provisions of the Internal Revenue Code. Accordingly, no provision has been made for income taxes. The fund files U.S. federal, state, local and non-U.S. tax returns as applicable. The fund's tax returns are subject to examination by the relevant taxing authority until expiration of the applicable statute of limitations, which is generally three years from the date of filing but can be longer in certain jurisdictions. At this time, management believes there are no uncertain tax positions which, based on their technical merit, would not be sustained upon examination and for which it is reasonably possible that the total amounts of unrecognized tax benefits will significantly change in the next twelve months.
Multiple Class — All shares of the fund represent an equal pro rata interest in the net assets of the class to which such shares belong, and have identical voting, dividend, liquidation and other rights and the same terms and conditions, except for class specific expenses and exclusive rights to vote on matters affecting only individual classes. Income, non-class specific expenses, and realized and unrealized capital gains and losses of the fund are allocated to each class of shares based on their relative net assets.
18
Distributions to Shareholders — Distributions from net investment income and net realized gains, if any, are generally declared and paid annually. The fund may make distributions on a more frequent basis to comply with the distribution requirements of the Internal Revenue Code, in all events in a manner consistent with provisions of the 1940 Act.
Redemption Fees — Prior to October 9, 2017, the fund may have imposed a 2.00% redemption fee on shares held less than 60 days. The fee was not applicable to all classes. The redemption fee was retained by the fund to help cover transaction costs that long-term investors may bear when the fund sells securities to meet investor redemptions.
Indemnifications — Under the corporation’s organizational documents, its officers and directors are indemnified against certain liabilities arising out of the performance of their duties to the fund. In addition, in the normal course of business, the fund enters into contracts that provide general indemnifications. The maximum exposure under these arrangements is unknown as this would involve future claims that may be made against a fund. The risk of material loss from such claims is considered by management to be remote.
3. Fees and Transactions with Related Parties
Certain officers and directors of the corporation are also officers and/or directors of American Century Companies, Inc. (ACC). The corporation’s investment advisor, ACIM, the corporation's distributor, American Century Investment Services, Inc. (ACIS), and the corporation’s transfer agent, American Century Services, LLC, are wholly owned, directly or indirectly, by ACC.
Management Fees — The corporation has entered into a management agreement with ACIM, under which ACIM provides the fund with investment advisory and management services in exchange for a single, unified management fee (the fee) per class. The agreement provides that all expenses of managing and operating the fund, except distribution and service fees, brokerage expenses, taxes, interest, fees and expenses of the independent directors (including legal counsel fees), and extraordinary expenses, will be paid by ACIM. The fee is computed and accrued daily based on each class’s daily net assets and paid monthly in arrears. The difference in the fee among the classes is a result of their separate arrangements for non-Rule 12b-1 shareholder services. It is not the result of any difference in advisory or custodial fees or other expenses related to the management of the fund’s assets, which do not vary by class. The rate of the fee is determined by applying a fee rate calculation formula. This formula takes into account the fund’s assets as well as certain assets, if any, of other clients of the investment advisor outside the American Century Investments family of funds (such as subadvised funds and separate accounts) that use very similar investment teams and strategies (strategy assets).
The management fee schedule range and the effective annual management fee for each class for the period ended November 30, 2018 are as follows:
Management Fee Schedule Range | Effective Annual Management Fee | |
| Investor Class | 1.050% to 1.300% | 1.07% |
| I Class | 0.850% to 1.100% | 0.87% |
| Y Class | 0.700% to 0.950% | 0.72% |
| A Class | 1.050% to 1.300% | 1.07% |
| C Class | 1.050% to 1.300% | 1.07% |
| R Class | 1.050% to 1.300% | 1.07% |
| R5 Class | 0.850% to 1.100% | 0.87% |
| R6 Class | 0.700% to 0.950% | 0.72% |
19
Distribution and Service Fees — The Board of Directors has adopted a separate Master Distribution and Individual Shareholder Services Plan for each of the A Class, C Class and R Class (collectively the plans), pursuant to Rule 12b-1 of the 1940 Act. The plans provide that the A Class will pay ACIS an annual distribution and service fee of 0.25%. The plans provide that the C Class will pay ACIS an annual distribution and service fee of 1.00%, of which 0.25% is paid for individual shareholder services and 0.75% is paid for distribution services. The plans provide that the R Class will pay ACIS an annual distribution and service fee of 0.50%. The fees are computed and accrued daily based on each class’s daily net assets and paid monthly in arrears. The fees are used to pay financial intermediaries for distribution and individual shareholder services. Fees incurred under the plans during the period ended November 30, 2018 are detailed in the Statement of Operations.
Directors' Fees and Expenses — The Board of Directors is responsible for overseeing the investment advisor’s management and operations of the fund. The directors receive detailed information about the fund and its investment advisor regularly throughout the year, and meet at least quarterly with management of the investment advisor to review reports about fund operations. The fund’s officers do not receive compensation from the fund.
Interfund Transactions — The fund may enter into security transactions with other American Century Investments funds and other client accounts of the investment advisor, in accordance with the 1940 Act rules and procedures adopted by the Board of Directors. The rules and procedures require, among other things, that these transactions be effected at the independent current market price of the security. During the period, the interfund purchases and sales were $954,136 and $420,034, respectively. The effect of interfund transactions on the Statement of Operations was $121,318 in net realized gain (loss) on investment transactions.
4. Investment Transactions
Purchases and sales of investment securities, excluding short-term investments, for the period ended November 30, 2018 were $227,310,854 and $275,539,723, respectively.
20
5. Capital Share Transactions
Transactions in shares of the fund were as follows:
| Year ended November 30, 2018 | Year ended November 30, 2017(1) | |||||||||
| Shares | Amount | Shares | Amount | |||||||
| Investor Class/Shares Authorized | 385,000,000 | 340,000,000 | ||||||||
| Sold | 2,390,301 | $ | 30,414,509 | 3,498,175 | $ | 43,157,809 | ||||
| Issued in reinvestment of distributions | 3,851,797 | 46,801,407 | 489,710 | 5,515,330 | ||||||
| Redeemed | (5,110,511 | ) | (65,185,892 | ) | (7,677,343 | ) | (92,524,581 | ) | ||
| 1,131,587 | 12,030,024 | (3,689,458 | ) | (43,851,442 | ) | |||||
| I Class/Shares Authorized | 50,000,000 | 55,000,000 | ||||||||
| Sold | 727,393 | 9,577,897 | 1,918,465 | 23,107,508 | ||||||
| Issued in reinvestment of distributions | 269,213 | 3,338,740 | 50,829 | 582,556 | ||||||
| Redeemed | (2,042,868 | ) | (26,578,900 | ) | (2,996,276 | ) | (37,375,484 | ) | ||
| (1,046,262 | ) | (13,662,263 | ) | (1,026,982 | ) | (13,685,420 | ) | |||
| Y Class/Shares Authorized | 25,000,000 | 50,000,000 | ||||||||
| Sold | 88 | 1,174 | 418 | 5,000 | ||||||
| Issued in reinvestment of distributions | 52 | 642 | — | — | ||||||
| 140 | 1,816 | 418 | 5,000 | |||||||
| A Class/Shares Authorized | 40,000,000 | 40,000,000 | ||||||||
| Sold | 451,629 | 5,642,831 | 410,718 | 4,855,728 | ||||||
| Issued in reinvestment of distributions | 273,488 | 3,221,690 | 46,105 | 505,916 | ||||||
| Redeemed | (829,318 | ) | (10,201,574 | ) | (1,595,257 | ) | (18,764,878 | ) | ||
| (104,201 | ) | (1,337,053 | ) | (1,138,434 | ) | (13,403,234 | ) | |||
| C Class/Shares Authorized | 30,000,000 | 30,000,000 | ||||||||
| Sold | 104,011 | 1,117,903 | 83,626 | 894,854 | ||||||
| Issued in reinvestment of distributions | 62,611 | 641,132 | 7,178 | 69,813 | ||||||
| Redeemed | (222,760 | ) | (2,402,989 | ) | (312,267 | ) | (3,208,186 | ) | ||
| (56,138 | ) | (643,954 | ) | (221,463 | ) | (2,243,519 | ) | |||
| R Class/Shares Authorized | 30,000,000 | 30,000,000 | ||||||||
| Sold | 83,143 | 1,011,937 | 131,343 | 1,517,519 | ||||||
| Issued in reinvestment of distributions | 76,654 | 889,957 | 9,907 | 107,628 | ||||||
| Redeemed | (167,806 | ) | (2,035,422 | ) | (207,598 | ) | (2,484,860 | ) | ||
| (8,009 | ) | (133,528 | ) | (66,348 | ) | (859,713 | ) | |||
| R5 Class/Shares Authorized | 20,000,000 | 50,000,000 | ||||||||
| Sold | — | — | 420 | 5,000 | ||||||
| Issued in reinvestment of distributions | 52 | 639 | — | — | ||||||
| 52 | 639 | 420 | 5,000 | |||||||
| R6 Class/Shares Authorized | 40,000,000 | 50,000,000 | ||||||||
| Sold | 1,521,533 | 20,077,660 | 1,567,880 | 20,550,216 | ||||||
| Issued in reinvestment of distributions | 334,272 | 4,170,767 | 23,164 | 266,625 | ||||||
| Redeemed | (709,871 | ) | (9,357,777 | ) | (420,129 | ) | (5,383,883 | ) | ||
| 1,145,934 | 14,890,650 | 1,170,915 | 15,432,958 | |||||||
| Net increase (decrease) | 1,063,103 | $ | 11,146,331 | (4,970,932 | ) | $ | (58,600,370 | ) | ||
| (1) | April 10, 2017 (commencement of sale) through November 30, 2017 for the Y Class and R5 Class. |
21
6. Fair Value Measurements
The fund’s investments valuation process is based on several considerations and may use multiple inputs to determine the fair value of the investments held by the fund. In conformity with accounting principles generally accepted in the United States of America, the inputs used to determine a valuation are classified into three broad levels.
| • | Level 1 valuation inputs consist of unadjusted quoted prices in an active market for identical investments. |
| • | Level 2 valuation inputs consist of direct or indirect observable market data (including quoted prices for comparable investments, evaluations of subsequent market events, interest rates, prepayment speeds, credit risk, etc.). These inputs also consist of quoted prices for identical investments initially expressed in local currencies that are adjusted through translation into U.S. dollars. |
| • | Level 3 valuation inputs consist of unobservable data (including a fund’s own assumptions). |
The level classification is based on the lowest level input that is significant to the fair valuation measurement. The valuation inputs are not necessarily an indication of the risks associated with investing in these securities or other financial instruments.
The following is a summary of the level classifications as of period end. The Schedule of Investments provides additional information on the fund’s portfolio holdings.
| Level 1 | Level 2 | Level 3 | ||||||
| Assets | ||||||||
| Investment Securities | ||||||||
| Common Stocks | ||||||||
| Austria | — | $ | 4,549,905 | — | ||||
| Brazil | — | 5,456,959 | — | |||||
| Canada | $ | 2,012,418 | 2,874,128 | — | ||||
| China | 10,789,023 | 6,594,278 | — | |||||
| France | — | 10,918,818 | — | |||||
| Hong Kong | — | 15,482,389 | — | |||||
| Hungary | — | 4,588,280 | — | |||||
| India | — | 5,657,192 | — | |||||
| Indonesia | — | 3,551,907 | — | |||||
| Ireland | — | 6,051,964 | — | |||||
| Italy | — | 2,881,490 | — | |||||
| Japan | — | 19,599,967 | — | |||||
| Mexico | — | 4,015,159 | — | |||||
| Netherlands | 1,839,456 | 7,790,207 | — | |||||
| Sweden | — | 2,151,236 | — | |||||
| Switzerland | — | 7,866,761 | — | |||||
| United Kingdom | — | 24,108,730 | — | |||||
| Other Countries | 357,800,132 | — | — | |||||
| Temporary Cash Investments | 13,879 | 2,805,781 | — | |||||
| $ | 372,454,908 | $ | 136,945,151 | — | ||||
7. Risk Factors
There are certain risks involved in investing in foreign securities. These risks include those resulting from future adverse political, social and economic developments, fluctuations in currency exchange rates, the possible imposition of exchange controls, and other foreign laws or restrictions. Investing in emerging markets may accentuate these risks.
22
8. Federal Tax Information
On December 18, 2018, the fund declared and paid a per-share distribution from net realized gains to shareholders of record on December 17, 2018 of $1.1089 for the Investor Class, I Class, Y Class, A Class, C Class, R Class, R5 Class and R6 Class.
On December 18, 2018, the fund declared and paid the following per-share distributions from net investment income to shareholders of record on December 17, 2018:
| Investor Class | I Class | Y Class | A Class | C Class | R Class | R5 Class | R6 Class | |||
| $0.0125 | $0.0353 | $0.0525 | — | — | — | $0.0353 | $0.0525 | |||
The tax character of distributions paid during the years ended November 30, 2018 and November 30, 2017 were as follows:
| 2018 | 2017 | |||||
| Distributions Paid From | ||||||
| Ordinary income | $ | 7,182,024 | $ | 1,487,781 | ||
| Long-term capital gains | $ | 53,608,978 | $ | 5,778,340 | ||
The book-basis character of distributions made during the year from net investment income or net realized gains may differ from their ultimate characterization for federal income tax purposes. These differences reflect the differing character of certain income items and net realized gains and losses for financial statement and tax purposes, and may result in reclassification among certain capital accounts on the financial statements.
As of period end, the federal tax cost of investments and the components of distributable earnings on a tax-basis were as follows:
| Federal tax cost of investments | $ | 380,741,352 | |
| Gross tax appreciation of investments | $ | 140,132,915 | |
| Gross tax depreciation of investments | (11,474,208 | ) | |
| Net tax appreciation (depreciation) of investments | 128,658,707 | ||
| Net tax appreciation (depreciation) on translation of assets and liabilities in foreign currencies | (35,548 | ) | |
| Net tax appreciation (depreciation) | $ | 128,623,159 | |
| Undistributed ordinary income | $ | 653,802 | |
| Accumulated long-term gains | $ | 45,743,771 | |
| Post-October capital loss deferral | $ | (1,201,618 | ) |
The difference between book-basis and tax-basis unrealized appreciation (depreciation) is attributable primarily to the realization to ordinary income for tax purposes of unrealized gains on investments in passive foreign investment companies.
Loss deferrals represent certain qualified losses that the fund has elected to treat as having been incurred in the following fiscal year for federal income tax purposes.
23
| Financial Highlights |
| For a Share Outstanding Throughout the Years Ended November 30 (except as noted) | |||||||||||||||
| Per-Share Data | Ratios and Supplemental Data | ||||||||||||||
| Income From Investment Operations: | Distributions From: | Ratio to Average Net Assets of: | |||||||||||||
Net Asset Value, Beginning of Period | Net Investment Income (Loss)(1) | Net Realized and Unrealized Gain (Loss) | Total From Investment Operations | Net Investment Income | Net Realized Gains | Total Distributions | Net Asset Value, End of Period | Total Return(2) | Operating Expenses | Net Investment Income (Loss) | Portfolio Turnover Rate | Net Assets, End of Period (in thousands) | |||
| Investor Class | |||||||||||||||
| 2018 | $13.67 | 0.04 | 0.11 | 0.15 | (0.03) | (1.47) | (1.50) | $12.32 | 1.27% | 1.07% | 0.29% | 42% | $408,562 | ||
| 2017 | $10.84 | 0.02 | 2.98 | 3.00 | (0.04) | (0.13) | (0.17) | $13.67 | 27.99% | 1.08% | 0.14% | 54% | $437,822 | ||
| 2016 | $12.01 | 0.03 | (0.42) | (0.39) | (0.01) | (0.77) | (0.78) | $10.84 | (3.24)% | 1.08% | 0.27% | 57% | $387,155 | ||
| 2015 | $12.94 | —(3) | 0.12 | 0.12 | — | (1.05) | (1.05) | $12.01 | 1.37% | 1.08% | 0.04% | 50% | $443,915 | ||
| 2014 | $12.39 | —(3) | 0.91 | 0.91 | (0.08) | (0.28) | (0.36) | $12.94 | 7.53% | 1.08% | 0.03% | 46% | $462,889 | ||
| I Class | |||||||||||||||
| 2018 | $13.91 | 0.06 | 0.12 | 0.18 | (0.05) | (1.47) | (1.52) | $12.57 | 1.52% | 0.87% | 0.49% | 42% | $16,210 | ||
| 2017 | $11.01 | 0.05 | 3.02 | 3.07 | (0.04) | (0.13) | (0.17) | $13.91 | 28.25% | 0.88% | 0.34% | 54% | $32,498 | ||
| 2016 | $12.19 | 0.05 | (0.42) | (0.37) | (0.04) | (0.77) | (0.81) | $11.01 | (3.07)% | 0.88% | 0.47% | 57% | $37,028 | ||
| 2015 | $13.09 | 0.03 | 0.12 | 0.15 | — | (1.05) | (1.05) | $12.19 | 1.60% | 0.88% | 0.24% | 50% | $33,211 | ||
| 2014 | $12.52 | 0.03 | 0.91 | 0.94 | (0.09) | (0.28) | (0.37) | $13.09 | 7.68% | 0.88% | 0.23% | 46% | $78,802 | ||
| Y Class | |||||||||||||||
| 2018 | $13.98 | 0.08 | 0.12 | 0.20 | (0.06) | (1.47) | (1.53) | $12.65 | 1.62% | 0.72% | 0.64% | 42% | $7 | ||
2017(4) | $11.95 | 0.04 | 1.99 | 2.03 | — | — | — | $13.98 | 16.99% | 0.73%(5) | 0.49%(5) | 54%(6) | $6 | ||
| For a Share Outstanding Throughout the Years Ended November 30 (except as noted) | |||||||||||||||
| Per-Share Data | Ratios and Supplemental Data | ||||||||||||||
| Income From Investment Operations: | Distributions From: | Ratio to Average Net Assets of: | |||||||||||||
Net Asset Value, Beginning of Period | Net Investment Income (Loss)(1) | Net Realized and Unrealized Gain (Loss) | Total From Investment Operations | Net Investment Income | Net Realized Gains | Total Distributions | Net Asset Value, End of Period | Total Return(2) | Operating Expenses | Net Investment Income (Loss) | Portfolio Turnover Rate | Net Assets, End of Period (in thousands) | |||
| A Class | |||||||||||||||
| 2018 | $13.31 | —(3) | 0.12 | 0.12 | — | (1.47) | (1.47) | $11.96 | 1.08% | 1.32% | 0.04% | 42% | $26,256 | ||
| 2017 | $10.58 | (0.01) | 2.90 | 2.89 | (0.03) | (0.13) | (0.16) | $13.31 | 27.65% | 1.33% | (0.11)% | 54% | $30,622 | ||
| 2016 | $11.76 | —(3) | (0.41) | (0.41) | — | (0.77) | (0.77) | $10.58 | (3.52)% | 1.33% | 0.02% | 57% | $36,382 | ||
| 2015 | $12.72 | (0.02) | 0.11 | 0.09 | — | (1.05) | (1.05) | $11.76 | 1.14% | 1.33% | (0.21)% | 50% | $45,855 | ||
| 2014 | $12.21 | (0.03) | 0.89 | 0.86 | (0.07) | (0.28) | (0.35) | $12.72 | 7.23% | 1.33% | (0.22)% | 46% | $54,091 | ||
| C Class | |||||||||||||||
| 2018 | $11.77 | (0.08) | 0.10 | 0.02 | — | (1.47) | (1.47) | $10.32 | 0.27% | 2.07% | (0.71)% | 42% | $4,662 | ||
| 2017 | $9.42 | (0.09) | 2.58 | 2.49 | (0.01) | (0.13) | (0.14) | $11.77 | 26.77% | 2.08% | (0.86)% | 54% | $5,977 | ||
| 2016 | $10.63 | (0.07) | (0.37) | (0.44) | — | (0.77) | (0.77) | $9.42 | (4.23)% | 2.08% | (0.73)% | 57% | $6,872 | ||
| 2015 | $11.68 | (0.10) | 0.10 | —(3) | — | (1.05) | (1.05) | $10.63 | 0.40% | 2.08% | (0.96)% | 50% | $8,520 | ||
| 2014 | $11.30 | (0.11) | 0.81 | 0.70 | (0.04) | (0.28) | (0.32) | $11.68 | 6.39% | 2.08% | (0.97)% | 46% | $7,234 | ||
| R Class | |||||||||||||||
| 2018 | $13.14 | (0.03) | 0.11 | 0.08 | — | (1.47) | (1.47) | $11.75 | 0.75% | 1.57% | (0.21)% | 42% | $6,995 | ||
| 2017 | $10.47 | (0.04) | 2.86 | 2.82 | (0.02) | (0.13) | (0.15) | $13.14 | 27.29% | 1.58% | (0.36)% | 54% | $7,925 | ||
| 2016 | $11.67 | (0.03) | (0.40) | (0.43) | — | (0.77) | (0.77) | $10.47 | (3.73)% | 1.58% | (0.23)% | 57% | $7,007 | ||
| 2015 | $12.66 | (0.05) | 0.11 | 0.06 | — | (1.05) | (1.05) | $11.67 | 0.89% | 1.58% | (0.46)% | 50% | $6,040 | ||
| 2014 | $12.18 | (0.06) | 0.88 | 0.82 | (0.06) | (0.28) | (0.34) | $12.66 | 7.00% | 1.58% | (0.47)% | 46% | $5,632 | ||
| For a Share Outstanding Throughout the Years Ended November 30 (except as noted) | |||||||||||||||
| Per-Share Data | Ratios and Supplemental Data | ||||||||||||||
| Income From Investment Operations: | Distributions From: | Ratio to Average Net Assets of: | |||||||||||||
Net Asset Value, Beginning of Period | Net Investment Income (Loss)(1) | Net Realized and Unrealized Gain (Loss) | Total From Investment Operations | Net Investment Income | Net Realized Gains | Total Distributions | Net Asset Value, End of Period | Total Return(2) | Operating Expenses | Net Investment Income (Loss) | Portfolio Turnover Rate | Net Assets, End of Period (in thousands) | |||
| R5 Class | |||||||||||||||
| 2018 | $13.90 | 0.06 | 0.12 | 0.18 | (0.04) | (1.47) | (1.51) | $12.57 | 1.52% | 0.87% | 0.49% | 42% | $6 | ||
2017(4) | $11.90 | 0.03 | 1.97 | 2.00 | — | — | — | $13.90 | 16.81% | 0.88%(5) | 0.34%(5) | 54%(6) | $6 | ||
| R6 Class | |||||||||||||||
| 2018 | $13.98 | 0.09 | 0.10 | 0.19 | (0.07) | (1.47) | (1.54) | $12.63 | 1.58% | 0.72% | 0.64% | 42% | $48,147 | ||
| 2017 | $11.05 | 0.05 | 3.05 | 3.10 | (0.04) | (0.13) | (0.17) | $13.98 | 28.46% | 0.73% | 0.49% | 54% | $37,248 | ||
| 2016 | $12.23 | 0.07 | (0.43) | (0.36) | (0.05) | (0.77) | (0.82) | $11.05 | (2.91)% | 0.73% | 0.62% | 57% | $16,508 | ||
| 2015 | $13.11 | 0.05 | 0.12 | 0.17 | — | (1.05) | (1.05) | $12.23 | 1.76% | 0.73% | 0.39% | 50% | $15,887 | ||
| 2014 | $12.53 | 0.02 | 0.93 | 0.95 | (0.09) | (0.28) | (0.37) | $13.11 | 7.80% | 0.73% | 0.38% | 46% | $16,992 | ||
| Notes to Financial Highlights |
| (1) | Computed using average shares outstanding throughout the period. |
| (2) | Total returns are calculated based on the net asset value of the last business day and do not reflect applicable sales charges, if any. Total returns for periods less than one year are not annualized. |
| (3) | Per-share amount was less than $0.005. |
| (4) | April 10, 2017 (commencement of sale) through November 30, 2017. |
| (5) | Annualized. |
| (6) | Portfolio turnover is calculated at the fund level. Percentage indicated was calculated for the year ended November 30, 2017. |
See Notes to Financial Statements.
| Report of Independent Registered Public Accounting Firm |
To the Shareholders and the Board of Directors of American Century World Mutual Funds, Inc.:
Opinion on the Financial Statements and Financial Highlights
We have audited the accompanying statement of assets and liabilities, including the schedule of investments, of Global Growth Fund, one of the funds constituting the American Century World Mutual Funds, Inc. (the “Fund”), as of November 30, 2018, the related statement of operations for the year then ended, the statements of changes in net assets for each of the two years in the period then ended, the financial highlights for each of the five years in the period then ended, and the related notes. In our opinion, the financial statements and financial highlights present fairly, in all material respects, the financial position of Global Growth Fund of the American Century World Mutual Funds, Inc. as of November 30, 2018, the results of its operations for the year then ended, the changes in its net assets for each of the two years in the period then ended, and the financial highlights for each of the five years in the period then ended, in conformity with accounting principles generally accepted in the United States of America.
Basis for Opinion
These financial statements and financial highlights are the responsibility of the Fund's management. Our responsibility is to express an opinion on the Fund’s financial statements and financial highlights based on our audits. We are a public accounting firm registered with the Public Company Accounting Oversight Board (United States) (PCAOB) and are required to be independent with respect to the Fund in accordance with the U.S. federal securities laws and the applicable rules and regulations of the Securities and Exchange Commission and the PCAOB.
We conducted our audits in accordance with the standards of the PCAOB. Those standards require that we plan and perform the audit to obtain reasonable assurance about whether the financial statements and financial highlights are free of material misstatement, whether due to error or fraud. The Fund is not required to have, nor were we engaged to perform, an audit of its internal control over financial reporting. As part of our audits we are required to obtain an understanding of internal control over financial reporting but not for the purpose of expressing an opinion on the effectiveness of the Fund’s internal control over financial reporting. Accordingly, we express no such opinion.
Our audits included performing procedures to assess the risks of material misstatement of the financial statements and financial highlights, whether due to error or fraud, and performing procedures that respond to those risks. Such procedures included examining, on a test basis, evidence regarding the amounts and disclosures in the financial statements and financial highlights. Our audits also included evaluating the accounting principles used and significant estimates made by management, as well as evaluating the overall presentation of the financial statements and financial highlights. Our procedures included confirmation of securities owned as of November 30, 2018, by correspondence with the custodian and brokers; when replies were not received from brokers, we performed other auditing procedures. We believe that our audits provide a reasonable basis for our opinion.
DELOITTE & TOUCHE LLP
Kansas City, Missouri
January 17, 2019
We have served as the auditor of one or more American Century investment companies since 1997.
27
| Management |
The Board of Directors
The individuals listed below serve as directors of the funds. Each director will continue to serve in this capacity until death, retirement, resignation or removal from office. The board has adopted a mandatory retirement age for directors who are not “interested persons,” as that term is defined in the Investment Company Act (independent directors). Independent directors shall retire by December 31 of the year in which they reach their 75th birthday.
Mr. Thomas is an “interested person” because he currently serves as President and Chief Executive Officer of American Century Companies, Inc. (ACC), the parent company of American Century Investment Management, Inc. (ACIM or the advisor). The other directors (more than three-fourths of the total number) are independent. They are not employees, directors or officers of, and have no financial interest in, ACC or any of its wholly owned, direct or indirect, subsidiaries, including ACIM, American Century Investment Services, Inc. (ACIS) and American Century Services, LLC (ACS), and they do not have any other affiliations, positions or relationships that would cause them to be considered “interested persons” under the Investment Company Act. The directors serve in this capacity for seven (in the case of Jonathan S. Thomas, 16; and Stephen E. Yates, 8) registered investment companies in the American Century Investments family of funds.
The following table presents additional information about the directors. The mailing address for each director is 4500 Main Street, Kansas City, Missouri 64111.
| Name (Year of Birth) | Position(s) Held with Funds | Length of Time Served | Principal Occupation(s) During Past 5 Years | Number of American Century Portfolios Overseen by Director | Other Directorships Held During Past 5 Years |
| Independent Directors | |||||
| Thomas W. Bunn (1953) | Director | Since 2017 | Retired | 68 | SquareTwo Financial; Barings (formerly Babson Capital Funds Trust) (2013 to 2016) |
| Barry Fink (1955) | Director | Since 2012 (independent since 2016) | Retired; Executive Vice President, ACC (2007 to 2013); President, ACS (2007 to 2013) | 68 | None |
| Jan M. Lewis (1957) | Director | Since 2011 | Retired; President and Chief Executive Officer, Catholic Charities of Northeast Kansas (human services organization) (2006 to 2013) | 68 | None |
M. Jeannine Strandjord(1) (1945) | Director | Since 1994 | Self-employed Consultant | 68 | Euronet Worldwide Inc. and MGP Ingredients, Inc. |
28
| Name (Year of Birth) | Position(s) Held with Funds | Length of Time Served | Principal Occupation(s) During Past 5 Years | Number of American Century Portfolios Overseen by Director | Other Directorships Held During Past 5 Years |
| Independent Directors | |||||
| John R. Whitten (1946) | Director | Since 2008 | Retired | 68 | Rudolph Technologies, Inc. |
| Stephen E. Yates (1948) | Director and Chairman of the Board | Since 2012 (Chairman since 2018) | Retired | 73 | None |
| Interested Director | |||||
| Jonathan S. Thomas (1963) | Director and President | Since 2007 | President and Chief Executive Officer, ACC (2007 to present). Also serves as Chief Executive Officer, ACS; Executive Vice President, ACIM; Director, ACC, ACIM and other ACC subsidiaries | 118 | BioMed Valley Discoveries, Inc. |
(1) Effective December 31, 2018, M. Jeannine Strandjord retired from the Board of Directors.
The Statement of Additional Information has additional information about the fund's directors and is available without charge, upon request, by calling 1-800-345-2021.
29
Officers
The following table presents certain information about the executive officers of the funds. Each officer serves as an officer for each of the 16 (in the case of Robert J. Leach, 15) investment companies in the American Century family of funds. No officer is compensated for his or her service as an officer of the funds. The listed officers are interested persons of the funds and are appointed or re-appointed on an annual basis. The mailing address for each officer listed below is 4500 Main Street, Kansas City, Missouri 64111.
| Name (Year of Birth) | Offices with the Funds | Principal Occupation(s) During the Past Five Years |
| Jonathan S. Thomas (1963) | Director and President since 2007 | President and Chief Executive Officer, ACC (2007 to present). Also serves as Chief Executive Officer, ACS; Executive Vice President, ACIM; Director, ACC, ACIM and other ACC subsidiaries |
| R. Wes Campbell (1974) | Chief Financial Officer and Treasurer since 2018 | Investment Operations and Investment Accounting, ACS (2000 to present) |
| Amy D. Shelton (1964) | Chief Compliance Officer and Vice President since 2014 | Chief Compliance Officer, American Century funds, (2014 to present); Chief Compliance Officer, ACIM (2014 to present); Chief Compliance Officer, ACIS (2009 to present); Vice President, Client Interactions and Marketing, ACIS (2013 to 2014). Also serves as Vice President, ACIS |
| Charles A. Etherington (1957) | General Counsel since 2007 and Senior Vice President since 2006 | Attorney, ACC (1994 to present); Vice President, ACC (2005 to present); General Counsel, ACC (2007 to present). Also serves as General Counsel, ACIM, ACS, ACIS and other ACC subsidiaries; and Senior Vice President, ACIM and ACS |
| C. Jean Wade (1964) | Vice President since 2012 | Senior Vice President, ACS (2017 to present); Vice President, ACS (2000 to 2017) |
| Robert J. Leach (1966) | Vice President since 2006 | Vice President, ACS (2000 to present) |
| David H. Reinmiller (1963) | Vice President since 2000 | Attorney, ACC (1994 to present). Also serves as Vice President, ACIM and ACS |
| Ward D. Stauffer (1960) | Secretary since 2005 | Attorney, ACC (2003 to present) |
30
| Approval of Management Agreement |
At a meeting held on June 28, 2018, the Fund’s Board of Directors (the "Board") unanimously approved the renewal of the management agreement pursuant to which American Century Investment Management, Inc. (the “Advisor”) acts as the investment advisor for the Fund. Under Section 15(c) of the Investment Company Act, contracts for investment advisory services are required to be reviewed, evaluated, and approved by a majority of a fund’s directors (the “Directors”), including a majority of the independent Directors, each year.
Prior to its consideration of the renewal of the management agreement, the Directors requested and reviewed extensive data and information compiled by the Advisor and certain independent providers of evaluation data concerning the Fund and the services provided to the Fund by the Advisor. This review was in addition to the oversight and evaluation undertaken by the Board and its committees on a continual basis and the information received was supplemental to the extensive information that the Board and its committees receive and consider throughout the year. The Directors also conducted a review of the process by which the Board considers the renewal of the management agreements. The Board consulted with industry experts and reviewed industry best practices and recent judicial precedent. The Directors believe that the enhancements resulting from their review resulted in increased dialogue with the Advisor and an improved process for fund shareholders.
In connection with its consideration of the renewal of the management agreement, the Board’s review and evaluation of the services provided by the Advisor included, but was not limited to, the following:
| • | the nature, extent, and quality of investment management, shareholder services, and other services provided and to be provided to the Fund; |
| • | the wide range of other programs and services provided and to be provided to the Fund and its shareholders on a routine and non-routine basis; |
| • | the investment performance of the Fund, including data comparing the Fund's performance to appropriate benchmarks and/or a peer group of other mutual funds with similar investment objectives and strategies; |
| • | the cost of owning the Fund compared to the cost of owning similar funds; |
| • | the compliance policies, procedures, and regulatory experience of the Advisor and the Fund's service providers; |
| • | financial data showing the cost of services provided to the Fund, the profitability of the Fund to the Advisor, and the overall profitability of the Advisor |
| • | strategic plans of the Advisor; |
| • | any economies of scale associated with the Advisor’s management of the Fund and other accounts; |
| • | services provided and charges to the Advisor's other investment management clients; |
| • | acquired fund fees and expenses; |
| • | payments and practices in connection with financial intermediaries holding shares of the Fund and the services provided by intermediaries in connection therewith; and |
| • | any collateral benefits derived by the Advisor from the management of the Fund. |
The Directors held two in-person meetings and one telephonic meeting to review and discuss the information provided. The independent Directors also reviewed responses to supplemental information requests provided by the Directors to the Advisor and held active discussions with the Advisor regarding the renewal of the management agreement. The independent Directors had the benefit of the advice of their independent counsel throughout the process.
31
Factors Considered
The Directors considered all of the information provided by the Advisor, the independent data providers, and independent counsel in connection with the approval. They determined that the information was sufficient for them to evaluate the management agreement for the Fund. In connection with their review, the Directors did not identify any single factor as being all-important or controlling, and each Director may have attributed different levels of importance to different factors. In deciding to renew the management agreement, the Board based its decision on a number of factors, including without limitation the following:
Nature, Extent and Quality of Services - Generally. Under the management agreement, the Advisor is responsible for providing or arranging for all services necessary for the operation of the Fund. The Board noted that the Advisor provides or arranges at its own expense a wide variety of services including without limitation the following:
| • | portfolio research and security selection |
| • | securities trading |
| • | Fund administration |
| • | custody of Fund assets |
| • | daily valuation of the Fund’s portfolio |
| • | shareholder servicing and transfer agency, including shareholder confirmations, recordkeeping, and communications |
| • | legal services (except the independent Directors’ counsel) |
| • | regulatory and portfolio compliance |
| • | financial reporting |
| • | marketing and distribution (except amounts paid by the Fund under Rule 12b-1 plans) |
The Board noted that many of these services have expanded over time in terms of both quantity and complexity in response to shareholder demands, competition in the industry, changing distribution channels, and the changing regulatory environment.
Investment Management Services. The nature of the investment management services provided to the Fund is quite complex and allows Fund shareholders access to professional money management, instant diversification of their investments within an asset class, the opportunity to easily diversify among asset classes by investing in or exchanging among various American Century Investments funds, and liquidity. In evaluating investment performance, the Board expects the Advisor to manage the Fund in accordance with its investment objectives and approved strategies. Further, the Directors recognize that the Advisor has an obligation to monitor trading activities, and in particular to seek the best execution of fund trades, and to evaluate the use of and payment for research. In providing these services, the Advisor utilizes teams of investment professionals (portfolio managers, analysts, research assistants, and securities traders) who require extensive information technology, research, training, compliance, and other systems to conduct their business. The Board, directly and through its Fund Performance Review Committee, provides oversight of the investment performance process. It regularly reviews investment performance information for the Fund, together with comparative information for appropriate benchmarks and/or peer groups of similarly-managed funds, over different time horizons. The Directors also review detailed performance information provided by the Advisor during the management agreement renewal process. If performance concerns are identified, the Fund receives special reviews until performance improves, during which the Board receives a report from the Advisor regarding the reasons for such results (e.g., market conditions, security selection) and any efforts being undertaken to improve performance. The Fund’s performance was above its benchmark for the one-, three-, five-, and ten-year periods reviewed by the Board. The Board found the investment management services provided by the Advisor to the Fund to be satisfactory and consistent with the management agreement.
32
Shareholder and Other Services. Under the management agreement, the Advisor provides the Fund with a comprehensive package of transfer agency, shareholder, and other services. The Board, directly and through various committees of the Board, regularly reviews reports and evaluations of such services at its regular meetings. These reports include, but are not limited to, information regarding the operational efficiency and accuracy of the shareholder and transfer agency services provided, staffing levels, shareholder satisfaction (as measured by external as well as internal sources), technology support, new products and services offered to Fund shareholders, securities trading activities, portfolio valuation services, auditing services, and legal and operational compliance activities. The Board found the services provided by the Advisor to the Fund under the management agreement to be competitive and of high quality.
Costs of Services and Profitability. The Advisor provides detailed information concerning its cost of providing various services to the Fund, its profitability in managing the Fund (pre- and post-distribution), its overall profitability, and its financial condition. The Directors have reviewed with the Advisor the methodology used to prepare this financial information. This information is considered in evaluating the Advisor’s financial condition, its ability to continue to provide services under the management agreement, and the reasonableness of the current management fee. The Board concluded that the Advisor’s profits were reasonable in light of the services provided to the Fund.
Ethics. The Board generally considers the Advisor’s commitment to providing quality services to shareholders and to conducting its business ethically. They noted that the Advisor’s practices generally meet or exceed industry best practices.
Economies of Scale. The Board also reviewed information provided by the Advisor regarding the possible existence of economies of scale in connection with the management of the Fund. The Board concluded that economies of scale are difficult to measure and predict with precision, especially on a fund-by-fund basis. The Board concluded that the Advisor is appropriately sharing economies of scale through its competitive fee structure, offering competitive fees from fund inception, and through reinvestment in its business to provide shareholders additional content and services. The Board also noted that economies of scale are shared with the Fund and its shareholders through management fee breakpoints that serve to reduce the effective management fee as the assets of the Fund grow.
Comparison to Other Funds’ Fees. The management agreement provides that the Fund pays the Advisor a single, all-inclusive (or unified) management fee for providing all services necessary for the management and operation of the Fund, other than brokerage expenses, expenses attributable to short sales, taxes, interest, extraordinary expenses, and the fees and expenses of the Fund’s independent Directors (including their independent legal counsel) and expenses incurred in connection with the provision of shareholder services and distribution services under a plan adopted pursuant to Rule 12b-1 under the 1940 Act. Under the unified fee structure, the Advisor is responsible for providing all investment advisory, custody, audit, administrative, compliance, recordkeeping, marketing and shareholder services, or arranging and supervising third parties to provide such services. By contrast, most other funds are charged a variety of fees, including an investment advisory fee, a transfer agency fee, an administrative fee, distribution charges, and other expenses. Other than their investment advisory fees and any applicable Rule 12b-1 distribution fees, all other components of the total fees charged by these other funds may be increased without shareholder approval. The Board believes the unified fee structure is a benefit to Fund shareholders because it clearly discloses to shareholders the cost of owning Fund shares, and, since the unified fee cannot be increased without a vote of Fund shareholders, it shifts to the Advisor the risk of increased costs of operating the Fund and provides a direct incentive to minimize administrative inefficiencies. Part of the Board’s analysis of fee levels involves reviewing certain evaluative data compiled by an independent provider comparing the Fund’s unified fee to the total expense ratios of its peers. The unified fee charged to shareholders of the Fund was below the median of the total expense ratios of the Fund’s peer expense universe. The Board concluded that the management fee paid by the Fund to the Advisor under the management agreement is reasonable in light of the services provided to the Fund.
33
Comparison to Fees and Services Provided to Other Clients of the Advisor. The Directors also requested and received information from the Advisor concerning the nature of the services, fees, costs, and profitability of its advisory services to advisory clients other than the Fund. They observed that these varying types of client accounts require different services and involve different regulatory and entrepreneurial risks than the management of the Fund. The Board analyzed this information and concluded that the fees charged and services provided to the Fund were reasonable by comparison.
Payments to Intermediaries. The Directors also requested and received a description of payments made to intermediaries by the Fund and the Advisor and services provided in response thereto. These payments include various payments made by the Fund or the Advisor to different types of intermediaries and recordkeepers for distribution and service activities provided for the Fund. The Board reviewed such information and received representations from the Advisor that all such payments by the Fund were made pursuant to the Fund's Rule 12b-1 Plan and that all such payments by the Advisor were made from the Advisor’s resources and reasonable profits. The Board found the payments to be reasonable in scope and purpose.
Collateral or “Fall-Out” Benefits Derived by the Advisor. The Board considered the existence of collateral benefits the Advisor may receive as a result of its relationship with the Fund. They concluded that the Advisor’s primary business is managing mutual funds and it generally does not use fund or shareholder information to generate profits in other lines of business, and therefore does not derive any significant collateral benefits from them. The Board noted that additional assets from other clients may offer the Advisor some benefit from increased leverage with service providers and counterparties. Additionally, the Advisor may receive proprietary research from broker-dealers that execute fund portfolio transactions, which the Board concluded is likely to benefit other clients of the Advisor, as well as Fund shareholders. The Board also determined that the Advisor is able to provide investment management services to certain clients other than the Fund, at least in part, due to its existing infrastructure built to serve the fund complex. The Board concluded that appropriate allocation methodologies had been employed to assign resources and the cost of those resources to these other clients and, where expressly provided, these other client assets may be included with the assets of the Fund to determine breakpoints in the management fee schedule.
Existing Relationship. The Board also considered whether there was any reason for not continuing the existing arrangement with the Advisor. In this regard, the Board was mindful of the potential disruptions of the Fund’s operations and various risks, uncertainties, and other effects that could occur as a result of a decision not to continue such relationship. In particular, the Board recognized that most shareholders have invested in the Fund on the strength of the Advisor’s industry standing and reputation and in the expectation that the Advisor will have a continuing role in providing advisory services to the Fund.
Conclusion of the Directors. As a result of this process, the Board, including all of the independent Directors, taking into account all of the factors discussed above and the information provided by the Advisor and others in connection with its review and throughout the year, determined that the management fee is fair and reasonable in light of the services provided and that the investment management agreement between the Fund and the Advisor should be renewed.
34
| Additional Information |
Retirement Account Information
As required by law, distributions you receive from certain retirement accounts are subject to federal income tax withholding, unless you elect not to have withholding apply*. Tax will be withheld on the total amount withdrawn even though you may be receiving amounts that are not subject to withholding, such as nondeductible contributions. In such case, excess amounts of withholding could occur. You may adjust your withholding election so that a greater or lesser amount will be withheld.
If you don’t want us to withhold on this amount, you must notify us to not withhold the federal income tax. You may notify us in writing or in certain situations by telephone or through other electronic means. For systematic withdrawals, your withholding election will remain in effect until revoked or changed by filing a new election. You have the right to revoke your election at any time and change your withholding percentage for future distributions.
Remember, even if you elect not to have income tax withheld, you are liable for paying income tax on the taxable portion of your withdrawal. If you elect not to have income tax withheld or you don’t have enough income tax withheld, you may be responsible for payment of estimated tax. You may incur penalties under the estimated tax rules if your withholding and estimated tax payments are not sufficient. You can reduce or defer the income tax on a distribution by directly or indirectly rolling such distribution over to another IRA or eligible plan. You should consult your tax advisor for additional information.
State tax will be withheld if, at the time of your distribution, your address is within one of the mandatory withholding states and you have federal income tax withheld (or as otherwise required by state law). State taxes will be withheld from your distribution in accordance with the respective state rules.
*Some 403(b), 457 and qualified retirement plan distributions may be subject to 20% mandatory withholding, as they are subject to special tax and withholding rules. Your plan administrator or plan sponsor is required to provide you with a special tax notice explaining those rules at the time you request a distribution. If applicable, federal and/or state taxes may be withheld from your distribution amount.
Proxy Voting Policies
A description of the policies that the fund's investment advisor uses in exercising the voting rights associated with the securities purchased and/or held by the fund is available without charge, upon request, by calling 1-800-345-2021. It is also available on the "About Us" page of American Century Investments’ website at americancentury.com and on the Securities and Exchange Commission’s website at sec.gov. Information regarding how the investment advisor voted proxies relating to portfolio securities during the most recent 12-month period ended June 30 is available on the "About Us" page at americancentury.com. It is also available at sec.gov.
Quarterly Portfolio Disclosure
The fund files its complete schedule of portfolio holdings with the Securities and Exchange Commission (SEC) for the first and third quarters of each fiscal year on Form N-Q. The fund’s Forms N-Q are available on the SEC’s website at sec.gov. The fund also makes its complete schedule of portfolio holdings for the most recent quarter of its fiscal year available on its website at americancentury.com and, upon request, by calling 1-800-345-2021.
35
Other Tax Information
The following information is provided pursuant to provisions of the Internal Revenue Code.
The fund hereby designates up to the maximum amount allowable as qualified dividend income for the fiscal year ended November 30, 2018.
For corporate taxpayers, the fund hereby designates $2,810,796, or up to the maximum amount allowable, of ordinary income distributions paid during the fiscal year ended November 30, 2018 as qualified for the corporate dividends received deduction.
The fund hereby designates $53,608,978, or up to the maximum amount allowable, as long-term capital gain distributions (20% rate gain distributions) for the fiscal year ended November 30, 2018.
The fund hereby designates $5,283,541 as qualified short-term capital gain distributions for purposes of Internal Revenue Code Section 871 for the fiscal year ended November 30, 2018.
36
| ||
| Contact Us | americancentury.com | |
| Automated Information Line | 1-800-345-8765 | |
| Investor Services Representative | 1-800-345-2021 or 816-531-5575 | |
| Investors Using Advisors | 1-800-378-9878 | |
| Business, Not-For-Profit, Employer-Sponsored Retirement Plans | 1-800-345-3533 | |
| Banks and Trust Companies, Broker-Dealers, Financial Professionals, Insurance Companies | 1-800-345-6488 | |
| Telecommunications Relay Service for the Deaf | 711 | |
| American Century World Mutual Funds, Inc. | ||
Investment Advisor: American Century Investment Management, Inc. Kansas City, Missouri | ||
| This report and the statements it contains are submitted for the general information of our shareholders. The report is not authorized for distribution to prospective investors unless preceded or accompanied by an effective prospectus. | ||
| ©2019 American Century Proprietary Holdings, Inc. All rights reserved. CL-ANN-91028 1901 | ||
| Annual Report | |
| November 30, 2018 | |
| Global Small Cap Fund | |
| Investor Class (AGCVX) | |
| I Class (AGCSX) | |
| A Class (AGCLX) | |
| C Class (AGCHX) | |
| R Class (AGCWX) | |
| R6 Class (AGCTX) | |
Beginning on January 1, 2021, as permitted by regulations adopted by the Securities and Exchange Commission, paper copies of the fund’s shareholder reports like this one will no longer be sent by mail, unless you specifically request paper copies of the reports from the fund or from your financial intermediary, such as a broker-dealer or bank. Instead, the reports will be made available on a website, and you will be notified by mail each time a report is posted and provided with a website link to access the report.
If you already elected to receive shareholder reports electronically, you will not be affected by this change and you need not take any action. You may elect to receive shareholder reports and other communications from the fund or your financial intermediary electronically by calling or sending an email request to your appropriate contacts as listed on the back cover of this report.
You may elect to receive all future reports in paper free of charge. You can inform the fund or your financial intermediary that you wish to continue receiving paper copies of your shareholder reports by calling or sending an email request to your appropriate contacts as listed on the back cover of this report. Your election to receive reports in paper will apply to all funds held with the fund complex/your financial intermediary.
| Table of Contents |
| President’s Letter | |
| Performance | |
| Portfolio Commentary | |
| Fund Characteristics | |
| Shareholder Fee Example | |
| Schedule of Investments | |
| Statement of Assets and Liabilities | |
| Statement of Operations | |
| Statement of Changes in Net Assets | |
| Notes to Financial Statements | |
| Financial Highlights | |
| Report of Independent Registered Public Accounting Firm | |
| Management | |
| Approval of Management Agreement | |
| Additional Information | |
Any opinions expressed in this report reflect those of the author as of the date of the report, and do not necessarily represent the opinions of American Century Investments® or any other person in the American Century Investments organization. Any such opinions are subject to change at any time based upon market or other conditions and American Century Investments disclaims any responsibility to update such opinions. These opinions may not be relied upon as investment advice and, because investment decisions made by American Century Investments funds are based on numerous factors, may not be relied upon as an indication of trading intent on behalf of any American Century Investments fund. Security examples are used for representational purposes only and are not intended as recommendations to purchase or sell securities. Performance information for comparative indices and securities is provided to American Century Investments by third party vendors. To the best of American Century Investments’ knowledge, such information is accurate at the time of printing.
| President’s Letter |
Jonathan ThomasDear Investor:
Thank you for reviewing this annual report for the 12 months ended November 30, 2018. Annual reports help convey important information about fund returns, including market factors that affected performance during the reporting period. For additional investment and market insights, please visit our website, americancentury.com.
Global Growth Divergence Drives Disparity in Stock Returns
The synchronization of global economic growth, which helped deliver robust gains for global stocks in 2017, unraveled as the 12-month period unfolded. The U.S. economy continued to expand at a healthy pace, but other regions experienced notable slowdowns. Similarly, stocks advanced in the U.S. but generally declined elsewhere.
In Europe, the threat of global tariffs from the U.S. dampened business sentiment and corporate earnings growth. In addition, uncertainties surrounding Brexit negotiations, Italy’s fiscal woes, and civil unrest in France weighed on economic and earnings growth outlooks and stock performance. Meanwhile, Japan’s economy contracted late in the period, largely due to the effects of several natural disasters, which curtailed personal and business spending. Global trade tensions also pressured Japan’s growth outlook.
After starting strong, emerging markets stocks quickly reversed course. The key culprits included rising U.S. interest rates, U.S.-China tariffs, and global trade-policy uncertainty. In addition, a strong U.S. dollar, falling oil prices, and several country-specific events weighed on the asset class. Late in the period, prospects for a tariff truce between the U.S. and China, along with dovish comments from the Federal Reserve, sparked a November rally among emerging markets stocks.
Overall, U.S. stocks, as measured by the S&P 500 Index, returned 6.27% for the 12 months. Non-U.S. developed markets stocks, as measured by the MSCI EAFE Index, declined 7.94%. Emerging markets stocks, as measured by the MSCI Emerging Markets Index, fell 9.09%.
Looking ahead, investors face a backdrop of uneven global growth, heightened market volatility, and lingering geopolitical uncertainties. But it’s often these challenging markets that produce the most compelling investment opportunities. We believe this scenario underscores the importance of using professionally managed portfolios in pursuit of investment goals. We appreciate your continued trust and confidence in us.
Sincerely,
Jonathan Thomas
President and Chief Executive Officer
American Century Investments
2
| Performance |
| Total Returns as of November 30, 2018 | ||||
Average Annual Returns | ||||
Ticker Symbol | 1 year | Since Inception | Inception Date | |
| Investor Class | AGCVX | -2.73% | 14.60% | 3/29/16 |
| MSCI ACWI Small Cap Index | — | -4.77% | 10.26% | — |
| I Class | AGCSX | -2.50% | 14.84% | 3/29/16 |
| A Class | AGCLX | 3/29/16 | ||
| No sales charge | -2.95% | 14.33% | ||
| With sales charge | -8.54% | 11.82% | ||
| C Class | AGCHX | -3.71% | 13.47% | 3/29/16 |
| R Class | AGCWX | -3.18% | 14.05% | 3/29/16 |
| R6 Class | AGCTX | -2.36% | 15.02% | 3/29/16 |
Sales charges include initial sales charges and contingent deferred sales charges (CDSCs), as applicable. A Class shares have a 5.75% maximum initial sales charge and may be subject to a maximum CDSC of 1.00%. C Class shares redeemed within 12 months of purchase are subject to a maximum CDSC of 1.00%. The SEC requires that mutual funds provide performance information net of maximum sales charges in all cases where charges could be applied.
Data presented reflect past performance. Past performance is no guarantee of future results. Current performance may be higher or lower than the performance shown. Total returns for periods less than one year are not annualized. Investment return and principal value will fluctuate, and redemption value may be more or less than original cost. Data assumes reinvestment of dividends and capital gains, and none of the charts reflect the deduction of taxes that a shareholder would pay on fund distributions or the redemption of fund shares. To obtain performance data current to the most recent month end, please call 1-800-345-2021 or visit americancentury.com. For additional information about the fund, please consult the prospectus.
3
| Growth of $10,000 Over Life of Class |
| $10,000 investment made March 29, 2016 |
| Performance for other share classes will vary due to differences in fee structure. |
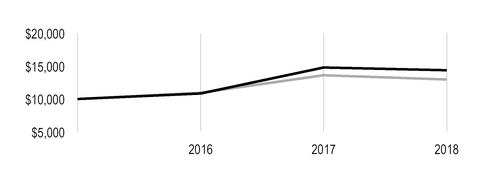
| Value on November 30, 2018 | |
| Investor Class — $14,397 | |
| MSCI ACWI Small Cap Index — $12,985 | |
Total Annual Fund Operating Expenses | |||||
Investor Class | I Class | A Class | C Class | R Class | R6 Class |
| 1.51% | 1.31% | 1.76% | 2.51% | 2.01% | 1.16% |
The total annual fund operating expenses shown is as stated in the fund’s prospectus current as of the date of this report. The prospectus may vary from the expense ratio shown elsewhere in this report because it is based on a different time period, includes acquired fund fees and expenses, and, if applicable, does not include fee waivers or expense reimbursements.
Data presented reflect past performance. Past performance is no guarantee of future results. Current performance may be higher or lower than the performance shown. Total returns for periods less than one year are not annualized. Investment return and principal value will fluctuate, and redemption value may be more or less than original cost. Data assumes reinvestment of dividends and capital gains, and none of the charts reflect the deduction of taxes that a shareholder would pay on fund distributions or the redemption of fund shares. To obtain performance data current to the most recent month end, please call 1-800-345-2021 or visit americancentury.com. For additional information about the fund, please consult the prospectus.
4
| Portfolio Commentary |
Portfolio Managers: Trevor Gurwich and Federico Laffan
Performance Summary
Global Small Cap returned -2.73%* for the 12-month period ended November 30, 2018, outperforming its benchmark. The portfolio’s benchmark, the MSCI ACWI Small Cap Index, returned -4.77% for the same period.
Concerns about slowing global economic growth and trade policy uncertainties created headwinds for stocks, especially outside the U.S. Small-cap global stocks underperformed their large-cap counterparts amid heightened global uncertainty. In this volatile environment, our focus on companies demonstrating accelerating and sustainable earnings growth supported the portfolio’s relative outperformance. Stock selection was especially favorable in the consumer discretionary, health care, and information technology sectors. An overweight compared with the benchmark in the defensive health care sector also aided relative performance. Stock selection in the industrials and financials sectors detracted. An underweight and stock selection in the real estate sector also dampened results. Regionally, stock selection in the U.S. lifted relative performance, while stock selection and an underweight in Japan detracted.
Contributors Included Chinese E-commerce Company and Health Care Technology Provider
Baozun, a leading provider of e-commerce services in China, was a key contributor in the consumer discretionary sector. The stock surged higher in the first half of 2018, boosted by the company’s strong earnings performance, expanding revenues, and strong pipeline of new brands.
Teladoc Health, a notable contributor in health care, provides on-demand remote health care consultation through phone calls and videoconferencing. It reported robust financial performance, aided in part by higher fee-based subscriptions and its integration of Advance Medical, a recent acquisition. The company also continues to add new customers and increase patient utilization.
Payments solutions provider Bottomline Technologies was a top contributor in information technology. It reported better-than-expected results, mainly because of increased subscription and transaction revenues. In our view, the company is also benefiting from the secular trend toward digital business-to-business payments. Elsewhere in the portfolio, TCI Company, a global supplier of nutritional supplements, capsules, and beauty products, was a standout performer. The company reported robust revenue growth and improving profit margins supported by its strong and growing position in China.
Several Industrials Holdings Weakened Relative Performance
The industrials sector underperformed the broader market as growth rates decelerated. Outsourcing, a notable detractor, provides outsourcing services for global manufacturing companies. The stock price declined on concerns that a new stock issue to finance acquisitions
might dilute the value of outstanding shares. The company announced plans to raise capital but
provided no details about potential acquisition targets. Finetex EnE, another leading detractor, manufactures nanofibers used in specialized filters, technical textiles, and other applications.
Despite healthy fundamentals, including rapid sales growth and long-term contracts, the stock fell
*All fund returns referenced in this commentary are for Investor Class shares. Performance for other share classes will vary due to differences in fee structure; when Investor Class performance exceeds that of the fund's benchmark, other share classes may not. See page 3 for returns for all share classes.
5
due to uncertainty surrounding an audit and related corporate governance issues. We sold
Outsourcing and Finetex EnE to pursue investments with more attractive risk/reward profiles.
Consumer finance company Curo Group Holdings was a prominent detractor in the financial services sector. The stock fell after the consumer finance company released a disappointing earnings report, reduced its guidance, and warned of credit issues. We liquidated our investment.
My EG Services, a laggard in the information technology sector, provides electronic government services in Malaysia. Political uncertainty weighed on the stock price in the second calendar quarter of 2018. The company’s large exposure to the Malaysian government and perceived connection to Malaysia’s out-of-favor Barisan Nasional party, which lost power, concerned investors. We sold the position.
Outlook
We will continue to focus on global small-cap companies we believe demonstrate improving, sustainable earnings growth. Stock selection continues to drive our industry weightings. We significantly increased our health care exposure, as we uncovered attractive earnings growth potential among companies with expanding sales in the U.S. and elsewhere. As a result, health care ended the period as the largest sector overweight relative to the benchmark. Although we reduced exposure to industrials, the sector remained among the portfolio’s largest positions on an absolute and relative basis. Real estate and materials were key underweights, as we found fewer companies in these sectors offering the earnings growth potential we favor. In addition, we also believe higher U.S. interest rates and expectations for higher global interest rates will continue to pressure property stocks.
From a regional standpoint, Europe remained the portfolio’s largest relative overweight, driven by bottom-up stock selection. We increased exposure to North America, primarily to the U.S., where the upbeat economic backdrop has supported corporate earnings growth. As a result, the portfolio ended the period with a slight overweight in the region. Conversely, we reduced exposure to emerging markets, which ended the period as an underweight position. We believe trade-war fears, higher U.S. interest rates, and adverse political and economic factors in specific countries may pressure earnings growth outlooks in emerging markets. We also moved to an underweight in Asia, where we have found fewer companies with accelerating earnings growth potential.
6
| Fund Characteristics |
| NOVEMBER 30, 2018 | |
Top Ten Holdings | % of net assets |
| Kinsale Capital Group, Inc. | 1.9% |
| Aveva Group plc | 1.6% |
| Mercury Systems, Inc. | 1.6% |
| WNS Holdings Ltd. ADR | 1.3% |
| ASR Nederland NV | 1.3% |
| Canada Goose Holdings, Inc. | 1.3% |
| FinecoBank Banca Fineco SpA | 1.3% |
| Chart Industries, Inc. | 1.2% |
| National Instruments Corp. | 1.2% |
| Saab AB* | 1.2% |
| *Includes all equity exposure held by the fund. | |
Types of Investments in Portfolio | % of net assets |
| Domestic Common Stocks | 52.0% |
| Foreign Common Stocks | 48.3% |
| Rights | 0.1% |
| Total Equity Exposure | 100.4% |
| Other Assets and Liabilities | (0.4)% |
Investments by Country | % of net assets |
| United States | 52.0% |
| United Kingdom | 9.5% |
| Japan | 7.9% |
| Canada | 4.4% |
| Australia | 3.6% |
| Switzerland | 3.5% |
| Sweden | 2.9% |
| Other Countries | 16.6% |
| Other Assets and Liabilities | (0.4)% |
7
| Shareholder Fee Example |
Fund shareholders may incur two types of costs: (1) transaction costs, including sales charges (loads) on purchase payments and redemption/exchange fees; and (2) ongoing costs, including management fees; distribution and service (12b-1) fees; and other fund expenses. This example is intended to help you understand your ongoing costs (in dollars) of investing in your fund and to compare these costs with the ongoing cost of investing in other mutual funds.
The example is based on an investment of $1,000 made at the beginning of the period and held for the entire period from June 1, 2018 to November 30, 2018.
Actual Expenses
The table provides information about actual account values and actual expenses for each class. You may use the information, together with the amount you invested, to estimate the expenses that you paid over the period. First, identify the share class you own. Then simply divide your account value by $1,000 (for example, an $8,600 account value divided by $1,000 = 8.6), then multiply the result by the number under the heading “Expenses Paid During Period” to estimate the expenses you paid on your account during this period.
If you hold Investor Class shares of any American Century Investments fund, or I Class shares of the American Century Diversified Bond Fund, in an American Century Investments account (i.e., not a financial intermediary or retirement plan account), American Century Investments may charge you a $12.50 semiannual account maintenance fee if the value of those shares is less than $10,000. We will redeem shares automatically in one of your accounts to pay the $12.50 fee. In determining your total eligible investment amount, we will include your investments in all personal accounts (including American Century Investments Brokerage accounts) registered under your Social Security number. Personal accounts include individual accounts, joint accounts, UGMA/UTMA accounts, personal trusts, Coverdell Education Savings Accounts and IRAs (including traditional, Roth, Rollover, SEP-, SARSEP- and SIMPLE-IRAs), and certain other retirement accounts. If you have only business, business retirement, employer-sponsored or American Century Investments Brokerage accounts, you are currently not subject to this fee. If you are subject to the Account Maintenance Fee, your account value could be reduced by the fee amount.
Hypothetical Example for Comparison Purposes
The table also provides information about hypothetical account values and hypothetical expenses based on the actual expense ratio of each class of your fund and an assumed rate of return of 5% per year before expenses, which is not the actual return of a fund’s share class. The hypothetical account values and expenses may not be used to estimate the actual ending account balance or expenses you paid for the period. You may use this information to compare the ongoing costs of investing in your fund and other funds. To do so, compare this 5% hypothetical example with the 5% hypothetical examples that appear in the shareholder reports of the other funds.
Please note that the expenses shown in the table are meant to highlight your ongoing costs only and do not reflect any transactional costs, such as sales charges (loads) or redemption/exchange fees. Therefore, the table is useful in comparing ongoing costs only, and will not help you determine the relative total costs of owning different funds. In addition, if these transactional costs were included, your costs would have been higher.
8
| Beginning Account Value 6/1/18 | Ending Account Value 11/30/18 | Expenses Paid During Period(1) 6/1/18 - 11/30/18 | Annualized Expense Ratio(1) | |
Actual | ||||
| Investor Class | $1,000 | $875.10 | $7.05 | 1.50% |
| I Class | $1,000 | $876.30 | $6.11 | 1.30% |
| A Class | $1,000 | $874.40 | $8.22 | 1.75% |
| C Class | $1,000 | $870.90 | $11.73 | 2.50% |
| R Class | $1,000 | $873.60 | $9.39 | 2.00% |
| R6 Class | $1,000 | $877.30 | $5.41 | 1.15% |
| Hypothetical | ||||
| Investor Class | $1,000 | $1,017.55 | $7.59 | 1.50% |
| I Class | $1,000 | $1,018.55 | $6.58 | 1.30% |
| A Class | $1,000 | $1,016.30 | $8.85 | 1.75% |
| C Class | $1,000 | $1,012.53 | $12.61 | 2.50% |
| R Class | $1,000 | $1,015.04 | $10.10 | 2.00% |
| R6 Class | $1,000 | $1,019.30 | $5.82 | 1.15% |
| (1) | Expenses are equal to the class's annualized expense ratio listed in the table above, multiplied by the average account value over the period, multiplied by 183, the number of days in the most recent fiscal half-year, divided by 365, to reflect the one-half year period. Annualized expense ratio reflects actual expenses, including any applicable fee waivers or expense reimbursements and excluding any acquired fund fees and expenses. |
9
| Schedule of Investments |
NOVEMBER 30, 2018
| Shares | Value | ||||
| COMMON STOCKS — 100.3% | |||||
| Australia — 3.6% | |||||
Afterpay Touch Group Ltd.(1) | 10,855 | $ | 115,490 | ||
| Cleanaway Waste Management Ltd. | 107,620 | 133,826 | |||
NEXTDC Ltd.(1) | 18,746 | 88,703 | |||
| Northern Star Resources Ltd. | 27,147 | 158,640 | |||
Saracen Mineral Holdings Ltd.(1) | 80,664 | 146,022 | |||
| Seven Group Holdings Ltd. | 7,876 | 91,665 | |||
| 734,346 | |||||
| Belgium — 0.8% | |||||
Galapagos NV(1) | 1,582 | 160,919 | |||
| Bermuda — 0.5% | |||||
| Bank of NT Butterfield & Son Ltd. (The) | 2,531 | 100,430 | |||
| Brazil — 1.2% | |||||
Azul SA ADR(1) | 7,965 | 214,975 | |||
Linx SA(1) | 3,800 | 27,515 | |||
| 242,490 | |||||
| Canada — 4.4% | |||||
| Altus Group Ltd. | 5,845 | 115,875 | |||
Canada Goose Holdings, Inc.(1) | 3,820 | 257,277 | |||
| Colliers International Group, Inc. | 1,761 | 115,973 | |||
| FirstService Corp. | 2,364 | 179,330 | |||
Largo Resources Ltd.(1) | 39,980 | 110,132 | |||
Parex Resources, Inc.(1) | 8,778 | 108,416 | |||
| 887,003 | |||||
| China — 1.7% | |||||
A-Living Services Co. Ltd., H Shares(1) | 81,250 | 107,102 | |||
Baozun, Inc. ADR(1) | 2,171 | 76,571 | |||
Li Ning Co. Ltd.(1) | 147,000 | 158,227 | |||
| 341,900 | |||||
| Denmark — 0.5% | |||||
| Royal Unibrew A/S | 1,548 | 112,124 | |||
| Finland — 0.5% | |||||
| Valmet Oyj | 4,823 | 103,836 | |||
| France — 1.8% | |||||
| Korian SA | 5,484 | 212,244 | |||
Solutions 30 SE(1) | 14,128 | 146,539 | |||
| 358,783 | |||||
| Germany — 0.2% | |||||
| Isra Vision AG | 1,316 | 51,195 | |||
| Hong Kong — 0.3% | |||||
| Melco International Development Ltd. | 34,000 | 68,579 | |||
10
| Shares | Value | ||||
| India — 1.3% | |||||
WNS Holdings Ltd. ADR(1) | 5,432 | $ | 265,299 | ||
| Italy — 1.6% | |||||
| FinecoBank Banca Fineco SpA | 23,745 | 254,750 | |||
| Moncler SpA | 1,899 | 62,091 | |||
| 316,841 | |||||
| Japan — 7.9% | |||||
| Activia Properties, Inc. | 13 | 54,652 | |||
| Adastria Co. Ltd. | 8,600 | 141,199 | |||
| Kyoritsu Maintenance Co. Ltd. | 1,100 | 55,235 | |||
| Nabtesco Corp. | 5,700 | 157,852 | |||
| Orix JREIT, Inc. | 93 | 151,320 | |||
| Pigeon Corp. | 2,200 | 90,688 | |||
| Rohto Pharmaceutical Co. Ltd. | 3,500 | 110,625 | |||
| Sawai Pharmaceutical Co. Ltd. | 3,600 | 190,353 | |||
| SHO-BOND Holdings Co. Ltd. | 2,400 | 183,941 | |||
| Systena Corp. | 14,800 | 190,484 | |||
| Tadano Ltd. | 8,700 | 104,433 | |||
| Trust Tech, Inc. | 6,400 | 183,962 | |||
| 1,614,744 | |||||
| Netherlands — 1.9% | |||||
| ASR Nederland NV | 6,087 | 263,441 | |||
InterXion Holding NV(1) | 1,883 | 117,255 | |||
| 380,696 | |||||
| Norway — 0.5% | |||||
| Aker BP ASA | 3,545 | 100,942 | |||
| South Korea — 1.2% | |||||
| Fila Korea Ltd. | 5,247 | 238,354 | |||
| Spain — 1.7% | |||||
| Applus Services SA | 10,135 | 121,847 | |||
| Cellnex Telecom SA | 3,916 | 108,809 | |||
| Ence Energia y Celulosa SA | 17,224 | 109,261 | |||
| 339,917 | |||||
| Sweden — 2.8% | |||||
| Elekta AB, B Shares | 19,069 | 230,452 | |||
| Fabege AB | 8,631 | 107,707 | |||
| Saab AB, B Shares | 5,658 | 226,851 | |||
| 565,010 | |||||
| Switzerland — 3.5% | |||||
| Georg Fischer AG | 154 | 119,855 | |||
Idorsia Ltd.(1) | 5,585 | 106,205 | |||
Medartis Holding AG(1) | 2,653 | 164,160 | |||
Siegfried Holding AG(1) | 474 | 169,189 | |||
| Tecan Group AG | 717 | 147,855 | |||
| 707,264 | |||||
| Taiwan — 0.9% | |||||
| TCI Co. Ltd. | 11,941 | 193,599 | |||
11
| Shares | Value | ||||
| United Kingdom — 9.5% | |||||
| Abcam plc | 11,522 | $ | 167,375 | ||
Avast plc(1) | 31,011 | 108,327 | |||
| Aveva Group plc | 10,121 | 330,827 | |||
| Beazley plc | 27,256 | 194,317 | |||
| Burford Capital Ltd. | 5,467 | 106,102 | |||
| Electrocomponents plc | 24,153 | 158,484 | |||
| Fevertree Drinks plc | 3,299 | 100,618 | |||
| Hikma Pharmaceuticals plc | 9,858 | 224,622 | |||
| HomeServe plc | 8,903 | 107,913 | |||
Nomad Foods Ltd.(1) | 5,028 | 101,666 | |||
| Rentokil Initial plc | 46,058 | 194,384 | |||
Seadrill Ltd.(1) | 2,652 | 36,147 | |||
| SSP Group plc | 12,315 | 98,316 | |||
| 1,929,098 | |||||
| United States — 52.0% | |||||
Advanced Disposal Services, Inc.(1) | 8,100 | 218,295 | |||
Aerie Pharmaceuticals, Inc.(1) | 1,122 | 44,757 | |||
Aerojet Rocketdyne Holdings, Inc.(1) | 5,015 | 176,578 | |||
Amedisys, Inc.(1) | 1,014 | 138,157 | |||
| American Eagle Outfitters, Inc. | 7,096 | 148,519 | |||
| Americold Realty Trust | 3,748 | 100,446 | |||
| Ares Management Corp., Class A | 6,931 | 155,532 | |||
Avalara, Inc.(1) | 4,733 | 151,409 | |||
Boot Barn Holdings, Inc.(1) | 5,209 | 117,932 | |||
Bottomline Technologies de, Inc.(1) | 2,086 | 114,876 | |||
| Brink's Co. (The) | 1,630 | 115,437 | |||
Burlington Stores, Inc.(1) | 820 | 135,923 | |||
| Callaway Golf Co. | 10,868 | 186,169 | |||
Callon Petroleum Co.(1) | 23,164 | 198,052 | |||
| CareTrust REIT, Inc. | 10,338 | 206,967 | |||
Cavco Industries, Inc.(1) | 1,013 | 166,699 | |||
Centennial Resource Development, Inc., Class A(1) | 7,967 | 123,648 | |||
Chart Industries, Inc.(1) | 3,970 | 252,333 | |||
Chegg, Inc.(1) | 6,280 | 175,526 | |||
| Churchill Downs, Inc. | 631 | 175,267 | |||
Clean Harbors, Inc.(1) | 2,830 | 182,620 | |||
Dycom Industries, Inc.(1) | 503 | 33,329 | |||
| EastGroup Properties, Inc. | 1,636 | 163,633 | |||
Etsy, Inc.(1) | 3,019 | 163,147 | |||
Fair Isaac Corp.(1) | 1,121 | 222,664 | |||
Five9, Inc.(1) | 3,229 | 138,459 | |||
| Glacier Bancorp, Inc. | 1,090 | 51,470 | |||
Goosehead Insurance, Inc., Class A(1) | 4,281 | 108,823 | |||
GrubHub, Inc.(1) | 1,274 | 99,741 | |||
Guardant Health, Inc.(1) | 3,275 | 117,016 | |||
| Hamilton Lane, Inc., Class A | 4,264 | 161,264 | |||
12
| Shares | Value | ||||
| Healthcare Services Group, Inc. | 3,400 | $ | 160,480 | ||
HealthEquity, Inc.(1) | 1,337 | 118,578 | |||
| HEICO Corp. | 2,376 | 200,819 | |||
Hudson Ltd., Class A(1) | 5,857 | 121,533 | |||
ICU Medical, Inc.(1) | 488 | 117,359 | |||
Inphi Corp.(1) | 3,427 | 136,703 | |||
Inspire Medical Systems, Inc.(1) | 2,938 | 134,972 | |||
Insulet Corp.(1) | 2,735 | 229,549 | |||
| Kemper Corp. | 3,255 | 247,705 | |||
| Kinsale Capital Group, Inc. | 6,273 | 390,243 | |||
Kratos Defense & Security Solutions, Inc.(1) | 13,936 | 185,349 | |||
Malibu Boats, Inc., Class A(1) | 2,479 | 120,033 | |||
Masimo Corp.(1) | 1,427 | 157,569 | |||
Mercury Systems, Inc.(1) | 6,260 | 324,331 | |||
| MGP Ingredients, Inc. | 3,006 | 204,378 | |||
MongoDB, Inc.(1) | 2,061 | 170,857 | |||
MRC Global, Inc.(1) | 6,672 | 104,951 | |||
| National Instruments Corp. | 5,088 | 249,108 | |||
NMI Holdings, Inc., Class A(1) | 5,677 | 110,929 | |||
Ollie's Bargain Outlet Holdings, Inc.(1) | 1,671 | 148,218 | |||
PetIQ, Inc.(1) | 5,718 | 178,402 | |||
PGT Innovations, Inc.(1) | 8,168 | 157,397 | |||
| Physicians Realty Trust | 8,838 | 157,405 | |||
PlayAGS, Inc.(1) | 4,286 | 96,221 | |||
Quantenna Communications, Inc.(1) | 6,616 | 99,108 | |||
R1 RCM, Inc.(1) | 23,027 | 210,927 | |||
RH(1) | 1,902 | 220,898 | |||
Seacoast Banking Corp. of Florida(1) | 4,086 | 118,494 | |||
Semtech Corp.(1) | 2,295 | 122,415 | |||
SI-BONE, Inc.(1) | 7,500 | 134,700 | |||
SVB Financial Group(1) | 619 | 157,727 | |||
Teladoc Health, Inc.(1) | 2,459 | 153,565 | |||
Trupanion, Inc.(1) | 6,292 | 188,320 | |||
Vocera Communications, Inc.(1) | 2,964 | 117,789 | |||
| World Wrestling Entertainment, Inc., Class A | 1,391 | 102,878 | |||
Zendesk, Inc.(1) | 2,935 | 174,427 | |||
| 10,569,025 | |||||
TOTAL COMMON STOCKS (Cost $18,978,932) | 20,382,394 | ||||
| RIGHTS — 0.1% | |||||
| Sweden — 0.1% | |||||
Saab AB(1) (Cost $—) | 5,658 | 22,238 | |||
TOTAL INVESTMENT SECURITIES — 100.4% (Cost $18,978,932) | 20,404,632 | ||||
| OTHER ASSETS AND LIABILITIES — (0.4)% | (84,825 | ) | |||
| TOTAL NET ASSETS — 100.0% | $ | 20,319,807 | |||
13
| MARKET SECTOR DIVERSIFICATION | ||
(as a % of net assets) | ||
| Industrials | 20.7 | % |
| Health Care | 18.5 | % |
| Consumer Discretionary | 16.0 | % |
| Information Technology | 15.4 | % |
| Financials | 12.8 | % |
| Real Estate | 6.7 | % |
| Consumer Staples | 3.9 | % |
| Energy | 2.8 | % |
| Materials | 2.6 | % |
| Communication Services | 1.0 | % |
| Other Assets and Liabilities | (0.4 | )% |
| NOTES TO SCHEDULE OF INVESTMENTS | ||
| ADR | - | American Depositary Receipt |
| (1) | Non-income producing. |
See Notes to Financial Statements.
14
| Statement of Assets and Liabilities |
| NOVEMBER 30, 2018 | |||
| Assets | |||
| Investment securities, at value (cost of $18,978,932) | $ | 20,404,632 | |
| Foreign currency holdings, at value (cost of $1,310) | 1,306 | ||
| Receivable for investments sold | 97,940 | ||
| Receivable for capital shares sold | 3,565 | ||
| Dividends and interest receivable | 12,995 | ||
| Other assets | 1,662 | ||
| 20,522,100 | |||
| Liabilities | |||
| Disbursements in excess of demand deposit cash | 12,030 | ||
| Payable for investments purchased | 59,643 | ||
| Payable for capital shares redeemed | 103,294 | ||
| Accrued management fees | 25,657 | ||
| Distribution and service fees payable | 1,669 | ||
| 202,293 | |||
| Net Assets | $ | 20,319,807 | |
| Net Assets Consist of: | |||
| Capital (par value and paid-in surplus) | $ | 19,184,853 | |
| Distributable earnings | 1,134,954 | ||
| $ | 20,319,807 | ||
| Net Assets | Shares Outstanding | Net Asset Value Per Share | ||||
| Investor Class, $0.01 Par Value | $15,158,749 | 1,109,700 | $13.66 | |||
| I Class, $0.01 Par Value | $1,424,340 | 103,679 | $13.74 | |||
| A Class, $0.01 Par Value | $1,476,773 | 108,848 | $13.57* | |||
| C Class, $0.01 Par Value | $1,406,749 | 105,863 | $13.29 | |||
| R Class, $0.01 Par Value | $492,652 | 36,560 | $13.48 | |||
| R6 Class, $0.01 Par Value | $360,544 | 26,136 | $13.79 | |||
*Maximum offering price $14.40 (net asset value divided by 0.9425).
See Notes to Financial Statements.
15
| Statement of Operations |
| YEAR ENDED NOVEMBER 30, 2018 | |||
| Investment Income (Loss) | |||
| Income: | |||
| Dividends (net of foreign taxes withheld of $11,946) | $ | 128,577 | |
| Interest | 3,587 | ||
| 132,164 | |||
| Expenses: | |||
| Management fees | 307,097 | ||
| Distribution and service fees: | |||
| A Class | 4,299 | ||
| C Class | 15,625 | ||
| R Class | 2,207 | ||
| Directors' fees and expenses | 569 | ||
| Other expenses | 69 | ||
| 329,866 | |||
| Net investment income (loss) | (197,702 | ) | |
| Realized and Unrealized Gain (Loss) | |||
| Net realized gain (loss) on: | |||
| Investment transactions (net of foreign tax expenses paid (refunded) of $5,705) | 43,440 | ||
| Foreign currency translation transactions | (8,765 | ) | |
| 34,675 | |||
| Change in net unrealized appreciation (depreciation) on: | |||
| Investments (includes (increase) decrease in accrued foreign taxes of $15,295) | (1,198,472 | ) | |
| Translation of assets and liabilities in foreign currencies | (712 | ) | |
| (1,199,184 | ) | ||
| Net realized and unrealized gain (loss) | (1,164,509 | ) | |
| Net Increase (Decrease) in Net Assets Resulting from Operations | $ | (1,362,211 | ) |
See Notes to Financial Statements.
16
| Statement of Changes in Net Assets |
| YEARS ENDED NOVEMBER 30, 2018 AND NOVEMBER 30, 2017 | ||||||
| Increase (Decrease) in Net Assets | November 30, 2018 | November 30, 2017 | ||||
| Operations | ||||||
| Net investment income (loss) | $ | (197,702 | ) | $ | (54,862 | ) |
| Net realized gain (loss) | 34,675 | 943,716 | ||||
| Change in net unrealized appreciation (depreciation) | (1,199,184 | ) | 2,036,762 | |||
| Net increase (decrease) in net assets resulting from operations | (1,362,211 | ) | 2,925,616 | |||
| Distributions to Shareholders | ||||||
| From earnings: | ||||||
| Investor Class | (529,903 | ) | — | |||
| I Class | (47,681 | ) | — | |||
| A Class | (81,489 | ) | — | |||
| C Class | (77,608 | ) | — | |||
| R Class | (17,910 | ) | — | |||
| R6 Class | (18,878 | ) | — | |||
| Decrease in net assets from distributions | (773,469 | ) | — | |||
| Capital Share Transactions | ||||||
| Net increase (decrease) in net assets from capital share transactions (Note 5) | 7,815,917 | 6,108,864 | ||||
| Net increase (decrease) in net assets | 5,680,237 | 9,034,480 | ||||
| Net Assets | ||||||
| Beginning of period | 14,639,570 | 5,605,090 | ||||
| End of period | $ | 20,319,807 | $ | 14,639,570 | ||
See Notes to Financial Statements.
17
| Notes to Financial Statements |
NOVEMBER 30, 2018
1. Organization
American Century World Mutual Funds, Inc. (the corporation) is registered under the Investment Company Act of 1940, as amended (the 1940 Act), as an open-end management investment company and is organized as a Maryland corporation. Global Small Cap Fund (the fund) is one fund in a series issued by the corporation. The fund’s investment objective is to seek capital growth.
The fund offers the Investor Class, I Class, A Class, C Class, R Class and R6 Class. The A Class may incur an initial sales charge. The A Class and C Class may be subject to a contingent deferred sales charge.
2. Significant Accounting Policies
The following is a summary of significant accounting policies consistently followed by the fund in preparation of its financial statements. The fund is an investment company and follows accounting and reporting guidance in accordance with accounting principles generally accepted in the United States of America. This may require management to make certain estimates and assumptions at the date of the financial statements. Actual results could differ from these estimates. Management evaluated the impact of events or transactions occurring through the date the financial statements were issued that would merit recognition or disclosure.
Investment Valuations — The fund determines the fair value of its investments and computes its net asset value per share at the close of regular trading (usually 4 p.m. Eastern time) on the New York Stock Exchange (NYSE) on each day the NYSE is open. The Board of Directors has adopted valuation policies and procedures to guide the investment advisor in the fund’s investment valuation process and to provide methodologies for the oversight of the fund’s pricing function.
Equity securities that are listed or traded on a domestic securities exchange are valued at the last reported sales price or at the official closing price as provided by the exchange. Equity securities traded on foreign securities exchanges are generally valued at the closing price of such securities on the exchange where primarily traded or at the close of the NYSE, if that is earlier. If no last sales price is reported, or if local convention or regulation so provides, the mean of the latest bid and asked prices may be used. Securities traded over-the-counter are valued at the mean of the latest bid and asked prices, the last sales price, or the official closing price. Equity securities initially expressed in local currencies are translated into U.S. dollars at the mean of the appropriate currency exchange rate at the close of the NYSE as provided by an independent pricing service.
Open-end management investment companies are valued at the reported net asset value per share. Repurchase agreements are valued at cost, which approximates fair value.
If the fund determines that the market price for an investment is not readily available or the valuation methods mentioned above do not reflect an investment’s fair value, such investment is valued as determined in good faith by the Board of Directors or its delegate, in accordance with policies and procedures adopted by the Board of Directors. In its determination of fair value, the fund may review several factors including, but not limited to, market information regarding the specific investment or comparable investments and correlation with other investment types, futures indices or general market indicators. Circumstances that may cause the fund to use these procedures to value an investment include, but are not limited to: an investment has been declared in default or is distressed; trading in a security has been suspended during the trading day or a security is not actively trading on its principal exchange; prices received from a regular pricing source are deemed unreliable; or there is a foreign market holiday and no trading occurred.
18
The fund monitors for significant events occurring after the close of an investment’s primary exchange but before the fund’s net asset value per share is determined. Significant events may include, but are not limited to: corporate announcements and transactions; governmental action and political unrest that could impact a specific investment or an investment sector; or armed conflicts, natural disasters and similar events that could affect investments in a specific country or region. The fund also monitors for significant fluctuations between domestic and foreign markets, as evidenced by the U.S. market or such other indicators that the Board of Directors, or its delegate, deems appropriate. If significant fluctuations in foreign markets are identified, the fund may apply a model-derived factor to the closing price of equity securities traded on foreign securities exchanges. The factor is based on observable market data as provided by an independent pricing service.
Security Transactions — Security transactions are accounted for as of the trade date. Net realized gains and losses are determined on the identified cost basis, which is also used for federal income tax purposes. Certain countries impose taxes on realized gains on the sale of securities registered in their country. The fund records the foreign tax expense, if any, on an accrual basis. The foreign tax expense on realized gains and unrealized appreciation reduces the net realized gain (loss) on investment transactions and net unrealized appreciation (depreciation) on investments, respectively.
Investment Income — Dividend income less foreign taxes withheld, if any, is recorded as of the ex-dividend date. Distributions received on securities that represent a return of capital or long-term capital gain are recorded as a reduction of cost of investments and/or as a realized gain. The fund may estimate the components of distributions received that may be considered nontaxable distributions or long-term capital gain distributions for income tax purposes. Interest income is recorded on the accrual basis and includes accretion of discounts and amortization of premiums.
Foreign Currency Translations — All assets and liabilities initially expressed in foreign currencies are translated into U.S. dollars at prevailing exchange rates at period end. The fund may enter into spot foreign currency exchange contracts to facilitate transactions denominated in a foreign currency. Purchases and sales of investment securities, dividend and interest income, spot foreign currency exchange contracts, and expenses are translated at the rates of exchange prevailing on the respective dates of such transactions. Net realized and unrealized foreign currency exchange gains or losses related to investment securities are a component of net realized gain (loss) on investment transactions and change in net unrealized appreciation (depreciation) on investments, respectively.
Repurchase Agreements — The fund may enter into repurchase agreements with institutions that American Century Investment Management, Inc. (ACIM) (the investment advisor) has determined are creditworthy pursuant to criteria adopted by the Board of Directors. The fund requires that the collateral, represented by securities, received in a repurchase transaction be transferred to the custodian in a manner sufficient to enable the fund to obtain those securities in the event of a default under the repurchase agreement. ACIM monitors, on a daily basis, the securities transferred to ensure the value, including accrued interest, of the securities under each repurchase agreement is equal to or greater than amounts owed to the fund under each repurchase agreement.
Joint Trading Account — Pursuant to an Exemptive Order issued by the Securities and Exchange Commission, the fund, along with certain other funds in the American Century Investments family of funds, may transfer uninvested cash balances into a joint trading account. These balances are invested in one or more repurchase agreements that are collateralized by U.S. Treasury or Agency obligations.
Income Tax Status — It is the fund’s policy to distribute substantially all net investment income and net realized gains to shareholders and to otherwise qualify as a regulated investment company under provisions of the Internal Revenue Code. Accordingly, no provision has been made for income taxes. The fund files U.S. federal, state, local and non-U.S. tax returns as applicable. The fund's tax returns are subject to examination by the relevant taxing authority until expiration of the applicable statute of limitations, which is generally three years from the date of filing but can be longer in certain jurisdictions. At this time, management believes there are no uncertain tax positions which, based on their technical merit, would not be sustained upon examination and for which it is reasonably possible that the total amounts of unrecognized tax benefits will significantly change in the next twelve months.
Multiple Class — All shares of the fund represent an equal pro rata interest in the net assets of the class to which such shares belong, and have identical voting, dividend, liquidation and other rights and the same terms and conditions, except for class specific expenses and exclusive rights to vote on matters affecting only individual classes. Income, non-class specific expenses, and realized and unrealized capital gains and losses of the fund are allocated to each class of shares based on their relative net assets.
19
Distributions to Shareholders — Distributions from net investment income and net realized gains, if any, are generally declared and paid annually. The fund may make distributions on a more frequent basis to comply with the distribution requirements of the Internal Revenue Code, in all events in a manner consistent with provisions of the 1940 Act. The fund may elect to treat a portion of its payment to a redeeming shareholder, which represents the pro rata share of undistributed net investment income and net realized gains, as a distribution for federal income tax purposes (tax equalization).
Indemnifications — Under the corporation’s organizational documents, its officers and directors are indemnified against certain liabilities arising out of the performance of their duties to the fund. In addition, in the normal course of business, the fund enters into contracts that provide general indemnifications. The maximum exposure under these arrangements is unknown as this would involve future claims that may be made against a fund. The risk of material loss from such claims is considered by management to be remote.
3. Fees and Transactions with Related Parties
Certain officers and directors of the corporation are also officers and/or directors of American Century Companies, Inc. (ACC). The corporation’s investment advisor, ACIM, the corporation's distributor, American Century Investment Services, Inc. (ACIS), and the corporation’s transfer agent, American Century Services, LLC, are wholly owned, directly or indirectly, by ACC. ACIM owns 35% of the shares of the fund. Related parties do not invest in the fund for the purpose of exercising management or control.
Management Fees — The corporation has entered into a management agreement with ACIM, under which ACIM provides the fund with investment advisory and management services in exchange for a single, unified management fee (the fee) per class. The agreement provides that all expenses of managing and operating the fund, except distribution and service fees, brokerage expenses, taxes, interest, fees and expenses of the independent directors (including legal counsel fees), and extraordinary expenses, will be paid by ACIM. The fee is computed and accrued daily based on each class's daily net assets and paid monthly in arrears. The difference in the fee among the classes is a result of their separate arrangements for non-Rule 12b-1 shareholder services. It is not the result of any difference in advisory or custodial fees or other expenses related to the management of the fund’s assets, which do not vary by class.
The annual management fee for each class is as follows:
| Investor Class | I Class | A Class | C Class | R Class | R6 Class |
| 1.50% | 1.30% | 1.50% | 1.50% | 1.50% | 1.15% |
Distribution and Service Fees — The Board of Directors has adopted a separate Master Distribution and Individual Shareholder Services Plan for each of the A Class, C Class and R Class (collectively the plans), pursuant to Rule 12b-1 of the 1940 Act. The plans provide that the A Class will pay ACIS an annual distribution and service fee of 0.25%. The plans provide that the C Class will pay ACIS an annual distribution and service fee of 1.00%, of which 0.25% is paid for individual shareholder services and 0.75% is paid for distribution services. The plans provide that the R Class will pay ACIS an annual distribution and service fee of 0.50%. The fees are computed and accrued daily based on each class’s daily net assets and paid monthly in arrears. The fees are used to pay financial intermediaries for distribution and individual shareholder services. Fees incurred under the plans during the period ended November 30, 2018 are detailed in the Statement of Operations.
Directors' Fees and Expenses — The Board of Directors is responsible for overseeing the investment advisor’s management and operations of the fund. The directors receive detailed information about the fund and its investment advisor regularly throughout the year, and meet at least quarterly with management of the investment advisor to review reports about fund operations. The fund’s officers do not receive compensation from the fund.
4. Investment Transactions
Purchases and sales of investment securities, excluding short-term investments, for the period ended November 30, 2018 were $36,875,919 and $29,940,450, respectively.
20
5. Capital Share Transactions
Transactions in shares of the fund were as follows:
| Year ended November 30, 2018 | Year ended November 30, 2017 | |||||||||
| Shares | Amount | Shares | Amount | |||||||
| Investor Class/Shares Authorized | 50,000,000 | 50,000,000 | ||||||||
| Sold | 1,046,645 | $ | 16,045,693 | 603,903 | $ | 7,813,445 | ||||
| Issued in reinvestment of distributions | 36,736 | 522,899 | — | — | ||||||
| Redeemed | (653,315 | ) | (9,818,276 | ) | (141,558 | ) | (1,850,032 | ) | ||
| 430,066 | 6,750,316 | 462,345 | 5,963,413 | |||||||
| I Class/Shares Authorized | 40,000,000 | 50,000,000 | ||||||||
| Sold | 63,911 | 971,359 | — | — | ||||||
| Issued in reinvestment of distributions | 3,332 | 47,681 | — | — | ||||||
| Redeemed | (23,564 | ) | (325,709 | ) | — | — | ||||
| 43,679 | 693,331 | — | — | |||||||
| A Class/Shares Authorized | 30,000,000 | 40,000,000 | ||||||||
| Sold | 8,679 | 128,659 | 2,893 | 41,378 | ||||||
| Issued in reinvestment of distributions | 5,750 | 81,489 | — | — | ||||||
| Redeemed | (8,474 | ) | (135,368 | ) | — | — | ||||
| 5,955 | 74,780 | 2,893 | 41,378 | |||||||
| C Class/Shares Authorized | 30,000,000 | 30,000,000 | ||||||||
| Sold | 351 | 5,042 | 836 | 8,999 | ||||||
| Issued in reinvestment of distributions | 5,556 | 77,608 | — | — | ||||||
| Redeemed | (880 | ) | (12,385 | ) | — | — | ||||
| 5,027 | 70,265 | 836 | 8,999 | |||||||
| R Class/Shares Authorized | 30,000,000 | 30,000,000 | ||||||||
| Sold | 15,498 | 235,808 | 3,309 | 43,878 | ||||||
| Issued in reinvestment of distributions | 1,270 | 17,910 | — | — | ||||||
| Redeemed | (3,267 | ) | (48,854 | ) | (392 | ) | (5,127 | ) | ||
| 13,501 | 204,864 | 2,917 | 38,751 | |||||||
| R6 Class/Shares Authorized | 30,000,000 | 50,000,000 | ||||||||
| Sold | 258 | 3,917 | 4,797 | 59,181 | ||||||
| Issued in reinvestment of distributions | 1,318 | 18,878 | — | — | ||||||
| Redeemed | (29 | ) | (434 | ) | (208 | ) | (2,858 | ) | ||
| 1,547 | 22,361 | 4,589 | 56,323 | |||||||
| Net increase (decrease) | 499,775 | $ | 7,815,917 | 473,580 | $ | 6,108,864 | ||||
21
6. Fair Value Measurements
The fund’s investments valuation process is based on several considerations and may use multiple inputs to determine the fair value of the investments held by the fund. In conformity with accounting principles generally accepted in the United States of America, the inputs used to determine a valuation are classified into three broad levels.
| • | Level 1 valuation inputs consist of unadjusted quoted prices in an active market for identical investments. |
| • | Level 2 valuation inputs consist of direct or indirect observable market data (including quoted prices for comparable investments, evaluations of subsequent market events, interest rates, prepayment speeds, credit risk, etc.). These inputs also consist of quoted prices for identical investments initially expressed in local currencies that are adjusted through translation into U.S. dollars. |
| • | Level 3 valuation inputs consist of unobservable data (including a fund’s own assumptions). |
The level classification is based on the lowest level input that is significant to the fair valuation measurement. The valuation inputs are not necessarily an indication of the risks associated with investing in these securities or other financial instruments.
The following is a summary of the level classifications as of period end. The Schedule of Investments provides additional information on the fund’s portfolio holdings.
| Level 1 | Level 2 | Level 3 | ||||||
| Assets | ||||||||
| Investment Securities | ||||||||
| Common Stocks | ||||||||
| Australia | — | $ | 734,346 | — | ||||
| Belgium | — | 160,919 | — | |||||
| Brazil | $ | 214,975 | 27,515 | — | ||||
| Canada | 257,277 | 629,726 | — | |||||
| China | 76,571 | 265,329 | — | |||||
| Denmark | — | 112,124 | — | |||||
| Finland | — | 103,836 | — | |||||
| France | — | 358,783 | — | |||||
| Germany | — | 51,195 | — | |||||
| Hong Kong | — | 68,579 | — | |||||
| Italy | — | 316,841 | — | |||||
| Japan | — | 1,614,744 | — | |||||
| Netherlands | 117,255 | 263,441 | — | |||||
| Norway | — | 100,942 | — | |||||
| South Korea | — | 238,354 | — | |||||
| Spain | — | 339,917 | — | |||||
| Sweden | — | 565,010 | — | |||||
| Switzerland | — | 707,264 | — | |||||
| Taiwan | — | 193,599 | — | |||||
| United Kingdom | 137,813 | 1,791,285 | — | |||||
| Other Countries | 10,934,754 | — | — | |||||
| Rights | — | 22,238 | — | |||||
| $ | 11,738,645 | $ | 8,665,987 | — | ||||
22
7. Risk Factors
There are certain risks involved in investing in foreign securities. These risks include those resulting from future adverse political, social and economic developments, fluctuations in currency exchange rates, the possible imposition of exchange controls, and other foreign laws or restrictions. Investing in emerging markets may accentuate these risks.
The fund invests in common stocks of small companies. Because of this, the fund may be subject to greater risk and market fluctuations than a fund investing in larger, more established companies.
The fund’s investment process may result in high portfolio turnover, which could mean high transaction costs, affecting both performance and capital gains tax liabilities to investors.
8. Federal Tax Information
On December 18, 2018, the fund declared and paid a per-share distribution from net realized gains to shareholders of record on December 17, 2018 of $0.2333 for the Investor Class, I Class, A Class, C Class, R Class and R6 Class.
The tax character of distributions paid during the years ended November 30, 2018 and November 30, 2017 were as follows:
| 2018 | 2017 | ||||
| Distributions Paid From | |||||
| Ordinary income | $ | 435,143 | — | ||
| Long-term capital gains | $ | 338,326 | — | ||
The book-basis character of distributions made during the year from net investment income or net realized gains may differ from their ultimate characterization for federal income tax purposes. These differences reflect the differing character of certain income items and net realized gains and losses for financial statement and tax purposes, and may result in reclassification among certain capital accounts on the financial statements.
As of period end, the federal tax cost of investments and the components of distributable earnings on a tax-basis were as follows:
| Federal tax cost of investments | $ | 19,134,916 | |
| Gross tax appreciation of investments | $ | 2,326,275 | |
| Gross tax depreciation of investments | (1,056,559 | ) | |
| Net tax appreciation (depreciation) of investments | 1,269,716 | ||
| Net tax appreciation (depreciation) on translation of assets and liabilities in foreign currencies | (39 | ) | |
| Net tax appreciation (depreciation) | $ | 1,269,677 | |
| Undistributed ordinary income | — | ||
| Accumulated long-term gains | $ | 328,661 | |
| Late-year ordinary loss deferral | $ | (95,659 | ) |
| Post-October capital loss deferral | $ | (367,725 | ) |
The difference between book-basis and tax-basis unrealized appreciation (depreciation) is attributable primarily to the tax deferral of losses on wash sales.
Loss deferrals represent certain qualified losses that the fund has elected to treat as having been incurred in the following fiscal year for federal income tax purposes.
23
| Financial Highlights |
| For a Share Outstanding Throughout the Years Ended November 30 (except as noted) | |||||||||||||
| Per-Share Data | Ratios and Supplemental Data | ||||||||||||
| Income From Investment Operations: | Ratio to Average Net Assets of: | ||||||||||||
| Net Asset Value, Beginning of Period | Net Investment Income (Loss)(1) | Net Realized and Unrealized Gain (Loss) | Total From Investment Operations | Distributions From Net Realized Gains | Net Asset Value, End of Period | Total Return(2) | Operating Expenses | Net Investment Income (Loss) | Portfolio Turnover Rate | Net Assets, End of Period (in thousands) | |||
| Investor Class | |||||||||||||
| 2018 | $14.80 | (0.13) | (0.24) | (0.37) | (0.77) | $13.66 | (2.73)% | 1.50% | (0.86)% | 147% | $15,159 | ||
| 2017 | $10.85 | (0.06) | 4.01 | 3.95 | — | $14.80 | 36.41% | 1.51% | (0.44)% | 130% | $10,059 | ||
2016(3) | $10.00 | (0.03) | 0.88 | 0.85 | — | $10.85 | 8.50% | 1.50%(4) | (0.40)%(4) | 95% | $2,357 | ||
| I Class | |||||||||||||
| 2018 | $14.85 | (0.10) | (0.24) | (0.34) | (0.77) | $13.74 | (2.50)% | 1.30% | (0.66)% | 147% | $1,424 | ||
| 2017 | $10.86 | (0.02) | 4.01 | 3.99 | — | $14.85 | 36.74% | 1.31% | (0.24)% | 130% | $891 | ||
2016(3) | $10.00 | (0.01) | 0.87 | 0.86 | — | $10.86 | 8.60% | 1.30%(4) | (0.20)%(4) | 95% | $652 | ||
| A Class | |||||||||||||
| 2018 | $14.74 | (0.17) | (0.23) | (0.40) | (0.77) | $13.57 | (2.95)% | 1.75% | (1.11)% | 147% | $1,477 | ||
| 2017 | $10.83 | (0.08) | 3.99 | 3.91 | — | $14.74 | 36.10% | 1.76% | (0.69)% | 130% | $1,517 | ||
2016(3) | $10.00 | (0.05) | 0.88 | 0.83 | — | $10.83 | 8.30% | 1.75%(4) | (0.65)%(4) | 95% | $1,083 | ||
| C Class | |||||||||||||
| 2018 | $14.56 | (0.28) | (0.22) | (0.50) | (0.77) | $13.29 | (3.71)% | 2.50% | (1.86)% | 147% | $1,407 | ||
| 2017 | $10.78 | (0.17) | 3.95 | 3.78 | — | $14.56 | 35.06% | 2.51% | (1.44)% | 130% | $1,468 | ||
2016(3) | $10.00 | (0.10) | 0.88 | 0.78 | — | $10.78 | 7.80% | 2.50%(4) | (1.40)%(4) | 95% | $1,078 | ||
| For a Share Outstanding Throughout the Years Ended November 30 (except as noted) | |||||||||||||
| Per-Share Data | Ratios and Supplemental Data | ||||||||||||
| Income From Investment Operations: | Ratio to Average Net Assets of: | ||||||||||||
| Net Asset Value, Beginning of Period | Net Investment Income (Loss)(1) | Net Realized and Unrealized Gain (Loss) | Total From Investment Operations | Distributions From Net Realized Gains | Net Asset Value, End of Period | Total Return(2) | Operating Expenses | Net Investment Income (Loss) | Portfolio Turnover Rate | Net Assets, End of Period (in thousands) | |||
| R Class | |||||||||||||
| 2018 | $14.68 | (0.21) | (0.22) | (0.43) | (0.77) | $13.48 | (3.18)% | 2.00% | (1.36)% | 147% | $493 | ||
| 2017 | $10.81 | (0.11) | 3.98 | 3.87 | — | $14.68 | 35.80% | 2.01% | (0.94)% | 130% | $338 | ||
2016(3) | $10.00 | (0.06) | 0.87 | 0.81 | — | $10.81 | 8.10% | 2.00%(4) | (0.90)%(4) | 95% | $218 | ||
| R6 Class | |||||||||||||
| 2018 | $14.89 | (0.08) | (0.25) | (0.33) | (0.77) | $13.79 | (2.36)% | 1.15% | (0.51)% | 147% | $361 | ||
| 2017 | $10.87 | (0.01) | 4.03 | 4.02 | — | $14.89 | 36.86% | 1.16% | (0.09)% | 130% | $366 | ||
2016(3) | $10.00 | —(5) | 0.87 | 0.87 | — | $10.87 | 8.80% | 1.15%(4) | (0.05)%(4) | 95% | $217 | ||
| Notes to Financial Highlights | |
| (1) | Computed using average shares outstanding throughout the period. |
| (2) | Total returns are calculated based on the net asset value of the last business day and do not reflect applicable sales charges, if any. Total returns for periods less than one year are not annualized. |
| (3) | March 29, 2016 (fund inception) through November 30, 2016. |
| (4) | Annualized. |
| (5) | Per-share amount was less than $0.005. |
See Notes to Financial Statements.
| Report of Independent Registered Public Accounting Firm |
To the Shareholders and the Board of Directors of American Century World Mutual Funds, Inc.:
Opinion on the Financial Statements and Financial Highlights
We have audited the accompanying statement of assets and liabilities, including the schedule of investments, of Global Small Cap Fund, one of the funds constituting the American Century World Mutual Funds, Inc. (the “Fund”), as of November 30, 2018, the related statement of operations for the year then ended, the statements of changes in net assets for each of the two years in the period then ended, the financial highlights for the years ended November 30, 2018, November 30, 2017, and for the period March 29, 2016 (fund inception) through November 30, 2016, and the related notes. In our opinion, the financial statements and financial highlights present fairly, in all material respects, the financial position of Global Small Cap Fund of the American Century World Mutual Funds, Inc. as of November 30, 2018, the results of its operations for the year then ended, the changes in its net assets for each of the two years in the period then ended, and the financial highlights for the years ended November 30, 2018, November 30, 2017, and for the period March 29, 2016 (fund inception) through November 30, 2016, in conformity with accounting principles generally accepted in the United States of America.
Basis for Opinion
These financial statements and financial highlights are the responsibility of the Fund's management. Our responsibility is to express an opinion on the Fund’s financial statements and financial highlights based on our audits. We are a public accounting firm registered with the Public Company Accounting Oversight Board (United States) (PCAOB) and are required to be independent with respect to the Fund in accordance with the U.S. federal securities laws and the applicable rules and regulations of the Securities and Exchange Commission and the PCAOB.
We conducted our audits in accordance with the standards of the PCAOB. Those standards require that we plan and perform the audit to obtain reasonable assurance about whether the financial statements and financial highlights are free of material misstatement, whether due to error or fraud. The Fund is not required to have, nor were we engaged to perform, an audit of its internal control over financial reporting. As part of our audits we are required to obtain an understanding of internal control over financial reporting but not for the purpose of expressing an opinion on the effectiveness of the Fund’s internal control over financial reporting. Accordingly, we express no such opinion.
Our audits included performing procedures to assess the risks of material misstatement of the financial statements and financial highlights, whether due to error or fraud, and performing procedures that respond to those risks. Such procedures included examining, on a test basis, evidence regarding the amounts and disclosures in the financial statements and financial highlights. Our audits also included evaluating the accounting principles used and significant estimates made by management, as well as evaluating the overall presentation of the financial statements and financial highlights. Our procedures included confirmation of securities owned as of November 30, 2018, by correspondence with the custodian and brokers; when replies were not received from brokers, we performed other auditing procedures. We believe that our audits provide a reasonable basis for our opinion.
DELOITTE & TOUCHE LLP
Kansas City, Missouri
January 17, 2019
We have served as the auditor of one or more American Century investment companies since 1997.
26
| Management |
The Board of Directors
The individuals listed below serve as directors of the funds. Each director will continue to serve in this capacity until death, retirement, resignation or removal from office. The board has adopted a mandatory retirement age for directors who are not “interested persons,” as that term is defined in the Investment Company Act (independent directors). Independent directors shall retire by December 31 of the year in which they reach their 75th birthday.
Mr. Thomas is an “interested person” because he currently serves as President and Chief Executive Officer of American Century Companies, Inc. (ACC), the parent company of American Century Investment Management, Inc. (ACIM or the advisor). The other directors (more than three-fourths of the total number) are independent. They are not employees, directors or officers of, and have no financial interest in, ACC or any of its wholly owned, direct or indirect, subsidiaries, including ACIM, American Century Investment Services, Inc. (ACIS) and American Century Services, LLC (ACS), and they do not have any other affiliations, positions or relationships that would cause them to be considered “interested persons” under the Investment Company Act. The directors serve in this capacity for seven (in the case of Jonathan S. Thomas, 16; and Stephen E. Yates, 8) registered investment companies in the American Century Investments family of funds.
The following table presents additional information about the directors. The mailing address for each director is 4500 Main Street, Kansas City, Missouri 64111.
| Name (Year of Birth) | Position(s) Held with Funds | Length of Time Served | Principal Occupation(s) During Past 5 Years | Number of American Century Portfolios Overseen by Director | Other Directorships Held During Past 5 Years |
| Independent Directors | |||||
| Thomas W. Bunn (1953) | Director | Since 2017 | Retired | 68 | SquareTwo Financial; Barings (formerly Babson Capital Funds Trust) (2013 to 2016) |
| Barry Fink (1955) | Director | Since 2012 (independent since 2016) | Retired; Executive Vice President, ACC (2007 to 2013); President, ACS (2007 to 2013) | 68 | None |
| Jan M. Lewis (1957) | Director | Since 2011 | Retired; President and Chief Executive Officer, Catholic Charities of Northeast Kansas (human services organization) (2006 to 2013) | 68 | None |
M. Jeannine Strandjord(1) (1945) | Director | Since 1994 | Self-employed Consultant | 68 | Euronet Worldwide Inc. and MGP Ingredients, Inc. |
27
| Name (Year of Birth) | Position(s) Held with Funds | Length of Time Served | Principal Occupation(s) During Past 5 Years | Number of American Century Portfolios Overseen by Director | Other Directorships Held During Past 5 Years |
| Independent Directors | |||||
| John R. Whitten (1946) | Director | Since 2008 | Retired | 68 | Rudolph Technologies, Inc. |
| Stephen E. Yates (1948) | Director and Chairman of the Board | Since 2012 (Chairman since 2018) | Retired | 73 | None |
| Interested Director | |||||
| Jonathan S. Thomas (1963) | Director and President | Since 2007 | President and Chief Executive Officer, ACC (2007 to present). Also serves as Chief Executive Officer, ACS; Executive Vice President, ACIM; Director, ACC, ACIM and other ACC subsidiaries | 118 | BioMed Valley Discoveries, Inc. |
(1) Effective December 31, 2018, M. Jeannine Strandjord retired from the Board of Directors.
The Statement of Additional Information has additional information about the fund's directors and is available without charge, upon request, by calling 1-800-345-2021.
28
Officers
The following table presents certain information about the executive officers of the funds. Each officer serves as an officer for each of the 16 (in the case of Robert J. Leach, 15) investment companies in the American Century family of funds. No officer is compensated for his or her service as an officer of the funds. The listed officers are interested persons of the funds and are appointed or re-appointed on an annual basis. The mailing address for each officer listed below is 4500 Main Street, Kansas City, Missouri 64111.
| Name (Year of Birth) | Offices with the Funds | Principal Occupation(s) During the Past Five Years |
| Jonathan S. Thomas (1963) | Director and President since 2007 | President and Chief Executive Officer, ACC (2007 to present). Also serves as Chief Executive Officer, ACS; Executive Vice President, ACIM; Director, ACC, ACIM and other ACC subsidiaries |
| R. Wes Campbell (1974) | Chief Financial Officer and Treasurer since 2018 | Investment Operations and Investment Accounting, ACS (2000 to present) |
| Amy D. Shelton (1964) | Chief Compliance Officer and Vice President since 2014 | Chief Compliance Officer, American Century funds, (2014 to present); Chief Compliance Officer, ACIM (2014 to present); Chief Compliance Officer, ACIS (2009 to present); Vice President, Client Interactions and Marketing, ACIS (2013 to 2014). Also serves as Vice President, ACIS |
| Charles A. Etherington (1957) | General Counsel since 2007 and Senior Vice President since 2006 | Attorney, ACC (1994 to present); Vice President, ACC (2005 to present); General Counsel, ACC (2007 to present). Also serves as General Counsel, ACIM, ACS, ACIS and other ACC subsidiaries; and Senior Vice President, ACIM and ACS |
| C. Jean Wade (1964) | Vice President since 2012 | Senior Vice President, ACS (2017 to present); Vice President, ACS (2000 to 2017) |
| Robert J. Leach (1966) | Vice President since 2006 | Vice President, ACS (2000 to present) |
| David H. Reinmiller (1963) | Vice President since 2000 | Attorney, ACC (1994 to present). Also serves as Vice President, ACIM and ACS |
| Ward D. Stauffer (1960) | Secretary since 2005 | Attorney, ACC (2003 to present) |
29
| Approval of Management Agreement |
At a meeting held on June 28, 2018, the Fund’s Board of Directors (the "Board") unanimously approved the renewal of the management agreement pursuant to which American Century Investment Management, Inc. (the “Advisor”) acts as the investment advisor for the Fund. Under Section 15(c) of the Investment Company Act, contracts for investment advisory services are required to be reviewed, evaluated, and approved by a majority of a fund’s directors (the “Directors”), including a majority of the independent Directors, each year.
Prior to its consideration of the renewal of the management agreement, the Directors requested and reviewed extensive data and information compiled by the Advisor and certain independent providers of evaluation data concerning the Fund and the services provided to the Fund by the Advisor. This review was in addition to the oversight and evaluation undertaken by the Board and its committees on a continual basis and the information received was supplemental to the extensive information that the Board and its committees receive and consider throughout the year. The Directors also conducted a review of the process by which the Board considers the renewal of the management agreements. The Board consulted with industry experts and reviewed industry best practices and recent judicial precedent. The Directors believe that the enhancements resulting from their review resulted in increased dialogue with the Advisor and an improved process for fund shareholders.
In connection with its consideration of the renewal of the management agreement, the Board’s review and evaluation of the services provided by the Advisor included, but was not limited to, the following:
| • | the nature, extent, and quality of investment management, shareholder services, and other services provided and to be provided to the Fund; |
| • | the wide range of other programs and services provided and to be provided to the Fund and its shareholders on a routine and non-routine basis; |
| • | the investment performance of the Fund, including data comparing the Fund's performance to appropriate benchmarks and/or a peer group of other mutual funds with similar investment objectives and strategies; |
| • | the cost of owning the Fund compared to the cost of owning similar funds; |
| • | the compliance policies, procedures, and regulatory experience of the Advisor and the Fund's service providers; |
| • | financial data showing the cost of services provided to the Fund, the profitability of the Fund to the Advisor, and the overall profitability of the Advisor |
| • | strategic plans of the Advisor; |
| • | any economies of scale associated with the Advisor’s management of the Fund and other accounts; |
| • | services provided and charges to the Advisor's other investment management clients; |
| • | acquired fund fees and expenses; |
| • | payments and practices in connection with financial intermediaries holding shares of the Fund and the services provided by intermediaries in connection therewith; and |
| • | any collateral benefits derived by the Advisor from the management of the Fund. |
The Directors held two in-person meetings and one telephonic meeting to review and discuss the information provided. The independent Directors also reviewed responses to supplemental information requests provided by the Directors to the Advisor and held active discussions with the Advisor regarding the renewal of the management agreement. The independent Directors had the benefit of the advice of their independent counsel throughout the process.
30
Factors Considered
The Directors considered all of the information provided by the Advisor, the independent data providers, and independent counsel in connection with the approval. They determined that the information was sufficient for them to evaluate the management agreement for the Fund. In connection with their review, the Directors did not identify any single factor as being all-important or controlling, and each Director may have attributed different levels of importance to different factors. In deciding to renew the management agreement, the Board based its decision on a number of factors, including without limitation the following:
Nature, Extent and Quality of Services - Generally. Under the management agreement, the Advisor is responsible for providing or arranging for all services necessary for the operation of the Fund. The Board noted that the Advisor provides or arranges at its own expense a wide variety of services including without limitation the following:
| • | portfolio research and security selection |
| • | securities trading |
| • | Fund administration |
| • | custody of Fund assets |
| • | daily valuation of the Fund’s portfolio |
| • | shareholder servicing and transfer agency, including shareholder confirmations, recordkeeping, and communications |
| • | legal services (except the independent Directors’ counsel) |
| • | regulatory and portfolio compliance |
| • | financial reporting |
| • | marketing and distribution (except amounts paid by the Fund under Rule 12b-1 plans) |
The Board noted that many of these services have expanded over time in terms of both quantity and complexity in response to shareholder demands, competition in the industry, changing distribution channels, and the changing regulatory environment.
Investment Management Services. The nature of the investment management services provided to the Fund is quite complex and allows Fund shareholders access to professional money management, instant diversification of their investments within an asset class, the opportunity to easily diversify among asset classes by investing in or exchanging among various American Century Investments funds, and liquidity. In evaluating investment performance, the Board expects the Advisor to manage the Fund in accordance with its investment objectives and approved strategies. Further, the Directors recognize that the Advisor has an obligation to monitor trading activities, and in particular to seek the best execution of fund trades, and to evaluate the use of and payment for research. In providing these services, the Advisor utilizes teams of investment professionals (portfolio managers, analysts, research assistants, and securities traders) who require extensive information technology, research, training, compliance, and other systems to conduct their business. The Board, directly and through its Fund Performance Review Committee, provides oversight of the investment performance process. It regularly reviews investment performance information for the Fund, together with comparative information for appropriate benchmarks and/or peer groups of similarly-managed funds, over different time horizons. The Directors also review detailed performance information provided by the Advisor during the management agreement renewal process. If performance concerns are identified, the Fund receives special reviews until performance improves, during which the Board receives a report from the Advisor regarding the reasons for such results (e.g., market conditions, security selection) and any efforts being undertaken to improve performance. The Fund’s performance was above its benchmark for the one-year period reviewed by the Board. The Board found the investment management services provided by the Advisor to the Fund to be satisfactory and consistent with the management agreement.
31
Shareholder and Other Services. Under the management agreement, the Advisor provides the Fund with a comprehensive package of transfer agency, shareholder, and other services. The Board, directly and through various committees of the Board, regularly reviews reports and evaluations of such services at its regular meetings. These reports include, but are not limited to, information regarding the operational efficiency and accuracy of the shareholder and transfer agency services provided, staffing levels, shareholder satisfaction (as measured by external as well as internal sources), technology support, new products and services offered to Fund shareholders, securities trading activities, portfolio valuation services, auditing services, and legal and operational compliance activities. The Board found the services provided by the Advisor to the Fund under the management agreement to be competitive and of high quality.
Costs of Services and Profitability. The Advisor provides detailed information concerning its cost of providing various services to the Fund, its profitability in managing the Fund (pre- and post-distribution), its overall profitability, and its financial condition. The Directors have reviewed with the Advisor the methodology used to prepare this financial information. This information is considered in evaluating the Advisor’s financial condition, its ability to continue to provide services under the management agreement, and the reasonableness of the current management fee. The Board concluded that the Advisor’s profits were reasonable in light of the services provided to the Fund.
Ethics. The Board generally considers the Advisor’s commitment to providing quality services to shareholders and to conducting its business ethically. They noted that the Advisor’s practices generally meet or exceed industry best practices.
Economies of Scale. The Board also reviewed information provided by the Advisor regarding the possible existence of economies of scale in connection with the management of the Fund. The Board concluded that economies of scale are difficult to measure and predict with precision, especially on a fund-by-fund basis. The Board concluded that the Advisor is appropriately sharing economies of scale through its competitive fee structure, offering competitive fees from fund inception, and through reinvestment in its business to provide shareholders additional content and services.
Comparison to Other Funds’ Fees. The management agreement provides that the Fund pays the Advisor a single, all-inclusive (or unified) management fee for providing all services necessary for the management and operation of the Fund, other than brokerage expenses, expenses attributable to short sales, taxes, interest, extraordinary expenses, and the fees and expenses of the Fund’s independent Directors (including their independent legal counsel) and expenses incurred in connection with the provision of shareholder services and distribution services under a plan adopted pursuant to Rule 12b-1 under the 1940 Act. Under the unified fee structure, the Advisor is responsible for providing all investment advisory, custody, audit, administrative, compliance, recordkeeping, marketing and shareholder services, or arranging and supervising third parties to provide such services. By contrast, most other funds are charged a variety of fees, including an investment advisory fee, a transfer agency fee, an administrative fee, distribution charges, and other expenses. Other than their investment advisory fees and any applicable Rule 12b-1 distribution fees, all other components of the total fees charged by these other funds may be increased without shareholder approval. The Board believes the unified fee structure is a benefit to Fund shareholders because it clearly discloses to shareholders the cost of owning Fund shares, and, since the unified fee cannot be increased without a vote of Fund shareholders, it shifts to the Advisor the risk of increased costs of operating the Fund and provides a direct incentive to minimize administrative inefficiencies. Part of the Board’s analysis of fee levels involves reviewing certain evaluative data compiled by an independent provider comparing the Fund’s unified fee to the total expense ratios of its peers. The unified fee charged to shareholders of the Fund was at the median of the total expense ratios of the Fund’s peer expense universe. The Board concluded that the management fee paid by the Fund to the Advisor under the management agreement is reasonable in light of the services provided to the Fund.
32
Comparison to Fees and Services Provided to Other Clients of the Advisor. The Directors also requested and received information from the Advisor concerning the nature of the services, fees, costs, and profitability of its advisory services to advisory clients other than the Fund. They observed that these varying types of client accounts require different services and involve different regulatory and entrepreneurial risks than the management of the Fund. The Board analyzed this information and concluded that the fees charged and services provided to the Fund were reasonable by comparison.
Payments to Intermediaries. The Directors also requested and received a description of payments made to intermediaries by the Fund and the Advisor and services provided in response thereto. These payments include various payments made by the Fund or the Advisor to different types of intermediaries and recordkeepers for distribution and service activities provided for the Fund. The Board reviewed such information and received representations from the Advisor that all such payments by the Fund were made pursuant to the Fund's Rule 12b-1 Plan and that all such payments by the Advisor were made from the Advisor’s resources and reasonable profits. The Board found the payments to be reasonable in scope and purpose.
Collateral or “Fall-Out” Benefits Derived by the Advisor. The Board considered the existence of collateral benefits the Advisor may receive as a result of its relationship with the Fund. They concluded that the Advisor’s primary business is managing mutual funds and it generally does not use fund or shareholder information to generate profits in other lines of business, and therefore does not derive any significant collateral benefits from them. The Board noted that additional assets from other clients may offer the Advisor some benefit from increased leverage with service providers and counterparties. Additionally, the Advisor may receive proprietary research from broker-dealers that execute fund portfolio transactions, which the Board concluded is likely to benefit other clients of the Advisor, as well as Fund shareholders. The Board also determined that the Advisor is able to provide investment management services to certain clients other than the Fund, at least in part, due to its existing infrastructure built to serve the fund complex. The Board concluded that appropriate allocation methodologies had been employed to assign resources and the cost of those resources to these other clients and, where expressly provided, these other client assets may be included with the assets of the Fund to determine breakpoints in the management fee schedule.
Existing Relationship. The Board also considered whether there was any reason for not continuing the existing arrangement with the Advisor. In this regard, the Board was mindful of the potential disruptions of the Fund’s operations and various risks, uncertainties, and other effects that could occur as a result of a decision not to continue such relationship. In particular, the Board recognized that most shareholders have invested in the Fund on the strength of the Advisor’s industry standing and reputation and in the expectation that the Advisor will have a continuing role in providing advisory services to the Fund.
Conclusion of the Directors. As a result of this process, the Board, including all of the independent Directors, taking into account all of the factors discussed above and the information provided by the Advisor and others in connection with its review and throughout the year, determined that the management fee is fair and reasonable in light of the services provided and that the investment management agreement between the Fund and the Advisor should be renewed.
33
| Additional Information |
Retirement Account Information
As required by law, distributions you receive from certain retirement accounts are subject to federal income tax withholding, unless you elect not to have withholding apply*. Tax will be withheld on the total amount withdrawn even though you may be receiving amounts that are not subject to withholding, such as nondeductible contributions. In such case, excess amounts of withholding could occur. You may adjust your withholding election so that a greater or lesser amount will be withheld.
If you don’t want us to withhold on this amount, you must notify us to not withhold the federal income tax. You may notify us in writing or in certain situations by telephone or through other electronic means. For systematic withdrawals, your withholding election will remain in effect until revoked or changed by filing a new election. You have the right to revoke your election at any time and change your withholding percentage for future distributions.
Remember, even if you elect not to have income tax withheld, you are liable for paying income tax on the taxable portion of your withdrawal. If you elect not to have income tax withheld or you don’t have enough income tax withheld, you may be responsible for payment of estimated tax. You may incur penalties under the estimated tax rules if your withholding and estimated tax payments are not sufficient. You can reduce or defer the income tax on a distribution by directly or indirectly rolling such distribution over to another IRA or eligible plan. You should consult your tax advisor for additional information.
State tax will be withheld if, at the time of your distribution, your address is within one of the mandatory withholding states and you have federal income tax withheld (or as otherwise required by state law). State taxes will be withheld from your distribution in accordance with the respective state rules.
*Some 403(b), 457 and qualified retirement plan distributions may be subject to 20% mandatory withholding, as they are subject to special tax and withholding rules. Your plan administrator or plan sponsor is required to provide you with a special tax notice explaining those rules at the time you request a distribution. If applicable, federal and/or state taxes may be withheld from your distribution amount.
Proxy Voting Policies
A description of the policies that the fund's investment advisor uses in exercising the voting rights associated with the securities purchased and/or held by the fund is available without charge, upon request, by calling 1-800-345-2021. It is also available on the "About Us" page of American Century Investments’ website at americancentury.com and on the Securities and Exchange Commission’s website at sec.gov. Information regarding how the investment advisor voted proxies relating to portfolio securities during the most recent 12-month period ended June 30 is available on the "About Us" page at americancentury.com. It is also available at sec.gov.
Quarterly Portfolio Disclosure
The fund files its complete schedule of portfolio holdings with the Securities and Exchange Commission (SEC) for the first and third quarters of each fiscal year on Form N-Q. The fund’s Forms N-Q are available on the SEC’s website at sec.gov. The fund also makes its complete schedule of portfolio holdings for the most recent quarter of its fiscal year available on its website at americancentury.com and, upon request, by calling 1-800-345-2021.
34
Other Tax Information
The following information is provided pursuant to provisions of the Internal Revenue Code.
The fund hereby designates $435,143 as qualified short-term capital gain distributions for purposes of Internal Revenue Code Section 871 for the fiscal year ended November 30, 2018.
The fund hereby designates $418,681, or up to the maximum amount allowable, as long-term capital gain distributions (20% rate gain distributions) for the fiscal year ended November 30, 2018.
The fund utilized earnings and profits of $80,355 distributed to shareholders on redemption of shares as part of the dividends paid deduction (tax equalization).
35
| Notes |
36
| ||
| Contact Us | americancentury.com | |
| Automated Information Line | 1-800-345-8765 | |
| Investor Services Representative | 1-800-345-2021 or 816-531-5575 | |
| Investors Using Advisors | 1-800-378-9878 | |
| Business, Not-For-Profit, Employer-Sponsored Retirement Plans | 1-800-345-3533 | |
| Banks and Trust Companies, Broker-Dealers, Financial Professionals, Insurance Companies | 1-800-345-6488 | |
| Telecommunications Relay Service for the Deaf | 711 | |
| American Century World Mutual Funds, Inc. | ||
Investment Advisor: American Century Investment Management, Inc. Kansas City, Missouri | ||
| This report and the statements it contains are submitted for the general information of our shareholders. The report is not authorized for distribution to prospective investors unless preceded or accompanied by an effective prospectus. | ||
| ©2019 American Century Proprietary Holdings, Inc. All rights reserved. CL-ANN-91035 1901 | ||
| Annual Report | |
| November 30, 2018 | |
| International Discovery Fund | |
| Investor Class (TWEGX) | |
| I Class (TIDIX) | |
| A Class (ACIDX) | |
| C Class (TWECX) | |
| R Class (TWERX) | |
Beginning on January 1, 2021, as permitted by regulations adopted by the Securities and Exchange Commission, paper copies of the fund’s shareholder reports like this one will no longer be sent by mail, unless you specifically request paper copies of the reports from the fund or from your financial intermediary, such as a broker-dealer or bank. Instead, the reports will be made available on a website, and you will be notified by mail each time a report is posted and provided with a website link to access the report.
If you already elected to receive shareholder reports electronically, you will not be affected by this change and you need not take any action. You may elect to receive shareholder reports and other communications from the fund or your financial intermediary electronically by calling or sending an email request to your appropriate contacts as listed on the back cover of this report.
You may elect to receive all future reports in paper free of charge. You can inform the fund or your financial intermediary that you wish to continue receiving paper copies of your shareholder reports by calling or sending an email request to your appropriate contacts as listed on the back cover of this report. Your election to receive reports in paper will apply to all funds held with the fund complex/your financial intermediary.
| Table of Contents |
| President’s Letter | 2 | |
| Performance | 3 | |
| Portfolio Commentary | ||
| Fund Characteristics | ||
| Shareholder Fee Example | ||
| Schedule of Investments | ||
| Statement of Assets and Liabilities | ||
| Statement of Operations | ||
| Statement of Changes in Net Assets | ||
| Notes to Financial Statements | ||
| Financial Highlights | ||
| Report of Independent Registered Public Accounting Firm | ||
| Management | ||
| Approval of Management Agreement | ||
| Additional Information | ||
Any opinions expressed in this report reflect those of the author as of the date of the report, and do not necessarily represent the opinions of American Century Investments® or any other person in the American Century Investments organization. Any such opinions are subject to change at any time based upon market or other conditions and American Century Investments disclaims any responsibility to update such opinions. These opinions may not be relied upon as investment advice and, because investment decisions made by American Century Investments funds are based on numerous factors, may not be relied upon as an indication of trading intent on behalf of any American Century Investments fund. Security examples are used for representational purposes only and are not intended as recommendations to purchase or sell securities. Performance information for comparative indices and securities is provided to American Century Investments by third party vendors. To the best of American Century Investments’ knowledge, such information is accurate at the time of printing.
| President’s Letter |
Jonathan ThomasDear Investor:
Thank you for reviewing this annual report for the 12 months ended November 30, 2018. Annual reports help convey important information about fund returns, including market factors that affected performance during the reporting period. For additional investment and market insights, please visit our website, americancentury.com.
Global Growth Divergence Drives Disparity in Stock Returns
The synchronization of global economic growth, which helped deliver robust gains for global stocks in 2017, unraveled as the 12-month period unfolded. The U.S. economy continued to expand at a healthy pace, but other regions experienced notable slowdowns. Similarly, stocks advanced in the U.S. but generally declined elsewhere.
In Europe, the threat of global tariffs from the U.S. dampened business sentiment and corporate earnings growth. In addition, uncertainties surrounding Brexit negotiations, Italy’s fiscal woes, and civil unrest in France weighed on economic and earnings growth outlooks and stock performance. Meanwhile, Japan’s economy contracted late in the period, largely due to the effects of several natural disasters, which curtailed personal and business spending. Global trade tensions also pressured Japan’s growth outlook.
After starting strong, emerging markets stocks quickly reversed course. The key culprits included rising U.S. interest rates, U.S.-China tariffs, and global trade-policy uncertainty. In addition, a strong U.S. dollar, falling oil prices, and several country-specific events weighed on the asset class. Late in the period, prospects for a tariff truce between the U.S. and China, along with dovish comments from the Federal Reserve, sparked a November rally among emerging markets stocks.
Overall, U.S. stocks, as measured by the S&P 500 Index, returned 6.27% for the 12 months. Non-U.S. developed markets stocks, as measured by the MSCI EAFE Index, declined 7.94%. Emerging markets stocks, as measured by the MSCI Emerging Markets Index, fell 9.09%.
Looking ahead, investors face a backdrop of uneven global growth, heightened market volatility, and lingering geopolitical uncertainties. But it’s often these challenging markets that produce the most compelling investment opportunities. We believe this scenario underscores the importance of using professionally managed portfolios in pursuit of investment goals. We appreciate your continued trust and confidence in us.
Sincerely,
Jonathan Thomas
President and Chief Executive Officer
American Century Investments
2
| Performance |
| Total Returns as of November 30, 2018 | ||||||
Average Annual Returns | ||||||
Ticker Symbol | 1 year | 5 years | 10 years | Since Inception | Inception Date | |
| Investor Class | TWEGX | -18.28% | 1.77% | 8.58% | — | 4/1/94 |
| MSCI ACWI ex-U.S. Mid Cap Growth Index | — | -10.34% | 3.22% | 9.04% | — | — |
| I Class | TIDIX | -18.10% | 1.98% | 8.80% | — | 1/2/98 |
| A Class | ACIDX | 4/28/98 | ||||
| No sales charge | -18.48% | 1.53% | 8.31% | — | ||
| With sales charge | -23.18% | 0.34% | 7.68% | — | ||
| C Class | TWECX | -19.12% | 0.75% | — | 4.91% | 3/1/10 |
| R Class | TWERX | -18.65% | 1.27% | — | 5.43% | 3/1/10 |
Average annual returns since inception are presented when ten years of performance history is not available.
Prior to March 1, 2010, the A Class was referred to as the Advisor Class and did not have a front-end sales charge. Performance prior to that date has been adjusted to reflect this charge.
Sales charges include initial sales charges and contingent deferred sales charges (CDSCs), as applicable. A Class shares have a 5.75% maximum initial sales charge and may be subject to a maximum CDSC of 1.00%. C Class shares redeemed within 12 months of purchase are subject to a maximum CDSC of 1.00%. The SEC requires that mutual funds provide performance information net of maximum sales charges in all cases where charges could be applied.
Data presented reflect past performance. Past performance is no guarantee of future results. Current performance may be higher or lower than the performance shown. Total returns for periods less than one year are not annualized. Investment return and principal value will fluctuate, and redemption value may be more or less than original cost. Data assumes reinvestment of dividends and capital gains, and none of the charts reflect the deduction of taxes that a shareholder would pay on fund distributions or the redemption of fund shares. To obtain performance data current to the most recent month end, please call 1-800-345-2021 or visit americancentury.com. For additional information about the fund, please consult the prospectus.
3
| Growth of $10,000 Over 10 Years |
| $10,000 investment made November 30, 2008 |
| Performance for other share classes will vary due to differences in fee structure. |
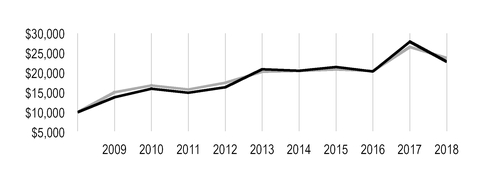
| Value on November 30, 2018 | |
| Investor Class — $22,796 | |
| MSCI ACWI ex-U.S. Mid Cap Growth Index — $23,768 | |
Total Annual Fund Operating Expenses | ||||
| Investor Class | I Class | A Class | C Class | R Class |
| 1.65% | 1.45% | 1.90% | 2.65% | 2.15% |
The total annual fund operating expenses shown is as stated in the fund’s prospectus current as of the date of this report. The prospectus may vary from the expense ratio shown elsewhere in this report because it is based on a different time period, includes acquired fund fees and expenses, and, if applicable, does not include fee waivers or expense reimbursements.
Data presented reflect past performance. Past performance is no guarantee of future results. Current performance may be higher or lower than the performance shown. Total returns for periods less than one year are not annualized. Investment return and principal value will fluctuate, and redemption value may be more or less than original cost. Data assumes reinvestment of dividends and capital gains, and none of the charts reflect the deduction of taxes that a shareholder would pay on fund distributions or the redemption of fund shares. To obtain performance data current to the most recent month end, please call 1-800-345-2021 or visit americancentury.com. For additional information about the fund, please consult the prospectus.
4
| Portfolio Commentary |
Portfolio Managers: Trevor Gurwich, Federico Laffan, and Pratik Patel
Trevor Gurwich and Federico Laffan joined the fund's management team in February 2018. Brian Brady left the fund's management team in April 2018.
Performance Summary
International Discovery returned -18.28%* for the 12 months ended November 30, 2018. The portfolio underperformed its benchmark, the MSCI ACWI ex-U.S. Mid Cap Growth Index, which returned -10.34% for the same period.
Heightened concerns about slowing global economic growth and political uncertainty dampened performance of non-U.S. small- and mid-cap stocks, which ended the 12-month period lower. Within the portfolio, stock selection in industrials hurt relative performance, as global trade tensions created earnings growth headwinds for non-U.S. small-cap industrials companies. Stock selection and an underweight relative to the benchmark in health care also detracted. Investments in the new communication services sector contributed, due to stock selection and not owning several benchmark detractors. An underweight in consumer discretionary added fractionally to relative performance. From a regional standpoint, investments in Japan, Canada, and India hindered relative performance, while holdings in Germany, Brazil, and France contributed.
Industrials Stocks Detracted
Stock selection across the industrials sector weakened relative performance in a challenging year for cyclical investments. Aerospace and transportation company Bombardier was a key laggard. After rising early in the year on solid earnings performance, the stock declined in October and November on concerns about the economic cycle, rising interest rates, and insider selling. On a positive note, its business jet order backlog continued to strengthen. We held onto the investment.
Lonza Group, a leading supplier of ingredients for the global pharmaceuticals industry, was a notable detractor in health care. The stock dropped sharply early in the year after the company provided weaker-than-expected guidance. We sold our stake and used the proceeds to fund investments we believe offer better risk/reward potential.
Vakrangee was a notable detractor in information technology. This IT services company operates a network of small rural-area outlets that provide one-stop shopping for banking and other services as well as hubs for ordering and receiving Amazon products. The stock was a strong performer for the portfolio in 2017. However, it declined in January 2018 after the company became the target of a Securities and Exchange Board of India investigation into price and volume manipulation. This investigation raised corporate governance concerns, and we exited the position.
Oilfield services provider Trican Well Service was a prominent detractor in the energy sector. The stock of Trican Well Service declined after the oil services company warned that weather delays and a pullback in industry capital spending hurt its results in the third calendar quarter of 2018. A fourth-quarter retreat in oil prices also pressured the stock price. We liquidated our investment.
* All fund returns referenced in this commentary are for Investor Class shares. Performance for other share classes will vary due to differences in fee structure; when Investor Class performance exceeds that of the fund's benchmark, other share classes may not. See page 3 for returns for all share classes.
5
South American Retailer and Global Financing Company Were Key Contributors
Magazine Luiza, a multiline retailer focused on Brazil, was a top contributor to relative performance. The stock surged higher in October after the company announced strong third-
quarter results lifted by expanding online sales. An improved economic environment in Brazil also supported its business.
Burford Capital was another strong contributor. Burford provides specialized financing and professional services for the global legal industry. The stock rose strongly after the company reported double-digit revenue and profits growth for the first half of 2018. The company’s portfolio is well diversified, and its business is becoming more recurring. We believe these trends will support sustainable earnings growth.
Elsewhere in the portfolio, materials holding Kirkland Lake Gold was a standout contributor. The gold producer reported very strong third-quarter earnings, record production, and increased guidance. Anritsu, a key performer in information technology, is a global supplier of telecommunications electronic equipment. The company is benefiting from strength in its mobile and broadband businesses as well as increased spending on 5G services.
Outlook
The portfolio continues to invest in non-U.S. small- and mid-cap companies that we believe are demonstrating accelerating and sustainable growth. Our stock selection process, which continues to drive our sector and country allocations, led to significant overweights relative to the benchmark in energy and health care. In health care, we uncovered attractive earnings growth potential among companies with expanding sales in the U.S. and elsewhere. We reduced exposure to consumer discretionary and consumer staples, both of which ended the period as notable underweights.
From a regional standpoint, the less-certain global economic outlook led us to reduce our overweight in emerging markets. We added exposure to Europe and North America (Canada), which ended the period as overweights relative to the index. Our stock selection led us to scale back exposure to Asia, which remained the largest regional underweight.
6
| Fund Characteristics |
| NOVEMBER 30, 2018 | |
Top Ten Holdings | % of net assets |
| Aristocrat Leisure Ltd. | 2.3% |
| Sika AG | 2.0% |
| Eiffage SA | 1.9% |
| BRP, Inc. | 1.8% |
| Straumann Holding AG | 1.8% |
| Kirkland Lake Gold Ltd. | 1.7% |
| DSV A/S | 1.7% |
| Wirecard AG | 1.6% |
| Ashtead Group plc | 1.5% |
| Eurofins Scientific SE | 1.5% |
Types of Investments in Portfolio | % of net assets |
| Common Stocks | 99.8% |
| Rights | 0.1% |
| Total Equity Exposure | 99.9% |
| Temporary Cash Investments | 0.6% |
| Other Assets and Liabilities | (0.5)% |
Investments by Country | % of net assets |
| United Kingdom | 16.6% |
| Japan | 14.8% |
| Canada | 9.7% |
| France | 8.5% |
| Switzerland | 6.3% |
| Australia | 6.0% |
| China | 4.4% |
| Sweden | 3.4% |
| South Korea | 3.3% |
| Netherlands | 3.3% |
| Germany | 2.9% |
| Spain | 2.6% |
| Belgium | 2.2% |
| Other Countries | 15.9% |
| Cash and Equivalents* | 0.1% |
*Includes temporary cash investments and other assets and liabilities.
7
| Shareholder Fee Example |
Fund shareholders may incur two types of costs: (1) transaction costs, including sales charges (loads) on purchase payments and redemption/exchange fees; and (2) ongoing costs, including management fees; distribution and service (12b-1) fees; and other fund expenses. This example is intended to help you understand your ongoing costs (in dollars) of investing in your fund and to compare these costs with the ongoing cost of investing in other mutual funds.
The example is based on an investment of $1,000 made at the beginning of the period and held for the entire period from June 1, 2018 to November 30, 2018.
Actual Expenses
The table provides information about actual account values and actual expenses for each class. You may use the information, together with the amount you invested, to estimate the expenses that you paid over the period. First, identify the share class you own. Then simply divide your account value by $1,000 (for example, an $8,600 account value divided by $1,000 = 8.6), then multiply the result by the number under the heading “Expenses Paid During Period” to estimate the expenses you paid on your account during this period.
If you hold Investor Class shares of any American Century Investments fund, or I Class shares of the American Century Diversified Bond Fund, in an American Century Investments account (i.e., not a financial intermediary or retirement plan account), American Century Investments may charge you a $12.50 semiannual account maintenance fee if the value of those shares is less than $10,000. We will redeem shares automatically in one of your accounts to pay the $12.50 fee. In determining your total eligible investment amount, we will include your investments in all personal accounts (including American Century Investments Brokerage accounts) registered under your Social Security number. Personal accounts include individual accounts, joint accounts, UGMA/UTMA accounts, personal trusts, Coverdell Education Savings Accounts and IRAs (including traditional, Roth, Rollover, SEP-, SARSEP- and SIMPLE-IRAs), and certain other retirement accounts. If you have only business, business retirement, employer-sponsored or American Century Investments Brokerage accounts, you are currently not subject to this fee. If you are subject to the Account Maintenance Fee, your account value could be reduced by the fee amount.
Hypothetical Example for Comparison Purposes
The table also provides information about hypothetical account values and hypothetical expenses based on the actual expense ratio of each class of your fund and an assumed rate of return of 5% per year before expenses, which is not the actual return of a fund’s share class. The hypothetical account values and expenses may not be used to estimate the actual ending account balance or expenses you paid for the period. You may use this information to compare the ongoing costs of investing in your fund and other funds. To do so, compare this 5% hypothetical example with the 5% hypothetical examples that appear in the shareholder reports of the other funds.
Please note that the expenses shown in the table are meant to highlight your ongoing costs only and do not reflect any transactional costs, such as sales charges (loads) or redemption/exchange fees. Therefore, the table is useful in comparing ongoing costs only, and will not help you determine the relative total costs of owning different funds. In addition, if these transactional costs were included, your costs would have been higher.
8
| Beginning Account Value 6/1/18 | Ending Account Value 11/30/18 | Expenses Paid During Period(1) 6/1/18 - 11/30/18 | Annualized Expense Ratio(1) | |
Actual | ||||
| Investor Class | $1,000 | $774.10 | $7.38 | 1.66% |
| I Class | $1,000 | $774.90 | $6.50 | 1.46% |
| A Class | $1,000 | $773.50 | $8.49 | 1.91% |
| C Class | $1,000 | $770.40 | $11.81 | 2.66% |
| R Class | $1,000 | $772.40 | $9.60 | 2.16% |
| Hypothetical | ||||
| Investor Class | $1,000 | $1,016.75 | $8.39 | 1.66% |
| I Class | $1,000 | $1,017.75 | $7.39 | 1.46% |
| A Class | $1,000 | $1,015.49 | $9.65 | 1.91% |
| C Class | $1,000 | $1,011.73 | $13.42 | 2.66% |
| R Class | $1,000 | $1,014.24 | $10.91 | 2.16% |
| (1) | Expenses are equal to the class's annualized expense ratio listed in the table above, multiplied by the average account value over the period, multiplied by 183, the number of days in the most recent fiscal half-year, divided by 365, to reflect the one-half year period. Annualized expense ratio reflects actual expenses, including any applicable fee waivers or expense reimbursements and excluding any acquired fund fees and expenses. |
9
| Schedule of Investments |
NOVEMBER 30, 2018
| Shares | Value | ||||
| COMMON STOCKS — 99.8% | |||||
| Argentina — 1.3% | |||||
Globant SA(1) | 88,840 | $ | 5,210,466 | ||
| Australia — 6.0% | |||||
Afterpay Touch Group Ltd.(1) | 223,810 | 2,381,197 | |||
| Aristocrat Leisure Ltd. | 547,940 | 9,478,555 | |||
| Cleanaway Waste Management Ltd. | 1,686,420 | 2,097,076 | |||
NEXTDC Ltd.(1) | 830,310 | 3,928,875 | |||
| Northern Star Resources Ltd. | 337,340 | 1,971,321 | |||
| Seven Group Holdings Ltd. | 397,130 | 4,622,030 | |||
| 24,479,054 | |||||
| Austria — 1.4% | |||||
| Wienerberger AG | 249,490 | 5,599,226 | |||
| Belgium — 2.2% | |||||
Galapagos NV(1) | 31,280 | 3,181,755 | |||
| Umicore SA | 134,930 | 5,858,608 | |||
| 9,040,363 | |||||
| Brazil — 1.2% | |||||
Azul SA ADR(1) | 150,060 | 4,050,119 | |||
| Magazine Luiza SA | 24,700 | 1,051,555 | |||
| 5,101,674 | |||||
| Canada — 9.7% | |||||
Bombardier, Inc., B Shares(1) | 2,229,200 | 3,724,701 | |||
| BRP, Inc. | 207,790 | 7,403,589 | |||
| CAE, Inc. | 226,840 | 4,606,287 | |||
Canada Goose Holdings, Inc.(1) | 67,540 | 4,548,819 | |||
| Colliers International Group, Inc. | 81,050 | 5,337,655 | |||
| First Quantum Minerals Ltd. | 296,240 | 2,720,150 | |||
Kelt Exploration Ltd.(1) | 486,870 | 1,605,006 | |||
| Kirkland Lake Gold Ltd. | 330,060 | 6,841,420 | |||
Parex Resources, Inc.(1) | 146,700 | 1,811,874 | |||
Trevali Mining Corp.(1) | 3,432,610 | 1,149,672 | |||
| 39,749,173 | |||||
| China — 4.4% | |||||
A-Living Services Co. Ltd., H Shares(1) | 2,181,000 | 2,874,954 | |||
Baozun, Inc. ADR(1) | 31,570 | 1,113,474 | |||
| China Resources Beer Holdings Co. Ltd. | 1,604,000 | 5,431,837 | |||
| China Resources Cement Holdings Ltd. | 3,242,000 | 3,164,788 | |||
GDS Holdings Ltd. ADR(1) | 84,890 | 2,503,406 | |||
| Shenzhou International Group Holdings Ltd. | 237,000 | 2,887,428 | |||
| 17,975,887 | |||||
| Denmark — 1.7% | |||||
| DSV A/S | 88,050 | 6,738,990 | |||
10
| Shares | Value | ||||
| France — 8.5% | |||||
| Eiffage SA | 81,940 | $ | 7,818,140 | ||
| Eurofins Scientific SE | 13,820 | 6,014,320 | |||
| Euronext NV | 54,990 | 3,220,389 | |||
| Gaztransport Et Technigaz SA | 19,910 | 1,488,396 | |||
| Korian SA | 84,280 | 3,261,847 | |||
SOITEC(1) | 34,490 | 2,118,741 | |||
| Teleperformance | 31,950 | 5,304,112 | |||
Ubisoft Entertainment SA(1) | 65,780 | 5,387,062 | |||
| 34,613,007 | |||||
| Germany — 2.9% | |||||
| Aroundtown SA | 262,830 | 2,253,607 | |||
| Rheinmetall AG | 33,670 | 3,118,845 | |||
| Wirecard AG | 43,470 | 6,572,950 | |||
| 11,945,402 | |||||
| Hong Kong — 0.7% | |||||
| Melco Resorts & Entertainment Ltd. ADR | 168,330 | 3,041,723 | |||
| Indonesia — 1.4% | |||||
| United Tractors Tbk PT | 2,963,200 | 5,703,351 | |||
| Israel — 1.0% | |||||
Nice Ltd. ADR(1) | 34,630 | 4,021,928 | |||
| Italy — 1.7% | |||||
| Amplifon SpA | 300,730 | 5,055,155 | |||
| FinecoBank Banca Fineco SpA | 161,980 | 1,737,815 | |||
| 6,792,970 | |||||
| Japan — 14.8% | |||||
| Ain Holdings, Inc. | 29,700 | 2,295,288 | |||
| Anritsu Corp. | 230,600 | 3,784,112 | |||
| Cosmos Pharmaceutical Corp. | 20,200 | 4,108,673 | |||
| Ichikoh Industries Ltd. | 308,400 | 2,023,417 | |||
| KH Neochem Co. Ltd. | 44,900 | 1,204,427 | |||
| Kose Corp. | 18,600 | 2,777,266 | |||
| Modec, Inc. | 140,900 | 3,506,519 | |||
| Nabtesco Corp. | 84,300 | 2,334,550 | |||
| Nihon M&A Center, Inc. | 182,200 | 4,253,190 | |||
| Orix JREIT, Inc. | 1,290 | 2,098,956 | |||
| Outsourcing, Inc. | 317,300 | 4,009,880 | |||
| Pigeon Corp. | 49,100 | 2,023,982 | |||
| Pressance Corp. | 246,200 | 3,073,660 | |||
| Rengo Co. Ltd. | 372,300 | 3,159,472 | |||
| Round One Corp. | 184,000 | 2,042,373 | |||
| Sankyu, Inc. | 79,000 | 3,704,458 | |||
| Sawai Pharmaceutical Co. Ltd. | 48,300 | 2,553,906 | |||
| Tokai Carbon Co. Ltd. | 354,400 | 4,920,358 | |||
| Trust Tech, Inc. | 108,400 | 3,115,853 | |||
| Tsubakimoto Chain Co. | 92,500 | 3,459,124 | |||
| 60,449,464 | |||||
11
| Shares | Value | ||||
| Mexico — 1.0% | |||||
Alpek SAB de CV(1) | 3,459,450 | $ | 4,215,162 | ||
| Netherlands — 3.3% | |||||
| AMG Advanced Metallurgical Group NV | 122,300 | 5,422,422 | |||
| ASR Nederland NV | 103,360 | 4,473,351 | |||
InterXion Holding NV(1) | 54,360 | 3,384,997 | |||
| 13,280,770 | |||||
| New Zealand — 1.1% | |||||
a2 Milk Co. Ltd.(1) | 603,240 | 4,326,918 | |||
| Norway — 1.0% | |||||
| Aker BP ASA | 142,520 | 4,058,168 | |||
| Russia — 1.2% | |||||
Yandex NV, A Shares(1) | 170,890 | 5,041,255 | |||
| South Korea — 3.3% | |||||
Cafe24 Corp.(1) | 25,090 | 2,292,666 | |||
| Dentium Co. Ltd. | 43,910 | 2,742,507 | |||
| Doosan Bobcat, Inc. | 116,350 | 3,419,805 | |||
| Hotel Shilla Co. Ltd. | 38,910 | 2,995,613 | |||
| Samsung Electro-Mechanics Co. Ltd. | 20,380 | 2,207,190 | |||
| 13,657,781 | |||||
| Spain — 2.6% | |||||
| Applus Services SA | 202,420 | 2,433,568 | |||
| Cellnex Telecom SA | 170,500 | 4,737,495 | |||
| Ence Energia y Celulosa SA | 519,540 | 3,295,712 | |||
| 10,466,775 | |||||
| Sweden — 3.3% | |||||
| Elekta AB, B Shares | 177,830 | 2,149,100 | |||
Epiroc AB, A Shares(1) | 669,020 | 5,490,482 | |||
| Saab AB, B Shares | 79,570 | 3,190,271 | |||
| SSAB AB, A Shares | 730,190 | 2,612,872 | |||
| 13,442,725 | |||||
| Switzerland — 6.3% | |||||
| Georg Fischer AG | 2,340 | 1,821,176 | |||
| Partners Group Holding AG | 6,680 | 4,390,072 | |||
Siegfried Holding AG(1) | 10,830 | 3,865,649 | |||
| Sika AG | 67,110 | 8,314,295 | |||
| Straumann Holding AG | 11,690 | 7,155,559 | |||
| 25,546,751 | |||||
| Taiwan — 1.2% | |||||
| Chailease Holding Co. Ltd. | 1,609,480 | 5,016,671 | |||
| United Kingdom — 16.6% | |||||
| Ashtead Group plc | 281,000 | 6,305,697 | |||
Avast plc(1) | 606,110 | 2,117,247 | |||
| Aveva Group plc | 157,910 | 5,161,637 | |||
| B&M European Value Retail SA | 652,880 | 2,906,998 | |||
| Burford Capital Ltd. | 273,880 | 5,315,379 | |||
Coca-Cola HBC AG(1) | 107,350 | 3,194,025 | |||
12
| Shares | Value | ||||
| Dechra Pharmaceuticals plc | 59,810 | $ | 1,650,358 | ||
| Electrocomponents plc | 583,590 | 3,829,318 | |||
| Fevertree Drinks plc | 57,590 | 1,756,464 | |||
| Hikma Pharmaceuticals plc | 245,770 | 5,600,070 | |||
| IG Group Holdings plc | 429,990 | 3,242,602 | |||
| Intermediate Capital Group plc | 346,260 | 4,481,614 | |||
| JD Sports Fashion plc | 551,990 | 2,790,780 | |||
| KAZ Minerals plc | 211,840 | 1,489,855 | |||
| Keywords Studios plc | 113,070 | 1,775,054 | |||
| Melrose Industries plc | 2,452,100 | 5,553,068 | |||
| NMC Health plc | 77,980 | 3,294,156 | |||
Nomad Foods Ltd.(1) | 41,510 | 839,332 | |||
| Rentokil Initial plc | 593,040 | 2,502,876 | |||
Seadrill Ltd.(1) | 128,260 | 1,748,184 | |||
| Segro plc | 262,450 | 2,022,807 | |||
| 67,577,521 | |||||
TOTAL COMMON STOCKS (Cost $436,201,085) | 407,093,175 | ||||
| RIGHTS — 0.1% | |||||
| Sweden — 0.1% | |||||
Saab AB(1) (Cost $—) | 79,570 | 312,733 | |||
| TEMPORARY CASH INVESTMENTS — 0.6% | |||||
| Repurchase Agreement, BMO Capital Markets Corp., (collateralized by various U.S. Treasury obligations, 1.125% - 3.125%, 5/31/19 - 11/15/28, valued at $2,026,699), in a joint trading account at 2.00%, dated 11/30/18, due 12/3/18 (Delivery value $1,987,193) | 1,986,862 | ||||
| Repurchase Agreement, Fixed Income Clearing Corp., (collateralized by various U.S. Treasury obligations, 3.375%, 11/15/48, valued at $454,603), at 1.05%, dated 11/30/18, due 12/3/18 (Delivery value $442,039) | 442,000 | ||||
TOTAL TEMPORARY CASH INVESTMENTS (Cost $2,428,862) | 2,428,862 | ||||
TOTAL INVESTMENT SECURITIES — 100.5% (Cost $438,629,947) | 409,834,770 | ||||
| OTHER ASSETS AND LIABILITIES — (0.5)% | (2,073,044 | ) | |||
| TOTAL NET ASSETS — 100.0% | $ | 407,761,726 | |||
| MARKET SECTOR DIVERSIFICATION | ||
(as a % of net assets) | ||
| Industrials | 23.8 | % |
| Materials | 15.2 | % |
| Information Technology | 12.6 | % |
| Health Care | 11.6 | % |
| Consumer Discretionary | 10.9 | % |
| Financials | 7.8 | % |
| Consumer Staples | 6.6 | % |
| Energy | 4.9 | % |
| Communication Services | 3.7 | % |
| Real Estate | 2.8 | % |
| Cash and Equivalents* | 0.1 | % |
*Includes temporary cash investments and other assets and liabilities.
13
| NOTES TO SCHEDULE OF INVESTMENTS | ||
| ADR | - | American Depositary Receipt |
| (1) | Non-income producing. |
See Notes to Financial Statements.
14
| Statement of Assets and Liabilities |
| NOVEMBER 30, 2018 | |||
| Assets | |||
| Investment securities, at value (cost of $438,629,947) | $ | 409,834,770 | |
| Cash | 5,608 | ||
| Foreign currency holdings, at value (cost of $42) | 42 | ||
| Receivable for investments sold | 1,070,320 | ||
| Receivable for capital shares sold | 16,589 | ||
| Dividends and interest receivable | 661,641 | ||
| Other assets | 106,847 | ||
| 411,695,817 | |||
| Liabilities | |||
| Payable for investments purchased | 3,257,909 | ||
| Payable for capital shares redeemed | 75,034 | ||
| Accrued management fees | 600,011 | ||
| Distribution and service fees payable | 1,137 | ||
| 3,934,091 | |||
| Net Assets | $ | 407,761,726 | |
| Net Assets Consist of: | |||
| Capital (par value and paid-in surplus) | $ | 418,460,929 | |
| Distributable earnings | (10,699,203 | ) | |
| $ | 407,761,726 | ||
| Net Assets | Shares Outstanding | Net Asset Value Per Share | ||||
| Investor Class, $0.01 Par Value | $383,923,018 | 28,284,615 | $13.57 | |||
| I Class, $0.01 Par Value | $20,646,178 | 1,499,313 | $13.77 | |||
| A Class, $0.01 Par Value | $2,337,562 | 177,340 | $13.18* | |||
| C Class, $0.01 Par Value | $650,410 | 50,720 | $12.82 | |||
| R Class, $0.01 Par Value | $204,558 | 15,378 | $13.30 | |||
*Maximum offering price $13.98 (net asset value divided by 0.9425).
See Notes to Financial Statements.
15
| Statement of Operations |
| YEAR ENDED NOVEMBER 30, 2018 | |||
| Investment Income (Loss) | |||
| Income: | |||
| Dividends (net of foreign taxes withheld of $660,620) | $ | 6,904,796 | |
| Interest | 36,212 | ||
| 6,941,008 | |||
| Expenses: | |||
| Management fees | 8,652,643 | ||
| Distribution and service fees: | |||
| A Class | 9,379 | ||
| C Class | 8,405 | ||
| R Class | 879 | ||
| Directors' fees and expenses | 14,942 | ||
| Other expenses | 22,041 | ||
| 8,708,289 | |||
| Net investment income (loss) | (1,767,281 | ) | |
| Realized and Unrealized Gain (Loss) | |||
| Net realized gain (loss) on: | |||
| Investment transactions | 24,923,963 | ||
| Foreign currency translation transactions | (252,785 | ) | |
| 24,671,178 | |||
| Change in net unrealized appreciation (depreciation) on: | |||
| Investments (includes (increase) decrease in accrued foreign taxes of $433,426) | (113,999,124 | ) | |
| Translation of assets and liabilities in foreign currencies | (30,704 | ) | |
| (114,029,828 | ) | ||
| Net realized and unrealized gain (loss) | (89,358,650 | ) | |
| Net Increase (Decrease) in Net Assets Resulting from Operations | $ | (91,125,931 | ) |
See Notes to Financial Statements.
16
| Statement of Changes in Net Assets |
| YEARS ENDED NOVEMBER 30, 2018 AND NOVEMBER 30, 2017 | ||||||
| Increase (Decrease) in Net Assets | November 30, 2018 | November 30, 2017 | ||||
| Operations | ||||||
| Net investment income (loss) | $ | (1,767,281 | ) | $ | (1,689,749 | ) |
| Net realized gain (loss) | 24,671,178 | 98,264,879 | ||||
| Change in net unrealized appreciation (depreciation) | (114,029,828 | ) | 57,458,605 | |||
| Net increase (decrease) in net assets resulting from operations | (91,125,931 | ) | 154,033,735 | |||
| Distributions to Shareholders | ||||||
| From earnings: | ||||||
| Investor Class | (1,722,208 | ) | — | |||
| I Class | (153,955 | ) | — | |||
| Y Class | (35 | ) | — | |||
| A Class | (3,172 | ) | — | |||
| Decrease in net assets from distributions | (1,879,370 | ) | — | |||
| Capital Share Transactions | ||||||
| Net increase (decrease) in net assets from capital share transactions (Note 5) | (49,973,852 | ) | (50,054,022 | ) | ||
| Redemption Fees | ||||||
| Increase in net assets from redemption fees | — | 4,236 | ||||
| Net increase (decrease) in net assets | (142,979,153 | ) | 103,983,949 | |||
| Net Assets | ||||||
| Beginning of period | 550,740,879 | 446,756,930 | ||||
| End of period | $ | 407,761,726 | $ | 550,740,879 | ||
See Notes to Financial Statements.
17
| Notes to Financial Statements |
NOVEMBER 30, 2018
1. Organization
American Century World Mutual Funds, Inc. (the corporation) is registered under the Investment Company Act of 1940, as amended (the 1940 Act), as an open-end management investment company and is organized as a Maryland corporation. International Discovery Fund (the fund) is one fund in a series issued by the corporation. The fund's investment objective is to seek capital growth.
The fund offers the Investor Class, I Class, A Class, C Class, and R Class. The A Class may incur an initial sales charge. The A Class and C Class may be subject to a contingent deferred sales charge. Sale of the Y Class commenced on April 10, 2017. On November 20, 2018, the fund discontinued offering the Y Class.
2. Significant Accounting Policies
The following is a summary of significant accounting policies consistently followed by the fund in preparation of its financial statements. The fund is an investment company and follows accounting and reporting guidance in accordance with accounting principles generally accepted in the United States of America. This may require management to make certain estimates and assumptions at the date of the financial statements. Actual results could differ from these estimates. Management evaluated the impact of events or transactions occurring through the date the financial statements were issued that would merit recognition or disclosure.
Investment Valuations — The fund determines the fair value of its investments and computes its net asset value per share at the close of regular trading (usually 4 p.m. Eastern time) on the New York Stock Exchange (NYSE) on each day the NYSE is open. The Board of Directors has adopted valuation policies and procedures to guide the investment advisor in the fund’s investment valuation process and to provide methodologies for the oversight of the fund’s pricing function.
Equity securities that are listed or traded on a domestic securities exchange are valued at the last reported sales price or at the official closing price as provided by the exchange. Equity securities traded on foreign securities exchanges are generally valued at the closing price of such securities on the exchange where primarily traded or at the close of the NYSE, if that is earlier. If no last sales price is reported, or if local convention or regulation so provides, the mean of the latest bid and asked prices may be used. Securities traded over-the-counter are valued at the mean of the latest bid and asked prices, the last sales price, or the official closing price. Equity securities initially expressed in local currencies are translated into U.S. dollars at the mean of the appropriate currency exchange rate at the close of the NYSE as provided by an independent pricing service.
Open-end management investment companies are valued at the reported net asset value per share. Repurchase agreements are valued at cost, which approximates fair value.
If the fund determines that the market price for an investment is not readily available or the valuation methods mentioned above do not reflect an investment’s fair value, such investment is valued as determined in good faith by the Board of Directors or its delegate, in accordance with policies and procedures adopted by the Board of Directors. In its determination of fair value, the fund may review several factors including, but not limited to, market information regarding the specific investment or comparable investments and correlation with other investment types, futures indices or general market indicators. Circumstances that may cause the fund to use these procedures to value an investment include, but are not limited to: an investment has been declared in default or is distressed; trading in a security has been suspended during the trading day or a security is not actively trading on its principal exchange; prices received from a regular pricing source are deemed unreliable; or there is a foreign market holiday and no trading occurred.
18
The fund monitors for significant events occurring after the close of an investment’s primary exchange but before the fund’s net asset value per share is determined. Significant events may include, but are not limited to: corporate announcements and transactions; governmental action and political unrest that could impact a specific investment or an investment sector; or armed conflicts, natural disasters and similar events that could affect investments in a specific country or region. The fund also monitors for significant fluctuations between domestic and foreign markets, as evidenced by the U.S. market or such other indicators that the Board of Directors, or its delegate, deems appropriate. If significant fluctuations in foreign markets are identified, the fund may apply a model-derived factor to the closing price of equity securities traded on foreign securities exchanges. The factor is based on observable market data as provided by an independent pricing service.
Security Transactions — Security transactions are accounted for as of the trade date. Net realized gains and losses are determined on the identified cost basis, which is also used for federal income tax purposes. Certain countries impose taxes on realized gains on the sale of securities registered in their country. The fund records the foreign tax expense, if any, on an accrual basis. The foreign tax expense on realized gains and unrealized appreciation reduces the net realized gain (loss) on investment transactions and net unrealized appreciation (depreciation) on investments, respectively.
Investment Income — Dividend income less foreign taxes withheld, if any, is recorded as of the ex-dividend date. Distributions received on securities that represent a return of capital or long-term capital gain are recorded as a reduction of cost of investments and/or as a realized gain. The fund may estimate the components of distributions received that may be considered nontaxable distributions or long-term capital gain distributions for income tax purposes. Interest income is recorded on the accrual basis and includes accretion of discounts and amortization of premiums.
Foreign Currency Translations — All assets and liabilities initially expressed in foreign currencies are translated into U.S. dollars at prevailing exchange rates at period end. The fund may enter into spot foreign currency exchange contracts to facilitate transactions denominated in a foreign currency. Purchases and sales of investment securities, dividend and interest income, spot foreign currency exchange contracts, and expenses are translated at the rates of exchange prevailing on the respective dates of such transactions. Net realized and unrealized foreign currency exchange gains or losses related to investment securities are a component of net realized gain (loss) on investment transactions and change in net unrealized appreciation (depreciation) on investments, respectively.
Repurchase Agreements — The fund may enter into repurchase agreements with institutions that American Century Investment Management, Inc. (ACIM) (the investment advisor) has determined are creditworthy pursuant to criteria adopted by the Board of Directors. The fund requires that the collateral, represented by securities, received in a repurchase transaction be transferred to the custodian in a manner sufficient to enable the fund to obtain those securities in the event of a default under the repurchase agreement. ACIM monitors, on a daily basis, the securities transferred to ensure the value, including accrued interest, of the securities under each repurchase agreement is equal to or greater than amounts owed to the fund under each repurchase agreement.
Joint Trading Account — Pursuant to an Exemptive Order issued by the Securities and Exchange Commission, the fund, along with certain other funds in the American Century Investments family of funds, may transfer uninvested cash balances into a joint trading account. These balances are invested in one or more repurchase agreements that are collateralized by U.S. Treasury or Agency obligations.
Income Tax Status — It is the fund’s policy to distribute substantially all net investment income and net realized gains to shareholders and to otherwise qualify as a regulated investment company under provisions of the Internal Revenue Code. Accordingly, no provision has been made for income taxes. The fund files U.S. federal, state, local and non-U.S. tax returns as applicable. The fund's tax returns are subject to examination by the relevant taxing authority until expiration of the applicable statute of limitations, which is generally three years from the date of filing but can be longer in certain jurisdictions. At this time, management believes there are no uncertain tax positions which, based on their technical merit, would not be sustained upon examination and for which it is reasonably possible that the total amounts of unrecognized tax benefits will significantly change in the next twelve months.
Multiple Class — All shares of the fund represent an equal pro rata interest in the net assets of the class to which such shares belong, and have identical voting, dividend, liquidation and other rights and the same terms and conditions, except for class specific expenses and exclusive rights to vote on matters affecting only individual classes. Income, non-class specific expenses, and realized and unrealized capital gains and losses of the fund are allocated to each class of shares based on their relative net assets.
19
Distributions to Shareholders — Distributions from net investment income and net realized gains, if any, are generally declared and paid annually. The fund may make distributions on a more frequent basis to comply with the distribution requirements of the Internal Revenue Code, in all events in a manner consistent with provisions of the 1940 Act. The fund may elect to treat a portion of its payment to a redeeming shareholder, which represents the pro rata share of undistributed net investment income and net realized gains, as a distribution for federal income tax purposes (tax equalization).
Redemption Fees — Prior to October 9, 2017, the fund may have imposed a 2.00% redemption fee on shares held less than 60 days. The fee was not applicable to all classes. The redemption fee was retained by the fund to help cover transaction costs that long-term investors may bear when the fund sells securities to meet investor redemptions.
Indemnifications — Under the corporation’s organizational documents, its officers and directors are indemnified against certain liabilities arising out of the performance of their duties to the fund. In addition, in the normal course of business, the fund enters into contracts that provide general indemnifications. The maximum exposure under these arrangements is unknown as this would involve future claims that may be made against a fund. The risk of material loss from such claims is considered by management to be remote.
3. Fees and Transactions with Related Parties
Certain officers and directors of the corporation are also officers and/or directors of American Century Companies, Inc. (ACC). The corporation’s investment advisor, ACIM, the corporation's distributor, American Century Investment Services, Inc. (ACIS), and the corporation’s transfer agent, American Century Services, LLC, are wholly owned, directly or indirectly, by ACC.
Management Fees — The corporation has entered into a management agreement with ACIM, under which ACIM provides the fund with investment advisory and management services in exchange for a single, unified management fee (the fee) per class. The agreement provides that all expenses of managing and operating the fund, except distribution and service fees, brokerage expenses, taxes, interest, fees and expenses of the independent directors (including legal counsel fees), and extraordinary expenses, will be paid by ACIM. The fee is computed and accrued daily based on each class's daily net assets and paid monthly in arrears. The difference in the fee among the classes is a result of their separate arrangements for non-Rule 12b-1 shareholder services. It is not the result of any difference in advisory or custodial fees or other expenses related to the management of the fund’s assets, which do not vary by class. The rate of the fee is determined by applying a fee rate calculation formula. This formula takes into account the fund’s assets as well as certain assets, if any, of other clients of the investment advisor outside the American Century Investments family of funds (such as subadvised funds and separate accounts) that use very similar investment teams and strategies (strategy assets).
The management fee schedule range and the effective annual management fee for each class for the period ended November 30, 2018 are as follows:
| Management Fee Schedule Range | Effective Annual Management Fee | |
| Investor Class | 1.200% to 1.750% | 1.63% |
| I Class | 1.000% to 1.550% | 1.43% |
| Y Class | 0.850% to 1.400% | N/A |
| A Class | 1.200% to 1.750% | 1.63% |
| C Class | 1.200% to 1.750% | 1.63% |
| R Class | 1.200% to 1.750% | 1.63% |
Distribution and Service Fees — The Board of Directors has adopted a separate Master Distribution and Individual Shareholder Services Plan for each of the A Class, C Class and R Class (collectively the plans), pursuant to Rule 12b-1 of the 1940 Act. The plans provide that the A Class will pay ACIS an annual distribution and service fee of 0.25%. The plans provide that the C Class will pay ACIS an annual distribution and service fee of 1.00%, of which 0.25% is paid for individual shareholder services and 0.75% is paid for distribution services. The plans provide that the R Class will pay ACIS an annual distribution and service fee of 0.50%. The fees are computed and accrued daily based on each class’s daily net assets and paid monthly in arrears. The fees are used to pay financial intermediaries for distribution and individual shareholder services. Fees incurred under the plans during the period ended November 30, 2018 are detailed in the Statement of Operations.
20
Directors' Fees and Expenses — The Board of Directors is responsible for overseeing the investment advisor’s management and operations of the fund. The directors receive detailed information about the fund and its investment advisor regularly throughout the year, and meet at least quarterly with management of the investment advisor to review reports about fund operations. The fund’s officers do not receive compensation from the fund.
Interfund Transactions — The fund may enter into security transactions with other American Century Investments funds and other client accounts of the investment advisor, in accordance with the 1940 Act rules and procedures adopted by the Board of Directors. The rules and procedures require, among other things, that these transactions be effected at the independent current market price of the security. During the period, the interfund purchases and sales were $652,745 and $879,121, respectively. The effect of interfund transactions on the Statement of Operations was $135,751 in net realized gain (loss) on investment transactions.
4. Investment Transactions
Purchases and sales of investment securities, excluding short-term investments, for the period ended November 30, 2018 were $734,241,075 and $773,106,080, respectively.
21
5. Capital Share Transactions
Transactions in shares of the fund were as follows:
| Year ended November 30, 2018 | Year ended November 30, 2017(1) | |||||||||
| Shares | Amount | Shares | Amount | |||||||
| Investor Class/Shares Authorized | 340,000,000 | 340,000,000 | ||||||||
| Sold | 896,496 | $ | 15,323,456 | 1,032,656 | $ | 14,967,943 | ||||
| Issued in reinvestment of distributions | 93,498 | 1,636,220 | — | — | ||||||
| Redeemed | (3,754,704 | ) | (62,961,995 | ) | (4,656,519 | ) | (64,073,784 | ) | ||
| (2,764,710 | ) | (46,002,319 | ) | (3,623,863 | ) | (49,105,841 | ) | |||
| I Class/Shares Authorized | 50,000,000 | 50,000,000 | ||||||||
| Sold | 507,499 | 8,806,513 | 386,641 | 5,886,834 | ||||||
| Issued in reinvestment of distributions | 8,632 | 153,040 | — | — | ||||||
| Redeemed | (665,508 | ) | (11,225,857 | ) | (299,960 | ) | (4,256,349 | ) | ||
| (149,377 | ) | (2,266,304 | ) | 86,681 | 1,630,485 | |||||
| Y Class/Shares Authorized | 25,000,000 | 50,000,000 | ||||||||
| Sold | — | — | 367 | 5,000 | ||||||
| Issued in reinvestment of distributions | 2 | 35 | — | — | ||||||
| Redeemed | (369 | ) | (5,108 | ) | — | — | ||||
| (367 | ) | (5,073 | ) | 367 | 5,000 | |||||
| A Class/Shares Authorized | 30,000,000 | 30,000,000 | ||||||||
| Sold | 27,799 | 459,687 | 39,572 | 539,675 | ||||||
| Issued in reinvestment of distributions | 186 | 3,172 | — | — | ||||||
| Redeemed | (138,747 | ) | (2,267,082 | ) | (190,435 | ) | (2,697,895 | ) | ||
| (110,762 | ) | (1,804,223 | ) | (150,863 | ) | (2,158,220 | ) | |||
| C Class/Shares Authorized | 30,000,000 | 30,000,000 | ||||||||
| Sold | 2,948 | 46,399 | 9,008 | 128,587 | ||||||
| Redeemed | (7,802 | ) | (127,931 | ) | (28,165 | ) | (420,180 | ) | ||
| (4,854 | ) | (81,532 | ) | (19,157 | ) | (291,593 | ) | |||
| R Class/Shares Authorized | 30,000,000 | 30,000,000 | ||||||||
| Sold | 12,287 | 204,777 | 2,625 | 37,296 | ||||||
| Redeemed | (1,200 | ) | (19,178 | ) | (11,805 | ) | (171,149 | ) | ||
| 11,087 | 185,599 | (9,180 | ) | (133,853 | ) | |||||
| Net increase (decrease) | (3,018,983 | ) | $ | (49,973,852 | ) | (3,716,015 | ) | $ | (50,054,022 | ) |
| (1) | April 10, 2017 (commencement of sale) through November 30, 2017 for the Y Class. |
22
6. Fair Value Measurements
The fund’s investments valuation process is based on several considerations and may use multiple inputs to determine the fair value of the investments held by the fund. In conformity with accounting principles generally accepted in the United States of America, the inputs used to determine a valuation are classified into three broad levels.
| • | Level 1 valuation inputs consist of unadjusted quoted prices in an active market for identical investments. |
| • | Level 2 valuation inputs consist of direct or indirect observable market data (including quoted prices for comparable investments, evaluations of subsequent market events, interest rates, prepayment speeds, credit risk, etc.). These inputs also consist of quoted prices for identical investments initially expressed in local currencies that are adjusted through translation into U.S. dollars. |
| • | Level 3 valuation inputs consist of unobservable data (including a fund’s own assumptions). |
The level classification is based on the lowest level input that is significant to the fair valuation measurement. The valuation inputs are not necessarily an indication of the risks associated with investing in these securities or other financial instruments.
The following is a summary of the level classifications as of period end. The Schedule of Investments provides additional information on the fund’s portfolio holdings.
| Level 1 | Level 2 | Level 3 | ||||||
| Assets | ||||||||
| Investment Securities | ||||||||
| Common Stocks | ||||||||
| Argentina | $ | 5,210,466 | — | — | ||||
| Brazil | 4,050,119 | $ | 1,051,555 | — | ||||
| Canada | 4,548,819 | 35,200,354 | — | |||||
| China | 3,616,880 | 14,359,007 | — | |||||
| Hong Kong | 3,041,723 | — | — | |||||
| Israel | 4,021,928 | — | — | |||||
| Netherlands | 3,384,997 | 9,895,773 | — | |||||
| Russia | 5,041,255 | — | — | |||||
| United Kingdom | 2,587,516 | 64,990,005 | — | |||||
| Other Countries | — | 246,092,778 | — | |||||
| Rights | — | 312,733 | — | |||||
| Temporary Cash Investments | — | 2,428,862 | — | |||||
| $ | 35,503,703 | $ | 374,331,067 | — | ||||
7. Risk Factors
There are certain risks involved in investing in foreign securities. These risks include those resulting from future adverse political, social and economic developments, fluctuations in currency exchange rates, the possible imposition of exchange controls, and other foreign laws or restrictions. Investing in emerging markets may accentuate these risks.
The fund invests in common stocks of small companies. Because of this, the fund may be subject to greater risk and market fluctuations than a fund investing in larger, more established companies.
The fund’s investment process may result in high portfolio turnover, which could mean high transaction costs, affecting both performance and capital gains tax liabilities to investors.
23
8. Federal Tax Information
On December 18, 2018, the fund declared and paid a per-share distribution from net realized gains to shareholders of record on December 17, 2018 of $0.7216 for the Investor Class, I Class, A Class, C Class and R Class.
On December 18, 2018, the fund declared and paid the following per-share distributions from net investment income to shareholders of record on December 17, 2018:
| Investor Class | I Class | A Class | C Class | R Class |
| $0.0373 | $0.0626 | $0.0058 | — | — |
The tax character of distributions paid during the years ended November 30, 2018 and November 30, 2017 were as follows:
| 2018 | 2017 | ||||
| Distributions Paid From | |||||
| Ordinary income | $ | 1,879,370 | — | ||
| Long-term capital gains | — | — | |||
The book-basis character of distributions made during the year from net investment income or net realized gains may differ from their ultimate characterization for federal income tax purposes. These differences reflect the differing character of certain income items and net realized gains and losses for financial statement and tax purposes, and may result in reclassification among certain capital accounts on the financial statements.
As of period end, the federal tax cost of investments and the components of distributable earnings on a tax-basis were as follows:
| Federal tax cost of investments | $ | 442,874,383 | |
| Gross tax appreciation of investments | $ | 19,938,727 | |
| Gross tax depreciation of investments | (52,978,340 | ) | |
| Net tax appreciation (depreciation) of investments | (33,039,613 | ) | |
| Net tax appreciation (depreciation) on translation of assets and liabilities in foreign currencies | (73,334 | ) | |
| Net tax appreciation (depreciation) | $ | (33,112,947 | ) |
| Undistributed ordinary income | $ | 1,123,875 | |
| Accumulated long-term gains | $ | 21,289,869 | |
The difference between book-basis and tax-basis unrealized appreciation (depreciation) is attributable primarily to the tax deferral of losses on wash sales.
9. Corporate Event
On December 4, 2018, the Board of Directors approved an agreement and plan of reorganization (the reorganization), whereby the net assets of the fund will be transferred to International Opportunities Fund, one fund in a series issued by the corporation, in exchange for shares of International Opportunities Fund. The financial statements and performance history of International Opportunities Fund will survive after the reorganization. The reorganization is expected to be effective as of the close of the NYSE on March 22, 2019.
24
| Financial Highlights |
| For a Share Outstanding Throughout the Years Ended November 30 (except as noted) | |||||||||||||
| Per-Share Data | Ratios and Supplemental Data | ||||||||||||
| Income From Investment Operations: | Ratio to Average Net Assets of: | ||||||||||||
Net Asset Value, Beginning of Period | Net Investment Income (Loss)(1) | Net Realized and Unrealized Gain (Loss) | Total From Investment Operations | Distributions From Net Investment Income | Net Asset Value, End of Period | Total Return(2) | Operating Expenses | Net Investment Income (Loss) | Portfolio Turnover Rate | Net Assets, End of Period (in thousands) | |||
| Investor Class | |||||||||||||
| 2018 | $16.66 | (0.06) | (2.97) | (3.03) | (0.06) | $13.57 | (18.28)% | 1.64% | (0.34)% | 139% | $383,923 | ||
| 2017 | $12.15 | (0.05) | 4.56 | 4.51 | — | $16.66 | 37.12% | 1.65% | (0.35)% | 125% | $517,259 | ||
| 2016 | $12.90 | (0.03) | (0.65) | (0.68) | (0.07) | $12.15 | (5.21)% | 1.64% | (0.25)% | 139% | $421,314 | ||
| 2015 | $12.35 | —(3) | 0.58 | 0.58 | (0.03) | $12.90 | 4.61% | 1.67% | 0.00%(4) | 171% | $506,817 | ||
| 2014 | $12.70 | 0.03 | (0.24) | (0.21) | (0.14) | $12.35 | (1.73)% | 1.61% | 0.20% | 134% | $541,410 | ||
| I Class | |||||||||||||
| 2018 | $16.90 | (0.01) | (3.03) | (3.04) | (0.09) | $13.77 | (18.10)% | 1.44% | (0.14)% | 139% | $20,646 | ||
| 2017 | $12.30 | (0.02) | 4.62 | 4.60 | — | $16.90 | 37.40% | 1.45% | (0.15)% | 125% | $27,864 | ||
| 2016 | $13.06 | (0.01) | (0.66) | (0.67) | (0.09) | $12.30 | (5.03)% | 1.44% | (0.05)% | 139% | $19,217 | ||
| 2015 | $12.50 | 0.03 | 0.58 | 0.61 | (0.05) | $13.06 | 4.84% | 1.47% | 0.20% | 171% | $22,415 | ||
| 2014 | $12.86 | 0.06 | (0.25) | (0.19) | (0.17) | $12.50 | (1.55)% | 1.41% | 0.40% | 134% | $22,304 | ||
| A Class | |||||||||||||
| 2018 | $16.18 | (0.10) | (2.89) | (2.99) | (0.01) | $13.18 | (18.48)% | 1.89% | (0.59)% | 139% | $2,338 | ||
| 2017 | $11.83 | (0.08) | 4.43 | 4.35 | — | $16.18 | 36.77% | 1.90% | (0.60)% | 125% | $4,661 | ||
| 2016 | $12.56 | (0.06) | (0.63) | (0.69) | (0.04) | $11.83 | (5.44)% | 1.89% | (0.50)% | 139% | $5,193 | ||
| 2015 | $12.03 | (0.03) | 0.56 | 0.53 | — | $12.56 | 4.32% | 1.92% | (0.25)% | 171% | $6,596 | ||
| 2014 | $12.36 | (0.01) | (0.22) | (0.23) | (0.10) | $12.03 | (1.92)% | 1.86% | (0.05)% | 134% | $5,576 | ||
| For a Share Outstanding Throughout the Years Ended November 30 (except as noted) | |||||||||||||
| Per-Share Data | Ratios and Supplemental Data | ||||||||||||
| Income From Investment Operations: | Ratio to Average Net Assets of: | ||||||||||||
Net Asset Value, Beginning of Period | Net Investment Income (Loss)(1) | Net Realized and Unrealized Gain (Loss) | Total From Investment Operations | Distributions From Net Investment Income | Net Asset Value, End of Period | Total Return(2) | Operating Expenses | Net Investment Income (Loss) | Portfolio Turnover Rate | Net Assets, End of Period (in thousands) | |||
| C Class | |||||||||||||
| 2018 | $15.85 | (0.21) | (2.82) | (3.03) | — | $12.82 | (19.12)% | 2.64% | (1.34)% | 139% | $650 | ||
| 2017 | $11.67 | (0.18) | 4.36 | 4.18 | — | $15.85 | 35.82% | 2.65% | (1.35)% | 125% | $881 | ||
| 2016 | $12.45 | (0.15) | (0.63) | (0.78) | — | $11.67 | (6.19)% | 2.64% | (1.25)% | 139% | $872 | ||
| 2015 | $12.01 | (0.12) | 0.56 | 0.44 | — | $12.45 | 3.58% | 2.67% | (1.00)% | 171% | $720 | ||
| 2014 | $12.39 | (0.10) | (0.23) | (0.33) | (0.05) | $12.01 | (2.74)% | 2.61% | (0.80)% | 134% | $456 | ||
| R Class | |||||||||||||
| 2018 | $16.35 | (0.12) | (2.93) | (3.05) | — | $13.30 | (18.65)% | 2.14% | (0.84)% | 139% | $205 | ||
| 2017 | $11.98 | (0.11) | 4.48 | 4.37 | — | $16.35 | 36.36% | 2.15% | (0.85)% | 125% | $70 | ||
| 2016 | $12.73 | (0.10) | (0.64) | (0.74) | (0.01) | $11.98 | (5.69)% | 2.14% | (0.75)% | 139% | $161 | ||
| 2015 | $12.22 | (0.08) | 0.59 | 0.51 | — | $12.73 | 4.09% | 2.17% | (0.50)% | 171% | $179 | ||
| 2014 | $12.55 | (0.05) | (0.22) | (0.27) | (0.06) | $12.22 | (2.19)% | 2.11% | (0.30)% | 134% | $374 | ||
| Notes to Financial Highlights |
| (1) | Computed using average shares outstanding throughout the period. |
| (2) | Total returns are calculated based on the net asset value of the last business day and do not reflect applicable sales charges, if any. Total returns for periods less than one year are not annualized. |
| (3) | Per-share amount was less than $0.005. |
| (4) | Ratio was less than 0.005%. |
See Notes to Financial Statements.
| Report of Independent Registered Public Accounting Firm |
To the Shareholders and the Board of Directors of American Century World Mutual Funds, Inc.:
Opinion on the Financial Statements and Financial Highlights
We have audited the accompanying statement of assets and liabilities, including the schedule of investments, of International Discovery Fund, one of the funds constituting the American Century World Mutual Funds, Inc. (the “Fund”), as of November 30, 2018, the related statement of operations for the year then ended, the statements of changes in net assets for each of the two years in the period then ended, the financial highlights for each of the five years in the period then ended, and the related notes. In our opinion, the financial statements and financial highlights present fairly, in all material respects, the financial position of International Discovery Fund of the American Century World Mutual Funds, Inc. as of November 30, 2018, the results of its operations for the year then ended, the changes in its net assets for each of the two years in the period then ended, and the financial highlights for each of the five years in the period then ended, in conformity with accounting principles generally accepted in the United States of America.
Basis for Opinion
These financial statements and financial highlights are the responsibility of the Fund's management. Our responsibility is to express an opinion on the Fund’s financial statements and financial highlights based on our audits. We are a public accounting firm registered with the Public Company Accounting Oversight Board (United States) (PCAOB) and are required to be independent with respect to the Fund in accordance with the U.S. federal securities laws and the applicable rules and regulations of the Securities and Exchange Commission and the PCAOB.
We conducted our audits in accordance with the standards of the PCAOB. Those standards require that we plan and perform the audit to obtain reasonable assurance about whether the financial statements and financial highlights are free of material misstatement, whether due to error or fraud. The Fund is not required to have, nor were we engaged to perform, an audit of its internal control over financial reporting. As part of our audits we are required to obtain an understanding of internal control over financial reporting but not for the purpose of expressing an opinion on the effectiveness of the Fund’s internal control over financial reporting. Accordingly, we express no such opinion.
Our audits included performing procedures to assess the risks of material misstatement of the financial statements and financial highlights, whether due to error or fraud, and performing procedures that respond to those risks. Such procedures included examining, on a test basis, evidence regarding the amounts and disclosures in the financial statements and financial highlights. Our audits also included evaluating the accounting principles used and significant estimates made by management, as well as evaluating the overall presentation of the financial statements and financial highlights. Our procedures included confirmation of securities owned as of November 30, 2018, by correspondence with the custodian and brokers; when replies were not received from brokers, we performed other auditing procedures. We believe that our audits provide a reasonable basis for our opinion.
DELOITTE & TOUCHE LLP
Kansas City, Missouri
January 17, 2019
We have served as the auditor of one or more American Century investment companies since 1997.
27
| Management |
The Board of Directors
The individuals listed below serve as directors of the funds. Each director will continue to serve in this capacity until death, retirement, resignation or removal from office. The board has adopted a mandatory retirement age for directors who are not “interested persons,” as that term is defined in the Investment Company Act (independent directors). Independent directors shall retire by December 31 of the year in which they reach their 75th birthday.
Mr. Thomas is an “interested person” because he currently serves as President and Chief Executive Officer of American Century Companies, Inc. (ACC), the parent company of American Century Investment Management, Inc. (ACIM or the advisor). The other directors (more than three-fourths of the total number) are independent. They are not employees, directors or officers of, and have no financial interest in, ACC or any of its wholly owned, direct or indirect, subsidiaries, including ACIM, American Century Investment Services, Inc. (ACIS) and American Century Services, LLC (ACS), and they do not have any other affiliations, positions or relationships that would cause them to be considered “interested persons” under the Investment Company Act. The directors serve in this capacity for seven (in the case of Jonathan S. Thomas, 16; and Stephen E. Yates, 8) registered investment companies in the American Century Investments family of funds.
The following table presents additional information about the directors. The mailing address for each director is 4500 Main Street, Kansas City, Missouri 64111.
| Name (Year of Birth) | Position(s) Held with Funds | Length of Time Served | Principal Occupation(s) During Past 5 Years | Number of American Century Portfolios Overseen by Director | Other Directorships Held During Past 5 Years |
| Independent Directors | |||||
| Thomas W. Bunn (1953) | Director | Since 2017 | Retired | 68 | SquareTwo Financial; Barings (formerly Babson Capital Funds Trust) (2013 to 2016) |
| Barry Fink (1955) | Director | Since 2012 (independent since 2016) | Retired; Executive Vice President, ACC (2007 to 2013); President, ACS (2007 to 2013) | 68 | None |
| Jan M. Lewis (1957) | Director | Since 2011 | Retired; President and Chief Executive Officer, Catholic Charities of Northeast Kansas (human services organization) (2006 to 2013) | 68 | None |
M. Jeannine Strandjord(1) (1945) | Director | Since 1994 | Self-employed Consultant | 68 | Euronet Worldwide Inc. and MGP Ingredients, Inc. |
28
| Name (Year of Birth) | Position(s) Held with Funds | Length of Time Served | Principal Occupation(s) During Past 5 Years | Number of American Century Portfolios Overseen by Director | Other Directorships Held During Past 5 Years |
| Independent Directors | |||||
| John R. Whitten (1946) | Director | Since 2008 | Retired | 68 | Rudolph Technologies, Inc. |
| Stephen E. Yates (1948) | Director and Chairman of the Board | Since 2012 (Chairman since 2018) | Retired | 73 | None |
| Interested Director | |||||
| Jonathan S. Thomas (1963) | Director and President | Since 2007 | President and Chief Executive Officer, ACC (2007 to present). Also serves as Chief Executive Officer, ACS; Executive Vice President, ACIM; Director, ACC, ACIM and other ACC subsidiaries | 118 | BioMed Valley Discoveries, Inc. |
(1) Effective December 31, 2018, M. Jeannine Strandjord retired from the Board of Directors.
The Statement of Additional Information has additional information about the fund's directors and is available without charge, upon request, by calling 1-800-345-2021.
29
Officers
The following table presents certain information about the executive officers of the funds. Each officer serves as an officer for each of the 16 (in the case of Robert J. Leach, 15) investment companies in the American Century family of funds. No officer is compensated for his or her service as an officer of the funds. The listed officers are interested persons of the funds and are appointed or re-appointed on an annual basis. The mailing address for each officer listed below is 4500 Main Street, Kansas City, Missouri 64111.
| Name (Year of Birth) | Offices with the Funds | Principal Occupation(s) During the Past Five Years |
| Jonathan S. Thomas (1963) | Director and President since 2007 | President and Chief Executive Officer, ACC (2007 to present). Also serves as Chief Executive Officer, ACS; Executive Vice President, ACIM; Director, ACC, ACIM and other ACC subsidiaries |
| R. Wes Campbell (1974) | Chief Financial Officer and Treasurer since 2018 | Investment Operations and Investment Accounting, ACS (2000 to present) |
| Amy D. Shelton (1964) | Chief Compliance Officer and Vice President since 2014 | Chief Compliance Officer, American Century funds, (2014 to present); Chief Compliance Officer, ACIM (2014 to present); Chief Compliance Officer, ACIS (2009 to present); Vice President, Client Interactions and Marketing, ACIS (2013 to 2014). Also serves as Vice President, ACIS |
| Charles A. Etherington (1957) | General Counsel since 2007 and Senior Vice President since 2006 | Attorney, ACC (1994 to present); Vice President, ACC (2005 to present); General Counsel, ACC (2007 to present). Also serves as General Counsel, ACIM, ACS, ACIS and other ACC subsidiaries; and Senior Vice President, ACIM and ACS |
| C. Jean Wade (1964) | Vice President since 2012 | Senior Vice President, ACS (2017 to present); Vice President, ACS (2000 to 2017) |
| Robert J. Leach (1966) | Vice President since 2006 | Vice President, ACS (2000 to present) |
| David H. Reinmiller (1963) | Vice President since 2000 | Attorney, ACC (1994 to present). Also serves as Vice President, ACIM and ACS |
| Ward D. Stauffer (1960) | Secretary since 2005 | Attorney, ACC (2003 to present) |
30
| Approval of Management Agreement |
At a meeting held on June 28, 2018, the Fund’s Board of Directors (the "Board") unanimously approved the renewal of the management agreement pursuant to which American Century Investment Management, Inc. (the “Advisor”) acts as the investment advisor for the Fund. Under Section 15(c) of the Investment Company Act, contracts for investment advisory services are required to be reviewed, evaluated, and approved by a majority of a fund’s directors (the “Directors”), including a majority of the independent Directors, each year.
Prior to its consideration of the renewal of the management agreement, the Directors requested and reviewed extensive data and information compiled by the Advisor and certain independent providers of evaluation data concerning the Fund and the services provided to the Fund by the Advisor. This review was in addition to the oversight and evaluation undertaken by the Board and its committees on a continual basis and the information received was supplemental to the extensive information that the Board and its committees receive and consider throughout the year. The Directors also conducted a review of the process by which the Board considers the renewal of the management agreements. The Board consulted with industry experts and reviewed industry best practices and recent judicial precedent. The Directors believe that the enhancements resulting from their review resulted in increased dialogue with the Advisor and an improved process for fund shareholders.
In connection with its consideration of the renewal of the management agreement, the Board’s review and evaluation of the services provided by the Advisor included, but was not limited to, the following:
| • | the nature, extent, and quality of investment management, shareholder services, and other services provided and to be provided to the Fund; |
| • | the wide range of other programs and services provided and to be provided to the Fund and its shareholders on a routine and non-routine basis; |
| • | the investment performance of the Fund, including data comparing the Fund's performance to appropriate benchmarks and/or a peer group of other mutual funds with similar investment objectives and strategies; |
| • | the cost of owning the Fund compared to the cost of owning similar funds; |
| • | the compliance policies, procedures, and regulatory experience of the Advisor and the Fund's service providers; |
| • | financial data showing the cost of services provided to the Fund, the profitability of the Fund to the Advisor, and the overall profitability of the Advisor |
| • | strategic plans of the Advisor; |
| • | any economies of scale associated with the Advisor’s management of the Fund and other accounts; |
| • | services provided and charges to the Advisor's other investment management clients; |
| • | acquired fund fees and expenses; |
| • | payments and practices in connection with financial intermediaries holding shares of the Fund and the services provided by intermediaries in connection therewith; and |
| • | any collateral benefits derived by the Advisor from the management of the Fund. |
The Directors held two in-person meetings and one telephonic meeting to review and discuss the information provided. The independent Directors also reviewed responses to supplemental information requests provided by the Directors to the Advisor and held active discussions with the Advisor regarding the renewal of the management agreement. The independent Directors had the benefit of the advice of their independent counsel throughout the process.
31
Factors Considered
The Directors considered all of the information provided by the Advisor, the independent data providers, and independent counsel in connection with the approval. They determined that the information was sufficient for them to evaluate the management agreement for the Fund. In connection with their review, the Directors did not identify any single factor as being all-important or controlling, and each Director may have attributed different levels of importance to different factors. In deciding to renew the management agreement, the Board based its decision on a number of factors, including without limitation the following:
Nature, Extent and Quality of Services - Generally. Under the management agreement, the Advisor is responsible for providing or arranging for all services necessary for the operation of the Fund. The Board noted that the Advisor provides or arranges at its own expense a wide variety of services including without limitation the following:
| • | portfolio research and security selection |
| • | securities trading |
| • | Fund administration |
| • | custody of Fund assets |
| • | daily valuation of the Fund’s portfolio |
| • | shareholder servicing and transfer agency, including shareholder confirmations, recordkeeping, and communications |
| • | legal services (except the independent Directors’ counsel) |
| • | regulatory and portfolio compliance |
| • | financial reporting |
| • | marketing and distribution (except amounts paid by the Fund under Rule 12b-1 plans) |
The Board noted that many of these services have expanded over time in terms of both quantity and complexity in response to shareholder demands, competition in the industry, changing distribution channels, and the changing regulatory environment.
Investment Management Services. The nature of the investment management services provided to the Fund is quite complex and allows Fund shareholders access to professional money management, instant diversification of their investments within an asset class, the opportunity to easily diversify among asset classes by investing in or exchanging among various American Century Investments funds, and liquidity. In evaluating investment performance, the Board expects the Advisor to manage the Fund in accordance with its investment objectives and approved strategies. Further, the Directors recognize that the Advisor has an obligation to monitor trading activities, and in particular to seek the best execution of fund trades, and to evaluate the use of and payment for research. In providing these services, the Advisor utilizes teams of investment professionals (portfolio managers, analysts, research assistants, and securities traders) who require extensive information technology, research, training, compliance, and other systems to conduct their business. The Board, directly and through its Fund Performance Review Committee, provides oversight of the investment performance process. It regularly reviews investment performance information for the Fund, together with comparative information for appropriate benchmarks and/or peer groups of similarly-managed funds, over different time horizons. The Directors also review detailed performance information provided by the Advisor during the management agreement renewal process. If performance concerns are identified, the Fund receives special reviews until performance improves, during which the Board receives a report from the Advisor regarding the reasons for such results (e.g., market conditions, security selection) and any efforts being undertaken to improve performance. The Fund’s performance was above its benchmark for the one-, three-, five-, and ten-year periods reviewed by the Board. The Board found the investment management services provided by the Advisor to the Fund to be satisfactory and consistent with the management agreement.
32
Shareholder and Other Services. Under the management agreement, the Advisor provides the Fund with a comprehensive package of transfer agency, shareholder, and other services. The Board, directly and through various committees of the Board, regularly reviews reports and evaluations of such services at its regular meetings. These reports include, but are not limited to, information regarding the operational efficiency and accuracy of the shareholder and transfer agency services provided, staffing levels, shareholder satisfaction (as measured by external as well as internal sources), technology support, new products and services offered to Fund shareholders, securities trading activities, portfolio valuation services, auditing services, and legal and operational compliance activities. The Board found the services provided by the Advisor to the Fund under the management agreement to be competitive and of high quality.
Costs of Services and Profitability. The Advisor provides detailed information concerning its cost of providing various services to the Fund, its profitability in managing the Fund (pre- and post-distribution), its overall profitability, and its financial condition. The Directors have reviewed with the Advisor the methodology used to prepare this financial information. This information is considered in evaluating the Advisor’s financial condition, its ability to continue to provide services under the management agreement, and the reasonableness of the current management fee. The Board concluded that the Advisor’s profits were reasonable in light of the services provided to the Fund.
Ethics. The Board generally considers the Advisor’s commitment to providing quality services to shareholders and to conducting its business ethically. They noted that the Advisor’s practices generally meet or exceed industry best practices.
Economies of Scale. The Board also reviewed information provided by the Advisor regarding the possible existence of economies of scale in connection with the management of the Fund. The Board concluded that economies of scale are difficult to measure and predict with precision, especially on a fund-by-fund basis. The Board concluded that the Advisor is appropriately sharing economies of scale through its competitive fee structure, offering competitive fees from fund inception, and through reinvestment in its business to provide shareholders additional content and services. The Board also noted that economies of scale are shared with the Fund and its shareholders through management fee breakpoints that serve to reduce the effective management fee as the assets of the Fund grow.
Comparison to Other Funds’ Fees. The management agreement provides that the Fund pays the Advisor a single, all-inclusive (or unified) management fee for providing all services necessary for the management and operation of the Fund, other than brokerage expenses, expenses attributable to short sales, taxes, interest, extraordinary expenses, and the fees and expenses of the Fund’s independent Directors (including their independent legal counsel) and expenses incurred in connection with the provision of shareholder services and distribution services under a plan adopted pursuant to Rule 12b-1 under the 1940 Act. Under the unified fee structure, the Advisor is responsible for providing all investment advisory, custody, audit, administrative, compliance, recordkeeping, marketing and shareholder services, or arranging and supervising third parties to provide such services. By contrast, most other funds are charged a variety of fees, including an investment advisory fee, a transfer agency fee, an administrative fee, distribution charges, and other expenses. Other than their investment advisory fees and any applicable Rule 12b-1 distribution fees, all other components of the total fees charged by these other funds may be increased without shareholder approval. The Board believes the unified fee structure is a benefit to Fund shareholders because it clearly discloses to shareholders the cost of owning Fund shares, and, since the unified fee cannot be increased without a vote of Fund shareholders, it shifts to the Advisor the risk of increased costs of operating the Fund and provides a direct incentive to minimize administrative inefficiencies. Part of the Board’s analysis of fee levels involves reviewing certain evaluative data compiled by an independent provider comparing the Fund’s unified fee to the total expense ratios of its peers. The unified fee charged to shareholders of the Fund was above the median of the total expense ratios of the Fund’s peer expense universe and was within the range of its peer expense group. The Board concluded that the management fee paid by the
33
Fund to the Advisor under the management agreement is reasonable in light of the services provided to the Fund.
Comparison to Fees and Services Provided to Other Clients of the Advisor. The Directors also requested and received information from the Advisor concerning the nature of the services, fees, costs, and profitability of its advisory services to advisory clients other than the Fund. They observed that these varying types of client accounts require different services and involve different regulatory and entrepreneurial risks than the management of the Fund. The Board analyzed this information and concluded that the fees charged and services provided to the Fund were reasonable by comparison.
Payments to Intermediaries. The Directors also requested and received a description of payments made to intermediaries by the Fund and the Advisor and services provided in response thereto. These payments include various payments made by the Fund or the Advisor to different types of intermediaries and recordkeepers for distribution and service activities provided for the Fund. The Board reviewed such information and received representations from the Advisor that all such payments by the Fund were made pursuant to the Fund's Rule 12b-1 Plan and that all such payments by the Advisor were made from the Advisor’s resources and reasonable profits. The Board found the payments to be reasonable in scope and purpose.
Collateral or “Fall-Out” Benefits Derived by the Advisor. The Board considered the existence of collateral benefits the Advisor may receive as a result of its relationship with the Fund. They concluded that the Advisor’s primary business is managing mutual funds and it generally does not use fund or shareholder information to generate profits in other lines of business, and therefore does not derive any significant collateral benefits from them. The Board noted that additional assets from other clients may offer the Advisor some benefit from increased leverage with service providers and counterparties. Additionally, the Advisor may receive proprietary research from broker-dealers that execute fund portfolio transactions, which the Board concluded is likely to benefit other clients of the Advisor, as well as Fund shareholders. The Board also determined that the Advisor is able to provide investment management services to certain clients other than the Fund, at least in part, due to its existing infrastructure built to serve the fund complex. The Board concluded that appropriate allocation methodologies had been employed to assign resources and the cost of those resources to these other clients and, where expressly provided, these other client assets may be included with the assets of the Fund to determine breakpoints in the management fee schedule.
Existing Relationship. The Board also considered whether there was any reason for not continuing the existing arrangement with the Advisor. In this regard, the Board was mindful of the potential disruptions of the Fund’s operations and various risks, uncertainties, and other effects that could occur as a result of a decision not to continue such relationship. In particular, the Board recognized that most shareholders have invested in the Fund on the strength of the Advisor’s industry standing and reputation and in the expectation that the Advisor will have a continuing role in providing advisory services to the Fund.
Conclusion of the Directors. As a result of this process, the Board, including all of the independent Directors, taking into account all of the factors discussed above and the information provided by the Advisor and others in connection with its review and throughout the year, determined that the management fee is fair and reasonable in light of the services provided and that the investment management agreement between the Fund and the Advisor should be renewed.
34
| Additional Information |
Retirement Account Information
As required by law, distributions you receive from certain retirement accounts are subject to federal income tax withholding, unless you elect not to have withholding apply*. Tax will be withheld on the total amount withdrawn even though you may be receiving amounts that are not subject to withholding, such as nondeductible contributions. In such case, excess amounts of withholding could occur. You may adjust your withholding election so that a greater or lesser amount will be withheld.
If you don’t want us to withhold on this amount, you must notify us to not withhold the federal income tax. You may notify us in writing or in certain situations by telephone or through other electronic means. For systematic withdrawals, your withholding election will remain in effect until revoked or changed by filing a new election. You have the right to revoke your election at any time and change your withholding percentage for future distributions.
Remember, even if you elect not to have income tax withheld, you are liable for paying income tax on the taxable portion of your withdrawal. If you elect not to have income tax withheld or you don’t have enough income tax withheld, you may be responsible for payment of estimated tax. You may incur penalties under the estimated tax rules if your withholding and estimated tax payments are not sufficient. You can reduce or defer the income tax on a distribution by directly or indirectly rolling such distribution over to another IRA or eligible plan. You should consult your tax advisor for additional information.
State tax will be withheld if, at the time of your distribution, your address is within one of the mandatory withholding states and you have federal income tax withheld (or as otherwise required by state law). State taxes will be withheld from your distribution in accordance with the respective state rules.
*Some 403(b), 457 and qualified retirement plan distributions may be subject to 20% mandatory withholding, as they are subject to special tax and withholding rules. Your plan administrator or plan sponsor is required to provide you with a special tax notice explaining those rules at the time you request a distribution. If applicable, federal and/or state taxes may be withheld from your distribution amount.
Proxy Voting Policies
A description of the policies that the fund's investment advisor uses in exercising the voting rights associated with the securities purchased and/or held by the fund is available without charge, upon request, by calling 1-800-345-2021. It is also available on the "About Us" page of American Century Investments’ website at americancentury.com and on the Securities and Exchange Commission’s website at sec.gov. Information regarding how the investment advisor voted proxies relating to portfolio securities during the most recent 12-month period ended June 30 is available on the "About Us" page at americancentury.com. It is also available at sec.gov.
Quarterly Portfolio Disclosure
The fund files its complete schedule of portfolio holdings with the Securities and Exchange Commission (SEC) for the first and third quarters of each fiscal year on Form N-Q. The fund’s Forms N-Q are available on the SEC’s website at sec.gov. The fund also makes its complete schedule of portfolio holdings for the most recent quarter of its fiscal year available on its website at americancentury.com and, upon request, by calling 1-800-345-2021.
35
Other Tax Information
The following information is provided pursuant to provisions of the Internal Revenue Code.
The fund hereby designates up to the maximum amount allowable as qualified dividend income for the fiscal year ended November 30, 2018.
The fund hereby designates $331,353, or up to the maximum amount allowable, as long-term capital gain distributions (20% rate gain distributions) for the fiscal year ended November 30, 2018.
For the fiscal year ended November 30, 2018, the fund intends to pass through to shareholders foreign source income of $7,565,416 and foreign taxes paid of $642,707, or up to the maximum amount allowable, as a foreign tax credit. Foreign source income and foreign tax expense per outstanding share on November 30, 2018 are $0.2520 and $0.0214, respectively.
The fund utilized earnings and profits of $331,353 distributed to shareholders on redemption of shares as part of the dividends paid deduction (tax equalization).
36
| ||
| Contact Us | americancentury.com | |
| Automated Information Line | 1-800-345-8765 | |
| Investor Services Representative | 1-800-345-2021 or 816-531-5575 | |
| Investors Using Advisors | 1-800-378-9878 | |
| Business, Not-For-Profit, Employer-Sponsored Retirement Plans | 1-800-345-3533 | |
| Banks and Trust Companies, Broker-Dealers, Financial Professionals, Insurance Companies | 1-800-345-6488 | |
| Telecommunications Relay Service for the Deaf | 711 | |
| American Century World Mutual Funds, Inc. | ||
Investment Advisor: American Century Investment Management, Inc. Kansas City, Missouri | ||
| This report and the statements it contains are submitted for the general information of our shareholders. The report is not authorized for distribution to prospective investors unless preceded or accompanied by an effective prospectus. | ||
| ©2019 American Century Proprietary Holdings, Inc. All rights reserved. CL-ANN-91031 1901 | ||
| Annual Report | |
| November 30, 2018 | |
| International Growth Fund | |
| Investor Class (TWIEX) | |
| I Class (TGRIX) | |
| Y Class (ATYGX) | |
| A Class (TWGAX) | |
| C Class (AIWCX) | |
| R Class (ATGRX) | |
| R5 Class (ATGGX) | |
| R6 Class (ATGDX) | |
Beginning on January 1, 2021, as permitted by regulations adopted by the Securities and Exchange Commission, paper copies of the fund’s shareholder reports like this one will no longer be sent by mail, unless you specifically request paper copies of the reports from the fund or from your financial intermediary, such as a broker-dealer or bank. Instead, the reports will be made available on a website, and you will be notified by mail each time a report is posted and provided with a website link to access the report.
If you already elected to receive shareholder reports electronically, you will not be affected by this change and you need not take any action. You may elect to receive shareholder reports and other communications from the fund or your financial intermediary electronically by calling or sending an email request to your appropriate contacts as listed on the back cover of this report.
You may elect to receive all future reports in paper free of charge. You can inform the fund or your financial intermediary that you wish to continue receiving paper copies of your shareholder reports by calling or sending an email request to your appropriate contacts as listed on the back cover of this report. Your election to receive reports in paper will apply to all funds held with the fund complex/your financial intermediary.
| Table of Contents |
| President’s Letter | 2 | |
| Performance | 3 | |
| Portfolio Commentary | ||
| Fund Characteristics | ||
| Shareholder Fee Example | ||
| Schedule of Investments | ||
| Statement of Assets and Liabilities | ||
| Statement of Operations | ||
| Statement of Changes in Net Assets | ||
| Notes to Financial Statements | ||
| Financial Highlights | ||
| Report of Independent Registered Public Accounting Firm | ||
| Management | ||
| Approval of Management Agreement | ||
| Additional Information | ||
Any opinions expressed in this report reflect those of the author as of the date of the report, and do not necessarily represent the opinions of American Century Investments® or any other person in the American Century Investments organization. Any such opinions are subject to change at any time based upon market or other conditions and American Century Investments disclaims any responsibility to update such opinions. These opinions may not be relied upon as investment advice and, because investment decisions made by American Century Investments funds are based on numerous factors, may not be relied upon as an indication of trading intent on behalf of any American Century Investments fund. Security examples are used for representational purposes only and are not intended as recommendations to purchase or sell securities. Performance information for comparative indices and securities is provided to American Century Investments by third party vendors. To the best of American Century Investments’ knowledge, such information is accurate at the time of printing.
| President’s Letter |
Jonathan ThomasDear Investor:
Thank you for reviewing this annual report for the 12 months ended November 30, 2018. Annual reports help convey important information about fund returns, including market factors that affected performance during the reporting period. For additional investment and market insights, please visit our website, americancentury.com.
Global Growth Divergence Drives Disparity in Stock Returns
The synchronization of global economic growth, which helped deliver robust gains for global stocks in 2017, unraveled as the 12-month period unfolded. The U.S. economy continued to expand at a healthy pace, but other regions experienced notable slowdowns. Similarly, stocks advanced in the U.S. but generally declined elsewhere.
In Europe, the threat of global tariffs from the U.S. dampened business sentiment and corporate earnings growth. In addition, uncertainties surrounding Brexit negotiations, Italy’s fiscal woes, and civil unrest in France weighed on economic and earnings growth outlooks and stock performance. Meanwhile, Japan’s economy contracted late in the period, largely due to the effects of several natural disasters, which curtailed personal and business spending. Global trade tensions also pressured Japan’s growth outlook.
After starting strong, emerging markets stocks quickly reversed course. The key culprits included rising U.S. interest rates, U.S.-China tariffs, and global trade-policy uncertainty. In addition, a strong U.S. dollar, falling oil prices, and several country-specific events weighed on the asset class. Late in the period, prospects for a tariff truce between the U.S. and China, along with dovish comments from the Federal Reserve, sparked a November rally among emerging markets stocks.
Overall, U.S. stocks, as measured by the S&P 500 Index, returned 6.27% for the 12 months. Non-U.S. developed markets stocks, as measured by the MSCI EAFE Index, declined 7.94%. Emerging markets stocks, as measured by the MSCI Emerging Markets Index, fell 9.09%.
Looking ahead, investors face a backdrop of uneven global growth, heightened market volatility, and lingering geopolitical uncertainties. But it’s often these challenging markets that produce the most compelling investment opportunities. We believe this scenario underscores the importance of using professionally managed portfolios in pursuit of investment goals. We appreciate your continued trust and confidence in us.
Sincerely,
Jonathan Thomas
President and Chief Executive Officer
American Century Investments
2
| Performance |
| Total Returns as of November 30, 2018 | ||||||
Average Annual Returns | ||||||
Ticker Symbol | 1 year | 5 years | 10 years | Since Inception | Inception Date | |
| Investor Class | TWIEX | -9.23% | 1.51% | 8.36% | — | 5/9/91 |
| MSCI EAFE Index | — | -7.94% | 1.84% | 7.47% | — | — |
| MSCI EAFE Growth Index | — | -6.88% | 2.96% | 8.26% | — | — |
| I Class | TGRIX | -9.12% | 1.70% | 8.57% | — | 11/20/97 |
| Y Class | ATYGX | -8.95% | — | — | 5.42% | 4/10/17 |
| A Class | TWGAX | 10/2/96 | ||||
| No sales charge | -9.45% | 1.24% | 8.09% | — | ||
| With sales charge | -14.68% | 0.05% | 7.46% | — | ||
| C Class | AIWCX | -10.12% | 0.49% | 7.28% | — | 6/4/01 |
| R Class | ATGRX | -9.68% | 1.00% | 7.83% | — | 8/29/03 |
| R5 Class | ATGGX | -9.03% | — | — | 5.28% | 4/10/17 |
| R6 Class | ATGDX | -8.93% | 1.86% | — | 3.46% | 7/26/13 |
Average annual returns since inception are presented when ten years of performance history is not available.
Sales charges include initial sales charges and contingent deferred sales charges (CDSCs), as applicable. A Class shares have a 5.75% maximum initial sales charge and may be subject to a maximum CDSC of 1.00%. C Class shares redeemed within 12 months of purchase are subject to a maximum CDSC of 1.00%. The SEC requires that mutual funds provide performance information net of maximum sales charges in all cases where charges could be applied.
Data presented reflect past performance. Past performance is no guarantee of future results. Current performance may be higher or lower than the performance shown. Total returns for periods less than one year are not annualized. Investment return and principal value will fluctuate, and redemption value may be more or less than original cost. Data assumes reinvestment of dividends and capital gains, and none of the charts reflect the deduction of taxes that a shareholder would pay on fund distributions or the redemption of fund shares. To obtain performance data current to the most recent month end, please call 1-800-345-2021 or visit americancentury.com. For additional information about the fund, please consult the prospectus.
3
| Growth of $10,000 Over 10 Years |
| $10,000 investment made November 30, 2008 |
| Performance for other share classes will vary due to differences in fee structure. |
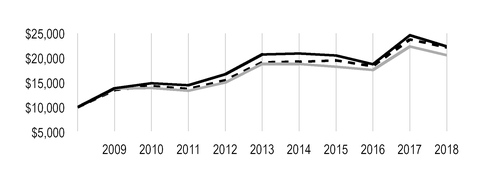
| Value on November 30, 2018 | |
| Investor Class — $22,339 | |
| MSCI EAFE Index — $20,560 | |
MSCI EAFE Growth Index — $22,130 | |
Total Annual Fund Operating Expenses | |||||||
| Investor Class | I Class | Y Class | A Class | C Class | R Class | R5 Class | R6 Class |
| 1.17% | 0.97% | 0.82% | 1.42% | 2.17% | 1.67% | 0.97% | 0.82% |
The total annual fund operating expenses shown is as stated in the fund’s prospectus current as of the date of this report. The prospectus may vary from the expense ratio shown elsewhere in this report because it is based on a different time period, includes acquired fund fees and expenses, and, if applicable, does not include fee waivers or expense reimbursements.
Data presented reflect past performance. Past performance is no guarantee of future results. Current performance may be higher or lower than the performance shown. Total returns for periods less than one year are not annualized. Investment return and principal value will fluctuate, and redemption value may be more or less than original cost. Data assumes reinvestment of dividends and capital gains, and none of the charts reflect the deduction of taxes that a shareholder would pay on fund distributions or the redemption of fund shares. To obtain performance data current to the most recent month end, please call 1-800-345-2021 or visit americancentury.com. For additional information about the fund, please consult the prospectus.
4
| Portfolio Commentary |
Portfolio Manager: Raj Gandhi and Jim Zhao
In September 2018, portfolio manager James Gendelman left the International Growth management team.
Performance Summary
International Growth returned -9.23%* for the fiscal year ended November 30, 2018, compared with the -7.94% return of its benchmark, the MSCI EAFE Index.
International Growth declined during the fiscal year, underperforming its benchmark, the MSCI EAFE Index. Security selection in the consumer staples and materials sectors detracted from relative performance, while holdings in the financials sector contributed. From a geographic perspective, U.K.- and Canada-based stocks weighed on returns, whereas stock selection in Germany lifted returns.
Non-U.S. equities, pressured by several global macroeconomic trends, significantly underperformed U.S. equities for the period. Rising concerns about decelerating earnings growth, Brexit uncertainty, potential trade war escalation, and slowing growth in China weighed on investor sentiment. In the last three months of the period, we saw the market rotate into low-volatility defensive stocks at the expense of cyclicals and high-growth stocks. The sell-off, which did not spare companies with good fundamentals and strong quarterly earnings, erased the year’s earlier gains. Although the shift to perceived safe havens has created a headwind, we remain confident in our bottom-up process, which focuses on identifying companies with accelerating, sustainable growth.
Consumer Staples and Stocks Exposed to Cyclical Industries Detracted
Consumer staples holdings weighed on the fund’s performance. Stock of tobacco firm Swedish Match fell after the U.S. Food and Drug Administration announced its plan to ban flavored cigars. We think the sell-off was an overreaction based on a worst-case scenario for cigars. Our focus is on the company’s higher-margin ZYN product as a growth driver. We believe the market opportunity in the U.S. for this vaping alternative is expanding, and a European product launch is expected in 2020.
Security selection in the materials sector also detracted. Mining company First Quantum Minerals’ stock weakened as concerns about a global growth slowdown weighed on the price of copper. We exited the position when evidence of weakening demand became more apparent.
Bombardier’s stock declined significantly after the airplane and train manufacturer’s free cash flow forecasts disappointed. Our thesis was that improvements in business jet demand and the commercial aircraft division would drive free cash flow growth, but our confidence in this outcome diminished, and we sold our position.
Stock of automotive supplier Valeo weakened after the company reduced its forward-looking guidance due to delays in the conversion of its backlog. New emissions standards regulations in Europe, which have caused a disruption in automotive production as vehicles move through the qualification process, and weakening demand in China have clouded the earnings outlook. We sold the position.
*All fund returns referenced in this commentary are for Investor Class shares. Performance for other share classes will vary due to differences in fee structure; when Investor Class performance exceeds that of the fund's benchmark, other share classes may not. See page 3 for returns for all share classes.
5
Earnings-Driven Stock Choices Boosted Relative Returns
Stock selection in the financials sector aided the fund’s relative returns as our process steered us to avoid most European banks, which underperformed. Industrials holdings, including MonotaRO, also bolstered the fund’s relative returns. The online industrial product distributor’s stock rose as the company reported better-than-expected second-quarter results followed by several better-than-expected monthly sales reports. The company also reported strong growth in new customer acquisition as it continues to lead the industry transition to online in Japan.
Lonza Group’s stock advanced after it reported ahead-of-expectations results, beating both revenue and earnings estimates. The contract manufacturer and producer of biologics continues to benefit from increased outsourcing by the pharmaceutical industry. In addition, Lonza is beginning to realize strong synergies from its Capsugel acquisition. Management raised full-year revenue guidance and margin targets.
Stock of CyberAgent, the Japan-based internet company, rose on strong earnings driven by robust performance in the advertising business, creation of hit titles in the game business, a rebound in existing game sales, and announced plans for a collaborative title with Nintendo. CyberAgent also reported an upward trend in monthly active users, daily active users, and average viewing time for AbemaTV.
Outlook
Despite the challenging market environment, we continue to focus on our disciplined process of identifying companies with accelerating, sustainable growth, where we see upside to consensus estimates. Our process has led us to focus on companies with intrinsic growth drivers that are not dependent on economic improvement. At period-end, the fund’s largest overweight positions relative to the benchmark were in the consumer discretionary and information technology sectors. The shift to e-commerce combined with consumers’ desire for lifestyle improvement and wellness helped drive the consumer discretionary overweight. Athletic wear retailers are among those companies benefiting from these trends. Growth drivers affecting our positions within information technology include the advent of 5G, increased capital expenditure in automation, data, and data management, and the shift to online solutions in multiple industries. Already the largest underweight in the fund, our financials weighting shrank further with the sale of multiple European banks. The fund's industrials weighting also decreased due to mounting evidence of peaking revenue growth and margins in cyclical industries such as automobiles, semiconductors, and construction. These data points increased our concerns over decelerating earnings growth and possible negative earnings revisions.
The fund’s largest regional weighting remains Europe. We continue to be underweight in Asia, especially Japan, partly because the MSCI EAFE Index skews heavily toward financials and automobile stocks.
6
| Fund Characteristics |
| NOVEMBER 30, 2018 | |
Top Ten Holdings | % of net assets |
| Lonza Group AG | 2.7% |
| AstraZeneca plc | 2.7% |
| AIA Group Ltd. | 2.6% |
| Diageo plc | 2.4% |
| CSL Ltd. | 2.2% |
| London Stock Exchange Group plc | 2.0% |
| Danone SA | 2.0% |
| Shiseido Co. Ltd. | 1.8% |
| Royal Dutch Shell plc, A Shares | 1.7% |
| Bunzl plc | 1.6% |
Types of Investments in Portfolio | % of net assets |
| Common Stocks | 99.4% |
| Other Assets and Liabilities | 0.6% |
Investments by Country | % of net assets |
| United Kingdom | 21.2% |
| Japan | 16.8% |
| France | 9.1% |
| Sweden | 6.6% |
| Germany | 5.5% |
| Switzerland | 4.9% |
| Netherlands | 4.6% |
| Australia | 4.2% |
| China | 3.7% |
| Spain | 3.1% |
| Hong Kong | 2.6% |
| Canada | 2.6% |
| Belgium | 2.5% |
| Ireland | 2.4% |
| Denmark | 2.4% |
| Brazil | 2.1% |
| Other Countries | 5.1% |
| Other Assets and Liabilities | 0.6% |
7
| Shareholder Fee Example |
Fund shareholders may incur two types of costs: (1) transaction costs, including sales charges (loads) on purchase payments and redemption/exchange fees; and (2) ongoing costs, including management fees; distribution and service (12b-1) fees; and other fund expenses. This example is intended to help you understand your ongoing costs (in dollars) of investing in your fund and to compare these costs with the ongoing cost of investing in other mutual funds.
The example is based on an investment of $1,000 made at the beginning of the period and held for the entire period from June 1, 2018 to November 30, 2018.
Actual Expenses
The table provides information about actual account values and actual expenses for each class. You may use the information, together with the amount you invested, to estimate the expenses that you paid over the period. First, identify the share class you own. Then simply divide your account value by $1,000 (for example, an $8,600 account value divided by $1,000 = 8.6), then multiply the result by the number under the heading “Expenses Paid During Period” to estimate the expenses you paid on your account during this period.
If you hold Investor Class shares of any American Century Investments fund, or I Class shares of the American Century Diversified Bond Fund, in an American Century Investments account (i.e., not a financial intermediary or retirement plan account), American Century Investments may charge you a $12.50 semiannual account maintenance fee if the value of those shares is less than $10,000. We will redeem shares automatically in one of your accounts to pay the $12.50 fee. In determining your total eligible investment amount, we will include your investments in all personal accounts (including American Century Investments Brokerage accounts) registered under your Social Security number. Personal accounts include individual accounts, joint accounts, UGMA/UTMA accounts, personal trusts, Coverdell Education Savings Accounts and IRAs (including traditional, Roth, Rollover, SEP-, SARSEP- and SIMPLE-IRAs), and certain other retirement accounts. If you have only business, business retirement, employer-sponsored or American Century Investments Brokerage accounts, you are currently not subject to this fee. If you are subject to the Account Maintenance Fee, your account value could be reduced by the fee amount.
Hypothetical Example for Comparison Purposes
The table also provides information about hypothetical account values and hypothetical expenses based on the actual expense ratio of each class of your fund and an assumed rate of return of 5% per year before expenses, which is not the actual return of a fund’s share class. The hypothetical account values and expenses may not be used to estimate the actual ending account balance or expenses you paid for the period. You may use this information to compare the ongoing costs of investing in your fund and other funds. To do so, compare this 5% hypothetical example with the 5% hypothetical examples that appear in the shareholder reports of the other funds.
Please note that the expenses shown in the table are meant to highlight your ongoing costs only and do not reflect any transactional costs, such as sales charges (loads) or redemption/exchange fees. Therefore, the table is useful in comparing ongoing costs only, and will not help you determine the relative total costs of owning different funds. In addition, if these transactional costs were included, your costs would have been higher.
8
| Beginning Account Value 6/1/18 | Ending Account Value 11/30/18 | Expenses Paid During Period(1) 6/1/18 - 11/30/18 | Annualized Expense Ratio(1) | |
Actual | ||||
| Investor Class | $1,000 | $865.40 | $5.47 | 1.17% |
| I Class | $1,000 | $865.30 | $4.54 | 0.97% |
| Y Class | $1,000 | $866.80 | $3.84 | 0.82% |
| A Class | $1,000 | $863.70 | $6.63 | 1.42% |
| C Class | $1,000 | $860.70 | $10.12 | 2.17% |
| R Class | $1,000 | $862.90 | $7.80 | 1.67% |
| R5 Class | $1,000 | $866.10 | $4.54 | 0.97% |
| R6 Class | $1,000 | $866.70 | $3.84 | 0.82% |
| Hypothetical | ||||
| Investor Class | $1,000 | $1,019.20 | $5.92 | 1.17% |
| I Class | $1,000 | $1,020.21 | $4.91 | 0.97% |
| Y Class | $1,000 | $1,020.96 | $4.15 | 0.82% |
| A Class | $1,000 | $1,017.95 | $7.18 | 1.42% |
| C Class | $1,000 | $1,014.19 | $10.96 | 2.17% |
| R Class | $1,000 | $1,016.70 | $8.44 | 1.67% |
| R5 Class | $1,000 | $1,020.21 | $4.91 | 0.97% |
| R6 Class | $1,000 | $1,020.96 | $4.15 | 0.82% |
| (1) | Expenses are equal to the class's annualized expense ratio listed in the table above, multiplied by the average account value over the period, multiplied by 183, the number of days in the most recent fiscal half-year, divided by 365, to reflect the one-half year period. Annualized expense ratio reflects actual expenses, including any applicable fee waivers or expense reimbursements and excluding any acquired fund fees and expenses. |
9
| Schedule of Investments |
NOVEMBER 30, 2018
| Shares | Value | ||||
| COMMON STOCKS — 99.4% | |||||
| Australia — 4.2% | |||||
| Aristocrat Leisure Ltd. | 493,530 | $ | 8,537,342 | ||
| CSL Ltd. | 232,920 | 30,330,692 | |||
| Treasury Wine Estates Ltd. | 1,747,540 | 18,212,692 | |||
| 57,080,726 | |||||
| Austria — 1.5% | |||||
Erste Group Bank AG(1) | 508,152 | 20,057,635 | |||
| Belgium — 2.5% | |||||
| KBC Group NV | 228,230 | 16,425,211 | |||
| Umicore SA | 413,500 | 17,954,007 | |||
| 34,379,218 | |||||
| Brazil — 2.1% | |||||
| Localiza Rent a Car SA | 2,273,200 | 15,818,933 | |||
| Magazine Luiza SA | 287,900 | 12,256,782 | |||
| 28,075,715 | |||||
| Canada — 2.6% | |||||
Canada Goose Holdings, Inc.(1) | 238,550 | 16,066,342 | |||
| Canadian Pacific Railway Ltd. | 49,330 | 10,433,314 | |||
| Nutrien Ltd. | 158,580 | 8,168,604 | |||
| 34,668,260 | |||||
| China — 3.7% | |||||
Alibaba Group Holding Ltd. ADR(1) | 97,120 | 15,622,723 | |||
| ANTA Sports Products Ltd. | 3,460,000 | 15,789,551 | |||
| Huazhu Group Ltd. ADR | 208,258 | 6,568,457 | |||
| Tencent Holdings Ltd. | 312,900 | 12,550,789 | |||
| 50,531,520 | |||||
| Denmark — 2.4% | |||||
| Chr Hansen Holding A/S | 204,610 | 18,478,721 | |||
| DSV A/S | 96,419 | 7,379,519 | |||
| Novozymes A/S, B Shares | 142,690 | 6,646,680 | |||
| 32,504,920 | |||||
| Finland — 1.2% | |||||
| Neste Oyj | 205,780 | 16,099,664 | |||
| France — 9.1% | |||||
| Accor SA | 301,570 | 13,389,811 | |||
| Danone SA | 356,840 | 26,706,471 | |||
| Eurofins Scientific SE | 18,310 | 7,968,321 | |||
| Kering SA | 29,390 | 12,871,964 | |||
| Peugeot SA | 410,400 | 9,021,893 | |||
| Thales SA | 134,300 | 16,526,231 | |||
| TOTAL SA | 214,880 | 11,961,964 | |||
Ubisoft Entertainment SA(1) | 171,850 | 14,073,680 | |||
10
| Shares | Value | ||||
| Vivendi SA | 429,980 | $ | 10,734,422 | ||
| 123,254,757 | |||||
| Germany — 5.5% | |||||
| adidas AG | 76,050 | 16,773,741 | |||
| Aroundtown SA | 1,146,480 | 9,830,367 | |||
| Deutsche Boerse AG | 138,640 | 17,720,087 | |||
| HUGO BOSS AG | 69,600 | 4,804,979 | |||
| Symrise AG | 254,890 | 20,564,176 | |||
| Wirecard AG | 28,790 | 4,353,238 | |||
| 74,046,588 | |||||
| Hong Kong — 2.6% | |||||
| AIA Group Ltd. | 4,386,600 | 35,979,785 | |||
| India — 0.7% | |||||
| HDFC Bank Ltd. | 294,580 | 8,988,164 | |||
| Indonesia — 0.2% | |||||
| Bank Central Asia Tbk PT | 1,536,500 | 2,798,519 | |||
| Ireland — 2.4% | |||||
| CRH plc | 538,040 | 14,869,506 | |||
ICON plc(1) | 24,660 | 3,568,795 | |||
| Kerry Group plc, A Shares | 140,550 | 14,528,749 | |||
| 32,967,050 | |||||
| Japan — 16.8% | |||||
| Anritsu Corp. | 678,000 | 11,125,879 | |||
| CyberAgent, Inc. | 269,000 | 12,279,224 | |||
| Daikin Industries Ltd. | 75,700 | 8,417,601 | |||
| Don Quijote Holdings Co. Ltd. | 224,400 | 13,620,585 | |||
| Fast Retailing Co. Ltd. | 25,400 | 13,210,730 | |||
| Keyence Corp. | 35,300 | 19,155,882 | |||
| Komatsu Ltd. | 253,900 | 6,783,938 | |||
| MonotaRO Co. Ltd. | 507,000 | 13,748,632 | |||
| Obic Co. Ltd. | 98,300 | 8,502,124 | |||
| Recruit Holdings Co. Ltd. | 650,700 | 17,918,745 | |||
| Shiseido Co. Ltd. | 389,300 | 24,798,982 | |||
| Sony Corp. | 262,500 | 13,895,969 | |||
| Sysmex Corp. | 165,300 | 8,821,685 | |||
| TDK Corp. | 172,700 | 13,771,335 | |||
| Terumo Corp. | 284,100 | 16,730,903 | |||
| Unicharm Corp. | 345,300 | 10,817,208 | |||
| ZOZO, Inc. | 652,000 | 14,517,186 | |||
| 228,116,608 | |||||
| Netherlands — 4.6% | |||||
| Akzo Nobel NV | 87,780 | 7,399,134 | |||
| ASML Holding NV | 110,880 | 18,853,474 | |||
| Heineken NV | 123,835 | 11,335,231 | |||
InterXion Holding NV(1) | 276,670 | 17,228,241 | |||
QIAGEN NV(1) | 216,975 | 7,689,594 | |||
| 62,505,674 | |||||
11
| Shares | Value | ||||
| Russia — 0.7% | |||||
Yandex NV, A Shares(1) | 322,730 | $ | 9,520,535 | ||
| Spain — 3.1% | |||||
| Amadeus IT Group SA | 246,770 | 17,726,887 | |||
| CaixaBank SA | 2,879,350 | 11,896,759 | |||
| Cellnex Telecom SA | 468,210 | 13,009,635 | |||
| 42,633,281 | |||||
| Sweden — 6.6% | |||||
Epiroc AB, A Shares(1) | 1,063,163 | 8,725,116 | |||
| Hexagon AB, B Shares | 318,890 | 15,939,278 | |||
| Lundin Petroleum AB | 498,580 | 13,165,409 | |||
Spotify Technology SA(1) | 31,940 | 4,355,977 | |||
| Swedbank AB, A Shares | 723,260 | 16,821,343 | |||
| Swedish Match AB | 322,030 | 12,591,823 | |||
| Telefonaktiebolaget LM Ericsson, B Shares | 2,147,180 | 17,950,036 | |||
| 89,548,982 | |||||
| Switzerland — 4.9% | |||||
Lonza Group AG(1) | 114,850 | 37,242,270 | |||
| Novartis AG | 200,920 | 18,341,300 | |||
| Straumann Holding AG | 17,630 | 10,791,489 | |||
| 66,375,059 | |||||
| Taiwan — 0.8% | |||||
| Taiwan Semiconductor Manufacturing Co. Ltd. | 1,515,000 | 11,075,120 | |||
| United Kingdom — 21.2% | |||||
ASOS plc(1) | 115,986 | 7,359,577 | |||
| Associated British Foods plc | 470,573 | 14,545,547 | |||
| AstraZeneca plc | 465,820 | 36,411,517 | |||
| Aviva plc | 1,401,615 | 7,273,780 | |||
| B&M European Value Retail SA | 3,429,139 | 15,268,505 | |||
| Bunzl plc | 713,500 | 22,015,795 | |||
| Burberry Group plc | 289,140 | 6,550,778 | |||
Coca-Cola HBC AG(1) | 330,700 | 9,839,443 | |||
| Compass Group plc | 785,039 | 16,798,521 | |||
| Diageo plc | 886,860 | 31,951,383 | |||
| Intertek Group plc | 342,577 | 20,557,422 | |||
Just Eat plc(1) | 730,724 | 5,429,999 | |||
| London Stock Exchange Group plc | 532,110 | 27,361,601 | |||
| Melrose Industries plc | 2,630,970 | 5,958,140 | |||
| Reckitt Benckiser Group plc | 175,060 | 14,564,644 | |||
| Royal Dutch Shell plc, A Shares | 757,027 | 22,895,100 | |||
| Standard Chartered plc | 1,011,780 | 7,864,064 | |||
| Tesco plc | 5,990,890 | 15,109,639 | |||
| 287,755,455 | |||||
TOTAL INVESTMENT SECURITIES — 99.4% (Cost $1,226,602,604) | 1,348,963,235 | ||||
| OTHER ASSETS AND LIABILITIES — 0.6% | 8,582,560 | ||||
| TOTAL NET ASSETS — 100.0% | $ | 1,357,545,795 | |||
12
| MARKET SECTOR DIVERSIFICATION | ||
| (as a % of net assets) | ||
| Consumer Discretionary | 17.7 | % |
| Consumer Staples | 15.2 | % |
| Health Care | 13.2 | % |
| Financials | 12.7 | % |
| Information Technology | 11.4 | % |
| Industrials | 11.3 | % |
| Materials | 6.9 | % |
| Communication Services | 5.5 | % |
| Energy | 4.8 | % |
| Real Estate | 0.7 | % |
| Other Assets and Liabilities | 0.6 | % |
| NOTES TO SCHEDULE OF INVESTMENTS | ||
| ADR | - | American Depositary Receipt |
| (1) | Non-income producing. |
See Notes to Financial Statements.
13
| Statement of Assets and Liabilities |
| NOVEMBER 30, 2018 | |||
| Assets | |||
| Investment securities, at value (cost of $1,226,602,604) | $ | 1,348,963,235 | |
| Foreign currency holdings, at value (cost of $628,336) | 626,596 | ||
| Receivable for investments sold | 14,801,871 | ||
| Receivable for capital shares sold | 882,150 | ||
| Dividends and interest receivable | 2,944,503 | ||
| Other assets | 85,723 | ||
| 1,368,304,078 | |||
| Liabilities | |||
| Disbursements in excess of demand deposit cash | 2,317,060 | ||
| Payable for investments purchased | 6,113,021 | ||
| Payable for capital shares redeemed | 951,630 | ||
| Accrued management fees | 1,307,589 | ||
| Distribution and service fees payable | 18,454 | ||
| Accrued foreign taxes | 50,529 | ||
| 10,758,283 | |||
| Net Assets | $ | 1,357,545,795 | |
| Net Assets Consist of: | |||
| Capital (par value and paid-in surplus) | $ | 1,124,180,126 | |
| Distributable earnings | 233,365,669 | ||
| $ | 1,357,545,795 | ||
| Net Assets | Shares Outstanding | Net Asset Value Per Share | ||||
| Investor Class, $0.01 Par Value | $1,173,093,630 | 99,172,761 | $11.83 | |||
| I Class, $0.01 Par Value | $67,676,521 | 5,752,710 | $11.76 | |||
| Y Class, $0.01 Par Value | $6,176,861 | 524,429 | $11.78 | |||
| A Class, $0.01 Par Value | $64,784,186 | 5,439,269 | $11.91* | |||
| C Class, $0.01 Par Value | $4,268,386 | 371,514 | $11.49 | |||
| R Class, $0.01 Par Value | $3,225,695 | 268,443 | $12.02 | |||
| R5 Class, $0.01 Par Value | $5,440 | 462 | $11.77 | |||
| R6 Class, $0.01 Par Value | $38,315,076 | 3,255,157 | $11.77 | |||
See Notes to Financial Statements.
14
| Statement of Operations |
| YEAR ENDED NOVEMBER 30, 2018 | |||
| Investment Income (Loss) | |||
| Income: | |||
| Dividends (net of foreign taxes withheld of $2,444,000) | $ | 27,887,116 | |
| Interest | 203,954 | ||
| 28,091,070 | |||
| Expenses: | |||
| Management fees | 17,882,095 | ||
| Distribution and service fees: | |||
| A Class | 190,347 | ||
| C Class | 63,029 | ||
| R Class | 18,508 | ||
| Directors' fees and expenses | 43,673 | ||
| Other expenses | 87,311 | ||
| 18,284,963 | |||
| Net investment income (loss) | 9,806,107 | ||
| Realized and Unrealized Gain (Loss) | |||
| Net realized gain (loss) on: | |||
| Investment transactions (net of foreign tax expenses paid (refunded) of $(21,404)) | 109,839,904 | ||
| Foreign currency translation transactions | (209,242 | ) | |
| 109,630,662 | |||
| Change in net unrealized appreciation (depreciation) on: | |||
| Investments (includes (increase) decrease in accrued foreign taxes of $26,177) | (257,472,414 | ) | |
| Translation of assets and liabilities in foreign currencies | (90,680 | ) | |
| (257,563,094 | ) | ||
| Net realized and unrealized gain (loss) | (147,932,432 | ) | |
| Net Increase (Decrease) in Net Assets Resulting from Operations | $ | (138,126,325 | ) |
See Notes to Financial Statements.
15
| Statement of Changes in Net Assets |
| YEARS ENDED NOVEMBER 30, 2018 AND NOVEMBER 30, 2017 | ||||||
| Increase (Decrease) in Net Assets | November 30, 2018 | November 30, 2017 | ||||
| Operations | ||||||
| Net investment income (loss) | $ | 9,806,107 | $ | 12,286,535 | ||
| Net realized gain (loss) | 109,630,662 | 125,630,001 | ||||
| Change in net unrealized appreciation (depreciation) | (257,563,094 | ) | 280,030,676 | |||
| Net increase (decrease) in net assets resulting from operations | (138,126,325 | ) | 417,947,212 | |||
| Distributions to Shareholders | ||||||
| From earnings: | ||||||
| Investor Class | (76,415,742 | ) | (5,994,029 | ) | ||
| I Class | (5,107,583 | ) | (404,902 | ) | ||
| Y Class | (2,854 | ) | — | |||
| A Class | (4,086,063 | ) | (256,085 | ) | ||
| C Class | (324,175 | ) | — | |||
| R Class | (180,431 | ) | — | |||
| R5 Class | (350 | ) | — | |||
| R6 Class | (1,801,202 | ) | (317,212 | ) | ||
| Decrease in net assets from distributions | (87,918,400 | ) | (6,972,228 | ) | ||
| Capital Share Transactions | ||||||
| Net increase (decrease) in net assets from capital share transactions (Note 5) | 17,365,423 | (290,117,289 | ) | |||
| Redemption Fees | ||||||
| Increase in net assets from redemption fees | — | 15,070 | ||||
| Net increase (decrease) in net assets | (208,679,302 | ) | 120,872,765 | |||
| Net Assets | ||||||
| Beginning of period | 1,566,225,097 | 1,445,352,332 | ||||
| End of period | $ | 1,357,545,795 | $ | 1,566,225,097 | ||
See Notes to Financial Statements.
16
| Notes to Financial Statements |
NOVEMBER 30, 2018
1. Organization
American Century World Mutual Funds, Inc. (the corporation) is registered under the Investment Company Act of 1940, as amended (the 1940 Act), as an open-end management investment company and is organized as a Maryland corporation. International Growth Fund (the fund) is one fund in a series issued by the corporation. The fund's investment objective is to seek capital growth.
The fund offers the Investor Class, I Class, Y Class, A Class, C Class, R Class, R5 Class and R6 Class. The A Class may incur an initial sales charge. The A Class and C Class may be subject to a contingent deferred sales charge. Sale of the Y Class and R5 Class commenced on April 10, 2017.
2. Significant Accounting Policies
The following is a summary of significant accounting policies consistently followed by the fund in preparation of its financial statements. The fund is an investment company and follows accounting and reporting guidance in accordance with accounting principles generally accepted in the United States of America. This may require management to make certain estimates and assumptions at the date of the financial statements. Actual results could differ from these estimates. Management evaluated the impact of events or transactions occurring through the date the financial statements were issued that would merit recognition or disclosure.
Investment Valuations — The fund determines the fair value of its investments and computes its net asset value per share at the close of regular trading (usually 4 p.m. Eastern time) on the New York Stock Exchange (NYSE) on each day the NYSE is open. The Board of Directors has adopted valuation policies and procedures to guide the investment advisor in the fund’s investment valuation process and to provide methodologies for the oversight of the fund’s pricing function.
Equity securities that are listed or traded on a domestic securities exchange are valued at the last reported sales price or at the official closing price as provided by the exchange. Equity securities traded on foreign securities exchanges are generally valued at the closing price of such securities on the exchange where primarily traded or at the close of the NYSE, if that is earlier. If no last sales price is reported, or if local convention or regulation so provides, the mean of the latest bid and asked prices may be used. Securities traded over-the-counter are valued at the mean of the latest bid and asked prices, the last sales price, or the official closing price. Equity securities initially expressed in local currencies are translated into U.S. dollars at the mean of the appropriate currency exchange rate at the close of the NYSE as provided by an independent pricing service.
Open-end management investment companies are valued at the reported net asset value per share. Repurchase agreements are valued at cost, which approximates fair value.
If the fund determines that the market price for an investment is not readily available or the valuation methods mentioned above do not reflect an investment’s fair value, such investment is valued as determined in good faith by the Board of Directors or its delegate, in accordance with policies and procedures adopted by the Board of Directors. In its determination of fair value, the fund may review several factors including, but not limited to, market information regarding the specific investment or comparable investments and correlation with other investment types, futures indices or general market indicators. Circumstances that may cause the fund to use these procedures to value an investment include, but are not limited to: an investment has been declared in default or is distressed; trading in a security has been suspended during the trading day or a security is not actively trading on its principal exchange; prices received from a regular pricing source are deemed unreliable; or there is a foreign market holiday and no trading occurred.
17
The fund monitors for significant events occurring after the close of an investment’s primary exchange but before the fund’s net asset value per share is determined. Significant events may include, but are not limited to: corporate announcements and transactions; governmental action and political unrest that could impact a specific investment or an investment sector; or armed conflicts, natural disasters and similar events that could affect investments in a specific country or region. The fund also monitors for significant fluctuations between domestic and foreign markets, as evidenced by the U.S. market or such other indicators that the Board of Directors, or its delegate, deems appropriate. If significant fluctuations in foreign markets are identified, the fund may apply a model-derived factor to the closing price of equity securities traded on foreign securities exchanges. The factor is based on observable market data as provided by an independent pricing service.
Security Transactions — Security transactions are accounted for as of the trade date. Net realized gains and losses are determined on the identified cost basis, which is also used for federal income tax purposes. Certain countries impose taxes on realized gains on the sale of securities registered in their country. The fund records the foreign tax expense, if any, on an accrual basis. The foreign tax expense on realized gains and unrealized appreciation reduces the net realized gain (loss) on investment transactions and net unrealized appreciation (depreciation) on investments, respectively.
Investment Income — Dividend income less foreign taxes withheld, if any, is recorded as of the ex-dividend date. Distributions received on securities that represent a return of capital or long-term capital gain are recorded as a reduction of cost of investments and/or as a realized gain. The fund may estimate the components of distributions received that may be considered nontaxable distributions or long-term capital gain distributions for income tax purposes. Interest income is recorded on the accrual basis and includes accretion of discounts and amortization of premiums.
Foreign Currency Translations — All assets and liabilities initially expressed in foreign currencies are translated into U.S. dollars at prevailing exchange rates at period end. The fund may enter into spot foreign currency exchange contracts to facilitate transactions denominated in a foreign currency. Purchases and sales of investment securities, dividend and interest income, spot foreign currency exchange contracts, and expenses are translated at the rates of exchange prevailing on the respective dates of such transactions. Net realized and unrealized foreign currency exchange gains or losses related to investment securities are a component of net realized gain (loss) on investment transactions and change in net unrealized appreciation (depreciation) on investments, respectively.
Repurchase Agreements — The fund may enter into repurchase agreements with institutions that American Century Investment Management, Inc. (ACIM) (the investment advisor) has determined are creditworthy pursuant to criteria adopted by the Board of Directors. The fund requires that the collateral, represented by securities, received in a repurchase transaction be transferred to the custodian in a manner sufficient to enable the fund to obtain those securities in the event of a default under the repurchase agreement. ACIM monitors, on a daily basis, the securities transferred to ensure the value, including accrued interest, of the securities under each repurchase agreement is equal to or greater than amounts owed to the fund under each repurchase agreement.
Joint Trading Account — Pursuant to an Exemptive Order issued by the Securities and Exchange Commission, the fund, along with certain other funds in the American Century Investments family of funds, may transfer uninvested cash balances into a joint trading account. These balances are invested in one or more repurchase agreements that are collateralized by U.S. Treasury or Agency obligations.
Income Tax Status — It is the fund’s policy to distribute substantially all net investment income and net realized gains to shareholders and to otherwise qualify as a regulated investment company under provisions of the Internal Revenue Code. Accordingly, no provision has been made for income taxes. The fund files U.S. federal, state, local and non-U.S. tax returns as applicable. The fund's tax returns are subject to examination by the relevant taxing authority until expiration of the applicable statute of limitations, which is generally three years from the date of filing but can be longer in certain jurisdictions. At this time, management believes there are no uncertain tax positions which, based on their technical merit, would not be sustained upon examination and for which it is reasonably possible that the total amounts of unrecognized tax benefits will significantly change in the next twelve months.
Multiple Class — All shares of the fund represent an equal pro rata interest in the net assets of the class to which such shares belong, and have identical voting, dividend, liquidation and other rights and the same terms and conditions, except for class specific expenses and exclusive rights to vote on matters affecting only individual classes. Income, non-class specific expenses, and realized and unrealized capital gains and losses of the fund are allocated to each class of shares based on their relative net assets.
18
Distributions to Shareholders — Distributions from net investment income and net realized gains, if any, are generally declared and paid annually. The fund may make distributions on a more frequent basis to comply with the distribution requirements of the Internal Revenue Code, in all events in a manner consistent with provisions of the 1940 Act.
Redemption Fees — Prior to October 9, 2017, the fund may have imposed a 2.00% redemption fee on shares held less than 60 days. The fee was not applicable to all classes. The redemption fee was retained by the fund to help cover transaction costs that long-term investors may bear when the fund sells securities to meet investor redemptions.
Indemnifications — Under the corporation’s organizational documents, its officers and directors are indemnified against certain liabilities arising out of the performance of their duties to the fund. In addition, in the normal course of business, the fund enters into contracts that provide general indemnifications. The maximum exposure under these arrangements is unknown as this would involve future claims that may be made against a fund. The risk of material loss from such claims is considered by management to be remote.
3. Fees and Transactions with Related Parties
Certain officers and directors of the corporation are also officers and/or directors of American Century Companies, Inc. (ACC). The corporation’s investment advisor, ACIM, the corporation's distributor, American Century Investment Services, Inc. (ACIS), and the corporation’s transfer agent, American Century Services, LLC, are wholly owned, directly or indirectly, by ACC. Various funds issued by American Century Asset Allocation Portfolios, Inc. own, in aggregate, 22% of the shares of the fund.
Management Fees — The corporation has entered into a management agreement with ACIM, under which ACIM provides the fund with investment advisory and management services in exchange for a single, unified management fee (the fee) per class. The agreement provides that all expenses of managing and operating the fund, except distribution and service fees, brokerage expenses, taxes, interest, fees and expenses of the independent directors (including legal counsel fees), and extraordinary expenses, will be paid by ACIM. The fee is computed and accrued daily based on each class's daily net assets and paid monthly in arrears. The difference in the fee among the classes is a result of their separate arrangements for non-Rule 12b-1 shareholder services. It is not the result of any difference in advisory or custodial fees or other expenses related to the management of the fund’s assets, which do not vary by class. The rate of the fee is determined by applying a fee rate calculation formula. This formula takes into account the fund’s assets as well as certain assets, if any, of other clients of the investment advisor outside the American Century Investments family of funds (such as subadvised funds and separate accounts) that use very similar investment teams and strategies (strategy assets). The strategy assets of the fund also include the assets of NT International Growth Fund, one fund in a series issued by the corporation.
The management fee schedule range and the effective annual management fee for each class for the period ended November 30, 2018 are as follows:
Management Fee Schedule Range | Effective Annual Management Fee | |
| Investor Class | 1.050% to 1.500% | 1.16% |
| I Class | 0.850% to 1.300% | 0.96% |
| Y Class | 0.700% to 1.150% | 0.81% |
| A Class | 1.050% to 1.500% | 1.16% |
| C Class | 1.050% to 1.500% | 1.16% |
| R Class | 1.050% to 1.500% | 1.16% |
| R5 Class | 0.850% to 1.300% | 0.96% |
| R6 Class | 0.700% to 1.150% | 0.81% |
19
Distribution and Service Fees — The Board of Directors has adopted a separate Master Distribution and Individual Shareholder Services Plan for each of the A Class, C Class and R Class (collectively the plans), pursuant to Rule 12b-1 of the 1940 Act. The plans provide that the A Class will pay ACIS an annual distribution and service fee of 0.25%. The plans provide that the C Class will pay ACIS an annual distribution and service fee of 1.00%, of which 0.25% is paid for individual shareholder services and 0.75% is paid for distribution services. The plans provide that the R Class will pay ACIS an annual distribution and service fee of 0.50%. The fees are computed and accrued daily based on each class’s daily net assets and paid monthly in arrears. The fees are used to pay financial intermediaries for distribution and individual shareholder services. Fees incurred under the plans during the period ended November 30, 2018 are detailed in the Statement of Operations.
Directors' Fees and Expenses — The Board of Directors is responsible for overseeing the investment advisor’s management and operations of the fund. The directors receive detailed information about the fund and its investment advisor regularly throughout the year, and meet at least quarterly with management of the investment advisor to review reports about fund operations. The fund’s officers do not receive compensation from the fund.
Interfund Transactions — The fund may enter into security transactions with other American Century Investments funds and other client accounts of the investment advisor, in accordance with the 1940 Act rules and procedures adopted by the Board of Directors. The rules and procedures require, among other things, that these transactions be effected at the independent current market price of the security. During the period, the interfund purchases and sales were $3,789,681 and $1,354,977, respectively. The effect of interfund transactions on the Statement of Operations was $(189,371) in net realized gain (loss) on investment transactions.
4. Investment Transactions
Purchases and sales of investment securities, excluding short-term investments, for the period ended November 30, 2018 were $1,061,187,285 and $1,123,527,742, respectively.
20
5. Capital Share Transactions
Transactions in shares of the fund were as follows:
| Year ended November 30, 2018 | Year ended November 30, 2017(1) | |||||||||
| Shares | Amount | Shares | Amount | |||||||
| Investor Class/Shares Authorized | 1,150,000,000 | 900,000,000 | ||||||||
| Sold | 6,514,994 | $ | 87,319,961 | 9,241,163 | $ | 110,317,323 | ||||
| Issued in reinvestment of distributions | 5,636,081 | 74,377,220 | 552,236 | 5,837,134 | ||||||
| Redeemed | (11,335,729 | ) | (151,348,295 | ) | (27,819,284 | ) | (341,059,230 | ) | ||
| 815,346 | 10,348,886 | (18,025,885 | ) | (224,904,773 | ) | |||||
| I Class/Shares Authorized | 80,000,000 | 80,000,000 | ||||||||
| Sold | 2,352,108 | 31,525,036 | 7,040,337 | 84,877,441 | ||||||
| Issued in reinvestment of distributions | 375,314 | 4,920,195 | 38,562 | 404,902 | ||||||
| Redeemed | (3,575,764 | ) | (46,693,872 | ) | (6,112,035 | ) | (76,557,575 | ) | ||
| (848,342 | ) | (10,248,641 | ) | 966,864 | 8,724,768 | |||||
| Y Class/Shares Authorized | 25,000,000 | 50,000,000 | ||||||||
| Sold | 684,641 | 8,989,207 | 436 | 5,000 | ||||||
| Issued in reinvestment of distributions | 211 | 2,854 | — | — | ||||||
| Redeemed | (160,859 | ) | (1,974,982 | ) | — | — | ||||
| 523,993 | 7,017,079 | 436 | 5,000 | |||||||
| A Class/Shares Authorized | 70,000,000 | 70,000,000 | ||||||||
| Sold | 1,051,613 | 14,187,925 | 853,399 | 10,384,738 | ||||||
| Issued in reinvestment of distributions | 301,770 | 4,018,061 | 23,420 | 249,663 | ||||||
| Redeemed | (1,531,409 | ) | (20,651,991 | ) | (5,500,584 | ) | (64,648,352 | ) | ||
| (178,026 | ) | (2,446,005 | ) | (4,623,765 | ) | (54,013,951 | ) | |||
| C Class/Shares Authorized | 30,000,000 | 30,000,000 | ||||||||
| Sold | 121,747 | 1,629,831 | 100,907 | 1,269,287 | ||||||
| Issued in reinvestment of distributions | 23,686 | 306,426 | — | — | ||||||
| Redeemed | (276,249 | ) | (3,605,194 | ) | (251,483 | ) | (2,905,747 | ) | ||
| (130,816 | ) | (1,668,937 | ) | (150,576 | ) | (1,636,460 | ) | |||
| R Class/Shares Authorized | 30,000,000 | 30,000,000 | ||||||||
| Sold | 67,863 | 926,078 | 102,324 | 1,268,493 | ||||||
| Issued in reinvestment of distributions | 12,462 | 167,835 | — | — | ||||||
| Redeemed | (69,684 | ) | (948,193 | ) | (132,853 | ) | (1,636,095 | ) | ||
| 10,641 | 145,720 | (30,529 | ) | (367,602 | ) | |||||
| R5 Class/Shares Authorized | 20,000,000 | 50,000,000 | ||||||||
| Sold | — | — | 436 | 5,000 | ||||||
| Issued in reinvestment of distributions | 26 | 350 | — | — | ||||||
| 26 | 350 | 436 | 5,000 | |||||||
| R6 Class/Shares Authorized | 40,000,000 | 50,000,000 | ||||||||
| Sold | 2,069,352 | 27,346,479 | 1,263,843 | 16,186,454 | ||||||
| Issued in reinvestment of distributions | 137,501 | 1,801,202 | 30,211 | 317,212 | ||||||
| Redeemed | (1,122,461 | ) | (14,930,710 | ) | (2,723,909 | ) | (34,432,937 | ) | ||
| 1,084,392 | 14,216,971 | (1,429,855 | ) | (17,929,271 | ) | |||||
| Net increase (decrease) | 1,277,214 | $ | 17,365,423 | (23,292,874 | ) | $ | (290,117,289 | ) | ||
| (1) | April 10, 2017 (commencement of sale) through November 30, 2017 for the Y Class and R5 Class. |
21
6. Fair Value Measurements
The fund’s investments valuation process is based on several considerations and may use multiple inputs to determine the fair value of the investments held by the fund. In conformity with accounting principles generally accepted in the United States of America, the inputs used to determine a valuation are classified into three broad levels.
| • | Level 1 valuation inputs consist of unadjusted quoted prices in an active market for identical investments. |
| • | Level 2 valuation inputs consist of direct or indirect observable market data (including quoted prices for comparable investments, evaluations of subsequent market events, interest rates, prepayment speeds, credit risk, etc.). These inputs also consist of quoted prices for identical investments initially expressed in local currencies that are adjusted through translation into U.S. dollars. |
| • | Level 3 valuation inputs consist of unobservable data (including a fund’s own assumptions). |
The level classification is based on the lowest level input that is significant to the fair valuation measurement. The valuation inputs are not necessarily an indication of the risks associated with investing in these securities or other financial instruments.
The following is a summary of the level classifications as of period end. The Schedule of Investments provides additional information on the fund’s portfolio holdings.
| Level 1 | Level 2 | Level 3 | ||||||
| Assets | ||||||||
| Investment Securities | ||||||||
| Common Stocks | ||||||||
| Canada | $ | 16,066,342 | $ | 18,601,918 | — | |||
| China | 22,191,180 | 28,340,340 | — | |||||
| Ireland | 3,568,795 | 29,398,255 | — | |||||
| Netherlands | 24,917,835 | 37,587,839 | — | |||||
| Russia | 9,520,535 | — | — | |||||
| Sweden | 4,355,977 | 85,193,005 | — | |||||
| Other Countries | — | 1,069,221,214 | — | |||||
| $ | 80,620,664 | $ | 1,268,342,571 | — | ||||
The fund may hold financial instruments at their inherent carrying value for financial statement purposes, which approximates fair value. As of period end, the fund’s disbursements in excess of demand deposit cash were classified as Level 2.
7. Risk Factors
There are certain risks involved in investing in foreign securities. These risks include those resulting from future adverse political, social and economic developments, fluctuations in currency exchange rates, the possible imposition of exchange controls, and other foreign laws or restrictions. Investing in emerging markets may accentuate these risks.
22
8. Federal Tax Information
On December 18, 2018, the fund declared and paid a per-share distribution from net realized gains to shareholders of record on December 17, 2018 of $1.0684 for the Investor Class, I Class, Y Class, A Class, C Class, R Class, R5 Class and R6 Class.
On December 18, 2018, the fund declared and paid the following per-share distributions from net investment income to shareholders of record on December 17, 2018:
| Investor Class | I Class | Y Class | A Class | C Class | R Class | R5 Class | R6 Class |
| $0.1230 | $0.1454 | $0.1622 | $0.0950 | $0.0110 | $0.0670 | $0.1454 | $0.1622 |
The tax character of distributions paid during the years ended November 30, 2018 and November 30, 2017 were as follows:
| 2018 | 2017 | |||||
| Distributions Paid From | ||||||
| Ordinary income | $ | 14,923,298 | $ | 6,972,228 | ||
| Long-term capital gains | $ | 72,995,102 | — | |||
The book-basis character of distributions made during the year from net investment income or net realized gains may differ from their ultimate characterization for federal income tax purposes. These differences reflect the differing character of certain income items and net realized gains and losses for financial statement and tax purposes, and may result in reclassification among certain capital accounts on the financial statements.
As of period end, the federal tax cost of investments and the components of distributable earnings on a tax-basis were as follows:
| Federal tax cost of investments | $ | 1,228,059,323 | |
| Gross tax appreciation of investments | $ | 187,664,669 | |
| Gross tax depreciation of investments | (66,760,757 | ) | |
| Net tax appreciation (depreciation) of investments | 120,903,912 | ||
| Net tax appreciation (depreciation) on translation of assets and liabilities in foreign currencies | (101,779 | ) | |
| Net tax appreciation (depreciation) | $ | 120,802,133 | |
| Undistributed ordinary income | $ | 9,752,908 | |
| Accumulated long-term gains | $ | 118,242,571 | |
| Post-October capital loss deferral | $ | (15,431,943 | ) |
The difference between book-basis and tax-basis unrealized appreciation (depreciation) is attributable primarily to the tax deferral of losses on wash sales.
Loss deferrals represent certain qualified losses that the fund has elected to treat as having been incurred in the following fiscal year for federal income tax purposes.
23
| Financial Highlights |
| For a Share Outstanding Throughout the Years Ended November 30 (except as noted) | |||||||||||||||
| Per-Share Data | Ratios and Supplemental Data | ||||||||||||||
| Income From Investment Operations: | Distributions From: | Ratio to Average Net Assets of: | |||||||||||||
Net Asset Value, Beginning of Period | Net Investment Income (Loss)(1) | Net Realized and Unrealized Gain (Loss) | Total From Investment Operations | Net Investment Income | Net Realized Gains | Total Distributions | Net Asset Value, End of Period | Total Return(2) | Operating Expenses | Net Investment Income (Loss) | Portfolio Turnover Rate | Net Assets, End of Period (in thousands) | |||
| Investor Class | |||||||||||||||
| 2018 | $13.80 | 0.08 | (1.28) | (1.20) | (0.13) | (0.64) | (0.77) | $11.83 | (9.23)% | 1.17% | 0.62% | 69% | $1,173,094 | ||
| 2017 | $10.56 | 0.10 | 3.19 | 3.29 | (0.05) | — | (0.05) | $13.80 | 31.32% | 1.17% | 0.80% | 57% | $1,357,353 | ||
| 2016 | $12.25 | 0.09 | (1.10) | (1.01) | (0.06) | (0.62) | (0.68) | $10.56 | (8.59)% | 1.18% | 0.83% | 70% | $1,229,531 | ||
| 2015 | $13.40 | 0.07 | (0.34) | (0.27) | (0.08) | (0.80) | (0.88) | $12.25 | (1.86)% | 1.17% | 0.62% | 62% | $1,432,784 | ||
| 2014 | $13.78 | 0.10 | —(3) | 0.10 | (0.20) | (0.28) | (0.48) | $13.40 | 0.80% | 1.18% | 0.74% | 75% | $1,521,655 | ||
| I Class | |||||||||||||||
| 2018 | $13.74 | 0.10 | (1.28) | (1.18) | (0.16) | (0.64) | (0.80) | $11.76 | (9.12)% | 0.97% | 0.82% | 69% | $67,677 | ||
| 2017 | $10.51 | 0.13 | 3.17 | 3.30 | (0.07) | — | (0.07) | $13.74 | 31.64% | 0.97% | 1.00% | 57% | $90,679 | ||
| 2016 | $12.19 | 0.11 | (1.09) | (0.98) | (0.08) | (0.62) | (0.70) | $10.51 | (8.40)% | 0.98% | 1.03% | 70% | $59,236 | ||
| 2015 | $13.33 | 0.10 | (0.34) | (0.24) | (0.10) | (0.80) | (0.90) | $12.19 | (1.63)% | 0.97% | 0.82% | 62% | $70,422 | ||
| 2014 | $13.73 | 0.14 | (0.03) | 0.11 | (0.23) | (0.28) | (0.51) | $13.33 | 0.91% | 0.98% | 0.94% | 75% | $138,527 | ||
| Y Class | |||||||||||||||
| 2018 | $13.75 | 0.15 | (1.30) | (1.15) | (0.18) | (0.64) | (0.82) | $11.78 | (8.95)% | 0.82% | 0.97% | 69% | $6,177 | ||
2017(4) | $11.48 | 0.09 | 2.18 | 2.27 | — | — | — | $13.75 | 19.77% | 0.82%(5) | 1.14%(5) | 57%(6) | $6 | ||
| For a Share Outstanding Throughout the Years Ended November 30 (except as noted) | |||||||||||||||
| Per-Share Data | Ratios and Supplemental Data | ||||||||||||||
| Income From Investment Operations: | Distributions From: | Ratio to Average Net Assets of: | |||||||||||||
Net Asset Value, Beginning of Period | Net Investment Income (Loss)(1) | Net Realized and Unrealized Gain (Loss) | Total From Investment Operations | Net Investment Income | Net Realized Gains | Total Distributions | Net Asset Value, End of Period | Total Return(2) | Operating Expenses | Net Investment Income (Loss) | Portfolio Turnover Rate | Net Assets, End of Period (in thousands) | |||
| A Class | |||||||||||||||
| 2018 | $13.88 | 0.05 | (1.29) | (1.24) | (0.09) | (0.64) | (0.73) | $11.91 | (9.45)% | 1.42% | 0.37% | 69% | $64,784 | ||
| 2017 | $10.63 | 0.06 | 3.22 | 3.28 | (0.03) | — | (0.03) | $13.88 | 30.88% | 1.42% | 0.55% | 57% | $77,983 | ||
| 2016 | $12.32 | 0.06 | (1.09) | (1.03) | (0.04) | (0.62) | (0.66) | $10.63 | (8.73)% | 1.43% | 0.58% | 70% | $108,847 | ||
| 2015 | $13.48 | 0.07 | (0.37) | (0.30) | (0.06) | (0.80) | (0.86) | $12.32 | (2.13)% | 1.42% | 0.37% | 62% | $141,175 | ||
| 2014 | $13.86 | 0.07 | (0.01) | 0.06 | (0.16) | (0.28) | (0.44) | $13.48 | 0.49% | 1.43% | 0.49% | 75% | $301,164 | ||
| C Class | |||||||||||||||
| 2018 | $13.42 | (0.04) | (1.25) | (1.29) | — | (0.64) | (0.64) | $11.49 | (10.12)% | 2.17% | (0.38)% | 69% | $4,268 | ||
| 2017 | $10.33 | (0.03) | 3.12 | 3.09 | — | — | — | $13.42 | 29.91% | 2.17% | (0.20)% | 57% | $6,743 | ||
| 2016 | $12.04 | (0.02) | (1.07) | (1.09) | — | (0.62) | (0.62) | $10.33 | (9.43)% | 2.18% | (0.17)% | 70% | $6,743 | ||
| 2015 | $13.22 | (0.05) | (0.33) | (0.38) | — | (0.80) | (0.80) | $12.04 | (2.81)% | 2.17% | (0.38)% | 62% | $10,402 | ||
| 2014 | $13.58 | (0.03) | (0.02) | (0.05) | (0.03) | (0.28) | (0.31) | $13.22 | (0.29)% | 2.18% | (0.26)% | 75% | $10,129 | ||
| R Class | |||||||||||||||
| 2018 | $14.00 | 0.02 | (1.30) | (1.28) | (0.06) | (0.64) | (0.70) | $12.02 | (9.68)% | 1.67% | 0.12% | 69% | $3,226 | ||
| 2017 | $10.72 | 0.03 | 3.25 | 3.28 | — | — | — | $14.00 | 30.60% | 1.67% | 0.30% | 57% | $3,609 | ||
| 2016 | $12.43 | 0.04 | (1.12) | (1.08) | (0.01) | (0.62) | (0.63) | $10.72 | (9.00)% | 1.68% | 0.33% | 70% | $3,090 | ||
| 2015 | $13.59 | 0.02 | (0.35) | (0.33) | (0.03) | (0.80) | (0.83) | $12.43 | (2.31)% | 1.67% | 0.12% | 62% | $3,313 | ||
| 2014 | $13.96 | 0.03 | (0.01) | 0.02 | (0.11) | (0.28) | (0.39) | $13.59 | 0.25% | 1.68% | 0.24% | 75% | $2,195 | ||
| For a Share Outstanding Throughout the Years Ended November 30 (except as noted) | |||||||||||||||
| Per-Share Data | Ratios and Supplemental Data | ||||||||||||||
| Income From Investment Operations: | Distributions From: | Ratio to Average Net Assets of: | |||||||||||||
Net Asset Value, Beginning of Period | Net Investment Income (Loss)(1) | Net Realized and Unrealized Gain (Loss) | Total From Investment Operations | Net Investment Income | Net Realized Gains | Total Distributions | Net Asset Value, End of Period | Total Return(2) | Operating Expenses | Net Investment Income (Loss) | Portfolio Turnover Rate | Net Assets, End of Period (in thousands) | |||
| R5 Class | |||||||||||||||
| 2018 | $13.73 | 0.11 | (1.27) | (1.16) | (0.16) | (0.64) | (0.80) | $11.77 | (9.03)% | 0.97% | 0.82% | 69% | $5 | ||
2017(4) | $11.48 | 0.08 | 2.17 | 2.25 | — | — | — | $13.73 | 19.60% | 0.97%(5) | 0.99%(5) | 57%(6) | $6 | ||
| R6 Class | |||||||||||||||
| 2018 | $13.75 | 0.14 | (1.29) | (1.15) | (0.19) | (0.64) | (0.83) | $11.77 | (8.93)% | 0.82% | 0.97% | 69% | $38,315 | ||
| 2017 | $10.53 | 0.15 | 3.16 | 3.31 | (0.09) | — | (0.09) | $13.75 | 31.68% | 0.82% | 1.15% | 57% | $29,846 | ||
| 2016 | $12.20 | 0.14 | (1.10) | (0.96) | (0.09) | (0.62) | (0.71) | $10.53 | (8.19)% | 0.83% | 1.18% | 70% | $37,903 | ||
| 2015 | $13.34 | 0.11 | (0.33) | (0.22) | (0.12) | (0.80) | (0.92) | $12.20 | (1.50)% | 0.82% | 0.97% | 62% | $48,887 | ||
| 2014 | $13.74 | 0.13 | —(3) | 0.13 | (0.25) | (0.28) | (0.53) | $13.34 | 1.10% | 0.83% | 1.09% | 75% | $8,411 | ||
| Notes to Financial Highlights | |
| (1) | Computed using average shares outstanding throughout the period. |
| (2) | Total returns are calculated based on the net asset value of the last business day and do not reflect applicable sales charges, if any. Total returns for periods less than one year are not annualized. |
| (3) | Per-share amount was less than $0.005. |
| (4) | April 10, 2017 (commencement of sale) through November 30, 2017. |
| (5) | Annualized. |
| (6) | Portfolio turnover is calculated at the fund level. Percentage indicated was calculated for the year ended November 30, 2017. |
See Notes to Financial Statements.
| Report of Independent Registered Public Accounting Firm |
To the Shareholders and the Board of Directors of American Century World Mutual Funds, Inc.:
Opinion on the Financial Statements and Financial Highlights
We have audited the accompanying statement of assets and liabilities, including the schedule of investments, of International Growth Fund, one of the funds constituting the American Century World Mutual Funds, Inc. (the “Fund”), as of November 30, 2018, the related statement of operations for the year then ended, the statements of changes in net assets for each of the two years in the period then ended, the financial highlights for each of the five years in the period then ended, and the related notes. In our opinion, the financial statements and financial highlights present fairly, in all material respects, the financial position of International Growth Fund of the American Century World Mutual Funds, Inc. as of November 30, 2018, the results of its operations for the year then ended, the changes in its net assets for each of the two years in the period then ended, and the financial highlights for each of the five years in the period then ended, in conformity with accounting principles generally accepted in the United States of America.
Basis for Opinion
These financial statements and financial highlights are the responsibility of the Fund's management. Our responsibility is to express an opinion on the Fund’s financial statements and financial highlights based on our audits. We are a public accounting firm registered with the Public Company Accounting Oversight Board (United States) (PCAOB) and are required to be independent with respect to the Fund in accordance with the U.S. federal securities laws and the applicable rules and regulations of the Securities and Exchange Commission and the PCAOB.
We conducted our audits in accordance with the standards of the PCAOB. Those standards require that we plan and perform the audit to obtain reasonable assurance about whether the financial statements and financial highlights are free of material misstatement, whether due to error or fraud. The Fund is not required to have, nor were we engaged to perform, an audit of its internal control over financial reporting. As part of our audits we are required to obtain an understanding of internal control over financial reporting but not for the purpose of expressing an opinion on the effectiveness of the Fund’s internal control over financial reporting. Accordingly, we express no such opinion.
Our audits included performing procedures to assess the risks of material misstatement of the financial statements and financial highlights, whether due to error or fraud, and performing procedures that respond to those risks. Such procedures included examining, on a test basis, evidence regarding the amounts and disclosures in the financial statements and financial highlights. Our audits also included evaluating the accounting principles used and significant estimates made by management, as well as evaluating the overall presentation of the financial statements and financial highlights. Our procedures included confirmation of securities owned as of November 30, 2018, by correspondence with the custodian and brokers; when replies were not received from brokers, we performed other auditing procedures. We believe that our audits provide a reasonable basis for our opinion.
DELOITTE & TOUCHE LLP
Kansas City, Missouri
January 17, 2019
We have served as the auditor of one or more American Century investment companies since 1997.
27
| Management |
The Board of Directors
The individuals listed below serve as directors of the funds. Each director will continue to serve in this capacity until death, retirement, resignation or removal from office. The board has adopted a mandatory retirement age for directors who are not “interested persons,” as that term is defined in the Investment Company Act (independent directors). Independent directors shall retire by December 31 of the year in which they reach their 75th birthday.
Mr. Thomas is an “interested person” because he currently serves as President and Chief Executive Officer of American Century Companies, Inc. (ACC), the parent company of American Century Investment Management, Inc. (ACIM or the advisor). The other directors (more than three-fourths of the total number) are independent. They are not employees, directors or officers of, and have no financial interest in, ACC or any of its wholly owned, direct or indirect, subsidiaries, including ACIM, American Century Investment Services, Inc. (ACIS) and American Century Services, LLC (ACS), and they do not have any other affiliations, positions or relationships that would cause them to be considered “interested persons” under the Investment Company Act. The directors serve in this capacity for seven (in the case of Jonathan S. Thomas, 16; and Stephen E. Yates, 8) registered investment companies in the American Century Investments family of funds.
The following table presents additional information about the directors. The mailing address for each director is 4500 Main Street, Kansas City, Missouri 64111.
| Name (Year of Birth) | Position(s) Held with Funds | Length of Time Served | Principal Occupation(s) During Past 5 Years | Number of American Century Portfolios Overseen by Director | Other Directorships Held During Past 5 Years |
| Independent Directors | |||||
| Thomas W. Bunn (1953) | Director | Since 2017 | Retired | 68 | SquareTwo Financial; Barings (formerly Babson Capital Funds Trust) (2013 to 2016) |
| Barry Fink (1955) | Director | Since 2012 (independent since 2016) | Retired; Executive Vice President, ACC (2007 to 2013); President, ACS (2007 to 2013) | 68 | None |
| Jan M. Lewis (1957) | Director | Since 2011 | Retired; President and Chief Executive Officer, Catholic Charities of Northeast Kansas (human services organization) (2006 to 2013) | 68 | None |
M. Jeannine Strandjord(1) (1945) | Director | Since 1994 | Self-employed Consultant | 68 | Euronet Worldwide Inc. and MGP Ingredients, Inc. |
28
| Name (Year of Birth) | Position(s) Held with Funds | Length of Time Served | Principal Occupation(s) During Past 5 Years | Number of American Century Portfolios Overseen by Director | Other Directorships Held During Past 5 Years |
| Independent Directors | |||||
| John R. Whitten (1946) | Director | Since 2008 | Retired | 68 | Rudolph Technologies, Inc. |
| Stephen E. Yates (1948) | Director and Chairman of the Board | Since 2012 (Chairman since 2018) | Retired | 73 | None |
| Interested Director | |||||
| Jonathan S. Thomas (1963) | Director and President | Since 2007 | President and Chief Executive Officer, ACC (2007 to present). Also serves as Chief Executive Officer, ACS; Executive Vice President, ACIM; Director, ACC, ACIM and other ACC subsidiaries | 118 | BioMed Valley Discoveries, Inc. |
(1) Effective December 31, 2018, M. Jeannine Strandjord retired from the Board of Directors.
The Statement of Additional Information has additional information about the fund's directors and is available without charge, upon request, by calling 1-800-345-2021.
29
Officers
The following table presents certain information about the executive officers of the funds. Each officer serves as an officer for each of the 16 (in the case of Robert J. Leach, 15) investment companies in the American Century family of funds. No officer is compensated for his or her service as an officer of the funds. The listed officers are interested persons of the funds and are appointed or re-appointed on an annual basis. The mailing address for each officer listed below is 4500 Main Street, Kansas City, Missouri 64111.
| Name (Year of Birth) | Offices with the Funds | Principal Occupation(s) During the Past Five Years |
| Jonathan S. Thomas (1963) | Director and President since 2007 | President and Chief Executive Officer, ACC (2007 to present). Also serves as Chief Executive Officer, ACS; Executive Vice President, ACIM; Director, ACC, ACIM and other ACC subsidiaries |
| R. Wes Campbell (1974) | Chief Financial Officer and Treasurer since 2018 | Investment Operations and Investment Accounting, ACS (2000 to present) |
| Amy D. Shelton (1964) | Chief Compliance Officer and Vice President since 2014 | Chief Compliance Officer, American Century funds, (2014 to present); Chief Compliance Officer, ACIM (2014 to present); Chief Compliance Officer, ACIS (2009 to present); Vice President, Client Interactions and Marketing, ACIS (2013 to 2014). Also serves as Vice President, ACIS |
| Charles A. Etherington (1957) | General Counsel since 2007 and Senior Vice President since 2006 | Attorney, ACC (1994 to present); Vice President, ACC (2005 to present); General Counsel, ACC (2007 to present). Also serves as General Counsel, ACIM, ACS, ACIS and other ACC subsidiaries; and Senior Vice President, ACIM and ACS |
| C. Jean Wade (1964) | Vice President since 2012 | Senior Vice President, ACS (2017 to present); Vice President, ACS (2000 to 2017) |
| Robert J. Leach (1966) | Vice President since 2006 | Vice President, ACS (2000 to present) |
| David H. Reinmiller (1963) | Vice President since 2000 | Attorney, ACC (1994 to present). Also serves as Vice President, ACIM and ACS |
| Ward D. Stauffer (1960) | Secretary since 2005 | Attorney, ACC (2003 to present) |
30
| Approval of Management Agreement |
At a meeting held on June 28, 2018, the Fund’s Board of Directors (the "Board") unanimously approved the renewal of the management agreement pursuant to which American Century Investment Management, Inc. (the “Advisor”) acts as the investment advisor for the Fund. Under Section 15(c) of the Investment Company Act, contracts for investment advisory services are required to be reviewed, evaluated, and approved by a majority of a fund’s directors (the “Directors”), including a majority of the independent Directors, each year.
Prior to its consideration of the renewal of the management agreement, the Directors requested and reviewed extensive data and information compiled by the Advisor and certain independent providers of evaluation data concerning the Fund and the services provided to the Fund by the Advisor. This review was in addition to the oversight and evaluation undertaken by the Board and its committees on a continual basis and the information received was supplemental to the extensive information that the Board and its committees receive and consider throughout the year. The Directors also conducted a review of the process by which the Board considers the renewal of the management agreements. The Board consulted with industry experts and reviewed industry best practices and recent judicial precedent. The Directors believe that the enhancements resulting from their review resulted in increased dialogue with the Advisor and an improved process for fund shareholders.
In connection with its consideration of the renewal of the management agreement, the Board’s review and evaluation of the services provided by the Advisor included, but was not limited to, the following:
| • | the nature, extent, and quality of investment management, shareholder services, and other services provided and to be provided to the Fund; |
| • | the wide range of other programs and services provided and to be provided to the Fund and its shareholders on a routine and non-routine basis; |
| • | the investment performance of the Fund, including data comparing the Fund's performance to appropriate benchmarks and/or a peer group of other mutual funds with similar investment objectives and strategies; |
| • | the cost of owning the Fund compared to the cost of owning similar funds; |
| • | the compliance policies, procedures, and regulatory experience of the Advisor and the Fund's service providers; |
| • | financial data showing the cost of services provided to the Fund, the profitability of the Fund to the Advisor, and the overall profitability of the Advisor |
| • | strategic plans of the Advisor; |
| • | any economies of scale associated with the Advisor’s management of the Fund and other accounts; |
| • | services provided and charges to the Advisor's other investment management clients; |
| • | acquired fund fees and expenses; |
| • | payments and practices in connection with financial intermediaries holding shares of the Fund and the services provided by intermediaries in connection therewith; and |
| • | any collateral benefits derived by the Advisor from the management of the Fund. |
The Directors held two in-person meetings and one telephonic meeting to review and discuss the information provided. The independent Directors also reviewed responses to supplemental information requests provided by the Directors to the Advisor and held active discussions with the Advisor regarding the renewal of the management agreement. The independent Directors had the benefit of the advice of their independent counsel throughout the process.
31
Factors Considered
The Directors considered all of the information provided by the Advisor, the independent data providers, and independent counsel in connection with the approval. They determined that the information was sufficient for them to evaluate the management agreement for the Fund. In connection with their review, the Directors did not identify any single factor as being all-important or controlling, and each Director may have attributed different levels of importance to different factors. In deciding to renew the management agreement, the Board based its decision on a number of factors, including without limitation the following:
Nature, Extent and Quality of Services - Generally. Under the management agreement, the Advisor is responsible for providing or arranging for all services necessary for the operation of the Fund. The Board noted that the Advisor provides or arranges at its own expense a wide variety of services including without limitation the following:
| • | portfolio research and security selection |
| • | securities trading |
| • | Fund administration |
| • | custody of Fund assets |
| • | daily valuation of the Fund’s portfolio |
| • | shareholder servicing and transfer agency, including shareholder confirmations, recordkeeping, and communications |
| • | legal services (except the independent Directors’ counsel) |
| • | regulatory and portfolio compliance |
| • | financial reporting |
| • | marketing and distribution (except amounts paid by the Fund under Rule 12b-1 plans) |
The Board noted that many of these services have expanded over time in terms of both quantity and complexity in response to shareholder demands, competition in the industry, changing distribution channels, and the changing regulatory environment.
Investment Management Services. The nature of the investment management services provided to the Fund is quite complex and allows Fund shareholders access to professional money management, instant diversification of their investments within an asset class, the opportunity to easily diversify among asset classes by investing in or exchanging among various American Century Investments funds, and liquidity. In evaluating investment performance, the Board expects the Advisor to manage the Fund in accordance with its investment objectives and approved strategies. Further, the Directors recognize that the Advisor has an obligation to monitor trading activities, and in particular to seek the best execution of fund trades, and to evaluate the use of and payment for research. In providing these services, the Advisor utilizes teams of investment professionals (portfolio managers, analysts, research assistants, and securities traders) who require extensive information technology, research, training, compliance, and other systems to conduct their business. The Board, directly and through its Fund Performance Review Committee, provides oversight of the investment performance process. It regularly reviews investment performance information for the Fund, together with comparative information for appropriate benchmarks and/or peer groups of similarly-managed funds, over different time horizons. The Directors also review detailed performance information provided by the Advisor during the management agreement renewal process. If performance concerns are identified, the Fund receives special reviews until performance improves, during which the Board receives a report from the Advisor regarding the reasons for such results (e.g., market conditions, security selection) and any efforts being undertaken to improve performance. The Fund’s performance was above its benchmark for the one-, three-, five-, and ten-year periods reviewed by the Board. The Board found the investment management services provided by the Advisor to the Fund to be satisfactory and consistent with the management agreement.
32
Shareholder and Other Services. Under the management agreement, the Advisor provides the Fund with a comprehensive package of transfer agency, shareholder, and other services. The Board, directly and through various committees of the Board, regularly reviews reports and evaluations of such services at its regular meetings. These reports include, but are not limited to, information regarding the operational efficiency and accuracy of the shareholder and transfer agency services provided, staffing levels, shareholder satisfaction (as measured by external as well as internal sources), technology support, new products and services offered to Fund shareholders, securities trading activities, portfolio valuation services, auditing services, and legal and operational compliance activities. The Board found the services provided by the Advisor to the Fund under the management agreement to be competitive and of high quality.
Costs of Services and Profitability. The Advisor provides detailed information concerning its cost of providing various services to the Fund, its profitability in managing the Fund (pre- and post-distribution), its overall profitability, and its financial condition. The Directors have reviewed with the Advisor the methodology used to prepare this financial information. This information is considered in evaluating the Advisor’s financial condition, its ability to continue to provide services under the management agreement, and the reasonableness of the current management fee. The Board concluded that the Advisor’s profits were reasonable in light of the services provided to the Fund.
Ethics. The Board generally considers the Advisor’s commitment to providing quality services to shareholders and to conducting its business ethically. They noted that the Advisor’s practices generally meet or exceed industry best practices.
Economies of Scale. The Board also reviewed information provided by the Advisor regarding the possible existence of economies of scale in connection with the management of the Fund. The Board concluded that economies of scale are difficult to measure and predict with precision, especially on a fund-by-fund basis. The Board concluded that the Advisor is appropriately sharing economies of scale through its competitive fee structure, offering competitive fees from fund inception, and through reinvestment in its business to provide shareholders additional content and services. The Board also noted that economies of scale are shared with the Fund and its shareholders through management fee breakpoints that serve to reduce the effective management fee as the assets of the Fund grow.
Comparison to Other Funds’ Fees. The management agreement provides that the Fund pays the Advisor a single, all-inclusive (or unified) management fee for providing all services necessary for the management and operation of the Fund, other than brokerage expenses, expenses attributable to short sales, taxes, interest, extraordinary expenses, and the fees and expenses of the Fund’s independent Directors (including their independent legal counsel) and expenses incurred in connection with the provision of shareholder services and distribution services under a plan adopted pursuant to Rule 12b-1 under the 1940 Act. Under the unified fee structure, the Advisor is responsible for providing all investment advisory, custody, audit, administrative, compliance, recordkeeping, marketing and shareholder services, or arranging and supervising third parties to provide such services. By contrast, most other funds are charged a variety of fees, including an investment advisory fee, a transfer agency fee, an administrative fee, distribution charges, and other expenses. Other than their investment advisory fees and any applicable Rule 12b-1 distribution fees, all other components of the total fees charged by these other funds may be increased without shareholder approval. The Board believes the unified fee structure is a benefit to Fund shareholders because it clearly discloses to shareholders the cost of owning Fund shares, and, since the unified fee cannot be increased without a vote of Fund shareholders, it shifts to the Advisor the risk of increased costs of operating the Fund and provides a direct incentive to minimize administrative inefficiencies. Part of the Board’s analysis of fee levels involves reviewing certain evaluative data compiled by an independent provider comparing the Fund’s unified fee to the total expense ratios of its peers. The unified fee charged to shareholders of the Fund was below the median of the total expense ratios of the Fund’s peer expense universe. The Board concluded that the management fee paid by the Fund to the Advisor under the management agreement is reasonable in light of the services provided to the Fund.
33
Comparison to Fees and Services Provided to Other Clients of the Advisor. The Directors also requested and received information from the Advisor concerning the nature of the services, fees, costs, and profitability of its advisory services to advisory clients other than the Fund. They observed that these varying types of client accounts require different services and involve different regulatory and entrepreneurial risks than the management of the Fund. The Board analyzed this information and concluded that the fees charged and services provided to the Fund were reasonable by comparison.
Payments to Intermediaries. The Directors also requested and received a description of payments made to intermediaries by the Fund and the Advisor and services provided in response thereto. These payments include various payments made by the Fund or the Advisor to different types of intermediaries and recordkeepers for distribution and service activities provided for the Fund. The Board reviewed such information and received representations from the Advisor that all such payments by the Fund were made pursuant to the Fund's Rule 12b-1 Plan and that all such payments by the Advisor were made from the Advisor’s resources and reasonable profits. The Board found the payments to be reasonable in scope and purpose.
Collateral or “Fall-Out” Benefits Derived by the Advisor. The Board considered the existence of collateral benefits the Advisor may receive as a result of its relationship with the Fund. They concluded that the Advisor’s primary business is managing mutual funds and it generally does not use fund or shareholder information to generate profits in other lines of business, and therefore does not derive any significant collateral benefits from them. The Board noted that additional assets from other clients may offer the Advisor some benefit from increased leverage with service providers and counterparties. Additionally, the Advisor may receive proprietary research from broker-dealers that execute fund portfolio transactions, which the Board concluded is likely to benefit other clients of the Advisor, as well as Fund shareholders. The Board also determined that the Advisor is able to provide investment management services to certain clients other than the Fund, at least in part, due to its existing infrastructure built to serve the fund complex. The Board concluded that appropriate allocation methodologies had been employed to assign resources and the cost of those resources to these other clients and, where expressly provided, these other client assets may be included with the assets of the Fund to determine breakpoints in the management fee schedule.
Existing Relationship. The Board also considered whether there was any reason for not continuing the existing arrangement with the Advisor. In this regard, the Board was mindful of the potential disruptions of the Fund’s operations and various risks, uncertainties, and other effects that could occur as a result of a decision not to continue such relationship. In particular, the Board recognized that most shareholders have invested in the Fund on the strength of the Advisor’s industry standing and reputation and in the expectation that the Advisor will have a continuing role in providing advisory services to the Fund.
Conclusion of the Directors. As a result of this process, the Board, including all of the independent Directors, taking into account all of the factors discussed above and the information provided by the Advisor and others in connection with its review and throughout the year, determined that the management fee is fair and reasonable in light of the services provided and that the investment management agreement between the Fund and the Advisor should be renewed.
34
| Additional Information |
Retirement Account Information
As required by law, distributions you receive from certain retirement accounts are subject to federal income tax withholding, unless you elect not to have withholding apply*. Tax will be withheld on the total amount withdrawn even though you may be receiving amounts that are not subject to withholding, such as nondeductible contributions. In such case, excess amounts of withholding could occur. You may adjust your withholding election so that a greater or lesser amount will be withheld.
If you don’t want us to withhold on this amount, you must notify us to not withhold the federal income tax. You may notify us in writing or in certain situations by telephone or through other electronic means. For systematic withdrawals, your withholding election will remain in effect until revoked or changed by filing a new election. You have the right to revoke your election at any time and change your withholding percentage for future distributions.
Remember, even if you elect not to have income tax withheld, you are liable for paying income tax on the taxable portion of your withdrawal. If you elect not to have income tax withheld or you don’t have enough income tax withheld, you may be responsible for payment of estimated tax. You may incur penalties under the estimated tax rules if your withholding and estimated tax payments are not sufficient. You can reduce or defer the income tax on a distribution by directly or indirectly rolling such distribution over to another IRA or eligible plan. You should consult your tax advisor for additional information.
State tax will be withheld if, at the time of your distribution, your address is within one of the mandatory withholding states and you have federal income tax withheld (or as otherwise required by state law). State taxes will be withheld from your distribution in accordance with the respective state rules.
*Some 403(b), 457 and qualified retirement plan distributions may be subject to 20% mandatory withholding, as they are subject to special tax and withholding rules. Your plan administrator or plan sponsor is required to provide you with a special tax notice explaining those rules at the time you request a distribution. If applicable, federal and/or state taxes may be withheld from your distribution amount.
Proxy Voting Policies
A description of the policies that the fund's investment advisor uses in exercising the voting rights associated with the securities purchased and/or held by the fund is available without charge, upon request, by calling 1-800-345-2021. It is also available on the "About Us" page of American Century Investments’ website at americancentury.com and on the Securities and Exchange Commission’s website at sec.gov. Information regarding how the investment advisor voted proxies relating to portfolio securities during the most recent 12-month period ended June 30 is available on the "About Us" page at americancentury.com. It is also available at sec.gov.
Quarterly Portfolio Disclosure
The fund files its complete schedule of portfolio holdings with the Securities and Exchange Commission (SEC) for the first and third quarters of each fiscal year on Form N-Q. The fund’s Forms N-Q are available on the SEC’s website at sec.gov. The fund also makes its complete schedule of portfolio holdings for the most recent quarter of its fiscal year available on its website at americancentury.com and, upon request, by calling 1-800-345-2021.
35
Other Tax Information
The following information is provided pursuant to provisions of the Internal Revenue Code.
The funds hereby designates up to the maximum amount allowable as qualified dividend income for the fiscal year ended November 30, 2018.
The fund hereby designates $72,995,102, or up to the maximum amount allowable, as long-term capital gain distributions (20% rate gain distributions) for the fiscal year ended November 30, 2018.
For the fiscal year ended November 30, 2018, the fund intends to pass through to shareholders foreign source income of $30,270,128 and foreign taxes paid of $2,383,002, or up to the maximum amount allowable, as a foreign tax credit. Foreign source income and foreign tax expense per outstanding share on November 30, 2018 are $0.2637 and $0.0208, respectively.
36
| ||
| Contact Us | americancentury.com | |
| Automated Information Line | 1-800-345-8765 | |
| Investor Services Representative | 1-800-345-2021 or 816-531-5575 | |
| Investors Using Advisors | 1-800-378-9878 | |
| Business, Not-For-Profit, Employer-Sponsored Retirement Plans | 1-800-345-3533 | |
| Banks and Trust Companies, Broker-Dealers, Financial Professionals, Insurance Companies | 1-800-345-6488 | |
| Telecommunications Relay Service for the Deaf | 711 | |
| American Century World Mutual Funds, Inc. | ||
Investment Advisor: American Century Investment Management, Inc. Kansas City, Missouri | ||
| This report and the statements it contains are submitted for the general information of our shareholders. The report is not authorized for distribution to prospective investors unless preceded or accompanied by an effective prospectus. | ||
| ©2019 American Century Proprietary Holdings, Inc. All rights reserved. CL-ANN-91027 1901 | ||
| Annual Report | |
| November 30, 2018 | |
| International Opportunities Fund | |
| Investor Class (AIOIX) | |
| I Class (ACIOX) | |
| A Class (AIVOX) | |
| C Class (AIOCX) | |
| R Class (AIORX) | |
Beginning on January 1, 2021, as permitted by regulations adopted by the Securities and Exchange Commission, paper copies of the fund’s shareholder reports like this one will no longer be sent by mail, unless you specifically request paper copies of the reports from the fund or from your financial intermediary, such as a broker-dealer or bank. Instead, the reports will be made available on a website, and you will be notified by mail each time a report is posted and provided with a website link to access the report.
If you already elected to receive shareholder reports electronically, you will not be affected by this change and you need not take any action. You may elect to receive shareholder reports and other communications from the fund or your financial intermediary electronically by calling or sending an email request to your appropriate contacts as listed on the back cover of this report.
You may elect to receive all future reports in paper free of charge. You can inform the fund or your financial intermediary that you wish to continue receiving paper copies of your shareholder reports by calling or sending an email request to your appropriate contacts as listed on the back cover of this report. Your election to receive reports in paper will apply to all funds held with the fund complex/your financial intermediary.
| Table of Contents |
| President’s Letter | 2 | |
| Performance | 3 | |
| Portfolio Commentary | ||
| Fund Characteristics | ||
| Shareholder Fee Example | ||
| Schedule of Investments | ||
| Statement of Assets and Liabilities | ||
| Statement of Operations | ||
| Statement of Changes in Net Assets | ||
| Notes to Financial Statements | ||
| Financial Highlights | ||
| Report of Independent Registered Public Accounting Firm | ||
| Management | ||
| Approval of Management Agreement | ||
| Additional Information | ||
Any opinions expressed in this report reflect those of the author as of the date of the report, and do not necessarily represent the opinions of American Century Investments® or any other person in the American Century Investments organization. Any such opinions are subject to change at any time based upon market or other conditions and American Century Investments disclaims any responsibility to update such opinions. These opinions may not be relied upon as investment advice and, because investment decisions made by American Century Investments funds are based on numerous factors, may not be relied upon as an indication of trading intent on behalf of any American Century Investments fund. Security examples are used for representational purposes only and are not intended as recommendations to purchase or sell securities. Performance information for comparative indices and securities is provided to American Century Investments by third party vendors. To the best of American Century Investments’ knowledge, such information is accurate at the time of printing.
| President’s Letter |
Jonathan ThomasDear Investor:
Thank you for reviewing this annual report for the 12 months ended November 30, 2018. Annual reports help convey important information about fund returns, including market factors that affected performance during the reporting period. For additional investment and market insights, please visit our website, americancentury.com.
Global Growth Divergence Drives Disparity in Stock Returns
The synchronization of global economic growth, which helped deliver robust gains for global stocks in 2017, unraveled as the 12-month period unfolded. The U.S. economy continued to expand at a healthy pace, but other regions experienced notable slowdowns. Similarly, stocks advanced in the U.S. but generally declined elsewhere.
In Europe, the threat of global tariffs from the U.S. dampened business sentiment and corporate earnings growth. In addition, uncertainties surrounding Brexit negotiations, Italy’s fiscal woes, and civil unrest in France weighed on economic and earnings growth outlooks and stock performance. Meanwhile, Japan’s economy contracted late in the period, largely due to the effects of several natural disasters, which curtailed personal and business spending. Global trade tensions also pressured Japan’s growth outlook.
After starting strong, emerging markets stocks quickly reversed course. The key culprits included rising U.S. interest rates, U.S.-China tariffs, and global trade-policy uncertainty. In addition, a strong U.S. dollar, falling oil prices, and several country-specific events weighed on the asset class. Late in the period, prospects for a tariff truce between the U.S. and China, along with dovish comments from the Federal Reserve, sparked a November rally among emerging markets stocks.
Overall, U.S. stocks, as measured by the S&P 500 Index, returned 6.27% for the 12 months. Non-U.S. developed markets stocks, as measured by the MSCI EAFE Index, declined 7.94%. Emerging markets stocks, as measured by the MSCI Emerging Markets Index, fell 9.09%.
Looking ahead, investors face a backdrop of uneven global growth, heightened market volatility, and lingering geopolitical uncertainties. But it’s often these challenging markets that produce the most compelling investment opportunities. We believe this scenario underscores the importance of using professionally managed portfolios in pursuit of investment goals. We appreciate your continued trust and confidence in us.
Sincerely,
Jonathan Thomas
President and Chief Executive Officer
American Century Investments
2
| Performance |
| Total Returns as of November 30, 2018 | ||||||
Average Annual Returns | ||||||
Ticker Symbol | 1 year | 5 years | 10 years | Since Inception | Inception Date | |
| Investor Class | AIOIX | -13.98% | 3.77% | 11.94% | — | 6/1/01 |
| MSCI ACWI ex-U.S. Small Cap Growth Index | — | -10.71% | 3.87% | 11.49% | — | — |
| I Class | ACIOX | -13.81% | 3.95% | 12.17% | — | 1/9/03 |
| A Class | AIVOX | 3/1/10 | ||||
| No sales charge | -14.25% | 3.50% | — | 8.29% | ||
| With sales charge | -19.17% | 2.28% | — | 7.55% | ||
| C Class | AIOCX | -14.93% | 2.72% | — | 7.49% | 3/1/10 |
| R Class | AIORX | -14.46% | 3.24% | — | 8.02% | 3/1/10 |
Average annual returns since inception are presented when ten years of performance history is not available.
Fund returns would have been lower if a portion of the fees had not been waived.
Sales charges include initial sales charges and contingent deferred sales charges (CDSCs), as applicable. A Class shares have a 5.75% maximum initial sales charge and may be subject to a maximum CDSC of 1.00%. C Class shares redeemed within 12 months of purchase are subject to a maximum CDSC of 1.00%. The SEC requires that mutual funds provide performance information net of maximum sales charges in all cases where charges could be applied.
Data presented reflect past performance. Past performance is no guarantee of future results. Current performance may be higher or lower than the performance shown. Total returns for periods less than one year are not annualized. Investment return and principal value will fluctuate, and redemption value may be more or less than original cost. Data assumes reinvestment of dividends and capital gains, and none of the charts reflect the deduction of taxes that a shareholder would pay on fund distributions or the redemption of fund shares. To obtain performance data current to the most recent month end, please call 1-800-345-2021 or visit americancentury.com. For additional information about the fund, please consult the prospectus.
3
| Growth of $10,000 Over 10 Years |
| $10,000 investment made November 30, 2008 |
| Performance for other share classes will vary due to differences in fee structure. |
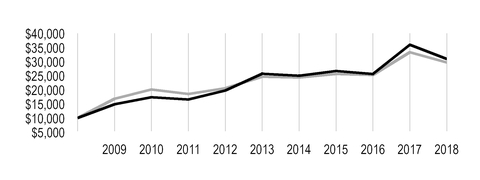
| Value on November 30, 2018 | |
| Investor Class — $30,901 | |
| MSCI ACWI ex-U.S. Small Cap Growth Index — $29,694 | |
Ending value of Investor Class would have been lower if a portion of the fees had not been waived.
Total Annual Fund Operating Expenses | ||||
| Investor Class | I Class | A Class | C Class | R Class |
| 1.55% | 1.35% | 1.80% | 2.55% | 2.05% |
The total annual fund operating expenses shown is as stated in the fund’s prospectus current as of the date of this report. The prospectus may vary from the expense ratio shown elsewhere in this report because it is based on a different time period, includes acquired fund fees and expenses, and, if applicable, does not include fee waivers or expense reimbursements.
Data presented reflect past performance. Past performance is no guarantee of future results. Current performance may be higher or lower than the performance shown. Total returns for periods less than one year are not annualized. Investment return and principal value will fluctuate, and redemption value may be more or less than original cost. Data assumes reinvestment of dividends and capital gains, and none of the charts reflect the deduction of taxes that a shareholder would pay on fund distributions or the redemption of fund shares. To obtain performance data current to the most recent month end, please call 1-800-345-2021 or visit americancentury.com. For additional information about the fund, please consult the prospectus.
4
| Portfolio Commentary |
Portfolio Managers: Trevor Gurwich, Federico Laffan, and Pratik Patel
Pratik Patel joined the fund's management team in February 2018.
Performance Summary
International Opportunities returned -13.98* for the 12 months ended November 30, 2018. The portfolio’s benchmark, the MSCI ACWI ex-U.S. Small Cap Growth Index, returned -10.71% for the same period.
Worries about moderating economic growth in Europe and China and trade policy uncertainties created headwinds for non-U.S. small-cap stocks, which ended the 12-month period lower. Small-cap non-U.S. stocks lagged their large-cap counterparts, largely due to relatively weak performance among small-cap stocks in Asia. Within the portfolio, stock selection hurt performance relative to the benchmark, especially in the industrials and consumer discretionary sectors. Stock selection in materials and information technology aided relative performance. Regionally, investments in Japan, India, and the U.K. detracted from relative performance. Holdings in Brazil, Taiwan, and the Netherlands lifted relative results.
Building Products Supplier and IT Services Company Were Notable Detractors
Finetex EnE, a notable detractor in industrials, manufactures nanofibers used in specialized filters and technical textiles. The stock declined in early 2018 because of audit concerns. We initially held onto our position given the company’s rapid sales growth and long-term contracts. Nonetheless, the stock remained under pressure due to ongoing corporate governance issues. As a result, we exited the position.
Vakrangee was a prominent detractor in information technology. This IT services company operates a network of small rural-area outlets in India. These outlets provide one-stop shopping for banking and other services as well as hubs for ordering and receiving Amazon products. The stock was a strong performer for the portfolio in 2017. However, it declined in January 2018 after the company became the target of a Securities and Exchange Board of India investigation into price and volume manipulation. This investigation raised corporate governance concerns, and we sold the stock.
We also exited our investment in My EG Services, a provider of IT-based government services in Malaysia. The stock fell sharply in the second calendar quarter of 2018 on investor concerns about the company's large government exposure and perceived connection to Malaysia’s out-of-favor Barisan Nasional party. Tateru, a supplier of cloud-based real estate marketing services, also was a prominent detractor. The company's stock struggled on news that a prospective client’s credit approval was based on falsified bank statements. This news prompted a wider investigation that created near-term uncertainty for the stock. We exited the position to pursue investments with better risk/reward potential.
Multichannel Retail and Telecommunications Equipment Supplier Were Top Contributors
Our stock selection in metals and mining and construction materials drove outperformance in the materials sector. China Resources Cement Holdings, a top contributor in the materials sector, is a
*All fund returns referenced in this commentary are for Investor Class shares. Fund returns would have been lower if a portion of the fees had not been waived. Performance for other share classes will vary due to differences in fee structure; when Investor Class performance exceeds that of the fund's benchmark, other share classes may not. See page 3 for returns for all share classes.
5
leading supplier of cement and concrete in southern China. The stock rose after the company reported strong quarterly earnings performance stemming from solid volume growth and rising average selling prices.
Anritsu, a global supplier of telecommunications electronic equipment, was a standout performer in information technology. Anritsu reported solid revenue and earnings growth boosted by strong trends in its mobile and broadband businesses and increased spending on 5G services.
Elsewhere in the portfolio, Magazine Luiza, a multichannel retailer in Brazil, was a key contributor. The stock jumped in October, after the company released strong quarterly financial results and announced acceleration in its e-commerce sales. It is also benefiting from an improved economic environment in Brazil. TCI Company, another contributor, is a global supplier of nutritional supplements, capsules, and beauty products. The company reported robust revenue growth and improving profit margins, supported by its strong and growing business in China.
Outlook
The portfolio continues to invest in non-U.S. small- and mid-cap companies that we believe are demonstrating accelerating and sustainable growth. Our stock selection process continues to drive our sector and country allocations. The information technology sector remains a prominent overweight relative to the benchmark, although our stock selection process led us to scale back our weighting over the period. The health care sector is another notable overweight. We added to our exposure as we found opportunities among drugmakers and health care equipment and supply companies, primarily in Europe and Japan.
Our bottom-up investment process led to a relative underweight in communication services, a sector that replaced telecommunication services due to recent updates to the Global Industry Classification Standard. The portfolio also has relative underweight positions in consumer discretionary and consumer staples.
From a regional standpoint, Europe remains the portfolio’s largest weighting in absolute and relative terms. We continue to find attractive stock-specific opportunities in France, Italy, and Spain. We found fewer companies with accelerating earnings growth potential in Asia, which remains underweight relative to the benchmark.
6
| Fund Characteristics |
| NOVEMBER 30, 2018 | |
Top Ten Holdings | % of net assets |
| ASR Nederland NV | 1.6% |
| Aveva Group plc | 1.6% |
| FinecoBank Banca Fineco SpA | 1.6% |
| Canada Goose Holdings, Inc. | 1.5% |
| WNS Holdings Ltd. ADR | 1.5% |
| Anritsu Corp. | 1.5% |
| Globant SA | 1.3% |
| Systena Corp. | 1.3% |
| Saab AB* | 1.2% |
| Rotork plc | 1.2% |
| *Includes all equity exposure held by the fund. | |
Types of Investments in Portfolio | % of net assets |
| Common Stocks | 98.8% |
| Rights | 0.1% |
| Total Equity Exposure | 98.9% |
| Temporary Cash Investments | 1.4% |
| Other Assets and Liabilities | (0.3)% |
Investments by Country | % of net assets |
| Japan | 23.4% |
| United Kingdom | 15.7% |
| Canada | 6.5% |
| France | 6.4% |
| Australia | 5.4% |
| Taiwan | 4.0% |
| Sweden | 3.8% |
| Germany | 3.6% |
| Netherlands | 3.6% |
| China | 3.6% |
| South Korea | 3.1% |
| Italy | 2.9% |
| Switzerland | 2.7% |
| India | 2.7% |
| Spain | 2.6% |
| Other Countries | 8.9% |
| Cash and Equivalents* | 1.1% |
*Includes temporary cash investments and other assets and liabilities.
7
| Shareholder Fee Example |
Fund shareholders may incur two types of costs: (1) transaction costs, including sales charges (loads) on purchase payments and redemption/exchange fees; and (2) ongoing costs, including management fees; distribution and service (12b-1) fees; and other fund expenses. This example is intended to help you understand your ongoing costs (in dollars) of investing in your fund and to compare these costs with the ongoing cost of investing in other mutual funds.
The example is based on an investment of $1,000 made at the beginning of the period and held for the entire period from June 1, 2018 to November 30, 2018.
Actual Expenses
The table provides information about actual account values and actual expenses for each class. You may use the information, together with the amount you invested, to estimate the expenses that you paid over the period. First, identify the share class you own. Then simply divide your account value by $1,000 (for example, an $8,600 account value divided by $1,000 = 8.6), then multiply the result by the number under the heading “Expenses Paid During Period” to estimate the expenses you paid on your account during this period.
If you hold Investor Class shares of any American Century Investments fund, or I Class shares of the American Century Diversified Bond Fund, in an American Century Investments account (i.e., not a financial intermediary or retirement plan account), American Century Investments may charge you a $12.50 semiannual account maintenance fee if the value of those shares is less than $10,000. We will redeem shares automatically in one of your accounts to pay the $12.50 fee. In determining your total eligible investment amount, we will include your investments in all personal accounts (including American Century Investments Brokerage accounts) registered under your Social Security number. Personal accounts include individual accounts, joint accounts, UGMA/UTMA accounts, personal trusts, Coverdell Education Savings Accounts and IRAs (including traditional, Roth, Rollover, SEP-, SARSEP- and SIMPLE-IRAs), and certain other retirement accounts. If you have only business, business retirement, employer-sponsored or American Century Investments Brokerage accounts, you are currently not subject to this fee. If you are subject to the Account Maintenance Fee, your account value could be reduced by the fee amount.
Hypothetical Example for Comparison Purposes
The table also provides information about hypothetical account values and hypothetical expenses based on the actual expense ratio of each class of your fund and an assumed rate of return of 5% per year before expenses, which is not the actual return of a fund’s share class. The hypothetical account values and expenses may not be used to estimate the actual ending account balance or expenses you paid for the period. You may use this information to compare the ongoing costs of investing in your fund and other funds. To do so, compare this 5% hypothetical example with the 5% hypothetical examples that appear in the shareholder reports of the other funds.
Please note that the expenses shown in the table are meant to highlight your ongoing costs only and do not reflect any transactional costs, such as sales charges (loads) or redemption/exchange fees. Therefore, the table is useful in comparing ongoing costs only, and will not help you determine the relative total costs of owning different funds. In addition, if these transactional costs were included, your costs would have been higher.
8
| Beginning Account Value 6/1/18 | Ending Account Value 11/30/18 | Expenses Paid During Period(1) 6/1/18 - 11/30/18 | Annualized Expense Ratio(1) | |
Actual | ||||
| Investor Class | $1,000 | $809.20 | $6.71 | 1.48% |
| I Class | $1,000 | $810.30 | $5.81 | 1.28% |
| A Class | $1,000 | $807.70 | $7.84 | 1.73% |
| C Class | $1,000 | $804.70 | $11.22 | 2.48% |
| R Class | $1,000 | $806.70 | $8.97 | 1.98% |
| Hypothetical | ||||
| Investor Class | $1,000 | $1,017.65 | $7.49 | 1.48% |
| I Class | $1,000 | $1,018.65 | $6.48 | 1.28% |
| A Class | $1,000 | $1,016.40 | $8.74 | 1.73% |
| C Class | $1,000 | $1,012.64 | $12.51 | 2.48% |
| R Class | $1,000 | $1,015.14 | $10.00 | 1.98% |
| (1) | Expenses are equal to the class's annualized expense ratio listed in the table above, multiplied by the average account value over the period, multiplied by 183, the number of days in the most recent fiscal half-year, divided by 365, to reflect the one-half year period. Annualized expense ratio reflects actual expenses, including any applicable fee waivers or expense reimbursements and excluding any acquired fund fees and expenses. |
9
| Schedule of Investments |
NOVEMBER 30, 2018
| Shares | Value | ||||
| COMMON STOCKS — 98.8% | |||||
| Argentina — 1.3% | |||||
Globant SA(1) | 44,236 | $ | 2,594,441 | ||
| Australia — 5.4% | |||||
Afterpay Touch Group Ltd.(1) | 113,434 | 1,206,866 | |||
| ALS Ltd. | 298,500 | 1,589,254 | |||
| Cleanaway Waste Management Ltd. | 1,004,434 | 1,249,021 | |||
NEXTDC Ltd.(1) | 316,840 | 1,499,229 | |||
| Northern Star Resources Ltd. | 378,974 | 2,214,619 | |||
Saracen Mineral Holdings Ltd.(1) | 772,280 | 1,398,016 | |||
| Seven Group Holdings Ltd. | 112,074 | 1,304,382 | |||
| 10,461,387 | |||||
| Austria — 1.3% | |||||
| FACC AG | 53,321 | 935,584 | |||
| Wienerberger AG | 75,099 | 1,685,423 | |||
| 2,621,007 | |||||
| Belgium — 1.0% | |||||
Galapagos NV(1) | 19,279 | 1,961,031 | |||
| Brazil — 1.7% | |||||
Azul SA ADR(1) | 75,424 | 2,035,694 | |||
Linx SA(1) | 37,000 | 267,908 | |||
| Magazine Luiza SA | 25,404 | 1,081,526 | |||
| 3,385,128 | |||||
| Canada — 6.5% | |||||
| BRP, Inc. | 62,957 | 2,243,167 | |||
Canada Goose Holdings, Inc.(1) | 44,779 | 3,015,866 | |||
Descartes Systems Group, Inc. (The)(1) | 46,743 | 1,376,626 | |||
| FirstService Corp. | 20,363 | 1,544,716 | |||
| Kirkland Lake Gold Ltd. | 97,857 | 2,028,361 | |||
Largo Resources Ltd.(1) | 383,081 | 1,055,264 | |||
Parex Resources, Inc.(1) | 114,561 | 1,414,929 | |||
| 12,678,929 | |||||
| China — 3.6% | |||||
A-Living Services Co. Ltd., H Shares(1) | 742,250 | 978,420 | |||
Baozun, Inc. ADR(1) | 19,574 | 690,375 | |||
| China Resources Cement Holdings Ltd. | 1,720,000 | 1,679,036 | |||
GDS Holdings Ltd. ADR(1) | 59,646 | 1,758,961 | |||
Li Ning Co. Ltd.(1) | 1,737,500 | 1,870,196 | |||
| 6,976,988 | |||||
| Denmark — 0.5% | |||||
| Royal Unibrew A/S | 13,851 | 1,003,251 | |||
| Finland — 0.6% | |||||
| Valmet Oyj | 54,154 | 1,165,899 | |||
10
| Shares | Value | ||||
| France — 6.4% | |||||
| Euronext NV | 23,489 | $ | 1,375,590 | ||
| Gaztransport Et Technigaz SA | 20,406 | 1,525,475 | |||
| Korian SA | 52,547 | 2,033,701 | |||
| Rubis SCA | 10,152 | 548,777 | |||
SOITEC(1) | 22,020 | 1,352,701 | |||
Solutions 30 SE(1) | 175,700 | 1,822,399 | |||
| Teleperformance | 11,563 | 1,919,607 | |||
Worldline SA(1) | 36,404 | 1,946,413 | |||
| 12,524,663 | |||||
| Germany — 3.6% | |||||
| Carl Zeiss Meditec AG | 30,524 | 2,107,618 | |||
| Isra Vision AG | 11,708 | 455,461 | |||
MorphoSys AG(1) | 18,786 | 2,146,999 | |||
| Rheinmetall AG | 15,486 | 1,434,465 | |||
| Scout24 AG | 23,198 | 966,638 | |||
| 7,111,181 | |||||
| Hong Kong — 0.5% | |||||
| Melco International Development Ltd. | 508,000 | 1,024,656 | |||
| India — 2.7% | |||||
| Bata India Ltd. | 72,905 | 1,095,111 | |||
| Graphite India Ltd. | 89,971 | 1,206,957 | |||
WNS Holdings Ltd. ADR(1) | 60,054 | 2,933,037 | |||
| 5,235,105 | |||||
| Indonesia — 0.2% | |||||
| Bank Tabungan Negara Persero Tbk PT | 2,631,100 | 493,742 | |||
| Ireland — 0.6% | |||||
| Dalata Hotel Group plc | 205,136 | 1,082,491 | |||
| Italy — 2.9% | |||||
| Amplifon SpA | 67,988 | 1,142,852 | |||
| FinecoBank Banca Fineco SpA | 284,974 | 3,057,366 | |||
| Moncler SpA | 41,884 | 1,369,467 | |||
| 5,569,685 | |||||
| Japan — 23.4% | |||||
| Adastria Co. Ltd. | 100,800 | 1,654,977 | |||
| Ain Holdings, Inc. | 19,400 | 1,499,279 | |||
| Anritsu Corp. | 178,700 | 2,932,440 | |||
| Cosmos Pharmaceutical Corp. | 9,800 | 1,993,317 | |||
| Fancl Corp. | 60,000 | 1,567,258 | |||
| GMO Payment Gateway, Inc. | 35,000 | 2,157,493 | |||
| Ichikoh Industries Ltd. | 137,400 | 901,484 | |||
| KH Neochem Co. Ltd. | 66,200 | 1,775,792 | |||
| Lasertec Corp. | 33,600 | 1,083,348 | |||
| Modec, Inc. | 63,400 | 1,577,809 | |||
| Nabtesco Corp. | 54,400 | 1,506,518 | |||
| Nihon Kohden Corp. | 68,300 | 2,235,423 | |||
| Nihon M&A Center, Inc. | 78,100 | 1,823,129 | |||
11
| Shares | Value | ||||
| Orix JREIT, Inc. | 888 | $ | 1,444,863 | ||
| Outsourcing, Inc. | 63,100 | 797,426 | |||
| Pigeon Corp. | 31,000 | 1,277,870 | |||
| Pressance Corp. | 100,600 | 1,255,931 | |||
| Rengo Co. Ltd. | 154,500 | 1,311,143 | |||
| Rohto Pharmaceutical Co. Ltd. | 64,400 | 2,035,507 | |||
| Sakata Seed Corp. | 41,200 | 1,414,686 | |||
| Sankyu, Inc. | 20,500 | 961,283 | |||
| Sawai Pharmaceutical Co. Ltd. | 32,900 | 1,739,617 | |||
| Seed Co. Ltd. | 44,100 | 615,376 | |||
| SHO-BOND Holdings Co. Ltd. | 29,500 | 2,260,935 | |||
| Solasto Corp. | 86,200 | 1,097,359 | |||
| Systena Corp. | 200,400 | 2,579,257 | |||
| Tadano Ltd. | 86,500 | 1,038,330 | |||
| Trust Tech, Inc. | 60,200 | 1,730,391 | |||
| Tsubakimoto Chain Co. | 37,500 | 1,402,348 | |||
| 45,670,589 | |||||
| Mexico — 0.7% | |||||
Alpek SAB de CV(1) | 777,995 | 947,947 | |||
| Gentera SAB de CV | 553,216 | 408,244 | |||
| 1,356,191 | |||||
| Netherlands — 3.6% | |||||
| AMG Advanced Metallurgical Group NV | 39,849 | 1,766,787 | |||
| ASR Nederland NV | 73,993 | 3,202,367 | |||
InterXion Holding NV(1) | 33,817 | 2,105,785 | |||
| 7,074,939 | |||||
| Norway — 0.5% | |||||
| Aker BP ASA | 33,697 | 959,501 | |||
| South Korea — 3.1% | |||||
Cafe24 Corp.(1) | 10,431 | 953,160 | |||
| Dentium Co. Ltd. | 18,259 | 1,140,411 | |||
| Doosan Bobcat, Inc. | 59,383 | 1,745,408 | |||
| Fila Korea Ltd. | 47,392 | 2,152,869 | |||
| 5,991,848 | |||||
| Spain — 2.6% | |||||
| Applus Services SA | 90,971 | 1,093,687 | |||
| Cellnex Telecom SA | 36,989 | 1,027,773 | |||
| Ence Energia y Celulosa SA | 156,164 | 990,629 | |||
| Inmobiliaria Colonial Socimi SA | 97,142 | 976,575 | |||
| Viscofan SA | 16,287 | 931,081 | |||
| 5,019,745 | |||||
| Sweden — 3.7% | |||||
| Elekta AB, B Shares | 182,403 | 2,204,365 | |||
| Fabege AB | 78,660 | 981,605 | |||
| Paradox Interactive AB | 27,855 | 399,823 | |||
| Saab AB, B Shares | 58,691 | 2,353,151 | |||
12
| Shares | Value | ||||
| Thule Group AB | 68,135 | $ | 1,276,543 | ||
| 7,215,487 | |||||
| Switzerland — 2.7% | |||||
| Georg Fischer AG | 1,296 | 1,008,651 | |||
Idorsia Ltd.(1) | 54,024 | 1,027,326 | |||
Siegfried Holding AG(1) | 4,333 | 1,546,616 | |||
| Tecan Group AG | 8,491 | 1,750,958 | |||
| 5,333,551 | |||||
| Taiwan — 4.0% | |||||
| Airtac International Group | 44,000 | 470,815 | |||
| Chailease Holding Co. Ltd. | 509,220 | 1,587,214 | |||
| Chroma ATE, Inc. | 361,000 | 1,407,426 | |||
| Eclat Textile Co. Ltd. | 170,000 | 2,133,722 | |||
| TCI Co. Ltd. | 131,941 | 2,139,152 | |||
| 7,738,329 | |||||
| United Kingdom — 15.7% | |||||
| Abcam plc | 107,183 | 1,557,004 | |||
Avast plc(1) | 318,817 | 1,113,683 | |||
| Aveva Group plc | 96,702 | 3,160,918 | |||
| Beazley plc | 292,370 | 2,084,400 | |||
| Burford Capital Ltd. | 111,749 | 2,168,790 | |||
| Dechra Pharmaceuticals plc | 34,323 | 947,086 | |||
| Electrocomponents plc | 218,053 | 1,430,789 | |||
| Fevertree Drinks plc | 31,017 | 946,002 | |||
| Hikma Pharmaceuticals plc | 93,854 | 2,138,540 | |||
| HomeServe plc | 160,032 | 1,939,741 | |||
| IG Group Holdings plc | 121,951 | 919,646 | |||
| Intermediate Capital Group plc | 147,565 | 1,909,921 | |||
| JD Sports Fashion plc | 203,401 | 1,028,366 | |||
Nomad Foods Ltd.(1) | 47,677 | 964,029 | |||
| Rentokil Initial plc | 508,846 | 2,147,543 | |||
| Rotork plc | 693,100 | 2,326,047 | |||
Seadrill Ltd.(1) | 23,499 | 320,291 | |||
| SSP Group plc | 227,725 | 1,818,025 | |||
| UNITE Group plc (The) | 157,736 | 1,676,945 | |||
| 30,597,766 | |||||
TOTAL COMMON STOCKS (Cost $183,045,978) | 192,847,530 | ||||
| RIGHTS — 0.1% | |||||
| Sweden — 0.1% | |||||
Saab AB(1) (Cost $—) | 51,186 | 201,176 | |||
13
| Shares | Value | ||||
| TEMPORARY CASH INVESTMENTS — 1.4% | |||||
| Repurchase Agreement, BMO Capital Markets Corp., (collateralized by various U.S. Treasury obligations, 1.125% - 3.125%, 5/31/19 - 11/15/28, valued at $2,209,381), in a joint trading account at 2.00%, dated 11/30/18, due 12/3/18 (Delivery value $2,166,314) | $ | 2,165,953 | |||
| Repurchase Agreement, Fixed Income Clearing Corp., (collateralized by various U.S. Treasury obligations, 3.375%, 11/15/48, valued at $495,012), at 1.05%, dated 11/30/18, due 12/3/18 (Delivery value $482,042) | 482,000 | ||||
| State Street Institutional U.S. Government Money Market Fund, Premier Class | 740 | 740 | |||
TOTAL TEMPORARY CASH INVESTMENTS (Cost $2,648,693) | 2,648,693 | ||||
TOTAL INVESTMENT SECURITIES — 100.3% (Cost $185,694,671) | 195,697,399 | ||||
| OTHER ASSETS AND LIABILITIES — (0.3)% | (589,533 | ) | |||
| TOTAL NET ASSETS — 100.0% | $ | 195,107,866 | |||
| MARKET SECTOR DIVERSIFICATION | ||
(as a % of net assets) | ||
| Industrials | 19.9 | % |
| Information Technology | 18.4 | % |
| Health Care | 15.0 | % |
| Consumer Discretionary | 13.4 | % |
| Financials | 8.8 | % |
| Materials | 8.5 | % |
| Consumer Staples | 7.1 | % |
| Real Estate | 3.3 | % |
| Energy | 3.0 | % |
| Communication Services | 1.2 | % |
| Utilities | 0.3 | % |
| Cash and Equivalents* | 1.1 | % |
*Includes temporary cash investments and other assets and liabilities.
| NOTES TO SCHEDULE OF INVESTMENTS | ||
| ADR | - | American Depositary Receipt |
| (1) | Non-income producing. |
See Notes to Financial Statements.
14
| Statement of Assets and Liabilities |
| NOVEMBER 30, 2018 | |||
| Assets | |||
| Investment securities, at value (cost of $185,694,671) | $ | 195,697,399 | |
| Foreign currency holdings, at value (cost of $509,105) | 509,071 | ||
| Receivable for investments sold | 1,006,669 | ||
| Receivable for capital shares sold | 1,319,517 | ||
| Dividends and interest receivable | 285,678 | ||
| Other assets | 51,032 | ||
| 198,869,366 | |||
| Liabilities | |||
| Payable for investments purchased | 3,156,702 | ||
| Payable for capital shares redeemed | 368,179 | ||
| Accrued management fees | 233,173 | ||
| Distribution and service fees payable | 3,446 | ||
| 3,761,500 | |||
| Net Assets | $ | 195,107,866 | |
| Net Assets Consist of: | |||
| Capital (par value and paid-in surplus) | $ | 185,018,948 | |
| Distributable earnings | 10,088,918 | ||
| $ | 195,107,866 | ||
| Net Assets | Shares Outstanding | Net Asset Value Per Share | ||||
| Investor Class, $0.01 Par Value | $131,042,661 | 14,047,882 | $9.33 | |||
| I Class, $0.01 Par Value | $53,223,852 | 5,640,538 | $9.44 | |||
| A Class, $0.01 Par Value | $8,130,580 | 879,783 | $9.24* | |||
| C Class, $0.01 Par Value | $1,411,113 | 159,230 | $8.86 | |||
| R Class, $0.01 Par Value | $1,299,660 | 142,134 | $9.14 | |||
*Maximum offering price $9.80 (net asset value divided by 0.9425).
See Notes to Financial Statements.
15
| Statement of Operations |
| YEAR ENDED NOVEMBER 30, 2018 | |||
| Investment Income (Loss) | |||
| Income: | |||
| Dividends (net of foreign taxes withheld of $317,048) | $ | 3,533,936 | |
| Interest | 41,094 | ||
| 3,575,030 | |||
| Expenses: | |||
| Management fees | 3,627,054 | ||
| Distribution and service fees: | |||
| A Class | 30,461 | ||
| C Class | 22,859 | ||
| R Class | 6,187 | ||
| Directors' fees and expenses | 6,368 | ||
| Other expenses | 6,420 | ||
| 3,699,349 | |||
Fees waived(1) | (325,277 | ) | |
| 3,374,072 | |||
| Net investment income (loss) | 200,958 | ||
| Realized and Unrealized Gain (Loss) | |||
| Net realized gain (loss) on: | |||
| Investment transactions | 3,179,668 | ||
| Foreign currency translation transactions | (134,394 | ) | |
| 3,045,274 | |||
| Change in net unrealized appreciation (depreciation) on: | |||
| Investments (includes (increase) decrease in accrued foreign taxes of $133,236) | (38,664,370 | ) | |
| Translation of assets and liabilities in foreign currencies | (19,123 | ) | |
| (38,683,493 | ) | ||
| Net realized and unrealized gain (loss) | (35,638,219 | ) | |
| Net Increase (Decrease) in Net Assets Resulting from Operations | $ | (35,437,261 | ) |
| (1) | Amount consists of $248,400, $53,661, $18,182, $3,389 and $1,645 for Investor Class, I Class, A Class, C Class and R Class, respectively. |
See Notes to Financial Statements.
16
| Statement of Changes in Net Assets |
| YEARS ENDED NOVEMBER 30, 2018 AND NOVEMBER 30, 2017 | ||||||
| Increase (Decrease) in Net Assets | November 30, 2018 | November 30, 2017 | ||||
| Operations | ||||||
| Net investment income (loss) | $ | 200,958 | $ | (214,314 | ) | |
| Net realized gain (loss) | 3,045,274 | 19,289,221 | ||||
| Change in net unrealized appreciation (depreciation) | (38,683,493 | ) | 33,851,197 | |||
| Net increase (decrease) in net assets resulting from operations | (35,437,261 | ) | 52,926,104 | |||
| Distributions to Shareholders | ||||||
| From earnings: | ||||||
| Investor Class | (15,648,809 | ) | (41,869 | ) | ||
| I Class | (1,327,425 | ) | (15,442 | ) | ||
| A Class | (1,166,105 | ) | — | |||
| C Class | (206,063 | ) | — | |||
| R Class | (86,554 | ) | — | |||
| Decrease in net assets from distributions | (18,434,956 | ) | (57,311 | ) | ||
| Capital Share Transactions | ||||||
| Net increase (decrease) in net assets from capital share transactions (Note 5) | 58,663,854 | 6,185,364 | ||||
| Redemption Fees | ||||||
| Increase in net assets from redemption fees | — | 11,161 | ||||
| Net increase (decrease) in net assets | 4,791,637 | 59,065,318 | ||||
| Net Assets | ||||||
| Beginning of period | 190,316,229 | 131,250,911 | ||||
| End of period | $ | 195,107,866 | $ | 190,316,229 | ||
See Notes to Financial Statements.
17
| Notes to Financial Statements |
NOVEMBER 30, 2018
1. Organization
American Century World Mutual Funds, Inc. (the corporation) is registered under the Investment Company Act of 1940, as amended (the 1940 Act), as an open-end management investment company and is organized as a Maryland corporation. International Opportunities Fund (the fund) is one fund in a series issued by the corporation. The fund's investment objective is to seek capital growth.
The fund offers the Investor Class, I Class, A Class, C Class and R Class. The A Class may incur an initial sales charge. The A Class and C Class may be subject to a contingent deferred sales charge.
2. Significant Accounting Policies
The following is a summary of significant accounting policies consistently followed by the fund in preparation of its financial statements. The fund is an investment company and follows accounting and reporting guidance in accordance with accounting principles generally accepted in the United States of America. This may require management to make certain estimates and assumptions at the date of the financial statements. Actual results could differ from these estimates. Management evaluated the impact of events or transactions occurring through the date the financial statements were issued that would merit recognition or disclosure.
Investment Valuations — The fund determines the fair value of its investments and computes its net asset value per share at the close of regular trading (usually 4 p.m. Eastern time) on the New York Stock Exchange (NYSE) on each day the NYSE is open. The Board of Directors has adopted valuation policies and procedures to guide the investment advisor in the fund’s investment valuation process and to provide methodologies for the oversight of the fund’s pricing function.
Equity securities that are listed or traded on a domestic securities exchange are valued at the last reported sales price or at the official closing price as provided by the exchange. Equity securities traded on foreign securities exchanges are generally valued at the closing price of such securities on the exchange where primarily traded or at the close of the NYSE, if that is earlier. If no last sales price is reported, or if local convention or regulation so provides, the mean of the latest bid and asked prices may be used. Securities traded over-the-counter are valued at the mean of the latest bid and asked prices, the last sales price, or the official closing price. Equity securities initially expressed in local currencies are translated into U.S. dollars at the mean of the appropriate currency exchange rate at the close of the NYSE as provided by an independent pricing service.
Open-end management investment companies are valued at the reported net asset value per share. Repurchase agreements are valued at cost, which approximates fair value.
If the fund determines that the market price for an investment is not readily available or the valuation methods mentioned above do not reflect an investment’s fair value, such investment is valued as determined in good faith by the Board of Directors or its delegate, in accordance with policies and procedures adopted by the Board of Directors. In its determination of fair value, the fund may review several factors including, but not limited to, market information regarding the specific investment or comparable investments and correlation with other investment types, futures indices or general market indicators. Circumstances that may cause the fund to use these procedures to value an investment include, but are not limited to: an investment has been declared in default or is distressed; trading in a security has been suspended during the trading day or a security is not actively trading on its principal exchange; prices received from a regular pricing source are deemed unreliable; or there is a foreign market holiday and no trading occurred.
18
The fund monitors for significant events occurring after the close of an investment’s primary exchange but before the fund’s net asset value per share is determined. Significant events may include, but are not limited to: corporate announcements and transactions; governmental action and political unrest that could impact a specific investment or an investment sector; or armed conflicts, natural disasters and similar events that could affect investments in a specific country or region. The fund also monitors for significant fluctuations between domestic and foreign markets, as evidenced by the U.S. market or such other indicators that the Board of Directors, or its delegate, deems appropriate. If significant fluctuations in foreign markets are identified, the fund may apply a model-derived factor to the closing price of equity securities traded on foreign securities exchanges. The factor is based on observable market data as provided by an independent pricing service.
Security Transactions — Security transactions are accounted for as of the trade date. Net realized gains and losses are determined on the identified cost basis, which is also used for federal income tax purposes. Certain countries impose taxes on realized gains on the sale of securities registered in their country. The fund records the foreign tax expense, if any, on an accrual basis. The foreign tax expense on realized gains and unrealized appreciation reduces the net realized gain (loss) on investment transactions and net unrealized appreciation (depreciation) on investments, respectively.
Investment Income — Dividend income less foreign taxes withheld, if any, is recorded as of the ex-dividend date. Distributions received on securities that represent a return of capital or long-term capital gain are recorded as a reduction of cost of investments and/or as a realized gain. The fund may estimate the components of distributions received that may be considered nontaxable distributions or long-term capital gain distributions for income tax purposes. Interest income is recorded on the accrual basis and includes accretion of discounts and amortization of premiums.
Foreign Currency Translations — All assets and liabilities initially expressed in foreign currencies are translated into U.S. dollars at prevailing exchange rates at period end. The fund may enter into spot foreign currency exchange contracts to facilitate transactions denominated in a foreign currency. Purchases and sales of investment securities, dividend and interest income, spot foreign currency exchange contracts, and expenses are translated at the rates of exchange prevailing on the respective dates of such transactions. Net realized and unrealized foreign currency exchange gains or losses related to investment securities are a component of net realized gain (loss) on investment transactions and change in net unrealized appreciation (depreciation) on investments, respectively.
Repurchase Agreements — The fund may enter into repurchase agreements with institutions that American Century Investment Management, Inc. (ACIM) (the investment advisor) has determined are creditworthy pursuant to criteria adopted by the Board of Directors. The fund requires that the collateral, represented by securities, received in a repurchase transaction be transferred to the custodian in a manner sufficient to enable the fund to obtain those securities in the event of a default under the repurchase agreement. ACIM monitors, on a daily basis, the securities transferred to ensure the value, including accrued interest, of the securities under each repurchase agreement is equal to or greater than amounts owed to the fund under each repurchase agreement.
Joint Trading Account — Pursuant to an Exemptive Order issued by the Securities and Exchange Commission, the fund, along with certain other funds in the American Century Investments family of funds, may transfer uninvested cash balances into a joint trading account. These balances are invested in one or more repurchase agreements that are collateralized by U.S. Treasury or Agency obligations.
Income Tax Status — It is the fund’s policy to distribute substantially all net investment income and net realized gains to shareholders and to otherwise qualify as a regulated investment company under provisions of the Internal Revenue Code. Accordingly, no provision has been made for income taxes. The fund files U.S. federal, state, local and non-U.S. tax returns as applicable. The fund's tax returns are subject to examination by the relevant taxing authority until expiration of the applicable statute of limitations, which is generally three years from the date of filing but can be longer in certain jurisdictions. At this time, management believes there are no uncertain tax positions which, based on their technical merit, would not be sustained upon examination and for which it is reasonably possible that the total amounts of unrecognized tax benefits will significantly change in the next twelve months.
Multiple Class — All shares of the fund represent an equal pro rata interest in the net assets of the class to which such shares belong, and have identical voting, dividend, liquidation and other rights and the same terms and conditions, except for class specific expenses and exclusive rights to vote on matters affecting only individual classes. Income, non-class specific expenses, and realized and unrealized capital gains and losses of the fund are allocated to each class of shares based on their relative net assets.
19
Distributions to Shareholders — Distributions from net investment income and net realized gains, if any, are generally declared and paid annually. The fund may make distributions on a more frequent basis to comply with the distribution requirements of the Internal Revenue Code, in all events in a manner consistent with provisions of the 1940 Act. The fund may elect to treat a portion of its payment to a redeeming shareholder, which represents the pro rata share of undistributed net investment income and net realized gains, as a distribution for federal income tax purposes (tax equalization).
Redemption Fees — Prior to October 9, 2017, the fund may have imposed a 2.00% redemption fee on shares held less than 60 days. The fee was not applicable to all classes. The redemption fee was retained by the fund to help cover transaction costs that long-term investors may bear when the fund sells securities to meet investor redemptions.
Indemnifications — Under the corporation’s organizational documents, its officers and directors are indemnified against certain liabilities arising out of the performance of their duties to the fund. In addition, in the normal course of business, the fund enters into contracts that provide general indemnifications. The maximum exposure under these arrangements is unknown as this would involve future claims that may be made against a fund. The risk of material loss from such claims is considered by management to be remote.
3. Fees and Transactions with Related Parties
Certain officers and directors of the corporation are also officers and/or directors of American Century Companies, Inc. (ACC). The corporation’s investment advisor, ACIM, the corporation's distributor, American Century Investment Services, Inc. (ACIS), and the corporation’s transfer agent, American Century Services, LLC, are wholly owned, directly or indirectly, by ACC.
Management Fees — The corporation has entered into a management agreement with ACIM, under which ACIM provides the fund with investment advisory and management services in exchange for a single, unified management fee (the fee) per class. The agreement provides that all expenses of managing and operating the fund, except distribution and service fees, brokerage expenses, taxes, interest, fees and expenses of the independent directors (including legal counsel fees), and extraordinary expenses, will be paid by ACIM. The fee is computed and accrued daily based on each class's daily net assets and paid monthly in arrears. The difference in the fee among the classes is a result of their separate arrangements for non-Rule 12b-1 shareholder services. It is not the result of any difference in advisory or custodial fees or other expenses related to the management of the fund’s assets, which do not vary by class. The rate of the fee is determined by applying a fee rate calculation formula. This formula takes into account the fund’s assets as well as certain assets, if any, of other clients of the investment advisor outside the American Century Investments family of funds (such as subadvised funds and separate accounts) that use very similar investment teams and strategies (strategy assets). From December 1, 2017 through July 31, 2018, the investment advisor agreed to waive 0.20% of the fund's management fee. Effective August 1, 2018, the investment advisor agreed to waive 0.02% of the fund's management fee and expected this waiver to continue until July 31, 2019. The waiver cannot be terminated prior to such date without the approval of the Board of Directors.
The management fee schedule range and the effective annual management fee before and after waiver for each class for the period ended November 30, 2018 are as follows:
Management Fee Schedule Range* | Effective Annual Management Fee | ||
| Before Waiver | After Waiver | ||
| Investor Class | 1.400% to 1.550% | 1.61% | 1.47% |
| I Class | 1.200% to 1.350% | 1.41% | 1.27% |
| A Class | 1.400% to 1.550% | 1.61% | 1.47% |
| C Class | 1.400% to 1.550% | 1.61% | 1.47% |
| R Class | 1.400% to 1.550% | 1.61% | 1.47% |
*Prior to August 1, 2018, the management fee schedule range was 1.400% to 2.000% for Investor Class, A Class, C Class and R Class and 1.200% to 1.800% for I Class.
20
Distribution and Service Fees — The Board of Directors has adopted a separate Master Distribution and Individual Shareholder Services Plan for each of the A Class, C Class and R Class (collectively the plans), pursuant to Rule 12b-1 of the 1940 Act. The plans provide that the A Class will pay ACIS an annual distribution and service fee of 0.25%. The plans provide that the C Class will pay ACIS an annual distribution and service fee of 1.00%, of which 0.25% is paid for individual shareholder services and 0.75% is paid for distribution services. The plans provide that the R Class will pay ACIS an annual distribution and service fee of 0.50%. The fees are computed and accrued daily based on each class’s daily net assets and paid monthly in arrears. The fees are used to pay financial intermediaries for distribution and individual shareholder services. Fees incurred under the plans during the period ended November 30, 2018 are detailed in the Statement of Operations.
Directors' Fees and Expenses — The Board of Directors is responsible for overseeing the investment advisor’s management and operations of the fund. The directors receive detailed information about the fund and its investment advisor regularly throughout the year, and meet at least quarterly with management of the investment advisor to review reports about fund operations. The fund’s officers do not receive compensation from the fund.
Interfund Transactions — The fund may enter into security transactions with other American Century Investments funds and other client accounts of the investment advisor, in accordance with the 1940 Act rules and procedures adopted by the Board of Directors. The rules and procedures require, among other things, that these transactions be effected at the independent current market price of the security. During the period, the interfund purchases and sales were $270,980 and $175,701, respectively. The effect of interfund transactions on the Statement of Operations was $86,993 in net realized gain (loss) on investment transactions.
4. Investment Transactions
Purchases and sales of investment securities, excluding short-term investments, for the period ended November 30, 2018 were $353,616,339 and $314,360,239, respectively.
21
5. Capital Share Transactions
Transactions in shares of the fund were as follows:
| Year ended November 30, 2018 | Year ended November 30, 2017 | |||||||||
| Shares | Amount | Shares | Amount | |||||||
| Investor Class/Shares Authorized | 180,000,000 | 120,000,000 | ||||||||
| Sold | 6,497,321 | $ | 74,175,520 | 4,116,295 | $ | 42,533,004 | ||||
| Issued in reinvestment of distributions | 1,361,687 | 15,058,764 | 4,880 | 40,599 | ||||||
| Redeemed | (7,504,994 | ) | (82,714,974 | ) | (3,173,740 | ) | (31,170,405 | ) | ||
| 354,014 | 6,519,310 | 947,435 | 11,403,198 | |||||||
| I Class/Shares Authorized | 50,000,000 | 50,000,000 | ||||||||
| Sold | 6,668,295 | 75,104,632 | 853,290 | 8,851,517 | ||||||
| Issued in reinvestment of distributions | 116,500 | 1,312,375 | 1,838 | 15,442 | ||||||
| Redeemed | (2,016,478 | ) | (22,295,992 | ) | (760,870 | ) | (8,148,776 | ) | ||
| 4,768,317 | 54,121,015 | 94,258 | 718,183 | |||||||
| A Class/Shares Authorized | 40,000,000 | 40,000,000 | ||||||||
| Sold | 438,179 | 4,956,079 | 406,592 | 3,848,170 | ||||||
| Issued in reinvestment of distributions | 105,230 | 1,155,579 | — | — | ||||||
| Redeemed | (749,566 | ) | (8,232,465 | ) | (999,803 | ) | (10,089,192 | ) | ||
| (206,157 | ) | (2,120,807 | ) | (593,211 | ) | (6,241,022 | ) | |||
| C Class/Shares Authorized | 30,000,000 | 30,000,000 | ||||||||
| Sold | 87,658 | 947,875 | 84,620 | 901,605 | ||||||
| Issued in reinvestment of distributions | 18,225 | 193,355 | — | — | ||||||
| Redeemed | (160,969 | ) | (1,683,628 | ) | (62,567 | ) | (612,643 | ) | ||
| (55,086 | ) | (542,398 | ) | 22,053 | 288,962 | |||||
| R Class/Shares Authorized | 30,000,000 | 30,000,000 | ||||||||
| Sold | 70,738 | 783,772 | 18,549 | 185,040 | ||||||
| Issued in reinvestment of distributions | 7,945 | 86,554 | — | — | ||||||
| Redeemed | (16,675 | ) | (183,592 | ) | (17,071 | ) | (168,997 | ) | ||
| 62,008 | 686,734 | 1,478 | 16,043 | |||||||
| Net increase (decrease) | 4,923,096 | $ | 58,663,854 | 472,013 | $ | 6,185,364 | ||||
6. Fair Value Measurements
The fund’s investments valuation process is based on several considerations and may use multiple inputs to determine the fair value of the investments held by the fund. In conformity with accounting principles generally accepted in the United States of America, the inputs used to determine a valuation are classified into three broad levels.
| • | Level 1 valuation inputs consist of unadjusted quoted prices in an active market for identical investments. |
| • | Level 2 valuation inputs consist of direct or indirect observable market data (including quoted prices for comparable investments, evaluations of subsequent market events, interest rates, prepayment speeds, credit risk, etc.). These inputs also consist of quoted prices for identical investments initially expressed in local currencies that are adjusted through translation into U.S. dollars. |
| • | Level 3 valuation inputs consist of unobservable data (including a fund’s own assumptions). |
The level classification is based on the lowest level input that is significant to the fair valuation measurement. The valuation inputs are not necessarily an indication of the risks associated with investing in these securities or other financial instruments.
22
The following is a summary of the level classifications as of period end. The Schedule of Investments provides additional information on the fund’s portfolio holdings.
| Level 1 | Level 2 | Level 3 | ||||||
| Assets | ||||||||
| Investment Securities | ||||||||
| Common Stocks | ||||||||
| Argentina | $ | 2,594,441 | — | — | ||||
| Brazil | 2,035,694 | $ | 1,349,434 | — | ||||
| Canada | 3,015,866 | 9,663,063 | — | |||||
| China | 2,449,336 | 4,527,652 | — | |||||
| India | 2,933,037 | 2,302,068 | — | |||||
| Netherlands | 2,105,785 | 4,969,154 | — | |||||
| United Kingdom | 1,284,320 | 29,313,446 | — | |||||
| Other Countries | — | 124,304,234 | — | |||||
| Rights | — | 201,176 | — | |||||
| Temporary Cash Investments | 740 | 2,647,953 | — | |||||
| $ | 16,419,219 | $ | 179,278,180 | — | ||||
7. Risk Factors
There are certain risks involved in investing in foreign securities. These risks include those resulting from future adverse political, social and economic developments, fluctuations in currency exchange rates, the possible imposition of exchange controls, and other foreign laws or restrictions. Investing in emerging markets may accentuate these risks.
The fund invests in common stocks of small companies. Because of this, the fund may be subject to greater risk and market fluctuations than a fund investing in larger, more established companies.
The fund’s investment process may result in high portfolio turnover, which could mean high transaction costs, affecting both performance and capital gains tax liabilities to investors.
8. Federal Tax Information
On December 18, 2018, the fund declared and paid a per-share distribution from net realized gains to shareholders of record on December 17, 2018 of $0.2450 for the Investor Class, I Class, A Class, C Class and R Class.
On December 18, 2018, the fund declared and paid the following per-share distributions from net investment income to shareholders of record on December 17, 2018:
| Investor Class | I Class | A Class | C Class | R Class |
| $0.0541 | $0.0715 | $0.0324 | — | $0.0107 |
The tax character of distributions paid during the years ended November 30, 2018 and November 30, 2017 were as follows:
| 2018 | 2017 | |||||
| Distributions Paid From | ||||||
| Ordinary income | $ | 6,196,120 | $ | 57,311 | ||
| Long-term capital gains | $ | 12,238,836 | — | |||
The book-basis character of distributions made during the year from net investment income or net realized gains may differ from their ultimate characterization for federal income tax purposes. These differences reflect the differing character of certain income items and net realized gains and losses for financial statement and tax purposes, and may result in reclassification among certain capital accounts on the financial statements.
The reclassifications, which are primarily due to tax equalization, were made to capital $1,960,128 and distributable earnings $(1,960,128).
23
As of period end, the federal tax cost of investments and the components of distributable earnings on a tax-basis were as follows:
| Federal tax cost of investments | $ | 188,957,381 | |
| Gross tax appreciation of investments | $ | 20,006,227 | |
| Gross tax depreciation of investments | (13,266,209 | ) | |
| Net tax appreciation (depreciation) of investments | 6,740,018 | ||
| Net tax appreciation (depreciation) on translation of assets and liabilities in foreign currencies | (28,066 | ) | |
| Net tax appreciation (depreciation) | $ | 6,711,952 | |
| Undistributed ordinary income | $ | 1,042,369 | |
| Accumulated long-term gains | $ | 4,937,173 | |
| Post-October capital loss deferral | $ | (2,602,576 | ) |
The difference between book-basis and tax-basis unrealized appreciation (depreciation) is attributable primarily to the tax deferral of losses on wash sales.
Loss deferrals represent certain qualified losses that the fund has elected to treat as having been incurred in the following fiscal year for federal income tax purposes.
24
| Financial Highlights |
| For a Share Outstanding Throughout the Years Ended November 30 (except as noted) | |||||||||||||||||
| Per-Share Data | Ratios and Supplemental Data | ||||||||||||||||
| Income From Investment Operations: | Distributions From: | Ratio to Average Net Assets of: | |||||||||||||||
Net Asset Value, Beginning of Period | Net Investment Income (Loss)(1) | Net Realized and Unrealized Gain (Loss) | Total From Investment Operations | Net Investment Income | Net Realized Gains | Total Distributions | Net Asset Value, End of Period | Total Return(2) | Operating Expenses | Operating Expenses (before expense waiver) | Net Investment Income (Loss) | Net Investment Income (Loss) (before expense waiver) | Portfolio Turnover Rate | Net Assets, End of Period (in thousands) | |||
| Investor Class | |||||||||||||||||
| 2018 | $11.94 | 0.01 | (1.51) | (1.50) | (0.06) | (1.05) | (1.11) | $9.33 | (13.98)% | 1.48% | 1.62% | 0.07% | (0.07)% | 140% | $131,043 | ||
| 2017 | $8.49 | (0.01) | 3.46 | 3.45 | —(3) | — | —(3) | $11.94 | 40.69% | 1.53% | 1.73% | (0.11)% | (0.31)% | 124% | $163,540 | ||
| 2016 | $9.08 | (0.01) | (0.36) | (0.37) | (0.08) | (0.14) | (0.22) | $8.49 | (4.14)% | 1.54% | 1.74% | (0.07)% | (0.27)% | 130% | $108,184 | ||
| 2015 | $8.92 | (0.03) | 0.58 | 0.55 | (0.02) | (0.37) | (0.39) | $9.08 | 6.67% | 1.51% | 1.71% | (0.33)% | (0.53)% | 152% | $128,450 | ||
| 2014 | $9.20 | 0.01 | (0.26) | (0.25) | (0.03) | — | (0.03) | $8.92 | (2.77)% | 1.55% | 1.75% | 0.11% | (0.09)% | 128% | $123,835 | ||
| I Class | |||||||||||||||||
| 2018 | $12.07 | 0.04 | (1.54) | (1.50) | (0.08) | (1.05) | (1.13) | $9.44 | (13.81)% | 1.28% | 1.42% | 0.27% | 0.13% | 140% | $53,224 | ||
| 2017 | $8.58 | 0.02 | 3.49 | 3.51 | (0.02) | — | (0.02) | $12.07 | 41.01% | 1.33% | 1.53% | 0.09% | (0.11)% | 124% | $10,529 | ||
| 2016 | $9.18 | 0.01 | (0.38) | (0.37) | (0.09) | (0.14) | (0.23) | $8.58 | (4.05)% | 1.34% | 1.54% | 0.13% | (0.07)% | 130% | $6,674 | ||
| 2015 | $9.02 | (0.01) | 0.58 | 0.57 | (0.04) | (0.37) | (0.41) | $9.18 | 6.82% | 1.31% | 1.51% | (0.13)% | (0.33)% | 152% | $6,685 | ||
| 2014 | $9.29 | 0.03 | (0.27) | (0.24) | (0.03) | — | (0.03) | $9.02 | (2.58)% | 1.35% | 1.55% | 0.31% | 0.11% | 128% | $4,491 | ||
| For a Share Outstanding Throughout the Years Ended November 30 (except as noted) | |||||||||||||||||
| Per-Share Data | Ratios and Supplemental Data | ||||||||||||||||
| Income From Investment Operations: | Distributions From: | Ratio to Average Net Assets of: | |||||||||||||||
Net Asset Value, Beginning of Period | Net Investment Income (Loss)(1) | Net Realized and Unrealized Gain (Loss) | Total From Investment Operations | Net Investment Income | Net Realized Gains | Total Distributions | Net Asset Value, End of Period | Total Return(2) | Operating Expenses | Operating Expenses (before expense waiver) | Net Investment Income (Loss) | Net Investment Income (Loss) (before expense waiver) | Portfolio Turnover Rate | Net Assets, End of Period (in thousands) | |||
| A Class | |||||||||||||||||
| 2018 | $11.84 | (0.02) | (1.50) | (1.52) | (0.03) | (1.05) | (1.08) | $9.24 | (14.25)% | 1.73% | 1.87% | (0.18)% | (0.32)% | 140% | $8,131 | ||
| 2017 | $8.43 | (0.03) | 3.44 | 3.41 | — | — | — | $11.84 | 40.45% | 1.78% | 1.98% | (0.36)% | (0.56)% | 124% | $12,855 | ||
| 2016 | $9.03 | (0.03) | (0.37) | (0.40) | (0.06) | (0.14) | (0.20) | $8.43 | (4.47)% | 1.79% | 1.99% | (0.32)% | (0.52)% | 130% | $14,156 | ||
| 2015 | $8.88 | (0.05) | 0.58 | 0.53 | (0.01) | (0.37) | (0.38) | $9.03 | 6.48% | 1.76% | 1.96% | (0.58)% | (0.78)% | 152% | $19,796 | ||
| 2014 | $9.18 | (0.01) | (0.27) | (0.28) | (0.02) | — | (0.02) | $8.88 | (3.06)% | 1.80% | 2.00% | (0.14)% | (0.34)% | 128% | $14,683 | ||
| C Class | |||||||||||||||||
| 2018 | $11.44 | (0.10) | (1.43) | (1.53) | — | (1.05) | (1.05) | $8.86 | (14.93)% | 2.48% | 2.62% | (0.93)% | (1.07)% | 140% | $1,411 | ||
| 2017 | $8.21 | (0.11) | 3.34 | 3.23 | — | — | — | $11.44 | 39.46% | 2.53% | 2.73% | (1.11)% | (1.31)% | 124% | $2,453 | ||
| 2016 | $8.81 | (0.09) | (0.36) | (0.45) | (0.01) | (0.14) | (0.15) | $8.21 | (5.17)% | 2.54% | 2.74% | (1.07)% | (1.27)% | 130% | $1,579 | ||
| 2015 | $8.73 | (0.12) | 0.57 | 0.45 | —(3) | (0.37) | (0.37) | $8.81 | 5.59% | 2.51% | 2.71% | (1.33)% | (1.53)% | 152% | $1,479 | ||
| 2014 | $9.07 | (0.08) | (0.26) | (0.34) | — | — | — | $8.73 | (3.75)% | 2.55% | 2.75% | (0.89)% | (1.09)% | 128% | $713 | ||
| R Class | |||||||||||||||||
| 2018 | $11.72 | (0.05) | (1.48) | (1.53) | —(3) | (1.05) | (1.05) | $9.14 | (14.46)% | 1.98% | 2.12% | (0.43)% | (0.57)% | 140% | $1,300 | ||
| 2017 | $8.37 | (0.06) | 3.41 | 3.35 | — | — | — | $11.72 | 40.02% | 2.03% | 2.23% | (0.61)% | (0.81)% | 124% | $939 | ||
| 2016 | $8.97 | (0.05) | (0.37) | (0.42) | (0.04) | (0.14) | (0.18) | $8.37 | (4.69)% | 2.04% | 2.24% | (0.57)% | (0.77)% | 130% | $658 | ||
| 2015 | $8.85 | (0.07) | 0.57 | 0.50 | (0.01) | (0.37) | (0.38) | $8.97 | 6.09% | 2.01% | 2.21% | (0.83)% | (1.03)% | 152% | $654 | ||
| 2014 | $9.15 | (0.04) | (0.25) | (0.29) | (0.01) | — | (0.01) | $8.85 | (3.15)% | 2.05% | 2.25% | (0.39)% | (0.59)% | 128% | $583 | ||
| Notes to Financial Highlights | |
| (1) | Computed using average shares outstanding throughout the period. |
| (2) | Total returns are calculated based on the net asset value of the last business day and do not reflect applicable sales charges, if any. Total returns for periods less than one year are not annualized. |
| (3) | Per-share amount was less than $0.005. |
See Notes to Financial Statements.
| Report of Independent Registered Public Accounting Firm |
To the Shareholders and the Board of Directors of American Century World Mutual Funds, Inc.:
Opinion on the Financial Statements and Financial Highlights
We have audited the accompanying statement of assets and liabilities, including the schedule of investments, of International Opportunities Fund, one of the funds constituting the American Century World Mutual Funds, Inc. (the “Fund”), as of November 30, 2018, the related statement of operations for the year then ended, the statements of changes in net assets for each of the two years in the period then ended, the financial highlights for each of the five years in the period then ended, and the related notes. In our opinion, the financial statements and financial highlights present fairly, in all material respects, the financial position of International Opportunities Fund of the American Century World Mutual Funds, Inc. as of November 30, 2018, the results of its operations for the year then ended, the changes in its net assets for each of the two years in the period then ended, and the financial highlights for each of the five years in the period then ended, in conformity with accounting principles generally accepted in the United States of America.
Basis for Opinion
These financial statements and financial highlights are the responsibility of the Fund's management. Our responsibility is to express an opinion on the Fund’s financial statements and financial highlights based on our audits. We are a public accounting firm registered with the Public Company Accounting Oversight Board (United States) (PCAOB) and are required to be independent with respect to the Fund in accordance with the U.S. federal securities laws and the applicable rules and regulations of the Securities and Exchange Commission and the PCAOB.
We conducted our audits in accordance with the standards of the PCAOB. Those standards require that we plan and perform the audit to obtain reasonable assurance about whether the financial statements and financial highlights are free of material misstatement, whether due to error or fraud. The Fund is not required to have, nor were we engaged to perform, an audit of its internal control over financial reporting. As part of our audits we are required to obtain an understanding of internal control over financial reporting but not for the purpose of expressing an opinion on the effectiveness of the Fund’s internal control over financial reporting. Accordingly, we express no such opinion.
Our audits included performing procedures to assess the risks of material misstatement of the financial statements and financial highlights, whether due to error or fraud, and performing procedures that respond to those risks. Such procedures included examining, on a test basis, evidence regarding the amounts and disclosures in the financial statements and financial highlights. Our audits also included evaluating the accounting principles used and significant estimates made by management, as well as evaluating the overall presentation of the financial statements and financial highlights. Our procedures included confirmation of securities owned as of November 30, 2018, by correspondence with the custodian and brokers; when replies were not received from brokers, we performed other auditing procedures. We believe that our audits provide a reasonable basis for our opinion.
DELOITTE & TOUCHE LLP
Kansas City, Missouri
January 17, 2019
We have served as the auditor of one or more American Century investment companies since 1997.
28
| Management |
The Board of Directors
The individuals listed below serve as directors of the funds. Each director will continue to serve in this capacity until death, retirement, resignation or removal from office. The board has adopted a mandatory retirement age for directors who are not “interested persons,” as that term is defined in the Investment Company Act (independent directors). Independent directors shall retire by December 31 of the year in which they reach their 75th birthday.
Mr. Thomas is an “interested person” because he currently serves as President and Chief Executive Officer of American Century Companies, Inc. (ACC), the parent company of American Century Investment Management, Inc. (ACIM or the advisor). The other directors (more than three-fourths of the total number) are independent. They are not employees, directors or officers of, and have no financial interest in, ACC or any of its wholly owned, direct or indirect, subsidiaries, including ACIM, American Century Investment Services, Inc. (ACIS) and American Century Services, LLC (ACS), and they do not have any other affiliations, positions or relationships that would cause them to be considered “interested persons” under the Investment Company Act. The directors serve in this capacity for seven (in the case of Jonathan S. Thomas, 16; and Stephen E. Yates, 8) registered investment companies in the American Century Investments family of funds.
The following table presents additional information about the directors. The mailing address for each director is 4500 Main Street, Kansas City, Missouri 64111.
| Name (Year of Birth) | Position(s) Held with Funds | Length of Time Served | Principal Occupation(s) During Past 5 Years | Number of American Century Portfolios Overseen by Director | Other Directorships Held During Past 5 Years |
| Independent Directors | |||||
| Thomas W. Bunn (1953) | Director | Since 2017 | Retired | 68 | SquareTwo Financial; Barings (formerly Babson Capital Funds Trust) (2013 to 2016) |
| Barry Fink (1955) | Director | Since 2012 (independent since 2016) | Retired; Executive Vice President, ACC (2007 to 2013); President, ACS (2007 to 2013) | 68 | None |
| Jan M. Lewis (1957) | Director | Since 2011 | Retired; President and Chief Executive Officer, Catholic Charities of Northeast Kansas (human services organization) (2006 to 2013) | 68 | None |
M. Jeannine Strandjord(1) (1945) | Director | Since 1994 | Self-employed Consultant | 68 | Euronet Worldwide Inc. and MGP Ingredients, Inc. |
29
| Name (Year of Birth) | Position(s) Held with Funds | Length of Time Served | Principal Occupation(s) During Past 5 Years | Number of American Century Portfolios Overseen by Director | Other Directorships Held During Past 5 Years |
| Independent Directors | |||||
| John R. Whitten (1946) | Director | Since 2008 | Retired | 68 | Rudolph Technologies, Inc. |
| Stephen E. Yates (1948) | Director and Chairman of the Board | Since 2012 (Chairman since 2018) | Retired | 73 | None |
| Interested Director | |||||
| Jonathan S. Thomas (1963) | Director and President | Since 2007 | President and Chief Executive Officer, ACC (2007 to present). Also serves as Chief Executive Officer, ACS; Executive Vice President, ACIM; Director, ACC, ACIM and other ACC subsidiaries | 118 | BioMed Valley Discoveries, Inc. |
(1) Effective December 31, 2018, M. Jeannine Strandjord retired from the Board of Directors.
The Statement of Additional Information has additional information about the fund's directors and is available without charge, upon request, by calling 1-800-345-2021.
30
Officers
The following table presents certain information about the executive officers of the funds. Each officer serves as an officer for each of the 16 (in the case of Robert J. Leach, 15) investment companies in the American Century family of funds. No officer is compensated for his or her service as an officer of the funds. The listed officers are interested persons of the funds and are appointed or re-appointed on an annual basis. The mailing address for each officer listed below is 4500 Main Street, Kansas City, Missouri 64111.
| Name (Year of Birth) | Offices with the Funds | Principal Occupation(s) During the Past Five Years |
| Jonathan S. Thomas (1963) | Director and President since 2007 | President and Chief Executive Officer, ACC (2007 to present). Also serves as Chief Executive Officer, ACS; Executive Vice President, ACIM; Director, ACC, ACIM and other ACC subsidiaries |
| R. Wes Campbell (1974) | Chief Financial Officer and Treasurer since 2018 | Investment Operations and Investment Accounting, ACS (2000 to present) |
| Amy D. Shelton (1964) | Chief Compliance Officer and Vice President since 2014 | Chief Compliance Officer, American Century funds, (2014 to present); Chief Compliance Officer, ACIM (2014 to present); Chief Compliance Officer, ACIS (2009 to present); Vice President, Client Interactions and Marketing, ACIS (2013 to 2014). Also serves as Vice President, ACIS |
| Charles A. Etherington (1957) | General Counsel since 2007 and Senior Vice President since 2006 | Attorney, ACC (1994 to present); Vice President, ACC (2005 to present); General Counsel, ACC (2007 to present). Also serves as General Counsel, ACIM, ACS, ACIS and other ACC subsidiaries; and Senior Vice President, ACIM and ACS |
| C. Jean Wade (1964) | Vice President since 2012 | Senior Vice President, ACS (2017 to present); Vice President, ACS (2000 to 2017) |
| Robert J. Leach (1966) | Vice President since 2006 | Vice President, ACS (2000 to present) |
| David H. Reinmiller (1963) | Vice President since 2000 | Attorney, ACC (1994 to present). Also serves as Vice President, ACIM and ACS |
| Ward D. Stauffer (1960) | Secretary since 2005 | Attorney, ACC (2003 to present) |
31
| Approval of Management Agreement |
At a meeting held on June 28, 2018, the Fund’s Board of Directors (the "Board") unanimously approved the renewal of the management agreement pursuant to which American Century Investment Management, Inc. (the “Advisor”) acts as the investment advisor for the Fund. Under Section 15(c) of the Investment Company Act, contracts for investment advisory services are required to be reviewed, evaluated, and approved by a majority of a fund’s directors (the “Directors”), including a majority of the independent Directors, each year.
Prior to its consideration of the renewal of the management agreement, the Directors requested and reviewed extensive data and information compiled by the Advisor and certain independent providers of evaluation data concerning the Fund and the services provided to the Fund by the Advisor. This review was in addition to the oversight and evaluation undertaken by the Board and its committees on a continual basis and the information received was supplemental to the extensive information that the Board and its committees receive and consider throughout the year. The Directors also conducted a review of the process by which the Board considers the renewal of the management agreements. The Board consulted with industry experts and reviewed industry best practices and recent judicial precedent. The Directors believe that the enhancements resulting from their review resulted in increased dialogue with the Advisor and an improved process for fund shareholders.
In connection with its consideration of the renewal of the management agreement, the Board’s review and evaluation of the services provided by the Advisor included, but was not limited to, the following:
| • | the nature, extent, and quality of investment management, shareholder services, and other services provided and to be provided to the Fund; |
| • | the wide range of other programs and services provided and to be provided to the Fund and its shareholders on a routine and non-routine basis; |
| • | the investment performance of the Fund, including data comparing the Fund's performance to appropriate benchmarks and/or a peer group of other mutual funds with similar investment objectives and strategies; |
| • | the cost of owning the Fund compared to the cost of owning similar funds; |
| • | the compliance policies, procedures, and regulatory experience of the Advisor and the Fund's service providers; |
| • | financial data showing the cost of services provided to the Fund, the profitability of the Fund to the Advisor, and the overall profitability of the Advisor |
| • | strategic plans of the Advisor; |
| • | any economies of scale associated with the Advisor’s management of the Fund and other accounts; |
| • | services provided and charges to the Advisor's other investment management clients; |
| • | acquired fund fees and expenses; |
| • | payments and practices in connection with financial intermediaries holding shares of the Fund and the services provided by intermediaries in connection therewith; and |
| • | any collateral benefits derived by the Advisor from the management of the Fund. |
The Directors held two in-person meetings and one telephonic meeting to review and discuss the information provided. The independent Directors also reviewed responses to supplemental information requests provided by the Directors to the Advisor and held active discussions with the Advisor regarding the renewal of the management agreement. The independent Directors had the benefit of the advice of their independent counsel throughout the process.
32
Factors Considered
The Directors considered all of the information provided by the Advisor, the independent data providers, and independent counsel in connection with the approval. They determined that the information was sufficient for them to evaluate the management agreement for the Fund. In connection with their review, the Directors did not identify any single factor as being all-important or controlling, and each Director may have attributed different levels of importance to different factors. In deciding to renew the management agreement, the Board based its decision on a number of factors, including without limitation the following:
Nature, Extent and Quality of Services - Generally. Under the management agreement, the Advisor is responsible for providing or arranging for all services necessary for the operation of the Fund. The Board noted that the Advisor provides or arranges at its own expense a wide variety of services including without limitation the following:
| • | portfolio research and security selection |
| • | securities trading |
| • | Fund administration |
| • | custody of Fund assets |
| • | daily valuation of the Fund’s portfolio |
| • | shareholder servicing and transfer agency, including shareholder confirmations, recordkeeping, and communications |
| • | legal services (except the independent Directors’ counsel) |
| • | regulatory and portfolio compliance |
| • | financial reporting |
| • | marketing and distribution (except amounts paid by the Fund under Rule 12b-1 plans) |
The Board noted that many of these services have expanded over time in terms of both quantity and complexity in response to shareholder demands, competition in the industry, changing distribution channels, and the changing regulatory environment.
Investment Management Services. The nature of the investment management services provided to the Fund is quite complex and allows Fund shareholders access to professional money management, instant diversification of their investments within an asset class, the opportunity to easily diversify among asset classes by investing in or exchanging among various American Century Investments funds, and liquidity. In evaluating investment performance, the Board expects the Advisor to manage the Fund in accordance with its investment objectives and approved strategies. Further, the Directors recognize that the Advisor has an obligation to monitor trading activities, and in particular to seek the best execution of fund trades, and to evaluate the use of and payment for research. In providing these services, the Advisor utilizes teams of investment professionals (portfolio managers, analysts, research assistants, and securities traders) who require extensive information technology, research, training, compliance, and other systems to conduct their business. The Board, directly and through its Fund Performance Review Committee, provides oversight of the investment performance process. It regularly reviews investment performance information for the Fund, together with comparative information for appropriate benchmarks and/or peer groups of similarly-managed funds, over different time horizons. The Directors also review detailed performance information provided by the Advisor during the management agreement renewal process. If performance concerns are identified, the Fund receives special reviews until performance improves, during which the Board receives a report from the Advisor regarding the reasons for such results (e.g., market conditions, security selection) and any efforts being undertaken to improve performance. The Fund’s performance was above its benchmark for the one-, three-, five-, and ten-year periods reviewed by the Board. The Board found the investment management services provided by the Advisor to the Fund to be satisfactory and consistent with the management agreement.
33
Shareholder and Other Services. Under the management agreement, the Advisor provides the Fund with a comprehensive package of transfer agency, shareholder, and other services. The Board, directly and through various committees of the Board, regularly reviews reports and evaluations of such services at its regular meetings. These reports include, but are not limited to, information regarding the operational efficiency and accuracy of the shareholder and transfer agency services provided, staffing levels, shareholder satisfaction (as measured by external as well as internal sources), technology support, new products and services offered to Fund shareholders, securities trading activities, portfolio valuation services, auditing services, and legal and operational compliance activities. The Board found the services provided by the Advisor to the Fund under the management agreement to be competitive and of high quality.
Costs of Services and Profitability. The Advisor provides detailed information concerning its cost of providing various services to the Fund, its profitability in managing the Fund (pre- and post-distribution), its overall profitability, and its financial condition. The Directors have reviewed with the Advisor the methodology used to prepare this financial information. This information is considered in evaluating the Advisor’s financial condition, its ability to continue to provide services under the management agreement, and the reasonableness of the current management fee. The Board concluded that the Advisor’s profits were reasonable in light of the services provided to the Fund.
Ethics. The Board generally considers the Advisor’s commitment to providing quality services to shareholders and to conducting its business ethically. They noted that the Advisor’s practices generally meet or exceed industry best practices.
Economies of Scale. The Board also reviewed information provided by the Advisor regarding the possible existence of economies of scale in connection with the management of the Fund. The Board concluded that economies of scale are difficult to measure and predict with precision, especially on a fund-by-fund basis. The Board concluded that the Advisor is appropriately sharing economies of scale through its competitive fee structure, offering competitive fees from fund inception, and through reinvestment in its business to provide shareholders additional content and services. The Board also noted that economies of scale are shared with the Fund and its shareholders through management fee breakpoints that serve to reduce the effective management fee as the assets of the Fund grow.
Comparison to Other Funds’ Fees. The management agreement provides that the Fund pays the Advisor a single, all-inclusive (or unified) management fee for providing all services necessary for the management and operation of the Fund, other than brokerage expenses, expenses attributable to short sales, taxes, interest, extraordinary expenses, and the fees and expenses of the Fund’s independent Directors (including their independent legal counsel) and expenses incurred in connection with the provision of shareholder services and distribution services under a plan adopted pursuant to Rule 12b-1 under the 1940 Act. Under the unified fee structure, the Advisor is responsible for providing all investment advisory, custody, audit, administrative, compliance, recordkeeping, marketing and shareholder services, or arranging and supervising third parties to provide such services. By contrast, most other funds are charged a variety of fees, including an investment advisory fee, a transfer agency fee, an administrative fee, distribution charges, and other expenses. Other than their investment advisory fees and any applicable Rule 12b-1 distribution fees, all other components of the total fees charged by these other funds may be increased without shareholder approval. The Board believes the unified fee structure is a benefit to Fund shareholders because it clearly discloses to shareholders the cost of owning Fund shares, and, since the unified fee cannot be increased without a vote of Fund shareholders, it shifts to the Advisor the risk of increased costs of operating the Fund and provides a direct incentive to minimize administrative inefficiencies. Part of the Board’s analysis of fee levels involves reviewing certain evaluative data compiled by an independent provider comparing the Fund’s unified fee to the total expense ratios of its peers. The unified fee charged to shareholders of the Fund was above the median of the total expense ratios of the Fund’s peer expense universe and was within the range of its peer expense group. The Board and the Advisor agreed to both a permanent change to the fund's fee schedule that could have the effect of lowering the fund's annual unified
34
management fee by approximately 0.20%, beginning August 1, 2018, and a temporary reduction of the Fund's annual unified management fee of 0.02% (e.g., the Investor Class unified fee will be reduced from 1.73% to 1.51%).The Board concluded that the management fee paid by the Fund to the Advisor under the management agreement is reasonable in light of the services provided to the Fund.
Comparison to Fees and Services Provided to Other Clients of the Advisor. The Directors also requested and received information from the Advisor concerning the nature of the services, fees, costs, and profitability of its advisory services to advisory clients other than the Fund. They observed that these varying types of client accounts require different services and involve different regulatory and entrepreneurial risks than the management of the Fund. The Board analyzed this information and concluded that the fees charged and services provided to the Fund were reasonable by comparison.
Payments to Intermediaries. The Directors also requested and received a description of payments made to intermediaries by the Fund and the Advisor and services provided in response thereto. These payments include various payments made by the Fund or the Advisor to different types of intermediaries and recordkeepers for distribution and service activities provided for the Fund. The Board reviewed such information and received representations from the Advisor that all such payments by the Fund were made pursuant to the Fund's Rule 12b-1 Plan and that all such payments by the Advisor were made from the Advisor’s resources and reasonable profits. The Board found the payments to be reasonable in scope and purpose.
Collateral or “Fall-Out” Benefits Derived by the Advisor. The Board considered the existence of collateral benefits the Advisor may receive as a result of its relationship with the Fund. They concluded that the Advisor’s primary business is managing mutual funds and it generally does not use fund or shareholder information to generate profits in other lines of business, and therefore does not derive any significant collateral benefits from them. The Board noted that additional assets from other clients may offer the Advisor some benefit from increased leverage with service providers and counterparties. Additionally, the Advisor may receive proprietary research from broker-dealers that execute fund portfolio transactions, which the Board concluded is likely to benefit other clients of the Advisor, as well as Fund shareholders. The Board also determined that the Advisor is able to provide investment management services to certain clients other than the Fund, at least in part, due to its existing infrastructure built to serve the fund complex. The Board concluded that appropriate allocation methodologies had been employed to assign resources and the cost of those resources to these other clients and, where expressly provided, these other client assets may be included with the assets of the Fund to determine breakpoints in the management fee schedule.
Existing Relationship. The Board also considered whether there was any reason for not continuing the existing arrangement with the Advisor. In this regard, the Board was mindful of the potential disruptions of the Fund’s operations and various risks, uncertainties, and other effects that could occur as a result of a decision not to continue such relationship. In particular, the Board recognized that most shareholders have invested in the Fund on the strength of the Advisor’s industry standing and reputation and in the expectation that the Advisor will have a continuing role in providing advisory services to the Fund.
Conclusion of the Directors. As a result of this process, the Board, including all of the independent Directors, taking into account all of the factors discussed above and the information provided by the Advisor and others in connection with its review and throughout the year, determined that the management fee is fair and reasonable in light of the services provided and that the investment management agreement between the Fund and the Advisor should be renewed.
35
| Additional Information |
Retirement Account Information
As required by law, distributions you receive from certain retirement accounts are subject to federal income tax withholding, unless you elect not to have withholding apply*. Tax will be withheld on the total amount withdrawn even though you may be receiving amounts that are not subject to withholding, such as nondeductible contributions. In such case, excess amounts of withholding could occur. You may adjust your withholding election so that a greater or lesser amount will be withheld.
If you don’t want us to withhold on this amount, you must notify us to not withhold the federal income tax. You may notify us in writing or in certain situations by telephone or through other electronic means. For systematic withdrawals, your withholding election will remain in effect until revoked or changed by filing a new election. You have the right to revoke your election at any time and change your withholding percentage for future distributions.
Remember, even if you elect not to have income tax withheld, you are liable for paying income tax on the taxable portion of your withdrawal. If you elect not to have income tax withheld or you don’t have enough income tax withheld, you may be responsible for payment of estimated tax. You may incur penalties under the estimated tax rules if your withholding and estimated tax payments are not sufficient. You can reduce or defer the income tax on a distribution by directly or indirectly rolling such distribution over to another IRA or eligible plan. You should consult your tax advisor for additional information.
State tax will be withheld if, at the time of your distribution, your address is within one of the mandatory withholding states and you have federal income tax withheld (or as otherwise required by state law). State taxes will be withheld from your distribution in accordance with the respective state rules.
*Some 403(b), 457 and qualified retirement plan distributions may be subject to 20% mandatory withholding, as they are subject to special tax and withholding rules. Your plan administrator or plan sponsor is required to provide you with a special tax notice explaining those rules at the time you request a distribution. If applicable, federal and/or state taxes may be withheld from your distribution amount.
Proxy Voting Policies
A description of the policies that the fund's investment advisor uses in exercising the voting rights associated with the securities purchased and/or held by the fund is available without charge, upon request, by calling 1-800-345-2021. It is also available on the "About Us" page of American Century Investments’ website at americancentury.com and on the Securities and Exchange Commission’s website at sec.gov. Information regarding how the investment advisor voted proxies relating to portfolio securities during the most recent 12-month period ended June 30 is available on the "About Us" page at americancentury.com. It is also available at sec.gov.
Quarterly Portfolio Disclosure
The fund files its complete schedule of portfolio holdings with the Securities and Exchange Commission (SEC) for the first and third quarters of each fiscal year on Form N-Q. The fund’s Forms N-Q are available on the SEC’s website at sec.gov. The fund also makes its complete schedule of portfolio holdings for the most recent quarter of its fiscal year available on its website at americancentury.com and, upon request, by calling 1-800-345-2021.
36
Other Tax Information
The following information is provided pursuant to provisions of the Internal Revenue Code.
The fund hereby designates up to the maximum amount allowable as qualified dividend income for the fiscal year ended November 30, 2018.
The fund hereby designates $14,048,094, or up to the maximum amount allowable, as long-term capital gain distributions (20% rate gain distributions) for the fiscal year ended November 30, 2018.
The fund hereby designates $5,233,468 as qualified short-term capital gain distributions for purposes of Internal Revenue Code Section 871 for the fiscal year ended November 30, 2018.
For the fiscal year ended November 30, 2018, the fund intends to pass through to shareholders foreign source income of $3,806,648 and foreign taxes paid of $315,278, or up to the maximum amount allowable, as a foreign tax credit. Foreign source income and foreign tax expense per outstanding share on November 30, 2018 are $0.1824 and $0.0151 respectively.
The fund utilized earnings and profits of $1,960,128 distributed to shareholders on redemption of shares as part of the dividends paid deduction (tax equalization).
37
| Notes |
38
| Notes |
39
| Notes |
40
| ||
| Contact Us | americancentury.com | |
| Automated Information Line | 1-800-345-8765 | |
| Investor Services Representative | 1-800-345-2021 or 816-531-5575 | |
| Investors Using Advisors | 1-800-378-9878 | |
| Business, Not-For-Profit, Employer-Sponsored Retirement Plans | 1-800-345-3533 | |
| Banks and Trust Companies, Broker-Dealers, Financial Professionals, Insurance Companies | 1-800-345-6488 | |
| Telecommunications Relay Service for the Deaf | 711 | |
| American Century World Mutual Funds, Inc. | ||
Investment Advisor: American Century Investment Management, Inc. Kansas City, Missouri | ||
| This report and the statements it contains are submitted for the general information of our shareholders. The report is not authorized for distribution to prospective investors unless preceded or accompanied by an effective prospectus. | ||
| ©2019 American Century Proprietary Holdings, Inc. All rights reserved. CL-ANN-91032 1901 | ||
| Annual Report | |
| November 30, 2018 | |
| International Value Fund | |
| Investor Class (ACEVX) | |
| I Class (ACVUX) | |
| A Class (MEQAX) | |
| C Class (ACCOX) | |
| R Class (ACVRX) | |
| R6 Class (ACVDX) | |
Beginning on January 1, 2021, as permitted by regulations adopted by the Securities and Exchange Commission, paper copies of the fund’s shareholder reports like this one will no longer be sent by mail, unless you specifically request paper copies of the reports from the fund or from your financial intermediary, such as a broker-dealer or bank. Instead, the reports will be made available on a website, and you will be notified by mail each time a report is posted and provided with a website link to access the report.
If you already elected to receive shareholder reports electronically, you will not be affected by this change and you need not take any action. You may elect to receive shareholder reports and other communications from the fund or your financial intermediary electronically by calling or sending an email request to your appropriate contacts as listed on the back cover of this report.
You may elect to receive all future reports in paper free of charge. You can inform the fund or your financial intermediary that you wish to continue receiving paper copies of your shareholder reports by calling or sending an email request to your appropriate contacts as listed on the back cover of this report. Your election to receive reports in paper will apply to all funds held with the fund complex/your financial intermediary.
| Table of Contents |
| President’s Letter | 2 | |
| Performance | 3 | |
| Portfolio Commentary | ||
| Fund Characteristics | ||
| Shareholder Fee Example | ||
| Schedule of Investments | ||
| Statement of Assets and Liabilities | ||
| Statement of Operations | ||
| Statement of Changes in Net Assets | ||
| Notes to Financial Statements | ||
| Financial Highlights | ||
| Report of Independent Registered Public Accounting Firm | ||
| Management | ||
| Approval of Management Agreement | ||
| Additional Information | ||
Any opinions expressed in this report reflect those of the author as of the date of the report, and do not necessarily represent the opinions of American Century Investments® or any other person in the American Century Investments organization. Any such opinions are subject to change at any time based upon market or other conditions and American Century Investments disclaims any responsibility to update such opinions. These opinions may not be relied upon as investment advice and, because investment decisions made by American Century Investments funds are based on numerous factors, may not be relied upon as an indication of trading intent on behalf of any American Century Investments fund. Security examples are used for representational purposes only and are not intended as recommendations to purchase or sell securities. Performance information for comparative indices and securities is provided to American Century Investments by third party vendors. To the best of American Century Investments’ knowledge, such information is accurate at the time of printing.
| President’s Letter |
Jonathan ThomasDear Investor:
Thank you for reviewing this annual report for the 12 months ended November 30, 2018. Annual reports help convey important information about fund returns, including market factors that affected performance during the reporting period. For additional investment and market insights, please visit our website, americancentury.com.
Global Growth Divergence Drives Disparity in Stock Returns
The synchronization of global economic growth, which helped deliver robust gains for global stocks in 2017, unraveled as the 12-month period unfolded. The U.S. economy continued to expand at a healthy pace, but other regions experienced notable slowdowns. Similarly, stocks advanced in the U.S. but generally declined elsewhere.
In Europe, the threat of global tariffs from the U.S. dampened business sentiment and corporate earnings growth. In addition, uncertainties surrounding Brexit negotiations, Italy’s fiscal woes, and civil unrest in France weighed on economic and earnings growth outlooks and stock performance. Meanwhile, Japan’s economy contracted late in the period, largely due to the effects of several natural disasters, which curtailed personal and business spending. Global trade tensions also pressured Japan’s growth outlook.
After starting strong, emerging markets stocks quickly reversed course. The key culprits included rising U.S. interest rates, U.S.-China tariffs, and global trade-policy uncertainty. In addition, a strong U.S. dollar, falling oil prices, and several country-specific events weighed on the asset class. Late in the period, prospects for a tariff truce between the U.S. and China, along with dovish comments from the Federal Reserve, sparked a November rally among emerging markets stocks.
Overall, U.S. stocks, as measured by the S&P 500 Index, returned 6.27% for the 12 months. Non-U.S. developed markets stocks, as measured by the MSCI EAFE Index, declined 7.94%. Emerging markets stocks, as measured by the MSCI Emerging Markets Index, fell 9.09%.
Looking ahead, investors face a backdrop of uneven global growth, heightened market volatility, and lingering geopolitical uncertainties. But it’s often these challenging markets that produce the most compelling investment opportunities. We believe this scenario underscores the importance of using professionally managed portfolios in pursuit of investment goals. We appreciate your continued trust and confidence in us.
Sincerely,
Jonathan Thomas
President and Chief Executive Officer
American Century Investments
2
| Performance |
| Total Returns as of November 30, 2018 | ||||||
Average Annual Returns | ||||||
Ticker Symbol | 1 year | 5 years | 10 years | Since Inception | Inception Date | |
| Investor Class | ACEVX | -12.25% | -0.53% | 6.14% | — | 4/3/06 |
| MSCI EAFE Value Index | — | -9.02% | 0.66% | 6.61% | — | — |
| I Class | ACVUX | -12.05% | -0.31% | 6.35% | — | 4/3/06 |
| A Class | MEQAX | 3/31/97 | ||||
| No sales charge | -12.43% | -0.76% | 5.87% | — | ||
| With sales charge | -17.48% | -1.93% | 5.26% | — | ||
| C Class | ACCOX | -13.04% | -1.49% | 5.08% | — | 4/3/06 |
| R Class | ACVRX | -12.74% | -1.03% | 5.59% | — | 4/3/06 |
| R6 Class | ACVDX | -11.91% | -0.16% | — | 1.50% | 7/26/13 |
Average annual returns since inception are presented when ten years of performance history is not available.
Sales charges include initial sales charges and contingent deferred sales charges (CDSCs), as applicable. A Class shares have a 5.75% maximum initial sales charge and may be subject to a maximum CDSC of 1.00%. C Class shares redeemed within 12 months of purchase are subject to a maximum CDSC of 1.00%. The SEC requires that mutual funds provide performance information net of maximum sales charges in all cases where charges could be applied.
Data presented reflect past performance. Past performance is no guarantee of future results. Current performance may be higher or lower than the performance shown. Total returns for periods less than one year are not annualized. Investment return and principal value will fluctuate, and redemption value may be more or less than original cost. Data assumes reinvestment of dividends and capital gains, and none of the charts reflect the deduction of taxes that a shareholder would pay on fund distributions or the redemption of fund shares. To obtain performance data current to the most recent month end, please call 1-800-345-2021 or visit americancentury.com. For additional information about the fund, please consult the prospectus.
3
| Growth of $10,000 Over 10 Years |
| $10,000 investment made November 30, 2008 |
| Performance for other share classes will vary due to differences in fee structure. |
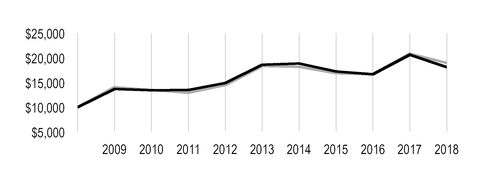
| Value on November 30, 2018 | |
| Investor Class — $18,145 | |
| MSCI EAFE Value Index — $18,972 | |
The investment advisor is presenting performance for the Investor Class, which is a change from the prior annual report. Of the classes with 10 or more years of annual returns, Investor Class is the largest.
Total Annual Fund Operating Expenses | |||||
| Investor Class | I Class | A Class | C Class | R Class | R6 Class |
| 1.30% | 1.10% | 1.55% | 2.30% | 1.80% | 0.95% |
The total annual fund operating expenses shown is as stated in the fund’s prospectus current as of the date of this report. The prospectus may vary from the expense ratio shown elsewhere in this report because it is based on a different time period, includes acquired fund fees and expenses, and, if applicable, does not include fee waivers or expense reimbursements.
Data presented reflect past performance. Past performance is no guarantee of future results. Current performance may be higher or lower than the performance shown. Total returns for periods less than one year are not annualized. Investment return and principal value will fluctuate, and redemption value may be more or less than original cost. Data assumes reinvestment of dividends and capital gains, and none of the charts reflect the deduction of taxes that a shareholder would pay on fund distributions or the redemption of fund shares. To obtain performance data current to the most recent month end, please call 1-800-345-2021 or visit americancentury.com. For additional information about the fund, please consult the prospectus.
4
| Portfolio Commentary |
Portfolio Managers: Elizabeth Xie and Vinod Chandrashekaran
Performance Summary
International Value fell -12.25%* for the fiscal year ended November 30, 2018, compared with the -9.02% return of its benchmark, the MSCI EAFE Value Index. Fund results reflect operating expenses, while benchmark returns do not.
Global stock markets delivered synchronized growth and robust gains for the first several months of the reporting period. However, a decoupling occurred in February, as market volatility re-entered the picture on the back of slowing economic growth outside the U.S., worries about rising interest rates and inflation in the U.S., and the threat of a global trade war. After a short bout of turmoil, the U.S. continued on a smooth growth trajectory throughout the spring and summer, fueled by robust corporate earnings and positive economic indicators. During this time, many eurozone and emerging markets economies stalled. A strong U.S. dollar, slowing growth, and hostile trade rhetoric helped to suppress non-U.S. market returns. In late summer, volatility crept back into the picture in U.S. markets. Investors could no longer overlook the potential effects of trade tariffs and midterm elections, coupled with economic and political issues abroad in Italy, Turkey, Argentina, and the U.K. In October, markets moved sharply lower. Continued worries over rising interest rates, trade disputes, and falling commodity prices pressured equity markets throughout the rest of the period.
Our stock selection process incorporates factors of valuation, quality, growth, and sentiment, while minimizing unintended risks among industries and other risk characteristics. Weak stock selection, particularly in the industrials, communication services, and energy sectors, detracted most from relative results. Utilities, real estate, and consumer discretionary also detracted from performance. Conversely, the health care, financials, materials, and consumer staples sectors added to relative returns, largely as a result of positive stock selection.
Geographically, stock selection within Japan, France, Hong Kong, Germany, and Sweden weighed on the fund’s results. In contrast, positioning in Switzerland, Norway, and Finland contributed meaningfully to relative returns.
Japan Holdings Detracted from Performance
In Japan, positions in Leopalace21, Kajima, and Subaru all weighed on results. Real estate developer and manager Leopalace21 saw its price fall during the latter half of the period as investors reacted poorly to business expansion efforts across Asia. Building and construction engineering company Kajima also suffered throughout the year after accusations of bid-rigging hurt the corporate reputation near the beginning of the reporting period. We have since closed the position. The price of automaker Subaru struggled the last several months due to production delays and expensive recalls.
*All fund returns referenced in this commentary are for Investor Class shares. Performance for other share classes will vary due to differences in fee structure; when Investor Class performance exceeds that of the fund's benchmark, other share classes may not. See page 3 for returns for all share classes.
5
Among notable individual detractors was a stake in U.K.-based vacation services firm Thomas Cook Group. The firm’s revenues suffered due to low bookings during the summer vacation season. The company recently issued a profit warning, which further depressed prices. We have since exited our position. A position in U.K.-based aerospace and defense firm BAE Systems also detracted from performance after its price faced pressure late in the period partly fueled by concerns over Brexit and the U.K. economy.
Pharmaceuticals Companies Among Top Contributors
Positioning in many pharmaceuticals companies, such as Sumitomo Dainippon Pharma Co., GlaxoSmithKline, and Bayer, helped returns. Japan-based Sumitomo Dainippon Pharma saw its stock price rise based on earnings, which beat estimates for much of the period. U.K.-based GlaxoSmithKline saw price volatility over the period, but saw appreciation during the first quarter of 2018 when news that the release of a generic version of its blockbuster asthma medication, Advair, would be delayed in the U.S. An underweight to German-based company Bayer was also helpful to returns. Bayer was hurt by its recent acquisition of Monsanto. The stock of the drug and chemical company slid considerably in August after litigation over Monsanto’s cornerstone weed killing product, Roundup, delivered an unfavorable outcome. The price continued to decline for the remainder of the period.
A Look Ahead
Looking generally at economic prospects outside the U.S., economic fundamentals are mixed. On the one hand, economic growth is moderating and uncertainty is high because of ongoing trade tensions. On the other hand, valuations across many non-U.S. markets are at or below long-term averages, and corporate earnings growth remains fairly healthy. Add it all up, and we think it’s reasonable to expect more volatility going forward.
We believe our disciplined investment approach is particularly beneficial during periods of likely volatility, and we adhere to our process regardless of the market environment. We believe that this allows us to take advantage of opportunities presented by market inefficiencies.
6
| Fund Characteristics |
| NOVEMBER 30, 2018 | |
Top Ten Holdings | % of net assets |
| Royal Dutch Shell plc, B Shares | 3.8% |
| Novartis AG | 3.2% |
| HSBC Holdings plc | 2.6% |
| GlaxoSmithKline plc | 2.4% |
| BHP Group plc | 1.9% |
| Australia & New Zealand Banking Group Ltd. | 1.8% |
| Toyota Motor Corp. | 1.8% |
| Zurich Insurance Group AG | 1.7% |
| Rio Tinto plc | 1.7% |
| TOTAL SA | 1.7% |
Types of Investments in Portfolio | % of net assets |
| Common Stocks | 98.0% |
| Exchange-Traded Funds | 0.2% |
| Total Equity Exposure | 98.2% |
| Temporary Cash Investments | 1.0% |
| Other Assets and Liabilities | 0.8% |
Investments by Country | % of net assets |
| Japan | 24.8% |
| United Kingdom | 21.9% |
| France | 8.3% |
| Switzerland | 7.8% |
| Australia | 5.2% |
| Netherlands | 4.1% |
| Germany | 3.8% |
| Spain | 3.1% |
| Hong Kong | 3.1% |
| Norway | 2.6% |
| Israel | 2.5% |
| Singapore | 2.4% |
| Other Countries | 8.4% |
| Exchange-Traded Funds* | 0.2% |
| Cash and Equivalents** | 1.8% |
*Category may increase exposure to the countries indicated. The Schedule of Investments provides additional information on the fund's portfolio holdings.
**Includes temporary cash investments and other assets and liabilities.
7
| Shareholder Fee Example |
Fund shareholders may incur two types of costs: (1) transaction costs, including sales charges (loads) on purchase payments and redemption/exchange fees; and (2) ongoing costs, including management fees; distribution and service (12b-1) fees; and other fund expenses. This example is intended to help you understand your ongoing costs (in dollars) of investing in your fund and to compare these costs with the ongoing cost of investing in other mutual funds.
The example is based on an investment of $1,000 made at the beginning of the period and held for the entire period from June 1, 2018 to November 30, 2018.
Actual Expenses
The table provides information about actual account values and actual expenses for each class. You may use the information, together with the amount you invested, to estimate the expenses that you paid over the period. First, identify the share class you own. Then simply divide your account value by $1,000 (for example, an $8,600 account value divided by $1,000 = 8.6), then multiply the result by the number under the heading “Expenses Paid During Period” to estimate the expenses you paid on your account during this period.
If you hold Investor Class shares of any American Century Investments fund, or I Class shares of the American Century Diversified Bond Fund, in an American Century Investments account (i.e., not a financial intermediary or retirement plan account), American Century Investments may charge you a $12.50 semiannual account maintenance fee if the value of those shares is less than $10,000. We will redeem shares automatically in one of your accounts to pay the $12.50 fee. In determining your total eligible investment amount, we will include your investments in all personal accounts (including American Century Investments Brokerage accounts) registered under your Social Security number. Personal accounts include individual accounts, joint accounts, UGMA/UTMA accounts, personal trusts, Coverdell Education Savings Accounts and IRAs (including traditional, Roth, Rollover, SEP-, SARSEP- and SIMPLE-IRAs), and certain other retirement accounts. If you have only business, business retirement, employer-sponsored or American Century Investments Brokerage accounts, you are currently not subject to this fee. If you are subject to the Account Maintenance Fee, your account value could be reduced by the fee amount.
Hypothetical Example for Comparison Purposes
The table also provides information about hypothetical account values and hypothetical expenses based on the actual expense ratio of each class of your fund and an assumed rate of return of 5% per year before expenses, which is not the actual return of a fund’s share class. The hypothetical account values and expenses may not be used to estimate the actual ending account balance or expenses you paid for the period. You may use this information to compare the ongoing costs of investing in your fund and other funds. To do so, compare this 5% hypothetical example with the 5% hypothetical examples that appear in the shareholder reports of the other funds.
Please note that the expenses shown in the table are meant to highlight your ongoing costs only and do not reflect any transactional costs, such as sales charges (loads) or redemption/exchange fees. Therefore, the table is useful in comparing ongoing costs only, and will not help you determine the relative total costs of owning different funds. In addition, if these transactional costs were included, your costs would have been higher.
8
| Beginning Account Value 6/1/18 | Ending Account Value 11/30/18 | Expenses Paid During Period(1) 6/1/18 - 11/30/18 | Annualized Expense Ratio(1) | |
Actual | ||||
| Investor Class | $1,000 | $892.10 | $6.12 | 1.29% |
| I Class | $1,000 | $893.30 | $5.17 | 1.09% |
| A Class | $1,000 | $892.50 | $7.31 | 1.54% |
| C Class | $1,000 | $889.20 | $10.85 | 2.29% |
| R Class | $1,000 | $889.70 | $8.48 | 1.79% |
| R6 Class | $1,000 | $894.50 | $4.46 | 0.94% |
| Hypothetical | ||||
| Investor Class | $1,000 | $1,018.60 | $6.53 | 1.29% |
| I Class | $1,000 | $1,019.60 | $5.52 | 1.09% |
| A Class | $1,000 | $1,017.35 | $7.79 | 1.54% |
| C Class | $1,000 | $1,013.59 | $11.56 | 2.29% |
| R Class | $1,000 | $1,016.09 | $9.05 | 1.79% |
| R6 Class | $1,000 | $1,020.36 | $4.76 | 0.94% |
| (1) | Expenses are equal to the class's annualized expense ratio listed in the table above, multiplied by the average account value over the period, multiplied by 183, the number of days in the most recent fiscal half-year, divided by 365, to reflect the one-half year period. Annualized expense ratio reflects actual expenses, including any applicable fee waivers or expense reimbursements and excluding any acquired fund fees and expenses. |
9
| Schedule of Investments |
NOVEMBER 30, 2018
| Shares | Value | ||||
| COMMON STOCKS — 98.0% | |||||
| Australia — 5.2% | |||||
| Australia & New Zealand Banking Group Ltd. | 41,295 | $ | 811,326 | ||
| CIMIC Group Ltd. | 5,629 | 167,929 | |||
Coles Group Ltd.(1) | 10,927 | 93,522 | |||
| Commonwealth Bank of Australia | 7,313 | 381,454 | |||
| JB Hi-Fi Ltd. | 4,135 | 70,360 | |||
| National Australia Bank Ltd. | 7,505 | 135,399 | |||
| Qantas Airways Ltd. | 6,680 | 29,157 | |||
| Regis Resources Ltd. | 14,287 | 44,356 | |||
| Santos Ltd. | 9,726 | 39,402 | |||
| Super Retail Group Ltd. | 32,743 | 176,146 | |||
| Telstra Corp. Ltd. | 20,610 | 44,199 | |||
| Wesfarmers Ltd. | 10,927 | 252,618 | |||
| Westpac Banking Corp. | 5,877 | 111,853 | |||
| 2,357,721 | |||||
| Brazil — 0.2% | |||||
| Banco Santander Brasil SA ADR | 7,100 | 79,520 | |||
| China — 0.5% | |||||
| China Construction Bank Corp., H Shares | 21,000 | 17,958 | |||
| Industrial & Commercial Bank of China Ltd., H Shares | 266,000 | 189,563 | |||
| 207,521 | |||||
| Denmark — 0.4% | |||||
| H Lundbeck A/S | 2,355 | 97,048 | |||
| Topdanmark A/S | 1,683 | 76,528 | |||
| 173,576 | |||||
| France — 8.3% | |||||
| BNP Paribas SA | 12,408 | 624,923 | |||
| Casino Guichard Perrachon SA | 2,321 | 104,927 | |||
| CNP Assurances | 16,972 | 389,435 | |||
| Eiffage SA | 2,365 | 225,652 | |||
| Engie SA | 9,442 | 133,181 | |||
| Kering SA | 206 | 90,222 | |||
| Lagardere SCA | 10,801 | 305,610 | |||
| Metropole Television SA | 2,358 | 41,895 | |||
| Orange SA | 6,894 | 118,552 | |||
| Peugeot SA | 17,027 | 374,307 | |||
| Sanofi | 4,404 | 398,587 | |||
| Societe Generale SA | 5,677 | 209,066 | |||
| TOTAL SA | 13,500 | 751,519 | |||
| 3,767,876 | |||||
| Germany — 3.8% | |||||
| Allianz SE | 2,140 | 451,975 | |||
10
| Shares | Value | ||||
| Bayer AG | 2,145 | $ | 156,663 | ||
| Covestro AG | 2,431 | 139,844 | |||
| Daimler AG | 633 | 35,611 | |||
| Deutsche Telekom AG | 12,939 | 226,890 | |||
| Hamburger Hafen und Logistik AG | 2,198 | 48,105 | |||
| HUGO BOSS AG | 1,770 | 122,195 | |||
| MTU Aero Engines AG | 490 | 101,938 | |||
| ProSiebenSat.1 Media SE | 6,912 | 140,244 | |||
| RTL Group SA | 988 | 59,246 | |||
| RWE AG | 2,052 | 44,365 | |||
| Schaeffler AG Preference Shares | 10,698 | 92,064 | |||
| Siemens AG | 975 | 112,926 | |||
| 1,732,066 | |||||
| Hong Kong — 3.1% | |||||
| BOC Hong Kong Holdings Ltd. | 26,500 | 103,634 | |||
| CLP Holdings Ltd. | 30,500 | 336,206 | |||
Health and Happiness H&H International Holdings Ltd.(1) | 13,000 | 83,935 | |||
| Kerry Properties Ltd. | 18,000 | 61,980 | |||
| Link REIT | 15,000 | 142,814 | |||
| PCCW Ltd. | 154,000 | 90,340 | |||
| Sands China Ltd. | 55,600 | 241,849 | |||
| Swire Properties Ltd. | 21,000 | 73,400 | |||
| Wharf Holdings Ltd. (The) | 105,000 | 281,848 | |||
| 1,416,006 | |||||
| India — 0.2% | |||||
| Tata Power Co. Ltd. (The) | 86,624 | 94,625 | |||
| Israel — 2.5% | |||||
| Bank Leumi Le-Israel BM | 56,696 | 372,958 | |||
| Israel Discount Bank Ltd., A Shares | 28,196 | 97,648 | |||
| Mizrahi Tefahot Bank Ltd. | 6,889 | 125,367 | |||
Nice Ltd.(1) | 2,442 | 283,652 | |||
| Teva Pharmaceutical Industries Ltd. ADR | 12,793 | 275,561 | |||
| 1,155,186 | |||||
| Italy — 1.8% | |||||
| Eni SpA | 28,177 | 454,568 | |||
| EXOR NV | 6,400 | 376,196 | |||
| 830,764 | |||||
| Japan — 24.8% | |||||
| Astellas Pharma, Inc. | 24,800 | 381,127 | |||
| Brother Industries Ltd. | 12,600 | 210,782 | |||
| Canon, Inc. | 600 | 17,013 | |||
| Cosmo Energy Holdings Co. Ltd. | 3,900 | 91,119 | |||
| Daiichikosho Co., Ltd. | 3,400 | 155,151 | |||
| Daiwa Securities Group, Inc. | 28,800 | 159,594 | |||
| DMG Mori Co. Ltd. | 1,500 | 21,010 | |||
| Eisai Co. Ltd. | 2,500 | 230,182 | |||
| Hazama Ando Corp. | 24,400 | 147,455 | |||
11
| Shares | Value | ||||
| Honda Motor Co. Ltd. | 7,600 | $ | 214,466 | ||
| Kansai Electric Power Co., Inc. (The) | 17,600 | 264,198 | |||
| KDDI Corp. | 19,400 | 455,284 | |||
| Kikkoman Corp. | 2,600 | 151,628 | |||
| Kirin Holdings Co. Ltd. | 2,800 | 65,736 | |||
| Leopalace21 Corp. | 15,400 | 67,271 | |||
| Marubeni Corp. | 48,700 | 363,935 | |||
| Mebuki Financial Group, Inc. | 120,000 | 362,859 | |||
| Mitsubishi Chemical Holdings Corp. | 33,700 | 275,680 | |||
| Mitsubishi Corp. | 9,500 | 256,441 | |||
| Mitsubishi UFJ Financial Group, Inc. | 57,400 | 313,209 | |||
| Mitsui & Co. Ltd. | 7,200 | 113,152 | |||
| Mizuho Financial Group, Inc. | 104,600 | 173,584 | |||
| Nihon Unisys Ltd. | 7,400 | 188,724 | |||
| Nikon Corp. | 11,700 | 183,634 | |||
| Nippon Telegraph & Telephone Corp. | 3,800 | 156,667 | |||
| NTT DOCOMO, Inc. | 11,600 | 268,604 | |||
| ORIX Corp. | 17,800 | 288,228 | |||
| SBI Holdings, Inc. | 13,600 | 308,625 | |||
| Sega Sammy Holdings, Inc. | 5,700 | 80,857 | |||
| Shiseido Co. Ltd. | 4,400 | 280,286 | |||
| Shizuoka Bank Ltd. (The) | 28,500 | 255,838 | |||
| Showa Shell Sekiyu KK | 17,200 | 266,756 | |||
| Sojitz Corp. | 90,500 | 320,495 | |||
| Sony Corp. | 3,200 | 169,398 | |||
| Subaru Corp. | 16,100 | 358,048 | |||
| Sumitomo Chemical Co. Ltd. | 34,000 | 184,504 | |||
| Sumitomo Dainippon Pharma Co., Ltd. | 16,900 | 553,653 | |||
| Sumitomo Mitsui Financial Group, Inc. | 7,500 | 275,386 | |||
| Sushiro Global Holdings Ltd. | 1,700 | 93,194 | |||
| Suzuken Co. Ltd. | 2,200 | 118,485 | |||
| Suzuki Motor Corp. | 7,200 | 358,684 | |||
| Takeda Pharmaceutical Co., Ltd. | 5,600 | 211,303 | |||
| Teijin Ltd. | 8,900 | 153,760 | |||
| Toho Holdings Co. Ltd. | 2,000 | 53,121 | |||
| Tokuyama Corp. | 9,600 | 263,222 | |||
| Toyota Boshoku Corp. | 5,300 | 81,661 | |||
| Toyota Motor Corp. | 13,300 | 800,487 | |||
| Trend Micro, Inc. | 2,000 | 114,699 | |||
| TS Tech Co. Ltd. | 10,900 | 317,811 | |||
| Unicharm Corp. | 3,300 | 103,379 | |||
| 11,300,385 | |||||
| Malaysia — 0.4% | |||||
| CIMB Group Holdings Bhd | 135,300 | 186,715 | |||
| Netherlands — 4.1% | |||||
| ABN AMRO Group NV CVA | 17,690 | 453,048 | |||
| Aegon NV | 21,921 | 122,121 | |||
12
| Shares | Value | ||||
| ASR Nederland NV | 6,987 | $ | 302,393 | ||
Coca-Cola European Partners plc(1) | 4,097 | 198,868 | |||
| Koninklijke Philips NV | 8,408 | 318,278 | |||
| NN Group NV | 6,236 | 265,512 | |||
QIAGEN NV(1) | 6,140 | 216,596 | |||
| 1,876,816 | |||||
| New Zealand — 0.8% | |||||
a2 Milk Co. Ltd.(1) | 37,812 | 269,159 | |||
| Spark New Zealand Ltd. | 30,653 | 89,340 | |||
| 358,499 | |||||
| Norway — 2.6% | |||||
| Aker BP ASA | 8,524 | 242,716 | |||
| Equinor ASA | 21,725 | 507,601 | |||
| Salmar ASA | 3,938 | 222,650 | |||
| Telenor ASA | 9,850 | 191,421 | |||
| 1,164,388 | |||||
| Poland — 0.3% | |||||
| Powszechny Zaklad Ubezpieczen SA | 10,635 | 120,305 | |||
| Portugal — 0.6% | |||||
| EDP - Energias de Portugal SA | 78,979 | 276,027 | |||
| Singapore — 2.4% | |||||
| ComfortDelGro Corp. Ltd. | 146,800 | 225,006 | |||
| Oversea-Chinese Banking Corp. Ltd. | 38,700 | 318,846 | |||
| Singapore Technologies Engineering Ltd. | 39,700 | 103,027 | |||
| United Overseas Bank Ltd. | 25,100 | 461,843 | |||
| 1,108,722 | |||||
| South Korea — 1.3% | |||||
| Daelim Industrial Co. Ltd. | 1,471 | 124,675 | |||
| Hanwha Corp. | 4,117 | 110,667 | |||
| Hyundai Marine & Fire Insurance Co. Ltd. | 1,752 | 62,597 | |||
| Samsung Electronics Co. Ltd. | 5,133 | 192,712 | |||
| SK Hynix, Inc. | 1,454 | 90,950 | |||
| 581,601 | |||||
| Spain — 3.1% | |||||
| Banco Bilbao Vizcaya Argentaria SA | 72,491 | 413,580 | |||
| Banco Santander SA | 48,021 | 228,666 | |||
| Ence Energia y Celulosa SA | 8,878 | 56,318 | |||
| Mapfre SA | 106,093 | 303,441 | |||
| Repsol SA | 24,133 | 416,933 | |||
| 1,418,938 | |||||
| Sweden — 1.3% | |||||
| Castellum AB | 8,308 | 145,702 | |||
| Lundin Petroleum AB | 8,192 | 216,317 | |||
| Tele2 AB, B Shares | 17,016 | 213,030 | |||
| 575,049 | |||||
| Switzerland — 7.8% | |||||
| Nestle SA | 5,973 | 510,034 | |||
13
| Shares | Value | ||||
| Novartis AG | 15,935 | $ | 1,454,652 | ||
| Roche Holding AG | 1,340 | 347,702 | |||
| Swisscom AG | 734 | 352,271 | |||
UBS Group AG(1) | 9,016 | 122,335 | |||
| Zurich Insurance Group AG | 2,466 | 774,280 | |||
| 3,561,274 | |||||
| Taiwan — 0.6% | |||||
| AU Optronics Corp. | 65,000 | 26,630 | |||
| Shin Kong Financial Holding Co. Ltd. | 285,760 | 96,846 | |||
| Uni-President Enterprises Corp. | 56,000 | 131,601 | |||
| 255,077 | |||||
| United Kingdom — 21.9% | |||||
| 3i Group plc | 39,674 | 422,961 | |||
| BAE Systems plc | 74,593 | 468,481 | |||
| BHP Group plc | 45,653 | 877,381 | |||
| BP plc | 104,541 | 693,226 | |||
| British American Tobacco plc | 6,079 | 212,059 | |||
| Centrica plc | 249,878 | 442,556 | |||
| Direct Line Insurance Group plc | 28,393 | 118,873 | |||
| Evraz plc | 22,910 | 132,787 | |||
| GlaxoSmithKline plc | 51,916 | 1,074,275 | |||
| HSBC Holdings plc | 141,123 | 1,195,643 | |||
| International Consolidated Airlines Group SA | 43,708 | 350,322 | |||
| Legal & General Group plc | 94,895 | 296,307 | |||
| Lloyds Banking Group plc | 363,398 | 256,488 | |||
| Marks & Spencer Group plc | 28,386 | 105,908 | |||
| Rio Tinto plc | 16,613 | 754,172 | |||
| Royal Dutch Shell plc, B Shares | 55,917 | 1,710,223 | |||
| Royal Mail plc | 59,937 | 244,788 | |||
| Segro plc | 27,374 | 210,982 | |||
| Tate & Lyle plc | 27,651 | 253,044 | |||
| Vodafone Group plc | 70,876 | 152,516 | |||
| 9,972,992 | |||||
TOTAL COMMON STOCKS (Cost $46,953,970) | 44,571,649 | ||||
| EXCHANGE-TRADED FUNDS — 0.2% | |||||
| iShares MSCI Japan ETF (Cost $87,181) | 1,600 | 88,544 | |||
| TEMPORARY CASH INVESTMENTS — 1.0% | |||||
| Repurchase Agreement, BMO Capital Markets Corp., (collateralized by various U.S. Treasury obligations, 1.125% - 3.125%, 5/31/19 - 11/15/28, valued at $358,328), in a joint trading account at 2.00%, dated 11/30/18, due 12/3/18 (Delivery value $351,343) | 351,284 | ||||
14
| Shares | Value | ||||
| State Street Institutional U.S. Government Money Market Fund, Premier Class | 78,294 | $ | 78,294 | ||
TOTAL TEMPORARY CASH INVESTMENTS (Cost $429,578) | 429,578 | ||||
TOTAL INVESTMENT SECURITIES — 99.2% (Cost $47,470,729) | 45,089,771 | ||||
| OTHER ASSETS AND LIABILITIES — 0.8% | 385,297 | ||||
| TOTAL NET ASSETS — 100.0% | $ | 45,475,068 | |||
| MARKET SECTOR DIVERSIFICATION | ||
| (as a % of net assets) | ||
| Financials | 29.1 | % |
| Health Care | 12.9 | % |
| Energy | 11.9 | % |
| Consumer Discretionary | 9.4 | % |
| Industrials | 7.8 | % |
| Communication Services | 6.7 | % |
| Materials | 6.3 | % |
| Consumer Staples | 5.7 | % |
| Utilities | 3.6 | % |
| Information Technology | 2.5 | % |
| Real Estate | 2.1 | % |
| Exchange-Traded Funds | 0.2 | % |
| Cash and Equivalents* | 1.8 | % |
*Includes temporary cash investments and other assets and liabilities.
| NOTES TO SCHEDULE OF INVESTMENTS | ||
| ADR | - | American Depositary Receipt |
| CVA | - | Certificaten Van Aandelen |
| (1) | Non-income producing. |
See Notes to Financial Statements.
15
| Statement of Assets and Liabilities |
| NOVEMBER 30, 2018 | |||
| Assets | |||
| Investment securities, at value (cost of $47,470,729) | $ | 45,089,771 | |
| Foreign currency holdings, at value (cost of $45,943) | 45,822 | ||
| Receivable for capital shares sold | 16,288 | ||
| Dividends and interest receivable | 408,070 | ||
| 45,559,951 | |||
| Liabilities | |||
| Payable for capital shares redeemed | 38,265 | ||
| Accrued management fees | 42,885 | ||
| Distribution and service fees payable | 3,733 | ||
| 84,883 | |||
| Net Assets | $ | 45,475,068 | |
| Net Assets Consist of: | |||
| Capital (par value and paid-in surplus) | $ | 50,371,107 | |
| Distributable earnings | (4,896,039 | ) | |
| $ | 45,475,068 | ||
| Net Assets | Shares Outstanding | Net Asset Value Per Share | ||||
| Investor Class, $0.01 Par Value | $11,008,335 | 1,445,653 | $7.61 | |||
| I Class, $0.01 Par Value | $7,434,396 | 975,655 | $7.62 | |||
| A Class, $0.01 Par Value | $7,651,343 | 1,002,039 | $7.64* | |||
| C Class, $0.01 Par Value | $2,224,228 | 295,090 | $7.54 | |||
| R Class, $0.01 Par Value | $672,023 | 88,608 | $7.58 | |||
| R6 Class, $0.01 Par Value | $16,484,743 | 2,160,708 | $7.63 | |||
*Maximum offering price $8.11 (net asset value divided by 0.9425).
See Notes to Financial Statements.
16
| Statement of Operations |
| YEAR ENDED NOVEMBER 30, 2018 | |||
| Investment Income (Loss) | |||
| Income: | |||
| Dividends (net of foreign taxes withheld of $259,335) | $ | 2,903,460 | |
| Interest | 10,001 | ||
| 2,913,461 | |||
| Expenses: | |||
| Management fees | 805,675 | ||
| Distribution and service fees: | |||
| A Class | 23,274 | ||
| C Class | 36,253 | ||
| R Class | 3,458 | ||
| Directors' fees and expenses | 2,155 | ||
| Other expenses | 10,890 | ||
| 881,705 | |||
| Net investment income (loss) | 2,031,756 | ||
| Realized and Unrealized Gain (Loss) | |||
| Net realized gain (loss) on: | |||
| Investment transactions (net of foreign tax expenses paid (refunded) of $2,246) | (3,908,667 | ) | |
| Foreign currency translation transactions | (34,922 | ) | |
| (3,943,589 | ) | ||
| Change in net unrealized appreciation (depreciation) on: | |||
| Investments | (6,072,206 | ) | |
| Translation of assets and liabilities in foreign currencies | (8,343 | ) | |
| (6,080,549 | ) | ||
| Net realized and unrealized gain (loss) | (10,024,138 | ) | |
| Net Increase (Decrease) in Net Assets Resulting from Operations | $ | (7,992,382 | ) |
See Notes to Financial Statements.
17
| Statement of Changes in Net Assets |
| YEARS ENDED NOVEMBER 30, 2018 AND NOVEMBER 30, 2017 | ||||||
| Increase (Decrease) in Net Assets | November 30, 2018 | November 30, 2017 | ||||
| Operations | ||||||
| Net investment income (loss) | $ | 2,031,756 | $ | 2,217,980 | ||
| Net realized gain (loss) | (3,943,589 | ) | 8,435,285 | |||
| Change in net unrealized appreciation (depreciation) | (6,080,549 | ) | 7,590,199 | |||
| Net increase (decrease) in net assets resulting from operations | (7,992,382 | ) | 18,243,464 | |||
| Distributions to Shareholders | ||||||
| From earnings: | ||||||
| Investor Class | (466,849 | ) | (303,253 | ) | ||
| I Class | (130,916 | ) | (197,608 | ) | ||
| A Class | (291,034 | ) | (193,052 | ) | ||
| C Class | (92,919 | ) | (48,855 | ) | ||
| R Class | (17,238 | ) | (6,975 | ) | ||
| R6 Class | (1,634,209 | ) | (1,271,342 | ) | ||
| Decrease in net assets from distributions | (2,633,165 | ) | (2,021,085 | ) | ||
| Capital Share Transactions | ||||||
| Net increase (decrease) in net assets from capital share transactions (Note 5) | (23,922,935 | ) | 4,056,076 | |||
| Redemption Fees | ||||||
| Increase in net assets from redemption fees | — | 6,221 | ||||
| Net increase (decrease) in net assets | (34,548,482 | ) | 20,284,676 | |||
| Net Assets | ||||||
| Beginning of period | 80,023,550 | 59,738,874 | ||||
| End of period | $ | 45,475,068 | $ | 80,023,550 | ||
See Notes to Financial Statements.
18
| Notes to Financial Statements |
NOVEMBER 30, 2018
1. Organization
American Century World Mutual Funds, Inc. (the corporation) is registered under the Investment Company Act of 1940, as amended (the 1940 Act), as an open-end management investment company and is organized as a Maryland corporation. International Value Fund (the fund) is one fund in a series issued by the corporation. The fund’s investment objective is to seek long-term capital growth.
The fund offers the Investor Class, I Class, A Class, C Class, R Class and R6 Class. The A Class may incur an initial sales charge. The A Class and C Class may be subject to a contingent deferred sales charge.
2. Significant Accounting Policies
The following is a summary of significant accounting policies consistently followed by the fund in preparation of its financial statements. The fund is an investment company and follows accounting and reporting guidance in accordance with accounting principles generally accepted in the United States of America. This may require management to make certain estimates and assumptions at the date of the financial statements. Actual results could differ from these estimates. Management evaluated the impact of events or transactions occurring through the date the financial statements were issued that would merit recognition or disclosure.
Investment Valuations — The fund determines the fair value of its investments and computes its net asset value per share at the close of regular trading (usually 4 p.m. Eastern time) on the New York Stock Exchange (NYSE) on each day the NYSE is open. The Board of Directors has adopted valuation policies and procedures to guide the investment advisor in the fund’s investment valuation process and to provide methodologies for the oversight of the fund’s pricing function.
Equity securities that are listed or traded on a domestic securities exchange are valued at the last reported sales price or at the official closing price as provided by the exchange. Equity securities traded on foreign securities exchanges are generally valued at the closing price of such securities on the exchange where primarily traded or at the close of the NYSE, if that is earlier. If no last sales price is reported, or if local convention or regulation so provides, the mean of the latest bid and asked prices may be used. Securities traded over-the-counter are valued at the mean of the latest bid and asked prices, the last sales price, or the official closing price. Equity securities initially expressed in local currencies are translated into U.S. dollars at the mean of the appropriate currency exchange rate at the close of the NYSE as provided by an independent pricing service.
Open-end management investment companies are valued at the reported net asset value per share. Repurchase agreements are valued at cost, which approximates fair value.
If the fund determines that the market price for an investment is not readily available or the valuation methods mentioned above do not reflect an investment’s fair value, such investment is valued as determined in good faith by the Board of Directors or its delegate, in accordance with policies and procedures adopted by the Board of Directors. In its determination of fair value, the fund may review several factors including, but not limited to, market information regarding the specific investment or comparable investments and correlation with other investment types, futures indices or general market indicators. Circumstances that may cause the fund to use these procedures to value an investment include, but are not limited to: an investment has been declared in default or is distressed; trading in a security has been suspended during the trading day or a security is not actively trading on its principal exchange; prices received from a regular pricing source are deemed unreliable; or there is a foreign market holiday and no trading occurred.
19
The fund monitors for significant events occurring after the close of an investment’s primary exchange but before the fund’s net asset value per share is determined. Significant events may include, but are not limited to: corporate announcements and transactions; governmental action and political unrest that could impact a specific investment or an investment sector; or armed conflicts, natural disasters and similar events that could affect investments in a specific country or region. The fund also monitors for significant fluctuations between domestic and foreign markets, as evidenced by the U.S. market or such other indicators that the Board of Directors, or its delegate, deems appropriate. If significant fluctuations in foreign markets are identified, the fund may apply a model-derived factor to the closing price of equity securities traded on foreign securities exchanges. The factor is based on observable market data as provided by an independent pricing service.
Security Transactions — Security transactions are accounted for as of the trade date. Net realized gains and losses are determined on the identified cost basis, which is also used for federal income tax purposes. Certain countries impose taxes on realized gains on the sale of securities registered in their country. The fund records the foreign tax expense, if any, on an accrual basis. The foreign tax expense on realized gains and unrealized appreciation reduces the net realized gain (loss) on investment transactions and net unrealized appreciation (depreciation) on investments, respectively.
Investment Income — Dividend income less foreign taxes withheld, if any, is recorded as of the ex-dividend date. Distributions received on securities that represent a return of capital or long-term capital gain are recorded as a reduction of cost of investments and/or as a realized gain. The fund may estimate the components of distributions received that may be considered nontaxable distributions or long-term capital gain distributions for income tax purposes. Interest income is recorded on the accrual basis and includes accretion of discounts and amortization of premiums.
Foreign Currency Translations — All assets and liabilities initially expressed in foreign currencies are translated into U.S. dollars at prevailing exchange rates at period end. The fund may enter into spot foreign currency exchange contracts to facilitate transactions denominated in a foreign currency. Purchases and sales of investment securities, dividend and interest income, spot foreign currency exchange contracts, and expenses are translated at the rates of exchange prevailing on the respective dates of such transactions. Net realized and unrealized foreign currency exchange gains or losses related to investment securities are a component of net realized gain (loss) on investment transactions and change in net unrealized appreciation (depreciation) on investments, respectively.
Repurchase Agreements — The fund may enter into repurchase agreements with institutions that American Century Investment Management, Inc. (ACIM) (the investment advisor) has determined are creditworthy pursuant to criteria adopted by the Board of Directors. The fund requires that the collateral, represented by securities, received in a repurchase transaction be transferred to the custodian in a manner sufficient to enable the fund to obtain those securities in the event of a default under the repurchase agreement. ACIM monitors, on a daily basis, the securities transferred to ensure the value, including accrued interest, of the securities under each repurchase agreement is equal to or greater than amounts owed to the fund under each repurchase agreement.
Joint Trading Account — Pursuant to an Exemptive Order issued by the Securities and Exchange Commission, the fund, along with certain other funds in the American Century Investments family of funds, may transfer uninvested cash balances into a joint trading account. These balances are invested in one or more repurchase agreements that are collateralized by U.S. Treasury or Agency obligations.
Income Tax Status — It is the fund’s policy to distribute substantially all net investment income and net realized gains to shareholders and to otherwise qualify as a regulated investment company under provisions of the Internal Revenue Code. Accordingly, no provision has been made for income taxes. The fund files U.S. federal, state, local and non-U.S. tax returns as applicable. The fund's tax returns are subject to examination by the relevant taxing authority until expiration of the applicable statute of limitations, which is generally three years from the date of filing but can be longer in certain jurisdictions. At this time, management believes there are no uncertain tax positions which, based on their technical merit, would not be sustained upon examination and for which it is reasonably possible that the total amounts of unrecognized tax benefits will significantly change in the next twelve months.
Multiple Class — All shares of the fund represent an equal pro rata interest in the net assets of the class to which such shares belong, and have identical voting, dividend, liquidation and other rights and the same terms and conditions, except for class specific expenses and exclusive rights to vote on matters affecting only individual classes. Income, non-class specific expenses, and realized and unrealized capital gains and losses of the fund are allocated to each class of shares based on their relative net assets.
20
Distributions to Shareholders — Distributions from net investment income and net realized gains, if any, are generally declared and paid annually. The fund may make distributions on a more frequent basis to comply with the distribution requirements of the Internal Revenue Code, in all events in a manner consistent with provisions of the 1940 Act. The fund may elect to treat a portion of its payment to a redeeming shareholder, which represents the pro rata share of undistributed net investment income and net realized gains, as a distribution for federal income tax purposes (tax equalization).
Redemption Fees — Prior to October 9, 2017, the fund may have imposed a 2.00% redemption fee on shares held less than 60 days. The fee was not applicable to all classes. The redemption fee was retained by the fund to help cover transaction costs that long-term investors may bear when the fund sells securities to meet investor redemptions.
Indemnifications — Under the corporation’s organizational documents, its officers and directors are indemnified against certain liabilities arising out of the performance of their duties to the fund. In addition, in the normal course of business, the fund enters into contracts that provide general indemnifications. The maximum exposure under these arrangements is unknown as this would involve future claims that may be made against a fund. The risk of material loss from such claims is considered by management to be remote.
3. Fees and Transactions with Related Parties
Certain officers and directors of the corporation are also officers and/or directors of American Century Companies, Inc. (ACC). The corporation’s investment advisor, ACIM, the corporation's distributor, American Century Investment Services, Inc. (ACIS), and the corporation’s transfer agent, American Century Services, LLC, are wholly owned, directly or indirectly, by ACC. Various funds issued by American Century Strategic Asset Allocations, Inc. own, in aggregate, 13% of the shares of the fund.
Management Fees — The corporation has entered into a management agreement with ACIM, under which ACIM provides the fund with investment advisory and management services in exchange for a single, unified management fee (the fee) per class. The agreement provides that all expenses of managing and operating the fund, except distribution and service fees, brokerage expenses, taxes, interest, fees and expenses of the independent directors (including legal counsel fees), and extraordinary expenses, will be paid by ACIM. The fee is computed and accrued daily based on each class's daily net assets and paid monthly in arrears. The difference in the fee among the classes is a result of their separate arrangements for non-Rule 12b-1 shareholder services. It is not the result of any difference in advisory or custodial fees or other expenses related to the management of the fund’s assets, which do not vary by class. The rate of the fee is determined by applying a fee rate calculation formula. This formula takes into account the fund’s assets as well as certain assets, if any, of other clients of the investment advisor outside the American Century Investments family of funds (such as subadvised funds and separate accounts) that use very similar investment teams and strategies (strategy assets). The strategy assets of the fund also include the assets of NT International Value Fund, one fund in a series issued by the corporation.
The management fee schedule range and the effective annual management fee for each class for the period ended November 30, 2018 are as follows:
| Management Fee Schedule Range | Effective Annual Management Fee | |
| Investor Class | 1.100% to 1.300% | 1.28% |
| I Class | 0.900% to 1.100% | 1.08% |
| A Class | 1.100% to 1.300% | 1.28% |
| C Class | 1.100% to 1.300% | 1.28% |
| R Class | 1.100% to 1.300% | 1.28% |
| R6 Class | 0.750% to 0.950% | 0.93% |
21
Distribution and Service Fees — The Board of Directors has adopted a separate Master Distribution and Individual Shareholder Services Plan for each of the A Class, C Class and R Class (collectively the plans), pursuant to Rule 12b-1 of the 1940 Act. The plans provide that the A Class will pay ACIS an annual distribution and service fee of 0.25%. The plans provide that the C Class will pay ACIS an annual distribution and service fee of 1.00%, of which 0.25% is paid for individual shareholder services and 0.75% is paid for distribution services. The plans provide that the R Class will pay ACIS an annual distribution and service fee of 0.50%. The fees are computed and accrued daily based on each class’s daily net assets and paid monthly in arrears. The fees are used to pay financial intermediaries for distribution and individual shareholder services. Fees incurred under the plans during the period ended November 30, 2018 are detailed in the Statement of Operations.
Directors' Fees and Expenses — The Board of Directors is responsible for overseeing the investment advisor’s management and operations of the fund. The directors receive detailed information about the fund and its investment advisor regularly throughout the year, and meet at least quarterly with management of the investment advisor to review reports about fund operations. The fund’s officers do not receive compensation from the fund.
Interfund Transactions — The fund may enter into security transactions with other American Century Investments funds and other client accounts of the investment advisor, in accordance with the 1940 Act rules and procedures adopted by the Board of Directors. The rules and procedures require, among other things, that these transactions be effected at the independent current market price of the security. During the period, the interfund purchases and sales were $92,950 and $494,400, respectively. The effect of interfund transactions on the Statement of Operations was $(46,256) in net realized gain (loss) on investment transactions.
4. Investment Transactions
Purchases and sales of investment securities, excluding short-term investments, for the period ended November 30, 2018 were $59,392,195 and $83,981,837, respectively.
22
5. Capital Share Transactions
Transactions in shares of the fund were as follows:
| Year ended November 30, 2018 | Year ended November 30, 2017 | |||||||||
| Shares | Amount | Shares | Amount | |||||||
| Investor Class/Shares Authorized | 50,000,000 | 45,000,000 | ||||||||
| Sold | 349,891 | $ | 3,016,186 | 640,164 | $ | 5,234,228 | ||||
| Issued in reinvestment of distributions | 51,815 | 453,754 | 37,544 | 294,211 | ||||||
| Redeemed | (562,468 | ) | (4,769,274 | ) | (938,412 | ) | (7,864,014 | ) | ||
| (160,762 | ) | (1,299,334 | ) | (260,704 | ) | (2,335,575 | ) | |||
| I Class/Shares Authorized | 40,000,000 | 50,000,000 | ||||||||
| Sold | 1,127,653 | 9,376,389 | 530,867 | 4,319,261 | ||||||
| Issued in reinvestment of distributions | 14,677 | 128,532 | 25,255 | 197,608 | ||||||
| Redeemed | (631,878 | ) | (5,193,026 | ) | (1,076,651 | ) | (8,996,703 | ) | ||
| 510,452 | 4,311,895 | (520,529 | ) | (4,479,834 | ) | |||||
| A Class/Shares Authorized | 30,000,000 | 30,000,000 | ||||||||
| Sold | 94,780 | 825,130 | 142,161 | 1,174,506 | ||||||
| Issued in reinvestment of distributions | 33,039 | 290,590 | 24,292 | 191,924 | ||||||
| Redeemed | (222,639 | ) | (1,886,645 | ) | (557,570 | ) | (4,576,658 | ) | ||
| (94,820 | ) | (770,925 | ) | (391,117 | ) | (3,210,228 | ) | |||
| C Class/Shares Authorized | 30,000,000 | 30,000,000 | ||||||||
| Sold | 11,233 | 97,411 | 69,598 | 554,958 | ||||||
| Issued in reinvestment of distributions | 10,599 | 92,411 | 6,082 | 48,354 | ||||||
| Redeemed | (202,952 | ) | (1,661,909 | ) | (114,545 | ) | (951,482 | ) | ||
| (181,120 | ) | (1,472,087 | ) | (38,865 | ) | (348,170 | ) | |||
| R Class/Shares Authorized | 30,000,000 | 30,000,000 | ||||||||
| Sold | 38,009 | 327,715 | 8,676 | 70,168 | ||||||
| Issued in reinvestment of distributions | 1,967 | 17,188 | 878 | 6,952 | ||||||
| Redeemed | (11,530 | ) | (99,229 | ) | (10,217 | ) | (83,536 | ) | ||
| 28,446 | 245,674 | (663 | ) | (6,416 | ) | |||||
| R6 Class/Shares Authorized | 70,000,000 | 70,000,000 | ||||||||
| Sold | 1,459,293 | 12,482,479 | 5,406,595 | 43,016,719 | ||||||
| Issued in reinvestment of distributions | 186,520 | 1,634,209 | 163,023 | 1,271,342 | ||||||
| Redeemed | (4,700,312 | ) | (39,054,846 | ) | (3,506,509 | ) | (29,851,762 | ) | ||
| (3,054,499 | ) | (24,938,158 | ) | 2,063,109 | 14,436,299 | |||||
| Net increase (decrease) | (2,952,303 | ) | $ | (23,922,935 | ) | 851,231 | $ | 4,056,076 | ||
23
6. Fair Value Measurements
The fund’s investments valuation process is based on several considerations and may use multiple inputs to determine the fair value of the investments held by the fund. In conformity with accounting principles generally accepted in the United States of America, the inputs used to determine a valuation are classified into three broad levels.
| • | Level 1 valuation inputs consist of unadjusted quoted prices in an active market for identical investments. |
| • | Level 2 valuation inputs consist of direct or indirect observable market data (including quoted prices for comparable investments, evaluations of subsequent market events, interest rates, prepayment speeds, credit risk, etc.). These inputs also consist of quoted prices for identical investments initially expressed in local currencies that are adjusted through translation into U.S. dollars. |
| • | Level 3 valuation inputs consist of unobservable data (including a fund’s own assumptions). |
The level classification is based on the lowest level input that is significant to the fair valuation measurement. The valuation inputs are not necessarily an indication of the risks associated with investing in these securities or other financial instruments.
The following is a summary of the level classifications as of period end. The Schedule of Investments provides additional information on the fund’s portfolio holdings.
| Level 1 | Level 2 | Level 3 | ||||||
| Assets | ||||||||
| Investment Securities | ||||||||
| Common Stocks | $ | 553,949 | $ | 44,017,700 | — | |||
| Exchange-Traded Funds | 88,544 | — | — | |||||
| Temporary Cash Investments | 78,294 | 351,284 | — | |||||
| $ | 720,787 | $ | 44,368,984 | — | ||||
7. Risk Factors
There are certain risks involved in investing in foreign securities. These risks include those resulting from future adverse political, social and economic developments, fluctuations in currency exchange rates, the possible imposition of exchange controls, and other foreign laws or restrictions. Investing in emerging markets may accentuate these risks.
The fund invests in common stocks of small companies. Because of this, the fund may be subject to greater risk and market fluctuations than a fund investing in larger, more established companies.
Investing a significant portion of assets in one country or region makes the fund more dependent upon the political economic circumstances of that particular country or region than a fund that is more widely diversified.
8. Federal Tax Information
On December 18, 2018, the fund declared and paid the following per-share distributions from net investment income to shareholders of record on December 17, 2018:
| Investor Class | I Class | A Class | C Class | R Class | R6 Class |
| $0.1340 | $0.1485 | $0.1158 | $0.0614 | $0.0977 | $0.1594 |
The tax character of distributions paid during the years ended November 30, 2018 and November 30, 2017 were as follows:
| 2018 | 2017 | |||||
| Distributions Paid From | ||||||
| Ordinary income | $ | 2,633,165 | $ | 2,021,085 | ||
| Long-term capital gains | — | — | ||||
24
The book-basis character of distributions made during the year from net investment income or net realized gains may differ from their ultimate characterization for federal income tax purposes. These differences reflect the differing character of certain income items and net realized gains and losses for financial statement and tax purposes, and may result in reclassification among certain capital accounts on the financial statements.
As of period end, the federal tax cost of investments and the components of distributable earnings on a tax-basis were as follows:
| Federal tax cost of investments | $ | 47,732,612 | |
| Gross tax appreciation of investments | $ | 1,621,567 | |
| Gross tax depreciation of investments | (4,264,408 | ) | |
| Net tax appreciation (depreciation) of investments | (2,642,841 | ) | |
| Net tax appreciation (depreciation) on translation of assets and liabilities in foreign currencies | (4,096 | ) | |
| Net tax appreciation (depreciation) | $ | (2,646,937 | ) |
| Undistributed ordinary income | $ | 1,665,331 | |
Accumulated short-term capital losses | $ | (3,410,549 | ) |
Accumulated long-term capital losses | $ | (503,884 | ) |
The difference between book-basis and tax-basis unrealized appreciation (depreciation) is attributable primarily to the tax deferral of losses on wash sales.
Accumulated capital losses represent net capital loss carryovers that may be used to offset future realized capital gains for federal income tax purposes. The capital loss carryovers may be carried forward for an unlimited period. Future capital loss carryover utilization in any given year may be subject to Internal Revenue Code limitations.
25
| Financial Highlights |
For a Share Outstanding Throughout the Years Ended November 30 (except as noted) | |||||||||||||
Per-Share Data | Ratios and Supplemental Data | ||||||||||||
Income From Investment Operations: | Ratio to Average Net Assets of: | ||||||||||||
Net Asset Value, Beginning of Period | Net Investment Income (Loss)(1) | Net Realized and Unrealized Gain (Loss) | Total From Investment Operations | Distributions From Net Investment Income | Net Asset Value, End of Period | Total Return(2) | Operating Expenses | Net Investment Income (Loss) | Portfolio Turnover Rate | Net Assets, End of Period (in thousands) | |||
| Investor Class | |||||||||||||
| 2018 | $8.96 | 0.21 | (1.27) | (1.06) | (0.29) | $7.61 | (12.25)% | 1.30% | 2.56% | 80% | $11,008 | ||
| 2017 | $7.40 | 0.21 | 1.51 | 1.72 | (0.16) | $8.96 | 23.59% | 1.30% | 2.47% | 101% | $14,398 | ||
| 2016 | $7.83 | 0.20 | (0.45) | (0.25) | (0.18) | $7.40 | (3.15)% | 1.31% | 2.86% | 76% | $13,810 | ||
| 2015 | $8.91 | 0.22 | (0.97) | (0.75) | (0.33) | $7.83 | (8.56)% | 1.31% | 2.70% | 77% | $20,945 | ||
| 2014 | $8.97 | 0.32 | (0.19) | 0.13 | (0.19) | $8.91 | 1.38% | 1.30% | 3.55% | 89% | $19,068 | ||
| I Class | |||||||||||||
| 2018 | $8.97 | 0.22 | (1.26) | (1.04) | (0.31) | $7.62 | (12.05)% | 1.10% | 2.76% | 80% | $7,434 | ||
| 2017 | $7.41 | 0.23 | 1.51 | 1.74 | (0.18) | $8.97 | 23.86% | 1.10% | 2.67% | 101% | $4,173 | ||
| 2016 | $7.84 | 0.22 | (0.45) | (0.23) | (0.20) | $7.41 | (2.99)% | 1.11% | 3.06% | 76% | $7,300 | ||
| 2015 | $8.92 | 0.28 | (1.01) | (0.73) | (0.35) | $7.84 | (8.37)% | 1.11% | 2.90% | 77% | $7,798 | ||
| 2014 | $8.96 | 0.38 | (0.23) | 0.15 | (0.19) | $8.92 | 1.67% | 1.10% | 3.75% | 89% | $513 | ||
For a Share Outstanding Throughout the Years Ended November 30 (except as noted) | |||||||||||||
Per-Share Data | Ratios and Supplemental Data | ||||||||||||
Income From Investment Operations: | Ratio to Average Net Assets of: | ||||||||||||
Net Asset Value, Beginning of Period | Net Investment Income (Loss)(1) | Net Realized and Unrealized Gain (Loss) | Total From Investment Operations | Distributions From Net Investment Income | Net Asset Value, End of Period | Total Return(2) | Operating Expenses | Net Investment Income (Loss) | Portfolio Turnover Rate | Net Assets, End of Period (in thousands) | |||
A Class | |||||||||||||
| 2018 | $8.99 | 0.19 | (1.27) | (1.08) | (0.27) | $7.64 | (12.43)% | 1.55% | 2.31% | 80% | $7,651 | ||
| 2017 | $7.41 | 0.17 | 1.55 | 1.72 | (0.14) | $8.99 | 23.45% | 1.55% | 2.22% | 101% | $9,857 | ||
| 2016 | $7.85 | 0.18 | (0.45) | (0.27) | (0.17) | $7.41 | (3.46)% | 1.56% | 2.61% | 76% | $11,029 | ||
| 2015 | $8.93 | 0.20 | (0.97) | (0.77) | (0.31) | $7.85 | (8.77)% | 1.56% | 2.45% | 77% | $14,838 | ||
| 2014 | $9.01 | 0.30 | (0.20) | 0.10 | (0.18) | $8.93 | 1.08% | 1.55% | 3.30% | 89% | $15,423 | ||
C Class | |||||||||||||
| 2018 | $8.87 | 0.13 | (1.26) | (1.13) | (0.20) | $7.54 | (13.04)% | 2.30% | 1.56% | 80% | $2,224 | ||
| 2017 | $7.33 | 0.12 | 1.51 | 1.63 | (0.09) | $8.87 | 22.41% | 2.30% | 1.47% | 101% | $4,225 | ||
| 2016 | $7.78 | 0.13 | (0.46) | (0.33) | (0.12) | $7.33 | (4.21)% | 2.31% | 1.86% | 76% | $3,774 | ||
| 2015 | $8.85 | 0.13 | (0.95) | (0.82) | (0.25) | $7.78 | (9.39)% | 2.31% | 1.70% | 77% | $3,502 | ||
| 2014 | $8.97 | 0.23 | (0.19) | 0.04 | (0.16) | $8.85 | 0.41% | 2.30% | 2.55% | 89% | $2,301 | ||
R Class | |||||||||||||
| 2018 | $8.93 | 0.18 | (1.29) | (1.11) | (0.24) | $7.58 | (12.74)% | 1.80% | 2.06% | 80% | $672 | ||
| 2017 | $7.36 | 0.16 | 1.52 | 1.68 | (0.11) | $8.93 | 23.09% | 1.80% | 1.97% | 101% | $537 | ||
| 2016 | $7.80 | 0.18 | (0.47) | (0.29) | (0.15) | $7.36 | (3.68)% | 1.81% | 2.36% | 76% | $448 | ||
| 2015 | $8.87 | 0.18 | (0.96) | (0.78) | (0.29) | $7.80 | (8.95)% | 1.81% | 2.20% | 77% | $387 | ||
| 2014 | $8.97 | 0.28 | (0.21) | 0.07 | (0.17) | $8.87 | 0.78% | 1.80% | 3.05% | 89% | $479 | ||
For a Share Outstanding Throughout the Years Ended November 30 (except as noted) | |||||||||||||
Per-Share Data | Ratios and Supplemental Data | ||||||||||||
Income From Investment Operations: | Ratio to Average Net Assets of: | ||||||||||||
Net Asset Value, Beginning of Period | Net Investment Income (Loss)(1) | Net Realized and Unrealized Gain (Loss) | Total From Investment Operations | Distributions From Net Investment Income | Net Asset Value, End of Period | Total Return(2) | Operating Expenses | Net Investment Income (Loss) | Portfolio Turnover Rate | Net Assets, End of Period (in thousands) | |||
| R6 Class | |||||||||||||
| 2018 | $8.98 | 0.26 | (1.29) | (1.03) | (0.32) | $7.63 | (11.91)% | 0.95% | 2.91% | 80% | $16,485 | ||
| 2017 | $7.42 | 0.23 | 1.52 | 1.75 | (0.19) | $8.98 | 24.06% | 0.95% | 2.82% | 101% | $46,833 | ||
| 2016 | $7.85 | 0.23 | (0.45) | (0.22) | (0.21) | $7.42 | (2.87)% | 0.96% | 3.21% | 76% | $23,378 | ||
| 2015 | $8.93 | 0.23 | (0.95) | (0.72) | (0.36) | $7.85 | (8.22)% | 0.96% | 3.05% | 77% | $31,418 | ||
| 2014 | $8.96 | 0.33 | (0.17) | 0.16 | (0.19) | $8.93 | 1.83% | 0.95% | 3.90% | 89% | $562 | ||
| Notes to Financial Highlights |
| (1) | Computed using average shares outstanding throughout the period. |
| (2) | Total returns are calculated based on the net asset value of the last business day and do not reflect applicable sales charges, if any. Total returns for periods less than one year are not annualized. |
See Notes to Financial Statements.
| Report of Independent Registered Public Accounting Firm |
To the Shareholders and the Board of Directors of American Century World Mutual Funds, Inc.:
Opinion on the Financial Statements and Financial Highlights
We have audited the accompanying statement of assets and liabilities, including the schedule of investments, of International Value Fund, one of the funds constituting the American Century World Mutual Funds, Inc. (the “Fund”), as of November 30, 2018, the related statement of operations for the year then ended, the statements of changes in net assets for each of the two years in the period then ended, the financial highlights for each of the five years in the period then ended, and the related notes. In our opinion, the financial statements and financial highlights present fairly, in all material respects, the financial position of International Value Fund of the American Century World Mutual Funds, Inc. as of November 30, 2018, the results of its operations for the year then ended, the changes in its net assets for each of the two years in the period then ended, and the financial highlights for each of the five years in the period then ended, in conformity with accounting principles generally accepted in the United States of America.
Basis for Opinion
These financial statements and financial highlights are the responsibility of the Fund's management. Our responsibility is to express an opinion on the Fund’s financial statements and financial highlights based on our audits. We are a public accounting firm registered with the Public Company Accounting Oversight Board (United States) (PCAOB) and are required to be independent with respect to the Fund in accordance with the U.S. federal securities laws and the applicable rules and regulations of the Securities and Exchange Commission and the PCAOB.
We conducted our audits in accordance with the standards of the PCAOB. Those standards require that we plan and perform the audit to obtain reasonable assurance about whether the financial statements and financial highlights are free of material misstatement, whether due to error or fraud. The Fund is not required to have, nor were we engaged to perform, an audit of its internal control over financial reporting. As part of our audits we are required to obtain an understanding of internal control over financial reporting but not for the purpose of expressing an opinion on the effectiveness of the Fund’s internal control over financial reporting. Accordingly, we express no such opinion.
Our audits included performing procedures to assess the risks of material misstatement of the financial statements and financial highlights, whether due to error or fraud, and performing procedures that respond to those risks. Such procedures included examining, on a test basis, evidence regarding the amounts and disclosures in the financial statements and financial highlights. Our audits also included evaluating the accounting principles used and significant estimates made by management, as well as evaluating the overall presentation of the financial statements and financial highlights. Our procedures included confirmation of securities owned as of November 30, 2018, by correspondence with the custodian and brokers; when replies were not received from brokers, we performed other auditing procedures. We believe that our audits provide a reasonable basis for our opinion.
DELOITTE & TOUCHE LLP
Kansas City, Missouri
January 17, 2019
We have served as the auditor of one or more American Century investment companies since 1997.
29
| Management |
The Board of Directors
The individuals listed below serve as directors of the funds. Each director will continue to serve in this capacity until death, retirement, resignation or removal from office. The board has adopted a mandatory retirement age for directors who are not “interested persons,” as that term is defined in the Investment Company Act (independent directors). Independent directors shall retire by December 31 of the year in which they reach their 75th birthday.
Mr. Thomas is an “interested person” because he currently serves as President and Chief Executive Officer of American Century Companies, Inc. (ACC), the parent company of American Century Investment Management, Inc. (ACIM or the advisor). The other directors (more than three-fourths of the total number) are independent. They are not employees, directors or officers of, and have no financial interest in, ACC or any of its wholly owned, direct or indirect, subsidiaries, including ACIM, American Century Investment Services, Inc. (ACIS) and American Century Services, LLC (ACS), and they do not have any other affiliations, positions or relationships that would cause them to be considered “interested persons” under the Investment Company Act. The directors serve in this capacity for seven (in the case of Jonathan S. Thomas, 16; and Stephen E. Yates, 8) registered investment companies in the American Century Investments family of funds.
The following table presents additional information about the directors. The mailing address for each director is 4500 Main Street, Kansas City, Missouri 64111.
| Name (Year of Birth) | Position(s) Held with Funds | Length of Time Served | Principal Occupation(s) During Past 5 Years | Number of American Century Portfolios Overseen by Director | Other Directorships Held During Past 5 Years |
| Independent Directors | |||||
| Thomas W. Bunn (1953) | Director | Since 2017 | Retired | 68 | SquareTwo Financial; Barings (formerly Babson Capital Funds Trust) (2013 to 2016) |
| Barry Fink (1955) | Director | Since 2012 (independent since 2016) | Retired; Executive Vice President, ACC (2007 to 2013); President, ACS (2007 to 2013) | 68 | None |
| Jan M. Lewis (1957) | Director | Since 2011 | Retired; President and Chief Executive Officer, Catholic Charities of Northeast Kansas (human services organization) (2006 to 2013) | 68 | None |
M. Jeannine Strandjord(1) (1945) | Director | Since 1994 | Self-employed Consultant | 68 | Euronet Worldwide Inc. and MGP Ingredients, Inc. |
30
| Name (Year of Birth) | Position(s) Held with Funds | Length of Time Served | Principal Occupation(s) During Past 5 Years | Number of American Century Portfolios Overseen by Director | Other Directorships Held During Past 5 Years |
| Independent Directors | |||||
| John R. Whitten (1946) | Director | Since 2008 | Retired | 68 | Rudolph Technologies, Inc. |
| Stephen E. Yates (1948) | Director and Chairman of the Board | Since 2012 (Chairman since 2018) | Retired | 73 | None |
| Interested Director | |||||
| Jonathan S. Thomas (1963) | Director and President | Since 2007 | President and Chief Executive Officer, ACC (2007 to present). Also serves as Chief Executive Officer, ACS; Executive Vice President, ACIM; Director, ACC, ACIM and other ACC subsidiaries | 118 | BioMed Valley Discoveries, Inc. |
(1) Effective December 31, 2018, M. Jeannine Strandjord retired from the Board of Directors.
The Statement of Additional Information has additional information about the fund's directors and is available without charge, upon request, by calling 1-800-345-2021.
31
Officers
The following table presents certain information about the executive officers of the funds. Each officer serves as an officer for each of the 16 (in the case of Robert J. Leach, 15) investment companies in the American Century family of funds. No officer is compensated for his or her service as an officer of the funds. The listed officers are interested persons of the funds and are appointed or re-appointed on an annual basis. The mailing address for each officer listed below is 4500 Main Street, Kansas City, Missouri 64111.
| Name (Year of Birth) | Offices with the Funds | Principal Occupation(s) During the Past Five Years |
| Jonathan S. Thomas (1963) | Director and President since 2007 | President and Chief Executive Officer, ACC (2007 to present). Also serves as Chief Executive Officer, ACS; Executive Vice President, ACIM; Director, ACC, ACIM and other ACC subsidiaries |
| R. Wes Campbell (1974) | Chief Financial Officer and Treasurer since 2018 | Investment Operations and Investment Accounting, ACS (2000 to present) |
| Amy D. Shelton (1964) | Chief Compliance Officer and Vice President since 2014 | Chief Compliance Officer, American Century funds, (2014 to present); Chief Compliance Officer, ACIM (2014 to present); Chief Compliance Officer, ACIS (2009 to present); Vice President, Client Interactions and Marketing, ACIS (2013 to 2014). Also serves as Vice President, ACIS |
| Charles A. Etherington (1957) | General Counsel since 2007 and Senior Vice President since 2006 | Attorney, ACC (1994 to present); Vice President, ACC (2005 to present); General Counsel, ACC (2007 to present). Also serves as General Counsel, ACIM, ACS, ACIS and other ACC subsidiaries; and Senior Vice President, ACIM and ACS |
| C. Jean Wade (1964) | Vice President since 2012 | Senior Vice President, ACS (2017 to present); Vice President, ACS (2000 to 2017) |
| Robert J. Leach (1966) | Vice President since 2006 | Vice President, ACS (2000 to present) |
| David H. Reinmiller (1963) | Vice President since 2000 | Attorney, ACC (1994 to present). Also serves as Vice President, ACIM and ACS |
| Ward D. Stauffer (1960) | Secretary since 2005 | Attorney, ACC (2003 to present) |
32
| Approval of Management Agreement |
At a meeting held on June 28, 2018, the Fund’s Board of Directors (the "Board") unanimously approved the renewal of the management agreement pursuant to which American Century Investment Management, Inc. (the “Advisor”) acts as the investment advisor for the Fund. Under Section 15(c) of the Investment Company Act, contracts for investment advisory services are required to be reviewed, evaluated, and approved by a majority of a fund’s directors (the “Directors”), including a majority of the independent Directors, each year.
Prior to its consideration of the renewal of the management agreement, the Directors requested and reviewed extensive data and information compiled by the Advisor and certain independent providers of evaluation data concerning the Fund and the services provided to the Fund by the Advisor. This review was in addition to the oversight and evaluation undertaken by the Board and its committees on a continual basis and the information received was supplemental to the extensive information that the Board and its committees receive and consider throughout the year. The Directors also conducted a review of the process by which the Board considers the renewal of the management agreements. The Board consulted with industry experts and reviewed industry best practices and recent judicial precedent. The Directors believe that the enhancements resulting from their review resulted in increased dialogue with the Advisor and an improved process for fund shareholders.
In connection with its consideration of the renewal of the management agreement, the Board’s review and evaluation of the services provided by the Advisor included, but was not limited to, the following:
| • | the nature, extent, and quality of investment management, shareholder services, and other services provided and to be provided to the Fund; |
| • | the wide range of other programs and services provided and to be provided to the Fund and its shareholders on a routine and non-routine basis; |
| • | the investment performance of the Fund, including data comparing the Fund's performance to appropriate benchmarks and/or a peer group of other mutual funds with similar investment objectives and strategies; |
| • | the cost of owning the Fund compared to the cost of owning similar funds; |
| • | the compliance policies, procedures, and regulatory experience of the Advisor and the Fund's service providers; |
| • | financial data showing the cost of services provided to the Fund, the profitability of the Fund to the Advisor, and the overall profitability of the Advisor |
| • | strategic plans of the Advisor; |
| • | any economies of scale associated with the Advisor’s management of the Fund and other accounts; |
| • | services provided and charges to the Advisor's other investment management clients; |
| • | acquired fund fees and expenses; |
| • | payments and practices in connection with financial intermediaries holding shares of the Fund and the services provided by intermediaries in connection therewith; and |
| • | any collateral benefits derived by the Advisor from the management of the Fund. |
The Directors held two in-person meetings and one telephonic meeting to review and discuss the information provided. The independent Directors also reviewed responses to supplemental information requests provided by the Directors to the Advisor and held active discussions with the Advisor regarding the renewal of the management agreement. The independent Directors had the benefit of the advice of their independent counsel throughout the process.
33
Factors Considered
The Directors considered all of the information provided by the Advisor, the independent data providers, and independent counsel in connection with the approval. They determined that the information was sufficient for them to evaluate the management agreement for the Fund. In connection with their review, the Directors did not identify any single factor as being all-important or controlling, and each Director may have attributed different levels of importance to different factors. In deciding to renew the management agreement, the Board based its decision on a number of factors, including without limitation the following:
Nature, Extent and Quality of Services - Generally. Under the management agreement, the Advisor is responsible for providing or arranging for all services necessary for the operation of the Fund. The Board noted that the Advisor provides or arranges at its own expense a wide variety of services including without limitation the following:
| • | portfolio research and security selection |
| • | securities trading |
| • | Fund administration |
| • | custody of Fund assets |
| • | daily valuation of the Fund’s portfolio |
| • | shareholder servicing and transfer agency, including shareholder confirmations, recordkeeping, and communications |
| • | legal services (except the independent Directors’ counsel) |
| • | regulatory and portfolio compliance |
| • | financial reporting |
| • | marketing and distribution (except amounts paid by the Fund under Rule 12b-1 plans) |
The Board noted that many of these services have expanded over time in terms of both quantity and complexity in response to shareholder demands, competition in the industry, changing distribution channels, and the changing regulatory environment.
Investment Management Services. The nature of the investment management services provided to the Fund is quite complex and allows Fund shareholders access to professional money management, instant diversification of their investments within an asset class, the opportunity to easily diversify among asset classes by investing in or exchanging among various American Century Investments funds, and liquidity. In evaluating investment performance, the Board expects the Advisor to manage the Fund in accordance with its investment objectives and approved strategies. Further, the Directors recognize that the Advisor has an obligation to monitor trading activities, and in particular to seek the best execution of fund trades, and to evaluate the use of and payment for research. In providing these services, the Advisor utilizes teams of investment professionals (portfolio managers, analysts, research assistants, and securities traders) who require extensive information technology, research, training, compliance, and other systems to conduct their business. The Board, directly and through its Fund Performance Review Committee, provides oversight of the investment performance process. It regularly reviews investment performance information for the Fund, together with comparative information for appropriate benchmarks and/or peer groups of similarly-managed funds, over different time horizons. The Directors also review detailed performance information provided by the Advisor during the management agreement renewal process. If performance concerns are identified, the Fund receives special reviews until performance improves, during which the Board receives a report from the Advisor regarding the reasons for such results (e.g., market conditions, security selection) and any efforts being undertaken to improve performance. The Fund’s performance was above its benchmark for the one-, five-, and ten-year periods and below its benchmark for the three-year period reviewed by the Board. The Board discussed the Fund's performance with the Advisor and was satisfied with the efforts being undertaken by the Advisor. The Board found the investment management services provided by the Advisor to the Fund to be satisfactory and consistent with the management agreement.
34
Shareholder and Other Services. Under the management agreement, the Advisor provides the Fund with a comprehensive package of transfer agency, shareholder, and other services. The Board, directly and through various committees of the Board, regularly reviews reports and evaluations of such services at its regular meetings. These reports include, but are not limited to, information regarding the operational efficiency and accuracy of the shareholder and transfer agency services provided, staffing levels, shareholder satisfaction (as measured by external as well as internal sources), technology support, new products and services offered to Fund shareholders, securities trading activities, portfolio valuation services, auditing services, and legal and operational compliance activities. The Board found the services provided by the Advisor to the Fund under the management agreement to be competitive and of high quality.
Costs of Services and Profitability. The Advisor provides detailed information concerning its cost of providing various services to the Fund, its profitability in managing the Fund (pre- and post-distribution), its overall profitability, and its financial condition. The Directors have reviewed with the Advisor the methodology used to prepare this financial information. This information is considered in evaluating the Advisor’s financial condition, its ability to continue to provide services under the management agreement, and the reasonableness of the current management fee. The Board concluded that the Advisor’s profits were reasonable in light of the services provided to the Fund.
Ethics. The Board generally considers the Advisor’s commitment to providing quality services to shareholders and to conducting its business ethically. They noted that the Advisor’s practices generally meet or exceed industry best practices.
Economies of Scale. The Board also reviewed information provided by the Advisor regarding the possible existence of economies of scale in connection with the management of the Fund. The Board concluded that economies of scale are difficult to measure and predict with precision, especially on a fund-by-fund basis. The Board concluded that the Advisor is appropriately sharing economies of scale through its competitive fee structure, offering competitive fees from fund inception, and through reinvestment in its business to provide shareholders additional content and services. The Board also noted that economies of scale are shared with the Fund and its shareholders through management fee breakpoints that serve to reduce the effective management fee as the assets of the Fund grow.
Comparison to Other Funds’ Fees. The management agreement provides that the Fund pays the Advisor a single, all-inclusive (or unified) management fee for providing all services necessary for the management and operation of the Fund, other than brokerage expenses, expenses attributable to short sales, taxes, interest, extraordinary expenses, and the fees and expenses of the Fund’s independent Directors (including their independent legal counsel) and expenses incurred in connection with the provision of shareholder services and distribution services under a plan adopted pursuant to Rule 12b-1 under the 1940 Act. Under the unified fee structure, the Advisor is responsible for providing all investment advisory, custody, audit, administrative, compliance, recordkeeping, marketing and shareholder services, or arranging and supervising third parties to provide such services. By contrast, most other funds are charged a variety of fees, including an investment advisory fee, a transfer agency fee, an administrative fee, distribution charges, and other expenses. Other than their investment advisory fees and any applicable Rule 12b-1 distribution fees, all other components of the total fees charged by these other funds may be increased without shareholder approval. The Board believes the unified fee structure is a benefit to Fund shareholders because it clearly discloses to shareholders the cost of owning Fund shares, and, since the unified fee cannot be increased without a vote of Fund shareholders, it shifts to the Advisor the risk of increased costs of operating the Fund and provides a direct incentive to minimize administrative inefficiencies. Part of the Board’s analysis of fee levels involves reviewing certain evaluative data compiled by an independent provider comparing the Fund’s unified fee to the total expense ratios of its peers. The unified fee charged to shareholders of the Fund was above the median of the total expense ratios of the Fund’s peer expense universe and was within the range of its peer expense group. The Board concluded that the management fee paid by the
35
Fund to the Advisor under the management agreement is reasonable in light of the services provided to the Fund.
Comparison to Fees and Services Provided to Other Clients of the Advisor. The Directors also requested and received information from the Advisor concerning the nature of the services, fees, costs, and profitability of its advisory services to advisory clients other than the Fund. They observed that these varying types of client accounts require different services and involve different regulatory and entrepreneurial risks than the management of the Fund. The Board analyzed this information and concluded that the fees charged and services provided to the Fund were reasonable by comparison.
Payments to Intermediaries. The Directors also requested and received a description of payments made to intermediaries by the Fund and the Advisor and services provided in response thereto. These payments include various payments made by the Fund or the Advisor to different types of intermediaries and recordkeepers for distribution and service activities provided for the Fund. The Board reviewed such information and received representations from the Advisor that all such payments by the Fund were made pursuant to the Fund's Rule 12b-1 Plan and that all such payments by the Advisor were made from the Advisor’s resources and reasonable profits. The Board found the payments to be reasonable in scope and purpose.
Collateral or “Fall-Out” Benefits Derived by the Advisor. The Board considered the existence of collateral benefits the Advisor may receive as a result of its relationship with the Fund. They concluded that the Advisor’s primary business is managing mutual funds and it generally does not use fund or shareholder information to generate profits in other lines of business, and therefore does not derive any significant collateral benefits from them. The Board noted that additional assets from other clients may offer the Advisor some benefit from increased leverage with service providers and counterparties. Additionally, the Advisor may receive proprietary research from broker-dealers that execute fund portfolio transactions, which the Board concluded is likely to benefit other clients of the Advisor, as well as Fund shareholders. The Board also determined that the Advisor is able to provide investment management services to certain clients other than the Fund, at least in part, due to its existing infrastructure built to serve the fund complex. The Board concluded that appropriate allocation methodologies had been employed to assign resources and the cost of those resources to these other clients and, where expressly provided, these other client assets may be included with the assets of the Fund to determine breakpoints in the management fee schedule.
Existing Relationship. The Board also considered whether there was any reason for not continuing the existing arrangement with the Advisor. In this regard, the Board was mindful of the potential disruptions of the Fund’s operations and various risks, uncertainties, and other effects that could occur as a result of a decision not to continue such relationship. In particular, the Board recognized that most shareholders have invested in the Fund on the strength of the Advisor’s industry standing and reputation and in the expectation that the Advisor will have a continuing role in providing advisory services to the Fund.
Conclusion of the Directors. As a result of this process, the Board, including all of the independent Directors, taking into account all of the factors discussed above and the information provided by the Advisor and others in connection with its review and throughout the year, determined that the management fee is fair and reasonable in light of the services provided and that the investment management agreement between the Fund and the Advisor should be renewed.
36
| Additional Information |
Retirement Account Information
As required by law, distributions you receive from certain retirement accounts are subject to federal income tax withholding, unless you elect not to have withholding apply*. Tax will be withheld on the total amount withdrawn even though you may be receiving amounts that are not subject to withholding, such as nondeductible contributions. In such case, excess amounts of withholding could occur. You may adjust your withholding election so that a greater or lesser amount will be withheld.
If you don’t want us to withhold on this amount, you must notify us to not withhold the federal income tax. You may notify us in writing or in certain situations by telephone or through other electronic means. For systematic withdrawals, your withholding election will remain in effect until revoked or changed by filing a new election. You have the right to revoke your election at any time and change your withholding percentage for future distributions.
Remember, even if you elect not to have income tax withheld, you are liable for paying income tax on the taxable portion of your withdrawal. If you elect not to have income tax withheld or you don’t have enough income tax withheld, you may be responsible for payment of estimated tax. You may incur penalties under the estimated tax rules if your withholding and estimated tax payments are not sufficient. You can reduce or defer the income tax on a distribution by directly or indirectly rolling such distribution over to another IRA or eligible plan. You should consult your tax advisor for additional information.
State tax will be withheld if, at the time of your distribution, your address is within one of the mandatory withholding states and you have federal income tax withheld (or as otherwise required by state law). State taxes will be withheld from your distribution in accordance with the respective state rules.
*Some 403(b), 457 and qualified retirement plan distributions may be subject to 20% mandatory withholding, as they are subject to special tax and withholding rules. Your plan administrator or plan sponsor is required to provide you with a special tax notice explaining those rules at the time you request a distribution. If applicable, federal and/or state taxes may be withheld from your distribution amount.
Proxy Voting Policies
A description of the policies that the fund's investment advisor uses in exercising the voting rights associated with the securities purchased and/or held by the fund is available without charge, upon request, by calling 1-800-345-2021. It is also available on the "About Us" page of American Century Investments’ website at americancentury.com and on the Securities and Exchange Commission’s website at sec.gov. Information regarding how the investment advisor voted proxies relating to portfolio securities during the most recent 12-month period ended June 30 is available on the "About Us" page at americancentury.com. It is also available at sec.gov.
Quarterly Portfolio Disclosure
The fund files its complete schedule of portfolio holdings with the Securities and Exchange Commission (SEC) for the first and third quarters of each fiscal year on Form N-Q. The fund’s Forms N-Q are available on the SEC’s website at sec.gov. The fund also makes its complete schedule of portfolio holdings for the most recent quarter of its fiscal year available on its website at americancentury.com and, upon request, by calling 1-800-345-2021.
37
Other Tax Information
The following information is provided pursuant to provisions of the Internal Revenue Code.
The fund hereby designates up to the maximum amount allowable as qualified dividend income for the fiscal year ended November 30, 2018.
For the fiscal year ended November 30, 2018, the fund intends to pass through to shareholders foreign source income of $3,084,677 and foreign taxes paid of $259,335, or up to the maximum amount allowable, as a foreign tax credit. Foreign source income and foreign tax expense per outstanding share on November 30, 2018 are $0.5169 and $0.0435, respectively.
The fund utilized earnings and profits of $213,881 distributed to shareholders on redemption of shares as part of the dividends paid deduction (tax equalization).
38
| Notes |
39
| Notes |
40
| ||
| Contact Us | americancentury.com | |
| Automated Information Line | 1-800-345-8765 | |
| Investor Services Representative | 1-800-345-2021 or 816-531-5575 | |
| Investors Using Advisors | 1-800-378-9878 | |
| Business, Not-For-Profit, Employer-Sponsored Retirement Plans | 1-800-345-3533 | |
| Banks and Trust Companies, Broker-Dealers, Financial Professionals, Insurance Companies | 1-800-345-6488 | |
| Telecommunications Relay Service for the Deaf | 711 | |
| American Century World Mutual Funds, Inc. | ||
Investment Advisor: American Century Investment Management, Inc. Kansas City, Missouri | ||
| This report and the statements it contains are submitted for the general information of our shareholders. The report is not authorized for distribution to prospective investors unless preceded or accompanied by an effective prospectus. | ||
| ©2019 American Century Proprietary Holdings, Inc. All rights reserved. CL-ANN-91029 1901 | ||
| Annual Report | |
| November 30, 2018 | |
| NT Emerging Markets Fund | |
| G Class (ACLKX) | |
Beginning on January 1, 2021, as permitted by regulations adopted by the Securities and Exchange Commission, paper copies of the fund’s shareholder reports like this one will no longer be sent by mail, unless you specifically request paper copies of the reports from the fund or from your financial intermediary, such as a broker-dealer or bank. Instead, the reports will be made available on a website, and you will be notified by mail each time a report is posted and provided with a website link to access the report.
If you already elected to receive shareholder reports electronically, you will not be affected by this change and you need not take any action. You may elect to receive shareholder reports and other communications from the fund or your financial intermediary electronically by calling or sending an email request to your appropriate contacts as listed on the back cover of this report.
You may elect to receive all future reports in paper free of charge. You can inform the fund or your financial intermediary that you wish to continue receiving paper copies of your shareholder reports by calling or sending an email request to your appropriate contacts as listed on the back cover of this report. Your election to receive reports in paper will apply to all funds held with the fund complex/your financial intermediary.
| Table of Contents |
| Performance | 2 | |
| Portfolio Commentary | ||
| Fund Characteristics | ||
| Shareholder Fee Example | ||
| Schedule of Investments | ||
| Statement of Assets and Liabilities | ||
| Statement of Operations | ||
| Statement of Changes in Net Assets | ||
| Notes to Financial Statements | ||
| Financial Highlights | ||
| Report of Independent Registered Public Accounting Firm | ||
| Management | ||
| Approval of Management Agreement | ||
| Additional Information | ||
Any opinions expressed in this report reflect those of the author as of the date of the report, and do not necessarily represent the opinions of American Century Investments® or any other person in the American Century Investments organization. Any such opinions are subject to change at any time based upon market or other conditions and American Century Investments disclaims any responsibility to update such opinions. These opinions may not be relied upon as investment advice and, because investment decisions made by American Century Investments funds are based on numerous factors, may not be relied upon as an indication of trading intent on behalf of any American Century Investments fund. Security examples are used for representational purposes only and are not intended as recommendations to purchase or sell securities. Performance information for comparative indices and securities is provided to American Century Investments by third party vendors. To the best of American Century Investments’ knowledge, such information is accurate at the time of printing.
| Performance |
| Total Returns as of November 30, 2018 | |||||
Average Annual Returns | |||||
Ticker Symbol | 1 year | 5 years | 10 years | Inception Date | |
| G Class | ACLKX | -13.75% | 3.65% | 9.69% | 5/12/06 |
| MSCI Emerging Markets Index | — | -9.09% | 1.90% | 9.12% | — |
Fund returns would have been lower if a portion of the fees had not been waived.
| Growth of $10,000 Over 10 Years |
| $10,000 investment made November 30, 2008 |
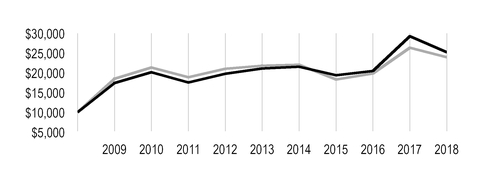
| Value on November 30, 2018 | |
G Class — $25,221 | |
| MSCI Emerging Markets Index — $23,953 | |
Ending value of G Class would have been lower if a portion of the fees had not been waived.
Total Annual Fund Operating Expenses | |
| G Class | 0.91% |
The total annual fund operating expenses shown is as stated in the fund’s prospectus current as of the date of this report. The prospectus may vary from the expense ratio shown elsewhere in this report because it is based on a different time period, includes acquired fund fees and expenses, and, if applicable, does not include fee waivers or expense reimbursements.
Data presented reflect past performance. Past performance is no guarantee of future results. Current performance may be higher or lower than the performance shown. Total returns for periods less than one year are not annualized. Investment return and principal value will fluctuate, and redemption value may be more or less than original cost. Data assumes reinvestment of dividends and capital gains, and none of the charts reflect the deduction of taxes that a shareholder would pay on fund distributions or the redemption of fund shares. To obtain performance data current to the most recent month end, please call 1-800-345-2021 or visit americancentury.com. For additional information about the fund, please consult the prospectus.
2
| Portfolio Commentary |
Portfolio Managers: Patricia Ribeiro and Sherwin Soo
Performance Summary
NT Emerging Markets returned -13.75%* for the 12 months ended November 30, 2018. The portfolio’s benchmark, the MSCI Emerging Markets Index, returned -9.09% for the same period.
The fund underperformed its benchmark during the period, primarily due to negative stock selection in the information technology sector, as well as stock selection and an underweight in financials for most of the year. Conversely, individual holdings in the consumer discretionary, energy, and financials sectors had a positive relative impact. Regionally, stock selection in China and Taiwan weighed on relative performance, while stock selection and an underweight in South Africa aided results.
Information Technology Holdings Detracted
Holdings in the information technology sector were the primary drivers of the fund’s underperformance over the 12-month period, where notable detractors included flexible printed circuit manufacturer Career Technology MFG, optical components manufacturer Sunny Optical Technology Group, and electronic government services provider My EG Services. We sold our position in My EG Services.
Asian equities suffered a brutal sell-off earlier this year amid negative headlines on deteriorating U.S.-China trade negotiations, a spike in global yields, and a strong U.S. dollar. Shares of Taiwan-based Career Technology MFG fell during the period due primarily to sluggish new product sales from Apple (sales of Apple’s newest phones have been lower than expected) coupled with intensifying competition. Sunny Optical Technology Group’s stock price declined after reporting disappointing midyear results. The China-based company’s net profit margin declined on decreased gross profit margins of handset camera modules and lower vehicle lens shipments. Increased competition also weighed on investor sentiment. Uncertainties surrounding the election of a new prime minister in Malaysia pressured My EG Services. Investors bid shares lower on assumptions that government changes would make it difficult for My EG Services to secure new projects.
The fund’s underperformance in the financials sector was driven primarily by Sberbank of Russia. Shares of state-owned financial services company Sberbank of Russia traded lower on concerns that additional U.S. sanctions may negatively impact growth and currency. Geopolitical risk and a challenging macroenvironment consequently led to a decline in credit demand from corporate borrowers. Additionally, the fund’s lack of exposure to Qatar National Bank and Banco Bradesco in Brazil weighed on relative results.
Individual Holdings Across Sectors Contributed
The fund’s consumer discretionary holdings aided relative results, led by retailer Magazine Luiza, textile manufacturer Shenzhou International Group Holdings, and multibrand hotel operator Huazhu Group. Magazine Luiza rallied on solid results driven by robust top-line growth. The company’s stock price was also supported by accelerated growth in online volume. Rising consumption in China and a consumer shift to foreign brands supported stock gains for Shenzhou International Group. Other positives for the stock included an acceleration in revenue growth due to market share gains, cost savings from new fabric and garment facilities, and margin improvement through automation. Huazhu Group, formerly known as China Lodging Group, rallied after exceeding expectations for revenue and earnings growth.
* Fund returns would have been lower if a portion of the fees had not been waived.
3
Within the energy sector, Russian independent gas producer Novatek and China-based CNOOC, which engages in the exploration, development, production, and sale of crude oil, natural gas, and other petroleum products, boosted relative performance. Novatek benefited from ramped-up production driven by the launch of several major projects this year. Meanwhile, rising oil prices combined with better-than-expected production in China, volume growth driven by overseas projects, and cost control measures supported shares of oil producer CNOOC.
Other notable contributors included India-based HDFC Bank, South Africa-based Capitec Bank Holdings, and Indonesia-based Bank Rakyat Indonesia Parsero. HDFC showed steady performance with stable asset quality and strong profit and loan growth, while Capitec’s profits jumped as the bank continues to consistently gain active clients. Meanwhile, Bank Rakyat benefited from steady microloan growth, cost efficiencies, and expected lower provisions.
Outlook
We continue to believe the long-term case for emerging markets stocks remains strong. The recent cooling of expectations for future U.S. interest rate hikes and de-escalation of trade tensions between the U.S. and China are expected to provide support for emerging markets stock prices.
The fund continues to invest in companies where fundamentals are strong and improving but share price performance does not fully reflect these factors. Our process is based on individual security selection, but broad themes have emerged.
Geographically, we remain overweight Brazil. We believe the 2018 elections provided a meaningful change in the direction of the country’s macroeconomic policy. Moving forward, we expect the Brazilian economy to accelerate without excessive inflation pressure and are positioned primarily in the private sector to benefit from the expected recovery in domestic demand.
Although we reduced our exposure to China, the country remains an important position on an absolute basis. We expect continued fiscal stimulus measures such as tax cuts and infrastructure spending to support a recovery in China’s economic growth, and as such, are positioned in the domestic market to benefit from rising household consumption.
Consumer discretionary is the largest relative sector position as of period-end. While we reduced our exposure during the period, we remain positive on companies positioned for strengthening consumer demand for luxury, education, and higher standard of living purchases. We continue to maintain our energy underweight as we see few names that fit our investment process. Our holdings in the sector represent companies that have earnings catalysts outside commodity prices.
Finally, we meaningfully increased our financials position over the last year, shifting from a relative underweight to an overweight versus the benchmark. We are finding opportunities in banks and diversified financial services firms positioned to benefit from the increasing demand for banking, investment, and insurance services, which remain at low penetration levels relative to developed markets.
4
| Fund Characteristics |
| NOVEMBER 30, 2018 | |
Top Ten Holdings | % of net assets |
| Tencent Holdings Ltd. | 5.3% |
| Taiwan Semiconductor Manufacturing Co. Ltd. | 4.6% |
| Alibaba Group Holding Ltd. ADR | 4.6% |
| Samsung Electronics Co. Ltd. | 3.7% |
| CNOOC Ltd. | 2.7% |
| Novatek PJSC GDR | 2.2% |
| China Construction Bank Corp., H Shares | 2.1% |
| HDFC Bank Ltd. | 2.0% |
| Industrial & Commercial Bank of China Ltd., H Shares | 2.0% |
| Naspers Ltd., N Shares | 2.0% |
Types of Investments in Portfolio | % of net assets |
| Common Stocks | 99.8% |
| Temporary Cash Investments | 1.5% |
| Other Assets and Liabilities | (1.3)% |
Investments by Country | % of net assets |
| China | 29.5% |
| South Korea | 13.6% |
| Taiwan | 10.1% |
| India | 10.0% |
| Brazil | 8.6% |
| South Africa | 4.6% |
| Russia | 4.3% |
| Indonesia | 3.4% |
| Mexico | 3.3% |
| Thailand | 2.8% |
| Other Countries | 9.6% |
| Cash and Equivalents* | 0.2% |
*Includes temporary cash investments and other assets and liabilities.
5
| Shareholder Fee Example |
Fund shareholders may incur two types of costs: (1) transaction costs, including sales charges (loads) on purchase payments and redemption/exchange fees; and (2) ongoing costs, including management fees; distribution and service (12b-1) fees; and other fund expenses. This example is intended to help you understand your ongoing costs (in dollars) of investing in your fund and to compare these costs with the ongoing cost of investing in other mutual funds.
The example is based on an investment of $1,000 made at the beginning of the period and held for the entire period from June 1, 2018 to November 30, 2018.
Actual Expenses
The table provides information about actual account values and actual expenses for each class. You may use the information, together with the amount you invested, to estimate the expenses that you paid over the period. First, identify the share class you own. Then simply divide your account value by $1,000 (for example, an $8,600 account value divided by $1,000 = 8.6), then multiply the result by the number under the heading “Expenses Paid During Period” to estimate the expenses you paid on your account during this period.
Hypothetical Example for Comparison Purposes
The table also provides information about hypothetical account values and hypothetical expenses based on the actual expense ratio of each class of your fund and an assumed rate of return of 5% per year before expenses, which is not the actual return of a fund’s share class. The hypothetical account values and expenses may not be used to estimate the actual ending account balance or expenses you paid for the period. You may use this information to compare the ongoing costs of investing in your fund and other funds. To do so, compare this 5% hypothetical example with the 5% hypothetical examples that appear in the shareholder reports of the other funds.
Please note that the expenses shown in the table are meant to highlight your ongoing costs only and do not reflect any transactional costs, such as sales charges (loads) or redemption/exchange fees. Therefore, the table is useful in comparing ongoing costs only, and will not help you determine the relative total costs of owning different funds. In addition, if these transactional costs were included, your costs would have been higher.
| Beginning Account Value 6/1/18 | Ending Account Value 11/30/18 | Expenses Paid During Period(1) 6/1/18 - 11/30/18 | Annualized Expense Ratio(1) | |
Actual | ||||
| G Class | $1,000 | $860.10 | $0.05 | 0.01% |
| Hypothetical | ||||
| G Class | $1,000 | $1,025.02 | $0.05 | 0.01% |
| (1) | Expenses are equal to the class's annualized expense ratio listed in the table above, multiplied by the average account value over the period, multiplied by 183, the number of days in the most recent fiscal half-year, divided by 365, to reflect the one-half year period. Annualized expense ratio reflects actual expenses, including any applicable fee waivers or expense reimbursements and excluding any acquired fund fees and expenses. |
6
| Schedule of Investments |
NOVEMBER 30, 2018
| Shares | Value | ||||
| COMMON STOCKS — 99.8% | |||||
| Brazil — 8.6% | |||||
| Ambev SA ADR | 454,381 | $ | 1,940,207 | ||
| B3 SA - Brasil Bolsa Balcao | 516,900 | 3,769,480 | |||
| Duratex SA | 391,300 | 1,238,560 | |||
| Itau Unibanco Holding SA ADR | 798,567 | 7,450,630 | |||
| Localiza Rent a Car SA | 532,600 | 3,706,301 | |||
| Lojas Renner SA | 433,000 | 4,378,149 | |||
| Magazine Luiza SA | 128,200 | 5,457,866 | |||
Pagseguro Digital Ltd., Class A(1) | 122,032 | 2,928,768 | |||
| Vale SA ADR | 287,099 | 3,933,256 | |||
| 34,803,217 | |||||
| China — 29.5% | |||||
Alibaba Group Holding Ltd. ADR(1) | 114,371 | 18,397,719 | |||
| Anhui Conch Cement Co. Ltd., H Shares | 955,000 | 4,984,953 | |||
Baozun, Inc. ADR(1) | 84,713 | 2,987,828 | |||
| Brilliance China Automotive Holdings Ltd. | 2,130,000 | 1,898,564 | |||
| China Construction Bank Corp., H Shares | 10,116,000 | 8,650,451 | |||
| China Gas Holdings Ltd. | 776,000 | 2,671,849 | |||
| China Resources Beer Holdings Co. Ltd. | 1,294,000 | 4,382,043 | |||
| CNOOC Ltd. | 6,555,000 | 11,057,285 | |||
| Geely Automobile Holdings Ltd. | 1,124,000 | 2,212,501 | |||
Haier Electronics Group Co. Ltd.(1) | 706,000 | 1,643,743 | |||
| Huazhu Group Ltd. ADR | 72,160 | 2,275,926 | |||
| Industrial & Commercial Bank of China Ltd., H Shares | 11,055,095 | 7,878,357 | |||
KWG Group Holdings Ltd.(1) | 3,769,000 | 3,352,037 | |||
New Oriental Education & Technology Group, Inc. ADR(1) | 64,004 | 3,658,469 | |||
| Ping An Insurance Group Co. of China Ltd., H Shares | 758,000 | 7,355,204 | |||
| Shenzhou International Group Holdings Ltd. | 538,000 | 6,554,583 | |||
| Sunny Optical Technology Group Co. Ltd. | 203,800 | 1,985,142 | |||
TAL Education Group ADR(1) | 122,390 | 3,435,487 | |||
| Tencent Holdings Ltd. | 537,200 | 21,547,726 | |||
| Yangtze Optical Fibre and Cable Joint Stock Ltd. Co., H Shares | 682,500 | 1,850,344 | |||
| 118,780,211 | |||||
| Czech Republic — 1.0% | |||||
| Moneta Money Bank AS | 1,169,877 | 4,030,486 | |||
| Egypt — 0.6% | |||||
| Commercial International Bank Egypt S.A.E. | 286,948 | 1,195,376 | |||
| Commercial International Bank Egypt S.A.E. GDR | 298,604 | 1,267,341 | |||
| 2,462,717 | |||||
| Hungary — 1.6% | |||||
| OTP Bank Nyrt | 163,381 | 6,540,029 | |||
7
| Shares | Value | ||||
| India — 10.0% | |||||
| Ashok Leyland Ltd. | 1,542,627 | $ | 2,488,147 | ||
| Balkrishna Industries Ltd. | 190,971 | 2,633,130 | |||
| Bata India Ltd. | 156,075 | 2,344,413 | |||
Bharat Financial Inclusion Ltd.(1) | 315,127 | 4,628,063 | |||
Future Retail Ltd.(1) | 381,850 | 2,882,298 | |||
| Godrej Consumer Products Ltd. | 538,180 | 5,797,158 | |||
| HDFC Bank Ltd. | 267,108 | 8,149,944 | |||
| Jubilant Foodworks Ltd. | 110,065 | 1,993,913 | |||
| Larsen & Toubro Ltd. | 280,158 | 5,760,425 | |||
| Tata Consultancy Services Ltd. | 123,598 | 3,488,673 | |||
| 40,166,164 | |||||
| Indonesia — 3.4% | |||||
| Bank Rakyat Indonesia Persero Tbk PT | 27,605,900 | 7,019,545 | |||
| Telekomunikasi Indonesia Persero Tbk PT | 16,532,100 | 4,273,693 | |||
| United Tractors Tbk PT | 1,284,100 | 2,471,542 | |||
| 13,764,780 | |||||
| Malaysia — 0.7% | |||||
| CIMB Group Holdings Bhd | 1,961,053 | 2,706,268 | |||
| Mexico — 3.3% | |||||
| America Movil SAB de CV, Class L ADR | 301,423 | 4,054,139 | |||
| Grupo Aeroportuario del Centro Norte SAB de CV | 317,154 | 1,419,996 | |||
| Mexichem SAB de CV | 1,290,101 | 3,010,737 | |||
| Wal-Mart de Mexico SAB de CV | 2,001,884 | 4,959,037 | |||
| 13,443,909 | |||||
| Peru — 1.2% | |||||
| Credicorp Ltd. | 21,642 | 4,745,874 | |||
| Philippines — 1.1% | |||||
| Ayala Land, Inc. | 5,429,600 | 4,321,800 | |||
| Russia — 4.3% | |||||
| Novatek PJSC GDR | 53,059 | 9,063,883 | |||
| Sberbank of Russia PJSC ADR (London) | 321,546 | 3,815,835 | |||
Yandex NV, A Shares(1) | 147,883 | 4,362,549 | |||
| 17,242,267 | |||||
| South Africa — 4.6% | |||||
| Capitec Bank Holdings Ltd. | 62,477 | 4,960,477 | |||
| Discovery Ltd. | 260,161 | 2,902,940 | |||
| Foschini Group Ltd. (The) | 220,061 | 2,790,027 | |||
| Naspers Ltd., N Shares | 39,158 | 7,866,560 | |||
| 18,520,004 | |||||
| South Korea — 13.6% | |||||
CJ Logistics Corp.(1) | 29,928 | 4,258,610 | |||
| Cosmax, Inc. | 27,662 | 3,373,955 | |||
Doosan Infracore Co. Ltd.(1) | 501,045 | 3,816,288 | |||
| Fila Korea Ltd. | 146,675 | 6,662,981 | |||
| Hana Financial Group, Inc. | 104,871 | 3,529,653 | |||
| Hotel Shilla Co. Ltd. | 31,190 | 2,401,264 | |||
8
| Shares | Value | ||||
Hyundai Heavy Industries Co. Ltd.(1) | 43,893 | $ | 5,198,589 | ||
| Medy-Tox, Inc. | 4,367 | 2,198,464 | |||
| Orion Corp/Republic of Korea | 30,158 | 3,002,105 | |||
| POSCO Chemtech Co. Ltd. | 47,744 | 2,901,104 | |||
| Samsung Electro-Mechanics Co. Ltd. | 22,745 | 2,463,324 | |||
| Samsung Electronics Co. Ltd. | 402,281 | 15,103,132 | |||
| 54,909,469 | |||||
| Taiwan — 10.1% | |||||
| Career Technology MFG. Co. Ltd. | 1,625,000 | 1,603,190 | |||
| Chailease Holding Co. Ltd. | 1,476,960 | 4,603,613 | |||
| Chroma ATE, Inc. | 432,000 | 1,684,233 | |||
| Globalwafers Co. Ltd. | 258,000 | 3,057,184 | |||
| Powertech Technology, Inc. | 365,000 | 855,611 | |||
| President Chain Store Corp. | 509,000 | 5,273,622 | |||
| Taiwan Cement Corp. | 4,560,400 | 5,132,004 | |||
| Taiwan Semiconductor Manufacturing Co. Ltd. | 2,521,774 | 18,434,950 | |||
| 40,644,407 | |||||
| Thailand — 2.8% | |||||
| Airports of Thailand PCL | 1,324,200 | 2,595,360 | |||
| CP ALL PCL | 1,042,700 | 2,160,741 | |||
| Kasikornbank PCL | 64,900 | 382,912 | |||
| Kasikornbank PCL NVDR | 595,300 | 3,512,689 | |||
| Minor International PCL | 2,516,000 | 2,784,560 | |||
| 11,436,262 | |||||
| Turkey — 1.1% | |||||
| BIM Birlesik Magazalar AS | 165,120 | 2,677,976 | |||
| Ford Otomotiv Sanayi AS | 170,692 | 1,766,058 | |||
| 4,444,034 | |||||
| United Arab Emirates — 1.1% | |||||
| First Abu Dhabi Bank PJSC | 1,164,624 | 4,314,952 | |||
| United Kingdom — 1.2% | |||||
| NMC Health plc | 120,550 | 5,092,467 | |||
TOTAL COMMON STOCKS (Cost $350,868,511) | 402,369,317 | ||||
| TEMPORARY CASH INVESTMENTS — 1.5% | |||||
| Repurchase Agreement, BMO Capital Markets Corp., (collateralized by various U.S. Treasury obligations, 1.125% - 3.125%, 5/31/19 - 11/15/28, valued at $4,949,893), in a joint trading account at 2.00%, dated 11/30/18, due 12/3/18 (Delivery value $4,853,405) | 4,852,596 | ||||
| Repurchase Agreement, Fixed Income Clearing Corp., (collateralized by various U.S. Treasury obligations, 3.375%, 11/15/48, valued at $1,101,149), at 1.05%, dated 11/30/18, due 12/3/18 (Delivery value $1,079,094) | 1,079,000 | ||||
| State Street Institutional U.S. Government Money Market Fund, Premier Class | 2,530 | 2,530 | |||
TOTAL TEMPORARY CASH INVESTMENTS (Cost $5,934,126) | 5,934,126 | ||||
TOTAL INVESTMENT SECURITIES — 101.3% (Cost $356,802,637) | 408,303,443 | ||||
| OTHER ASSETS AND LIABILITIES — (1.3)% | (5,325,261 | ) | |||
| TOTAL NET ASSETS — 100.0% | $ | 402,978,182 | |||
9
| MARKET SECTOR DIVERSIFICATION | ||
(as a % of net assets) | ||
| Financials | 25.5 | % |
| Consumer Discretionary | 19.2 | % |
| Information Technology | 13.4 | % |
| Communication Services | 10.5 | % |
| Consumer Staples | 8.9 | % |
| Industrials | 7.2 | % |
| Energy | 5.6 | % |
| Materials | 5.2 | % |
| Real Estate | 1.9 | % |
| Health Care | 1.7 | % |
| Utilities | 0.7 | % |
| Cash and Equivalents* | 0.2 | % |
* Includes temporary cash investments and other assets and liabilities.
| NOTES TO SCHEDULE OF INVESTMENTS | ||
| ADR | - | American Depositary Receipt |
| GDR | - | Global Depositary Receipt |
| NVDR | - | Non-Voting Depositary Receipt |
| (1) | Non-income producing. |
See Notes to Financial Statements.
10
| Statement of Assets and Liabilities |
| NOVEMBER 30, 2018 | |||
| Assets | |||
| Investment securities, at value (cost of $356,802,637) | $ | 408,303,443 | |
| Foreign currency holdings, at value (cost of $165,163) | 165,248 | ||
| Receivable for investments sold | 637,610 | ||
| Dividends and interest receivable | 159,189 | ||
| Other assets | 36,169 | ||
| 409,301,659 | |||
| Liabilities | |||
| Payable for capital shares redeemed | 6,323,477 | ||
| Net Assets | $ | 402,978,182 | |
| G Class Capital Shares, $0.01 Par Value | |||
| Shares authorized | 400,000,000 | ||
| Shares outstanding | 36,007,021 | ||
| Net Asset Value Per Share | $ | 11.19 | |
| Net Assets Consist of: | |||
| Capital (par value and paid-in surplus) | $ | 318,365,435 | |
| Distributable earnings | 84,612,747 | ||
| $ | 402,978,182 | ||
See Notes to Financial Statements.
11
| Statement of Operations |
| YEAR ENDED NOVEMBER 30, 2018 | |||
| Investment Income (Loss) | |||
| Income: | |||
| Dividends (net of foreign taxes withheld of $1,042,221) | $ | 7,929,916 | |
| Interest | 92,050 | ||
| 8,021,966 | |||
| Expenses: | |||
| Management fees | 4,242,689 | ||
| Directors' fees and expenses | 12,507 | ||
| Other expenses | 39,797 | ||
| 4,294,993 | |||
| Fees waived | (4,242,689 | ) | |
| 52,304 | |||
| Net investment income (loss) | 7,969,662 | ||
| Realized and Unrealized Gain (Loss) | |||
| Net realized gain (loss) on: | |||
| Investment transactions (net of foreign tax expenses paid (refunded) of $524,362) | 30,599,298 | ||
| Foreign currency translation transactions | (424,294 | ) | |
| 30,175,004 | |||
| Change in net unrealized appreciation (depreciation) on: | |||
| Investments (includes (increase) decrease in accrued foreign taxes of $1,819,315) | (98,664,481 | ) | |
| Translation of assets and liabilities in foreign currencies | (4,338 | ) | |
| (98,668,819 | ) | ||
| Net realized and unrealized gain (loss) | (68,493,815 | ) | |
| Net Increase (Decrease) in Net Assets Resulting from Operations | $ | (60,524,153 | ) |
See Notes to Financial Statements.
12
| Statement of Changes in Net Assets |
| YEARS ENDED NOVEMBER 30, 2018 AND NOVEMBER 30, 2017 | ||||||
| Increase (Decrease) in Net Assets | November 30, 2018 | November 30, 2017 | ||||
| Operations | ||||||
| Net investment income (loss) | $ | 7,969,662 | $ | 3,583,701 | ||
| Net realized gain (loss) | 30,175,004 | 55,557,307 | ||||
| Change in net unrealized appreciation (depreciation) | (98,668,819 | ) | 111,702,130 | |||
| Net increase (decrease) in net assets resulting from operations | (60,524,153 | ) | 170,843,138 | |||
| Distributions to Shareholders | ||||||
| From earnings: | ||||||
| G Class | (52,688,830 | ) | (3,148,286 | ) | ||
| R6 Class | — | (409,550 | ) | |||
| Decrease in net assets from distributions | (52,688,830 | ) | (3,557,836 | ) | ||
| Capital Share Transactions | ||||||
| Net increase (decrease) in net assets from capital share transactions (Note 5) | 34,697,164 | (119,607,753 | ) | |||
| Net increase (decrease) in net assets | (78,515,819 | ) | 47,677,549 | |||
| Net Assets | ||||||
| Beginning of period | 481,494,001 | 433,816,452 | ||||
| End of period | $ | 402,978,182 | $ | 481,494,001 | ||
See Notes to Financial Statements.
13
| Notes to Financial Statements |
NOVEMBER 30, 2018
1. Organization
American Century World Mutual Funds, Inc. (the corporation) is registered under the Investment Company Act of 1940, as amended (the 1940 Act), as an open-end management investment company and is organized as a Maryland corporation. NT Emerging Markets Fund (the fund) is one fund in a series issued by the corporation. The fund’s investment objective is to seek capital growth. The fund is not permitted to invest in securities issued by companies assigned the Global Industry Classification Standard or the Bloomberg Industry Classification Standard for the tobacco industry. The fund offers the G Class. On July 31, 2017, all outstanding R6 Class shares were converted to G Class shares and the fund discontinued offering the R6 Class.
2. Significant Accounting Policies
The following is a summary of significant accounting policies consistently followed by the fund in preparation of its financial statements. The fund is an investment company and follows accounting and reporting guidance in accordance with accounting principles generally accepted in the United States of America. This may require management to make certain estimates and assumptions at the date of the financial statements. Actual results could differ from these estimates. Management evaluated the impact of events or transactions occurring through the date the financial statements were issued that would merit recognition or disclosure.
Investment Valuations — The fund determines the fair value of its investments and computes its net asset value per share at the close of regular trading (usually 4 p.m. Eastern time) on the New York Stock Exchange (NYSE) on each day the NYSE is open. The Board of Directors has adopted valuation policies and procedures to guide the investment advisor in the fund’s investment valuation process and to provide methodologies for the oversight of the fund’s pricing function.
Equity securities that are listed or traded on a domestic securities exchange are valued at the last reported sales price or at the official closing price as provided by the exchange. Equity securities traded on foreign securities exchanges are generally valued at the closing price of such securities on the exchange where primarily traded or at the close of the NYSE, if that is earlier. If no last sales price is reported, or if local convention or regulation so provides, the mean of the latest bid and asked prices may be used. Securities traded over-the-counter are valued at the mean of the latest bid and asked prices, the last sales price, or the official closing price. Equity securities initially expressed in local currencies are translated into U.S. dollars at the mean of the appropriate currency exchange rate at the close of the NYSE as provided by an independent pricing service.
Open-end management investment companies are valued at the reported net asset value per share. Repurchase agreements are valued at cost, which approximates fair value.
If the fund determines that the market price for an investment is not readily available or the valuation methods mentioned above do not reflect an investment’s fair value, such investment is valued as determined in good faith by the Board of Directors or its delegate, in accordance with policies and procedures adopted by the Board of Directors. In its determination of fair value, the fund may review several factors including, but not limited to, market information regarding the specific investment or comparable investments and correlation with other investment types, futures indices or general market indicators. Circumstances that may cause the fund to use these procedures to value an investment include, but are not limited to: an investment has been declared in default or is distressed; trading in a security has been suspended during the trading day or a security is not actively trading on its principal exchange; prices received from a regular pricing source are deemed unreliable; or there is a foreign market holiday and no trading occurred.
The fund monitors for significant events occurring after the close of an investment’s primary exchange but before the fund’s net asset value per share is determined. Significant events may include, but are not limited to: corporate announcements and transactions; governmental action and political unrest that could impact a specific investment or an investment sector; or armed conflicts, natural disasters and similar events that could affect investments in a specific country or region. The fund also monitors for significant fluctuations between domestic and foreign markets, as evidenced by the U.S. market or such other indicators that the Board of Directors, or its delegate, deems appropriate. If significant fluctuations in foreign markets are identified, the
14
fund may apply a model-derived factor to the closing price of equity securities traded on foreign securities exchanges. The factor is based on observable market data as provided by an independent pricing service.
Security Transactions — Security transactions are accounted for as of the trade date. Net realized gains and losses are determined on the identified cost basis, which is also used for federal income tax purposes. Certain countries impose taxes on realized gains on the sale of securities registered in their country. The fund records the foreign tax expense, if any, on an accrual basis. The foreign tax expense on realized gains and unrealized appreciation reduces the net realized gain (loss) on investment transactions and net unrealized appreciation (depreciation) on investments, respectively.
Investment Income — Dividend income less foreign taxes withheld, if any, is recorded as of the ex-dividend date. Distributions received on securities that represent a return of capital or long-term capital gain are recorded as a reduction of cost of investments and/or as a realized gain. The fund may estimate the components of distributions received that may be considered nontaxable distributions or long-term capital gain distributions for income tax purposes. Interest income is recorded on the accrual basis and includes accretion of discounts and amortization of premiums.
Foreign Currency Translations — All assets and liabilities initially expressed in foreign currencies are translated into U.S. dollars at prevailing exchange rates at period end. The fund may enter into spot foreign currency exchange contracts to facilitate transactions denominated in a foreign currency. Purchases and sales of investment securities, dividend and interest income, spot foreign currency exchange contracts, and expenses are translated at the rates of exchange prevailing on the respective dates of such transactions. Net realized and unrealized foreign currency exchange gains or losses related to investment securities are a component of net realized gain (loss) on investment transactions and change in net unrealized appreciation (depreciation) on investments, respectively.
Repurchase Agreements — The fund may enter into repurchase agreements with institutions that American Century Investment Management, Inc. (ACIM) (the investment advisor) has determined are creditworthy pursuant to criteria adopted by the Board of Directors. The fund requires that the collateral, represented by securities, received in a repurchase transaction be transferred to the custodian in a manner sufficient to enable the fund to obtain those securities in the event of a default under the repurchase agreement. ACIM monitors, on a daily basis, the securities transferred to ensure the value, including accrued interest, of the securities under each repurchase agreement is equal to or greater than amounts owed to the fund under each repurchase agreement.
Joint Trading Account — Pursuant to an Exemptive Order issued by the Securities and Exchange Commission, the fund, along with certain other funds in the American Century Investments family of funds, may transfer uninvested cash balances into a joint trading account. These balances are invested in one or more repurchase agreements that are collateralized by U.S. Treasury or Agency obligations.
Income Tax Status — It is the fund’s policy to distribute substantially all net investment income and net realized gains to shareholders and to otherwise qualify as a regulated investment company under provisions of the Internal Revenue Code. Accordingly, no provision has been made for income taxes. The fund files U.S. federal, state, local and non-U.S. tax returns as applicable. The fund's tax returns are subject to examination by the relevant taxing authority until expiration of the applicable statute of limitations, which is generally three years from the date of filing but can be longer in certain jurisdictions. At this time, management believes there are no uncertain tax positions which, based on their technical merit, would not be sustained upon examination and for which it is reasonably possible that the total amounts of unrecognized tax benefits will significantly change in the next twelve months.
Distributions to Shareholders — Distributions from net investment income and net realized gains, if any, are generally declared and paid annually. The fund may make distributions on a more frequent basis to comply with the distribution requirements of the Internal Revenue Code, in all events in a manner consistent with provisions of the 1940 Act.
Indemnifications — Under the corporation’s organizational documents, its officers and directors are indemnified against certain liabilities arising out of the performance of their duties to the fund. In addition, in the normal course of business, the fund enters into contracts that provide general indemnifications. The maximum exposure under these arrangements is unknown as this would involve future claims that may be made against a fund. The risk of material loss from such claims is considered by management to be remote.
15
3. Fees and Transactions with Related Parties
Certain officers and directors of the corporation are also officers and/or directors of American Century Companies, Inc. (ACC). The corporation’s investment advisor, ACIM, the corporation's distributor, American Century Investment Services, Inc., and the corporation’s transfer agent, American Century Services, LLC, are wholly owned, directly or indirectly, by ACC. Various funds issued by American Century Asset Allocation Portfolios, Inc. own, in aggregate, 100% of the shares of the fund. Related parties do not invest in the fund for the purpose of exercising management or control.
Management Fees — The corporation has entered into a management agreement with ACIM, under which ACIM provides the fund with investment advisory and management services in exchange for a single, unified management fee (the fee). The agreement provides that all expenses of managing and operating the fund, except brokerage expenses, taxes, interest, fees and expenses of the independent directors (including legal counsel fees), and extraordinary expenses, will be paid by ACIM. The fee is computed and accrued daily based on the daily net assets of the fund and paid monthly in arrears. From December 1, 2017 through March 31, 2018, the rate of the fee was determined by applying a fee rate calculation formula. This formula took into account the fund’s assets as well as certain assets, if any, of other clients of the investment advisor outside the American Century Investments family of funds (such as subadvised funds and separate accounts) that use very similar investment teams and strategies (strategy assets). The strategy assets of the fund also included the assets of Emerging Markets Fund, one fund in a series issued by the corporation. The annual management fee schedule ranged from 0.900% to 1.500%. Effective April 1, 2018, the stepped annual management fee schedule was terminated. The annual management fee is 0.90%. During the period ended November 30, 2018, the investment advisor agreed to waive the management fee in its entirety. The investment advisor expects this waiver to remain in effect permanently and cannot terminate it without the approval of the Board of Directors. The effective annual management fee for the period ended November 30, 2018 was 0.94% before waiver and 0.00% after waiver.
Directors' Fees and Expenses — The Board of Directors is responsible for overseeing the investment advisor’s management and operations of the fund. The directors receive detailed information about the fund and its investment advisor regularly throughout the year, and meet at least quarterly with management of the investment advisor to review reports about fund operations. The fund’s officers do not receive compensation from the fund.
Interfund Transactions — The fund may enter into security transactions with other American Century Investments funds and other client accounts of the investment advisor, in accordance with the 1940 Act rules and procedures adopted by the Board of Directors. The rules and procedures require, among other things, that these transactions be effected at the independent current market price of the security. During the period, the interfund sales were $2,281,769 and there were no interfund purchases. The effect of interfund transactions on the Statement of Operations was $797,201 in net realized gain (loss) on investment transactions.
4. Investment Transactions
Purchases and sales of investment securities, excluding short-term investments, for the period ended November 30, 2018 were $292,206,355 and $303,259,387, respectively.
16
5. Capital Share Transactions
Transactions in shares of the fund were as follows:
| Year ended November 30, 2018 | Year ended November 30, 2017 | |||||||||
| Shares | Amount | Shares | Amount | |||||||
| G Class/Shares Authorized | 400,000,000 | 400,000,000 | ||||||||
| Sold | 6,690,534 | $ | 83,983,869 | 7,513,763 | $ | 91,808,056 | ||||
| Issued in reinvestment of distributions | 3,988,864 | 52,688,830 | 316,093 | 3,148,286 | ||||||
| Redeemed | (7,781,471 | ) | (101,975,535 | ) | (13,118,731 | ) | (162,731,010 | ) | ||
| 2,897,927 | 34,697,164 | (5,288,875 | ) | (67,774,668 | ) | |||||
| R6 Class/Shares Authorized | N/A | N/A | ||||||||
| Sold | 1,068,935 | 11,481,250 | ||||||||
| Issued in reinvestment of distributions | 41,161 | 409,550 | ||||||||
| Redeemed | (4,941,581 | ) | (63,723,885 | ) | ||||||
| (3,831,485 | ) | (51,833,085 | ) | |||||||
| Net increase (decrease) | 2,897,927 | $ | 34,697,164 | (9,120,360 | ) | $ | (119,607,753 | ) | ||
6. Fair Value Measurements
The fund’s investments valuation process is based on several considerations and may use multiple inputs to determine the fair value of the investments held by the fund. In conformity with accounting principles generally accepted in the United States of America, the inputs used to determine a valuation are classified into three broad levels.
| • | Level 1 valuation inputs consist of unadjusted quoted prices in an active market for identical investments. |
| • | Level 2 valuation inputs consist of direct or indirect observable market data (including quoted prices for comparable investments, evaluations of subsequent market events, interest rates, prepayment speeds, credit risk, etc.). These inputs also consist of quoted prices for identical investments initially expressed in local currencies that are adjusted through translation into U.S. dollars. |
| • | Level 3 valuation inputs consist of unobservable data (including a fund’s own assumptions). |
The level classification is based on the lowest level input that is significant to the fair valuation measurement. The valuation inputs are not necessarily an indication of the risks associated with investing in these securities or other financial instruments.
The following is a summary of the level classifications as of period end. The Schedule of Investments provides additional information on the fund’s portfolio holdings.
| Level 1 | Level 2 | Level 3 | ||||||
| Assets | ||||||||
| Investment Securities | ||||||||
| Common Stocks | ||||||||
| Brazil | $ | 16,252,861 | $ | 18,550,356 | — | |||
| China | 30,755,429 | 88,024,782 | — | |||||
| Mexico | 4,054,139 | 9,389,770 | — | |||||
| Peru | 4,745,874 | — | — | |||||
| Russia | 4,362,549 | 12,879,718 | — | |||||
| Other Countries | — | 213,353,839 | — | |||||
| Temporary Cash Investments | 2,530 | 5,931,596 | — | |||||
| $ | 60,173,382 | $ | 348,130,061 | — | ||||
17
7. Risk Factors
There are certain risks involved in investing in foreign securities. These risks include those resulting from future adverse political, social and economic developments, fluctuations in currency exchange rates, the possible imposition of exchange controls, and other foreign laws or restrictions. Investing in emerging markets may accentuate these risks.
Investing a significant portion of assets in one country or region makes the fund more dependent upon the political and economic circumstances of that particular country or region than a fund that is more widely diversified.
8. Federal Tax Information
On December 18, 2018, the fund declared and paid per-share distributions of $0.7700 and $0.1528 from net
realized gains and net investment income, respectively, to shareholders of record on December 17, 2018 for
the G Class.
The tax character of distributions paid during the years ended November 30, 2018 and November 30, 2017 were as follows:
| 2018 | 2017 | |||||
| Distributions Paid From | ||||||
| Ordinary income | $ | 7,802,142 | $ | 3,557,836 | ||
| Long-term capital gains | $ | 44,886,688 | — | |||
The book-basis character of distributions made during the year from net investment income or net realized gains may differ from their ultimate characterization for federal income tax purposes. These differences reflect the differing character of certain income items and net realized gains and losses for financial statement and tax purposes, and may result in reclassification among certain capital accounts on the financial statements.
As of period end, the federal tax cost of investments and the components of distributable earnings on a tax-basis were as follows:
| Federal tax cost of investments | $ | 358,404,542 | |
| Gross tax appreciation of investments | $ | 79,232,205 | |
| Gross tax depreciation of investments | (29,333,304 | ) | |
| Net tax appreciation (depreciation) of investments | 49,898,901 | ||
| Net tax appreciation (depreciation) on translation of assets and liabilities in foreign currencies | (10,200 | ) | |
| Net tax appreciation (depreciation) | $ | 49,888,701 | |
| Undistributed ordinary income | $ | 5,976,439 | |
| Accumulated long-term gains | $ | 30,122,592 | |
| Post-October capital loss deferral | $ | (1,374,985 | ) |
The difference between book-basis and tax-basis unrealized appreciation (depreciation) is attributable
primarily to the tax deferral of losses on wash sales.
Loss deferrals represent certain qualified losses that the fund has elected to treat as having been incurred in the following fiscal year for federal income tax purposes.
18
| Financial Highlights |
| For a Share Outstanding Throughout the Years Ended November 30 (except as noted) | |||||||||||||||||
| Per-Share Data | Ratios and Supplemental Data | ||||||||||||||||
| Income From Investment Operations: | Distributions From: | Ratio to Average Net Assets of: | |||||||||||||||
Net Asset Value, Beginning of Period | Net Investment Income (Loss)(1) | Net Realized and Unrealized Gain (Loss) | Total From Investment Operations | Net Investment Income | Net Realized Gains | Total Distributions | Net Asset Value, End of Period | Total Return(2) | Operating Expenses | Operating Expenses (before expense waiver) | Net Investment Income (Loss) | Net Investment Income (Loss) (before expense waiver) | Portfolio Turnover Rate | Net Assets, End of Period (in thousands) | |||
| G Class | |||||||||||||||||
| 2018 | $14.54 | 0.23 | (2.00) | (1.77) | (0.14) | (1.44) | (1.58) | $11.19 | (13.75)% | 0.01% | 0.95% | 1.78% | 0.84% | 66% | $402,978 | ||
| 2017 | $10.27 | 0.09 | 4.26 | 4.35 | (0.08) | — | (0.08) | $14.54 | 42.75% | 0.69% | 1.25% | 0.74% | 0.18% | 56% | $481,494 | ||
| 2016 | $9.75 | 0.05 | 0.50 | 0.55 | (0.03) | — | (0.03) | $10.27 | 5.68% | 1.18% | 1.18% | 0.53% | 0.53% | 75% | $394,433 | ||
| 2015 | $10.84 | 0.05 | (1.12) | (1.07) | (0.02) | — | (0.02) | $9.75 | (9.88)% | 1.24% | 1.24% | 0.49% | 0.49% | 61% | $372,802 | ||
| 2014 | $10.67 | 0.05 | 0.16 | 0.21 | (0.04) | — | (0.04) | $10.84 | 2.02% | 1.25% | 1.25% | 0.45% | 0.45% | 84% | $323,641 | ||
| Notes to Financial Highlights |
| (1) | Computed using average shares outstanding throughout the period. |
| (2) | Total returns are calculated based on the net asset value of the last business day. Total returns for periods less than one year are not annualized. |
See Notes to Financial Statements.
| Report of Independent Registered Public Accounting Firm |
To the Shareholders and the Board of Directors of American Century World Mutual Funds, Inc.:
Opinion on the Financial Statements and Financial Highlights
We have audited the accompanying statement of assets and liabilities, including the schedule of investments, of NT Emerging Markets Fund, one of the funds constituting the American Century World Mutual Funds, Inc. (the “Fund”), as of November 30, 2018, the related statement of operations for the year then ended, the statements of changes in net assets for each of the two years in the period then ended, the financial highlights for each of the five years in the period then ended, and the related notes. In our opinion, the financial statements and financial highlights present fairly, in all material respects, the financial position of NT Emerging Markets Fund of the American Century World Mutual Funds, Inc. as of November 30, 2018, the results of its operations for the year then ended, the changes in its net assets for each of the two years in the period then ended, and the financial highlights for each of the five years in the period then ended, in conformity with accounting principles generally accepted in the United States of America.
Basis for Opinion
These financial statements and financial highlights are the responsibility of the Fund's management. Our responsibility is to express an opinion on the Fund’s financial statements and financial highlights based on our audits. We are a public accounting firm registered with the Public Company Accounting Oversight Board (United States) (PCAOB) and are required to be independent with respect to the Fund in accordance with the U.S. federal securities laws and the applicable rules and regulations of the Securities and Exchange Commission and the PCAOB.
We conducted our audits in accordance with the standards of the PCAOB. Those standards require that we plan and perform the audit to obtain reasonable assurance about whether the financial statements and financial highlights are free of material misstatement, whether due to error or fraud. The Fund is not required to have, nor were we engaged to perform, an audit of its internal control over financial reporting. As part of our audits we are required to obtain an understanding of internal control over financial reporting but not for the purpose of expressing an opinion on the effectiveness of the Fund’s internal control over financial reporting. Accordingly, we express no such opinion.
Our audits included performing procedures to assess the risks of material misstatement of the financial statements and financial highlights, whether due to error or fraud, and performing procedures that respond to those risks. Such procedures included examining, on a test basis, evidence regarding the amounts and disclosures in the financial statements and financial highlights. Our audits also included evaluating the accounting principles used and significant estimates made by management, as well as evaluating the overall presentation of the financial statements and financial highlights. Our procedures included confirmation of securities owned as of November 30, 2018, by correspondence with the custodian and brokers; when replies were not received from brokers, we performed other auditing procedures. We believe that our audits provide a reasonable basis for our opinion.
DELOITTE & TOUCHE LLP
Kansas City, Missouri
January 17, 2019
We have served as the auditor of one or more American Century investment companies since 1997.
20
| Management |
The Board of Directors
The individuals listed below serve as directors of the funds. Each director will continue to serve in this capacity until death, retirement, resignation or removal from office. The board has adopted a mandatory retirement age for directors who are not “interested persons,” as that term is defined in the Investment Company Act (independent directors). Independent directors shall retire by December 31 of the year in which they reach their 75th birthday.
Mr. Thomas is an “interested person” because he currently serves as President and Chief Executive Officer of American Century Companies, Inc. (ACC), the parent company of American Century Investment Management, Inc. (ACIM or the advisor). The other directors (more than three-fourths of the total number) are independent. They are not employees, directors or officers of, and have no financial interest in, ACC or any of its wholly owned, direct or indirect, subsidiaries, including ACIM, American Century Investment Services, Inc. (ACIS) and American Century Services, LLC (ACS), and they do not have any other affiliations, positions or relationships that would cause them to be considered “interested persons” under the Investment Company Act. The directors serve in this capacity for seven (in the case of Jonathan S. Thomas, 16; and Stephen E. Yates, 8) registered investment companies in the American Century Investments family of funds.
The following table presents additional information about the directors. The mailing address for each director is 4500 Main Street, Kansas City, Missouri 64111.
| Name (Year of Birth) | Position(s) Held with Funds | Length of Time Served | Principal Occupation(s) During Past 5 Years | Number of American Century Portfolios Overseen by Director | Other Directorships Held During Past 5 Years |
| Independent Directors | |||||
| Thomas W. Bunn (1953) | Director | Since 2017 | Retired | 68 | SquareTwo Financial; Barings (formerly Babson Capital Funds Trust) (2013 to 2016) |
| Barry Fink (1955) | Director | Since 2012 (independent since 2016) | Retired; Executive Vice President, ACC (2007 to 2013); President, ACS (2007 to 2013) | 68 | None |
| Jan M. Lewis (1957) | Director | Since 2011 | Retired; President and Chief Executive Officer, Catholic Charities of Northeast Kansas (human services organization) (2006 to 2013) | 68 | None |
M. Jeannine Strandjord(1) (1945) | Director | Since 1994 | Self-employed Consultant | 68 | Euronet Worldwide Inc. and MGP Ingredients, Inc. |
21
| Name (Year of Birth) | Position(s) Held with Funds | Length of Time Served | Principal Occupation(s) During Past 5 Years | Number of American Century Portfolios Overseen by Director | Other Directorships Held During Past 5 Years |
| Independent Directors | |||||
| John R. Whitten (1946) | Director | Since 2008 | Retired | 68 | Rudolph Technologies, Inc. |
| Stephen E. Yates (1948) | Director and Chairman of the Board | Since 2012 (Chairman since 2018) | Retired | 73 | None |
| Interested Director | |||||
| Jonathan S. Thomas (1963) | Director and President | Since 2007 | President and Chief Executive Officer, ACC (2007 to present). Also serves as Chief Executive Officer, ACS; Executive Vice President, ACIM; Director, ACC, ACIM and other ACC subsidiaries | 118 | BioMed Valley Discoveries, Inc. |
(1) Effective December 31, 2018, M. Jeannine Strandjord retired from the Board of Directors.
The Statement of Additional Information has additional information about the fund's directors and is available without charge, upon request, by calling 1-800-345-2021.
22
Officers
The following table presents certain information about the executive officers of the funds. Each officer serves as an officer for each of the 16 (in the case of Robert J. Leach, 15) investment companies in the American Century family of funds. No officer is compensated for his or her service as an officer of the funds. The listed officers are interested persons of the funds and are appointed or re-appointed on an annual basis. The mailing address for each officer listed below is 4500 Main Street, Kansas City, Missouri 64111.
| Name (Year of Birth) | Offices with the Funds | Principal Occupation(s) During the Past Five Years |
| Jonathan S. Thomas (1963) | Director and President since 2007 | President and Chief Executive Officer, ACC (2007 to present). Also serves as Chief Executive Officer, ACS; Executive Vice President, ACIM; Director, ACC, ACIM and other ACC subsidiaries |
| R. Wes Campbell (1974) | Chief Financial Officer and Treasurer since 2018 | Investment Operations and Investment Accounting, ACS (2000 to present) |
| Amy D. Shelton (1964) | Chief Compliance Officer and Vice President since 2014 | Chief Compliance Officer, American Century funds, (2014 to present); Chief Compliance Officer, ACIM (2014 to present); Chief Compliance Officer, ACIS (2009 to present); Vice President, Client Interactions and Marketing, ACIS (2013 to 2014). Also serves as Vice President, ACIS |
| Charles A. Etherington (1957) | General Counsel since 2007 and Senior Vice President since 2006 | Attorney, ACC (1994 to present); Vice President, ACC (2005 to present); General Counsel, ACC (2007 to present). Also serves as General Counsel, ACIM, ACS, ACIS and other ACC subsidiaries; and Senior Vice President, ACIM and ACS |
| C. Jean Wade (1964) | Vice President since 2012 | Senior Vice President, ACS (2017 to present); Vice President, ACS (2000 to 2017) |
| Robert J. Leach (1966) | Vice President since 2006 | Vice President, ACS (2000 to present) |
| David H. Reinmiller (1963) | Vice President since 2000 | Attorney, ACC (1994 to present). Also serves as Vice President, ACIM and ACS |
| Ward D. Stauffer (1960) | Secretary since 2005 | Attorney, ACC (2003 to present) |
23
| Approval of Management Agreement |
At a meeting held on June 28, 2018, the Fund’s Board of Directors (the "Board") unanimously approved the renewal of the management agreement pursuant to which American Century Investment Management, Inc. (the “Advisor”) acts as the investment advisor for the Fund. Under Section 15(c) of the Investment Company Act, contracts for investment advisory services are required to be reviewed, evaluated, and approved by a majority of a fund’s directors (the “Directors”), including a majority of the independent Directors, each year.
Prior to its consideration of the renewal of the management agreement, the Directors requested and reviewed extensive data and information compiled by the Advisor and certain independent providers of evaluation data concerning the Fund and the services provided to the Fund by the Advisor. This review was in addition to the oversight and evaluation undertaken by the Board and its committees on a continual basis and the information received was supplemental to the extensive information that the Board and its committees receive and consider throughout the year. The Directors also conducted a review of the process by which the Board considers the renewal of the management agreements. The Board consulted with industry experts and reviewed industry best practices and recent judicial precedent. The Directors believe that the enhancements resulting from their review resulted in increased dialogue with the Advisor and an improved process for fund shareholders.
In connection with its consideration of the renewal of the management agreement, the Board’s review and evaluation of the services provided by the Advisor included, but was not limited to, the following:
| • | the nature, extent, and quality of investment management, shareholder services, and other services provided and to be provided to the Fund; |
| • | the wide range of other programs and services provided and to be provided to the Fund and its shareholders on a routine and non-routine basis; |
| • | the investment performance of the Fund, including data comparing the Fund's performance to appropriate benchmarks and/or a peer group of other mutual funds with similar investment objectives and strategies; |
| • | the cost of owning the Fund compared to the cost of owning similar funds; |
| • | the compliance policies, procedures, and regulatory experience of the Advisor and the Fund's service providers; |
| • | financial data showing the cost of services provided to the Fund, the profitability of the Fund to the Advisor, and the overall profitability of the Advisor |
| • | strategic plans of the Advisor; |
| • | any economies of scale associated with the Advisor’s management of the Fund and other accounts; |
| • | services provided and charges to the Advisor's other investment management clients; |
| • | acquired fund fees and expenses; |
| • | payments and practices in connection with financial intermediaries holding shares of the Fund and the services provided by intermediaries in connection therewith; and |
| • | any collateral benefits derived by the Advisor from the management of the Fund. |
The Directors held two in-person meetings and one telephonic meeting to review and discuss the information provided. The independent Directors also reviewed responses to supplemental information requests provided by the Directors to the Advisor and held active discussions with the Advisor regarding the renewal of the management agreement. The independent Directors had the benefit of the advice of their independent counsel throughout the process.
24
Factors Considered
The Directors considered all of the information provided by the Advisor, the independent data providers, and independent counsel in connection with the approval. They determined that the information was sufficient for them to evaluate the management agreement for the Fund. In connection with their review, the Directors did not identify any single factor as being all-important or controlling, and each Director may have attributed different levels of importance to different factors. In deciding to renew the management agreement, the Board based its decision on a number of factors, including without limitation the following:
Nature, Extent and Quality of Services - Generally. Under the management agreement, the Advisor is responsible for providing or arranging for all services necessary for the operation of the Fund. The Board noted that the Advisor provides or arranges at its own expense a wide variety of services including without limitation the following:
| • | portfolio research and security selection |
| • | securities trading |
| • | Fund administration |
| • | custody of Fund assets |
| • | daily valuation of the Fund’s portfolio |
| • | shareholder servicing and transfer agency, including shareholder confirmations, recordkeeping, and communications |
| • | legal services (except the independent Directors’ counsel) |
| • | regulatory and portfolio compliance |
| • | financial reporting |
| • | marketing and distribution (except amounts paid by the Fund under Rule 12b-1 plans) |
The Board noted that many of these services have expanded over time in terms of both quantity and complexity in response to shareholder demands, competition in the industry, changing distribution channels, and the changing regulatory environment.
Investment Management Services. The nature of the investment management services provided to the Fund is quite complex and allows Fund shareholders access to professional money management, instant diversification of their investments within an asset class, the opportunity to easily diversify among asset classes by investing in or exchanging among various American Century Investments funds, and liquidity. In evaluating investment performance, the Board expects the Advisor to manage the Fund in accordance with its investment objectives and approved strategies. Further, the Directors recognize that the Advisor has an obligation to monitor trading activities, and in particular to seek the best execution of fund trades, and to evaluate the use of and payment for research. In providing these services, the Advisor utilizes teams of investment professionals (portfolio managers, analysts, research assistants, and securities traders) who require extensive information technology, research, training, compliance, and other systems to conduct their business. The Board, directly and through its Fund Performance Review Committee, provides oversight of the investment performance process. It regularly reviews investment performance information for the Fund, together with comparative information for appropriate benchmarks and/or peer groups of similarly-managed funds, over different time horizons. The Directors also review detailed performance information provided by the Advisor during the management agreement renewal process. If performance concerns are identified, the Fund receives special reviews until performance improves, during which the Board receives a report from the Advisor regarding the reasons for such results (e.g., market conditions, security selection) and any efforts being undertaken to improve performance. The Fund’s performance was above its benchmark for the one-, three-, five-, and ten-year periods reviewed by the Board. The Board found the investment management services provided by the Advisor to the Fund to be satisfactory and consistent with the management agreement.
25
Shareholder and Other Services. Under the management agreement, the Advisor provides the Fund with a comprehensive package of transfer agency, shareholder, and other services. The Board, directly and through various committees of the Board, regularly reviews reports and evaluations of such services at its regular meetings. These reports include, but are not limited to, information regarding the operational efficiency and accuracy of the shareholder and transfer agency services provided, staffing levels, shareholder satisfaction (as measured by external as well as internal sources), technology support, new products and services offered to Fund shareholders, securities trading activities, portfolio valuation services, auditing services, and legal and operational compliance activities. The Board found the services provided by the Advisor to the Fund under the management agreement to be competitive and of high quality.
Costs of Services and Profitability. The Advisor provides detailed information concerning its cost of providing various services to the Fund, its profitability in managing the Fund (pre- and post-distribution), its overall profitability, and its financial condition. The Directors have reviewed with the Advisor the methodology used to prepare this financial information. This information is considered in evaluating the Advisor’s financial condition, its ability to continue to provide services under the management agreement, and the reasonableness of the current management fee. The Board concluded that the Advisor’s profits were reasonable in light of the services provided to the Fund.
Ethics. The Board generally considers the Advisor’s commitment to providing quality services to shareholders and to conducting its business ethically. They noted that the Advisor’s practices generally meet or exceed industry best practices.
Economies of Scale. The Board also reviewed information provided by the Advisor regarding the possible existence of economies of scale in connection with the management of the Fund. The Board concluded that economies of scale are difficult to measure and predict with precision, especially on a fund-by-fund basis. The Board concluded that the Advisor is appropriately sharing economies of scale through its competitive fee structure, offering competitive fees from fund inception, and through reinvestment in its business to provide shareholders additional content and services.
Comparison to Other Funds’ Fees. The management agreement provides that the Fund pays the Advisor a single, all-inclusive (or unified) management fee for providing all services necessary for the management and operation of the Fund, other than brokerage expenses, expenses attributable to short sales, taxes, interest, extraordinary expenses, and the fees and expenses of the Fund’s independent Directors (including their independent legal counsel) and expenses incurred in connection with the provision of shareholder services and distribution services under a plan adopted pursuant to Rule 12b-1 under the 1940 Act. Under the unified fee structure, the Advisor is responsible for providing all investment advisory, custody, audit, administrative, compliance, recordkeeping, marketing and shareholder services, or arranging and supervising third parties to provide such services. By contrast, most other funds are charged a variety of fees, including an investment advisory fee, a transfer agency fee, an administrative fee, distribution charges, and other expenses. Other than their investment advisory fees and any applicable Rule 12b-1 distribution fees, all other components of the total fees charged by these other funds may be increased without shareholder approval. The Board believes the unified fee structure is a benefit to Fund shareholders because it clearly discloses to shareholders the cost of owning Fund shares, and, since the unified fee cannot be increased without a vote of Fund shareholders, it shifts to the Advisor the risk of increased costs of operating the Fund and provides a direct incentive to minimize administrative inefficiencies. Part of the Board’s analysis of fee levels involves reviewing certain evaluative data compiled by an independent provider comparing the Fund’s unified fee to the total expense ratios of its peers. The unified fee charged to shareholders of the Fund was below the median of the total expense ratios of the Fund’s peer expense universe. The Board concluded that the management fee paid by the Fund to the Advisor under the management agreement is reasonable in light of the services provided to the Fund.
26
Comparison to Fees and Services Provided to Other Clients of the Advisor. The Directors also requested and received information from the Advisor concerning the nature of the services, fees, costs, and profitability of its advisory services to advisory clients other than the Fund. They observed that these varying types of client accounts require different services and involve different regulatory and entrepreneurial risks than the management of the Fund. The Board analyzed this information and concluded that the fees charged and services provided to the Fund were reasonable by comparison.
Payments to Intermediaries. The Directors also requested and received a description of payments made to intermediaries by the Fund and the Advisor and services provided in response thereto. These payments include various payments made by the Fund or the Advisor to different types of intermediaries and recordkeepers for distribution and service activities provided for the Fund. The Board reviewed such information and received representations from the Advisor that all such payments by the Fund were made pursuant to the Fund's Rule 12b-1 Plan and that all such payments by the Advisor were made from the Advisor’s resources and reasonable profits. The Board found the payments to be reasonable in scope and purpose.
Collateral or “Fall-Out” Benefits Derived by the Advisor. The Board considered the existence of collateral benefits the Advisor may receive as a result of its relationship with the Fund. They concluded that the Advisor’s primary business is managing mutual funds and it generally does not use fund or shareholder information to generate profits in other lines of business, and therefore does not derive any significant collateral benefits from them. The Board noted that additional assets from other clients may offer the Advisor some benefit from increased leverage with service providers and counterparties. Additionally, the Advisor may receive proprietary research from broker-dealers that execute fund portfolio transactions, which the Board concluded is likely to benefit other clients of the Advisor, as well as Fund shareholders. The Board also determined that the Advisor is able to provide investment management services to certain clients other than the Fund, at least in part, due to its existing infrastructure built to serve the fund complex. The Board concluded that appropriate allocation methodologies had been employed to assign resources and the cost of those resources to these other clients and, where expressly provided, these other client assets may be included with the assets of the Fund to determine breakpoints in the management fee schedule.
Existing Relationship. The Board also considered whether there was any reason for not continuing the existing arrangement with the Advisor. In this regard, the Board was mindful of the potential disruptions of the Fund’s operations and various risks, uncertainties, and other effects that could occur as a result of a decision not to continue such relationship. In particular, the Board recognized that most shareholders have invested in the Fund on the strength of the Advisor’s industry standing and reputation and in the expectation that the Advisor will have a continuing role in providing advisory services to the Fund.
Conclusion of the Directors. As a result of this process, the Board, including all of the independent Directors, taking into account all of the factors discussed above and the information provided by the Advisor and others in connection with its review and throughout the year, determined that the management fee is fair and reasonable in light of the services provided and that the investment management agreement between the Fund and the Advisor should be renewed.
27
| Additional Information |
Retirement Account Information
As required by law, distributions you receive from certain retirement accounts are subject to federal income tax withholding, unless you elect not to have withholding apply*. Tax will be withheld on the total amount withdrawn even though you may be receiving amounts that are not subject to withholding, such as nondeductible contributions. In such case, excess amounts of withholding could occur. You may adjust your withholding election so that a greater or lesser amount will be withheld.
If you don’t want us to withhold on this amount, you must notify us to not withhold the federal income tax. You may notify us in writing or in certain situations by telephone or through other electronic means. For systematic withdrawals, your withholding election will remain in effect until revoked or changed by filing a new election. You have the right to revoke your election at any time and change your withholding percentage for future distributions.
Remember, even if you elect not to have income tax withheld, you are liable for paying income tax on the taxable portion of your withdrawal. If you elect not to have income tax withheld or you don’t have enough income tax withheld, you may be responsible for payment of estimated tax. You may incur penalties under the estimated tax rules if your withholding and estimated tax payments are not sufficient. You can reduce or defer the income tax on a distribution by directly or indirectly rolling such distribution over to another IRA or eligible plan. You should consult your tax advisor for additional information.
State tax will be withheld if, at the time of your distribution, your address is within one of the mandatory withholding states and you have federal income tax withheld (or as otherwise required by state law). State taxes will be withheld from your distribution in accordance with the respective state rules.
*Some 403(b), 457 and qualified retirement plan distributions may be subject to 20% mandatory withholding, as they are subject to special tax and withholding rules. Your plan administrator or plan sponsor is required to provide you with a special tax notice explaining those rules at the time you request a distribution. If applicable, federal and/or state taxes may be withheld from your distribution amount.
Proxy Voting Policies
A description of the policies that the fund's investment advisor uses in exercising the voting rights associated with the securities purchased and/or held by the fund is available without charge, upon request, by calling 1-800-345-2021. It is also available on the "About Us" page of American Century Investments’ website at americancentury.com and on the Securities and Exchange Commission’s website at sec.gov. Information regarding how the investment advisor voted proxies relating to portfolio securities during the most recent 12-month period ended June 30 is available on the "About Us" page at americancentury.com. It is also available at sec.gov.
Quarterly Portfolio Disclosure
The fund files its complete schedule of portfolio holdings with the Securities and Exchange Commission (SEC) for the first and third quarters of each fiscal year on Form N-Q. The fund’s Forms N-Q are available on the SEC’s website at sec.gov. The fund also makes its complete schedule of portfolio holdings for the most recent quarter of its fiscal year available on its website at americancentury.com and, upon request, by calling 1-800-345-2021.
28
Other Tax Information
The following information is provided pursuant to provisions of the Internal Revenue Code.
The fund hereby designates up to the maximum amount allowable as qualified dividend income for the fiscal year ended November 30, 2018.
The fund hereby designates $44,886,688, or up to the maximum amount allowable, as long-term
capital gain distributions (20% rate gain distributions) for the fiscal year ended November 30, 2018.
The fund hereby designates $2,887,179 as qualified short-term capital gain distributions for purposes of Internal Revenue Code Section 871 for the fiscal year ended November 30, 2018.
For the fiscal year ended November 30, 2018, the fund intends to pass through to shareholders foreign source income of $8,926,430 and foreign taxes paid of $992,310, or up to the maximum amount allowable, as a foreign tax credit. Foreign source income and foreign tax expense per outstanding share on November 30, 2018 are $0.2479 and $0.0276, respectively.
29
| Notes |
30
| Notes |
31
| Notes |
32
| ||
| Contact Us | americancentury.com | |
| Automated Information Line | 1-800-345-8765 | |
| Investor Services Representative | 1-800-345-2021 or 816-531-5575 | |
| Investors Using Advisors | 1-800-378-9878 | |
| Business, Not-For-Profit, Employer-Sponsored Retirement Plans | 1-800-345-3533 | |
| Banks and Trust Companies, Broker-Dealers, Financial Professionals, Insurance Companies | 1-800-345-6488 | |
| Telecommunications Relay Service for the Deaf | 711 | |
| American Century World Mutual Funds, Inc. | ||
Investment Advisor: American Century Investment Management, Inc. Kansas City, Missouri | ||
| This report and the statements it contains are submitted for the general information of our shareholders. The report is not authorized for distribution to prospective investors unless preceded or accompanied by an effective prospectus. | ||
| ©2019 American Century Proprietary Holdings, Inc. All rights reserved. CL-ANN-91023 1901 | ||
| Annual Report | |
| November 30, 2018 | |
| NT International Growth Fund | |
| G Class (ACLNX) | |
Beginning on January 1, 2021, as permitted by regulations adopted by the Securities and Exchange Commission, paper copies of the fund’s shareholder reports like this one will no longer be sent by mail, unless you specifically request paper copies of the reports from the fund or from your financial intermediary, such as a broker-dealer or bank. Instead, the reports will be made available on a website, and you will be notified by mail each time a report is posted and provided with a website link to access the report.
If you already elected to receive shareholder reports electronically, you will not be affected by this change and you need not take any action. You may elect to receive shareholder reports and other communications from the fund or your financial intermediary electronically by calling or sending an email request to your appropriate contacts as listed on the back cover of this report.
You may elect to receive all future reports in paper free of charge. You can inform the fund or your financial intermediary that you wish to continue receiving paper copies of your shareholder reports by calling or sending an email request to your appropriate contacts as listed on the back cover of this report. Your election to receive reports in paper will apply to all funds held with the fund complex/your financial intermediary.
| Table of Contents |
| Performance | 2 | |
| Portfolio Commentary | ||
| Fund Characteristics | ||
| Shareholder Fee Example | ||
| Schedule of Investments | ||
| Statement of Assets and Liabilities | ||
| Statement of Operations | ||
| Statement of Changes in Net Assets | ||
| Notes to Financial Statements | ||
| Financial Highlights | ||
| Report of Independent Registered Public Accounting Firm | ||
| Management | ||
| Approval of Management Agreement | ||
| Additional Information | ||
Any opinions expressed in this report reflect those of the author as of the date of the report, and do not necessarily represent the opinions of American Century Investments® or any other person in the American Century Investments organization. Any such opinions are subject to change at any time based upon market or other conditions and American Century Investments disclaims any responsibility to update such opinions. These opinions may not be relied upon as investment advice and, because investment decisions made by American Century Investments funds are based on numerous factors, may not be relied upon as an indication of trading intent on behalf of any American Century Investments fund. Security examples are used for representational purposes only and are not intended as recommendations to purchase or sell securities. Performance information for comparative indices and securities is provided to American Century Investments by third party vendors. To the best of American Century Investments’ knowledge, such information is accurate at the time of printing.
| Performance |
| Total Returns as of November 30, 2018 | |||||
Average Annual Returns | |||||
Ticker Symbol | 1 year | 5 years | 10 years | Inception Date | |
| G Class | ACLNX | -7.35% | 2.20% | 8.67% | 5/12/06 |
| MSCI EAFE Index | — | -7.94% | 1.84% | 7.47% | — |
| MSCI EAFE Growth Index | — | -6.88% | 2.96% | 8.26% | — |
Fund returns would have been lower if a portion of the fees had not been waived.
| Growth of $10,000 Over 10 Years |
| $10,000 investment made November 30, 2008 |

| Value on November 30, 2018 | |
| G Class — $22,975 | |
| MSCI EAFE Index — $20,560 | |
MSCI EAFE Growth Index — $22,130 | |
Ending value of G Class would have been lower if a portion of the fees had not been waived.
Total Annual Fund Operating Expenses | |
| G Class | 0.82% |
The total annual fund operating expenses shown is as stated in the fund’s prospectus current as of the date of this report. The prospectus may vary from the expense ratio shown elsewhere in this report because it is based on a different time period, includes acquired fund fees and expenses, and, if applicable, does not include fee waivers or expense reimbursements.
Data presented reflect past performance. Past performance is no guarantee of future results. Current performance may be higher or lower than the performance shown. Total returns for periods less than one year are not annualized. Investment return and principal value will fluctuate, and redemption value may be more or less than original cost. Data assumes reinvestment of dividends and capital gains, and none of the charts reflect the deduction of taxes that a shareholder would pay on fund distributions or the redemption of fund shares. To obtain performance data current to the most recent month end, please call 1-800-345-2021 or visit americancentury.com. For additional information about the fund, please consult the prospectus.
2
| Portfolio Commentary |
Portfolio Manager: Raj Gandhi and Jim Zhao
In September 2018, James Gendelman left the NT International Growth management team.
Performance Summary
NT International Growth returned -7.35%* for the fiscal year ended November 30, 2018, compared with the -7.94% return of its benchmark, the MSCI EAFE Index.
NT International Growth declined during the fiscal year, but outperformed its benchmark, the MSCI EAFE Index. Security selection in the financials sector contributed to relative performance, while holdings in the materials sector detracted. From a geographic perspective, positioning in Germany and stock selection in Japan lifted returns, whereas positioning in Canada weighed on performance.
Non-U.S. equities, pressured by several global macroeconomic trends, significantly underperformed U.S. equities for the period. Rising concerns about decelerating earnings growth, Brexit uncertainty, potential trade war escalation, and slowing growth in China weighed on investor sentiment. In the last three months of the period, we saw the market rotate into low-volatility defensive stocks at the expense of cyclicals and high-growth stocks. The sell-off, which did not spare companies with good fundamentals and strong quarterly earnings, erased the year’s earlier gains. Although the shift to perceived safe havens has created a headwind, we remain confident in our bottom-up process, which focuses on identifying companies with accelerating sustainable growth.
Earnings-Driven Stock Choices Boosted Relative Returns
Stock selection in the financials sector aided the fund’s relative returns, primarily due to an underweight relative to the benchmark in European banks, which were very weak. Industrials holdings, including MonotaRO, also bolstered returns. The online industrial product distributor’s stock rose as the company reported better-than-expected second-quarter results followed by several better-than-expected monthly sales reports. The company also reported strong growth in new customer acquisition as it continues to lead the industry transition to online in Japan.
Lonza Group’s stock advanced after it reported ahead-of-expectations results, beating both revenue and earnings estimates. This contract manufacturer and producer of biologics has benefited from increased outsourcing by the pharmaceutical industry. In addition, Lonza has begun to realize strong synergies from its Capsugel acquisition. Management raised full-year revenue guidance and margin targets.
Stock of CyberAgent, the Japan-based internet company, rose on strong earnings driven by robust performance in the advertising business, creation of hit titles in the game business, a rebound in existing game sales, and announced plans for a collaborative title with Nintendo. CyberAgent also reported an upward trend in monthly active users, daily active users, and average viewing time for AbemaTV.
* Fund returns would have been lower if a portion of the fees had not been waived.
3
Stocks Heavily Exposed to Cyclical Industries Detracted
Materials holdings weighed on the fund’s performance. Mining company First Quantum Minerals’ stock weakened as concerns about a global growth slowdown weighed on the price of copper. We exited the position when evidence of weakening demand became more apparent. Umicore, a firm that makes materials used in electric vehicle batteries, and cement and aggregates firm HeidelbergCement were also among the top detractors. We sold our position in HeidelbergCement after continued disappointment in volume growth and increasing cost pressures gave us concern about the potential for downward earnings revisions.
Bombardier’s stock fell significantly after the airplane and train manufacturer’s free cash flow forecasts disappointed. Our thesis was that improvements in business jet demand and the commercial aircraft division would drive free cash flow growth, but our confidence in this outcome diminished, and we sold our position.
Stock of automotive supplier Valeo weakened after the company reduced its forward-looking guidance due to delays in the conversion of its backlog. New emissions standards regulations in Europe, which have caused a disruption in automotive production as vehicles move through the qualification process, and weakening demand in China have clouded the earnings outlook. We sold the position.
Outlook
Despite the challenging market environment, we continue to focus on our disciplined process of identifying companies with accelerating, sustainable growth, where we see upside to consensus estimates. Our process has led us to focus on companies with intrinsic growth drivers that are not dependent on economic improvement. At period-end, the fund’s largest overweight positions relative to the benchmark were in the consumer discretionary and information technology sectors. The shift to e-commerce combined with consumers’ desire for lifestyle improvement and wellness helped drive the consumer discretionary overweight. Athletic wear retailers are among those companies benefiting from these trends. Growth drivers affecting our positions within information technology include the advent of 5G, increased capital expenditure in automation, data, and data management, and the shift to online solutions in multiple industries. Already the largest underweight in the fund, our financials position shrank further with the sale of multiple European banks. The fund’s industrials weighting also decreased due to mounting evidence of peaking revenue growth and margins in multiple cyclical areas such as automobiles, semiconductors, and construction. These data points increased our concerns over decelerating earnings growth and possible negative earnings revisions.
The fund’s largest regional exposure remains Europe. We continue to be underweight in Asia, especially Japan, partly because the MSCI EAFE Index skews heavily toward financials and automobile stocks.
4
| Fund Characteristics |
| NOVEMBER 30, 2018 | |
Top Ten Holdings | % of net assets |
| Lonza Group AG | 2.7% |
| AIA Group Ltd. | 2.7% |
| AstraZeneca plc | 2.6% |
| Diageo plc | 2.3% |
| CSL Ltd. | 2.2% |
| Reckitt Benckiser Group plc | 2.2% |
| London Stock Exchange Group plc | 2.0% |
| Danone SA | 1.9% |
| Shiseido Co. Ltd. | 1.8% |
| Royal Dutch Shell plc, A Shares | 1.7% |
Types of Investments in Portfolio | % of net assets |
| Common Stocks | 98.2% |
| Temporary Cash Investments | 1.1% |
| Other Assets and Liabilities | 0.7% |
Investments by Country | % of net assets |
| United Kingdom | 22.1% |
| Japan | 16.5% |
| France | 8.8% |
| Sweden | 5.6% |
| Germany | 5.4% |
| Switzerland | 4.8% |
| Netherlands | 4.4% |
| Australia | 4.1% |
| China | 3.6% |
| Spain | 3.2% |
| Hong Kong | 2.7% |
| Canada | 2.6% |
| Belgium | 2.5% |
| Ireland | 2.4% |
| Denmark | 2.4% |
| Brazil | 2.1% |
| Other Countries | 5.0% |
| Cash and Equivalents* | 1.8% |
*Includes temporary cash investments and other assets and liabilities.
5
| Shareholder Fee Example |
Fund shareholders may incur two types of costs: (1) transaction costs, including sales charges (loads) on purchase payments and redemption/exchange fees; and (2) ongoing costs, including management fees; distribution and service (12b-1) fees; and other fund expenses. This example is intended to help you understand your ongoing costs (in dollars) of investing in your fund and to compare these costs with the ongoing cost of investing in other mutual funds.
The example is based on an investment of $1,000 made at the beginning of the period and held for the entire period from June 1, 2018 to November 30, 2018.
Actual Expenses
The table provides information about actual account values and actual expenses for each class. You may use the information, together with the amount you invested, to estimate the expenses that you paid over the period. First, identify the share class you own. Then simply divide your account value by $1,000 (for example, an $8,600 account value divided by $1,000 = 8.6), then multiply the result by the number under the heading “Expenses Paid During Period” to estimate the expenses you paid on your account during this period.
Hypothetical Example for Comparison Purposes
The table also provides information about hypothetical account values and hypothetical expenses based on the actual expense ratio of each class of your fund and an assumed rate of return of 5% per year before expenses, which is not the actual return of a fund’s share class. The hypothetical account values and expenses may not be used to estimate the actual ending account balance or expenses you paid for the period. You may use this information to compare the ongoing costs of investing in your fund and other funds. To do so, compare this 5% hypothetical example with the 5% hypothetical examples that appear in the shareholder reports of the other funds.
Please note that the expenses shown in the table are meant to highlight your ongoing costs only and do not reflect any transactional costs, such as sales charges (loads) or redemption/exchange fees. Therefore, the table is useful in comparing ongoing costs only, and will not help you determine the relative total costs of owning different funds. In addition, if these transactional costs were included, your costs would have been higher.
| Beginning Account Value 6/1/18 | Ending Account Value 11/30/18 | Expenses Paid During Period(1) 6/1/18 - 11/30/18 | Annualized Expense Ratio(1) | |
Actual | ||||
| G Class | $1,000 | $873.60 | $0.05 | 0.01% |
| Hypothetical | ||||
| G Class | $1,000 | $1,025.02 | $0.05 | 0.01% |
| (1) | Expenses are equal to the class's annualized expense ratio listed in the table above, multiplied by the average account value over the period, multiplied by 183, the number of days in the most recent fiscal half-year, divided by 365, to reflect the one-half year period. Annualized expense ratio reflects actual expenses, including any applicable fee waivers or expense reimbursements and excluding any acquired fund fees and expenses. |
6
| Schedule of Investments |
NOVEMBER 30, 2018
| Shares | Value | ||||
| COMMON STOCKS — 98.2% | |||||
| Australia — 4.1% | |||||
| Aristocrat Leisure Ltd. | 326,240 | $ | 5,643,471 | ||
| CSL Ltd. | 150,780 | 19,634,475 | |||
| Treasury Wine Estates Ltd. | 1,118,630 | 11,658,253 | |||
| 36,936,199 | |||||
| Austria — 1.5% | |||||
Erste Group Bank AG(1) | 341,254 | 13,469,884 | |||
| Belgium — 2.5% | |||||
| KBC Group NV | 149,950 | 10,791,571 | |||
| Umicore SA | 257,460 | 11,178,812 | |||
| 21,970,383 | |||||
| Brazil — 2.1% | |||||
| Localiza Rent a Car SA | 1,480,300 | 10,301,234 | |||
| Magazine Luiza SA | 196,000 | 8,344,319 | |||
| 18,645,553 | |||||
| Canada — 2.6% | |||||
Canada Goose Holdings, Inc.(1) | 162,300 | 10,930,905 | |||
| Canadian Pacific Railway Ltd. | 32,160 | 6,801,853 | |||
| Nutrien Ltd. | 104,540 | 5,384,953 | |||
| 23,117,711 | |||||
| China — 3.6% | |||||
Alibaba Group Holding Ltd. ADR(1) | 63,130 | 10,155,092 | |||
| ANTA Sports Products Ltd. | 2,252,000 | 10,276,898 | |||
| Huazhu Group Ltd. ADR | 129,669 | 4,089,760 | |||
| Tencent Holdings Ltd. | 202,700 | 8,130,537 | |||
| 32,652,287 | |||||
| Denmark — 2.4% | |||||
| Chr Hansen Holding A/S | 129,670 | 11,710,746 | |||
| DSV A/S | 63,322 | 4,846,409 | |||
| Novozymes A/S, B Shares | 97,080 | 4,522,109 | |||
| 21,079,264 | |||||
| Finland — 1.1% | |||||
| Neste Oyj | 127,990 | 10,013,587 | |||
| France — 8.8% | |||||
| Accor SA | 187,340 | 8,317,960 | |||
| Danone SA | 225,430 | 16,871,539 | |||
| Eurofins Scientific SE | 11,630 | 5,061,255 | |||
| Kering SA | 19,440 | 8,514,153 | |||
| Peugeot SA | 271,030 | 5,958,099 | |||
| Thales SA | 88,590 | 10,901,405 | |||
| TOTAL SA | 139,170 | 7,747,331 | |||
Ubisoft Entertainment SA(1) | 110,300 | 9,033,034 | |||
7
| Shares | Value | ||||
| Vivendi SA | 273,030 | $ | 6,816,176 | ||
| 79,220,952 | |||||
| Germany — 5.4% | |||||
| adidas AG | 50,220 | 11,076,624 | |||
| Aroundtown SA | 755,770 | 6,480,267 | |||
| Deutsche Boerse AG | 91,300 | 11,669,388 | |||
| HUGO BOSS AG | 46,020 | 3,177,085 | |||
| Symrise AG | 161,770 | 13,051,382 | |||
| Wirecard AG | 18,960 | 2,866,877 | |||
| 48,321,623 | |||||
| Hong Kong — 2.7% | |||||
| AIA Group Ltd. | 2,900,600 | 23,791,311 | |||
| India — 0.7% | |||||
| HDFC Bank Ltd. | 190,740 | 5,819,820 | |||
| Indonesia — 0.2% | |||||
| Bank Central Asia Tbk PT | 1,015,600 | 1,849,773 | |||
| Ireland — 2.4% | |||||
| CRH plc | 366,030 | 10,115,764 | |||
ICON plc(1) | 16,310 | 2,360,383 | |||
| Kerry Group plc, A Shares | 91,050 | 9,411,900 | |||
| 21,888,047 | |||||
| Japan — 16.5% | |||||
| Anritsu Corp. | 444,900 | 7,300,743 | |||
| CyberAgent, Inc. | 167,400 | 7,641,420 | |||
| Daikin Industries Ltd. | 49,100 | 5,459,765 | |||
| Don Quijote Holdings Co. Ltd. | 148,400 | 9,007,553 | |||
| Fast Retailing Co. Ltd. | 16,400 | 8,529,763 | |||
| Keyence Corp. | 23,200 | 12,589,702 | |||
| Komatsu Ltd. | 173,200 | 4,627,720 | |||
| MonotaRO Co. Ltd. | 327,200 | 8,872,885 | |||
| Obic Co. Ltd. | 66,500 | 5,751,691 | |||
| Recruit Holdings Co. Ltd. | 414,500 | 11,414,353 | |||
| Shiseido Co. Ltd. | 257,800 | 16,422,239 | |||
| Sony Corp. | 169,900 | 8,994,000 | |||
| Sysmex Corp. | 109,300 | 5,833,092 | |||
| TDK Corp. | 106,800 | 8,516,379 | |||
| Terumo Corp. | 181,500 | 10,688,697 | |||
| Unicharm Corp. | 221,800 | 6,948,325 | |||
| ZOZO, Inc. | 431,000 | 9,596,483 | |||
| 148,194,810 | |||||
| Netherlands — 4.4% | |||||
| Akzo Nobel NV | 55,720 | 4,696,739 | |||
| ASML Holding NV | 70,310 | 11,955,156 | |||
| Heineken NV | 81,788 | 7,486,461 | |||
InterXion Holding NV(1) | 170,800 | 10,635,716 | |||
QIAGEN NV(1) | 140,963 | 4,995,729 | |||
| 39,769,801 | |||||
8
| Shares | Value | ||||
| Russia — 0.7% | |||||
Yandex NV, A Shares(1) | 211,360 | $ | 6,235,120 | ||
| Spain — 3.2% | |||||
| Amadeus IT Group SA | 167,770 | 12,051,869 | |||
| CaixaBank SA | 1,875,110 | 7,747,489 | |||
| Cellnex Telecom SA | 302,410 | 8,402,733 | |||
| 28,202,091 | |||||
| Sweden — 5.6% | |||||
Epiroc AB, A Shares(1) | 692,370 | 5,682,109 | |||
| Hexagon AB, B Shares | 211,180 | 10,555,542 | |||
| Lundin Petroleum AB | 345,220 | 9,115,814 | |||
Spotify Technology SA(1) | 19,450 | 2,652,591 | |||
| Swedbank AB, A Shares | 471,010 | 10,954,595 | |||
| Telefonaktiebolaget LM Ericsson, B Shares | 1,385,480 | 11,582,362 | |||
| 50,543,013 | |||||
| Switzerland — 4.8% | |||||
Lonza Group AG(1) | 74,350 | 24,109,384 | |||
| Novartis AG | 132,320 | 12,079,040 | |||
| Straumann Holding AG | 11,460 | 7,014,774 | |||
| 43,203,198 | |||||
| Taiwan — 0.8% | |||||
| Taiwan Semiconductor Manufacturing Co. Ltd. | 961,000 | 7,025,208 | |||
| United Kingdom — 22.1% | |||||
ASOS plc(1) | 74,851 | 4,749,467 | |||
| Associated British Foods plc | 311,060 | 9,614,954 | |||
| AstraZeneca plc | 301,550 | 23,571,107 | |||
| Aviva plc | 926,511 | 4,808,194 | |||
| B&M European Value Retail SA | 2,338,176 | 10,410,908 | |||
| Bunzl plc | 456,140 | 14,074,681 | |||
| Burberry Group plc | 191,010 | 4,327,537 | |||
Coca-Cola HBC AG(1) | 216,080 | 6,429,110 | |||
| Compass Group plc | 493,244 | 10,554,596 | |||
| Diageo plc | 577,550 | 20,807,705 | |||
| Intertek Group plc | 217,527 | 13,053,400 | |||
Just Eat plc(1) | 453,387 | 3,369,112 | |||
| London Stock Exchange Group plc | 346,830 | 17,834,328 | |||
| Melrose Industries plc | 1,738,090 | 3,936,109 | |||
| Reckitt Benckiser Group plc | 234,900 | 19,543,213 | |||
| Royal Dutch Shell plc, A Shares | 515,002 | 15,575,432 | |||
| Standard Chartered plc | 703,410 | 5,467,257 | |||
| Tesco plc | 3,877,340 | 9,779,049 | |||
| 197,906,159 | |||||
TOTAL COMMON STOCKS (Cost $798,743,117) | 879,855,794 | ||||
9
| Shares | Value | ||||
| TEMPORARY CASH INVESTMENTS — 1.1% | |||||
| Repurchase Agreement, BMO Capital Markets Corp., (collateralized by various U.S. Treasury obligations, 1.125% - 3.125%, 5/31/19 - 11/15/28, valued at $8,730,782), in a joint trading account at 2.00%, dated 11/30/18, due 12/3/18 (Delivery value $8,560,593) | $ | 8,559,166 | |||
| Repurchase Agreement, Fixed Income Clearing Corp., (collateralized by various U.S. Treasury obligations, 3.375%, 11/15/48, valued at $1,944,689), at 1.05%, dated 11/30/18, due 12/3/18 (Delivery value $1,904,167) | 1,904,000 | ||||
| State Street Institutional U.S. Government Money Market Fund, Premier Class | 3,638 | 3,638 | |||
TOTAL TEMPORARY CASH INVESTMENTS (Cost $10,466,804) | 10,466,804 | ||||
TOTAL INVESTMENT SECURITIES — 99.3% (Cost $809,209,921) | 890,322,598 | ||||
| OTHER ASSETS AND LIABILITIES — 0.7% | 5,916,861 | ||||
| TOTAL NET ASSETS — 100.0% | $ | 896,239,459 | |||
| MARKET SECTOR DIVERSIFICATION | ||
(as a % of net assets) | ||
| Consumer Discretionary | 17.4 | % |
| Consumer Staples | 15.0 | % |
| Health Care | 12.9 | % |
| Financials | 12.8 | % |
| Industrials | 11.3 | % |
| Information Technology | 11.2 | % |
| Materials | 6.8 | % |
| Communication Services | 5.4 | % |
| Energy | 4.7 | % |
| Real Estate | 0.7 | % |
| Cash and Equivalents* | 1.8 | % |
*Includes temporary cash investments and other assets and liabilities.
| NOTES TO SCHEDULE OF INVESTMENTS | ||
| ADR | - | American Depositary Receipt |
| (1) | Non-income producing. |
See Notes to Financial Statements.
10
| Statement of Assets and Liabilities |
| NOVEMBER 30, 2018 | |||
| Assets | |||
| Investment securities, at value (cost of $809,209,921) | $ | 890,322,598 | |
| Receivable for investments sold | 8,828,955 | ||
| Receivable for capital shares sold | 22,894 | ||
| Dividends and interest receivable | 1,866,458 | ||
| Other assets | 17,925 | ||
| 901,058,830 | |||
| Liabilities | |||
| Foreign currency overdraft payable, at value (cost of $5,145) | 5,137 | ||
| Payable for investments purchased | 3,782,642 | ||
| Payable for capital shares redeemed | 1,011,547 | ||
| Accrued foreign taxes | 20,045 | ||
| 4,819,371 | |||
| Net Assets | $ | 896,239,459 | |
| G Class Capital Shares, $0.01 Par Value | |||
| Shares authorized | 855,000,000 | ||
| Shares outstanding | 80,511,791 | ||
| Net Asset Value Per Share | $ | 11.13 | |
| Net Assets Consist of: | |||
| Capital (par value and paid-in surplus) | $ | 718,364,261 | |
| Distributable earnings | 177,875,198 | ||
| $ | 896,239,459 | ||
See Notes to Financial Statements.
11
| Statement of Operations |
| YEAR ENDED NOVEMBER 30, 2018 | |||
| Investment Income (Loss) | |||
| Income: | |||
| Dividends (net of foreign taxes withheld of $1,544,073) | $ | 17,061,598 | |
| Interest | 191,831 | ||
| 17,253,429 | |||
| Expenses: | |||
| Management fees | 7,944,623 | ||
| Directors' fees and expenses | 27,355 | ||
| Other expenses | 75,809 | ||
| 8,047,787 | |||
| Fees waived | (7,944,623 | ) | |
| 103,164 | |||
| Net investment income (loss) | 17,150,265 | ||
| Realized and Unrealized Gain (Loss) | |||
| Net realized gain (loss) on: | |||
| Investment transactions (net of foreign tax expenses paid (refunded) of $(5,628)) | 92,109,816 | ||
| Foreign currency translation transactions | (129,323 | ) | |
| 91,980,493 | |||
| Change in net unrealized appreciation (depreciation) on: | |||
| Investments (includes (increase) decrease in accrued foreign taxes of $47,333) | (172,837,585 | ) | |
| Translation of assets and liabilities in foreign currencies | (52,587 | ) | |
| (172,890,172 | ) | ||
| Net realized and unrealized gain (loss) | (80,909,679 | ) | |
| Net Increase (Decrease) in Net Assets Resulting from Operations | $ | (63,759,414 | ) |
See Notes to Financial Statements.
12
| Statement of Changes in Net Assets |
| YEARS ENDED NOVEMBER 30, 2018 AND NOVEMBER 30, 2017 | ||||||
| Increase (Decrease) in Net Assets | November 30, 2018 | November 30, 2017 | ||||
| Operations | ||||||
| Net investment income (loss) | $ | 17,150,265 | $ | 12,997,922 | ||
| Net realized gain (loss) | 91,980,493 | 69,693,779 | ||||
| Change in net unrealized appreciation (depreciation) | (172,890,172 | ) | 201,328,540 | |||
| Net increase (decrease) in net assets resulting from operations | (63,759,414 | ) | 284,020,241 | |||
| Distributions to Shareholders | ||||||
| From earnings: | ||||||
| G Class | (46,157,333 | ) | (7,905,118 | ) | ||
| R6 Class | — | (1,009,740 | ) | |||
| Decrease in net assets from distributions | (46,157,333 | ) | (8,914,858 | ) | ||
| Capital Share Transactions | ||||||
| Net increase (decrease) in net assets from capital share transactions (Note 5) | (33,688,529 | ) | (164,632,252 | ) | ||
| Net increase (decrease) in net assets | (143,605,276 | ) | 110,473,131 | |||
| Net Assets | ||||||
| Beginning of period | 1,039,844,735 | 929,371,604 | ||||
| End of period | $ | 896,239,459 | $ | 1,039,844,735 | ||
See Notes to Financial Statements.
13
| Notes to Financial Statements |
NOVEMBER 30, 2018
1. Organization
American Century World Mutual Funds, Inc. (the corporation) is registered under the Investment Company Act of 1940, as amended (the 1940 Act), as an open-end management investment company and is organized as a Maryland corporation. NT International Growth Fund (the fund) is one fund in a series issued by the corporation. The fund's investment objective is to seek capital growth. The fund is not permitted to invest in securities issued by companies assigned the Global Industry Classification Standard or the Bloomberg Industry Classification Standard for the tobacco industry. The fund offers the G Class. On July 31, 2017, all outstanding R6 Class shares were converted to G Class shares and the fund discontinued offering the R6 Class.
2. Significant Accounting Policies
The following is a summary of significant accounting policies consistently followed by the fund in preparation of its financial statements. The fund is an investment company and follows accounting and reporting guidance in accordance with accounting principles generally accepted in the United States of America. This may require management to make certain estimates and assumptions at the date of the financial statements. Actual results could differ from these estimates. Management evaluated the impact of events or transactions occurring through the date the financial statements were issued that would merit recognition or disclosure.
Investment Valuations — The fund determines the fair value of its investments and computes its net asset value per share at the close of regular trading (usually 4 p.m. Eastern time) on the New York Stock Exchange (NYSE) on each day the NYSE is open. The Board of Directors has adopted valuation policies and procedures to guide the investment advisor in the fund’s investment valuation process and to provide methodologies for the oversight of the fund’s pricing function.
Equity securities that are listed or traded on a domestic securities exchange are valued at the last reported sales price or at the official closing price as provided by the exchange. Equity securities traded on foreign securities exchanges are generally valued at the closing price of such securities on the exchange where primarily traded or at the close of the NYSE, if that is earlier. If no last sales price is reported, or if local convention or regulation so provides, the mean of the latest bid and asked prices may be used. Securities traded over-the-counter are valued at the mean of the latest bid and asked prices, the last sales price, or the official closing price. Equity securities initially expressed in local currencies are translated into U.S. dollars at the mean of the appropriate currency exchange rate at the close of the NYSE as provided by an independent pricing service.
Open-end management investment companies are valued at the reported net asset value per share. Repurchase agreements are valued at cost, which approximates fair value.
If the fund determines that the market price for an investment is not readily available or the valuation methods mentioned above do not reflect an investment’s fair value, such investment is valued as determined in good faith by the Board of Directors or its delegate, in accordance with policies and procedures adopted by the Board of Directors. In its determination of fair value, the fund may review several factors including, but not limited to, market information regarding the specific investment or comparable investments and correlation with other investment types, futures indices or general market indicators. Circumstances that may cause the fund to use these procedures to value an investment include, but are not limited to: an investment has been declared in default or is distressed; trading in a security has been suspended during the trading day or a security is not actively trading on its principal exchange; prices received from a regular pricing source are deemed unreliable; or there is a foreign market holiday and no trading occurred.
14
The fund monitors for significant events occurring after the close of an investment’s primary exchange but before the fund’s net asset value per share is determined. Significant events may include, but are not limited to: corporate announcements and transactions; governmental action and political unrest that could impact a specific investment or an investment sector; or armed conflicts, natural disasters and similar events that could affect investments in a specific country or region. The fund also monitors for significant fluctuations between domestic and foreign markets, as evidenced by the U.S. market or such other indicators that the Board of Directors, or its delegate, deems appropriate. If significant fluctuations in foreign markets are identified, the fund may apply a model-derived factor to the closing price of equity securities traded on foreign securities exchanges. The factor is based on observable market data as provided by an independent pricing service.
Security Transactions — Security transactions are accounted for as of the trade date. Net realized gains and losses are determined on the identified cost basis, which is also used for federal income tax purposes. Certain countries impose taxes on realized gains on the sale of securities registered in their country. The fund records the foreign tax expense, if any, on an accrual basis. The foreign tax expense on realized gains and unrealized appreciation reduces the net realized gain (loss) on investment transactions and net unrealized appreciation (depreciation) on investments, respectively.
Investment Income — Dividend income less foreign taxes withheld, if any, is recorded as of the ex-dividend date. Distributions received on securities that represent a return of capital or long-term capital gain are recorded as a reduction of cost of investments and/or as a realized gain. The fund may estimate the components of distributions received that may be considered nontaxable distributions or long-term capital gain distributions for income tax purposes. Interest income is recorded on the accrual basis and includes accretion of discounts and amortization of premiums.
Foreign Currency Translations — All assets and liabilities initially expressed in foreign currencies are translated into U.S. dollars at prevailing exchange rates at period end. The fund may enter into spot foreign currency exchange contracts to facilitate transactions denominated in a foreign currency. Purchases and sales of investment securities, dividend and interest income, spot foreign currency exchange contracts, and expenses are translated at the rates of exchange prevailing on the respective dates of such transactions. Net realized and unrealized foreign currency exchange gains or losses related to investment securities are a component of net realized gain (loss) on investment transactions and change in net unrealized appreciation (depreciation) on investments, respectively.
Repurchase Agreements — The fund may enter into repurchase agreements with institutions that American Century Investment Management, Inc. (ACIM) (the investment advisor) has determined are creditworthy pursuant to criteria adopted by the Board of Directors. The fund requires that the collateral, represented by securities, received in a repurchase transaction be transferred to the custodian in a manner sufficient to enable the fund to obtain those securities in the event of a default under the repurchase agreement. ACIM monitors, on a daily basis, the securities transferred to ensure the value, including accrued interest, of the securities under each repurchase agreement is equal to or greater than amounts owed to the fund under each repurchase agreement.
Joint Trading Account — Pursuant to an Exemptive Order issued by the Securities and Exchange Commission, the fund, along with certain other funds in the American Century Investments family of funds, may transfer uninvested cash balances into a joint trading account. These balances are invested in one or more repurchase agreements that are collateralized by U.S. Treasury or Agency obligations.
Income Tax Status — It is the fund’s policy to distribute substantially all net investment income and net realized gains to shareholders and to otherwise qualify as a regulated investment company under provisions of the Internal Revenue Code. Accordingly, no provision has been made for income taxes. The fund files U.S. federal, state, local and non-U.S. tax returns as applicable. The fund's tax returns are subject to examination by the relevant taxing authority until expiration of the applicable statute of limitations, which is generally three years from the date of filing but can be longer in certain jurisdictions. At this time, management believes there are no uncertain tax positions which, based on their technical merit, would not be sustained upon examination and for which it is reasonably possible that the total amounts of unrecognized tax benefits will significantly change in the next twelve months.
Distributions to Shareholders — Distributions from net investment income and net realized gains, if any, are generally declared and paid annually. The fund may make distributions on a more frequent basis to comply with the distribution requirements of the Internal Revenue Code, in all events in a manner consistent with provisions of the 1940 Act. The fund may elect to treat a portion of its payment to a redeeming shareholder, which represents the pro rata share of undistributed net investment income and net realized gains, as a distribution for federal income tax purposes (tax equalization).
15
Indemnifications — Under the corporation’s organizational documents, its officers and directors are indemnified against certain liabilities arising out of the performance of their duties to the fund. In addition, in the normal course of business, the fund enters into contracts that provide general indemnifications. The maximum exposure under these arrangements is unknown as this would involve future claims that may be made against a fund. The risk of material loss from such claims is considered by management to be remote.
3. Fees and Transactions with Related Parties
Certain officers and directors of the corporation are also officers and/or directors of American Century Companies, Inc. (ACC). The corporation’s investment advisor, ACIM, the corporation's distributor, American Century Investment Services, Inc., and the corporation’s transfer agent, American Century Services, LLC, are wholly owned, directly or indirectly, by ACC. Various funds issued by American Century Asset Allocation Portfolios, Inc. own, in aggregate, 100% of the shares of the fund. Related parties do not invest in the fund for the purpose of exercising management or control.
Management Fees —The corporation has entered into a management agreement with ACIM, under which ACIM provides the fund with investment advisory and management services in exchange for a single, unified management fee (the fee). The agreement provides that all expenses of managing and operating the fund, except brokerage expenses, taxes, interest, fees and expenses of the independent directors (including legal counsel fees), and extraordinary expenses, will be paid by ACIM. The fee is computed and accrued daily based on the daily net assets of the fund and paid monthly in arrears. The rate of the fee is determined by applying a fee rate calculation formula. This formula takes into account the fund’s assets as well as certain assets, if any, of other clients of the investment advisor outside the American Century Investments family of funds (such as subadvised funds and separate accounts) that use very similar investment teams and strategies (strategy assets). The strategy assets of the fund also include the assets of International Growth Fund, one fund in a series issued by the corporation. The management fee schedule ranges from 0.700% to 1.150%. The investment advisor agreed to waive the fund’s management fee in its entirety. The investment advisor expects this waiver to remain in effect permanently and cannot terminate it without the approval of the Board of Directors. The effective annual management fee for the period ended November 30, 2018 was 0.81% before waiver and 0.00% after waiver.
Directors' Fees and Expenses — The Board of Directors is responsible for overseeing the investment advisor’s management and operations of the fund. The directors receive detailed information about the fund and its investment advisor regularly throughout the year, and meet at least quarterly with management of the investment advisor to review reports about fund operations. The fund’s officers do not receive compensation from the fund.
Interfund Transactions — The fund may enter into security transactions with other American Century Investments funds and other client accounts of the investment advisor, in accordance with the 1940 Act rules and procedures adopted by the Board of Directors. The rules and procedures require, among other things, that these transactions be effected at the independent current market price of the security. During the period, the interfund purchases and sales were $2,300,170 and $528,810, respectively. The effect of interfund transactions on the Statement of Operations was $(24,172) in net realized gain (loss) on investment transactions.
4. Investment Transactions
Purchases and sales of investment securities, excluding short-term investments, for the period ended November 30, 2018 were $688,669,543 and $749,828,816, respectively.
16
5. Capital Share Transactions
Transactions in shares of the fund were as follows:
| Year ended November 30, 2018 | Year ended November 30, 2017 | |||||||||
| Shares | Amount | Shares | Amount | |||||||
| G Class/Shares Authorized | 855,000,000 | 770,000,000 | ||||||||
| Sold | 7,621,342 | $ | 91,937,445 | 15,337,677 | $ | 172,998,742 | ||||
| Issued in reinvestment of distributions | 3,761,239 | 46,157,333 | 826,031 | 7,905,118 | ||||||
| Redeemed | (13,568,888 | ) | (171,783,307 | ) | (21,420,057 | ) | (240,387,705 | ) | ||
| (2,186,307 | ) | (33,688,529 | ) | (5,256,349 | ) | (59,483,845 | ) | |||
| R6 Class/Shares Authorized | N/A | N/A | ||||||||
| Sold | 2,848,050 | 28,985,767 | ||||||||
| Issued in reinvestment of distributions | 105,511 | 1,009,740 | ||||||||
| Redeemed | (11,680,227 | ) | (135,143,914 | ) | ||||||
| (8,726,666 | ) | (105,148,407 | ) | |||||||
| Net increase (decrease) | (2,186,307 | ) | $ | (33,688,529 | ) | (13,983,015 | ) | $ | (164,632,252 | ) |
6. Fair Value Measurements
The fund’s investments valuation process is based on several considerations and may use multiple inputs to determine the fair value of the investments held by the fund. In conformity with accounting principles generally accepted in the United States of America, the inputs used to determine a valuation are classified into three broad levels.
| • | Level 1 valuation inputs consist of unadjusted quoted prices in an active market for identical investments. |
| • | Level 2 valuation inputs consist of direct or indirect observable market data (including quoted prices for comparable investments, evaluations of subsequent market events, interest rates, prepayment speeds, credit risk, etc.). These inputs also consist of quoted prices for identical investments initially expressed in local currencies that are adjusted through translation into U.S. dollars. |
| • | Level 3 valuation inputs consist of unobservable data (including a fund’s own assumptions). |
The level classification is based on the lowest level input that is significant to the fair valuation measurement. The valuation inputs are not necessarily an indication of the risks associated with investing in these securities or other financial instruments.
The following is a summary of the level classifications as of period end. The Schedule of Investments provides additional information on the fund’s portfolio holdings.
| Level 1 | Level 2 | Level 3 | ||||||
| Assets | ||||||||
| Investment Securities | ||||||||
| Common Stocks | ||||||||
| Canada | $ | 10,930,905 | $ | 12,186,806 | — | |||
| China | 14,244,852 | 18,407,435 | — | |||||
| Ireland | 2,360,383 | 19,527,664 | — | |||||
| Netherlands | 15,631,445 | 24,138,356 | — | |||||
| Russia | 6,235,120 | — | — | |||||
| Sweden | 2,652,591 | 47,890,422 | — | |||||
| Other Countries | — | 705,649,815 | — | |||||
| Temporary Cash Investments | 3,638 | 10,463,166 | — | |||||
| $ | 52,058,934 | $ | 838,263,664 | — | ||||
17
7. Risk Factors
There are certain risks involved in investing in foreign securities. These risks include those resulting from future adverse political, social and economic developments, fluctuations in currency exchange rates, the possible imposition of exchange controls, and other foreign laws or restrictions. Investing in emerging markets may accentuate these risks.
8. Federal Tax Information
On December 18, 2018, the fund declared and paid per-share distributions of $1.2138 and $0.2214 from net realized gains and net investment income, respectively, to shareholders of record on December 17, 2018 for the G Class.
The tax character of distributions paid during the years ended November 30, 2018 and November 30, 2017 were as follows:
| 2018 | 2017 | |||||
| Distributions Paid From | ||||||
| Ordinary income | $ | 15,877,581 | $ | 8,914,858 | ||
| Long-term capital gains | $ | 30,279,752 | — | |||
The book-basis character of distributions made during the year from net investment income or net realized gains may differ from their ultimate characterization for federal income tax purposes. These differences reflect the differing character of certain income items and net realized gains and losses for financial statement and tax purposes, and may result in reclassification among certain capital accounts on the financial statements.
As of period end, the federal tax cost of investments and the components of distributable earnings on a tax-basis were as follows:
| Federal tax cost of investments | $ | 811,192,842 | |
| Gross tax appreciation of investments | $ | 117,399,130 | |
| Gross tax depreciation of investments | (38,269,374 | ) | |
| Net tax appreciation (depreciation) of investments | 79,129,756 | ||
| Net tax appreciation (depreciation) on translation of assets and liabilities in foreign currencies | (39,175 | ) | |
| Net tax appreciation (depreciation) | $ | 79,090,581 | |
| Undistributed ordinary income | $ | 16,255,211 | |
| Accumulated long-term gains | $ | 91,518,618 | |
| Post-October capital loss deferral | $ | (8,989,212 | ) |
The difference between book-basis and tax-basis unrealized appreciation (depreciation) is attributable primarily to the tax deferral of losses on wash sales.
Loss deferrals represent certain qualified losses that the fund has elected to treat as having been incurred in the following fiscal year for federal income tax purposes.
18
| Financial Highlights |
| For a Share Outstanding Throughout the Years Ended November 30 (except as noted) | |||||||||||||||||
| Per-Share Data | Ratios and Supplemental Data | ||||||||||||||||
| Income From Investment Operations: | Distributions From: | Ratio to Average Net Assets of: | |||||||||||||||
Net Asset Value, Beginning of Period | Net Investment Income (Loss)(1) | Net Realized and Unrealized Gain (Loss) | Total From Investment Operations | Net Investment Income | Net Realized Gains | Total Distributions | Net Asset Value, End of Period | Total Return(2) | Operating Expenses | Operating Expenses (before expense waiver) | Net Investment Income (Loss) | Net Investment Income (Loss) (before expense waiver) | Portfolio Turnover Rate | Net Assets, End of Period (in thousands) | |||
| G Class | |||||||||||||||||
| 2018 | $12.57 | 0.22 | (1.09) | (0.87) | (0.20) | (0.37) | (0.57) | $11.13 | (7.35)% | 0.01% | 0.82% | 1.75% | 0.94% | 71% | $896,239 | ||
| 2017 | $9.61 | 0.14 | 2.91 | 3.05 | (0.09) | — | (0.09) | $12.57 | 32.02% | 0.61% | 0.91% | 1.26% | 0.96% | 57% | $1,039,845 | ||
| 2016 | $10.95 | 0.10 | (1.02) | (0.92) | (0.08) | (0.34) | (0.42) | $9.61 | (8.69)% | 0.98% | 0.98% | 0.98% | 0.98% | 69% | $845,423 | ||
| 2015 | $11.58 | 0.08 | (0.26) | (0.18) | (0.05) | (0.40) | (0.45) | $10.95 | (1.44)% | 0.97% | 0.97% | 0.69% | 0.69% | 83% | $795,985 | ||
| 2014 | $12.17 | 0.10 | 0.03 | 0.13 | (0.17) | (0.55) | (0.72) | $11.58 | 1.26% | 0.98% | 0.98% | 0.86% | 0.86% | 67% | $938,672 | ||
| Notes to Financial Highlights |
| (1) | Computed using average shares outstanding throughout the period. |
| (2) | Total returns are calculated based on the net asset value of the last business day. Total returns for periods less than one year are not annualized. |
See Notes to Financial Statements.
| Report of Independent Registered Public Accounting Firm |
To the Shareholders and the Board of Directors of American Century World Mutual Funds, Inc.:
Opinion on the Financial Statements and Financial Highlights
We have audited the accompanying statement of assets and liabilities, including the schedule of investments, of NT International Growth Fund, one of the funds constituting the American Century World Mutual Funds, Inc. (the “Fund”), as of November 30, 2018, the related statement of operations for the year then ended, the statements of changes in net assets for each of the two years in the period then ended, the financial highlights for each of the five years in the period then ended, and the related notes. In our opinion, the financial statements and financial highlights present fairly, in all material respects, the financial position of NT International Growth Fund of the American Century World Mutual Funds, Inc. as of November 30, 2018, the results of its operations for the year then ended, the changes in its net assets for each of the two years in the period then ended, and the financial highlights for each of the five years in the period then ended, in conformity with accounting principles generally accepted in the United States of America.
Basis for Opinion
These financial statements and financial highlights are the responsibility of the Fund's management. Our responsibility is to express an opinion on the Fund’s financial statements and financial highlights based on our audits. We are a public accounting firm registered with the Public Company Accounting Oversight Board (United States) (PCAOB) and are required to be independent with respect to the Fund in accordance with the U.S. federal securities laws and the applicable rules and regulations of the Securities and Exchange Commission and the PCAOB.
We conducted our audits in accordance with the standards of the PCAOB. Those standards require that we plan and perform the audit to obtain reasonable assurance about whether the financial statements and financial highlights are free of material misstatement, whether due to error or fraud. The Fund is not required to have, nor were we engaged to perform, an audit of its internal control over financial reporting. As part of our audits we are required to obtain an understanding of internal control over financial reporting but not for the purpose of expressing an opinion on the effectiveness of the Fund’s internal control over financial reporting. Accordingly, we express no such opinion.
Our audits included performing procedures to assess the risks of material misstatement of the financial statements and financial highlights, whether due to error or fraud, and performing procedures that respond to those risks. Such procedures included examining, on a test basis, evidence regarding the amounts and disclosures in the financial statements and financial highlights. Our audits also included evaluating the accounting principles used and significant estimates made by management, as well as evaluating the overall presentation of the financial statements and financial highlights. Our procedures included confirmation of securities owned as of November 30, 2018, by correspondence with the custodian and brokers; when replies were not received from brokers, we performed other auditing procedures. We believe that our audits provide a reasonable basis for our opinion.
DELOITTE & TOUCHE LLP
Kansas City, Missouri
January 17, 2019
We have served as the auditor of one or more American Century investment companies since 1997.
20
| Management |
The Board of Directors
The individuals listed below serve as directors of the funds. Each director will continue to serve in this capacity until death, retirement, resignation or removal from office. The board has adopted a mandatory retirement age for directors who are not “interested persons,” as that term is defined in the Investment Company Act (independent directors). Independent directors shall retire by December 31 of the year in which they reach their 75th birthday.
Mr. Thomas is an “interested person” because he currently serves as President and Chief Executive Officer of American Century Companies, Inc. (ACC), the parent company of American Century Investment Management, Inc. (ACIM or the advisor). The other directors (more than three-fourths of the total number) are independent. They are not employees, directors or officers of, and have no financial interest in, ACC or any of its wholly owned, direct or indirect, subsidiaries, including ACIM, American Century Investment Services, Inc. (ACIS) and American Century Services, LLC (ACS), and they do not have any other affiliations, positions or relationships that would cause them to be considered “interested persons” under the Investment Company Act. The directors serve in this capacity for seven (in the case of Jonathan S. Thomas, 16; and Stephen E. Yates, 8) registered investment companies in the American Century Investments family of funds.
The following table presents additional information about the directors. The mailing address for each director is 4500 Main Street, Kansas City, Missouri 64111.
| Name (Year of Birth) | Position(s) Held with Funds | Length of Time Served | Principal Occupation(s) During Past 5 Years | Number of American Century Portfolios Overseen by Director | Other Directorships Held During Past 5 Years |
| Independent Directors | |||||
| Thomas W. Bunn (1953) | Director | Since 2017 | Retired | 68 | SquareTwo Financial; Barings (formerly Babson Capital Funds Trust) (2013 to 2016) |
| Barry Fink (1955) | Director | Since 2012 (independent since 2016) | Retired; Executive Vice President, ACC (2007 to 2013); President, ACS (2007 to 2013) | 68 | None |
| Jan M. Lewis (1957) | Director | Since 2011 | Retired; President and Chief Executive Officer, Catholic Charities of Northeast Kansas (human services organization) (2006 to 2013) | 68 | None |
M. Jeannine Strandjord(1) (1945) | Director | Since 1994 | Self-employed Consultant | 68 | Euronet Worldwide Inc. and MGP Ingredients, Inc. |
21
| Name (Year of Birth) | Position(s) Held with Funds | Length of Time Served | Principal Occupation(s) During Past 5 Years | Number of American Century Portfolios Overseen by Director | Other Directorships Held During Past 5 Years |
| Independent Directors | |||||
| John R. Whitten (1946) | Director | Since 2008 | Retired | 68 | Rudolph Technologies, Inc. |
| Stephen E. Yates (1948) | Director and Chairman of the Board | Since 2012 (Chairman since 2018) | Retired | 73 | None |
| Interested Director | |||||
| Jonathan S. Thomas (1963) | Director and President | Since 2007 | President and Chief Executive Officer, ACC (2007 to present). Also serves as Chief Executive Officer, ACS; Executive Vice President, ACIM; Director, ACC, ACIM and other ACC subsidiaries | 118 | BioMed Valley Discoveries, Inc. |
(1) Effective December 31, 2018, M. Jeannine Strandjord retired from the Board of Directors.
The Statement of Additional Information has additional information about the fund's directors and is available without charge, upon request, by calling 1-800-345-2021.
22
Officers
The following table presents certain information about the executive officers of the funds. Each officer serves as an officer for each of the 16 (in the case of Robert J. Leach, 15) investment companies in the American Century family of funds. No officer is compensated for his or her service as an officer of the funds. The listed officers are interested persons of the funds and are appointed or re-appointed on an annual basis. The mailing address for each officer listed below is 4500 Main Street, Kansas City, Missouri 64111.
| Name (Year of Birth) | Offices with the Funds | Principal Occupation(s) During the Past Five Years |
| Jonathan S. Thomas (1963) | Director and President since 2007 | President and Chief Executive Officer, ACC (2007 to present). Also serves as Chief Executive Officer, ACS; Executive Vice President, ACIM; Director, ACC, ACIM and other ACC subsidiaries |
| R. Wes Campbell (1974) | Chief Financial Officer and Treasurer since 2018 | Investment Operations and Investment Accounting, ACS (2000 to present) |
| Amy D. Shelton (1964) | Chief Compliance Officer and Vice President since 2014 | Chief Compliance Officer, American Century funds, (2014 to present); Chief Compliance Officer, ACIM (2014 to present); Chief Compliance Officer, ACIS (2009 to present); Vice President, Client Interactions and Marketing, ACIS (2013 to 2014). Also serves as Vice President, ACIS |
| Charles A. Etherington (1957) | General Counsel since 2007 and Senior Vice President since 2006 | Attorney, ACC (1994 to present); Vice President, ACC (2005 to present); General Counsel, ACC (2007 to present). Also serves as General Counsel, ACIM, ACS, ACIS and other ACC subsidiaries; and Senior Vice President, ACIM and ACS |
| C. Jean Wade (1964) | Vice President since 2012 | Senior Vice President, ACS (2017 to present); Vice President, ACS (2000 to 2017) |
| Robert J. Leach (1966) | Vice President since 2006 | Vice President, ACS (2000 to present) |
| David H. Reinmiller (1963) | Vice President since 2000 | Attorney, ACC (1994 to present). Also serves as Vice President, ACIM and ACS |
| Ward D. Stauffer (1960) | Secretary since 2005 | Attorney, ACC (2003 to present) |
23
| Approval of Management Agreement |
At a meeting held on June 28, 2018, the Fund’s Board of Directors (the "Board") unanimously approved the renewal of the management agreement pursuant to which American Century Investment Management, Inc. (the “Advisor”) acts as the investment advisor for the Fund. Under Section 15(c) of the Investment Company Act, contracts for investment advisory services are required to be reviewed, evaluated, and approved by a majority of a fund’s directors (the “Directors”), including a majority of the independent Directors, each year.
Prior to its consideration of the renewal of the management agreement, the Directors requested and reviewed extensive data and information compiled by the Advisor and certain independent providers of evaluation data concerning the Fund and the services provided to the Fund by the Advisor. This review was in addition to the oversight and evaluation undertaken by the Board and its committees on a continual basis and the information received was supplemental to the extensive information that the Board and its committees receive and consider throughout the year. The Directors also conducted a review of the process by which the Board considers the renewal of the management agreements. The Board consulted with industry experts and reviewed industry best practices and recent judicial precedent. The Directors believe that the enhancements resulting from their review resulted in increased dialogue with the Advisor and an improved process for fund shareholders.
In connection with its consideration of the renewal of the management agreement, the Board’s review and evaluation of the services provided by the Advisor included, but was not limited to, the following:
| • | the nature, extent, and quality of investment management, shareholder services, and other services provided and to be provided to the Fund; |
| • | the wide range of other programs and services provided and to be provided to the Fund and its shareholders on a routine and non-routine basis; |
| • | the investment performance of the Fund, including data comparing the Fund's performance to appropriate benchmarks and/or a peer group of other mutual funds with similar investment objectives and strategies; |
| • | the cost of owning the Fund compared to the cost of owning similar funds; |
| • | the compliance policies, procedures, and regulatory experience of the Advisor and the Fund's service providers; |
| • | financial data showing the cost of services provided to the Fund, the profitability of the Fund to the Advisor, and the overall profitability of the Advisor |
| • | strategic plans of the Advisor; |
| • | any economies of scale associated with the Advisor’s management of the Fund and other accounts; |
| • | services provided and charges to the Advisor's other investment management clients; |
| • | acquired fund fees and expenses; |
| • | payments and practices in connection with financial intermediaries holding shares of the Fund and the services provided by intermediaries in connection therewith; and |
| • | any collateral benefits derived by the Advisor from the management of the Fund. |
The Directors held two in-person meetings and one telephonic meeting to review and discuss the information provided. The independent Directors also reviewed responses to supplemental information requests provided by the Directors to the Advisor and held active discussions with the Advisor regarding the renewal of the management agreement. The independent Directors had the benefit of the advice of their independent counsel throughout the process.
24
Factors Considered
The Directors considered all of the information provided by the Advisor, the independent data providers, and independent counsel in connection with the approval. They determined that the information was sufficient for them to evaluate the management agreement for the Fund. In connection with their review, the Directors did not identify any single factor as being all-important or controlling, and each Director may have attributed different levels of importance to different factors. In deciding to renew the management agreement, the Board based its decision on a number of factors, including without limitation the following:
Nature, Extent and Quality of Services - Generally. Under the management agreement, the Advisor is responsible for providing or arranging for all services necessary for the operation of the Fund. The Board noted that the Advisor provides or arranges at its own expense a wide variety of services including without limitation the following:
| • | portfolio research and security selection |
| • | securities trading |
| • | Fund administration |
| • | custody of Fund assets |
| • | daily valuation of the Fund’s portfolio |
| • | shareholder servicing and transfer agency, including shareholder confirmations, recordkeeping, and communications |
| • | legal services (except the independent Directors’ counsel) |
| • | regulatory and portfolio compliance |
| • | financial reporting |
| • | marketing and distribution (except amounts paid by the Fund under Rule 12b-1 plans) |
The Board noted that many of these services have expanded over time in terms of both quantity and complexity in response to shareholder demands, competition in the industry, changing distribution channels, and the changing regulatory environment.
Investment Management Services. The nature of the investment management services provided to the Fund is quite complex and allows Fund shareholders access to professional money management, instant diversification of their investments within an asset class, the opportunity to easily diversify among asset classes by investing in or exchanging among various American Century Investments funds, and liquidity. In evaluating investment performance, the Board expects the Advisor to manage the Fund in accordance with its investment objectives and approved strategies. Further, the Directors recognize that the Advisor has an obligation to monitor trading activities, and in particular to seek the best execution of fund trades, and to evaluate the use of and payment for research. In providing these services, the Advisor utilizes teams of investment professionals (portfolio managers, analysts, research assistants, and securities traders) who require extensive information technology, research, training, compliance, and other systems to conduct their business. The Board, directly and through its Fund Performance Review Committee, provides oversight of the investment performance process. It regularly reviews investment performance information for the Fund, together with comparative information for appropriate benchmarks and/or peer groups of similarly-managed funds, over different time horizons. The Directors also review detailed performance information provided by the Advisor during the management agreement renewal process. If performance concerns are identified, the Fund receives special reviews until performance improves, during which the Board receives a report from the Advisor regarding the reasons for such results (e.g., market conditions, security selection) and any efforts being undertaken to improve performance. The Fund’s performance was above its benchmark for the one-, three-, five-, and ten-year periods reviewed by the Board. The Board found the investment management services provided by the Advisor to the Fund to be satisfactory and consistent with the management agreement.
25
Shareholder and Other Services. Under the management agreement, the Advisor provides the Fund with a comprehensive package of transfer agency, shareholder, and other services. The Board, directly and through various committees of the Board, regularly reviews reports and evaluations of such services at its regular meetings. These reports include, but are not limited to, information regarding the operational efficiency and accuracy of the shareholder and transfer agency services provided, staffing levels, shareholder satisfaction (as measured by external as well as internal sources), technology support, new products and services offered to Fund shareholders, securities trading activities, portfolio valuation services, auditing services, and legal and operational compliance activities. The Board found the services provided by the Advisor to the Fund under the management agreement to be competitive and of high quality.
Costs of Services and Profitability. The Advisor provides detailed information concerning its cost of providing various services to the Fund, its profitability in managing the Fund (pre- and post-distribution), its overall profitability, and its financial condition. The Directors have reviewed with the Advisor the methodology used to prepare this financial information. This information is considered in evaluating the Advisor’s financial condition, its ability to continue to provide services under the management agreement, and the reasonableness of the current management fee. The Board concluded that the Advisor’s profits were reasonable in light of the services provided to the Fund.
Ethics. The Board generally considers the Advisor’s commitment to providing quality services to shareholders and to conducting its business ethically. They noted that the Advisor’s practices generally meet or exceed industry best practices.
Economies of Scale. The Board also reviewed information provided by the Advisor regarding the possible existence of economies of scale in connection with the management of the Fund. The Board concluded that economies of scale are difficult to measure and predict with precision, especially on a fund-by-fund basis. The Board concluded that the Advisor is appropriately sharing economies of scale through its competitive fee structure, offering competitive fees from fund inception, and through reinvestment in its business to provide shareholders additional content and services. The Board also noted that economies of scale are shared with the Fund and its shareholders through management fee breakpoints that serve to reduce the effective management fee as the assets of the Fund grow.
Comparison to Other Funds’ Fees. The management agreement provides that the Fund pays the Advisor a single, all-inclusive (or unified) management fee for providing all services necessary for the management and operation of the Fund, other than brokerage expenses, expenses attributable to short sales, taxes, interest, extraordinary expenses, and the fees and expenses of the Fund’s independent Directors (including their independent legal counsel) and expenses incurred in connection with the provision of shareholder services and distribution services under a plan adopted pursuant to Rule 12b-1 under the 1940 Act. Under the unified fee structure, the Advisor is responsible for providing all investment advisory, custody, audit, administrative, compliance, recordkeeping, marketing and shareholder services, or arranging and supervising third parties to provide such services. By contrast, most other funds are charged a variety of fees, including an investment advisory fee, a transfer agency fee, an administrative fee, distribution charges, and other expenses. Other than their investment advisory fees and any applicable Rule 12b-1 distribution fees, all other components of the total fees charged by these other funds may be increased without shareholder approval. The Board believes the unified fee structure is a benefit to Fund shareholders because it clearly discloses to shareholders the cost of owning Fund shares, and, since the unified fee cannot be increased without a vote of Fund shareholders, it shifts to the Advisor the risk of increased costs of operating the Fund and provides a direct incentive to minimize administrative inefficiencies. Part of the Board’s analysis of fee levels involves reviewing certain evaluative data compiled by an independent provider comparing the Fund’s unified fee to the total expense ratios of its peers. The unified fee charged to shareholders of the Fund was below the median of the total expense ratios of the Fund’s peer expense universe. The Board concluded that the management fee paid by the Fund to the Advisor under the management agreement is reasonable in light of the services provided to the Fund.
26
Comparison to Fees and Services Provided to Other Clients of the Advisor. The Directors also requested and received information from the Advisor concerning the nature of the services, fees, costs, and profitability of its advisory services to advisory clients other than the Fund. They observed that these varying types of client accounts require different services and involve different regulatory and entrepreneurial risks than the management of the Fund. The Board analyzed this information and concluded that the fees charged and services provided to the Fund were reasonable by comparison.
Payments to Intermediaries. The Directors also requested and received a description of payments made to intermediaries by the Fund and the Advisor and services provided in response thereto. These payments include various payments made by the Fund or the Advisor to different types of intermediaries and recordkeepers for distribution and service activities provided for the Fund. The Board reviewed such information and received representations from the Advisor that all such payments by the Fund were made pursuant to the Fund's Rule 12b-1 Plan and that all such payments by the Advisor were made from the Advisor’s resources and reasonable profits. The Board found the payments to be reasonable in scope and purpose.
Collateral or “Fall-Out” Benefits Derived by the Advisor. The Board considered the existence of collateral benefits the Advisor may receive as a result of its relationship with the Fund. They concluded that the Advisor’s primary business is managing mutual funds and it generally does not use fund or shareholder information to generate profits in other lines of business, and therefore does not derive any significant collateral benefits from them. The Board noted that additional assets from other clients may offer the Advisor some benefit from increased leverage with service providers and counterparties. Additionally, the Advisor may receive proprietary research from broker-dealers that execute fund portfolio transactions, which the Board concluded is likely to benefit other clients of the Advisor, as well as Fund shareholders. The Board also determined that the Advisor is able to provide investment management services to certain clients other than the Fund, at least in part, due to its existing infrastructure built to serve the fund complex. The Board concluded that appropriate allocation methodologies had been employed to assign resources and the cost of those resources to these other clients and, where expressly provided, these other client assets may be included with the assets of the Fund to determine breakpoints in the management fee schedule.
Existing Relationship. The Board also considered whether there was any reason for not continuing the existing arrangement with the Advisor. In this regard, the Board was mindful of the potential disruptions of the Fund’s operations and various risks, uncertainties, and other effects that could occur as a result of a decision not to continue such relationship. In particular, the Board recognized that most shareholders have invested in the Fund on the strength of the Advisor’s industry standing and reputation and in the expectation that the Advisor will have a continuing role in providing advisory services to the Fund.
Conclusion of the Directors. As a result of this process, the Board, including all of the independent Directors, taking into account all of the factors discussed above and the information provided by the Advisor and others in connection with its review and throughout the year, determined that the management fee is fair and reasonable in light of the services provided and that the investment management agreement between the Fund and the Advisor should be renewed.
27
| Additional Information |
Retirement Account Information
As required by law, distributions you receive from certain retirement accounts are subject to federal income tax withholding, unless you elect not to have withholding apply*. Tax will be withheld on the total amount withdrawn even though you may be receiving amounts that are not subject to withholding, such as nondeductible contributions. In such case, excess amounts of withholding could occur. You may adjust your withholding election so that a greater or lesser amount will be withheld.
If you don’t want us to withhold on this amount, you must notify us to not withhold the federal income tax. You may notify us in writing or in certain situations by telephone or through other electronic means. For systematic withdrawals, your withholding election will remain in effect until revoked or changed by filing a new election. You have the right to revoke your election at any time and change your withholding percentage for future distributions.
Remember, even if you elect not to have income tax withheld, you are liable for paying income tax on the taxable portion of your withdrawal. If you elect not to have income tax withheld or you don’t have enough income tax withheld, you may be responsible for payment of estimated tax. You may incur penalties under the estimated tax rules if your withholding and estimated tax payments are not sufficient. You can reduce or defer the income tax on a distribution by directly or indirectly rolling such distribution over to another IRA or eligible plan. You should consult your tax advisor for additional information.
State tax will be withheld if, at the time of your distribution, your address is within one of the mandatory withholding states and you have federal income tax withheld (or as otherwise required by state law). State taxes will be withheld from your distribution in accordance with the respective state rules.
*Some 403(b), 457 and qualified retirement plan distributions may be subject to 20% mandatory withholding, as they are subject to special tax and withholding rules. Your plan administrator or plan sponsor is required to provide you with a special tax notice explaining those rules at the time you request a distribution. If applicable, federal and/or state taxes may be withheld from your distribution amount.
Proxy Voting Policies
A description of the policies that the fund's investment advisor uses in exercising the voting rights associated with the securities purchased and/or held by the fund is available without charge, upon request, by calling 1-800-345-2021. It is also available on the "About Us" page of American Century Investments’ website at americancentury.com and on the Securities and Exchange Commission’s website at sec.gov. Information regarding how the investment advisor voted proxies relating to portfolio securities during the most recent 12-month period ended June 30 is available on the "About Us" page at americancentury.com. It is also available at sec.gov.
Quarterly Portfolio Disclosure
The fund files its complete schedule of portfolio holdings with the Securities and Exchange Commission (SEC) for the first and third quarters of each fiscal year on Form N-Q. The fund’s Forms N-Q are available on the SEC’s website at sec.gov. The fund also makes its complete schedule of portfolio holdings for the most recent quarter of its fiscal year available on its website at americancentury.com and, upon request, by calling 1-800-345-2021.
28
Other Tax Information
The following information is provided pursuant to provisions of the Internal Revenue Code.
The fund hereby designates up to the maximum amount allowable as qualified dividend income for the fiscal year ended November 30, 2018.
The fund hereby designates $34,697,591, or up to the maximum amount allowable, as long-term capital gain distributions (20% rate gain distributions) for the fiscal year ended November 30, 2018.
For the fiscal year ended November 30, 2018, the fund intends to pass through to shareholders foreign source income of $18,605,671 and foreign taxes paid of $1,544,073, or up to the maximum amount allowable, as a foreign tax credit. Foreign source income and foreign tax expense per outstanding share on November 30, 2018 are $0.2311 and $0.0192, respectively.
The fund utilized earnings and profits of $5,270,963 distributed to shareholders on redemption of shares as part of the dividends paid deduction (tax equalization).
29
| Notes |
30
| Notes |
31
| Notes |
32
| ||
| Contact Us | americancentury.com | |
| Automated Information Line | 1-800-345-8765 | |
| Investor Services Representative | 1-800-345-2021 or 816-531-5575 | |
| Investors Using Advisors | 1-800-378-9878 | |
| Business, Not-For-Profit, Employer-Sponsored Retirement Plans | 1-800-345-3533 | |
| Banks and Trust Companies, Broker-Dealers, Financial Professionals, Insurance Companies | 1-800-345-6488 | |
| Telecommunications Relay Service for the Deaf | 711 | |
| American Century World Mutual Funds, Inc. | ||
Investment Advisor: American Century Investment Management, Inc. Kansas City, Missouri | ||
| This report and the statements it contains are submitted for the general information of our shareholders. The report is not authorized for distribution to prospective investors unless preceded or accompanied by an effective prospectus. | ||
| ©2019 American Century Proprietary Holdings, Inc. All rights reserved. CL-ANN-91024 1901 | ||
| Annual Report | |
| November 30, 2018 | |
| NT International Small-Mid Cap Fund | |
| Investor Class (ANTSX) | |
| G Class (ANTMX) | |
Beginning on January 1, 2021, as permitted by regulations adopted by the Securities and Exchange Commission, paper copies of the fund’s shareholder reports like this one will no longer be sent by mail, unless you specifically request paper copies of the reports from the fund or from your financial intermediary, such as a broker-dealer or bank. Instead, the reports will be made available on a website, and you will be notified by mail each time a report is posted and provided with a website link to access the report.
If you already elected to receive shareholder reports electronically, you will not be affected by this change and you need not take any action. You may elect to receive shareholder reports and other communications from the fund or your financial intermediary electronically by calling or sending an email request to your appropriate contacts as listed on the back cover of this report.
You may elect to receive all future reports in paper free of charge. You can inform the fund or your financial intermediary that you wish to continue receiving paper copies of your shareholder reports by calling or sending an email request to your appropriate contacts as listed on the back cover of this report. Your election to receive reports in paper will apply to all funds held with the fund complex/your financial intermediary.
| Table of Contents |
| Performance | 2 | |
| Portfolio Commentary | ||
| Fund Characteristics | ||
| Shareholder Fee Example | ||
| Schedule of Investments | ||
| Statement of Assets and Liabilities | ||
| Statement of Operations | ||
| Statement of Changes in Net Assets | ||
| Notes to Financial Statements | ||
| Financial Highlights | ||
| Report of Independent Registered Public Accounting Firm | ||
| Management | ||
| Approval of Management Agreement | ||
| Additional Information | ||
Any opinions expressed in this report reflect those of the author as of the date of the report, and do not necessarily represent the opinions of American Century Investments® or any other person in the American Century Investments organization. Any such opinions are subject to change at any time based upon market or other conditions and American Century Investments disclaims any responsibility to update such opinions. These opinions may not be relied upon as investment advice and, because investment decisions made by American Century Investments funds are based on numerous factors, may not be relied upon as an indication of trading intent on behalf of any American Century Investments fund. Security examples are used for representational purposes only and are not intended as recommendations to purchase or sell securities. Performance information for comparative indices and securities is provided to American Century Investments by third party vendors. To the best of American Century Investments’ knowledge, such information is accurate at the time of printing.
| Performance |
| Total Returns as of November 30, 2018 | ||||
Average Annual Returns | ||||
Ticker Symbol | 1 year | Since Inception | Inception Date | |
| Investor Class | ANTSX | -14.20% | 3.53% | 3/19/15 |
| MSCI EAFE Small Cap Index | — | -9.89% | 6.20% | — |
| G Class | ANTMX | -12.95% | 4.22% | 3/19/15 |
G Class returns would have been lower if a portion of the fees had not been waived.
| Growth of $10,000 Over Life of Class |
| $10,000 investment made March 19, 2015 |
| Performance for other share classes will vary due to differences in fee structure. |
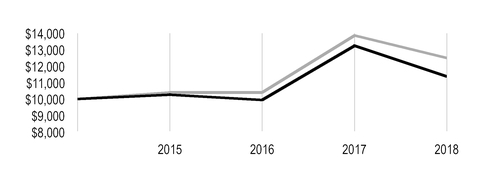
| Value on November 30, 2018 | |
| Investor Class — $11,370 | |
| MSCI EAFE Small Cap Index — $12,496 | |
Total Annual Fund Operating Expenses | |
| Investor Class | G Class |
| 1.48% | 1.13% |
The total annual fund operating expenses shown is as stated in the fund’s prospectus current as of the date of this report. The prospectus may vary from the expense ratio shown elsewhere in this report because it is based on a different time period, includes acquired fund fees and expenses, and, if applicable, does not include fee waivers or expense reimbursements.
Data presented reflect past performance. Past performance is no guarantee of future results. Current performance may be higher or lower than the performance shown. Total returns for periods less than one year are not annualized. Investment return and principal value will fluctuate, and redemption value may be more or less than original cost. Data assumes reinvestment of dividends and capital gains, and none of the charts reflect the deduction of taxes that a shareholder would pay on fund distributions or the redemption of fund shares. To obtain performance data current to the most recent month end, please call 1-800-345-2021 or visit americancentury.com. For additional information about the fund, please consult the prospectus.
2
| Portfolio Commentary |
Portfolio Managers: Trevor Gurwich, Federico Laffan, and Pratik Patel
Trevor Gurwich and Federico Laffan joined the fund's management team in February 2018. Brian Brady left the fund's management team in April 2018.
Performance Summary
NT International Small-Mid Cap returned -12.95%* for the 12 months ended November 30, 2018. The portfolio underperformed its benchmark, the MSCI EAFE Small Cap Index, which returned -9.89% for the same period.
Signs of moderating economic growth in Europe and China and geopolitical tensions contributed to volatility in non-U.S. stocks, which ended the 12-month period lower. Small-cap non-U.S. stocks lagged their large-cap counterparts. Within the portfolio, stock selection in industrials hurt relative performance, as global trade tensions created earnings growth headwinds for non-U.S. small-cap industrials companies. Stock selection and an overweight relative to the benchmark in consumer discretionary also detracted. Investments in the new communication services sector contributed, due to stock selection and not owning several benchmark detractors. Stock selection in information technology also added to relative performance. From a regional standpoint, investments in Japan, Canada, and Sweden detracted. Investments in France, the U.K., and China contributed.
Detractors Included Aerospace Company and Several Energy Sector Holdings
Aerospace and transportation company Bombardier was a key laggard. After rising early in the year on solid earnings performance, the stock declined in October and November on concerns about the economic cycle, rising interest rates, and insider selling. On a positive note, its business jet order backlog continued to strengthen. We held onto the investment.
Several energy companies were notable detractors. The stock of Trican Well Service declined after the oil services company warned that weather delays and a pullback in industry capital spending hurt its results in the third calendar quarter of 2018. A fourth-quarter retreat in oil prices also pressured the stock price. We decided to liquidate our holdings to help fund investments with more compelling sustainable and accelerating earnings growth profiles. Kelt Exploration is an oil and gas exploration company we added in the third quarter due to its high-quality assets. The stock price fell in October after the company reported disappointing production metrics. In our view, the company has a long runway to expand its current production profile, which could translate to a sustainable acceleration in earnings growth.
Elsewhere in the portfolio, real estate holding Tateru was a key detractor. Tateru provides cloud-based real estate marketing services. The stock performed well in the first half of 2018, aided by a growing user base. It declined in the third quarter, however, after the company reported a prospective client’s credit approval was based on falsified bank statements. Amid a wider investigation into other potential occurrences, and given near-term uncertainty for the stock, we exited the position.
*All fund returns referenced in this commentary are for G Class shares. G Class returns would have been lower if a portion of the fees had not been waived. Performance for other share classes will vary due to differences in fee structure; when G Class performance exceeds that of the fund's benchmark, other share classes may not. See page 2 for returns for all share classes.
3
Media Company and Telecommunications Equipment Supplier Were Key Contributors
Stock selection in the new communication services sector bolstered relative performance, especially in the entertainment industry. Entertainment One, an investment we added during the year, was a notable contributor. The media and entertainment company continues to deliver
solid growth. We also believe its overseas operations, especially in China, support growth, and its film and television division is well positioned with a healthy pipeline.
Anritsu, a global supplier of telecommunications electronic equipment, was a leading contributor in information technology. The company reported strong trends in its mobile and broadband businesses as it capitalized on increased spending on 5G services.
Burford Capital, which provides specialized financing and professional services for the global legal industry, was another top contributor. The stock rose strongly after the company reported double-digit revenue and profits growth for the first half of 2018. The company’s portfolio is well diversified, and its business is becoming more recurring, which we believe will support sustainable earnings growth. In the materials sector, Kirkland Lake Gold was also a standout contributor. The gold producer reported very strong third-quarter earnings, record production, and increased guidance.
Outlook
The portfolio continues to invest in non-U.S. small- and mid-cap companies that we believe are demonstrating accelerating and sustainable growth. Our stock selection continues to drive our sector and country allocations. This bottom-up process led us to increase our weighting in materials, which ended the period as the largest sector overweight. We added exposure to select companies exhibiting accelerating earnings growth potential in the metals and mining industry. We also increased our weighting in health care, which ended the period as a prominent overweight due to stock-specific opportunities. The real estate sector remained a significant underweight, as rising interest rates and expectations for higher rates continued to pressure property stocks.
From a regional standpoint, we scaled back exposure to emerging markets, especially China. We remain overweight in the region compared with the benchmark, which has no emerging markets exposure. We added to our weighting in Europe, moving to an overweight position. We also increased exposure to Canada, but the portfolio remains underweight in Asia, where we have found fewer stock selection opportunities.
4
| Fund Characteristics |
| NOVEMBER 30, 2018 | |
Top Ten Holdings | % of net assets |
| BRP, Inc. | 1.7% |
| Kirkland Lake Gold Ltd. | 1.6% |
| Entertainment One Ltd. | 1.6% |
| ASR Nederland NV | 1.6% |
| Aveva Group plc | 1.5% |
| Wienerberger AG | 1.5% |
| NEXTDC Ltd. | 1.4% |
| Umicore SA | 1.4% |
| Hikma Pharmaceuticals plc | 1.4% |
| Eurofins Scientific SE | 1.3% |
Types of Investments in Portfolio | % of net assets |
| Common Stocks | 99.1% |
| Rights | 0.1% |
| Total Equity Exposure | 99.2% |
| Temporary Cash Investments | 1.3% |
| Other Assets and Liabilities | (0.5)% |
Investments by Country | % of net assets |
| Japan | 23.5% |
| United Kingdom | 21.7% |
| Canada | 9.5% |
| France | 9.4% |
| Australia | 5.6% |
| Spain | 4.0% |
| Sweden | 3.7% |
| Netherlands | 3.7% |
| Italy | 3.0% |
| Germany | 2.3% |
| Belgium | 2.2% |
| Other Countries | 10.6% |
| Cash and Equivalents* | 0.8% |
| *Includes temporary cash investments and other assets and liabilities. | |
5
| Shareholder Fee Example |
Fund shareholders may incur two types of costs: (1) transaction costs, including sales charges (loads) on purchase payments and redemption/exchange fees; and (2) ongoing costs, including management fees; distribution and service (12b-1) fees; and other fund expenses. This example is intended to help you understand your ongoing costs (in dollars) of investing in your fund and to compare these costs with the ongoing cost of investing in other mutual funds.
The example is based on an investment of $1,000 made at the beginning of the period and held for the entire period from June 1, 2018 to November 30, 2018.
Actual Expenses
The table provides information about actual account values and actual expenses for each class. You may use the information, together with the amount you invested, to estimate the expenses that you paid over the period. First, identify the share class you own. Then simply divide your account value by $1,000 (for example, an $8,600 account value divided by $1,000 = 8.6), then multiply the result by the number under the heading “Expenses Paid During Period” to estimate the expenses you paid on your account during this period.
Hypothetical Example for Comparison Purposes
The table also provides information about hypothetical account values and hypothetical expenses based on the actual expense ratio of each class of your fund and an assumed rate of return of 5% per year before expenses, which is not the actual return of a fund’s share class. The hypothetical account values and expenses may not be used to estimate the actual ending account balance or expenses you paid for the period. You may use this information to compare the ongoing costs of investing in your fund and other funds. To do so, compare this 5% hypothetical example with the 5% hypothetical examples that appear in the shareholder reports of the other funds.
Please note that the expenses shown in the table are meant to highlight your ongoing costs only and do not reflect any transactional costs, such as sales charges (loads) or redemption/exchange fees. Therefore, the table is useful in comparing ongoing costs only, and will not help you determine the relative total costs of owning different funds. In addition, if these transactional costs were included, your costs would have been higher.
| Beginning Account Value 6/1/18 | Ending Account Value 11/30/18 | Expenses Paid During Period(1) 6/1/18 - 11/30/18 | Annualized Expense Ratio(1) | |
Actual | ||||
| Investor Class | $1,000 | $787.50 | $6.59 | 1.47% |
| G Class | $1,000 | $793.50 | $0.00 | 0.00%(2) |
| Hypothetical | ||||
| Investor Class | $1,000 | $1,017.70 | $7.44 | 1.47% |
| G Class | $1,000 | $1,025.07 | $0.00 | 0.00%(2) |
| (1) | Expenses are equal to the class's annualized expense ratio listed in the table above, multiplied by the average account value over the period, multiplied by 183, the number of days in the most recent fiscal half-year, divided by 365, to reflect the one-half year period. Annualized expense ratio reflects actual expenses, including any applicable fee waivers or expense reimbursements and excluding any acquired fund fees and expenses. |
| (2) | Other expenses, which include directors' fees and expenses, did not exceed 0.005%. |
6
| Schedule of Investments |
NOVEMBER 30, 2018
| Shares | Value | ||||
| COMMON STOCKS — 99.1% | |||||
| Australia — 5.6% | |||||
Afterpay Touch Group Ltd.(1) | 105,199 | $ | 1,119,251 | ||
| Bingo Industries Ltd. | 269,320 | 438,341 | |||
| Cleanaway Waste Management Ltd. | 1,286,910 | 1,600,282 | |||
| Corporate Travel Management Ltd. | 48,565 | 819,342 | |||
NEXTDC Ltd.(1) | 622,619 | 2,946,119 | |||
| Northern Star Resources Ltd. | 253,416 | 1,480,893 | |||
| Sandfire Resources NL | 201,740 | 943,896 | |||
| Seven Group Holdings Ltd. | 197,350 | 2,296,874 | |||
| 11,644,998 | |||||
| Austria — 1.5% | |||||
| Wienerberger AG | 134,590 | 3,020,561 | |||
| Belgium — 2.2% | |||||
Galapagos NV(1) | 15,509 | 1,577,552 | |||
| Umicore SA | 67,810 | 2,944,284 | |||
| 4,521,836 | |||||
| Canada — 9.5% | |||||
| Altus Group Ltd. | 24,890 | 493,435 | |||
Bombardier, Inc., B Shares(1) | 1,038,260 | 1,734,796 | |||
| BRP, Inc. | 100,583 | 3,583,787 | |||
Canada Goose Holdings, Inc.(1) | 40,360 | 2,718,246 | |||
| Colliers International Group, Inc. | 39,490 | 2,600,666 | |||
Descartes Systems Group, Inc. (The)(1) | 58,370 | 1,719,052 | |||
Interfor Corp.(1) | 68,370 | 771,874 | |||
Kelt Exploration Ltd.(1) | 271,164 | 893,914 | |||
| Kirkland Lake Gold Ltd. | 161,450 | 3,346,504 | |||
Parex Resources, Inc.(1) | 93,270 | 1,151,967 | |||
Trevali Mining Corp.(1) | 1,505,870 | 504,356 | |||
| 19,518,597 | |||||
| China — 1.8% | |||||
| China Resources Beer Holdings Co. Ltd. | 644,000 | 2,180,862 | |||
| China Resources Cement Holdings Ltd. | 1,574,000 | 1,536,513 | |||
| 3,717,375 | |||||
| Denmark — 1.0% | |||||
| DSV A/S | 26,414 | 2,021,620 | |||
| France — 9.4% | |||||
| Eurofins Scientific SE | 6,390 | 2,780,861 | |||
| Euronext NV | 37,160 | 2,176,208 | |||
| Gaztransport Et Technigaz SA | 24,530 | 1,833,770 | |||
| Korian SA | 46,400 | 1,795,796 | |||
SOITEC(1) | 17,239 | 1,059,002 | |||
Solutions 30 SE(1) | 175,108 | 1,816,259 | |||
7
| Shares | Value | ||||
| Teleperformance | 15,387 | $ | 2,554,441 | ||
| Trigano SA | 9,960 | 1,052,190 | |||
Ubisoft Entertainment SA(1) | 31,641 | 2,591,244 | |||
Worldline SA(1) | 31,720 | 1,695,973 | |||
| 19,355,744 | |||||
| Germany — 2.3% | |||||
| Aroundtown SA | 261,931 | 2,245,898 | |||
| AURELIUS Equity Opportunities SE & Co. KGaA | 21,800 | 957,434 | |||
| Rheinmetall AG | 17,831 | 1,651,682 | |||
| 4,855,014 | |||||
| Hong Kong — 1.1% | |||||
| Melco International Development Ltd. | 1,115,000 | 2,248,998 | |||
| Ireland — 0.7% | |||||
| Dalata Hotel Group plc | 273,900 | 1,445,354 | |||
| Israel — 1.0% | |||||
Nice Ltd. ADR(1) | 17,860 | 2,074,260 | |||
| Italy — 3.0% | |||||
| Amplifon SpA | 148,618 | 2,498,211 | |||
| FinecoBank Banca Fineco SpA | 109,890 | 1,178,963 | |||
| IMA Industria Macchine Automatiche SpA | 15,094 | 938,745 | |||
| Saras SpA | 812,490 | 1,574,344 | |||
| 6,190,263 | |||||
| Japan — 23.5% | |||||
| Ain Holdings, Inc. | 21,400 | 1,653,844 | |||
| Anritsu Corp. | 140,500 | 2,305,584 | |||
| Cosmos Pharmaceutical Corp. | 11,700 | 2,379,776 | |||
| GMO Payment Gateway, Inc. | 25,600 | 1,578,052 | |||
| Ichikoh Industries Ltd. | 175,500 | 1,151,458 | |||
| KH Neochem Co. Ltd. | 79,300 | 2,127,195 | |||
| Kose Corp. | 6,600 | 985,482 | |||
| Modec, Inc. | 76,500 | 1,903,823 | |||
| Nabtesco Corp. | 43,100 | 1,193,584 | |||
| Nextage Co. Ltd. | 105,000 | 1,110,085 | |||
| Nihon Kohden Corp. | 47,800 | 1,564,469 | |||
| Nihon M&A Center, Inc. | 102,700 | 2,397,380 | |||
| Orix JREIT, Inc. | 770 | 1,252,865 | |||
| Outsourcing, Inc. | 166,300 | 2,101,617 | |||
PeptiDream, Inc.(1) | 48,300 | 1,980,981 | |||
| Pigeon Corp. | 25,600 | 1,055,274 | |||
| Pressance Corp. | 141,900 | 1,771,536 | |||
| Relo Group, Inc. | 73,300 | 2,014,676 | |||
| Rengo Co. Ltd. | 230,700 | 1,957,804 | |||
| Round One Corp. | 135,100 | 1,499,590 | |||
| Sankyu, Inc. | 38,000 | 1,781,891 | |||
| Sawai Pharmaceutical Co. Ltd. | 32,300 | 1,707,892 | |||
| SHO-BOND Holdings Co. Ltd. | 18,200 | 1,394,882 | |||
| Solasto Corp. | 95,500 | 1,215,752 | |||
8
| Shares | Value | ||||
| Systena Corp. | 175,000 | $ | 2,252,345 | ||
| Tokai Carbon Co. Ltd. | 176,300 | 2,447,684 | |||
| Trust Tech, Inc. | 59,300 | 1,704,521 | |||
| Tsubakimoto Chain Co. | 51,700 | 1,933,370 | |||
| 48,423,412 | |||||
| Netherlands — 3.7% | |||||
| AMG Advanced Metallurgical Group NV | 55,750 | 2,471,791 | |||
| ASR Nederland NV | 75,960 | 3,287,498 | |||
InterXion Holding NV(1) | 29,808 | 1,856,144 | |||
| 7,615,433 | |||||
| New Zealand — 1.0% | |||||
a2 Milk Co. Ltd.(1) | 286,460 | 2,054,720 | |||
| Norway — 0.9% | |||||
| Aker BP ASA | 63,200 | 1,799,581 | |||
| Spain — 4.0% | |||||
| Applus Services SA | 145,930 | 1,754,424 | |||
| Cellnex Telecom SA | 86,656 | 2,407,815 | |||
| Ence Energia y Celulosa SA | 293,030 | 1,858,841 | |||
| Inmobiliaria Colonial Socimi SA | 218,150 | 2,193,077 | |||
| 8,214,157 | |||||
| Sweden — 3.6% | |||||
| Elekta AB, B Shares | 92,124 | 1,113,331 | |||
Epiroc AB, A Shares(1) | 208,243 | 1,708,999 | |||
| Saab AB, B Shares | 41,900 | 1,679,934 | |||
| SSAB AB, A Shares | 376,780 | 1,348,249 | |||
| Thule Group AB | 90,370 | 1,693,126 | |||
| 7,543,639 | |||||
| Switzerland — 1.6% | |||||
| Georg Fischer AG | 1,360 | 1,058,461 | |||
Siegfried Holding AG(1) | 6,180 | 2,205,883 | |||
| 3,264,344 | |||||
| United Kingdom — 21.7% | |||||
| Ashtead Group plc | 76,650 | 1,720,041 | |||
Avast plc(1) | 426,350 | 1,489,314 | |||
| Aveva Group plc | 92,616 | 3,027,358 | |||
| B&M European Value Retail SA | 457,563 | 2,037,334 | |||
| Beazley plc | 143,902 | 1,025,924 | |||
| Burford Capital Ltd. | 135,012 | 2,620,272 | |||
Coca-Cola HBC AG(1) | 53,940 | 1,604,897 | |||
| Dechra Pharmaceuticals plc | 41,420 | 1,142,916 | |||
| Electrocomponents plc | 300,350 | 1,970,794 | |||
| Entertainment One Ltd. | 713,482 | 3,345,148 | |||
| Fevertree Drinks plc | 28,690 | 875,029 | |||
| Hikma Pharmaceuticals plc | 123,790 | 2,820,656 | |||
| HomeServe plc | 183,380 | 2,222,741 | |||
| IG Group Holdings plc | 273,100 | 2,059,477 | |||
| Intermediate Capital Group plc | 171,830 | 2,223,981 | |||
9
| Shares | Value | ||||
| JD Sports Fashion plc | 317,760 | $ | 1,606,548 | ||
| KAZ Minerals plc | 129,460 | 910,483 | |||
| Keywords Studios plc | 71,097 | 1,116,132 | |||
| Melrose Industries plc | 1,221,130 | 2,765,392 | |||
| NMC Health plc | 38,450 | 1,624,267 | |||
Nomad Foods Ltd.(1) | 20,660 | 417,745 | |||
| Rentokil Initial plc | 503,290 | 2,124,094 | |||
Seadrill Ltd.(1) | 69,390 | 945,786 | |||
| Segro plc | 150,880 | 1,162,893 | |||
| UNITE Group plc (The) | 180,450 | 1,918,425 | |||
| 44,777,647 | |||||
TOTAL COMMON STOCKS (Cost $215,812,740) | 204,307,553 | ||||
| RIGHTS — 0.1% | |||||
| Sweden — 0.1% | |||||
Saab AB(1) (Cost $—) | 41,900 | 164,679 | |||
| TEMPORARY CASH INVESTMENTS — 1.3% | |||||
| Repurchase Agreement, BMO Capital Markets Corp., (collateralized by various U.S. Treasury obligations, 1.125% - 3.125%, 5/31/19 - 11/15/28, valued at $2,293,952), in a joint trading account at 2.00%, dated 11/30/18, due 12/3/18 (Delivery value $2,249,236) | 2,248,861 | ||||
| Repurchase Agreement, Fixed Income Clearing Corp., (collateralized by various U.S. Treasury obligations, 3.375%, 11/15/48, valued at $510,165), at 1.05%, dated 11/30/18, due 12/3/18 (Delivery value $500,044) | 500,000 | ||||
| State Street Institutional U.S. Government Money Market Fund, Premier Class | 1,218 | 1,218 | |||
TOTAL TEMPORARY CASH INVESTMENTS (Cost $2,750,079) | 2,750,079 | ||||
TOTAL INVESTMENT SECURITIES — 100.5% (Cost $218,562,819) | 207,222,311 | ||||
| OTHER ASSETS AND LIABILITIES — (0.5)% | (1,122,567 | ) | |||
| TOTAL NET ASSETS — 100.0% | $ | 206,099,744 | |||
| MARKET SECTOR DIVERSIFICATION | ||
(as a % of net assets) | ||
| Industrials | 19.7 | % |
| Information Technology | 13.5 | % |
| Materials | 13.4 | % |
| Health Care | 11.7 | % |
| Consumer Discretionary | 11.0 | % |
| Financials | 7.6 | % |
| Real Estate | 6.8 | % |
| Consumer Staples | 6.4 | % |
| Energy | 5.0 | % |
| Communication Services | 4.1 | % |
| Cash and Equivalents* | 0.8 | % |
*Includes temporary cash investments and other assets and liabilities.
10
| NOTES TO SCHEDULE OF INVESTMENTS | ||
| ADR | - | American Depositary Receipt |
| (1) | Non-income producing. |
See Notes to Financial Statements.
11
| Statement of Assets and Liabilities |
| NOVEMBER 30, 2018 | |||
| Assets | |||
| Investment securities, at value (cost of $218,562,819) | $ | 207,222,311 | |
| Foreign currency holdings, at value (cost of $42,142) | 42,030 | ||
| Receivable for investments sold | 620,772 | ||
| Receivable for capital shares sold | 2,241 | ||
| Dividends and interest receivable | 348,393 | ||
| 208,235,747 | |||
| Liabilities | |||
| Payable for investments purchased | 2,055,259 | ||
| Accrued management fees | 80,744 | ||
| 2,136,003 | |||
| Net Assets | $ | 206,099,744 | |
| Net Assets Consist of: | |||
| Capital (par value and paid-in surplus) | $ | 183,500,988 | |
| Distributable earnings | 22,598,756 | ||
| $ | 206,099,744 | ||
| Net Assets | Shares Outstanding | Net Asset Value Per Share | ||||
| Investor Class, $0.01 Par Value | $66,042,353 | 6,253,687 | $10.56 | |||
| G Class, $0.01 Par Value | $140,057,391 | 13,066,906 | $10.72 | |||
See Notes to Financial Statements.
12
| Statement of Operations |
| YEAR ENDED NOVEMBER 30, 2018 | |||
| Investment Income (Loss) | |||
| Income: | |||
| Dividends (net of foreign taxes withheld of $360,886) | $ | 3,672,894 | |
| Interest | 35,188 | ||
| 3,708,082 | |||
| Expenses: | |||
| Management fees | 2,945,105 | ||
| Directors' fees and expenses | 6,656 | ||
| Other expenses | 4,908 | ||
| 2,956,669 | |||
| Fees waived - G Class | (1,780,734 | ) | |
| 1,175,935 | |||
| Net investment income (loss) | 2,532,147 | ||
| Realized and Unrealized Gain (Loss) | |||
| Net realized gain (loss) on: | |||
| Investment transactions | 33,875,040 | ||
| Foreign currency translation transactions | (86,324 | ) | |
| 33,788,716 | |||
| Change in net unrealized appreciation (depreciation) on: | |||
| Investments | (65,508,409 | ) | |
| Translation of assets and liabilities in foreign currencies | (6,833 | ) | |
| (65,515,242 | ) | ||
| Net realized and unrealized gain (loss) | (31,726,526 | ) | |
| Net Increase (Decrease) in Net Assets Resulting from Operations | $ | (29,194,379 | ) |
See Notes to Financial Statements.
13
| Statement of Changes in Net Assets |
| YEARS ENDED NOVEMBER 30, 2018 AND NOVEMBER 30, 2017 | ||||||
| Increase (Decrease) in Net Assets | November 30, 2018 | November 30, 2017 | ||||
| Operations | ||||||
| Net investment income (loss) | $ | 2,532,147 | $ | 859,795 | ||
| Net realized gain (loss) | 33,788,716 | 30,770,432 | ||||
| Change in net unrealized appreciation (depreciation) | (65,515,242 | ) | 38,759,498 | |||
| Net increase (decrease) in net assets resulting from operations | (29,194,379 | ) | 70,389,725 | |||
| Distributions to Shareholders | ||||||
| From earnings: | ||||||
| Investor Class | (5,214,906 | ) | — | |||
| G Class | (12,170,408 | ) | (229,198 | ) | ||
| R6 Class | — | (48,848 | ) | |||
| Decrease in net assets from distributions | (17,385,314 | ) | (278,046 | ) | ||
| Capital Share Transactions | ||||||
| Net increase (decrease) in net assets from capital share transactions (Note 5) | 3,241,291 | (31,989,073 | ) | |||
| Net increase (decrease) in net assets | (43,338,402 | ) | 38,122,606 | |||
| Net Assets | ||||||
| Beginning of period | 249,438,146 | 211,315,540 | ||||
| End of period | $ | 206,099,744 | $ | 249,438,146 | ||
See Notes to Financial Statements.
14
| Notes to Financial Statements |
NOVEMBER 30, 2018
1. Organization
American Century World Mutual Funds, Inc. (the corporation) is registered under the Investment Company Act of 1940, as amended (the 1940 Act), as an open-end management investment company and is organized as a Maryland corporation. NT International Small-Mid Cap Fund (the fund) is one fund in a series issued by the corporation. The fund’s investment objective is to seek capital growth. The fund is not permitted to invest in securities issued by companies assigned the Global Industry Classification Standard or the Bloomberg Industry Classification Standard for the tobacco industry. The fund offers the Investor Class and G Class. On July 31, 2017, all outstanding R6 Class shares were converted to G Class shares and the fund discontinued offering the R6 Class.
2. Significant Accounting Policies
The following is a summary of significant accounting policies consistently followed by the fund in preparation of its financial statements. The fund is an investment company and follows accounting and reporting guidance in accordance with accounting principles generally accepted in the United States of America. This may require management to make certain estimates and assumptions at the date of the financial statements. Actual results could differ from these estimates. Management evaluated the impact of events or transactions occurring through the date the financial statements were issued that would merit recognition or disclosure.
Investment Valuations — The fund determines the fair value of its investments and computes its net asset value per share at the close of regular trading (usually 4 p.m. Eastern time) on the New York Stock Exchange (NYSE) on each day the NYSE is open. The Board of Directors has adopted valuation policies and procedures to guide the investment advisor in the fund’s investment valuation process and to provide methodologies for the oversight of the fund’s pricing function.
Equity securities that are listed or traded on a domestic securities exchange are valued at the last reported sales price or at the official closing price as provided by the exchange. Equity securities traded on foreign securities exchanges are generally valued at the closing price of such securities on the exchange where primarily traded or at the close of the NYSE, if that is earlier. If no last sales price is reported, or if local convention or regulation so provides, the mean of the latest bid and asked prices may be used. Securities traded over-the-counter are valued at the mean of the latest bid and asked prices, the last sales price, or the official closing price. Equity securities initially expressed in local currencies are translated into U.S. dollars at the mean of the appropriate currency exchange rate at the close of the NYSE as provided by an independent pricing service.
Open-end management investment companies are valued at the reported net asset value per share. Repurchase agreements are valued at cost, which approximates fair value.
If the fund determines that the market price for an investment is not readily available or the valuation methods mentioned above do not reflect an investment’s fair value, such investment is valued as determined in good faith by the Board of Directors or its delegate, in accordance with policies and procedures adopted by the Board of Directors. In its determination of fair value, the fund may review several factors including, but not limited to, market information regarding the specific investment or comparable investments and correlation with other investment types, futures indices or general market indicators. Circumstances that may cause the fund to use these procedures to value an investment include, but are not limited to: an investment has been declared in default or is distressed; trading in a security has been suspended during the trading day or a security is not actively trading on its principal exchange; prices received from a regular pricing source are deemed unreliable; or there is a foreign market holiday and no trading occurred.
15
The fund monitors for significant events occurring after the close of an investment’s primary exchange but before the fund’s net asset value per share is determined. Significant events may include, but are not limited to: corporate announcements and transactions; governmental action and political unrest that could impact a specific investment or an investment sector; or armed conflicts, natural disasters and similar events that could affect investments in a specific country or region. The fund also monitors for significant fluctuations between domestic and foreign markets, as evidenced by the U.S. market or such other indicators that the Board of Directors, or its delegate, deems appropriate. If significant fluctuations in foreign markets are identified, the fund may apply a model-derived factor to the closing price of equity securities traded on foreign securities exchanges. The factor is based on observable market data as provided by an independent pricing service.
Security Transactions — Security transactions are accounted for as of the trade date. Net realized gains and losses are determined on the identified cost basis, which is also used for federal income tax purposes.
Investment Income — Dividend income less foreign taxes withheld, if any, is recorded as of the ex-dividend date. Distributions received on securities that represent a return of capital or long-term capital gain are recorded as a reduction of cost of investments and/or as a realized gain. The fund may estimate the components of distributions received that may be considered nontaxable distributions or long-term capital gain distributions for income tax purposes. Interest income is recorded on the accrual basis and includes accretion of discounts and amortization of premiums.
Foreign Currency Translations — All assets and liabilities initially expressed in foreign currencies are translated into U.S. dollars at prevailing exchange rates at period end. The fund may enter into spot foreign currency exchange contracts to facilitate transactions denominated in a foreign currency. Purchases and sales of investment securities, dividend and interest income, spot foreign currency exchange contracts, and expenses are translated at the rates of exchange prevailing on the respective dates of such transactions. Net realized and unrealized foreign currency exchange gains or losses related to investment securities are a component of net realized gain (loss) on investment transactions and change in net unrealized appreciation (depreciation) on investments, respectively.
Repurchase Agreements — The fund may enter into repurchase agreements with institutions that American Century Investment Management, Inc. (ACIM) (the investment advisor) has determined are creditworthy pursuant to criteria adopted by the Board of Directors. The fund requires that the collateral, represented by securities, received in a repurchase transaction be transferred to the custodian in a manner sufficient to enable the fund to obtain those securities in the event of a default under the repurchase agreement. ACIM monitors, on a daily basis, the securities transferred to ensure the value, including accrued interest, of the securities under each repurchase agreement is equal to or greater than amounts owed to the fund under each repurchase agreement.
Joint Trading Account — Pursuant to an Exemptive Order issued by the Securities and Exchange Commission, the fund, along with certain other funds in the American Century Investments family of funds, may transfer uninvested cash balances into a joint trading account. These balances are invested in one or more repurchase agreements that are collateralized by U.S. Treasury or Agency obligations.
Income Tax Status — It is the fund’s policy to distribute substantially all net investment income and net realized gains to shareholders and to otherwise qualify as a regulated investment company under provisions of the Internal Revenue Code. Accordingly, no provision has been made for income taxes. The fund files U.S. federal, state, local and non-U.S. tax returns as applicable. The fund's tax returns are subject to examination by the relevant taxing authority until expiration of the applicable statute of limitations, which is generally three years from the date of filing but can be longer in certain jurisdictions. At this time, management believes there are no uncertain tax positions which, based on their technical merit, would not be sustained upon examination and for which it is reasonably possible that the total amounts of unrecognized tax benefits will significantly change in the next twelve months.
Multiple Class — All shares of the fund represent an equal pro rata interest in the net assets of the class to which such shares belong, and have identical voting, dividend, liquidation and other rights and the same terms and conditions, except for class specific expenses and exclusive rights to vote on matters affecting only individual classes. Income, non-class specific expenses, and realized and unrealized capital gains and losses of the fund are allocated to each class of shares based on their relative net assets.
Distributions to Shareholders — Distributions from net investment income and net realized gains, if any, are generally declared and paid annually. The fund may make distributions on a more frequent basis to comply with the distribution requirements of the Internal Revenue Code, in all events in a manner consistent with provisions of the 1940 Act.
16
Indemnifications — Under the corporation’s organizational documents, its officers and directors are indemnified against certain liabilities arising out of the performance of their duties to the fund. In addition, in the normal course of business, the fund enters into contracts that provide general indemnifications. The maximum exposure under these arrangements is unknown as this would involve future claims that may be made against a fund. The risk of material loss from such claims is considered by management to be remote.
3. Fees and Transactions with Related Parties
Certain officers and directors of the corporation are also officers and/or directors of American Century Companies, Inc. (ACC). The corporation’s investment advisor, ACIM, the corporation's distributor, American Century Investment Services, Inc., and the corporation’s transfer agent, American Century Services, LLC, are wholly owned, directly or indirectly, by ACC. Various funds issued by American Century Asset Allocation Portfolios, Inc. own, in aggregate, 100% of the shares of the fund. Related parties do not invest in the fund for the purpose of exercising management or control.
Management Fees —The corporation has entered into a management agreement with ACIM, under which ACIM provides the fund with investment advisory and management services in exchange for a single, unified management fee (the fee) per class. The agreement provides that all expenses of managing and operating the fund, except brokerage expenses, taxes, interest, fees and expenses of the independent directors (including legal counsel fees), and extraordinary expenses, will be paid by ACIM. The fee is computed and accrued daily based on each class's daily net assets and paid monthly in arrears. The difference in the fee among the classes is a result of their separate arrangements for non-Rule 12b-1 shareholder services, which may be provided indirectly through another American Century Investments mutual fund. It is not the result of any difference in advisory or custodial fees or other expenses related to the management of the fund’s assets, which do not vary by class. The investment advisor agreed to waive the G Class’s management fee in its entirety. The investment advisor expects this waiver to remain in effect permanently and cannot terminate it without the approval of the Board of Directors.
The annual management fee for each class is as follows:
| Investor Class | G Class |
| 1.47% | 0.00%(1) |
| (1) | Annual management fee before waiver was 1.12%. |
Directors' Fees and Expenses — The Board of Directors is responsible for overseeing the investment advisor’s management and operations of the fund. The directors receive detailed information about the fund and its investment advisor regularly throughout the year, and meet at least quarterly with management of the investment advisor to review reports about fund operations. The fund’s officers do not receive compensation from the fund.
Interfund Transactions — The fund may enter into security transactions with other American Century Investments funds and other client accounts of the investment advisor, in accordance with the 1940 Act rules and procedures adopted by the Board of Directors. The rules and procedures require, among other things, that these transactions be effected at the independent current market price of the security. During the period, the interfund sales were $199,564 and there were no interfund purchases. The effect of interfund transactions on the Statement of Operations was $(25,899) in net realized gain (loss) on investment transactions.
4. Investment Transactions
Purchases and sales of investment securities, excluding short-term investments, for the period ended November 30, 2018 were $329,920,612 and $337,675,561, respectively.
17
5. Capital Share Transactions
Transactions in shares of the fund were as follows:
| Year ended November 30, 2018 | Year ended November 30, 2017 | |||||||||
| Shares | Amount | Shares | Amount | |||||||
| Investor Class/Shares Authorized | 80,000,000 | 80,000,000 | ||||||||
| Sold | 119,310 | $ | 1,527,631 | 185,865 | $ | 1,926,572 | ||||
| Issued in reinvestment of distributions | 404,215 | 5,214,906 | — | — | ||||||
| Redeemed | (81,134 | ) | (1,058,906 | ) | (668,963 | ) | (8,684,935 | ) | ||
| 442,391 | 5,683,631 | (483,098 | ) | (6,758,363 | ) | |||||
| G Class/Shares Authorized | 140,000,000 | 140,000,000 | ||||||||
| Sold | 1,614,756 | 19,145,913 | 2,156,750 | 25,135,249 | ||||||
| Issued in reinvestment of distributions | 935,115 | 12,170,408 | 23,435 | 229,198 | ||||||
| Redeemed | (2,540,006 | ) | (33,758,661 | ) | (2,806,216 | ) | (33,432,000 | ) | ||
| 9,865 | (2,442,340 | ) | (626,031 | ) | (8,067,553 | ) | ||||
| R6 Class/Shares Authorized | N/A | N/A | ||||||||
| Sold | 442,046 | 4,634,032 | ||||||||
| Issued in reinvestment of distributions | 4,995 | 48,848 | ||||||||
| Redeemed | (1,837,661 | ) | (21,846,037 | ) | ||||||
| (1,390,620 | ) | (17,163,157 | ) | |||||||
| Net increase (decrease) | 452,256 | $ | 3,241,291 | (2,499,749 | ) | $ | (31,989,073 | ) | ||
6. Fair Value Measurements
The fund’s investments valuation process is based on several considerations and may use multiple inputs to determine the fair value of the investments held by the fund. In conformity with accounting principles generally accepted in the United States of America, the inputs used to determine a valuation are classified into three broad levels.
| • | Level 1 valuation inputs consist of unadjusted quoted prices in an active market for identical investments. |
| • | Level 2 valuation inputs consist of direct or indirect observable market data (including quoted prices for comparable investments, evaluations of subsequent market events, interest rates, prepayment speeds, credit risk, etc.). These inputs also consist of quoted prices for identical investments initially expressed in local currencies that are adjusted through translation into U.S. dollars. |
| • | Level 3 valuation inputs consist of unobservable data (including a fund’s own assumptions). |
The level classification is based on the lowest level input that is significant to the fair valuation measurement. The valuation inputs are not necessarily an indication of the risks associated with investing in these securities or other financial instruments.
The following is a summary of the level classifications as of period end. The Schedule of Investments provides additional information on the fund’s portfolio holdings.
| Level 1 | Level 2 | Level 3 | ||||||
| Assets | ||||||||
| Investment Securities | ||||||||
| Common Stocks | $ | 8,012,181 | $ | 196,295,372 | — | |||
| Rights | — | 164,679 | — | |||||
| Temporary Cash Investments | 1,218 | 2,748,861 | — | |||||
| $ | 8,013,399 | $ | 199,208,912 | — | ||||
18
7. Risk Factors
There are certain risks involved in investing in foreign securities. These risks include those resulting from future adverse political, social and economic developments, fluctuations in currency exchange rates, the possible imposition of exchange controls, and other foreign laws or restrictions.
The fund invests in common stocks of small companies. Because of this, the fund may be subject to greater risk and market fluctuations than a fund investing in larger, more established companies.
The fund’s investment process may result in high portfolio turnover, which could mean high transaction costs, affecting both performance and capital gains tax liabilities to investors.
8. Federal Tax Information
On December 18, 2018, the fund declared and paid the following per-share distributions from net investment income to shareholders of record on December 17, 2018:
| Investor Class | G Class |
| $0.0394 | $0.1838 |
On December 18, 2018, the fund declared and paid a per-share distributions from net realized gains to shareholders of record on December 17, 2018 of $1.0587 for the Investor Class and G Class.
The tax character of distributions paid during the years ended November 30, 2018 and November 30, 2017 were as follows:
| 2018 | 2017 | |||||
| Distributions Paid From | ||||||
| Ordinary income | $ | 3,086,384 | $ | 278,046 | ||
| Long-term capital gains | $ | 14,298,930 | — | |||
The book-basis character of distributions made during the year from net investment income or net realized gains may differ from their ultimate characterization for federal income tax purposes. These differences reflect the differing character of certain income items and net realized gains and losses for financial statement and tax purposes, and may result in reclassification among certain capital accounts on the financial statements.
As of period end, the federal tax cost of investments and the components of distributable earnings on a tax-basis were as follows:
| Federal tax cost of investments | $ | 222,292,868 | |
| Gross tax appreciation of investments | $ | 11,141,743 | |
| Gross tax depreciation of investments | (26,212,300 | ) | |
| Net tax appreciation (depreciation) of investments | (15,070,557 | ) | |
| Net tax appreciation (depreciation) on translation of assets and liabilities in foreign currencies | (73 | ) | |
| Net tax appreciation (depreciation) | $ | (15,070,630 | ) |
| Undistributed ordinary income | $ | 7,269,770 | |
| Accumulated long-term gains | $ | 30,867,623 | |
| Post-October capital loss deferral | $ | (468,007 | ) |
The difference between book-basis and tax-basis unrealized appreciation (depreciation) is attributable primarily to the tax deferral of losses on wash sales.
Loss deferrals represent certain qualified losses that the fund has elected to treat as having been incurred in the following fiscal year for federal income tax purposes.
19
| Financial Highlights |
| For a Share Outstanding Throughout the Years Ended November 30 (except as noted) | |||||||||||||||
| Per-Share Data | Ratios and Supplemental Data | ||||||||||||||
| Income From Investment Operations: | Distributions From: | Ratio to Average Net Assets of: | |||||||||||||
Net Asset Value, Beginning of Period | Net Investment Income (Loss)(1) | Net Realized and Unrealized Gain (Loss) | Total From Investment Operations | Net Investment Income | Net Realized Gains | Total Distributions | Net Asset Value, End of Period | Total Return(2) | Operating Expenses | Net Investment Income (Loss) | Portfolio Turnover Rate | Net Assets, End of Period (in thousands) | |||
| Investor Class | |||||||||||||||
| 2018 | $13.16 | 0.01 | (1.73) | (1.72) | (0.11) | (0.77) | (0.88) | $10.56 | (14.20)% | 1.47% | 0.09% | 140% | $66,042 | ||
| 2017 | $9.88 | (0.01) | 3.29 | 3.28 | — | — | — | $13.16 | 33.20% | 1.48% | (0.10)% | 122% | $76,484 | ||
| 2016 | $10.29 | (0.01) | (0.33) | (0.34) | (0.07) | — | (0.07) | $9.88 | (3.12)% | 1.47% | (0.07)% | 138% | $62,162 | ||
2015(3) | $10.00 | 0.02 | 0.27 | 0.29 | — | — | — | $10.29 | 2.70% | 1.47%(4) | 0.32%(4) | 118% | $65,428 | ||
| G Class | |||||||||||||||
| 2018 | $13.25 | 0.20 | (1.76) | (1.56) | (0.20) | (0.77) | (0.97) | $10.72 | (12.95)% | 0.00%(5)(6) | 1.56%(5) | 140% | $140,057 | ||
| 2017 | $9.89 | 0.06 | 3.32 | 3.38 | (0.02) | — | (0.02) | $13.25 | 34.20% | 0.80%(7) | 0.58%(7) | 122% | $172,954 | ||
| 2016 | $10.30 | 0.01 | (0.33) | (0.32) | (0.09) | — | (0.09) | $9.89 | (2.97)% | 1.27% | 0.13% | 138% | $135,377 | ||
2015(3) | $10.00 | 0.04 | 0.26 | 0.30 | — | — | — | $10.30 | 2.80% | 1.27%(4) | 0.52%(4) | 118% | $133,255 | ||
| Notes to Financial Highlights |
| (1) | Computed using average shares outstanding throughout the period. |
| (2) | Total returns are calculated based on the net asset value of the last business day. Total returns for periods less than one year are not annualized. |
| (3) | March 19, 2015 (fund inception) through November 30, 2015. |
| (4) | Annualized. |
| (5) | The ratio of operating expenses to average net assets before expense waiver and the ratio of net investment income (loss) to average net assets before expense waiver was 1.12% and 0.44%, respectively. |
| (6) | Ratio was less than 0.005%. |
| (7) | The ratio of operating expenses to average net assets before expense waiver and the ratio of net investment income (loss) to average net assets before expense waiver was 1.22% and 0.16%, respectively. |
See Notes to Financial Statements.
| Report of Independent Registered Public Accounting Firm |
To the Shareholders and the Board of Directors of American Century World Mutual Funds, Inc.:
Opinion on the Financial Statements and Financial Highlights
We have audited the accompanying statement of assets and liabilities, including the schedule of investments, of NT International Small-Mid Cap Fund, one of the funds constituting the American Century World Mutual Funds, Inc. (the “Fund”), as of November 30, 2018, the related statement of operations for the year then ended, the statements of changes in net assets for each of the two years in the period then ended, the financial highlights for the years ended November 30, 2018, November 30, 2017, November 30, 2016, and for the period March 19, 2015 (fund inception) through November 30, 2015, and the related notes. In our opinion, the financial statements and financial highlights present fairly, in all material respects, the financial position of NT International Small-Mid Cap Fund of the American Century World Mutual Funds, Inc. as of November 30, 2018, the results of its operations for the year then ended, the changes in its net assets for each of the two years in the period then ended, and the financial highlights for the years ended November 30, 2018, November 30, 2017, November 30, 2016, and for the period March 19, 2015 (fund inception) through November 30, 2015, in conformity with accounting principles generally accepted in the United States of America.
Basis for Opinion
These financial statements and financial highlights are the responsibility of the Fund's management. Our responsibility is to express an opinion on the Fund’s financial statements and financial highlights based on our audits. We are a public accounting firm registered with the Public Company Accounting Oversight Board (United States) (PCAOB) and are required to be independent with respect to the Fund in accordance with the U.S. federal securities laws and the applicable rules and regulations of the Securities and Exchange Commission and the PCAOB.
We conducted our audits in accordance with the standards of the PCAOB. Those standards require that we plan and perform the audit to obtain reasonable assurance about whether the financial statements and financial highlights are free of material misstatement, whether due to error or fraud. The Fund is not required to have, nor were we engaged to perform, an audit of its internal control over financial reporting. As part of our audits we are required to obtain an understanding of internal control over financial reporting but not for the purpose of expressing an opinion on the effectiveness of the Fund’s internal control over financial reporting. Accordingly, we express no such opinion.
Our audits included performing procedures to assess the risks of material misstatement of the financial statements and financial highlights, whether due to error or fraud, and performing procedures that respond to those risks. Such procedures included examining, on a test basis, evidence regarding the amounts and disclosures in the financial statements and financial highlights. Our audits also included evaluating the accounting principles used and significant estimates made by management, as well as evaluating the overall presentation of the financial statements and financial highlights. Our procedures included confirmation of securities owned as of November 30, 2018, by correspondence with the custodian and brokers; when replies were not received from brokers, we performed other auditing procedures. We believe that our audits provide a reasonable basis for our opinion.
DELOITTE & TOUCHE LLP
Kansas City, Missouri
January 17, 2019
We have served as the auditor of one or more American Century investment companies since 1997.
22
| Management |
The Board of Directors
The individuals listed below serve as directors of the funds. Each director will continue to serve in this capacity until death, retirement, resignation or removal from office. The board has adopted a mandatory retirement age for directors who are not “interested persons,” as that term is defined in the Investment Company Act (independent directors). Independent directors shall retire by December 31 of the year in which they reach their 75th birthday.
Mr. Thomas is an “interested person” because he currently serves as President and Chief Executive Officer of American Century Companies, Inc. (ACC), the parent company of American Century Investment Management, Inc. (ACIM or the advisor). The other directors (more than three-fourths of the total number) are independent. They are not employees, directors or officers of, and have no financial interest in, ACC or any of its wholly owned, direct or indirect, subsidiaries, including ACIM, American Century Investment Services, Inc. (ACIS) and American Century Services, LLC (ACS), and they do not have any other affiliations, positions or relationships that would cause them to be considered “interested persons” under the Investment Company Act. The directors serve in this capacity for seven (in the case of Jonathan S. Thomas, 16; and Stephen E. Yates, 8) registered investment companies in the American Century Investments family of funds.
The following table presents additional information about the directors. The mailing address for each director is 4500 Main Street, Kansas City, Missouri 64111.
| Name (Year of Birth) | Position(s) Held with Funds | Length of Time Served | Principal Occupation(s) During Past 5 Years | Number of American Century Portfolios Overseen by Director | Other Directorships Held During Past 5 Years |
| Independent Directors | |||||
| Thomas W. Bunn (1953) | Director | Since 2017 | Retired | 68 | SquareTwo Financial; Barings (formerly Babson Capital Funds Trust) (2013 to 2016) |
| Barry Fink (1955) | Director | Since 2012 (independent since 2016) | Retired; Executive Vice President, ACC (2007 to 2013); President, ACS (2007 to 2013) | 68 | None |
| Jan M. Lewis (1957) | Director | Since 2011 | Retired; President and Chief Executive Officer, Catholic Charities of Northeast Kansas (human services organization) (2006 to 2013) | 68 | None |
M. Jeannine Strandjord(1) (1945) | Director | Since 1994 | Self-employed Consultant | 68 | Euronet Worldwide Inc. and MGP Ingredients, Inc. |
23
| Name (Year of Birth) | Position(s) Held with Funds | Length of Time Served | Principal Occupation(s) During Past 5 Years | Number of American Century Portfolios Overseen by Director | Other Directorships Held During Past 5 Years |
| Independent Directors | |||||
| John R. Whitten (1946) | Director | Since 2008 | Retired | 68 | Rudolph Technologies, Inc. |
| Stephen E. Yates (1948) | Director and Chairman of the Board | Since 2012 (Chairman since 2018) | Retired | 73 | None |
| Interested Director | |||||
| Jonathan S. Thomas (1963) | Director and President | Since 2007 | President and Chief Executive Officer, ACC (2007 to present). Also serves as Chief Executive Officer, ACS; Executive Vice President, ACIM; Director, ACC, ACIM and other ACC subsidiaries | 118 | BioMed Valley Discoveries, Inc. |
(1) Effective December 31, 2018, M. Jeannine Strandjord retired from the Board of Directors.
The Statement of Additional Information has additional information about the fund's directors and is available without charge, upon request, by calling 1-800-345-2021.
24
Officers
The following table presents certain information about the executive officers of the funds. Each officer serves as an officer for each of the 16 (in the case of Robert J. Leach, 15) investment companies in the American Century family of funds. No officer is compensated for his or her service as an officer of the funds. The listed officers are interested persons of the funds and are appointed or re-appointed on an annual basis. The mailing address for each officer listed below is 4500 Main Street, Kansas City, Missouri 64111.
| Name (Year of Birth) | Offices with the Funds | Principal Occupation(s) During the Past Five Years |
| Jonathan S. Thomas (1963) | Director and President since 2007 | President and Chief Executive Officer, ACC (2007 to present). Also serves as Chief Executive Officer, ACS; Executive Vice President, ACIM; Director, ACC, ACIM and other ACC subsidiaries |
| R. Wes Campbell (1974) | Chief Financial Officer and Treasurer since 2018 | Investment Operations and Investment Accounting, ACS (2000 to present) |
| Amy D. Shelton (1964) | Chief Compliance Officer and Vice President since 2014 | Chief Compliance Officer, American Century funds, (2014 to present); Chief Compliance Officer, ACIM (2014 to present); Chief Compliance Officer, ACIS (2009 to present); Vice President, Client Interactions and Marketing, ACIS (2013 to 2014). Also serves as Vice President, ACIS |
| Charles A. Etherington (1957) | General Counsel since 2007 and Senior Vice President since 2006 | Attorney, ACC (1994 to present); Vice President, ACC (2005 to present); General Counsel, ACC (2007 to present). Also serves as General Counsel, ACIM, ACS, ACIS and other ACC subsidiaries; and Senior Vice President, ACIM and ACS |
| C. Jean Wade (1964) | Vice President since 2012 | Senior Vice President, ACS (2017 to present); Vice President, ACS (2000 to 2017) |
| Robert J. Leach (1966) | Vice President since 2006 | Vice President, ACS (2000 to present) |
| David H. Reinmiller (1963) | Vice President since 2000 | Attorney, ACC (1994 to present). Also serves as Vice President, ACIM and ACS |
| Ward D. Stauffer (1960) | Secretary since 2005 | Attorney, ACC (2003 to present) |
25
| Approval of Management Agreement |
At a meeting held on June 28, 2018, the Fund’s Board of Directors (the "Board") unanimously approved the renewal of the management agreement pursuant to which American Century Investment Management, Inc. (the “Advisor”) acts as the investment advisor for the Fund. Under Section 15(c) of the Investment Company Act, contracts for investment advisory services are required to be reviewed, evaluated, and approved by a majority of a fund’s directors (the “Directors”), including a majority of the independent Directors, each year.
Prior to its consideration of the renewal of the management agreement, the Directors requested and reviewed extensive data and information compiled by the Advisor and certain independent providers of evaluation data concerning the Fund and the services provided to the Fund by the Advisor. This review was in addition to the oversight and evaluation undertaken by the Board and its committees on a continual basis and the information received was supplemental to the extensive information that the Board and its committees receive and consider throughout the year. The Directors also conducted a review of the process by which the Board considers the renewal of the management agreements. The Board consulted with industry experts and reviewed industry best practices and recent judicial precedent. The Directors believe that the enhancements resulting from their review resulted in increased dialogue with the Advisor and an improved process for fund shareholders.
In connection with its consideration of the renewal of the management agreement, the Board’s review and evaluation of the services provided by the Advisor included, but was not limited to, the following:
| • | the nature, extent, and quality of investment management, shareholder services, and other services provided and to be provided to the Fund; |
| • | the wide range of other programs and services provided and to be provided to the Fund and its shareholders on a routine and non-routine basis; |
| • | the investment performance of the Fund, including data comparing the Fund's performance to appropriate benchmarks and/or a peer group of other mutual funds with similar investment objectives and strategies; |
| • | the cost of owning the Fund compared to the cost of owning similar funds; |
| • | the compliance policies, procedures, and regulatory experience of the Advisor and the Fund's service providers; |
| • | financial data showing the cost of services provided to the Fund, the profitability of the Fund to the Advisor, and the overall profitability of the Advisor |
| • | strategic plans of the Advisor; |
| • | any economies of scale associated with the Advisor’s management of the Fund and other accounts; |
| • | services provided and charges to the Advisor's other investment management clients; |
| • | acquired fund fees and expenses; |
| • | payments and practices in connection with financial intermediaries holding shares of the Fund and the services provided by intermediaries in connection therewith; and |
| • | any collateral benefits derived by the Advisor from the management of the Fund. |
The Directors held two in-person meetings and one telephonic meeting to review and discuss the information provided. The independent Directors also reviewed responses to supplemental information requests provided by the Directors to the Advisor and held active discussions with the Advisor regarding the renewal of the management agreement. The independent Directors had the benefit of the advice of their independent counsel throughout the process.
26
Factors Considered
The Directors considered all of the information provided by the Advisor, the independent data providers, and independent counsel in connection with the approval. They determined that the information was sufficient for them to evaluate the management agreement for the Fund. In connection with their review, the Directors did not identify any single factor as being all-important or controlling, and each Director may have attributed different levels of importance to different factors. In deciding to renew the management agreement, the Board based its decision on a number of factors, including without limitation the following:
Nature, Extent and Quality of Services - Generally. Under the management agreement, the Advisor is responsible for providing or arranging for all services necessary for the operation of the Fund. The Board noted that the Advisor provides or arranges at its own expense a wide variety of services including without limitation the following:
| • | portfolio research and security selection |
| • | securities trading |
| • | Fund administration |
| • | custody of Fund assets |
| • | daily valuation of the Fund’s portfolio |
| • | shareholder servicing and transfer agency, including shareholder confirmations, recordkeeping, and communications |
| • | legal services (except the independent Directors’ counsel) |
| • | regulatory and portfolio compliance |
| • | financial reporting |
| • | marketing and distribution (except amounts paid by the Fund under Rule 12b-1 plans) |
The Board noted that many of these services have expanded over time in terms of both quantity and complexity in response to shareholder demands, competition in the industry, changing distribution channels, and the changing regulatory environment.
Investment Management Services. The nature of the investment management services provided to the Fund is quite complex and allows Fund shareholders access to professional money management, instant diversification of their investments within an asset class, the opportunity to easily diversify among asset classes by investing in or exchanging among various American Century Investments funds, and liquidity. In evaluating investment performance, the Board expects the Advisor to manage the Fund in accordance with its investment objectives and approved strategies. Further, the Directors recognize that the Advisor has an obligation to monitor trading activities, and in particular to seek the best execution of fund trades, and to evaluate the use of and payment for research. In providing these services, the Advisor utilizes teams of investment professionals (portfolio managers, analysts, research assistants, and securities traders) who require extensive information technology, research, training, compliance, and other systems to conduct their business. The Board, directly and through its Fund Performance Review Committee, provides oversight of the investment performance process. It regularly reviews investment performance information for the Fund, together with comparative information for appropriate benchmarks and/or peer groups of similarly-managed funds, over different time horizons. The Directors also review detailed performance information provided by the Advisor during the management agreement renewal process. If performance concerns are identified, the Fund receives special reviews until performance improves, during which the Board receives a report from the Advisor regarding the reasons for such results (e.g., market conditions, security selection) and any efforts being undertaken to improve performance. The Fund’s performance was above its benchmark for the one-year period reviewed by the Board. The Board found the investment management services provided by the Advisor to the Fund to be satisfactory and consistent with the management agreement.
27
Shareholder and Other Services. Under the management agreement, the Advisor provides the Fund with a comprehensive package of transfer agency, shareholder, and other services. The Board, directly and through various committees of the Board, regularly reviews reports and evaluations of such services at its regular meetings. These reports include, but are not limited to, information regarding the operational efficiency and accuracy of the shareholder and transfer agency services provided, staffing levels, shareholder satisfaction (as measured by external as well as internal sources), technology support, new products and services offered to Fund shareholders, securities trading activities, portfolio valuation services, auditing services, and legal and operational compliance activities. The Board found the services provided by the Advisor to the Fund under the management agreement to be competitive and of high quality.
Costs of Services and Profitability. The Advisor provides detailed information concerning its cost of providing various services to the Fund, its profitability in managing the Fund (pre- and post-distribution), its overall profitability, and its financial condition. The Directors have reviewed with the Advisor the methodology used to prepare this financial information. This information is considered in evaluating the Advisor’s financial condition, its ability to continue to provide services under the management agreement, and the reasonableness of the current management fee. The Board concluded that the Advisor’s profits were reasonable in light of the services provided to the Fund.
Ethics. The Board generally considers the Advisor’s commitment to providing quality services to shareholders and to conducting its business ethically. They noted that the Advisor’s practices generally meet or exceed industry best practices.
Economies of Scale. The Board also reviewed information provided by the Advisor regarding the possible existence of economies of scale in connection with the management of the Fund. The Board concluded that economies of scale are difficult to measure and predict with precision, especially on a fund-by-fund basis. The Board concluded that the Advisor is appropriately sharing economies of scale through its competitive fee structure, offering competitive fees from fund inception, and through reinvestment in its business to provide shareholders additional content and services.
Comparison to Other Funds’ Fees. The management agreement provides that the Fund pays the Advisor a single, all-inclusive (or unified) management fee for providing all services necessary for the management and operation of the Fund, other than brokerage expenses, expenses attributable to short sales, taxes, interest, extraordinary expenses, and the fees and expenses of the Fund’s independent Directors (including their independent legal counsel) and expenses incurred in connection with the provision of shareholder services and distribution services under a plan adopted pursuant to Rule 12b-1 under the 1940 Act. Under the unified fee structure, the Advisor is responsible for providing all investment advisory, custody, audit, administrative, compliance, recordkeeping, marketing and shareholder services, or arranging and supervising third parties to provide such services. By contrast, most other funds are charged a variety of fees, including an investment advisory fee, a transfer agency fee, an administrative fee, distribution charges, and other expenses. Other than their investment advisory fees and any applicable Rule 12b-1 distribution fees, all other components of the total fees charged by these other funds may be increased without shareholder approval. The Board believes the unified fee structure is a benefit to Fund shareholders because it clearly discloses to shareholders the cost of owning Fund shares, and, since the unified fee cannot be increased without a vote of Fund shareholders, it shifts to the Advisor the risk of increased costs of operating the Fund and provides a direct incentive to minimize administrative inefficiencies. Part of the Board’s analysis of fee levels involves reviewing certain evaluative data compiled by an independent provider comparing the Fund’s unified fee to the total expense ratios of its peers. The unified fee charged to shareholders of the Fund was above the median of the total expense ratios of the Fund’s peer expense universe and was within the range of its peer expense group. The Board concluded that the management fee paid by the Fund to the Advisor under the management agreement is reasonable in light of the services provided to the Fund.
28
Comparison to Fees and Services Provided to Other Clients of the Advisor. The Directors also requested and received information from the Advisor concerning the nature of the services, fees, costs, and profitability of its advisory services to advisory clients other than the Fund. They observed that these varying types of client accounts require different services and involve different regulatory and entrepreneurial risks than the management of the Fund. The Board analyzed this information and concluded that the fees charged and services provided to the Fund were reasonable by comparison.
Payments to Intermediaries. The Directors also requested and received a description of payments made to intermediaries by the Fund and the Advisor and services provided in response thereto. These payments include various payments made by the Fund or the Advisor to different types of intermediaries and recordkeepers for distribution and service activities provided for the Fund. The Board reviewed such information and received representations from the Advisor that all such payments by the Fund were made pursuant to the Fund's Rule 12b-1 Plan and that all such payments by the Advisor were made from the Advisor’s resources and reasonable profits. The Board found the payments to be reasonable in scope and purpose.
Collateral or “Fall-Out” Benefits Derived by the Advisor. The Board considered the existence of collateral benefits the Advisor may receive as a result of its relationship with the Fund. They concluded that the Advisor’s primary business is managing mutual funds and it generally does not use fund or shareholder information to generate profits in other lines of business, and therefore does not derive any significant collateral benefits from them. The Board noted that additional assets from other clients may offer the Advisor some benefit from increased leverage with service providers and counterparties. Additionally, the Advisor may receive proprietary research from broker-dealers that execute fund portfolio transactions, which the Board concluded is likely to benefit other clients of the Advisor, as well as Fund shareholders. The Board also determined that the Advisor is able to provide investment management services to certain clients other than the Fund, at least in part, due to its existing infrastructure built to serve the fund complex. The Board concluded that appropriate allocation methodologies had been employed to assign resources and the cost of those resources to these other clients and, where expressly provided, these other client assets may be included with the assets of the Fund to determine breakpoints in the management fee schedule.
Existing Relationship. The Board also considered whether there was any reason for not continuing the existing arrangement with the Advisor. In this regard, the Board was mindful of the potential disruptions of the Fund’s operations and various risks, uncertainties, and other effects that could occur as a result of a decision not to continue such relationship. In particular, the Board recognized that most shareholders have invested in the Fund on the strength of the Advisor’s industry standing and reputation and in the expectation that the Advisor will have a continuing role in providing advisory services to the Fund.
Conclusion of the Directors. As a result of this process, the Board, including all of the independent Directors, taking into account all of the factors discussed above and the information provided by the Advisor and others in connection with its review and throughout the year, determined that the management fee is fair and reasonable in light of the services provided and that the investment management agreement between the Fund and the Advisor should be renewed.
29
| Additional Information |
Retirement Account Information
As required by law, distributions you receive from certain retirement accounts are subject to federal income tax withholding, unless you elect not to have withholding apply*. Tax will be withheld on the total amount withdrawn even though you may be receiving amounts that are not subject to withholding, such as nondeductible contributions. In such case, excess amounts of withholding could occur. You may adjust your withholding election so that a greater or lesser amount will be withheld.
If you don’t want us to withhold on this amount, you must notify us to not withhold the federal income tax. You may notify us in writing or in certain situations by telephone or through other electronic means. For systematic withdrawals, your withholding election will remain in effect until revoked or changed by filing a new election. You have the right to revoke your election at any time and change your withholding percentage for future distributions.
Remember, even if you elect not to have income tax withheld, you are liable for paying income tax on the taxable portion of your withdrawal. If you elect not to have income tax withheld or you don’t have enough income tax withheld, you may be responsible for payment of estimated tax. You may incur penalties under the estimated tax rules if your withholding and estimated tax payments are not sufficient. You can reduce or defer the income tax on a distribution by directly or indirectly rolling such distribution over to another IRA or eligible plan. You should consult your tax advisor for additional information.
State tax will be withheld if, at the time of your distribution, your address is within one of the mandatory withholding states and you have federal income tax withheld (or as otherwise required by state law). State taxes will be withheld from your distribution in accordance with the respective state rules.
*Some 403(b), 457 and qualified retirement plan distributions may be subject to 20% mandatory withholding, as they are subject to special tax and withholding rules. Your plan administrator or plan sponsor is required to provide you with a special tax notice explaining those rules at the time you request a distribution. If applicable, federal and/or state taxes may be withheld from your distribution amount.
Proxy Voting Policies
A description of the policies that the fund's investment advisor uses in exercising the voting rights associated with the securities purchased and/or held by the fund is available without charge, upon request, by calling 1-800-345-2021. It is also available on the "About Us" page of American Century Investments’ website at americancentury.com and on the Securities and Exchange Commission’s website at sec.gov. Information regarding how the investment advisor voted proxies relating to portfolio securities during the most recent 12-month period ended June 30 is available on the "About Us" page at americancentury.com. It is also available at sec.gov.
Quarterly Portfolio Disclosure
The fund files its complete schedule of portfolio holdings with the Securities and Exchange Commission (SEC) for the first and third quarters of each fiscal year on Form N-Q. The fund’s Forms N-Q are available on the SEC’s website at sec.gov. The fund also makes its complete schedule of portfolio holdings for the most recent quarter of its fiscal year available on its website at americancentury.com and, upon request, by calling 1-800-345-2021.
30
Other Tax Information
The following information is provided pursuant to provisions of the Internal Revenue Code.
The fund hereby designates up to the maximum amount allowable as qualified dividend income for the fiscal year ended November 30, 2018.
The fund hereby designates $14,298,930, or up to the maximum amount allowable, as long-term capital gain distributions (20% rate gain distributions) for the fiscal year ended November 30, 2018.
For the fiscal year ended November 30, 2018, the fund intends to pass through to shareholders foreign source income of $4,033,779 and foreign taxes paid of $346,355, or up to the maximum amount allowable, as a foreign tax credit. Foreign source income and foreign tax expense per outstanding share on November 30, 2018 are $0.2088 and $0.0179, respectively.
31
| Notes |
32
| ||
| Contact Us | americancentury.com | |
| Automated Information Line | 1-800-345-8765 | |
| Investor Services Representative | 1-800-345-2021 or 816-531-5575 | |
| Investors Using Advisors | 1-800-378-9878 | |
| Business, Not-For-Profit, Employer-Sponsored Retirement Plans | 1-800-345-3533 | |
| Banks and Trust Companies, Broker-Dealers, Financial Professionals, Insurance Companies | 1-800-345-6488 | |
| Telecommunications Relay Service for the Deaf | 711 | |
| American Century World Mutual Funds, Inc. | ||
Investment Advisor: American Century Investment Management, Inc. Kansas City, Missouri | ||
| This report and the statements it contains are submitted for the general information of our shareholders. The report is not authorized for distribution to prospective investors unless preceded or accompanied by an effective prospectus. | ||
| ©2019 American Century Proprietary Holdings, Inc. All rights reserved. CL-ANN-91025 1901 | ||
| Annual Report | |
| November 30, 2018 | |
| NT International Value Fund | |
| Investor Class (ANTVX) | |
| G Class (ANTYX) | |
Beginning on January 1, 2021, as permitted by regulations adopted by the Securities and Exchange Commission, paper copies of the fund’s shareholder reports like this one will no longer be sent by mail, unless you specifically request paper copies of the reports from the fund or from your financial intermediary, such as a broker-dealer or bank. Instead, the reports will be made available on a website, and you will be notified by mail each time a report is posted and provided with a website link to access the report.
If you already elected to receive shareholder reports electronically, you will not be affected by this change and you need not take any action. You may elect to receive shareholder reports and other communications from the fund or your financial intermediary electronically by calling or sending an email request to your appropriate contacts as listed on the back cover of this report.
You may elect to receive all future reports in paper free of charge. You can inform the fund or your financial intermediary that you wish to continue receiving paper copies of your shareholder reports by calling or sending an email request to your appropriate contacts as listed on the back cover of this report. Your election to receive reports in paper will apply to all funds held with the fund complex/your financial intermediary.
| Table of Contents |
| Performance | 2 | |
| Portfolio Commentary | ||
| Fund Characteristics | ||
| Shareholder Fee Example | ||
| Schedule of Investments | ||
| Statement of Assets and Liabilities | ||
| Statement of Operations | ||
| Statement of Changes in Net Assets | ||
| Notes to Financial Statements | ||
| Financial Highlights | ||
| Report of Independent Registered Public Accounting Firm | ||
| Management | ||
| Approval of Management Agreement | ||
| Additional Information | ||
Any opinions expressed in this report reflect those of the author as of the date of the report, and do not necessarily represent the opinions of American Century Investments® or any other person in the American Century Investments organization. Any such opinions are subject to change at any time based upon market or other conditions and American Century Investments disclaims any responsibility to update such opinions. These opinions may not be relied upon as investment advice and, because investment decisions made by American Century Investments funds are based on numerous factors, may not be relied upon as an indication of trading intent on behalf of any American Century Investments fund. Security examples are used for representational purposes only and are not intended as recommendations to purchase or sell securities. Performance information for comparative indices and securities is provided to American Century Investments by third party vendors. To the best of American Century Investments’ knowledge, such information is accurate at the time of printing.
| Performance |
| Total Returns as of November 30, 2018 | ||||
| Average Annual Returns | ||||
Ticker Symbol | 1 year | Since Inception | Inception Date | |
| Investor Class | ANTVX | -11.95% | -0.63% | 3/19/15 |
| MSCI EAFE Value Index | — | -9.02% | 1.09% | — |
| G Class | ANTYX | -10.79% | -0.03% | 3/19/15 |
G Class returns would have been lower if a portion of the fees had not been waived.
| Growth of $10,000 Over Life of Class |
| $10,000 investment made March 19, 2015 |
| Performance for other share classes will vary due to differences in fee structure. |
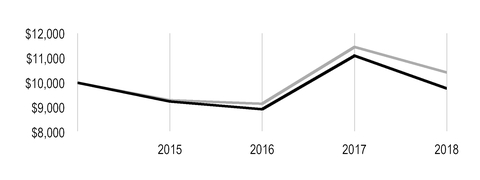
| Value on November 30, 2018 | |
| Investor Class — $9,768 | |
| MSCI EAFE Value Index — $10,410 | |
Total Annual Fund Operating Expenses | |
| Investor Class | G Class |
| 1.29% | 0.94% |
The total annual fund operating expenses shown is as stated in the fund’s prospectus current as of the date of this report. The prospectus may vary from the expense ratio shown elsewhere in this report because it is based on a different time period, includes acquired fund fees and expenses, and, if applicable, does not include fee waivers or expense reimbursements.
Data presented reflect past performance. Past performance is no guarantee of future results. Current performance may be higher or lower than the performance shown. Total returns for periods less than one year are not annualized. Investment return and principal value will fluctuate, and redemption value may be more or less than original cost. Data assumes reinvestment of dividends and capital gains, and none of the charts reflect the deduction of taxes that a shareholder would pay on fund distributions or the redemption of fund shares. To obtain performance data current to the most recent month end, please call 1-800-345-2021 or visit americancentury.com. For additional information about the fund, please consult the prospectus.
2
| Portfolio Commentary |
Portfolio Managers: Elizabeth Xie and Vinod Chandrashekaran
Performance Summary
NT International Value fell -10.79%* for the fiscal year ended November 30, 2018, compared with the -9.02% return of its benchmark, the MSCI EAFE Value Index. Fund results reflect operating expenses, while benchmark returns do not.
Global stock markets delivered synchronized growth and robust gains for the first several months of the reporting period. However, a decoupling occurred in February, as market volatility re-entered the picture on the back of slowing economic growth outside the U.S., worries about rising interest rates and inflation in the U.S., and the threat of a global trade war. After a short bout of turmoil, the U.S. continued on a smooth growth trajectory throughout the spring and summer, fueled by robust corporate earnings and positive economic indicators. During this time, many eurozone and emerging markets economies stalled. A strong U.S. dollar, slowing growth, and hostile trade rhetoric helped to suppress non-U.S. market returns. In late summer, volatility crept back into the picture in U.S. markets. Investors could no longer overlook the potential effects of trade tariffs and midterm elections, coupled with economic and political issues abroad in Italy, Turkey, Argentina, and the U.K. In October, markets moved sharply lower. Continued worries over rising interest rates, trade disputes, and falling commodity prices pressured equity markets throughout the rest of the period.
Our stock selection process incorporates factors of valuation, quality, growth, and sentiment, while minimizing unintended risks among industries and other risk characteristics. Weak stock selection, particularly in the industrials, communication services, and energy sectors, detracted most from relative results. Utilities, real estate, and consumer discretionary also detracted from performance. Conversely, the health care, financials, consumer staples, and materials sectors added to relative returns, largely as a result of positive stock selection.
Geographically, stock selection within Japan, France, Germany, Hong Kong, and Sweden weighed on the fund’s results, along with positioning in India. In contrast, selections within the U.K., Switzerland, Norway, and Finland contributed to relative returns.
Japan Holdings Detracted from Performance
In Japan, positions in Leopalace21, Kajima, and Subaru all weighed on results. Real estate developer and manager Leopalace21 saw its price fall during the latter half of the period as investors reacted poorly to business expansion efforts across Asia. Building and construction engineering company Kajima also suffered throughout the year after accusations of bid-rigging hurt the corporate reputation near the beginning of the reporting period. We have since closed the position. The price of automaker Subaru struggled the last several months due to production delays and expensive recalls.
*All fund returns referenced in this commentary are for G Class shares. G Class returns would have been lower if a portion of the fees had not been waived. Performance for other share classes will vary due to differences in fee structure; when G Class performance exceeds that of the fund's benchmark, other share classes may not. See page 2 for returns for all share classes.
3
Among notable individual detractors was a stake in U.K.-based vacation services firm Thomas Cook Group. The firm’s revenues suffered due to low bookings during the summer vacation season. The company recently issued a profit warning, which further depressed prices. We have since exited our position. A position in U.K.-based aerospace and defense firm BAE Systems also detracted from performance after its price faced pressure late in the period partly fueled by concerns over Brexit and the U.K. economy.
Pharmaceuticals Companies Among Contributors
Positioning in many pharmaceuticals companies, such as Sumitomo Dainippon Pharma Co., GlaxoSmithKline, and Bayer, helped returns. Japan-based Sumitomo Dainippon Pharma saw its stock price rise based on earnings, which beat estimates for much of the period. U.K.-based GlaxoSmithKline saw price volatility over the period, but saw appreciation during the first quarter of 2018 when news that the release of a generic version of its blockbuster asthma medication, Advair, would be delayed in the U.S. An underweight to German-based company Bayer was also helpful to returns. Bayer was hurt by its recent acquisition of Monsanto. The stock of the drug and chemical company slid considerably in August after litigation over Monsanto’s cornerstone weed killing product, Roundup, delivered an unfavorable outcome. Elsewhere, in the consumer staples sector, a lack of exposure to British American Tobacco was also a top contributor to relative performance.
A Look Ahead
Looking generally at economic prospects outside the U.S., economic fundamentals are mixed. On the one hand, economic growth is moderating and uncertainty is high because of ongoing trade tensions. On the other hand, valuations across many non-U.S. markets are at or below long-term averages, and corporate earnings growth remains fairly healthy. Add it all up, and we think it’s reasonable to expect more volatility going forward.
We believe our disciplined investment approach is particularly beneficial during periods of likely volatility, and we adhere to our process regardless of the market environment. We believe that this allows us to take advantage of opportunities presented by market inefficiencies.
4
| Fund Characteristics |
| NOVEMBER 30, 2018 | |
Top Ten Holdings | % of net assets |
| Royal Dutch Shell plc, B Shares | 3.7% |
| Novartis AG | 3.1% |
| HSBC Holdings plc | 2.6% |
| GlaxoSmithKline plc | 2.5% |
| BHP Group plc | 1.9% |
| Toyota Motor Corp. | 1.8% |
| Australia & New Zealand Banking Group Ltd. | 1.7% |
| Zurich Insurance Group AG | 1.6% |
| Rio Tinto plc | 1.6% |
| TOTAL SA | 1.6% |
Types of Investments in Portfolio | % of net assets |
| Common Stocks | 96.9% |
| Exchange-Traded Funds | 2.1% |
| Total Equity Exposure | 99.0% |
| Temporary Cash Investments | 0.5% |
| Other Assets and Liabilities | 0.5% |
Investments by Country | % of net assets |
| Japan | 24.5% |
| United Kingdom | 21.6% |
| France | 8.2% |
| Switzerland | 7.9% |
| Australia | 5.1% |
| Netherlands | 3.9% |
| Germany | 3.7% |
| Spain | 3.2% |
| Hong Kong | 3.0% |
| Israel | 2.6% |
| Norway | 2.5% |
| Singapore | 2.3% |
| Other Countries | 8.4% |
| Exchange-Traded Funds* | 2.1% |
| Cash and Equivalents** | 1.0% |
| *Category may increase exposure to the countries indicated. The Schedule of Investments provides additional information on the fund's portfolio holdings. | |
| **Includes temporary cash investments and other assets and liabilities. | |
5
| Shareholder Fee Example |
Fund shareholders may incur two types of costs: (1) transaction costs, including sales charges (loads) on purchase payments and redemption/exchange fees; and (2) ongoing costs, including management fees; distribution and service (12b-1) fees; and other fund expenses. This example is intended to help you understand your ongoing costs (in dollars) of investing in your fund and to compare these costs with the ongoing cost of investing in other mutual funds.
The example is based on an investment of $1,000 made at the beginning of the period and held for the entire period from June 1, 2018 to November 30, 2018.
Actual Expenses
The table provides information about actual account values and actual expenses for each class. You may use the information, together with the amount you invested, to estimate the expenses that you paid over the period. First, identify the share class you own. Then simply divide your account value by $1,000 (for example, an $8,600 account value divided by $1,000 = 8.6), then multiply the result by the number under the heading “Expenses Paid During Period” to estimate the expenses you paid on your account during this period.
Hypothetical Example for Comparison Purposes
The table also provides information about hypothetical account values and hypothetical expenses based on the actual expense ratio of each class of your fund and an assumed rate of return of 5% per year before expenses, which is not the actual return of a fund’s share class. The hypothetical account values and expenses may not be used to estimate the actual ending account balance or expenses you paid for the period. You may use this information to compare the ongoing costs of investing in your fund and other funds. To do so, compare this 5% hypothetical example with the 5% hypothetical examples that appear in the shareholder reports of the other funds.
Please note that the expenses shown in the table are meant to highlight your ongoing costs only and do not reflect any transactional costs, such as sales charges (loads) or redemption/exchange fees. Therefore, the table is useful in comparing ongoing costs only, and will not help you determine the relative total costs of owning different funds. In addition, if these transactional costs were included, your costs would have been higher.
| Beginning Account Value 6/1/18 | Ending Account Value 11/30/18 | Expenses Paid During Period(1) 6/1/18 - 11/30/18 | Annualized Expense Ratio(1) | |
Actual | ||||
| Investor Class | $1,000 | $894.60 | $6.13 | 1.29% |
| G Class | $1,000 | $900.20 | $0.05 | 0.01% |
| Hypothetical | ||||
| Investor Class | $1,000 | $1,018.60 | $6.53 | 1.29% |
| G Class | $1,000 | $1,025.02 | $0.05 | 0.01% |
| (1) | Expenses are equal to the class's annualized expense ratio listed in the table above, multiplied by the average account value over the period, multiplied by 183, the number of days in the most recent fiscal half-year, divided by 365, to reflect the one-half year period. Annualized expense ratio reflects actual expenses, including any applicable fee waivers or expense reimbursements and excluding any acquired fund fees and expenses. |
6
| Schedule of Investments |
NOVEMBER 30, 2018
| Shares | Value | ||||
| COMMON STOCKS — 96.9% | |||||
| Australia — 5.1% | |||||
| Australia & New Zealand Banking Group Ltd. | 729,963 | $ | 14,341,629 | ||
| CIMIC Group Ltd. | 102,583 | 3,060,344 | |||
Coles Group Ltd.(1) | 199,205 | 1,704,964 | |||
| Commonwealth Bank of Australia | 124,852 | 6,512,410 | |||
| JB Hi-Fi Ltd. | 68,654 | 1,168,190 | |||
| National Australia Bank Ltd. | 119,038 | 2,147,591 | |||
| Qantas Airways Ltd. | 279,458 | 1,219,763 | |||
| Regis Resources Ltd. | 243,117 | 754,784 | |||
| Santos Ltd. | 226,674 | 918,311 | |||
| Super Retail Group Ltd. | 615,334 | 3,310,286 | |||
| Telstra Corp. Ltd. | 285,015 | 611,223 | |||
| Wesfarmers Ltd. | 199,205 | 4,605,368 | |||
| Westpac Banking Corp. | 106,837 | 2,033,363 | |||
| 42,388,226 | |||||
| Brazil — 0.2% | |||||
| Banco Santander Brasil SA ADR | 132,294 | 1,481,693 | |||
| China — 0.5% | |||||
| China Construction Bank Corp., H Shares | 1,448,000 | 1,238,222 | |||
| Industrial & Commercial Bank of China Ltd., H Shares | 4,538,000 | 3,233,983 | |||
| 4,472,205 | |||||
| Denmark — 0.4% | |||||
| H Lundbeck A/S | 42,677 | 1,758,680 | |||
| Topdanmark A/S | 43,897 | 1,996,052 | |||
| 3,754,732 | |||||
| France — 8.2% | |||||
| BNP Paribas SA | 246,757 | 12,427,805 | |||
| Casino Guichard Perrachon SA | 50,355 | 2,276,429 | |||
| CNP Assurances | 297,588 | 6,828,374 | |||
| Eiffage SA | 38,693 | 3,691,814 | |||
| Engie SA | 197,302 | 2,782,990 | |||
| Kering SA | 3,232 | 1,415,522 | |||
| Lagardere SCA | 195,692 | 5,537,021 | |||
| Metropole Television SA | 60,877 | 1,081,617 | |||
| Orange SA | 126,093 | 2,168,341 | |||
| Peugeot SA | 299,556 | 6,585,190 | |||
| Sanofi | 74,372 | 6,731,084 | |||
| Societe Generale SA | 104,105 | 3,833,858 | |||
| TOTAL SA | 238,741 | 13,290,261 | |||
| 68,650,306 | |||||
| Germany — 3.7% | |||||
| Allianz SE | 36,427 | 7,693,499 | |||
7
| Shares | Value | ||||
| Bayer AG | 42,442 | $ | 3,099,807 | ||
| Covestro AG | 61,904 | 3,561,050 | |||
| Daimler AG | 18,855 | 1,060,726 | |||
| Deutsche Telekom AG | 176,788 | 3,100,041 | |||
| Hamburger Hafen und Logistik AG | 38,203 | 836,097 | |||
| HUGO BOSS AG | 28,495 | 1,967,211 | |||
| MTU Aero Engines AG | 7,972 | 1,658,475 | |||
| ProSiebenSat.1 Media SE | 111,542 | 2,263,188 | |||
| RTL Group SA | 16,868 | 1,011,501 | |||
| RWE AG | 28,544 | 617,129 | |||
| Schaeffler AG Preference Shares | 211,656 | 1,821,448 | |||
| Siemens AG | 17,736 | 2,054,209 | |||
| 30,744,381 | |||||
| Hong Kong — 3.0% | |||||
| BOC Hong Kong Holdings Ltd. | 441,500 | 1,726,578 | |||
| CLP Holdings Ltd. | 522,500 | 5,759,593 | |||
Health and Happiness H&H International Holdings Ltd.(1) | 303,500 | 1,959,549 | |||
| Kerry Properties Ltd. | 444,000 | 1,528,851 | |||
| Link REIT | 234,500 | 2,232,655 | |||
| PCCW Ltd. | 2,656,000 | 1,558,066 | |||
| Sands China Ltd. | 932,800 | 4,057,504 | |||
| Swire Properties Ltd. | 353,600 | 1,235,914 | |||
| Wharf Holdings Ltd. (The) | 1,933,000 | 5,188,688 | |||
| 25,247,398 | |||||
| India — 0.2% | |||||
| Tata Power Co. Ltd. (The) | 1,839,312 | 2,009,201 | |||
| Israel — 2.6% | |||||
| Bank Leumi Le-Israel BM | 1,185,036 | 7,795,412 | |||
| Israel Discount Bank Ltd., A Shares | 529,589 | 1,834,064 | |||
| Mizrahi Tefahot Bank Ltd. | 119,387 | 2,172,613 | |||
Nice Ltd.(1) | 42,639 | 4,952,768 | |||
| Teva Pharmaceutical Industries Ltd. ADR | 226,647 | 4,881,976 | |||
| 21,636,833 | |||||
| Italy — 1.8% | |||||
| Eni SpA | 504,012 | 8,131,029 | |||
| EXOR NV | 113,776 | 6,687,817 | |||
| 14,818,846 | |||||
| Japan — 24.5% | |||||
| Astellas Pharma, Inc. | 435,300 | 6,689,696 | |||
| Brother Industries Ltd. | 202,100 | 3,380,872 | |||
| Canon, Inc. | 25,200 | 714,558 | |||
| Cosmo Energy Holdings Co. Ltd. | 65,900 | 1,539,681 | |||
| Daiichikosho Co., Ltd. | 62,900 | 2,870,299 | |||
| Daiwa Securities Group, Inc. | 436,000 | 2,416,076 | |||
| DMG Mori Co. Ltd. | 26,700 | 373,986 | |||
| Eisai Co. Ltd. | 45,000 | 4,143,274 | |||
| Hazama Ando Corp. | 430,300 | 2,600,412 | |||
8
| Shares | Value | ||||
| Honda Motor Co. Ltd. | 128,400 | $ | 3,623,343 | ||
| Kansai Electric Power Co., Inc. (The) | 302,700 | 4,543,900 | |||
| KDDI Corp. | 354,400 | 8,317,153 | |||
| Kikkoman Corp. | 46,500 | 2,711,800 | |||
| Kirin Holdings Co. Ltd. | 104,500 | 2,453,354 | |||
| Leopalace21 Corp. | 450,000 | 1,965,724 | |||
| Marubeni Corp. | 872,900 | 6,523,188 | |||
| Mebuki Financial Group, Inc. | 2,172,500 | 6,569,264 | |||
| Mitsubishi Chemical Holdings Corp. | 571,000 | 4,671,018 | |||
| Mitsubishi Corp. | 157,000 | 4,238,027 | |||
| Mitsubishi UFJ Financial Group, Inc. | 1,347,800 | 7,354,413 | |||
| Mitsui & Co. Ltd. | 108,400 | 1,703,569 | |||
| Mizuho Financial Group, Inc. | 1,612,100 | 2,675,285 | |||
| Nihon Unisys Ltd. | 118,500 | 3,022,134 | |||
| Nikon Corp. | 204,100 | 3,203,391 | |||
| Nippon Telegraph & Telephone Corp. | 71,600 | 2,951,927 | |||
| NTT DOCOMO, Inc. | 290,300 | 6,722,050 | |||
| ORIX Corp. | 301,800 | 4,886,914 | |||
| SBI Holdings, Inc. | 253,600 | 5,754,954 | |||
| Sega Sammy Holdings, Inc. | 152,600 | 2,164,691 | |||
| Shiseido Co. Ltd. | 78,000 | 4,968,715 | |||
| Shizuoka Bank Ltd. (The) | 448,200 | 4,023,396 | |||
| Showa Shell Sekiyu KK | 306,500 | 4,753,527 | |||
| Sojitz Corp. | 1,614,900 | 5,718,978 | |||
| Sony Corp. | 62,400 | 3,303,270 | |||
| Subaru Corp. | 286,000 | 6,360,356 | |||
| Sumitomo Chemical Co. Ltd. | 587,800 | 3,189,753 | |||
| Sumitomo Dainippon Pharma Co., Ltd. | 297,600 | 9,749,541 | |||
| Sumitomo Mitsui Financial Group, Inc. | 125,700 | 4,615,473 | |||
| Sushiro Global Holdings Ltd. | 27,700 | 1,518,508 | |||
| Suzuken Co. Ltd. | 42,300 | 2,278,139 | |||
| Suzuki Motor Corp. | 130,000 | 6,476,237 | |||
| Takeda Pharmaceutical Co., Ltd. | 93,000 | 3,509,134 | |||
| Teijin Ltd. | 152,700 | 2,638,099 | |||
| Toho Holdings Co. Ltd. | 39,000 | 1,035,854 | |||
| Tokuyama Corp. | 168,700 | 4,625,583 | |||
| Toyota Boshoku Corp. | 104,600 | 1,611,641 | |||
| Toyota Motor Corp. | 250,600 | 15,082,854 | |||
| Trend Micro, Inc. | 34,000 | 1,949,875 | |||
| TS Tech Co. Ltd. | 188,500 | 5,496,088 | |||
| Unicharm Corp. | 47,100 | 1,475,501 | |||
| 205,165,475 | |||||
| Malaysia — 0.4% | |||||
| CIMB Group Holdings Bhd | 2,243,300 | 3,095,771 | |||
| Netherlands — 3.9% | |||||
| ABN AMRO Group NV CVA | 304,848 | 7,807,284 | |||
| Aegon NV | 354,677 | 1,975,888 | |||
9
| Shares | Value | ||||
| ASR Nederland NV | 125,022 | $ | 5,410,868 | ||
Coca-Cola European Partners plc(1) | 64,458 | 3,128,791 | |||
| Koninklijke Philips NV | 150,120 | 5,682,669 | |||
| NN Group NV | 107,568 | 4,579,948 | |||
QIAGEN NV(1) | 106,088 | 3,742,384 | |||
| 32,327,832 | |||||
| New Zealand — 0.8% | |||||
a2 Milk Co. Ltd.(1) | 736,543 | 5,242,979 | |||
| Spark New Zealand Ltd. | 528,655 | 1,540,788 | |||
| 6,783,767 | |||||
| Norway — 2.5% | |||||
| Aker BP ASA | 156,106 | 4,445,021 | |||
| Equinor ASA | 393,407 | 9,191,896 | |||
| Salmar ASA | 72,477 | 4,097,761 | |||
| Telenor ASA | 173,542 | 3,372,547 | |||
| 21,107,225 | |||||
| Poland — 0.4% | |||||
| Powszechny Zaklad Ubezpieczen SA | 290,180 | 3,282,560 | |||
| Portugal — 0.6% | |||||
| EDP - Energias de Portugal SA | 1,345,666 | 4,703,026 | |||
| Singapore — 2.3% | |||||
| ComfortDelGro Corp. Ltd. | 2,520,600 | 3,863,426 | |||
| Oversea-Chinese Banking Corp. Ltd. | 694,000 | 5,717,801 | |||
| Singapore Technologies Engineering Ltd. | 620,200 | 1,609,509 | |||
| United Overseas Bank Ltd. | 433,800 | 7,981,966 | |||
| 19,172,702 | |||||
| South Korea — 1.3% | |||||
| Daelim Industrial Co. Ltd. | 22,006 | 1,865,126 | |||
| Hanwha Corp. | 93,223 | 2,505,891 | |||
| Hyundai Marine & Fire Insurance Co. Ltd. | 33,148 | 1,184,332 | |||
| Samsung Electronics Co. Ltd. | 82,900 | 3,112,376 | |||
| SK Hynix, Inc. | 29,133 | 1,822,317 | |||
| 10,490,042 | |||||
| Spain — 3.2% | |||||
| Banco Bilbao Vizcaya Argentaria SA | 1,259,222 | 7,184,190 | |||
| Banco Santander SA | 860,815 | 4,099,011 | |||
| Ence Energia y Celulosa SA | 134,890 | 855,677 | |||
| Mapfre SA | 1,889,023 | 5,402,879 | |||
| Repsol SA | 516,000 | 8,914,662 | |||
| 26,456,419 | |||||
| Sweden — 1.2% | |||||
| Castellum AB | 133,046 | 2,333,307 | |||
| Lundin Petroleum AB | 147,591 | 3,897,260 | |||
| Tele2 AB, B Shares | 315,216 | 3,946,316 | |||
| 10,176,883 | |||||
| Switzerland — 7.9% | |||||
| Nestle SA | 110,117 | 9,402,886 | |||
10
| Shares | Value | ||||
| Novartis AG | 284,505 | $ | 25,971,489 | ||
| Roche Holding AG | 33,650 | 8,731,465 | |||
| Swisscom AG | 12,815 | 6,150,351 | |||
UBS Group AG(1) | 147,052 | 1,995,294 | |||
| Zurich Insurance Group AG | 43,633 | 13,699,990 | |||
| 65,951,475 | |||||
| Taiwan — 0.6% | |||||
| AU Optronics Corp. | 2,954,000 | 1,210,235 | |||
| Shin Kong Financial Holding Co. Ltd. | 4,515,099 | 1,530,202 | |||
| Uni-President Enterprises Corp. | 901,000 | 2,117,363 | |||
| 4,857,800 | |||||
| United Kingdom — 21.6% | |||||
| 3i Group plc | 723,876 | 7,717,171 | |||
| BAE Systems plc | 1,375,819 | 8,640,823 | |||
| BHP Group plc | 828,675 | 15,925,866 | |||
| BP plc | 1,932,153 | 12,812,375 | |||
| Centrica plc | 4,597,582 | 8,142,719 | |||
| Direct Line Insurance Group plc | 577,819 | 2,419,160 | |||
| Evraz plc | 394,639 | 2,287,332 | |||
| GlaxoSmithKline plc | 1,028,352 | 21,279,244 | |||
| HSBC Holdings plc | 2,541,137 | 21,529,391 | |||
| International Consolidated Airlines Group SA | 838,942 | 6,724,173 | |||
| Legal & General Group plc | 1,754,585 | 5,478,636 | |||
| Lloyds Banking Group plc | 6,299,578 | 4,446,281 | |||
| Marks & Spencer Group plc | 519,733 | 1,939,115 | |||
| Rio Tinto plc | 296,065 | 13,440,320 | |||
| Royal Dutch Shell plc, B Shares | 1,012,870 | 30,978,649 | |||
| Royal Mail plc | 1,039,616 | 4,245,891 | |||
| Segro plc | 486,709 | 3,751,261 | |||
| Tate & Lyle plc | 560,284 | 5,127,361 | |||
| Vodafone Group plc | 1,878,227 | 4,041,696 | |||
| 180,927,464 | |||||
TOTAL COMMON STOCKS (Cost $829,145,594) | 809,702,262 | ||||
| EXCHANGE-TRADED FUNDS — 2.1% | |||||
| iShares MSCI EAFE ETF | 154,000 | 9,666,580 | |||
| iShares MSCI EAFE Value ETF | 142,000 | 6,881,320 | |||
| iShares MSCI Japan ETF | 22,000 | 1,217,480 | |||
TOTAL EXCHANGE-TRADED FUNDS (Cost $19,285,560) | 17,765,380 | ||||
| TEMPORARY CASH INVESTMENTS — 0.5% | |||||
| Repurchase Agreement, BMO Capital Markets Corp., (collateralized by various U.S. Treasury obligations, 1.125% - 3.125%, 5/31/19 - 11/15/28, valued at $3,394,403), in a joint trading account at 2.00%, dated 11/30/18, due 12/3/18 (Delivery value $3,328,236) | 3,327,681 | ||||
| Repurchase Agreement, Fixed Income Clearing Corp., (collateralized by various U.S. Treasury obligations, 3.375%, 11/15/48, valued at $757,671), at 1.05%, dated 11/30/18, due 12/3/18 (Delivery value $740,065) | 740,000 | ||||
11
| Shares | Value | ||||
| State Street Institutional U.S. Government Money Market Fund, Premier Class | 1,662 | $ | 1,662 | ||
TOTAL TEMPORARY CASH INVESTMENTS (Cost $4,069,343) | 4,069,343 | ||||
TOTAL INVESTMENT SECURITIES — 99.5% (Cost $852,500,497) | 831,536,985 | ||||
| OTHER ASSETS AND LIABILITIES — 0.5% | 4,073,703 | ||||
| TOTAL NET ASSETS — 100.0% | $ | 835,610,688 | |||
| MARKET SECTOR DIVERSIFICATION | ||
(as a % of net assets) | ||
| Financials | 28.5 | % |
| Health Care | 13.2 | % |
| Energy | 11.8 | % |
| Consumer Discretionary | 9.2 | % |
| Industrials | 7.5 | % |
| Communication Services | 6.9 | % |
| Materials | 6.2 | % |
| Consumer Staples | 5.6 | % |
| Utilities | 3.4 | % |
| Information Technology | 2.4 | % |
| Real Estate | 2.2 | % |
| Exchange-Traded Funds | 2.1 | % |
| Cash and Equivalents* | 1.0 | % |
*Includes temporary cash investments and other assets and liabilities.
| NOTES TO SCHEDULE OF INVESTMENTS | ||
| ADR | - | American Depositary Receipt |
| CVA | - | Certificaten Van Aandelen |
| (1) | Non-income producing. |
See Notes to Financial Statements.
12
| Statement of Assets and Liabilities |
| NOVEMBER 30, 2018 | |||
| Assets | |||
| Investment securities, at value (cost of $852,500,497) | $ | 831,536,985 | |
| Foreign currency holdings, at value (cost of $369,324) | 368,266 | ||
| Receivable for capital shares sold | 29,038 | ||
| Dividends and interest receivable | 5,913,486 | ||
| 837,847,775 | |||
| Liabilities | |||
| Payable for capital shares redeemed | 2,003,098 | ||
| Accrued management fees | 233,989 | ||
| 2,237,087 | |||
| Net Assets | $ | 835,610,688 | |
| Net Assets Consist of: | |||
| Capital (par value and paid-in surplus) | $ | 883,606,394 | |
| Distributable earnings | (47,995,706 | ) | |
| $ | 835,610,688 | ||
| Net Assets | Shares Outstanding | Net Asset Value Per Share | ||||
| Investor Class, $0.01 Par Value | $219,272,638 | 24,355,346 | $9.00 | |||
| G Class, $0.01 Par Value | $616,338,050 | 67,664,415 | $9.11 | |||
See Notes to Financial Statements.
13
| Statement of Operations |
| YEAR ENDED NOVEMBER 30, 2018 | |||
| Investment Income (Loss) | |||
| Income: | |||
| Dividends (net of foreign taxes withheld of $3,104,163) | $ | 34,650,101 | |
| Interest | 95,514 | ||
| 34,745,615 | |||
| Expenses: | |||
| Management fees | 9,470,743 | ||
| Directors' fees and expenses | 25,679 | ||
| Other expenses | 49,002 | ||
| 9,545,424 | |||
| Fees waived - G Class | (6,248,456 | ) | |
| 3,296,968 | |||
| Net investment income (loss) | 31,448,647 | ||
| Realized and Unrealized Gain (Loss) | |||
| Net realized gain (loss) on: | |||
| Investment transactions (net of foreign tax expenses paid (refunded) of $28,327) | 10,651,840 | ||
| Foreign currency translation transactions | (231,828 | ) | |
| 10,420,012 | |||
| Change in net unrealized appreciation (depreciation) on: | |||
| Investments | (144,831,474 | ) | |
| Translation of assets and liabilities in foreign currencies | (109,940 | ) | |
| (144,941,414 | ) | ||
| Net realized and unrealized gain (loss) | (134,521,402 | ) | |
| Net Increase (Decrease) in Net Assets Resulting from Operations | $ | (103,072,755 | ) |
See Notes to Financial Statements.
14
| Statement of Changes in Net Assets |
| YEARS ENDED NOVEMBER 30, 2018 AND NOVEMBER 30, 2017 | ||||||
| Increase (Decrease) in Net Assets | November 30, 2018 | November 30, 2017 | ||||
| Operations | ||||||
| Net investment income (loss) | $ | 31,448,647 | $ | 26,929,967 | ||
| Net realized gain (loss) | 10,420,012 | 57,804,335 | ||||
| Change in net unrealized appreciation (depreciation) | (144,941,414 | ) | 121,250,768 | |||
| Net increase (decrease) in net assets resulting from operations | (103,072,755 | ) | 205,985,070 | |||
| Distributions to Shareholders | ||||||
| From earnings: | ||||||
| Investor Class | (7,142,667 | ) | (6,184,068 | ) | ||
| G Class | (25,397,074 | ) | (18,723,887 | ) | ||
| R6 Class | — | (2,164,034 | ) | |||
| Decrease in net assets from distributions | (32,539,741 | ) | (27,071,989 | ) | ||
| Capital Share Transactions | ||||||
| Net increase (decrease) in net assets from capital share transactions (Note 5) | 18,264,749 | (72,123,783 | ) | |||
| Net increase (decrease) in net assets | (117,347,747 | ) | 106,789,298 | |||
| Net Assets | ||||||
| Beginning of period | 952,958,435 | 846,169,137 | ||||
| End of period | $ | 835,610,688 | $ | 952,958,435 | ||
See Notes to Financial Statements.
15
| Notes to Financial Statements |
NOVEMBER 30, 2018
1. Organization
American Century World Mutual Funds, Inc. (the corporation) is registered under the Investment Company Act of 1940, as amended (the 1940 Act), as an open-end management investment company and is organized as a Maryland corporation. NT International Value Fund (the fund) is one fund in a series issued by the corporation. The fund’s investment objective is to seek long-term capital growth. The fund is not permitted to invest in securities issued by companies assigned the Global Industry Classification Standard or the Bloomberg Industry Classification Standard for the tobacco industry. The fund offers the Investor Class and G Class. On July 31, 2017, all outstanding R6 Class shares were converted to G Class shares and the fund discontinued offering the R6 Class.
2. Significant Accounting Policies
The following is a summary of significant accounting policies consistently followed by the fund in preparation of its financial statements. The fund is an investment company and follows accounting and reporting guidance in accordance with accounting principles generally accepted in the United States of America. This may require management to make certain estimates and assumptions at the date of the financial statements. Actual results could differ from these estimates. Management evaluated the impact of events or transactions occurring through the date the financial statements were issued that would merit recognition or disclosure.
Investment Valuations — The fund determines the fair value of its investments and computes its net asset value per share at the close of regular trading (usually 4 p.m. Eastern time) on the New York Stock Exchange (NYSE) on each day the NYSE is open. The Board of Directors has adopted valuation policies and procedures to guide the investment advisor in the fund’s investment valuation process and to provide methodologies for the oversight of the fund’s pricing function.
Equity securities that are listed or traded on a domestic securities exchange are valued at the last reported sales price or at the official closing price as provided by the exchange. Equity securities traded on foreign securities exchanges are generally valued at the closing price of such securities on the exchange where primarily traded or at the close of the NYSE, if that is earlier. If no last sales price is reported, or if local convention or regulation so provides, the mean of the latest bid and asked prices may be used. Securities traded over-the-counter are valued at the mean of the latest bid and asked prices, the last sales price, or the official closing price. Equity securities initially expressed in local currencies are translated into U.S. dollars at the mean of the appropriate currency exchange rate at the close of the NYSE as provided by an independent pricing service.
Open-end management investment companies are valued at the reported net asset value per share. Repurchase agreements are valued at cost, which approximates fair value.
If the fund determines that the market price for an investment is not readily available or the valuation methods mentioned above do not reflect an investment’s fair value, such investment is valued as determined in good faith by the Board of Directors or its delegate, in accordance with policies and procedures adopted by the Board of Directors. In its determination of fair value, the fund may review several factors including, but not limited to, market information regarding the specific investment or comparable investments and correlation with other investment types, futures indices or general market indicators. Circumstances that may cause the fund to use these procedures to value an investment include, but are not limited to: an investment has been declared in default or is distressed; trading in a security has been suspended during the trading day or a security is not actively trading on its principal exchange; prices received from a regular pricing source are deemed unreliable; or there is a foreign market holiday and no trading occurred.
16
The fund monitors for significant events occurring after the close of an investment’s primary exchange but before the fund’s net asset value per share is determined. Significant events may include, but are not limited to: corporate announcements and transactions; governmental action and political unrest that could impact a specific investment or an investment sector; or armed conflicts, natural disasters and similar events that could affect investments in a specific country or region. The fund also monitors for significant fluctuations between domestic and foreign markets, as evidenced by the U.S. market or such other indicators that the Board of Directors, or its delegate, deems appropriate. If significant fluctuations in foreign markets are identified, the fund may apply a model-derived factor to the closing price of equity securities traded on foreign securities exchanges. The factor is based on observable market data as provided by an independent pricing service.
Security Transactions — Security transactions are accounted for as of the trade date. Net realized gains and losses are determined on the identified cost basis, which is also used for federal income tax purposes. Certain countries impose taxes on realized gains on the sale of securities registered in their country. The fund records the foreign tax expense, if any, on an accrual basis. The foreign tax expense on realized gains and unrealized appreciation reduces the net realized gain (loss) on investment transactions and net unrealized appreciation (depreciation) on investments, respectively.
Investment Income — Dividend income less foreign taxes withheld, if any, is recorded as of the ex-dividend date. Distributions received on securities that represent a return of capital or long-term capital gain are recorded as a reduction of cost of investments and/or as a realized gain. The fund may estimate the components of distributions received that may be considered nontaxable distributions or long-term capital gain distributions for income tax purposes. Interest income is recorded on the accrual basis and includes accretion of discounts and amortization of premiums.
Foreign Currency Translations — All assets and liabilities initially expressed in foreign currencies are translated into U.S. dollars at prevailing exchange rates at period end. The fund may enter into spot foreign currency exchange contracts to facilitate transactions denominated in a foreign currency. Purchases and sales of investment securities, dividend and interest income, spot foreign currency exchange contracts, and expenses are translated at the rates of exchange prevailing on the respective dates of such transactions. Net realized and unrealized foreign currency exchange gains or losses related to investment securities are a component of net realized gain (loss) on investment transactions and change in net unrealized appreciation (depreciation) on investments, respectively.
Repurchase Agreements — The fund may enter into repurchase agreements with institutions that American Century Investment Management, Inc. (ACIM) (the investment advisor) has determined are creditworthy pursuant to criteria adopted by the Board of Directors. The fund requires that the collateral, represented by securities, received in a repurchase transaction be transferred to the custodian in a manner sufficient to enable the fund to obtain those securities in the event of a default under the repurchase agreement. ACIM monitors, on a daily basis, the securities transferred to ensure the value, including accrued interest, of the securities under each repurchase agreement is equal to or greater than amounts owed to the fund under each repurchase agreement.
Joint Trading Account — Pursuant to an Exemptive Order issued by the Securities and Exchange Commission, the fund, along with certain other funds in the American Century Investments family of funds, may transfer uninvested cash balances into a joint trading account. These balances are invested in one or more repurchase agreements that are collateralized by U.S. Treasury or Agency obligations.
Income Tax Status — It is the fund’s policy to distribute substantially all net investment income and net realized gains to shareholders and to otherwise qualify as a regulated investment company under provisions of the Internal Revenue Code. Accordingly, no provision has been made for income taxes. The fund files U.S. federal, state, local and non-U.S. tax returns as applicable. The fund's tax returns are subject to examination by the relevant taxing authority until expiration of the applicable statute of limitations, which is generally three years from the date of filing but can be longer in certain jurisdictions. At this time, management believes there are no uncertain tax positions which, based on their technical merit, would not be sustained upon examination and for which it is reasonably possible that the total amounts of unrecognized tax benefits will significantly change in the next twelve months.
Multiple Class — All shares of the fund represent an equal pro rata interest in the net assets of the class to which such shares belong, and have identical voting, dividend, liquidation and other rights and the same terms and conditions, except for class specific expenses and exclusive rights to vote on matters affecting only individual classes. Income, non-class specific expenses, and realized and unrealized capital gains and losses of the fund are allocated to each class of shares based on their relative net assets.
17
Distributions to Shareholders — Distributions from net investment income and net realized gains, if any, are generally declared and paid annually. The fund may make distributions on a more frequent basis to comply with the distribution requirements of the Internal Revenue Code, in all events in a manner consistent with provisions of the 1940 Act.
Indemnifications — Under the corporation’s organizational documents, its officers and directors are indemnified against certain liabilities arising out of the performance of their duties to the fund. In addition, in the normal course of business, the fund enters into contracts that provide general indemnifications. The maximum exposure under these arrangements is unknown as this would involve future claims that may be made against a fund. The risk of material loss from such claims is considered by management to be remote.
3. Fees and Transactions with Related Parties
Certain officers and directors of the corporation are also officers and/or directors of American Century Companies, Inc. (ACC). The corporation’s investment advisor, ACIM, the corporation's distributor, American Century Investment Services, Inc., and the corporation’s transfer agent, American Century Services, LLC, are wholly owned, directly or indirectly, by ACC. Various funds issued by American Century Asset Allocation Portfolios, Inc. own, in aggregate, 100% of the shares of the fund. Related parties do not invest in the fund for the purpose of exercising management or control.
Management Fees — The corporation has entered into a management agreement with ACIM, under which ACIM provides the fund with investment advisory and management services in exchange for a single, unified management fee (the fee) per class. The agreement provides that all expenses of managing and operating the fund, except brokerage expenses, taxes, interest, fees and expenses of the independent directors (including legal counsel fees), and extraordinary expenses, will be paid by ACIM. The fee is computed and accrued daily based on each class's daily net assets and paid monthly in arrears. The difference in the fee among the classes is a result of their separate arrangements for non-Rule 12b-1 shareholder services, which may be provided indirectly through another American Century Investments mutual fund. It is not the result of any difference in advisory or custodial fees or other expenses related to the management of the fund’s assets, which do not vary by class. The rate of the fee is determined by applying a fee rate calculation formula. This formula takes into account the fund’s assets as well as certain assets, if any, of other clients of the investment advisor outside the American Century Investments family of funds (such as subadvised funds and separate accounts) that use very similar investment teams and strategies (strategy assets). The strategy assets of the fund also include the assets of International Value Fund, one fund in a series issued by the corporation. The investment advisor agreed to waive the G Class’s management fee in its entirety. The investment advisor expects this waiver to remain in effect permanently and cannot terminate it without the approval of the Board of Directors.
The management fee schedule range and the effective annual management fee before and after waiver for each class for the period ended November 30, 2018 are as follows:
| Effective Annual Management Fee | |||
| Management Fee Schedule Range | Before Waiver | After Waiver | |
| Investor Class | 1.100% to 1.300% | 1.28% | 1.28% |
| G Class | 0.750% to 0.950% | 0.93% | 0.00% |
Directors' Fees and Expenses — The Board of Directors is responsible for overseeing the investment advisor’s management and operations of the fund. The directors receive detailed information about the fund and its investment advisor regularly throughout the year, and meet at least quarterly with management of the investment advisor to review reports about fund operations. The fund’s officers do not receive compensation from the fund.
Interfund Transactions — The fund may enter into security transactions with other American Century Investments funds and other client accounts of the investment advisor, in accordance with the 1940 Act rules and procedures adopted by the Board of Directors. The rules and procedures require, among other things, that these transactions be effected at the independent current market price of the security. During the period, the interfund purchases were $1,365,638 and there were no interfund sales.
18
4. Investment Transactions
Purchases and sales of investment securities, excluding short-term investments, for the period ended November 30, 2018 were $714,027,866 and $694,721,150, respectively.
5. Capital Share Transactions
Transactions in shares of the fund were as follows:
| Year ended November 30, 2018 | Year ended November 30, 2017 | |||||||||
| Shares | Amount | Shares | Amount | |||||||
| Investor Class/Shares Authorized | 290,000,000 | 250,000,000 | ||||||||
| Sold | 3,651,240 | $ | 37,375,720 | 2,144,328 | $ | 20,023,440 | ||||
| Issued in reinvestment of distributions | 697,526 | 7,142,667 | 706,751 | 6,184,068 | ||||||
| Redeemed | (2,992,499 | ) | (28,821,565 | ) | (2,892,490 | ) | (29,614,935 | ) | ||
| 1,356,267 | 15,696,822 | (41,411 | ) | (3,407,427 | ) | |||||
| G Class/Shares Authorized | 710,000,000 | 640,000,000 | ||||||||
| Sold | 7,898,598 | 78,787,132 | 11,463,291 | 115,098,247 | ||||||
| Issued in reinvestment of distributions | 2,480,183 | 25,397,074 | 2,139,873 | 18,723,887 | ||||||
| Redeemed | (9,819,811 | ) | (101,616,279 | ) | (13,518,000 | ) | (132,347,786 | ) | ||
| 558,970 | 2,567,927 | 85,164 | 1,474,348 | |||||||
| R6 Class/Shares Authorized | N/A | N/A | ||||||||
| Sold | 1,980,937 | 18,309,291 | ||||||||
| Issued in reinvestment of distributions | 247,318 | 2,164,034 | ||||||||
| Redeemed | (8,948,145 | ) | (90,664,029 | ) | ||||||
| (6,719,890 | ) | (70,190,704 | ) | |||||||
| Net increase (decrease) | 1,915,237 | $ | 18,264,749 | (6,676,137 | ) | $ | (72,123,783 | ) | ||
6. Fair Value Measurements
The fund’s investments valuation process is based on several considerations and may use multiple inputs to determine the fair value of the investments held by the fund. In conformity with accounting principles generally accepted in the United States of America, the inputs used to determine a valuation are classified into three broad levels.
| • | Level 1 valuation inputs consist of unadjusted quoted prices in an active market for identical investments. |
| • | Level 2 valuation inputs consist of direct or indirect observable market data (including quoted prices for comparable investments, evaluations of subsequent market events, interest rates, prepayment speeds, credit risk, etc.). These inputs also consist of quoted prices for identical investments initially expressed in local currencies that are adjusted through translation into U.S. dollars. |
| • | Level 3 valuation inputs consist of unobservable data (including a fund’s own assumptions). |
The level classification is based on the lowest level input that is significant to the fair valuation measurement. The valuation inputs are not necessarily an indication of the risks associated with investing in these securities or other financial instruments.
19
The following is a summary of the level classifications as of period end. The Schedule of Investments provides additional information on the fund’s portfolio holdings.
| Level 1 | Level 2 | Level 3 | ||||||
| Assets | ||||||||
| Investment Securities | ||||||||
| Common Stocks | $ | 9,492,460 | $ | 800,209,802 | — | |||
| Exchange-Traded Funds | 17,765,380 | — | — | |||||
| Temporary Cash Investments | 1,662 | 4,067,681 | — | |||||
| $ | 27,259,502 | $ | 804,277,483 | — | ||||
7. Risk Factors
There are certain risks involved in investing in foreign securities. These risks include those resulting from future adverse political, social and economic developments, fluctuations in currency exchange rates, the possible imposition of exchange controls, and other foreign laws or restrictions. Investing in emerging markets may accentuate these risks.
The fund invests in common stocks of small companies. Because of this, the fund may be subject to greater risk and market fluctuations than a fund investing in larger, more established companies.
Investing a significant portion of assets in one country or region makes the fund more dependent upon the political economic circumstances of that particular country or region than a fund that is more widely diversified.
8. Federal Tax Information
On December 18, 2018, the fund declared and paid the following per-share distributions from net investment income to shareholders of record on December 17, 2018:
| Investor Class | G Class |
| $0.2400 | $0.3499 |
The tax character of distributions paid during the years ended November 30, 2018 and November 30, 2017 were as follows:
| 2018 | 2017 | |||||
| Distributions Paid From | ||||||
| Ordinary income | $ | 32,539,741 | $ | 27,071,989 | ||
| Long-term capital gains | — | — | ||||
The book-basis character of distributions made during the year from net investment income or net realized gains may differ from their ultimate characterization for federal income tax purposes. These differences reflect the differing character of certain income items and net realized gains and losses for financial statement and tax purposes, and may result in reclassification among certain capital accounts on the financial statements.
20
As of period end, the federal tax cost of investments and the components of distributable earnings on a tax-basis were as follows:
| Federal tax cost of investments | $ | 860,901,898 | |
| Gross tax appreciation of investments | $ | 41,541,341 | |
| Gross tax depreciation of investments | (70,906,254 | ) | |
| Net tax appreciation (depreciation) of investments | (29,364,913 | ) | |
| Net tax appreciation (depreciation) on translation of assets and liabilities in foreign currencies | (27,167 | ) | |
| Net tax appreciation (depreciation) | $ | (29,392,080 | ) |
| Undistributed ordinary income | $ | 27,793,242 | |
Accumulated short-term capital losses | $ | (46,396,868 | ) |
The difference between book-basis and tax-basis unrealized appreciation (depreciation) is attributable primarily to the tax deferral of losses on wash sales.
Accumulated capital losses represent net capital loss carryovers that may be used to offset future realized capital gains for federal income tax purposes. The capital loss carryovers may be carried forward for an unlimited period. Future capital loss carryover utilization in any given year may be subject to Internal Revenue Code limitations.
21
| Financial Highlights |
| For a Share Outstanding Throughout the Years Ended November 30 (except as noted) | |||||||||||||
| Per-Share Data | Ratios and Supplemental Data | ||||||||||||
| Income From Investment Operations: | Ratio to Average Net Assets of: | ||||||||||||
| Net Asset Value, Beginning of Period | Net Investment Income (Loss)(1) | Net Realized and Unrealized Gain (Loss) | Total From Investment Operations | Distributions From Net Investment Income | Net Asset Value, End of Period | Total Return(2) | Operating Expenses | Net Investment Income (Loss) | Portfolio Turnover Rate | Net Assets, End of Period (in thousands) | |||
| Investor Class | |||||||||||||
| 2018 | $10.53 | 0.25 | (1.47) | (1.22) | (0.31) | $9.00 | (11.95)% | 1.29% | 2.48% | 76% | $219,273 | ||
| 2017 | $8.73 | 0.24 | 1.83 | 2.07 | (0.27) | $10.53 | 24.32% | 1.29% | 2.44% | 79% | $242,242 | ||
| 2016 | $9.24 | 0.25 | (0.56) | (0.31) | (0.20) | $8.73 | (3.42)% | 1.30% | 2.88% | 81% | $201,138 | ||
2015(3) | $10.00 | 0.20 | (0.96) | (0.76) | — | $9.24 | (7.60)% | 1.30%(4) | 2.95%(4) | 55% | $194,181 | ||
| G Class | |||||||||||||
| 2018 | $10.59 | 0.38 | (1.48) | (1.10) | (0.38) | $9.11 | (10.79)% | 0.01%(5) | 3.76%(5) | 76% | $616,338 | ||
| 2017 | $8.75 | 0.29 | 1.84 | 2.13 | (0.29) | $10.59 | 24.99% | 0.69%(6) | 3.04%(6) | 79% | $710,717 | ||
| 2016 | $9.25 | 0.26 | (0.55) | (0.29) | (0.21) | $8.75 | (3.16)% | 1.10% | 3.08% | 81% | $586,173 | ||
2015(3) | $10.00 | 0.21 | (0.96) | (0.75) | — | $9.25 | (7.50)% | 1.10%(4) | 3.15%(4) | 55% | $544,369 | ||
| Notes to Financial Highlights |
| (1) | Computed using average shares outstanding throughout the period. |
| (2) | Total returns are calculated based on the net asset value of the last business day. Total returns for periods less than one year are not annualized. |
| (3) | March 19, 2015 (fund inception) through November 30, 2015. |
| (4) | Annualized. |
| (5) | The ratio of operating expenses to average net assets before expense waiver and the ratio of net investment income (loss) to average net assets before expense waiver was 0.94% and 2.83%, respectively. |
| (6) | The ratio of operating expenses to average net assets before expense waiver and the ratio of net investment income (loss) to average net assets before expense waiver was 1.04% and 2.69%, respectively. |
See Notes to Financial Statements.
| Report of Independent Registered Public Accounting Firm |
To the Shareholders and the Board of Directors of American Century World Mutual Funds, Inc.:
Opinion on the Financial Statements and Financial Highlights
We have audited the accompanying statement of assets and liabilities, including the schedule of investments, of NT International Value Fund, one of the funds constituting the American Century World Mutual Funds, Inc. (the “Fund”), as of November 30, 2018, the related statement of operations for the year then ended, the statements of changes in net assets for each of the two years in the period then ended, the financial highlights for the years ended November 30, 2018, November 30, 2017, November 30, 2016, and for the period March 19, 2015 (fund inception) through November 30, 2015, and the related notes. In our opinion, the financial statements and financial highlights present fairly, in all material respects, the financial position of NT International Value Fund of the American Century World Mutual Funds, Inc. as of November 30, 2018, the results of its operations for the year then ended, the changes in its net assets for each of the two years in the period then ended, and the financial highlights for the years ended November 30, 2018, November 30, 2017, November 2016, and for the period March 19, 2015 (fund inception) through November 30, 2015, in conformity with accounting principles generally accepted in the United States of America.
Basis for Opinion
These financial statements and financial highlights are the responsibility of the Fund's management. Our responsibility is to express an opinion on the Fund’s financial statements and financial highlights based on our audits. We are a public accounting firm registered with the Public Company Accounting Oversight Board (United States) (PCAOB) and are required to be independent with respect to the Fund in accordance with the U.S. federal securities laws and the applicable rules and regulations of the Securities and Exchange Commission and the PCAOB.
We conducted our audits in accordance with the standards of the PCAOB. Those standards require that we plan and perform the audit to obtain reasonable assurance about whether the financial statements and financial highlights are free of material misstatement, whether due to error or fraud. The Fund is not required to have, nor were we engaged to perform, an audit of its internal control over financial reporting. As part of our audits we are required to obtain an understanding of internal control over financial reporting but not for the purpose of expressing an opinion on the effectiveness of the Fund’s internal control over financial reporting. Accordingly, we express no such opinion.
Our audits included performing procedures to assess the risks of material misstatement of the financial statements and financial highlights, whether due to error or fraud, and performing procedures that respond to those risks. Such procedures included examining, on a test basis, evidence regarding the amounts and disclosures in the financial statements and financial highlights. Our audits also included evaluating the accounting principles used and significant estimates made by management, as well as evaluating the overall presentation of the financial statements and financial highlights. Our procedures included confirmation of securities owned as of November 30, 2018, by correspondence with the custodian and brokers; when replies were not received from brokers, we performed other auditing procedures. We believe that our audits provide a reasonable basis for our opinion.
DELOITTE & TOUCHE LLP
Kansas City, Missouri
January 17, 2019
We have served as the auditor of one or more American Century investment companies since 1997.
23
| Management |
The Board of Directors
The individuals listed below serve as directors of the funds. Each director will continue to serve in this capacity until death, retirement, resignation or removal from office. The board has adopted a mandatory retirement age for directors who are not “interested persons,” as that term is defined in the Investment Company Act (independent directors). Independent directors shall retire by December 31 of the year in which they reach their 75th birthday.
Mr. Thomas is an “interested person” because he currently serves as President and Chief Executive Officer of American Century Companies, Inc. (ACC), the parent company of American Century Investment Management, Inc. (ACIM or the advisor). The other directors (more than three-fourths of the total number) are independent. They are not employees, directors or officers of, and have no financial interest in, ACC or any of its wholly owned, direct or indirect, subsidiaries, including ACIM, American Century Investment Services, Inc. (ACIS) and American Century Services, LLC (ACS), and they do not have any other affiliations, positions or relationships that would cause them to be considered “interested persons” under the Investment Company Act. The directors serve in this capacity for seven (in the case of Jonathan S. Thomas, 16; and Stephen E. Yates, 8) registered investment companies in the American Century Investments family of funds.
The following table presents additional information about the directors. The mailing address for each director is 4500 Main Street, Kansas City, Missouri 64111.
| Name (Year of Birth) | Position(s) Held with Funds | Length of Time Served | Principal Occupation(s) During Past 5 Years | Number of American Century Portfolios Overseen by Director | Other Directorships Held During Past 5 Years |
| Independent Directors | |||||
| Thomas W. Bunn (1953) | Director | Since 2017 | Retired | 68 | SquareTwo Financial; Barings (formerly Babson Capital Funds Trust) (2013 to 2016) |
| Barry Fink (1955) | Director | Since 2012 (independent since 2016) | Retired; Executive Vice President, ACC (2007 to 2013); President, ACS (2007 to 2013) | 68 | None |
| Jan M. Lewis (1957) | Director | Since 2011 | Retired; President and Chief Executive Officer, Catholic Charities of Northeast Kansas (human services organization) (2006 to 2013) | 68 | None |
M. Jeannine Strandjord(1) (1945) | Director | Since 1994 | Self-employed Consultant | 68 | Euronet Worldwide Inc. and MGP Ingredients, Inc. |
24
| Name (Year of Birth) | Position(s) Held with Funds | Length of Time Served | Principal Occupation(s) During Past 5 Years | Number of American Century Portfolios Overseen by Director | Other Directorships Held During Past 5 Years |
| Independent Directors | |||||
| John R. Whitten (1946) | Director | Since 2008 | Retired | 68 | Rudolph Technologies, Inc. |
| Stephen E. Yates (1948) | Director and Chairman of the Board | Since 2012 (Chairman since 2018) | Retired | 73 | None |
| Interested Director | |||||
| Jonathan S. Thomas (1963) | Director and President | Since 2007 | President and Chief Executive Officer, ACC (2007 to present). Also serves as Chief Executive Officer, ACS; Executive Vice President, ACIM; Director, ACC, ACIM and other ACC subsidiaries | 118 | BioMed Valley Discoveries, Inc. |
(1) Effective December 31, 2018, M. Jeannine Strandjord retired from the Board of Directors.
The Statement of Additional Information has additional information about the fund's directors and is available without charge, upon request, by calling 1-800-345-2021.
25
Officers
The following table presents certain information about the executive officers of the funds. Each officer serves as an officer for each of the 16 (in the case of Robert J. Leach, 15) investment companies in the American Century family of funds. No officer is compensated for his or her service as an officer of the funds. The listed officers are interested persons of the funds and are appointed or re-appointed on an annual basis. The mailing address for each officer listed below is 4500 Main Street, Kansas City, Missouri 64111.
| Name (Year of Birth) | Offices with the Funds | Principal Occupation(s) During the Past Five Years |
| Jonathan S. Thomas (1963) | Director and President since 2007 | President and Chief Executive Officer, ACC (2007 to present). Also serves as Chief Executive Officer, ACS; Executive Vice President, ACIM; Director, ACC, ACIM and other ACC subsidiaries |
| R. Wes Campbell (1974) | Chief Financial Officer and Treasurer since 2018 | Investment Operations and Investment Accounting, ACS (2000 to present) |
| Amy D. Shelton (1964) | Chief Compliance Officer and Vice President since 2014 | Chief Compliance Officer, American Century funds, (2014 to present); Chief Compliance Officer, ACIM (2014 to present); Chief Compliance Officer, ACIS (2009 to present); Vice President, Client Interactions and Marketing, ACIS (2013 to 2014). Also serves as Vice President, ACIS |
| Charles A. Etherington (1957) | General Counsel since 2007 and Senior Vice President since 2006 | Attorney, ACC (1994 to present); Vice President, ACC (2005 to present); General Counsel, ACC (2007 to present). Also serves as General Counsel, ACIM, ACS, ACIS and other ACC subsidiaries; and Senior Vice President, ACIM and ACS |
| C. Jean Wade (1964) | Vice President since 2012 | Senior Vice President, ACS (2017 to present); Vice President, ACS (2000 to 2017) |
| Robert J. Leach (1966) | Vice President since 2006 | Vice President, ACS (2000 to present) |
| David H. Reinmiller (1963) | Vice President since 2000 | Attorney, ACC (1994 to present). Also serves as Vice President, ACIM and ACS |
| Ward D. Stauffer (1960) | Secretary since 2005 | Attorney, ACC (2003 to present) |
26
| Approval of Management Agreement |
At a meeting held on June 28, 2018, the Fund’s Board of Directors (the "Board") unanimously approved the renewal of the management agreement pursuant to which American Century Investment Management, Inc. (the “Advisor”) acts as the investment advisor for the Fund. Under Section 15(c) of the Investment Company Act, contracts for investment advisory services are required to be reviewed, evaluated, and approved by a majority of a fund’s directors (the “Directors”), including a majority of the independent Directors, each year.
Prior to its consideration of the renewal of the management agreement, the Directors requested and reviewed extensive data and information compiled by the Advisor and certain independent providers of evaluation data concerning the Fund and the services provided to the Fund by the Advisor. This review was in addition to the oversight and evaluation undertaken by the Board and its committees on a continual basis and the information received was supplemental to the extensive information that the Board and its committees receive and consider throughout the year. The Directors also conducted a review of the process by which the Board considers the renewal of the management agreements. The Board consulted with industry experts and reviewed industry best practices and recent judicial precedent. The Directors believe that the enhancements resulting from their review resulted in increased dialogue with the Advisor and an improved process for fund shareholders.
In connection with its consideration of the renewal of the management agreement, the Board’s review and evaluation of the services provided by the Advisor included, but was not limited to, the following:
| • | the nature, extent, and quality of investment management, shareholder services, and other services provided and to be provided to the Fund; |
| • | the wide range of other programs and services provided and to be provided to the Fund and its shareholders on a routine and non-routine basis; |
| • | the investment performance of the Fund, including data comparing the Fund's performance to appropriate benchmarks and/or a peer group of other mutual funds with similar investment objectives and strategies; |
| • | the cost of owning the Fund compared to the cost of owning similar funds; |
| • | the compliance policies, procedures, and regulatory experience of the Advisor and the Fund's service providers; |
| • | financial data showing the cost of services provided to the Fund, the profitability of the Fund to the Advisor, and the overall profitability of the Advisor |
| • | strategic plans of the Advisor; |
| • | any economies of scale associated with the Advisor’s management of the Fund and other accounts; |
| • | services provided and charges to the Advisor's other investment management clients; |
| • | acquired fund fees and expenses; |
| • | payments and practices in connection with financial intermediaries holding shares of the Fund and the services provided by intermediaries in connection therewith; and |
| • | any collateral benefits derived by the Advisor from the management of the Fund. |
The Directors held two in-person meetings and one telephonic meeting to review and discuss the information provided. The independent Directors also reviewed responses to supplemental information requests provided by the Directors to the Advisor and held active discussions with the Advisor regarding the renewal of the management agreement. The independent Directors had the benefit of the advice of their independent counsel throughout the process.
27
Factors Considered
The Directors considered all of the information provided by the Advisor, the independent data providers, and independent counsel in connection with the approval. They determined that the information was sufficient for them to evaluate the management agreement for the Fund. In connection with their review, the Directors did not identify any single factor as being all-important or controlling, and each Director may have attributed different levels of importance to different factors. In deciding to renew the management agreement, the Board based its decision on a number of factors, including without limitation the following:
Nature, Extent and Quality of Services - Generally. Under the management agreement, the Advisor is responsible for providing or arranging for all services necessary for the operation of the Fund. The Board noted that the Advisor provides or arranges at its own expense a wide variety of services including without limitation the following:
| • | portfolio research and security selection |
| • | securities trading |
| • | Fund administration |
| • | custody of Fund assets |
| • | daily valuation of the Fund’s portfolio |
| • | shareholder servicing and transfer agency, including shareholder confirmations, recordkeeping, and communications |
| • | legal services (except the independent Directors’ counsel) |
| • | regulatory and portfolio compliance |
| • | financial reporting |
| • | marketing and distribution (except amounts paid by the Fund under Rule 12b-1 plans) |
The Board noted that many of these services have expanded over time in terms of both quantity and complexity in response to shareholder demands, competition in the industry, changing distribution channels, and the changing regulatory environment.
Investment Management Services. The nature of the investment management services provided to the Fund is quite complex and allows Fund shareholders access to professional money management, instant diversification of their investments within an asset class, the opportunity to easily diversify among asset classes by investing in or exchanging among various American Century Investments funds, and liquidity. In evaluating investment performance, the Board expects the Advisor to manage the Fund in accordance with its investment objectives and approved strategies. Further, the Directors recognize that the Advisor has an obligation to monitor trading activities, and in particular to seek the best execution of fund trades, and to evaluate the use of and payment for research. In providing these services, the Advisor utilizes teams of investment professionals (portfolio managers, analysts, research assistants, and securities traders) who require extensive information technology, research, training, compliance, and other systems to conduct their business. The Board, directly and through its Fund Performance Review Committee, provides oversight of the investment performance process. It regularly reviews investment performance information for the Fund, together with comparative information for appropriate benchmarks and/or peer groups of similarly-managed funds, over different time horizons. The Directors also review detailed performance information provided by the Advisor during the management agreement renewal process. If performance concerns are identified, the Fund receives special reviews until performance improves, during which the Board receives a report from the Advisor regarding the reasons for such results (e.g., market conditions, security selection) and any efforts being undertaken to improve performance. The Fund’s performance was above its benchmark for the one-year period reviewed by the Board. The Board found the investment management services provided by the Advisor to the Fund to be satisfactory and consistent with the management agreement.
28
Shareholder and Other Services. Under the management agreement, the Advisor provides the Fund with a comprehensive package of transfer agency, shareholder, and other services. The Board, directly and through various committees of the Board, regularly reviews reports and evaluations of such services at its regular meetings. These reports include, but are not limited to, information regarding the operational efficiency and accuracy of the shareholder and transfer agency services provided, staffing levels, shareholder satisfaction (as measured by external as well as internal sources), technology support, new products and services offered to Fund shareholders, securities trading activities, portfolio valuation services, auditing services, and legal and operational compliance activities. The Board found the services provided by the Advisor to the Fund under the management agreement to be competitive and of high quality.
Costs of Services and Profitability. The Advisor provides detailed information concerning its cost of providing various services to the Fund, its profitability in managing the Fund (pre- and post-distribution), its overall profitability, and its financial condition. The Directors have reviewed with the Advisor the methodology used to prepare this financial information. This information is considered in evaluating the Advisor’s financial condition, its ability to continue to provide services under the management agreement, and the reasonableness of the current management fee. The Board concluded that the Advisor’s profits were reasonable in light of the services provided to the Fund.
Ethics. The Board generally considers the Advisor’s commitment to providing quality services to shareholders and to conducting its business ethically. They noted that the Advisor’s practices generally meet or exceed industry best practices.
Economies of Scale. The Board also reviewed information provided by the Advisor regarding the possible existence of economies of scale in connection with the management of the Fund. The Board concluded that economies of scale are difficult to measure and predict with precision, especially on a fund-by-fund basis. The Board concluded that the Advisor is appropriately sharing economies of scale through its competitive fee structure, offering competitive fees from fund inception, and through reinvestment in its business to provide shareholders additional content and services. The Board also noted that economies of scale are shared with the Fund and its shareholders through management fee breakpoints that serve to reduce the effective management fee as the assets of the Fund grow.
Comparison to Other Funds’ Fees. The management agreement provides that the Fund pays the Advisor a single, all-inclusive (or unified) management fee for providing all services necessary for the management and operation of the Fund, other than brokerage expenses, expenses attributable to short sales, taxes, interest, extraordinary expenses, and the fees and expenses of the Fund’s independent Directors (including their independent legal counsel) and expenses incurred in connection with the provision of shareholder services and distribution services under a plan adopted pursuant to Rule 12b-1 under the 1940 Act. Under the unified fee structure, the Advisor is responsible for providing all investment advisory, custody, audit, administrative, compliance, recordkeeping, marketing and shareholder services, or arranging and supervising third parties to provide such services. By contrast, most other funds are charged a variety of fees, including an investment advisory fee, a transfer agency fee, an administrative fee, distribution charges, and other expenses. Other than their investment advisory fees and any applicable Rule 12b-1 distribution fees, all other components of the total fees charged by these other funds may be increased without shareholder approval. The Board believes the unified fee structure is a benefit to Fund shareholders because it clearly discloses to shareholders the cost of owning Fund shares, and, since the unified fee cannot be increased without a vote of Fund shareholders, it shifts to the Advisor the risk of increased costs of operating the Fund and provides a direct incentive to minimize administrative inefficiencies. Part of the Board’s analysis of fee levels involves reviewing certain evaluative data compiled by an independent provider comparing the Fund’s unified fee to the total expense ratios of its peers. The unified fee charged to shareholders of the Fund was above the median of the total expense ratios of the Fund’s peer expense universe and was within the range of its peer expense group. The Board concluded that the management fee paid by the
29
Fund to the Advisor under the management agreement is reasonable in light of the services provided to the Fund.
Comparison to Fees and Services Provided to Other Clients of the Advisor. The Directors also requested and received information from the Advisor concerning the nature of the services, fees, costs, and profitability of its advisory services to advisory clients other than the Fund. They observed that these varying types of client accounts require different services and involve different regulatory and entrepreneurial risks than the management of the Fund. The Board analyzed this information and concluded that the fees charged and services provided to the Fund were reasonable by comparison.
Payments to Intermediaries. The Directors also requested and received a description of payments made to intermediaries by the Fund and the Advisor and services provided in response thereto. These payments include various payments made by the Fund or the Advisor to different types of intermediaries and recordkeepers for distribution and service activities provided for the Fund. The Board reviewed such information and received representations from the Advisor that all such payments by the Fund were made pursuant to the Fund's Rule 12b-1 Plan and that all such payments by the Advisor were made from the Advisor’s resources and reasonable profits. The Board found the payments to be reasonable in scope and purpose.
Collateral or “Fall-Out” Benefits Derived by the Advisor. The Board considered the existence of collateral benefits the Advisor may receive as a result of its relationship with the Fund. They concluded that the Advisor’s primary business is managing mutual funds and it generally does not use fund or shareholder information to generate profits in other lines of business, and therefore does not derive any significant collateral benefits from them. The Board noted that additional assets from other clients may offer the Advisor some benefit from increased leverage with service providers and counterparties. Additionally, the Advisor may receive proprietary research from broker-dealers that execute fund portfolio transactions, which the Board concluded is likely to benefit other clients of the Advisor, as well as Fund shareholders. The Board also determined that the Advisor is able to provide investment management services to certain clients other than the Fund, at least in part, due to its existing infrastructure built to serve the fund complex. The Board concluded that appropriate allocation methodologies had been employed to assign resources and the cost of those resources to these other clients and, where expressly provided, these other client assets may be included with the assets of the Fund to determine breakpoints in the management fee schedule.
Existing Relationship. The Board also considered whether there was any reason for not continuing the existing arrangement with the Advisor. In this regard, the Board was mindful of the potential disruptions of the Fund’s operations and various risks, uncertainties, and other effects that could occur as a result of a decision not to continue such relationship. In particular, the Board recognized that most shareholders have invested in the Fund on the strength of the Advisor’s industry standing and reputation and in the expectation that the Advisor will have a continuing role in providing advisory services to the Fund.
Conclusion of the Directors. As a result of this process, the Board, including all of the independent Directors, taking into account all of the factors discussed above and the information provided by the Advisor and others in connection with its review and throughout the year, determined that the management fee is fair and reasonable in light of the services provided and that the investment management agreement between the Fund and the Advisor should be renewed.
30
| Additional Information |
Retirement Account Information
As required by law, distributions you receive from certain retirement accounts are subject to federal income tax withholding, unless you elect not to have withholding apply*. Tax will be withheld on the total amount withdrawn even though you may be receiving amounts that are not subject to withholding, such as nondeductible contributions. In such case, excess amounts of withholding could occur. You may adjust your withholding election so that a greater or lesser amount will be withheld.
If you don’t want us to withhold on this amount, you must notify us to not withhold the federal income tax. You may notify us in writing or in certain situations by telephone or through other electronic means. For systematic withdrawals, your withholding election will remain in effect until revoked or changed by filing a new election. You have the right to revoke your election at any time and change your withholding percentage for future distributions.
Remember, even if you elect not to have income tax withheld, you are liable for paying income tax on the taxable portion of your withdrawal. If you elect not to have income tax withheld or you don’t have enough income tax withheld, you may be responsible for payment of estimated tax. You may incur penalties under the estimated tax rules if your withholding and estimated tax payments are not sufficient. You can reduce or defer the income tax on a distribution by directly or indirectly rolling such distribution over to another IRA or eligible plan. You should consult your tax advisor for additional information.
State tax will be withheld if, at the time of your distribution, your address is within one of the mandatory withholding states and you have federal income tax withheld (or as otherwise required by state law). State taxes will be withheld from your distribution in accordance with the respective state rules.
*Some 403(b), 457 and qualified retirement plan distributions may be subject to 20% mandatory withholding, as they are subject to special tax and withholding rules. Your plan administrator or plan sponsor is required to provide you with a special tax notice explaining those rules at the time you request a distribution. If applicable, federal and/or state taxes may be withheld from your distribution amount.
Proxy Voting Policies
A description of the policies that the fund's investment advisor uses in exercising the voting rights associated with the securities purchased and/or held by the fund is available without charge, upon request, by calling 1-800-345-2021. It is also available on the "About Us" page of American Century Investments’ website at americancentury.com and on the Securities and Exchange Commission’s website at sec.gov. Information regarding how the investment advisor voted proxies relating to portfolio securities during the most recent 12-month period ended June 30 is available on the "About Us" page at americancentury.com. It is also available at sec.gov.
Quarterly Portfolio Disclosure
The fund files its complete schedule of portfolio holdings with the Securities and Exchange Commission (SEC) for the first and third quarters of each fiscal year on Form N-Q. The fund’s Forms N-Q are available on the SEC’s website at sec.gov. The fund also makes its complete schedule of portfolio holdings for the most recent quarter of its fiscal year available on its website at americancentury.com and, upon request, by calling 1-800-345-2021.
31
Other Tax Information
The following information is provided pursuant to provisions of the Internal Revenue Code.
The fund hereby designates up to the maximum amount allowable as qualified dividend income for the fiscal year ended November 30, 2018.
For the fiscal year ended November 30, 2018, the fund intends to pass through to shareholders foreign source income of $37,307,930 and foreign taxes paid of $3,104,163, or up to the maximum amount allowable, as a foreign tax credit. Foreign source income and foreign tax expense per outstanding share on November 30, 2018 are $0.4054 and $0.0337, respectively.
32
| ||
| Contact Us | americancentury.com | |
| Automated Information Line | 1-800-345-8765 | |
| Investor Services Representative | 1-800-345-2021 or 816-531-5575 | |
| Investors Using Advisors | 1-800-378-9878 | |
| Business, Not-For-Profit, Employer-Sponsored Retirement Plans | 1-800-345-3533 | |
| Banks and Trust Companies, Broker-Dealers, Financial Professionals, Insurance Companies | 1-800-345-6488 | |
| Telecommunications Relay Service for the Deaf | 711 | |
| American Century World Mutual Funds, Inc. | ||
Investment Advisor: American Century Investment Management, Inc. Kansas City, Missouri | ||
| This report and the statements it contains are submitted for the general information of our shareholders. The report is not authorized for distribution to prospective investors unless preceded or accompanied by an effective prospectus. | ||
| ©2019 American Century Proprietary Holdings, Inc. All rights reserved. CL-ANN-91026 1901 | ||
ITEM 2. CODE OF ETHICS.
| (a) | The registrant has adopted a Code of Ethics for Senior Financial Officers that applies to the registrant’s principal executive officer, principal financial officer, principal accounting officer, and persons performing similar functions. |
| (b) | No response required. |
| (c) | None. |
| (d) | None. |
| (e) | Not applicable. |
| (f) | The registrant’s Code of Ethics for Senior Financial Officers was filed as Exhibit 12 (a)(1) to American Century Asset Allocation Portfolios, Inc.’s Annual Certified Shareholder Report on Form N-CSR, File No. 811-21591, on September 29, 2005, and is incorporated herein by reference. |
ITEM 3. AUDIT COMMITTEE FINANCIAL EXPERT.
| (a)(1) | The registrant’s board has determined that the registrant has at least one audit committee financial expert serving on its audit committee. |
| (a)(2) | John R. Whitten and Jan M. Lewis are the registrant’s designated audit committee financial experts. They are “independent” as defined in Item 3 of Form N-CSR. |
| (a)(3) | Not applicable. |
| (b) | No response required. |
| (c) | No response required. |
| (d) | No response required. |
ITEM 4. PRINCIPAL ACCOUNTANT FEES AND SERVICES.
| (a) | Audit Fees. |
The aggregate fees billed for each of the last two fiscal years for professional services rendered by the principal accountant for the audit of the registrant’s annual financial statements or services that are normally provided by the accountant in connection with statutory and regulatory filings or engagements for those fiscal years were as follows:
FY 2017: $314,130
FY 2018: $310,910
| (b) | Audit-Related Fees. |
The aggregate fees billed in each of the last two fiscal years for assurance and related services by the principal accountant that are reasonably related to the performance of the audit of the registrant’s financial statements and are not reported under paragraph (a) of this Item were as follows:
For services rendered to the registrant:
FY 2017:$0
FY 2018:$0
Fees required to be approved pursuant to paragraph (c)(7)(ii) of Rule 2-01 of Regulation S-X (relating to certain engagements for non-audit services with the registrant’s investment adviser and its affiliates):
FY 2017:$0
FY 2018:$0
| (c) | Tax Fees. |
The aggregate fees billed in each of the last two fiscal years for professional services rendered by the principal accountant for tax compliance, tax advice, and tax planning were as follows:
For services rendered to the registrant:
FY 2017: $0
FY 2018: $0
Fees required to be approved pursuant to paragraph (c)(7)(ii) of Rule 2-01 of Regulation S-X (relating to certain engagements for non-audit services with the registrant’s investment adviser and its affiliates):
FY 2017: $0
FY 2018: $0
| (d) | All Other Fees. |
The aggregate fees billed in each of the last two fiscal years for products and services provided by the principal accountant, other than the services reported in paragraphs (a) through (c) of this Item were as follows:
For services rendered to the registrant:
FY 2017:$0
FY 2018:$0
Fees required to be approved pursuant to paragraph (c)(7)(ii) of Rule 2-01 of Regulation S-X (relating to certain engagements for non-audit services with the registrant’s investment adviser and its affiliates):
FY 2017:$0
FY 2018:$0
| (e)(1) | In accordance with paragraph (c)(7)(i)(A) of Rule 2-01 of Regulation S-X, before the accountant is engaged by the registrant to render audit or non-audit services, the engagement is approved by the registrant’s audit committee. Pursuant to paragraph (c)(7)(ii) of Rule 2-01 of Regulation S-X, the registrant’s audit committee also pre-approves its accountant’s engagements for non-audit services with the registrant’s investment adviser, its parent company, and any entity controlled by, or under common control with the investment adviser that provides ongoing services to the registrant, if the engagement relates directly to the operations and financial reporting of the registrant. |
| (e)(2) | All services described in each of paragraphs (b) through (d) of this Item were pre-approved before the engagement by the registrant’s audit committee pursuant to paragraph (c)(7)(i)(A) of Rule 2-01 of Regulation S-X. Consequently, none of such services were required to be approved by the audit committee pursuant to paragraph (c)(7)(i)(C). |
| (f) | The percentage of hours expended on the principal accountant’s engagement to audit the registrant’s financial statements for the most recent fiscal year that were attributed to work performed by persons other than the principal accountant’s full-time, permanent employees was less than 50%. |
| (g) | The aggregate non-audit fees billed by the registrant’s accountant for services rendered to the registrant, and rendered to the registrant’s investment adviser (not including any sub-adviser whose role is primarily portfolio management and is subcontracted with or overseen by another investment adviser), and any entity controlling, controlled by, or under common control with the adviser that provides ongoing services to the registrant for each of the last two fiscal years of the registrant were as follows: |
FY 2017: $104,750
FY 2018: $115,750
| (h) | The registrant’s investment adviser and accountant have notified the registrant’s audit committee of all non-audit services that were rendered by the registrant’s accountant to the registrant’s investment adviser, its parent company, and any entity controlled by, or under common control with the investment adviser that provides services to the registrant, which services were not required to be pre-approved pursuant to paragraph (c)(7)(ii) of Rule 2-01 of Regulation S-X. The notification provided to the registrant’s audit committee included sufficient details regarding such services to allow the registrant’s audit committee to consider the continuing independence of its principal accountant. |
ITEM 5. AUDIT COMMITTEE OF LISTED REGISTRANTS.
Not applicable.
ITEM 6. INVESTMENTS.
| (a) | The schedule of investments is included as part of the report to stockholders filed under Item 1 of this Form. |
| (b) | Not applicable. |
ITEM 7. DISCLOSURE OF PROXY VOTING POLICIES AND PROCEDURES FOR CLOSED-END MANAGEMENT INVESTMENT COMPANIES.
Not applicable.
ITEM 8. PORTFOLIO MANAGERS OF CLOSED-END MANAGEMENT INVESTMENT COMPANIES.
Not applicable.
ITEM 9. PURCHASES OF EQUITY SECURITIES BY CLOSED-END MANAGEMENT INVESTMENT COMPANY AND AFFILIATED PURCHASERS.
Not applicable.
ITEM 10. SUBMISSION OF MATTERS TO A VOTE OF SECURITY HOLDERS.
During the reporting period, there were no material changes to the procedures by which shareholders may recommend nominees to the registrant’s board.
ITEM 11. CONTROLS AND PROCEDURES.
| (a) | The registrant's principal executive officer and principal financial officer have concluded that the registrant's disclosure controls and procedures (as defined in Rule 30a-3(c) under the Investment Company Act of 1940) are effective based on their evaluation of these controls and procedures as of a date within 90 days of the filing date of this report. |
| (b) | There were no changes in the registrant's internal control over financial reporting (as defined in Rule 30a-3(d) under the Investment Company Act of 1940) that occurred during the period covered by this report that have materially affected, or are reasonably likely to materially affect, the registrant's internal control over financial reporting. |
ITEM 12. DISCLOSURE OF SECURITIES LENDING ACTIVITIES FOR CLOSED-END MANAGEMENT INVESTMENT COMPANIES.
Not applicable.
ITEM 13. EXHIBITS.
| (a)(1) | Registrant’s Code of Ethics for Senior Financial Officers, which is the subject of the disclosure required by Item 2 of Form N-CSR, was filed as Exhibit 12(a)(1) to American Century Asset Allocation Portfolios, Inc.’s Certified Shareholder Report on Form N-CSR, File No. 811-21591, on September 29, 2005. |
| (a)(2) | Separate certifications by the registrant’s principal executive officer and principal financial officer, pursuant to Section 302 of the Sarbanes-Oxley Act of 2002 and Rule 30a-2(a) under the Investment Company Act of 1940, are filed and attached hereto as EX-99.CERT. |
| (a)(3) | Not applicable. |
| (a)(4) | Not applicable. |
| (b) | A certification by the registrant’s chief executive officer and chief financial officer, pursuant to Section 906 of the Sarbanes-Oxley Act of 2002, is furnished and attached hereto as EX-99.906CERT. |
SIGNATURES
Pursuant to the requirements of the Securities Exchange Act of 1934 and the Investment Company Act of 1940, the registrant has duly caused this report to be signed on its behalf by the undersigned, thereunto duly authorized.
| Registrant: | American Century World Mutual Funds, Inc. | |||
| By: | /s/ Jonathan S. Thomas | |||
| Name: | Jonathan S. Thomas | |||
| Title: | President | |||
| Date: | January 25, 2019 | |||
Pursuant to the requirements of the Securities Exchange Act of 1934 and the Investment Company Act of 1940, this report has been signed below by the following persons on behalf of the registrant and in the capacities and on the dates indicated.
| By: | /s/ Jonathan S. Thomas | ||
| Name: | Jonathan S. Thomas | ||
| Title: | President | ||
| (principal executive officer) | |||
| Date: | January 25, 2019 | ||
| By: | /s/ R. Wes Campbell | ||
| Name: | R. Wes Campbell | ||
| Title: | Treasurer and | ||
| Chief Financial Officer | |||
| (principal financial officer) | |||
| Date: | January 25, 2019 | ||