0000872825ck0000872825:C000167115Member2020-12-012021-11-30
UNITED STATES
SECURITIES AND EXCHANGE COMMISSION
Washington, D.C. 20549
FORM N-CSR
CERTIFIED SHAREHOLDER REPORT OF REGISTERED
MANAGEMENT INVESTMENT COMPANIES
| | | | | | | | | | | | | | | | | | | | |
| Investment Company Act file number | 811-06247 |
| |
| AMERICAN CENTURY WORLD MUTUAL FUNDS, INC. |
| (Exact name of registrant as specified in charter) |
| |
| 4500 MAIN STREET, KANSAS CITY, MISSOURI | 64111 |
| (Address of principal executive offices) | (Zip Code) |
| |
JOHN PAK
4500 MAIN STREET, KANSAS CITY, MISSOURI 64111 |
| (Name and address of agent for service) |
| |
| Registrant’s telephone number, including area code: | 816-531-5575 |
| |
| Date of fiscal year end: | 11-30 |
| |
| Date of reporting period: | 11-30-2024 |
ITEM 1. REPORTS TO STOCKHOLDERS.
(a)
ANNUAL SHAREHOLDER REPORT
Emerging Markets Fund 
| | | | | |
Investor Class (TWMIX) | November 30, 2024 |
This annual shareholder report contains important information about Emerging Markets Fund for the period of December 1, 2023 to November 30, 2024. You can find additional information about the fund at americancentury.com/docs. You can also request this information by contacting us at 1-800-345-2021. This report describes changes to the fund that occurred during the reporting period.
| | | | | | | | |
What were the fund costs for the last year? (based on a hypothetical $10,000 investment) |
|
| Costs of a $10,000 investment | Costs paid as a percentage of a $10,000 investment |
| Investor Class | $137 | 1.27% |
|
| | | | | |
| What were the key factors that affected the fund’s performance? |
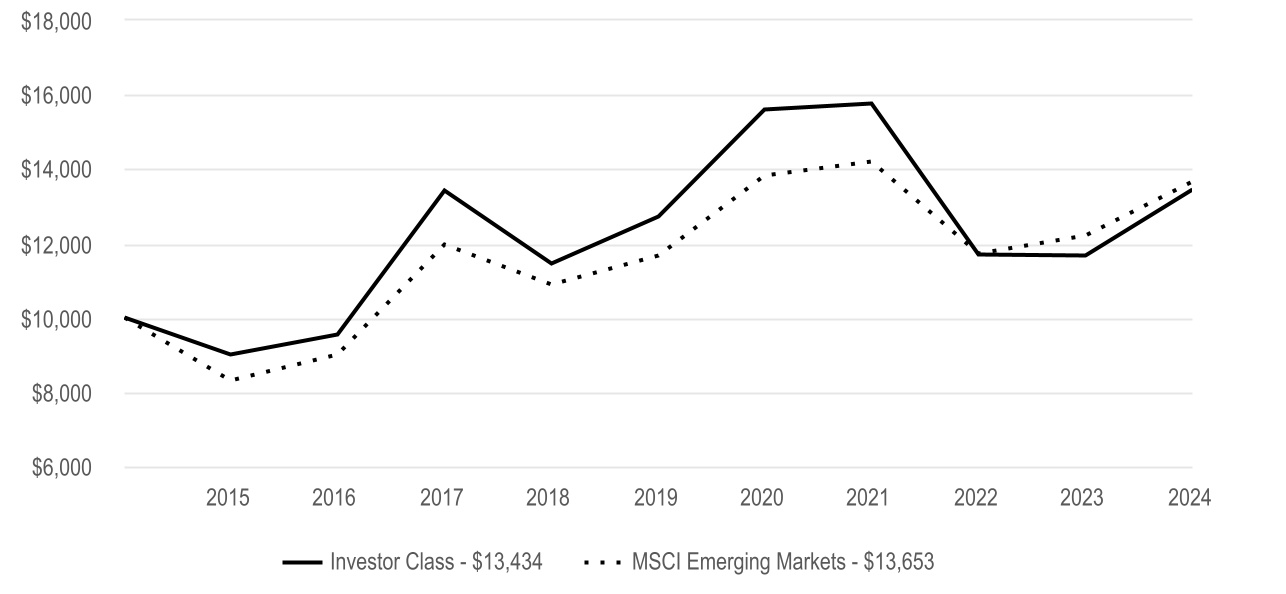
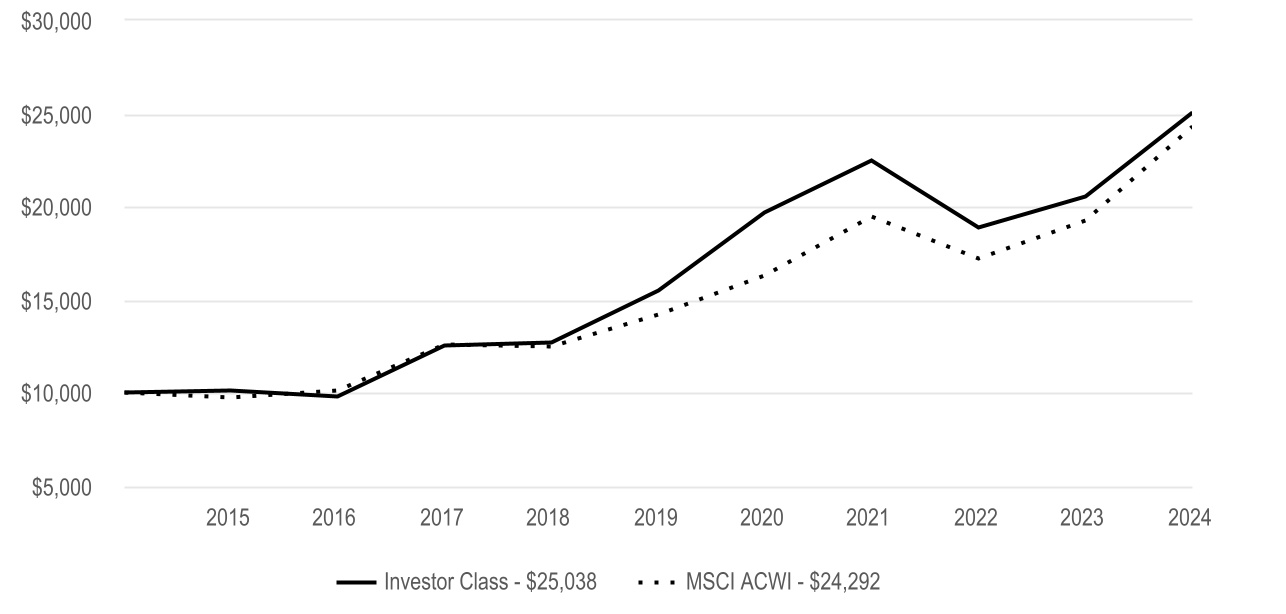
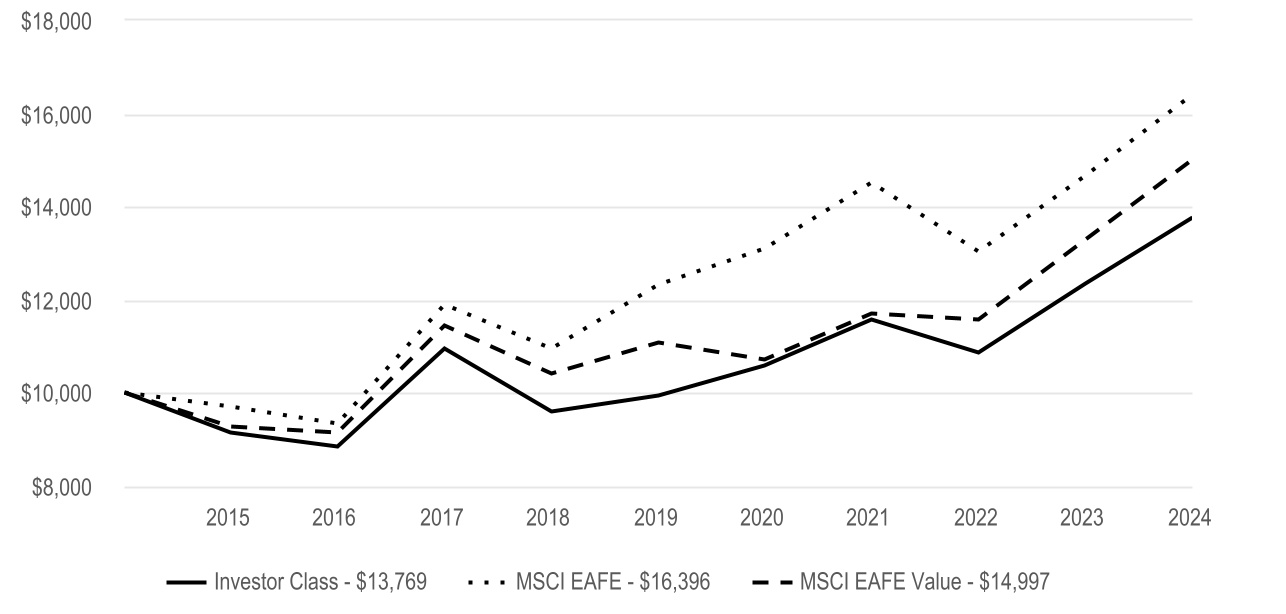
Emerging Markets Fund Investor Class returned 15.29% for the reporting period ended November 30, 2024. |
| The fund seeks capital growth. The commentary below refers to the fund's performance relative to the MSCI Emerging Markets Index. |
| • | Consumer discretionary contributed to relative performance with contributions from MakeMyTrip, an India-based travel company, and Zomato, an India-based food delivery and restaurant reservation company. Trip.com Group, a China-based travel company, benefited results as well. The fund's underweight position in the materials sector also boosted performance. |
| • | Other individual contributors included aircraft company Embraer and semiconductor business Taiwan Semiconductor Manufacturing Co. |
| • | The communication services and energy sectors were the leading detractors from relative performance. NetEase, a China-based internet technology business, and PRIO, an oil and natural gas company, dragged on results. |
| • | Other notable detractors included Samsung Electronics and Hapvida Participacoes e Investimentos, the Brazil-based health care company. Kweichow Moutai, a China-based liquor producer, and Banco BTG Pactual, a financial company based in Brazil, also hurt results. |
| | |
Cumulative Performance (based on an initial $10,000 investment) |
| November 30, 2014 through November 30, 2024 |
|
| | | | | | | | | | | | | | |
Average Annual Total Returns | |
| 1 Year | 5 Year | 10 Year | | | |
| Investor Class | 15.29% | 1.12% | 3.00% | | | |
| | | | | | |
| | | | | | |
| | | | | | |
| | | | | | |
| | | | | | |
| MSCI Emerging Markets | 11.86% | 3.20% | 3.16% | | | |
| | | | | | |
| | | | | | |
| | | | | | |
| | | | | | |
| | |
|
The opinions expressed are those of American Century Investments and are no guarantee of the future performance of any American Century Investments fund. This information is for educational purposes only and is not intended as investment advice. Data reflects past performance, assumes reinvestment of dividends and capital gains and is no guarantee of future results. Current performance may be higher or lower than data shown. Investment return and principal value will fluctuate and redemption value may be more or less than original cost, and none of the charts reflect the deduction of taxes that a shareholder would pay on fund distributions or the redemption of fund shares. Total returns for periods less than one year are not annualized. Visit americancentury.com for more recent performance information.
|
| | | | | |
Fund Statistics | |
| Net Assets | $1,785,280,256 |
| Management Fees (dollars paid during the reporting period) | $12,707,240 |
| Portfolio Turnover Rate | 29 | % |
| Total Number of Portfolio Holdings | 78 |
| |
| |
| | | | | | | | | | | | | | | | | | | | | | | | | | | | | | | | | | | | |
| Types of Investments in Portfolio (as a % of net assets) | | | | | | | | | | | | Top Five Countries (as a % of net assets) | | | | |
| Common Stocks | 99.5% | | | | | | | | | | | | | | | | | China | 27% | | | | | | |
| Short-Term Investments | 1.2% | | | | | | | | | | | | | | | | | India | 19% | | | | | | |
| Other Assets and Liabilities | (0.7)% | | | | | | | | | | | | | | | | | Taiwan | 19% | | | | | | |
| | | | | | | | | | | | | | | | | | | South Korea | 8% | | | | | | |
| | | | | | | | | | | | | | | | | | | Brazil | 6% | | | | | | |
| | | | | | | | | | | | | | | | | | | | | | | | | | |
| | | | | | | | | | | | | | | | | | | | | | | | | | |
| | | | | | | | | | | | | | | | | | | | | | | | | | |
| | | | | | | | | | | | | | | | | | | | | | | | | | |
| | | | | | | | | | | | | | | | | | | | | | | | | | |
| | | | | | | | | | | | | | | | | | | | | | | | | | |
| | | | | | | | | | | | | | | | | | | | | | | | | | |
| | | | | | | | | | | | | | | | | | | | | | | | | | |
| | | | | | | | | | | | | | | | | | | | | | | | | | |
| | | | | | | | | | | | | | | | | | | | | | | | | | |
| | | | | | | | | | | | | | | | | | | | | | | | | | |
| | |
| Fund Changes |
|
|
| Beginning October 2024, the total eligible investments required to qualify for a waiver of the annual account maintenance fee changed from $10,000 to $25,000. Such fee will also be waived for any accounts for which the shareholder has elected to receive electronic delivery of all fund/account documents. |
|
|
|
|
| | |
| For additional information about the fund, including its Prospectus, Statement of Additional Information, financial statements, holdings and proxy voting information, scan the QR code or visit americancentury.com/docs. |

| | |
|
| ©2025 American Century Proprietary Holdings, Inc. All rights reserved. |
A-25086885
ANNUAL SHAREHOLDER REPORT
Emerging Markets Fund
| | | | | |
I Class (AMKIX) | November 30, 2024 |
This annual shareholder report contains important information about Emerging Markets Fund for the period of December 1, 2023 to November 30, 2024. You can find additional information about the fund at americancentury.com/docs. You can also request this information by contacting us at 1-800-345-2021.
| | | | | | | | |
What were the fund costs for the last year? (based on a hypothetical $10,000 investment) |
|
| Costs of a $10,000 investment | Costs paid as a percentage of a $10,000 investment |
| I Class | $115 | 1.07% |
|
| | | | | |
| What were the key factors that affected the fund’s performance? |
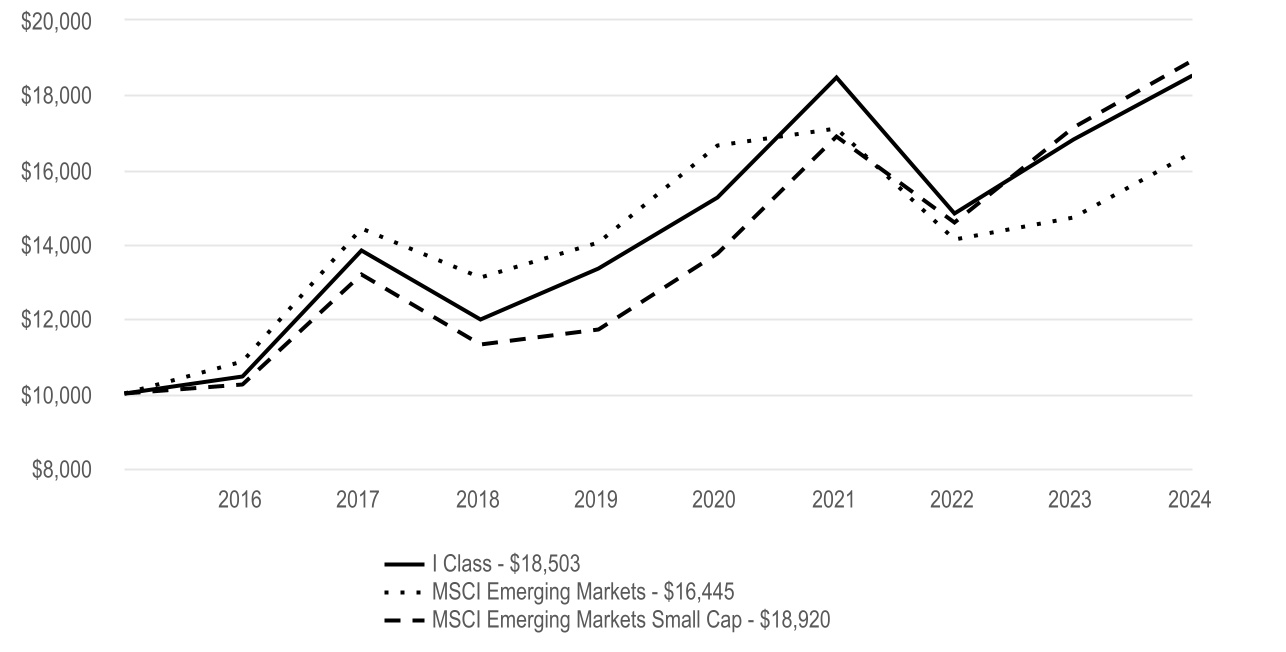
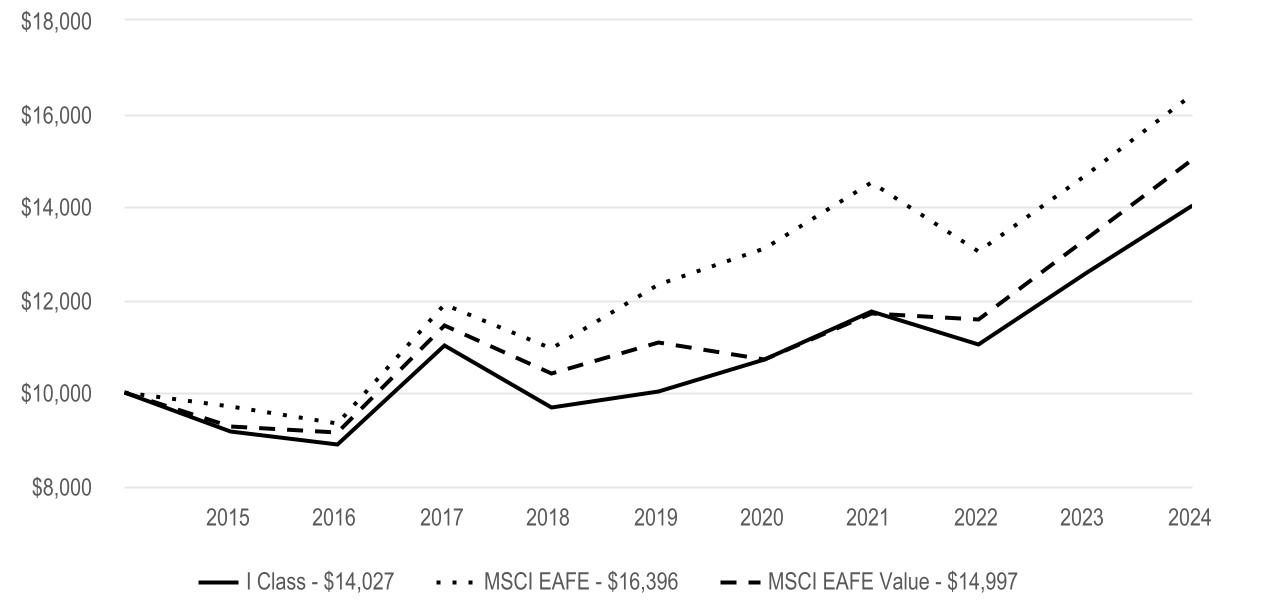
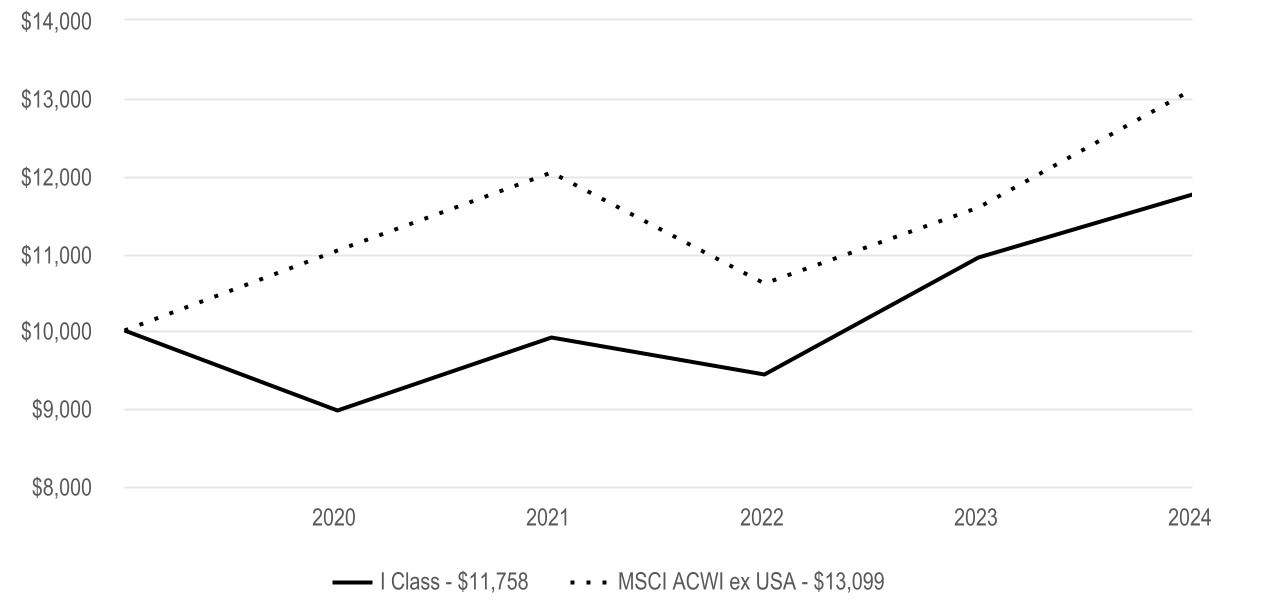
Emerging Markets Fund I Class returned 15.60% for the reporting period ended November 30, 2024. |
| The fund seeks capital growth. The commentary below refers to the fund's performance relative to the MSCI Emerging Markets Index. |
| • | Consumer discretionary contributed to relative performance with contributions from MakeMyTrip, an India-based travel company, and Zomato, an India-based food delivery and restaurant reservation company. Trip.com Group, a China-based travel company, benefited results as well. The fund's underweight position in the materials sector also boosted performance. |
| • | Other individual contributors included aircraft company Embraer and semiconductor business Taiwan Semiconductor Manufacturing Co. |
| • | The communication services and energy sectors were the leading detractors from relative performance. NetEase, a China-based internet technology business, and PRIO, an oil and natural gas company, dragged on results. |
| • | Other notable detractors included Samsung Electronics and Hapvida Participacoes e Investimentos, the Brazil-based health care company. Kweichow Moutai, a China-based liquor producer, and Banco BTG Pactual, a financial company based in Brazil, also hurt results. |
| | |
Cumulative Performance (based on an initial $10,000 investment) |
| November 30, 2014 through November 30, 2024 |
|
| | | | | | | | | | | | | | |
Average Annual Total Returns | |
| 1 Year | 5 Year | 10 Year | | | |
| I Class | 15.60% | 1.32% | 3.21% | | | |
| | | | | | |
| | | | | | |
| | | | | | |
| | | | | | |
| | | | | | |
| MSCI Emerging Markets | 11.86% | 3.20% | 3.16% | | | |
| | | | | | |
| | | | | | |
| | | | | | |
| | | | | | |
| | |
|
The opinions expressed are those of American Century Investments and are no guarantee of the future performance of any American Century Investments fund. This information is for educational purposes only and is not intended as investment advice. Data reflects past performance, assumes reinvestment of dividends and capital gains and is no guarantee of future results. Current performance may be higher or lower than data shown. Investment return and principal value will fluctuate and redemption value may be more or less than original cost, and none of the charts reflect the deduction of taxes that a shareholder would pay on fund distributions or the redemption of fund shares. Total returns for periods less than one year are not annualized. Visit americancentury.com for more recent performance information.
|
| | | | | |
Fund Statistics | |
| Net Assets | $1,785,280,256 |
| Management Fees (dollars paid during the reporting period) | $12,707,240 |
| Portfolio Turnover Rate | 29 | % |
| Total Number of Portfolio Holdings | 78 |
| |
| |
| | | | | | | | | | | | | | | | | | | | | | | | | | | | | | | | | | | | |
| Types of Investments in Portfolio (as a % of net assets) | | | | | | | | | | | | Top Five Countries (as a % of net assets) | | | | |
| Common Stocks | 99.5% | | | | | | | | | | | | | | | | | China | 27% | | | | | | |
| Short-Term Investments | 1.2% | | | | | | | | | | | | | | | | | India | 19% | | | | | | |
| Other Assets and Liabilities | (0.7)% | | | | | | | | | | | | | | | | | Taiwan | 19% | | | | | | |
| | | | | | | | | | | | | | | | | | | South Korea | 8% | | | | | | |
| | | | | | | | | | | | | | | | | | | Brazil | 6% | | | | | | |
| | | | | | | | | | | | | | | | | | | | | | | | | | |
| | | | | | | | | | | | | | | | | | | | | | | | | | |
| | | | | | | | | | | | | | | | | | | | | | | | | | |
| | | | | | | | | | | | | | | | | | | | | | | | | | |
| | | | | | | | | | | | | | | | | | | | | | | | | | |
| | | | | | | | | | | | | | | | | | | | | | | | | | |
| | | | | | | | | | | | | | | | | | | | | | | | | | |
| | | | | | | | | | | | | | | | | | | | | | | | | | |
| | | | | | | | | | | | | | | | | | | | | | | | | | |
| | | | | | | | | | | | | | | | | | | | | | | | | | |
| | | | | | | | | | | | | | | | | | | | | | | | | | |
| | |
| For additional information about the fund, including its Prospectus, Statement of Additional Information, financial statements, holdings and proxy voting information, scan the QR code or visit americancentury.com/docs. |
| | |
|
| ©2025 American Century Proprietary Holdings, Inc. All rights reserved. |
A-25086877
ANNUAL SHAREHOLDER REPORT
Emerging Markets Fund
| | | | | |
Y Class (AEYMX) | November 30, 2024 |
This annual shareholder report contains important information about Emerging Markets Fund for the period of December 1, 2023 to November 30, 2024. You can find additional information about the fund at americancentury.com/docs. You can also request this information by contacting us at 1-800-345-2021.
| | | | | | | | |
What were the fund costs for the last year? (based on a hypothetical $10,000 investment) |
|
| Costs of a $10,000 investment | Costs paid as a percentage of a $10,000 investment |
| Y Class | $99 | 0.92% |
|
| | | | | |
| What were the key factors that affected the fund’s performance? |
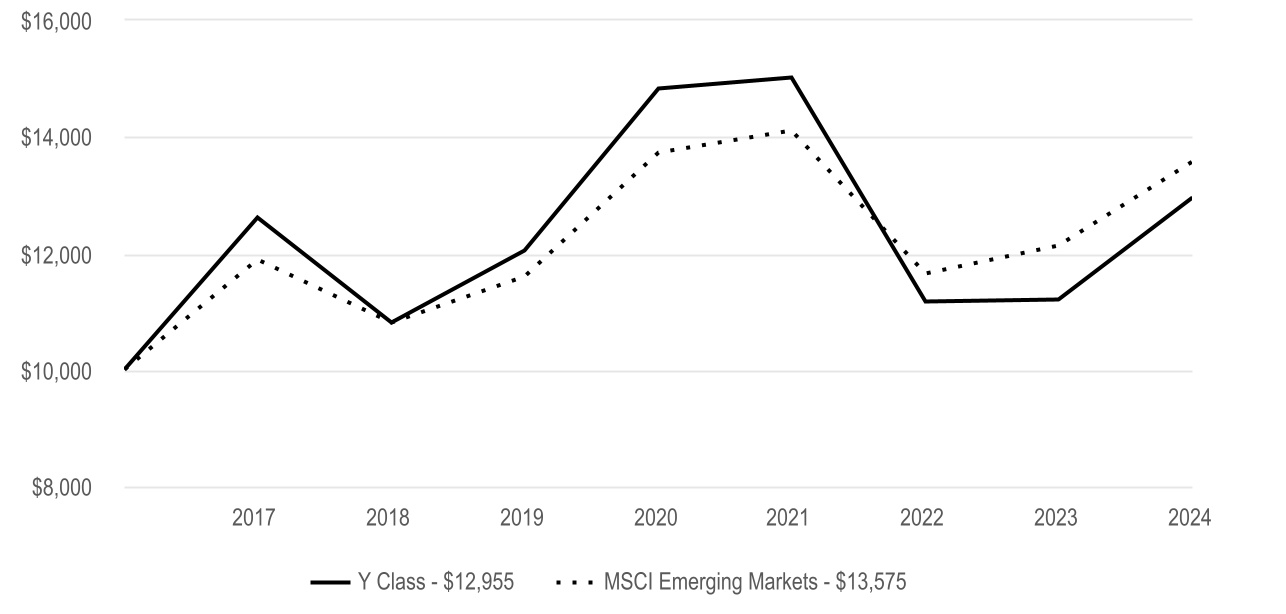
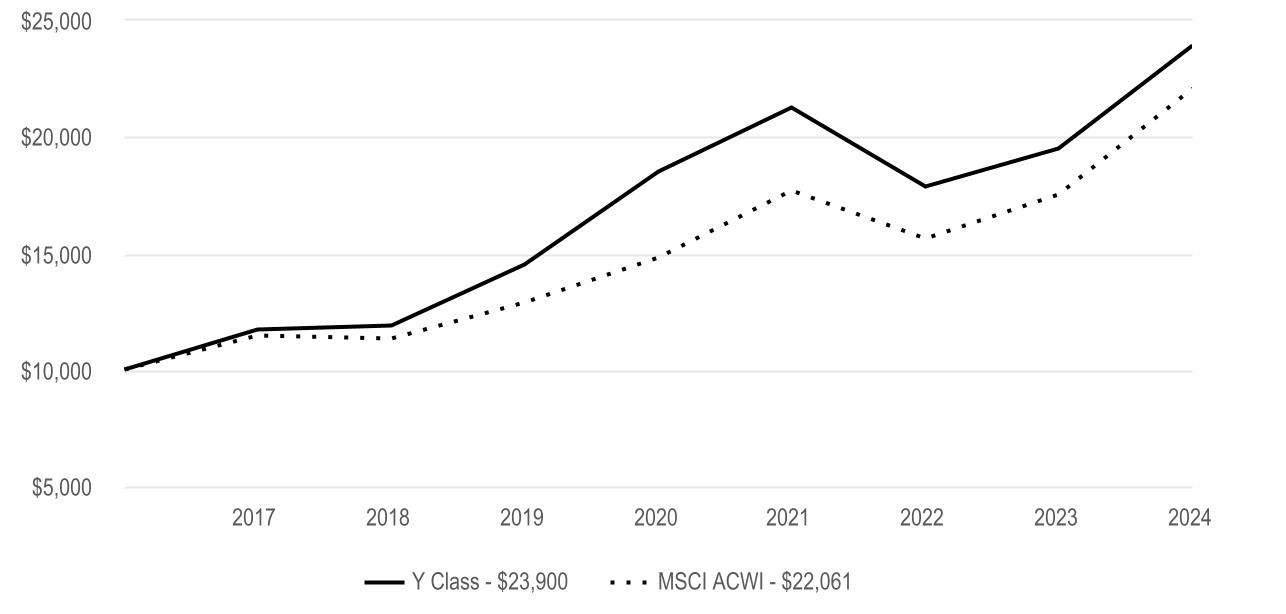
Emerging Markets Fund Y Class returned 15.72% for the reporting period ended November 30, 2024. |
| The fund seeks capital growth. The commentary below refers to the fund's performance relative to the MSCI Emerging Markets Index. |
| • | Consumer discretionary contributed to relative performance with contributions from MakeMyTrip, an India-based travel company, and Zomato, an India-based food delivery and restaurant reservation company. Trip.com Group, a China-based travel company, benefited results as well. The fund's underweight position in the materials sector also boosted performance. |
| • | Other individual contributors included aircraft company Embraer and semiconductor business Taiwan Semiconductor Manufacturing Co. |
| • | The communication services and energy sectors were the leading detractors from relative performance. NetEase, a China-based internet technology business, and PRIO, an oil and natural gas company, dragged on results. |
| • | Other notable detractors included Samsung Electronics and Hapvida Participacoes e Investimentos, the Brazil-based health care company. Kweichow Moutai, a China-based liquor producer, and Banco BTG Pactual, a financial company based in Brazil, also hurt results. |
| | |
Cumulative Performance (based on an initial $10,000 investment) |
| April 10, 2017 through November 30, 2024 |
|
| | | | | | | | | | | | | | | | |
Average Annual Total Returns | |
| 1 Year | 5 Year | | Since Inception | Inception Date | |
| Y Class | 15.72% | 1.46% | | 3.44% | 4/10/17 | |
| | | | | | |
| | | | | | |
| | | | | | |
| | | | | | |
| | | | | | |
| MSCI Emerging Markets | 11.86% | 3.20% | | 4.08% | — | |
| | | | | | |
| | | | | | |
| | | | | | |
| | | | | | |
| | |
|
The opinions expressed are those of American Century Investments and are no guarantee of the future performance of any American Century Investments fund. This information is for educational purposes only and is not intended as investment advice. Data reflects past performance, assumes reinvestment of dividends and capital gains and is no guarantee of future results. Current performance may be higher or lower than data shown. Investment return and principal value will fluctuate and redemption value may be more or less than original cost, and none of the charts reflect the deduction of taxes that a shareholder would pay on fund distributions or the redemption of fund shares. Total returns for periods less than one year are not annualized. Visit americancentury.com for more recent performance information.
|
| | | | | |
Fund Statistics | |
| Net Assets | $1,785,280,256 |
| Management Fees (dollars paid during the reporting period) | $12,707,240 |
| Portfolio Turnover Rate | 29 | % |
| Total Number of Portfolio Holdings | 78 |
| |
| |
| | | | | | | | | | | | | | | | | | | | | | | | | | | | | | | | | | | | |
| Types of Investments in Portfolio (as a % of net assets) | | | | | | | | | | | | Top Five Countries (as a % of net assets) | | | | |
| Common Stocks | 99.5% | | | | | | | | | | | | | | | | | China | 27% | | | | | | |
| Short-Term Investments | 1.2% | | | | | | | | | | | | | | | | | India | 19% | | | | | | |
| Other Assets and Liabilities | (0.7)% | | | | | | | | | | | | | | | | | Taiwan | 19% | | | | | | |
| | | | | | | | | | | | | | | | | | | South Korea | 8% | | | | | | |
| | | | | | | | | | | | | | | | | | | Brazil | 6% | | | | | | |
| | | | | | | | | | | | | | | | | | | | | | | | | | |
| | | | | | | | | | | | | | | | | | | | | | | | | | |
| | | | | | | | | | | | | | | | | | | | | | | | | | |
| | | | | | | | | | | | | | | | | | | | | | | | | | |
| | | | | | | | | | | | | | | | | | | | | | | | | | |
| | | | | | | | | | | | | | | | | | | | | | | | | | |
| | | | | | | | | | | | | | | | | | | | | | | | | | |
| | | | | | | | | | | | | | | | | | | | | | | | | | |
| | | | | | | | | | | | | | | | | | | | | | | | | | |
| | | | | | | | | | | | | | | | | | | | | | | | | | |
| | | | | | | | | | | | | | | | | | | | | | | | | | |
| | |
| For additional information about the fund, including its Prospectus, Statement of Additional Information, financial statements, holdings and proxy voting information, scan the QR code or visit americancentury.com/docs. |
| | |
|
| ©2025 American Century Proprietary Holdings, Inc. All rights reserved. |
A-2509A885
ANNUAL SHAREHOLDER REPORT
Emerging Markets Fund
| | | | | |
A Class (AEMMX) | November 30, 2024 |
This annual shareholder report contains important information about Emerging Markets Fund for the period of December 1, 2023 to November 30, 2024. You can find additional information about the fund at americancentury.com/docs. You can also request this information by contacting us at 1-800-345-2021.
| | | | | | | | |
What were the fund costs for the last year? (based on a hypothetical $10,000 investment) |
|
| Costs of a $10,000 investment | Costs paid as a percentage of a $10,000 investment |
| A Class | $163 | 1.52% |
|
| | | | | |
| What were the key factors that affected the fund’s performance? |
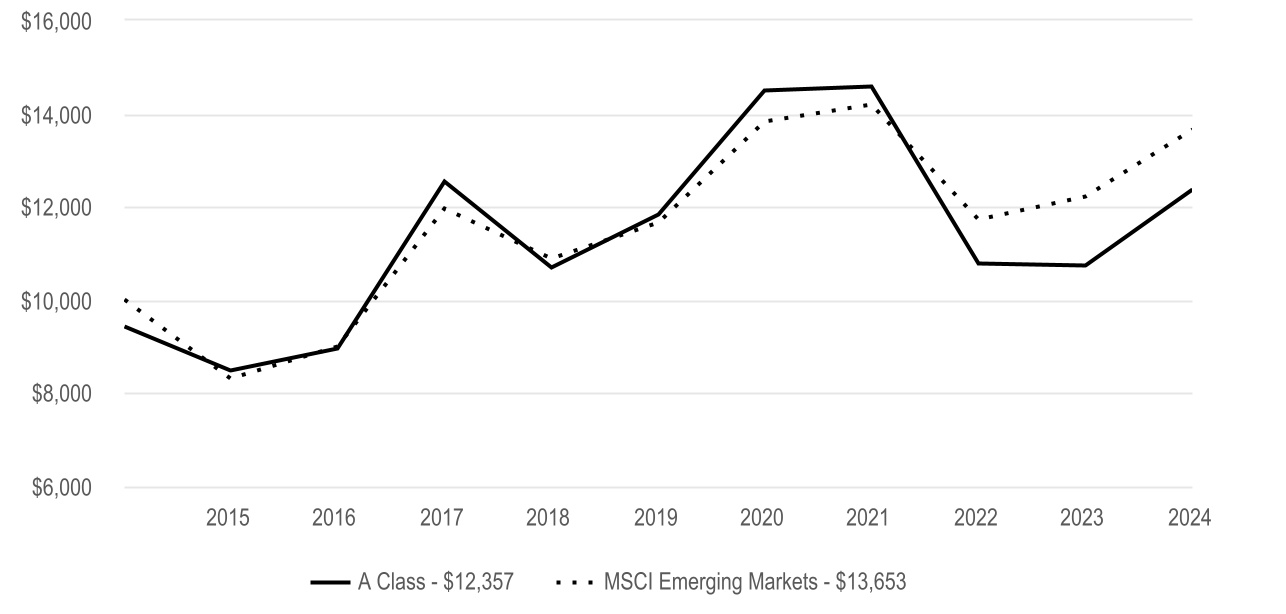
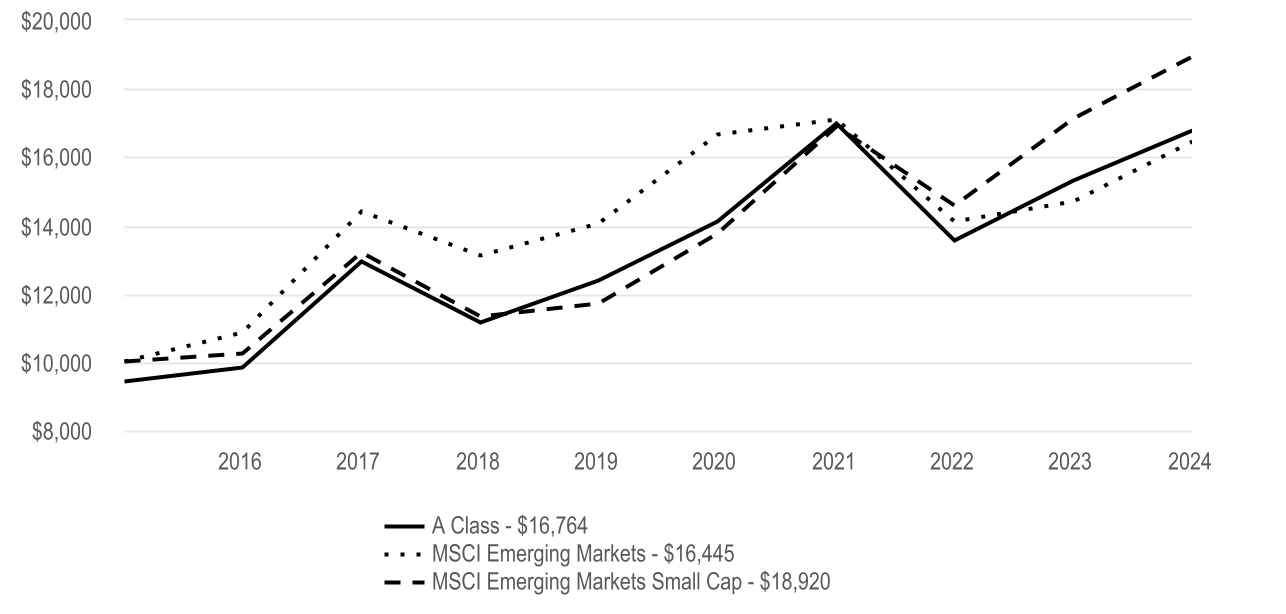
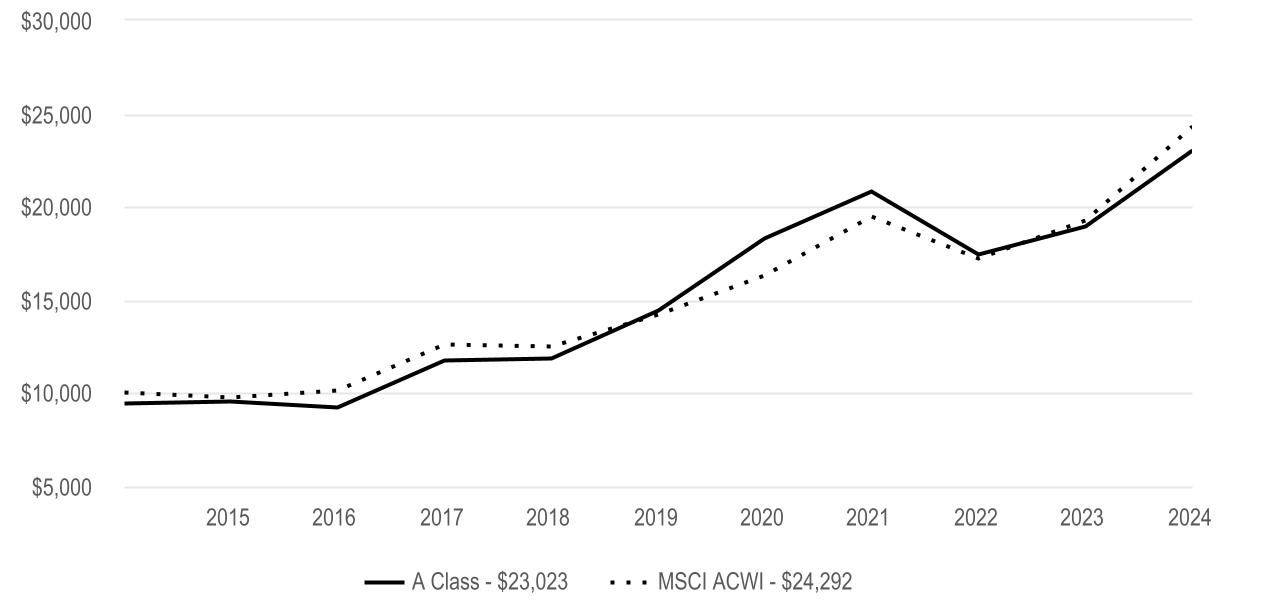
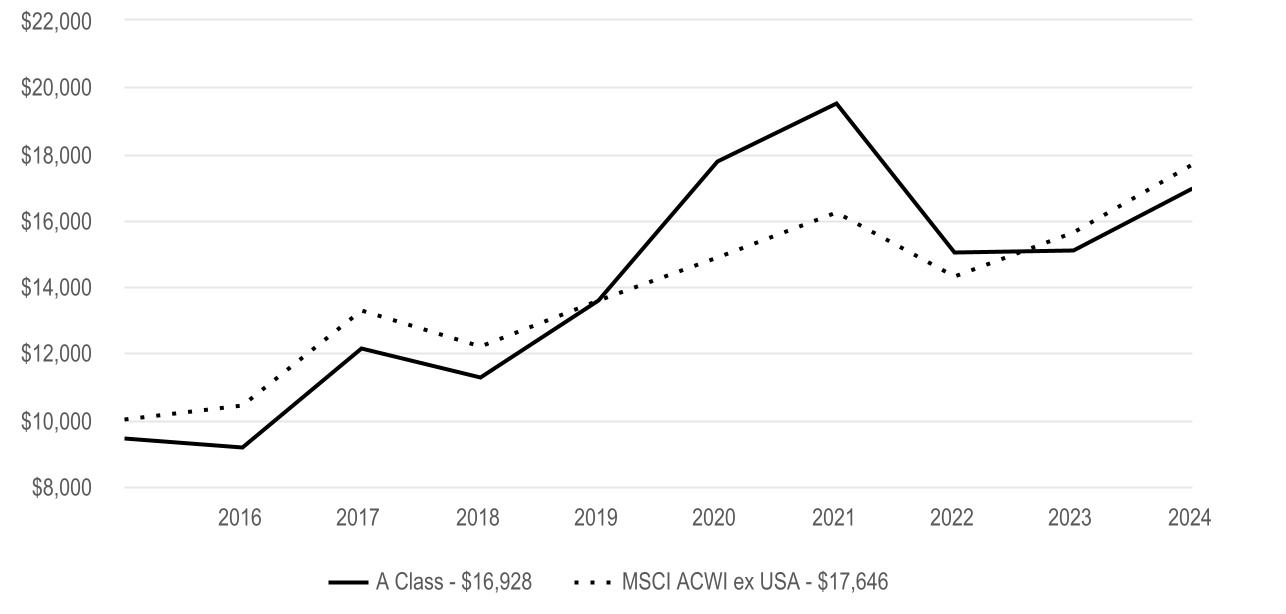
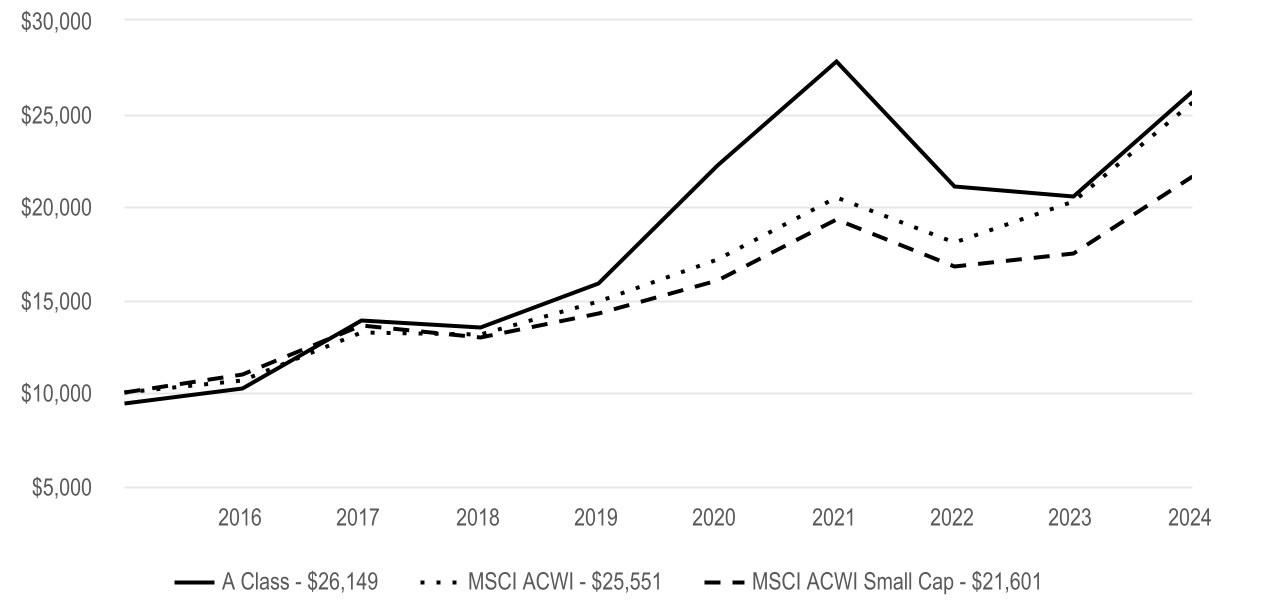
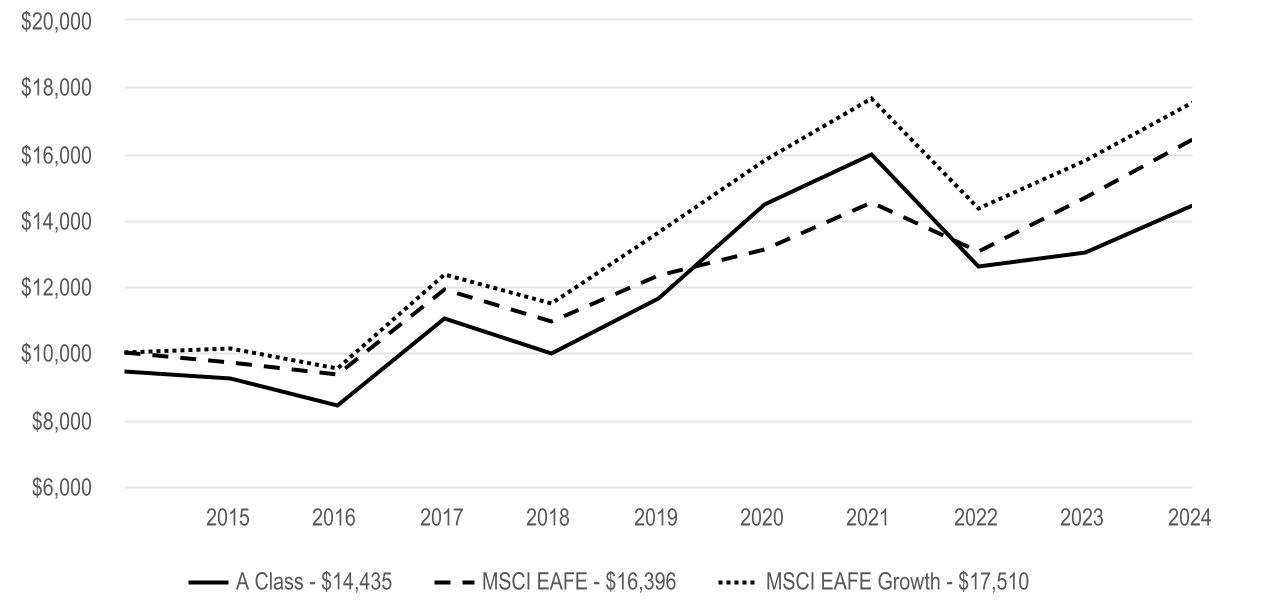
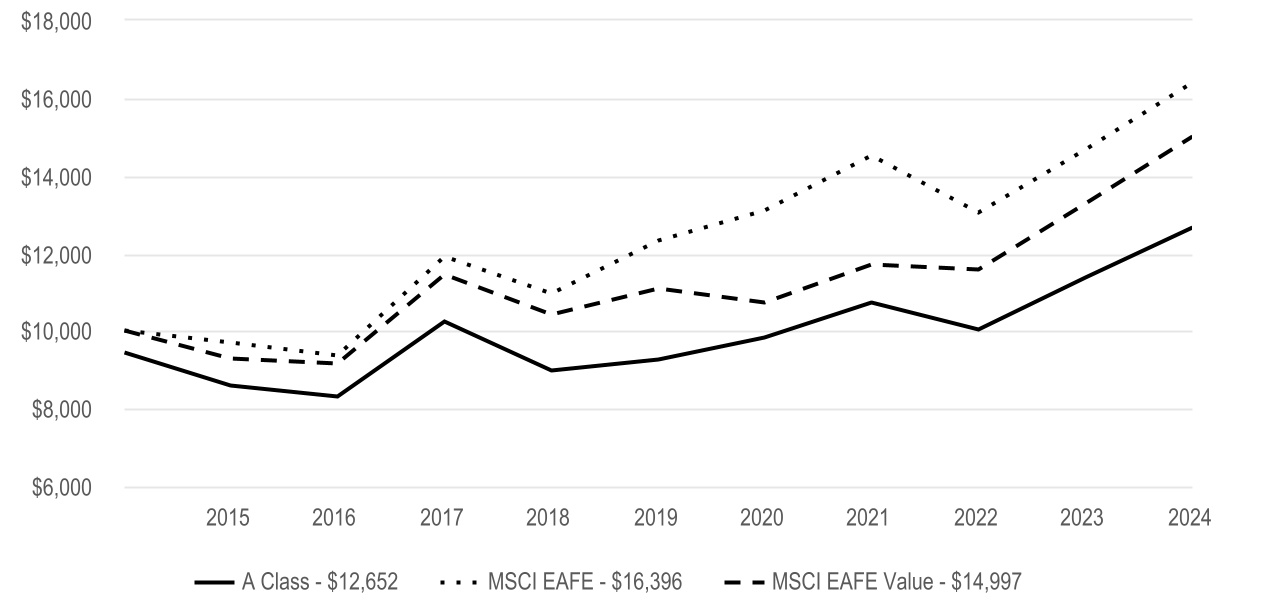
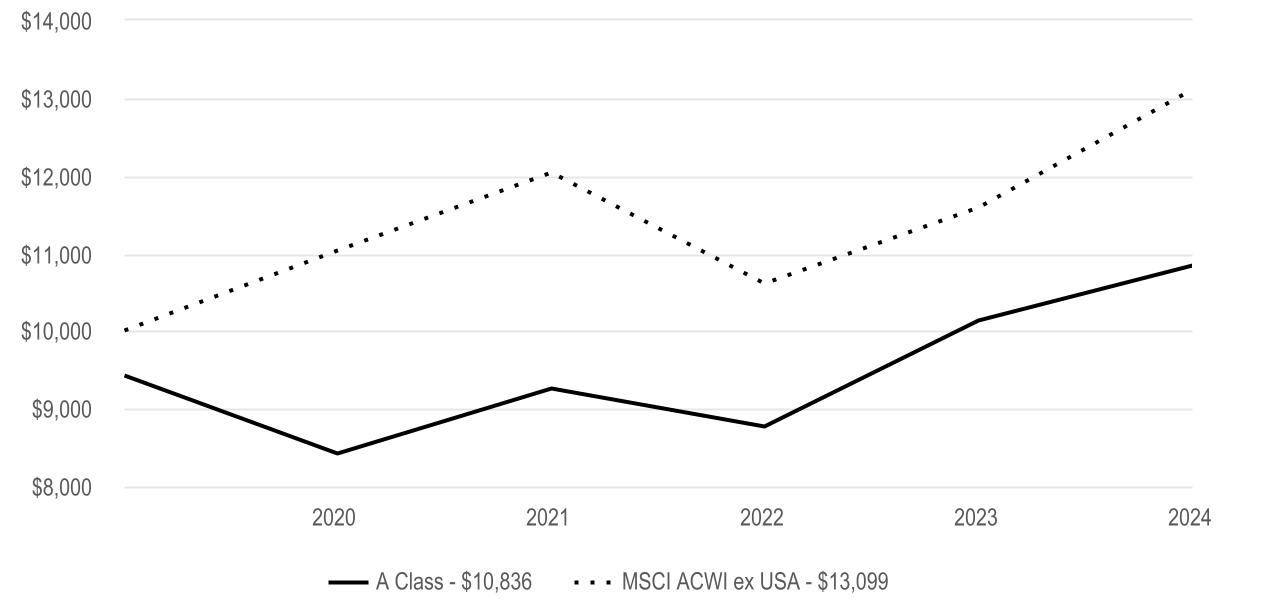
Emerging Markets Fund A Class returned 15.06% for the reporting period ended November 30, 2024. |
| The fund seeks capital growth. The commentary below refers to the fund's performance relative to the MSCI Emerging Markets Index. |
| • | Consumer discretionary contributed to relative performance with contributions from MakeMyTrip, an India-based travel company, and Zomato, an India-based food delivery and restaurant reservation company. Trip.com Group, a China-based travel company, benefited results as well. The fund's underweight position in the materials sector also boosted performance. |
| • | Other individual contributors included aircraft company Embraer and semiconductor business Taiwan Semiconductor Manufacturing Co. |
| • | The communication services and energy sectors were the leading detractors from relative performance. NetEase, a China-based internet technology business, and PRIO, an oil and natural gas company, dragged on results. |
| • | Other notable detractors included Samsung Electronics and Hapvida Participacoes e Investimentos, the Brazil-based health care company. Kweichow Moutai, a China-based liquor producer, and Banco BTG Pactual, a financial company based in Brazil, also hurt results. |
| | |
Cumulative Performance (based on an initial $10,000 investment) |
| November 30, 2014 through November 30, 2024 |
| The initial investment is adjusted to reflect the maximum initial sales charge. |
| | | | | | | | | | | | | | |
Average Annual Total Returns | |
| 1 Year | 5 Year | 10 Year | | | |
| A Class | 15.06% | 0.88% | 2.75% | | | |
| A Class - with sales charge | 8.44% | -0.31% | 2.14% | | | |
| | | | | | |
| | | | | | |
| | | | | | |
| | | | | | |
| MSCI Emerging Markets | 11.86% | 3.20% | 3.16% | | | |
| | | | | | |
| | | | | | |
| | | | | | |
| | | | | | |
| | | | | | | | | | | | | | | | | |
|
| A Class shares have a 5.75% maximum initial sales charge and may be subject to a maximum contingent deferred sales charge of 1.00%. |
|
|
|
|
|
|
|
|
|
| | |
|
The opinions expressed are those of American Century Investments and are no guarantee of the future performance of any American Century Investments fund. This information is for educational purposes only and is not intended as investment advice. Data reflects past performance, assumes reinvestment of dividends and capital gains and is no guarantee of future results. Current performance may be higher or lower than data shown. Investment return and principal value will fluctuate and redemption value may be more or less than original cost, and none of the charts reflect the deduction of taxes that a shareholder would pay on fund distributions or the redemption of fund shares. Total returns for periods less than one year are not annualized. Visit americancentury.com for more recent performance information.
|
| | | | | |
Fund Statistics | |
| Net Assets | $1,785,280,256 |
| Management Fees (dollars paid during the reporting period) | $12,707,240 |
| Portfolio Turnover Rate | 29 | % |
| Total Number of Portfolio Holdings | 78 |
| |
| |
| | | | | | | | | | | | | | | | | | | | | | | | | | | | | | | | | | | | |
| Types of Investments in Portfolio (as a % of net assets) | | | | | | | | | | | | Top Five Countries (as a % of net assets) | | | | |
| Common Stocks | 99.5% | | | | | | | | | | | | | | | | | China | 27% | | | | | | |
| Short-Term Investments | 1.2% | | | | | | | | | | | | | | | | | India | 19% | | | | | | |
| Other Assets and Liabilities | (0.7)% | | | | | | | | | | | | | | | | | Taiwan | 19% | | | | | | |
| | | | | | | | | | | | | | | | | | | South Korea | 8% | | | | | | |
| | | | | | | | | | | | | | | | | | | Brazil | 6% | | | | | | |
| | | | | | | | | | | | | | | | | | | | | | | | | | |
| | | | | | | | | | | | | | | | | | | | | | | | | | |
| | | | | | | | | | | | | | | | | | | | | | | | | | |
| | | | | | | | | | | | | | | | | | | | | | | | | | |
| | | | | | | | | | | | | | | | | | | | | | | | | | |
| | | | | | | | | | | | | | | | | | | | | | | | | | |
| | | | | | | | | | | | | | | | | | | | | | | | | | |
| | | | | | | | | | | | | | | | | | | | | | | | | | |
| | | | | | | | | | | | | | | | | | | | | | | | | | |
| | | | | | | | | | | | | | | | | | | | | | | | | | |
| | | | | | | | | | | | | | | | | | | | | | | | | | |
| | |
| For additional information about the fund, including its Prospectus, Statement of Additional Information, financial statements, holdings and proxy voting information, scan the QR code or visit americancentury.com/docs. |
| | |
|
| ©2025 American Century Proprietary Holdings, Inc. All rights reserved. |
A-25086851
ANNUAL SHAREHOLDER REPORT
Emerging Markets Fund
| | | | | |
C Class (ACECX) | November 30, 2024 |
This annual shareholder report contains important information about Emerging Markets Fund for the period of December 1, 2023 to November 30, 2024. You can find additional information about the fund at americancentury.com/docs. You can also request this information by contacting us at 1-800-345-2021.
| | | | | | | | |
What were the fund costs for the last year? (based on a hypothetical $10,000 investment) |
|
| Costs of a $10,000 investment | Costs paid as a percentage of a $10,000 investment |
| C Class | $243 | 2.27% |
|
| | | | | |
| What were the key factors that affected the fund’s performance? |
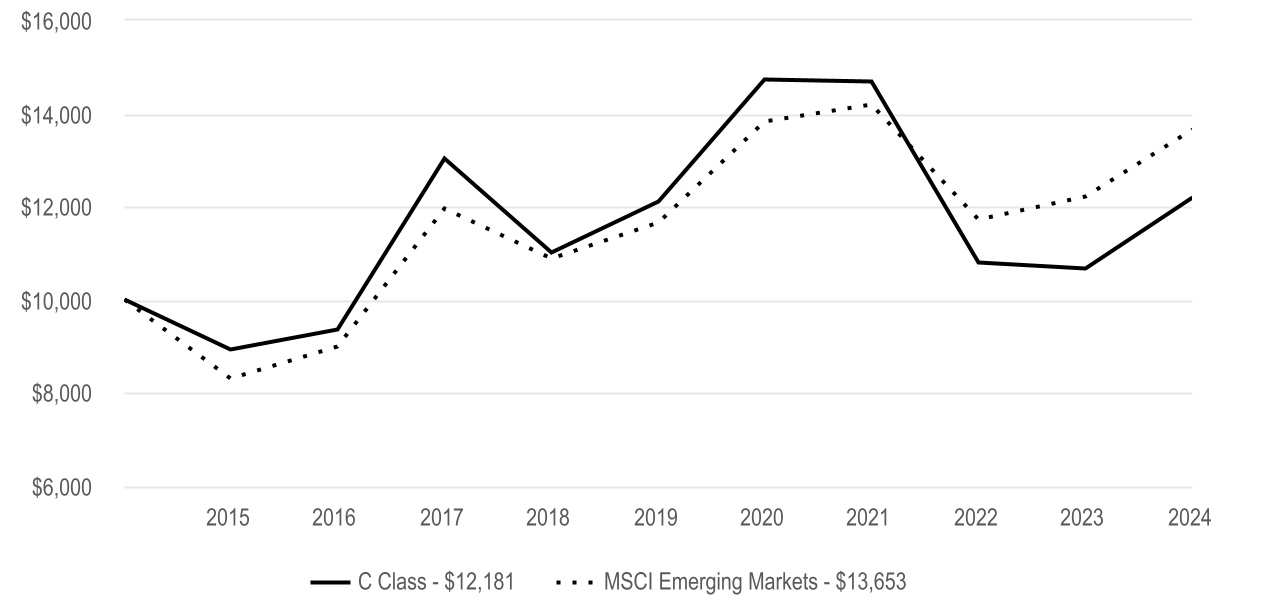
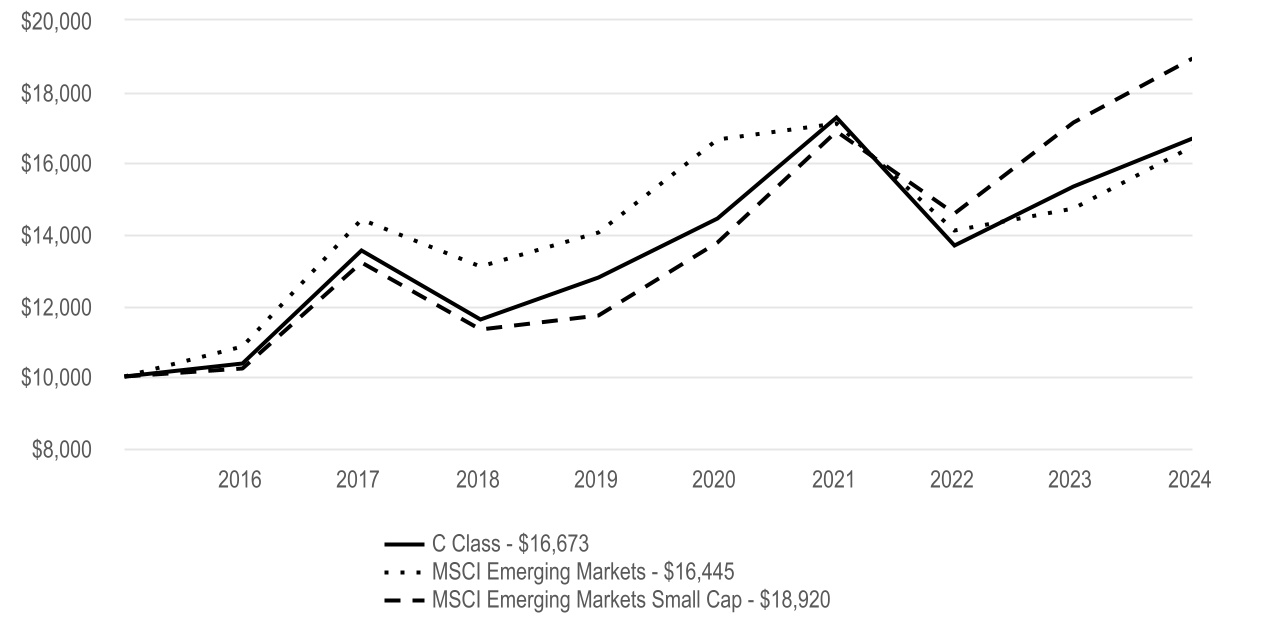
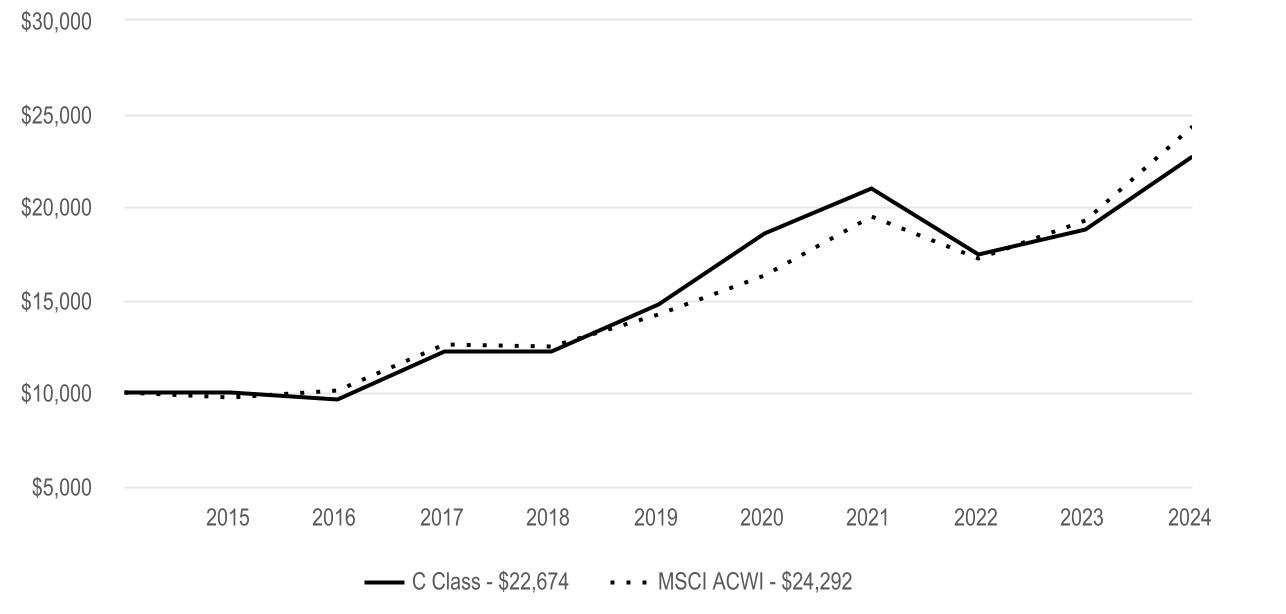
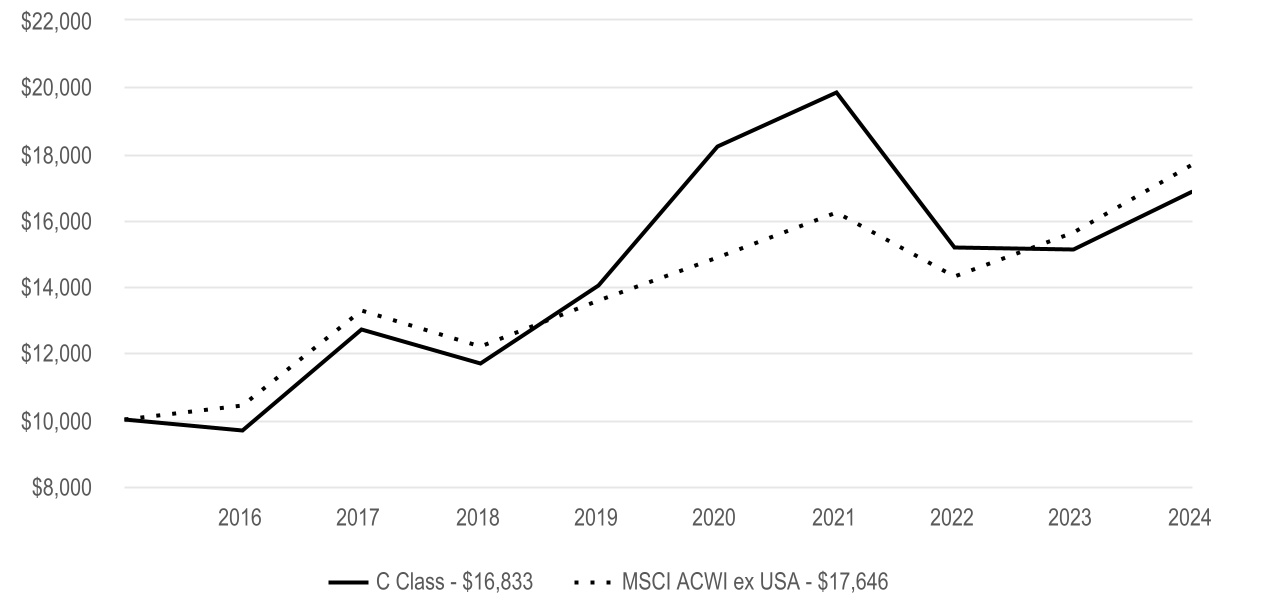
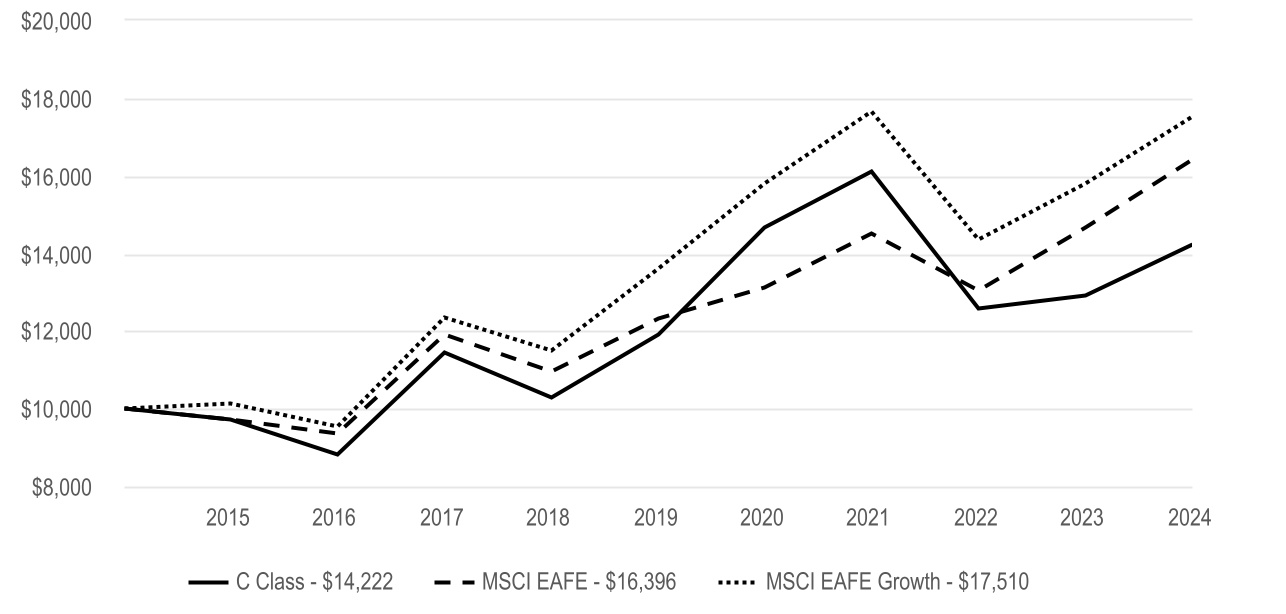
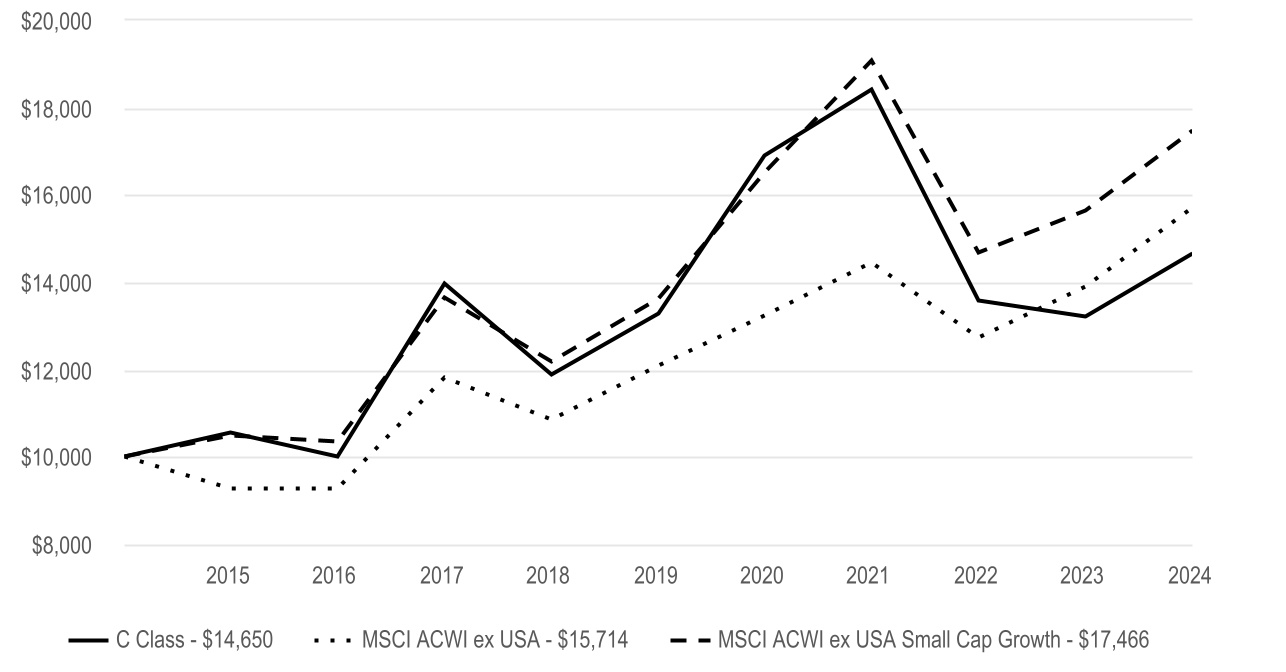
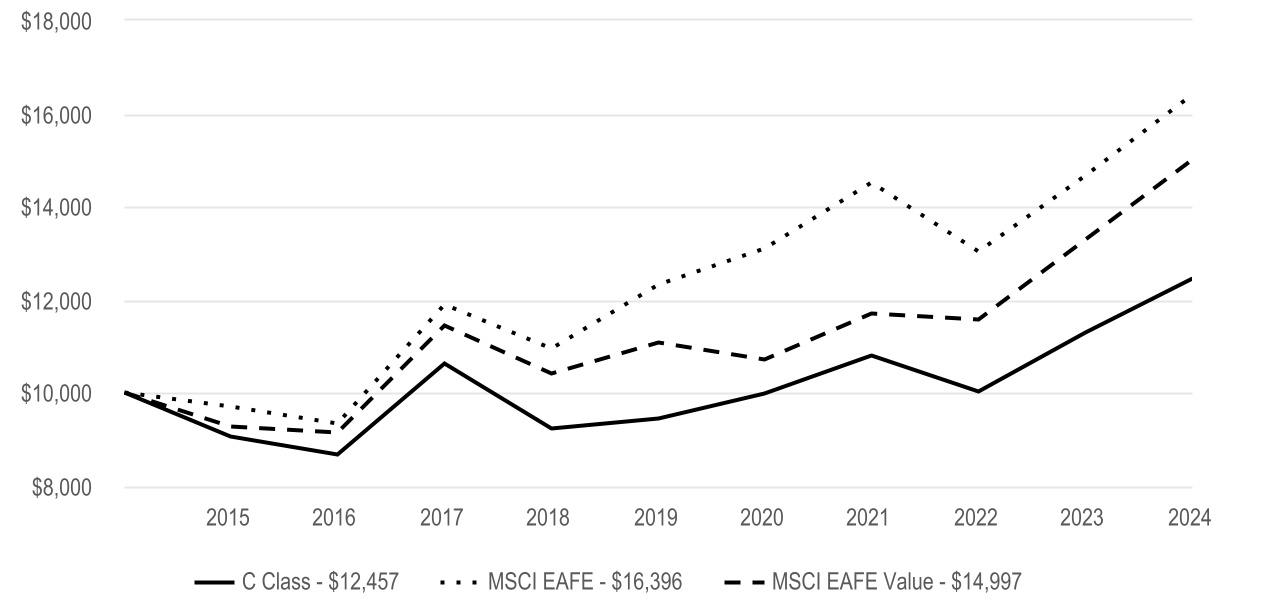
Emerging Markets Fund C Class returned 14.25% for the reporting period ended November 30, 2024. |
| The fund seeks capital growth. The commentary below refers to the fund's performance relative to the MSCI Emerging Markets Index. |
| • | Consumer discretionary contributed to relative performance with contributions from MakeMyTrip, an India-based travel company, and Zomato, an India-based food delivery and restaurant reservation company. Trip.com Group, a China-based travel company, benefited results as well. The fund's underweight position in the materials sector also boosted performance. |
| • | Other individual contributors included aircraft company Embraer and semiconductor business Taiwan Semiconductor Manufacturing Co. |
| • | The communication services and energy sectors were the leading detractors from relative performance. NetEase, a China-based internet technology business, and PRIO, an oil and natural gas company, dragged on results. |
| • | Other notable detractors included Samsung Electronics and Hapvida Participacoes e Investimentos, the Brazil-based health care company. Kweichow Moutai, a China-based liquor producer, and Banco BTG Pactual, a financial company based in Brazil, also hurt results. |
| | |
Cumulative Performance (based on an initial $10,000 investment) |
| November 30, 2014 through November 30, 2024 |
|
| | | | | | | | | | | | | | |
Average Annual Total Returns | |
| 1 Year | 5 Year | 10 Year | | | |
| C Class | 14.25% | 0.11% | 1.99% | | | |
| | | | | | |
| | | | | | |
| | | | | | |
| | | | | | |
| | | | | | |
| MSCI Emerging Markets | 11.86% | 3.20% | 3.16% | | | |
| | | | | | |
| | | | | | |
| | | | | | |
| | | | | | |
| | | | | | | | | | | | | | | | | |
|
|
|
|
|
| C Class shares will automatically convert to A Class shares after being held for approximately eight years. C Class average annual returns do not reflect this conversion. |
|
|
|
|
|
| | |
|
The opinions expressed are those of American Century Investments and are no guarantee of the future performance of any American Century Investments fund. This information is for educational purposes only and is not intended as investment advice. Data reflects past performance, assumes reinvestment of dividends and capital gains and is no guarantee of future results. Current performance may be higher or lower than data shown. Investment return and principal value will fluctuate and redemption value may be more or less than original cost, and none of the charts reflect the deduction of taxes that a shareholder would pay on fund distributions or the redemption of fund shares. Total returns for periods less than one year are not annualized. Visit americancentury.com for more recent performance information.
|
| | | | | |
Fund Statistics | |
| Net Assets | $1,785,280,256 |
| Management Fees (dollars paid during the reporting period) | $12,707,240 |
| Portfolio Turnover Rate | 29 | % |
| Total Number of Portfolio Holdings | 78 |
| |
| |
| | | | | | | | | | | | | | | | | | | | | | | | | | | | | | | | | | | | |
| Types of Investments in Portfolio (as a % of net assets) | | | | | | | | | | | | Top Five Countries (as a % of net assets) | | | | |
| Common Stocks | 99.5% | | | | | | | | | | | | | | | | | China | 27% | | | | | | |
| Short-Term Investments | 1.2% | | | | | | | | | | | | | | | | | India | 19% | | | | | | |
| Other Assets and Liabilities | (0.7)% | | | | | | | | | | | | | | | | | Taiwan | 19% | | | | | | |
| | | | | | | | | | | | | | | | | | | South Korea | 8% | | | | | | |
| | | | | | | | | | | | | | | | | | | Brazil | 6% | | | | | | |
| | | | | | | | | | | | | | | | | | | | | | | | | | |
| | | | | | | | | | | | | | | | | | | | | | | | | | |
| | | | | | | | | | | | | | | | | | | | | | | | | | |
| | | | | | | | | | | | | | | | | | | | | | | | | | |
| | | | | | | | | | | | | | | | | | | | | | | | | | |
| | | | | | | | | | | | | | | | | | | | | | | | | | |
| | | | | | | | | | | | | | | | | | | | | | | | | | |
| | | | | | | | | | | | | | | | | | | | | | | | | | |
| | | | | | | | | | | | | | | | | | | | | | | | | | |
| | | | | | | | | | | | | | | | | | | | | | | | | | |
| | | | | | | | | | | | | | | | | | | | | | | | | | |
| | |
| For additional information about the fund, including its Prospectus, Statement of Additional Information, financial statements, holdings and proxy voting information, scan the QR code or visit americancentury.com/docs. |
| | |
|
| ©2025 American Century Proprietary Holdings, Inc. All rights reserved. |
A-25086679
ANNUAL SHAREHOLDER REPORT
Emerging Markets Fund
| | | | | |
R Class (AEMRX) | November 30, 2024 |
This annual shareholder report contains important information about Emerging Markets Fund for the period of December 1, 2023 to November 30, 2024. You can find additional information about the fund at americancentury.com/docs. You can also request this information by contacting us at 1-800-345-2021.
| | | | | | | | |
What were the fund costs for the last year? (based on a hypothetical $10,000 investment) |
|
| Costs of a $10,000 investment | Costs paid as a percentage of a $10,000 investment |
| R Class | $190 | 1.77% |
|
| | | | | |
| What were the key factors that affected the fund’s performance? |
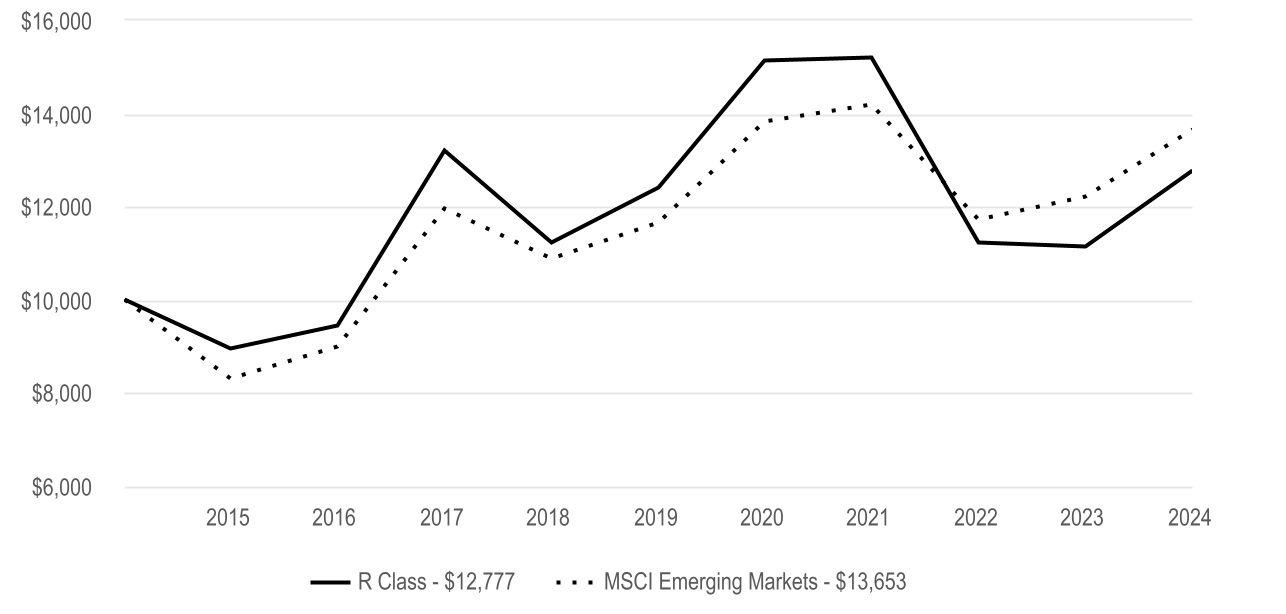
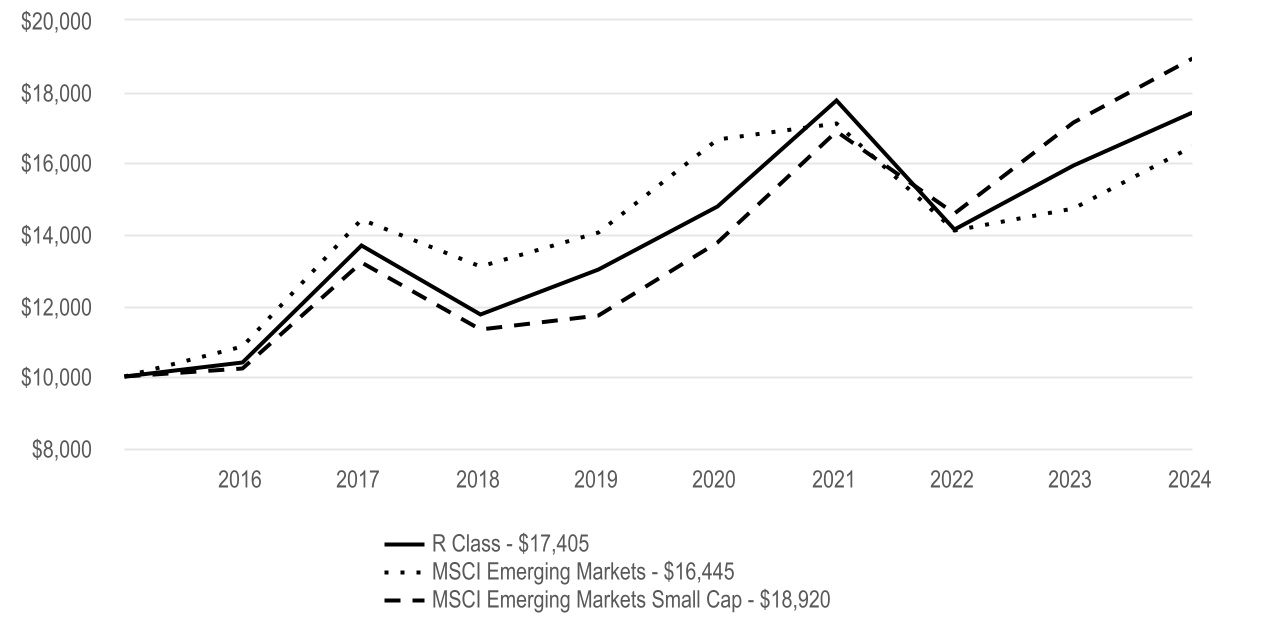
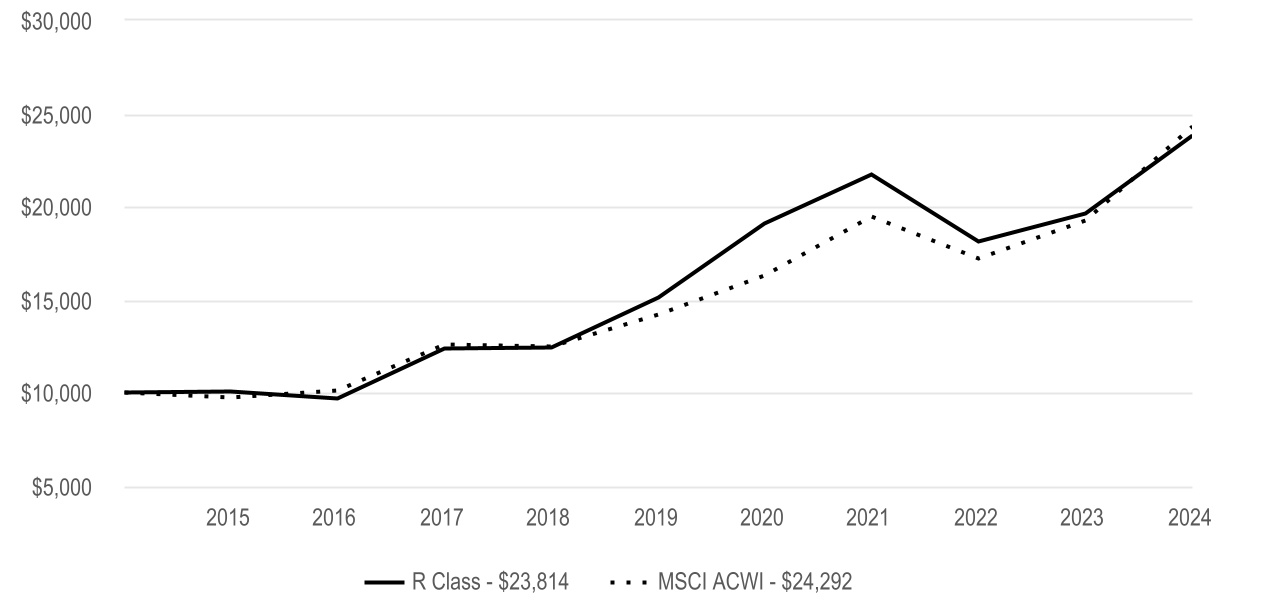
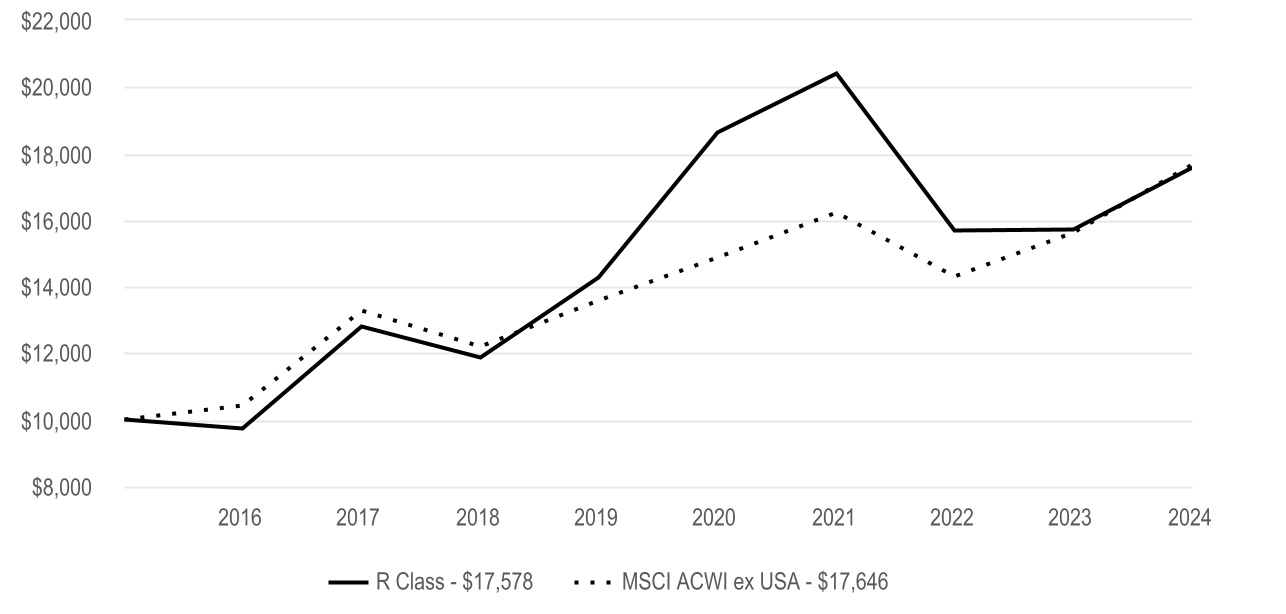
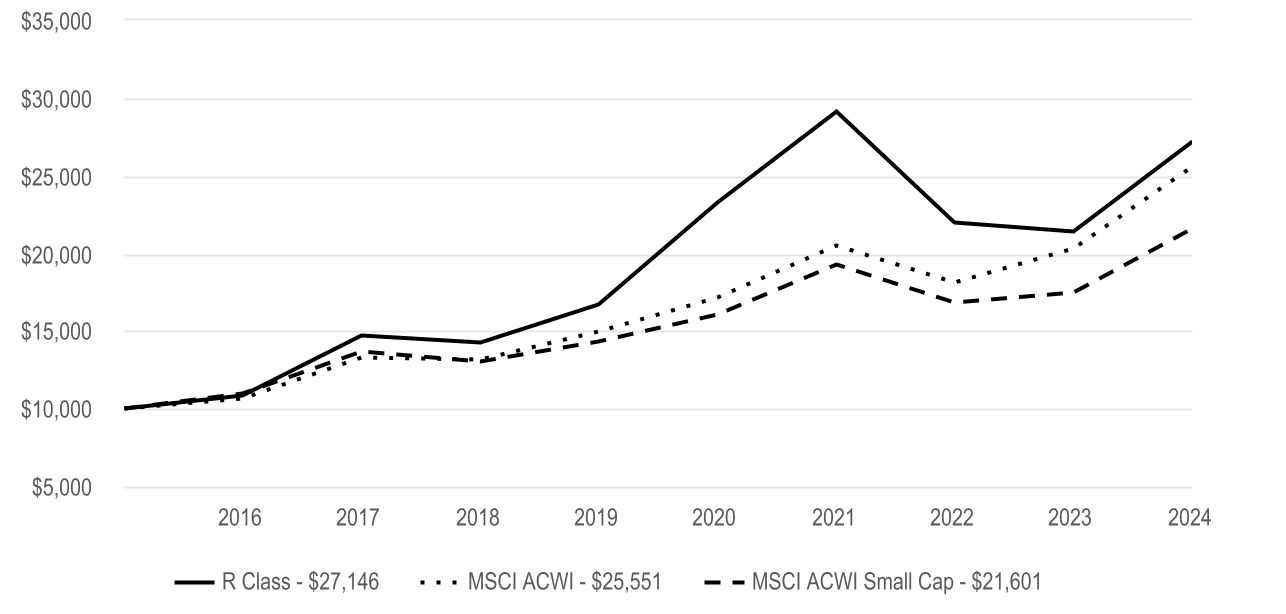
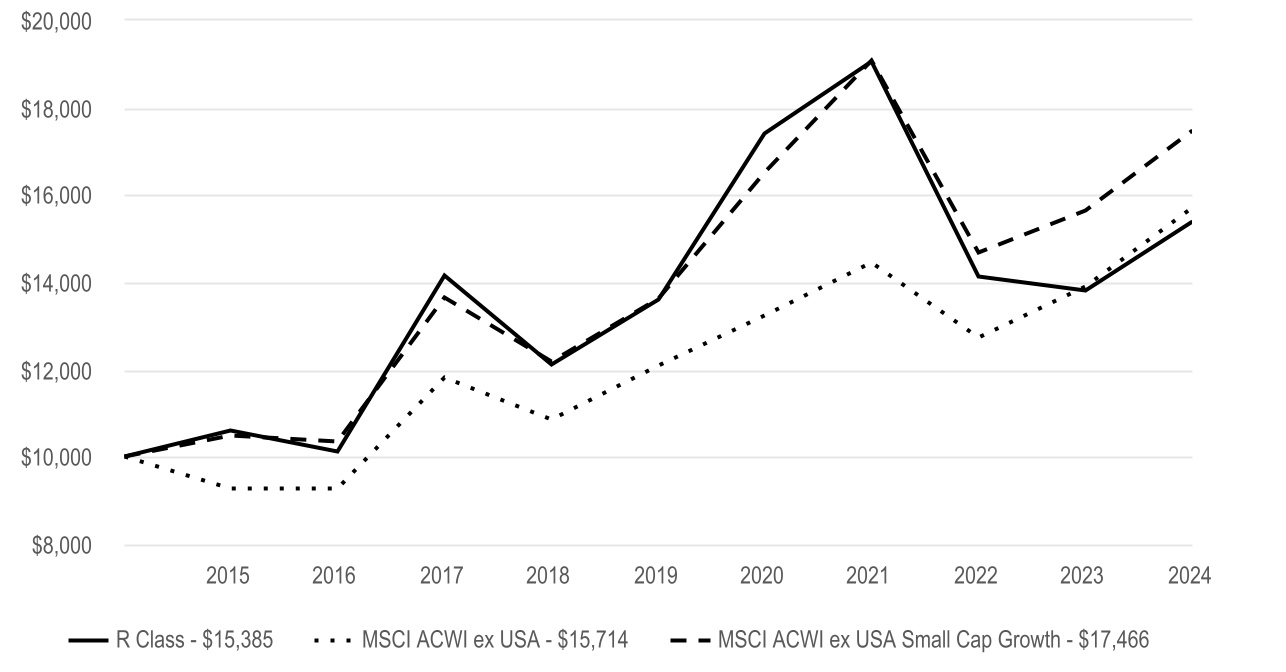
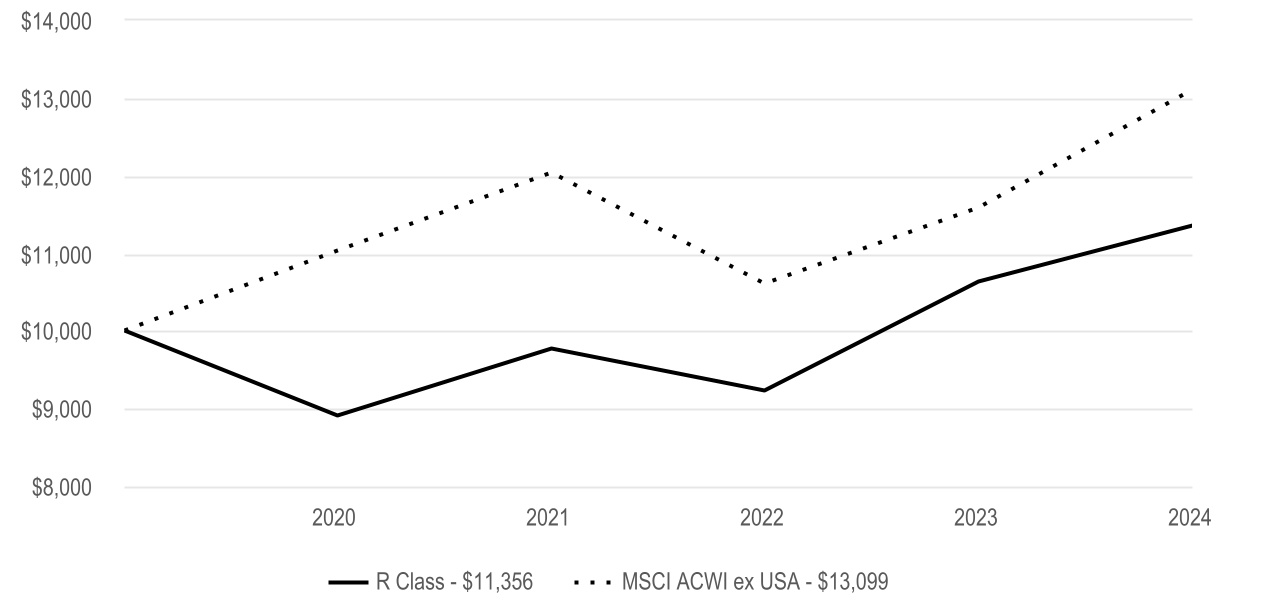
Emerging Markets Fund R Class returned 14.71% for the reporting period ended November 30, 2024. |
| The fund seeks capital growth. The commentary below refers to the fund's performance relative to the MSCI Emerging Markets Index. |
| • | Consumer discretionary contributed to relative performance with contributions from MakeMyTrip, an India-based travel company, and Zomato, an India-based food delivery and restaurant reservation company. Trip.com Group, a China-based travel company, benefited results as well. The fund's underweight position in the materials sector also boosted performance. |
| • | Other individual contributors included aircraft company Embraer and semiconductor business Taiwan Semiconductor Manufacturing Co. |
| • | The communication services and energy sectors were the leading detractors from relative performance. NetEase, a China-based internet technology business, and PRIO, an oil and natural gas company, dragged on results. |
| • | Other notable detractors included Samsung Electronics and Hapvida Participacoes e Investimentos, the Brazil-based health care company. Kweichow Moutai, a China-based liquor producer, and Banco BTG Pactual, a financial company based in Brazil, also hurt results. |
| | |
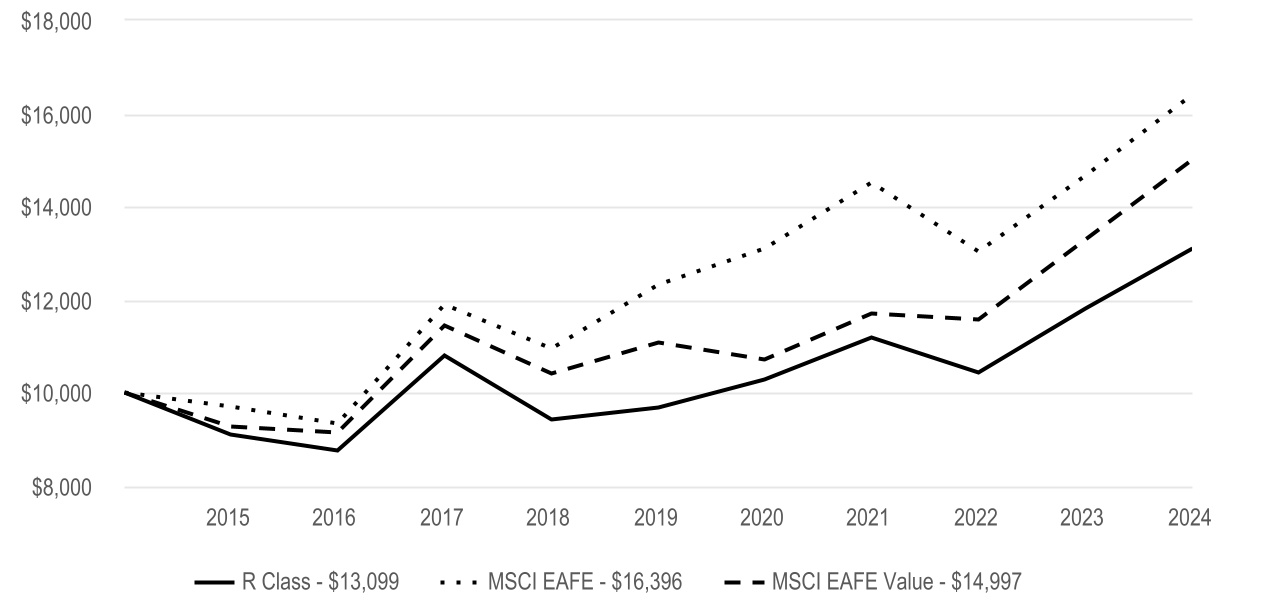
Cumulative Performance (based on an initial $10,000 investment) |
| November 30, 2014 through November 30, 2024 |
|
| | | | | | | | | | | | | | |
Average Annual Total Returns | |
| 1 Year | 5 Year | 10 Year | | | |
| R Class | 14.71% | 0.61% | 2.48% | | | |
| | | | | | |
| | | | | | |
| | | | | | |
| | | | | | |
| | | | | | |
| MSCI Emerging Markets | 11.86% | 3.20% | 3.16% | | | |
| | | | | | |
| | | | | | |
| | | | | | |
| | | | | | |
| | |
|
The opinions expressed are those of American Century Investments and are no guarantee of the future performance of any American Century Investments fund. This information is for educational purposes only and is not intended as investment advice. Data reflects past performance, assumes reinvestment of dividends and capital gains and is no guarantee of future results. Current performance may be higher or lower than data shown. Investment return and principal value will fluctuate and redemption value may be more or less than original cost, and none of the charts reflect the deduction of taxes that a shareholder would pay on fund distributions or the redemption of fund shares. Total returns for periods less than one year are not annualized. Visit americancentury.com for more recent performance information.
|
| | | | | |
Fund Statistics | |
| Net Assets | $1,785,280,256 |
| Management Fees (dollars paid during the reporting period) | $12,707,240 |
| Portfolio Turnover Rate | 29 | % |
| Total Number of Portfolio Holdings | 78 |
| |
| |
| | | | | | | | | | | | | | | | | | | | | | | | | | | | | | | | | | | | |
| Types of Investments in Portfolio (as a % of net assets) | | | | | | | | | | | | Top Five Countries (as a % of net assets) | | | | |
| Common Stocks | 99.5% | | | | | | | | | | | | | | | | | China | 27% | | | | | | |
| Short-Term Investments | 1.2% | | | | | | | | | | | | | | | | | India | 19% | | | | | | |
| Other Assets and Liabilities | (0.7)% | | | | | | | | | | | | | | | | | Taiwan | 19% | | | | | | |
| | | | | | | | | | | | | | | | | | | South Korea | 8% | | | | | | |
| | | | | | | | | | | | | | | | | | | Brazil | 6% | | | | | | |
| | | | | | | | | | | | | | | | | | | | | | | | | | |
| | | | | | | | | | | | | | | | | | | | | | | | | | |
| | | | | | | | | | | | | | | | | | | | | | | | | | |
| | | | | | | | | | | | | | | | | | | | | | | | | | |
| | | | | | | | | | | | | | | | | | | | | | | | | | |
| | | | | | | | | | | | | | | | | | | | | | | | | | |
| | | | | | | | | | | | | | | | | | | | | | | | | | |
| | | | | | | | | | | | | | | | | | | | | | | | | | |
| | | | | | | | | | | | | | | | | | | | | | | | | | |
| | | | | | | | | | | | | | | | | | | | | | | | | | |
| | | | | | | | | | | | | | | | | | | | | | | | | | |
| | |
| For additional information about the fund, including its Prospectus, Statement of Additional Information, financial statements, holdings and proxy voting information, scan the QR code or visit americancentury.com/docs. |
| | |
|
| ©2025 American Century Proprietary Holdings, Inc. All rights reserved. |
A-25086489
ANNUAL SHAREHOLDER REPORT
Emerging Markets Fund
| | | | | |
R5 Class (AEGMX) | November 30, 2024 |
This annual shareholder report contains important information about Emerging Markets Fund for the period of December 1, 2023 to November 30, 2024. You can find additional information about the fund at americancentury.com/docs. You can also request this information by contacting us at 1-800-345-2021.
| | | | | | | | |
What were the fund costs for the last year? (based on a hypothetical $10,000 investment) |
|
| Costs of a $10,000 investment | Costs paid as a percentage of a $10,000 investment |
| R5 Class | $115 | 1.07% |
|
| | | | | |
| What were the key factors that affected the fund’s performance? |
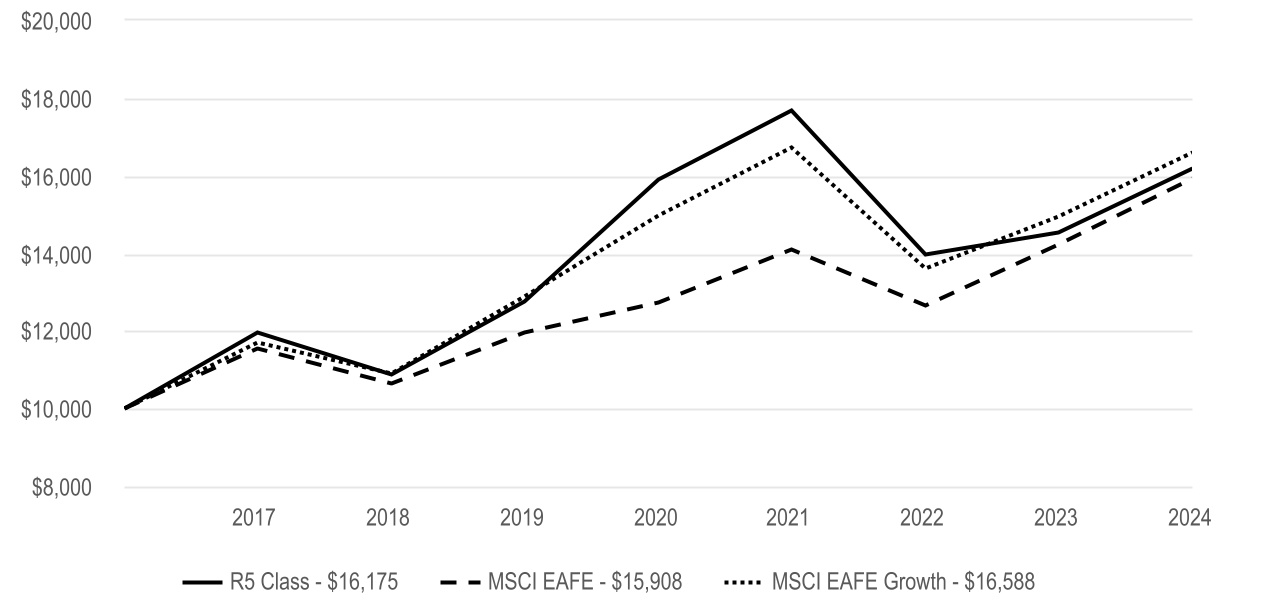
Emerging Markets Fund R5 Class returned 15.48% for the reporting period ended November 30, 2024. |
| The fund seeks capital growth. The commentary below refers to the fund's performance relative to the MSCI Emerging Markets Index. |
| • | Consumer discretionary contributed to relative performance with contributions from MakeMyTrip, an India-based travel company, and Zomato, an India-based food delivery and restaurant reservation company. Trip.com Group, a China-based travel company, benefited results as well. The fund's underweight position in the materials sector also boosted performance. |
| • | Other individual contributors included aircraft company Embraer and semiconductor business Taiwan Semiconductor Manufacturing Co. |
| • | The communication services and energy sectors were the leading detractors from relative performance. NetEase, a China-based internet technology business, and PRIO, an oil and natural gas company, dragged on results. |
| • | Other notable detractors included Samsung Electronics and Hapvida Participacoes e Investimentos, the Brazil-based health care company. Kweichow Moutai, a China-based liquor producer, and Banco BTG Pactual, a financial company based in Brazil, also hurt results. |
| | |
Cumulative Performance (based on an initial $10,000 investment) |
| April 10, 2017 through November 30, 2024 |
|
| | | | | | | | | | | | | | | | |
Average Annual Total Returns | |
| 1 Year | 5 Year | | Since Inception | Inception Date | |
| R5 Class | 15.48% | 1.30% | | 3.28% | 4/10/17 | |
| | | | | | |
| | | | | | |
| | | | | | |
| | | | | | |
| | | | | | |
| MSCI Emerging Markets | 11.86% | 3.20% | | 4.08% | — | |
| | | | | | |
| | | | | | |
| | | | | | |
| | | | | | |
| | |
|
The opinions expressed are those of American Century Investments and are no guarantee of the future performance of any American Century Investments fund. This information is for educational purposes only and is not intended as investment advice. Data reflects past performance, assumes reinvestment of dividends and capital gains and is no guarantee of future results. Current performance may be higher or lower than data shown. Investment return and principal value will fluctuate and redemption value may be more or less than original cost, and none of the charts reflect the deduction of taxes that a shareholder would pay on fund distributions or the redemption of fund shares. Total returns for periods less than one year are not annualized. Visit americancentury.com for more recent performance information.
|
| | | | | |
Fund Statistics | |
| Net Assets | $1,785,280,256 |
| Management Fees (dollars paid during the reporting period) | $12,707,240 |
| Portfolio Turnover Rate | 29 | % |
| Total Number of Portfolio Holdings | 78 |
| |
| |
| | | | | | | | | | | | | | | | | | | | | | | | | | | | | | | | | | | | |
| Types of Investments in Portfolio (as a % of net assets) | | | | | | | | | | | | Top Five Countries (as a % of net assets) | | | | |
| Common Stocks | 99.5% | | | | | | | | | | | | | | | | | China | 27% | | | | | | |
| Short-Term Investments | 1.2% | | | | | | | | | | | | | | | | | India | 19% | | | | | | |
| Other Assets and Liabilities | (0.7)% | | | | | | | | | | | | | | | | | Taiwan | 19% | | | | | | |
| | | | | | | | | | | | | | | | | | | South Korea | 8% | | | | | | |
| | | | | | | | | | | | | | | | | | | Brazil | 6% | | | | | | |
| | | | | | | | | | | | | | | | | | | | | | | | | | |
| | | | | | | | | | | | | | | | | | | | | | | | | | |
| | | | | | | | | | | | | | | | | | | | | | | | | | |
| | | | | | | | | | | | | | | | | | | | | | | | | | |
| | | | | | | | | | | | | | | | | | | | | | | | | | |
| | | | | | | | | | | | | | | | | | | | | | | | | | |
| | | | | | | | | | | | | | | | | | | | | | | | | | |
| | | | | | | | | | | | | | | | | | | | | | | | | | |
| | | | | | | | | | | | | | | | | | | | | | | | | | |
| | | | | | | | | | | | | | | | | | | | | | | | | | |
| | | | | | | | | | | | | | | | | | | | | | | | | | |
| | |
| For additional information about the fund, including its Prospectus, Statement of Additional Information, financial statements, holdings and proxy voting information, scan the QR code or visit americancentury.com/docs. |
| | |
|
| ©2025 American Century Proprietary Holdings, Inc. All rights reserved. |
A-2509A802
ANNUAL SHAREHOLDER REPORT
Emerging Markets Fund
| | | | | |
| R6 Class (AEDMX) | November 30, 2024 |
This annual shareholder report contains important information about Emerging Markets Fund for the period of December 1, 2023 to November 30, 2024. You can find additional information about the fund at americancentury.com/docs. You can also request this information by contacting us at 1-800-345-2021.
| | | | | | | | |
What were the fund costs for the last year? (based on a hypothetical $10,000 investment) |
|
| Costs of a $10,000 investment | Costs paid as a percentage of a $10,000 investment |
| R6 Class | $99 | 0.92% |
|
| | | | | |
| What were the key factors that affected the fund’s performance? |
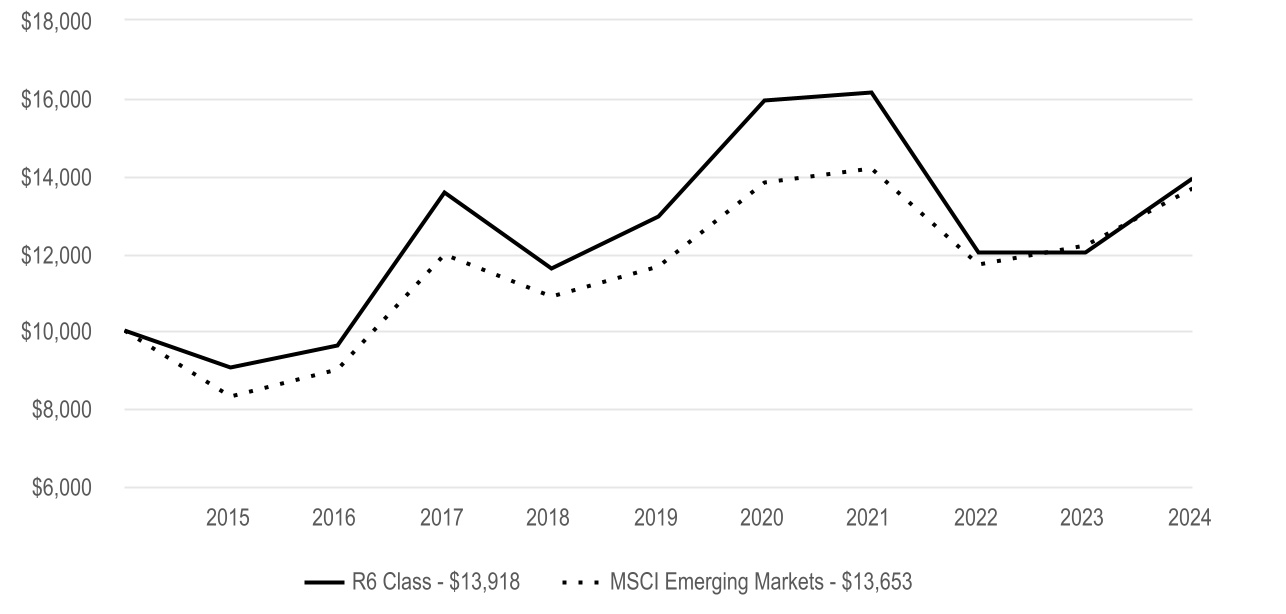
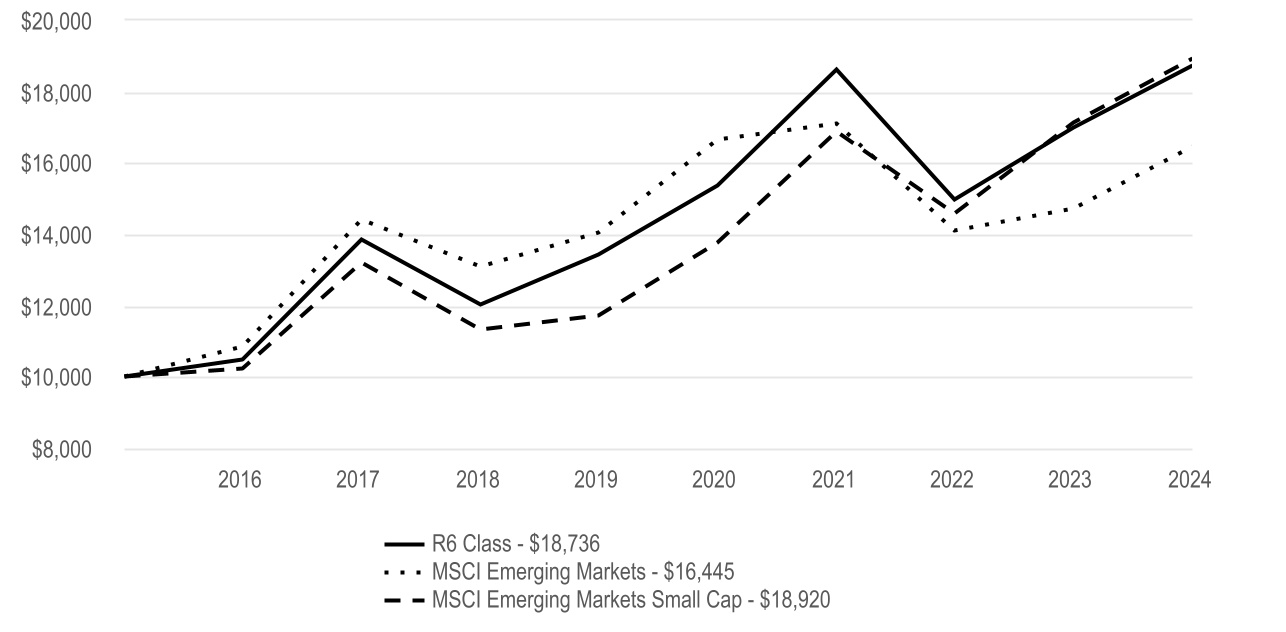
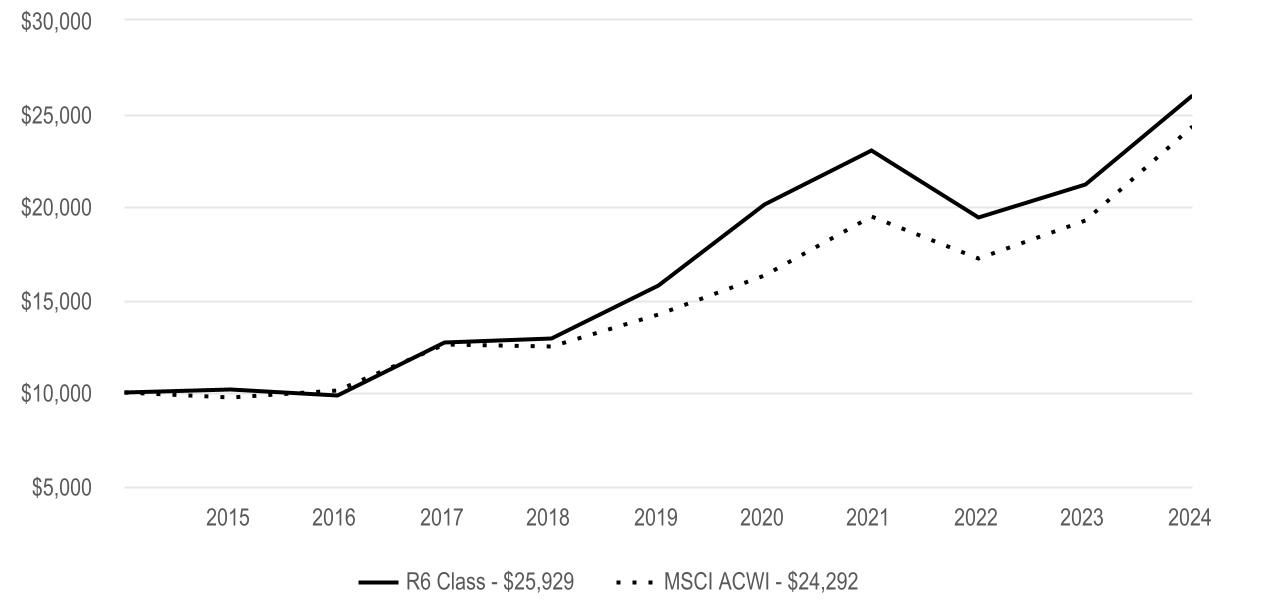
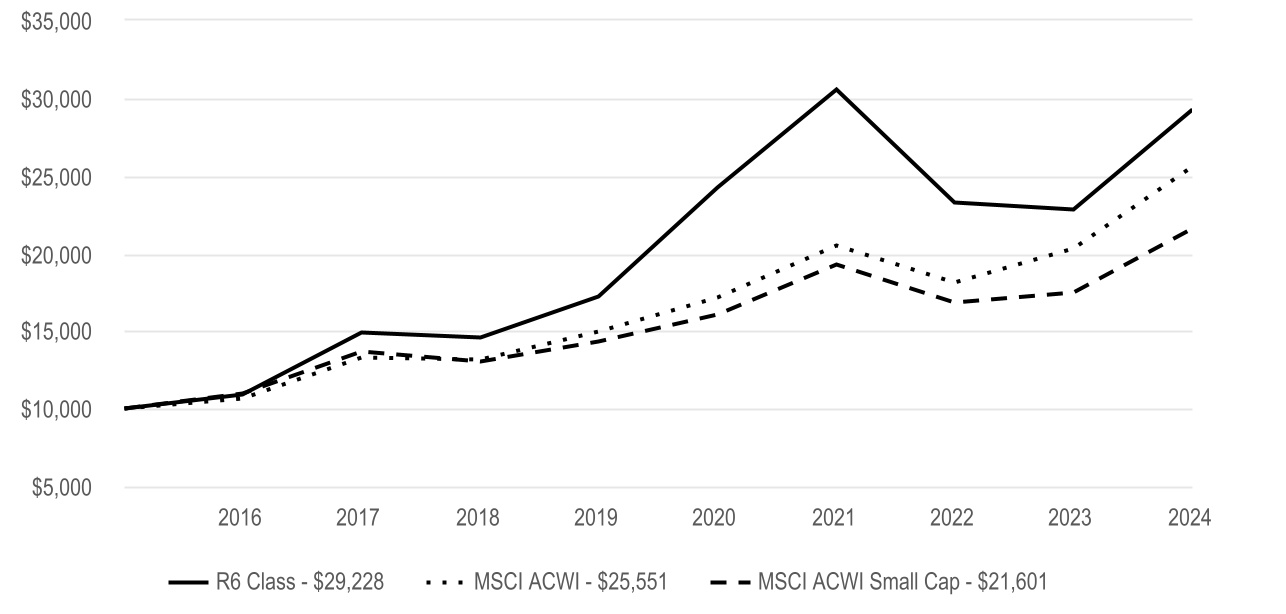
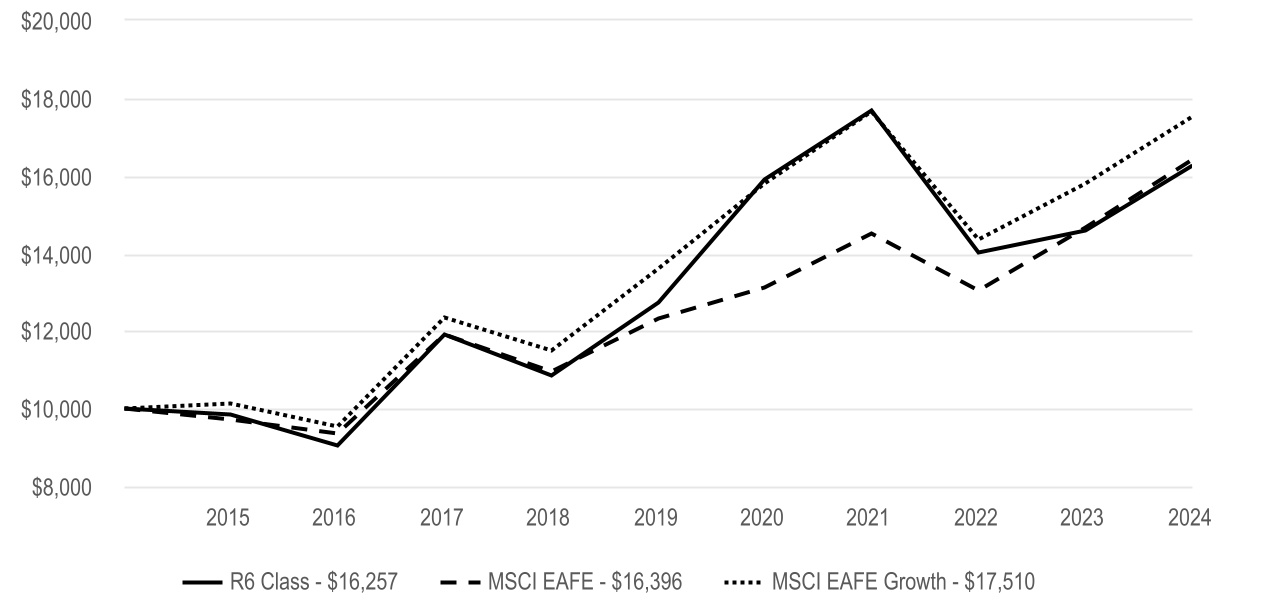
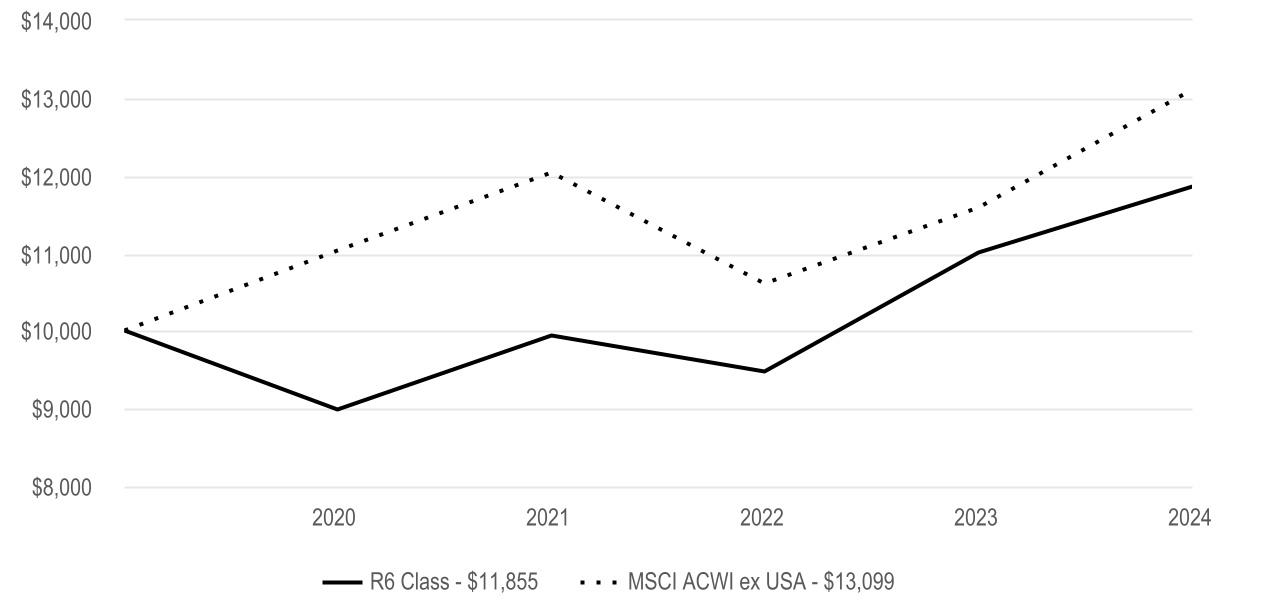
Emerging Markets Fund R6 Class returned 15.75% for the reporting period ended November 30, 2024. |
| The fund seeks capital growth. The commentary below refers to the fund's performance relative to the MSCI Emerging Markets Index. |
| • | Consumer discretionary contributed to relative performance with contributions from MakeMyTrip, an India-based travel company, and Zomato, an India-based food delivery and restaurant reservation company. Trip.com Group, a China-based travel company, benefited results as well. The fund's underweight position in the materials sector also boosted performance. |
| • | Other individual contributors included aircraft company Embraer and semiconductor business Taiwan Semiconductor Manufacturing Co. |
| • | The communication services and energy sectors were the leading detractors from relative performance. NetEase, a China-based internet technology business, and PRIO, an oil and natural gas company, dragged on results. |
| • | Other notable detractors included Samsung Electronics and Hapvida Participacoes e Investimentos, the Brazil-based health care company. Kweichow Moutai, a China-based liquor producer, and Banco BTG Pactual, a financial company based in Brazil, also hurt results. |
| | |
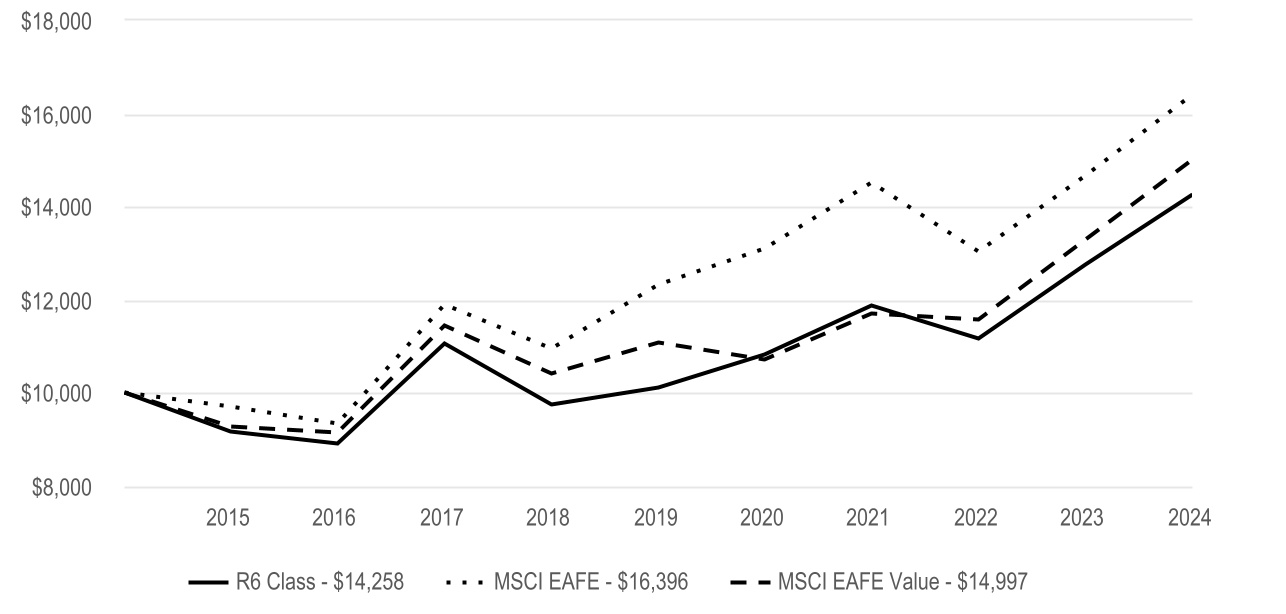
Cumulative Performance (based on an initial $10,000 investment) |
| November 30, 2014 through November 30, 2024 |
|
| | | | | | | | | | | | | | |
Average Annual Total Returns | |
| 1 Year | 5 Year | 10 Year | | | |
| R6 Class | 15.75% | 1.47% | 3.36% | | | |
| | | | | | |
| | | | | | |
| | | | | | |
| | | | | | |
| | | | | | |
| MSCI Emerging Markets | 11.86% | 3.20% | 3.16% | | | |
| | | | | | |
| | | | | | |
| | | | | | |
| | | | | | |
| | |
|
The opinions expressed are those of American Century Investments and are no guarantee of the future performance of any American Century Investments fund. This information is for educational purposes only and is not intended as investment advice. Data reflects past performance, assumes reinvestment of dividends and capital gains and is no guarantee of future results. Current performance may be higher or lower than data shown. Investment return and principal value will fluctuate and redemption value may be more or less than original cost, and none of the charts reflect the deduction of taxes that a shareholder would pay on fund distributions or the redemption of fund shares. Total returns for periods less than one year are not annualized. Visit americancentury.com for more recent performance information.
|
| | | | | |
Fund Statistics | |
| Net Assets | $1,785,280,256 |
| Management Fees (dollars paid during the reporting period) | $12,707,240 |
| Portfolio Turnover Rate | 29 | % |
| Total Number of Portfolio Holdings | 78 |
| |
| |
| | | | | | | | | | | | | | | | | | | | | | | | | | | | | | | | | | | | |
| Types of Investments in Portfolio (as a % of net assets) | | | | | | | | | | | | Top Five Countries (as a % of net assets) | | | | |
| Common Stocks | 99.5% | | | | | | | | | | | | | | | | | China | 27% | | | | | | |
| Short-Term Investments | 1.2% | | | | | | | | | | | | | | | | | India | 19% | | | | | | |
| Other Assets and Liabilities | (0.7)% | | | | | | | | | | | | | | | | | Taiwan | 19% | | | | | | |
| | | | | | | | | | | | | | | | | | | South Korea | 8% | | | | | | |
| | | | | | | | | | | | | | | | | | | Brazil | 6% | | | | | | |
| | | | | | | | | | | | | | | | | | | | | | | | | | |
| | | | | | | | | | | | | | | | | | | | | | | | | | |
| | | | | | | | | | | | | | | | | | | | | | | | | | |
| | | | | | | | | | | | | | | | | | | | | | | | | | |
| | | | | | | | | | | | | | | | | | | | | | | | | | |
| | | | | | | | | | | | | | | | | | | | | | | | | | |
| | | | | | | | | | | | | | | | | | | | | | | | | | |
| | | | | | | | | | | | | | | | | | | | | | | | | | |
| | | | | | | | | | | | | | | | | | | | | | | | | | |
| | | | | | | | | | | | | | | | | | | | | | | | | | |
| | | | | | | | | | | | | | | | | | | | | | | | | | |
| | |
| For additional information about the fund, including its Prospectus, Statement of Additional Information, financial statements, holdings and proxy voting information, scan the QR code or visit americancentury.com/docs. |
| | |
|
| ©2025 American Century Proprietary Holdings, Inc. All rights reserved. |
A-25086422
ANNUAL SHAREHOLDER REPORT
Emerging Markets Fund
| | | | | |
G Class (ACADX) | November 30, 2024 |
This annual shareholder report contains important information about Emerging Markets Fund for the period of December 1, 2023 to November 30, 2024. You can find additional information about the fund at americancentury.com/docs. You can also request this information by contacting us at 1-800-345-2021.
| | | | | | | | |
What were the fund costs for the last year? (based on a hypothetical $10,000 investment) |
|
| Costs of a $10,000 investment | Costs paid as a percentage of a $10,000 investment |
| G Class | $2 | 0.02% |
|
| | | | | |
| What were the key factors that affected the fund’s performance? |
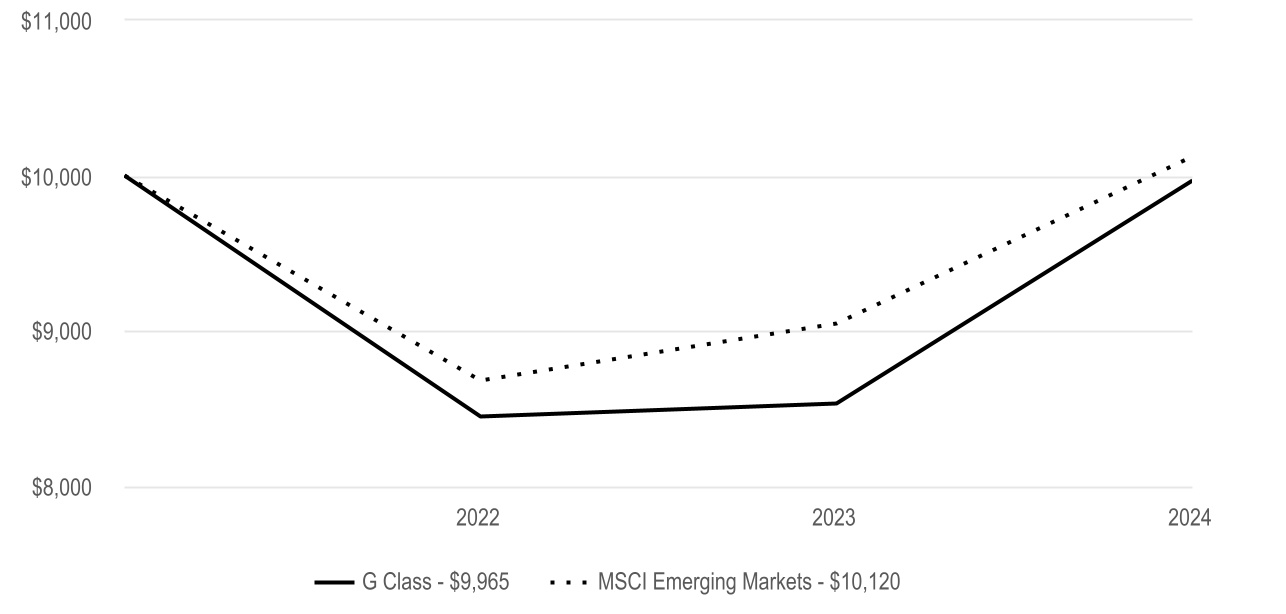
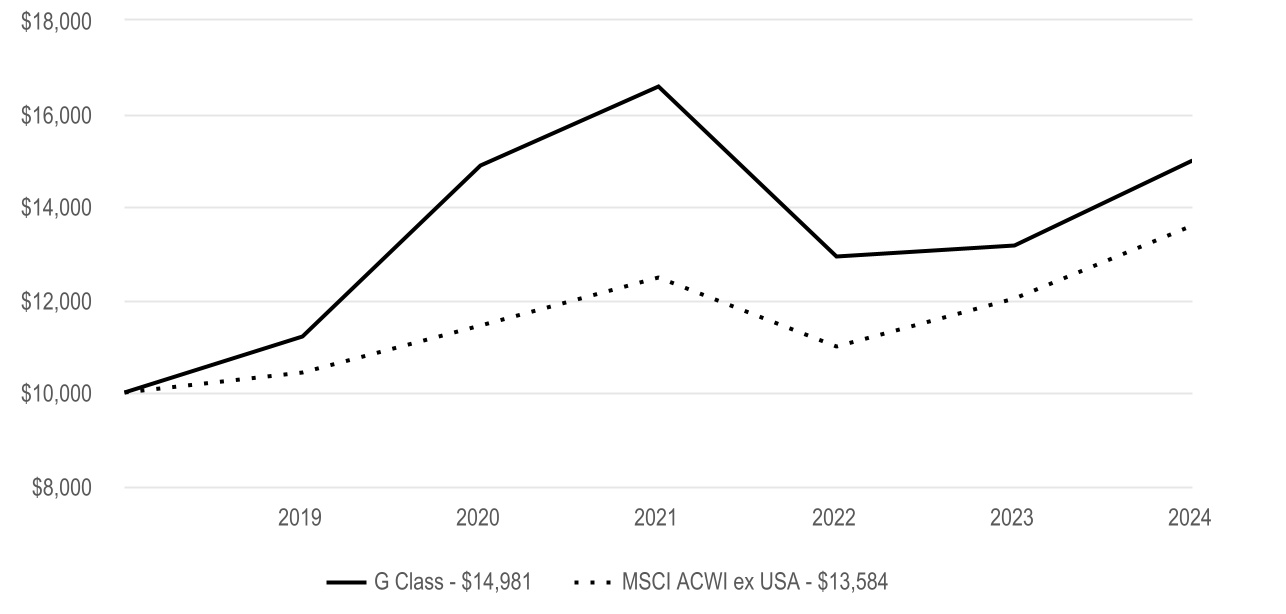
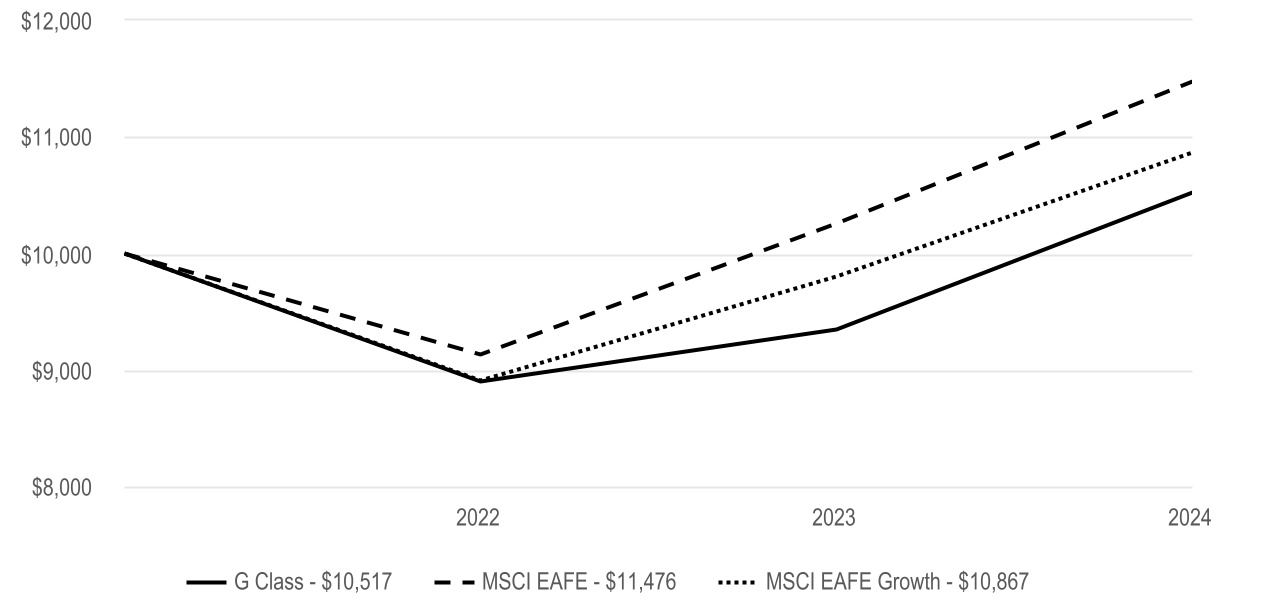
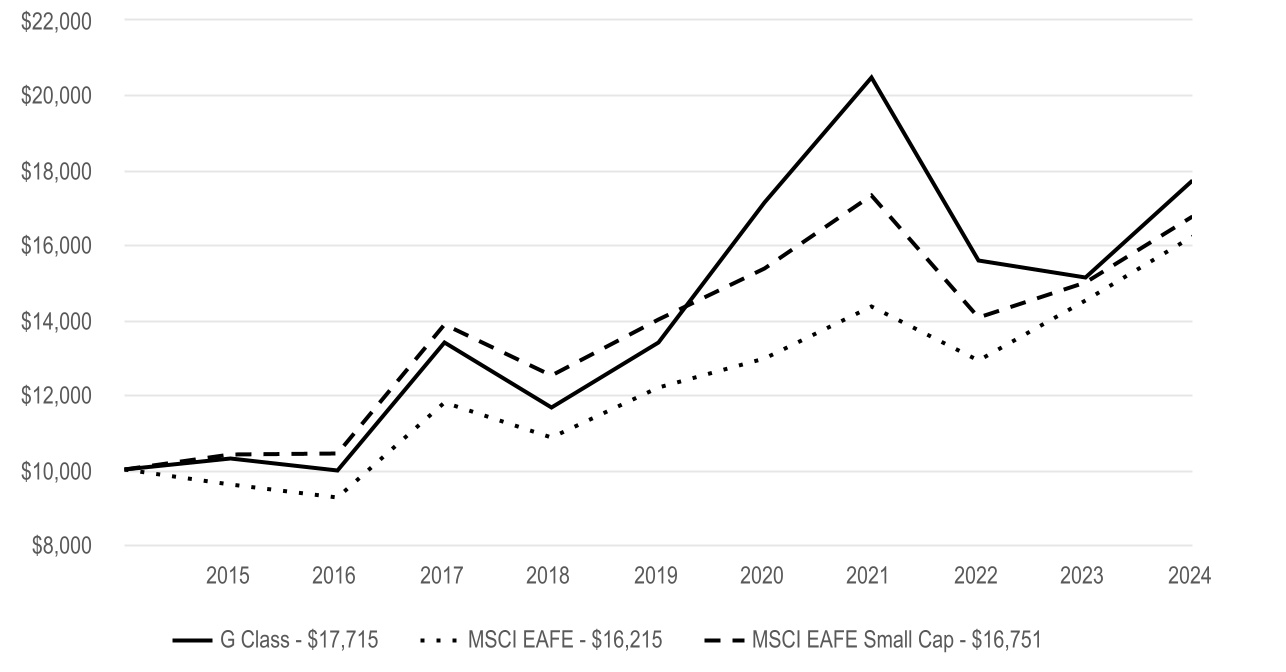
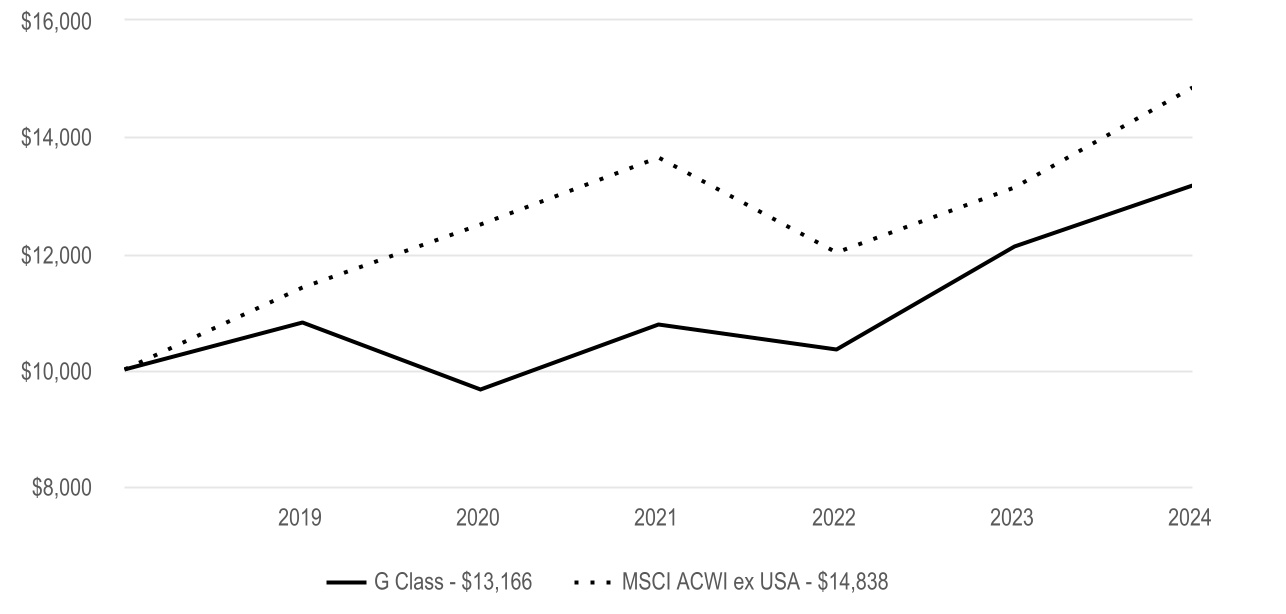
Emerging Markets Fund G Class returned 16.79% for the reporting period ended November 30, 2024. |
| The fund seeks capital growth. The commentary below refers to the fund's performance relative to the MSCI Emerging Markets Index. |
| • | Consumer discretionary contributed to relative performance with contributions from MakeMyTrip, an India-based travel company, and Zomato, an India-based food delivery and restaurant reservation company. Trip.com Group, a China-based travel company, benefited results as well. The fund's underweight position in the materials sector also boosted performance. |
| • | Other individual contributors included aircraft company Embraer and semiconductor business Taiwan Semiconductor Manufacturing Co. |
| • | The communication services and energy sectors were the leading detractors from relative performance. NetEase, a China-based internet technology business, and PRIO, an oil and natural gas company, dragged on results. |
| • | Other notable detractors included Samsung Electronics and Hapvida Participacoes e Investimentos, the Brazil-based health care company. Kweichow Moutai, a China-based liquor producer, and Banco BTG Pactual, a financial company based in Brazil, also hurt results. |
| | |
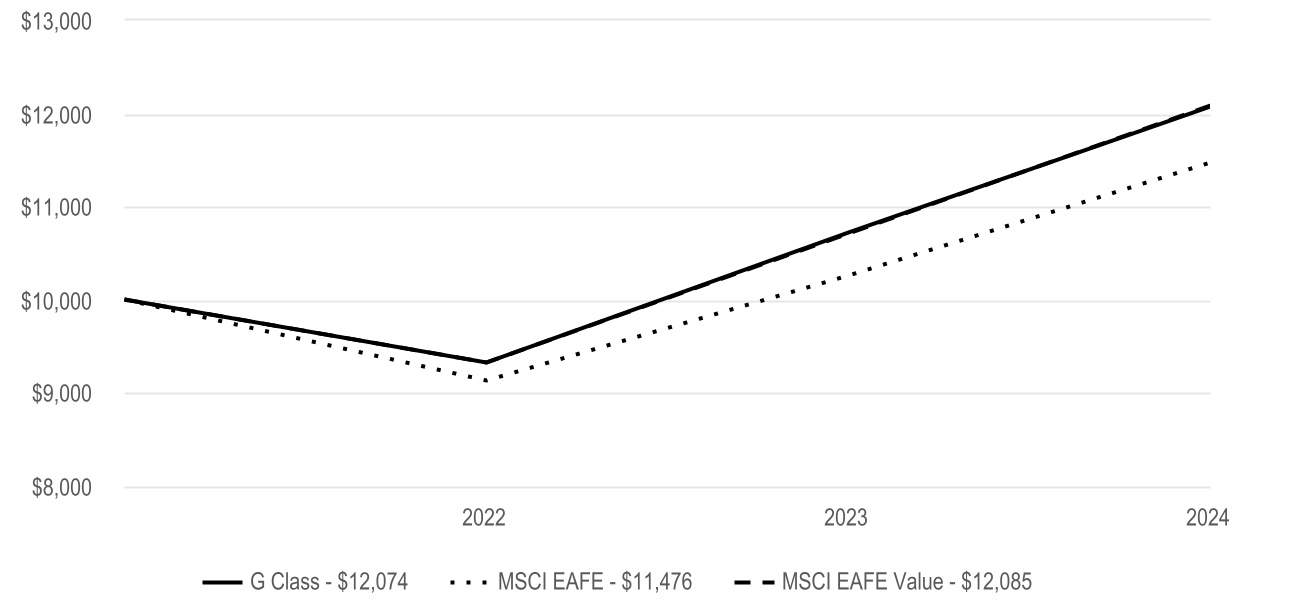
Cumulative Performance (based on an initial $10,000 investment) |
| April 1, 2022 through November 30, 2024 |
|
| | | | | | | | | | | | | | |
Average Annual Total Returns | |
| 1 Year | | | Since Inception | Inception Date | |
| G Class | 16.79% | | | -0.13% | 4/1/22 | |
| | | | | | |
| | | | | | |
| | | | | | |
| | | | | | |
| | | | | | |
| MSCI Emerging Markets | 11.86% | | | 0.45% | — | |
| | | | | | |
| | | | | | |
| | | | | | |
| | | | | | |
| | |
|
The opinions expressed are those of American Century Investments and are no guarantee of the future performance of any American Century Investments fund. This information is for educational purposes only and is not intended as investment advice. Data reflects past performance, assumes reinvestment of dividends and capital gains and is no guarantee of future results. Current performance may be higher or lower than data shown. Investment return and principal value will fluctuate and redemption value may be more or less than original cost, and none of the charts reflect the deduction of taxes that a shareholder would pay on fund distributions or the redemption of fund shares. Total returns for periods less than one year are not annualized. Visit americancentury.com for more recent performance information.
|
| | | | | |
Fund Statistics | |
| Net Assets | $1,785,280,256 |
| Management Fees (dollars paid during the reporting period) | $12,707,240 |
| Portfolio Turnover Rate | 29 | % |
| Total Number of Portfolio Holdings | 78 |
| |
| |
| | | | | | | | | | | | | | | | | | | | | | | | | | | | | | | | | | | | |
| Types of Investments in Portfolio (as a % of net assets) | | | | | | | | | | | | Top Five Countries (as a % of net assets) | | | | |
| Common Stocks | 99.5% | | | | | | | | | | | | | | | | | China | 27% | | | | | | |
| Short-Term Investments | 1.2% | | | | | | | | | | | | | | | | | India | 19% | | | | | | |
| Other Assets and Liabilities | (0.7)% | | | | | | | | | | | | | | | | | Taiwan | 19% | | | | | | |
| | | | | | | | | | | | | | | | | | | South Korea | 8% | | | | | | |
| | | | | | | | | | | | | | | | | | | Brazil | 6% | | | | | | |
| | | | | | | | | | | | | | | | | | | | | | | | | | |
| | | | | | | | | | | | | | | | | | | | | | | | | | |
| | | | | | | | | | | | | | | | | | | | | | | | | | |
| | | | | | | | | | | | | | | | | | | | | | | | | | |
| | | | | | | | | | | | | | | | | | | | | | | | | | |
| | | | | | | | | | | | | | | | | | | | | | | | | | |
| | | | | | | | | | | | | | | | | | | | | | | | | | |
| | | | | | | | | | | | | | | | | | | | | | | | | | |
| | | | | | | | | | | | | | | | | | | | | | | | | | |
| | | | | | | | | | | | | | | | | | | | | | | | | | |
| | | | | | | | | | | | | | | | | | | | | | | | | | |
| | |
| For additional information about the fund, including its Prospectus, Statement of Additional Information, financial statements, holdings and proxy voting information, scan the QR code or visit americancentury.com/docs. |
| | |
|
| ©2025 American Century Proprietary Holdings, Inc. All rights reserved. |
A-2509A729
ANNUAL SHAREHOLDER REPORT
Emerging Markets Small Cap Fund
| | | | | |
Investor Class (AECVX) | November 30, 2024 |
This annual shareholder report contains important information about Emerging Markets Small Cap Fund for the period of December 1, 2023 to November 30, 2024. You can find additional information about the fund at americancentury.com/docs. You can also request this information by contacting us at 1-800-345-2021. This report describes changes to the fund that occurred during the reporting period.
| | | | | | | | |
What were the fund costs for the last year? (based on a hypothetical $10,000 investment) |
|
| Costs of a $10,000 investment | Costs paid as a percentage of a $10,000 investment |
| Investor Class | $146 | 1.39% |
|
| | | | | |
| What were the key factors that affected the fund’s performance? |
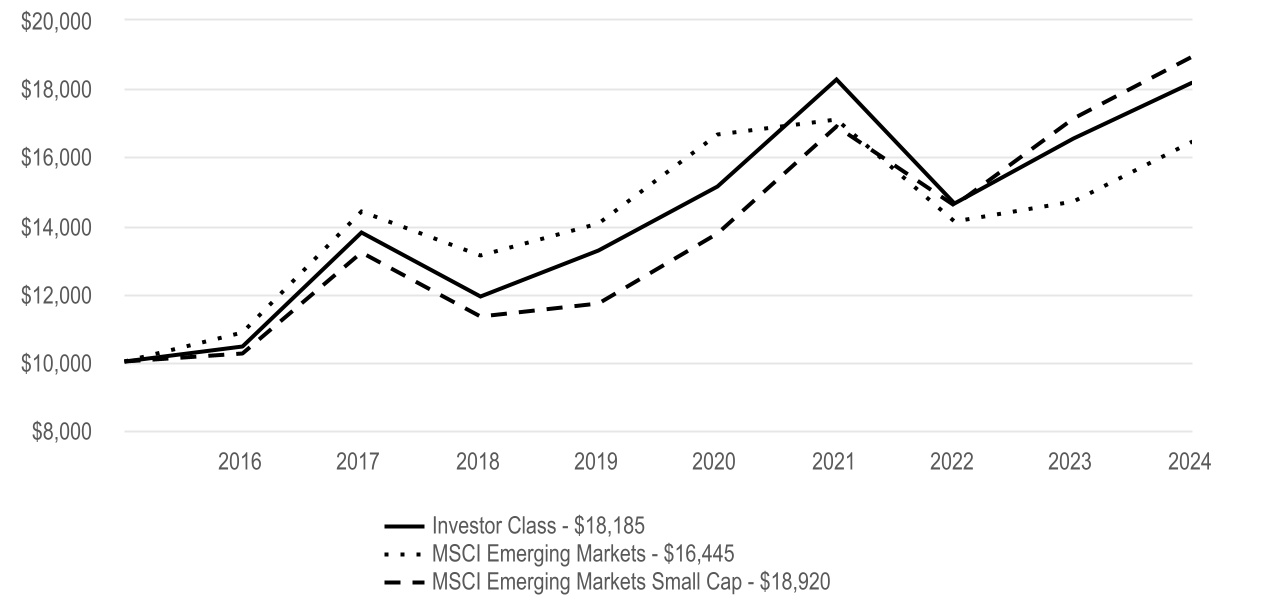
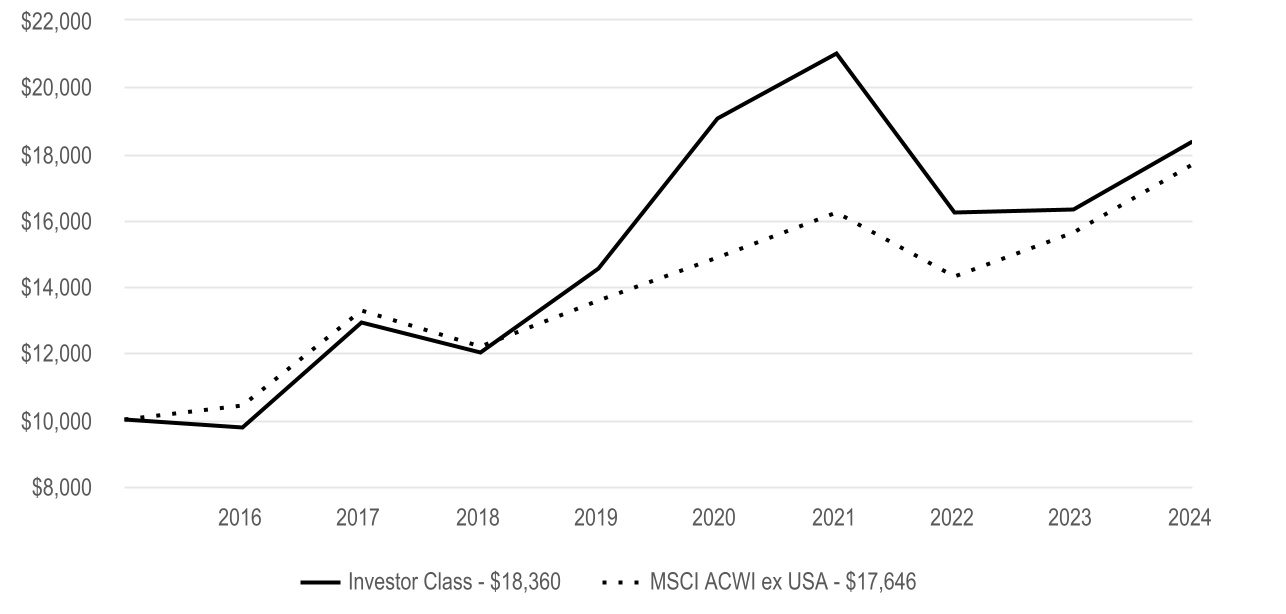
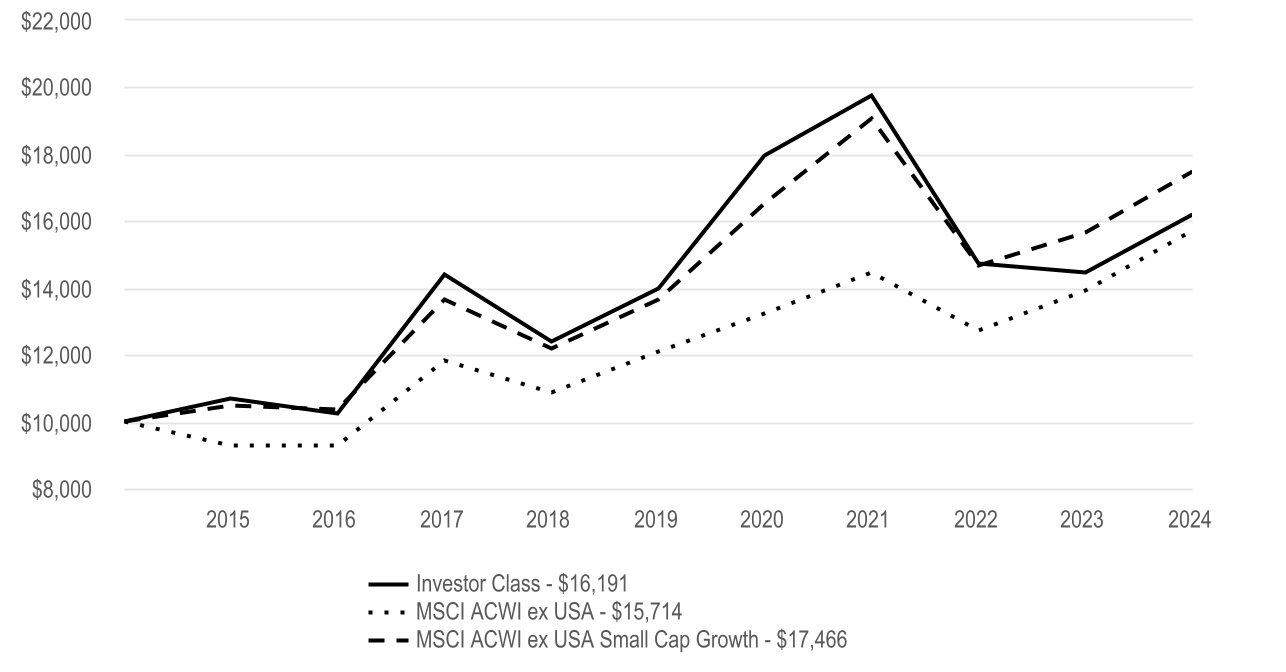
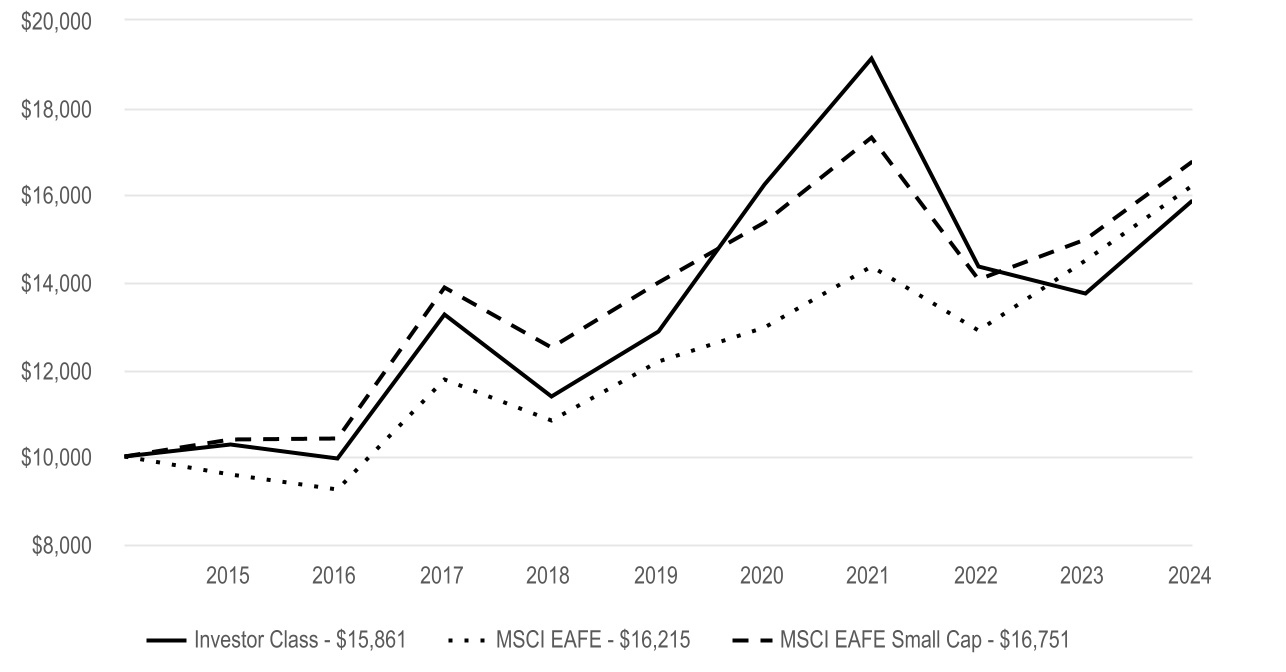
Emerging Markets Small Cap Fund Investor Class returned 9.93% for the reporting period ended November 30, 2024. |
| The fund seeks capital growth. The commentary below refers to the fund's performance compared to the MSCI Emerging Markets Small Cap Index. |
| • | The industrials sector contributed to relative performance. Key holdings included Gamuda, a Malaysia-based engineering and construction company, and BizLink Holding, a company focused on interconnect solutions. Stock selection in financials also contributed to results. |
| • | Notable contributors were MakeMyTrip, an India-based online travel company, and Prestige Estates Projects, an India-based real estate company. India-based PB Fintech, an online platform for insurance and lending products, also helped. |
| • | Communication services and consumer staples hurt relative performance. VTEX, a digital commerce platform, was a notable detractor in interactive media and services. LG H&H, the South Korea-based cosmetics and household goods company, dragged on relative results in personal care products. |
| • | Other notable detractors included Isu Petasys, a South Korea-based maker of printed circuit boards, and Taiwan-based Global Unichip, which specializes in application-specific integrated circuits. A holding in Samsung E&A, a South Korea-based engineering company, also hurt relative results. |
| | |
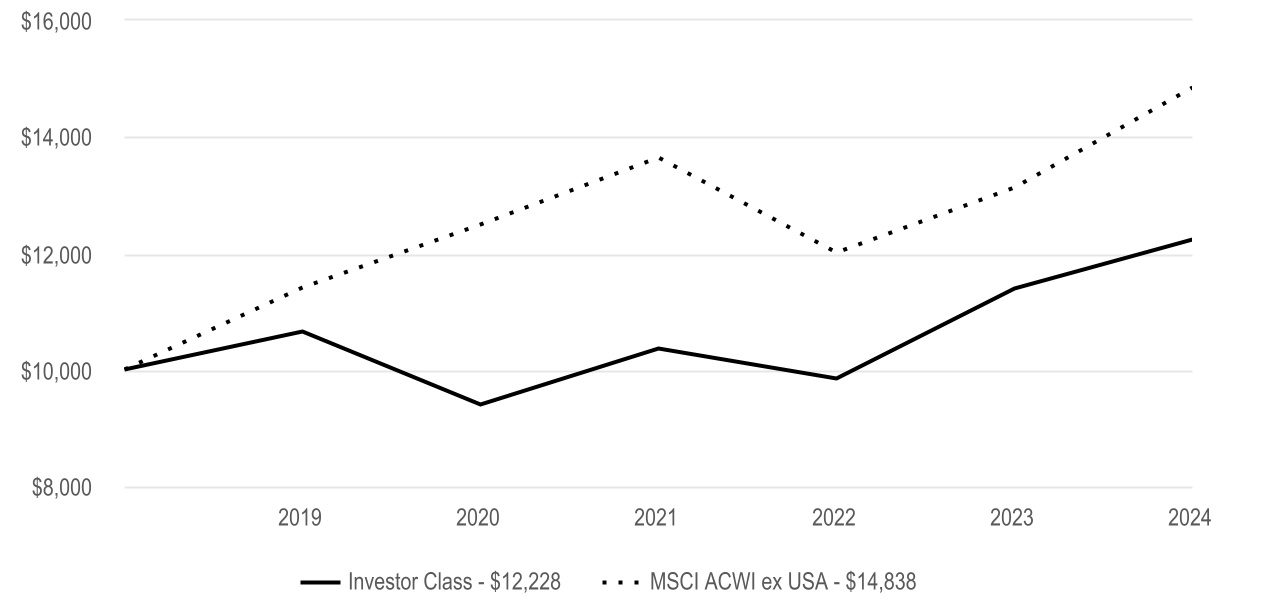
Cumulative Performance (based on an initial $10,000 investment) |
| April 7, 2016 through November 30, 2024 |
|
| | | | | | | | | | | | | | | | |
Average Annual Total Returns | |
| 1 Year | 5 Year | | Since Inception | Inception Date | |
| Investor Class | 9.93% | 6.52% | | 7.15% | 4/7/16 | |
| | | | | | |
| Regulatory Index | | | | | | |
| MSCI Emerging Markets | 11.86% | 3.20% | | 5.92% | — | |
| | | | | | |
| Performance Index | | | | | | |
| MSCI Emerging Markets Small Cap | 10.55% | 10.08% | | 7.65% | — | |
| | | | | | |
| | | | | | |
| | | | | | |
| | | | | | |
| | | | | | | | | | | | | | | | | |
| The regulatory index is provided as a broad measure of market performance. The performance index is provided because the advisor believes it is more reflective of the fund’s investment strategy. |
|
|
|
|
|
|
|
|
|
|
| | |
|
The opinions expressed are those of American Century Investments and are no guarantee of the future performance of any American Century Investments fund. This information is for educational purposes only and is not intended as investment advice. Data reflects past performance, assumes reinvestment of dividends and capital gains and is no guarantee of future results. Current performance may be higher or lower than data shown. Investment return and principal value will fluctuate and redemption value may be more or less than original cost, and none of the charts reflect the deduction of taxes that a shareholder would pay on fund distributions or the redemption of fund shares. Total returns for periods less than one year are not annualized. Visit americancentury.com for more recent performance information.
|
| | | | | |
Fund Statistics | |
| Net Assets | $22,706,690 |
| Management Fees (dollars paid during the reporting period) | $241,521 |
| Portfolio Turnover Rate | 70 | % |
| Total Number of Portfolio Holdings | 99 |
| |
| |
| | | | | | | | | | | | | | | | | | | | | | | | | | | | | | | | | | | | |
| Types of Investments in Portfolio (as a % of net assets) | | | | | | | | | | | | Top Five Countries (as a % of net assets) | | | | |
| Common Stocks | 95.9% | | | | | | | | | | | | | | | | | India | 27% | | | | | | |
| Exchange-Traded Funds | 0.7% | | | | | | | | | | | | | | | | | Taiwan | 20% | | | | | | |
| Short-Term Investments | 6.2% | | | | | | | | | | | | | | | | | China | 13% | | | | | | |
| Other Assets and Liabilities | (2.8)% | | | | | | | | | | | | | | | | | South Korea | 10% | | | | | | |
| | | | | | | | | | | | | | | | | | | Brazil | 5% | | | | | | |
| | | | | | | | | | | | | | | | | | | | | | | | | | |
| | | | | | | | | | | | | | | | | | | | | | | | | | |
| | | | | | | | | | | | | | | | | | | | | | | | | | |
| | | | | | | | | | | | | | | | | | | | | | | | | | |
| | | | | | | | | | | | | | | | | | | | | | | | | | |
| | | | | | | | | | | | | | | | | | | | | | | | | | |
| | | | | | | | | | | | | | | | | | | | | | | | | | |
| | | | | | | | | | | | | | | | | | | | | | | | | | |
| | | | | | | | | | | | | | | | | | | | | | | | | | |
| | | | | | | | | | | | | | | | | | | | | | | | | | |
| | | | | | | | | | | | | | | | | | | | | | | | | | |
| | |
| Fund Changes |
|
|
| Beginning October 2024, the total eligible investments required to qualify for a waiver of the annual account maintenance fee changed from $10,000 to $25,000. Such fee will also be waived for any accounts for which the shareholder has elected to receive electronic delivery of all fund/account documents. |
|
|
|
|
| | |
| For additional information about the fund, including its Prospectus, Statement of Additional Information, financial statements, holdings and proxy voting information, scan the QR code or visit americancentury.com/docs. |
| | |
|
| ©2025 American Century Proprietary Holdings, Inc. All rights reserved. |
A-25086281
ANNUAL SHAREHOLDER REPORT
Emerging Markets Small Cap Fund
| | | | | |
I Class (AECSX) | November 30, 2024 |
This annual shareholder report contains important information about Emerging Markets Small Cap Fund for the period of December 1, 2023 to November 30, 2024. You can find additional information about the fund at americancentury.com/docs. You can also request this information by contacting us at 1-800-345-2021.
| | | | | | | | |
What were the fund costs for the last year? (based on a hypothetical $10,000 investment) |
|
| Costs of a $10,000 investment | Costs paid as a percentage of a $10,000 investment |
| I Class | $125 | 1.19% |
|
| | | | | |
| What were the key factors that affected the fund’s performance? |
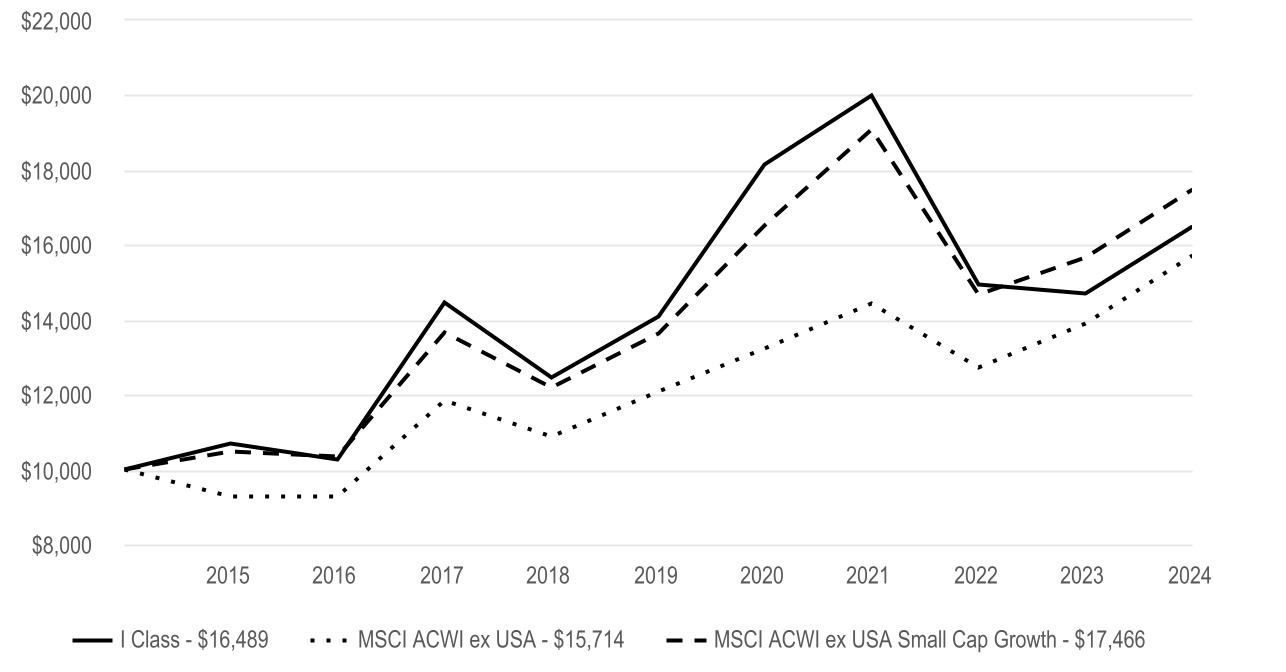
Emerging Markets Small Cap Fund I Class returned 10.17% for the reporting period ended November 30, 2024. |
| The fund seeks capital growth. The commentary below refers to the fund's performance compared to the MSCI Emerging Markets Small Cap Index. |
| • | The industrials sector contributed to relative performance. Key holdings included Gamuda, a Malaysia-based engineering and construction company, and BizLink Holding, a company focused on interconnect solutions. Stock selection in financials also contributed to results. |
| • | Notable contributors were MakeMyTrip, an India-based online travel company, and Prestige Estates Projects, an India-based real estate company. India-based PB Fintech, an online platform for insurance and lending products, also helped. |
| • | Communication services and consumer staples hurt relative performance. VTEX, a digital commerce platform, was a notable detractor in interactive media and services. LG H&H, the South Korea-based cosmetics and household goods company, dragged on relative results in personal care products. |
| • | Other notable detractors included Isu Petasys, a South Korea-based maker of printed circuit boards, and Taiwan-based Global Unichip, which specializes in application-specific integrated circuits. A holding in Samsung E&A, a South Korea-based engineering company, also hurt relative results. |
| | |
Cumulative Performance (based on an initial $10,000 investment) |
| April 7, 2016 through November 30, 2024 |
|
| | | | | | | | | | | | | | | | |
Average Annual Total Returns | |
| 1 Year | 5 Year | | Since Inception | Inception Date | |
| I Class | 10.17% | 6.74% | | 7.37% | 4/7/16 | |
| | | | | | |
| Regulatory Index | | | | | | |
| MSCI Emerging Markets | 11.86% | 3.20% | | 5.92% | — | |
| | | | | | |
| Performance Index | | | | | | |
| MSCI Emerging Markets Small Cap | 10.55% | 10.08% | | 7.65% | — | |
| | | | | | |
| | | | | | |
| | | | | | |
| | | | | | |
| | | | | | | | | | | | | | | | | |
| The regulatory index is provided as a broad measure of market performance. The performance index is provided because the advisor believes it is more reflective of the fund’s investment strategy. |
|
|
|
|
|
|
|
|
|
|
| | |
|
The opinions expressed are those of American Century Investments and are no guarantee of the future performance of any American Century Investments fund. This information is for educational purposes only and is not intended as investment advice. Data reflects past performance, assumes reinvestment of dividends and capital gains and is no guarantee of future results. Current performance may be higher or lower than data shown. Investment return and principal value will fluctuate and redemption value may be more or less than original cost, and none of the charts reflect the deduction of taxes that a shareholder would pay on fund distributions or the redemption of fund shares. Total returns for periods less than one year are not annualized. Visit americancentury.com for more recent performance information.
|
| | | | | |
Fund Statistics | |
| Net Assets | $22,706,690 |
| Management Fees (dollars paid during the reporting period) | $241,521 |
| Portfolio Turnover Rate | 70 | % |
| Total Number of Portfolio Holdings | 99 |
| |
| |
| | | | | | | | | | | | | | | | | | | | | | | | | | | | | | | | | | | | |
| Types of Investments in Portfolio (as a % of net assets) | | | | | | | | | | | | Top Five Countries (as a % of net assets) | | | | |
| Common Stocks | 95.9% | | | | | | | | | | | | | | | | | India | 27% | | | | | | |
| Exchange-Traded Funds | 0.7% | | | | | | | | | | | | | | | | | Taiwan | 20% | | | | | | |
| Short-Term Investments | 6.2% | | | | | | | | | | | | | | | | | China | 13% | | | | | | |
| Other Assets and Liabilities | (2.8)% | | | | | | | | | | | | | | | | | South Korea | 10% | | | | | | |
| | | | | | | | | | | | | | | | | | | Brazil | 5% | | | | | | |
| | | | | | | | | | | | | | | | | | | | | | | | | | |
| | | | | | | | | | | | | | | | | | | | | | | | | | |
| | | | | | | | | | | | | | | | | | | | | | | | | | |
| | | | | | | | | | | | | | | | | | | | | | | | | | |
| | | | | | | | | | | | | | | | | | | | | | | | | | |
| | | | | | | | | | | | | | | | | | | | | | | | | | |
| | | | | | | | | | | | | | | | | | | | | | | | | | |
| | | | | | | | | | | | | | | | | | | | | | | | | | |
| | | | | | | | | | | | | | | | | | | | | | | | | | |
| | | | | | | | | | | | | | | | | | | | | | | | | | |
| | | | | | | | | | | | | | | | | | | | | | | | | | |
| | |
| For additional information about the fund, including its Prospectus, Statement of Additional Information, financial statements, holdings and proxy voting information, scan the QR code or visit americancentury.com/docs. |
| | |
|
| ©2025 American Century Proprietary Holdings, Inc. All rights reserved. |
A-25086273
ANNUAL SHAREHOLDER REPORT
Emerging Markets Small Cap Fund
| | | | | |
A Class (AECLX) | November 30, 2024 |
This annual shareholder report contains important information about Emerging Markets Small Cap Fund for the period of December 1, 2023 to November 30, 2024. You can find additional information about the fund at americancentury.com/docs. You can also request this information by contacting us at 1-800-345-2021.
| | | | | | | | |
What were the fund costs for the last year? (based on a hypothetical $10,000 investment) |
|
| Costs of a $10,000 investment | Costs paid as a percentage of a $10,000 investment |
| A Class | $172 | 1.64% |
|
| | | | | |
| What were the key factors that affected the fund’s performance? |
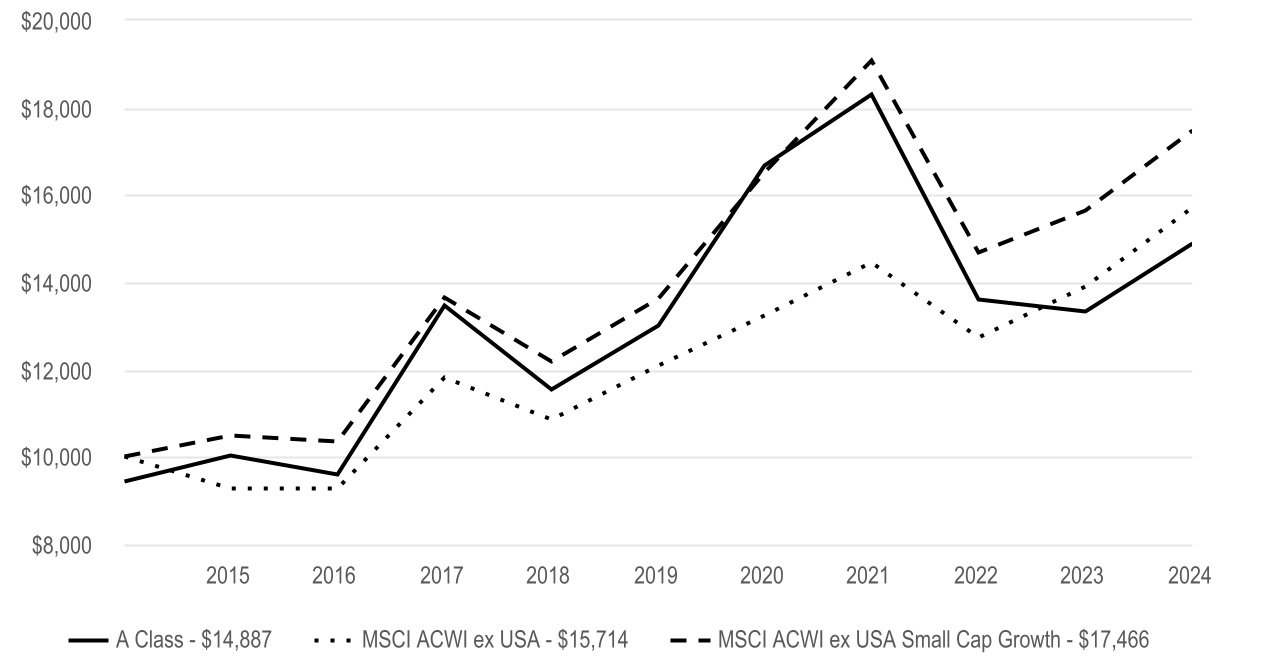
Emerging Markets Small Cap Fund A Class returned 9.59% for the reporting period ended November 30, 2024. |
| The fund seeks capital growth. The commentary below refers to the fund's performance compared to the MSCI Emerging Markets Small Cap Index. |
| • | The industrials sector contributed to relative performance. Key holdings included Gamuda, a Malaysia-based engineering and construction company, and BizLink Holding, a company focused on interconnect solutions. Stock selection in financials also contributed to results. |
| • | Notable contributors were MakeMyTrip, an India-based online travel company, and Prestige Estates Projects, an India-based real estate company. India-based PB Fintech, an online platform for insurance and lending products, also helped. |
| • | Communication services and consumer staples hurt relative performance. VTEX, a digital commerce platform, was a notable detractor in interactive media and services. LG H&H, the South Korea-based cosmetics and household goods company, dragged on relative results in personal care products. |
| • | Other notable detractors included Isu Petasys, a South Korea-based maker of printed circuit boards, and Taiwan-based Global Unichip, which specializes in application-specific integrated circuits. A holding in Samsung E&A, a South Korea-based engineering company, also hurt relative results. |
| | |
Cumulative Performance (based on an initial $10,000 investment) |
| April 7, 2016 through November 30, 2024 |
| The initial investment is adjusted to reflect the maximum initial sales charge. |
| | | | | | | | | | | | | | | | |
Average Annual Total Returns | |
| 1 Year | 5 Year | | Since Inception | Inception Date | |
| A Class | 9.59% | 6.24% | | 6.88% | 4/7/16 | |
| A Class - with sales charge | 3.29% | 4.99% | | 6.15% | 4/7/16 | |
| Regulatory Index | | | | | | |
| MSCI Emerging Markets | 11.86% | 3.20% | | 5.92% | — | |
| | | | | | |
| Performance Index | | | | | | |
| MSCI Emerging Markets Small Cap | 10.55% | 10.08% | | 7.65% | — | |
| | | | | | |
| | | | | | |
| | | | | | |
| | | | | | |
| | | | | | | | | | | | | | | | | |
| The regulatory index is provided as a broad measure of market performance. The performance index is provided because the advisor believes it is more reflective of the fund’s investment strategy. |
| A Class shares have a 5.75% maximum initial sales charge and may be subject to a maximum contingent deferred sales charge of 1.00%. |
|
|
|
|
|
|
|
|
|
| | |
|
The opinions expressed are those of American Century Investments and are no guarantee of the future performance of any American Century Investments fund. This information is for educational purposes only and is not intended as investment advice. Data reflects past performance, assumes reinvestment of dividends and capital gains and is no guarantee of future results. Current performance may be higher or lower than data shown. Investment return and principal value will fluctuate and redemption value may be more or less than original cost, and none of the charts reflect the deduction of taxes that a shareholder would pay on fund distributions or the redemption of fund shares. Total returns for periods less than one year are not annualized. Visit americancentury.com for more recent performance information.
|
| | | | | |
Fund Statistics | |
| Net Assets | $22,706,690 |
| Management Fees (dollars paid during the reporting period) | $241,521 |
| Portfolio Turnover Rate | 70 | % |
| Total Number of Portfolio Holdings | 99 |
| |
| |
| | | | | | | | | | | | | | | | | | | | | | | | | | | | | | | | | | | | |
| Types of Investments in Portfolio (as a % of net assets) | | | | | | | | | | | | Top Five Countries (as a % of net assets) | | | | |
| Common Stocks | 95.9% | | | | | | | | | | | | | | | | | India | 27% | | | | | | |
| Exchange-Traded Funds | 0.7% | | | | | | | | | | | | | | | | | Taiwan | 20% | | | | | | |
| Short-Term Investments | 6.2% | | | | | | | | | | | | | | | | | China | 13% | | | | | | |
| Other Assets and Liabilities | (2.8)% | | | | | | | | | | | | | | | | | South Korea | 10% | | | | | | |
| | | | | | | | | | | | | | | | | | | Brazil | 5% | | | | | | |
| | | | | | | | | | | | | | | | | | | | | | | | | | |
| | | | | | | | | | | | | | | | | | | | | | | | | | |
| | | | | | | | | | | | | | | | | | | | | | | | | | |
| | | | | | | | | | | | | | | | | | | | | | | | | | |
| | | | | | | | | | | | | | | | | | | | | | | | | | |
| | | | | | | | | | | | | | | | | | | | | | | | | | |
| | | | | | | | | | | | | | | | | | | | | | | | | | |
| | | | | | | | | | | | | | | | | | | | | | | | | | |
| | | | | | | | | | | | | | | | | | | | | | | | | | |
| | | | | | | | | | | | | | | | | | | | | | | | | | |
| | | | | | | | | | | | | | | | | | | | | | | | | | |
| | |
| For additional information about the fund, including its Prospectus, Statement of Additional Information, financial statements, holdings and proxy voting information, scan the QR code or visit americancentury.com/docs. |
| | |
|
| ©2025 American Century Proprietary Holdings, Inc. All rights reserved. |
A-25086265
ANNUAL SHAREHOLDER REPORT
Emerging Markets Small Cap Fund
| | | | | |
C Class (AECHX) | November 30, 2024 |
This annual shareholder report contains important information about Emerging Markets Small Cap Fund for the period of December 1, 2023 to November 30, 2024. You can find additional information about the fund at americancentury.com/docs. You can also request this information by contacting us at 1-800-345-2021.
| | | | | | | | |
What were the fund costs for the last year? (based on a hypothetical $10,000 investment) |
|
| Costs of a $10,000 investment | Costs paid as a percentage of a $10,000 investment |
| C Class | $249 | 2.39% |
|
| | | | | |
| What were the key factors that affected the fund’s performance? |
Emerging Markets Small Cap Fund C Class returned 8.76% for the reporting period ended November 30, 2024. |
| The fund seeks capital growth. The commentary below refers to the fund's performance compared to the MSCI Emerging Markets Small Cap Index. |
| • | The industrials sector contributed to relative performance. Key holdings included Gamuda, a Malaysia-based engineering and construction company, and BizLink Holding, a company focused on interconnect solutions. Stock selection in financials also contributed to results. |
| • | Notable contributors were MakeMyTrip, an India-based online travel company, and Prestige Estates Projects, an India-based real estate company. India-based PB Fintech, an online platform for insurance and lending products, also helped. |
| • | Communication services and consumer staples hurt relative performance. VTEX, a digital commerce platform, was a notable detractor in interactive media and services. LG H&H, the South Korea-based cosmetics and household goods company, dragged on relative results in personal care products. |
| • | Other notable detractors included Isu Petasys, a South Korea-based maker of printed circuit boards, and Taiwan-based Global Unichip, which specializes in application-specific integrated circuits. A holding in Samsung E&A, a South Korea-based engineering company, also hurt relative results. |
| | |
Cumulative Performance (based on an initial $10,000 investment) |
| April 7, 2016 through November 30, 2024 |
|
| | | | | | | | | | | | | | | | |
Average Annual Total Returns | |
| 1 Year | 5 Year | | Since Inception | Inception Date | |
| C Class | 8.76% | 5.46% | | 6.08% | 4/7/16 | |
| | | | | | |
| Regulatory Index | | | | | | |
| MSCI Emerging Markets | 11.86% | 3.20% | | 5.92% | — | |
| | | | | | |
| Performance Index | | | | | | |
| MSCI Emerging Markets Small Cap | 10.55% | 10.08% | | 7.65% | — | |
| | | | | | |
| | | | | | |
| | | | | | |
| | | | | | |
| | | | | | | | | | | | | | | | | |
| The regulatory index is provided as a broad measure of market performance. The performance index is provided because the advisor believes it is more reflective of the fund’s investment strategy. |
|
|
|
|
| C Class shares will automatically convert to A Class shares after being held for approximately eight years. C Class average annual returns do not reflect this conversion. |
|
|
|
|
|
| | |
|
The opinions expressed are those of American Century Investments and are no guarantee of the future performance of any American Century Investments fund. This information is for educational purposes only and is not intended as investment advice. Data reflects past performance, assumes reinvestment of dividends and capital gains and is no guarantee of future results. Current performance may be higher or lower than data shown. Investment return and principal value will fluctuate and redemption value may be more or less than original cost, and none of the charts reflect the deduction of taxes that a shareholder would pay on fund distributions or the redemption of fund shares. Total returns for periods less than one year are not annualized. Visit americancentury.com for more recent performance information.
|
| | | | | |
Fund Statistics | |
| Net Assets | $22,706,690 |
| Management Fees (dollars paid during the reporting period) | $241,521 |
| Portfolio Turnover Rate | 70 | % |
| Total Number of Portfolio Holdings | 99 |
| |
| |
| | | | | | | | | | | | | | | | | | | | | | | | | | | | | | | | | | | | |
| Types of Investments in Portfolio (as a % of net assets) | | | | | | | | | | | | Top Five Countries (as a % of net assets) | | | | |
| Common Stocks | 95.9% | | | | | | | | | | | | | | | | | India | 27% | | | | | | |
| Exchange-Traded Funds | 0.7% | | | | | | | | | | | | | | | | | Taiwan | 20% | | | | | | |
| Short-Term Investments | 6.2% | | | | | | | | | | | | | | | | | China | 13% | | | | | | |
| Other Assets and Liabilities | (2.8)% | | | | | | | | | | | | | | | | | South Korea | 10% | | | | | | |
| | | | | | | | | | | | | | | | | | | Brazil | 5% | | | | | | |
| | | | | | | | | | | | | | | | | | | | | | | | | | |
| | | | | | | | | | | | | | | | | | | | | | | | | | |
| | | | | | | | | | | | | | | | | | | | | | | | | | |
| | | | | | | | | | | | | | | | | | | | | | | | | | |
| | | | | | | | | | | | | | | | | | | | | | | | | | |
| | | | | | | | | | | | | | | | | | | | | | | | | | |
| | | | | | | | | | | | | | | | | | | | | | | | | | |
| | | | | | | | | | | | | | | | | | | | | | | | | | |
| | | | | | | | | | | | | | | | | | | | | | | | | | |
| | | | | | | | | | | | | | | | | | | | | | | | | | |
| | | | | | | | | | | | | | | | | | | | | | | | | | |
| | |
| For additional information about the fund, including its Prospectus, Statement of Additional Information, financial statements, holdings and proxy voting information, scan the QR code or visit americancentury.com/docs. |
| | |
|
| ©2025 American Century Proprietary Holdings, Inc. All rights reserved. |
A-25086257
ANNUAL SHAREHOLDER REPORT
Emerging Markets Small Cap Fund
| | | | | |
R Class (AECMX) | November 30, 2024 |
This annual shareholder report contains important information about Emerging Markets Small Cap Fund for the period of December 1, 2023 to November 30, 2024. You can find additional information about the fund at americancentury.com/docs. You can also request this information by contacting us at 1-800-345-2021.
| | | | | | | | |
What were the fund costs for the last year? (based on a hypothetical $10,000 investment) |
|
| Costs of a $10,000 investment | Costs paid as a percentage of a $10,000 investment |
| R Class | $198 | 1.89% |
|
| | | | | |
| What were the key factors that affected the fund’s performance? |
Emerging Markets Small Cap Fund R Class returned 9.35% for the reporting period ended November 30, 2024. |
| The fund seeks capital growth. The commentary below refers to the fund's performance compared to the MSCI Emerging Markets Small Cap Index. |
| • | The industrials sector contributed to relative performance. Key holdings included Gamuda, a Malaysia-based engineering and construction company, and BizLink Holding, a company focused on interconnect solutions. Stock selection in financials also contributed to results. |
| • | Notable contributors were MakeMyTrip, an India-based online travel company, and Prestige Estates Projects, an India-based real estate company. India-based PB Fintech, an online platform for insurance and lending products, also helped. |
| • | Communication services and consumer staples hurt relative performance. VTEX, a digital commerce platform, was a notable detractor in interactive media and services. LG H&H, the South Korea-based cosmetics and household goods company, dragged on relative results in personal care products. |
| • | Other notable detractors included Isu Petasys, a South Korea-based maker of printed circuit boards, and Taiwan-based Global Unichip, which specializes in application-specific integrated circuits. A holding in Samsung E&A, a South Korea-based engineering company, also hurt relative results. |
| | |
Cumulative Performance (based on an initial $10,000 investment) |
| April 7, 2016 through November 30, 2024 |
|
| | | | | | | | | | | | | | | | |
Average Annual Total Returns | |
| 1 Year | 5 Year | | Since Inception | Inception Date | |
| R Class | 9.35% | 5.99% | | 6.61% | 4/7/16 | |
| | | | | | |
| Regulatory Index | | | | | | |
| MSCI Emerging Markets | 11.86% | 3.20% | | 5.92% | — | |
| | | | | | |
| Performance Index | | | | | | |
| MSCI Emerging Markets Small Cap | 10.55% | 10.08% | | 7.65% | — | |
| | | | | | |
| | | | | | |
| | | | | | |
| | | | | | |
| | | | | | | | | | | | | | | | | |
| The regulatory index is provided as a broad measure of market performance. The performance index is provided because the advisor believes it is more reflective of the fund’s investment strategy. |
|
|
|
|
|
|
|
|
|
|
| | |
|
The opinions expressed are those of American Century Investments and are no guarantee of the future performance of any American Century Investments fund. This information is for educational purposes only and is not intended as investment advice. Data reflects past performance, assumes reinvestment of dividends and capital gains and is no guarantee of future results. Current performance may be higher or lower than data shown. Investment return and principal value will fluctuate and redemption value may be more or less than original cost, and none of the charts reflect the deduction of taxes that a shareholder would pay on fund distributions or the redemption of fund shares. Total returns for periods less than one year are not annualized. Visit americancentury.com for more recent performance information.
|
| | | | | |
Fund Statistics | |
| Net Assets | $22,706,690 |
| Management Fees (dollars paid during the reporting period) | $241,521 |
| Portfolio Turnover Rate | 70 | % |
| Total Number of Portfolio Holdings | 99 |
| |
| |
| | | | | | | | | | | | | | | | | | | | | | | | | | | | | | | | | | | | |
| Types of Investments in Portfolio (as a % of net assets) | | | | | | | | | | | | Top Five Countries (as a % of net assets) | | | | |
| Common Stocks | 95.9% | | | | | | | | | | | | | | | | | India | 27% | | | | | | |
| Exchange-Traded Funds | 0.7% | | | | | | | | | | | | | | | | | Taiwan | 20% | | | | | | |
| Short-Term Investments | 6.2% | | | | | | | | | | | | | | | | | China | 13% | | | | | | |
| Other Assets and Liabilities | (2.8)% | | | | | | | | | | | | | | | | | South Korea | 10% | | | | | | |
| | | | | | | | | | | | | | | | | | | Brazil | 5% | | | | | | |
| | | | | | | | | | | | | | | | | | | | | | | | | | |
| | | | | | | | | | | | | | | | | | | | | | | | | | |
| | | | | | | | | | | | | | | | | | | | | | | | | | |
| | | | | | | | | | | | | | | | | | | | | | | | | | |
| | | | | | | | | | | | | | | | | | | | | | | | | | |
| | | | | | | | | | | | | | | | | | | | | | | | | | |
| | | | | | | | | | | | | | | | | | | | | | | | | | |
| | | | | | | | | | | | | | | | | | | | | | | | | | |
| | | | | | | | | | | | | | | | | | | | | | | | | | |
| | | | | | | | | | | | | | | | | | | | | | | | | | |
| | | | | | | | | | | | | | | | | | | | | | | | | | |
| | |
| For additional information about the fund, including its Prospectus, Statement of Additional Information, financial statements, holdings and proxy voting information, scan the QR code or visit americancentury.com/docs. |
| | |
|
| ©2025 American Century Proprietary Holdings, Inc. All rights reserved. |
A-25086240
ANNUAL SHAREHOLDER REPORT
Emerging Markets Small Cap Fund
| | | | | |
R6 Class (AECTX) | November 30, 2024 |
This annual shareholder report contains important information about Emerging Markets Small Cap Fund for the period of December 1, 2023 to November 30, 2024. You can find additional information about the fund at americancentury.com/docs. You can also request this information by contacting us at 1-800-345-2021.
| | | | | | | | |
What were the fund costs for the last year? (based on a hypothetical $10,000 investment) |
|
| Costs of a $10,000 investment | Costs paid as a percentage of a $10,000 investment |
| R6 Class | $109 | 1.04% |
|
| | | | | |
| What were the key factors that affected the fund’s performance? |
Emerging Markets Small Cap Fund R6 Class returned 10.29% for the reporting period ended November 30, 2024. |
| The fund seeks capital growth. The commentary below refers to the fund's performance compared to the MSCI Emerging Markets Small Cap Index. |
| • | The industrials sector contributed to relative performance. Key holdings included Gamuda, a Malaysia-based engineering and construction company, and BizLink Holding, a company focused on interconnect solutions. Stock selection in financials also contributed to results. |
| • | Notable contributors were MakeMyTrip, an India-based online travel company, and Prestige Estates Projects, an India-based real estate company. India-based PB Fintech, an online platform for insurance and lending products, also helped. |
| • | Communication services and consumer staples hurt relative performance. VTEX, a digital commerce platform, was a notable detractor in interactive media and services. LG H&H, the South Korea-based cosmetics and household goods company, dragged on relative results in personal care products. |
| • | Other notable detractors included Isu Petasys, a South Korea-based maker of printed circuit boards, and Taiwan-based Global Unichip, which specializes in application-specific integrated circuits. A holding in Samsung E&A, a South Korea-based engineering company, also hurt relative results. |
| | |
Cumulative Performance (based on an initial $10,000 investment) |
| April 7, 2016 through November 30, 2024 |
|
| | | | | | | | | | | | | | | | |
Average Annual Total Returns | |
| 1 Year | 5 Year | | Since Inception | Inception Date | |
| R6 Class | 10.29% | 6.89% | | 7.52% | 4/7/16 | |
| | | | | | |
| Regulatory Index | | | | | | |
| MSCI Emerging Markets | 11.86% | 3.20% | | 5.92% | — | |
| | | | | | |
| Performance Index | | | | | | |
| MSCI Emerging Markets Small Cap | 10.55% | 10.08% | | 7.65% | — | |
| | | | | | |
| | | | | | |
| | | | | | |
| | | | | | |
| | | | | | | | | | | | | | | | | |
| The regulatory index is provided as a broad measure of market performance. The performance index is provided because the advisor believes it is more reflective of the fund’s investment strategy. |
|
|
|
|
|
|
|
|
|
|
| | |
|
The opinions expressed are those of American Century Investments and are no guarantee of the future performance of any American Century Investments fund. This information is for educational purposes only and is not intended as investment advice. Data reflects past performance, assumes reinvestment of dividends and capital gains and is no guarantee of future results. Current performance may be higher or lower than data shown. Investment return and principal value will fluctuate and redemption value may be more or less than original cost, and none of the charts reflect the deduction of taxes that a shareholder would pay on fund distributions or the redemption of fund shares. Total returns for periods less than one year are not annualized. Visit americancentury.com for more recent performance information.
|
| | | | | |
Fund Statistics | |
| Net Assets | $22,706,690 |
| Management Fees (dollars paid during the reporting period) | $241,521 |
| Portfolio Turnover Rate | 70 | % |
| Total Number of Portfolio Holdings | 99 |
| |
| |
| | | | | | | | | | | | | | | | | | | | | | | | | | | | | | | | | | | | |
| Types of Investments in Portfolio (as a % of net assets) | | | | | | | | | | | | Top Five Countries (as a % of net assets) | | | | |
| Common Stocks | 95.9% | | | | | | | | | | | | | | | | | India | 27% | | | | | | |
| Exchange-Traded Funds | 0.7% | | | | | | | | | | | | | | | | | Taiwan | 20% | | | | | | |
| Short-Term Investments | 6.2% | | | | | | | | | | | | | | | | | China | 13% | | | | | | |
| Other Assets and Liabilities | (2.8)% | | | | | | | | | | | | | | | | | South Korea | 10% | | | | | | |
| | | | | | | | | | | | | | | | | | | Brazil | 5% | | | | | | |
| | | | | | | | | | | | | | | | | | | | | | | | | | |
| | | | | | | | | | | | | | | | | | | | | | | | | | |
| | | | | | | | | | | | | | | | | | | | | | | | | | |
| | | | | | | | | | | | | | | | | | | | | | | | | | |
| | | | | | | | | | | | | | | | | | | | | | | | | | |
| | | | | | | | | | | | | | | | | | | | | | | | | | |
| | | | | | | | | | | | | | | | | | | | | | | | | | |
| | | | | | | | | | | | | | | | | | | | | | | | | | |
| | | | | | | | | | | | | | | | | | | | | | | | | | |
| | | | | | | | | | | | | | | | | | | | | | | | | | |
| | | | | | | | | | | | | | | | | | | | | | | | | | |
| | |
| For additional information about the fund, including its Prospectus, Statement of Additional Information, financial statements, holdings and proxy voting information, scan the QR code or visit americancentury.com/docs. |
| | |
|
| ©2025 American Century Proprietary Holdings, Inc. All rights reserved. |
A-25086232
ANNUAL SHAREHOLDER REPORT
Focused Global Growth Fund
| | | | | |
Investor Class (TWGGX) | November 30, 2024 |
This annual shareholder report contains important information about Focused Global Growth Fund for the period of December 1, 2023 to November 30, 2024. You can find additional information about the fund at americancentury.com/docs. You can also request this information by contacting us at 1-800-345-2021. This report describes changes to the fund that occurred during the reporting period.
| | | | | | | | |
What were the fund costs for the last year? (based on a hypothetical $10,000 investment) |
|
| Costs of a $10,000 investment | Costs paid as a percentage of a $10,000 investment |
| Investor Class | $120 | 1.08% |
|
| | | | | |
| What were the key factors that affected the fund’s performance? |
Focused Global Growth Fund Investor Class returned 22.03% for the reporting period ended November 30, 2024. |
| The fund seeks capital growth. The commentary below refers to the fund's performance relative to the MSCI ACWI Index. |
| • | Security selection among energy stocks contributed to relative results. The sector lagged the broader market due to low oil prices, but the fund's position in pipeline infrastructure provider The Williams Cos. contributed to performance. The fund also benefited from having no exposure to the underperforming materials sector. |
| • | Notable individual contributors during the period included chipmaker NVIDIA, a beneficiary of the artificial intelligence infrastructure build-out, and aircraft parts manufacturer Howmet Aerospace. Auto insurance carrier Progressive also contributed. |
| • | Security selection and being overweight in the underperforming real estate sector hurt relative performance. Detractors included cell tower leasing company SBA Communications and Prologis, an industrial real estate investment trust. In the financials sector, positions in B3 Brasil Bolsa Balcao and Hong Kong Exchanges & Clearing hurt relative returns. |
| • | Top individual detractors from relative performance included pharmaceutical services provider ICON, semiconductor materials company Entegris and enterprise software developer Workday. |
| | |
Cumulative Performance (based on an initial $10,000 investment) |
| November 30, 2014 through November 30, 2024 |
|
| | | | | | | | | | | | | | |
Average Annual Total Returns | |
| 1 Year | 5 Year | 10 Year | | | |
| Investor Class | 22.03% | 10.08% | 9.61% | | | |
| | | | | | |
| | | | | | |
| | | | | | |
| | | | | | |
| | | | | | |
| MSCI ACWI | 26.12% | 11.36% | 9.28% | | | |
| | | | | | |
| | | | | | |
| | | | | | |
| | | | | | |
| | |
|
The opinions expressed are those of American Century Investments and are no guarantee of the future performance of any American Century Investments fund. This information is for educational purposes only and is not intended as investment advice. Data reflects past performance, assumes reinvestment of dividends and capital gains and is no guarantee of future results. Current performance may be higher or lower than data shown. Investment return and principal value will fluctuate and redemption value may be more or less than original cost, and none of the charts reflect the deduction of taxes that a shareholder would pay on fund distributions or the redemption of fund shares. Total returns for periods less than one year are not annualized. Visit americancentury.com for more recent performance information.
|
| | | | | |
Fund Statistics | |
| Net Assets | $639,759,273 |
| Management Fees (dollars paid during the reporting period) | $6,217,220 |
| Portfolio Turnover Rate | 72 | % |
| Total Number of Portfolio Holdings | 36 |
| |
| |
| | | | | | | | | | | | | | | | | | | | | | | | | | | | | | | | | | | | |
| Types of Investments in Portfolio (as a % of net assets) | | | | | | | | | | | | Top Five Countries (as a % of net assets) | | | | |
| Common Stocks | 99.6% | | | | | | | | | | | | | | | | | United States | 69% | | | | | | |
| Short-Term Investments | 0.4% | | | | | | | | | | | | | | | | | United Kingdom | 6% | | | | | | |
| Other Assets and Liabilities | 0.0% | | | | | | | | | | | | | | | | | Japan | 6% | | | | | | |
| | | | | | | | | | | | | | | | | | | Denmark | 3% | | | | | | |
| | | | | | | | | | | | | | | | | | | France | 3% | | | | | | |
| | | | | | | | | | | | | | | | | | | | | | | | | | |
| | | | | | | | | | | | | | | | | | | | | | | | | | |
| | | | | | | | | | | | | | | | | | | | | | | | | | |
| | | | | | | | | | | | | | | | | | | | | | | | | | |
| | | | | | | | | | | | | | | | | | | | | | | | | | |
| | | | | | | | | | | | | | | | | | | | | | | | | | |
| | | | | | | | | | | | | | | | | | | | | | | | | | |
| | | | | | | | | | | | | | | | | | | | | | | | | | |
| | | | | | | | | | | | | | | | | | | | | | | | | | |
| | | | | | | | | | | | | | | | | | | | | | | | | | |
| | | | | | | | | | | | | | | | | | | | | | | | | | |
| | |
| Fund Changes |
|
|
| Beginning October 2024, the total eligible investments required to qualify for a waiver of the annual account maintenance fee changed from $10,000 to $25,000. Such fee will also be waived for any accounts for which the shareholder has elected to receive electronic delivery of all fund/account documents. |
|
|
|
|
| | |
| For additional information about the fund, including its Prospectus, Statement of Additional Information, financial statements, holdings and proxy voting information, scan the QR code or visit americancentury.com/docs. |
| | |
|
| ©2025 American Century Proprietary Holdings, Inc. All rights reserved. |
A-25086844
ANNUAL SHAREHOLDER REPORT
Focused Global Growth Fund
| | | | | |
I Class (AGGIX) | November 30, 2024 |
This annual shareholder report contains important information about Focused Global Growth Fund for the period of December 1, 2023 to November 30, 2024. You can find additional information about the fund at americancentury.com/docs. You can also request this information by contacting us at 1-800-345-2021.
| | | | | | | | |
What were the fund costs for the last year? (based on a hypothetical $10,000 investment) |
|
| Costs of a $10,000 investment | Costs paid as a percentage of a $10,000 investment |
| I Class | $98 | 0.88% |
|
| | | | | |
| What were the key factors that affected the fund’s performance? |
Focused Global Growth Fund I Class returned 22.36% for the reporting period ended November 30, 2024. |
| The fund seeks capital growth. The commentary below refers to the fund's performance relative to the MSCI ACWI Index. |
| • | Security selection among energy stocks contributed to relative results. The sector lagged the broader market due to low oil prices, but the fund's position in pipeline infrastructure provider The Williams Cos. contributed to performance. The fund also benefited from having no exposure to the underperforming materials sector. |
| • | Notable individual contributors during the period included chipmaker NVIDIA, a beneficiary of the artificial intelligence infrastructure build-out, and aircraft parts manufacturer Howmet Aerospace. Auto insurance carrier Progressive also contributed. |
| • | Security selection and being overweight in the underperforming real estate sector hurt relative performance. Detractors included cell tower leasing company SBA Communications and Prologis, an industrial real estate investment trust. In the financials sector, positions in B3 Brasil Bolsa Balcao and Hong Kong Exchanges & Clearing hurt relative returns. |
| • | Top individual detractors from relative performance included pharmaceutical services provider ICON, semiconductor materials company Entegris and enterprise software developer Workday. |
| | |
Cumulative Performance (based on an initial $10,000 investment) |
| November 30, 2014 through November 30, 2024 |
|
| | | | | | | | | | | | | | |
Average Annual Total Returns | |
| 1 Year | 5 Year | 10 Year | | | |
| I Class | 22.36% | 10.30% | 9.84% | | | |
| | | | | | |
| | | | | | |
| | | | | | |
| | | | | | |
| | | | | | |
| MSCI ACWI | 26.12% | 11.36% | 9.28% | | | |
| | | | | | |
| | | | | | |
| | | | | | |
| | | | | | |
| | |
|
The opinions expressed are those of American Century Investments and are no guarantee of the future performance of any American Century Investments fund. This information is for educational purposes only and is not intended as investment advice. Data reflects past performance, assumes reinvestment of dividends and capital gains and is no guarantee of future results. Current performance may be higher or lower than data shown. Investment return and principal value will fluctuate and redemption value may be more or less than original cost, and none of the charts reflect the deduction of taxes that a shareholder would pay on fund distributions or the redemption of fund shares. Total returns for periods less than one year are not annualized. Visit americancentury.com for more recent performance information.
|
| | | | | |
Fund Statistics | |
| Net Assets | $639,759,273 |
| Management Fees (dollars paid during the reporting period) | $6,217,220 |
| Portfolio Turnover Rate | 72 | % |
| Total Number of Portfolio Holdings | 36 |
| |
| |
| | | | | | | | | | | | | | | | | | | | | | | | | | | | | | | | | | | | |
| Types of Investments in Portfolio (as a % of net assets) | | | | | | | | | | | | Top Five Countries (as a % of net assets) | | | | |
| Common Stocks | 99.6% | | | | | | | | | | | | | | | | | United States | 69% | | | | | | |
| Short-Term Investments | 0.4% | | | | | | | | | | | | | | | | | United Kingdom | 6% | | | | | | |
| Other Assets and Liabilities | 0.0% | | | | | | | | | | | | | | | | | Japan | 6% | | | | | | |
| | | | | | | | | | | | | | | | | | | Denmark | 3% | | | | | | |
| | | | | | | | | | | | | | | | | | | France | 3% | | | | | | |
| | | | | | | | | | | | | | | | | | | | | | | | | | |
| | | | | | | | | | | | | | | | | | | | | | | | | | |
| | | | | | | | | | | | | | | | | | | | | | | | | | |
| | | | | | | | | | | | | | | | | | | | | | | | | | |
| | | | | | | | | | | | | | | | | | | | | | | | | | |
| | | | | | | | | | | | | | | | | | | | | | | | | | |
| | | | | | | | | | | | | | | | | | | | | | | | | | |
| | | | | | | | | | | | | | | | | | | | | | | | | | |
| | | | | | | | | | | | | | | | | | | | | | | | | | |
| | | | | | | | | | | | | | | | | | | | | | | | | | |
| | | | | | | | | | | | | | | | | | | | | | | | | | |
| | |
| For additional information about the fund, including its Prospectus, Statement of Additional Information, financial statements, holdings and proxy voting information, scan the QR code or visit americancentury.com/docs. |
| | |
|
| ©2025 American Century Proprietary Holdings, Inc. All rights reserved. |
A-25086836
ANNUAL SHAREHOLDER REPORT
Focused Global Growth Fund
| | | | | |
Y Class (AGYGX) | November 30, 2024 |
This annual shareholder report contains important information about Focused Global Growth Fund for the period of December 1, 2023 to November 30, 2024. You can find additional information about the fund at americancentury.com/docs. You can also request this information by contacting us at 1-800-345-2021.
| | | | | | | | |
What were the fund costs for the last year? (based on a hypothetical $10,000 investment) |
|
| Costs of a $10,000 investment | Costs paid as a percentage of a $10,000 investment |
| Y Class | $81 | 0.73% |
|
| | | | | |
| What were the key factors that affected the fund’s performance? |
Focused Global Growth Fund Y Class returned 22.53% for the reporting period ended November 30, 2024. |
| The fund seeks capital growth. The commentary below refers to the fund's performance relative to the MSCI ACWI Index. |
| • | Security selection among energy stocks contributed to relative results. The sector lagged the broader market due to low oil prices, but the fund's position in pipeline infrastructure provider The Williams Cos. contributed to performance. The fund also benefited from having no exposure to the underperforming materials sector. |
| • | Notable individual contributors during the period included chipmaker NVIDIA, a beneficiary of the artificial intelligence infrastructure build-out, and aircraft parts manufacturer Howmet Aerospace. Auto insurance carrier Progressive also contributed. |
| • | Security selection and being overweight in the underperforming real estate sector hurt relative performance. Detractors included cell tower leasing company SBA Communications and Prologis, an industrial real estate investment trust. In the financials sector, positions in B3 Brasil Bolsa Balcao and Hong Kong Exchanges & Clearing hurt relative returns. |
| • | Top individual detractors from relative performance included pharmaceutical services provider ICON, semiconductor materials company Entegris and enterprise software developer Workday. |
| | |
Cumulative Performance (based on an initial $10,000 investment) |
| April 10, 2017 through November 30, 2024 |
|
| | | | | | | | | | | | | | | | |
Average Annual Total Returns | |
| 1 Year | 5 Year | | Since Inception | Inception Date | |
| Y Class | 22.53% | 10.47% | | 12.07% | 4/10/17 | |
| | | | | | |
| | | | | | |
| | | | | | |
| | | | | | |
| | | | | | |
| MSCI ACWI | 26.12% | 11.36% | | 10.90% | — | |
| | | | | | |
| | | | | | |
| | | | | | |
| | | | | | |
| | |
|
The opinions expressed are those of American Century Investments and are no guarantee of the future performance of any American Century Investments fund. This information is for educational purposes only and is not intended as investment advice. Data reflects past performance, assumes reinvestment of dividends and capital gains and is no guarantee of future results. Current performance may be higher or lower than data shown. Investment return and principal value will fluctuate and redemption value may be more or less than original cost, and none of the charts reflect the deduction of taxes that a shareholder would pay on fund distributions or the redemption of fund shares. Total returns for periods less than one year are not annualized. Visit americancentury.com for more recent performance information.
|
| | | | | |
Fund Statistics | |
| Net Assets | $639,759,273 |
| Management Fees (dollars paid during the reporting period) | $6,217,220 |
| Portfolio Turnover Rate | 72 | % |
| Total Number of Portfolio Holdings | 36 |
| |
| |
| | | | | | | | | | | | | | | | | | | | | | | | | | | | | | | | | | | | |
| Types of Investments in Portfolio (as a % of net assets) | | | | | | | | | | | | Top Five Countries (as a % of net assets) | | | | |
| Common Stocks | 99.6% | | | | | | | | | | | | | | | | | United States | 69% | | | | | | |
| Short-Term Investments | 0.4% | | | | | | | | | | | | | | | | | United Kingdom | 6% | | | | | | |
| Other Assets and Liabilities | 0.0% | | | | | | | | | | | | | | | | | Japan | 6% | | | | | | |
| | | | | | | | | | | | | | | | | | | Denmark | 3% | | | | | | |
| | | | | | | | | | | | | | | | | | | France | 3% | | | | | | |
| | | | | | | | | | | | | | | | | | | | | | | | | | |
| | | | | | | | | | | | | | | | | | | | | | | | | | |
| | | | | | | | | | | | | | | | | | | | | | | | | | |
| | | | | | | | | | | | | | | | | | | | | | | | | | |
| | | | | | | | | | | | | | | | | | | | | | | | | | |
| | | | | | | | | | | | | | | | | | | | | | | | | | |
| | | | | | | | | | | | | | | | | | | | | | | | | | |
| | | | | | | | | | | | | | | | | | | | | | | | | | |
| | | | | | | | | | | | | | | | | | | | | | | | | | |
| | | | | | | | | | | | | | | | | | | | | | | | | | |
| | | | | | | | | | | | | | | | | | | | | | | | | | |
| | |
| For additional information about the fund, including its Prospectus, Statement of Additional Information, financial statements, holdings and proxy voting information, scan the QR code or visit americancentury.com/docs. |
| | |
|
| ©2025 American Century Proprietary Holdings, Inc. All rights reserved. |
A-2509A844
ANNUAL SHAREHOLDER REPORT
Focused Global Growth Fund
| | | | | |
A Class (AGGRX) | November 30, 2024 |
This annual shareholder report contains important information about Focused Global Growth Fund for the period of December 1, 2023 to November 30, 2024. You can find additional information about the fund at americancentury.com/docs. You can also request this information by contacting us at 1-800-345-2021.
| | | | | | | | |
What were the fund costs for the last year? (based on a hypothetical $10,000 investment) |
|
| Costs of a $10,000 investment | Costs paid as a percentage of a $10,000 investment |
| A Class | $147 | 1.33% |
|
| | | | | |
| What were the key factors that affected the fund’s performance? |
Focused Global Growth Fund A Class returned 21.77% for the reporting period ended November 30, 2024. |
| The fund seeks capital growth. The commentary below refers to the fund's performance relative to the MSCI ACWI Index. |
| • | Security selection among energy stocks contributed to relative results. The sector lagged the broader market due to low oil prices, but the fund's position in pipeline infrastructure provider The Williams Cos. contributed to performance. The fund also benefited from having no exposure to the underperforming materials sector. |
| • | Notable individual contributors during the period included chipmaker NVIDIA, a beneficiary of the artificial intelligence infrastructure build-out, and aircraft parts manufacturer Howmet Aerospace. Auto insurance carrier Progressive also contributed. |
| • | Security selection and being overweight in the underperforming real estate sector hurt relative performance. Detractors included cell tower leasing company SBA Communications and Prologis, an industrial real estate investment trust. In the financials sector, positions in B3 Brasil Bolsa Balcao and Hong Kong Exchanges & Clearing hurt relative returns. |
| • | Top individual detractors from relative performance included pharmaceutical services provider ICON, semiconductor materials company Entegris and enterprise software developer Workday. |
| | |
Cumulative Performance (based on an initial $10,000 investment) |
| November 30, 2014 through November 30, 2024 |
| The initial investment is adjusted to reflect the maximum initial sales charge. |
| | | | | | | | | | | | | | |
Average Annual Total Returns | |
| 1 Year | 5 Year | 10 Year | | | |
| A Class | 21.77% | 9.82% | 9.34% | | | |
| A Class - with sales charge | 14.77% | 8.52% | 8.70% | | | |
| | | | | | |
| | | | | | |
| | | | | | |
| | | | | | |
| MSCI ACWI | 26.12% | 11.36% | 9.28% | | | |
| | | | | | |
| | | | | | |
| | | | | | |
| | | | | | |
| | | | | | | | | | | | | | | | | |
|
| A Class shares have a 5.75% maximum initial sales charge and may be subject to a maximum contingent deferred sales charge of 1.00%. |
|
|
|
|
|
|
|
|
|
| | |
|
The opinions expressed are those of American Century Investments and are no guarantee of the future performance of any American Century Investments fund. This information is for educational purposes only and is not intended as investment advice. Data reflects past performance, assumes reinvestment of dividends and capital gains and is no guarantee of future results. Current performance may be higher or lower than data shown. Investment return and principal value will fluctuate and redemption value may be more or less than original cost, and none of the charts reflect the deduction of taxes that a shareholder would pay on fund distributions or the redemption of fund shares. Total returns for periods less than one year are not annualized. Visit americancentury.com for more recent performance information.
|
| | | | | |
Fund Statistics | |
| Net Assets | $639,759,273 |
| Management Fees (dollars paid during the reporting period) | $6,217,220 |
| Portfolio Turnover Rate | 72 | % |
| Total Number of Portfolio Holdings | 36 |
| |
| |
| | | | | | | | | | | | | | | | | | | | | | | | | | | | | | | | | | | | |
| Types of Investments in Portfolio (as a % of net assets) | | | | | | | | | | | | Top Five Countries (as a % of net assets) | | | | |
| Common Stocks | 99.6% | | | | | | | | | | | | | | | | | United States | 69% | | | | | | |
| Short-Term Investments | 0.4% | | | | | | | | | | | | | | | | | United Kingdom | 6% | | | | | | |
| Other Assets and Liabilities | 0.0% | | | | | | | | | | | | | | | | | Japan | 6% | | | | | | |
| | | | | | | | | | | | | | | | | | | Denmark | 3% | | | | | | |
| | | | | | | | | | | | | | | | | | | France | 3% | | | | | | |
| | | | | | | | | | | | | | | | | | | | | | | | | | |
| | | | | | | | | | | | | | | | | | | | | | | | | | |
| | | | | | | | | | | | | | | | | | | | | | | | | | |
| | | | | | | | | | | | | | | | | | | | | | | | | | |
| | | | | | | | | | | | | | | | | | | | | | | | | | |
| | | | | | | | | | | | | | | | | | | | | | | | | | |
| | | | | | | | | | | | | | | | | | | | | | | | | | |
| | | | | | | | | | | | | | | | | | | | | | | | | | |
| | | | | | | | | | | | | | | | | | | | | | | | | | |
| | | | | | | | | | | | | | | | | | | | | | | | | | |
| | | | | | | | | | | | | | | | | | | | | | | | | | |
| | |
| For additional information about the fund, including its Prospectus, Statement of Additional Information, financial statements, holdings and proxy voting information, scan the QR code or visit americancentury.com/docs. |
| | |
|
| ©2025 American Century Proprietary Holdings, Inc. All rights reserved. |
A-25086828
ANNUAL SHAREHOLDER REPORT
Focused Global Growth Fund
| | | | | |
C Class (AGLCX) | November 30, 2024 |
This annual shareholder report contains important information about Focused Global Growth Fund for the period of December 1, 2023 to November 30, 2024. You can find additional information about the fund at americancentury.com/docs. You can also request this information by contacting us at 1-800-345-2021.
| | | | | | | | |
What were the fund costs for the last year? (based on a hypothetical $10,000 investment) |
|
| Costs of a $10,000 investment | Costs paid as a percentage of a $10,000 investment |
| C Class | $230 | 2.08% |
|
| | | | | |
| What were the key factors that affected the fund’s performance? |
Focused Global Growth Fund C Class returned 20.88% for the reporting period ended November 30, 2024. |
| The fund seeks capital growth. The commentary below refers to the fund's performance relative to the MSCI ACWI Index. |
| • | Security selection among energy stocks contributed to relative results. The sector lagged the broader market due to low oil prices, but the fund's position in pipeline infrastructure provider The Williams Cos. contributed to performance. The fund also benefited from having no exposure to the underperforming materials sector. |
| • | Notable individual contributors during the period included chipmaker NVIDIA, a beneficiary of the artificial intelligence infrastructure build-out, and aircraft parts manufacturer Howmet Aerospace. Auto insurance carrier Progressive also contributed. |
| • | Security selection and being overweight in the underperforming real estate sector hurt relative performance. Detractors included cell tower leasing company SBA Communications and Prologis, an industrial real estate investment trust. In the financials sector, positions in B3 Brasil Bolsa Balcao and Hong Kong Exchanges & Clearing hurt relative returns. |
| • | Top individual detractors from relative performance included pharmaceutical services provider ICON, semiconductor materials company Entegris and enterprise software developer Workday. |
| | |
Cumulative Performance (based on an initial $10,000 investment) |
| November 30, 2014 through November 30, 2024 |
|
| | | | | | | | | | | | | | |
Average Annual Total Returns | |
| 1 Year | 5 Year | 10 Year | | | |
| C Class | 20.88% | 9.01% | 8.53% | | | |
| | | | | | |
| | | | | | |
| | | | | | |
| | | | | | |
| | | | | | |
| MSCI ACWI | 26.12% | 11.36% | 9.28% | | | |
| | | | | | |
| | | | | | |
| | | | | | |
| | | | | | |
| | | | | | | | | | | | | | | | | |
|
|
|
|
|
| C Class shares will automatically convert to A Class shares after being held for approximately eight years. C Class average annual returns do not reflect this conversion. |
|
|
|
|
|
| | |
|
The opinions expressed are those of American Century Investments and are no guarantee of the future performance of any American Century Investments fund. This information is for educational purposes only and is not intended as investment advice. Data reflects past performance, assumes reinvestment of dividends and capital gains and is no guarantee of future results. Current performance may be higher or lower than data shown. Investment return and principal value will fluctuate and redemption value may be more or less than original cost, and none of the charts reflect the deduction of taxes that a shareholder would pay on fund distributions or the redemption of fund shares. Total returns for periods less than one year are not annualized. Visit americancentury.com for more recent performance information.
|
| | | | | |
Fund Statistics | |
| Net Assets | $639,759,273 |
| Management Fees (dollars paid during the reporting period) | $6,217,220 |
| Portfolio Turnover Rate | 72 | % |
| Total Number of Portfolio Holdings | 36 |
| |
| |
| | | | | | | | | | | | | | | | | | | | | | | | | | | | | | | | | | | | |
| Types of Investments in Portfolio (as a % of net assets) | | | | | | | | | | | | Top Five Countries (as a % of net assets) | | | | |
| Common Stocks | 99.6% | | | | | | | | | | | | | | | | | United States | 69% | | | | | | |
| Short-Term Investments | 0.4% | | | | | | | | | | | | | | | | | United Kingdom | 6% | | | | | | |
| Other Assets and Liabilities | 0.0% | | | | | | | | | | | | | | | | | Japan | 6% | | | | | | |
| | | | | | | | | | | | | | | | | | | Denmark | 3% | | | | | | |
| | | | | | | | | | | | | | | | | | | France | 3% | | | | | | |
| | | | | | | | | | | | | | | | | | | | | | | | | | |
| | | | | | | | | | | | | | | | | | | | | | | | | | |
| | | | | | | | | | | | | | | | | | | | | | | | | | |
| | | | | | | | | | | | | | | | | | | | | | | | | | |
| | | | | | | | | | | | | | | | | | | | | | | | | | |
| | | | | | | | | | | | | | | | | | | | | | | | | | |
| | | | | | | | | | | | | | | | | | | | | | | | | | |
| | | | | | | | | | | | | | | | | | | | | | | | | | |
| | | | | | | | | | | | | | | | | | | | | | | | | | |
| | | | | | | | | | | | | | | | | | | | | | | | | | |
| | | | | | | | | | | | | | | | | | | | | | | | | | |
| | |
| For additional information about the fund, including its Prospectus, Statement of Additional Information, financial statements, holdings and proxy voting information, scan the QR code or visit americancentury.com/docs. |
| | |
|
| ©2025 American Century Proprietary Holdings, Inc. All rights reserved. |
A-25086695
ANNUAL SHAREHOLDER REPORT
Focused Global Growth Fund
| | | | | |
R Class (AGORX) | November 30, 2024 |
This annual shareholder report contains important information about Focused Global Growth Fund for the period of December 1, 2023 to November 30, 2024. You can find additional information about the fund at americancentury.com/docs. You can also request this information by contacting us at 1-800-345-2021.
| | | | | | | | |
What were the fund costs for the last year? (based on a hypothetical $10,000 investment) |
|
| Costs of a $10,000 investment | Costs paid as a percentage of a $10,000 investment |
| R Class | $175 | 1.58% |
|
| | | | | |
| What were the key factors that affected the fund’s performance? |
Focused Global Growth Fund R Class returned 21.48% for the reporting period ended November 30, 2024. |
| The fund seeks capital growth. The commentary below refers to the fund's performance relative to the MSCI ACWI Index. |
| • | Security selection among energy stocks contributed to relative results. The sector lagged the broader market due to low oil prices, but the fund's position in pipeline infrastructure provider The Williams Cos. contributed to performance. The fund also benefited from having no exposure to the underperforming materials sector. |
| • | Notable individual contributors during the period included chipmaker NVIDIA, a beneficiary of the artificial intelligence infrastructure build-out, and aircraft parts manufacturer Howmet Aerospace. Auto insurance carrier Progressive also contributed. |
| • | Security selection and being overweight in the underperforming real estate sector hurt relative performance. Detractors included cell tower leasing company SBA Communications and Prologis, an industrial real estate investment trust. In the financials sector, positions in B3 Brasil Bolsa Balcao and Hong Kong Exchanges & Clearing hurt relative returns. |
| • | Top individual detractors from relative performance included pharmaceutical services provider ICON, semiconductor materials company Entegris and enterprise software developer Workday. |
| | |
Cumulative Performance (based on an initial $10,000 investment) |
| November 30, 2014 through November 30, 2024 |
|
| | | | | | | | | | | | | | |
Average Annual Total Returns | |
| 1 Year | 5 Year | 10 Year | | | |
| R Class | 21.48% | 9.54% | 9.06% | | | |
| | | | | | |
| | | | | | |
| | | | | | |
| | | | | | |
| | | | | | |
| MSCI ACWI | 26.12% | 11.36% | 9.28% | | | |
| | | | | | |
| | | | | | |
| | | | | | |
| | | | | | |
| | |
|
The opinions expressed are those of American Century Investments and are no guarantee of the future performance of any American Century Investments fund. This information is for educational purposes only and is not intended as investment advice. Data reflects past performance, assumes reinvestment of dividends and capital gains and is no guarantee of future results. Current performance may be higher or lower than data shown. Investment return and principal value will fluctuate and redemption value may be more or less than original cost, and none of the charts reflect the deduction of taxes that a shareholder would pay on fund distributions or the redemption of fund shares. Total returns for periods less than one year are not annualized. Visit americancentury.com for more recent performance information.
|
| | | | | |
Fund Statistics | |
| Net Assets | $639,759,273 |
| Management Fees (dollars paid during the reporting period) | $6,217,220 |
| Portfolio Turnover Rate | 72 | % |
| Total Number of Portfolio Holdings | 36 |
| |
| |
| | | | | | | | | | | | | | | | | | | | | | | | | | | | | | | | | | | | |
| Types of Investments in Portfolio (as a % of net assets) | | | | | | | | | | | | Top Five Countries (as a % of net assets) | | | | |
| Common Stocks | 99.6% | | | | | | | | | | | | | | | | | United States | 69% | | | | | | |
| Short-Term Investments | 0.4% | | | | | | | | | | | | | | | | | United Kingdom | 6% | | | | | | |
| Other Assets and Liabilities | 0.0% | | | | | | | | | | | | | | | | | Japan | 6% | | | | | | |
| | | | | | | | | | | | | | | | | | | Denmark | 3% | | | | | | |
| | | | | | | | | | | | | | | | | | | France | 3% | | | | | | |
| | | | | | | | | | | | | | | | | | | | | | | | | | |
| | | | | | | | | | | | | | | | | | | | | | | | | | |
| | | | | | | | | | | | | | | | | | | | | | | | | | |
| | | | | | | | | | | | | | | | | | | | | | | | | | |
| | | | | | | | | | | | | | | | | | | | | | | | | | |
| | | | | | | | | | | | | | | | | | | | | | | | | | |
| | | | | | | | | | | | | | | | | | | | | | | | | | |
| | | | | | | | | | | | | | | | | | | | | | | | | | |
| | | | | | | | | | | | | | | | | | | | | | | | | | |
| | | | | | | | | | | | | | | | | | | | | | | | | | |
| | | | | | | | | | | | | | | | | | | | | | | | | | |
| | |
| For additional information about the fund, including its Prospectus, Statement of Additional Information, financial statements, holdings and proxy voting information, scan the QR code or visit americancentury.com/docs. |
| | |
|
| ©2025 American Century Proprietary Holdings, Inc. All rights reserved. |
A-25086620
ANNUAL SHAREHOLDER REPORT
Focused Global Growth Fund
| | | | | |
R5 Class (AGFGX) | November 30, 2024 |
This annual shareholder report contains important information about Focused Global Growth Fund for the period of December 1, 2023 to November 30, 2024. You can find additional information about the fund at americancentury.com/docs. You can also request this information by contacting us at 1-800-345-2021.
| | | | | | | | |
What were the fund costs for the last year? (based on a hypothetical $10,000 investment) |
|
| Costs of a $10,000 investment | Costs paid as a percentage of a $10,000 investment |
| R5 Class | $98 | 0.88% |
|
| | | | | |
| What were the key factors that affected the fund’s performance? |
Focused Global Growth Fund R5 Class returned 22.25% for the reporting period ended November 30, 2024. |
| The fund seeks capital growth. The commentary below refers to the fund's performance relative to the MSCI ACWI Index. |
| • | Security selection among energy stocks contributed to relative results. The sector lagged the broader market due to low oil prices, but the fund's position in pipeline infrastructure provider The Williams Cos. contributed to performance. The fund also benefited from having no exposure to the underperforming materials sector. |
| • | Notable individual contributors during the period included chipmaker NVIDIA, a beneficiary of the artificial intelligence infrastructure build-out, and aircraft parts manufacturer Howmet Aerospace. Auto insurance carrier Progressive also contributed. |
| • | Security selection and being overweight in the underperforming real estate sector hurt relative performance. Detractors included cell tower leasing company SBA Communications and Prologis, an industrial real estate investment trust. In the financials sector, positions in B3 Brasil Bolsa Balcao and Hong Kong Exchanges & Clearing hurt relative returns. |
| • | Top individual detractors from relative performance included pharmaceutical services provider ICON, semiconductor materials company Entegris and enterprise software developer Workday. |
| | |
Cumulative Performance (based on an initial $10,000 investment) |
| April 10, 2017 through November 30, 2024 |
|
| | | | | | | | | | | | | | | | |
Average Annual Total Returns | |
| 1 Year | 5 Year | | Since Inception | Inception Date | |
| R5 Class | 22.25% | 10.30% | | 11.90% | 4/10/17 | |
| | | | | | |
| | | | | | |
| | | | | | |
| | | | | | |
| | | | | | |
| MSCI ACWI | 26.12% | 11.36% | | 10.90% | — | |
| | | | | | |
| | | | | | |
| | | | | | |
| | | | | | |
| | |
|
The opinions expressed are those of American Century Investments and are no guarantee of the future performance of any American Century Investments fund. This information is for educational purposes only and is not intended as investment advice. Data reflects past performance, assumes reinvestment of dividends and capital gains and is no guarantee of future results. Current performance may be higher or lower than data shown. Investment return and principal value will fluctuate and redemption value may be more or less than original cost, and none of the charts reflect the deduction of taxes that a shareholder would pay on fund distributions or the redemption of fund shares. Total returns for periods less than one year are not annualized. Visit americancentury.com for more recent performance information.
|
| | | | | |
Fund Statistics | |
| Net Assets | $639,759,273 |
| Management Fees (dollars paid during the reporting period) | $6,217,220 |
| Portfolio Turnover Rate | 72 | % |
| Total Number of Portfolio Holdings | 36 |
| |
| |
| | | | | | | | | | | | | | | | | | | | | | | | | | | | | | | | | | | | |
| Types of Investments in Portfolio (as a % of net assets) | | | | | | | | | | | | Top Five Countries (as a % of net assets) | | | | |
| Common Stocks | 99.6% | | | | | | | | | | | | | | | | | United States | 69% | | | | | | |
| Short-Term Investments | 0.4% | | | | | | | | | | | | | | | | | United Kingdom | 6% | | | | | | |
| Other Assets and Liabilities | 0.0% | | | | | | | | | | | | | | | | | Japan | 6% | | | | | | |
| | | | | | | | | | | | | | | | | | | Denmark | 3% | | | | | | |
| | | | | | | | | | | | | | | | | | | France | 3% | | | | | | |
| | | | | | | | | | | | | | | | | | | | | | | | | | |
| | | | | | | | | | | | | | | | | | | | | | | | | | |
| | | | | | | | | | | | | | | | | | | | | | | | | | |
| | | | | | | | | | | | | | | | | | | | | | | | | | |
| | | | | | | | | | | | | | | | | | | | | | | | | | |
| | | | | | | | | | | | | | | | | | | | | | | | | | |
| | | | | | | | | | | | | | | | | | | | | | | | | | |
| | | | | | | | | | | | | | | | | | | | | | | | | | |
| | | | | | | | | | | | | | | | | | | | | | | | | | |
| | | | | | | | | | | | | | | | | | | | | | | | | | |
| | | | | | | | | | | | | | | | | | | | | | | | | | |
| | |
| For additional information about the fund, including its Prospectus, Statement of Additional Information, financial statements, holdings and proxy voting information, scan the QR code or visit americancentury.com/docs. |
| | |
|
| ©2025 American Century Proprietary Holdings, Inc. All rights reserved. |
A-2509A869
ANNUAL SHAREHOLDER REPORT
Focused Global Growth Fund
| | | | | |
R6 Class (AGGDX) | November 30, 2024 |
This annual shareholder report contains important information about Focused Global Growth Fund for the period of December 1, 2023 to November 30, 2024. You can find additional information about the fund at americancentury.com/docs. You can also request this information by contacting us at 1-800-345-2021.
| | | | | | | | |
What were the fund costs for the last year? (based on a hypothetical $10,000 investment) |
|
| Costs of a $10,000 investment | Costs paid as a percentage of a $10,000 investment |
| R6 Class | $81 | 0.73% |
|
| | | | | |
| What were the key factors that affected the fund’s performance? |
Focused Global Growth Fund R6 Class returned 22.48% for the reporting period ended November 30, 2024. |
| The fund seeks capital growth. The commentary below refers to the fund's performance relative to the MSCI ACWI Index. |
| • | Security selection among energy stocks contributed to relative results. The sector lagged the broader market due to low oil prices, but the fund's position in pipeline infrastructure provider The Williams Cos. contributed to performance. The fund also benefited from having no exposure to the underperforming materials sector. |
| • | Notable individual contributors during the period included chipmaker NVIDIA, a beneficiary of the artificial intelligence infrastructure build-out, and aircraft parts manufacturer Howmet Aerospace. Auto insurance carrier Progressive also contributed. |
| • | Security selection and being overweight in the underperforming real estate sector hurt relative performance. Detractors included cell tower leasing company SBA Communications and Prologis, an industrial real estate investment trust. In the financials sector, positions in B3 Brasil Bolsa Balcao and Hong Kong Exchanges & Clearing hurt relative returns. |
| • | Top individual detractors from relative performance included pharmaceutical services provider ICON, semiconductor materials company Entegris and enterprise software developer Workday. |
| | |
Cumulative Performance (based on an initial $10,000 investment) |
| November 30, 2014 through November 30, 2024 |
|
| | | | | | | | | | | | | | |
Average Annual Total Returns | |
| 1 Year | 5 Year | 10 Year | | | |
| R6 Class | 22.48% | 10.46% | 10.00% | | | |
| | | | | | |
| | | | | | |
| | | | | | |
| | | | | | |
| | | | | | |
| MSCI ACWI | 26.12% | 11.36% | 9.28% | | | |
| | | | | | |
| | | | | | |
| | | | | | |
| | | | | | |
| | |
|
The opinions expressed are those of American Century Investments and are no guarantee of the future performance of any American Century Investments fund. This information is for educational purposes only and is not intended as investment advice. Data reflects past performance, assumes reinvestment of dividends and capital gains and is no guarantee of future results. Current performance may be higher or lower than data shown. Investment return and principal value will fluctuate and redemption value may be more or less than original cost, and none of the charts reflect the deduction of taxes that a shareholder would pay on fund distributions or the redemption of fund shares. Total returns for periods less than one year are not annualized. Visit americancentury.com for more recent performance information.
|
| | | | | |
Fund Statistics | |
| Net Assets | $639,759,273 |
| Management Fees (dollars paid during the reporting period) | $6,217,220 |
| Portfolio Turnover Rate | 72 | % |
| Total Number of Portfolio Holdings | 36 |
| |
| |
| | | | | | | | | | | | | | | | | | | | | | | | | | | | | | | | | | | | |
| Types of Investments in Portfolio (as a % of net assets) | | | | | | | | | | | | Top Five Countries (as a % of net assets) | | | | |
| Common Stocks | 99.6% | | | | | | | | | | | | | | | | | United States | 69% | | | | | | |
| Short-Term Investments | 0.4% | | | | | | | | | | | | | | | | | United Kingdom | 6% | | | | | | |
| Other Assets and Liabilities | 0.0% | | | | | | | | | | | | | | | | | Japan | 6% | | | | | | |
| | | | | | | | | | | | | | | | | | | Denmark | 3% | | | | | | |
| | | | | | | | | | | | | | | | | | | France | 3% | | | | | | |
| | | | | | | | | | | | | | | | | | | | | | | | | | |
| | | | | | | | | | | | | | | | | | | | | | | | | | |
| | | | | | | | | | | | | | | | | | | | | | | | | | |
| | | | | | | | | | | | | | | | | | | | | | | | | | |
| | | | | | | | | | | | | | | | | | | | | | | | | | |
| | | | | | | | | | | | | | | | | | | | | | | | | | |
| | | | | | | | | | | | | | | | | | | | | | | | | | |
| | | | | | | | | | | | | | | | | | | | | | | | | | |
| | | | | | | | | | | | | | | | | | | | | | | | | | |
| | | | | | | | | | | | | | | | | | | | | | | | | | |
| | | | | | | | | | | | | | | | | | | | | | | | | | |
| | |
| For additional information about the fund, including its Prospectus, Statement of Additional Information, financial statements, holdings and proxy voting information, scan the QR code or visit americancentury.com/docs. |
| | |
|
| ©2025 American Century Proprietary Holdings, Inc. All rights reserved. |
A-25086414
ANNUAL SHAREHOLDER REPORT
Focused International Growth Fund
| | | | | |
Investor Class (AFCNX) | November 30, 2024 |
This annual shareholder report contains important information about Focused International Growth Fund for the period of December 1, 2023 to November 30, 2024. You can find additional information about the fund at americancentury.com/docs. You can also request this information by contacting us at 1-800-345-2021. This report describes changes to the fund that occurred during the reporting period.
| | | | | | | | |
What were the fund costs for the last year? (based on a hypothetical $10,000 investment) |
|
| Costs of a $10,000 investment | Costs paid as a percentage of a $10,000 investment |
| Investor Class | $116 | 1.09% |
|
| | | | | |
| What were the key factors that affected the fund’s performance? |
Focused International Growth Fund Investor Class returned 12.49% for the reporting period ended November 30, 2024. |
| The fund seeks capital growth. The commentary below refers to the fund's performance compared to the MSCI ACWI ex-U.S. Index. |
| • | Amid high spending on artificial intelligence infrastructure, the fund's position in the information technology sector was the top contributor to relative performance. Key holdings included chipmakers ARM Holdings and Taiwan Semiconductor Manufacturing Co. In the consumer discretionary sector, sportswear maker On Holding and online travel company MakeMyTrip contributed. |
| • | Other notable individual contributors included enterprise software developer SAP, investment bank Barclays and Schneider Electric, a specialist in energy management and automation. |
| • | Security selection in the financials sector weighed on relative returns. Key holdings included financial services companies Edenred and Adyen, as well as insurer AIA Group. Holdings in health care also hurt relative returns. Detractors included Sartorius, a pharmaceuticals and laboratory supplier, and ICON, an outsourced clinical trial and services company. |
| • | Other notable individual detractors included wine and spirits producer Davide Campari-Milano, semiconductor equipment company ASML Holding and BayCurrent, an information technology consulting firm. |
| | |
Cumulative Performance (based on an initial $10,000 investment) |
| March 29, 2016 through November 30, 2024 |
|
| | | | | | | | | | | | | | | | |
Average Annual Total Returns | |
| 1 Year | 5 Year | | Since Inception | Inception Date | |
| Investor Class | 12.49% | 4.79% | | 7.25% | 3/29/16 | |
| | | | | | |
| | | | | | |
| | | | | | |
| | | | | | |
| | | | | | |
| MSCI ACWI ex USA | 13.03% | 5.40% | | 6.76% | — | |
| | | | | | |
| | | | | | |
| | | | | | |
| | | | | | |
| | |
|
The opinions expressed are those of American Century Investments and are no guarantee of the future performance of any American Century Investments fund. This information is for educational purposes only and is not intended as investment advice. Data reflects past performance, assumes reinvestment of dividends and capital gains and is no guarantee of future results. Current performance may be higher or lower than data shown. Investment return and principal value will fluctuate and redemption value may be more or less than original cost, and none of the charts reflect the deduction of taxes that a shareholder would pay on fund distributions or the redemption of fund shares. Total returns for periods less than one year are not annualized. Visit americancentury.com for more recent performance information.
|
| | | | | |
Fund Statistics | |
| Net Assets | $108,581,952 |
| Management Fees (dollars paid during the reporting period) | $478,302 |
| Portfolio Turnover Rate | 82 | % |
| Total Number of Portfolio Holdings | 45 |
| |
| |
| | | | | | | | | | | | | | | | | | | | | | | | | | | | | | | | | | | | |
| Types of Investments in Portfolio (as a % of net assets) | | | | | | | | | | | | Top Five Countries (as a % of net assets) | | | | |
| Common Stocks | 96.8% | | | | | | | | | | | | | | | | | Japan | 19% | | | | | | |
| Short-Term Investments | 9.2% | | | | | | | | | | | | | | | | | United Kingdom | 18% | | | | | | |
| Other Assets and Liabilities | (6.0)% | | | | | | | | | | | | | | | | | Taiwan | 6% | | | | | | |
| | | | | | | | | | | | | | | | | | | France | 6% | | | | | | |
| | | | | | | | | | | | | | | | | | | Netherlands | 6% | | | | | | |
| | | | | | | | | | | | | | | | | | | | | | | | | | |
| | | | | | | | | | | | | | | | | | | | | | | | | | |
| | | | | | | | | | | | | | | | | | | | | | | | | | |
| | | | | | | | | | | | | | | | | | | | | | | | | | |
| | | | | | | | | | | | | | | | | | | | | | | | | | |
| | | | | | | | | | | | | | | | | | | | | | | | | | |
| | | | | | | | | | | | | | | | | | | | | | | | | | |
| | | | | | | | | | | | | | | | | | | | | | | | | | |
| | | | | | | | | | | | | | | | | | | | | | | | | | |
| | | | | | | | | | | | | | | | | | | | | | | | | | |
| | | | | | | | | | | | | | | | | | | | | | | | | | |
| | |
| Fund Changes |
|
|
| Beginning October 2024, the total eligible investments required to qualify for a waiver of the annual account maintenance fee changed from $10,000 to $25,000. Such fee will also be waived for any accounts for which the shareholder has elected to receive electronic delivery of all fund/account documents. |
|
|
|
|
| | |
| For additional information about the fund, including its Prospectus, Statement of Additional Information, financial statements, holdings and proxy voting information, scan the QR code or visit americancentury.com/docs. |
| | |
|
| ©2025 American Century Proprietary Holdings, Inc. All rights reserved. |
A-25086224
ANNUAL SHAREHOLDER REPORT
Focused International Growth Fund
| | | | | |
I Class (AFCSX) | November 30, 2024 |
This annual shareholder report contains important information about Focused International Growth Fund for the period of December 1, 2023 to November 30, 2024. You can find additional information about the fund at americancentury.com/docs. You can also request this information by contacting us at 1-800-345-2021.
| | | | | | | | |
What were the fund costs for the last year? (based on a hypothetical $10,000 investment) |
|
| Costs of a $10,000 investment | Costs paid as a percentage of a $10,000 investment |
| I Class | $95 | 0.89% |
|
| | | | | |
| What were the key factors that affected the fund’s performance? |
Focused International Growth Fund I Class returned 12.72% for the reporting period ended November 30, 2024. |
| The fund seeks capital growth. The commentary below refers to the fund's performance compared to the MSCI ACWI ex-U.S. Index. |
| • | Amid high spending on artificial intelligence infrastructure, the fund's position in the information technology sector was the top contributor to relative performance. Key holdings included chipmakers ARM Holdings and Taiwan Semiconductor Manufacturing Co. In the consumer discretionary sector, sportswear maker On Holding and online travel company MakeMyTrip contributed. |
| • | Other notable individual contributors included enterprise software developer SAP, investment bank Barclays and Schneider Electric, a specialist in energy management and automation. |
| • | Security selection in the financials sector weighed on relative returns. Key holdings included financial services companies Edenred and Adyen, as well as insurer AIA Group. Holdings in health care also hurt relative returns. Detractors included Sartorius, a pharmaceuticals and laboratory supplier, and ICON, an outsourced clinical trial and services company. |
| • | Other notable individual detractors included wine and spirits producer Davide Campari-Milano, semiconductor equipment company ASML Holding and BayCurrent, an information technology consulting firm. |
| | |
Cumulative Performance (based on an initial $10,000 investment) |
| March 29, 2016 through November 30, 2024 |
|
| | | | | | | | | | | | | | | | |
Average Annual Total Returns | |
| 1 Year | 5 Year | | Since Inception | Inception Date | |
| I Class | 12.72% | 5.00% | | 7.47% | 3/29/16 | |
| | | | | | |
| | | | | | |
| | | | | | |
| | | | | | |
| | | | | | |
| MSCI ACWI ex USA | 13.03% | 5.40% | | 6.76% | — | |
| | | | | | |
| | | | | | |
| | | | | | |
| | | | | | |
| | |
|
The opinions expressed are those of American Century Investments and are no guarantee of the future performance of any American Century Investments fund. This information is for educational purposes only and is not intended as investment advice. Data reflects past performance, assumes reinvestment of dividends and capital gains and is no guarantee of future results. Current performance may be higher or lower than data shown. Investment return and principal value will fluctuate and redemption value may be more or less than original cost, and none of the charts reflect the deduction of taxes that a shareholder would pay on fund distributions or the redemption of fund shares. Total returns for periods less than one year are not annualized. Visit americancentury.com for more recent performance information.
|
| | | | | |
Fund Statistics | |
| Net Assets | $108,581,952 |
| Management Fees (dollars paid during the reporting period) | $478,302 |
| Portfolio Turnover Rate | 82 | % |
| Total Number of Portfolio Holdings | 45 |
| |
| |
| | | | | | | | | | | | | | | | | | | | | | | | | | | | | | | | | | | | |
| Types of Investments in Portfolio (as a % of net assets) | | | | | | | | | | | | Top Five Countries (as a % of net assets) | | | | |
| Common Stocks | 96.8% | | | | | | | | | | | | | | | | | Japan | 19% | | | | | | |
| Short-Term Investments | 9.2% | | | | | | | | | | | | | | | | | United Kingdom | 18% | | | | | | |
| Other Assets and Liabilities | (6.0)% | | | | | | | | | | | | | | | | | Taiwan | 6% | | | | | | |
| | | | | | | | | | | | | | | | | | | France | 6% | | | | | | |
| | | | | | | | | | | | | | | | | | | Netherlands | 6% | | | | | | |
| | | | | | | | | | | | | | | | | | | | | | | | | | |
| | | | | | | | | | | | | | | | | | | | | | | | | | |
| | | | | | | | | | | | | | | | | | | | | | | | | | |
| | | | | | | | | | | | | | | | | | | | | | | | | | |
| | | | | | | | | | | | | | | | | | | | | | | | | | |
| | | | | | | | | | | | | | | | | | | | | | | | | | |
| | | | | | | | | | | | | | | | | | | | | | | | | | |
| | | | | | | | | | | | | | | | | | | | | | | | | | |
| | | | | | | | | | | | | | | | | | | | | | | | | | |
| | | | | | | | | | | | | | | | | | | | | | | | | | |
| | | | | | | | | | | | | | | | | | | | | | | | | | |
| | |
| For additional information about the fund, including its Prospectus, Statement of Additional Information, financial statements, holdings and proxy voting information, scan the QR code or visit americancentury.com/docs. |
| | |
|
| ©2025 American Century Proprietary Holdings, Inc. All rights reserved. |
A-25086216
ANNUAL SHAREHOLDER REPORT
Focused International Growth Fund
| | | | | |
A Class (AFCLX) | November 30, 2024 |
This annual shareholder report contains important information about Focused International Growth Fund for the period of December 1, 2023 to November 30, 2024. You can find additional information about the fund at americancentury.com/docs. You can also request this information by contacting us at 1-800-345-2021.
| | | | | | | | |
What were the fund costs for the last year? (based on a hypothetical $10,000 investment) |
|
| Costs of a $10,000 investment | Costs paid as a percentage of a $10,000 investment |
| A Class | $142 | 1.34% |
|
| | | | | |
| What were the key factors that affected the fund’s performance? |
Focused International Growth Fund A Class returned 12.23% for the reporting period ended November 30, 2024. |
| The fund seeks capital growth. The commentary below refers to the fund's performance compared to the MSCI ACWI ex-U.S. Index. |
| • | Amid high spending on artificial intelligence infrastructure, the fund's position in the information technology sector was the top contributor to relative performance. Key holdings included chipmakers ARM Holdings and Taiwan Semiconductor Manufacturing Co. In the consumer discretionary sector, sportswear maker On Holding and online travel company MakeMyTrip contributed. |
| • | Other notable individual contributors included enterprise software developer SAP, investment bank Barclays and Schneider Electric, a specialist in energy management and automation. |
| • | Security selection in the financials sector weighed on relative returns. Key holdings included financial services companies Edenred and Adyen, as well as insurer AIA Group. Holdings in health care also hurt relative returns. Detractors included Sartorius, a pharmaceuticals and laboratory supplier, and ICON, an outsourced clinical trial and services company. |
| • | Other notable individual detractors included wine and spirits producer Davide Campari-Milano, semiconductor equipment company ASML Holding and BayCurrent, an information technology consulting firm. |
| | |
Cumulative Performance (based on an initial $10,000 investment) |
| March 29, 2016 through November 30, 2024 |
| The initial investment is adjusted to reflect the maximum initial sales charge. |
| | | | | | | | | | | | | | | | |
Average Annual Total Returns | |
| 1 Year | 5 Year | | Since Inception | Inception Date | |
| A Class | 12.23% | 4.52% | | 6.98% | 3/29/16 | |
| A Class - with sales charge | 5.78% | 3.29% | | 6.25% | 3/29/16 | |
| | | | | | |
| | | | | | |
| | | | | | |
| | | | | | |
| MSCI ACWI ex USA | 13.03% | 5.40% | | 6.76% | — | |
| | | | | | |
| | | | | | |
| | | | | | |
| | | | | | |
| | | | | | | | | | | | | | | | | |
|
| A Class shares have a 5.75% maximum initial sales charge and may be subject to a maximum contingent deferred sales charge of 1.00%. |
|
|
|
|
|
|
|
|
|
| | |
|
The opinions expressed are those of American Century Investments and are no guarantee of the future performance of any American Century Investments fund. This information is for educational purposes only and is not intended as investment advice. Data reflects past performance, assumes reinvestment of dividends and capital gains and is no guarantee of future results. Current performance may be higher or lower than data shown. Investment return and principal value will fluctuate and redemption value may be more or less than original cost, and none of the charts reflect the deduction of taxes that a shareholder would pay on fund distributions or the redemption of fund shares. Total returns for periods less than one year are not annualized. Visit americancentury.com for more recent performance information.
|
| | | | | |
Fund Statistics | |
| Net Assets | $108,581,952 |
| Management Fees (dollars paid during the reporting period) | $478,302 |
| Portfolio Turnover Rate | 82 | % |
| Total Number of Portfolio Holdings | 45 |
| |
| |
| | | | | | | | | | | | | | | | | | | | | | | | | | | | | | | | | | | | |
| Types of Investments in Portfolio (as a % of net assets) | | | | | | | | | | | | Top Five Countries (as a % of net assets) | | | | |
| Common Stocks | 96.8% | | | | | | | | | | | | | | | | | Japan | 19% | | | | | | |
| Short-Term Investments | 9.2% | | | | | | | | | | | | | | | | | United Kingdom | 18% | | | | | | |
| Other Assets and Liabilities | (6.0)% | | | | | | | | | | | | | | | | | Taiwan | 6% | | | | | | |
| | | | | | | | | | | | | | | | | | | France | 6% | | | | | | |
| | | | | | | | | | | | | | | | | | | Netherlands | 6% | | | | | | |
| | | | | | | | | | | | | | | | | | | | | | | | | | |
| | | | | | | | | | | | | | | | | | | | | | | | | | |
| | | | | | | | | | | | | | | | | | | | | | | | | | |
| | | | | | | | | | | | | | | | | | | | | | | | | | |
| | | | | | | | | | | | | | | | | | | | | | | | | | |
| | | | | | | | | | | | | | | | | | | | | | | | | | |
| | | | | | | | | | | | | | | | | | | | | | | | | | |
| | | | | | | | | | | | | | | | | | | | | | | | | | |
| | | | | | | | | | | | | | | | | | | | | | | | | | |
| | | | | | | | | | | | | | | | | | | | | | | | | | |
| | | | | | | | | | | | | | | | | | | | | | | | | | |
| | |
| For additional information about the fund, including its Prospectus, Statement of Additional Information, financial statements, holdings and proxy voting information, scan the QR code or visit americancentury.com/docs. |
| | |
|
| ©2025 American Century Proprietary Holdings, Inc. All rights reserved. |
A-25086190
ANNUAL SHAREHOLDER REPORT
Focused International Growth Fund
| | | | | |
C Class (AFCHX) | November 30, 2024 |
This annual shareholder report contains important information about Focused International Growth Fund for the period of December 1, 2023 to November 30, 2024. You can find additional information about the fund at americancentury.com/docs. You can also request this information by contacting us at 1-800-345-2021.
| | | | | | | | |
What were the fund costs for the last year? (based on a hypothetical $10,000 investment) |
|
| Costs of a $10,000 investment | Costs paid as a percentage of a $10,000 investment |
| C Class | $221 | 2.09% |
|
| | | | | |
| What were the key factors that affected the fund’s performance? |
Focused International Growth Fund C Class returned 11.38% for the reporting period ended November 30, 2024. |
| The fund seeks capital growth. The commentary below refers to the fund's performance compared to the MSCI ACWI ex-U.S. Index. |
| • | Amid high spending on artificial intelligence infrastructure, the fund's position in the information technology sector was the top contributor to relative performance. Key holdings included chipmakers ARM Holdings and Taiwan Semiconductor Manufacturing Co. In the consumer discretionary sector, sportswear maker On Holding and online travel company MakeMyTrip contributed. |
| • | Other notable individual contributors included enterprise software developer SAP, investment bank Barclays and Schneider Electric, a specialist in energy management and automation. |
| • | Security selection in the financials sector weighed on relative returns. Key holdings included financial services companies Edenred and Adyen, as well as insurer AIA Group. Holdings in health care also hurt relative returns. Detractors included Sartorius, a pharmaceuticals and laboratory supplier, and ICON, an outsourced clinical trial and services company. |
| • | Other notable individual detractors included wine and spirits producer Davide Campari-Milano, semiconductor equipment company ASML Holding and BayCurrent, an information technology consulting firm. |
| | |
Cumulative Performance (based on an initial $10,000 investment) |
| March 29, 2016 through November 30, 2024 |
|
| | | | | | | | | | | | | | | | |
Average Annual Total Returns | |
| 1 Year | 5 Year | | Since Inception | Inception Date | |
| C Class | 11.38% | 3.74% | | 6.18% | 3/29/16 | |
| | | | | | |
| | | | | | |
| | | | | | |
| | | | | | |
| | | | | | |
| MSCI ACWI ex USA | 13.03% | 5.40% | | 6.76% | — | |
| | | | | | |
| | | | | | |
| | | | | | |
| | | | | | |
| | | | | | | | | | | | | | | | | |
|
|
|
|
|
| C Class shares will automatically convert to A Class shares after being held for approximately eight years. C Class average annual returns do not reflect this conversion. |
|
|
|
|
|
| | |
|
The opinions expressed are those of American Century Investments and are no guarantee of the future performance of any American Century Investments fund. This information is for educational purposes only and is not intended as investment advice. Data reflects past performance, assumes reinvestment of dividends and capital gains and is no guarantee of future results. Current performance may be higher or lower than data shown. Investment return and principal value will fluctuate and redemption value may be more or less than original cost, and none of the charts reflect the deduction of taxes that a shareholder would pay on fund distributions or the redemption of fund shares. Total returns for periods less than one year are not annualized. Visit americancentury.com for more recent performance information.
|
| | | | | |
Fund Statistics | |
| Net Assets | $108,581,952 |
| Management Fees (dollars paid during the reporting period) | $478,302 |
| Portfolio Turnover Rate | 82 | % |
| Total Number of Portfolio Holdings | 45 |
| |
| |
| | | | | | | | | | | | | | | | | | | | | | | | | | | | | | | | | | | | |
| Types of Investments in Portfolio (as a % of net assets) | | | | | | | | | | | | Top Five Countries (as a % of net assets) | | | | |
| Common Stocks | 96.8% | | | | | | | | | | | | | | | | | Japan | 19% | | | | | | |
| Short-Term Investments | 9.2% | | | | | | | | | | | | | | | | | United Kingdom | 18% | | | | | | |
| Other Assets and Liabilities | (6.0)% | | | | | | | | | | | | | | | | | Taiwan | 6% | | | | | | |
| | | | | | | | | | | | | | | | | | | France | 6% | | | | | | |
| | | | | | | | | | | | | | | | | | | Netherlands | 6% | | | | | | |
| | | | | | | | | | | | | | | | | | | | | | | | | | |
| | | | | | | | | | | | | | | | | | | | | | | | | | |
| | | | | | | | | | | | | | | | | | | | | | | | | | |
| | | | | | | | | | | | | | | | | | | | | | | | | | |
| | | | | | | | | | | | | | | | | | | | | | | | | | |
| | | | | | | | | | | | | | | | | | | | | | | | | | |
| | | | | | | | | | | | | | | | | | | | | | | | | | |
| | | | | | | | | | | | | | | | | | | | | | | | | | |
| | | | | | | | | | | | | | | | | | | | | | | | | | |
| | | | | | | | | | | | | | | | | | | | | | | | | | |
| | | | | | | | | | | | | | | | | | | | | | | | | | |
| | |
| For additional information about the fund, including its Prospectus, Statement of Additional Information, financial statements, holdings and proxy voting information, scan the QR code or visit americancentury.com/docs. |
| | |
|
| ©2025 American Century Proprietary Holdings, Inc. All rights reserved. |
A-25086182
ANNUAL SHAREHOLDER REPORT
Focused International Growth Fund
| | | | | |
R Class (AFCWX) | November 30, 2024 |
This annual shareholder report contains important information about Focused International Growth Fund for the period of December 1, 2023 to November 30, 2024. You can find additional information about the fund at americancentury.com/docs. You can also request this information by contacting us at 1-800-345-2021.
| | | | | | | | |
What were the fund costs for the last year? (based on a hypothetical $10,000 investment) |
|
| Costs of a $10,000 investment | Costs paid as a percentage of a $10,000 investment |
| R Class | $168 | 1.59% |
|
| | | | | |
| What were the key factors that affected the fund’s performance? |
Focused International Growth Fund R Class returned 11.92% for the reporting period ended November 30, 2024. |
| The fund seeks capital growth. The commentary below refers to the fund's performance compared to the MSCI ACWI ex-U.S. Index. |
| • | Amid high spending on artificial intelligence infrastructure, the fund's position in the information technology sector was the top contributor to relative performance. Key holdings included chipmakers ARM Holdings and Taiwan Semiconductor Manufacturing Co. In the consumer discretionary sector, sportswear maker On Holding and online travel company MakeMyTrip contributed. |
| • | Other notable individual contributors included enterprise software developer SAP, investment bank Barclays and Schneider Electric, a specialist in energy management and automation. |
| • | Security selection in the financials sector weighed on relative returns. Key holdings included financial services companies Edenred and Adyen, as well as insurer AIA Group. Holdings in health care also hurt relative returns. Detractors included Sartorius, a pharmaceuticals and laboratory supplier, and ICON, an outsourced clinical trial and services company. |
| • | Other notable individual detractors included wine and spirits producer Davide Campari-Milano, semiconductor equipment company ASML Holding and BayCurrent, an information technology consulting firm. |
| | |
Cumulative Performance (based on an initial $10,000 investment) |
| March 29, 2016 through November 30, 2024 |
|
| | | | | | | | | | | | | | | | |
Average Annual Total Returns | |
| 1 Year | 5 Year | | Since Inception | Inception Date | |
| R Class | 11.92% | 4.27% | | 6.71% | 3/29/16 | |
| | | | | | |
| | | | | | |
| | | | | | |
| | | | | | |
| | | | | | |
| MSCI ACWI ex USA | 13.03% | 5.40% | | 6.76% | — | |
| | | | | | |
| | | | | | |
| | | | | | |
| | | | | | |
| | |
|
The opinions expressed are those of American Century Investments and are no guarantee of the future performance of any American Century Investments fund. This information is for educational purposes only and is not intended as investment advice. Data reflects past performance, assumes reinvestment of dividends and capital gains and is no guarantee of future results. Current performance may be higher or lower than data shown. Investment return and principal value will fluctuate and redemption value may be more or less than original cost, and none of the charts reflect the deduction of taxes that a shareholder would pay on fund distributions or the redemption of fund shares. Total returns for periods less than one year are not annualized. Visit americancentury.com for more recent performance information.
|
| | | | | |
Fund Statistics | |
| Net Assets | $108,581,952 |
| Management Fees (dollars paid during the reporting period) | $478,302 |
| Portfolio Turnover Rate | 82 | % |
| Total Number of Portfolio Holdings | 45 |
| |
| |
| | | | | | | | | | | | | | | | | | | | | | | | | | | | | | | | | | | | |
| Types of Investments in Portfolio (as a % of net assets) | | | | | | | | | | | | Top Five Countries (as a % of net assets) | | | | |
| Common Stocks | 96.8% | | | | | | | | | | | | | | | | | Japan | 19% | | | | | | |
| Short-Term Investments | 9.2% | | | | | | | | | | | | | | | | | United Kingdom | 18% | | | | | | |
| Other Assets and Liabilities | (6.0)% | | | | | | | | | | | | | | | | | Taiwan | 6% | | | | | | |
| | | | | | | | | | | | | | | | | | | France | 6% | | | | | | |
| | | | | | | | | | | | | | | | | | | Netherlands | 6% | | | | | | |
| | | | | | | | | | | | | | | | | | | | | | | | | | |
| | | | | | | | | | | | | | | | | | | | | | | | | | |
| | | | | | | | | | | | | | | | | | | | | | | | | | |
| | | | | | | | | | | | | | | | | | | | | | | | | | |
| | | | | | | | | | | | | | | | | | | | | | | | | | |
| | | | | | | | | | | | | | | | | | | | | | | | | | |
| | | | | | | | | | | | | | | | | | | | | | | | | | |
| | | | | | | | | | | | | | | | | | | | | | | | | | |
| | | | | | | | | | | | | | | | | | | | | | | | | | |
| | | | | | | | | | | | | | | | | | | | | | | | | | |
| | | | | | | | | | | | | | | | | | | | | | | | | | |
| | |
| For additional information about the fund, including its Prospectus, Statement of Additional Information, financial statements, holdings and proxy voting information, scan the QR code or visit americancentury.com/docs. |
| | |
|
| ©2025 American Century Proprietary Holdings, Inc. All rights reserved. |
A-25086174
ANNUAL SHAREHOLDER REPORT
Focused International Growth Fund
| | | | | |
R6 Class (AFCMX) | November 30, 2024 |
This annual shareholder report contains important information about Focused International Growth Fund for the period of December 1, 2023 to November 30, 2024. You can find additional information about the fund at americancentury.com/docs. You can also request this information by contacting us at 1-800-345-2021.
| | | | | | | | |
What were the fund costs for the last year? (based on a hypothetical $10,000 investment) |
|
| Costs of a $10,000 investment | Costs paid as a percentage of a $10,000 investment |
| R6 Class | $79 | 0.74% |
|
| | | | | |
| What were the key factors that affected the fund’s performance? |
Focused International Growth Fund R6 Class returned 12.94% for the reporting period ended November 30, 2024. |
| The fund seeks capital growth. The commentary below refers to the fund's performance compared to the MSCI ACWI ex-U.S. Index. |
| • | Amid high spending on artificial intelligence infrastructure, the fund's position in the information technology sector was the top contributor to relative performance. Key holdings included chipmakers ARM Holdings and Taiwan Semiconductor Manufacturing Co. In the consumer discretionary sector, sportswear maker On Holding and online travel company MakeMyTrip contributed. |
| • | Other notable individual contributors included enterprise software developer SAP, investment bank Barclays and Schneider Electric, a specialist in energy management and automation. |
| • | Security selection in the financials sector weighed on relative returns. Key holdings included financial services companies Edenred and Adyen, as well as insurer AIA Group. Holdings in health care also hurt relative returns. Detractors included Sartorius, a pharmaceuticals and laboratory supplier, and ICON, an outsourced clinical trial and services company. |
| • | Other notable individual detractors included wine and spirits producer Davide Campari-Milano, semiconductor equipment company ASML Holding and BayCurrent, an information technology consulting firm. |
| | |
Cumulative Performance (based on an initial $10,000 investment) |
| March 29, 2016 through November 30, 2024 |
|
| | | | | | | | | | | | | | | | |
Average Annual Total Returns | |
| 1 Year | 5 Year | | Since Inception | Inception Date | |
| R6 Class | 12.94% | 5.17% | | 7.63% | 3/29/16 | |
| | | | | | |
| | | | | | |
| | | | | | |
| | | | | | |
| | | | | | |
| MSCI ACWI ex USA | 13.03% | 5.40% | | 6.76% | — | |
| | | | | | |
| | | | | | |
| | | | | | |
| | | | | | |
| | |
|
The opinions expressed are those of American Century Investments and are no guarantee of the future performance of any American Century Investments fund. This information is for educational purposes only and is not intended as investment advice. Data reflects past performance, assumes reinvestment of dividends and capital gains and is no guarantee of future results. Current performance may be higher or lower than data shown. Investment return and principal value will fluctuate and redemption value may be more or less than original cost, and none of the charts reflect the deduction of taxes that a shareholder would pay on fund distributions or the redemption of fund shares. Total returns for periods less than one year are not annualized. Visit americancentury.com for more recent performance information.
|
| | | | | |
Fund Statistics | |
| Net Assets | $108,581,952 |
| Management Fees (dollars paid during the reporting period) | $478,302 |
| Portfolio Turnover Rate | 82 | % |
| Total Number of Portfolio Holdings | 45 |
| |
| |
| | | | | | | | | | | | | | | | | | | | | | | | | | | | | | | | | | | | |
| Types of Investments in Portfolio (as a % of net assets) | | | | | | | | | | | | Top Five Countries (as a % of net assets) | | | | |
| Common Stocks | 96.8% | | | | | | | | | | | | | | | | | Japan | 19% | | | | | | |
| Short-Term Investments | 9.2% | | | | | | | | | | | | | | | | | United Kingdom | 18% | | | | | | |
| Other Assets and Liabilities | (6.0)% | | | | | | | | | | | | | | | | | Taiwan | 6% | | | | | | |
| | | | | | | | | | | | | | | | | | | France | 6% | | | | | | |
| | | | | | | | | | | | | | | | | | | Netherlands | 6% | | | | | | |
| | | | | | | | | | | | | | | | | | | | | | | | | | |
| | | | | | | | | | | | | | | | | | | | | | | | | | |
| | | | | | | | | | | | | | | | | | | | | | | | | | |
| | | | | | | | | | | | | | | | | | | | | | | | | | |
| | | | | | | | | | | | | | | | | | | | | | | | | | |
| | | | | | | | | | | | | | | | | | | | | | | | | | |
| | | | | | | | | | | | | | | | | | | | | | | | | | |
| | | | | | | | | | | | | | | | | | | | | | | | | | |
| | | | | | | | | | | | | | | | | | | | | | | | | | |
| | | | | | | | | | | | | | | | | | | | | | | | | | |
| | | | | | | | | | | | | | | | | | | | | | | | | | |
| | |
| For additional information about the fund, including its Prospectus, Statement of Additional Information, financial statements, holdings and proxy voting information, scan the QR code or visit americancentury.com/docs. |
| | |
|
| ©2025 American Century Proprietary Holdings, Inc. All rights reserved. |
A-25086166
ANNUAL SHAREHOLDER REPORT
Focused International Growth Fund
| | | | | |
G Class (AFCGX) | November 30, 2024 |
This annual shareholder report contains important information about Focused International Growth Fund for the period of December 1, 2023 to November 30, 2024. You can find additional information about the fund at americancentury.com/docs. You can also request this information by contacting us at 1-800-345-2021.
| | | | | | | | |
What were the fund costs for the last year? (based on a hypothetical $10,000 investment) |
|
| Costs of a $10,000 investment | Costs paid as a percentage of a $10,000 investment |
| G Class | $0 | 0.00% |
|
| | | | | |
| What were the key factors that affected the fund’s performance? |
Focused International Growth Fund G Class returned 13.75% for the reporting period ended November 30, 2024. |
| The fund seeks capital growth. The commentary below refers to the fund's performance compared to the MSCI ACWI ex-U.S. Index. |
| • | Amid high spending on artificial intelligence infrastructure, the fund's position in the information technology sector was the top contributor to relative performance. Key holdings included chipmakers ARM Holdings and Taiwan Semiconductor Manufacturing Co. In the consumer discretionary sector, sportswear maker On Holding and online travel company MakeMyTrip contributed. |
| • | Other notable individual contributors included enterprise software developer SAP, investment bank Barclays and Schneider Electric, a specialist in energy management and automation. |
| • | Security selection in the financials sector weighed on relative returns. Key holdings included financial services companies Edenred and Adyen, as well as insurer AIA Group. Holdings in health care also hurt relative returns. Detractors included Sartorius, a pharmaceuticals and laboratory supplier, and ICON, an outsourced clinical trial and services company. |
| • | Other notable individual detractors included wine and spirits producer Davide Campari-Milano, semiconductor equipment company ASML Holding and BayCurrent, an information technology consulting firm. |
| | |
Cumulative Performance (based on an initial $10,000 investment) |
| April 1, 2019 through November 30, 2024 |
|
| | | | | | | | | | | | | | | | |
Average Annual Total Returns | |
| 1 Year | 5 Year | | Since Inception | Inception Date | |
| G Class | 13.75% | 5.96% | | 7.39% | 4/1/19 | |
| | | | | | |
| | | | | | |
| | | | | | |
| | | | | | |
| | | | | | |
| MSCI ACWI ex USA | 13.03% | 5.40% | | 5.55% | — | |
| | | | | | |
| | | | | | |
| | | | | | |
| | | | | | |
| | |
|
The opinions expressed are those of American Century Investments and are no guarantee of the future performance of any American Century Investments fund. This information is for educational purposes only and is not intended as investment advice. Data reflects past performance, assumes reinvestment of dividends and capital gains and is no guarantee of future results. Current performance may be higher or lower than data shown. Investment return and principal value will fluctuate and redemption value may be more or less than original cost, and none of the charts reflect the deduction of taxes that a shareholder would pay on fund distributions or the redemption of fund shares. Total returns for periods less than one year are not annualized. Visit americancentury.com for more recent performance information.
|
| | | | | |
Fund Statistics | |
| Net Assets | $108,581,952 |
| Management Fees (dollars paid during the reporting period) | $478,302 |
| Portfolio Turnover Rate | 82 | % |
| Total Number of Portfolio Holdings | 45 |
| |
| |
| | | | | | | | | | | | | | | | | | | | | | | | | | | | | | | | | | | | |
| Types of Investments in Portfolio (as a % of net assets) | | | | | | | | | | | | Top Five Countries (as a % of net assets) | | | | |
| Common Stocks | 96.8% | | | | | | | | | | | | | | | | | Japan | 19% | | | | | | |
| Short-Term Investments | 9.2% | | | | | | | | | | | | | | | | | United Kingdom | 18% | | | | | | |
| Other Assets and Liabilities | (6.0)% | | | | | | | | | | | | | | | | | Taiwan | 6% | | | | | | |
| | | | | | | | | | | | | | | | | | | France | 6% | | | | | | |
| | | | | | | | | | | | | | | | | | | Netherlands | 6% | | | | | | |
| | | | | | | | | | | | | | | | | | | | | | | | | | |
| | | | | | | | | | | | | | | | | | | | | | | | | | |
| | | | | | | | | | | | | | | | | | | | | | | | | | |
| | | | | | | | | | | | | | | | | | | | | | | | | | |
| | | | | | | | | | | | | | | | | | | | | | | | | | |
| | | | | | | | | | | | | | | | | | | | | | | | | | |
| | | | | | | | | | | | | | | | | | | | | | | | | | |
| | | | | | | | | | | | | | | | | | | | | | | | | | |
| | | | | | | | | | | | | | | | | | | | | | | | | | |
| | | | | | | | | | | | | | | | | | | | | | | | | | |
| | | | | | | | | | | | | | | | | | | | | | | | | | |
| | |
| For additional information about the fund, including its Prospectus, Statement of Additional Information, financial statements, holdings and proxy voting information, scan the QR code or visit americancentury.com/docs. |
| | |
|
| ©2025 American Century Proprietary Holdings, Inc. All rights reserved. |
A-2509A794
ANNUAL SHAREHOLDER REPORT
Global Small Cap Fund
| | | | | |
Investor Class (AGCVX) | November 30, 2024 |
This annual shareholder report contains important information about Global Small Cap Fund for the period of December 1, 2023 to November 30, 2024. You can find additional information about the fund at americancentury.com/docs. You can also request this information by contacting us at 1-800-345-2021. This report describes changes to the fund that occurred during the reporting period.
| | | | | | | | |
What were the fund costs for the last year? (based on a hypothetical $10,000 investment) |
|
| Costs of a $10,000 investment | Costs paid as a percentage of a $10,000 investment |
| Investor Class | $126 | 1.11% |
|
| | | | | |
| What were the key factors that affected the fund’s performance? |
Global Small Cap Fund Investor Class returned 27.64% for the reporting period ended November 30, 2024. |
| The fund seeks capital growth. The commentary below refers to the fund's performance relative to the MSCI ACWI Small Cap Index. |
| • | The health care sector drove relative performance as did materials and consumer discretionary. U.S.-based biopharmaceutical company ADMA Biologics and Natera, a U.S.-based genetic testing business, contributed in biotechnology. Other notables included Carpenter Technology, a U.S.-based provider of specialty metals, and Asics, the Japan-based shoe and apparel company. |
| • | U.S.-based Modine Manufacturing, which specializes in thermal management products, and RadNet, a U.S.-based diagnostic imaging company, were among the top individual contributors, along with U.S.-based boutique investment bank Evercore. |
| • | The energy and industrials sectors were the biggest drags on relative performance. Kosmos Energy, a U.S.-based oil and gas company, was a notable detractor in oil, gas and consumable fuels. Airtac International Group, a Taiwan-based pneumatic equipment company, weighed on relative returns. |
| • | Other notable individual detractors included DoubleVerify Holdings, a digital media measurement and analytics company; Progyny, a provider of reproductive and women's health benefits; and Alphatec Holdings, which specializes in solutions for spinal disorders. |
| | |
Cumulative Performance (based on an initial $10,000 investment) |
| March 29, 2016 through November 30, 2024 |
|
| | | | | | | | | | | | | | | | |
Average Annual Total Returns | |
| 1 Year | 5 Year | | Since Inception | Inception Date | |
| Investor Class | 27.64% | 10.79% | | 12.75% | 3/29/16 | |
| | | | | | |
| Regulatory Index | | | | | | |
| MSCI ACWI | 26.12% | 11.36% | | 11.41% | — | |
| | | | | | |
| Performance Index | | | | | | |
| MSCI ACWI Small Cap | 23.78% | 8.64% | | 9.28% | — | |
| | | | | | |
| | | | | | |
| | | | | | |
| | | | | | |
| | | | | | | | | | | | | | | | | |
| The regulatory index is provided as a broad measure of market performance. The performance index is provided because the advisor believes it is more reflective of the fund’s investment strategy. |
|
|
|
|
|
|
|
|
|
|
| | |
|
The opinions expressed are those of American Century Investments and are no guarantee of the future performance of any American Century Investments fund. This information is for educational purposes only and is not intended as investment advice. Data reflects past performance, assumes reinvestment of dividends and capital gains and is no guarantee of future results. Current performance may be higher or lower than data shown. Investment return and principal value will fluctuate and redemption value may be more or less than original cost, and none of the charts reflect the deduction of taxes that a shareholder would pay on fund distributions or the redemption of fund shares. Total returns for periods less than one year are not annualized. Visit americancentury.com for more recent performance information.
|
| | | | | |
Fund Statistics | |
| Net Assets | $83,600,570 |
| Management Fees (dollars paid during the reporting period) | $817,858 |
| Portfolio Turnover Rate | 109 | % |
| Total Number of Portfolio Holdings | 139 |
| |
| |
| | | | | | | | | | | | | | | | | | | | | | | | | | | | | | | | | | | | |
| Types of Investments in Portfolio (as a % of net assets) | | | | | | | | | | | | Top Five Countries (as a % of net assets) | | | | |
| Common Stocks | 100.1% | | | | | | | | | | | | | | | | | United States | 61% | | | | | | |
| Exchange-Traded Funds | 0.0% | | | | | | | | | | | | | | | | | Canada | 10% | | | | | | |
| Short-Term Investments | 3.0% | | | | | | | | | | | | | | | | | Japan | 6% | | | | | | |
| Other Assets and Liabilities | (3.1)% | | | | | | | | | | | | | | | | | India | 4% | | | | | | |
| | | | | | | | | | | | | | | | | | | United Kingdom | 3% | | | | | | |
| | | | | | | | | | | | | | | | | | | | | | | | | | |
| | | | | | | | | | | | | | | | | | | | | | | | | | |
| | | | | | | | | | | | | | | | | | | | | | | | | | |
| | | | | | | | | | | | | | | | | | | | | | | | | | |
| | | | | | | | | | | | | | | | | | | | | | | | | | |
| | | | | | | | | | | | | | | | | | | | | | | | | | |
| | | | | | | | | | | | | | | | | | | | | | | | | | |
| | | | | | | | | | | | | | | | | | | | | | | | | | |
| | | | | | | | | | | | | | | | | | | | | | | | | | |
| | | | | | | | | | | | | | | | | | | | | | | | | | |
| | | | | | | | | | | | | | | | | | | | | | | | | | |
| | |
| Fund Changes |
|
|
| Beginning October 2024, the total eligible investments required to qualify for a waiver of the annual account maintenance fee changed from $10,000 to $25,000. Such fee will also be waived for any accounts for which the shareholder has elected to receive electronic delivery of all fund/account documents. |
|
|
|
|
| | |
| For additional information about the fund, including its Prospectus, Statement of Additional Information, financial statements, holdings and proxy voting information, scan the QR code or visit americancentury.com/docs. |
| | |
|
| ©2025 American Century Proprietary Holdings, Inc. All rights reserved. |
A-2509A109
ANNUAL SHAREHOLDER REPORT
Global Small Cap Fund
| | | | | |
I Class (AGCSX) | November 30, 2024 |
This annual shareholder report contains important information about Global Small Cap Fund for the period of December 1, 2023 to November 30, 2024. You can find additional information about the fund at americancentury.com/docs. You can also request this information by contacting us at 1-800-345-2021.
| | | | | | | | |
What were the fund costs for the last year? (based on a hypothetical $10,000 investment) |
|
| Costs of a $10,000 investment | Costs paid as a percentage of a $10,000 investment |
| I Class | $104 | 0.91% |
|
| | | | | |
| What were the key factors that affected the fund’s performance? |
Global Small Cap Fund I Class returned 27.91% for the reporting period ended November 30, 2024. |
| The fund seeks capital growth. The commentary below refers to the fund's performance relative to the MSCI ACWI Small Cap Index. |
| • | The health care sector drove relative performance as did materials and consumer discretionary. U.S.-based biopharmaceutical company ADMA Biologics and Natera, a U.S.-based genetic testing business, contributed in biotechnology. Other notables included Carpenter Technology, a U.S.-based provider of specialty metals, and Asics, the Japan-based shoe and apparel company. |
| • | U.S.-based Modine Manufacturing, which specializes in thermal management products, and RadNet, a U.S.-based diagnostic imaging company, were among the top individual contributors, along with U.S.-based boutique investment bank Evercore. |
| • | The energy and industrials sectors were the biggest drags on relative performance. Kosmos Energy, a U.S.-based oil and gas company, was a notable detractor in oil, gas and consumable fuels. Airtac International Group, a Taiwan-based pneumatic equipment company, weighed on relative returns. |
| • | Other notable individual detractors included DoubleVerify Holdings, a digital media measurement and analytics company; Progyny, a provider of reproductive and women's health benefits; and Alphatec Holdings, which specializes in solutions for spinal disorders. |
| | |
Cumulative Performance (based on an initial $10,000 investment) |
| March 29, 2016 through November 30, 2024 |
|
| | | | | | | | | | | | | | | | |
Average Annual Total Returns | |
| 1 Year | 5 Year | | Since Inception | Inception Date | |
| I Class | 27.91% | 11.02% | | 12.98% | 3/29/16 | |
| | | | | | |
| Regulatory Index | | | | | | |
| MSCI ACWI | 26.12% | 11.36% | | 11.41% | — | |
| | | | | | |
| Performance Index | | | | | | |
| MSCI ACWI Small Cap | 23.78% | 8.64% | | 9.28% | — | |
| | | | | | |
| | | | | | |
| | | | | | |
| | | | | | |
| | | | | | | | | | | | | | | | | |
| The regulatory index is provided as a broad measure of market performance. The performance index is provided because the advisor believes it is more reflective of the fund’s investment strategy. |
|
|
|
|
|
|
|
|
|
|
| | |
|
The opinions expressed are those of American Century Investments and are no guarantee of the future performance of any American Century Investments fund. This information is for educational purposes only and is not intended as investment advice. Data reflects past performance, assumes reinvestment of dividends and capital gains and is no guarantee of future results. Current performance may be higher or lower than data shown. Investment return and principal value will fluctuate and redemption value may be more or less than original cost, and none of the charts reflect the deduction of taxes that a shareholder would pay on fund distributions or the redemption of fund shares. Total returns for periods less than one year are not annualized. Visit americancentury.com for more recent performance information.
|
| | | | | |
Fund Statistics | |
| Net Assets | $83,600,570 |
| Management Fees (dollars paid during the reporting period) | $817,858 |
| Portfolio Turnover Rate | 109 | % |
| Total Number of Portfolio Holdings | 139 |
| |
| |
| | | | | | | | | | | | | | | | | | | | | | | | | | | | | | | | | | | | |
| Types of Investments in Portfolio (as a % of net assets) | | | | | | | | | | | | Top Five Countries (as a % of net assets) | | | | |
| Common Stocks | 100.1% | | | | | | | | | | | | | | | | | United States | 61% | | | | | | |
| Exchange-Traded Funds | 0.0% | | | | | | | | | | | | | | | | | Canada | 10% | | | | | | |
| Short-Term Investments | 3.0% | | | | | | | | | | | | | | | | | Japan | 6% | | | | | | |
| Other Assets and Liabilities | (3.1)% | | | | | | | | | | | | | | | | | India | 4% | | | | | | |
| | | | | | | | | | | | | | | | | | | United Kingdom | 3% | | | | | | |
| | | | | | | | | | | | | | | | | | | | | | | | | | |
| | | | | | | | | | | | | | | | | | | | | | | | | | |
| | | | | | | | | | | | | | | | | | | | | | | | | | |
| | | | | | | | | | | | | | | | | | | | | | | | | | |
| | | | | | | | | | | | | | | | | | | | | | | | | | |
| | | | | | | | | | | | | | | | | | | | | | | | | | |
| | | | | | | | | | | | | | | | | | | | | | | | | | |
| | | | | | | | | | | | | | | | | | | | | | | | | | |
| | | | | | | | | | | | | | | | | | | | | | | | | | |
| | | | | | | | | | | | | | | | | | | | | | | | | | |
| | | | | | | | | | | | | | | | | | | | | | | | | | |
| | |
| For additional information about the fund, including its Prospectus, Statement of Additional Information, financial statements, holdings and proxy voting information, scan the QR code or visit americancentury.com/docs. |
| | |
|
| ©2025 American Century Proprietary Holdings, Inc. All rights reserved. |
A-2509A208
ANNUAL SHAREHOLDER REPORT
Global Small Cap Fund
| | | | | |
A Class (AGCLX) | November 30, 2024 |
This annual shareholder report contains important information about Global Small Cap Fund for the period of December 1, 2023 to November 30, 2024. You can find additional information about the fund at americancentury.com/docs. You can also request this information by contacting us at 1-800-345-2021.
| | | | | | | | |
What were the fund costs for the last year? (based on a hypothetical $10,000 investment) |
|
| Costs of a $10,000 investment | Costs paid as a percentage of a $10,000 investment |
| A Class | $155 | 1.36% |
|
| | | | | |
| What were the key factors that affected the fund’s performance? |
Global Small Cap Fund A Class returned 27.40% for the reporting period ended November 30, 2024. |
| The fund seeks capital growth. The commentary below refers to the fund's performance relative to the MSCI ACWI Small Cap Index. |
| • | The health care sector drove relative performance as did materials and consumer discretionary. U.S.-based biopharmaceutical company ADMA Biologics and Natera, a U.S.-based genetic testing business, contributed in biotechnology. Other notables included Carpenter Technology, a U.S.-based provider of specialty metals, and Asics, the Japan-based shoe and apparel company. |
| • | U.S.-based Modine Manufacturing, which specializes in thermal management products, and RadNet, a U.S.-based diagnostic imaging company, were among the top individual contributors, along with U.S.-based boutique investment bank Evercore. |
| • | The energy and industrials sectors were the biggest drags on relative performance. Kosmos Energy, a U.S.-based oil and gas company, was a notable detractor in oil, gas and consumable fuels. Airtac International Group, a Taiwan-based pneumatic equipment company, weighed on relative returns. |
| • | Other notable individual detractors included DoubleVerify Holdings, a digital media measurement and analytics company; Progyny, a provider of reproductive and women's health benefits; and Alphatec Holdings, which specializes in solutions for spinal disorders. |
| | |
Cumulative Performance (based on an initial $10,000 investment) |
| March 29, 2016 through November 30, 2024 |
| The initial investment is adjusted to reflect the maximum initial sales charge. |
| | | | | | | | | | | | | | | | |
Average Annual Total Returns | | | | | | |
| 1 Year | 5 Year | | Since Inception | Inception Date | |
| A Class | 27.40% | 10.52% | | 12.48% | 3/29/16 | |
| A Class - with sales charge | 20.07% | 9.22% | | 11.71% | 3/29/16 | |
| Regulatory Index | | | | | | |
| MSCI ACWI | 26.12% | 11.36% | | 11.41% | — | |
| | | | | | |
| Performance Index | | | | | | |
| MSCI ACWI Small Cap | 23.78% | 8.64% | | 9.28% | — | |
| | | | | | |
| | | | | | |
| | | | | | |
| | | | | | |
| | | | | | | | | | | | | | | | | |
| The regulatory index is provided as a broad measure of market performance. The performance index is provided because the advisor believes it is more reflective of the fund’s investment strategy. |
| A Class shares have a 5.75% maximum initial sales charge and may be subject to a maximum contingent deferred sales charge of 1.00%. |
|
|
|
|
|
|
|
|
|
| | |
|
The opinions expressed are those of American Century Investments and are no guarantee of the future performance of any American Century Investments fund. This information is for educational purposes only and is not intended as investment advice. Data reflects past performance, assumes reinvestment of dividends and capital gains and is no guarantee of future results. Current performance may be higher or lower than data shown. Investment return and principal value will fluctuate and redemption value may be more or less than original cost, and none of the charts reflect the deduction of taxes that a shareholder would pay on fund distributions or the redemption of fund shares. Total returns for periods less than one year are not annualized. Visit americancentury.com for more recent performance information.
|
| | | | | |
Fund Statistics | |
| Net Assets | $83,600,570 |
| Management Fees (dollars paid during the reporting period) | $817,858 |
| Portfolio Turnover Rate | 109 | % |
| Total Number of Portfolio Holdings | 139 |
| |
| |
| | | | | | | | | | | | | | | | | | | | | | | | | | | | | | | | | | | | |
| Types of Investments in Portfolio (as a % of net assets) | | | | | | | | | | | | Top Five Countries (as a % of net assets) | | | | |
| Common Stocks | 100.1% | | | | | | | | | | | | | | | | | United States | 61% | | | | | | |
| Exchange-Traded Funds | 0.0% | | | | | | | | | | | | | | | | | Canada | 10% | | | | | | |
| Short-Term Investments | 3.0% | | | | | | | | | | | | | | | | | Japan | 6% | | | | | | |
| Other Assets and Liabilities | (3.1)% | | | | | | | | | | | | | | | | | India | 4% | | | | | | |
| | | | | | | | | | | | | | | | | | | United Kingdom | 3% | | | | | | |
| | | | | | | | | | | | | | | | | | | | | | | | | | |
| | | | | | | | | | | | | | | | | | | | | | | | | | |
| | | | | | | | | | | | | | | | | | | | | | | | | | |
| | | | | | | | | | | | | | | | | | | | | | | | | | |
| | | | | | | | | | | | | | | | | | | | | | | | | | |
| | | | | | | | | | | | | | | | | | | | | | | | | | |
| | | | | | | | | | | | | | | | | | | | | | | | | | |
| | | | | | | | | | | | | | | | | | | | | | | | | | |
| | | | | | | | | | | | | | | | | | | | | | | | | | |
| | | | | | | | | | | | | | | | | | | | | | | | | | |
| | | | | | | | | | | | | | | | | | | | | | | | | | |
| | |
| For additional information about the fund, including its Prospectus, Statement of Additional Information, financial statements, holdings and proxy voting information, scan the QR code or visit americancentury.com/docs. |
| | |
|
| ©2025 American Century Proprietary Holdings, Inc. All rights reserved. |
A-2509A307
ANNUAL SHAREHOLDER REPORT
Global Small Cap Fund
| | | | | |
C Class (AGCHX) | November 30, 2024 |
This annual shareholder report contains important information about Global Small Cap Fund for the period of December 1, 2023 to November 30, 2024. You can find additional information about the fund at americancentury.com/docs. You can also request this information by contacting us at 1-800-345-2021.
| | | | | | | | |
What were the fund costs for the last year? (based on a hypothetical $10,000 investment) |
|
| Costs of a $10,000 investment | Costs paid as a percentage of a $10,000 investment |
| C Class | $239 | 2.11% |
|
| | | | | |
| What were the key factors that affected the fund’s performance? |
Global Small Cap Fund C Class returned 26.44% for the reporting period ended November 30, 2024. |
| The fund seeks capital growth. The commentary below refers to the fund's performance relative to the MSCI ACWI Small Cap Index. |
| • | The health care sector drove relative performance as did materials and consumer discretionary. U.S.-based biopharmaceutical company ADMA Biologics and Natera, a U.S.-based genetic testing business, contributed in biotechnology. Other notables included Carpenter Technology, a U.S.-based provider of specialty metals, and Asics, the Japan-based shoe and apparel company. |
| • | U.S.-based Modine Manufacturing, which specializes in thermal management products, and RadNet, a U.S.-based diagnostic imaging company, were among the top individual contributors, along with U.S.-based boutique investment bank Evercore. |
| • | The energy and industrials sectors were the biggest drags on relative performance. Kosmos Energy, a U.S.-based oil and gas company, was a notable detractor in oil, gas and consumable fuels. Airtac International Group, a Taiwan-based pneumatic equipment company, weighed on relative returns. |
| • | Other notable individual detractors included DoubleVerify Holdings, a digital media measurement and analytics company; Progyny, a provider of reproductive and women's health benefits; and Alphatec Holdings, which specializes in solutions for spinal disorders. |
| | |
Cumulative Performance (based on an initial $10,000 investment) |
| March 29, 2016 through November 30, 2024 |
|
| | | | | | | | | | | | | | | | |
Average Annual Total Returns | |
| 1 Year | 5 Year | | Since Inception | Inception Date | |
| C Class | 26.44% | 9.68% | | 11.63% | 3/29/16 | |
| | | | | | |
| Regulatory Index | | | | | | |
| MSCI ACWI | 26.12% | 11.36% | | 11.41% | — | |
| | | | | | |
| Performance Index | | | | | | |
| MSCI ACWI Small Cap | 23.78% | 8.64% | | 9.28% | — | |
| | | | | | |
| | | | | | |
| | | | | | |
| | | | | | |
| | | | | | | | | | | | | | | | | |
| The regulatory index is provided as a broad measure of market performance. The performance index is provided because the advisor believes it is more reflective of the fund’s investment strategy. |
|
|
|
|
| C Class shares will automatically convert to A Class shares after being held for approximately eight years. C Class average annual returns do not reflect this conversion. |
|
|
|
|
|
| | |
|
The opinions expressed are those of American Century Investments and are no guarantee of the future performance of any American Century Investments fund. This information is for educational purposes only and is not intended as investment advice. Data reflects past performance, assumes reinvestment of dividends and capital gains and is no guarantee of future results. Current performance may be higher or lower than data shown. Investment return and principal value will fluctuate and redemption value may be more or less than original cost, and none of the charts reflect the deduction of taxes that a shareholder would pay on fund distributions or the redemption of fund shares. Total returns for periods less than one year are not annualized. Visit americancentury.com for more recent performance information.
|
| | | | | |
Fund Statistics | |
| Net Assets | $83,600,570 |
| Management Fees (dollars paid during the reporting period) | $817,858 |
| Portfolio Turnover Rate | 109 | % |
| Total Number of Portfolio Holdings | 139 |
| |
| |
| | | | | | | | | | | | | | | | | | | | | | | | | | | | | | | | | | | | |
| Types of Investments in Portfolio (as a % of net assets) | | | | | | | | | | | | Top Five Countries (as a % of net assets) | | | | |
| Common Stocks | 100.1% | | | | | | | | | | | | | | | | | United States | 61% | | | | | | |
| Exchange-Traded Funds | 0.0% | | | | | | | | | | | | | | | | | Canada | 10% | | | | | | |
| Short-Term Investments | 3.0% | | | | | | | | | | | | | | | | | Japan | 6% | | | | | | |
| Other Assets and Liabilities | (3.1)% | | | | | | | | | | | | | | | | | India | 4% | | | | | | |
| | | | | | | | | | | | | | | | | | | United Kingdom | 3% | | | | | | |
| | | | | | | | | | | | | | | | | | | | | | | | | | |
| | | | | | | | | | | | | | | | | | | | | | | | | | |
| | | | | | | | | | | | | | | | | | | | | | | | | | |
| | | | | | | | | | | | | | | | | | | | | | | | | | |
| | | | | | | | | | | | | | | | | | | | | | | | | | |
| | | | | | | | | | | | | | | | | | | | | | | | | | |
| | | | | | | | | | | | | | | | | | | | | | | | | | |
| | | | | | | | | | | | | | | | | | | | | | | | | | |
| | | | | | | | | | | | | | | | | | | | | | | | | | |
| | | | | | | | | | | | | | | | | | | | | | | | | | |
| | | | | | | | | | | | | | | | | | | | | | | | | | |
| | |
| For additional information about the fund, including its Prospectus, Statement of Additional Information, financial statements, holdings and proxy voting information, scan the QR code or visit americancentury.com/docs. |
| | |
|
| ©2025 American Century Proprietary Holdings, Inc. All rights reserved. |
A-2509A406
ANNUAL SHAREHOLDER REPORT
Global Small Cap Fund
| | | | | |
R Class (AGCWX) | November 30, 2024 |
This annual shareholder report contains important information about Global Small Cap Fund for the period of December 1, 2023 to November 30, 2024. You can find additional information about the fund at americancentury.com/docs. You can also request this information by contacting us at 1-800-345-2021.
| | | | | | | | |
What were the fund costs for the last year? (based on a hypothetical $10,000 investment) |
|
| Costs of a $10,000 investment | Costs paid as a percentage of a $10,000 investment |
| R Class | $183 | 1.61% |
|
| | | | | |
| What were the key factors that affected the fund’s performance? |
Global Small Cap Fund R Class returned 27.05% for the reporting period ended November 30, 2024. |
| The fund seeks capital growth. The commentary below refers to the fund's performance relative to the MSCI ACWI Small Cap Index. |
| • | The health care sector drove relative performance as did materials and consumer discretionary. U.S.-based biopharmaceutical company ADMA Biologics and Natera, a U.S.-based genetic testing business, contributed in biotechnology. Other notables included Carpenter Technology, a U.S.-based provider of specialty metals, and Asics, the Japan-based shoe and apparel company. |
| • | U.S.-based Modine Manufacturing, which specializes in thermal management products, and RadNet, a U.S.-based diagnostic imaging company, were among the top individual contributors, along with U.S.-based boutique investment bank Evercore. |
| • | The energy and industrials sectors were the biggest drags on relative performance. Kosmos Energy, a U.S.-based oil and gas company, was a notable detractor in oil, gas and consumable fuels. Airtac International Group, a Taiwan-based pneumatic equipment company, weighed on relative returns. |
| • | Other notable individual detractors included DoubleVerify Holdings, a digital media measurement and analytics company; Progyny, a provider of reproductive and women's health benefits; and Alphatec Holdings, which specializes in solutions for spinal disorders. |
| | |
Cumulative Performance (based on an initial $10,000 investment) |
| March 29, 2016 through November 30, 2024 |
|
| | | | | | | | | | | | | | | | |
Average Annual Total Returns | |
| 1 Year | 5 Year | | Since Inception | Inception Date | |
| R Class | 27.05% | 10.23% | | 12.19% | 3/29/16 | |
| | | | | | |
| Regulatory Index | | | | | | |
| MSCI ACWI | 26.12% | 11.36% | | 11.41% | — | |
| | | | | | |
| Performance Index | | | | | | |
| MSCI ACWI Small Cap | 23.78% | 8.64% | | 9.28% | — | |
| | | | | | |
| | | | | | |
| | | | | | |
| | | | | | |
| | | | | | | | | | | | | | | | | |
| The regulatory index is provided as a broad measure of market performance. The performance index is provided because the advisor believes it is more reflective of the fund’s investment strategy. |
|
|
|
|
|
|
|
|
|
|
| | |
|
The opinions expressed are those of American Century Investments and are no guarantee of the future performance of any American Century Investments fund. This information is for educational purposes only and is not intended as investment advice. Data reflects past performance, assumes reinvestment of dividends and capital gains and is no guarantee of future results. Current performance may be higher or lower than data shown. Investment return and principal value will fluctuate and redemption value may be more or less than original cost, and none of the charts reflect the deduction of taxes that a shareholder would pay on fund distributions or the redemption of fund shares. Total returns for periods less than one year are not annualized. Visit americancentury.com for more recent performance information.
|
| | | | | |
Fund Statistics | |
| Net Assets | $83,600,570 |
| Management Fees (dollars paid during the reporting period) | $817,858 |
| Portfolio Turnover Rate | 109 | % |
| Total Number of Portfolio Holdings | 139 |
| |
| |
| | | | | | | | | | | | | | | | | | | | | | | | | | | | | | | | | | | | |
| Types of Investments in Portfolio (as a % of net assets) | | | | | | | | | | | | Top Five Countries (as a % of net assets) | | | | |
| Common Stocks | 100.1% | | | | | | | | | | | | | | | | | United States | 61% | | | | | | |
| Exchange-Traded Funds | 0.0% | | | | | | | | | | | | | | | | | Canada | 10% | | | | | | |
| Short-Term Investments | 3.0% | | | | | | | | | | | | | | | | | Japan | 6% | | | | | | |
| Other Assets and Liabilities | (3.1)% | | | | | | | | | | | | | | | | | India | 4% | | | | | | |
| | | | | | | | | | | | | | | | | | | United Kingdom | 3% | | | | | | |
| | | | | | | | | | | | | | | | | | | | | | | | | | |
| | | | | | | | | | | | | | | | | | | | | | | | | | |
| | | | | | | | | | | | | | | | | | | | | | | | | | |
| | | | | | | | | | | | | | | | | | | | | | | | | | |
| | | | | | | | | | | | | | | | | | | | | | | | | | |
| | | | | | | | | | | | | | | | | | | | | | | | | | |
| | | | | | | | | | | | | | | | | | | | | | | | | | |
| | | | | | | | | | | | | | | | | | | | | | | | | | |
| | | | | | | | | | | | | | | | | | | | | | | | | | |
| | | | | | | | | | | | | | | | | | | | | | | | | | |
| | | | | | | | | | | | | | | | | | | | | | | | | | |
| | |
| For additional information about the fund, including its Prospectus, Statement of Additional Information, financial statements, holdings and proxy voting information, scan the QR code or visit americancentury.com/docs. |
| | |
|
| ©2025 American Century Proprietary Holdings, Inc. All rights reserved. |
A-2509A505
ANNUAL SHAREHOLDER REPORT
Global Small Cap Fund
| | | | | |
R6 Class (AGCTX) | November 30, 2024 |
This annual shareholder report contains important information about Global Small Cap Fund for the period of December 1, 2023 to November 30, 2024. You can find additional information about the fund at americancentury.com/docs. You can also request this information by contacting us at 1-800-345-2021.
| | | | | | | | |
What were the fund costs for the last year? (based on a hypothetical $10,000 investment) |
|
| Costs of a $10,000 investment | Costs paid as a percentage of a $10,000 investment |
| R6 Class | $87 | 0.76% |
|
| | | | | |
| What were the key factors that affected the fund’s performance? |
Global Small Cap Fund R6 Class returned 28.10% for the reporting period ended November 30, 2024. |
| The fund seeks capital growth. The commentary below refers to the fund's performance relative to the MSCI ACWI Small Cap Index. |
| • | The health care sector drove relative performance as did materials and consumer discretionary. U.S.-based biopharmaceutical company ADMA Biologics and Natera, a U.S.-based genetic testing business, contributed in biotechnology. Other notables included Carpenter Technology, a U.S.-based provider of specialty metals, and Asics, the Japan-based shoe and apparel company. |
| • | U.S.-based Modine Manufacturing, which specializes in thermal management products, and RadNet, a U.S.-based diagnostic imaging company, were among the top individual contributors, along with U.S.-based boutique investment bank Evercore. |
| • | The energy and industrials sectors were the biggest drags on relative performance. Kosmos Energy, a U.S.-based oil and gas company, was a notable detractor in oil, gas and consumable fuels. Airtac International Group, a Taiwan-based pneumatic equipment company, weighed on relative returns. |
| • | Other notable individual detractors included DoubleVerify Holdings, a digital media measurement and analytics company; Progyny, a provider of reproductive and women's health benefits; and Alphatec Holdings, which specializes in solutions for spinal disorders. |
| | |
Cumulative Performance (based on an initial $10,000 investment) |
| March 29, 2016 through November 30, 2024 |
|
| | | | | | | | | | | | | | | | |
Average Annual Total Returns | |
| 1 Year | 5 Year | | Since Inception | Inception Date | |
| R6 Class | 28.10% | 11.18% | | 13.15% | 3/29/16 | |
| | | | | | |
| Regulatory Index | | | | | | |
| MSCI ACWI | 26.12% | 11.36% | | 11.41% | — | |
| | | | | | |
| Performance Index | | | | | | |
| MSCI ACWI Small Cap | 23.78% | 8.64% | | 9.28% | — | |
| | | | | | |
| | | | | | |
| | | | | | |
| | | | | | |
| | | | | | | | | | | | | | | | | |
| The regulatory index is provided as a broad measure of market performance. The performance index is provided because the advisor believes it is more reflective of the fund’s investment strategy. |
|
|
|
|
|
|
|
|
|
|
| | |
|
The opinions expressed are those of American Century Investments and are no guarantee of the future performance of any American Century Investments fund. This information is for educational purposes only and is not intended as investment advice. Data reflects past performance, assumes reinvestment of dividends and capital gains and is no guarantee of future results. Current performance may be higher or lower than data shown. Investment return and principal value will fluctuate and redemption value may be more or less than original cost, and none of the charts reflect the deduction of taxes that a shareholder would pay on fund distributions or the redemption of fund shares. Total returns for periods less than one year are not annualized. Visit americancentury.com for more recent performance information.
|
| | | | | |
Fund Statistics |
| Net Assets | $83,600,570 |
| Management Fees (dollars paid during the reporting period) | $817,858 |
| Portfolio Turnover Rate | 109 | % |
| Total Number of Portfolio Holdings | 139 |
| |
| |
| | | | | | | | | | | | | | | | | | | | | | | | | | | | | | | | | | | | |
| Types of Investments in Portfolio (as a % of net assets) | | | | | | | | | | | | Top Five Countries (as a % of net assets) | | | | |
| Common Stocks | 100.1% | | | | | | | | | | | | | | | | | United States | 61% | | | | | | |
| Exchange-Traded Funds | 0.0% | | | | | | | | | | | | | | | | | Canada | 10% | | | | | | |
| Short-Term Investments | 3.0% | | | | | | | | | | | | | | | | | Japan | 6% | | | | | | |
| Other Assets and Liabilities | (3.1)% | | | | | | | | | | | | | | | | | India | 4% | | | | | | |
| | | | | | | | | | | | | | | | | | | United Kingdom | 3% | | | | | | |
| | | | | | | | | | | | | | | | | | | | | | | | | | |
| | | | | | | | | | | | | | | | | | | | | | | | | | |
| | | | | | | | | | | | | | | | | | | | | | | | | | |
| | | | | | | | | | | | | | | | | | | | | | | | | | |
| | | | | | | | | | | | | | | | | | | | | | | | | | |
| | | | | | | | | | | | | | | | | | | | | | | | | | |
| | | | | | | | | | | | | | | | | | | | | | | | | | |
| | | | | | | | | | | | | | | | | | | | | | | | | | |
| | | | | | | | | | | | | | | | | | | | | | | | | | |
| | | | | | | | | | | | | | | | | | | | | | | | | | |
| | | | | | | | | | | | | | | | | | | | | | | | | | |
| | |
| For additional information about the fund, including its Prospectus, Statement of Additional Information, financial statements, holdings and proxy voting information, scan the QR code or visit americancentury.com/docs. |
| | |
|
| ©2025 American Century Proprietary Holdings, Inc. All rights reserved. |
A-2509A604
ANNUAL SHAREHOLDER REPORT
International Growth Fund
| | | | | |
Investor Class (TWIEX) | November 30, 2024 |
This annual shareholder report contains important information about International Growth Fund for the period of December 1, 2023 to November 30, 2024. You can find additional information about the fund at americancentury.com/docs. You can also request this information by contacting us at 1-800-345-2021. This report describes changes to the fund that occurred during the reporting period.
| | | | | | | | |
What were the fund costs for the last year? (based on a hypothetical $10,000 investment) |
|
| Costs of a $10,000 investment | Costs paid as a percentage of a $10,000 investment |
| Investor Class | $131 | 1.24% |
|
| | | | | |
| What were the key factors that affected the fund’s performance? |
International Growth Fund Investor Class returned 11.19% for the reporting period ended November 30, 2024. |
| The fund seeks capital growth. The commentary below refers to the fund's performance compared to the MSCI EAFE Index. |
| • | The fund's position in the industrials sector boosted relative performance. Holdings included the top individual contributor to relative returns, Mitsubishi Heavy Industries, a manufacturer of electricity-generating gas turbines. In the consumer discretionary sector, the fund benefited from owning travel and hospitality-related businesses and avoiding the underperforming automobiles industry. |
| • | Amid rising investment in artificial intelligence, semiconductor companies ARM Holdings and Taiwan Semiconductor Manufacturing Co. were among the top individual contributors to performance. Sportswear maker On Holding also lifted relative results. |
| • | The fund's underweight position and security selection in the financials sector weighed on relative returns. Detractors included digital payment solutions company Edenred and insurer AIA Group. Positioning in the communication services sector, most notably a stake in wireless telecommunications infrastructure and services company Cellnex Telecom, also hurt relative performance. |
| • | Notable individual detractors from relative returns included information technology consulting firm BayCurrent and Davide Campari-Milano, a producer of wine and spirits. ICON, an outsourced clinical trial and services company, and Infineon Technologies, a maker of semiconductors for the automotive and industrial sectors, also detracted. |
| | |
Cumulative Performance (based on an initial $10,000 investment) |
| November 30, 2014 through November 30, 2024 |
|
| | | | | | | | | | | | | | |
Average Annual Total Returns | |
| 1 Year | 5 Year | 10 Year | | | |
| Investor Class | 11.19% | 4.69% | 4.62% | | | |
| | | | | | |
| | | | | | |
| MSCI EAFE | 11.88% | 5.89% | 5.07% | | | |
| | | | | | |
| | | | | | |
| | | | | | |
| MSCI EAFE Growth | 10.95% | 5.18% | 5.76% | | | |
| | | | | | |
| | | | | | |
| | | | | | |
| | |
|
The opinions expressed are those of American Century Investments and are no guarantee of the future performance of any American Century Investments fund. This information is for educational purposes only and is not intended as investment advice. Data reflects past performance, assumes reinvestment of dividends and capital gains and is no guarantee of future results. Current performance may be higher or lower than data shown. Investment return and principal value will fluctuate and redemption value may be more or less than original cost, and none of the charts reflect the deduction of taxes that a shareholder would pay on fund distributions or the redemption of fund shares. Total returns for periods less than one year are not annualized. Visit americancentury.com for more recent performance information.
|
| | | | | |
Fund Statistics | |
| Net Assets | $2,827,786,559 |
| Management Fees (dollars paid during the reporting period) | $15,263,452 |
| Portfolio Turnover Rate | 56 | % |
| Total Number of Portfolio Holdings | 97 |
| |
| |
| | | | | | | | | | | | | | | | | | | | | | | | | | | | | | | | | | | | |
| Types of Investments in Portfolio (as a % of net assets) | | | | | | | | | | | | Top Five Countries (as a % of net assets) | | | | |
| Common Stocks | 97.8% | | | | | | | | | | | | | | | | | Japan | 21% | | | | | | |
| Short-Term Investments | 3.2% | | | | | | | | | | | | | | | | | United Kingdom | 18% | | | | | | |
| Other Assets and Liabilities | (1.0)% | | | | | | | | | | | | | | | | | France | 12% | | | | | | |
| | | | | | | | | | | | | | | | | | | Germany | 7% | | | | | | |
| | | | | | | | | | | | | | | | | | | Switzerland | 6% | | | | | | |
| | | | | | | | | | | | | | | | | | | | | | | | | | |
| | | | | | | | | | | | | | | | | | | | | | | | | | |
| | | | | | | | | | | | | | | | | | | | | | | | | | |
| | | | | | | | | | | | | | | | | | | | | | | | | | |
| | | | | | | | | | | | | | | | | | | | | | | | | | |
| | | | | | | | | | | | | | | | | | | | | | | | | | |
| | | | | | | | | | | | | | | | | | | | | | | | | | |
| | | | | | | | | | | | | | | | | | | | | | | | | | |
| | | | | | | | | | | | | | | | | | | | | | | | | | |
| | | | | | | | | | | | | | | | | | | | | | | | | | |
| | | | | | | | | | | | | | | | | | | | | | | | | | |
| | |
| Fund Changes |
|
|
| Beginning October 2024, the total eligible investments required to qualify for a waiver of the annual account maintenance fee changed from $10,000 to $25,000. Such fee will also be waived for any accounts for which the shareholder has elected to receive electronic delivery of all fund/account documents. |
|
|
|
|
| | |
| For additional information about the fund, including its Prospectus, Statement of Additional Information, financial statements, holdings and proxy voting information, scan the QR code or visit americancentury.com/docs. |
| | |
|
| ©2025 American Century Proprietary Holdings, Inc. All rights reserved. |
A-25086109
ANNUAL SHAREHOLDER REPORT
International Growth Fund
| | | | | |
I Class (TGRIX) | November 30, 2024 |
This annual shareholder report contains important information about International Growth Fund for the period of December 1, 2023 to November 30, 2024. You can find additional information about the fund at americancentury.com/docs. You can also request this information by contacting us at 1-800-345-2021.
| | | | | | | | |
What were the fund costs for the last year? (based on a hypothetical $10,000 investment) |
|
| Costs of a $10,000 investment | Costs paid as a percentage of a $10,000 investment |
| I Class | $110 | 1.04% |
|
| | | | | |
| What were the key factors that affected the fund’s performance? |
International Growth Fund I Class returned 11.41% for the reporting period ended November 30, 2024. |
| The fund seeks capital growth. The commentary below refers to the fund's performance compared to the MSCI EAFE Index. |
| • | The fund's position in the industrials sector boosted relative performance. Holdings included the top individual contributor to relative returns, Mitsubishi Heavy Industries, a manufacturer of electricity-generating gas turbines. In the consumer discretionary sector, the fund benefited from owning travel and hospitality-related businesses and avoiding the underperforming automobiles industry. |
| • | Amid rising investment in artificial intelligence, semiconductor companies ARM Holdings and Taiwan Semiconductor Manufacturing Co. were among the top individual contributors to performance. Sportswear maker On Holding also lifted relative results. |
| • | The fund's underweight position and security selection in the financials sector weighed on relative returns. Detractors included digital payment solutions company Edenred and insurer AIA Group. Positioning in the communication services sector, most notably a stake in wireless telecommunications infrastructure and services company Cellnex Telecom, also hurt relative performance. |
| • | Notable individual detractors from relative returns included information technology consulting firm BayCurrent and Davide Campari-Milano, a producer of wine and spirits. ICON, an outsourced clinical trial and services company, and Infineon Technologies, a maker of semiconductors for the automotive and industrial sectors, also detracted. |
| | |
Cumulative Performance (based on an initial $10,000 investment) |
| November 30, 2014 through November 30, 2024 |
|
| | | | | | | | | | | | | | |
Average Annual Total Returns | |
| 1 Year | 5 Year | 10 Year | | | |
| I Class | 11.41% | 4.90% | 4.83% | | | |
| | | | | | |
| | | | | | |
| MSCI EAFE | 11.88% | 5.89% | 5.07% | | | |
| | | | | | |
| | | | | | |
| | | | | | |
| MSCI EAFE Growth | 10.95% | 5.18% | 5.76% | | | |
| | | | | | |
| | | | | | |
| | | | | | |
| | |
|
The opinions expressed are those of American Century Investments and are no guarantee of the future performance of any American Century Investments fund. This information is for educational purposes only and is not intended as investment advice. Data reflects past performance, assumes reinvestment of dividends and capital gains and is no guarantee of future results. Current performance may be higher or lower than data shown. Investment return and principal value will fluctuate and redemption value may be more or less than original cost, and none of the charts reflect the deduction of taxes that a shareholder would pay on fund distributions or the redemption of fund shares. Total returns for periods less than one year are not annualized. Visit americancentury.com for more recent performance information.
|
| | | | | |
Fund Statistics | |
| Net Assets | $2,827,786,559 |
| Management Fees (dollars paid during the reporting period) | $15,263,452 |
| Portfolio Turnover Rate | 56 | % |
| Total Number of Portfolio Holdings | 97 |
| |
| |
| | | | | | | | | | | | | | | | | | | | | | | | | | | | | | | | | | | | |
| Types of Investments in Portfolio (as a % of net assets) | | | | | | | | | | | | Top Five Countries (as a % of net assets) | | | | |
| Common Stocks | 97.8% | | | | | | | | | | | | | | | | | Japan | 21% | | | | | | |
| Short-Term Investments | 3.2% | | | | | | | | | | | | | | | | | United Kingdom | 18% | | | | | | |
| Other Assets and Liabilities | (1.0)% | | | | | | | | | | | | | | | | | France | 12% | | | | | | |
| | | | | | | | | | | | | | | | | | | Germany | 7% | | | | | | |
| | | | | | | | | | | | | | | | | | | Switzerland | 6% | | | | | | |
| | | | | | | | | | | | | | | | | | | | | | | | | | |
| | | | | | | | | | | | | | | | | | | | | | | | | | |
| | | | | | | | | | | | | | | | | | | | | | | | | | |
| | | | | | | | | | | | | | | | | | | | | | | | | | |
| | | | | | | | | | | | | | | | | | | | | | | | | | |
| | | | | | | | | | | | | | | | | | | | | | | | | | |
| | | | | | | | | | | | | | | | | | | | | | | | | | |
| | | | | | | | | | | | | | | | | | | | | | | | | | |
| | | | | | | | | | | | | | | | | | | | | | | | | | |
| | | | | | | | | | | | | | | | | | | | | | | | | | |
| | | | | | | | | | | | | | | | | | | | | | | | | | |
| | |
| For additional information about the fund, including its Prospectus, Statement of Additional Information, financial statements, holdings and proxy voting information, scan the QR code or visit americancentury.com/docs. |
| | |
|
| ©2025 American Century Proprietary Holdings, Inc. All rights reserved. |
A-25086208
ANNUAL SHAREHOLDER REPORT
International Growth Fund
| | | | | |
Y Class (ATYGX) | November 30, 2024 |
This annual shareholder report contains important information about International Growth Fund for the period of December 1, 2023 to November 30, 2024. You can find additional information about the fund at americancentury.com/docs. You can also request this information by contacting us at 1-800-345-2021.
| | | | | | | | |
What were the fund costs for the last year? (based on a hypothetical $10,000 investment) |
|
| Costs of a $10,000 investment | Costs paid as a percentage of a $10,000 investment |
| Y Class | $94 | 0.89% |
|
| | | | | |
| What were the key factors that affected the fund’s performance? |
International Growth Fund Y Class returned 11.54% for the reporting period ended November 30, 2024. |
| The fund seeks capital growth. The commentary below refers to the fund's performance compared to the MSCI EAFE Index. |
| • | The fund's position in the industrials sector boosted relative performance. Holdings included the top individual contributor to relative returns, Mitsubishi Heavy Industries, a manufacturer of electricity-generating gas turbines. In the consumer discretionary sector, the fund benefited from owning travel and hospitality-related businesses and avoiding the underperforming automobiles industry. |
| • | Amid rising investment in artificial intelligence, semiconductor companies ARM Holdings and Taiwan Semiconductor Manufacturing Co. were among the top individual contributors to performance. Sportswear maker On Holding also lifted relative results. |
| • | The fund's underweight position and security selection in the financials sector weighed on relative returns. Detractors included digital payment solutions company Edenred and insurer AIA Group. Positioning in the communication services sector, most notably a stake in wireless telecommunications infrastructure and services company Cellnex Telecom, also hurt relative performance. |
| • | Notable individual detractors from relative returns included information technology consulting firm BayCurrent and Davide Campari-Milano, a producer of wine and spirits. ICON, an outsourced clinical trial and services company, and Infineon Technologies, a maker of semiconductors for the automotive and industrial sectors, also detracted. |
| | |
Cumulative Performance (based on an initial $10,000 investment) |
| April 10, 2017 through November 30, 2024 |
|
| | | | | | | | | | | | | | | | |
Average Annual Total Returns | |
| 1 Year | 5 Year | | Since Inception | Inception Date | |
| Y Class | 11.54% | 5.05% | | 6.65% | 4/10/17 | |
| | | | | | |
| | | | | | |
| MSCI EAFE | 11.88% | 5.89% | | 6.26% | — | |
| | | | | | |
| | | | | | |
| | | | | | |
| MSCI EAFE Growth | 10.95% | 5.18% | | 6.84% | — | |
| | | | | | |
| | | | | | |
| | | | | | |
| | |
|
The opinions expressed are those of American Century Investments and are no guarantee of the future performance of any American Century Investments fund. This information is for educational purposes only and is not intended as investment advice. Data reflects past performance, assumes reinvestment of dividends and capital gains and is no guarantee of future results. Current performance may be higher or lower than data shown. Investment return and principal value will fluctuate and redemption value may be more or less than original cost, and none of the charts reflect the deduction of taxes that a shareholder would pay on fund distributions or the redemption of fund shares. Total returns for periods less than one year are not annualized. Visit americancentury.com for more recent performance information.
|
| | | | | |
Fund Statistics | |
| Net Assets | $2,827,786,559 |
| Management Fees (dollars paid during the reporting period) | $15,263,452 |
| Portfolio Turnover Rate | 56 | % |
| Total Number of Portfolio Holdings | 97 |
| |
| |
| | | | | | | | | | | | | | | | | | | | | | | | | | | | | | | | | | | | |
| Types of Investments in Portfolio (as a % of net assets) | | | | | | | | | | | | Top Five Countries (as a % of net assets) | | | | |
| Common Stocks | 97.8% | | | | | | | | | | | | | | | | | Japan | 21% | | | | | | |
| Short-Term Investments | 3.2% | | | | | | | | | | | | | | | | | United Kingdom | 18% | | | | | | |
| Other Assets and Liabilities | (1.0)% | | | | | | | | | | | | | | | | | France | 12% | | | | | | |
| | | | | | | | | | | | | | | | | | | Germany | 7% | | | | | | |
| | | | | | | | | | | | | | | | | | | Switzerland | 6% | | | | | | |
| | | | | | | | | | | | | | | | | | | | | | | | | | |
| | | | | | | | | | | | | | | | | | | | | | | | | | |
| | | | | | | | | | | | | | | | | | | | | | | | | | |
| | | | | | | | | | | | | | | | | | | | | | | | | | |
| | | | | | | | | | | | | | | | | | | | | | | | | | |
| | | | | | | | | | | | | | | | | | | | | | | | | | |
| | | | | | | | | | | | | | | | | | | | | | | | | | |
| | | | | | | | | | | | | | | | | | | | | | | | | | |
| | | | | | | | | | | | | | | | | | | | | | | | | | |
| | | | | | | | | | | | | | | | | | | | | | | | | | |
| | | | | | | | | | | | | | | | | | | | | | | | | | |
| | |
| For additional information about the fund, including its Prospectus, Statement of Additional Information, financial statements, holdings and proxy voting information, scan the QR code or visit americancentury.com/docs. |
| | |
|
| ©2025 American Century Proprietary Holdings, Inc. All rights reserved. |
A-2509A703
ANNUAL SHAREHOLDER REPORT
International Growth Fund
| | | | | |
A Class (TWGAX) | November 30, 2024 |
This annual shareholder report contains important information about International Growth Fund for the period of December 1, 2023 to November 30, 2024. You can find additional information about the fund at americancentury.com/docs. You can also request this information by contacting us at 1-800-345-2021.
| | | | | | | | |
What were the fund costs for the last year? (based on a hypothetical $10,000 investment) |
|
| Costs of a $10,000 investment | Costs paid as a percentage of a $10,000 investment |
| A Class | $157 | 1.49% |
|
| | | | | |
| What were the key factors that affected the fund’s performance? |
International Growth Fund A Class returned 10.87% for the reporting period ended November 30, 2024. |
| The fund seeks capital growth. The commentary below refers to the fund's performance compared to the MSCI EAFE Index. |
| • | The fund's position in the industrials sector boosted relative performance. Holdings included the top individual contributor to relative returns, Mitsubishi Heavy Industries, a manufacturer of electricity-generating gas turbines. In the consumer discretionary sector, the fund benefited from owning travel and hospitality-related businesses and avoiding the underperforming automobiles industry. |
| • | Amid rising investment in artificial intelligence, semiconductor companies ARM Holdings and Taiwan Semiconductor Manufacturing Co. were among the top individual contributors to performance. Sportswear maker On Holding also lifted relative results. |
| • | The fund's underweight position and security selection in the financials sector weighed on relative returns. Detractors included digital payment solutions company Edenred and insurer AIA Group. Positioning in the communication services sector, most notably a stake in wireless telecommunications infrastructure and services company Cellnex Telecom, also hurt relative performance. |
| • | Notable individual detractors from relative returns included information technology consulting firm BayCurrent and Davide Campari-Milano, a producer of wine and spirits. ICON, an outsourced clinical trial and services company, and Infineon Technologies, a maker of semiconductors for the automotive and industrial sectors, also detracted. |
| | |
Cumulative Performance (based on an initial $10,000 investment) |
| November 30, 2014 through November 30, 2024 |
| The initial investment is adjusted to reflect the maximum initial sales charge. |
| | | | | | | | | | | | | | |
Average Annual Total Returns | |
| 1 Year | 5 Year | 10 Year | | | |
| A Class | 10.87% | 4.42% | 4.36% | | | |
| A Class - with sales charge | 4.50% | 3.19% | 3.74% | | | |
| | | | | | |
| MSCI EAFE | 11.88% | 5.89% | 5.07% | | | |
| | | | | | |
| | | | | | |
| | | | | | |
| MSCI EAFE Growth | 10.95% | 5.18% | 5.76% | | | |
| | | | | | |
| | | | | | |
| | | | | | |
| | | | | | | | | | | | | | | | | |
|
| A Class shares have a 5.75% maximum initial sales charge and may be subject to a maximum contingent deferred sales charge of 1.00%. |
|
|
|
|
|
|
|
|
|
| | |
|
The opinions expressed are those of American Century Investments and are no guarantee of the future performance of any American Century Investments fund. This information is for educational purposes only and is not intended as investment advice. Data reflects past performance, assumes reinvestment of dividends and capital gains and is no guarantee of future results. Current performance may be higher or lower than data shown. Investment return and principal value will fluctuate and redemption value may be more or less than original cost, and none of the charts reflect the deduction of taxes that a shareholder would pay on fund distributions or the redemption of fund shares. Total returns for periods less than one year are not annualized. Visit americancentury.com for more recent performance information.
|
| | | | | |
Fund Statistics | |
| Net Assets | $2,827,786,559 |
| Management Fees (dollars paid during the reporting period) | $15,263,452 |
| Portfolio Turnover Rate | 56 | % |
| Total Number of Portfolio Holdings | 97 |
| |
| |
| | | | | | | | | | | | | | | | | | | | | | | | | | | | | | | | | | | | |
| Types of Investments in Portfolio (as a % of net assets) | | | | | | | | | | | | Top Five Countries (as a % of net assets) | | | | |
| Common Stocks | 97.8% | | | | | | | | | | | | | | | | | Japan | 21% | | | | | | |
| Short-Term Investments | 3.2% | | | | | | | | | | | | | | | | | United Kingdom | 18% | | | | | | |
| Other Assets and Liabilities | (1.0)% | | | | | | | | | | | | | | | | | France | 12% | | | | | | |
| | | | | | | | | | | | | | | | | | | Germany | 7% | | | | | | |
| | | | | | | | | | | | | | | | | | | Switzerland | 6% | | | | | | |
| | | | | | | | | | | | | | | | | | | | | | | | | | |
| | | | | | | | | | | | | | | | | | | | | | | | | | |
| | | | | | | | | | | | | | | | | | | | | | | | | | |
| | | | | | | | | | | | | | | | | | | | | | | | | | |
| | | | | | | | | | | | | | | | | | | | | | | | | | |
| | | | | | | | | | | | | | | | | | | | | | | | | | |
| | | | | | | | | | | | | | | | | | | | | | | | | | |
| | | | | | | | | | | | | | | | | | | | | | | | | | |
| | | | | | | | | | | | | | | | | | | | | | | | | | |
| | | | | | | | | | | | | | | | | | | | | | | | | | |
| | | | | | | | | | | | | | | | | | | | | | | | | | |
| | |
| For additional information about the fund, including its Prospectus, Statement of Additional Information, financial statements, holdings and proxy voting information, scan the QR code or visit americancentury.com/docs. |
| | |
|
| ©2025 American Century Proprietary Holdings, Inc. All rights reserved. |
A-25086406
ANNUAL SHAREHOLDER REPORT
International Growth Fund
| | | | | |
C Class (AIWCX) | November 30, 2024 |
This annual shareholder report contains important information about International Growth Fund for the period of December 1, 2023 to November 30, 2024. You can find additional information about the fund at americancentury.com/docs. You can also request this information by contacting us at 1-800-345-2021.
| | | | | | | | |
What were the fund costs for the last year? (based on a hypothetical $10,000 investment) |
|
| Costs of a $10,000 investment | Costs paid as a percentage of a $10,000 investment |
| C Class | $235 | 2.24% |
|
| | | | | |
| What were the key factors that affected the fund’s performance? |
International Growth Fund C Class returned 10.13% for the reporting period ended November 30, 2024. |
| The fund seeks capital growth. The commentary below refers to the fund's performance compared to the MSCI EAFE Index. |
| • | The fund's position in the industrials sector boosted relative performance. Holdings included the top individual contributor to relative returns, Mitsubishi Heavy Industries, a manufacturer of electricity-generating gas turbines. In the consumer discretionary sector, the fund benefited from owning travel and hospitality-related businesses and avoiding the underperforming automobiles industry. |
| • | Amid rising investment in artificial intelligence, semiconductor companies ARM Holdings and Taiwan Semiconductor Manufacturing Co. were among the top individual contributors to performance. Sportswear maker On Holding also lifted relative results. |
| • | The fund's underweight position and security selection in the financials sector weighed on relative returns. Detractors included digital payment solutions company Edenred and insurer AIA Group. Positioning in the communication services sector, most notably a stake in wireless telecommunications infrastructure and services company Cellnex Telecom, also hurt relative performance. |
| • | Notable individual detractors from relative returns included information technology consulting firm BayCurrent and Davide Campari-Milano, a producer of wine and spirits. ICON, an outsourced clinical trial and services company, and Infineon Technologies, a maker of semiconductors for the automotive and industrial sectors, also detracted. |
| | |
Cumulative Performance (based on an initial $10,000 investment) |
| November 30, 2014 through November 30, 2024 |
|
| | | | | | | | | | | | | | |
Average Annual Total Returns | |
| 1 Year | 5 Year | 10 Year | | | |
| C Class | 10.13% | 3.65% | 3.58% | | | |
| | | | | | |
| | | | | | |
| MSCI EAFE | 11.88% | 5.89% | 5.07% | | | |
| | | | | | |
| | | | | | |
| | | | | | |
| MSCI EAFE Growth | 10.95% | 5.18% | 5.76% | | | |
| | | | | | |
| | | | | | |
| | | | | | |
| | | | | | | | | | | | | | | | | |
|
|
|
|
|
| C Class shares will automatically convert to A Class shares after being held for approximately eight years. C Class average annual returns do not reflect this conversion. |
|
|
|
|
|
| | |
|
The opinions expressed are those of American Century Investments and are no guarantee of the future performance of any American Century Investments fund. This information is for educational purposes only and is not intended as investment advice. Data reflects past performance, assumes reinvestment of dividends and capital gains and is no guarantee of future results. Current performance may be higher or lower than data shown. Investment return and principal value will fluctuate and redemption value may be more or less than original cost, and none of the charts reflect the deduction of taxes that a shareholder would pay on fund distributions or the redemption of fund shares. Total returns for periods less than one year are not annualized. Visit americancentury.com for more recent performance information.
|
| | | | | |
Fund Statistics | |
| Net Assets | $2,827,786,559 |
| Management Fees (dollars paid during the reporting period) | $15,263,452 |
| Portfolio Turnover Rate | 56 | % |
| Total Number of Portfolio Holdings | 97 |
| |
| |
| | | | | | | | | | | | | | | | | | | | | | | | | | | | | | | | | | | | |
| Types of Investments in Portfolio (as a % of net assets) | | | | | | | | | | | | Top Five Countries (as a % of net assets) | | | | |
| Common Stocks | 97.8% | | | | | | | | | | | | | | | | | Japan | 21% | | | | | | |
| Short-Term Investments | 3.2% | | | | | | | | | | | | | | | | | United Kingdom | 18% | | | | | | |
| Other Assets and Liabilities | (1.0)% | | | | | | | | | | | | | | | | | France | 12% | | | | | | |
| | | | | | | | | | | | | | | | | | | Germany | 7% | | | | | | |
| | | | | | | | | | | | | | | | | | | Switzerland | 6% | | | | | | |
| | | | | | | | | | | | | | | | | | | | | | | | | | |
| | | | | | | | | | | | | | | | | | | | | | | | | | |
| | | | | | | | | | | | | | | | | | | | | | | | | | |
| | | | | | | | | | | | | | | | | | | | | | | | | | |
| | | | | | | | | | | | | | | | | | | | | | | | | | |
| | | | | | | | | | | | | | | | | | | | | | | | | | |
| | | | | | | | | | | | | | | | | | | | | | | | | | |
| | | | | | | | | | | | | | | | | | | | | | | | | | |
| | | | | | | | | | | | | | | | | | | | | | | | | | |
| | | | | | | | | | | | | | | | | | | | | | | | | | |
| | | | | | | | | | | | | | | | | | | | | | | | | | |
| | |
| For additional information about the fund, including its Prospectus, Statement of Additional Information, financial statements, holdings and proxy voting information, scan the QR code or visit americancentury.com/docs. |
| | |
|
| ©2025 American Century Proprietary Holdings, Inc. All rights reserved. |
A-25086687
ANNUAL SHAREHOLDER REPORT
International Growth Fund
| | | | | |
R Class (ATGRX) | November 30, 2024 |
This annual shareholder report contains important information about International Growth Fund for the period of December 1, 2023 to November 30, 2024. You can find additional information about the fund at americancentury.com/docs. You can also request this information by contacting us at 1-800-345-2021.
| | | | | | | | |
What were the fund costs for the last year? (based on a hypothetical $10,000 investment) |
|
| Costs of a $10,000 investment | Costs paid as a percentage of a $10,000 investment |
| R Class | $183 | 1.74% |
|
| | | | | |
| What were the key factors that affected the fund’s performance? |
International Growth Fund R Class returned 10.66% for the reporting period ended November 30, 2024. |
| The fund seeks capital growth. The commentary below refers to the fund's performance compared to the MSCI EAFE Index. |
| • | The fund's position in the industrials sector boosted relative performance. Holdings included the top individual contributor to relative returns, Mitsubishi Heavy Industries, a manufacturer of electricity-generating gas turbines. In the consumer discretionary sector, the fund benefited from owning travel and hospitality-related businesses and avoiding the underperforming automobiles industry. |
| • | Amid rising investment in artificial intelligence, semiconductor companies ARM Holdings and Taiwan Semiconductor Manufacturing Co. were among the top individual contributors to performance. Sportswear maker On Holding also lifted relative results. |
| • | The fund's underweight position and security selection in the financials sector weighed on relative returns. Detractors included digital payment solutions company Edenred and insurer AIA Group. Positioning in the communication services sector, most notably a stake in wireless telecommunications infrastructure and services company Cellnex Telecom, also hurt relative performance. |
| • | Notable individual detractors from relative returns included information technology consulting firm BayCurrent and Davide Campari-Milano, a producer of wine and spirits. ICON, an outsourced clinical trial and services company, and Infineon Technologies, a maker of semiconductors for the automotive and industrial sectors, also detracted. |
| | |
Cumulative Performance (based on an initial $10,000 investment) |
| November 30, 2014 through November 30, 2024 |
|
| | | | | | | | | | | | | | |
Average Annual Total Returns | |
| 1 Year | 5 Year | 10 Year | | | |
| R Class | 10.66% | 4.17% | 4.10% | | | |
| | | | | | |
| | | | | | |
| MSCI EAFE | 11.88% | 5.89% | 5.07% | | | |
| | | | | | |
| | | | | | |
| | | | | | |
| MSCI EAFE Growth | 10.95% | 5.18% | 5.76% | | | |
| | | | | | |
| | | | | | |
| | | | | | |
| | |
|
The opinions expressed are those of American Century Investments and are no guarantee of the future performance of any American Century Investments fund. This information is for educational purposes only and is not intended as investment advice. Data reflects past performance, assumes reinvestment of dividends and capital gains and is no guarantee of future results. Current performance may be higher or lower than data shown. Investment return and principal value will fluctuate and redemption value may be more or less than original cost, and none of the charts reflect the deduction of taxes that a shareholder would pay on fund distributions or the redemption of fund shares. Total returns for periods less than one year are not annualized. Visit americancentury.com for more recent performance information.
|
| | | | | |
Fund Statistics | |
| Net Assets | $2,827,786,559 |
| Management Fees (dollars paid during the reporting period) | $15,263,452 |
| Portfolio Turnover Rate | 56 | % |
| Total Number of Portfolio Holdings | 97 |
| |
| |
| | | | | | | | | | | | | | | | | | | | | | | | | | | | | | | | | | | | |
| Types of Investments in Portfolio (as a % of net assets) | | | | | | | | | | | | Top Five Countries (as a % of net assets) | | | | |
| Common Stocks | 97.8% | | | | | | | | | | | | | | | | | Japan | 21% | | | | | | |
| Short-Term Investments | 3.2% | | | | | | | | | | | | | | | | | United Kingdom | 18% | | | | | | |
| Other Assets and Liabilities | (1.0)% | | | | | | | | | | | | | | | | | France | 12% | | | | | | |
| | | | | | | | | | | | | | | | | | | Germany | 7% | | | | | | |
| | | | | | | | | | | | | | | | | | | Switzerland | 6% | | | | | | |
| | | | | | | | | | | | | | | | | | | | | | | | | | |
| | | | | | | | | | | | | | | | | | | | | | | | | | |
| | | | | | | | | | | | | | | | | | | | | | | | | | |
| | | | | | | | | | | | | | | | | | | | | | | | | | |
| | | | | | | | | | | | | | | | | | | | | | | | | | |
| | | | | | | | | | | | | | | | | | | | | | | | | | |
| | | | | | | | | | | | | | | | | | | | | | | | | | |
| | | | | | | | | | | | | | | | | | | | | | | | | | |
| | | | | | | | | | | | | | | | | | | | | | | | | | |
| | | | | | | | | | | | | | | | | | | | | | | | | | |
| | | | | | | | | | | | | | | | | | | | | | | | | | |
| | |
| For additional information about the fund, including its Prospectus, Statement of Additional Information, financial statements, holdings and proxy voting information, scan the QR code or visit americancentury.com/docs. |
| | |
|
| ©2025 American Century Proprietary Holdings, Inc. All rights reserved. |
A-25086646
ANNUAL SHAREHOLDER REPORT
International Growth Fund
| | | | | |
R5 Class (ATGGX) | November 30, 2024 |
This annual shareholder report contains important information about International Growth Fund for the period of December 1, 2023 to November 30, 2024. You can find additional information about the fund at americancentury.com/docs. You can also request this information by contacting us at 1-800-345-2021.
| | | | | | | | |
What were the fund costs for the last year? (based on a hypothetical $10,000 investment) |
|
| Costs of a $10,000 investment | Costs paid as a percentage of a $10,000 investment |
| R5 Class | $110 | 1.04% |
|
| | | | | |
| What were the key factors that affected the fund’s performance? |
International Growth Fund R5 Class returned 11.40% for the reporting period ended November 30, 2024. |
| The fund seeks capital growth. The commentary below refers to the fund's performance compared to the MSCI EAFE Index. |
| • | The fund's position in the industrials sector boosted relative performance. Holdings included the top individual contributor to relative returns, Mitsubishi Heavy Industries, a manufacturer of electricity-generating gas turbines. In the consumer discretionary sector, the fund benefited from owning travel and hospitality-related businesses and avoiding the underperforming automobiles industry. |
| • | Amid rising investment in artificial intelligence, semiconductor companies ARM Holdings and Taiwan Semiconductor Manufacturing Co. were among the top individual contributors to performance. Sportswear maker On Holding also lifted relative results. |
| • | The fund's underweight position and security selection in the financials sector weighed on relative returns. Detractors included digital payment solutions company Edenred and insurer AIA Group. Positioning in the communication services sector, most notably a stake in wireless telecommunications infrastructure and services company Cellnex Telecom, also hurt relative performance. |
| • | Notable individual detractors from relative returns included information technology consulting firm BayCurrent and Davide Campari-Milano, a producer of wine and spirits. ICON, an outsourced clinical trial and services company, and Infineon Technologies, a maker of semiconductors for the automotive and industrial sectors, also detracted. |
| | |
Cumulative Performance (based on an initial $10,000 investment) |
| April 10, 2017 through November 30, 2024 |
|
| | | | | | | | | | | | | | | | |
Average Annual Total Returns | |
| 1 Year | 5 Year | | Since Inception | Inception Date | |
| R5 Class | 11.40% | 4.89% | | 6.49% | 4/10/17 | |
| | | | | | |
| | | | | | |
| MSCI EAFE | 11.88% | 5.89% | | 6.26% | — | |
| | | | | | |
| | | | | | |
| | | | | | |
| MSCI EAFE Growth | 10.95% | 5.18% | | 6.84% | — | |
| | | | | | |
| | | | | | |
| | | | | | |
| | |
|
The opinions expressed are those of American Century Investments and are no guarantee of the future performance of any American Century Investments fund. This information is for educational purposes only and is not intended as investment advice. Data reflects past performance, assumes reinvestment of dividends and capital gains and is no guarantee of future results. Current performance may be higher or lower than data shown. Investment return and principal value will fluctuate and redemption value may be more or less than original cost, and none of the charts reflect the deduction of taxes that a shareholder would pay on fund distributions or the redemption of fund shares. Total returns for periods less than one year are not annualized. Visit americancentury.com for more recent performance information.
|
| | | | | |
Fund Statistics | |
| Net Assets | $2,827,786,559 |
| Management Fees (dollars paid during the reporting period) | $15,263,452 |
| Portfolio Turnover Rate | 56 | % |
| Total Number of Portfolio Holdings | 97 |
| |
| |
| | | | | | | | | | | | | | | | | | | | | | | | | | | | | | | | | | | | |
| Types of Investments in Portfolio (as a % of net assets) | | | | | | | | | | | | Top Five Countries (as a % of net assets) | | | | |
| Common Stocks | 97.8% | | | | | | | | | | | | | | | | | Japan | 21% | | | | | | |
| Short-Term Investments | 3.2% | | | | | | | | | | | | | | | | | United Kingdom | 18% | | | | | | |
| Other Assets and Liabilities | (1.0)% | | | | | | | | | | | | | | | | | France | 12% | | | | | | |
| | | | | | | | | | | | | | | | | | | Germany | 7% | | | | | | |
| | | | | | | | | | | | | | | | | | | Switzerland | 6% | | | | | | |
| | | | | | | | | | | | | | | | | | | | | | | | | | |
| | | | | | | | | | | | | | | | | | | | | | | | | | |
| | | | | | | | | | | | | | | | | | | | | | | | | | |
| | | | | | | | | | | | | | | | | | | | | | | | | | |
| | | | | | | | | | | | | | | | | | | | | | | | | | |
| | | | | | | | | | | | | | | | | | | | | | | | | | |
| | | | | | | | | | | | | | | | | | | | | | | | | | |
| | | | | | | | | | | | | | | | | | | | | | | | | | |
| | | | | | | | | | | | | | | | | | | | | | | | | | |
| | | | | | | | | | | | | | | | | | | | | | | | | | |
| | | | | | | | | | | | | | | | | | | | | | | | | | |
| | |
| For additional information about the fund, including its Prospectus, Statement of Additional Information, financial statements, holdings and proxy voting information, scan the QR code or visit americancentury.com/docs. |
| | |
|
| ©2025 American Century Proprietary Holdings, Inc. All rights reserved. |
A-2509A810
ANNUAL SHAREHOLDER REPORT
International Growth Fund
| | | | | |
R6 Class (ATGDX) | November 30, 2024 |
This annual shareholder report contains important information about International Growth Fund for the period of December 1, 2023 to November 30, 2024. You can find additional information about the fund at americancentury.com/docs. You can also request this information by contacting us at 1-800-345-2021.
| | | | | | | | |
What were the fund costs for the last year? (based on a hypothetical $10,000 investment) |
|
| Costs of a $10,000 investment | Costs paid as a percentage of a $10,000 investment |
| R6 Class | $94 | 0.89% |
|
| | | | | |
| What were the key factors that affected the fund’s performance? |
International Growth Fund R6 Class returned 11.56% for the reporting period ended November 30, 2024. |
| The fund seeks capital growth. The commentary below refers to the fund's performance compared to the MSCI EAFE Index. |
| • | The fund's position in the industrials sector boosted relative performance. Holdings included the top individual contributor to relative returns, Mitsubishi Heavy Industries, a manufacturer of electricity-generating gas turbines. In the consumer discretionary sector, the fund benefited from owning travel and hospitality-related businesses and avoiding the underperforming automobiles industry. |
| • | Amid rising investment in artificial intelligence, semiconductor companies ARM Holdings and Taiwan Semiconductor Manufacturing Co. were among the top individual contributors to performance. Sportswear maker On Holding also lifted relative results. |
| • | The fund's underweight position and security selection in the financials sector weighed on relative returns. Detractors included digital payment solutions company Edenred and insurer AIA Group. Positioning in the communication services sector, most notably a stake in wireless telecommunications infrastructure and services company Cellnex Telecom, also hurt relative performance. |
| • | Notable individual detractors from relative returns included information technology consulting firm BayCurrent and Davide Campari-Milano, a producer of wine and spirits. ICON, an outsourced clinical trial and services company, and Infineon Technologies, a maker of semiconductors for the automotive and industrial sectors, also detracted. |
| | |
Cumulative Performance (based on an initial $10,000 investment) |
| November 30, 2014 through November 30, 2024 |
|
| | | | | | | | | | | | | | |
Average Annual Total Returns | |
| 1 Year | 5 Year | 10 Year | | | |
| R6 Class | 11.56% | 5.03% | 4.98% | | | |
| | | | | | |
| | | | | | |
| MSCI EAFE | 11.88% | 5.89% | 5.07% | | | |
| | | | | | |
| | | | | | |
| | | | | | |
| MSCI EAFE Growth | 10.95% | 5.18% | 5.76% | | | |
| | | | | | |
| | | | | | |
| | | | | | |
| | |
|
The opinions expressed are those of American Century Investments and are no guarantee of the future performance of any American Century Investments fund. This information is for educational purposes only and is not intended as investment advice. Data reflects past performance, assumes reinvestment of dividends and capital gains and is no guarantee of future results. Current performance may be higher or lower than data shown. Investment return and principal value will fluctuate and redemption value may be more or less than original cost, and none of the charts reflect the deduction of taxes that a shareholder would pay on fund distributions or the redemption of fund shares. Total returns for periods less than one year are not annualized. Visit americancentury.com for more recent performance information.
|
| | | | | |
Fund Statistics | |
| Net Assets | $2,827,786,559 |
| Management Fees (dollars paid during the reporting period) | $15,263,452 |
| Portfolio Turnover Rate | 56 | % |
| Total Number of Portfolio Holdings | 97 |
| |
| |
| | | | | | | | | | | | | | | | | | | | | | | | | | | | | | | | | | | | |
| Types of Investments in Portfolio (as a % of net assets) | | | | | | | | | | | | Top Five Countries (as a % of net assets) | | | | |
| Common Stocks | 97.8% | | | | | | | | | | | | | | | | | Japan | 21% | | | | | | |
| Short-Term Investments | 3.2% | | | | | | | | | | | | | | | | | United Kingdom | 18% | | | | | | |
| Other Assets and Liabilities | (1.0)% | | | | | | | | | | | | | | | | | France | 12% | | | | | | |
| | | | | | | | | | | | | | | | | | | Germany | 7% | | | | | | |
| | | | | | | | | | | | | | | | | | | Switzerland | 6% | | | | | | |
| | | | | | | | | | | | | | | | | | | | | | | | | | |
| | | | | | | | | | | | | | | | | | | | | | | | | | |
| | | | | | | | | | | | | | | | | | | | | | | | | | |
| | | | | | | | | | | | | | | | | | | | | | | | | | |
| | | | | | | | | | | | | | | | | | | | | | | | | | |
| | | | | | | | | | | | | | | | | | | | | | | | | | |
| | | | | | | | | | | | | | | | | | | | | | | | | | |
| | | | | | | | | | | | | | | | | | | | | | | | | | |
| | | | | | | | | | | | | | | | | | | | | | | | | | |
| | | | | | | | | | | | | | | | | | | | | | | | | | |
| | | | | | | | | | | | | | | | | | | | | | | | | | |
| | |
| For additional information about the fund, including its Prospectus, Statement of Additional Information, financial statements, holdings and proxy voting information, scan the QR code or visit americancentury.com/docs. |
| | |
|
| ©2025 American Century Proprietary Holdings, Inc. All rights reserved. |
A-25086398
ANNUAL SHAREHOLDER REPORT
International Growth Fund
| | | | | |
G Class (ACAEX) | November 30, 2024 |
This annual shareholder report contains important information about International Growth Fund for the period of December 1, 2023 to November 30, 2024. You can find additional information about the fund at americancentury.com/docs. You can also request this information by contacting us at 1-800-345-2021.
| | | | | | | | |
What were the fund costs for the last year? (based on a hypothetical $10,000 investment) |
|
| Costs of a $10,000 investment | Costs paid as a percentage of a $10,000 investment |
| G Class | $2 | 0.02% |
|
| | | | | |
| What were the key factors that affected the fund’s performance? |
International Growth Fund G Class returned 12.54% for the reporting period ended November 30, 2024. |
| The fund seeks capital growth. The commentary below refers to the fund's performance compared to the MSCI EAFE Index. |
| • | The fund's position in the industrials sector boosted relative performance. Holdings included the top individual contributor to relative returns, Mitsubishi Heavy Industries, a manufacturer of electricity-generating gas turbines. In the consumer discretionary sector, the fund benefited from owning travel and hospitality-related businesses and avoiding the underperforming automobiles industry. |
| • | Amid rising investment in artificial intelligence, semiconductor companies ARM Holdings and Taiwan Semiconductor Manufacturing Co. were among the top individual contributors to performance. Sportswear maker On Holding also lifted relative results. |
| • | The fund's underweight position and security selection in the financials sector weighed on relative returns. Detractors included digital payment solutions company Edenred and insurer AIA Group. Positioning in the communication services sector, most notably a stake in wireless telecommunications infrastructure and services company Cellnex Telecom, also hurt relative performance. |
| • | Notable individual detractors from relative returns included information technology consulting firm BayCurrent and Davide Campari-Milano, a producer of wine and spirits. ICON, an outsourced clinical trial and services company, and Infineon Technologies, a maker of semiconductors for the automotive and industrial sectors, also detracted. |
| | |
Cumulative Performance (based on an initial $10,000 investment) |
| April 1, 2022 through November 30, 2024 |
|
| | | | | | | | | | | | | | |
Average Annual Total Returns | |
| 1 Year | | | Since Inception | Inception Date | |
| G Class | 12.54% | | | 1.91% | 4/1/22 | |
| | | | | | |
| | | | | | |
| MSCI EAFE | 11.88% | | | 5.30% | — | |
| | | | | | |
| | | | | | |
| | | | | | |
| MSCI EAFE Growth | 10.95% | | | 3.16% | — | |
| | | | | | |
| | | | | | |
| | | | | | |
| | |
|
The opinions expressed are those of American Century Investments and are no guarantee of the future performance of any American Century Investments fund. This information is for educational purposes only and is not intended as investment advice. Data reflects past performance, assumes reinvestment of dividends and capital gains and is no guarantee of future results. Current performance may be higher or lower than data shown. Investment return and principal value will fluctuate and redemption value may be more or less than original cost, and none of the charts reflect the deduction of taxes that a shareholder would pay on fund distributions or the redemption of fund shares. Total returns for periods less than one year are not annualized. Visit americancentury.com for more recent performance information.
|
| | | | | |
Fund Statistics | |
| Net Assets | $2,827,786,559 |
| Management Fees (dollars paid during the reporting period) | $15,263,452 |
| Portfolio Turnover Rate | 56 | % |
| Total Number of Portfolio Holdings | 97 |
| |
| |
| | | | | | | | | | | | | | | | | | | | | | | | | | | | | | | | | | | | |
| Types of Investments in Portfolio (as a % of net assets) | | | | | | | | | | | | Top Five Countries (as a % of net assets) | | | | |
| Common Stocks | 97.8% | | | | | | | | | | | | | | | | | Japan | 21% | | | | | | |
| Short-Term Investments | 3.2% | | | | | | | | | | | | | | | | | United Kingdom | 18% | | | | | | |
| Other Assets and Liabilities | (1.0)% | | | | | | | | | | | | | | | | | France | 12% | | | | | | |
| | | | | | | | | | | | | | | | | | | Germany | 7% | | | | | | |
| | | | | | | | | | | | | | | | | | | Switzerland | 6% | | | | | | |
| | | | | | | | | | | | | | | | | | | | | | | | | | |
| | | | | | | | | | | | | | | | | | | | | | | | | | |
| | | | | | | | | | | | | | | | | | | | | | | | | | |
| | | | | | | | | | | | | | | | | | | | | | | | | | |
| | | | | | | | | | | | | | | | | | | | | | | | | | |
| | | | | | | | | | | | | | | | | | | | | | | | | | |
| | | | | | | | | | | | | | | | | | | | | | | | | | |
| | | | | | | | | | | | | | | | | | | | | | | | | | |
| | | | | | | | | | | | | | | | | | | | | | | | | | |
| | | | | | | | | | | | | | | | | | | | | | | | | | |
| | | | | | | | | | | | | | | | | | | | | | | | | | |
| | |
| For additional information about the fund, including its Prospectus, Statement of Additional Information, financial statements, holdings and proxy voting information, scan the QR code or visit americancentury.com/docs. |
| | |
|
| ©2025 American Century Proprietary Holdings, Inc. All rights reserved. |
A-2509A737
ANNUAL SHAREHOLDER REPORT
International Opportunities Fund
| | | | | |
Investor Class (AIOIX) | November 30, 2024 |
This annual shareholder report contains important information about International Opportunities Fund for the period of December 1, 2023 to November 30, 2024. You can find additional information about the fund at americancentury.com/docs. You can also request this information by contacting us at 1-800-345-2021. This report describes changes to the fund that occurred during the reporting period.
| | | | | | | | |
What were the fund costs for the last year? (based on a hypothetical $10,000 investment) |
|
| Costs of a $10,000 investment | Costs paid as a percentage of a $10,000 investment |
| Investor Class | $162 | 1.53% |
|
| | | | | |
| What were the key factors that affected the fund’s performance? |
International Opportunities Fund Investor Class returned 12.01% for the reporting period ended November 30, 2024. |
| The fund seeks capital growth. The commentary below refers to the fund's performance relative to the MSCI ACWI ex-U.S. Small Cap Growth Index. |
| • | The consumer discretionary and information technology sectors were the leading drivers of relative performance. Sanrio, the Japan-based company behind Hello Kitty, was a notable contributor in specialty retail, along with Asics, the Japan-based shoe and activewear company, and Kalyan Jewellers India, a multinational jewelry business. |
| • | Other notable individual contributors included Pro Medicus, an Australia-based health care software company, and Max Healthcare Institute, an India-based health care company. |
| • | Relative performance was hurt by the consumer staples and communication services sectors. Japan-based Kotobuki Spirits, a maker of sweets, dragged on relative results in food products, as did JYP Entertainment, the South Korea-based music business, in entertainment. |
| • | FP Partner, an insurance and financial services firm headquartered in Japan, was another notable individual detractor from relative performance. Paladin Energy, an Australia-based uranium production company, and Taiwan-based Gold Circuit Electronics, which focuses on printed circuit boards, also lagged. |
| | |
Cumulative Performance (based on an initial $10,000 investment) |
| November 30, 2014 through November 30, 2024 |
|
| | | | | | | | | | | | | | |
Average Annual Total Returns | |
| 1 Year | 5 Year | 10 Year | | | |
| Investor Class | 12.01% | 3.00% | 4.94% | | | |
| | | | | | |
| Regulatory Index | | | | | | |
| MSCI ACWI ex USA | 13.03% | 5.40% | 4.62% | | | |
| | | | | | |
| Performance Index | | | | | | |
| MSCI ACWI ex USA Small Cap Growth | 11.62% | 5.09% | 5.74% | | | |
| | | | | | |
| | | | | | |
| | | | | | |
| | | | | | |
| | | | | | | | | | | | | | | | | |
| The regulatory index is provided as a broad measure of market performance. The performance index is provided because the advisor believes it is more reflective of the fund’s investment strategy. |
|
|
|
|
|
|
|
|
|
|
| | |
|
The opinions expressed are those of American Century Investments and are no guarantee of the future performance of any American Century Investments fund. This information is for educational purposes only and is not intended as investment advice. Data reflects past performance, assumes reinvestment of dividends and capital gains and is no guarantee of future results. Current performance may be higher or lower than data shown. Investment return and principal value will fluctuate and redemption value may be more or less than original cost, and none of the charts reflect the deduction of taxes that a shareholder would pay on fund distributions or the redemption of fund shares. Total returns for periods less than one year are not annualized. Visit americancentury.com for more recent performance information.
|
| | | | | |
Fund Statistics | |
| Net Assets | $471,323,289 |
| Management Fees (dollars paid during the reporting period) | $6,573,126 |
| Portfolio Turnover Rate | 135 | % |
| Total Number of Portfolio Holdings | 129 |
| |
| |
| | | | | | | | | | | | | | | | | | | | | | | | | | | | | | | | | | | | |
| Types of Investments in Portfolio (as a % of net assets) | | | | | | | | | | | | Top Five Countries (as a % of net assets) | | | | |
| Common Stocks | 99.6% | | | | | | | | | | | | | | | | | Japan | 20% | | | | | | |
| Exchange-Traded Funds | 0.3% | | | | | | | | | | | | | | | | | Canada | 13% | | | | | | |
| Short-Term Investments | 1.9% | | | | | | | | | | | | | | | | | India | 10% | | | | | | |
| Other Assets and Liabilities | (1.8)% | | | | | | | | | | | | | | | | | United Kingdom | 8% | | | | | | |
| | | | | | | | | | | | | | | | | | | Australia | 8% | | | | | | |
| | | | | | | | | | | | | | | | | | | | | | | | | | |
| | | | | | | | | | | | | | | | | | | | | | | | | | |
| | | | | | | | | | | | | | | | | | | | | | | | | | |
| | | | | | | | | | | | | | | | | | | | | | | | | | |
| | | | | | | | | | | | | | | | | | | | | | | | | | |
| | | | | | | | | | | | | | | | | | | | | | | | | | |
| | | | | | | | | | | | | | | | | | | | | | | | | | |
| | | | | | | | | | | | | | | | | | | | | | | | | | |
| | | | | | | | | | | | | | | | | | | | | | | | | | |
| | | | | | | | | | | | | | | | | | | | | | | | | | |
| | | | | | | | | | | | | | | | | | | | | | | | | | |
| | |
| Fund Changes |
|
|
| Beginning October 2024, the total eligible investments required to qualify for a waiver of the annual account maintenance fee changed from $10,000 to $25,000. Such fee will also be waived for any accounts for which the shareholder has elected to receive electronic delivery of all fund/account documents. |
|
|
|
|
| | |
| For additional information about the fund, including its Prospectus, Statement of Additional Information, financial statements, holdings and proxy voting information, scan the QR code or visit americancentury.com/docs. |
| | |
|
| ©2025 American Century Proprietary Holdings, Inc. All rights reserved. |
A-25086745
ANNUAL SHAREHOLDER REPORT
International Opportunities Fund
| | | | | |
| I Class (ACIOX) | November 30, 2024 |
This annual shareholder report contains important information about International Opportunities Fund for the period of December 1, 2023 to November 30, 2024. You can find additional information about the fund at americancentury.com/docs. You can also request this information by contacting us at 1-800-345-2021.
| | | | | | | | |
What were the fund costs for the last year? (based on a hypothetical $10,000 investment) |
|
| Costs of a $10,000 investment | Costs paid as a percentage of a $10,000 investment |
| I Class | $141 | 1.33% |
|
| | | | | |
| What were the key factors that affected the fund’s performance? |
International Opportunities Fund I Class returned 12.27% for the reporting period ended November 30, 2024. |
| The fund seeks capital growth. The commentary below refers to the fund's performance relative to the MSCI ACWI ex-U.S. Small Cap Growth Index. |
| • | The consumer discretionary and information technology sectors were the leading drivers of relative performance. Sanrio, the Japan-based company behind Hello Kitty, was a notable contributor in specialty retail, along with Asics, the Japan-based shoe and activewear company, and Kalyan Jewellers India, a multinational jewelry business. |
| • | Other notable individual contributors included Pro Medicus, an Australia-based health care software company, and Max Healthcare Institute, an India-based health care company. |
| • | Relative performance was hurt by the consumer staples and communication services sectors. Japan-based Kotobuki Spirits, a maker of sweets, dragged on relative results in food products, as did JYP Entertainment, the South Korea-based music business, in entertainment. |
| • | FP Partner, an insurance and financial services firm headquartered in Japan, was another notable individual detractor from relative performance. Paladin Energy, an Australia-based uranium production company, and Taiwan-based Gold Circuit Electronics, which focuses on printed circuit boards, also lagged. |
| | |
Cumulative Performance (based on an initial $10,000 investment) |
| November 30, 2014 through November 30, 2024 |
|
| | | | | | | | | | | | | | |
Average Annual Total Returns | |
| 1 Year | 5 Year | 10 Year | | | |
| I Class | 12.27% | 3.20% | 5.13% | | | |
| | | | | | |
| Regulatory Index | | | | | | |
| MSCI ACWI ex USA | 13.03% | 5.40% | 4.62% | | | |
| | | | | | |
| Performance Index | | | | | | |
| MSCI ACWI ex USA Small Cap Growth | 11.62% | 5.09% | 5.74% | | | |
| | | | | | |
| | | | | | |
| | | | | | |
| | | | | | |
| | | | | | | | | | | | | | | | | |
| The regulatory index is provided as a broad measure of market performance. The performance index is provided because the advisor believes it is more reflective of the fund’s investment strategy. |
|
|
|
|
|
|
|
|
|
|
| | |
|
The opinions expressed are those of American Century Investments and are no guarantee of the future performance of any American Century Investments fund. This information is for educational purposes only and is not intended as investment advice. Data reflects past performance, assumes reinvestment of dividends and capital gains and is no guarantee of future results. Current performance may be higher or lower than data shown. Investment return and principal value will fluctuate and redemption value may be more or less than original cost, and none of the charts reflect the deduction of taxes that a shareholder would pay on fund distributions or the redemption of fund shares. Total returns for periods less than one year are not annualized. Visit americancentury.com for more recent performance information.
|
| | | | | |
Fund Statistics | |
| Net Assets | $471,323,289 |
| Management Fees (dollars paid during the reporting period) | $6,573,126 |
| Portfolio Turnover Rate | 135 | % |
| Total Number of Portfolio Holdings | 129 |
| |
| |
| | | | | | | | | | | | | | | | | | | | | | | | | | | | | | | | | | | | |
| Types of Investments in Portfolio (as a % of net assets) | | | | | | | | | | | | Top Five Countries (as a % of net assets) | | | | |
| Common Stocks | 99.6% | | | | | | | | | | | | | | | | | Japan | 20% | | | | | | |
| Exchange-Traded Funds | 0.3% | | | | | | | | | | | | | | | | | Canada | 13% | | | | | | |
| Short-Term Investments | 1.9% | | | | | | | | | | | | | | | | | India | 10% | | | | | | |
| Other Assets and Liabilities | (1.8)% | | | | | | | | | | | | | | | | | United Kingdom | 8% | | | | | | |
| | | | | | | | | | | | | | | | | | | Australia | 8% | | | | | | |
| | | | | | | | | | | | | | | | | | | | | | | | | | |
| | | | | | | | | | | | | | | | | | | | | | | | | | |
| | | | | | | | | | | | | | | | | | | | | | | | | | |
| | | | | | | | | | | | | | | | | | | | | | | | | | |
| | | | | | | | | | | | | | | | | | | | | | | | | | |
| | | | | | | | | | | | | | | | | | | | | | | | | | |
| | | | | | | | | | | | | | | | | | | | | | | | | | |
| | | | | | | | | | | | | | | | | | | | | | | | | | |
| | | | | | | | | | | | | | | | | | | | | | | | | | |
| | | | | | | | | | | | | | | | | | | | | | | | | | |
| | | | | | | | | | | | | | | | | | | | | | | | | | |
| | |
| For additional information about the fund, including its Prospectus, Statement of Additional Information, financial statements, holdings and proxy voting information, scan the QR code or visit americancentury.com/docs. |
| | |
|
| ©2025 American Century Proprietary Holdings, Inc. All rights reserved. |
A-25086737
ANNUAL SHAREHOLDER REPORT
International Opportunities Fund
| | | | | |
| A Class (AIVOX) | November 30, 2024 |
This annual shareholder report contains important information about International Opportunities Fund for the period of December 1, 2023 to November 30, 2024. You can find additional information about the fund at americancentury.com/docs. You can also request this information by contacting us at 1-800-345-2021.
| | | | | | | | |
What were the fund costs for the last year? (based on a hypothetical $10,000 investment) |
|
| Costs of a $10,000 investment | Costs paid as a percentage of a $10,000 investment |
| A Class | $188 | 1.78% |
|
| | | | | |
| What were the key factors that affected the fund’s performance? |
International Opportunities Fund A Class returned 11.71% for the reporting period ended November 30, 2024. |
| The fund seeks capital growth. The commentary below refers to the fund's performance relative to the MSCI ACWI ex-U.S. Small Cap Growth Index. |
| • | The consumer discretionary and information technology sectors were the leading drivers of relative performance. Sanrio, the Japan-based company behind Hello Kitty, was a notable contributor in specialty retail, along with Asics, the Japan-based shoe and activewear company, and Kalyan Jewellers India, a multinational jewelry business. |
| • | Other notable individual contributors included Pro Medicus, an Australia-based health care software company, and Max Healthcare Institute, an India-based health care company. |
| • | Relative performance was hurt by the consumer staples and communication services sectors. Japan-based Kotobuki Spirits, a maker of sweets, dragged on relative results in food products, as did JYP Entertainment, the South Korea-based music business, in entertainment. |
| • | FP Partner, an insurance and financial services firm headquartered in Japan, was another notable individual detractor from relative performance. Paladin Energy, an Australia-based uranium production company, and Taiwan-based Gold Circuit Electronics, which focuses on printed circuit boards, also lagged. |
| | |
Cumulative Performance (based on an initial $10,000 investment) |
| November 30, 2014 through November 30, 2024 |
| The initial investment is adjusted to reflect the maximum initial sales charge. |
| | | | | | | | | | | | | | |
Average Annual Total Returns | |
| 1 Year | 5 Year | 10 Year | | | |
| A Class | 11.71% | 2.75% | 4.68% | | | |
| A Class - with sales charge | 5.29% | 1.54% | 4.06% | | | |
| Regulatory Index | | | | | | |
| MSCI ACWI ex USA | 13.03% | 5.40% | 4.62% | | | |
| | | | | | |
| Performance Index | | | | | | |
| MSCI ACWI ex USA Small Cap Growth | 11.62% | 5.09% | 5.74% | | | |
| | | | | | |
| | | | | | |
| | | | | | |
| | | | | | |
| | | | | | | | | | | | | | | | | |
| The regulatory index is provided as a broad measure of market performance. The performance index is provided because the advisor believes it is more reflective of the fund’s investment strategy. |
| A Class shares have a 5.75% maximum initial sales charge and may be subject to a maximum contingent deferred sales charge of 1.00%. |
|
|
|
|
|
|
|
|
|
| | |
|
The opinions expressed are those of American Century Investments and are no guarantee of the future performance of any American Century Investments fund. This information is for educational purposes only and is not intended as investment advice. Data reflects past performance, assumes reinvestment of dividends and capital gains and is no guarantee of future results. Current performance may be higher or lower than data shown. Investment return and principal value will fluctuate and redemption value may be more or less than original cost, and none of the charts reflect the deduction of taxes that a shareholder would pay on fund distributions or the redemption of fund shares. Total returns for periods less than one year are not annualized. Visit americancentury.com for more recent performance information.
|
| | | | | |
Fund Statistics | |
| Net Assets | $471,323,289 |
| Management Fees (dollars paid during the reporting period) | $6,573,126 |
| Portfolio Turnover Rate | 135 | % |
| Total Number of Portfolio Holdings | 129 |
| |
| |
| | | | | | | | | | | | | | | | | | | | | | | | | | | | | | | | | | | | |
| Types of Investments in Portfolio (as a % of net assets) | | | | | | | | | | | | Top Five Countries (as a % of net assets) | | | | |
| Common Stocks | 99.6% | | | | | | | | | | | | | | | | | Japan | 20% | | | | | | |
| Exchange-Traded Funds | 0.3% | | | | | | | | | | | | | | | | | Canada | 13% | | | | | | |
| Short-Term Investments | 1.9% | | | | | | | | | | | | | | | | | India | 10% | | | | | | |
| Other Assets and Liabilities | (1.8)% | | | | | | | | | | | | | | | | | United Kingdom | 8% | | | | | | |
| | | | | | | | | | | | | | | | | | | Australia | 8% | | | | | | |
| | | | | | | | | | | | | | | | | | | | | | | | | | |
| | | | | | | | | | | | | | | | | | | | | | | | | | |
| | | | | | | | | | | | | | | | | | | | | | | | | | |
| | | | | | | | | | | | | | | | | | | | | | | | | | |
| | | | | | | | | | | | | | | | | | | | | | | | | | |
| | | | | | | | | | | | | | | | | | | | | | | | | | |
| | | | | | | | | | | | | | | | | | | | | | | | | | |
| | | | | | | | | | | | | | | | | | | | | | | | | | |
| | | | | | | | | | | | | | | | | | | | | | | | | | |
| | | | | | | | | | | | | | | | | | | | | | | | | | |
| | | | | | | | | | | | | | | | | | | | | | | | | | |
| | |
| For additional information about the fund, including its Prospectus, Statement of Additional Information, financial statements, holdings and proxy voting information, scan the QR code or visit americancentury.com/docs. |
| | |
|
| ©2025 American Century Proprietary Holdings, Inc. All rights reserved. |
A-25086455
ANNUAL SHAREHOLDER REPORT
International Opportunities Fund
| | | | | |
| C Class (AIOCX) | November 30, 2024 |
This annual shareholder report contains important information about International Opportunities Fund for the period of December 1, 2023 to November 30, 2024. You can find additional information about the fund at americancentury.com/docs. You can also request this information by contacting us at 1-800-345-2021.
| | | | | | | | |
What were the fund costs for the last year? (based on a hypothetical $10,000 investment) |
|
| Costs of a $10,000 investment | Costs paid as a percentage of a $10,000 investment |
| C Class | $267 | 2.53% |
|
| | | | | |
| What were the key factors that affected the fund’s performance? |
International Opportunities Fund C Class returned 10.88% for the reporting period ended November 30, 2024. |
| The fund seeks capital growth. The commentary below refers to the fund's performance relative to the MSCI ACWI ex-U.S. Small Cap Growth Index. |
| • | The consumer discretionary and information technology sectors were the leading drivers of relative performance. Sanrio, the Japan-based company behind Hello Kitty, was a notable contributor in specialty retail, along with Asics, the Japan-based shoe and activewear company, and Kalyan Jewellers India, a multinational jewelry business. |
| • | Other notable individual contributors included Pro Medicus, an Australia-based health care software company, and Max Healthcare Institute, an India-based health care company. |
| • | Relative performance was hurt by the consumer staples and communication services sectors. Japan-based Kotobuki Spirits, a maker of sweets, dragged on relative results in food products, as did JYP Entertainment, the South Korea-based music business, in entertainment. |
| • | FP Partner, an insurance and financial services firm headquartered in Japan, was another notable individual detractor from relative performance. Paladin Energy, an Australia-based uranium production company, and Taiwan-based Gold Circuit Electronics, which focuses on printed circuit boards, also lagged. |
| | |
Cumulative Performance (based on an initial $10,000 investment) |
| November 30, 2014 through November 30, 2024 |
|
| | | | | | | | | | | | | | |
Average Annual Total Returns | |
| 1 Year | 5 Year | 10 Year | | | |
| C Class | 10.88% | 1.99% | 3.89% | | | |
| | | | | | |
| Regulatory Index | | | | | | |
| MSCI ACWI ex USA | 13.03% | 5.40% | 4.62% | | | |
| | | | | | |
| Performance Index | | | | | | |
| MSCI ACWI ex USA Small Cap Growth | 11.62% | 5.09% | 5.74% | | | |
| | | | | | |
| | | | | | |
| | | | | | |
| | | | | | |
| | | | | | | | | | | | | | | | | |
| The regulatory index is provided as a broad measure of market performance. The performance index is provided because the advisor believes it is more reflective of the fund’s investment strategy. |
|
|
|
|
| C Class shares will automatically convert to A Class shares after being held for approximately eight years. C Class average annual returns do not reflect this conversion. |
|
|
|
|
|
| | |
|
The opinions expressed are those of American Century Investments and are no guarantee of the future performance of any American Century Investments fund. This information is for educational purposes only and is not intended as investment advice. Data reflects past performance, assumes reinvestment of dividends and capital gains and is no guarantee of future results. Current performance may be higher or lower than data shown. Investment return and principal value will fluctuate and redemption value may be more or less than original cost, and none of the charts reflect the deduction of taxes that a shareholder would pay on fund distributions or the redemption of fund shares. Total returns for periods less than one year are not annualized. Visit americancentury.com for more recent performance information.
|
| | | | | |
Fund Statistics | |
| Net Assets | $471,323,289 |
| Management Fees (dollars paid during the reporting period) | $6,573,126 |
| Portfolio Turnover Rate | 135 | % |
| Total Number of Portfolio Holdings | 129 |
| |
| |
| | | | | | | | | | | | | | | | | | | | | | | | | | | | | | | | | | | | |
| Types of Investments in Portfolio (as a % of net assets) | | | | | | | | | | | | Top Five Countries (as a % of net assets) | | | | |
| Common Stocks | 99.6% | | | | | | | | | | | | | | | | | Japan | 20% | | | | | | |
| Exchange-Traded Funds | 0.3% | | | | | | | | | | | | | | | | | Canada | 13% | | | | | | |
| Short-Term Investments | 1.9% | | | | | | | | | | | | | | | | | India | 10% | | | | | | |
| Other Assets and Liabilities | (1.8)% | | | | | | | | | | | | | | | | | United Kingdom | 8% | | | | | | |
| | | | | | | | | | | | | | | | | | | Australia | 8% | | | | | | |
| | | | | | | | | | | | | | | | | | | | | | | | | | |
| | | | | | | | | | | | | | | | | | | | | | | | | | |
| | | | | | | | | | | | | | | | | | | | | | | | | | |
| | | | | | | | | | | | | | | | | | | | | | | | | | |
| | | | | | | | | | | | | | | | | | | | | | | | | | |
| | | | | | | | | | | | | | | | | | | | | | | | | | |
| | | | | | | | | | | | | | | | | | | | | | | | | | |
| | | | | | | | | | | | | | | | | | | | | | | | | | |
| | | | | | | | | | | | | | | | | | | | | | | | | | |
| | | | | | | | | | | | | | | | | | | | | | | | | | |
| | | | | | | | | | | | | | | | | | | | | | | | | | |
| | |
| For additional information about the fund, including its Prospectus, Statement of Additional Information, financial statements, holdings and proxy voting information, scan the QR code or visit americancentury.com/docs. |
| | |
|
| ©2025 American Century Proprietary Holdings, Inc. All rights reserved. |
A-25086448
ANNUAL SHAREHOLDER REPORT
International Opportunities Fund
| | | | | |
| R Class (AIORX) | November 30, 2024 |
This annual shareholder report contains important information about International Opportunities Fund for the period of December 1, 2023 to November 30, 2024. You can find additional information about the fund at americancentury.com/docs. You can also request this information by contacting us at 1-800-345-2021.
| | | | | | | | |
What were the fund costs for the last year? (based on a hypothetical $10,000 investment) |
|
| Costs of a $10,000 investment | Costs paid as a percentage of a $10,000 investment |
| R Class | $215 | 2.03% |
|
| | | | | |
| What were the key factors that affected the fund’s performance? |
International Opportunities Fund R Class returned 11.46% for the reporting period ended November 30, 2024. |
| The fund seeks capital growth. The commentary below refers to the fund's performance relative to the MSCI ACWI ex-U.S. Small Cap Growth Index. |
| • | The consumer discretionary and information technology sectors were the leading drivers of relative performance. Sanrio, the Japan-based company behind Hello Kitty, was a notable contributor in specialty retail, along with Asics, the Japan-based shoe and activewear company, and Kalyan Jewellers India, a multinational jewelry business. |
| • | Other notable individual contributors included Pro Medicus, an Australia-based health care software company, and Max Healthcare Institute, an India-based health care company. |
| • | Relative performance was hurt by the consumer staples and communication services sectors. Japan-based Kotobuki Spirits, a maker of sweets, dragged on relative results in food products, as did JYP Entertainment, the South Korea-based music business, in entertainment. |
| • | FP Partner, an insurance and financial services firm headquartered in Japan, was another notable individual detractor from relative performance. Paladin Energy, an Australia-based uranium production company, and Taiwan-based Gold Circuit Electronics, which focuses on printed circuit boards, also lagged. |
| | |
Cumulative Performance (based on an initial $10,000 investment) |
| November 30, 2014 through November 30, 2024 |
|
| | | | | | | | | | | | | | |
Average Annual Total Returns | |
| 1 Year | 5 Year | 10 Year | | | |
| R Class | 11.46% | 2.49% | 4.40% | | | |
| | | | | | |
| Regulatory Index | | | | | | |
| MSCI ACWI ex USA | 13.03% | 5.40% | 4.62% | | | |
| | | | | | |
| Performance Index | | | | | | |
| MSCI ACWI ex USA Small Cap Growth | 11.62% | 5.09% | 5.74% | | | |
| | | | | | |
| | | | | | |
| | | | | | |
| | | | | | |
| | | | | | | | | | | | | | | | | |
| The regulatory index is provided as a broad measure of market performance. The performance index is provided because the advisor believes it is more reflective of the fund’s investment strategy. |
|
|
|
|
|
|
|
|
|
|
| | |
|
The opinions expressed are those of American Century Investments and are no guarantee of the future performance of any American Century Investments fund. This information is for educational purposes only and is not intended as investment advice. Data reflects past performance, assumes reinvestment of dividends and capital gains and is no guarantee of future results. Current performance may be higher or lower than data shown. Investment return and principal value will fluctuate and redemption value may be more or less than original cost, and none of the charts reflect the deduction of taxes that a shareholder would pay on fund distributions or the redemption of fund shares. Total returns for periods less than one year are not annualized. Visit americancentury.com for more recent performance information.
|
| | | | | |
Fund Statistics | |
| Net Assets | $471,323,289 |
| Management Fees (dollars paid during the reporting period) | $6,573,126 |
| Portfolio Turnover Rate | 135 | % |
| Total Number of Portfolio Holdings | 129 |
| |
| |
| | | | | | | | | | | | | | | | | | | | | | | | | | | | | | | | | | | | |
| Types of Investments in Portfolio (as a % of net assets) | | | | | | | | | | | | Top Five Countries (as a % of net assets) | | | | |
| Common Stocks | 99.6% | | | | | | | | | | | | | | | | | Japan | 20% | | | | | | |
| Exchange-Traded Funds | 0.3% | | | | | | | | | | | | | | | | | Canada | 13% | | | | | | |
| Short-Term Investments | 1.9% | | | | | | | | | | | | | | | | | India | 10% | | | | | | |
| Other Assets and Liabilities | (1.8)% | | | | | | | | | | | | | | | | | United Kingdom | 8% | | | | | | |
| | | | | | | | | | | | | | | | | | | Australia | 8% | | | | | | |
| | | | | | | | | | | | | | | | | | | | | | | | | | |
| | | | | | | | | | | | | | | | | | | | | | | | | | |
| | | | | | | | | | | | | | | | | | | | | | | | | | |
| | | | | | | | | | | | | | | | | | | | | | | | | | |
| | | | | | | | | | | | | | | | | | | | | | | | | | |
| | | | | | | | | | | | | | | | | | | | | | | | | | |
| | | | | | | | | | | | | | | | | | | | | | | | | | |
| | | | | | | | | | | | | | | | | | | | | | | | | | |
| | | | | | | | | | | | | | | | | | | | | | | | | | |
| | | | | | | | | | | | | | | | | | | | | | | | | | |
| | | | | | | | | | | | | | | | | | | | | | | | | | |
| | |
| For additional information about the fund, including its Prospectus, Statement of Additional Information, financial statements, holdings and proxy voting information, scan the QR code or visit americancentury.com/docs. |
| | |
|
| ©2025 American Century Proprietary Holdings, Inc. All rights reserved. |
A-25086430
ANNUAL SHAREHOLDER REPORT
International Small-Mid Cap Fund
| | | | | |
Investor Class (ANTSX) | November 30, 2024 |
This annual shareholder report contains important information about International Small-Mid Cap Fund for the period of December 1, 2023 to November 30, 2024. You can find additional information about the fund at americancentury.com/docs. You can also request this information by contacting us at 1-800-345-2021. This report describes changes to the fund that occurred during the reporting period.
| | | | | | | | |
What were the fund costs for the last year? (based on a hypothetical $10,000 investment) |
|
| Costs of a $10,000 investment | Costs paid as a percentage of a $10,000 investment |
| Investor Class | $154 | 1.43% |
|
| | | | | |
| What were the key factors that affected the fund’s performance? |
International Small-Mid Cap Fund Investor Class returned 15.45% for the reporting period ended November 30, 2024. |
| The fund seeks capital growth. The commentary below refers to the fund's performance compared to the MSCI EAFE Small Cap Index. |
| • | The consumer discretionary sector was a leading contributor to relative performance, benefiting from results in specialty retail. A position in Sanrio, the Japan-based business behind Hello Kitty and other characters, helped. Industrials also contributed to relative performance. |
| • | Notable individual contributors included Asics, the Japan-based shoe and activewear company, and Pro Medicus, the Australia-based health care software business. Holding AtkinsRealis Group, a Canada-based engineering services and nuclear energy company, also helped. |
| • | The consumer staples sector weighed on relative performance, particularly in the food products industry. Japan-based Yamazaki Baking and Kotobuki Spirits, a Japan-based sweets maker, lagged. The energy sector also detracted from relative results. |
| • | Other individual detractors included Paladin Energy, an Australia-based uranium production company, and Amvis Holdings, a Japan-based health care company. Micronics Japan, a company involved in semiconductor testing and measurement, was another detractor. |
| | |
Cumulative Performance (based on an initial $10,000 investment) |
| March 19, 2015 through November 30, 2024 |
|
| | | | | | | | | | | | | | | | |
Average Annual Total Returns | |
| 1 Year | 5 Year | | Since Inception | Inception Date | |
| Investor Class | 15.45% | 4.28% | | 4.87% | 3/19/15 | |
| | | | | | |
| Regulatory Index | | | | | | |
| MSCI EAFE | 11.88% | 5.89% | | 5.10% | — | |
| | | | | | |
| Performance Index | | | | | | |
| MSCI EAFE Small Cap | 11.81% | 3.66% | | 5.46% | — | |
| | | | | | |
| | | | | | |
| | | | | | |
| | | | | | |
| | | | | | | | | | | | | | | | | |
| The regulatory index is provided as a broad measure of market performance. The performance index is provided because the advisor believes it is more reflective of the fund’s investment strategy. |
|
|
|
|
|
|
|
|
|
|
| | |
|
The opinions expressed are those of American Century Investments and are no guarantee of the future performance of any American Century Investments fund. This information is for educational purposes only and is not intended as investment advice. Data reflects past performance, assumes reinvestment of dividends and capital gains and is no guarantee of future results. Current performance may be higher or lower than data shown. Investment return and principal value will fluctuate and redemption value may be more or less than original cost, and none of the charts reflect the deduction of taxes that a shareholder would pay on fund distributions or the redemption of fund shares. Total returns for periods less than one year are not annualized. Visit americancentury.com for more recent performance information.
|
| | | | | |
Fund Statistics | |
| Net Assets | $548,584,736 |
| Management Fees (dollars paid during the reporting period) | $1,307,903 |
| Portfolio Turnover Rate | 109 | % |
| Total Number of Portfolio Holdings | 123 |
| |
| |
| | | | | | | | | | | | | | | | | | | | | | | | | | | | | | | | | | | | |
| Types of Investments in Portfolio (as a % of net assets) | | | | | | | | | | | | Top Five Countries (as a % of net assets) | | | | |
| Common Stocks | 98.4% | | | | | | | | | | | | | | | | | Japan | 29% | | | | | | |
| Exchange-Traded Funds | 0.6% | | | | | | | | | | | | | | | | | Australia | 14% | | | | | | |
| Short-Term Investments | 3.5% | | | | | | | | | | | | | | | | | United Kingdom | 12% | | | | | | |
| Other Assets and Liabilities | (2.5)% | | | | | | | | | | | | | | | | | Canada | 11% | | | | | | |
| | | | | | | | | | | | | | | | | | | Sweden | 5% | | | | | | |
| | | | | | | | | | | | | | | | | | | | | | | | | | |
| | | | | | | | | | | | | | | | | | | | | | | | | | |
| | | | | | | | | | | | | | | | | | | | | | | | | | |
| | | | | | | | | | | | | | | | | | | | | | | | | | |
| | | | | | | | | | | | | | | | | | | | | | | | | | |
| | | | | | | | | | | | | | | | | | | | | | | | | | |
| | | | | | | | | | | | | | | | | | | | | | | | | | |
| | | | | | | | | | | | | | | | | | | | | | | | | | |
| | | | | | | | | | | | | | | | | | | | | | | | | | |
| | | | | | | | | | | | | | | | | | | | | | | | | | |
| | | | | | | | | | | | | | | | | | | | | | | | | | |
| | |
| Fund Changes |
|
|
| Beginning October 2024, the total eligible investments required to qualify for a waiver of the annual account maintenance fee changed from $10,000 to $25,000. Such fee will also be waived for any accounts for which the shareholder has elected to receive electronic delivery of all fund/account documents. |
|
|
|
|
| | |
| For additional information about the fund, including its Prospectus, Statement of Additional Information, financial statements, holdings and proxy voting information, scan the QR code or visit americancentury.com/docs. |
| | |
|
| ©2025 American Century Proprietary Holdings, Inc. All rights reserved. |
A-25086323
ANNUAL SHAREHOLDER REPORT
International Small-Mid Cap Fund
| | | | | |
G Class (ANTMX) | November 30, 2024 |
This annual shareholder report contains important information about International Small-Mid Cap Fund for the period of December 1, 2023 to November 30, 2024. You can find additional information about the fund at americancentury.com/docs. You can also request this information by contacting us at 1-800-345-2021.
| | | | | | | | |
What were the fund costs for the last year? (based on a hypothetical $10,000 investment) |
|
| Costs of a $10,000 investment | Costs paid as a percentage of a $10,000 investment |
| G Class | $1 | 0.01% |
|
| | | | | |
| What were the key factors that affected the fund’s performance? |
International Small-Mid Cap Fund G Class returned 17.12% for the reporting period ended November 30, 2024. |
| The fund seeks capital growth. The commentary below refers to the fund's performance compared to the MSCI EAFE Small Cap Index. |
| • | The consumer discretionary sector was a leading contributor to relative performance, benefiting from results in specialty retail. A position in Sanrio, the Japan-based business behind Hello Kitty and other characters, helped. Industrials also contributed to relative performance. |
| • | Notable individual contributors included Asics, the Japan-based shoe and activewear company, and Pro Medicus, the Australia-based health care software business. Holding AtkinsRealis Group, a Canada-based engineering services and nuclear energy company, also helped. |
| • | The consumer staples sector weighed on relative performance, particularly in the food products industry. Japan-based Yamazaki Baking and Kotobuki Spirits, a Japan-based sweets maker, lagged. The energy sector also detracted from relative results. |
| • | Other individual detractors included Paladin Energy, an Australia-based uranium production company, and Amvis Holdings, a Japan-based health care company. Micronics Japan, a company involved in semiconductor testing and measurement, was another detractor. |
| | |
Cumulative Performance (based on an initial $10,000 investment) |
| March 19, 2015 through November 30, 2024 |
|
| | | | | | | | | | | | | | | | |
Average Annual Total Returns | |
| 1 Year | 5 Year | | Since Inception | Inception Date | |
| G Class | 17.12% | 5.78% | | 6.07% | 3/19/15 | |
| | | | | | |
| Regulatory Index | | | | | | |
| MSCI EAFE | 11.88% | 5.89% | | 5.10% | — | |
| | | | | | |
| Performance Index | | | | | | |
| MSCI EAFE Small Cap | 11.81% | 3.66% | | 5.46% | — | |
| | | | | | |
| | | | | | |
| | | | | | |
| | | | | | |
| | | | | | | | | | | | | | | | | |
| The regulatory index is provided as a broad measure of market performance. The performance index is provided because the advisor believes it is more reflective of the fund’s investment strategy. |
|
|
|
|
|
|
|
|
|
|
| | |
|
The opinions expressed are those of American Century Investments and are no guarantee of the future performance of any American Century Investments fund. This information is for educational purposes only and is not intended as investment advice. Data reflects past performance, assumes reinvestment of dividends and capital gains and is no guarantee of future results. Current performance may be higher or lower than data shown. Investment return and principal value will fluctuate and redemption value may be more or less than original cost, and none of the charts reflect the deduction of taxes that a shareholder would pay on fund distributions or the redemption of fund shares. Total returns for periods less than one year are not annualized. Visit americancentury.com for more recent performance information.
|
| | | | | |
Fund Statistics | |
| Net Assets | $548,584,736 |
| Management Fees (dollars paid during the reporting period) | $1,307,903 |
| Portfolio Turnover Rate | 109 | % |
| Total Number of Portfolio Holdings | 123 |
| |
| |
| | | | | | | | | | | | | | | | | | | | | | | | | | | | | | | | | | | | |
| Types of Investments in Portfolio (as a % of net assets) | | | | | | | | | | | | Top Five Countries (as a % of net assets) | | | | |
| Common Stocks | 98.4% | | | | | | | | | | | | | | | | | Japan | 29% | | | | | | |
| Exchange-Traded Funds | 0.6% | | | | | | | | | | | | | | | | | Australia | 14% | | | | | | |
| Short-Term Investments | 3.5% | | | | | | | | | | | | | | | | | United Kingdom | 12% | | | | | | |
| Other Assets and Liabilities | (2.5)% | | | | | | | | | | | | | | | | | Canada | 11% | | | | | | |
| | | | | | | | | | | | | | | | | | | Sweden | 5% | | | | | | |
| | | | | | | | | | | | | | | | | | | | | | | | | | |
| | | | | | | | | | | | | | | | | | | | | | | | | | |
| | | | | | | | | | | | | | | | | | | | | | | | | | |
| | | | | | | | | | | | | | | | | | | | | | | | | | |
| | | | | | | | | | | | | | | | | | | | | | | | | | |
| | | | | | | | | | | | | | | | | | | | | | | | | | |
| | | | | | | | | | | | | | | | | | | | | | | | | | |
| | | | | | | | | | | | | | | | | | | | | | | | | | |
| | | | | | | | | | | | | | | | | | | | | | | | | | |
| | | | | | | | | | | | | | | | | | | | | | | | | | |
| | | | | | | | | | | | | | | | | | | | | | | | | | |
| | |
| For additional information about the fund, including its Prospectus, Statement of Additional Information, financial statements, holdings and proxy voting information, scan the QR code or visit americancentury.com/docs. |
| | |
|
| ©2025 American Century Proprietary Holdings, Inc. All rights reserved. |
A-25086315
ANNUAL SHAREHOLDER REPORT
International Value Fund
| | | | | |
| Investor Class (ACEVX) | November 30, 2024 |
This annual shareholder report contains important information about International Value Fund for the period of December 1, 2023 to November 30, 2024. You can find additional information about the fund at americancentury.com/docs. You can also request this information by contacting us at 1-800-345-2021. This report describes changes to the fund that occurred during the reporting period.
| | | | | | | | |
What were the fund costs for the last year? (based on a hypothetical $10,000 investment) |
|
| Costs of a $10,000 investment | Costs paid as a percentage of a $10,000 investment |
| Investor Class | $117 | 1.11% |
|
| | | | | |
| What were the key factors that affected the fund’s performance? |
International Value Fund Investor Class returned 11.57% for the reporting period ended November 30, 2024. |
| The fund seeks long-term capital growth. The commentary below refers to the fund's performance relative to the MSCI EAFE Value Index. |
| • | Positioning in the financials sector contributed most to performance, led by holdings among insurance and bank stocks. Three of the top five individual contributors were banks, which benefited from global central bank rate cuts, improving bank lending profitability. Insurers enjoyed strong underwriting performance and profitability. |
| • | The health care sector was another source of strength, led by stock choices in the pharmaceuticals and health care equipment and supplies industries. The leading contributor in the sector was Belgium-based pharmaceutical company UCB, which reported positive clinical trial results and drug approvals. |
| • | Materials stocks were the leading detractors from performance, reflecting positioning among metals and mining, chemicals and construction materials companies. Stock choices and an overweight position in this poor-performing sector hurt relative results. These stocks lagged amid slow economic growth and poor pricing for many industrial metals. |
| • | Elsewhere, the communication services and information technology (IT) sectors underperformed. In communication services, positioning in wireless telecommunication services firms detracted most. Stock selection among semiconductors and semiconductor equipment companies was the main source of weakness in IT. |
| | |
Cumulative Performance (based on an initial $10,000 investment) |
| November 30, 2014 through November 30, 2024 |
|
| | | | | | | | | | | | | | |
Average Annual Total Returns | |
| 1 Year | 5 Year | 10 Year | | | |
| Investor Class | 11.57% | 6.75% | 3.25% | | | |
| | | | | | |
| Regulatory Index | | | | | | |
| MSCI EAFE | 11.88% | 5.89% | 5.07% | | | |
| | | | | | |
| Performance Index | | | | | | |
| MSCI EAFE Value | 12.86% | 6.23% | 4.14% | | | |
| | | | | | |
| | | | | | |
| | | | | | |
| | | | | | |
| | | | | | | | | | | | | | | | | |
| The regulatory index is provided as a broad measure of market performance. The performance index is provided because the advisor believes it is more reflective of the fund’s investment strategy. |
|
|
|
|
|
|
|
|
|
|
| | |
|
The opinions expressed are those of American Century Investments and are no guarantee of the future performance of any American Century Investments fund. This information is for educational purposes only and is not intended as investment advice. Data reflects past performance, assumes reinvestment of dividends and capital gains and is no guarantee of future results. Current performance may be higher or lower than data shown. Investment return and principal value will fluctuate and redemption value may be more or less than original cost, and none of the charts reflect the deduction of taxes that a shareholder would pay on fund distributions or the redemption of fund shares. Total returns for periods less than one year are not annualized. Visit americancentury.com for more recent performance information.
|
| | | | | |
Fund Statistics | |
| Net Assets | $1,475,316,751 |
| Management Fees (dollars paid during the reporting period) | $2,533,691 |
| Portfolio Turnover Rate | 68 | % |
| Total Number of Portfolio Holdings | 163 |
| |
| |
| | | | | | | | | | | | | | | | | | | | | | | | | | | | | | | | | | | | |
| Types of Investments in Portfolio (as a % of net assets) | | | | | | | | | | | | Top Five Countries (as a % of net assets) | | | | |
| Common Stocks | 97.7% | | | | | | | | | | | | | | | | | United Kingdom | 20% | | | | | | |
| Short-Term Investments | 2.2% | | | | | | | | | | | | | | | | | Japan | 19% | | | | | | |
| Other Assets and Liabilities | 0.1% | | | | | | | | | | | | | | | | | France | 12% | | | | | | |
| | | | | | | | | | | | | | | | | | | Germany | 9% | | | | | | |
| | | | | | | | | | | | | | | | | | | Switzerland | 7% | | | | | | |
| | | | | | | | | | | | | | | | | | | | | | | | | | |
| | | | | | | | | | | | | | | | | | | | | | | | | | |
| | | | | | | | | | | | | | | | | | | | | | | | | | |
| | | | | | | | | | | | | | | | | | | | | | | | | | |
| | | | | | | | | | | | | | | | | | | | | | | | | | |
| | | | | | | | | | | | | | | | | | | | | | | | | | |
| | | | | | | | | | | | | | | | | | | | | | | | | | |
| | | | | | | | | | | | | | | | | | | | | | | | | | |
| | | | | | | | | | | | | | | | | | | | | | | | | | |
| | | | | | | | | | | | | | | | | | | | | | | | | | |
| | | | | | | | | | | | | | | | | | | | | | | | | | |
| | |
| Fund Changes |
|
|
| Beginning October 2024, the total eligible investments required to qualify for a waiver of the annual account maintenance fee changed from $10,000 to $25,000. Such fee will also be waived for any accounts for which the shareholder has elected to receive electronic delivery of all fund/account documents. |
|
|
|
|
| | |
| For additional information about the fund, including its Prospectus, Statement of Additional Information, financial statements, holdings and proxy voting information, scan the QR code or visit americancentury.com/docs. |
| | |
|
| ©2025 American Century Proprietary Holdings, Inc. All rights reserved. |
A-25086588
ANNUAL SHAREHOLDER REPORT
International Value Fund
| | | | | |
| I Class (ACVUX) | November 30, 2024 |
This annual shareholder report contains important information about International Value Fund for the period of December 1, 2023 to November 30, 2024. You can find additional information about the fund at americancentury.com/docs. You can also request this information by contacting us at 1-800-345-2021.
| | | | | | | | |
What were the fund costs for the last year? (based on a hypothetical $10,000 investment) |
|
| Costs of a $10,000 investment | Costs paid as a percentage of a $10,000 investment |
| I Class | $96 | 0.91% |
|
| | | | | |
| What were the key factors that affected the fund’s performance? |
International Value Fund I Class returned 11.69% for the reporting period ended November 30, 2024. |
| The fund seeks long-term capital growth. The commentary below refers to the fund's performance relative to the MSCI EAFE Value Index. |
| • | Positioning in the financials sector contributed most to performance, led by holdings among insurance and bank stocks. Three of the top five individual contributors were banks, which benefited from global central bank rate cuts, improving bank lending profitability. Insurers enjoyed strong underwriting performance and profitability. |
| • | The health care sector was another source of strength, led by stock choices in the pharmaceuticals and health care equipment and supplies industries. The leading contributor in the sector was Belgium-based pharmaceutical company UCB, which reported positive clinical trial results and drug approvals. |
| • | Materials stocks were the leading detractors from performance, reflecting positioning among metals and mining, chemicals and construction materials companies. Stock choices and an overweight position in this poor-performing sector hurt relative results. These stocks lagged amid slow economic growth and poor pricing for many industrial metals. |
| • | Elsewhere, the communication services and information technology (IT) sectors underperformed. In communication services, positioning in wireless telecommunication services firms detracted most. Stock selection among semiconductors and semiconductor equipment companies was the main source of weakness in IT. |
| | |
Cumulative Performance (based on an initial $10,000 investment) |
| November 30, 2014 through November 30, 2024 |
|
| | | | | | | | | | | | | | |
Average Annual Total Returns | |
| 1 Year | 5 Year | 10 Year | | | |
| I Class | 11.69% | 6.95% | 3.44% | | | |
| | | | | | |
| Regulatory Index | | | | | | |
| MSCI EAFE | 11.88% | 5.89% | 5.07% | | | |
| | | | | | |
| Performance Index | | | | | | |
| MSCI EAFE Value | 12.86% | 6.23% | 4.14% | | | |
| | | | | | |
| | | | | | |
| | | | | | |
| | | | | | |
| | | | | | | | | | | | | | | | | |
| The regulatory index is provided as a broad measure of market performance. The performance index is provided because the advisor believes it is more reflective of the fund’s investment strategy. |
|
|
|
|
|
|
|
|
|
|
| | |
|
The opinions expressed are those of American Century Investments and are no guarantee of the future performance of any American Century Investments fund. This information is for educational purposes only and is not intended as investment advice. Data reflects past performance, assumes reinvestment of dividends and capital gains and is no guarantee of future results. Current performance may be higher or lower than data shown. Investment return and principal value will fluctuate and redemption value may be more or less than original cost, and none of the charts reflect the deduction of taxes that a shareholder would pay on fund distributions or the redemption of fund shares. Total returns for periods less than one year are not annualized. Visit americancentury.com for more recent performance information.
|
| | | | | |
Fund Statistics | |
| Net Assets | $1,475,316,751 |
| Management Fees (dollars paid during the reporting period) | $2,533,691 |
| Portfolio Turnover Rate | 68 | % |
| Total Number of Portfolio Holdings | 163 |
| |
| |
| | | | | | | | | | | | | | | | | | | | | | | | | | | | | | | | | | | | |
| Types of Investments in Portfolio (as a % of net assets) | | | | | | | | | | | | Top Five Countries (as a % of net assets) | | | | |
| Common Stocks | 97.7% | | | | | | | | | | | | | | | | | United Kingdom | 20% | | | | | | |
| Short-Term Investments | 2.2% | | | | | | | | | | | | | | | | | Japan | 19% | | | | | | |
| Other Assets and Liabilities | 0.1% | | | | | | | | | | | | | | | | | France | 12% | | | | | | |
| | | | | | | | | | | | | | | | | | | Germany | 9% | | | | | | |
| | | | | | | | | | | | | | | | | | | Switzerland | 7% | | | | | | |
| | | | | | | | | | | | | | | | | | | | | | | | | | |
| | | | | | | | | | | | | | | | | | | | | | | | | | |
| | | | | | | | | | | | | | | | | | | | | | | | | | |
| | | | | | | | | | | | | | | | | | | | | | | | | | |
| | | | | | | | | | | | | | | | | | | | | | | | | | |
| | | | | | | | | | | | | | | | | | | | | | | | | | |
| | | | | | | | | | | | | | | | | | | | | | | | | | |
| | | | | | | | | | | | | | | | | | | | | | | | | | |
| | | | | | | | | | | | | | | | | | | | | | | | | | |
| | | | | | | | | | | | | | | | | | | | | | | | | | |
| | | | | | | | | | | | | | | | | | | | | | | | | | |
| | |
| For additional information about the fund, including its Prospectus, Statement of Additional Information, financial statements, holdings and proxy voting information, scan the QR code or visit americancentury.com/docs. |
| | |
|
| ©2025 American Century Proprietary Holdings, Inc. All rights reserved. |
A-25086570
ANNUAL SHAREHOLDER REPORT
International Value Fund
| | | | | |
| A Class (MEQAX) | November 30, 2024 |
This annual shareholder report contains important information about International Value Fund for the period of December 1, 2023 to November 30, 2024. You can find additional information about the fund at americancentury.com/docs. You can also request this information by contacting us at 1-800-345-2021.
| | | | | | | | |
What were the fund costs for the last year? (based on a hypothetical $10,000 investment) |
|
| Costs of a $10,000 investment | Costs paid as a percentage of a $10,000 investment |
| A Class | $144 | 1.36% |
|
| | | | | |
| What were the key factors that affected the fund’s performance? |
International Value Fund A Class returned 11.21% for the reporting period ended November 30, 2024. |
| The fund seeks long-term capital growth. The commentary below refers to the fund's performance relative to the MSCI EAFE Value Index. |
| • | Positioning in the financials sector contributed most to performance, led by holdings among insurance and bank stocks. Three of the top five individual contributors were banks, which benefited from global central bank rate cuts, improving bank lending profitability. Insurers enjoyed strong underwriting performance and profitability. |
| • | The health care sector was another source of strength, led by stock choices in the pharmaceuticals and health care equipment and supplies industries. The leading contributor in the sector was Belgium-based pharmaceutical company UCB, which reported positive clinical trial results and drug approvals. |
| • | Materials stocks were the leading detractors from performance, reflecting positioning among metals and mining, chemicals and construction materials companies. Stock choices and an overweight position in this poor-performing sector hurt relative results. These stocks lagged amid slow economic growth and poor pricing for many industrial metals. |
| • | Elsewhere, the communication services and information technology (IT) sectors underperformed. In communication services, positioning in wireless telecommunication services firms detracted most. Stock selection among semiconductors and semiconductor equipment companies was the main source of weakness in IT. |
| | |
Cumulative Performance (based on an initial $10,000 investment) |
November 30, 2014, through November 30, 2024 |
| The initial investment is adjusted to reflect the maximum initial sales charge. |
| | | | | | | | | | | | | | |
Average Annual Total Returns | |
| 1 Year | 5 Year | 10 Year | | | |
| A Class | 11.21% | 6.47% | 2.99% | | | |
| A Class - with sales charge | 4.82% | 5.21% | 2.38% | | | |
| Regulatory Index | | | | | | |
| MSCI EAFE | 11.88% | 5.89% | 5.07% | | | |
| | | | | | |
| Performance Index | | | | | | |
| MSCI EAFE Value | 12.86% | 6.23% | 4.14% | | | |
| | | | | | |
| | | | | | |
| | | | | | |
| | | | | | |
| | | | | | | | | | | | | | | | | |
| The regulatory index is provided as a broad measure of market performance. The performance index is provided because the advisor believes it is more reflective of the fund’s investment strategy. |
| A Class shares have a 5.75% maximum initial sales charge and may be subject to a maximum contingent deferred sales charge of 1.00%. |
|
|
|
|
|
|
|
|
|
| | |
|
The opinions expressed are those of American Century Investments and are no guarantee of the future performance of any American Century Investments fund. This information is for educational purposes only and is not intended as investment advice. Data reflects past performance, assumes reinvestment of dividends and capital gains and is no guarantee of future results. Current performance may be higher or lower than data shown. Investment return and principal value will fluctuate and redemption value may be more or less than original cost, and none of the charts reflect the deduction of taxes that a shareholder would pay on fund distributions or the redemption of fund shares. Total returns for periods less than one year are not annualized. Visit americancentury.com for more recent performance information.
|
| | | | | |
Fund Statistics | |
| Net Assets | $1,475,316,751 |
| Management Fees (dollars paid during the reporting period) | $2,533,691 |
| Portfolio Turnover Rate | 68 | % |
| Total Number of Portfolio Holdings | 163 |
| |
| |
| | | | | | | | | | | | | | | | | | | | | | | | | | | | | | | | | | | | |
| Types of Investments in Portfolio (as a % of net assets) | | | | | | | | | | | | Top Five Countries (as a % of net assets) | | | | |
| Common Stocks | 97.7% | | | | | | | | | | | | | | | | | United Kingdom | 20% | | | | | | |
| Short-Term Investments | 2.2% | | | | | | | | | | | | | | | | | Japan | 19% | | | | | | |
| Other Assets and Liabilities | 0.1% | | | | | | | | | | | | | | | | | France | 12% | | | | | | |
| | | | | | | | | | | | | | | | | | | Germany | 9% | | | | | | |
| | | | | | | | | | | | | | | | | | | Switzerland | 7% | | | | | | |
| | | | | | | | | | | | | | | | | | | | | | | | | | |
| | | | | | | | | | | | | | | | | | | | | | | | | | |
| | | | | | | | | | | | | | | | | | | | | | | | | | |
| | | | | | | | | | | | | | | | | | | | | | | | | | |
| | | | | | | | | | | | | | | | | | | | | | | | | | |
| | | | | | | | | | | | | | | | | | | | | | | | | | |
| | | | | | | | | | | | | | | | | | | | | | | | | | |
| | | | | | | | | | | | | | | | | | | | | | | | | | |
| | | | | | | | | | | | | | | | | | | | | | | | | | |
| | | | | | | | | | | | | | | | | | | | | | | | | | |
| | | | | | | | | | | | | | | | | | | | | | | | | | |
| | |
| For additional information about the fund, including its Prospectus, Statement of Additional Information, financial statements, holdings and proxy voting information, scan the QR code or visit americancentury.com/docs. |
| | |
|
| ©2025 American Century Proprietary Holdings, Inc. All rights reserved. |
A-25086562
ANNUAL SHAREHOLDER REPORT
International Value Fund
| | | | | |
| C Class (ACCOX) | November 30, 2024 |
This annual shareholder report contains important information about International Value Fund for the period of December 1, 2023 to November 30, 2024. You can find additional information about the fund at americancentury.com/docs. You can also request this information by contacting us at 1-800-345-2021.
| | | | | | | | |
What were the fund costs for the last year? (based on a hypothetical $10,000 investment) |
|
| Costs of a $10,000 investment | Costs paid as a percentage of a $10,000 investment |
| C Class | $222 | 2.11% |
|
| | | | | |
| What were the key factors that affected the fund’s performance? |
International Value Fund C Class returned 10.32% for the reporting period ended November 30, 2024. |
| The fund seeks long-term capital growth. The commentary below refers to the fund's performance relative to the MSCI EAFE Value Index. |
| • | Positioning in the financials sector contributed most to performance, led by holdings among insurance and bank stocks. Three of the top five individual contributors were banks, which benefited from global central bank rate cuts, improving bank lending profitability. Insurers enjoyed strong underwriting performance and profitability. |
| • | The health care sector was another source of strength, led by stock choices in the pharmaceuticals and health care equipment and supplies industries. The leading contributor in the sector was Belgium-based pharmaceutical company UCB, which reported positive clinical trial results and drug approvals. |
| • | Materials stocks were the leading detractors from performance, reflecting positioning among metals and mining, chemicals and construction materials companies. Stock choices and an overweight position in this poor-performing sector hurt relative results. These stocks lagged amid slow economic growth and poor pricing for many industrial metals. |
| • | Elsewhere, the communication services and information technology (IT) sectors underperformed. In communication services, positioning in wireless telecommunication services firms detracted most. Stock selection among semiconductors and semiconductor equipment companies was the main source of weakness in IT. |
| | |
Cumulative Performance (based on an initial $10,000 investment) |
| November 30, 2014 through November 30, 2024 |
|
| | | | | | | | | | | | | | |
Average Annual Total Returns | |
| 1 Year | 5 Year | 10 Year | | | |
| C Class | 10.32% | 5.68% | 2.22% | | | |
| | | | | | |
| Regulatory Index | | | | | | |
| MSCI EAFE | 11.88% | 5.89% | 5.07% | | | |
| | | | | | |
| Performance Index | | | | | | |
| MSCI EAFE Value | 12.86% | 6.23% | 4.14% | | | |
| | | | | | |
| | | | | | |
| | | | | | |
| | | | | | |
| | | | | | | | | | | | | | | | | |
| The regulatory index is provided as a broad measure of market performance. The performance index is provided because the advisor believes it is more reflective of the fund’s investment strategy. |
|
|
|
|
| C Class shares will automatically convert to A Class shares after being held for approximately eight years. C Class average annual returns do not reflect this conversion. |
|
|
|
|
|
| | |
|
The opinions expressed are those of American Century Investments and are no guarantee of the future performance of any American Century Investments fund. This information is for educational purposes only and is not intended as investment advice. Data reflects past performance, assumes reinvestment of dividends and capital gains and is no guarantee of future results. Current performance may be higher or lower than data shown. Investment return and principal value will fluctuate and redemption value may be more or less than original cost, and none of the charts reflect the deduction of taxes that a shareholder would pay on fund distributions or the redemption of fund shares. Total returns for periods less than one year are not annualized. Visit americancentury.com for more recent performance information.
|
| | | | | |
Fund Statistics | |
| Net Assets | $1,475,316,751 |
| Management Fees (dollars paid during the reporting period) | $2,533,691 |
| Portfolio Turnover Rate | 68 | % |
| Total Number of Portfolio Holdings | 163 |
| |
| |
| | | | | | | | | | | | | | | | | | | | | | | | | | | | | | | | | | | | |
| Types of Investments in Portfolio (as a % of net assets) | | | | | | | | | | | | Top Five Countries (as a % of net assets) | | | | |
| Common Stocks | 97.7% | | | | | | | | | | | | | | | | | United Kingdom | 20% | | | | | | |
| Short-Term Investments | 2.2% | | | | | | | | | | | | | | | | | Japan | 19% | | | | | | |
| Other Assets and Liabilities | 0.1% | | | | | | | | | | | | | | | | | France | 12% | | | | | | |
| | | | | | | | | | | | | | | | | | | Germany | 9% | | | | | | |
| | | | | | | | | | | | | | | | | | | Switzerland | 7% | | | | | | |
| | | | | | | | | | | | | | | | | | | | | | | | | | |
| | | | | | | | | | | | | | | | | | | | | | | | | | |
| | | | | | | | | | | | | | | | | | | | | | | | | | |
| | | | | | | | | | | | | | | | | | | | | | | | | | |
| | | | | | | | | | | | | | | | | | | | | | | | | | |
| | | | | | | | | | | | | | | | | | | | | | | | | | |
| | | | | | | | | | | | | | | | | | | | | | | | | | |
| | | | | | | | | | | | | | | | | | | | | | | | | | |
| | | | | | | | | | | | | | | | | | | | | | | | | | |
| | | | | | | | | | | | | | | | | | | | | | | | | | |
| | | | | | | | | | | | | | | | | | | | | | | | | | |
| | |
| For additional information about the fund, including its Prospectus, Statement of Additional Information, financial statements, holdings and proxy voting information, scan the QR code or visit americancentury.com/docs. |
| | |
|
| ©2025 American Century Proprietary Holdings, Inc. All rights reserved. |
A-25086547
ANNUAL SHAREHOLDER REPORT
International Value Fund
| | | | | |
| R Class (ACVRX) | November 30, 2024 |
This annual shareholder report contains important information about International Value Fund for the period of December 1, 2023 to November 30, 2024. You can find additional information about the fund at americancentury.com/docs. You can also request this information by contacting us at 1-800-345-2021.
| | | | | | | | |
What were the fund costs for the last year? (based on a hypothetical $10,000 investment) |
|
| Costs of a $10,000 investment | Costs paid as a percentage of a $10,000 investment |
| R Class | $170 | 1.61% |
|
| | | | | |
| What were the key factors that affected the fund’s performance? |
International Value Fund R Class returned 11.00% for the reporting period ended November 30, 2024. |
| The fund seeks long-term capital growth. The commentary below refers to the fund's performance relative to the MSCI EAFE Value Index. |
| • | Positioning in the financials sector contributed most to performance, led by holdings among insurance and bank stocks. Three of the top five individual contributors were banks, which benefited from global central bank rate cuts, improving bank lending profitability. Insurers enjoyed strong underwriting performance and profitability. |
| • | The health care sector was another source of strength, led by stock choices in the pharmaceuticals and health care equipment and supplies industries. The leading contributor in the sector was Belgium-based pharmaceutical company UCB, which reported positive clinical trial results and drug approvals. |
| • | Materials stocks were the leading detractors from performance, reflecting positioning among metals and mining, chemicals and construction materials companies. Stock choices and an overweight position in this poor-performing sector hurt relative results. These stocks lagged amid slow economic growth and poor pricing for many industrial metals. |
| • | Elsewhere, the communication services and information technology (IT) sectors underperformed. In communication services, positioning in wireless telecommunication services firms detracted most. Stock selection among semiconductors and semiconductor equipment companies was the main source of weakness in IT. |
| | |
Cumulative Performance (based on an initial $10,000 investment) |
| November 30, 2014 through November 30, 2024 |
|
| | | | | | | | | | | | | | |
Average Annual Total Returns | |
| 1 Year | 5 Year | 10 Year | | | |
| R Class | 11.00% | 6.21% | 2.74% | | | |
| | | | | | |
| Regulatory Index | | | | | | |
| MSCI EAFE | 11.88% | 5.89% | 5.07% | | | |
| | | | | | |
| Performance Index | | | | | | |
| MSCI EAFE Value | 12.86% | 6.23% | 4.14% | | | |
| | | | | | |
| | | | | | |
| | | | | | |
| | | | | | |
| | | | | | | | | | | | | | | | | |
| The regulatory index is provided as a broad measure of market performance. The performance index is provided because the advisor believes it is more reflective of the fund’s investment strategy. |
|
|
|
|
|
|
|
|
|
|
| | |
|
The opinions expressed are those of American Century Investments and are no guarantee of the future performance of any American Century Investments fund. This information is for educational purposes only and is not intended as investment advice. Data reflects past performance, assumes reinvestment of dividends and capital gains and is no guarantee of future results. Current performance may be higher or lower than data shown. Investment return and principal value will fluctuate and redemption value may be more or less than original cost, and none of the charts reflect the deduction of taxes that a shareholder would pay on fund distributions or the redemption of fund shares. Total returns for periods less than one year are not annualized. Visit americancentury.com for more recent performance information.
|
| | | | | |
Fund Statistics | |
| Net Assets | $1,475,316,751 |
| Management Fees (dollars paid during the reporting period) | $2,533,691 |
| Portfolio Turnover Rate | 68 | % |
| Total Number of Portfolio Holdings | 163 |
| |
| |
| | | | | | | | | | | | | | | | | | | | | | | | | | | | | | | | | | | | |
| Types of Investments in Portfolio (as a % of net assets) | | | | | | | | | | | | Top Five Countries (as a % of net assets) | | | | |
| Common Stocks | 97.7% | | | | | | | | | | | | | | | | | United Kingdom | 20% | | | | | | |
| Short-Term Investments | 2.2% | | | | | | | | | | | | | | | | | Japan | 19% | | | | | | |
| Other Assets and Liabilities | 0.1% | | | | | | | | | | | | | | | | | France | 12% | | | | | | |
| | | | | | | | | | | | | | | | | | | Germany | 9% | | | | | | |
| | | | | | | | | | | | | | | | | | | Switzerland | 7% | | | | | | |
| | | | | | | | | | | | | | | | | | | | | | | | | | |
| | | | | | | | | | | | | | | | | | | | | | | | | | |
| | | | | | | | | | | | | | | | | | | | | | | | | | |
| | | | | | | | | | | | | | | | | | | | | | | | | | |
| | | | | | | | | | | | | | | | | | | | | | | | | | |
| | | | | | | | | | | | | | | | | | | | | | | | | | |
| | | | | | | | | | | | | | | | | | | | | | | | | | |
| | | | | | | | | | | | | | | | | | | | | | | | | | |
| | | | | | | | | | | | | | | | | | | | | | | | | | |
| | | | | | | | | | | | | | | | | | | | | | | | | | |
| | | | | | | | | | | | | | | | | | | | | | | | | | |
| | |
| For additional information about the fund, including its Prospectus, Statement of Additional Information, financial statements, holdings and proxy voting information, scan the QR code or visit americancentury.com/docs. |
| | |
|
| ©2025 American Century Proprietary Holdings, Inc. All rights reserved. |
A-25086539
ANNUAL SHAREHOLDER REPORT
International Value Fund
| | | | | |
| R6 Class (ACVDX) | November 30, 2024 |
This annual shareholder report contains important information about International Value Fund for the period of December 1, 2023 to November 30, 2024. You can find additional information about the fund at americancentury.com/docs. You can also request this information by contacting us at 1-800-345-2021.
| | | | | | | | |
What were the fund costs for the last year? (based on a hypothetical $10,000 investment) |
|
| Costs of a $10,000 investment | Costs paid as a percentage of a $10,000 investment |
| R6 Class | $81 | 0.76% |
|
| | | | | |
| What were the key factors that affected the fund’s performance? |
International Value Fund R6 Class returned 11.86% for the reporting period ended November 30, 2024. |
| The fund seeks long-term capital growth. The commentary below refers to the fund's performance relative to the MSCI EAFE Value Index. |
| • | Positioning in the financials sector contributed most to performance, led by holdings among insurance and bank stocks. Three of the top five individual contributors were banks, which benefited from global central bank rate cuts, improving bank lending profitability. Insurers enjoyed strong underwriting performance and profitability. |
| • | The health care sector was another source of strength, led by stock choices in the pharmaceuticals and health care equipment and supplies industries. The leading contributor in the sector was Belgium-based pharmaceutical company UCB, which reported positive clinical trial results and drug approvals. |
| • | Materials stocks were the leading detractors from performance, reflecting positioning among metals and mining, chemicals and construction materials companies. Stock choices and an overweight position in this poor-performing sector hurt relative results. These stocks lagged amid slow economic growth and poor pricing for many industrial metals. |
| • | Elsewhere, the communication services and information technology (IT) sectors underperformed. In communication services, positioning in wireless telecommunication services firms detracted most. Stock selection among semiconductors and semiconductor equipment companies was the main source of weakness in IT. |
| | |
Cumulative Performance (based on an initial $10,000 investment) |
| November 30, 2014 through November 30, 2024 |
|
| | | | | | | | | | | | | | |
Average Annual Total Returns | |
| 1 Year | 5 Year | 10 Year | | | |
| R6 Class | 11.86% | 7.13% | 3.61% | | | |
| | | | | | |
| Regulatory Index | | | | | | |
| MSCI EAFE | 11.88% | 5.89% | 5.07% | | | |
| | | | | | |
| Performance Index | | | | | | |
| MSCI EAFE Value | 12.86% | 6.23% | 4.14% | | | |
| | | | | | |
| | | | | | |
| | | | | | |
| | | | | | |
| | | | | | | | | | | | | | | | | |
| The regulatory index is provided as a broad measure of market performance. The performance index is provided because the advisor believes it is more reflective of the fund’s investment strategy. |
|
|
|
|
|
|
|
|
|
|
| | |
|
The opinions expressed are those of American Century Investments and are no guarantee of the future performance of any American Century Investments fund. This information is for educational purposes only and is not intended as investment advice. Data reflects past performance, assumes reinvestment of dividends and capital gains and is no guarantee of future results. Current performance may be higher or lower than data shown. Investment return and principal value will fluctuate and redemption value may be more or less than original cost, and none of the charts reflect the deduction of taxes that a shareholder would pay on fund distributions or the redemption of fund shares. Total returns for periods less than one year are not annualized. Visit americancentury.com for more recent performance information.
|
| | | | | |
Fund Statistics | |
| Net Assets | $1,475,316,751 |
| Management Fees (dollars paid during the reporting period) | $2,533,691 |
| Portfolio Turnover Rate | 68 | % |
| Total Number of Portfolio Holdings | 163 |
| |
| |
| | | | | | | | | | | | | | | | | | | | | | | | | | | | | | | | | | | | |
| Types of Investments in Portfolio (as a % of net assets) | | | | | | | | | | | | Top Five Countries (as a % of net assets) | | | | |
| Common Stocks | 97.7% | | | | | | | | | | | | | | | | | United Kingdom | 20% | | | | | | |
| Short-Term Investments | 2.2% | | | | | | | | | | | | | | | | | Japan | 19% | | | | | | |
| Other Assets and Liabilities | 0.1% | | | | | | | | | | | | | | | | | France | 12% | | | | | | |
| | | | | | | | | | | | | | | | | | | Germany | 9% | | | | | | |
| | | | | | | | | | | | | | | | | | | Switzerland | 7% | | | | | | |
| | | | | | | | | | | | | | | | | | | | | | | | | | |
| | | | | | | | | | | | | | | | | | | | | | | | | | |
| | | | | | | | | | | | | | | | | | | | | | | | | | |
| | | | | | | | | | | | | | | | | | | | | | | | | | |
| | | | | | | | | | | | | | | | | | | | | | | | | | |
| | | | | | | | | | | | | | | | | | | | | | | | | | |
| | | | | | | | | | | | | | | | | | | | | | | | | | |
| | | | | | | | | | | | | | | | | | | | | | | | | | |
| | | | | | | | | | | | | | | | | | | | | | | | | | |
| | | | | | | | | | | | | | | | | | | | | | | | | | |
| | | | | | | | | | | | | | | | | | | | | | | | | | |
| | |
| For additional information about the fund, including its Prospectus, Statement of Additional Information, financial statements, holdings and proxy voting information, scan the QR code or visit americancentury.com/docs. |
| | |
|
| ©2025 American Century Proprietary Holdings, Inc. All rights reserved. |
A-25086380
ANNUAL SHAREHOLDER REPORT
International Value Fund
| | | | | |
| G Class (ACAFX) | November 30, 2024 |
This annual shareholder report contains important information about International Value Fund for the period of December 1, 2023 to November 30, 2024. You can find additional information about the fund at americancentury.com/docs. You can also request this information by contacting us at 1-800-345-2021.
| | | | | | | | |
What were the fund costs for the last year? (based on a hypothetical $10,000 investment) |
|
| Costs of a $10,000 investment | Costs paid as a percentage of a $10,000 investment |
| G Class | $1 | 0.01% |
|
| | | | | |
| What were the key factors that affected the fund’s performance? |
International Value Fund G Class returned 12.63% for the reporting period ended November 30, 2024. |
| The fund seeks long-term capital growth. The commentary below refers to the fund's performance relative to the MSCI EAFE Value Index. |
| • | Positioning in the financials sector contributed most to performance, led by holdings among insurance and bank stocks. Three of the top five individual contributors were banks, which benefited from global central bank rate cuts, improving bank lending profitability. Insurers enjoyed strong underwriting performance and profitability. |
| • | The health care sector was another source of strength, led by stock choices in the pharmaceuticals and health care equipment and supplies industries. The leading contributor in the sector was Belgium-based pharmaceutical company UCB, which reported positive clinical trial results and drug approvals. |
| • | Materials stocks were the leading detractors from performance, reflecting positioning among metals and mining, chemicals and construction materials companies. Stock choices and an overweight position in this poor-performing sector hurt relative results. These stocks lagged amid slow economic growth and poor pricing for many industrial metals. |
| • | Elsewhere, the communication services and information technology (IT) sectors underperformed. In communication services, positioning in wireless telecommunication services firms detracted most. Stock selection among semiconductors and semiconductor equipment companies was the main source of weakness in IT. |
| | |
Cumulative Performance (based on an initial $10,000 investment) |
| April 1, 2022 through November 30, 2024 |
|
| | | | | | | | | | | | | | |
Average Annual Total Returns | |
| 1 Year | | | Since Inception | Inception Date | |
| G Class | 12.63% | | | 7.32% | 4/1/22 | |
| | | | | | |
| Regulatory Index | | | | | | |
| MSCI EAFE | 11.88% | | | 5.30% | — | |
| | | | | | |
| Performance Index | | | | | | |
| MSCI EAFE Value | 12.86% | | | 7.35% | — | |
| | | | | | |
| | | | | | |
| | | | | | |
| | | | | | |
| | | | | | | | | | | | | | | | | |
| The regulatory index is provided as a broad measure of market performance. The performance index is provided because the advisor believes it is more reflective of the fund’s investment strategy. |
|
|
|
|
|
|
|
|
|
|
| | |
|
The opinions expressed are those of American Century Investments and are no guarantee of the future performance of any American Century Investments fund. This information is for educational purposes only and is not intended as investment advice. Data reflects past performance, assumes reinvestment of dividends and capital gains and is no guarantee of future results. Current performance may be higher or lower than data shown. Investment return and principal value will fluctuate and redemption value may be more or less than original cost, and none of the charts reflect the deduction of taxes that a shareholder would pay on fund distributions or the redemption of fund shares. Total returns for periods less than one year are not annualized. Visit americancentury.com for more recent performance information.
|
| | | | | |
Fund Statistics | |
| Net Assets | $1,475,316,751 |
| Management Fees (dollars paid during the reporting period) | $2,533,691 |
| Portfolio Turnover Rate | 68 | % |
| Total Number of Portfolio Holdings | 163 |
| |
| |
| | | | | | | | | | | | | | | | | | | | | | | | | | | | | | | | | | | | |
| Types of Investments in Portfolio (as a % of net assets) | | | | | | | | | | | | Top Five Countries (as a % of net assets) | | | | |
| Common Stocks | 97.7% | | | | | | | | | | | | | | | | | United Kingdom | 20% | | | | | | |
| Short-Term Investments | 2.2% | | | | | | | | | | | | | | | | | Japan | 19% | | | | | | |
| Other Assets and Liabilities | 0.1% | | | | | | | | | | | | | | | | | France | 12% | | | | | | |
| | | | | | | | | | | | | | | | | | | Germany | 9% | | | | | | |
| | | | | | | | | | | | | | | | | | | Switzerland | 7% | | | | | | |
| | | | | | | | | | | | | | | | | | | | | | | | | | |
| | | | | | | | | | | | | | | | | | | | | | | | | | |
| | | | | | | | | | | | | | | | | | | | | | | | | | |
| | | | | | | | | | | | | | | | | | | | | | | | | | |
| | | | | | | | | | | | | | | | | | | | | | | | | | |
| | | | | | | | | | | | | | | | | | | | | | | | | | |
| | | | | | | | | | | | | | | | | | | | | | | | | | |
| | | | | | | | | | | | | | | | | | | | | | | | | | |
| | | | | | | | | | | | | | | | | | | | | | | | | | |
| | | | | | | | | | | | | | | | | | | | | | | | | | |
| | | | | | | | | | | | | | | | | | | | | | | | | | |
| | |
| For additional information about the fund, including its Prospectus, Statement of Additional Information, financial statements, holdings and proxy voting information, scan the QR code or visit americancentury.com/docs. |
| | |
|
| ©2025 American Century Proprietary Holdings, Inc. All rights reserved. |
A-2509A745
ANNUAL SHAREHOLDER REPORT
Non-U.S. Intrinsic Value Fund
| | | | | |
| Investor Class (ANTUX) | November 30, 2024 |
This annual shareholder report contains important information about Non-U.S. Intrinsic Value Fund for the period of December 1, 2023 to November 30, 2024. You can find additional information about the fund at americancentury.com/docs. You can also request this information by contacting us at 1-800-345-2021. This report describes changes to the fund that occurred during the reporting period.
| | | | | | | | |
What were the fund costs for the last year? (based on a hypothetical $10,000 investment) |
|
| Costs of a $10,000 investment | Costs paid as a percentage of a $10,000 investment |
| Investor Class | $121 | 1.17% |
|
| | | | | |
| What were the key factors that affected the fund’s performance? |
Non-U.S. Intrinsic Value Fund Investor Class returned 7.28% for the reporting period ended November 30, 2024. |
| The fund seeks capital appreciation. The commentary below refers to the fund's performance relative to the MSCI ACWI ex-U.S. Index. |
| • | Global equities broadly advanced during an extended bull market propelled by enthusiasm for artificial intelligence-related stocks. Many central banks cut interest rates, giving investors added confidence. Japan’s cyclical rebound and China’s weak economy made for an uneven landscape for companies trading at significant discounts to their intrinsic value. |
| • | Security selection in the information technology sector weighed on performance during the period. The portfolio is broadly underweight in the sector, so a lack of exposure to several names in the semiconductors, software and IT services industries detracted from results. A holding in SUMCO, a silicon wafer producer in Japan, detracted as it faces near-term cyclical headwinds. |
| • | Choices of investments in the industrials sector also amounted to a drag on performance. Certain holdings in the professional services and electrical equipment industries underperformed, while not owning certain names in those same industries also weighed on results. |
| • | The interaction effect was a positive contributor to performance. In particular, interaction in consumer staples helped results. Allocation in the tobacco industry helped as well. An overweight position in British American Tobacco aided performance as the U.K.-based company likely faces fewer anticipated regulatory burdens in the U.S. |
| | |
Cumulative Performance (based on an initial $10,000 investment) |
| December 6, 2018 through November 30, 2024 |
|
| | | | | | | | | | | | | | | | |
Average Annual Total Returns | |
| 1 Year | 5 Year | | Since Inception | Inception Date | |
| Investor Class | 7.28% | 2.78% | | 3.42% | 12/6/18 | |
| | | | | | |
| | | | | | |
| | | | | | |
| | | | | | |
| | | | | | |
| MSCI ACWI ex USA | 13.03% | 5.40% | | 6.81% | — | |
| | | | | | |
| | | | | | |
| | | | | | |
| | | | | | |
| | |
|
The opinions expressed are those of American Century Investments and are no guarantee of the future performance of any American Century Investments fund. This information is for educational purposes only and is not intended as investment advice. Data reflects past performance, assumes reinvestment of dividends and capital gains and is no guarantee of future results. Current performance may be higher or lower than data shown. Investment return and principal value will fluctuate and redemption value may be more or less than original cost, and none of the charts reflect the deduction of taxes that a shareholder would pay on fund distributions or the redemption of fund shares. Total returns for periods less than one year are not annualized. Visit americancentury.com for more recent performance information.
|
| | | | | |
Fund Statistics | |
| Net Assets | $574,244,407 |
| Management Fees (dollars paid during the reporting period) | $1,237,873 |
| Portfolio Turnover Rate | 64 | % |
| Total Number of Portfolio Holdings | 55 |
| |
| |
| | | | | | | | | | | | | | | | | | | | | | | | | | | | | | | | | | | | |
| Types of Investments in Portfolio (as a % of net assets) | | | | | | | | | | | | Top Five Countries (as a % of net assets) | | | | |
| Common Stocks | 98.5% | | | | | | | | | | | | | | | | | United Kingdom | 27% | | | | | | |
| Short-Term Investments | 0.9% | | | | | | | | | | | | | | | | | France | 20% | | | | | | |
| Other Assets and Liabilities | 0.6% | | | | | | | | | | | | | | | | | South Korea | 11% | | | | | | |
| | | | | | | | | | | | | | | | | | | Germany | 9% | | | | | | |
| | | | | | | | | | | | | | | | | | | Switzerland | 7% | | | | | | |
| | | | | | | | | | | | | | | | | | | | | | | | | | |
| | | | | | | | | | | | | | | | | | | | | | | | | | |
| | | | | | | | | | | | | | | | | | | | | | | | | | |
| | | | | | | | | | | | | | | | | | | | | | | | | | |
| | | | | | | | | | | | | | | | | | | | | | | | | | |
| | | | | | | | | | | | | | | | | | | | | | | | | | |
| | | | | | | | | | | | | | | | | | | | | | | | | | |
| | | | | | | | | | | | | | | | | | | | | | | | | | |
| | | | | | | | | | | | | | | | | | | | | | | | | | |
| | | | | | | | | | | | | | | | | | | | | | | | | | |
| | | | | | | | | | | | | | | | | | | | | | | | | | |
| | |
| Fund Changes |
|
|
| Beginning October 2024, the total eligible investments required to qualify for a waiver of the annual account maintenance fee changed from $10,000 to $25,000. Such fee will also be waived for any accounts for which the shareholder has elected to receive electronic delivery of all fund/account documents. |
|
|
|
|
| | |
| For additional information about the fund, including its Prospectus, Statement of Additional Information, financial statements, holdings and proxy voting information, scan the QR code or visit americancentury.com/docs. |
| | |
|
| ©2025 American Century Proprietary Holdings, Inc. All rights reserved. |
A-25086158
ANNUAL SHAREHOLDER REPORT
Non-U.S. Intrinsic Value Fund
| | | | | |
| I Class (ANVHX) | November 30, 2024 |
This annual shareholder report contains important information about Non-U.S. Intrinsic Value Fund for the period of December 1, 2023 to November 30, 2024. You can find additional information about the fund at americancentury.com/docs. You can also request this information by contacting us at 1-800-345-2021.
| | | | | | | | |
What were the fund costs for the last year? (based on a hypothetical $10,000 investment) |
|
| Costs of a $10,000 investment | Costs paid as a percentage of a $10,000 investment |
| I Class | $101 | 0.97% |
|
| | | | | |
| What were the key factors that affected the fund’s performance? |
Non-U.S. Intrinsic Value Fund I Class returned 7.51% for the reporting period ended November 30, 2024. |
| The fund seeks capital appreciation. The commentary below refers to the fund's performance relative to the MSCI ACWI ex-U.S. Index. |
| • | Global equities broadly advanced during an extended bull market propelled by enthusiasm for artificial intelligence-related stocks. Many central banks cut interest rates, giving investors added confidence. Japan’s cyclical rebound and China’s weak economy made for an uneven landscape for companies trading at significant discounts to their intrinsic value. |
| • | Security selection in the information technology sector weighed on performance during the period. The portfolio is broadly underweight in the sector, so a lack of exposure to several names in the semiconductors, software and IT services industries detracted from results. A holding in SUMCO, a silicon wafer producer in Japan, detracted as it faces near-term cyclical headwinds. |
| • | Choices of investments in the industrials sector also amounted to a drag on performance. Certain holdings in the professional services and electrical equipment industries underperformed, while not owning certain names in those same industries also weighed on results. |
| • | The interaction effect was a positive contributor to performance. In particular, interaction in consumer staples helped results. Allocation in the tobacco industry helped as well. An overweight position in British American Tobacco aided performance as the U.K.-based company likely faces fewer anticipated regulatory burdens in the U.S. |
| | |
Cumulative Performance (based on an initial $10,000 investment) |
| December 3, 2019 through November 30, 2024 |
|
| | | | | | | | | | | | | | |
Average Annual Total Returns | |
| 1 Year | | | Since Inception | Inception Date | |
| I Class | 7.51% | | | 3.29% | 12/3/19 | |
| | | | | | |
| | | | | | |
| | | | | | |
| | | | | | |
| | | | | | |
| MSCI ACWI ex USA | 13.03% | | | 5.55% | — | |
| | | | | | |
| | | | | | |
| | | | | | |
| | | | | | |
| | |
|
The opinions expressed are those of American Century Investments and are no guarantee of the future performance of any American Century Investments fund. This information is for educational purposes only and is not intended as investment advice. Data reflects past performance, assumes reinvestment of dividends and capital gains and is no guarantee of future results. Current performance may be higher or lower than data shown. Investment return and principal value will fluctuate and redemption value may be more or less than original cost, and none of the charts reflect the deduction of taxes that a shareholder would pay on fund distributions or the redemption of fund shares. Total returns for periods less than one year are not annualized. Visit americancentury.com for more recent performance information.
|
| | | | | |
Fund Statistics | |
| Net Assets | $574,244,407 |
| Management Fees (dollars paid during the reporting period) | $1,237,873 |
| Portfolio Turnover Rate | 64 | % |
| Total Number of Portfolio Holdings | 55 |
| |
| |
| | | | | | | | | | | | | | | | | | | | | | | | | | | | | | | | | | | | |
| Types of Investments in Portfolio (as a % of net assets) | | | | | | | | | | | | Top Five Countries (as a % of net assets) | | | | |
| Common Stocks | 98.5% | | | | | | | | | | | | | | | | | United Kingdom | 27% | | | | | | |
| Short-Term Investments | 0.9% | | | | | | | | | | | | | | | | | France | 20% | | | | | | |
| Other Assets and Liabilities | 0.6% | | | | | | | | | | | | | | | | | South Korea | 11% | | | | | | |
| | | | | | | | | | | | | | | | | | | Germany | 9% | | | | | | |
| | | | | | | | | | | | | | | | | | | Switzerland | 7% | | | | | | |
| | | | | | | | | | | | | | | | | | | | | | | | | | |
| | | | | | | | | | | | | | | | | | | | | | | | | | |
| | | | | | | | | | | | | | | | | | | | | | | | | | |
| | | | | | | | | | | | | | | | | | | | | | | | | | |
| | | | | | | | | | | | | | | | | | | | | | | | | | |
| | | | | | | | | | | | | | | | | | | | | | | | | | |
| | | | | | | | | | | | | | | | | | | | | | | | | | |
| | | | | | | | | | | | | | | | | | | | | | | | | | |
| | | | | | | | | | | | | | | | | | | | | | | | | | |
| | | | | | | | | | | | | | | | | | | | | | | | | | |
| | | | | | | | | | | | | | | | | | | | | | | | | | |
| | |
| For additional information about the fund, including its Prospectus, Statement of Additional Information, financial statements, holdings and proxy voting information, scan the QR code or visit americancentury.com/docs. |
| | |
|
| ©2025 American Century Proprietary Holdings, Inc. All rights reserved. |
A-2509A786
ANNUAL SHAREHOLDER REPORT
Non-U.S. Intrinsic Value Fund
| | | | | |
| A Class (ANVLX) | November 30, 2024 |
This annual shareholder report contains important information about Non-U.S. Intrinsic Value Fund for the period of December 1, 2023 to November 30, 2024. You can find additional information about the fund at americancentury.com/docs. You can also request this information by contacting us at 1-800-345-2021.
| | | | | | | | |
What were the fund costs for the last year? (based on a hypothetical $10,000 investment) |
|
| Costs of a $10,000 investment | Costs paid as a percentage of a $10,000 investment |
| A Class | $147 | 1.42% |
|
| | | | | |
| What were the key factors that affected the fund’s performance? |
Non-U.S. Intrinsic Value Fund A Class returned 7.01% for the reporting period ended November 30, 2024. |
| The fund seeks capital appreciation. The commentary below refers to the fund's performance relative to the MSCI ACWI ex-U.S. Index. |
| • | Global equities broadly advanced during an extended bull market propelled by enthusiasm for artificial intelligence-related stocks. Many central banks cut interest rates, giving investors added confidence. Japan’s cyclical rebound and China’s weak economy made for an uneven landscape for companies trading at significant discounts to their intrinsic value. |
| • | Security selection in the information technology sector weighed on performance during the period. The portfolio is broadly underweight in the sector, so a lack of exposure to several names in the semiconductors, software and IT services industries detracted from results. A holding in SUMCO, a silicon wafer producer in Japan, detracted as it faces near-term cyclical headwinds. |
| • | Choices of investments in the industrials sector also amounted to a drag on performance. Certain holdings in the professional services and electrical equipment industries underperformed, while not owning certain names in those same industries also weighed on results. |
| • | The interaction effect was a positive contributor to performance. In particular, interaction in consumer staples helped results. Allocation in the tobacco industry helped as well. An overweight position in British American Tobacco aided performance as the U.K.-based company likely faces fewer anticipated regulatory burdens in the U.S. |
| | |
Cumulative Performance (based on an initial $10,000 investment) |
| December 3, 2019 through November 30, 2024 |
| The initial investment is adjusted to reflect the maximum initial sales charge. |
| | | | | | | | | | | | | | |
Average Annual Total Returns | |
| 1 Year | | | Since Inception | Inception Date | |
| A Class | 7.01% | | | 2.83% | 12/3/19 | |
| A Class - with sales charge | 0.86% | | | 1.62% | 12/3/19 | |
| | | | | | |
| | | | | | |
| | | | | | |
| | | | | | |
| MSCI ACWI ex USA | 13.03% | | | 5.55% | — | |
| | | | | | |
| | | | | | |
| | | | | | |
| | | | | | |
| | | | | | | | | | | | | | | | | |
|
| A Class shares have a 5.75% maximum initial sales charge and may be subject to a maximum contingent deferred sales charge of 1.00%. |
|
|
|
|
|
|
|
|
|
| | |
|
The opinions expressed are those of American Century Investments and are no guarantee of the future performance of any American Century Investments fund. This information is for educational purposes only and is not intended as investment advice. Data reflects past performance, assumes reinvestment of dividends and capital gains and is no guarantee of future results. Current performance may be higher or lower than data shown. Investment return and principal value will fluctuate and redemption value may be more or less than original cost, and none of the charts reflect the deduction of taxes that a shareholder would pay on fund distributions or the redemption of fund shares. Total returns for periods less than one year are not annualized. Visit americancentury.com for more recent performance information.
|
| | | | | |
Fund Statistics | |
| Net Assets | $574,244,407 |
| Management Fees (dollars paid during the reporting period) | $1,237,873 |
| Portfolio Turnover Rate | 64 | % |
| Total Number of Portfolio Holdings | 55 |
| |
| |
| | | | | | | | | | | | | | | | | | | | | | | | | | | | | | | | | | | | |
| Types of Investments in Portfolio (as a % of net assets) | | | | | | | | | | | | Top Five Countries (as a % of net assets) | | | | |
| Common Stocks | 98.5% | | | | | | | | | | | | | | | | | United Kingdom | 27% | | | | | | |
| Short-Term Investments | 0.9% | | | | | | | | | | | | | | | | | France | 20% | | | | | | |
| Other Assets and Liabilities | 0.6% | | | | | | | | | | | | | | | | | South Korea | 11% | | | | | | |
| | | | | | | | | | | | | | | | | | | Germany | 9% | | | | | | |
| | | | | | | | | | | | | | | | | | | Switzerland | 7% | | | | | | |
| | | | | | | | | | | | | | | | | | | | | | | | | | |
| | | | | | | | | | | | | | | | | | | | | | | | | | |
| | | | | | | | | | | | | | | | | | | | | | | | | | |
| | | | | | | | | | | | | | | | | | | | | | | | | | |
| | | | | | | | | | | | | | | | | | | | | | | | | | |
| | | | | | | | | | | | | | | | | | | | | | | | | | |
| | | | | | | | | | | | | | | | | | | | | | | | | | |
| | | | | | | | | | | | | | | | | | | | | | | | | | |
| | | | | | | | | | | | | | | | | | | | | | | | | | |
| | | | | | | | | | | | | | | | | | | | | | | | | | |
| | | | | | | | | | | | | | | | | | | | | | | | | | |
| | |
| For additional information about the fund, including its Prospectus, Statement of Additional Information, financial statements, holdings and proxy voting information, scan the QR code or visit americancentury.com/docs. |
| | |
|
| ©2025 American Century Proprietary Holdings, Inc. All rights reserved. |
A-2509A778
ANNUAL SHAREHOLDER REPORT
Non-U.S. Intrinsic Value Fund
| | | | | |
| R Class (ANVRX) | November 30, 2024 |
This annual shareholder report contains important information about Non-U.S. Intrinsic Value Fund for the period of December 1, 2023 to November 30, 2024. You can find additional information about the fund at americancentury.com/docs. You can also request this information by contacting us at 1-800-345-2021.
| | | | | | | | |
What were the fund costs for the last year? (based on a hypothetical $10,000 investment) |
|
| Costs of a $10,000 investment | Costs paid as a percentage of a $10,000 investment |
| R Class | $173 | 1.67% |
|
| | | | | |
| What were the key factors that affected the fund’s performance? |
Non-U.S. Intrinsic Value Fund R Class returned 6.85% for the reporting period ended November 30, 2024. |
| The fund seeks capital appreciation. The commentary below refers to the fund's performance relative to the MSCI ACWI ex-U.S. Index. |
| • | Global equities broadly advanced during an extended bull market propelled by enthusiasm for artificial intelligence-related stocks. Many central banks cut interest rates, giving investors added confidence. Japan’s cyclical rebound and China’s weak economy made for an uneven landscape for companies trading at significant discounts to their intrinsic value. |
| • | Security selection in the information technology sector weighed on performance during the period. The portfolio is broadly underweight in the sector, so a lack of exposure to several names in the semiconductors, software and IT services industries detracted from results. A holding in SUMCO, a silicon wafer producer in Japan, detracted as it faces near-term cyclical headwinds. |
| • | Choices of investments in the industrials sector also amounted to a drag on performance. Certain holdings in the professional services and electrical equipment industries underperformed, while not owning certain names in those same industries also weighed on results. |
| • | The interaction effect was a positive contributor to performance. In particular, interaction in consumer staples helped results. Allocation in the tobacco industry helped as well. An overweight position in British American Tobacco aided performance as the U.K.-based company likely faces fewer anticipated regulatory burdens in the U.S. |
| | |
Cumulative Performance (based on an initial $10,000 investment) |
| December 3, 2019 through November 30, 2024 |
|
| | | | | | | | | | | | | | |
Average Annual Total Returns | |
| 1 Year | | | Since Inception | Inception Date | |
| R Class | 6.85% | | | 2.58% | 12/3/19 | |
| | | | | | |
| | | | | | |
| | | | | | |
| | | | | | |
| | | | | | |
| MSCI ACWI ex USA | 13.03% | | | 5.55% | — | |
| | | | | | |
| | | | | | |
| | | | | | |
| | | | | | |
| | |
|
The opinions expressed are those of American Century Investments and are no guarantee of the future performance of any American Century Investments fund. This information is for educational purposes only and is not intended as investment advice. Data reflects past performance, assumes reinvestment of dividends and capital gains and is no guarantee of future results. Current performance may be higher or lower than data shown. Investment return and principal value will fluctuate and redemption value may be more or less than original cost, and none of the charts reflect the deduction of taxes that a shareholder would pay on fund distributions or the redemption of fund shares. Total returns for periods less than one year are not annualized. Visit americancentury.com for more recent performance information.
|
| | | | | |
Fund Statistics | |
| Net Assets | $574,244,407 |
| Management Fees (dollars paid during the reporting period) | $1,237,873 |
| Portfolio Turnover Rate | 64 | % |
| Total Number of Portfolio Holdings | 55 |
| |
| |
| | | | | | | | | | | | | | | | | | | | | | | | | | | | | | | | | | | | |
| Types of Investments in Portfolio (as a % of net assets) | | | | | | | | | | | | Top Five Countries (as a % of net assets) | | | | |
| Common Stocks | 98.5% | | | | | | | | | | | | | | | | | United Kingdom | 27% | | | | | | |
| Short-Term Investments | 0.9% | | | | | | | | | | | | | | | | | France | 20% | | | | | | |
| Other Assets and Liabilities | 0.6% | | | | | | | | | | | | | | | | | South Korea | 11% | | | | | | |
| | | | | | | | | | | | | | | | | | | Germany | 9% | | | | | | |
| | | | | | | | | | | | | | | | | | | Switzerland | 7% | | | | | | |
| | | | | | | | | | | | | | | | | | | | | | | | | | |
| | | | | | | | | | | | | | | | | | | | | | | | | | |
| | | | | | | | | | | | | | | | | | | | | | | | | | |
| | | | | | | | | | | | | | | | | | | | | | | | | | |
| | | | | | | | | | | | | | | | | | | | | | | | | | |
| | | | | | | | | | | | | | | | | | | | | | | | | | |
| | | | | | | | | | | | | | | | | | | | | | | | | | |
| | | | | | | | | | | | | | | | | | | | | | | | | | |
| | | | | | | | | | | | | | | | | | | | | | | | | | |
| | | | | | | | | | | | | | | | | | | | | | | | | | |
| | | | | | | | | | | | | | | | | | | | | | | | | | |
| | |
| For additional information about the fund, including its Prospectus, Statement of Additional Information, financial statements, holdings and proxy voting information, scan the QR code or visit americancentury.com/docs. |
| | |
|
| ©2025 American Century Proprietary Holdings, Inc. All rights reserved. |
A-2509A760
ANNUAL SHAREHOLDER REPORT
Non-U.S. Intrinsic Value Fund
| | | | | |
| R6 Class (ANVMX) | November 30, 2024 |
This annual shareholder report contains important information about Non-U.S. Intrinsic Value Fund for the period of December 1, 2023 to November 30, 2024. You can find additional information about the fund at americancentury.com/docs. You can also request this information by contacting us at 1-800-345-2021.
| | | | | | | | |
What were the fund costs for the last year? (based on a hypothetical $10,000 investment) |
|
| Costs of a $10,000 investment | Costs paid as a percentage of a $10,000 investment |
| R6 Class | $85 | 0.82% |
|
| | | | | |
| What were the key factors that affected the fund’s performance? |
Non-U.S. Intrinsic Value Fund R6 Class returned 7.75% for the reporting period ended November 30, 2024. |
| The fund seeks capital appreciation. The commentary below refers to the fund's performance relative to the MSCI ACWI ex-U.S. Index. |
| • | Global equities broadly advanced during an extended bull market propelled by enthusiasm for artificial intelligence-related stocks. Many central banks cut interest rates, giving investors added confidence. Japan’s cyclical rebound and China’s weak economy made for an uneven landscape for companies trading at significant discounts to their intrinsic value. |
| • | Security selection in the information technology sector weighed on performance during the period. The portfolio is broadly underweight in the sector, so a lack of exposure to several names in the semiconductors, software and IT services industries detracted from results. A holding in SUMCO, a silicon wafer producer in Japan, detracted as it faces near-term cyclical headwinds. |
| • | Choices of investments in the industrials sector also amounted to a drag on performance. Certain holdings in the professional services and electrical equipment industries underperformed, while not owning certain names in those same industries also weighed on results. |
| • | The interaction effect was a positive contributor to performance. In particular, interaction in consumer staples helped results. Allocation in the tobacco industry helped as well. An overweight position in British American Tobacco aided performance as the U.K.-based company likely faces fewer anticipated regulatory burdens in the U.S. |
| | |
Cumulative Performance (based on an initial $10,000 investment) |
| December 3, 2019 through November 30, 2024 |
|
| | | | | | | | | | | | | | |
Average Annual Total Returns | |
| 1 Year | | | Since Inception | Inception Date | |
| R6 Class | 7.75% | | | 3.46% | 12/3/19 | |
| | | | | | |
| | | | | | |
| | | | | | |
| | | | | | |
| | | | | | |
| MSCI ACWI ex USA | 13.03% | | | 5.55% | — | |
| | | | | | |
| | | | | | |
| | | | | | |
| | | | | | |
| | |
|
The opinions expressed are those of American Century Investments and are no guarantee of the future performance of any American Century Investments fund. This information is for educational purposes only and is not intended as investment advice. Data reflects past performance, assumes reinvestment of dividends and capital gains and is no guarantee of future results. Current performance may be higher or lower than data shown. Investment return and principal value will fluctuate and redemption value may be more or less than original cost, and none of the charts reflect the deduction of taxes that a shareholder would pay on fund distributions or the redemption of fund shares. Total returns for periods less than one year are not annualized. Visit americancentury.com for more recent performance information.
|
| | | | | |
Fund Statistics | |
| Net Assets | $574,244,407 |
| Management Fees (dollars paid during the reporting period) | $1,237,873 |
| Portfolio Turnover Rate | 64 | % |
| Total Number of Portfolio Holdings | 55 |
| |
| |
| | | | | | | | | | | | | | | | | | | | | | | | | | | | | | | | | | | | |
| Types of Investments in Portfolio (as a % of net assets) | | | | | | | | | | | | Top Five Countries (as a % of net assets) | | | | |
| Common Stocks | 98.5% | | | | | | | | | | | | | | | | | United Kingdom | 27% | | | | | | |
| Short-Term Investments | 0.9% | | | | | | | | | | | | | | | | | France | 20% | | | | | | |
| Other Assets and Liabilities | 0.6% | | | | | | | | | | | | | | | | | South Korea | 11% | | | | | | |
| | | | | | | | | | | | | | | | | | | Germany | 9% | | | | | | |
| | | | | | | | | | | | | | | | | | | Switzerland | 7% | | | | | | |
| | | | | | | | | | | | | | | | | | | | | | | | | | |
| | | | | | | | | | | | | | | | | | | | | | | | | | |
| | | | | | | | | | | | | | | | | | | | | | | | | | |
| | | | | | | | | | | | | | | | | | | | | | | | | | |
| | | | | | | | | | | | | | | | | | | | | | | | | | |
| | | | | | | | | | | | | | | | | | | | | | | | | | |
| | | | | | | | | | | | | | | | | | | | | | | | | | |
| | | | | | | | | | | | | | | | | | | | | | | | | | |
| | | | | | | | | | | | | | | | | | | | | | | | | | |
| | | | | | | | | | | | | | | | | | | | | | | | | | |
| | | | | | | | | | | | | | | | | | | | | | | | | | |
| | |
| For additional information about the fund, including its Prospectus, Statement of Additional Information, financial statements, holdings and proxy voting information, scan the QR code or visit americancentury.com/docs. |
| | |
|
| ©2025 American Century Proprietary Holdings, Inc. All rights reserved. |
A-2509A752
ANNUAL SHAREHOLDER REPORT
Non-U.S. Intrinsic Value Fund
| | | | | |
| G Class (ANTGX) | November 30, 2024 |
This annual shareholder report contains important information about Non-U.S. Intrinsic Value Fund for the period of December 1, 2023 to November 30, 2024. You can find additional information about the fund at americancentury.com/docs. You can also request this information by contacting us at 1-800-345-2021.
| | | | | | | | |
What were the fund costs for the last year? (based on a hypothetical $10,000 investment) |
|
| Costs of a $10,000 investment | Costs paid as a percentage of a $10,000 investment |
| G Class | $2 | 0.02% |
|
| | | | | |
| What were the key factors that affected the fund’s performance? |
Non-U.S. Intrinsic Value Fund G Class returned 8.65% for the reporting period ended November 30, 2024. |
| The fund seeks capital appreciation. The commentary below refers to the fund's performance relative to the MSCI ACWI ex-U.S. Index. |
| • | Global equities broadly advanced during an extended bull market propelled by enthusiasm for artificial intelligence-related stocks. Many central banks cut interest rates, giving investors added confidence. Japan’s cyclical rebound and China’s weak economy made for an uneven landscape for companies trading at significant discounts to their intrinsic value. |
| • | Security selection in the information technology sector weighed on performance during the period. The portfolio is broadly underweight in the sector, so a lack of exposure to several names in the semiconductors, software and IT services industries detracted from results. A holding in SUMCO, a silicon wafer producer in Japan, detracted as it faces near-term cyclical headwinds. |
| • | Choices of investments in the industrials sector also amounted to a drag on performance. Certain holdings in the professional services and electrical equipment industries underperformed, while not owning certain names in those same industries also weighed on results. |
| • | The interaction effect was a positive contributor to performance. In particular, interaction in consumer staples helped results. Allocation in the tobacco industry helped as well. An overweight position in British American Tobacco aided performance as the U.K.-based company likely faces fewer anticipated regulatory burdens in the U.S. |
| | |
Cumulative Performance (based on an initial $10,000 investment) |
| December 6, 2018 through November 30, 2024 |
|
| | | | | | | | | | | | | | | | |
Average Annual Total Returns | |
| 1 Year | 5 Year | | Since Inception | Inception Date | |
| G Class | 8.65% | 4.04% | | 4.70% | 12/6/18 | |
| | | | | | |
| | | | | | |
| | | | | | |
| | | | | | |
| | | | | | |
| MSCI ACWI ex USA | 13.03% | 5.40% | | 6.81% | — | |
| | | | | | |
| | | | | | |
| | | | | | |
| | | | | | |
| | |
|
The opinions expressed are those of American Century Investments and are no guarantee of the future performance of any American Century Investments fund. This information is for educational purposes only and is not intended as investment advice. Data reflects past performance, assumes reinvestment of dividends and capital gains and is no guarantee of future results. Current performance may be higher or lower than data shown. Investment return and principal value will fluctuate and redemption value may be more or less than original cost, and none of the charts reflect the deduction of taxes that a shareholder would pay on fund distributions or the redemption of fund shares. Total returns for periods less than one year are not annualized. Visit americancentury.com for more recent performance information.
|
| | | | | |
Fund Statistics | |
| Net Assets | $574,244,407 |
| Management Fees (dollars paid during the reporting period) | $1,237,873 |
| Portfolio Turnover Rate | 64 | % |
| Total Number of Portfolio Holdings | 55 |
| |
| |
| | | | | | | | | | | | | | | | | | | | | | | | | | | | | | | | | | | | |
| Types of Investments in Portfolio (as a % of net assets) | | | | | | | | | | | | Top Five Countries (as a % of net assets) | | | | |
| Common Stocks | 98.5% | | | | | | | | | | | | | | | | | United Kingdom | 27% | | | | | | |
| Short-Term Investments | 0.9% | | | | | | | | | | | | | | | | | France | 20% | | | | | | |
| Other Assets and Liabilities | 0.6% | | | | | | | | | | | | | | | | | South Korea | 11% | | | | | | |
| | | | | | | | | | | | | | | | | | | Germany | 9% | | | | | | |
| | | | | | | | | | | | | | | | | | | Switzerland | 7% | | | | | | |
| | | | | | | | | | | | | | | | | | | | | | | | | | |
| | | | | | | | | | | | | | | | | | | | | | | | | | |
| | | | | | | | | | | | | | | | | | | | | | | | | | |
| | | | | | | | | | | | | | | | | | | | | | | | | | |
| | | | | | | | | | | | | | | | | | | | | | | | | | |
| | | | | | | | | | | | | | | | | | | | | | | | | | |
| | | | | | | | | | | | | | | | | | | | | | | | | | |
| | | | | | | | | | | | | | | | | | | | | | | | | | |
| | | | | | | | | | | | | | | | | | | | | | | | | | |
| | | | | | | | | | | | | | | | | | | | | | | | | | |
| | | | | | | | | | | | | | | | | | | | | | | | | | |
| | |
| For additional information about the fund, including its Prospectus, Statement of Additional Information, financial statements, holdings and proxy voting information, scan the QR code or visit americancentury.com/docs. |
| | |
|
| ©2025 American Century Proprietary Holdings, Inc. All rights reserved. |
A-25086141
(b) Not applicable.
ITEM 2. CODE OF ETHICS.
(a) The registrant has adopted a Code of Ethics for Senior Financial Officers that applies to the registrant’s principal executive officer, principal financial officer, principal accounting officer, and persons performing similar functions.
(b) No response required.
(c) None.
(d) None.
(e) Not applicable.
(f) The registrant’s Code of Ethics for Senior Financial Officers was filed as Exhibit 12 (a)(1) to American Century Asset Allocation Portfolios, Inc.’s Annual Certified Shareholder Report on Form N-CSR, File No. 811-21591, on September 29, 2005, and is incorporated herein by reference.
ITEM 3. AUDIT COMMITTEE FINANCIAL EXPERT.
(a)(1) The registrant’s board has determined that the registrant has at least one audit committee financial expert serving on its audit committee.
(a)(2) Chris H. Cheesman, Lynn M. Jenkins, Barry Fink and Gary Meltzer are the registrant’s designated audit committee financial experts. They are “independent” as defined in Item 3 of Form N-CSR.
(a)(3) Not applicable.
(b) No response required.
(c) No response required.
(d) No response required.
ITEM 4. PRINCIPAL ACCOUNTANT FEES AND SERVICES.
(a) Audit Fees.
The aggregate fees billed for each of the last two fiscal years for professional services rendered by the principal
accountant for the audit of the registrant’s annual financial statements or services that are normally provided by the accountant in connection with statutory and regulatory filings or engagements for those fiscal years were as follows:
| | | | | |
| FY 2023: | $219,310 |
| FY 2024: | $219,310 |
(b) Audit-Related Fees.
The aggregate fees billed in each of the last two fiscal years for assurance and related services by the principal accountant that are reasonably related to the performance of the audit of the registrant’s financial statements and are not reported under paragraph (a) of this Item were as follows:
For services rendered to the registrant:
Fees required to be approved pursuant to paragraph (c)(7)(ii) of Rule 2-01 of Regulation S-X (relating to certain engagements for non-audit services with the registrant’s investment adviser and its affiliates):
(c) Tax Fees.
The aggregate fees billed in each of the last two fiscal years for professional services rendered by the principal accountant for tax compliance, tax advice, and tax planning were as follows:
For services rendered to the registrant:
Fees required to be approved pursuant to paragraph (c)(7)(ii) of Rule 2-01 of Regulation S-X (relating to certain engagements for non-audit services with the registrant’s investment adviser and its affiliates):
(d) All Other Fees.
The aggregate fees billed in each of the last two fiscal years for products and services provided by the principal accountant, other than the services reported in paragraphs (a) through (c) of this Item were as follows:
For services rendered to the registrant:
Fees required to be approved pursuant to paragraph (c)(7)(ii) of Rule 2-01 of Regulation S-X (relating to certain engagements for non-audit services with the registrant’s investment adviser and its affiliates):
(e)(1) In accordance with paragraph (c)(7)(i)(A) of Rule 2-01 of Regulation S-X, before the accountant is engaged by the registrant to render audit or non-audit services, the engagement is approved by the registrant’s audit committee. Pursuant to paragraph (c)(7)(ii) of Rule 2-01 of Regulation S-X, the registrant’s audit committee also pre-approves its accountant’s engagements for non-audit services with the registrant’s investment adviser, its parent company, and any entity controlled by, or under common control with the investment adviser that provides ongoing services to the registrant, if the engagement relates directly to the operations and financial reporting of the registrant.
(e)(2) All services described in each of paragraphs (b) through (d) of this Item were pre-approved before the engagement by the registrant’s audit committee pursuant to paragraph (c)(7)(i)(A) of Rule 2-01 of Regulation S-X.
Consequently, none of such services were required to be approved by the audit committee pursuant to paragraph (c)(7)(i)(C).
(f) The percentage of hours expended on the principal accountant’s engagement to audit the registrant’s financial statements for the most recent fiscal year that were attributed to work performed by persons other than the principal accountant’s full-time, permanent employees was less than 50%.
(g) The aggregate non-audit fees billed by the registrant’s accountant for services rendered to the registrant, and rendered to the registrant’s investment adviser (not including any sub-adviser whose role is primarily portfolio management and is subcontracted with or overseen by another investment adviser), and any entity controlling, controlled by, or under common control with the adviser that provides ongoing services to the registrant for each of the last two fiscal years of the registrant were as follows:
| | | | | |
| FY 2023: | $343,325 |
| FY 2024: | $98,325 |
(h) The registrant’s investment adviser and accountant have notified the registrant’s audit committee of all non-audit services that were rendered by the registrant’s accountant to the registrant’s investment adviser, its parent company, and any entity controlled by, or under common control with the investment adviser that provides services to the registrant, which services were not required to be pre-approved pursuant to paragraph (c)(7)(ii) of Rule 2-01 of Regulation S-X. The notification provided to the registrant’s audit committee included sufficient details regarding such services to allow the registrant’s audit committee to consider the continuing independence of its principal accountant.
| | | | | |
| (i) | Not applicable. |
| |
| (j) | Not applicable. |
ITEM 5. AUDIT COMMITTEE OF LISTED REGISTRANTS.
Not applicable.
ITEM 6. INVESTMENTS.
(a) The schedule of investments is included as part of the report to stockholders filed under Item 7 of this Form.
(b) Not applicable.
ITEM 7. FINANCIAL STATEMENTS AND FINANCIAL HIGHLIGHTS FOR OPEN-END MANAGEMENT INVESTMENT COMPANIES.
(a)
| | | | | |
| |
| Annual Financial Statements and Other Information |
| |
| November 30, 2024 |
| |
| Emerging Markets Fund |
| Investor Class (TWMIX) |
| I Class (AMKIX) |
| Y Class (AEYMX) |
| A Class (AEMMX) |
| C Class (ACECX) |
| R Class (AEMRX) |
| R5 Class (AEGMX) |
| R6 Class (AEDMX) |
| G Class (ACADX) |
| | | | | |
| Schedule of Investments | |
| Statement of Assets and Liabilities | |
| Statement of Operations | |
| Statement of Changes in Net Assets | |
| Notes to Financial Statements | |
| Financial Highlights | |
| Report of Independent Registered Public Accounting Firm | |
| Approval of Management Agreement | |
| |
| Other Tax Information | |
NOVEMBER 30, 2024
| | | | | | | | |
| Shares | Value |
| COMMON STOCKS — 99.5% | | |
| Brazil — 5.9% | | |
| Banco BTG Pactual SA | 3,089,100 | | $ | 15,412,642 | |
Embraer SA, ADR(1) | 901,291 | | 34,456,355 | |
Hapvida Participacoes e Investimentos SA(1) | 14,785,355 | | 6,487,391 | |
NU Holdings Ltd., Class A(1) | 1,911,584 | | 23,952,148 | |
| PRIO SA | 1,519,500 | | 10,073,935 | |
| WEG SA | 1,674,200 | | 14,961,729 | |
| | 105,344,200 | |
| China — 26.5% | | |
| Alibaba Group Holding Ltd., ADR | 224,978 | | 19,656,328 | |
| BYD Co. Ltd., H Shares | 959,500 | | 31,649,091 | |
| China Construction Bank Corp., H Shares | 44,590,000 | | 33,712,671 | |
| China Railway Group Ltd., H Shares | 18,300,000 | | 8,845,766 | |
| China State Construction International Holdings Ltd. | 17,886,000 | | 24,972,787 | |
| Contemporary Amperex Technology Co. Ltd., Class A | 500,960 | | 18,210,959 | |
| Henan Pinggao Electric Co. Ltd., Class A | 6,937,520 | | 16,776,878 | |
| Industrial & Commercial Bank of China Ltd., H Shares | 30,304,740 | | 17,867,702 | |
| KE Holdings, Inc., ADR | 237,282 | | 4,472,766 | |
| Kweichow Moutai Co. Ltd., A Shares | 48,110 | | 10,189,985 | |
Meituan, Class B(1) | 2,246,240 | | 47,380,542 | |
| NetEase, Inc. | 1,733,600 | | 30,180,718 | |
| New Oriental Education & Technology Group, Inc., ADR | 161,771 | | 9,434,485 | |
| Ping An Insurance Group Co. of China Ltd., H Shares | 6,632,000 | | 38,570,271 | |
| Tencent Holdings Ltd. | 2,228,900 | | 115,107,668 | |
Trip.com Group Ltd.(1) | 634,100 | | 41,218,795 | |
Xiaomi Corp., Class B(1) | 1,516,400 | | 5,457,643 | |
| | | 473,705,055 | |
| India — 19.4% | | |
| Apollo Hospitals Enterprise Ltd. | 381,639 | | 30,885,279 | |
| Bajaj Auto Ltd. | 176,538 | | 18,904,824 | |
| DLF Ltd. | 2,687,933 | | 26,270,842 | |
| Godrej Consumer Products Ltd. | 1,090,770 | | 16,120,470 | |
| HDFC Bank Ltd. | 1,123,844 | | 23,982,542 | |
| ICICI Bank Ltd., ADR | 1,556,538 | | 47,552,236 | |
Infosys Ltd., ADR(2) | 984,982 | | 21,738,553 | |
InterGlobe Aviation Ltd.(1) | 415,729 | | 21,596,949 | |
MakeMyTrip Ltd.(1) | 167,738 | | 19,246,258 | |
| Reliance Industries Ltd. | 1,961,044 | | 30,091,856 | |
| Sun Pharmaceutical Industries Ltd. | 1,618,642 | | 34,165,025 | |
| Varun Beverages Ltd. | 3,496,472 | | 25,705,382 | |
Zomato Ltd.(1) | 9,032,037 | | 30,057,637 | |
| | 346,317,853 | |
| Indonesia — 0.7% | | |
| Bank Rakyat Indonesia Persero Tbk. PT | 45,326,900 | | 12,210,829 | |
| Malaysia — 1.1% | | |
| CIMB Group Holdings Bhd. | 11,167,609 | | 20,725,728 | |
| Mexico — 1.5% | | |
| Cemex SAB de CV, ADR | 1,575,956 | | 8,778,074 | |
| Fomento Economico Mexicano SAB de CV, ADR | 92,522 | | 8,270,542 | |
| | | | | | | | |
| Shares | Value |
Gruma SAB de CV, B Shares(2) | 547,109 | | $ | 9,355,517 | |
| | 26,404,133 | |
| Peru — 1.5% | | |
| Credicorp Ltd. | 144,262 | | 26,756,273 | |
| Philippines — 0.6% | | |
| Ayala Land, Inc. | 20,581,480 | | 10,053,155 | |
Russia(3) — 0.0% | | |
| Novatek PJSC | 1,100,400 | | 1 | |
| Saudi Arabia — 4.2% | | |
| Al Rajhi Bank | 844,471 | | 20,486,654 | |
| Alinma Bank | 1,800,910 | | 13,319,096 | |
| Elm Co. | 81,712 | | 23,574,529 | |
| Saudi Arabian Oil Co. | 2,326,709 | | 17,006,809 | |
| | | 74,387,088 | |
| Singapore — 0.3% | | |
Sea Ltd., ADR(1) | 48,032 | | 5,466,042 | |
| South Africa — 4.9% | | |
| Capitec Bank Holdings Ltd. | 213,426 | | 38,735,969 | |
| Naspers Ltd., N Shares | 140,431 | | 31,861,743 | |
| Shoprite Holdings Ltd. | 1,075,959 | | 17,722,335 | |
| | | 88,320,047 | |
| South Korea — 7.7% | | |
| HD Hyundai Electric Co. Ltd. | 57,011 | | 14,485,649 | |
| HYBE Co. Ltd. | 69,174 | | 9,691,473 | |
| Hyundai Motor Co. | 52,066 | | 8,206,338 | |
| KB Financial Group, Inc. | 353,100 | | 24,386,847 | |
Samsung Biologics Co. Ltd.(1) | 17,800 | | 12,496,919 | |
| Samsung Electronics Co. Ltd. | 1,494,899 | | 58,784,207 | |
| SK Hynix, Inc. | 76,473 | | 8,928,475 | |
| | | 136,979,908 | |
| Taiwan — 18.8% | | |
ASPEED Technology, Inc.(2) | 80,000 | | 10,197,935 | |
| Asustek Computer, Inc. | 715,000 | | 13,043,128 | |
| Delta Electronics, Inc. | 1,337,000 | | 15,851,353 | |
| E Ink Holdings, Inc. | 1,754,000 | | 15,351,865 | |
| E.Sun Financial Holding Co. Ltd. | 15,054,286 | | 12,559,632 | |
| Kinik Co. | 1,488,000 | | 13,798,523 | |
| MediaTek, Inc. | 555,000 | | 21,791,650 | |
| Quanta Computer, Inc. | 1,815,000 | | 16,500,071 | |
| Taiwan Semiconductor Manufacturing Co. Ltd. | 6,599,713 | | 205,650,655 | |
| Wiwynn Corp. | 181,000 | | 10,922,074 | |
| | | 335,666,886 | |
| Thailand — 2.6% | | |
| CP ALL PCL | 11,342,300 | | 20,292,489 | |
| Minor International PCL | 16,056,900 | | 12,553,215 | |
| PTT Exploration & Production PCL | 3,672,100 | | 13,666,096 | |
| | 46,511,800 | |
| Turkey — 0.9% | | |
| BIM Birlesik Magazalar AS | 1,149,352 | | 15,710,225 | |
| United Arab Emirates — 1.8% | | |
| Emaar Properties PJSC | 12,637,408 | | 32,876,064 | |
| United States — 1.1% | | |
MercadoLibre, Inc.(1) | 9,777 | | 19,409,007 | |
TOTAL COMMON STOCKS (Cost $1,203,308,064) | | 1,776,844,294 | |
| | | | | | | | |
| Shares | Value |
| SHORT-TERM INVESTMENTS — 1.2% | | |
| Money Market Funds — 0.6% | | |
State Street Navigator Securities Lending Government Money Market Portfolio(4) | 10,312,689 | | $ | 10,312,689 | |
| Repurchase Agreements — 0.6% | | |
| BMO Capital Markets Corp., (collateralized by various U.S. Treasury obligations, 3.625%, 2/15/44, valued at $1,066,715), in a joint trading account at 4.56%, dated 11/29/24, due 12/2/24 (Delivery value $1,048,002) | | 1,047,604 | |
| Fixed Income Clearing Corp., (collateralized by various U.S. Treasury obligations, 2.00% - 4.125%, 10/31/31 - 2/15/50, valued at $10,582,670), at 4.57%, dated 11/29/24, due 12/2/24 (Delivery value $10,378,951) | | 10,375,000 | |
| | 11,422,604 | |
TOTAL SHORT-TERM INVESTMENTS (Cost $21,735,293) | | 21,735,293 | |
TOTAL INVESTMENT SECURITIES — 100.7% (Cost $1,225,043,357) | | 1,798,579,587 | |
| OTHER ASSETS AND LIABILITIES — (0.7)% | | (13,299,331) | |
| TOTAL NET ASSETS — 100.0% | | $ | 1,785,280,256 | |
| | | | | |
| MARKET SECTOR DIVERSIFICATION |
| (as a % of net assets) | |
| Information Technology | 24.0% |
| Financials | 20.7% |
| Consumer Discretionary | 16.2% |
| Industrials | 9.4% |
| Communication Services | 9.0% |
| Consumer Staples | 6.9% |
| Health Care | 4.7% |
| Real Estate | 4.1% |
| Energy | 4.0% |
| Materials | 0.5% |
| Short-Term Investments | 1.2% |
| Other Assets and Liabilities | (0.7)% |
| | | | | | | | |
| NOTES TO SCHEDULE OF INVESTMENTS |
| ADR | – | American Depositary Receipt |
(1)Non-income producing.
(2)Security, or a portion thereof, is on loan. At the period end, the aggregate value of securities on loan was $13,772,935. The amount of securities on loan indicated may not correspond with the securities on loan identified because securities with pending sales are in the process of recall from the brokers.
(3)Securities may be subject to resale, redemption or transferability restrictions.
(4)Investment of cash collateral from securities on loan. At the period end, the aggregate value of the collateral held by the fund was $14,285,174, which includes securities collateral of $3,972,485.
See Notes to Financial Statements.
| | |
| Statement of Assets and Liabilities |
| | | | | |
| NOVEMBER 30, 2024 | |
| Assets | |
| Investment securities, at value (cost of $1,214,730,668) — including $13,772,935 of securities on loan | $ | 1,788,266,898 | |
| Investment made with cash collateral received for securities on loan, at value (cost of $10,312,689) | 10,312,689 | |
| Total investment securities, at value (cost of $1,225,043,357) | 1,798,579,587 | |
| Cash | 342,711 | |
| Foreign currency holdings, at value (cost of $95,958) | 95,975 | |
| Receivable for capital shares sold | 7,368,026 | |
| Dividends and interest receivable | 467,584 | |
| Securities lending receivable | 35,966 | |
| Other assets | 200,274 | |
| 1,807,090,123 | |
| |
| Liabilities | |
| Payable for collateral received for securities on loan | 10,312,689 | |
| Payable for capital shares redeemed | 1,078,891 | |
| Accrued management fees | 905,045 | |
| Distribution and service fees payable | 14,926 | |
| Accrued foreign taxes | 9,498,316 | |
| 21,809,867 | |
| |
| Net Assets | $ | 1,785,280,256 | |
| |
| Net Assets Consist of: | |
| Capital (par value and paid-in surplus) | $ | 2,003,989,725 | |
| Distributable earnings (loss) | (218,709,469) | |
| $ | 1,785,280,256 | |
| | | | | | | | | | | |
| Net Assets | Shares Outstanding | Net Asset Value Per Share* |
| Investor Class, $0.01 Par Value | $277,169,999 | 24,851,714 | $11.15 |
| I Class, $0.01 Par Value | $429,152,688 | 37,425,509 | $11.47 |
| Y Class, $0.01 Par Value | $40,090,467 | 3,487,124 | $11.50 |
| A Class, $0.01 Par Value | $36,158,418 | 3,370,627 | $10.73 |
| C Class, $0.01 Par Value | $5,750,201 | 597,338 | $9.63 |
| R Class, $0.01 Par Value | $5,542,152 | 515,015 | $10.76 |
| R5 Class, $0.01 Par Value | $856,712 | 74,661 | $11.47 |
| R6 Class, $0.01 Par Value | $205,571,967 | 17,910,181 | $11.48 |
| G Class, $0.01 Par Value | $784,987,652 | 67,564,535 | $11.62 |
*Maximum offering price per share was equal to the net asset value per share for all share classes, except A Class, for which the maximum offering price per share was $11.38 (net asset value divided by 0.9425). A contingent deferred sales charge may be imposed on redemptions of A Class and C Class.
See Notes to Financial Statements.
| | | | | |
| YEAR ENDED NOVEMBER 30, 2024 | |
| Investment Income (Loss) | |
| Income: | |
| Dividends (net of foreign taxes withheld of $4,417,769) | $ | 40,523,636 | |
| Interest | 493,656 | |
| Securities lending, net | 72,506 | |
| 41,089,798 | |
| |
| Expenses: | |
| Management fees | 19,905,455 | |
| Distribution and service fees: | |
| A Class | 94,092 | |
| C Class | 74,284 | |
| R Class | 28,395 | |
| Directors' fees and expenses | 59,551 | |
| Other expenses | 393,990 | |
| 20,555,767 | |
| Fees waived - G Class | (7,198,215) | |
| 13,357,552 | |
| |
| Net investment income (loss) | 27,732,246 | |
| |
| Realized and Unrealized Gain (Loss) | |
| Net realized gain (loss) on: | |
| Investment transactions (net of foreign tax expenses paid (refunded) of $5,997,154) | 79,011,703 | |
| Foreign currency translation transactions | (1,289,523) | |
| 77,722,180 | |
| |
| Change in net unrealized appreciation (depreciation) on: | |
| Investments (includes (increase) decrease in accrued foreign taxes of $(6,202,368)) | 203,051,567 | |
| Translation of assets and liabilities in foreign currencies | 4,781 | |
| 203,056,348 | |
| |
| Net realized and unrealized gain (loss) | 280,778,528 | |
| |
| Net Increase (Decrease) in Net Assets Resulting from Operations | $ | 308,510,774 | |
See Notes to Financial Statements.
| | |
| Statement of Changes in Net Assets |
| | | | | | | | |
| YEARS ENDED NOVEMBER 30, 2024 AND NOVEMBER 30, 2023 |
| Increase (Decrease) in Net Assets | November 30, 2024 | November 30, 2023 |
| Operations | | |
| Net investment income (loss) | $ | 27,732,246 | | $ | 38,370,735 | |
| Net realized gain (loss) | 77,722,180 | | (275,108,189) | |
| Change in net unrealized appreciation (depreciation) | 203,056,348 | | 243,204,662 | |
| Net increase (decrease) in net assets resulting from operations | 308,510,774 | | 6,467,208 | |
| | |
| Distributions to Shareholders | | |
| From earnings: | | |
| Investor Class | (4,361,760) | | (7,908,718) | |
| I Class | (7,257,740) | | (17,845,842) | |
| Y Class | (551,472) | | (843,213) | |
| A Class | (430,427) | | (1,076,143) | |
| C Class | (32,481) | | (214,857) | |
| R Class | (44,517) | | (112,728) | |
| R5 Class | (139,050) | | (237,310) | |
| R6 Class | (7,344,369) | | (15,916,126) | |
| G Class | (18,625,613) | | (20,631,687) | |
| Decrease in net assets from distributions | (38,787,429) | | (64,786,624) | |
| | |
| Capital Share Transactions | | |
| Net increase (decrease) in net assets from capital share transactions (Note 5) | (619,744,143) | | (542,582,034) | |
| | |
| Net increase (decrease) in net assets | (350,020,798) | | (600,901,450) | |
| | |
| Net Assets | | |
| Beginning of period | 2,135,301,054 | | 2,736,202,504 | |
| End of period | $ | 1,785,280,256 | | $ | 2,135,301,054 | |
See Notes to Financial Statements.
| | |
| Notes to Financial Statements |
NOVEMBER 30, 2024
1. Organization
American Century World Mutual Funds, Inc. (the corporation) is registered under the Investment Company Act of 1940, as amended (the 1940 Act), as an open-end management investment company and is organized as a Maryland corporation. Emerging Markets Fund (the fund) is one fund in a series issued by the corporation. The fund’s investment objective is to seek capital growth.
The fund offers the Investor Class, I Class, Y Class, A Class, C Class, R Class, R5 Class, R6 Class and G Class. The A Class may incur an initial sales charge. The A Class and C Class may be subject to a contingent deferred sales charge.
2. Significant Accounting Policies
The following is a summary of significant accounting policies consistently followed by the fund in preparation of its financial statements. The fund is an investment company and follows accounting and reporting guidance in accordance with accounting principles generally accepted in the United States of America. This may require management to make certain estimates and assumptions at the date of the financial statements. Actual results could differ from these estimates. Management evaluated the impact of events or transactions occurring through the date the financial statements were issued that would merit recognition or disclosure.
Investment Valuations — The fund determines the fair value of its investments and computes its net asset value (NAV) per share at the close of regular trading (usually 4 p.m. Eastern time) on the New York Stock Exchange (NYSE) on each day the NYSE is open. The value of investments of the fund is determined by American Century Investment Management, Inc. (ACIM) (the investment advisor), as the valuation designee, pursuant to its valuation policies and procedures. The Board of Directors oversees the valuation designee and reviews its valuation policies and procedures at least annually.
Equity securities that are listed or traded on a domestic securities exchange are valued at the last reported sales price or at the official closing price as provided by the exchange. Equity securities traded on foreign securities exchanges are generally valued at the closing price of such securities on the exchange where primarily traded or at the close of the NYSE, if that is earlier. If no last sales price is reported, or if local convention or regulation so provides, the mean of the latest bid and asked prices may be used. Securities traded over-the-counter are valued at the mean of the latest bid and asked prices, the last sales price, or the official closing price.
Open-end management investment companies are valued at the reported NAV per share. Repurchase agreements are valued at cost, which approximates fair value.
If the valuation designee determines that the market price for a portfolio security is not readily available or is believed by the valuation designee to be unreliable, such security is valued at fair value as determined in good faith by the valuation designee, in accordance with its policies and procedures. Circumstances that may cause the fund to determine that market quotations are not available or reliable include, but are not limited to: when there is a significant event subsequent to the market quotation; trading in a security has been halted during the trading day; or trading in a security is insufficient or did not take place due to a closure or holiday.
The valuation designee monitors for significant events occurring after the close of an investment’s primary exchange but before the fund’s NAV per share is determined. Significant events may include, but are not limited to: corporate announcements and transactions; regulatory news, governmental action and political unrest that could impact a specific investment or an investment sector; or armed conflicts, natural disasters and similar events that could affect investments in a specific country or region. The valuation designee also monitors for significant fluctuations between domestic and foreign markets, as evidenced by the U.S. market or such other indicators that it deems appropriate. The valuation designee may apply a model-derived factor to the closing price of equity securities traded on foreign securities exchanges. The factor is based on observable market data as provided by an independent pricing service.
Foreign Currency Translations — All assets and liabilities, including investment securities and other financial instruments, initially expressed in foreign currencies are translated into U.S. dollars each day at the mean of the appropriate currency exchange rate at the close of the NYSE as provided by an independent pricing service. The fund may enter into spot foreign currency exchange contracts to facilitate transactions denominated in a foreign currency. Purchases and sales of investment securities, dividend and interest income, spot foreign currency exchange contracts, and expenses are translated at the rates of exchange prevailing on the respective dates of such transactions. Net realized and unrealized foreign currency exchange gains or losses related to investment securities are a component of net realized gain (loss) on investment transactions and change in net unrealized appreciation (depreciation) on investments, respectively.
Security Transactions — Security transactions are accounted for as of the trade date. Net realized gains and losses are determined on the identified cost basis, which is also used for federal income tax purposes. Certain countries impose taxes on realized gains on the sale of securities registered in their country. The fund records the foreign tax expense, if any, on an accrual basis. The foreign tax expense on realized gains and unrealized appreciation reduces the net realized gain (loss) on investment transactions and net unrealized appreciation (depreciation) on investments, respectively.
Investment Income — Dividend income less foreign taxes withheld, if any, is recorded as of the ex-dividend date. Distributions received on securities that represent a return of capital or long-term capital gain are recorded as a reduction of cost of investments and/or as a realized gain. The fund may estimate the components of distributions received that may be considered nontaxable distributions or long-term capital gain distributions for income tax purposes. Interest income is recorded on the accrual basis and includes accretion of discounts and amortization of premiums. Securities lending income is net of fees and rebates earned by the lending agent for its services.
Repurchase Agreements — The fund may enter into repurchase agreements with institutions that ACIM has determined are creditworthy pursuant to criteria adopted by the Board of Directors. The fund requires that the collateral, represented by securities, received in a repurchase transaction be transferred to the custodian in a manner sufficient to enable the fund to obtain those securities in the event of a default under the repurchase agreement. ACIM monitors, on a daily basis, the securities transferred to ensure the value, including accrued interest, of the securities under each repurchase agreement is equal to or greater than amounts owed to the fund under each repurchase agreement.
Joint Trading Account — Pursuant to an Exemptive Order issued by the Securities and Exchange Commission, the fund, along with certain other funds in the American Century Investments family of funds, may transfer uninvested cash balances into a joint trading account. These balances are invested in one or more repurchase agreements that are collateralized by U.S. Treasury or Agency obligations.
Income Tax Status — It is the fund's policy to distribute substantially all net investment income and net realized gains to shareholders and to otherwise qualify as a regulated investment company under provisions of the Internal Revenue Code. Accordingly, no provision has been made for income taxes. The fund files U.S. federal, state, local and non-U.S. tax returns as applicable. The fund's tax returns are subject to examination by the relevant taxing authority until expiration of the applicable statute of limitations, which is generally three years from the date of filing but can be longer in certain jurisdictions. At this time, management believes there are no uncertain tax positions which, based on their technical merit, would not be sustained upon examination and for which it is reasonably possible that the total amounts of unrecognized tax benefits will significantly change in the next twelve months.
Multiple Class — All shares of the fund represent an equal pro rata interest in the net assets of the class to which such shares belong, and have identical voting, dividend, liquidation and other rights and the same terms and conditions, except for class specific expenses and exclusive rights to vote on matters affecting only individual classes. Income, non-class specific expenses, and realized and unrealized capital gains and losses of the fund are allocated to each class of shares based on their relative net assets.
Distributions to Shareholders — Distributions from net investment income and net realized gains, if any, are generally declared and paid annually. The fund may make distributions on a more frequent basis to comply with the distribution requirements of the Internal Revenue Code, in all events in a manner consistent with provisions of the 1940 Act.
Indemnifications — Under the corporation’s organizational documents, its officers and directors are indemnified against certain liabilities arising out of the performance of their duties to the fund. In addition, in the normal course of business, the fund enters into contracts that provide general indemnifications. The maximum exposure under these arrangements is unknown as this would involve future claims that may be made against a fund. The risk of material loss from such claims is considered by management to be remote.
Securities Lending — Securities are lent to qualified financial institutions and brokers. State Street Bank & Trust Co. serves as securities lending agent to the fund pursuant to a Securities Lending Agreement. The lending of securities exposes the fund to risks such as: the borrowers may fail to return the loaned securities, the borrowers may not be able to provide additional collateral, the fund may experience delays in recovery of the loaned securities or delays in access to collateral, or the fund may experience losses related to the investment collateral. To minimize certain risks, loan counterparties pledge collateral in the form of cash and/or securities. The lending agent has agreed to indemnify the fund in the case of default of any securities borrowed. Cash collateral received is invested in the State Street Navigator Securities Lending Government Money Market Portfolio, a money market mutual fund registered under the 1940 Act. The loans may also be secured by U.S. government securities in an amount at least equal to the market value of the securities loaned, plus accrued interest and dividends, determined on a daily basis and adjusted accordingly. By lending securities, the fund seeks to increase its net investment income through the receipt of interest and fees. Such income is reflected separately within the Statement of Operations. The value of loaned securities and related collateral outstanding at period end, if any, are shown on a gross basis within the Schedule of Investments and Statement of Assets and Liabilities.
The following table reflects a breakdown of transactions accounted for as secured borrowings, the gross obligation by the type of collateral pledged, and the remaining contractual maturity of those transactions as of November 30, 2024.
| | | | | | | | | | | | | | | | | |
| Remaining Contractual Maturity of Agreements |
| Overnight and Continuous | <30 days | Between 30 & 90 days | >90 days | Total |
Securities Lending Transactions(1) | | | | | |
| Common Stocks | $ | 10,312,689 | | — | | — | | — | | $ | 10,312,689 | |
| Gross amount of recognized liabilities for securities lending transactions | $ | 10,312,689 | |
(1)Amount represents the payable for cash collateral received for securities on loan. This will generally be in the Overnight and Continuous column as the securities are typically callable on demand.
3. Fees and Transactions with Related Parties
Certain officers and directors of the corporation are also officers and/or directors of American Century Companies, Inc. (ACC). The corporation's investment advisor, ACIM, the corporation's distributor, American Century Investment Services, Inc. (ACIS), and the corporation's transfer agent, American Century Services, LLC, are wholly owned, directly or indirectly, by ACC. Various funds issued by American Century Asset Allocation Portfolios, Inc. own, in aggregate, 25% of the shares of the fund. Related parties do not invest in the fund for the purpose of exercising management or control.
Management Fees — The corporation has entered into a management agreement with ACIM, under which ACIM provides the fund with investment advisory and management services in exchange for a single, unified management fee (the fee) per class. The agreement provides that ACIM will pay all expenses of managing and operating the fund, except brokerage expenses, taxes, interest, fees and expenses of the independent directors (including legal counsel fees), extraordinary expenses, and expenses incurred in connection with the provision of shareholder services and distribution services under a plan adopted pursuant to Rule 12b-1 under the 1940 Act. The fee is computed and accrued daily based on each class's daily net assets and paid monthly in arrears. The difference in the fee among the classes is a result of their separate arrangements for non-Rule 12b-1 shareholder services. It is not the result of any difference in advisory or custodial fees or other expenses related to the management of the fund’s assets, which do not vary by class. The investment advisor agreed to waive the G Class's management fee in its entirety. The investment advisor expects this waiver to remain in effect permanently and cannot terminate it without the approval of the Board of Directors.
The annual management fee for each class is as follows:
| | | | | | | | | | | | | | | | | | | | | | | | | | |
| Investor Class | I Class | Y Class | A Class | C Class | R Class | R5 Class | R6 Class | G Class |
| 1.25% | 1.05% | 0.90% | 1.25% | 1.25% | 1.25% | 1.05% | 0.90% | 0.00%(1) |
(1)Annual management fee before waiver was 0.90%.
Distribution and Service Fees — The Board of Directors has adopted a separate Master Distribution and Individual Shareholder Services Plan for each of the A Class, C Class and R Class (collectively the plans), pursuant to Rule 12b-1 of the 1940 Act. The plans provide that the A Class will pay ACIS an annual distribution and service fee of 0.25%. The plans provide that the C Class will pay ACIS an annual distribution and service fee of 1.00%, of which 0.25% is paid for individual shareholder services and 0.75% is paid for distribution services. The plans provide that the R Class will pay ACIS an annual distribution and service fee of 0.50%. The fees are computed and accrued daily based on each class’s daily net assets and paid monthly in arrears. The fees are used to pay financial intermediaries for distribution and individual shareholder services. Fees incurred under the plans during the period ended November 30, 2024 are detailed in the Statement of Operations.
Directors' Fees and Expenses — The Board of Directors is responsible for overseeing the investment advisor’s management and operations of the fund. The directors receive detailed information about the fund and its investment advisor regularly throughout the year, and meet at least quarterly with management of the investment advisor to review reports about fund operations. The fund's officers do not receive compensation from the fund.
Other Expenses — A fund’s other expenses may include interest charges, clearing exchange fees, proxy solicitation expenses, fees associated with the recovery of foreign tax reclaims and other miscellaneous expenses.
Interfund Transactions — The fund may enter into security transactions with other American Century Investments funds and other client accounts of the investment advisor, in accordance with the 1940 Act rules and procedures adopted by the Board of Directors. The rules and procedures require, among other things, that these transactions be effected at the independent current market price of the security. There were no interfund transactions during the period.
4. Investment Transactions
Purchases and sales of investment securities, excluding short-term investments, for the period ended November 30, 2024 were $571,816,499 and $1,219,742,417, respectively.
5. Capital Share Transactions
Transactions in shares of the fund were as follows:
| | | | | | | | | | | | | | |
| Year ended
November 30, 2024 | Year ended
November 30, 2023 |
| Shares | Amount | Shares | Amount |
| Investor Class/Shares Authorized | 1,000,000,000 | | | 1,000,000,000 | | |
| Sold | 3,660,264 | | $ | 36,838,013 | | 3,656,054 | | $ | 36,283,668 | |
| Issued in reinvestment of distributions | 432,357 | | 4,258,569 | | 800,057 | | 7,704,547 | |
| Redeemed | (10,460,426) | | (113,479,624) | | (9,949,067) | | (98,170,889) | |
| (6,367,805) | | (72,383,042) | | (5,492,956) | | (54,182,674) | |
| I Class/Shares Authorized | 1,400,000,000 | | | 1,400,000,000 | | |
| Sold | 8,130,675 | | 89,099,436 | | 18,371,410 | | 186,971,811 | |
| Issued in reinvestment of distributions | 653,946 | | 6,611,393 | | 1,688,115 | | 16,678,573 | |
| Redeemed | (21,694,114) | | (232,804,755) | | (50,178,089) | | (504,979,214) | |
| (12,909,493) | | (137,093,926) | | (30,118,564) | | (301,328,830) | |
| Y Class/Shares Authorized | 40,000,000 | | | 40,000,000 | | |
| Sold | 1,156,322 | | 12,492,861 | | 1,864,558 | | 18,995,855 | |
| Issued in reinvestment of distributions | 53,344 | | 539,843 | | 82,397 | | 814,907 | |
| Redeemed | (1,009,372) | | (11,456,288) | | (2,331,774) | | (23,804,303) | |
| 200,294 | | 1,576,416 | | (384,819) | | (3,993,541) | |
| A Class/Shares Authorized | 100,000,000 | | | 100,000,000 | | |
| Sold | 688,795 | | 7,079,984 | | 1,531,564 | | 14,418,387 | |
| Issued in reinvestment of distributions | 31,114 | | 295,580 | | 62,812 | | 583,523 | |
| Redeemed | (1,444,371) | | (14,631,829) | | (2,816,817) | | (26,851,961) | |
| (724,462) | | (7,256,265) | | (1,222,441) | | (11,850,051) | |
| C Class/Shares Authorized | 45,000,000 | | | 45,000,000 | | |
| Sold | 60,629 | | 548,210 | | 72,259 | | 620,177 | |
| Issued in reinvestment of distributions | 3,353 | | 28,771 | | 22,066 | | 185,358 | |
| Redeemed | (521,969) | | (4,811,270) | | (557,756) | | (4,757,802) | |
| (457,987) | | (4,234,289) | | (463,431) | | (3,952,267) | |
| R Class/Shares Authorized | 25,000,000 | | | 25,000,000 | | |
| Sold | 154,960 | | 1,615,180 | | 185,739 | | 1,770,769 | |
| Issued in reinvestment of distributions | 4,661 | | 44,514 | | 12,069 | | 112,728 | |
| Redeemed | (205,872) | | (2,145,508) | | (262,324) | | (2,443,366) | |
| (46,251) | | (485,814) | | (64,516) | | (559,869) | |
| R5 Class/Shares Authorized | 25,000,000 | | | 25,000,000 | | |
| Sold | 60,169 | | 642,294 | | 206,002 | | 2,077,788 | |
| Issued in reinvestment of distributions | 13,723 | | 138,877 | | 23,973 | | 237,095 | |
| Redeemed | (916,584) | | (9,818,615) | | (352,740) | | (3,615,826) | |
| (842,692) | | (9,037,444) | | (122,765) | | (1,300,943) | |
| R6 Class/Shares Authorized | 750,000,000 | | | 750,000,000 | | |
| Sold | 7,573,473 | | 81,687,250 | | 15,693,581 | | 158,454,648 | |
| Issued in reinvestment of distributions | 709,900 | | 7,177,086 | | 1,563,411 | | 15,446,501 | |
| Redeemed | (36,075,619) | | (389,770,830) | | (38,268,284) | | (385,099,436) | |
| (27,792,246) | | (300,906,494) | | (21,011,292) | | (211,198,287) | |
| G Class/Shares Authorized | 750,000,000 | | | 750,000,000 | | |
| Sold | 10,683,295 | | 119,196,673 | | 10,079,379 | | 101,110,315 | |
| Issued in reinvestment of distributions | 1,836,846 | | 18,625,613 | | 2,081,906 | | 20,631,687 | |
| Redeemed | (20,061,171) | | (227,745,571) | | (7,434,199) | | (75,957,574) | |
| (7,541,030) | | (89,923,285) | | 4,727,086 | | 45,784,428 | |
| Net increase (decrease) | (56,481,672) | | $ | (619,744,143) | | (54,153,698) | | $ | (542,582,034) | |
6. Fair Value Measurements
The fund's investments valuation process is based on several considerations and may use multiple inputs to determine the fair value of the investments held by the fund. In conformity with accounting principles generally accepted in the United States of America, the inputs used to determine a valuation are classified into three broad levels.
•Level 1 valuation inputs consist of unadjusted quoted prices in an active market for identical investments.
•Level 2 valuation inputs consist of direct or indirect observable market data (including quoted prices for comparable investments, evaluations of subsequent market events, interest rates, prepayment speeds, credit risk, etc.). These inputs also consist of quoted prices for identical investments initially expressed in local currencies that are adjusted through translation into U.S. dollars.
•Level 3 valuation inputs consist of unobservable data (including a fund’s own assumptions).
The level classification is based on the lowest level input that is significant to the fair valuation measurement. The valuation inputs are not necessarily an indication of the risks associated with investing in these securities or other financial instruments.
The following is a summary of the level classifications as of period end. The Schedule of Investments provides additional information on the fund's portfolio holdings.
| | | | | | | | | | | |
| Level 1 | Level 2 | Level 3 |
| Assets | | | |
| Investment Securities | | | |
| Common Stocks | | | |
| Brazil | $ | 58,408,503 | | $ | 46,935,697 | | — | |
| China | 33,563,579 | | 440,141,476 | | — | |
| India | 88,537,047 | | 257,780,806 | | — | |
| Mexico | 17,048,616 | | 9,355,517 | | — | |
| Peru | 26,756,273 | | — | | — | |
| Singapore | 5,466,042 | | — | | — | |
| United States | 19,409,007 | | — | | — | |
| Other Countries | — | | 773,441,731 | | — | |
| Short-Term Investments | 10,312,689 | | 11,422,604 | | — | |
| $ | 259,501,756 | | $ | 1,539,077,831 | | — | |
7. Risk Factors
The value of the fund’s shares will go up and down, sometimes rapidly or unpredictably, based on the performance of the securities owned by the fund and other factors generally affecting the securities market. Market risks, including political, regulatory, economic and social developments, can affect the value of the fund’s investments. Natural disasters, public health emergencies, war, terrorism and other unforeseeable events may lead to increased market volatility and may have adverse long-term effects on world economies and markets generally.
There are certain risks involved in investing in foreign securities. These risks include those resulting from political events (such as civil unrest, national elections and imposition of exchange controls), social and economic events (such as labor strikes and rising inflation), and natural disasters. Securities of foreign issuers may be less liquid and more volatile. Investing in emerging markets or a significant portion of assets in one country or region may accentuate these risks.
8. Federal Tax Information
On December 17, 2024, the fund declared and paid the following per-share distributions from net investment income to shareholders of record on December 16, 2024:
| | | | | | | | | | | | | | | | | | | | | | | | | | |
| Investor Class | I Class | Y Class | A Class | C Class | R Class | R5 Class | R6 Class | G Class |
| $0.0787 | $0.1016 | $0.1187 | $0.0502 | — | $0.0216 | $0.1016 | $0.1187 | $0.2215 |
The tax character of distributions paid during the years ended November 30, 2024 and November 30, 2023 were as follows:
| | | | | | | | |
| 2024 | 2023 |
| Distributions Paid From | | |
| Ordinary income | $ | 38,787,429 | | $ | 64,786,624 | |
| Long-term capital gains | — | | — | |
The book-basis character of distributions made during the year from net investment income or net realized gains may differ from their ultimate characterization for federal income tax purposes. These differences reflect the differing character of certain income items and net realized gains and losses for financial statement and tax purposes, and may result in reclassification among certain capital accounts on the financial statements.
As of period end, the federal tax cost of investments and the components of distributable earnings on a tax-basis were as follows:
| | | | | |
| Federal tax cost of investments | $ | 1,240,632,770 | |
| Gross tax appreciation of investments | $ | 623,907,654 | |
| Gross tax depreciation of investments | (65,960,837) | |
| Net tax appreciation (depreciation) of investments | 557,946,817 | |
| Net tax appreciation (depreciation) on translation of assets and liabilities in foreign currencies | (9,516,469) | |
| Net tax appreciation (depreciation) | $ | 548,430,348 | |
| Undistributed ordinary income | $ | 23,620,888 | |
| Accumulated short-term capital losses | $ | (683,198,842) | |
| Accumulated long-term capital losses | $ | (107,561,863) | |
The difference between book-basis and tax-basis unrealized appreciation (depreciation) is attributable primarily to the realization to ordinary income for tax purposes of unrealized gains on investments in passive foreign investment companies.
Accumulated capital losses represent net capital loss carryovers that may be used to offset future realized capital gains for federal income tax purposes. The capital loss carryovers may be carried forward for an unlimited period. Future capital loss carryover utilization in any given year may be subject to Internal Revenue Code limitations.
| | | | | | | | | | | | | | | | | | | | | | | | | | | | | | | | | | | | | | | | | |
| For a Share Outstanding Throughout the Years Ended November 30 (except as noted) | | | | |
| Per-Share Data | | Ratios and Supplemental Data | | |
| | Income From Investment Operations*: | | | | Ratio to Average Net Assets of†: | | |
| Net Asset
Value,
Beginning
of Period | Net Investment Income (Loss)(1) | Net
Realized
and
Unrealized
Gain (Loss) | Total From
Investment
Operations | Distributions
From
Net
Investment
Income | Net Asset
Value,
End
of Period | Total Return(2) | Operating
Expenses | Operating
Expenses
(before
expense
waiver) | Net
Investment
Income
(Loss) | Net
Investment
Income
(Loss)
(before
expense
waiver) | Portfolio
Turnover
Rate | Net
Assets,
End of
Period
(in thousands) |
| Investor Class | | | | | | | | | | | |
| 2024 | $9.80 | 0.09 | 1.39 | 1.48 | (0.13) | $11.15 | 15.29% | 1.27% | 1.27% | 0.79% | 0.79% | 29% | $277,170 | |
| 2023 | $10.04 | 0.10 | (0.13) | (0.03) | (0.21) | $9.80 | (0.22)% | 1.27% | 1.27% | 1.05% | 1.05% | 29% | $305,994 | |
| 2022 | $13.67 | 0.09 | (3.61) | (3.52) | (0.11) | $10.04 | (25.84)% | 1.26% | 1.26% | 0.84% | 0.84% | 52% | $368,506 | |
| 2021 | $13.62 | 0.05 | 0.08 | 0.13 | (0.08) | $13.67 | 0.91% | 1.25% | 1.25% | 0.36% | 0.36% | 35% | $554,001 | |
| 2020 | $11.25 | 0.04 | 2.48 | 2.52 | (0.15) | $13.62 | 22.79% | 1.26% | 1.26% | 0.33% | 0.33% | 30% | $582,036 | |
| I Class | | | | | | | | | | | |
| 2024 | $10.07 | 0.11 | 1.44 | 1.55 | (0.15) | $11.47 | 15.60% | 1.07% | 1.07% | 0.99% | 0.99% | 29% | $429,153 | |
| 2023 | $10.30 | 0.13 | (0.13) | — | (0.23) | $10.07 | 0.02% | 1.07% | 1.07% | 1.25% | 1.25% | 29% | $507,013 | |
| 2022 | $14.02 | 0.11 | (3.70) | (3.59) | (0.13) | $10.30 | (25.69)% | 1.06% | 1.06% | 1.04% | 1.04% | 52% | $828,883 | |
| 2021 | $13.97 | 0.09 | 0.07 | 0.16 | (0.11) | $14.02 | 1.09% | 1.05% | 1.05% | 0.56% | 0.56% | 35% | $1,661,545 | |
| 2020 | $11.56 | 0.06 | 2.54 | 2.60 | (0.19) | $13.97 | 22.94% | 1.06% | 1.06% | 0.53% | 0.53% | 30% | $1,534,445 | |
| Y Class | | | | | | | | | | | |
| 2024 | $10.10 | 0.13 | 1.44 | 1.57 | (0.17) | $11.50 | 15.72% | 0.92% | 0.92% | 1.14% | 1.14% | 29% | $40,090 | |
| 2023 | $10.32 | 0.13 | (0.11) | 0.02 | (0.24) | $10.10 | 0.23% | 0.92% | 0.92% | 1.40% | 1.40% | 29% | $33,189 | |
| 2022 | $14.05 | 0.13 | (3.71) | (3.58) | (0.15) | $10.32 | (25.60)% | 0.91% | 0.91% | 1.19% | 1.19% | 52% | $37,909 | |
| 2021 | $14.00 | 0.10 | 0.08 | 0.18 | (0.13) | $14.05 | 1.24% | 0.90% | 0.90% | 0.71% | 0.71% | 35% | $39,377 | |
| 2020 | $11.60 | 0.08 | 2.54 | 2.62 | (0.22) | $14.00 | 23.09% | 0.91% | 0.91% | 0.68% | 0.68% | 30% | $30,169 | |
| A Class | | | | | | | | | | | |
| 2024 | $9.43 | 0.06 | 1.35 | 1.41 | (0.11) | $10.73 | 15.06% | 1.52% | 1.52% | 0.54% | 0.54% | 29% | $36,158 | |
| 2023 | $9.67 | 0.08 | (0.12) | (0.04) | (0.20) | $9.43 | (0.41)% | 1.52% | 1.52% | 0.80% | 0.80% | 29% | $38,620 | |
| 2022 | $13.17 | 0.06 | (3.48) | (3.42) | (0.08) | $9.67 | (26.03)% | 1.51% | 1.51% | 0.59% | 0.59% | 52% | $51,434 | |
| 2021 | $13.13 | 0.01 | 0.07 | 0.08 | (0.04) | $13.17 | 0.60% | 1.50% | 1.50% | 0.11% | 0.11% | 35% | $94,363 | |
| 2020 | $10.84 | 0.01 | 2.40 | 2.41 | (0.12) | $13.13 | 22.50% | 1.51% | 1.51% | 0.08% | 0.08% | 30% | $88,485 | |
| C Class | | | | | | | | | | |
| 2024 | $8.46 | (0.02) | 1.22 | 1.20 | (0.03) | $9.63 | 14.25% | 2.27% | 2.27% | (0.21)% | (0.21)% | 29% | $5,750 | |
| 2023 | $8.71 | 0.01 | (0.11) | (0.10) | (0.15) | $8.46 | (1.18)% | 2.27% | 2.27% | 0.05% | 0.05% | 29% | $8,932 | |
| 2022 | $11.87 | (0.02) | (3.14) | (3.16) | — | $8.71 | (26.56)% | 2.26% | 2.26% | (0.16)% | (0.16)% | 52% | $13,231 | |
| 2021 | $11.88 | (0.08) | 0.07 | (0.01) | — | $11.87 | (0.17)% | 2.25% | 2.25% | (0.64)% | (0.64)% | 35% | $25,448 | |
| 2020 | $9.82 | (0.07) | 2.17 | 2.10 | (0.04) | $11.88 | 21.48% | 2.26% | 2.26% | (0.67)% | (0.67)% | 30% | $27,101 | |
| | | | | | | | | | | | | | | | | | | | | | | | | | | | | | | | | | | | | | | | | |
| For a Share Outstanding Throughout the Years Ended November 30 (except as noted) | | | | |
| Per-Share Data | | Ratios and Supplemental Data | | |
| | Income From Investment Operations*: | | | | Ratio to Average Net Assets of†: | | |
| Net Asset
Value,
Beginning
of Period | Net Investment Income (Loss)(1) | Net
Realized
and
Unrealized
Gain (Loss) | Total From
Investment
Operations | Distributions
From
Net
Investment
Income | Net Asset
Value,
End
of Period | Total Return(2) | Operating
Expenses | Operating
Expenses
(before
expense
waiver) | Net
Investment
Income
(Loss) | Net
Investment
Income
(Loss)
(before
expense
waiver) | Portfolio
Turnover
Rate | Net
Assets,
End of
Period
(in thousands) |
| R Class | | | | | | | | | | | |
| 2024 | $9.46 | 0.03 | 1.35 | 1.38 | (0.08) | $10.76 | 14.71% | 1.77% | 1.77% | 0.29% | 0.29% | 29% | $5,542 | |
| 2023 | $9.71 | 0.05 | (0.12) | (0.07) | (0.18) | $9.46 | (0.69)% | 1.77% | 1.77% | 0.55% | 0.55% | 29% | $5,309 | |
| 2022 | $13.22 | 0.03 | (3.49) | (3.46) | (0.05) | $9.71 | (26.20)% | 1.76% | 1.76% | 0.34% | 0.34% | 52% | $6,075 | |
| 2021 | $13.17 | (0.02) | 0.08 | 0.06 | (0.01) | $13.22 | 0.41% | 1.75% | 1.75% | (0.14)% | (0.14)% | 35% | $7,687 | |
| 2020 | $10.88 | (0.02) | 2.40 | 2.38 | (0.09) | $13.17 | 22.11% | 1.76% | 1.76% | (0.17)% | (0.17)% | 30% | $7,466 | |
| R5 Class | | | | | | | | | | | |
| 2024 | $10.08 | 0.11 | 1.43 | 1.54 | (0.15) | $11.47 | 15.48% | 1.07% | 1.07% | 0.99% | 0.99% | 29% | $857 | |
| 2023 | $10.31 | 0.12 | (0.12) | — | (0.23) | $10.08 | 0.02% | 1.07% | 1.07% | 1.25% | 1.25% | 29% | $9,249 | |
| 2022 | $14.04 | 0.11 | (3.71) | (3.60) | (0.13) | $10.31 | (25.67)% | 1.06% | 1.06% | 1.04% | 1.04% | 52% | $10,725 | |
| 2021 | $13.98 | 0.06 | 0.11 | 0.17 | (0.11) | $14.04 | 1.09% | 1.05% | 1.05% | 0.56% | 0.56% | 35% | $12,172 | |
| 2020 | $11.57 | 0.06 | 2.54 | 2.60 | (0.19) | $13.98 | 22.92% | 1.06% | 1.06% | 0.53% | 0.53% | 30% | $3,863 | |
| R6 Class | | | | | | | | | | | |
| 2024 | $10.08 | 0.11 | 1.46 | 1.57 | (0.17) | $11.48 | 15.75% | 0.92% | 0.92% | 1.14% | 1.14% | 29% | $205,572 | |
| 2023 | $10.31 | 0.14 | (0.13) | 0.01 | (0.24) | $10.08 | 0.13% | 0.92% | 0.92% | 1.40% | 1.40% | 29% | $460,847 | |
| 2022 | $14.03 | 0.13 | (3.70) | (3.57) | (0.15) | $10.31 | (25.56)% | 0.91% | 0.91% | 1.19% | 1.19% | 52% | $687,720 | |
| 2021 | $13.98 | 0.11 | 0.07 | 0.18 | (0.13) | $14.03 | 1.24% | 0.90% | 0.90% | 0.71% | 0.71% | 35% | $851,240 | |
| 2020 | $11.58 | 0.08 | 2.54 | 2.62 | (0.22) | $13.98 | 23.13% | 0.91% | 0.91% | 0.68% | 0.68% | 30% | $570,868 | |
| G Class | | | | | | | | | | | |
| 2024 | $10.20 | 0.23 | 1.44 | 1.67 | (0.25) | $11.62 | 16.79% | 0.02% | 0.92% | 2.04% | 1.14% | 29% | $784,988 | |
| 2023 | $10.40 | 0.23 | (0.13) | 0.10 | (0.30) | $10.20 | 1.04% | 0.02% | 0.92% | 2.30% | 1.40% | 29% | $766,148 | |
2022(3) | $12.44 | 0.16 | (2.08) | (1.92) | (0.12) | $10.40 | (15.56)% | 0.01% | 0.91% | 2.42% | 1.52% | 52%(4) | $731,719 | |
| | |
| Notes to Financial Highlights |
(1)Computed using average shares outstanding throughout the period.
(2)Total returns are calculated based on the net asset value of the last business day and do not reflect applicable sales charges, if any. Total returns for periods less than one year are not annualized.
(3)April 1, 2022 (commencement of sale) through November 30, 2022.
(4)Portfolio turnover is calculated at the fund level. Percentage indicated was calculated for the year ended November 30, 2022.
*The amount shown for a share outstanding throughout the period may not correlate with the Statement(s) of Operations or precisely reflect the class expense differentials due to the timing of transactions in shares of a fund in relation to income earned and/or fluctuations in the fair value of a fund's investments.
†Ratios for periods less than one year are annualized. Zero balances may reflect amounts less than 0.005%.
See Notes to Financial Statements.
| | |
| Report of Independent Registered Public Accounting Firm |
To the shareholders of the Emerging Markets Fund and the Board of Directors of American Century World Mutual Funds, Inc.
Opinion on the Financial Statements and Financial Highlights
We have audited the accompanying statement of assets and liabilities, including the schedule of investments, of Emerging Markets Fund (the “Fund”), one of the funds constituting the American Century World Mutual Funds, Inc., as of November 30, 2024, the related statement of operations for the year then ended, the statements of changes in net assets for each of the two years in the period then ended, the financial highlights for each of the five years in the period then ended, and the related notes. In our opinion, the financial statements and financial highlights present fairly, in all material respects, the financial position of the Fund as of November 30, 2024, and the results of its operations for the year then ended, the changes in its net assets for each of the two years in the period then ended, and the financial highlights for each of the five years in the period then ended, in conformity with accounting principles generally accepted in the United States of America.
Basis for Opinion
These financial statements and financial highlights are the responsibility of the Fund's management. Our responsibility is to express an opinion on the Fund’s financial statements and financial highlights based on our audits. We are a public accounting firm registered with the Public Company Accounting Oversight Board (United States) (PCAOB) and are required to be independent with respect to the Fund in accordance with the U.S. federal securities laws and the applicable rules and regulations of the Securities and Exchange Commission and the PCAOB.
We conducted our audits in accordance with the standards of the PCAOB. Those standards require that we plan and perform the audit to obtain reasonable assurance about whether the financial statements and financial highlights are free of material misstatement, whether due to error or fraud. The Fund is not required to have, nor were we engaged to perform, an audit of its internal control over financial reporting. As part of our audits, we are required to obtain an understanding of internal control over financial reporting but not for the purpose of expressing an opinion on the effectiveness of the Fund’s internal control over financial reporting. Accordingly, we express no such opinion.
Our audits included performing procedures to assess the risks of material misstatement of the financial statements and financial highlights, whether due to error or fraud, and performing procedures that respond to those risks. Such procedures included examining, on a test basis, evidence regarding the amounts and disclosures in the financial statements and financial highlights. Our audits also included evaluating the accounting principles used and significant estimates made by management, as well as evaluating the overall presentation of the financial statements and financial highlights. Our procedures included confirmation of securities owned as of November 30, 2024, by correspondence with the custodian and brokers; when replies were not received from brokers, we performed other auditing procedures. We believe that our audits provide a reasonable basis for our opinion.
/s/ Deloitte & Touche LLP
Kansas City, Missouri
January 16, 2025
We have served as the auditor of one or more American Century investment companies since 1997.
| | |
| Approval of Management Agreement |
At a meeting held on June 27, 2024, the Fund’s Board of Directors (the “Board”) unanimously approved the renewal of the management agreement pursuant to which American Century Investment Management, Inc. (the “Advisor”) acts as the investment advisor for the Fund. Under the Investment Company Act of 1940 (the “Investment Company Act”), contracts for investment advisory services are required to be reviewed, evaluated, and approved by a majority of a fund’s Directors, including a majority of the independent Directors.
Prior to its consideration of the renewal of the management agreement, the Directors requested and reviewed data and information compiled by the Advisor and certain independent consultants and data providers concerning the Fund. This review was in addition to the oversight and evaluation undertaken by the Board and its committees on a continual basis and the information received was supplemental to the information that the Board and its committees receive and consider over time.
In connection with its consideration of the renewal of the management agreement, the Board’s review and evaluation of the services provided by the Advisor and its affiliates included, but was not limited to
•the nature, extent, and quality of investment management, shareholder services, distribution services, and other services provided to the Fund;
•the wide range of programs and services the Advisor and other service providers provide to the Fund and its shareholders on a routine and non-routine basis;
•the Fund’s investment performance compared to appropriate benchmarks and/or peer groups of other mutual funds with similar investment objectives and strategies;
•the cost of owning the Fund compared to the cost of owning similarly-managed funds;
•the Advisor’s compliance policies, procedures, and regulatory experience and those of certain other service providers;
•the Advisor’s strategic plans, generally, and with respect to the Advisor’s response to investment management industry challenges;
•the Advisor’s business continuity plans, vendor management practices, and information security practices;
•the cost of services provided to the Fund, the profitability of the Fund to the Advisor, and the Advisor’s financial results of operation;
•possible economies of scale associated with the Advisor’s management of the Fund;
•any collateral benefits derived by the Advisor from the management of the Fund;
•fees and expenses associated with any investment by the Fund in other funds;
•payments to intermediaries by the Fund and the Advisor and services provided by intermediaries in connection therewith; and
•services provided and charges to the Advisor’s other investment management clients.
The Board held two meetings to consider the renewal. The independent Directors also met in private session multiple times to review and discuss the information provided in response to their request. The independent Directors held active discussions with the Advisor regarding the renewal of the management agreement, requesting supplemental information, and reviewing information provided by the Advisor in response thereto. The independent Directors had the benefit of the advice of their independent counsel throughout the process.
Factors Considered
The Directors considered all of the information provided by the Advisor, the independent consultant and data providers, and the independent Directors’ independent counsel in connection with the approval. They determined that the information was sufficient for them to evaluate the management agreement for the Fund. In connection with their review, the Directors did not identify any single factor as being all-important or controlling, and each Director may have attributed different levels of importance to different factors. In deciding to renew the management agreement, the Board based its decision on a number of factors, including without limitation the following:
Nature, Extent and Quality of Services — Generally. Under the management agreement, the Advisor is responsible for providing or arranging for all services necessary for the operation of the Fund. The Board noted that the Advisor provides or arranges at its own expense a wide variety of services which include, without limitation, the following:
•constructing and designing the Fund
•portfolio research and security selection
•initial capitalization/funding
•securities trading
•Fund administration
•custody of Fund assets
•daily valuation of the Fund’s portfolio
•liquidity monitoring and management
•risk management, including information security
•shareholder servicing and transfer agency, including shareholder confirmations, recordkeeping, and communications
•legal services (except the independent Directors’ counsel)
•regulatory and portfolio compliance
•financial reporting
•marketing and distribution (except amounts paid by the Fund under Rule 12b-1 plans)
The Board noted that many of these services have expanded over time in terms of both quantity and complexity in response to shareholder demands, competition in the industry, changing distribution channels, and the changing regulatory environment.
Investment Management Services. The nature of the investment management services provided to the Fund is quite complex and allows Fund shareholders access to professional money management, instant diversification of their investments, the opportunity to easily diversify among asset classes by investing in or exchanging among various American Century Investments funds, and liquidity. In evaluating investment performance, the Board expects the Advisor to manage the Fund in accordance with its investment objectives and principal investment strategies. Further, the Directors recognize that the Advisor has an obligation to monitor trading activities, and in particular to seek the best execution of fund trades, and to evaluate the use of and payment for research. In providing these services, the Advisor utilizes teams of investment professionals who require extensive information technology, research, training, compliance, and other systems to conduct their business. The Board, directly and through its Fund Performance Review Committee, provides oversight of the investment performance process. It regularly reviews investment performance information for the Fund, together with comparative information for appropriate benchmarks and/or peer groups of similarly-managed funds, over different time horizons. The Directors also review investment performance information from both the Advisor and an independent third party during the management agreement renewal process. If performance concerns are identified, the Board discusses with the Advisor the reasons for such results and any actions being taken to improve performance and may conduct special reviews until performance improves. The Fund’s performance was above its benchmark for the ten-year period and below its benchmark for the one-, three-, and five-year periods reviewed by the Board. In relation to industry peers, the Fund was above the median of its peer performance universe as identified by a third-party service provider for the ten-year period and below the median for the one-, three-, and five-year periods. The Board discussed the Fund’s performance with the Advisor, including steps being taken to address underperformance, and was satisfied with the efforts being undertaken by the Advisor. The Board found the investment management services provided by the Advisor to the Fund to be satisfactory and consistent with the management agreement.
Shareholder and Other Services. Under the management agreement, the Advisor provides the Fund with a comprehensive package of transfer agency, shareholder, and other services. The Board, directly and through its various committees, regularly reviews reports and evaluations of such services at its regular meetings. These reports include, but are not limited to, information regarding the operational efficiency and accuracy of the shareholder and transfer agency services provided, staffing levels, shareholder satisfaction, technology support (including information security), new products and services offered to Fund shareholders, securities trading activities, portfolio valuation services, auditing services, and legal and operational compliance activities. The Board found the services provided by the Advisor to the Fund under the management agreement to be competitive and of high quality.
Costs of Services and Profitability. The Advisor provides detailed information concerning its cost of providing various services to the Fund, its profitability in managing the Fund (pre- and post-distribution), and its financial results of operation. The Directors have reviewed with the Advisor the methodology used to prepare this financial information and arranged for an independent consultant to confirm the reasonableness of the allocation methodology used. This information is considered in evaluating the Advisor’s financial condition, its ability to continue to provide services under the management agreement, and the reasonableness of the terms of the current management agreement. The Board concluded that the Advisor’s profits were reasonable in light of the services provided to the Fund.
Ethics. The Board generally considers the Advisor’s commitment to providing quality services to shareholders and to conducting its business ethically. They noted that the Advisor’s practices generally meet or exceed industry best practices.
Economies of Scale. The Board also reviewed information provided by the Advisor regarding the possible existence of economies of scale in connection with the management of the Fund. The Board concluded that economies of scale are difficult to measure and predict with precision, especially on a fund-by-fund basis. The Board concluded that the Advisor is sharing economies of scale, to the extent they exist, through its fee structure, and through reinvestment in its business, infrastructure, investment capabilities and initiatives to provide shareholders enhanced and expanded content and services.
Comparison to Other Funds’ Fees. The management agreement provides that the Fund pays the Advisor a single, all-inclusive (or unified) management fee for providing all services necessary for the management and operation of the Fund, other than brokerage and other transaction fees and expenses relating to acquisition and disposition of portfolio securities, acquired fund fees and expenses, taxes, interest, extraordinary expenses, fund litigation expenses, fees and expenses of the Fund’s independent Directors (including their independent legal counsel), and expenses incurred in connection with the provision of shareholder services and distribution services under a plan adopted pursuant to Investment Company Act Rule 12b-1. Under the unified fee structure, the Advisor is responsible for providing all investment advisory, custody, audit, administrative, compliance, recordkeeping, marketing and shareholder services, or arranging and supervising third parties to provide such services. By contrast, most other funds are charged a variety of fees, including an investment advisory fee, a transfer agency fee, an administrative fee, distribution charges, and other expenses. Other than their investment advisory fees and any applicable Rule 12b-1 distribution fees, all other components of the total fees charged by these other funds may be increased without shareholder approval. The Board believes
the unified fee structure is a benefit to Fund shareholders because it clearly discloses to shareholders the cost of owning Fund shares, and, since the unified fee cannot be increased without a vote of Fund shareholders, it shifts to the Advisor the risk of increased costs of operating the Fund and provides a direct incentive to minimize administrative inefficiencies. Part of the Board’s analysis of fee levels involves reviewing certain evaluative data compiled by an independent provider comparing the Fund’s unified fee to the total expense ratios of its peers. The unified fee charged to shareholders of the Fund was below the median of the total expense ratios of the Fund’s peer expense universe. In addition, the Board reviewed the Fund’s position relative to the narrower set of its expense group peers. The Board concluded that the management fee paid by the Fund to the Advisor under the management agreement is reasonable in light of the services provided to the Fund.
Comparison to Fees and Services Provided to Other Clients of the Advisor. The Board also requested and received information from the Advisor concerning the nature of the services, fees, costs, and profitability of its advisory services to advisory clients other than the Fund. They observed that these varying types of client accounts require different services and involve different regulatory and entrepreneurial risks than the management of the Fund. The Board analyzed this information and concluded that the fees charged and services provided to the Fund were reasonable by comparison.
Payments to Intermediaries. The Directors also requested and received a description of payments made to intermediaries by the Fund and the Advisor and services provided in response thereto. These payments include various payments made by the Fund or the Advisor to different types of intermediaries and recordkeepers for distribution and service activities provided for the Fund. The Directors reviewed such information and received representations from the Advisor that all such payments by the Fund were made pursuant to the Fund’s Rule 12b-1 Plan and that all such payments by the Advisor were made from the Advisor’s resources and reasonable profits.
Collateral or “Fall-Out” Benefits Derived by the Advisor. The Board considered the possible existence of collateral benefits the Advisor may receive as a result of its relationship with the Fund. They concluded that the Advisor’s primary business is managing funds and it generally does not use fund or shareholder information to generate profits in other lines of business, and therefore does not derive any significant collateral benefits from them. To the extent there are potential collateral benefits, the Board has been advised and has taken this into consideration in its review of the management contract with the Fund. The Board noted that additional assets from other clients may offer the Advisor some benefit from increased leverage with prospective clients, service providers, and counterparties. Additionally, the Advisor may receive proprietary research from broker-dealers that execute fund portfolio transactions, which the Board concluded is likely to benefit other clients of the Advisor, as well as Fund shareholders. The Board also determined that the Advisor is able to provide investment management services to certain clients other than the Fund, at least in part, due to its existing infrastructure built to serve the fund complex. The Board concluded that appropriate allocation methodologies had been employed to assign resources and the cost of those resources to these other clients.
Existing Relationship. The Board also considered whether there was any reason for not continuing the existing arrangement with the Advisor. In this regard, the Board was mindful of the potential disruptions of the Fund’s operations and various risks, uncertainties, and other effects that could occur as a result of a decision not to continue such relationship. In particular, the Board recognized that most shareholders have invested in the Fund on the strength of the Advisor’s industry standing and reputation and in the expectation that the Advisor will have a continuing role in providing advisory services to the Fund.
Conclusion of the Directors. As a result of this process, the Board, including all of the independent Directors, taking into account all of the factors discussed above and the information provided by the Advisor and others in connection with its review and received over time, determined that the terms of the management agreement are fair and reasonable and that the management fee charged to the Fund is reasonable in light of the services provided and that the management agreement between the Fund and the Advisor should be renewed for an additional one-year period.
Other Tax Information
The following information is provided pursuant to provisions of the Internal Revenue Code.
The fund hereby designates up to the maximum amount allowable as qualified dividend income for the fiscal year ended November 30, 2024.
For the fiscal year ended November 30, 2024, the fund intends to pass through to shareholders foreign source income of $43,366,257 and foreign taxes paid of $10,145,819, or up to the maximum amount allowable, as a foreign tax credit. Foreign source income and foreign tax expense per outstanding share on November 30, 2024 are $0.2784 and $0.0651, respectively.
| | | | | | | | |
| Contact Us | americancentury.com | |
| Automated Information Line | 1-800-345-8765 | |
| Investor Services Representative | 1-800-345-2021
or 816-531-5575 | |
| Banks and Trust Companies, Broker-Dealers, Financial Professionals, Insurance Companies | 1-800-345-6488 | |
| | |
| This report and the statements it contains are submitted for the general information of our shareholders. The report is not authorized for distribution to prospective investors unless preceded or accompanied by an effective prospectus. | |
| | |
©2025 American Century Proprietary Holdings, Inc. All rights reserved.
CL-ANN-91030 2501 | |
| | | | | |
| |
| Annual Financial Statements and Other Information |
| |
| November 30, 2024 |
| |
| Emerging Markets Small Cap Fund |
| Investor Class (AECVX) |
| I Class (AECSX) |
| A Class (AECLX) |
| C Class (AECHX) |
| R Class (AECMX) |
| R6 Class (AECTX) |
| | | | | |
| Schedule of Investments | |
| Statement of Assets and Liabilities | |
| Statement of Operations | |
| Statement of Changes in Net Assets | |
| Notes to Financial Statements | |
| Financial Highlights | |
| Report of Independent Registered Public Accounting Firm | |
| Approval of Management Agreement | |
| |
| Other Tax Information | |
NOVEMBER 30, 2024
| | | | | | | | |
| | Shares | Value |
| COMMON STOCKS — 95.9% | | |
| Brazil — 5.3% | | |
Embraer SA, ADR(1) | 9,374 | | $ | 358,368 | |
| Inter & Co., Inc., Class A | 18,422 | | 85,110 | |
| Marcopolo SA, Preference Shares | 261,240 | | 364,281 | |
| PRIO SA | 11,100 | | 73,590 | |
| Vivara Participacoes SA | 24,500 | | 91,944 | |
VTEX, Class A(1) | 37,335 | | 232,224 | |
| | | 1,205,517 | |
| Canada — 0.8% | | |
ERO Copper Corp.(1)(2) | 11,752 | | 179,547 | |
| China — 12.7% | | |
| Atour Lifestyle Holdings Ltd., ADR | 5,445 | | 136,942 | |
| BOC Aviation Ltd. | 21,200 | | 164,201 | |
| China Lesso Group Holdings Ltd. | 469,000 | | 212,553 | |
| China Overseas Property Holdings Ltd. | 505,000 | | 339,304 | |
GDS Holdings Ltd., ADR(1) | 15,264 | | 300,548 | |
| Haitian International Holdings Ltd. | 117,000 | | 298,506 | |
| Henan Pinggao Electric Co. Ltd., Class A | 152,000 | | 367,579 | |
MMG Ltd.(1) | 520,000 | | 178,486 | |
| Shenzhen Envicool Technology Co. Ltd., Class A | 76,440 | | 396,046 | |
| Tongcheng Travel Holdings Ltd. | 139,200 | | 342,217 | |
Xtep International Holdings Ltd.(2) | 233,500 | | 158,708 | |
| | | 2,895,090 | |
| Greece — 0.9% | | |
| Piraeus Financial Holdings SA | 55,172 | | 202,872 | |
| Hong Kong — 0.5% | | |
MGM China Holdings Ltd.(2) | 90,800 | | 114,293 | |
| India — 27.0% | | |
| Alembic Pharmaceuticals Ltd. | 28,276 | | 366,313 | |
| CMS Info Systems Ltd. | 44,189 | | 260,165 | |
| Crompton Greaves Consumer Electricals Ltd. | 48,762 | | 236,998 | |
| Endurance Technologies Ltd. | 7,480 | | 208,343 | |
| Fortis Healthcare Ltd. | 50,237 | | 393,020 | |
| Indian Hotels Co. Ltd. | 40,019 | | 376,799 | |
| Jyothy Labs Ltd. | 59,084 | | 294,425 | |
| KEI Industries Ltd. | 8,058 | | 412,820 | |
MakeMyTrip Ltd.(1) | 2,023 | | 232,119 | |
PB Fintech Ltd.(1) | 17,842 | | 401,768 | |
| Persistent Systems Ltd. | 2,531 | | 177,376 | |
| Phoenix Mills Ltd. | 17,960 | | 353,045 | |
| Poly Medicure Ltd. | 15,771 | | 520,141 | |
| Prestige Estates Projects Ltd. | 22,618 | | 443,525 | |
| Shriram Finance Ltd. | 5,801 | | 207,624 | |
| Supreme Industries Ltd. | 3,089 | | 170,239 | |
| Torrent Pharmaceuticals Ltd. | 5,695 | | 224,385 | |
| Varun Beverages Ltd. | 65,545 | | 481,874 | |
| V-Guard Industries Ltd. | 53,757 | | 265,687 | |
| Wonderla Holidays Ltd. | 10,024 | | 98,628 | |
| | | 6,125,294 | |
| | | | | | | | |
| | Shares | Value |
| Indonesia — 2.7% | | |
| Aspirasi Hidup Indonesia Tbk. PT | 4,313,500 | | $ | 209,893 | |
| Ciputra Development Tbk. PT | 2,934,200 | | 198,424 | |
| United Tractors Tbk. PT | 121,400 | | 205,076 | |
| | 613,393 | |
| Malaysia — 2.0% | | |
| Gamuda Bhd. | 221,200 | | 443,874 | |
| Mexico — 0.8% | | |
Corp. Inmobiliaria Vesta SAB de CV(2) | 33,130 | | 78,872 | |
Gentera SAB de CV(2) | 81,005 | | 102,272 | |
| | 181,144 | |
| Philippines — 1.3% | | |
| GT Capital Holdings, Inc. | 16,960 | | 189,643 | |
| International Container Terminal Services, Inc. | 17,560 | | 110,769 | |
| | 300,412 | |
Russia(3) — 0.0% | | |
HeadHunter Group PLC, ADR(1) | 776 | | — | |
| Saudi Arabia — 4.0% | | |
| Catrion Catering Holding Co. | 2,967 | | 98,732 | |
| Leejam Sports Co. JSC | 3,333 | | 161,410 | |
| National Medical Care Co. | 6,000 | | 258,987 | |
| Riyadh Cables Group Co. | 7,173 | | 246,075 | |
| SAL Saudi Logistics Services | 2,054 | | 141,017 | |
| | 906,221 | |
| South Africa — 4.2% | | |
| Capitec Bank Holdings Ltd. | 702 | | 127,410 | |
| Clicks Group Ltd. | 19,778 | | 433,586 | |
| Mr. Price Group Ltd. | 24,534 | | 393,174 | |
| | 954,170 | |
| South Korea — 10.1% | | |
| Cosmax, Inc. | 1,156 | | 110,696 | |
| Fila Holdings Corp. | 3,341 | | 97,496 | |
| HD HYUNDAI MIPO | 3,075 | | 277,757 | |
| HYBE Co. Ltd. | 1,599 | | 224,024 | |
| Hyundai Autoever Corp. | 1,116 | | 112,690 | |
| Hyundai Rotem Co. Ltd. | 7,580 | | 276,713 | |
| Hyundai Steel Co. | 5,593 | | 84,296 | |
| IsuPetasys Co. Ltd. | 6,564 | | 106,738 | |
| LG H&H Co. Ltd. | 457 | | 102,150 | |
| LG Innotek Co. Ltd. | 810 | | 94,830 | |
| Park Systems Corp. | 776 | | 113,444 | |
| PharmaResearch Co. Ltd. | 1,645 | | 234,953 | |
Sanil Electric Co. Ltd.(1) | 7,523 | | 335,704 | |
Silicon2 Co. Ltd.(1) | 6,956 | | 123,274 | |
| | 2,294,765 | |
| Taiwan — 19.0% | | |
| Accton Technology Corp. | 11,000 | | 224,607 | |
| Asia Vital Components Co. Ltd. | 11,000 | | 220,892 | |
| ASMedia Technology, Inc. | 2,000 | | 100,599 | |
| ASPEED Technology, Inc. | 1,000 | | 127,474 | |
| Bizlink Holding, Inc. | 28,067 | | 565,033 | |
| Chroma ATE, Inc. | 20,000 | | 256,315 | |
| Eclat Textile Co. Ltd. | 13,000 | | 213,794 | |
| Elite Material Co. Ltd. | 22,000 | | 320,083 | |
| | | | | | | | |
| | Shares | Value |
| Fortune Electric Co. Ltd. | 18,000 | | $ | 306,991 | |
| Gold Circuit Electronics Ltd. | 44,000 | | 253,751 | |
| Gourmet Master Co. Ltd. | 80,000 | | 236,240 | |
| Gudeng Precision Industrial Co. Ltd. | 13,000 | | 200,956 | |
| King Yuan Electronics Co. Ltd. | 77,000 | | 303,870 | |
| Kinik Co. | 31,000 | | 287,469 | |
| Lotes Co. Ltd. | 5,000 | | 278,403 | |
| Nien Made Enterprise Co. Ltd. | 17,000 | | 210,800 | |
| Pegavision Corp. | 8,000 | | 92,643 | |
| Poya International Co. Ltd. | 8,000 | | 118,163 | |
| | 4,318,083 | |
| Thailand — 2.7% | | |
| Bumrungrad Hospital PCL | 20,100 | | 122,038 | |
| Minor International PCL | 314,900 | | 246,188 | |
| WHA Corp. PCL | 1,415,400 | | 235,512 | |
| | 603,738 | |
| Turkey — 0.9% | | |
| Migros Ticaret AS | 15,367 | | 214,399 | |
| United Arab Emirates — 1.0% | | |
| Burjeel Holdings PLC | 176,654 | | 101,091 | |
| Emirates Central Cooling Systems Corp. | 253,653 | | 126,403 | |
| | 227,494 | |
TOTAL COMMON STOCKS (Cost $17,878,730) | | 21,780,306 | |
| EXCHANGE-TRADED FUNDS — 0.7% | | |
Fubon Taiwan Small-Mid Cap Alpha Momentum 50 ETF (Cost $138,977) | 93,000 | | 153,309 | |
| SHORT-TERM INVESTMENTS — 6.2% | | |
| Money Market Funds — 1.1% | | |
State Street Navigator Securities Lending Government Money Market Portfolio(4) | 253,976 | | 253,976 | |
| Repurchase Agreements — 5.1% | | |
| BMO Capital Markets Corp., (collateralized by various U.S. Treasury obligations, 3.625%, 2/15/44, valued at $107,983), in a joint trading account at 4.56%, dated 11/29/24, due 12/2/24 (Delivery value $106,088) | | 106,048 | |
| Fixed Income Clearing Corp., (collateralized by various U.S. Treasury obligations, 2.00%, 2/15/50, valued at $1,071,027), at 4.57%, dated 11/29/24, due 12/2/24 (Delivery value $1,050,400) | | 1,050,000 | |
| | 1,156,048 | |
TOTAL SHORT-TERM INVESTMENTS (Cost $1,410,024) | | 1,410,024 | |
TOTAL INVESTMENT SECURITIES — 102.8% (Cost $19,427,731) | | 23,343,639 | |
| OTHER ASSETS AND LIABILITIES — (2.8)% | | (636,949) | |
| TOTAL NET ASSETS — 100.0% | | $ | 22,706,690 | |
| | | | | |
| MARKET SECTOR DIVERSIFICATION | |
| (as a % of net assets) | |
| Industrials | 28.1% |
| Consumer Discretionary | 17.6% |
| Information Technology | 14.1% |
| Health Care | 10.2% |
| Real Estate | 7.3% |
| Consumer Staples | 7.2% |
| Financials | 5.0% |
| Materials | 2.7% |
| Communication Services | 2.0% |
| Energy | 1.2% |
| Utilities | 0.5% |
| Exchange-Traded Funds | 0.7% |
| Short-Term Investments | 6.2% |
| Other Assets and Liabilities | (2.8)% |
| | | | | | | | |
| NOTES TO SCHEDULE OF INVESTMENTS |
| ADR | – | American Depositary Receipt |
(1)Non-income producing.
(2)Security, or a portion thereof, is on loan. At the period end, the aggregate value of securities on loan was $449,653. The amount of securities on loan indicated may not correspond with the securities on loan identified because securities with pending sales are in the process of recall from the brokers.
(3)Securities may be subject to resale, redemption or transferability restrictions.
(4)Investment of cash collateral from securities on loan. At the period end, the aggregate value of the collateral held by the fund was $474,935, which includes securities collateral of $220,959.
See Notes to Financial Statements.
| | |
| Statement of Assets and Liabilities |
| | | | | |
| NOVEMBER 30, 2024 | |
| Assets | |
| Investment securities, at value (cost of $19,173,755) — including $449,653 of securities on loan | $ | 23,089,663 | |
| Investment made with cash collateral received for securities on loan, at value (cost of $253,976) | 253,976 | |
| Total investment securities, at value (cost of $19,427,731) | 23,343,639 | |
| Cash | 4,773 | |
| Receivable for capital shares sold | 17,888 | |
| Dividends and interest receivable | 9,052 | |
| Securities lending receivable | 167 | |
| Other assets | 509 | |
| 23,376,028 | |
| |
| Liabilities | |
| Payable for collateral received for securities on loan | 253,976 | |
| Payable for capital shares redeemed | 15,144 | |
| Accrued management fees | 22,142 | |
| Distribution and service fees payable | 382 | |
| Accrued foreign taxes | 377,694 | |
| 669,338 | |
| |
| Net Assets | $ | 22,706,690 | |
| |
| Net Assets Consist of: | |
| Capital (par value and paid-in surplus) | $ | 19,585,861 | |
| Distributable earnings (loss) | 3,120,829 | |
| $ | 22,706,690 | |
| | | | | | | | | | | |
| Net Assets | Shares Outstanding | Net Asset Value Per Share* |
| Investor Class, $0.01 Par Value | $3,019,867 | 204,630 | $14.76 |
| I Class, $0.01 Par Value | $13,639,046 | 918,737 | $14.85 |
| A Class, $0.01 Par Value | $473,477 | 32,379 | $14.62 |
| C Class, $0.01 Par Value | $14,869 | 1,060 | $14.03 |
| R Class, $0.01 Par Value | $656,586 | 45,424 | $14.45 |
| R6 Class, $0.01 Par Value | $4,902,845 | 328,793 | $14.91 |
*Maximum offering price per share was equal to the net asset value per share for all share classes, except A Class, for which the maximum offering price per share was $15.51 (net asset value divided by 0.9425). A contingent deferred sales charge may be imposed on redemptions of A Class and C Class.
See Notes to Financial Statements.
| | | | | |
| YEAR ENDED NOVEMBER 30, 2024 | |
| Investment Income (Loss) | |
| Income: | |
| Dividends (net of foreign taxes withheld of $36,193) | $ | 354,319 | |
| Interest | 27,933 | |
| Securities lending, net | 2,553 | |
| 384,805 | |
| |
| Expenses: | |
| Management fees | 241,521 | |
| Distribution and service fees: | |
| A Class | 1,107 | |
| C Class | 149 | |
| R Class | 3,594 | |
| Directors' fees and expenses | 581 | |
| Other expenses | 349 | |
| 247,301 | |
| |
| |
| |
| Net investment income (loss) | 137,504 | |
| |
| Realized and Unrealized Gain (Loss) | |
| Net realized gain (loss) on: | |
| Investment transactions (net of foreign tax expenses paid (refunded) of $107,155) | 573,972 | |
| Foreign currency translation transactions | (40,273) | |
| 533,699 | |
| |
| Change in net unrealized appreciation (depreciation) on: | |
| Investments (includes (increase) decrease in accrued foreign taxes of $(198,895)) | 760,203 | |
| Translation of assets and liabilities in foreign currencies | 421 | |
| 760,624 | |
| |
| Net realized and unrealized gain (loss) | 1,294,323 | |
| |
| Net Increase (Decrease) in Net Assets Resulting from Operations | $ | 1,431,827 | |
See Notes to Financial Statements.
| | |
| Statement of Changes in Net Assets |
| | | | | | | | |
| YEARS ENDED NOVEMBER 30, 2024 AND NOVEMBER 30, 2023 |
| Increase (Decrease) in Net Assets | November 30, 2024 | November 30, 2023 |
| Operations | | |
| Net investment income (loss) | $ | 137,504 | | $ | 117,194 | |
| Net realized gain (loss) | 533,699 | | (300,120) | |
| Change in net unrealized appreciation (depreciation) | 760,624 | | 1,750,190 | |
| Net increase (decrease) in net assets resulting from operations | 1,431,827 | | 1,567,264 | |
| | |
| Distributions to Shareholders | | |
| From earnings: | | |
| Investor Class | (23,263) | | (50,517) | |
| I Class | (103,777) | | (137,593) | |
| A Class | (2,472) | | (4,405) | |
| C Class | — | | (135) | |
| R Class | (1,872) | | (7,964) | |
| R6 Class | (24,395) | | (26,437) | |
| Decrease in net assets from distributions | (155,779) | | (227,051) | |
| | |
| Capital Share Transactions | | |
| Net increase (decrease) in net assets from capital share transactions (Note 5) | 7,030,932 | | 2,422,828 | |
| | |
| Net increase (decrease) in net assets | 8,306,980 | | 3,763,041 | |
| | |
| Net Assets | | |
| Beginning of period | 14,399,710 | | 10,636,669 | |
| End of period | $ | 22,706,690 | | $ | 14,399,710 | |
See Notes to Financial Statements.
| | |
| Notes to Financial Statements |
NOVEMBER 30, 2024
1. Organization
American Century World Mutual Funds, Inc. (the corporation) is registered under the Investment Company Act of 1940, as amended (the 1940 Act), as an open-end management investment company and is organized as a Maryland corporation. Emerging Markets Small Cap Fund (the fund) is one fund in a series issued by the corporation. The fund’s investment objective is to seek capital growth.
The fund offers the Investor Class, I Class, A Class, C Class, R Class and R6 Class. The A Class may incur an initial sales charge. The A Class and C Class may be subject to a contingent deferred sales charge.
2. Significant Accounting Policies
The following is a summary of significant accounting policies consistently followed by the fund in preparation of its financial statements. The fund is an investment company and follows accounting and reporting guidance in accordance with accounting principles generally accepted in the United States of America. This may require management to make certain estimates and assumptions at the date of the financial statements. Actual results could differ from these estimates. Management evaluated the impact of events or transactions occurring through the date the financial statements were issued that would merit recognition or disclosure.
Investment Valuations — The fund determines the fair value of its investments and computes its net asset value (NAV) per share at the close of regular trading (usually 4 p.m. Eastern time) on the New York Stock Exchange (NYSE) on each day the NYSE is open. The value of investments of the fund is determined by American Century Investment Management, Inc. (ACIM) (the investment advisor), as the valuation designee, pursuant to its valuation policies and procedures. The Board of Directors oversees the valuation designee and reviews its valuation policies and procedures at least annually.
Equity securities that are listed or traded on a domestic securities exchange are valued at the last reported sales price or at the official closing price as provided by the exchange. Equity securities traded on foreign securities exchanges are generally valued at the closing price of such securities on the exchange where primarily traded or at the close of the NYSE, if that is earlier. If no last sales price is reported, or if local convention or regulation so provides, the mean of the latest bid and asked prices may be used. Securities traded over-the-counter are valued at the mean of the latest bid and asked prices, the last sales price, or the official closing price.
Open-end management investment companies are valued at the reported NAV per share. Repurchase agreements are valued at cost, which approximates fair value.
If the valuation designee determines that the market price for a portfolio security is not readily available or is believed by the valuation designee to be unreliable, such security is valued at fair value as determined in good faith by the valuation designee, in accordance with its policies and procedures. Circumstances that may cause the fund to determine that market quotations are not available or reliable include, but are not limited to: when there is a significant event subsequent to the market quotation; trading in a security has been halted during the trading day; or trading in a security is insufficient or did not take place due to a closure or holiday.
The valuation designee monitors for significant events occurring after the close of an investment’s primary exchange but before the fund’s NAV per share is determined. Significant events may include, but are not limited to: corporate announcements and transactions; regulatory news, governmental action and political unrest that could impact a specific investment or an investment sector; or armed conflicts, natural disasters and similar events that could affect investments in a specific country or region. The valuation designee also monitors for significant fluctuations between domestic and foreign markets, as evidenced by the U.S. market or such other indicators that it deems appropriate. The valuation designee may apply a model-derived factor to the closing price of equity securities traded on foreign securities exchanges. The factor is based on observable market data as provided by an independent pricing service.
Foreign Currency Translations — All assets and liabilities, including investment securities and other financial instruments, initially expressed in foreign currencies are translated into U.S. dollars each day at the mean of the appropriate currency exchange rate at the close of the NYSE as provided by an independent pricing service. The fund may enter into spot foreign currency exchange contracts to facilitate transactions denominated in a foreign currency. Purchases and sales of investment securities, dividend and interest income, spot foreign currency exchange contracts, and expenses are translated at the rates of exchange prevailing on the respective dates of such transactions. Net realized and unrealized foreign currency exchange gains or losses related to investment securities are a component of net realized gain (loss) on investment transactions and change in net unrealized appreciation (depreciation) on investments, respectively.
Security Transactions — Security transactions are accounted for as of the trade date. Net realized gains and losses are determined on the identified cost basis, which is also used for federal income tax purposes. Certain countries impose taxes on realized gains on the sale of securities registered in their country. The fund records the foreign tax expense, if any, on an accrual basis. The foreign tax expense on realized gains and unrealized appreciation reduces the net realized gain (loss) on investment transactions and net unrealized appreciation (depreciation) on investments, respectively.
Investment Income — Dividend income less foreign taxes withheld, if any, is recorded as of the ex-dividend date. Distributions received on securities that represent a return of capital or long-term capital gain are recorded as a reduction of cost of investments and/or as a realized gain. The fund may estimate the components of distributions received that may be considered nontaxable distributions or long-term capital gain distributions for income tax purposes. Interest income is recorded on the accrual basis and includes accretion of discounts and amortization of premiums. Securities lending income is net of fees and rebates earned by the lending agent for its services.
Repurchase Agreements — The fund may enter into repurchase agreements with institutions that ACIM has determined are creditworthy pursuant to criteria adopted by the Board of Directors. The fund requires that the collateral, represented by securities, received in a repurchase transaction be transferred to the custodian in a manner sufficient to enable the fund to obtain those securities in the event of a default under the repurchase agreement. ACIM monitors, on a daily basis, the securities transferred to ensure the value, including accrued interest, of the securities under each repurchase agreement is equal to or greater than amounts owed to the fund under each repurchase agreement.
Joint Trading Account — Pursuant to an Exemptive Order issued by the Securities and Exchange Commission, the fund, along with certain other funds in the American Century Investments family of funds, may transfer uninvested cash balances into a joint trading account. These balances are invested in one or more repurchase agreements that are collateralized by U.S. Treasury or Agency obligations.
Income Tax Status — It is the fund's policy to distribute substantially all net investment income and net realized gains to shareholders and to otherwise qualify as a regulated investment company under provisions of the Internal Revenue Code. Accordingly, no provision has been made for income taxes. The fund files U.S. federal, state, local and non-U.S. tax returns as applicable. The fund's tax returns are subject to examination by the relevant taxing authority until expiration of the applicable statute of limitations, which is generally three years from the date of filing but can be longer in certain jurisdictions. At this time, management believes there are no uncertain tax positions which, based on their technical merit, would not be sustained upon examination and for which it is reasonably possible that the total amounts of unrecognized tax benefits will significantly change in the next twelve months.
Multiple Class — All shares of the fund represent an equal pro rata interest in the net assets of the class to which such shares belong, and have identical voting, dividend, liquidation and other rights and the same terms and conditions, except for class specific expenses and exclusive rights to vote on matters affecting only individual classes. Income, non-class specific expenses, and realized and unrealized capital gains and losses of the fund are allocated to each class of shares based on their relative net assets.
Distributions to Shareholders — Distributions from net investment income and net realized gains, if any, are generally declared and paid annually. The fund may make distributions on a more frequent basis to comply with the distribution requirements of the Internal Revenue Code, in all events in a manner consistent with provisions of the 1940 Act.
Indemnifications — Under the corporation’s organizational documents, its officers and directors are indemnified against certain liabilities arising out of the performance of their duties to the fund. In addition, in the normal course of business, the fund enters into contracts that provide general indemnifications. The maximum exposure under these arrangements is unknown as this would involve future claims that may be made against a fund. The risk of material loss from such claims is considered by management to be remote.
Securities Lending — Securities are lent to qualified financial institutions and brokers. State Street Bank & Trust Co. serves as securities lending agent to the fund pursuant to a Securities Lending Agreement. The lending of securities exposes the fund to risks such as: the borrowers may fail to return the loaned securities, the borrowers may not be able to provide additional collateral, the fund may experience delays in recovery of the loaned securities or delays in access to collateral, or the fund may experience losses related to the investment collateral. To minimize certain risks, loan counterparties pledge collateral in the form of cash and/or securities. The lending agent has agreed to indemnify the fund in the case of default of any securities borrowed. Cash collateral received is invested in the State Street Navigator Securities Lending Government Money Market Portfolio, a money market mutual fund registered under the 1940 Act. The loans may also be secured by U.S. government securities in an amount at least equal to the market value of the securities loaned, plus accrued interest and dividends, determined on a daily basis and adjusted accordingly. By lending securities, the fund seeks to increase its net investment income through the receipt of interest and fees. Such income is reflected separately within the Statement of Operations. The value of loaned securities and related collateral outstanding at period end, if any, are shown on a gross basis within the Schedule of Investments and Statement of Assets and Liabilities.
The following table reflects a breakdown of transactions accounted for as secured borrowings, the gross obligation by the type of collateral pledged, and the remaining contractual maturity of those transactions as of November 30, 2024.
| | | | | | | | | | | | | | | | | |
| Remaining Contractual Maturity of Agreements |
| Overnight and Continuous | <30 days | Between 30 & 90 days | >90 days | Total |
Securities Lending Transactions(1) | | | | |
| Common Stocks | $ | 253,976 | | — | | — | | — | | $ | 253,976 | |
| Gross amount of recognized liabilities for securities lending transactions | $ | 253,976 | |
(1)Amount represents the payable for cash collateral received for securities on loan. This will generally be in the Overnight and Continuous column as the securities are typically callable on demand.
3. Fees and Transactions with Related Parties
Certain officers and directors of the corporation are also officers and/or directors of American Century Companies, Inc. (ACC). The corporation's investment advisor, ACIM, the corporation's distributor, American Century Investment Services, Inc. (ACIS), and the corporation's transfer agent, American Century Services, LLC, are wholly owned, directly or indirectly, by ACC.
Management Fees — The corporation has entered into a management agreement with ACIM, under which ACIM provides the fund with investment advisory and management services in exchange for a single, unified management fee (the fee) per class. The agreement provides that ACIM will pay all expenses of managing and operating the fund, except brokerage expenses, taxes, interest, fees and expenses of the independent directors (including legal counsel fees), extraordinary expenses, and expenses incurred in connection with the provision of shareholder services and distribution services under a plan adopted pursuant to Rule 12b-1 under the 1940 Act. The fee is computed and accrued daily based on each class's daily net assets and paid monthly in arrears. The difference in the fee among the classes is a result of their separate arrangements for non-Rule 12b-1 shareholder services. It is not the result of any difference in advisory or custodial fees or other expenses related to the management of the fund’s assets, which do not vary by class.
The annual management fee for each class is as follows:
| | | | | | | | | | | | | | | | | |
| Investor Class | I Class | A Class | C Class | R Class | R6 Class |
| 1.39% | 1.19% | 1.39% | 1.39% | 1.39% | 1.04% |
Distribution and Service Fees — The Board of Directors has adopted a separate Master Distribution and Individual Shareholder Services Plan for each of the A Class, C Class and R Class (collectively the plans), pursuant to Rule 12b-1 of the 1940 Act. The plans provide that the A Class will pay ACIS an annual distribution and service fee of 0.25%. The plans provide that the C Class will pay ACIS an annual distribution and service fee of 1.00%, of which 0.25% is paid for individual shareholder services and 0.75% is paid for distribution services. The plans provide that the R Class will pay ACIS an annual distribution and service fee of 0.50%. The fees are computed and accrued daily based on each class’s daily net assets and paid monthly in arrears. The fees are used to pay financial intermediaries for distribution and individual shareholder services. Fees incurred under the plans during the period ended November 30, 2024 are detailed in the Statement of Operations.
Directors' Fees and Expenses — The Board of Directors is responsible for overseeing the investment advisor’s management and operations of the fund. The directors receive detailed information about the fund and its investment advisor regularly throughout the year, and meet at least quarterly with management of the investment advisor to review reports about fund operations. The fund's officers do not receive compensation from the fund.
Other Expenses — A fund’s other expenses may include interest charges, clearing exchange fees, proxy solicitation expenses, fees associated with the recovery of foreign tax reclaims and other miscellaneous expenses.
Interfund Transactions — The fund may enter into security transactions with other American Century Investments funds and other client accounts of the investment advisor, in accordance with the 1940 Act rules and procedures adopted by the Board of Directors. The rules and procedures require, among other things, that these transactions be effected at the independent current market price of the security. There were no interfund transactions during the period.
4. Investment Transactions
Purchases and sales of investment securities, excluding short-term investments, for the period ended November 30, 2024 were $19,571,325 and $13,822,749, respectively.
5. Capital Share Transactions
Transactions in shares of the fund were as follows:
| | | | | | | | | | | | | | |
| Year ended
November 30, 2024 | Year ended
November 30, 2023 |
| Shares | Amount | Shares | Amount |
| Investor Class/Shares Authorized | 35,000,000 | | | 35,000,000 | | |
| Sold | 68,570 | | $ | 1,008,874 | | 24,632 | | $ | 307,215 | |
| Issued in reinvestment of distributions | 1,569 | | 22,840 | | 4,214 | | 49,679 | |
| Redeemed | (49,125) | | (731,268) | | (44,108) | | (556,922) | |
| 21,014 | | 300,446 | | (15,262) | | (200,028) | |
| I Class/Shares Authorized | 30,000,000 | | | 30,000,000 | | |
| Sold | 500,785 | | 7,416,985 | | 223,069 | | 2,890,187 | |
| Issued in reinvestment of distributions | 7,098 | | 103,777 | | 11,621 | | 137,593 | |
| Redeemed | (222,075) | | (3,319,202) | | (115,512) | | (1,448,980) | |
| 285,808 | | 4,201,560 | | 119,178 | | 1,578,800 | |
| A Class/Shares Authorized | 25,000,000 | | | 25,000,000 | | |
| Sold | 7,432 | | 109,706 | | 15,288 | | 190,423 | |
| Issued in reinvestment of distributions | 171 | | 2,472 | | 376 | | 4,405 | |
| Redeemed | (8,834) | | (128,455) | | (2,185) | | (29,298) | |
| (1,231) | | (16,277) | | 13,479 | | 165,530 | |
| C Class/Shares Authorized | 25,000,000 | | | 25,000,000 | | |
| Issued in reinvestment of distributions | — | | — | | 12 | | 135 | |
| R Class/Shares Authorized | 20,000,000 | | | 20,000,000 | | |
| Sold | 29,140 | | 418,701 | | 22,964 | | 283,693 | |
| Issued in reinvestment of distributions | 131 | | 1,871 | | 687 | | 7,964 | |
| Redeemed | (26,947) | | (392,423) | | (24,307) | | (294,988) | |
| 2,324 | | 28,149 | | (656) | | (3,331) | |
| R6 Class/Shares Authorized | 20,000,000 | | | 20,000,000 | | |
| Sold | 201,621 | | 3,080,761 | | 116,870 | | 1,406,437 | |
| Issued in reinvestment of distributions | 1,663 | | 24,395 | | 2,227 | | 26,437 | |
| Redeemed | (40,122) | | (588,102) | | (44,300) | | (551,152) | |
| 163,162 | | 2,517,054 | | 74,797 | | 881,722 | |
| Net increase (decrease) | 471,077 | | $ | 7,030,932 | | 191,548 | | $ | 2,422,828 | |
6. Fair Value Measurements
The fund's investments valuation process is based on several considerations and may use multiple inputs to determine the fair value of the investments held by the fund. In conformity with accounting principles generally accepted in the United States of America, the inputs used to determine a valuation are classified into three broad levels.
•Level 1 valuation inputs consist of unadjusted quoted prices in an active market for identical investments.
• Level 2 valuation inputs consist of direct or indirect observable market data (including quoted prices for comparable investments, evaluations of subsequent market events, interest rates, prepayment speeds, credit risk, etc.). These inputs also consist of quoted prices for identical investments initially expressed in local currencies that are adjusted through translation into U.S. dollars.
• Level 3 valuation inputs consist of unobservable data (including a fund’s own assumptions).
The level classification is based on the lowest level input that is significant to the fair valuation measurement. The valuation inputs are not necessarily an indication of the risks associated with investing in these securities or other financial instruments.
The following is a summary of the level classifications as of period end. The Schedule of Investments provides additional information on the fund's portfolio holdings.
| | | | | | | | | | | |
| Level 1 | Level 2 | Level 3 |
| Assets | | | |
| Investment Securities | | | |
| Common Stocks | | | |
| Brazil | $ | 675,702 | | $ | 529,815 | | |
| China | 437,490 | | 2,457,600 | | |
| India | 232,119 | | 5,893,175 | | |
| Other Countries | — | | 11,554,405 | | |
| Exchange-Traded Funds | — | | 153,309 | | — | |
| Short-Term Investments | 253,976 | | 1,156,048 | | — | |
| $ | 1,599,287 | | $ | 21,744,352 | | — | |
7. Risk Factors
The value of the fund’s shares will go up and down, sometimes rapidly or unpredictably, based on the performance of the securities owned by the fund and other factors generally affecting the securities market. Market risks, including political, regulatory, economic and social developments, can affect the value of the fund’s investments. Natural disasters, public health emergencies, war, terrorism and other unforeseeable events may lead to increased market volatility and may have adverse long-term effects on world economies and markets generally.
There are certain risks involved in investing in foreign securities. These risks include those resulting from political events (such as civil unrest, national elections and imposition of exchange controls), social and economic events (such as labor strikes and rising inflation), and natural disasters. Securities of foreign issuers may be less liquid and more volatile. Investing in emerging markets or a significant portion of assets in one country or region may accentuate these risks.
The fund invests in common stocks of small companies. Because of this, the fund may be subject to greater risk and market fluctuations than a fund investing in larger, more established companies.
8. Federal Tax Information
On December 17, 2024, the fund declared and paid the following per-share distributions from net investment income to shareholders of record on December 16, 2024:
| | | | | | | | | | | | | | | | | |
| Investor Class | I Class | A Class | C Class | R Class | R6 Class |
| $0.0103 | $0.0340 | — | — | — | $0.0518 |
The tax character of distributions paid during the years ended November 30, 2024 and November 30, 2023 were as follows:
| | | | | | | | |
| 2024 | 2023 |
| Distributions Paid From | | |
| Ordinary income | $ | 155,779 | | $ | 227,051 | |
| Long-term capital gains | — | | — | |
The book-basis character of distributions made during the year from net investment income or net realized gains may differ from their ultimate characterization for federal income tax purposes. These differences reflect the differing character of certain income items and net realized gains and losses for financial statement and tax purposes, and may result in reclassification among certain capital accounts on the financial statements.
As of period end, the federal tax cost of investments and the components of distributable earnings on a tax-basis were as follows:
| | | | | |
| Federal tax cost of investments | $ | 19,590,389 | |
| Gross tax appreciation of investments | $ | 5,035,049 | |
| Gross tax depreciation of investments | (1,281,799) | |
| Net tax appreciation (depreciation) of investments | 3,753,250 | |
| Net tax appreciation (depreciation) on translation of assets and liabilities in foreign currencies | (377,936) | |
| Net tax appreciation (depreciation) | $ | 3,375,314 | |
| Undistributed ordinary income | $ | 50,081 | |
| Accumulated short-term capital losses | $ | (304,566) | |
The difference between book-basis and tax-basis unrealized appreciation (depreciation) is attributable primarily to the realization to ordinary income for tax purposes of unrealized gains on investments in passive foreign investment companies.
Accumulated capital losses represent net capital loss carryovers that may be used to offset future realized capital gains for federal income tax purposes. The capital loss carryovers may be carried forward for an unlimited period. Future capital loss carryover utilization in any given year may be subject to Internal Revenue Code limitations.
| | | | | | | | | | | | | | | | | | | | | | | | | | | | | | | | | | | | | | | | | |
| For a Share Outstanding Throughout the Years Ended November 30 (except as noted) | |
| Per-Share Data | | Ratios and Supplemental Data | | |
| | Income From Investment Operations*: | Distributions From: | | | Ratio to Average Net Assets of†: | | |
| Net Asset
Value,
Beginning
of Period | Net Investment Income (Loss)(1) | Net
Realized and
Unrealized
Gain (Loss) | Total From
Investment
Operations | Net
Investment
Income | Net
Realized
Gains | Total
Distributions | Net Asset Value,
End of
Period | Total Return(2) | Operating Expenses | Net
Investment
Income
(Loss) | Portfolio Turnover
Rate | Net Assets,
End of
Period
(in thousands) |
| Investor Class | | | | | | | | | | | | |
| 2024 | $13.53 | 0.08 | 1.26 | 1.34 | (0.11) | — | (0.11) | $14.76 | 9.93% | 1.39% | 0.54% | 70% | $3,020 | |
| 2023 | $12.21 | 0.10 | 1.47 | 1.57 | (0.25) | — | (0.25) | $13.53 | 13.15% | 1.40% | 0.83% | 48% | $2,484 | |
| 2022 | $16.48 | 0.15 | (3.20) | (3.05) | (0.02) | (1.20) | (1.22) | $12.21 | (19.90)% | 1.41% | 1.21% | 64% | $2,428 | |
| 2021 | $14.23 | 0.04 | 2.82 | 2.86 | — | (0.61) | (0.61) | $16.48 | 20.69% | 1.39% | 0.25% | 52% | $3,451 | |
| 2020 | $12.52 | 0.04 | 1.72 | 1.76 | (0.05) | — | (0.05) | $14.23 | 14.07% | 1.54% | 0.37% | 60% | $2,984 | |
| I Class | | | | | | | | | | | | | |
| 2024 | $13.61 | 0.11 | 1.27 | 1.38 | (0.14) | — | (0.14) | $14.85 | 10.17% | 1.19% | 0.74% | 70% | $13,639 | |
| 2023 | $12.28 | 0.13 | 1.47 | 1.60 | (0.27) | — | (0.27) | $13.61 | 13.38% | 1.20% | 1.03% | 48% | $8,615 | |
| 2022 | $16.57 | 0.18 | (3.22) | (3.04) | (0.05) | (1.20) | (1.25) | $12.28 | (19.80)% | 1.21% | 1.41% | 64% | $6,309 | |
| 2021 | $14.27 | 0.07 | 2.84 | 2.91 | — | (0.61) | (0.61) | $16.57 | 21.06% | 1.19% | 0.45% | 52% | $6,090 | |
| 2020 | $12.56 | 0.07 | 1.71 | 1.78 | (0.07) | — | (0.07) | $14.27 | 14.25% | 1.34% | 0.57% | 60% | $3,932 | |
| A Class | | | | | | | | | | | | | |
| 2024 | $13.41 | 0.03 | 1.26 | 1.29 | (0.08) | — | (0.08) | $14.62 | 9.59% | 1.64% | 0.29% | 70% | $473 | |
| 2023 | $12.10 | 0.07 | 1.46 | 1.53 | (0.22) | — | (0.22) | $13.41 | 12.90% | 1.65% | 0.58% | 48% | $451 | |
| 2022 | $16.36 | 0.12 | (3.18) | (3.06) | — | (1.20) | (1.20) | $12.10 | (20.13)% | 1.66% | 0.96% | 64% | $244 | |
| 2021 | $14.17 | (0.01) | 2.81 | 2.80 | — | (0.61) | (0.61) | $16.36 | 20.41% | 1.64% | 0.00% | 52% | $305 | |
| 2020 | $12.47 | 0.02 | 1.69 | 1.71 | (0.01) | — | (0.01) | $14.17 | 13.76% | 1.79% | 0.12% | 60% | $206 | |
| C Class | | | | | | | | | | | | | |
| 2024 | $12.90 | (0.07) | 1.20 | 1.13 | — | — | — | $14.03 | 8.76% | 2.39% | (0.46)% | 70% | $15 | |
| 2023 | $11.64 | (0.02) | 1.41 | 1.39 | (0.13) | — | (0.13) | $12.90 | 12.09% | 2.40% | (0.17)% | 48% | $14 | |
| 2022 | $15.90 | 0.04 | (3.10) | (3.06) | — | (1.20) | (1.20) | $11.64 | (20.75)% | 2.41% | 0.21% | 64% | $12 | |
| 2021 | $13.88 | (0.12) | 2.75 | 2.63 | — | (0.61) | (0.61) | $15.90 | 19.58% | 2.39% | (0.75)% | 52% | $10 | |
| 2020 | $12.29 | (0.07) | 1.66 | 1.59 | — | — | — | $13.88 | 12.94% | 2.54% | (0.63)% | 60% | $8 | |
| R Class | | | | | | | | | | | | | |
| 2024 | $13.25 | —(3) | 1.24 | 1.24 | (0.04) | — | (0.04) | $14.45 | 9.35% | 1.89% | 0.04% | 70% | $657 | |
| 2023 | $11.96 | 0.04 | 1.44 | 1.48 | (0.19) | — | (0.19) | $13.25 | 12.59% | 1.90% | 0.33% | 48% | $571 | |
| 2022 | $16.23 | 0.09 | (3.16) | (3.07) | — | (1.20) | (1.20) | $11.96 | (20.37)% | 1.91% | 0.71% | 64% | $523 | |
| 2021 | $14.09 | (0.04) | 2.79 | 2.75 | — | (0.61) | (0.61) | $16.23 | 20.16% | 1.89% | (0.25)% | 52% | $521 | |
| 2020 | $12.42 | (0.01) | 1.68 | 1.67 | — | — | — | $14.09 | 13.54% | 2.04% | (0.13)% | 60% | $268 | |
| | | | | | | | | | | | | | | | | | | | | | | | | | | | | | | | | | | | | | | | | |
| For a Share Outstanding Throughout the Years Ended November 30 (except as noted) | |
| Per-Share Data | | Ratios and Supplemental Data | | |
| | Income From Investment Operations*: | Distributions From: | | | Ratio to Average Net Assets of†: | | |
| Net Asset
Value,
Beginning
of Period | Net Investment Income (Loss)(1) | Net
Realized and
Unrealized
Gain (Loss) | Total From
Investment
Operations | Net
Investment
Income | Net
Realized
Gains | Total
Distributions | Net Asset Value,
End of
Period | Total Return(2) | Operating Expenses | Net
Investment
Income
(Loss) | Portfolio Turnover
Rate | Net Assets,
End of
Period
(in thousands) |
| R6 Class | | | | | | | | | | | | | |
| 2024 | $13.67 | 0.12 | 1.28 | 1.40 | (0.16) | — | (0.16) | $14.91 | 10.29% | 1.04% | 0.89% | 70% | $4,903 | |
| 2023 | $12.33 | 0.15 | 1.48 | 1.63 | (0.29) | — | (0.29) | $13.67 | 13.58% | 1.05% | 1.18% | 48% | $2,265 | |
| 2022 | $16.64 | 0.20 | (3.24) | (3.04) | (0.07) | (1.20) | (1.27) | $12.33 | (19.66)% | 1.06% | 1.56% | 64% | $1,120 | |
| 2021 | $14.31 | 0.10 | 2.84 | 2.94 | — | (0.61) | (0.61) | $16.64 | 21.15% | 1.04% | 0.60% | 52% | $18 | |
| 2020 | $12.59 | 0.10 | 1.71 | 1.81 | (0.09) | — | (0.09) | $14.31 | 14.47% | 1.19% | 0.72% | 60% | $15 | |
| | | | | |
| Notes to Financial Highlights |
(1)Computed using average shares outstanding throughout the period.
(2)Total returns are calculated based on the net asset value of the last business day and do not reflect applicable sales charges, if any. Total returns for periods less than one year are not annualized.
(3)Per-share amount was less than $0.005.
*The amount shown for a share outstanding throughout the period may not correlate with the Statement(s) of Operations or precisely reflect the class expense differentials due to the timing of transactions in shares of a fund in relation to income earned and/or fluctuations in the fair value of a fund's investments.
†Ratios for periods less than one year are annualized. Zero balances may reflect amounts less than 0.005%.
See Notes to Financial Statements.
| | |
| Report of Independent Registered Public Accounting Firm |
To the shareholders of the Emerging Markets Small Cap Fund and the Board of Directors of American Century World Mutual Funds, Inc.
Opinion on the Financial Statements and Financial Highlights
We have audited the accompanying statement of assets and liabilities, including the schedule of investments, of Emerging Markets Small Cap Fund (the “Fund”), one of the funds constituting the American Century World Mutual Funds, Inc., as of November 30, 2024, the related statement of operations for the year then ended, the statements of changes in net assets for each of the two years in the period then ended, the financial highlights for each of the five years in the period then ended, and the related notes. In our opinion, the financial statements and financial highlights present fairly, in all material respects, the financial position of the Fund as of November 30, 2024, and the results of its operations for the year then ended, the changes in its net assets for each of the two years in the period then ended, and the financial highlights for each of the five years in the period then ended, in conformity with accounting principles generally accepted in the United States of America.
Basis for Opinion
These financial statements and financial highlights are the responsibility of the Fund's management. Our responsibility is to express an opinion on the Fund’s financial statements and financial highlights based on our audits. We are a public accounting firm registered with the Public Company Accounting Oversight Board (United States) (PCAOB) and are required to be independent with respect to the Fund in accordance with the U.S. federal securities laws and the applicable rules and regulations of the Securities and Exchange Commission and the PCAOB.
We conducted our audits in accordance with the standards of the PCAOB. Those standards require that we plan and perform the audit to obtain reasonable assurance about whether the financial statements and financial highlights are free of material misstatement, whether due to error or fraud. The Fund is not required to have, nor were we engaged to perform, an audit of its internal control over financial reporting. As part of our audits, we are required to obtain an understanding of internal control over financial reporting but not for the purpose of expressing an opinion on the effectiveness of the Fund’s internal control over financial reporting. Accordingly, we express no such opinion.
Our audits included performing procedures to assess the risks of material misstatement of the financial statements and financial highlights, whether due to error or fraud, and performing procedures that respond to those risks. Such procedures included examining, on a test basis, evidence regarding the amounts and disclosures in the financial statements and financial highlights. Our audits also included evaluating the accounting principles used and significant estimates made by management, as well as evaluating the overall presentation of the financial statements and financial highlights. Our procedures included confirmation of securities owned as of November 30, 2024, by correspondence with the custodian and brokers; when replies were not received from brokers, we performed other auditing procedures. We believe that our audits provide a reasonable basis for our opinion.
/s/ Deloitte & Touche LLP
Kansas City, Missouri
January 16, 2025
We have served as the auditor of one or more American Century investment companies since 1997.
| | |
| Approval of Management Agreement |
At a meeting held on June 27, 2024, the Fund’s Board of Directors (the “Board”) unanimously approved the renewal of the management agreement pursuant to which American Century Investment Management, Inc. (the “Advisor”) acts as the investment advisor for the Fund. Under the Investment Company Act of 1940 (the “Investment Company Act”), contracts for investment advisory services are required to be reviewed, evaluated, and approved by a majority of a fund’s Directors, including a majority of the independent Directors.
Prior to its consideration of the renewal of the management agreement, the Directors requested and reviewed data and information compiled by the Advisor and certain independent consultants and data providers concerning the Fund. This review was in addition to the oversight and evaluation undertaken by the Board and its committees on a continual basis and the information received was supplemental to the information that the Board and its committees receive and consider over time.
In connection with its consideration of the renewal of the management agreement, the Board’s review and evaluation of the services provided by the Advisor and its affiliates included, but was not limited to
•the nature, extent, and quality of investment management, shareholder services, distribution services, and other services provided to the Fund;
•the wide range of programs and services the Advisor and other service providers provide to the Fund and its shareholders on a routine and non-routine basis;
•the Fund’s investment performance compared to appropriate benchmarks and/or peer groups of other mutual funds with similar investment objectives and strategies;
•the cost of owning the Fund compared to the cost of owning similarly-managed funds;
•the Advisor’s compliance policies, procedures, and regulatory experience and those of certain other service providers;
•the Advisor’s strategic plans, generally, and with respect to the Advisor’s response to investment management industry challenges;
•the Advisor’s business continuity plans, vendor management practices, and information security practices;
•the cost of services provided to the Fund, the profitability of the Fund to the Advisor, and the Advisor’s financial results of operation;
•possible economies of scale associated with the Advisor’s management of the Fund;
•any collateral benefits derived by the Advisor from the management of the Fund;
•fees and expenses associated with any investment by the Fund in other funds;
•payments to intermediaries by the Fund and the Advisor and services provided by intermediaries in connection therewith; and
•services provided and charges to the Advisor’s other investment management clients.
The Board held two meetings to consider the renewal. The independent Directors also met in private session multiple times to review and discuss the information provided in response to their request. The independent Directors held active discussions with the Advisor regarding the renewal of the management agreement, requesting supplemental information, and reviewing information provided by the Advisor in response thereto. The independent Directors had the benefit of the advice of their independent counsel throughout the process.
Factors Considered
The Directors considered all of the information provided by the Advisor, the independent consultant and data providers, and the independent Directors’ independent counsel in connection with the approval. They determined that the information was sufficient for them to evaluate the management agreement for the Fund. In connection with their review, the Directors did not identify any single factor as being all-important or controlling, and each Director may have attributed different levels of importance to different factors. In deciding to renew the management agreement, the Board based its decision on a number of factors, including without limitation the following:
Nature, Extent and Quality of Services — Generally. Under the management agreement, the Advisor is responsible for providing or arranging for all services necessary for the operation of the Fund. The Board noted that the Advisor provides or arranges at its own expense a wide variety of services which include, without limitation, the following:
•constructing and designing the Fund
•portfolio research and security selection
•initial capitalization/funding
•securities trading
•Fund administration
•custody of Fund assets
•daily valuation of the Fund’s portfolio
•liquidity monitoring and management
•risk management, including information security
•shareholder servicing and transfer agency, including shareholder confirmations, recordkeeping, and communications
•legal services (except the independent Directors’ counsel)
•regulatory and portfolio compliance
•financial reporting
•marketing and distribution (except amounts paid by the Fund under Rule 12b-1 plans)
The Board noted that many of these services have expanded over time in terms of both quantity and complexity in response to shareholder demands, competition in the industry, changing distribution channels, and the changing regulatory environment.
Investment Management Services. The nature of the investment management services provided to the Fund is quite complex and allows Fund shareholders access to professional money management, instant diversification of their investments, the opportunity to easily diversify among asset classes by investing in or exchanging among various American Century Investments funds, and liquidity. In evaluating investment performance, the Board expects the Advisor to manage the Fund in accordance with its investment objectives and principal investment strategies. Further, the Directors recognize that the Advisor has an obligation to monitor trading activities, and in particular to seek the best execution of fund trades, and to evaluate the use of and payment for research. In providing these services, the Advisor utilizes teams of investment professionals who require extensive information technology, research, training, compliance, and other systems to conduct their business. The Board, directly and through its Fund Performance Review Committee, provides oversight of the investment performance process. It regularly reviews investment performance information for the Fund, together with comparative information for appropriate benchmarks and/or peer groups of similarly-managed funds, over different time horizons. The Directors also review investment performance information from both the Advisor and an independent third party during the management agreement renewal process. If performance concerns are identified, the Board discusses with the Advisor the reasons for such results and any actions being taken to improve performance and may conduct special reviews until performance improves. The Fund’s performance was above its benchmark for the one- and five-year periods and below its benchmark for the three-year period reviewed by the Board. In relation to industry peers, the Fund was above the median of its peer performance universe as identified by a third-party service provider for the one-, three-, and five-year periods. The Board discussed the Fund’s performance with the Advisor, including steps being taken to address underperformance, and was satisfied with the efforts being undertaken by the Advisor. The Board found the investment management services provided by the Advisor to the Fund to be satisfactory and consistent with the management agreement.
Shareholder and Other Services. Under the management agreement, the Advisor provides the Fund with a comprehensive package of transfer agency, shareholder, and other services. The Board, directly and through its various committees, regularly reviews reports and evaluations of such services at its regular meetings. These reports include, but are not limited to, information regarding the operational efficiency and accuracy of the shareholder and transfer agency services provided, staffing levels, shareholder satisfaction, technology support (including information security), new products and services offered to Fund shareholders, securities trading activities, portfolio valuation services, auditing services, and legal and operational compliance activities. The Board found the services provided by the Advisor to the Fund under the management agreement to be competitive and of high quality.
Costs of Services and Profitability. The Advisor provides detailed information concerning its cost of providing various services to the Fund, its profitability in managing the Fund (pre- and post-distribution), and its financial results of operation. The Directors have reviewed with the Advisor the methodology used to prepare this financial information and arranged for an independent consultant to confirm the reasonableness of the allocation methodology used. This information is considered in evaluating the Advisor’s financial condition, its ability to continue to provide services under the management agreement, and the reasonableness of the terms of the current management agreement. The Board concluded that the Advisor’s profits were reasonable in light of the services provided to the Fund.
Ethics. The Board generally considers the Advisor’s commitment to providing quality services to shareholders and to conducting its business ethically. They noted that the Advisor’s practices generally meet or exceed industry best practices.
Economies of Scale. The Board also reviewed information provided by the Advisor regarding the possible existence of economies of scale in connection with the management of the Fund. The Board concluded that economies of scale are difficult to measure and predict with precision, especially on a fund-by-fund basis. The Board concluded that the Advisor is sharing economies of scale, to the extent they exist, through its fee structure, and through reinvestment in its business, infrastructure, investment capabilities and initiatives to provide shareholders enhanced and expanded content and services.
Comparison to Other Funds’ Fees. The management agreement provides that the Fund pays the Advisor a single, all-inclusive (or unified) management fee for providing all services necessary for the management and operation of the Fund, other than brokerage and other transaction fees and expenses relating to acquisition and disposition of portfolio securities, acquired fund fees and expenses, taxes, interest, extraordinary expenses, fund litigation expenses, fees and expenses of the Fund’s independent Directors (including their independent legal counsel), and expenses incurred in connection with the provision of shareholder services and distribution services under a plan adopted pursuant to Investment Company Act Rule 12b-1. Under the unified fee structure, the Advisor is responsible for providing all investment advisory, custody, audit, administrative, compliance, recordkeeping, marketing and shareholder services, or arranging and supervising third parties to provide such services. By contrast, most other funds are charged a variety of fees, including an investment advisory fee, a transfer agency fee, an administrative fee, distribution charges, and other expenses. Other than their investment advisory fees and any applicable Rule 12b-1 distribution fees, all other components of the total fees charged by these other funds may be increased without shareholder approval. The Board believes
the unified fee structure is a benefit to Fund shareholders because it clearly discloses to shareholders the cost of owning Fund shares, and, since the unified fee cannot be increased without a vote of Fund shareholders, it shifts to the Advisor the risk of increased costs of operating the Fund and provides a direct incentive to minimize administrative inefficiencies. Part of the Board’s analysis of fee levels involves reviewing certain evaluative data compiled by an independent provider comparing the Fund’s unified fee to the total expense ratios of its peers. The unified fee charged to shareholders of the Fund was above the median of the total expense ratios of the Fund’s peer expense universe. In addition, the Board reviewed the Fund’s position relative to the narrower set of its expense group peers. The Board concluded that the management fee paid by the Fund to the Advisor under the management agreement is reasonable in light of the services provided to the Fund.
Comparison to Fees and Services Provided to Other Clients of the Advisor. The Board also requested and received information from the Advisor concerning the nature of the services, fees, costs, and profitability of its advisory services to advisory clients other than the Fund. They observed that these varying types of client accounts require different services and involve different regulatory and entrepreneurial risks than the management of the Fund. The Board analyzed this information and concluded that the fees charged and services provided to the Fund were reasonable by comparison.
Payments to Intermediaries. The Directors also requested and received a description of payments made to intermediaries by the Fund and the Advisor and services provided in response thereto. These payments include various payments made by the Fund or the Advisor to different types of intermediaries and recordkeepers for distribution and service activities provided for the Fund. The Directors reviewed such information and received representations from the Advisor that all such payments by the Fund were made pursuant to the Fund’s Rule 12b-1 Plan and that all such payments by the Advisor were made from the Advisor’s resources and reasonable profits.
Collateral or “Fall-Out” Benefits Derived by the Advisor. The Board considered the possible existence of collateral benefits the Advisor may receive as a result of its relationship with the Fund. They concluded that the Advisor’s primary business is managing funds and it generally does not use fund or shareholder information to generate profits in other lines of business, and therefore does not derive any significant collateral benefits from them. To the extent there are potential collateral benefits, the Board has been advised and has taken this into consideration in its review of the management contract with the Fund. The Board noted that additional assets from other clients may offer the Advisor some benefit from increased leverage with prospective clients, service providers, and counterparties. Additionally, the Advisor may receive proprietary research from broker-dealers that execute fund portfolio transactions, which the Board concluded is likely to benefit other clients of the Advisor, as well as Fund shareholders. The Board also determined that the Advisor is able to provide investment management services to certain clients other than the Fund, at least in part, due to its existing infrastructure built to serve the fund complex. The Board concluded that appropriate allocation methodologies had been employed to assign resources and the cost of those resources to these other clients.
Existing Relationship. The Board also considered whether there was any reason for not continuing the existing arrangement with the Advisor. In this regard, the Board was mindful of the potential disruptions of the Fund’s operations and various risks, uncertainties, and other effects that could occur as a result of a decision not to continue such relationship. In particular, the Board recognized that most shareholders have invested in the Fund on the strength of the Advisor’s industry standing and reputation and in the expectation that the Advisor will have a continuing role in providing advisory services to the Fund.
Conclusion of the Directors. As a result of this process, the Board, including all of the independent Directors, taking into account all of the factors discussed above and the information provided by the Advisor and others in connection with its review and received over time, determined that the terms of the management agreement are fair and reasonable and that the management fee charged to the Fund is reasonable in light of the services provided and that the management agreement between the Fund and the Advisor should be renewed for an additional one-year period.
Other Tax Information
The following information is provided pursuant to provisions of the Internal Revenue Code.
The fund hereby designates up to the maximum amount allowable as qualified dividend income for the fiscal year ended November 30, 2024.
For the fiscal year ended November 30, 2024, the fund intends to pass through to shareholders foreign source income of $367,915 and foreign taxes paid of $141,295, or up to the maximum amount allowable, as a foreign tax credit. Foreign source income and foreign tax expense per outstanding share on November 30, 2024 are $0.2403 and $0.0923, respectively.
| | | | | | | | |
| Contact Us | americancentury.com | |
| Automated Information Line | 1-800-345-8765 | |
| Investor Services Representative | 1-800-345-2021
or 816-531-5575 | |
| Banks and Trust Companies, Broker-Dealers, Financial Professionals, Insurance Companies | 1-800-345-6488 | |
| | |
| This report and the statements it contains are submitted for the general information of our shareholders. The report is not authorized for distribution to prospective investors unless preceded or accompanied by an effective prospectus. | |
| | |
©2025 American Century Proprietary Holdings, Inc. All rights reserved.
CL-ANN-91033 2501 | |
| | | | | |
| |
| Annual Financial Statements and Other Information |
| |
| November 30, 2024 |
| |
| Focused Global Growth Fund |
| Investor Class (TWGGX) |
| I Class (AGGIX) |
| Y Class (AGYGX) |
| A Class (AGGRX) |
| C Class (AGLCX) |
| R Class (AGORX) |
| R5 Class (AGFGX) |
| R6 Class (AGGDX) |
| | | | | |
| Schedule of Investments | |
| Statement of Assets and Liabilities | |
| Statement of Operations | |
| Statement of Changes in Net Assets | |
| Notes to Financial Statements | |
| Financial Highlights | |
| Report of Independent Registered Public Accounting Firm | |
| Approval of Management Agreement | |
| |
| Other Tax Information | |
NOVEMBER 30, 2024
| | | | | | | | |
| Shares | Value |
| COMMON STOCKS — 99.6% | | |
| Canada — 2.8% | | |
| Canadian Pacific Kansas City Ltd. | 229,920 | | $ | 17,609,573 | |
| Denmark — 2.9% | | |
| Novo Nordisk AS, Class B | 174,940 | | 18,748,279 | |
| France — 2.9% | | |
| Schneider Electric SE | 70,790 | | 18,236,981 | |
| Germany — 2.6% | | |
| SAP SE | 71,090 | | 16,881,438 | |
| Hong Kong — 2.5% | | |
| Techtronic Industries Co. Ltd. | 1,128,500 | | 16,062,064 | |
| Indonesia — 2.8% | | |
| Bank Central Asia Tbk. PT | 28,458,800 | | 17,970,677 | |
| Japan — 5.6% | | |
| Hitachi Ltd. | 740,600 | | 18,663,737 | |
| Keyence Corp. | 39,300 | | 17,051,989 | |
| | 35,715,726 | |
| Spain — 2.7% | | |
| Cellnex Telecom SA | 485,970 | | 17,463,556 | |
| United Kingdom — 6.0% | | |
| Barclays PLC, ADR | 1,363,150 | | 18,375,262 | |
| London Stock Exchange Group PLC | 139,990 | | 20,063,189 | |
| | 38,438,451 | |
| United States — 68.8% | | |
| AbbVie, Inc. | 95,780 | | 17,521,035 | |
Amazon.com, Inc.(1) | 157,220 | | 32,684,466 | |
| AMETEK, Inc. | 72,034 | | 14,001,969 | |
| ARES Management Corp., Class A | 93,079 | | 16,449,852 | |
Boston Scientific Corp.(1) | 188,930 | | 17,128,394 | |
| Broadcom, Inc. | 126,400 | | 20,486,912 | |
| Dominion Energy, Inc. | 244,980 | | 14,392,575 | |
| Entegris, Inc. | 126,490 | | 13,361,139 | |
| Howmet Aerospace, Inc. | 139,520 | | 16,516,378 | |
| Mastercard, Inc., Class A | 36,307 | | 19,349,452 | |
MercadoLibre, Inc.(1) | 1,210 | | 2,402,056 | |
| Meta Platforms, Inc., Class A | 47,150 | | 27,079,188 | |
| Microsoft Corp. | 95,220 | | 40,321,861 | |
| Nasdaq, Inc. | 174,170 | | 14,454,368 | |
| NVIDIA Corp. | 325,410 | | 44,987,932 | |
| Oracle Corp. | 99,450 | | 18,382,338 | |
| Progressive Corp. | 65,510 | | 17,614,329 | |
| Roper Technologies, Inc. | 26,480 | | 14,999,331 | |
| S&P Global, Inc. | 33,580 | | 17,545,886 | |
| SBA Communications Corp. | 69,300 | | 15,679,125 | |
| Stryker Corp. | 32,340 | | 12,682,131 | |
Uber Technologies, Inc.(1) | 217,170 | | 15,627,553 | |
| Williams Cos., Inc. | 282,310 | | 16,520,781 | |
| | 440,189,051 | |
TOTAL COMMON STOCKS (Cost $527,912,484) | | 637,315,796 | |
| | | | | | | | |
| Shares | Value |
| SHORT-TERM INVESTMENTS — 0.4% | | |
| Repurchase Agreements — 0.4% | | |
| BMO Capital Markets Corp., (collateralized by various U.S. Treasury obligations, 3.625%, 2/15/44, valued at $241,787), in a joint trading account at 4.56%, dated 11/29/24, due 12/2/24 (Delivery value $237,545) | | $ | 237,455 | |
| Fixed Income Clearing Corp., (collateralized by various U.S. Treasury obligations, 2.00%, 2/15/50, valued at $2,398,050), at 4.57%, dated 11/29/24, due 12/2/24 (Delivery value $2,351,895) | | 2,351,000 | |
TOTAL SHORT-TERM INVESTMENTS (Cost $2,588,455) | | 2,588,455 | |
TOTAL INVESTMENT SECURITIES — 100.0% (Cost $530,500,939) | | 639,904,251 | |
| OTHER ASSETS AND LIABILITIES — 0.0% | | (144,978) | |
| TOTAL NET ASSETS — 100.0% | | $ | 639,759,273 | |
| | | | | |
| MARKET SECTOR DIVERSIFICATION |
| (as a % of net assets) | |
| Information Technology | 29.1% |
| Financials | 22.2% |
| Industrials | 18.2% |
| Health Care | 10.3% |
| Communication Services | 7.0% |
| Consumer Discretionary | 5.5% |
| Energy | 2.6% |
| Real Estate | 2.5% |
| Utilities | 2.2% |
| Short-Term Investments | 0.4% |
| Other Assets and Liabilities | 0.0% |
| | | | | | | | |
| NOTES TO SCHEDULE OF INVESTMENTS |
| ADR | – | American Depositary Receipt |
(1)Non-income producing.
See Notes to Financial Statements.
| | |
| Statement of Assets and Liabilities |
| | | | | |
| NOVEMBER 30, 2024 |
| Assets | |
| Investment securities, at value (cost of $530,500,939) | $ | 639,904,251 | |
| Cash | 10,757 | |
| Receivable for capital shares sold | 128,039 | |
| Dividends and interest receivable | 783,273 | |
| Other assets | 1,038 | |
| 640,827,358 | |
| |
| Liabilities | |
| Payable for capital shares redeemed | 538,463 | |
| Accrued management fees | 519,492 | |
| Distribution and service fees payable | 10,130 | |
| 1,068,085 | |
| |
| Net Assets | $ | 639,759,273 | |
| |
| Net Assets Consist of: | |
| Capital (par value and paid-in surplus) | $ | 450,860,147 | |
| Distributable earnings (loss) | 188,899,126 | |
| $ | 639,759,273 | |
| | | | | | | | | | | |
| Net Assets | Shares Outstanding | Net Asset Value Per Share* |
| Investor Class, $0.01 Par Value | $432,422,720 | 34,287,242 | $12.61 |
| I Class, $0.01 Par Value | $74,007,433 | 5,641,149 | $13.12 |
| Y Class, $0.01 Par Value | $395,361 | 29,746 | $13.29 |
| A Class, $0.01 Par Value | $29,427,390 | 2,493,729 | $11.80 |
| C Class, $0.01 Par Value | $1,915,467 | 235,074 | $8.15 |
| R Class, $0.01 Par Value | $6,039,972 | 537,275 | $11.24 |
| R5 Class, $0.01 Par Value | $11,819 | 901 | $13.12 |
| R6 Class, $0.01 Par Value | $95,539,111 | 7,202,401 | $13.26 |
*Maximum offering price per share was equal to the net asset value per share for all share classes, except A Class, for which the maximum offering price per share was $12.52 (net asset value divided by 0.9425). A contingent deferred sales charge may be imposed on redemptions of A Class and C Class.
See Notes to Financial Statements.
| | | | | |
| YEAR ENDED NOVEMBER 30, 2024 |
| Investment Income (Loss) | |
| Income: | |
| Dividends (net of foreign taxes withheld of $347,642) | $ | 7,805,607 | |
| Interest | 226,333 | |
| 8,031,940 | |
| |
| Expenses: | |
| Management fees | 6,217,220 | |
| Distribution and service fees: | |
| A Class | 69,075 | |
| C Class | 21,316 | |
| R Class | 30,526 | |
| Directors' fees and expenses | 18,489 | |
| Other expenses | 44,942 | |
| 6,401,568 | |
| |
| |
| |
| Net investment income (loss) | 1,630,372 | |
| |
| Realized and Unrealized Gain (Loss) | |
| Net realized gain (loss) on: | |
| Investment transactions (net of foreign tax expenses paid (refunded) of $492,879) | 87,093,765 | |
| Foreign currency translation transactions | (77,512) | |
| 87,016,253 | |
| |
| Change in net unrealized appreciation (depreciation) on: | |
| Investments (includes (increase) decrease in accrued foreign taxes of $375,151) | 35,317,904 | |
| Translation of assets and liabilities in foreign currencies | (2,721) | |
| 35,315,183 | |
| |
| Net realized and unrealized gain (loss) | 122,331,436 | |
| |
| Net Increase (Decrease) in Net Assets Resulting from Operations | $ | 123,961,808 | |
See Notes to Financial Statements.
| | |
| Statement of Changes in Net Assets |
| | | | | | | | |
| YEARS ENDED NOVEMBER 30, 2024 AND NOVEMBER 30, 2023 |
| Increase (Decrease) in Net Assets | November 30, 2024 | November 30, 2023 |
| Operations | | |
| Net investment income (loss) | $ | 1,630,372 | | $ | 3,252,179 | |
| Net realized gain (loss) | 87,016,253 | | 20,963,058 | |
| Change in net unrealized appreciation (depreciation) | 35,315,183 | | 24,541,115 | |
| Net increase (decrease) in net assets resulting from operations | 123,961,808 | | 48,756,352 | |
| | |
| Distributions to Shareholders | | |
| From earnings: | | |
| Investor Class | (14,740,592) | | (41,136,845) | |
| I Class | (2,922,662) | | (8,447,283) | |
| Y Class | (12,763) | | (34,387) | |
| A Class | (939,440) | | (2,818,294) | |
| C Class | (106,841) | | (404,907) | |
| R Class | (204,720) | | (677,257) | |
| R5 Class | (372) | | (932) | |
| R6 Class | (3,508,992) | | (8,363,717) | |
| Decrease in net assets from distributions | (22,436,382) | | (61,883,622) | |
| | |
| Capital Share Transactions | | |
| Net increase (decrease) in net assets from capital share transactions (Note 5) | (51,849,796) | | 17,634,212 | |
| | |
| Net increase (decrease) in net assets | 49,675,630 | | 4,506,942 | |
| | |
| Net Assets | | |
| Beginning of period | 590,083,643 | | 585,576,701 | |
| End of period | $ | 639,759,273 | | $ | 590,083,643 | |
See Notes to Financial Statements.
| | |
| Notes to Financial Statements |
NOVEMBER 30, 2024
1. Organization
American Century World Mutual Funds, Inc. (the corporation) is registered under the Investment Company Act of 1940, as amended (the 1940 Act), as an open-end management investment company and is organized as a Maryland corporation. Focused Global Growth Fund (the fund) is one fund in a series issued by the corporation. The fund's investment objective is to seek capital growth.
The fund offers the Investor Class, I Class, Y Class, A Class, C Class, R Class, R5 Class and R6 Class. The A Class may incur an initial sales charge. The A Class and C Class may be subject to a contingent deferred sales charge.
2. Significant Accounting Policies
The following is a summary of significant accounting policies consistently followed by the fund in preparation of its financial statements. The fund is an investment company and follows accounting and reporting guidance in accordance with accounting principles generally accepted in the United States of America. This may require management to make certain estimates and assumptions at the date of the financial statements. Actual results could differ from these estimates. Management evaluated the impact of events or transactions occurring through the date the financial statements were issued that would merit recognition or disclosure.
Investment Valuations — The fund determines the fair value of its investments and computes its net asset value (NAV) per share at the close of regular trading (usually 4 p.m. Eastern time) on the New York Stock Exchange (NYSE) on each day the NYSE is open. The value of investments of the fund is determined by American Century Investment Management, Inc. (ACIM) (the investment advisor), as the valuation designee, pursuant to its valuation policies and procedures. The Board of Directors oversees the valuation designee and reviews its valuation policies and procedures at least annually.
Equity securities that are listed or traded on a domestic securities exchange are valued at the last reported sales price or at the official closing price as provided by the exchange. Equity securities traded on foreign securities exchanges are generally valued at the closing price of such securities on the exchange where primarily traded or at the close of the NYSE, if that is earlier. If no last sales price is reported, or if local convention or regulation so provides, the mean of the latest bid and asked prices may be used. Securities traded over-the-counter are valued at the mean of the latest bid and asked prices, the last sales price, or the official closing price.
Open-end management investment companies are valued at the reported NAV per share. Repurchase agreements are valued at cost, which approximates fair value.
If the valuation designee determines that the market price for a portfolio security is not readily available or is believed by the valuation designee to be unreliable, such security is valued at fair value as determined in good faith by the valuation designee, in accordance with its policies and procedures. Circumstances that may cause the fund to determine that market quotations are not available or reliable include, but are not limited to: when there is a significant event subsequent to the market quotation; trading in a security has been halted during the trading day; or trading in a security is insufficient or did not take place due to a closure or holiday.
The valuation designee monitors for significant events occurring after the close of an investment’s primary exchange but before the fund’s NAV per share is determined. Significant events may include, but are not limited to: corporate announcements and transactions; regulatory news, governmental action and political unrest that could impact a specific investment or an investment sector; or armed conflicts, natural disasters and similar events that could affect investments in a specific country or region. The valuation designee also monitors for significant fluctuations between domestic and foreign markets, as evidenced by the U.S. market or such other indicators that it deems appropriate. The valuation designee may apply a model-derived factor to the closing price of equity securities traded on foreign securities exchanges. The factor is based on observable market data as provided by an independent pricing service.
Foreign Currency Translations — All assets and liabilities, including investment securities and other financial instruments, initially expressed in foreign currencies are translated into U.S. dollars each day at the mean of the appropriate currency exchange rate at the close of the NYSE as provided by an independent pricing service. The fund may enter into spot foreign currency exchange contracts to facilitate transactions denominated in a foreign currency. Purchases and sales of investment securities, dividend and interest income, spot foreign currency exchange contracts, and expenses are translated at the rates of exchange prevailing on the respective dates of such transactions. Net realized and unrealized foreign currency exchange gains or losses related to investment securities are a component of net realized gain (loss) on investment transactions and change in net unrealized appreciation (depreciation) on investments, respectively.
Security Transactions — Security transactions are accounted for as of the trade date. Net realized gains and losses are determined on the identified cost basis, which is also used for federal income tax purposes. Certain countries impose taxes on realized gains on the sale of securities registered in their country. The fund records the foreign tax expense, if any, on an accrual basis. The foreign tax expense on realized gains and unrealized appreciation reduces the net realized gain (loss) on investment transactions and net unrealized appreciation (depreciation) on investments, respectively.
Investment Income — Dividend income less foreign taxes withheld, if any, is recorded as of the ex-dividend date. Distributions received on securities that represent a return of capital or long-term capital gain are recorded as a reduction of cost of investments and/or as a realized gain. The fund may estimate the components of distributions received that may be considered nontaxable distributions or long-term capital gain distributions for income tax purposes. Interest income is recorded on the accrual basis and includes accretion of discounts and amortization of premiums.
Repurchase Agreements — The fund may enter into repurchase agreements with institutions that ACIM has determined are creditworthy pursuant to criteria adopted by the Board of Directors. The fund requires that the collateral, represented by securities, received in a repurchase transaction be transferred to the custodian in a manner sufficient to enable the fund to obtain those securities in the event of a default under the repurchase agreement. ACIM monitors, on a daily basis, the securities transferred to ensure the value, including accrued interest, of the securities under each repurchase agreement is equal to or greater than amounts owed to the fund under each repurchase agreement.
Joint Trading Account — Pursuant to an Exemptive Order issued by the Securities and Exchange Commission, the fund, along with certain other funds in the American Century Investments family of funds, may transfer uninvested cash balances into a joint trading account. These balances are invested in one or more repurchase agreements that are collateralized by U.S. Treasury or Agency obligations.
Income Tax Status — It is the fund's policy to distribute substantially all net investment income and net realized gains to shareholders and to otherwise qualify as a regulated investment company under provisions of the Internal Revenue Code. Accordingly, no provision has been made for income taxes. The fund files U.S. federal, state, local and non-U.S. tax returns as applicable. The fund's tax returns are subject to examination by the relevant taxing authority until expiration of the applicable statute of limitations, which is generally three years from the date of filing but can be longer in certain jurisdictions. At this time, management believes there are no uncertain tax positions which, based on their technical merit, would not be sustained upon examination and for which it is reasonably possible that the total amounts of unrecognized tax benefits will significantly change in the next twelve months.
Multiple Class — All shares of the fund represent an equal pro rata interest in the net assets of the class to which such shares belong, and have identical voting, dividend, liquidation and other rights and the same terms and conditions, except for class specific expenses and exclusive rights to vote on matters affecting only individual classes. Income, non-class specific expenses, and realized and unrealized capital gains and losses of the fund are allocated to each class of shares based on their relative net assets.
Distributions to Shareholders — Distributions from net investment income and net realized gains, if any, are generally declared and paid annually. The fund may make distributions on a more frequent basis to comply with the distribution requirements of the Internal Revenue Code, in all events in a manner consistent with provisions of the 1940 Act. The fund may elect to treat a portion of its payment to a redeeming shareholder, which represents the pro rata share of undistributed net investment income and net realized gains, as a distribution for federal income tax purposes (tax equalization).
Indemnifications — Under the corporation’s organizational documents, its officers and directors are indemnified against certain liabilities arising out of the performance of their duties to the fund. In addition, in the normal course of business, the fund enters into contracts that provide general indemnifications. The maximum exposure under these arrangements is unknown as this would involve future claims that may be made against a fund. The risk of material loss from such claims is considered by management to be remote.
3. Fees and Transactions with Related Parties
Certain officers and directors of the corporation are also officers and/or directors of American Century Companies, Inc. (ACC). The corporation's investment advisor, ACIM, the corporation's distributor, American Century Investment Services, Inc. (ACIS), and the corporation's transfer agent, American Century Services, LLC, are wholly owned, directly or indirectly, by ACC.
Management Fees — The corporation has entered into a management agreement with ACIM, under which ACIM provides the fund with investment advisory and management services in exchange for a single, unified management fee (the fee) per class. The agreement provides that ACIM will pay all expenses of managing and operating the fund, except brokerage expenses, taxes, interest, fees and expenses of the independent directors (including legal counsel fees), extraordinary expenses, and expenses incurred in connection with the provision of shareholder services and distribution services under a plan adopted pursuant to Rule 12b-1 under the 1940 Act. The fee is computed and accrued daily based on each class's daily net assets and paid monthly in arrears. The difference in the fee among the classes is a result of their separate arrangements for non-Rule 12b-1 shareholder services. It is not the result of any difference in advisory or custodial fees or other expenses related to the management of the fund's assets, which do not vary by class. The rate of the fee is determined by applying a fee rate calculation formula. This formula takes into account the fund's assets as well as certain assets, if any, of other clients of the investment advisor outside the American Century Investments family of funds (such as subadvised funds and separate accounts), as well as exchange-traded funds managed by the investment advisor, that use very similar investment teams and strategies (strategy assets).
The management fee schedule range and the effective annual management fee for each class for the period ended November 30, 2024 are as follows:
| | | | | | | | |
| Management Fee Schedule Range | Effective Annual Management Fee |
| Investor Class | 1.050% to 1.300% | 1.07% |
| I Class | 0.850% to 1.100% | 0.87% |
| Y Class | 0.700% to 0.950% | 0.72% |
| A Class | 1.050% to 1.300% | 1.07% |
| C Class | 1.050% to 1.300% | 1.07% |
| R Class | 1.050% to 1.300% | 1.07% |
| R5 Class | 0.850% to 1.100% | 0.87% |
| R6 Class | 0.700% to 0.950% | 0.72% |
Distribution and Service Fees — The Board of Directors has adopted a separate Master Distribution and Individual Shareholder Services Plan for each of the A Class, C Class and R Class (collectively the plans), pursuant to Rule 12b-1 of the 1940 Act. The plans provide that the A Class will pay ACIS an annual distribution and service fee of 0.25%. The plans provide that the C Class will pay ACIS an annual distribution and service fee of 1.00%, of which 0.25% is paid for individual shareholder services and 0.75% is paid for distribution services. The plans provide that the R Class will pay ACIS an annual distribution and service fee of 0.50%. The fees are computed and accrued daily based on each class’s daily net assets and paid monthly in arrears. The fees are used to pay financial intermediaries for distribution and individual shareholder services. Fees incurred under the plans during the period ended November 30, 2024 are detailed in the Statement of Operations.
Directors' Fees and Expenses — The Board of Directors is responsible for overseeing the investment advisor’s management and operations of the fund. The directors receive detailed information about the fund and its investment advisor regularly throughout the year, and meet at least quarterly with management of the investment advisor to review reports about fund operations. The fund's officers do not receive compensation from the fund.
Other Expenses — A fund’s other expenses may include interest charges, clearing exchange fees, proxy solicitation expenses, fees associated with the recovery of foreign tax reclaims and other miscellaneous expenses.
Interfund Transactions — The fund may enter into security transactions with other American Century Investments funds and other client accounts of the investment advisor, in accordance with the 1940 Act rules and procedures adopted by the Board of Directors. The rules and procedures require, among other things, that these transactions be effected at the independent current market price of the security. There were no interfund transactions during the period.
4. Investment Transactions
Purchases and sales of investment securities, excluding short-term investments, for the period ended November 30, 2024 were $448,446,338 and $514,543,345, respectively.
5. Capital Share Transactions
Transactions in shares of the fund were as follows:
| | | | | | | | | | | | | | |
| Year ended November 30, 2024 | Year ended
November 30, 2023 |
| Shares | Amount | Shares | Amount |
| Investor Class/Shares Authorized | 450,000,000 | | | 450,000,000 | | |
| Sold | 1,204,615 | | $ | 14,038,725 | | 1,330,890 | | $ | 13,536,718 | |
| Issued in reinvestment of distributions | 1,331,834 | | 14,130,756 | | 4,185,379 | | 39,468,121 | |
| Redeemed | (4,678,448) | | (54,546,504) | | (4,095,358) | | (41,949,103) | |
| (2,141,999) | | (26,377,023) | | 1,420,911 | | 11,055,736 | |
| I Class/Shares Authorized | 100,000,000 | | | 100,000,000 | | |
| Sold | 391,554 | | 4,690,552 | | 1,039,876 | | 11,007,895 | |
| Issued in reinvestment of distributions | 265,136 | | 2,921,805 | | 863,486 | | 8,444,893 | |
| Redeemed | (1,935,551) | | (23,008,103) | | (2,119,457) | | (22,483,236) | |
| (1,278,861) | | (15,395,746) | | (216,095) | | (3,030,448) | |
| Y Class/Shares Authorized | 20,000,000 | | | 20,000,000 | | |
| Sold | 1,724 | | 21,647 | | 8,554 | | 91,496 | |
| Issued in reinvestment of distributions | 1,145 | | 12,763 | | 3,477 | | 34,387 | |
| Redeemed | (2,622) | | (30,661) | | (10,963) | | (122,314) | |
| 247 | | 3,749 | | 1,068 | | 3,569 | |
| A Class/Shares Authorized | 40,000,000 | | | 40,000,000 | | |
| Sold | 332,420 | | 3,654,739 | | 514,710 | | 4,928,940 | |
| Issued in reinvestment of distributions | 92,542 | | 920,792 | | 312,247 | | 2,769,627 | |
| Redeemed | (465,510) | | (5,043,132) | | (779,154) | | (7,579,406) | |
| (40,548) | | (467,601) | | 47,803 | | 119,161 | |
| C Class/Shares Authorized | 25,000,000 | | | 25,000,000 | | |
| Sold | 21,575 | | 166,732 | | 15,900 | | 110,764 | |
| Issued in reinvestment of distributions | 15,433 | | 106,798 | | 63,840 | | 401,551 | |
| Redeemed | (110,059) | | (837,935) | | (135,365) | | (917,748) | |
| (73,051) | | (564,405) | | (55,625) | | (405,433) | |
| R Class/Shares Authorized | 25,000,000 | | | 25,000,000 | | |
| Sold | 89,475 | | 934,839 | | 87,214 | | 805,743 | |
| Issued in reinvestment of distributions | 21,549 | | 204,720 | | 79,865 | | 677,257 | |
| Redeemed | (148,603) | | (1,580,369) | | (192,108) | | (1,753,944) | |
| (37,579) | | (440,810) | | (25,029) | | (270,944) | |
| R5 Class/Shares Authorized | 20,000,000 | | | 20,000,000 | | |
| Issued in reinvestment of distributions | 34 | | 372 | | 95 | | 932 | |
| R6 Class/Shares Authorized | 75,000,000 | | | 75,000,000 | | |
| Sold | 1,602,752 | | 19,824,781 | | 1,862,989 | | 19,904,062 | |
| Issued in reinvestment of distributions | 285,757 | | 3,177,617 | | 763,180 | | 7,532,585 | |
| Redeemed | (2,560,029) | | (31,610,730) | | (1,630,838) | | (17,275,008) | |
| (671,520) | | (8,608,332) | | 995,331 | | 10,161,639 | |
| Net increase (decrease) | (4,243,277) | | $ | (51,849,796) | | 2,168,459 | | $ | 17,634,212 | |
6. Fair Value Measurements
The fund's investments valuation process is based on several considerations and may use multiple inputs to determine the fair value of the investments held by the fund. In conformity with accounting principles generally accepted in the United States of America, the inputs used to determine a valuation are classified into three broad levels.
•Level 1 valuation inputs consist of unadjusted quoted prices in an active market for identical investments.
•Level 2 valuation inputs consist of direct or indirect observable market data (including quoted prices for comparable investments, evaluations of subsequent market events, interest rates, prepayment speeds, credit risk, etc.). These inputs also consist of quoted prices for identical investments initially expressed in local currencies that are adjusted through translation into U.S. dollars.
•Level 3 valuation inputs consist of unobservable data (including a fund’s own assumptions).
The level classification is based on the lowest level input that is significant to the fair valuation measurement. The valuation inputs are not necessarily an indication of the risks associated with investing in these securities or other financial instruments.
The following is a summary of the level classifications as of period end. The Schedule of Investments provides additional information on the fund's portfolio holdings.
| | | | | | | | | | | |
| Level 1 | Level 2 | Level 3 |
| Assets | | | |
| Investment Securities | | | |
| Common Stocks | | | |
| Denmark | — | | $ | 18,748,279 | | — | |
| France | — | | 18,236,981 | | — | |
| Germany | — | | 16,881,438 | | — | |
| Hong Kong | — | | 16,062,064 | | — | |
| Indonesia | — | | 17,970,677 | | — | |
| Japan | — | | 35,715,726 | | — | |
| Spain | — | | 17,463,556 | | — | |
| United Kingdom | $ | 18,375,262 | | 20,063,189 | | — | |
| Other Countries | 457,798,624 | | — | | — | |
| Short-Term Investments | — | | 2,588,455 | | — | |
| $ | 476,173,886 | | $ | 163,730,365 | | — | |
7. Risk Factors
The value of the fund’s shares will go up and down, sometimes rapidly or unpredictably, based on the performance of the securities owned by the fund and other factors generally affecting the securities market. Market risks, including political, regulatory, economic and social developments, can affect the value of the fund’s investments. Natural disasters, public health emergencies, war, terrorism and other unforeseeable events may lead to increased market volatility and may have adverse long-term effects on world economies and markets generally.
There are certain risks involved in investing in foreign securities. These risks include those resulting from political events (such as civil unrest, national elections and imposition of exchange controls), social and economic events (such as labor strikes and rising inflation), and natural disasters. Securities of foreign issuers may be less liquid and more volatile. Investing in emerging markets or a significant portion of assets in one country or region may accentuate these risks.
8. Federal Tax Information
On December 17, 2024, the fund declared and paid a per-share distribution from net realized gains to shareholders of record on December 16, 2024 of $1.5771 for the Investor Class, I Class, Y Class, A Class, C Class, R Class, R5 Class and R6 Class.
On December 17, 2024, the fund declared and paid the following per-share distributions from net investment income to shareholders of record on December 16, 2024:
| | | | | | | | | | | | | | | | | | | | | | | |
| Investor Class | I Class | Y Class | A Class | C Class | R Class | R5 Class | R6 Class |
| $0.0111 | $0.0365 | $0.0555 | — | — | — | $0.0365 | $0.0555 |
The tax character of distributions paid during the years ended November 30, 2024 and November 30, 2023 were as follows:
| | | | | | | | |
| 2024 | 2023 |
| Distributions Paid From | | |
| Ordinary income | $ | 3,076,251 | | $ | 3,452,272 | |
| Long-term capital gains | $ | 19,360,131 | | $ | 58,431,350 | |
The book-basis character of distributions made during the year from net investment income or net realized gains may differ from their ultimate characterization for federal income tax purposes. These differences reflect the differing character of certain income items and net realized gains and losses for financial statement and tax purposes, and may result in reclassification among certain capital accounts on the financial statements.
As of period end, the federal tax cost of investments and the components of distributable earnings on a tax-basis were as follows:
| | | | | |
| Federal tax cost of investments | $ | 531,055,786 | |
| Gross tax appreciation of investments | $ | 125,009,114 | |
| Gross tax depreciation of investments | (16,160,649) | |
| Net tax appreciation (depreciation) of investments | 108,848,465 | |
| Net tax appreciation (depreciation) on translation of assets and liabilities in foreign currencies | 8,826 | |
| Net tax appreciation (depreciation) | $ | 108,857,291 | |
| Undistributed ordinary income | $ | 19,332,072 | |
| Accumulated long-term gains | $ | 60,709,763 | |
The difference between book-basis and tax-basis unrealized appreciation (depreciation) is attributable primarily to the tax deferral of losses on wash sales.
| | | | | | | | | | | | | | | | | | | | | | | | | | | | | | | | | | | | | | | | | |
| For a Share Outstanding Throughout the Years Ended November 30 (except as noted) | | | | | | | |
| Per-Share Data | | | | | | Ratios and Supplemental Data | |
| | Income From Investment Operations*: | Distributions From: | | | Ratio to Average Net Assets of†: | | |
| Net Asset
Value,
Beginning
of Period | Net Investment Income (Loss)(1) | Net
Realized
and
Unrealized
Gain (Loss) | Total From
Investment
Operations | Net
Investment
Income | Net
Realized
Gains | Total
Distributions | Net Asset
Value,
End
of Period | Total Return(2) | Operating
Expenses | Net
Investment
Income
(Loss) | Portfolio
Turnover
Rate | Net
Assets,
End of
Period
(in thousands) |
| Investor Class | | | | | | | | | | | |
| 2024 | $10.73 | 0.02 | 2.27 | 2.29 | (0.05) | (0.36) | (0.41) | $12.61 | 22.03% | 1.08% | 0.21% | 72% | $432,423 | |
| 2023 | $11.10 | 0.05 | 0.77 | 0.82 | (0.06) | (1.13) | (1.19) | $10.73 | 8.84% | 1.09% | 0.50% | 79% | $390,767 | |
| 2022 | $15.00 | 0.06 | (2.16) | (2.10) | (0.03) | (1.77) | (1.80) | $11.10 | (16.07)% | 1.10% | 0.54% | 45% | $388,619 | |
| 2021 | $14.56 | 0.04 | 1.84 | 1.88 | — | (1.44) | (1.44) | $15.00 | 14.18% | 1.07% | 0.26% | 40% | $495,712 | |
| 2020 | $13.54 | (0.02) | 3.16 | 3.14 | —(3) | (2.12) | (2.12) | $14.56 | 27.02% | 1.07% | (0.14)% | 73% | $462,781 | |
| I Class | | | | | | | | | | | |
| 2024 | $11.14 | 0.05 | 2.36 | 2.41 | (0.07) | (0.36) | (0.43) | $13.12 | 22.36% | 0.88% | 0.41% | 72% | $74,007 | |
| 2023 | $11.48 | 0.07 | 0.80 | 0.87 | (0.08) | (1.13) | (1.21) | $11.14 | 9.03% | 0.89% | 0.70% | 79% | $77,104 | |
| 2022 | $15.46 | 0.09 | (2.24) | (2.15) | (0.06) | (1.77) | (1.83) | $11.48 | (15.93)% | 0.90% | 0.74% | 45% | $81,949 | |
| 2021 | $14.93 | 0.07 | 1.90 | 1.97 | — | (1.44) | (1.44) | $15.46 | 14.45% | 0.87% | 0.46% | 40% | $103,394 | |
| 2020 | $13.84 | —(3) | 3.24 | 3.24 | (0.03) | (2.12) | (2.15) | $14.93 | 27.21% | 0.87% | 0.06% | 73% | $94,888 | |
| Y Class | | | | | | | | | | | | | |
| 2024 | $11.28 | 0.07 | 2.39 | 2.46 | (0.09) | (0.36) | (0.45) | $13.29 | 22.53% | 0.73% | 0.56% | 72% | $395 | |
| 2023 | $11.61 | 0.09 | 0.81 | 0.90 | (0.10) | (1.13) | (1.23) | $11.28 | 9.18% | 0.74% | 0.85% | 79% | $333 | |
| 2022 | $15.62 | 0.11 | (2.27) | (2.16) | (0.08) | (1.77) | (1.85) | $11.61 | (15.82)% | 0.75% | 0.89% | 45% | $330 | |
| 2021 | $15.05 | 0.08 | 1.93 | 2.01 | — | (1.44) | (1.44) | $15.62 | 14.62% | 0.72% | 0.61% | 40% | $311 | |
| 2020 | $13.93 | 0.03 | 3.26 | 3.29 | (0.05) | (2.12) | (2.17) | $15.05 | 27.48% | 0.72% | 0.21% | 73% | $167 | |
| A Class | | | | | | | | | | | | | |
| 2024 | $10.06 | —(3) | 2.12 | 2.12 | (0.02) | (0.36) | (0.38) | $11.80 | 21.77% | 1.33% | (0.04)% | 72% | $29,427 | |
| 2023 | $10.48 | 0.02 | 0.72 | 0.74 | (0.03) | (1.13) | (1.16) | $10.06 | 8.56% | 1.34% | 0.25% | 79% | $25,494 | |
| 2022 | $14.27 | 0.03 | (2.05) | (2.02) | — | (1.77) | (1.77) | $10.48 | (16.32)% | 1.35% | 0.29% | 45% | $26,064 | |
| 2021 | $13.94 | —(3) | 1.77 | 1.77 | — | (1.44) | (1.44) | $14.27 | 13.99% | 1.32% | 0.01% | 40% | $34,059 | |
| 2020 | $13.08 | (0.05) | 3.03 | 2.98 | — | (2.12) | (2.12) | $13.94 | 26.66% | 1.32% | (0.39)% | 73% | $30,537 | |
| C Class | | | | | | | | | | | | | |
| 2024 | $7.09 | (0.06) | 1.48 | 1.42 | — | (0.36) | (0.36) | $8.15 | 20.88% | 2.08% | (0.79)% | 72% | $1,915 | |
| 2023 | $7.76 | (0.03) | 0.49 | 0.46 | — | (1.13) | (1.13) | $7.09 | 7.72% | 2.09% | (0.50)% | 79% | $2,184 | |
| 2022 | $11.08 | (0.04) | (1.51) | (1.55) | — | (1.77) | (1.77) | $7.76 | (16.87)% | 2.10% | (0.46)% | 45% | $2,822 | |
| 2021 | $11.23 | (0.08) | 1.37 | 1.29 | — | (1.44) | (1.44) | $11.08 | 12.99% | 2.07% | (0.74)% | 40% | $5,426 | |
| 2020 | $11.00 | (0.11) | 2.46 | 2.35 | — | (2.12) | (2.12) | $11.23 | 25.84% | 2.07% | (1.14)% | 73% | $5,302 | |
| | | | | | | | | | | | | | | | | | | | | | | | | | | | | | | | | | | | | | | | | |
| For a Share Outstanding Throughout the Years Ended November 30 (except as noted) | | | | | | | |
| Per-Share Data | | | | | | Ratios and Supplemental Data | |
| | Income From Investment Operations*: | Distributions From: | | | Ratio to Average Net Assets of†: | | |
| Net Asset
Value,
Beginning
of Period | Net Investment Income (Loss)(1) | Net
Realized
and
Unrealized
Gain (Loss) | Total From
Investment
Operations | Net
Investment
Income | Net
Realized
Gains | Total
Distributions | Net Asset
Value,
End
of Period | Total Return(2) | Operating
Expenses | Net
Investment
Income
(Loss) | Portfolio
Turnover
Rate | Net
Assets,
End of
Period
(in thousands) |
| R Class | | | | | | | | | | | | | |
| 2024 | $9.60 | (0.03) | 2.03 | 2.00 | — | (0.36) | (0.36) | $11.24 | 21.48% | 1.58% | (0.29)% | 72% | $6,040 | |
| 2023 | $10.06 | —(3) | 0.68 | 0.68 | (0.01) | (1.13) | (1.14) | $9.60 | 8.20% | 1.59% | —% | 79% | $5,520 | |
| 2022 | $13.79 | —(3) | (1.96) | (1.96) | — | (1.77) | (1.77) | $10.06 | (16.48)% | 1.60% | 0.04% | 45% | $6,033 | |
| 2021 | $13.55 | (0.03) | 1.71 | 1.68 | — | (1.44) | (1.44) | $13.79 | 13.71% | 1.57% | (0.24)% | 40% | $8,411 | |
| 2020 | $12.80 | (0.07) | 2.94 | 2.87 | — | (2.12) | (2.12) | $13.55 | 26.34% | 1.57% | (0.64)% | 73% | $8,931 | |
| R5 Class | | | | | | | | | | | | | |
| 2024 | $11.15 | 0.05 | 2.35 | 2.40 | (0.07) | (0.36) | (0.43) | $13.12 | 22.25% | 0.88% | 0.41% | 72% | $12 | |
| 2023 | $11.49 | 0.07 | 0.80 | 0.87 | (0.08) | (1.13) | (1.21) | $11.15 | 9.03% | 0.89% | 0.70% | 79% | $10 | |
| 2022 | $15.46 | 0.09 | (2.23) | (2.14) | (0.06) | (1.77) | (1.83) | $11.49 | (15.86)% | 0.90% | 0.74% | 45% | $9 | |
| 2021 | $14.93 | 0.07 | 1.90 | 1.97 | — | (1.44) | (1.44) | $15.46 | 14.45% | 0.87% | 0.46% | 40% | $11 | |
| 2020 | $13.84 | 0.01 | 3.23 | 3.24 | (0.03) | (2.12) | (2.15) | $14.93 | 27.21% | 0.87% | 0.06% | 73% | $9 | |
| R6 Class | | | | | | | | | | | | | |
| 2024 | $11.26 | 0.07 | 2.38 | 2.45 | (0.09) | (0.36) | (0.45) | $13.26 | 22.48% | 0.73% | 0.56% | 72% | $95,539 | |
| 2023 | $11.59 | 0.09 | 0.81 | 0.90 | (0.10) | (1.13) | (1.23) | $11.26 | 9.20% | 0.74% | 0.85% | 79% | $88,671 | |
| 2022 | $15.59 | 0.11 | (2.26) | (2.15) | (0.08) | (1.77) | (1.85) | $11.59 | (15.79)% | 0.75% | 0.89% | 45% | $79,749 | |
| 2021 | $15.03 | 0.09 | 1.91 | 2.00 | — | (1.44) | (1.44) | $15.59 | 14.57% | 0.72% | 0.61% | 40% | $98,318 | |
| 2020 | $13.92 | 0.03 | 3.25 | 3.28 | (0.05) | (2.12) | (2.17) | $15.03 | 27.44% | 0.72% | 0.21% | 73% | $90,433 | |
| | |
| Notes to Financial Highlights |
(1)Computed using average shares outstanding throughout the period.
(2)Total returns are calculated based on the net asset value of the last business day and do not reflect applicable sales charges, if any. Total returns for periods less than one year are not annualized.
(3)Per-share amount was less than $0.005.
*The amount shown for a share outstanding throughout the period may not correlate with the Statement(s) of Operations or precisely reflect the class expense differentials due to the timing of transactions in shares of a fund in relation to income earned and/or fluctuations in the fair value of a fund's investments.
†Ratios for periods less than one year are annualized. Zero balances may reflect amounts less than 0.005%.
See Notes to Financial Statements.
| | |
| Report of Independent Registered Public Accounting Firm |
To the shareholders of the Focused Global Growth Fund and the Board of Directors of American Century World Mutual Funds, Inc.
Opinion on the Financial Statements and Financial Highlights
We have audited the accompanying statement of assets and liabilities, including the schedule of investments, of Focused Global Growth Fund (the “Fund”), one of the funds constituting the American Century World Mutual Funds, Inc., as of November 30, 2024, the related statement of operations for the year then ended, the statements of changes in net assets for each of the two years in the period then ended, the financial highlights for each of the five years in the period then ended, and the related notes. In our opinion, the financial statements and financial highlights present fairly, in all material respects, the financial position of the Fund as of November 30, 2024, and the results of its operations for the year then ended, the changes in its net assets for each of the two years in the period then ended, and the financial highlights for each of the five years in the period then ended, in conformity with accounting principles generally accepted in the United States of America.
Basis for Opinion
These financial statements and financial highlights are the responsibility of the Fund's management. Our responsibility is to express an opinion on the Fund’s financial statements and financial highlights based on our audits. We are a public accounting firm registered with the Public Company Accounting Oversight Board (United States) (PCAOB) and are required to be independent with respect to the Fund in accordance with the U.S. federal securities laws and the applicable rules and regulations of the Securities and Exchange Commission and the PCAOB.
We conducted our audits in accordance with the standards of the PCAOB. Those standards require that we plan and perform the audit to obtain reasonable assurance about whether the financial statements and financial highlights are free of material misstatement, whether due to error or fraud. The Fund is not required to have, nor were we engaged to perform, an audit of its internal control over financial reporting. As part of our audits, we are required to obtain an understanding of internal control over financial reporting but not for the purpose of expressing an opinion on the effectiveness of the Fund’s internal control over financial reporting. Accordingly, we express no such opinion.
Our audits included performing procedures to assess the risks of material misstatement of the financial statements and financial highlights, whether due to error or fraud, and performing procedures that respond to those risks. Such procedures included examining, on a test basis, evidence regarding the amounts and disclosures in the financial statements and financial highlights. Our audits also included evaluating the accounting principles used and significant estimates made by management, as well as evaluating the overall presentation of the financial statements and financial highlights. Our procedures included confirmation of securities owned as of November 30, 2024, by correspondence with the custodian and brokers; when replies were not received from brokers, we performed other auditing procedures. We believe that our audits provide a reasonable basis for our opinion.
/s/ Deloitte & Touche LLP
Kansas City, Missouri
January 16, 2025
We have served as the auditor of one or more American Century investment companies since 1997.
| | |
| Approval of Management Agreement |
At a meeting held on June 27, 2024, the Fund’s Board of Directors (the “Board”) unanimously approved the renewal of the management agreement pursuant to which American Century Investment Management, Inc. (the “Advisor”) acts as the investment advisor for the Fund. Under the Investment Company Act of 1940 (the “Investment Company Act”), contracts for investment advisory services are required to be reviewed, evaluated, and approved by a majority of a fund’s Directors, including a majority of the independent Directors.
Prior to its consideration of the renewal of the management agreement, the Directors requested and reviewed data and information compiled by the Advisor and certain independent consultants and data providers concerning the Fund. This review was in addition to the oversight and evaluation undertaken by the Board and its committees on a continual basis and the information received was supplemental to the information that the Board and its committees receive and consider over time.
In connection with its consideration of the renewal of the management agreement, the Board’s review and evaluation of the services provided by the Advisor and its affiliates included, but was not limited to
•the nature, extent, and quality of investment management, shareholder services, distribution services, and other services provided to the Fund;
•the wide range of programs and services the Advisor and other service providers provide to the Fund and its shareholders on a routine and non-routine basis;
•the Fund’s investment performance compared to appropriate benchmarks and/or peer groups of other mutual funds with similar investment objectives and strategies;
•the cost of owning the Fund compared to the cost of owning similarly-managed funds;
•the Advisor’s compliance policies, procedures, and regulatory experience and those of certain other service providers;
•the Advisor’s strategic plans, generally, and with respect to the Advisor’s response to investment management industry challenges;
•the Advisor’s business continuity plans, vendor management practices, and information security practices;
•the cost of services provided to the Fund, the profitability of the Fund to the Advisor, and the Advisor’s financial results of operation;
•possible economies of scale associated with the Advisor’s management of the Fund;
•any collateral benefits derived by the Advisor from the management of the Fund;
•fees and expenses associated with any investment by the Fund in other funds;
•payments to intermediaries by the Fund and the Advisor and services provided by intermediaries in connection therewith; and
•services provided and charges to the Advisor’s other investment management clients.
The Board held two meetings to consider the renewal. The independent Directors also met in private session multiple times to review and discuss the information provided in response to their request. The independent Directors held active discussions with the Advisor regarding the renewal of the management agreement, requesting supplemental information, and reviewing information provided by the Advisor in response thereto. The independent Directors had the benefit of the advice of their independent counsel throughout the process.
Factors Considered
The Directors considered all of the information provided by the Advisor, the independent consultant and data providers, and the independent Directors’ independent counsel in connection with the approval. They determined that the information was sufficient for them to evaluate the management agreement for the Fund. In connection with their review, the Directors did not identify any single factor as being all-important or controlling, and each Director may have attributed different levels of importance to different factors. In deciding to renew the management agreement, the Board based its decision on a number of factors, including without limitation the following:
Nature, Extent and Quality of Services — Generally. Under the management agreement, the Advisor is responsible for providing or arranging for all services necessary for the operation of the Fund. The Board noted that the Advisor provides or arranges at its own expense a wide variety of services which include, without limitation, the following:
•constructing and designing the Fund
•portfolio research and security selection
•initial capitalization/funding
•securities trading
•Fund administration
•custody of Fund assets
•daily valuation of the Fund’s portfolio
•liquidity monitoring and management
•risk management, including information security
•shareholder servicing and transfer agency, including shareholder confirmations, recordkeeping, and communications
•legal services (except the independent Directors’ counsel)
•regulatory and portfolio compliance
•financial reporting
•marketing and distribution (except amounts paid by the Fund under Rule 12b-1 plans)
The Board noted that many of these services have expanded over time in terms of both quantity and complexity in response to shareholder demands, competition in the industry, changing distribution channels, and the changing regulatory environment.
Investment Management Services. The nature of the investment management services provided to the Fund is quite complex and allows Fund shareholders access to professional money management, instant diversification of their investments, the opportunity to easily diversify among asset classes by investing in or exchanging among various American Century Investments funds, and liquidity. In evaluating investment performance, the Board expects the Advisor to manage the Fund in accordance with its investment objectives and principal investment strategies. Further, the Directors recognize that the Advisor has an obligation to monitor trading activities, and in particular to seek the best execution of fund trades, and to evaluate the use of and payment for research. In providing these services, the Advisor utilizes teams of investment professionals who require extensive information technology, research, training, compliance, and other systems to conduct their business. The Board, directly and through its Fund Performance Review Committee, provides oversight of the investment performance process. It regularly reviews investment performance information for the Fund, together with comparative information for appropriate benchmarks and/or peer groups of similarly-managed funds, over different time horizons. The Directors also review investment performance information from both the Advisor and an independent third party during the management agreement renewal process. If performance concerns are identified, the Board discusses with the Advisor the reasons for such results and any actions being taken to improve performance and may conduct special reviews until performance improves. The Fund’s performance was above its benchmark for the five- and ten-year periods and below its benchmark for the one- and three-year periods reviewed by the Board. In relation to industry peers, the Fund was below the median of its peer performance universe as identified by a third-party service provider for the one-, three-, five-, and ten-year periods. The Board discussed the Fund’s performance with the Advisor, including steps being taken to address underperformance, and was satisfied with the efforts being undertaken by the Advisor. The Board found the investment management services provided by the Advisor to the Fund to be satisfactory and consistent with the management agreement.
Shareholder and Other Services. Under the management agreement, the Advisor provides the Fund with a comprehensive package of transfer agency, shareholder, and other services. The Board, directly and through its various committees, regularly reviews reports and evaluations of such services at its regular meetings. These reports include, but are not limited to, information regarding the operational efficiency and accuracy of the shareholder and transfer agency services provided, staffing levels, shareholder satisfaction, technology support (including information security), new products and services offered to Fund shareholders, securities trading activities, portfolio valuation services, auditing services, and legal and operational compliance activities. The Board found the services provided by the Advisor to the Fund under the management agreement to be competitive and of high quality.
Costs of Services and Profitability. The Advisor provides detailed information concerning its cost of providing various services to the Fund, its profitability in managing the Fund (pre- and post-distribution), and its financial results of operation. The Directors have reviewed with the Advisor the methodology used to prepare this financial information and arranged for an independent consultant to confirm the reasonableness of the allocation methodology used. This information is considered in evaluating the Advisor’s financial condition, its ability to continue to provide services under the management agreement, and the reasonableness of the terms of the current management agreement. The Board concluded that the Advisor’s profits were reasonable in light of the services provided to the Fund.
Ethics. The Board generally considers the Advisor’s commitment to providing quality services to shareholders and to conducting its business ethically. They noted that the Advisor’s practices generally meet or exceed industry best practices.
Economies of Scale. The Board also reviewed information provided by the Advisor regarding the possible existence of economies of scale in connection with the management of the Fund. The Board concluded that economies of scale are difficult to measure and predict with precision, especially on a fund-by-fund basis. The Board concluded that the Advisor is sharing economies of scale, to the extent they exist, through its fee structure, and through reinvestment in its business, infrastructure, investment capabilities and initiatives to provide shareholders enhanced and expanded content and services. The Board also noted that economies of scale are shared with the Fund and its shareholders through management fee breakpoints that serve to reduce the effective management fee as the assets of the Fund grow. Assets of various classes of the same Fund or similarly-managed products are combined with the assets of the Fund to help achieve those breakpoints.
Comparison to Other Funds’ Fees. The management agreement provides that the Fund pays the Advisor a single, all-inclusive (or unified) management fee for providing all services necessary for the management and operation of the Fund, other than brokerage and other transaction fees and expenses relating to acquisition and disposition of portfolio securities, acquired fund fees and expenses, taxes, interest, extraordinary expenses, fund litigation expenses, fees and expenses of the Fund’s independent Directors (including their independent legal counsel), and expenses incurred in connection with the provision of shareholder services and distribution services under a plan adopted pursuant to Investment Company Act Rule 12b-1. Under the unified fee structure, the Advisor is responsible for providing all investment advisory, custody, audit, administrative, compliance, recordkeeping, marketing and shareholder services, or arranging and supervising third parties to provide such services. By contrast, most other funds are charged a variety of fees, including an investment advisory fee, a transfer agency fee, an
administrative fee, distribution charges, and other expenses. Other than their investment advisory fees and any applicable Rule 12b-1 distribution fees, all other components of the total fees charged by these other funds may be increased without shareholder approval. The Board believes the unified fee structure is a benefit to Fund shareholders because it clearly discloses to shareholders the cost of owning Fund shares, and, since the unified fee cannot be increased without a vote of Fund shareholders, it shifts to the Advisor the risk of increased costs of operating the Fund and provides a direct incentive to minimize administrative inefficiencies. Part of the Board’s analysis of fee levels involves reviewing certain evaluative data compiled by an independent provider comparing the Fund’s unified fee to the total expense ratios of its peers. The unified fee charged to shareholders of the Fund was below the median of the total expense ratios of the Fund’s peer expense universe. In addition, the Board reviewed the Fund’s position relative to the narrower set of its expense group peers. The Board concluded that the management fee paid by the Fund to the Advisor under the management agreement is reasonable in light of the services provided to the Fund.
Comparison to Fees and Services Provided to Other Clients of the Advisor. The Board also requested and received information from the Advisor concerning the nature of the services, fees, costs, and profitability of its advisory services to advisory clients other than the Fund. They observed that these varying types of client accounts require different services and involve different regulatory and entrepreneurial risks than the management of the Fund. The Board analyzed this information and concluded that the fees charged and services provided to the Fund were reasonable by comparison.
Payments to Intermediaries. The Directors also requested and received a description of payments made to intermediaries by the Fund and the Advisor and services provided in response thereto. These payments include various payments made by the Fund or the Advisor to different types of intermediaries and recordkeepers for distribution and service activities provided for the Fund. The Directors reviewed such information and received representations from the Advisor that all such payments by the Fund were made pursuant to the Fund’s Rule 12b-1 Plan and that all such payments by the Advisor were made from the Advisor’s resources and reasonable profits.
Collateral or “Fall-Out” Benefits Derived by the Advisor. The Board considered the possible existence of collateral benefits the Advisor may receive as a result of its relationship with the Fund. They concluded that the Advisor’s primary business is managing funds and it generally does not use fund or shareholder information to generate profits in other lines of business, and therefore does not derive any significant collateral benefits from them. To the extent there are potential collateral benefits, the Board has been advised and has taken this into consideration in its review of the management contract with the Fund. The Board noted that additional assets from other clients may offer the Advisor some benefit from increased leverage with prospective clients, service providers, and counterparties. Additionally, the Advisor may receive proprietary research from broker-dealers that execute fund portfolio transactions, which the Board concluded is likely to benefit other clients of the Advisor, as well as Fund shareholders. The Board also determined that the Advisor is able to provide investment management services to certain clients other than the Fund, at least in part, due to its existing infrastructure built to serve the fund complex. The Board concluded that appropriate allocation methodologies had been employed to assign resources and the cost of those resources to these other clients and these other client assets are included with the assets of the Fund to determine breakpoints in the management fee schedule.
Existing Relationship. The Board also considered whether there was any reason for not continuing the existing arrangement with the Advisor. In this regard, the Board was mindful of the potential disruptions of the Fund’s operations and various risks, uncertainties, and other effects that could occur as a result of a decision not to continue such relationship. In particular, the Board recognized that most shareholders have invested in the Fund on the strength of the Advisor’s industry standing and reputation and in the expectation that the Advisor will have a continuing role in providing advisory services to the Fund.
Conclusion of the Directors. As a result of this process, the Board, including all of the independent Directors, taking into account all of the factors discussed above and the information provided by the Advisor and others in connection with its review and received over time, determined that the terms of the management agreement are fair and reasonable and that the management fee charged to the Fund is reasonable in light of the services provided and that the management agreement between the Fund and the Advisor should be renewed for an additional one-year period.
Other Tax Information
The following information is provided pursuant to provisions of the Internal Revenue Code.
The fund hereby designates up to the maximum amount allowable as qualified dividend income for the fiscal year ended November 30, 2024.
For corporate taxpayers, the fund hereby designates $3,076,251, or up to the maximum amount allowable, of ordinary income distributions paid during the fiscal year ended November 30, 2024 as qualified for the corporate dividends received deduction.
The fund hereby designates $791,125 as qualified short-term capital gain distributions for purposes of Internal Revenue Code Section 871 for the fiscal year ended November 30, 2024.
The fund hereby designates $21,977,030, or up to the maximum amount allowable, as long-term capital gain distributions (20% rate gain distributions) for the fiscal year ended November 30, 2024.
The fund utilized earnings and profits of $3,450,254 distributed to shareholders on redemption of shares as part of the dividends paid deduction (tax equalization).
| | | | | | | | |
| Contact Us | americancentury.com | |
| Automated Information Line | 1-800-345-8765 | |
| Investor Services Representative | 1-800-345-2021
or 816-531-5575 | |
| Banks and Trust Companies, Broker-Dealers, Financial Professionals, Insurance Companies | 1-800-345-6488 | |
| | |
| This report and the statements it contains are submitted for the general information of our shareholders. The report is not authorized for distribution to prospective investors unless preceded or accompanied by an effective prospectus. | |
| | |
©2025 American Century Proprietary Holdings, Inc. All rights reserved.
CL-ANN-91028 2501 | |
| | | | | |
| |
| Annual Financial Statements and Other Information |
| |
| November 30, 2024 |
| |
| Focused International Growth Fund |
| Investor Class (AFCNX) |
| I Class (AFCSX) |
| A Class (AFCLX) |
| C Class (AFCHX) |
| R Class (AFCWX) |
| R6 Class (AFCMX) |
| G Class (AFCGX) |
| | | | | |
| Schedule of Investments | |
| Statement of Assets and Liabilities | |
| Statement of Operations | |
| Statement of Changes in Net Assets | |
| Notes to Financial Statements | |
| Financial Highlights | |
| Report of Independent Registered Public Accounting Firm | |
| Approval of Management Agreement | |
| |
| Other Tax Information | |
NOVEMBER 30, 2024
| | | | | | | | |
| Shares | Value |
| COMMON STOCKS — 96.8% | | |
| Australia — 4.3% | | |
| CSL Ltd. | 11,640 | | $ | 2,145,975 | |
NEXTDC Ltd.(1) | 241,342 | | 2,574,448 | |
| | 4,720,423 | |
| Brazil — 1.1% | | |
NU Holdings Ltd., Class A(1) | 94,990 | | 1,190,225 | |
| Canada — 1.0% | | |
Canadian Pacific Kansas City Ltd.(2) | 14,330 | | 1,096,308 | |
| China — 4.8% | | |
| Tencent Holdings Ltd. | 54,100 | | 2,793,901 | |
Trip.com Group Ltd., ADR(1) | 36,940 | | 2,388,171 | |
| | 5,182,072 | |
| Denmark — 4.8% | | |
| DSV AS | 4,940 | | 1,058,032 | |
| Novo Nordisk AS, Class B | 38,504 | | 4,126,464 | |
| | 5,184,496 | |
| France — 6.1% | | |
| Air Liquide SA | 16,489 | | 2,742,701 | |
| Schneider Electric SE | 15,036 | | 3,873,588 | |
| | 6,616,289 | |
| Germany — 5.9% | | |
| SAP SE | 18,550 | | 4,404,989 | |
Siemens Energy AG(1) | 37,790 | | 2,050,188 | |
| | 6,455,177 | |
| Hong Kong — 2.1% | | |
| Techtronic Industries Co. Ltd. | 163,000 | | 2,319,997 | |
| India — 2.2% | | |
MakeMyTrip Ltd.(1) | 20,950 | | 2,403,803 | |
| Indonesia — 2.3% | | |
| Bank Central Asia Tbk. PT | 4,029,800 | | 2,544,669 | |
| Ireland — 1.4% | | |
| Kerry Group PLC, A Shares | 15,840 | | 1,532,301 | |
| Italy — 2.2% | | |
| Ferrari NV | 5,580 | | 2,430,797 | |
| Japan — 18.8% | | |
| Fast Retailing Co. Ltd. | 3,200 | | 1,096,550 | |
| Hitachi Ltd. | 127,800 | | 3,220,667 | |
| Keyence Corp. | 6,700 | | 2,907,082 | |
| MonotaRO Co. Ltd. | 92,500 | | 1,652,637 | |
| NEC Corp. | 27,600 | | 2,359,755 | |
| NTT Data Group Corp. | 145,600 | | 2,829,162 | |
Shin-Etsu Chemical Co. Ltd.(2) | 50,600 | | 1,877,683 | |
Terumo Corp.(2) | 140,300 | | 2,865,623 | |
| Tokio Marine Holdings, Inc. | 42,800 | | 1,595,952 | |
| | 20,405,111 | |
| Netherlands — 6.1% | | |
Adyen NV(1) | 1,430 | | 2,081,382 | |
ASML Holding NV(2) | 3,370 | | 2,302,749 | |
| | | | | | | | |
| Shares | Value |
| DSM-Firmenich AG | 19,930 | | $ | 2,189,188 | |
| | 6,573,319 | |
| Spain — 2.2% | | |
| Iberdrola SA | 164,160 | | 2,340,856 | |
| Switzerland — 4.4% | | |
| Lonza Group AG | 3,520 | | 2,110,602 | |
On Holding AG, Class A(1) | 44,890 | | 2,618,434 | |
| | 4,729,036 | |
| Taiwan — 6.3% | | |
| Taiwan Semiconductor Manufacturing Co. Ltd. | 219,000 | | 6,824,159 | |
| United Kingdom — 18.1% | | |
| Ashtead Group PLC | 21,900 | | 1,755,196 | |
| AstraZeneca PLC | 17,880 | | 2,419,960 | |
| Barclays PLC | 932,260 | | 3,124,937 | |
| Experian PLC | 39,800 | | 1,902,590 | |
| Haleon PLC | 398,847 | | 1,902,547 | |
| London Stock Exchange Group PLC | 25,306 | | 3,626,824 | |
| RELX PLC | 60,300 | | 2,842,790 | |
| Unilever PLC | 34,670 | | 2,076,106 | |
| | 19,650,950 | |
| United States — 2.7% | | |
| CRH PLC | 28,450 | | 2,909,582 | |
TOTAL COMMON STOCKS (Cost $87,628,659) | | 105,109,570 | |
| SHORT-TERM INVESTMENTS — 9.2% | | |
| Money Market Funds — 5.6% | | |
State Street Navigator Securities Lending Government Money Market Portfolio(3) | 6,034,478 | | 6,034,478 | |
| Repurchase Agreements — 3.6% | | |
| BMO Capital Markets Corp., (collateralized by various U.S. Treasury obligations, 3.625%, 2/15/44, valued at $367,767), in a joint trading account at 4.56%, dated 11/29/24, due 12/2/24 (Delivery value $361,315) | | 361,178 | |
| Fixed Income Clearing Corp., (collateralized by various U.S. Treasury obligations, 2.00%, 2/15/50, valued at $3,648,615), at 4.57%, dated 11/29/24, due 12/2/24 (Delivery value $3,578,362) | | 3,577,000 | |
| | 3,938,178 | |
TOTAL SHORT-TERM INVESTMENTS (Cost $9,972,656) | | 9,972,656 | |
TOTAL INVESTMENT SECURITIES — 106.0% (Cost $97,601,315) | | 115,082,226 | |
| OTHER ASSETS AND LIABILITIES — (6.0)% | | (6,500,274) | |
| TOTAL NET ASSETS — 100.0% | | $ | 108,581,952 | |
| | | | | |
| MARKET SECTOR DIVERSIFICATION |
| (as a % of net assets) | |
| Information Technology | 22.3% |
| Industrials | 20.0% |
| Financials | 13.0% |
| Health Care | 12.6% |
| Consumer Discretionary | 10.1% |
| Materials | 8.9% |
| Consumer Staples | 5.1% |
| Communication Services | 2.6% |
| Utilities | 2.2% |
| Short-Term Investments | 9.2% |
| Other Assets and Liabilities | (6.0)% |
| | | | | | | | |
| NOTES TO SCHEDULE OF INVESTMENTS |
| ADR | – | American Depositary Receipt |
(1)Non-income producing.
(2)Security, or a portion thereof, is on loan. At the period end, the aggregate value of securities on loan was $6,020,779. The amount of securities on loan indicated may not correspond with the securities on loan identified because securities with pending sales are in the process of recall from the brokers.
(3)Investment of cash collateral from securities on loan. At the period end, the aggregate value of the collateral held by the fund was $6,374,188, which includes securities collateral of $339,710.
See Notes to Financial Statements.
| | |
| Statement of Assets and Liabilities |
| | | | | |
| NOVEMBER 30, 2024 | |
| Assets | |
| Investment securities, at value (cost of $91,566,837) — including $6,020,779 of securities on loan | $ | 109,047,748 | |
| Investment made with cash collateral received for securities on loan, at value (cost of $6,034,478) | 6,034,478 | |
| Total investment securities, at value (cost of $97,601,315) | 115,082,226 | |
| Cash | 15,328 | |
| Foreign currency holdings, at value (cost of $11) | 11 | |
| Receivable for investments sold | 1,293,323 | |
| Receivable for capital shares sold | 121,855 | |
| Dividends and interest receivable | 174,554 | |
| Securities lending receivable | 570 | |
| 116,687,867 | |
| |
| Liabilities | |
| Payable for collateral received for securities on loan | 6,034,478 | |
| Payable for investments purchased | 1,761,035 | |
| Payable for capital shares redeemed | 272,931 | |
| Accrued management fees | 37,008 | |
| Distribution and service fees payable | 463 | |
| 8,105,915 | |
| |
| Net Assets | $ | 108,581,952 | |
| |
| Net Assets Consist of: | |
| Capital (par value and paid-in surplus) | $ | 106,006,821 | |
| Distributable earnings (loss) | 2,575,131 | |
| $ | 108,581,952 | |
| | | | | | | | | | | |
| Net Assets | Shares Outstanding | Net Asset Value Per Share* |
| Investor Class, $0.01 Par Value | $13,025,049 | 767,304 | $16.98 |
| I Class, $0.01 Par Value | $27,745,508 | 1,618,920 | $17.14 |
| A Class, $0.01 Par Value | $833,591 | 49,732 | $16.76 |
| C Class, $0.01 Par Value | $50,252 | 3,169 | $15.86 |
| R Class, $0.01 Par Value | $611,901 | 37,040 | $16.52 |
| R6 Class, $0.01 Par Value | $5,939,165 | 344,395 | $17.25 |
| G Class, $0.01 Par Value | $60,376,486 | 3,415,667 | $17.68 |
*Maximum offering price per share was equal to the net asset value per share for all share classes, except A Class, for which the maximum offering price per share was $17.78 (net asset value divided by 0.9425). A contingent deferred sales charge may be imposed on redemptions of A Class and C Class.
See Notes to Financial Statements.
| | | | | |
| YEAR ENDED NOVEMBER 30, 2024 |
| Investment Income (Loss) | |
| Income: | |
| Dividends (net of foreign taxes withheld of $114,947) | $ | 1,078,552 | |
| Interest | 89,843 | |
| Securities lending, net | 7,166 | |
| 1,175,561 | |
| |
| Expenses: | |
| Management fees | 803,016 | |
| Distribution and service fees: | |
| A Class | 1,701 | |
| C Class | 454 | |
| R Class | 3,797 | |
| Directors' fees and expenses | 2,802 | |
| Other expenses | 1,237 | |
| 813,007 | |
| Fees waived - G Class | (324,714) | |
| 488,293 | |
| |
| Net investment income (loss) | 687,268 | |
| |
| Realized and Unrealized Gain (Loss) | |
| Net realized gain (loss) on: | |
| Investment transactions | (328,303) | |
| Foreign currency translation transactions | (19,076) | |
| (347,379) | |
| |
| Change in net unrealized appreciation (depreciation) on: | |
| Investments | 10,799,848 | |
| Translation of assets and liabilities in foreign currencies | (2,952) | |
| 10,796,896 | |
| |
| Net realized and unrealized gain (loss) | 10,449,517 | |
| |
| Net Increase (Decrease) in Net Assets Resulting from Operations | $ | 11,136,785 | |
See Notes to Financial Statements.
| | |
| Statement of Changes in Net Assets |
| | | | | | | | |
| YEARS ENDED NOVEMBER 30, 2024 AND NOVEMBER 30, 2023 |
| Increase (Decrease) in Net Assets | November 30, 2024 | November 30, 2023 |
| Operations | | |
| Net investment income (loss) | $ | 687,268 | | $ | 807,933 | |
| Net realized gain (loss) | (347,379) | | (7,069,953) | |
| Change in net unrealized appreciation (depreciation) | 10,796,896 | | 6,996,183 | |
| Net increase (decrease) in net assets resulting from operations | 11,136,785 | | 734,163 | |
| | |
| Distributions to Shareholders | | |
| From earnings: | | |
| Investor Class | (49,886) | | (53,821) | |
| I Class | (156,977) | | (171,794) | |
| A Class | (662) | | (156) | |
| R6 Class | (56,368) | | (40,405) | |
| G Class | (528,074) | | (383,934) | |
| Decrease in net assets from distributions | (791,967) | | (650,110) | |
| | |
| Capital Share Transactions | | |
| Net increase (decrease) in net assets from capital share transactions (Note 5) | 11,242,164 | | 4,147,257 | |
| | |
| Net increase (decrease) in net assets | 21,586,982 | | 4,231,310 | |
| | |
| Net Assets | | |
| Beginning of period | 86,994,970 | | 82,763,660 | |
| End of period | $ | 108,581,952 | | $ | 86,994,970 | |
See Notes to Financial Statements.
| | |
| Notes to Financial Statements |
NOVEMBER 30, 2024
1. Organization
American Century World Mutual Funds, Inc. (the corporation) is registered under the Investment Company Act of 1940, as amended (the 1940 Act), as an open-end management investment company and is organized as a Maryland corporation. Focused International Growth Fund (the fund) is one fund in a series issued by the corporation. The fund's investment objective is to seek capital growth.
The fund offers the Investor Class, I Class, A Class, C Class, R Class, R6 Class and G Class. The A Class may incur an initial sales charge. The A Class and C Class may be subject to a contingent deferred sales charge.
2. Significant Accounting Policies
The following is a summary of significant accounting policies consistently followed by the fund in preparation of its financial statements. The fund is an investment company and follows accounting and reporting guidance in accordance with accounting principles generally accepted in the United States of America. This may require management to make certain estimates and assumptions at the date of the financial statements. Actual results could differ from these estimates. Management evaluated the impact of events or transactions occurring through the date the financial statements were issued that would merit recognition or disclosure.
Investment Valuations — The fund determines the fair value of its investments and computes its net asset value (NAV) per share at the close of regular trading (usually 4 p.m. Eastern time) on the New York Stock Exchange (NYSE) on each day the NYSE is open. The value of investments of the fund is determined by American Century Investment Management, Inc. (ACIM) (the investment advisor), as the valuation designee, pursuant to its valuation policies and procedures. The Board of Directors oversees the valuation designee and reviews its valuation policies and procedures at least annually.
Equity securities that are listed or traded on a domestic securities exchange are valued at the last reported sales price or at the official closing price as provided by the exchange. Equity securities traded on foreign securities exchanges are generally valued at the closing price of such securities on the exchange where primarily traded or at the close of the NYSE, if that is earlier. If no last sales price is reported, or if local convention or regulation so provides, the mean of the latest bid and asked prices may be used. Securities traded over-the-counter are valued at the mean of the latest bid and asked prices, the last sales price, or the official closing price.
Open-end management investment companies are valued at the reported NAV per share. Repurchase agreements are valued at cost, which approximates fair value.
If the valuation designee determines that the market price for a portfolio security is not readily available or is believed by the valuation designee to be unreliable, such security is valued at fair value as determined in good faith by the valuation designee, in accordance with its policies and procedures. Circumstances that may cause the fund to determine that market quotations are not available or reliable include, but are not limited to: when there is a significant event subsequent to the market quotation; trading in a security has been halted during the trading day; or trading in a security is insufficient or did not take place due to a closure or holiday.
The valuation designee monitors for significant events occurring after the close of an investment’s primary exchange but before the fund’s NAV per share is determined. Significant events may include, but are not limited to: corporate announcements and transactions; regulatory news, governmental action and political unrest that could impact a specific investment or an investment sector; or armed conflicts, natural disasters and similar events that could affect investments in a specific country or region. The valuation designee also monitors for significant fluctuations between domestic and foreign markets, as evidenced by the U.S. market or such other indicators that it deems appropriate. The valuation designee may apply a model-derived factor to the closing price of equity securities traded on foreign securities exchanges. The factor is based on observable market data as provided by an independent pricing service.
Foreign Currency Translations — All assets and liabilities, including investment securities and other financial instruments, initially expressed in foreign currencies are translated into U.S. dollars each day at the mean of the appropriate currency exchange rate at the close of the NYSE as provided by an independent pricing service. The fund may enter into spot foreign currency exchange contracts to facilitate transactions denominated in a foreign currency. Purchases and sales of investment securities, dividend and interest income, spot foreign currency exchange contracts, and expenses are translated at the rates of exchange prevailing on the respective dates of such transactions. Net realized and unrealized foreign currency exchange gains or losses related to investment securities are a component of net realized gain (loss) on investment transactions and change in net unrealized appreciation (depreciation) on investments, respectively.
Security Transactions — Security transactions are accounted for as of the trade date. Net realized gains and losses are determined on the identified cost basis, which is also used for federal income tax purposes.
Investment Income — Dividend income less foreign taxes withheld, if any, is recorded as of the ex-dividend date. Distributions received on securities that represent a return of capital or long-term capital gain are recorded as a reduction of cost of investments and/or as a realized gain. The fund may estimate the components of distributions received that may be considered nontaxable distributions or long-term capital gain distributions for income tax purposes. Interest income is recorded on the accrual basis and includes accretion of discounts and amortization of premiums. Securities lending income is net of fees and rebates earned by the lending agent for its services.
Repurchase Agreements — The fund may enter into repurchase agreements with institutions that ACIM has determined are creditworthy pursuant to criteria adopted by the Board of Directors. The fund requires that the collateral, represented by securities, received in a repurchase transaction be transferred to the custodian in a manner sufficient to enable the fund to obtain those securities in the event of a default under the repurchase agreement. ACIM monitors, on a daily basis, the securities transferred to ensure the value, including accrued interest, of the securities under each repurchase agreement is equal to or greater than amounts owed to the fund under each repurchase agreement.
Joint Trading Account — Pursuant to an Exemptive Order issued by the Securities and Exchange Commission, the fund, along with certain other funds in the American Century Investments family of funds, may transfer uninvested cash balances into a joint trading account. These balances are invested in one or more repurchase agreements that are collateralized by U.S. Treasury or Agency obligations.
Income Tax Status — It is the fund's policy to distribute substantially all net investment income and net realized gains to shareholders and to otherwise qualify as a regulated investment company under provisions of the Internal Revenue Code. Accordingly, no provision has been made for income taxes. The fund files U.S. federal, state, local and non-U.S. tax returns as applicable. The fund's tax returns are subject to examination by the relevant taxing authority until expiration of the applicable statute of limitations, which is generally three years from the date of filing but can be longer in certain jurisdictions. At this time, management believes there are no uncertain tax positions which, based on their technical merit, would not be sustained upon examination and for which it is reasonably possible that the total amounts of unrecognized tax benefits will significantly change in the next twelve months.
Multiple Class — All shares of the fund represent an equal pro rata interest in the net assets of the class to which such shares belong, and have identical voting, dividend, liquidation and other rights and the same terms and conditions, except for class specific expenses and exclusive rights to vote on matters affecting only individual classes. Income, non-class specific expenses, and realized and unrealized capital gains and losses of the fund are allocated to each class of shares based on their relative net assets.
Distributions to Shareholders — Distributions from net investment income and net realized gains, if any, are generally declared and paid annually. The fund may make distributions on a more frequent basis to comply with the distribution requirements of the Internal Revenue Code, in all events in a manner consistent with provisions of the 1940 Act.
Indemnifications — Under the corporation’s organizational documents, its officers and directors are indemnified against certain liabilities arising out of the performance of their duties to the fund. In addition, in the normal course of business, the fund enters into contracts that provide general indemnifications. The maximum exposure under these arrangements is unknown as this would involve future claims that may be made against a fund. The risk of material loss from such claims is considered by management to be remote.
Securities Lending — Securities are lent to qualified financial institutions and brokers. State Street Bank & Trust Co. serves as securities lending agent to the fund pursuant to a Securities Lending Agreement. The lending of securities exposes the fund to risks such as: the borrowers may fail to return the loaned securities, the borrowers may not be able to provide additional collateral, the fund may experience delays in recovery of the loaned securities or delays in access to collateral, or the fund may experience losses related to the investment collateral. To minimize certain risks, loan counterparties pledge collateral in the form of cash and/or securities. The lending agent has agreed to indemnify the fund in the case of default of any securities borrowed. Cash collateral received is invested in the State Street Navigator Securities Lending Government Money Market Portfolio, a money market mutual fund registered under the 1940 Act. The loans may also be secured by U.S. government securities in an amount at least equal to the market value of the securities loaned, plus accrued interest and dividends, determined on a daily basis and adjusted accordingly. By lending securities, the fund seeks to increase its net investment income through the receipt of interest and fees. Such income is reflected separately within the Statement of Operations. The value of loaned securities and related collateral outstanding at period end, if any, are shown on a gross basis within the Schedule of Investments and Statement of Assets and Liabilities.
The following table reflects a breakdown of transactions accounted for as secured borrowings, the gross obligation by the type of collateral pledged, and the remaining contractual maturity of those transactions as of November 30, 2024.
| | | | | | | | | | | | | | | | | |
| Remaining Contractual Maturity of Agreements |
| Overnight and
Continuous | <30 days | Between 30 & 90 days | >90 days | Total |
Securities Lending Transactions(1) | | | | | |
| Common Stocks | $ | 6,034,478 | | — | | — | | — | | $ | 6,034,478 | |
| Gross amount of recognized liabilities for securities lending transactions | $ | 6,034,478 | |
(1)Amount represents the payable for cash collateral received for securities on loan. This will generally be in the Overnight and Continuous column as the securities are typically callable on demand.
3. Fees and Transactions with Related Parties
Certain officers and directors of the corporation are also officers and/or directors of American Century Companies, Inc. (ACC). The corporation's investment advisor, ACIM, the corporation's distributor, American Century Investment Services, Inc. (ACIS), and the corporation's transfer agent, American Century Services, LLC, are wholly owned, directly or indirectly, by ACC. Various funds issued by American Century Asset Allocation Portfolios, Inc. own, in aggregate, 11% of the shares of the fund.
Management Fees — The corporation has entered into a management agreement with ACIM, under which ACIM provides the fund with investment advisory and management services in exchange for a single, unified management fee (the fee) per class. The agreement provides that ACIM will pay all expenses of managing and operating the fund, except brokerage expenses, taxes, interest, fees and expenses of the independent directors (including legal counsel fees), extraordinary expenses, and expenses incurred in connection with the provision of shareholder services and distribution services under a plan adopted pursuant to Rule 12b-1 under the 1940 Act. The fee is computed and accrued daily based on each class's daily net assets and paid monthly in arrears. The difference in the fee among the classes is a result of their separate arrangements for non-Rule 12b-1 shareholder services. It is not the result of any difference in advisory or custodial fees or other expenses related to the management of the fund’s assets, which do not vary by class. The investment advisor agreed to waive the G Class's management fee in its entirety. The investment advisor expects this waiver to remain in effect permanently and cannot terminate it without the approval of the Board of Directors.
The annual management fee for each class is as follows:
| | | | | | | | | | | | | | | | | | | | |
| Investor Class | I Class | A Class | C Class | R Class | R6 Class | G Class |
| 1.09% | 0.89% | 1.09% | 1.09% | 1.09% | 0.74% | 0.00%(1) |
(1)Annual management fee before waiver was 0.74%.
Distribution and Service Fees — The Board of Directors has adopted a separate Master Distribution and Individual Shareholder Services Plan for each of the A Class, C Class and R Class (collectively the plans), pursuant to Rule 12b-1 of the 1940 Act. The plans provide that the A Class will pay ACIS an annual distribution and service fee of 0.25%. The plans provide that the C Class will pay ACIS an annual distribution and service fee of 1.00%, of which 0.25% is paid for individual shareholder services and 0.75% is paid for distribution services. The plans provide that the R Class will pay ACIS an annual distribution and service fee of 0.50%. The fees are computed and accrued daily based on each class’s daily net assets and paid monthly in arrears. The fees are used to pay financial intermediaries for distribution and individual shareholder services. Fees incurred under the plans during the period ended November 30, 2024 are detailed in the Statement of Operations.
Directors' Fees and Expenses — The Board of Directors is responsible for overseeing the investment advisor’s management and operations of the fund. The directors receive detailed information about the fund and its investment advisor regularly throughout the year, and meet at least quarterly with management of the investment advisor to review reports about fund operations. The fund's officers do not receive compensation from the fund.
Other Expenses — A fund’s other expenses may include interest charges, clearing exchange fees, proxy solicitation expenses, fees associated with the recovery of foreign tax reclaims and other miscellaneous expenses.
Interfund Transactions — The fund may enter into security transactions with other American Century Investments funds and other client accounts of the investment advisor, in accordance with the 1940 Act rules and procedures adopted by the Board of Directors. The rules and procedures require, among other things, that these transactions be effected at the independent current market price of the security. There were no interfund transactions during the period.
4. Investment Transactions
Purchases and sales of investment securities, excluding short-term investments, for the period ended November 30, 2024 were $85,406,865 and $77,042,560, respectively.
5. Capital Share Transactions
Transactions in shares of the fund were as follows:
| | | | | | | | | | | | | | |
| Year ended November 30, 2024 | Year ended November 30, 2023 |
| Shares | Amount | Shares | Amount |
| Investor Class/Shares Authorized | 50,000,000 | | | 50,000,000 | | |
| Sold | 144,362 | | $ | 2,393,269 | | 222,961 | | $ | 3,473,694 | |
| Issued in reinvestment of distributions | 3,154 | | 49,306 | | 3,584 | | 52,535 | |
| Redeemed | (281,554) | | (4,652,641) | | (320,179) | | (4,895,744) | |
| (134,038) | | (2,210,066) | | (93,634) | | (1,369,515) | |
| I Class/Shares Authorized | 25,000,000 | | | 25,000,000 | | |
| Sold | 701,832 | | 11,435,612 | | 483,105 | | 7,399,760 | |
| Issued in reinvestment of distributions | 9,967 | | 156,977 | | 11,631 | | 171,794 | |
| Redeemed | (861,617) | | (14,089,560) | | (938,362) | | (14,162,798) | |
| (149,818) | | (2,496,971) | | (443,626) | | (6,591,244) | |
| A Class/Shares Authorized | 20,000,000 | | | 20,000,000 | | |
| Sold | 19,492 | | 318,443 | | 38,047 | | 515,691 | |
| Issued in reinvestment of distributions | 43 | | 662 | | 11 | | 156 | |
| Redeemed | (9,124) | | (147,153) | | (5,292) | | (79,076) | |
| 10,411 | | 171,952 | | 32,766 | | 436,771 | |
| C Class/Shares Authorized | 20,000,000 | | | 20,000,000 | | |
| Sold | 659 | | 10,335 | | 257 | | 3,735 | |
| Redeemed | — | | — | | (1,131) | | (16,767) | |
| 659 | | 10,335 | | (874) | | (13,032) | |
| R Class/Shares Authorized | 20,000,000 | | | 20,000,000 | | |
| Sold | 18,689 | | 302,680 | | 27,534 | | 414,806 | |
| Redeemed | (33,543) | | (544,916) | | (50,538) | | (699,364) | |
| (14,854) | | (242,236) | | (23,004) | | (284,558) | |
| R6 Class/Shares Authorized | 20,000,000 | | | 20,000,000 | | |
| Sold | 101,216 | | 1,700,914 | | 249,710 | | 3,967,587 | |
| Issued in reinvestment of distributions | 3,561 | | 56,368 | | 2,723 | | 40,405 | |
| Redeemed | (267,514) | | (4,560,228) | | (131,645) | | (2,074,557) | |
| (162,737) | | (2,802,946) | | 120,788 | | 1,933,435 | |
| G Class/Shares Authorized | 30,000,000 | | | 30,000,000 | | |
| Sold | 1,613,677 | | 28,552,733 | | 896,696 | | 14,020,911 | |
| Issued in reinvestment of distributions | 32,779 | | 528,074 | | 25,426 | | 383,934 | |
| Redeemed | (587,299) | | (10,268,711) | | (273,394) | | (4,369,445) | |
| 1,059,157 | | 18,812,096 | | 648,728 | | 10,035,400 | |
| Net increase (decrease) | 608,780 | | $ | 11,242,164 | | 241,144 | | $ | 4,147,257 | |
6. Fair Value Measurements
The fund's investments valuation process is based on several considerations and may use multiple inputs to determine the fair value of the investments held by the fund. In conformity with accounting principles generally accepted in the United States of America, the inputs used to determine a valuation are classified into three broad levels.
•Level 1 valuation inputs consist of unadjusted quoted prices in an active market for identical investments.
•Level 2 valuation inputs consist of direct or indirect observable market data (including quoted prices for comparable investments, evaluations of subsequent market events, interest rates, prepayment speeds, credit risk, etc.). These inputs also consist of quoted prices for identical investments initially expressed in local currencies that are adjusted through translation into U.S. dollars.
•Level 3 valuation inputs consist of unobservable data (including a fund’s own assumptions).
The level classification is based on the lowest level input that is significant to the fair valuation measurement. The valuation inputs are not necessarily an indication of the risks associated with investing in these securities or other financial instruments.
The following is a summary of the level classifications as of period end. The Schedule of Investments provides additional information on the fund's portfolio holdings.
| | | | | | | | | | | |
| Level 1 | Level 2 | Level 3 |
| Assets | | | |
| Investment Securities | | | |
| Common Stocks | | | |
| Brazil | $ | 1,190,225 | | — | | — | |
| China | 2,388,171 | | $ | 2,793,901 | | — | |
| India | 2,403,803 | | — | | — | |
| Switzerland | 2,618,434 | | 2,110,602 | | — | |
| United States | 2,909,582 | | — | | — | |
| Other Countries | — | | 88,694,852 | | — | |
| Short-Term Investments | 6,034,478 | | 3,938,178 | | — | |
| $ | 17,544,693 | | $ | 97,537,533 | | — | |
7. Risk Factors
The value of the fund’s shares will go up and down, sometimes rapidly or unpredictably, based on the performance of the securities owned by the fund and other factors generally affecting the securities market. Market risks, including political, regulatory, economic and social developments, can affect the value of the fund’s investments. Natural disasters, public health emergencies, war, terrorism and other unforeseeable events may lead to increased market volatility and may have adverse long-term effects on world economies and markets generally.
There are certain risks involved in investing in foreign securities. These risks include those resulting from political events (such as civil unrest, national elections and imposition of exchange controls), social and economic events (such as labor strikes and rising inflation), and natural disasters. Securities of foreign issuers may be less liquid and more volatile. Investing in emerging markets or a significant portion of assets in one country or region may accentuate these risks.
8. Federal Tax Information
On December 17, 2024, the fund declared and paid the following per-share distributions from net investment income to shareholders of record on December 16, 2024:
| | | | | | | | | | | | | | | | | | | | |
| Investor Class | I Class | A Class | C Class | R Class | R6 Class | G Class |
| — | — | — | — | — | $0.0152 | $0.1411 |
The tax character of distributions paid during the years ended November 30, 2024 and November 30, 2023 were as follows:
| | | | | | | | |
| 2024 | 2023 |
| Distributions Paid From | | |
| Ordinary income | $ | 791,967 | | $ | 650,110 | |
| Long-term capital gains | — | | — | |
The book-basis character of distributions made during the year from net investment income or net realized gains may differ from their ultimate characterization for federal income tax purposes. These differences reflect the differing character of certain income items and net realized gains and losses for financial statement and tax purposes, and may result in reclassification among certain capital accounts on the financial statements.
As of period end, the federal tax cost of investments and the components of distributable earnings on a tax-basis were as follows:
| | | | | |
| Federal tax cost of investments | $ | 98,026,956 | |
| Gross tax appreciation of investments | $ | 19,274,809 | |
| Gross tax depreciation of investments | (2,219,539) | |
| Net tax appreciation (depreciation) of investments | 17,055,270 | |
| Net tax appreciation (depreciation) on translation of assets and liabilities in foreign currencies | (2,833) | |
| Net tax appreciation (depreciation) | $ | 17,052,437 | |
| Undistributed ordinary income | $ | 667,852 | |
| Accumulated short-term capital losses | $ | (11,425,314) | |
| Accumulated long-term capital losses | $ | (3,719,844) | |
The difference between book-basis and tax-basis unrealized appreciation (depreciation) is attributable primarily to the tax deferral of losses on wash sales.
Accumulated capital losses represent net capital loss carryovers that may be used to offset future realized capital gains for federal income tax purposes.The capital loss carryovers may be carried forward for an unlimited period. Future capital loss carryover utilization in any given year may be subject to Internal Revenue Code limitations.
| | | | | | | | | | | | | | | | | | | | | | | | | | | | | | | | | | | | | | | | | | | | | | | |
| For a Share Outstanding Throughout the Years Ended November 30 (except as noted) |
| Per-Share Data | Ratios and Supplemental Data |
| | Income From Investment Operations*: | Distributions From: | | | Ratio to Average Net Assets of†: | | |
| Net Asset Value, Beginning of Period | Net Investment Income (Loss)(1) | Net Realized and Unrealized Gain (Loss) | Total From Investment Operations | Net
Investment
Income | Net
Realized
Gains | Total
Distributions | Net Asset Value, End of Period | Total Return(2) | Operating
Expenses | Operating
Expenses
(before
expense
waiver) | Net
Investment
Income
(Loss) | Net
Investment
Income
(Loss)
(before
expense
waiver) | Portfolio
Turnover
Rate | Net Assets, End of Period (in thousands) |
| Investor Class |
| 2024 | $15.14 | 0.02 | 1.88 | 1.90 | (0.06) | — | (0.06) | $16.98 | 12.49% | 1.09% | 1.09% | 0.14% | 0.14% | 82% | $13,025 | |
| 2023 | $15.10 | 0.08 | 0.02 | 0.10 | (0.06) | — | (0.06) | $15.14 | 0.65% | 1.09% | 1.09% | 0.47% | 0.47% | 61% | $13,645 | |
| 2022 | $20.04 | 0.12 | (4.56) | (4.44) | — | (0.50) | (0.50) | $15.10 | (22.71)% | 1.10% | 1.10% | 0.59% | 0.59% | 51% | $15,028 | |
| 2021 | $18.20 | (0.03) | 1.87 | 1.84 | — | — | — | $20.04 | 10.11% | 1.10% | 1.10% | (0.12)% | (0.12)% | 71% | $22,250 | |
| 2020 | $14.34 | (0.01) | 4.33 | 4.32 | — | (0.46) | (0.46) | $18.20 | 31.15% | 1.18% | 1.18% | (0.09)% | (0.09)% | 92% | $9,749 | |
| I Class |
| 2024 | $15.28 | 0.06 | 1.89 | 1.95 | (0.09) | — | (0.09) | $17.14 | 12.72% | 0.89% | 0.89% | 0.34% | 0.34% | 82% | $27,746 | |
| 2023 | $15.25 | 0.11 | 0.01 | 0.12 | (0.09) | — | (0.09) | $15.28 | 0.91% | 0.89% | 0.89% | 0.67% | 0.67% | 61% | $27,034 | |
| 2022 | $20.19 | 0.11 | (4.55) | (4.44) | — | (0.50) | (0.50) | $15.25 | (22.59)% | 0.90% | 0.90% | 0.79% | 0.79% | 51% | $33,731 | |
| 2021 | $18.30 | 0.01 | 1.88 | 1.89 | — | — | — | $20.19 | 10.33% | 0.90% | 0.90% | 0.08% | 0.08% | 71% | $19,111 | |
| 2020 | $14.39 | 0.01 | 4.36 | 4.37 | — | (0.46) | (0.46) | $18.30 | 31.39% | 0.98% | 0.98% | 0.11% | 0.11% | 92% | $5,585 | |
| A Class |
| 2024 | $14.95 | (0.02) | 1.85 | 1.83 | (0.02) | — | (0.02) | $16.76 | 12.23% | 1.34% | 1.34% | (0.11)% | (0.11)% | 82% | $834 | |
| 2023 | $14.91 | (0.01) | 0.07 | 0.06 | (0.02) | — | (0.02) | $14.95 | 0.41% | 1.34% | 1.34% | 0.22% | 0.22% | 61% | $588 | |
| 2022 | $19.85 | 0.07 | (4.51) | (4.44) | — | (0.50) | (0.50) | $14.91 | (22.94)% | 1.35% | 1.35% | 0.34% | 0.34% | 51% | $98 | |
| 2021 | $18.07 | (0.07) | 1.85 | 1.78 | — | — | — | $19.85 | 9.85% | 1.35% | 1.35% | (0.37)% | (0.37)% | 71% | $99 | |
| 2020 | $14.28 | (0.04) | 4.29 | 4.25 | — | (0.46) | (0.46) | $18.07 | 30.78% | 1.43% | 1.43% | (0.34)% | (0.34)% | 92% | $85 | |
| C Class |
| 2024 | $14.23 | (0.13) | 1.76 | 1.63 | — | — | — | $15.86 | 11.38% | 2.09% | 2.09% | (0.86)% | (0.86)% | 82% | $50 | |
| 2023 | $14.29 | (0.08) | 0.02 | (0.06) | — | — | — | $14.23 | (0.35)% | 2.09% | 2.09% | (0.53)% | (0.53)% | 61% | $36 | |
| 2022 | $19.17 | (0.04) | (4.34) | (4.38) | — | (0.50) | (0.50) | $14.29 | (23.54)% | 2.10% | 2.10% | (0.41)% | (0.41)% | 51% | $48 | |
| 2021 | $17.59 | (0.22) | 1.80 | 1.58 | — | — | — | $19.17 | 9.04% | 2.10% | 2.10% | (1.12)% | (1.12)% | 71% | $58 | |
| 2020 | $14.01 | (0.14) | 4.18 | 4.04 | — | (0.46) | (0.46) | $17.59 | 29.84% | 2.18% | 2.18% | (1.09)% | (1.09)% | 92% | $49 | |
| R Class |
| 2024 | $14.75 | (0.06) | 1.83 | 1.77 | — | — | — | $16.52 | 11.92% | 1.59% | 1.59% | (0.36)% | (0.36)% | 82% | $612 | |
| 2023 | $14.74 | —(3) | 0.01 | 0.01 | — | — | — | $14.75 | 0.20% | 1.59% | 1.59% | (0.03)% | (0.03)% | 61% | $766 | |
| 2022 | $19.67 | 0.03 | (4.46) | (4.43) | — | (0.50) | (0.50) | $14.74 | (23.15)% | 1.60% | 1.60% | 0.09% | 0.09% | 51% | $1,104 | |
| 2021 | $17.95 | (0.12) | 1.84 | 1.72 | — | — | — | $19.67 | 9.58% | 1.60% | 1.60% | (0.62)% | (0.62)% | 71% | $1,148 | |
| 2020 | $14.22 | (0.08) | 4.27 | 4.19 | — | (0.46) | (0.46) | $17.95 | 30.47% | 1.68% | 1.68% | (0.59)% | (0.59)% | 92% | $683 | |
| | | | | | | | | | | | | | | | | | | | | | | | | | | | | | | | | | | | | | | | | | | | | | | |
| For a Share Outstanding Throughout the Years Ended November 30 (except as noted) |
| Per-Share Data | Ratios and Supplemental Data |
| | Income From Investment Operations*: | Distributions From: | | | Ratio to Average Net Assets of†: | | |
| Net Asset Value, Beginning of Period | Net Investment Income (Loss)(1) | Net Realized and Unrealized Gain (Loss) | Total From Investment Operations | Net
Investment
Income | Net
Realized
Gains | Total
Distributions | Net Asset Value, End of Period | Total Return(2) | Operating
Expenses | Operating
Expenses
(before
expense
waiver) | Net
Investment
Income
(Loss) | Net
Investment
Income
(Loss)
(before
expense
waiver) | Portfolio
Turnover
Rate | Net Assets, End of Period (in thousands) |
| R6 Class |
| 2024 | $15.38 | 0.09 | 1.89 | 1.98 | (0.11) | — | (0.11) | $17.25 | 12.94% | 0.74% | 0.74% | 0.49% | 0.49% | 82% | $5,939 | |
| 2023 | $15.34 | 0.13 | 0.02 | 0.15 | (0.11) | — | (0.11) | $15.38 | 0.99% | 0.74% | 0.74% | 0.82% | 0.82% | 61% | $7,799 | |
| 2022 | $20.30 | 0.05 | (4.49) | (4.44) | (0.02) | (0.50) | (0.52) | $15.34 | (22.44)% | 0.75% | 0.75% | 0.94% | 0.94% | 51% | $5,927 | |
| 2021 | $18.37 | 0.02 | 1.91 | 1.93 | — | — | — | $20.30 | 10.51% | 0.75% | 0.75% | 0.23% | 0.23% | 71% | $674 | |
| 2020 | $14.42 | 0.05 | 4.36 | 4.41 | — | (0.46) | (0.46) | $18.37 | 31.61% | 0.83% | 0.83% | 0.26% | 0.26% | 92% | $190 | |
| G Class |
| 2024 | $15.76 | 0.21 | 1.94 | 2.15 | (0.23) | — | (0.23) | $17.68 | 13.75% | 0.00% | 0.74% | 1.23% | 0.49% | 82% | $60,376 | |
| 2023 | $15.71 | 0.24 | 0.03 | 0.27 | (0.22) | — | (0.22) | $15.76 | 1.81% | 0.00% | 0.74% | 1.56% | 0.82% | 61% | $37,128 | |
| 2022 | $20.74 | 0.27 | (4.67) | (4.40) | (0.13) | (0.50) | (0.63) | $15.71 | (21.92)% | 0.01% | 0.75% | 1.68% | 0.94% | 51% | $26,828 | |
| 2021 | $18.65 | 0.21 | 1.89 | 2.10 | (0.01) | — | (0.01) | $20.74 | 11.28% | 0.01% | 0.75% | 0.97% | 0.23% | 71% | $16,684 | |
| 2020 | $14.51 | 0.17 | 4.43 | 4.60 | — | (0.46) | (0.46) | $18.65 | 32.75% | 0.00% | 0.83% | 1.09% | 0.26% | 92% | $4,356 | |
| | |
| Notes to Financial Highlights |
(1)Computed using average shares outstanding throughout the period.
(2)Total returns are calculated based on the net asset value of the last business day and do not reflect applicable sales charges, if any. Total returns for periods less than one year are not annualized.
(3)Per-share amount was less than $0.005.
*The amount shown for a share outstanding throughout the period may not correlate with the Statement(s) of Operations or precisely reflect the class expense differentials due to the timing of transactions in shares of a fund in relation to income earned and/or fluctuations in the fair value of a fund's investments.
†Ratios for periods less than one year are annualized. Zero balances may reflect amounts less than 0.005%.
See Notes to Financial Statements.
| | |
| Report of Independent Registered Public Accounting Firm |
To the shareholders of the Focused International Growth Fund and the Board of Directors of American Century World Mutual Funds, Inc.
Opinion on the Financial Statements and Financial Highlights
We have audited the accompanying statement of assets and liabilities, including the schedule of investments, of Focused International Growth Fund (the “Fund”), one of the funds constituting the American Century World Mutual Funds, Inc., as of November 30, 2024, the related statement of operations for the year then ended, the statements of changes in net assets for each of the two years in the period then ended, the financial highlights for each of the five years in the period then ended, and the related notes. In our opinion, the financial statements and financial highlights present fairly, in all material respects, the financial position of the Fund as of November 30, 2024, and the results of its operations for the year then ended, the changes in its net assets for each of the two years in the period then ended, and the financial highlights for each of the five years in the period then ended, in conformity with accounting principles generally accepted in the United States of America.
Basis for Opinion
These financial statements and financial highlights are the responsibility of the Fund's management. Our responsibility is to express an opinion on the Fund’s financial statements and financial highlights based on our audits. We are a public accounting firm registered with the Public Company Accounting Oversight Board (United States) (PCAOB) and are required to be independent with respect to the Fund in accordance with the U.S. federal securities laws and the applicable rules and regulations of the Securities and Exchange Commission and the PCAOB.
We conducted our audits in accordance with the standards of the PCAOB. Those standards require that we plan and perform the audit to obtain reasonable assurance about whether the financial statements and financial highlights are free of material misstatement, whether due to error or fraud. The Fund is not required to have, nor were we engaged to perform, an audit of its internal control over financial reporting. As part of our audits, we are required to obtain an understanding of internal control over financial reporting but not for the purpose of expressing an opinion on the effectiveness of the Fund’s internal control over financial reporting. Accordingly, we express no such opinion.
Our audits included performing procedures to assess the risks of material misstatement of the financial statements and financial highlights, whether due to error or fraud, and performing procedures that respond to those risks. Such procedures included examining, on a test basis, evidence regarding the amounts and disclosures in the financial statements and financial highlights. Our audits also included evaluating the accounting principles used and significant estimates made by management, as well as evaluating the overall presentation of the financial statements and financial highlights. Our procedures included confirmation of securities owned as of November 30, 2024, by correspondence with the custodian and brokers; when replies were not received from brokers, we performed other auditing procedures. We believe that our audits provide a reasonable basis for our opinion.
/s/ Deloitte & Touche LLP
Kansas City, Missouri
January 16, 2025
We have served as the auditor of one or more American Century investment companies since 1997.
| | |
| Approval of Management Agreement |
At a meeting held on June 27, 2024, the Fund’s Board of Directors (the “Board”) unanimously approved the renewal of the management agreement pursuant to which American Century Investment Management, Inc. (the “Advisor”) acts as the investment advisor for the Fund. Under the Investment Company Act of 1940 (the “Investment Company Act”), contracts for investment advisory services are required to be reviewed, evaluated, and approved by a majority of a fund’s Directors, including a majority of the independent Directors.
Prior to its consideration of the renewal of the management agreement, the Directors requested and reviewed data and information compiled by the Advisor and certain independent consultants and data providers concerning the Fund. This review was in addition to the oversight and evaluation undertaken by the Board and its committees on a continual basis and the information received was supplemental to the information that the Board and its committees receive and consider over time.
In connection with its consideration of the renewal of the management agreement, the Board’s review and evaluation of the services provided by the Advisor and its affiliates included, but was not limited to
•the nature, extent, and quality of investment management, shareholder services, distribution services, and other services provided to the Fund;
•the wide range of programs and services the Advisor and other service providers provide to the Fund and its shareholders on a routine and non-routine basis;
•the Fund’s investment performance compared to appropriate benchmarks and/or peer groups of other mutual funds with similar investment objectives and strategies;
•the cost of owning the Fund compared to the cost of owning similarly-managed funds;
•the Advisor’s compliance policies, procedures, and regulatory experience and those of certain other service providers;
•the Advisor’s strategic plans, generally, and with respect to the Advisor’s response to investment management industry challenges;
•the Advisor’s business continuity plans, vendor management practices, and information security practices;
•the cost of services provided to the Fund, the profitability of the Fund to the Advisor, and the Advisor’s financial results of operation;
•possible economies of scale associated with the Advisor’s management of the Fund;
•any collateral benefits derived by the Advisor from the management of the Fund;
•fees and expenses associated with any investment by the Fund in other funds;
•payments to intermediaries by the Fund and the Advisor and services provided by intermediaries in connection therewith; and
•services provided and charges to the Advisor’s other investment management clients.
The Board held two meetings to consider the renewal. The independent Directors also met in private session multiple times to review and discuss the information provided in response to their request. The independent Directors held active discussions with the Advisor regarding the renewal of the management agreement, requesting supplemental information, and reviewing information provided by the Advisor in response thereto. The independent Directors had the benefit of the advice of their independent counsel throughout the process.
Factors Considered
The Directors considered all of the information provided by the Advisor, the independent consultant and data providers, and the independent Directors’ independent counsel in connection with the approval. They determined that the information was sufficient for them to evaluate the management agreement for the Fund. In connection with their review, the Directors did not identify any single factor as being all-important or controlling, and each Director may have attributed different levels of importance to different factors. In deciding to renew the management agreement, the Board based its decision on a number of factors, including without limitation the following:
Nature, Extent and Quality of Services — Generally. Under the management agreement, the Advisor is responsible for providing or arranging for all services necessary for the operation of the Fund. The Board noted that the Advisor provides or arranges at its own expense a wide variety of services which include, without limitation, the following:
•constructing and designing the Fund
•portfolio research and security selection
•initial capitalization/funding
•securities trading
•Fund administration
•custody of Fund assets
•daily valuation of the Fund’s portfolio
•liquidity monitoring and management
•risk management, including information security
•shareholder servicing and transfer agency, including shareholder confirmations, recordkeeping, and communications
•legal services (except the independent Directors’ counsel)
•regulatory and portfolio compliance
•financial reporting
•marketing and distribution (except amounts paid by the Fund under Rule 12b-1 plans)
The Board noted that many of these services have expanded over time in terms of both quantity and complexity in response to shareholder demands, competition in the industry, changing distribution channels, and the changing regulatory environment.
Investment Management Services. The nature of the investment management services provided to the Fund is quite complex and allows Fund shareholders access to professional money management, instant diversification of their investments, the opportunity to easily diversify among asset classes by investing in or exchanging among various American Century Investments funds, and liquidity. In evaluating investment performance, the Board expects the Advisor to manage the Fund in accordance with its investment objectives and principal investment strategies. Further, the Directors recognize that the Advisor has an obligation to monitor trading activities, and in particular to seek the best execution of fund trades, and to evaluate the use of and payment for research. In providing these services, the Advisor utilizes teams of investment professionals who require extensive information technology, research, training, compliance, and other systems to conduct their business. The Board, directly and through its Fund Performance Review Committee, provides oversight of the investment performance process. It regularly reviews investment performance information for the Fund, together with comparative information for appropriate benchmarks and/or peer groups of similarly-managed funds, over different time horizons. The Directors also review investment performance information from both the Advisor and an independent third party during the management agreement renewal process. If performance concerns are identified, the Board discusses with the Advisor the reasons for such results and any actions being taken to improve performance and may conduct special reviews until performance improves. The Fund’s performance was above its benchmark for the five-year period and below its benchmark for the one- and three-year periods reviewed by the Board. In relation to industry peers, the Fund was below the median of its peer performance universe as identified by a third-party service provider for the one-, three-, and five-year periods. The Board discussed the Fund’s performance with the Advisor, including steps being taken to address underperformance, and was satisfied with the efforts being undertaken by the Advisor. The Board found the investment management services provided by the Advisor to the Fund to be satisfactory and consistent with the management agreement.
Shareholder and Other Services. Under the management agreement, the Advisor provides the Fund with a comprehensive package of transfer agency, shareholder, and other services. The Board, directly and through its various committees, regularly reviews reports and evaluations of such services at its regular meetings. These reports include, but are not limited to, information regarding the operational efficiency and accuracy of the shareholder and transfer agency services provided, staffing levels, shareholder satisfaction, technology support (including information security), new products and services offered to Fund shareholders, securities trading activities, portfolio valuation services, auditing services, and legal and operational compliance activities. The Board found the services provided by the Advisor to the Fund under the management agreement to be competitive and of high quality.
Costs of Services and Profitability. The Advisor provides detailed information concerning its cost of providing various services to the Fund, its profitability in managing the Fund (pre- and post-distribution), and its financial results of operation. The Directors have reviewed with the Advisor the methodology used to prepare this financial information and arranged for an independent consultant to confirm the reasonableness of the allocation methodology used. This information is considered in evaluating the Advisor’s financial condition, its ability to continue to provide services under the management agreement, and the reasonableness of the terms of the current management agreement. The Board concluded that the Advisor’s profits were reasonable in light of the services provided to the Fund.
Ethics. The Board generally considers the Advisor’s commitment to providing quality services to shareholders and to conducting its business ethically. They noted that the Advisor’s practices generally meet or exceed industry best practices.
Economies of Scale. The Board also reviewed information provided by the Advisor regarding the possible existence of economies of scale in connection with the management of the Fund. The Board concluded that economies of scale are difficult to measure and predict with precision, especially on a fund-by-fund basis. The Board concluded that the Advisor is sharing economies of scale, to the extent they exist, through its fee structure, and through reinvestment in its business, infrastructure, investment capabilities and initiatives to provide shareholders enhanced and expanded content and services.
Comparison to Other Funds’ Fees. The management agreement provides that the Fund pays the Advisor a single, all-inclusive (or unified) management fee for providing all services necessary for the management and operation of the Fund, other than brokerage and other transaction fees and expenses relating to acquisition and disposition of portfolio securities, acquired fund fees and expenses, taxes, interest, extraordinary expenses, fund litigation expenses, fees and expenses of the Fund’s independent Directors (including their independent legal counsel), and expenses incurred in connection with the provision of shareholder services and distribution services under a plan adopted pursuant to Investment Company Act Rule 12b-1. Under the unified fee structure, the Advisor is responsible for providing all investment advisory, custody, audit, administrative, compliance, recordkeeping, marketing and shareholder services, or arranging and supervising third parties to provide such services. By contrast, most other funds are charged a variety of fees, including an investment advisory fee, a transfer agency fee, an administrative fee, distribution charges, and other expenses. Other than their investment advisory fees and any applicable Rule 12b-1 distribution fees, all other components of the total fees charged by these other funds may be increased without shareholder approval. The Board believes
the unified fee structure is a benefit to Fund shareholders because it clearly discloses to shareholders the cost of owning Fund shares, and, since the unified fee cannot be increased without a vote of Fund shareholders, it shifts to the Advisor the risk of increased costs of operating the Fund and provides a direct incentive to minimize administrative inefficiencies. Part of the Board’s analysis of fee levels involves reviewing certain evaluative data compiled by an independent provider comparing the Fund’s unified fee to the total expense ratios of its peers. The unified fee charged to shareholders of the Fund was below the median of the total expense ratios of the Fund’s peer expense universe. In addition, the Board reviewed the Fund’s position relative to the narrower set of its expense group peers. The Board concluded that the management fee paid by the Fund to the Advisor under the management agreement is reasonable in light of the services provided to the Fund.
Comparison to Fees and Services Provided to Other Clients of the Advisor. The Board also requested and received information from the Advisor concerning the nature of the services, fees, costs, and profitability of its advisory services to advisory clients other than the Fund. They observed that these varying types of client accounts require different services and involve different regulatory and entrepreneurial risks than the management of the Fund. The Board analyzed this information and concluded that the fees charged and services provided to the Fund were reasonable by comparison.
Payments to Intermediaries. The Directors also requested and received a description of payments made to intermediaries by the Fund and the Advisor and services provided in response thereto. These payments include various payments made by the Fund or the Advisor to different types of intermediaries and recordkeepers for distribution and service activities provided for the Fund. The Directors reviewed such information and received representations from the Advisor that all such payments by the Fund were made pursuant to the Fund’s Rule 12b-1 Plan and that all such payments by the Advisor were made from the Advisor’s resources and reasonable profits.
Collateral or “Fall-Out” Benefits Derived by the Advisor. The Board considered the possible existence of collateral benefits the Advisor may receive as a result of its relationship with the Fund. They concluded that the Advisor’s primary business is managing funds and it generally does not use fund or shareholder information to generate profits in other lines of business, and therefore does not derive any significant collateral benefits from them. To the extent there are potential collateral benefits, the Board has been advised and has taken this into consideration in its review of the management contract with the Fund. The Board noted that additional assets from other clients may offer the Advisor some benefit from increased leverage with prospective clients, service providers, and counterparties. Additionally, the Advisor may receive proprietary research from broker-dealers that execute fund portfolio transactions, which the Board concluded is likely to benefit other clients of the Advisor, as well as Fund shareholders. The Board also determined that the Advisor is able to provide investment management services to certain clients other than the Fund, at least in part, due to its existing infrastructure built to serve the fund complex. The Board concluded that appropriate allocation methodologies had been employed to assign resources and the cost of those resources to these other clients.
Existing Relationship. The Board also considered whether there was any reason for not continuing the existing arrangement with the Advisor. In this regard, the Board was mindful of the potential disruptions of the Fund’s operations and various risks, uncertainties, and other effects that could occur as a result of a decision not to continue such relationship. In particular, the Board recognized that most shareholders have invested in the Fund on the strength of the Advisor’s industry standing and reputation and in the expectation that the Advisor will have a continuing role in providing advisory services to the Fund.
Conclusion of the Directors. As a result of this process, the Board, including all of the independent Directors, taking into account all of the factors discussed above and the information provided by the Advisor and others in connection with its review and received over time, determined that the terms of the management agreement are fair and reasonable and that the management fee charged to the Fund is reasonable in light of the services provided and that the management agreement between the Fund and the Advisor should be renewed for an additional one-year period.
Other Tax Information
The following information is provided pursuant to provisions of the Internal Revenue Code.
The fund hereby designates up to the maximum amount allowable as qualified dividend income for the fiscal year ended November 30, 2024.
For the fiscal year ended November 30, 2024, the fund intends to pass through to shareholders foreign source income of $1,118,458 and foreign taxes paid of $103,688, or up to the maximum amount allowable, as a foreign tax credit. Foreign source income and foreign tax expense per outstanding share on November 30, 2024 are $0.1793 and $0.0166, respectively.
| | | | | | | | |
| Contact Us | americancentury.com | |
| Automated Information Line | 1-800-345-8765 | |
| Investor Services Representative | 1-800-345-2021
or 816-531-5575 | |
| Banks and Trust Companies, Broker-Dealers, Financial Professionals, Insurance Companies | 1-800-345-6488 | |
| | |
| This report and the statements it contains are submitted for the general information of our shareholders. The report is not authorized for distribution to prospective investors unless preceded or accompanied by an effective prospectus. | |
| | |
©2025 American Century Proprietary Holdings, Inc. All rights reserved.
CL-ANN-91034 2501 | |
| | | | | |
| |
| Annual Financial Statements and Other Information |
| |
| November 30, 2024 |
| |
| Global Small Cap Fund |
| Investor Class (AGCVX) |
| I Class (AGCSX) |
| A Class (AGCLX) |
| C Class (AGCHX) |
| R Class (AGCWX) |
| R6 Class (AGCTX) |
| | | | | |
| Schedule of Investments | |
| Statement of Assets and Liabilities | |
| Statement of Operations | |
| Statement of Changes in Net Assets | |
| Notes to Financial Statements | |
| Financial Highlights | |
| Report of Independent Registered Public Accounting Firm | |
| Approval of Management Agreement | |
| |
| Other Tax Information | |
NOVEMBER 30, 2024
| | | | | | | | |
| Shares | Value |
| COMMON STOCKS — 100.1% | | |
| Australia — 1.0% | | |
| CAR Group Ltd. | 31,425 | | $ | 854,111 | |
| Belgium — 0.6% | | |
D'ieteren Group(1) | 738 | | 157,835 | |
| Solvay SA | 10,291 | | 357,132 | |
| | 514,967 | |
| Brazil — 0.8% | | |
| Direcional Engenharia SA | 98,000 | | 468,272 | |
VTEX, Class A(2) | 25,270 | | 157,180 | |
| | 625,452 | |
| Canada — 10.0% | | |
Aritzia, Inc.(2) | 10,304 | | 343,258 | |
| AtkinsRealis Group, Inc. | 20,491 | | 1,112,622 | |
| Boardwalk Real Estate Investment Trust | 11,551 | | 589,080 | |
Brookfield Infrastructure Corp., Class A(1) | 19,000 | | 852,910 | |
Capstone Copper Corp.(2) | 122,619 | | 847,793 | |
Docebo, Inc.(1)(2) | 10,875 | | 541,711 | |
| Element Fleet Management Corp. | 39,740 | | 843,026 | |
| FirstService Corp. (Toronto) | 5,149 | | 1,004,460 | |
| goeasy Ltd. | 5,656 | | 703,056 | |
| Lundin Gold, Inc. | 36,627 | | 851,809 | |
MDA Space Ltd.(2) | 12,356 | | 237,491 | |
TransAlta Corp.(1) | 39,274 | | 445,183 | |
| | 8,372,399 | |
| China — 1.9% | | |
| Bosideng International Holdings Ltd. | 712,000 | | 371,776 | |
GDS Holdings Ltd., ADR(2) | 38,237 | | 752,886 | |
| Tongcheng Travel Holdings Ltd. | 179,600 | | 441,539 | |
| | 1,566,201 | |
| France — 2.3% | | |
Gaztransport Et Technigaz SA(1) | 2,607 | | 379,592 | |
| SPIE SA | 17,528 | | 552,452 | |
| Technip Energies NV | 24,719 | | 608,320 | |
VusionGroup(1) | 2,713 | | 409,658 | |
| | 1,950,022 | |
| Germany — 1.9% | | |
| CTS Eventim AG & Co. KGaA | 5,192 | | 459,509 | |
Hypoport SE(2) | 1,355 | | 279,342 | |
Redcare Pharmacy NV(2) | 5,215 | | 822,989 | |
| | 1,561,840 | |
| India — 3.9% | | |
Amber Enterprises India Ltd.(2) | 7,256 | | 522,102 | |
| Kalyan Jewellers India Ltd. | 73,623 | | 633,062 | |
| KEI Industries Ltd. | 15,896 | | 814,368 | |
| Max Healthcare Institute Ltd. | 49,533 | | 575,609 | |
| Prestige Estates Projects Ltd. | 36,235 | | 710,545 | |
| | 3,255,686 | |
| Israel — 1.6% | | |
CyberArk Software Ltd.(2) | 2,858 | | 924,591 | |
| | | | | | | | |
| Shares | Value |
Nova Ltd.(2) | 2,239 | | $ | 411,439 | |
| | 1,336,030 | |
| Italy — 1.0% | | |
BPER Banca SpA(1) | 129,757 | | 791,901 | |
| Japan — 6.1% | | |
| Asics Corp. | 59,800 | | 1,208,161 | |
CyberAgent, Inc.(1) | 68,600 | | 478,255 | |
| Isetan Mitsukoshi Holdings Ltd. | 23,000 | | 328,298 | |
| Mebuki Financial Group, Inc. | 245,600 | | 1,090,846 | |
Money Forward, Inc.(1)(2) | 15,300 | | 484,100 | |
| Ryohin Keikaku Co. Ltd. | 33,800 | | 695,485 | |
| Santen Pharmaceutical Co. Ltd. | 73,700 | | 848,726 | |
| | 5,133,871 | |
| Mexico — 0.7% | | |
| Genomma Lab Internacional SAB de CV, Class B | 446,953 | | 594,689 | |
| Netherlands — 1.5% | | |
| Arcadis NV | 11,432 | | 753,678 | |
| Fugro NV | 27,074 | | 490,936 | |
| | 1,244,614 | |
| Norway — 0.7% | | |
| Subsea 7 SA | 37,492 | | 593,682 | |
| Singapore — 0.7% | | |
| SATS Ltd. | 213,800 | | 600,668 | |
| South Korea — 0.4% | | |
| KIWOOM Securities Co. Ltd. | 3,692 | | 342,193 | |
| Sweden — 0.6% | | |
| Thule Group AB | 15,112 | | 476,024 | |
| Taiwan — 0.5% | | |
| King Yuan Electronics Co. Ltd. | 101,000 | | 398,583 | |
| United Kingdom — 3.0% | | |
| Howden Joinery Group PLC | 57,563 | | 598,606 | |
| Intermediate Capital Group PLC | 31,730 | | 855,065 | |
| Rotork PLC | 102,075 | | 432,051 | |
| Tritax Big Box REIT PLC | 353,774 | | 625,399 | |
| | 2,511,121 | |
| United States — 60.9% | | |
AAR Corp.(2) | 6,554 | | 455,634 | |
ADMA Biologics, Inc.(2) | 44,935 | | 903,643 | |
Agilysys, Inc.(2) | 3,830 | | 514,369 | |
ATI, Inc.(2) | 15,774 | | 949,122 | |
Bancorp, Inc.(2) | 15,548 | | 908,470 | |
BellRing Brands, Inc.(2) | 7,490 | | 587,665 | |
BJ's Wholesale Club Holdings, Inc.(2) | 4,811 | | 463,299 | |
BlackLine, Inc.(2) | 9,116 | | 565,283 | |
Bowhead Specialty Holdings, Inc.(2) | 27,480 | | 1,012,363 | |
| Carpenter Technology Corp. | 4,999 | | 970,006 | |
Champion Homes, Inc.(2) | 8,737 | | 906,289 | |
Chefs' Warehouse, Inc.(2) | 9,814 | | 438,784 | |
Clean Harbors, Inc.(2) | 3,418 | | 888,988 | |
| Commerce Bancshares, Inc. | 9,194 | | 678,058 | |
Construction Partners, Inc., Class A(2) | 8,398 | | 853,321 | |
Credo Technology Group Holding Ltd.(2) | 8,876 | | 434,569 | |
Donnelley Financial Solutions, Inc.(2) | 6,855 | | 413,014 | |
Duolingo, Inc.(2) | 1,709 | | 595,193 | |
| | | | | | | | |
| Shares | Value |
| Element Solutions, Inc. | 14,064 | | $ | 403,356 | |
elf Beauty, Inc.(2) | 4,499 | | 582,710 | |
| Evercore, Inc., Class A | 4,151 | | 1,278,093 | |
ExlService Holdings, Inc.(2) | 18,414 | | 853,673 | |
Expro Group Holdings NV(2) | 28,206 | | 391,781 | |
Extreme Networks, Inc.(2) | 26,264 | | 435,982 | |
Foot Locker, Inc.(2) | 4,438 | | 111,616 | |
| Fortune Brands Innovations, Inc. | 9,425 | | 737,978 | |
Freshpet, Inc.(2) | 5,254 | | 804,125 | |
| FTAI Aviation Ltd. | 7,621 | | 1,286,577 | |
FTI Consulting, Inc.(2) | 2,916 | | 590,548 | |
Globant SA(2) | 3,816 | | 869,132 | |
Goosehead Insurance, Inc., Class A(2) | 4,579 | | 577,503 | |
| Graphic Packaging Holding Co. | 16,947 | | 509,935 | |
Guidewire Software, Inc.(2) | 4,444 | | 901,643 | |
GXO Logistics, Inc.(2) | 4,753 | | 289,125 | |
| Hamilton Lane, Inc., Class A | 4,679 | | 900,240 | |
Hanesbrands, Inc.(2) | 56,435 | | 490,985 | |
Hayward Holdings, Inc.(2) | 34,072 | | 550,604 | |
Huron Consulting Group, Inc.(2) | 4,269 | | 524,276 | |
Impinj, Inc.(2) | 1,808 | | 347,516 | |
Integer Holdings Corp.(2) | 3,352 | | 470,956 | |
| Interparfums, Inc. | 3,248 | | 447,120 | |
Knife River Corp.(2) | 4,330 | | 448,155 | |
| Knight-Swift Transportation Holdings, Inc. | 7,537 | | 447,396 | |
| Korn Ferry | 7,926 | | 620,923 | |
Kosmos Energy Ltd.(2) | 50,426 | | 198,678 | |
| Levi Strauss & Co., Class A | 20,272 | | 353,949 | |
Life Time Group Holdings, Inc.(2) | 16,682 | | 404,872 | |
| Littelfuse, Inc. | 1,503 | | 370,745 | |
MACOM Technology Solutions Holdings, Inc.(2) | 6,415 | | 852,040 | |
Mirion Technologies, Inc.(2) | 29,140 | | 491,592 | |
Modine Manufacturing Co.(2) | 9,231 | | 1,253,478 | |
| Mueller Water Products, Inc., Class A | 36,963 | | 925,554 | |
Natera, Inc.(2) | 6,985 | | 1,171,943 | |
| National Storage Affiliates Trust | 8,668 | | 390,927 | |
| Newmark Group, Inc., Class A | 53,647 | | 830,456 | |
Ollie's Bargain Outlet Holdings, Inc.(2) | 5,669 | | 560,948 | |
Onto Innovation, Inc.(2) | 2,394 | | 393,047 | |
Paylocity Holding Corp.(2) | 2,073 | | 430,230 | |
| Primoris Services Corp. | 7,291 | | 610,330 | |
Q2 Holdings, Inc.(2) | 11,118 | | 1,164,499 | |
RadNet, Inc.(2) | 8,695 | | 710,903 | |
Rambus, Inc.(2) | 8,495 | | 491,096 | |
Redfin Corp.(2) | 37,311 | | 354,081 | |
RH(2) | 1,329 | | 511,851 | |
RxSight, Inc.(2) | 9,287 | | 435,375 | |
| Ryman Hospitality Properties, Inc. | 5,727 | | 671,433 | |
| Safehold, Inc. | 15,506 | | 331,208 | |
Shift4 Payments, Inc., Class A(1)(2) | 5,117 | | 583,747 | |
Skyward Specialty Insurance Group, Inc.(2) | 9,276 | | 501,924 | |
Summit Materials, Inc., Class A(2) | 10,063 | | 512,609 | |
Surgery Partners, Inc.(2) | 12,672 | | 302,100 | |
| Terreno Realty Corp. | 6,001 | | 363,841 | |
| | | | | | | | |
| Shares | Value |
| Toll Brothers, Inc. | 5,349 | | $ | 883,494 | |
Triumph Financial, Inc.(2) | 9,538 | | 1,021,424 | |
TWFG, Inc.(2) | 25,178 | | 889,035 | |
Uranium Energy Corp.(2) | 48,038 | | 399,196 | |
Verra Mobility Corp.(2) | 7,507 | | 177,616 | |
Warby Parker, Inc., Class A(2) | 30,637 | | 690,558 | |
Waystar Holding Corp.(2) | 21,941 | | 677,538 | |
| Wingstop, Inc. | 1,334 | | 438,579 | |
| Wintrust Financial Corp. | 8,581 | | 1,184,264 | |
| | 50,945,178 | |
TOTAL COMMON STOCKS (Cost $59,231,949) | | 83,669,232 | |
| EXCHANGE-TRADED FUNDS — 0.0% | | |
| Schwab International Small-Cap Equity ETF | 247 | | 9,082 | |
Schwab U.S. Small-Cap ETF(1) | 431 | | 12,154 | |
TOTAL EXCHANGE-TRADED FUNDS (Cost $16,150) | | 21,236 | |
| SHORT-TERM INVESTMENTS — 3.0% | | |
| Money Market Funds — 3.0% | | |
State Street Navigator Securities Lending Government Money Market Portfolio(3) | 2,458,255 | | 2,458,255 | |
| Repurchase Agreements — 0.0% | | |
| BMO Capital Markets Corp., (collateralized by various U.S. Treasury obligations, 3.625%, 2/15/44, valued at $8,615), in a joint trading account at 4.56%, dated 11/29/24, due 12/2/24 (Delivery value $8,463) | | 8,460 | |
TOTAL SHORT-TERM INVESTMENTS (Cost $2,466,715) | | 2,466,715 | |
TOTAL INVESTMENT SECURITIES — 103.1% (Cost $61,714,814) | | 86,157,183 | |
| OTHER ASSETS AND LIABILITIES — (3.1)% | | (2,556,613) | |
| TOTAL NET ASSETS — 100.0% | | $ | 83,600,570 | |
| | | | | |
| MARKET SECTOR DIVERSIFICATION |
| (as a % of net assets) | |
| Industrials | 19.9% |
| Financials | 16.8% |
| Consumer Discretionary | 15.4% |
| Information Technology | 14.1% |
| Health Care | 8.0% |
| Real Estate | 7.0% |
| Materials | 7.0% |
| Consumer Staples | 5.0% |
| Energy | 3.1% |
| Communication Services | 2.3% |
| Utilities | 1.5% |
| Exchange-Traded Funds | 0.0% |
| Short-Term Investments | 3.0% |
| Other Assets and Liabilities | (3.1)% |
| | | | | | | | |
| NOTES TO SCHEDULE OF INVESTMENTS |
| ADR | – | American Depositary Receipt |
(1)Security, or a portion thereof, is on loan. At the period end, the aggregate value of securities on loan was $4,367,927. The amount of securities on loan indicated may not correspond with the securities on loan identified because securities with pending sales are in the process of recall from the brokers.
(2)Non-income producing.
(3)Investment of cash collateral from securities on loan. At the period end, the aggregate value of the collateral held by the fund was $4,549,821, which includes securities collateral of $2,091,566.
See Notes to Financial Statements.
| | |
| Statement of Assets and Liabilities |
| | | | | |
| NOVEMBER 30, 2024 | |
| Assets | |
| Investment securities, at value (cost of $59,256,559) — including $4,367,927 of securities on loan | $ | 83,698,928 | |
| Investment made with cash collateral received for securities on loan, at value (cost of $2,458,255) | 2,458,255 | |
| Total investment securities, at value (cost of $61,714,814) | 86,157,183 | |
| Cash | 84,148 | |
| Foreign currency holdings, at value (cost of $8,395) | 8,500 | |
| Receivable for capital shares sold | 73,753 | |
| Dividends and interest receivable | 74,605 | |
| Securities lending receivable | 1,864 | |
| Other assets | 1,392 | |
| 86,401,445 | |
| |
| Liabilities | |
| Payable for collateral received for securities on loan | 2,458,255 | |
| Payable for capital shares redeemed | 28,351 | |
| Accrued management fees | 67,731 | |
| Distribution and service fees payable | 1,788 | |
| Accrued foreign taxes | 244,750 | |
| 2,800,875 | |
| |
| Net Assets | $ | 83,600,570 | |
| |
| Net Assets Consist of: | |
| Capital (par value and paid-in surplus) | $ | 71,780,195 | |
| Distributable earnings (loss) | 11,820,375 | |
| $ | 83,600,570 | |
| | | | | | | | | | | |
| Net Assets | Shares Outstanding | Net Asset Value Per Share* |
| Investor Class, $0.01 Par Value | $39,193,451 | 1,955,371 | $20.04 |
| I Class, $0.01 Par Value | $22,261,935 | 1,093,869 | $20.35 |
| A Class, $0.01 Par Value | $4,905,919 | 249,439 | $19.67 |
| C Class, $0.01 Par Value | $97,280 | 5,339 | $18.22 |
| R Class, $0.01 Par Value | $1,763,854 | 91,803 | $19.21 |
| R6 Class, $0.01 Par Value | $15,378,131 | 747,296 | $20.58 |
*Maximum offering price per share was equal to the net asset value per share for all share classes, except A Class, for which the maximum offering price per share was $20.87 (net asset value divided by 0.9425). A contingent deferred sales charge may be imposed on redemptions of A Class and C Class.
See Notes to Financial Statements.
| | | | | |
| YEAR ENDED NOVEMBER 30, 2024 |
| Investment Income (Loss) | |
| Income: | |
| Dividends (net of foreign taxes withheld of $85,207) | $ | 928,950 | |
| Interest | 28,311 | |
| Securities lending, net | 23,120 | |
| 980,381 | |
| |
| Expenses: | |
| Management fees | 817,858 | |
| Distribution and service fees: | |
| A Class | 10,863 | |
| C Class | 2,181 | |
| R Class | 7,844 | |
| Directors' fees and expenses | 2,529 | |
| Other expenses | 3,238 | |
| 844,513 | |
| |
| |
| |
| Net investment income (loss) | 135,868 | |
| |
| Realized and Unrealized Gain (Loss) | |
| Net realized gain (loss) on: | |
| Investment transactions (net of foreign tax expenses paid (refunded) of $17,873) | 7,880,065 | |
| Foreign currency translation transactions | (25,520) | |
| 7,854,545 | |
| |
| Change in net unrealized appreciation (depreciation) on: | |
| Investments (includes (increase) decrease in accrued foreign taxes of $(244,750)) | 12,836,229 | |
| Translation of assets and liabilities in foreign currencies | (3,117) | |
| 12,833,112 | |
| |
| Net realized and unrealized gain (loss) | 20,687,657 | |
| |
| Net Increase (Decrease) in Net Assets Resulting from Operations | $ | 20,823,525 | |
See Notes to Financial Statements.
| | |
| Statement of Changes in Net Assets |
| | | | | | | | |
| YEARS ENDED NOVEMBER 30, 2024 AND NOVEMBER 30, 2023 |
| Increase (Decrease) in Net Assets | November 30, 2024 | November 30, 2023 |
| Operations | | |
| Net investment income (loss) | $ | 135,868 | | $ | 108,183 | |
| Net realized gain (loss) | 7,854,545 | | (6,115,232) | |
| Change in net unrealized appreciation (depreciation) | 12,833,112 | | 4,443,113 | |
| Net increase (decrease) in net assets resulting from operations | 20,823,525 | | (1,563,936) | |
| | |
| Distributions to Shareholders | | |
| From earnings: | | |
| Investor Class | (179,269) | | (92,695) | |
| I Class | (155,028) | | (98,318) | |
| A Class | (11,127) | | — | |
| R6 Class | (185,410) | | (88,224) | |
| Decrease in net assets from distributions | (530,834) | | (279,237) | |
| | |
| Capital Share Transactions | | |
| Net increase (decrease) in net assets from capital share transactions (Note 5) | (14,796,000) | | (1,610,437) | |
| | |
| Net increase (decrease) in net assets | 5,496,691 | | (3,453,610) | |
| | |
| Net Assets | | |
| Beginning of period | 78,103,879 | | 81,557,489 | |
| End of period | $ | 83,600,570 | | $ | 78,103,879 | |
See Notes to Financial Statements.
| | |
| Notes to Financial Statements |
NOVEMBER 30, 2024
1. Organization
American Century World Mutual Funds, Inc. (the corporation) is registered under the Investment Company Act of 1940, as amended (the 1940 Act), as an open-end management investment company and is organized as a Maryland corporation. Global Small Cap Fund (the fund) is one fund in a series issued by the corporation. The fund’s investment objective is to seek capital growth.
The fund offers the Investor Class, I Class, A Class, C Class, R Class and R6 Class. The A Class may incur an initial sales charge. The A Class and C Class may be subject to a contingent deferred sales charge.
2. Significant Accounting Policies
The following is a summary of significant accounting policies consistently followed by the fund in preparation of its financial statements. The fund is an investment company and follows accounting and reporting guidance in accordance with accounting principles generally accepted in the United States of America. This may require management to make certain estimates and assumptions at the date of the financial statements. Actual results could differ from these estimates. Management evaluated the impact of events or transactions occurring through the date the financial statements were issued that would merit recognition or disclosure.
Investment Valuations — The fund determines the fair value of its investments and computes its net asset value (NAV) per share at the close of regular trading (usually 4 p.m. Eastern time) on the New York Stock Exchange (NYSE) on each day the NYSE is open. The value of investments of the fund is determined by American Century Investment Management, Inc. (ACIM) (the investment advisor), as the valuation designee, pursuant to its valuation policies and procedures. The Board of Directors oversees the valuation designee and reviews its valuation policies and procedures at least annually.
Equity securities that are listed or traded on a domestic securities exchange are valued at the last reported sales price or at the official closing price as provided by the exchange. Equity securities traded on foreign securities exchanges are generally valued at the closing price of such securities on the exchange where primarily traded or at the close of the NYSE, if that is earlier. If no last sales price is reported, or if local convention or regulation so provides, the mean of the latest bid and asked prices may be used. Securities traded over-the-counter are valued at the mean of the latest bid and asked prices, the last sales price, or the official closing price.
Open-end management investment companies are valued at the reported NAV per share. Repurchase agreements are valued at cost, which approximates fair value.
If the valuation designee determines that the market price for a portfolio security is not readily available or is believed by the valuation designee to be unreliable, such security is valued at fair value as determined in good faith by the valuation designee, in accordance with its policies and procedures. Circumstances that may cause the fund to determine that market quotations are not available or reliable include, but are not limited to: when there is a significant event subsequent to the market quotation; trading in a security has been halted during the trading day; or trading in a security is insufficient or did not take place due to a closure or holiday.
The valuation designee monitors for significant events occurring after the close of an investment’s primary exchange but before the fund’s NAV per share is determined. Significant events may include, but are not limited to: corporate announcements and transactions; regulatory news, governmental action and political unrest that could impact a specific investment or an investment sector; or armed conflicts, natural disasters and similar events that could affect investments in a specific country or region. The valuation designee also monitors for significant fluctuations between domestic and foreign markets, as evidenced by the U.S. market or such other indicators that it deems appropriate. The valuation designee may apply a model-derived factor to the closing price of equity securities traded on foreign securities exchanges. The factor is based on observable market data as provided by an independent pricing service.
Foreign Currency Translations — All assets and liabilities, including investment securities and other financial instruments, initially expressed in foreign currencies are translated into U.S. dollars each day at the mean of the appropriate currency exchange rate at the close of the NYSE as provided by an independent pricing service. The fund may enter into spot foreign currency exchange contracts to facilitate transactions denominated in a foreign currency. Purchases and sales of investment securities, dividend and interest income, spot foreign currency exchange contracts, and expenses are translated at the rates of exchange prevailing on the respective dates of such transactions. Net realized and unrealized foreign currency exchange gains or losses related to investment securities are a component of net realized gain (loss) on investment transactions and change in net unrealized appreciation (depreciation) on investments, respectively.
Security Transactions — Security transactions are accounted for as of the trade date. Net realized gains and losses are determined on the identified cost basis, which is also used for federal income tax purposes. Certain countries impose taxes on realized gains on the sale of securities registered in their country. The fund records the foreign tax expense, if any, on an accrual basis. The foreign tax expense on realized gains and unrealized appreciation reduces the net realized gain (loss) on investment transactions and net unrealized appreciation (depreciation) on investments, respectively.
Investment Income — Dividend income less foreign taxes withheld, if any, is recorded as of the ex-dividend date. Distributions received on securities that represent a return of capital or long-term capital gain are recorded as a reduction of cost of investments and/or as a realized gain. The fund may estimate the components of distributions received that may be considered nontaxable distributions or long-term capital gain distributions for income tax purposes. Interest income is recorded on the accrual basis and includes accretion of discounts and amortization of premiums. Securities lending income is net of fees and rebates earned by the lending agent for its services.
Repurchase Agreements — The fund may enter into repurchase agreements with institutions that ACIM has determined are creditworthy pursuant to criteria adopted by the Board of Directors. The fund requires that the collateral, represented by securities, received in a repurchase transaction be transferred to the custodian in a manner sufficient to enable the fund to obtain those securities in the event of a default under the repurchase agreement. ACIM monitors, on a daily basis, the securities transferred to ensure the value, including accrued interest, of the securities under each repurchase agreement is equal to or greater than amounts owed to the fund under each repurchase agreement.
Joint Trading Account — Pursuant to an Exemptive Order issued by the Securities and Exchange Commission, the fund, along with certain other funds in the American Century Investments family of funds, may transfer uninvested cash balances into a joint trading account. These balances are invested in one or more repurchase agreements that are collateralized by U.S. Treasury or Agency obligations.
Income Tax Status — It is the fund's policy to distribute substantially all net investment income and net realized gains to shareholders and to otherwise qualify as a regulated investment company under provisions of the Internal Revenue Code. Accordingly, no provision has been made for income taxes. The fund files U.S. federal, state, local and non-U.S. tax returns as applicable. The fund's tax returns are subject to examination by the relevant taxing authority until expiration of the applicable statute of limitations, which is generally three years from the date of filing but can be longer in certain jurisdictions. At this time, management believes there are no uncertain tax positions which, based on their technical merit, would not be sustained upon examination and for which it is reasonably possible that the total amounts of unrecognized tax benefits will significantly change in the next twelve months.
Multiple Class — All shares of the fund represent an equal pro rata interest in the net assets of the class to which such shares belong, and have identical voting, dividend, liquidation and other rights and the same terms and conditions, except for class specific expenses and exclusive rights to vote on matters affecting only individual classes. Income, non-class specific expenses, and realized and unrealized capital gains and losses of the fund are allocated to each class of shares based on their relative net assets.
Distributions to Shareholders — Distributions from net investment income and net realized gains, if any, are generally declared and paid annually. The fund may make distributions on a more frequent basis to comply with the distribution requirements of the Internal Revenue Code, in all events in a manner consistent with provisions of the 1940 Act.
Indemnifications — Under the corporation’s organizational documents, its officers and directors are indemnified against certain liabilities arising out of the performance of their duties to the fund. In addition, in the normal course of business, the fund enters into contracts that provide general indemnifications. The maximum exposure under these arrangements is unknown as this would involve future claims that may be made against a fund. The risk of material loss from such claims is considered by management to be remote.
Securities Lending — Securities are lent to qualified financial institutions and brokers. State Street Bank & Trust Co. serves as securities lending agent to the fund pursuant to a Securities Lending Agreement. The lending of securities exposes the fund to risks such as: the borrowers may fail to return the loaned securities, the borrowers may not be able to provide additional collateral, the fund may experience delays in recovery of the loaned securities or delays in access to collateral, or the fund may experience losses related to the investment collateral. To minimize certain risks, loan counterparties pledge collateral in the form of cash and/or securities. The lending agent has agreed to indemnify the fund in the case of default of any securities borrowed. Cash collateral received is invested in the State Street Navigator Securities Lending Government Money Market Portfolio, a money market mutual fund registered under the 1940 Act. The loans may also be secured by U.S. government securities in an amount at least equal to the market value of the securities loaned, plus accrued interest and dividends, determined on a daily basis and adjusted accordingly. By lending securities, the fund seeks to increase its net investment income through the receipt of interest and fees. Such income is reflected separately within the Statement of Operations. The value of loaned securities and related collateral outstanding at period end, if any, are shown on a gross basis within the Schedule of Investments and Statement of Assets and Liabilities.
The following table reflects a breakdown of transactions accounted for as secured borrowings, the gross obligation by the type of collateral pledged, and the remaining contractual maturity of those transactions as of November 30, 2024.
| | | | | | | | | | | | | | | | | |
| Remaining Contractual Maturity of Agreements |
| Overnight and
Continuous | <30 days | Between
30 & 90 days | >90 days | Total |
Securities Lending Transactions(1) | | | | |
| Common Stocks | $ | 2,446,400 | | — | | — | | — | | $ | 2,446,400 | |
| Exchange-Traded Funds | 11,855 | | — | | — | | — | | 11,855 | |
| Total Borrowings | $ | 2,458,255 | | — | | — | | — | | $ | 2,458,255 | |
| Gross amount of recognized liabilities for securities lending transactions | $ | 2,458,255 | |
(1)Amount represents the payable for cash collateral received for securities on loan. This will generally be in the Overnight and Continuous column as the securities are typically callable on demand.
3. Fees and Transactions with Related Parties
Certain officers and directors of the corporation are also officers and/or directors of American Century Companies, Inc. (ACC). The corporation's investment advisor, ACIM, the corporation's distributor, American Century Investment Services, Inc. (ACIS), and the corporation's transfer agent, American Century Services, LLC, are wholly owned, directly or indirectly, by ACC.
Management Fees — The corporation has entered into a management agreement with ACIM, under which ACIM provides the fund with investment advisory and management services in exchange for a single, unified management fee (the fee) per class. The agreement provides that ACIM will pay all expenses of managing and operating the fund, except brokerage expenses, taxes, interest, fees and expenses of the independent directors (including legal counsel fees), extraordinary expenses, and expenses incurred in connection with the provision of shareholder services and distribution services under a plan adopted pursuant to Rule 12b-1 under the 1940 Act. The fee is computed and accrued daily based on each class's daily net assets and paid monthly in arrears. The difference in the fee among the classes is a result of their separate arrangements for non-Rule 12b-1 shareholder services. It is not the result of any difference in advisory or custodial fees or other expenses related to the management of the fund’s assets, which do not vary by class.
The annual management fee for each class is as follows:
| | | | | | | | | | | | | | | | | |
| Investor Class | I Class | A Class | C Class | R Class | R6 Class |
| 1.10% | 0.90% | 1.10% | 1.10% | 1.10% | 0.75% |
Distribution and Service Fees — The Board of Directors has adopted a separate Master Distribution and Individual Shareholder Services Plan for each of the A Class, C Class and R Class (collectively the plans), pursuant to Rule 12b-1 of the 1940 Act. The plans provide that the A Class will pay ACIS an annual distribution and service fee of 0.25%. The plans provide that the C Class will pay ACIS an annual distribution and service fee of 1.00%, of which 0.25% is paid for individual shareholder services and 0.75% is paid for distribution services. The plans provide that the R Class will pay ACIS an annual distribution and service fee of 0.50%. The fees are computed and accrued daily based on each class’s daily net assets and paid monthly in arrears. The fees are used to pay financial intermediaries for distribution and individual shareholder services. Fees incurred under the plans during the period ended November 30, 2024 are detailed in the Statement of Operations.
Directors' Fees and Expenses — The Board of Directors is responsible for overseeing the investment advisor’s management and operations of the fund. The directors receive detailed information about the fund and its investment advisor regularly throughout the year, and meet at least quarterly with management of the investment advisor to review reports about fund operations. The fund's officers do not receive compensation from the fund.
Other Expenses — A fund’s other expenses may include interest charges, clearing exchange fees, proxy solicitation expenses, fees associated with the recovery of foreign tax reclaims and other miscellaneous expenses.
Interfund Transactions — The fund may enter into security transactions with other American Century Investments funds and other client accounts of the investment advisor, in accordance with the 1940 Act rules and procedures adopted by the Board of Directors. The rules and procedures require, among other things, that these transactions be effected at the independent current market price of the security. There were no interfund transactions during the period.
4. Investment Transactions
Purchases and sales of investment securities, excluding short-term investments, for the period ended November 30, 2024 were $92,150,166 and $107,072,515, respectively.
5. Capital Share Transactions
Transactions in shares of the fund were as follows:
| | | | | | | | | | | | | | |
| Year ended November 30, 2024 | Year ended November 30, 2023 |
| Shares | Amount | Shares | Amount |
| Investor Class/Shares Authorized | 40,000,000 | | | 40,000,000 | | |
| Sold | 306,590 | | $ | 5,507,307 | | 453,528 | | $ | 7,259,926 | |
| Issued in reinvestment of distributions | 10,007 | | 176,821 | | 5,811 | | 91,465 | |
| Redeemed | (562,205) | | (9,932,679) | | (686,681) | | (10,844,446) | |
| (245,608) | | (4,248,551) | | (227,342) | | (3,493,055) | |
| I Class/Shares Authorized | 25,000,000 | | | 25,000,000 | | |
| Sold | 393,138 | | 7,081,405 | | 286,831 | | 4,658,833 | |
| Issued in reinvestment of distributions | 8,651 | | 155,028 | | 6,164 | | 98,318 | |
| Redeemed | (533,253) | | (9,779,529) | | (630,237) | | (9,983,116) | |
| (131,464) | | (2,543,096) | | (337,242) | | (5,225,965) | |
| A Class/Shares Authorized | 20,000,000 | | | 20,000,000 | | |
| Sold | 41,109 | | 713,946 | | 340,447 | | 5,173,279 | |
| Issued in reinvestment of distributions | 641 | | 11,127 | | — | | — | |
| Redeemed | (36,932) | | (642,522) | | (119,735) | | (1,941,925) | |
| 4,818 | | 82,551 | | 220,712 | | 3,231,354 | |
| C Class/Shares Authorized | 20,000,000 | | | 20,000,000 | | |
| Sold | 465 | | 7,376 | | 12,380 | | 179,782 | |
| Redeemed | (22,766) | | (368,495) | | (11,051) | | (157,882) | |
| (22,301) | | (361,119) | | 1,329 | | 21,900 | |
| R Class/Shares Authorized | 20,000,000 | | | 20,000,000 | | |
| Sold | 45,971 | | 797,548 | | 34,731 | | 535,463 | |
| Redeemed | (35,394) | | (622,463) | | (68,861) | | (1,005,678) | |
| 10,577 | | 175,085 | | (34,130) | | (470,215) | |
| R6 Class/Shares Authorized | 20,000,000 | | | 20,000,000 | | |
| Sold | 377,694 | | 6,889,028 | | 590,570 | | 9,415,393 | |
| Issued in reinvestment of distributions | 10,244 | | 185,410 | | 5,476 | | 88,224 | |
| Redeemed | (772,715) | | (14,975,308) | | (313,436) | | (5,178,073) | |
| (384,777) | | (7,900,870) | | 282,610 | | 4,325,544 | |
| Net increase (decrease) | (768,755) | | $ | (14,796,000) | | (94,063) | | $ | (1,610,437) | |
6. Fair Value Measurements
The fund's investments valuation process is based on several considerations and may use multiple inputs to determine the fair value of the investments held by the fund. In conformity with accounting principles generally accepted in the United States of America, the inputs used to determine a valuation are classified into three broad levels.
•Level 1 valuation inputs consist of unadjusted quoted prices in an active market for identical investments.
•Level 2 valuation inputs consist of direct or indirect observable market data (including quoted prices for comparable investments, evaluations of subsequent market events, interest rates, prepayment speeds, credit risk, etc.). These inputs also consist of quoted prices for identical investments initially expressed in local currencies that are adjusted through translation into U.S. dollars.
•Level 3 valuation inputs consist of unobservable data (including a fund’s own assumptions).
The level classification is based on the lowest level input that is significant to the fair valuation measurement. The valuation inputs are not necessarily an indication of the risks associated with investing in these securities or other financial instruments.
The following is a summary of the level classifications as of period end. The Schedule of Investments provides additional information on the fund's portfolio holdings.
| | | | | | | | | | | |
| Level 1 | Level 2 | Level 3 |
| Assets | | | |
| Investment Securities | | | |
| Common Stocks | | | |
| Australia | — | | $ | 854,111 | | — | |
| Belgium | — | | 514,967 | | — | |
| Brazil | $ | 157,180 | | 468,272 | | — | |
| Canada | 852,910 | | 7,519,489 | | — | |
| China | 752,886 | | 813,315 | | — | |
| France | — | | 1,950,022 | | — | |
| Germany | — | | 1,561,840 | | — | |
| India | — | | 3,255,686 | | — | |
| Italy | — | | 791,901 | | — | |
| Japan | — | | 5,133,871 | | — | |
| Mexico | — | | 594,689 | | — | |
| Netherlands | — | | 1,244,614 | | — | |
| Norway | — | | 593,682 | | — | |
| Singapore | — | | 600,668 | | — | |
| South Korea | — | | 342,193 | | — | |
| Sweden | — | | 476,024 | | — | |
| Taiwan | — | | 398,583 | | — | |
| United Kingdom | — | | 2,511,121 | | — | |
| Other Countries | 52,281,208 | | — | | — | |
| Exchange-Traded Funds | 21,236 | | — | | — | |
| Short-Term Investments | 2,458,255 | | 8,460 | | — | |
| $ | 56,523,675 | | $ | 29,633,508 | | — | |
7. Risk Factors
The value of the fund’s shares will go up and down, sometimes rapidly or unpredictably, based on the performance of the securities owned by the fund and other factors generally affecting the securities market. Market risks, including political, regulatory, economic and social developments, can affect the value of the fund’s investments. Natural disasters, public health emergencies, war, terrorism and other unforeseeable events may lead to increased market volatility and may have adverse long-term effects on world economies and markets generally.
There are certain risks involved in investing in foreign securities. These risks include those resulting from political events (such as civil unrest, national elections and imposition of exchange controls), social and economic events (such as labor strikes and rising inflation), and natural disasters. Securities of foreign issuers may be less liquid and more volatile. Investing in emerging markets or a significant portion of assets in one country or region may accentuate these risks.
The fund invests in common stocks of small companies. Because of this, the fund may be subject to greater risk and market fluctuations than a fund investing in larger, more established companies.
The fund's investment process may result in high portfolio turnover, which could mean high transaction costs, affecting both performance and capital gains tax liabilities to investors.
8. Federal Tax Information
On December 17, 2024, the fund declared and paid the following per-share distributions from net investment income to shareholders of record on December 16, 2024:
| | | | | | | | | | | | | | | | | |
| Investor Class | I Class | A Class | C Class | R Class | R6 Class |
| $0.3180 | $0.3488 | $0.2796 | $0.1643 | $0.2412 | $0.3718 |
The tax character of distributions paid during the years ended November 30, 2024 and November 30, 2023 were as follows:
| | | | | | | | |
| 2024 | 2023 |
| Distributions Paid From | | |
| Ordinary income | $ | 530,834 | | $ | 279,237 | |
| Long-term capital gains | — | | — | |
The book-basis character of distributions made during the year from net investment income or net realized gains may differ from their ultimate characterization for federal income tax purposes. These differences reflect the differing character of certain income items and net realized gains and losses for financial statement and tax purposes, and may result in reclassification among certain capital accounts on the financial statements.
As of period end, the federal tax cost of investments and the components of distributable earnings on a tax-basis were as follows:
| | | | | |
| Federal tax cost of investments | $ | 63,692,008 | |
| Gross tax appreciation of investments | $ | 23,840,412 | |
| Gross tax depreciation of investments | (1,375,237) | |
| Net tax appreciation (depreciation) of investments | 22,465,175 | |
| Net tax appreciation (depreciation) on translation of assets and liabilities in foreign currencies | (248,133) | |
| Net tax appreciation (depreciation) | $ | 22,217,042 | |
| Undistributed ordinary income | $ | 1,370,903 | |
| Accumulated short-term capital losses | $ | (11,767,570) | |
The difference between book-basis and tax-basis unrealized appreciation (depreciation) is attributable primarily to the realization to ordinary income for tax
purposes of unrealized gains on investments in passive foreign investment companies.
Accumulated capital losses represent net capital loss carryovers that may be used to offset future realized capital gains for federal income tax purposes. The capital loss carryovers may be carried forward for an unlimited period. Future capital loss carryover utilization in any given year may be subject to Internal Revenue Code limitations.
| | | | | | | | | | | | | | | | | | | | | | | | | | | | | | | | | | | | | | | | | |
| For a Share Outstanding Throughout the Years Ended November 30 (except as noted) |
| Per-Share Data | Ratios and Supplemental Data |
| | Income From Investment Operations*: | Distributions From: | | | Ratio to Average Net Assets of†: | | |
| Net Asset Value, Beginning of Period | Net Investment Income (Loss)(1) | Net Realized and Unrealized Gain (Loss) | Total From Investment Operations | Net
Investment
Income | Net
Realized
Gains | Total
Distributions | Net Asset Value, End of Period | Total Return(2) | Operating
Expenses | Net
Investment
Income
(Loss) | Portfolio
Turnover
Rate | Net Assets, End of Period (in thousands) |
| Investor Class | | | | | | | | | | |
| 2024 | $15.78 | 0.01 | 4.34 | 4.35 | (0.09) | — | (0.09) | $20.04 | 27.64% | 1.11% | 0.04% | 109% | $39,193 | |
| 2023 | $16.17 | 0.01 | (0.36) | (0.35) | (0.04) | — | (0.04) | $15.78 | (2.18)% | 1.11% | 0.03% | 130% | $34,727 | |
| 2022 | $24.94 | 0.03 | (5.23) | (5.20) | (0.04) | (3.53) | (3.57) | $16.17 | (24.11)% | 1.11% | 0.17% | 115% | $39,261 | |
| 2021 | $21.11 | (0.10) | 5.29 | 5.19 | — | (1.36) | (1.36) | $24.94 | 25.57% | 1.11% | (0.40)% | 136% | $41,838 | |
| 2020 | $15.81 | (0.11) | 6.19 | 6.08 | — | (0.78) | (0.78) | $21.11 | 40.28% | 1.39% | (0.63)% | 204% | $21,562 | |
| I Class | | | | | | | | | | |
| 2024 | $16.02 | 0.04 | 4.41 | 4.45 | (0.12) | — | (0.12) | $20.35 | 27.91% | 0.91% | 0.24% | 109% | $22,262 | |
| 2023 | $16.41 | 0.04 | (0.36) | (0.32) | (0.07) | — | (0.07) | $16.02 | (1.96)% | 0.91% | 0.23% | 130% | $19,628 | |
| 2022 | $25.27 | 0.06 | (5.30) | (5.24) | (0.09) | (3.53) | (3.62) | $16.41 | (23.98)% | 0.91% | 0.37% | 115% | $25,641 | |
| 2021 | $21.33 | (0.04) | 5.34 | 5.30 | — | (1.36) | (1.36) | $25.27 | 25.84% | 0.91% | (0.20)% | 136% | $11,067 | |
| 2020 | $15.94 | (0.08) | 6.25 | 6.17 | — | (0.78) | (0.78) | $21.33 | 40.62% | 1.19% | (0.43)% | 204% | $587 | |
| A Class | | | | | | | | | | |
| 2024 | $15.48 | (0.04) | 4.28 | 4.24 | (0.05) | — | (0.05) | $19.67 | 27.40% | 1.36% | (0.21)% | 109% | $4,906 | |
| 2023 | $15.87 | (0.04) | (0.35) | (0.39) | — | — | — | $15.48 | (2.46)% | 1.36% | (0.22)% | 130% | $3,787 | |
| 2022 | $24.55 | (0.01) | (5.14) | (5.15) | — | (3.53) | (3.53) | $15.87 | (24.28)% | 1.36% | (0.08)% | 115% | $379 | |
| 2021 | $20.85 | (0.16) | 5.22 | 5.06 | — | (1.36) | (1.36) | $24.55 | 25.25% | 1.36% | (0.65)% | 136% | $317 | |
| 2020 | $15.66 | (0.15) | 6.12 | 5.97 | — | (0.78) | (0.78) | $20.85 | 39.95% | 1.64% | (0.88)% | 204% | $63 | |
| C Class | | | | | | | | | | |
| 2024 | $14.41 | (0.16) | 3.97 | 3.81 | — | — | — | $18.22 | 26.44% | 2.11% | (0.96)% | 109% | $97 | |
| 2023 | $14.88 | (0.14) | (0.33) | (0.47) | — | — | — | $14.41 | (3.16)% | 2.11% | (0.97)% | 130% | $398 | |
| 2022 | $23.41 | (0.13) | (4.87) | (5.00) | — | (3.53) | (3.53) | $14.88 | (24.91)% | 2.11% | (0.83)% | 115% | $392 | |
| 2021 | $20.08 | (0.33) | 5.02 | 4.69 | — | (1.36) | (1.36) | $23.41 | 24.32% | 2.11% | (1.40)% | 136% | $178 | |
| 2020 | $15.22 | (0.26) | 5.90 | 5.64 | — | (0.78) | (0.78) | $20.08 | 38.88% | 2.39% | (1.63)% | 204% | $45 | |
| R Class | | | | | | | | | | |
| 2024 | $15.12 | (0.08) | 4.17 | 4.09 | — | — | — | $19.21 | 27.05% | 1.61% | (0.46)% | 109% | $1,764 | |
| 2023 | $15.54 | (0.07) | (0.35) | (0.42) | — | — | — | $15.12 | (2.70)% | 1.61% | (0.47)% | 130% | $1,228 | |
| 2022 | $24.17 | (0.06) | (5.04) | (5.10) | — | (3.53) | (3.53) | $15.54 | (24.49)% | 1.61% | (0.33)% | 115% | $1,792 | |
| 2021 | $20.59 | (0.21) | 5.15 | 4.94 | — | (1.36) | (1.36) | $24.17 | 24.97% | 1.61% | (0.90)% | 136% | $1,937 | |
| 2020 | $15.52 | (0.18) | 6.03 | 5.85 | — | (0.78) | (0.78) | $20.59 | 39.52% | 1.89% | (1.13)% | 204% | $839 | |
| | | | | | | | | | | | | | | | | | | | | | | | | | | | | | | | | | | | | | | | | |
| For a Share Outstanding Throughout the Years Ended November 30 (except as noted) |
| Per-Share Data | Ratios and Supplemental Data |
| | Income From Investment Operations*: | Distributions From: | | | Ratio to Average Net Assets of†: | | |
| Net Asset Value, Beginning of Period | Net Investment Income (Loss)(1) | Net Realized and Unrealized Gain (Loss) | Total From Investment Operations | Net
Investment
Income | Net
Realized
Gains | Total
Distributions | Net Asset Value, End of Period | Total Return(2) | Operating
Expenses | Net
Investment
Income
(Loss) | Portfolio
Turnover
Rate | Net Assets, End of Period (in thousands) |
| R6 Class | | | | | | | | | | |
| 2024 | $16.20 | 0.07 | 4.46 | 4.53 | (0.15) | — | (0.15) | $20.58 | 28.10% | 0.76% | 0.39% | 109% | $15,378 | |
| 2023 | $16.59 | 0.06 | (0.36) | (0.30) | (0.09) | — | (0.09) | $16.20 | (1.80)% | 0.76% | 0.38% | 130% | $18,335 | |
| 2022 | $25.51 | 0.09 | (5.35) | (5.26) | (0.13) | (3.53) | (3.66) | $16.59 | (23.87)% | 0.76% | 0.52% | 115% | $14,092 | |
| 2021 | $21.49 | (0.01) | 5.39 | 5.38 | — | (1.36) | (1.36) | $25.51 | 26.03% | 0.76% | (0.05)% | 136% | $15,878 | |
| 2020 | $16.03 | (0.03) | 6.27 | 6.24 | — | (0.78) | (0.78) | $21.49 | 40.75% | 1.04% | (0.28)% | 204% | $24,743 | |
| | |
| Notes to Financial Highlights |
(1)Computed using average shares outstanding throughout the period.
(2)Total returns are calculated based on the net asset value of the last business day and do not reflect applicable sales charges, if any. Total returns for periods less than one year are not annualized.
*The amount shown for a share outstanding throughout the period may not correlate with the Statement(s) of Operations or precisely reflect the class expense differentials due to the timing of transactions in shares of a fund in relation to income earned and/or fluctuations in the fair value of a fund's investments.
†Ratios for periods less than one year are annualized. Zero balances may reflect amounts less than 0.005%.
See Notes to Financial Statements.
| | |
| Report of Independent Registered Public Accounting Firm |
To the shareholders of the Global Small Cap Fund and the Board of Directors of American Century World Mutual Funds, Inc.
Opinion on the Financial Statements and Financial Highlights
We have audited the accompanying statement of assets and liabilities, including the schedule of investments, of Global Small Cap Fund (the “Fund”), one of the funds constituting the American Century World Mutual Funds, Inc., as of November 30, 2024, the related statement of operations for the year then ended, the statements of changes in net assets for each of the two years in the period then ended, the financial highlights for each of the five years in the period then ended, and the related notes. In our opinion, the financial statements and financial highlights present fairly, in all material respects, the financial position of the Fund as of November 30, 2024, and the results of its operations for the year then ended, the changes in its net assets for each of the two years in the period then ended, and the financial highlights for each of the five years in the period then ended, in conformity with accounting principles generally accepted in the United States of America.
Basis for Opinion
These financial statements and financial highlights are the responsibility of the Fund's management. Our responsibility is to express an opinion on the Fund’s financial statements and financial highlights based on our audits. We are a public accounting firm registered with the Public Company Accounting Oversight Board (United States) (PCAOB) and are required to be independent with respect to the Fund in accordance with the U.S. federal securities laws and the applicable rules and regulations of the Securities and Exchange Commission and the PCAOB.
We conducted our audits in accordance with the standards of the PCAOB. Those standards require that we plan and perform the audit to obtain reasonable assurance about whether the financial statements and financial highlights are free of material misstatement, whether due to error or fraud. The Fund is not required to have, nor were we engaged to perform, an audit of its internal control over financial reporting. As part of our audits, we are required to obtain an understanding of internal control over financial reporting but not for the purpose of expressing an opinion on the effectiveness of the Fund’s internal control over financial reporting. Accordingly, we express no such opinion.
Our audits included performing procedures to assess the risks of material misstatement of the financial statements and financial highlights, whether due to error or fraud, and performing procedures that respond to those risks. Such procedures included examining, on a test basis, evidence regarding the amounts and disclosures in the financial statements and financial highlights. Our audits also included evaluating the accounting principles used and significant estimates made by management, as well as evaluating the overall presentation of the financial statements and financial highlights. Our procedures included confirmation of securities owned as of November 30, 2024, by correspondence with the custodian and brokers; when replies were not received from brokers, we performed other auditing procedures. We believe that our audits provide a reasonable basis for our opinion.
/s/ Deloitte & Touche LLP
Kansas City, Missouri
January 16, 2025
We have served as the auditor of one or more American Century investment companies since 1997.
| | |
| Approval of Management Agreement |
At a meeting held on June 27, 2024, the Fund’s Board of Directors (the “Board”) unanimously approved the renewal of the management agreement pursuant to which American Century Investment Management, Inc. (the “Advisor”) acts as the investment advisor for the Fund. Under the Investment Company Act of 1940 (the “Investment Company Act”), contracts for investment advisory services are required to be reviewed, evaluated, and approved by a majority of a fund’s Directors, including a majority of the independent Directors.
Prior to its consideration of the renewal of the management agreement, the Directors requested and reviewed data and information compiled by the Advisor and certain independent consultants and data providers concerning the Fund. This review was in addition to the oversight and evaluation undertaken by the Board and its committees on a continual basis and the information received was supplemental to the information that the Board and its committees receive and consider over time.
In connection with its consideration of the renewal of the management agreement, the Board’s review and evaluation of the services provided by the Advisor and its affiliates included, but was not limited to
•the nature, extent, and quality of investment management, shareholder services, distribution services, and other services provided to the Fund;
•the wide range of programs and services the Advisor and other service providers provide to the Fund and its shareholders on a routine and non-routine basis;
•the Fund’s investment performance compared to appropriate benchmarks and/or peer groups of other mutual funds with similar investment objectives and strategies;
•the cost of owning the Fund compared to the cost of owning similarly-managed funds;
•the Advisor’s compliance policies, procedures, and regulatory experience and those of certain other service providers;
•the Advisor’s strategic plans, generally, and with respect to the Advisor’s response to investment management industry challenges;
•the Advisor’s business continuity plans, vendor management practices, and information security practices;
•the cost of services provided to the Fund, the profitability of the Fund to the Advisor, and the Advisor’s financial results of operation;
•possible economies of scale associated with the Advisor’s management of the Fund;
•any collateral benefits derived by the Advisor from the management of the Fund;
•fees and expenses associated with any investment by the Fund in other funds;
•payments to intermediaries by the Fund and the Advisor and services provided by intermediaries in connection therewith; and
•services provided and charges to the Advisor’s other investment management clients.
The Board held two meetings to consider the renewal. The independent Directors also met in private session multiple times to review and discuss the information provided in response to their request. The independent Directors held active discussions with the Advisor regarding the renewal of the management agreement, requesting supplemental information, and reviewing information provided by the Advisor in response thereto. The independent Directors had the benefit of the advice of their independent counsel throughout the process.
Factors Considered
The Directors considered all of the information provided by the Advisor, the independent consultant and data providers, and the independent Directors’ independent counsel in connection with the approval. They determined that the information was sufficient for them to evaluate the management agreement for the Fund. In connection with their review, the Directors did not identify any single factor as being all-important or controlling, and each Director may have attributed different levels of importance to different factors. In deciding to renew the management agreement, the Board based its decision on a number of factors, including without limitation the following:
Nature, Extent and Quality of Services — Generally. Under the management agreement, the Advisor is responsible for providing or arranging for all services necessary for the operation of the Fund. The Board noted that the Advisor provides or arranges at its own expense a wide variety of services which include, without limitation, the following:
•constructing and designing the Fund
•portfolio research and security selection
•initial capitalization/funding
•securities trading
•Fund administration
•custody of Fund assets
•daily valuation of the Fund’s portfolio
•liquidity monitoring and management
•risk management, including information security
•shareholder servicing and transfer agency, including shareholder confirmations, recordkeeping, and communications
•legal services (except the independent Directors’ counsel)
•regulatory and portfolio compliance
•financial reporting
•marketing and distribution (except amounts paid by the Fund under Rule 12b-1 plans)
The Board noted that many of these services have expanded over time in terms of both quantity and complexity in response to shareholder demands, competition in the industry, changing distribution channels, and the changing regulatory environment.
Investment Management Services. The nature of the investment management services provided to the Fund is quite complex and allows Fund shareholders access to professional money management, instant diversification of their investments, the opportunity to easily diversify among asset classes by investing in or exchanging among various American Century Investments funds, and liquidity. In evaluating investment performance, the Board expects the Advisor to manage the Fund in accordance with its investment objectives and principal investment strategies. Further, the Directors recognize that the Advisor has an obligation to monitor trading activities, and in particular to seek the best execution of fund trades, and to evaluate the use of and payment for research. In providing these services, the Advisor utilizes teams of investment professionals who require extensive information technology, research, training, compliance, and other systems to conduct their business. The Board, directly and through its Fund Performance Review Committee, provides oversight of the investment performance process. It regularly reviews investment performance information for the Fund, together with comparative information for appropriate benchmarks and/or peer groups of similarly-managed funds, over different time horizons. The Directors also review investment performance information from both the Advisor and an independent third party during the management agreement renewal process. If performance concerns are identified, the Board discusses with the Advisor the reasons for such results and any actions being taken to improve performance and may conduct special reviews until performance improves. The Fund’s performance was above its benchmark for the five-year period and below its benchmark for the one- and three-year periods reviewed by the Board. In relation to industry peers, the Fund was above the median of its peer performance universe as identified by a third-party service provider for the five-year period and below the median for the one- and three-year periods. The Board discussed the Fund’s performance with the Advisor, including steps being taken to address underperformance, and was satisfied with the efforts being undertaken by the Advisor. The Board found the investment management services provided by the Advisor to the Fund to be satisfactory and consistent with the management agreement.
Shareholder and Other Services. Under the management agreement, the Advisor provides the Fund with a comprehensive package of transfer agency, shareholder, and other services. The Board, directly and through its various committees, regularly reviews reports and evaluations of such services at its regular meetings. These reports include, but are not limited to, information regarding the operational efficiency and accuracy of the shareholder and transfer agency services provided, staffing levels, shareholder satisfaction, technology support (including information security), new products and services offered to Fund shareholders, securities trading activities, portfolio valuation services, auditing services, and legal and operational compliance activities. The Board found the services provided by the Advisor to the Fund under the management agreement to be competitive and of high quality.
Costs of Services and Profitability. The Advisor provides detailed information concerning its cost of providing various services to the Fund, its profitability in managing the Fund (pre- and post-distribution), and its financial results of operation. The Directors have reviewed with the Advisor the methodology used to prepare this financial information and arranged for an independent consultant to confirm the reasonableness of the allocation methodology used. This information is considered in evaluating the Advisor’s financial condition, its ability to continue to provide services under the management agreement, and the reasonableness of the terms of the current management agreement. The Board concluded that the Advisor’s profits were reasonable in light of the services provided to the Fund.
Ethics. The Board generally considers the Advisor’s commitment to providing quality services to shareholders and to conducting its business ethically. They noted that the Advisor’s practices generally meet or exceed industry best practices.
Economies of Scale. The Board also reviewed information provided by the Advisor regarding the possible existence of economies of scale in connection with the management of the Fund. The Board concluded that economies of scale are difficult to measure and predict with precision, especially on a fund-by-fund basis. The Board concluded that the Advisor is sharing economies of scale, to the extent they exist, through its fee structure, and through reinvestment in its business, infrastructure, investment capabilities and initiatives to provide shareholders enhanced and expanded content and services.
Comparison to Other Funds’ Fees. The management agreement provides that the Fund pays the Advisor a single, all-inclusive (or unified) management fee for providing all services necessary for the management and operation of the Fund, other than brokerage and other transaction fees and expenses relating to acquisition and disposition of portfolio securities, acquired fund fees and expenses, taxes, interest, extraordinary expenses, fund litigation expenses, fees and expenses of the Fund’s independent Directors (including their independent legal counsel), and expenses incurred in connection with the provision of shareholder services and distribution services under a plan adopted pursuant to Investment Company Act Rule 12b-1. Under the unified fee structure, the Advisor is responsible for providing all investment advisory, custody, audit, administrative, compliance, recordkeeping, marketing and shareholder services, or arranging and supervising third parties to provide such services. By contrast, most other funds are charged a variety of fees, including an investment advisory fee, a transfer agency fee, an administrative fee, distribution charges, and other expenses. Other than their investment advisory fees and any applicable Rule 12b-1 distribution fees, all other components of the total fees charged by these other funds may be increased without shareholder approval. The Board believes
the unified fee structure is a benefit to Fund shareholders because it clearly discloses to shareholders the cost of owning Fund shares, and, since the unified fee cannot be increased without a vote of Fund shareholders, it shifts to the Advisor the risk of increased costs of operating the Fund and provides a direct incentive to minimize administrative inefficiencies. Part of the Board’s analysis of fee levels involves reviewing certain evaluative data compiled by an independent provider comparing the Fund’s unified fee to the total expense ratios of its peers. The unified fee charged to shareholders of the Fund was below the median of the total expense ratios of the Fund’s peer expense universe. In addition, the Board reviewed the Fund’s position relative to the narrower set of its expense group peers. The Board concluded that the management fee paid by the Fund to the Advisor under the management agreement is reasonable in light of the services provided to the Fund.
Comparison to Fees and Services Provided to Other Clients of the Advisor. The Board also requested and received information from the Advisor concerning the nature of the services, fees, costs, and profitability of its advisory services to advisory clients other than the Fund. They observed that these varying types of client accounts require different services and involve different regulatory and entrepreneurial risks than the management of the Fund. The Board analyzed this information and concluded that the fees charged and services provided to the Fund were reasonable by comparison.
Payments to Intermediaries. The Directors also requested and received a description of payments made to intermediaries by the Fund and the Advisor and services provided in response thereto. These payments include various payments made by the Fund or the Advisor to different types of intermediaries and recordkeepers for distribution and service activities provided for the Fund. The Directors reviewed such information and received representations from the Advisor that all such payments by the Fund were made pursuant to the Fund’s Rule 12b-1 Plan and that all such payments by the Advisor were made from the Advisor’s resources and reasonable profits.
Collateral or “Fall-Out” Benefits Derived by the Advisor. The Board considered the possible existence of collateral benefits the Advisor may receive as a result of its relationship with the Fund. They concluded that the Advisor’s primary business is managing funds and it generally does not use fund or shareholder information to generate profits in other lines of business, and therefore does not derive any significant collateral benefits from them. To the extent there are potential collateral benefits, the Board has been advised and has taken this into consideration in its review of the management contract with the Fund. The Board noted that additional assets from other clients may offer the Advisor some benefit from increased leverage with prospective clients, service providers, and counterparties. Additionally, the Advisor may receive proprietary research from broker-dealers that execute fund portfolio transactions, which the Board concluded is likely to benefit other clients of the Advisor, as well as Fund shareholders. The Board also determined that the Advisor is able to provide investment management services to certain clients other than the Fund, at least in part, due to its existing infrastructure built to serve the fund complex. The Board concluded that appropriate allocation methodologies had been employed to assign resources and the cost of those resources to these other clients.
Existing Relationship. The Board also considered whether there was any reason for not continuing the existing arrangement with the Advisor. In this regard, the Board was mindful of the potential disruptions of the Fund’s operations and various risks, uncertainties, and other effects that could occur as a result of a decision not to continue such relationship. In particular, the Board recognized that most shareholders have invested in the Fund on the strength of the Advisor’s industry standing and reputation and in the expectation that the Advisor will have a continuing role in providing advisory services to the Fund.
Conclusion of the Directors. As a result of this process, the Board, including all of the independent Directors, taking into account all of the factors discussed above and the information provided by the Advisor and others in connection with its review and received over time, determined that the terms of the management agreement are fair and reasonable and that the management fee charged to the Fund is reasonable in light of the services provided and that the management agreement between the Fund and the Advisor should be renewed for an additional one-year period.
Other Tax Information
The following information is provided pursuant to provisions of the Internal Revenue Code.
The fund hereby designates up to the maximum amount allowable as qualified dividend income for the fiscal year ended November 30, 2024.
For corporate taxpayers, the fund hereby designates $111,272, or up to the maximum amount allowable, of ordinary income distributions paid during the fiscal year ended November 30, 2024 as qualified for the corporate dividends received deduction.
| | | | | | | | |
| Contact Us | americancentury.com | |
| Automated Information Line | 1-800-345-8765 | |
| Investor Services Representative | 1-800-345-2021
or 816-531-5575 | |
| Banks and Trust Companies, Broker-Dealers, Financial Professionals, Insurance Companies | 1-800-345-6488 | |
| | |
| This report and the statements it contains are submitted for the general information of our shareholders. The report is not authorized for distribution to prospective investors unless preceded or accompanied by an effective prospectus. | |
| | |
©2025 American Century Proprietary Holdings, Inc. All rights reserved.
CL-ANN-91035 2501 | |
| | | | | |
| |
| Annual Financial Statements and Other Information |
| |
| November 30, 2024 |
| |
| International Growth Fund |
| Investor Class (TWIEX) |
| I Class (TGRIX) |
| Y Class (ATYGX) |
| A Class (TWGAX) |
| C Class (AIWCX) |
| R Class (ATGRX) |
| R5 Class (ATGGX) |
| R6 Class (ATGDX) |
| G Class (ACAEX) |
| | | | | |
| Schedule of Investments | |
| Statement of Assets and Liabilities | |
| Statement of Operations | |
| Statement of Changes in Net Assets | |
| Notes to Financial Statements | |
| Financial Highlights | |
| Report of Independent Registered Public Accounting Firm | |
| Approval of Management Agreement | |
| |
| Other Tax Information | |
NOVEMBER 30, 2024
| | | | | | | | |
| Shares | Value |
| COMMON STOCKS — 97.8% | | |
| Australia — 2.8% | | |
| CSL Ltd. | 187,350 | | $ | 34,540,236 | |
James Hardie Industries PLC(1) | 421,160 | | 15,690,972 | |
NEXTDC Ltd.(1) | 2,721,978 | | 29,035,936 | |
| | 79,267,144 | |
| Belgium — 0.5% | | |
UCB SA(2) | 70,170 | | 13,760,464 | |
| Brazil — 0.4% | | |
NU Holdings Ltd., Class A(1) | 958,490 | | 12,009,880 | |
| Canada — 3.8% | | |
| Canadian Pacific Kansas City Ltd. | 259,550 | | 19,856,720 | |
Capstone Copper Corp.(1)(2) | 3,126,300 | | 21,615,359 | |
| GFL Environmental, Inc. | 324,400 | | 15,279,240 | |
| Intact Financial Corp. | 154,130 | | 29,357,414 | |
Shopify, Inc., Class A(1) | 179,180 | | 20,712,468 | |
| | 106,821,201 | |
| China — 0.9% | | |
GDS Holdings Ltd., ADR(1) | 481,386 | | 9,478,490 | |
Trip.com Group Ltd., ADR(1) | 237,560 | | 15,358,254 | |
| | 24,836,744 | |
| Denmark — 5.6% | | |
| DSV AS | 96,510 | | 20,670,171 | |
| Novo Nordisk AS, Class B | 1,135,436 | | 121,684,412 | |
| Pandora AS | 91,670 | | 14,791,389 | |
| | 157,145,972 | |
| France — 12.4% | | |
| Air Liquide SA | 369,035 | | 61,383,515 | |
| Airbus SE | 159,150 | | 24,876,054 | |
| Bureau Veritas SA | 684,840 | | 20,856,504 | |
| Dassault Systemes SE | 251,390 | | 8,677,181 | |
| EssilorLuxottica SA | 121,030 | | 29,419,180 | |
| Hermes International SCA | 11,160 | | 24,358,112 | |
| L'Oreal SA | 63,740 | | 22,178,058 | |
| LVMH Moet Hennessy Louis Vuitton SE | 45,321 | | 28,411,219 | |
| Publicis Groupe SA | 142,320 | | 15,460,203 | |
| Safran SA | 90,590 | | 21,138,647 | |
| Schneider Electric SE | 291,747 | | 75,160,115 | |
| Societe Generale SA | 683,670 | | 18,125,765 | |
| | 350,044,553 | |
| Germany — 6.9% | | |
| adidas AG | 48,870 | | 11,556,727 | |
| Infineon Technologies AG | 527,751 | | 17,203,022 | |
| SAP SE | 444,840 | | 105,634,249 | |
Siemens Energy AG(1) | 508,080 | | 27,564,416 | |
| Symrise AG | 301,290 | | 33,329,114 | |
| | 195,287,528 | |
| Hong Kong — 2.5% | | |
| AIA Group Ltd. | 2,695,400 | | 20,295,271 | |
| Hong Kong Exchanges & Clearing Ltd. | 355,400 | | 13,379,450 | |
| | | | | | | | |
| Shares | Value |
| Techtronic Industries Co. Ltd. | 2,687,500 | | $ | 38,251,482 | |
| | 71,926,203 | |
| India — 0.5% | | |
MakeMyTrip Ltd.(1) | 131,200 | | 15,053,888 | |
| Indonesia — 0.7% | | |
| Bank Central Asia Tbk. PT | 31,296,400 | | 19,762,516 | |
| Ireland — 1.4% | | |
| Bank of Ireland Group PLC | 1,439,170 | | 12,616,576 | |
| Kerry Group PLC, A Shares | 283,380 | | 27,413,103 | |
| | 40,029,679 | |
| Israel — 0.6% | | |
Global-e Online Ltd.(1) | 309,350 | | 16,172,818 | |
| Italy — 3.9% | | |
Davide Campari-Milano NV(2) | 1,702,351 | | 10,216,468 | |
Ferrari NV(2) | 109,950 | | 47,897,163 | |
Prysmian SpA(2) | 435,450 | | 28,723,057 | |
Saipem SpA(1) | 9,104,460 | | 23,496,618 | |
| | 110,333,306 | |
| Japan — 20.9% | | |
| Advantest Corp. | 315,400 | | 17,466,964 | |
| Asics Corp. | 647,700 | | 13,085,721 | |
Denso Corp.(2) | 716,100 | | 10,252,159 | |
Disco Corp.(2) | 43,200 | | 11,805,054 | |
| Fast Retailing Co. Ltd. | 97,900 | | 33,547,575 | |
| Fujikura Ltd. | 239,100 | | 8,538,957 | |
| Hirose Electric Co. Ltd. | 67,700 | | 8,157,532 | |
| Hitachi Ltd. | 2,767,800 | | 69,750,866 | |
| Hoya Corp. | 239,300 | | 30,935,246 | |
| Keyence Corp. | 118,300 | | 51,329,524 | |
Kobe Bussan Co. Ltd.(2) | 933,200 | | 23,567,523 | |
| Mitsubishi Heavy Industries Ltd. | 2,398,900 | | 35,318,635 | |
MonotaRO Co. Ltd.(2) | 1,308,600 | | 23,379,904 | |
| NEC Corp. | 332,000 | | 28,385,457 | |
| NTT Data Group Corp. | 1,503,500 | | 29,214,598 | |
| Obic Co. Ltd. | 494,000 | | 16,225,621 | |
| Pan Pacific International Holdings Corp. | 360,800 | | 9,190,721 | |
| Recruit Holdings Co. Ltd. | 458,500 | | 31,892,192 | |
Shin-Etsu Chemical Co. Ltd.(2) | 615,800 | | 22,851,328 | |
| Sumitomo Mitsui Financial Group, Inc. | 1,932,200 | | 47,688,270 | |
Terumo Corp.(2) | 1,931,100 | | 39,442,656 | |
| Tokio Marine Holdings, Inc. | 796,700 | | 29,707,827 | |
| | 591,734,330 | |
| Netherlands — 5.2% | | |
Adyen NV(1) | 21,210 | | 30,871,414 | |
| ASML Holding NV | 107,350 | | 73,353,151 | |
| DSM-Firmenich AG | 253,249 | | 27,817,844 | |
| Heineken NV | 204,750 | | 15,155,616 | |
| | 147,198,025 | |
| Spain — 1.6% | | |
| Cellnex Telecom SA | 422,930 | | 15,198,184 | |
| Iberdrola SA | 2,210,602 | | 31,522,301 | |
| | 46,720,485 | |
| Sweden — 0.4% | | |
Hexagon AB, B Shares(2) | 1,289,350 | | 10,992,062 | |
| | | | | | | | |
| Shares | Value |
| Switzerland — 5.8% | | |
| Cie Financiere Richemont SA, Class A | 192,760 | | $ | 26,963,581 | |
Galderma Group AG(1) | 213,205 | | 21,858,013 | |
| Lonza Group AG | 55,890 | | 33,511,814 | |
On Holding AG, Class A(1) | 720,570 | | 42,030,848 | |
Partners Group Holding AG(2) | 11,390 | | 16,552,849 | |
| Zurich Insurance Group AG | 34,260 | | 21,745,303 | |
| | 162,662,408 | |
| Taiwan — 1.2% | | |
| Taiwan Semiconductor Manufacturing Co. Ltd. | 1,098,000 | | 34,214,279 | |
| United Kingdom — 18.4% | | |
| Ashtead Group PLC | 338,370 | | 27,118,977 | |
| AstraZeneca PLC | 611,610 | | 82,778,073 | |
| BAE Systems PLC | 1,651,590 | | 25,814,153 | |
| Barclays PLC | 17,240,510 | | 57,790,222 | |
| BP PLC | 4,000,320 | | 19,589,751 | |
| Compass Group PLC | 1,123,830 | | 38,506,614 | |
| Experian PLC | 434,720 | | 20,781,248 | |
| Haleon PLC | 6,959,541 | | 33,197,830 | |
| London Stock Exchange Group PLC | 491,705 | | 70,470,537 | |
| National Grid PLC | 2,217,800 | | 27,994,524 | |
| RELX PLC | 1,016,830 | | 47,937,548 | |
| Segro PLC | 1,970,171 | | 19,545,454 | |
| Unilever PLC | 820,880 | | 49,155,868 | |
| | 520,680,799 | |
| United States — 1.4% | | |
| CRH PLC | 383,210 | | 39,190,887 | |
TOTAL COMMON STOCKS (Cost $2,017,481,636) | | 2,765,845,171 | |
| SHORT-TERM INVESTMENTS — 3.2% | | |
| Money Market Funds — 1.3% | | |
State Street Navigator Securities Lending Government Money Market Portfolio(3) | 36,258,830 | | 36,258,830 | |
| Repurchase Agreements — 1.9% | | |
| BMO Capital Markets Corp., (collateralized by various U.S. Treasury obligations, 3.625%, 2/15/44, valued at $4,982,367), in a joint trading account at 4.56%, dated 11/29/24, due 12/2/24 (Delivery value $4,894,962) | | 4,893,103 | |
| Fixed Income Clearing Corp., (collateralized by various U.S. Treasury obligations, 3.625%, 5/15/26, valued at $49,430,273), at 4.57%, dated 11/29/24, due 12/2/24 (Delivery value $48,479,456) | | 48,461,000 | |
| | 53,354,103 | |
TOTAL SHORT-TERM INVESTMENTS (Cost $89,612,933) | | 89,612,933 | |
TOTAL INVESTMENT SECURITIES — 101.0% (Cost $2,107,094,569) | | 2,855,458,104 | |
| OTHER ASSETS AND LIABILITIES — (1.0)% | | (27,671,545) | |
| TOTAL NET ASSETS — 100.0% | | $ | 2,827,786,559 | |
| | | | | |
| MARKET SECTOR DIVERSIFICATION | |
| (as a % of net assets) | |
| Industrials | 20.6% |
| Information Technology | 16.7% |
| Health Care | 14.4% |
| Financials | 14.2% |
| Consumer Discretionary | 12.3% |
| Materials | 7.8% |
| Consumer Staples | 6.4% |
| Utilities | 2.1% |
| Energy | 1.5% |
| Communication Services | 1.1% |
| Real Estate | 0.7% |
| Short-Term Investments | 3.2% |
| Other Assets and Liabilities | (1.0)% |
| | | | | | | | |
| NOTES TO SCHEDULE OF INVESTMENTS |
| ADR | – | American Depositary Receipt |
(1)Non-income producing.
(2)Security, or a portion thereof, is on loan. At the period end, the aggregate value of securities on loan was $38,842,384. The amount of securities on loan indicated may not correspond with the securities on loan identified because securities with pending sales are in the process of recall from the brokers.
(3)Investment of cash collateral from securities on loan. At the period end, the aggregate value of the collateral held by the fund was $40,864,267, which includes securities collateral of $4,605,437.
See Notes to Financial Statements.
| | |
| Statement of Assets and Liabilities |
| | | | | |
| NOVEMBER 30, 2024 | |
| Assets | |
| Investment securities, at value (cost of $2,070,835,739) — including $38,842,384 of securities on loan | $ | 2,819,199,274 | |
| Investment made with cash collateral received for securities on loan, at value (cost of $36,258,830) | 36,258,830 | |
| Total investment securities, at value (cost of $2,107,094,569) | 2,855,458,104 | |
| Cash | 206,453 | |
| Foreign currency holdings, at value (cost of $63,491) | 65,562 | |
| Receivable for investments sold | 28,757,514 | |
| Receivable for capital shares sold | 301,516 | |
| Dividends and interest receivable | 10,694,255 | |
| Securities lending receivable | 6,098 | |
| Other assets | 66,654 | |
| 2,895,556,156 | |
| |
| Liabilities | |
| Payable for collateral received for securities on loan | 36,258,830 | |
| Payable for investments purchased | 26,261,366 | |
| Payable for capital shares redeemed | 390,928 | |
| Accrued management fees | 1,175,523 | |
| Distribution and service fees payable | 14,081 | |
| Accrued IRS compliance fees | 3,651,031 | |
| Accrued other expenses | 17,838 | |
| 67,769,597 | |
| |
| Net Assets | $ | 2,827,786,559 | |
| |
| Net Assets Consist of: | |
| Capital (par value and paid-in surplus) | $ | 2,232,778,089 | |
| Distributable earnings (loss) | 595,008,470 | |
| $ | 2,827,786,559 | |
| | | | | | | | | | | |
| Net Assets | Shares Outstanding | Net Asset Value Per Share* |
| Investor Class, $0.01 Par Value | $840,891,050 | 65,872,227 | $12.77 |
| I Class, $0.01 Par Value | $306,768,123 | 24,197,641 | $12.68 |
| Y Class, $0.01 Par Value | $54,627,019 | 4,298,993 | $12.71 |
| A Class, $0.01 Par Value | $53,978,443 | 4,214,009 | $12.81 |
| C Class, $0.01 Par Value | $315,741 | 26,654 | $11.85 |
| R Class, $0.01 Par Value | $7,159,886 | 556,460 | $12.87 |
| R5 Class, $0.01 Par Value | $8,085 | 637 | $12.69 |
| R6 Class, $0.01 Par Value | $27,305,682 | 2,151,090 | $12.69 |
| G Class, $0.01 Par Value | $1,536,732,530 | 119,141,864 | $12.90 |
*Maximum offering price per share was equal to the net asset value per share for all share classes, except A Class, for which the maximum offering price per share was $13.59 (net asset value divided by 0.9425). A contingent deferred sales charge may be imposed on redemptions of A Class and C Class.
See Notes to Financial Statements.
| | | | | |
| YEAR ENDED NOVEMBER 30, 2024 | |
| Investment Income (Loss) | |
| Income: | |
| Dividends (net of foreign taxes withheld of $3,924,306) | $ | 43,694,625 | |
| Interest | 1,366,849 | |
| Securities lending, net | 119,797 | |
| 45,181,271 | |
| |
| Expenses: | |
| Management fees | 28,773,301 | |
| Distribution and service fees: | |
| A Class | 155,238 | |
| C Class | 3,880 | |
| R Class | 37,458 | |
| Directors' fees and expenses | 85,492 | |
| Other expenses | 393,752 | |
| 29,449,121 | |
| Fees waived - G Class | (13,509,849) | |
| 15,939,272 | |
| |
| Net investment income (loss) | 29,241,999 | |
| |
| Realized and Unrealized Gain (Loss) | |
| Net realized gain (loss) on: | |
| Investment transactions (net of foreign tax expenses paid (refunded) of $574,855) | 69,286,003 | |
| Foreign currency translation transactions | 45,837 | |
| 69,331,840 | |
| |
| Change in net unrealized appreciation (depreciation) on: | |
| Investments (includes (increase) decrease in accrued foreign taxes of $660,448) | 227,185,805 | |
| Translation of assets and liabilities in foreign currencies | (252,590) | |
| 226,933,215 | |
| |
| Net realized and unrealized gain (loss) | 296,265,055 | |
| |
| Net Increase (Decrease) in Net Assets Resulting from Operations | $ | 325,507,054 | |
See Notes to Financial Statements.
| | |
| Statement of Changes in Net Assets |
| | | | | | | | |
| YEARS ENDED NOVEMBER 30, 2024 AND NOVEMBER 30, 2023 |
| Increase (Decrease) in Net Assets | November 30, 2024 | November 30, 2023 |
| Operations | | |
| Net investment income (loss) | $ | 29,241,999 | | $ | 31,340,690 | |
| Net realized gain (loss) | 69,331,840 | | (99,172,745) | |
| Change in net unrealized appreciation (depreciation) | 226,933,215 | | 188,671,789 | |
| Net increase (decrease) in net assets resulting from operations | 325,507,054 | | 120,839,734 | |
| | |
| Distributions to Shareholders | | |
| From earnings: | | |
| Investor Class | (4,397,930) | | — | |
| I Class | (2,048,613) | | — | |
| Y Class | (466,755) | | — | |
| A Class | (161,260) | | — | |
| R5 Class | (55) | | — | |
| R6 Class | (199,461) | | — | |
| G Class | (26,731,358) | | — | |
| Decrease in net assets from distributions | (34,005,432) | | — | |
| | |
| Capital Share Transactions | | |
| Net increase (decrease) in net assets from capital share transactions (Note 5) | (228,792,849) | | (22,208,949) | |
| | |
| Net increase (decrease) in net assets | 62,708,773 | | 98,630,785 | |
| | |
| Net Assets | | |
| Beginning of period | 2,765,077,786 | | 2,666,447,001 | |
| End of period | $ | 2,827,786,559 | | $ | 2,765,077,786 | |
See Notes to Financial Statements.
| | |
| Notes to Financial Statements |
NOVEMBER 30, 2024
1. Organization
American Century World Mutual Funds, Inc. (the corporation) is registered under the Investment Company Act of 1940, as amended (the 1940 Act), as an open-end management investment company and is organized as a Maryland corporation. International Growth Fund (the fund) is one fund in a series issued by the corporation. The fund's investment objective is to seek capital growth.
The fund offers the Investor Class, I Class, Y Class, A Class, C Class, R Class, R5 Class, R6 Class and G Class. The A Class may incur an initial sales charge. The A Class and C Class may be subject to a contingent deferred sales charge.
2. Significant Accounting Policies
The following is a summary of significant accounting policies consistently followed by the fund in preparation of its financial statements. The fund is an investment company and follows accounting and reporting guidance in accordance with accounting principles generally accepted in the United States of America. This may require management to make certain estimates and assumptions at the date of the financial statements. Actual results could differ from these estimates. Management evaluated the impact of events or transactions occurring through the date the financial statements were issued that would merit recognition or disclosure.
Investment Valuations — The fund determines the fair value of its investments and computes its net asset value (NAV) per share at the close of regular trading (usually 4 p.m. Eastern time) on the New York Stock Exchange (NYSE) on each day the NYSE is open. The value of investments of the fund is determined by American Century Investment Management, Inc. (ACIM) (the investment advisor), as the valuation designee, pursuant to its valuation policies and procedures. The Board of Directors oversees the valuation designee and reviews its valuation policies and procedures at least annually.
Equity securities that are listed or traded on a domestic securities exchange are valued at the last reported sales price or at the official closing price as provided by the exchange. Equity securities traded on foreign securities exchanges are generally valued at the closing price of such securities on the exchange where primarily traded or at the close of the NYSE, if that is earlier. If no last sales price is reported, or if local convention or regulation so provides, the mean of the latest bid and asked prices may be used. Securities traded over-the-counter are valued at the mean of the latest bid and asked prices, the last sales price, or the official closing price.
Open-end management investment companies are valued at the reported NAV per share. Repurchase agreements are valued at cost, which approximates fair value.
If the valuation designee determines that the market price for a portfolio security is not readily available or is believed by the valuation designee to be unreliable, such security is valued at fair value as determined in good faith by the valuation designee, in accordance with its policies and procedures. Circumstances that may cause the fund to determine that market quotations are not available or reliable include, but are not limited to: when there is a significant event subsequent to the market quotation; trading in a security has been halted during the trading day; or trading in a security is insufficient or did not take place due to a closure or holiday.
The valuation designee monitors for significant events occurring after the close of an investment’s primary exchange but before the fund’s NAV per share is determined. Significant events may include, but are not limited to: corporate announcements and transactions; regulatory news, governmental action and political unrest that could impact a specific investment or an investment sector; or armed conflicts, natural disasters and similar events that could affect investments in a specific country or region. The valuation designee also monitors for significant fluctuations between domestic and foreign markets, as evidenced by the U.S. market or such other indicators that it deems appropriate. The valuation designee may apply a model-derived factor to the closing price of equity securities traded on foreign securities exchanges. The factor is based on observable market data as provided by an independent pricing service.
Foreign Currency Translations — All assets and liabilities, including investment securities and other financial instruments, initially expressed in foreign currencies are translated into U.S. dollars each day at the mean of the appropriate currency exchange rate at the close of the NYSE as provided by an independent pricing service. The fund may enter into spot foreign currency exchange contracts to facilitate transactions denominated in a foreign currency. Purchases and sales of investment securities, dividend and interest income, spot foreign currency exchange contracts, and expenses are translated at the rates of exchange prevailing on the respective dates of such transactions. Net realized and unrealized foreign currency exchange gains or losses related to investment securities are a component of net realized gain (loss) on investment transactions and change in net unrealized appreciation (depreciation) on investments, respectively.
Security Transactions — Security transactions are accounted for as of the trade date. Net realized gains and losses are determined on the identified cost basis, which is also used for federal income tax purposes. Certain countries impose taxes on realized gains on the sale of securities registered in their country. The fund records the foreign tax expense, if any, on an accrual basis. The foreign tax expense on realized gains and unrealized appreciation reduces the net realized gain (loss) on investment transactions and net unrealized appreciation (depreciation) on investments, respectively.
Investment Income — Dividend income less foreign taxes withheld, if any, is recorded as of the ex-dividend date. Distributions received on securities that represent a return of capital or long-term capital gain are recorded as a reduction of cost of investments and/or as a realized gain. The fund may estimate the components of distributions received that may be considered nontaxable distributions or long-term capital gain distributions for income tax purposes. Interest income is recorded on the accrual basis and includes accretion of discounts and amortization of premiums. Securities lending income is net of fees and rebates earned by the lending agent for its services.
Repurchase Agreements — The fund may enter into repurchase agreements with institutions that ACIM has determined are creditworthy pursuant to criteria adopted by the Board of Directors. The fund requires that the collateral, represented by securities, received in a repurchase transaction be transferred to the custodian in a manner sufficient to enable the fund to obtain those securities in the event of a default under the repurchase agreement. ACIM monitors, on a daily basis, the securities transferred to ensure the value, including accrued interest, of the securities under each repurchase agreement is equal to or greater than amounts owed to the fund under each repurchase agreement.
Joint Trading Account — Pursuant to an Exemptive Order issued by the Securities and Exchange Commission, the fund, along with certain other funds in the American Century Investments family of funds, may transfer uninvested cash balances into a joint trading account. These balances are invested in one or more repurchase agreements that are collateralized by U.S. Treasury or Agency obligations.
Income Tax Status — It is the fund's policy to distribute substantially all net investment income and net realized gains to shareholders and to otherwise qualify as a regulated investment company under provisions of the Internal Revenue Code. Accordingly, no provision has been made for income taxes. The fund files U.S. federal, state, local and non-U.S. tax returns as applicable. The fund's tax returns are subject to examination by the relevant taxing authority until expiration of the applicable statute of limitations, which is generally three years from the date of filing but can be longer in certain jurisdictions. At this time, management believes there are no uncertain tax positions which, based on their technical merit, would not be sustained upon examination and for which it is reasonably possible that the total amounts of unrecognized tax benefits will significantly change in the next twelve months.
Multiple Class — All shares of the fund represent an equal pro rata interest in the net assets of the class to which such shares belong, and have identical voting, dividend, liquidation and other rights and the same terms and conditions, except for class specific expenses and exclusive rights to vote on matters affecting only individual classes. Income, non-class specific expenses, and realized and unrealized capital gains and losses of the fund are allocated to each class of shares based on their relative net assets.
Distributions to Shareholders — Distributions from net investment income and net realized gains, if any, are generally declared and paid annually. The fund may make distributions on a more frequent basis to comply with the distribution requirements of the Internal Revenue Code, in all events in a manner consistent with provisions of the 1940 Act.
Indemnifications — Under the corporation’s organizational documents, its officers and directors are indemnified against certain liabilities arising out of the performance of their duties to the fund. In addition, in the normal course of business, the fund enters into contracts that provide general indemnifications. The maximum exposure under these arrangements is unknown as this would involve future claims that may be made against a fund. The risk of material loss from such claims is considered by management to be remote.
Securities Lending — Securities are lent to qualified financial institutions and brokers. State Street Bank & Trust Co. serves as securities lending agent to the fund pursuant to a Securities Lending Agreement. The lending of securities exposes the fund to risks such as: the borrowers may fail to return the loaned securities, the borrowers may not be able to provide additional collateral, the fund may experience delays in recovery of the loaned securities or delays in access to collateral, or the fund may experience losses related to the investment collateral. To minimize certain risks, loan counterparties pledge collateral in the form of cash and/or securities. The lending agent has agreed to indemnify the fund in the case of default of any securities borrowed. Cash collateral received is invested in the State Street Navigator Securities Lending Government Money Market Portfolio, a money market mutual fund registered under the 1940 Act. The loans may also be secured by U.S. government securities in an amount at least equal to the market value of the securities loaned, plus accrued interest and dividends, determined on a daily basis and adjusted accordingly. By lending securities, the fund seeks to increase its net investment income through the receipt of interest and fees. Such income is reflected separately within the Statement of Operations. The value of loaned securities and related collateral outstanding at period end, if any, are shown on a gross basis within the Schedule of Investments and Statement of Assets and Liabilities.
The following table reflects a breakdown of transactions accounted for as secured borrowings, the gross obligation by the type of collateral pledged, and the remaining contractual maturity of those transactions as of November 30, 2024.
| | | | | | | | | | | | | | | | | |
| Remaining Contractual Maturity of Agreements |
| Overnight and
Continuous | <30 days | Between 30 & 90 days | >90 days | Total |
Securities Lending Transactions(1) | | | | | |
| Common Stocks | $ | 36,258,830 | | — | | — | | — | | $ | 36,258,830 | |
| Gross amount of recognized liabilities for securities lending transactions | $ | 36,258,830 | |
(1)Amount represents the payable for cash collateral received for securities on loan. This will generally be in the Overnight and Continuous column as the securities are typically callable on demand.
3. Fees and Transactions with Related Parties
Certain officers and directors of the corporation are also officers and/or directors of American Century Companies, Inc. (ACC). The corporation's investment advisor, ACIM, the corporation's distributor, American Century Investment Services, Inc. (ACIS), and the corporation's transfer agent, American Century Services, LLC, are wholly owned, directly or indirectly, by ACC. Various funds issued by American Century Asset Allocation Portfolios, Inc. own, in aggregate, 33% of the shares of the fund. Related parties do not invest in the fund for the purpose of exercising management or control.
Management Fees — The corporation has entered into a management agreement with ACIM, under which ACIM provides the fund with investment advisory and management services in exchange for a single, unified management fee (the fee) per class. The agreement provides that ACIM will pay all expenses of managing and operating the fund, except brokerage expenses, taxes, interest, fees and expenses of the independent directors (including legal counsel fees), extraordinary expenses, and expenses incurred in connection with the provision of shareholder services and distribution services under a plan adopted pursuant to Rule 12b-1 under the 1940 Act. The fee is computed and accrued daily based on each class's daily net assets and paid monthly in arrears. The difference in the fee among the classes is a result of their separate arrangements for non-Rule 12b-1 shareholder services. It is not the result of any difference in advisory or custodial fees or other expenses related to the management of the fund's assets, which do not vary by class. The rate of the fee is determined by applying a fee rate calculation formula. This formula takes into account the fund's assets as well as certain assets, if any, of other clients of the investment advisor outside the American Century Investments family of funds (such as subadvised funds and separate accounts), as well as exchange-traded funds managed by the investment advisor, that use very similar investment teams and strategies (strategy assets). The investment advisor agreed to waive the G Class's management fee in its entirety. The investment advisor expects this waiver to remain in effect permanently and cannot terminate it without the approval of the Board of Directors.
The management fee schedule range and the effective annual management fee for each class for the period ended November 30, 2024 are as follows:
| | | | | | | | |
| Management Fee
Schedule Range* | Effective Annual Management Fee |
| Investor Class | 1.050% to 1.400% | 1.22% |
| I Class | 0.850% to 1.200% | 1.02% |
| Y Class | 0.700% to 1.050% | 0.87% |
| A Class | 1.050% to 1.400% | 1.22% |
| C Class | 1.050% to 1.400% | 1.22% |
| R Class | 1.050% to 1.400% | 1.22% |
| R5 Class | 0.850% to 1.200% | 1.02% |
| R6 Class | 0.700% to 1.050% | 0.87% |
| G Class | 0.700% to 1.050% | 0.00%(1) |
*Prior to August 1, 2024, the management fee schedule range was 1.050% to 1.500% for Investor Class, A Class, C Class and R Class and 0.850% to 1.300% for I Class and R5 Class and 0.700% to 1.150% for Y Class, R6 Class and G Class.
(1)Effective annual management fee before waiver was 0.87%.
Distribution and Service Fees — The Board of Directors has adopted a separate Master Distribution and Individual Shareholder Services Plan for each of the A Class, C Class and R Class (collectively the plans), pursuant to Rule 12b-1 of the 1940 Act. The plans provide that the A Class will pay ACIS an annual distribution and service fee of 0.25%. The plans provide that the C Class will pay ACIS an annual distribution and service fee of 1.00%, of which 0.25% is paid for individual shareholder services and 0.75% is paid for distribution services. The plans provide that the R Class will pay ACIS an annual distribution and service fee of 0.50%. The fees are computed and accrued daily based on each class’s daily net assets and paid monthly in arrears. The fees are used to pay financial intermediaries for distribution and individual shareholder services. Fees incurred under the plans during the period ended November 30, 2024 are detailed in the Statement of Operations.
Directors' Fees and Expenses — The Board of Directors is responsible for overseeing the investment advisor’s management and operations of the fund. The directors receive detailed information about the fund and its investment advisor regularly throughout the year, and meet at least quarterly with management of the investment advisor to review reports about fund operations. The fund's officers do not receive compensation from the fund.
Other Expenses — A fund’s other expenses may include interest charges, clearing exchange fees, proxy solicitation expenses, fees associated with the recovery of foreign tax reclaims and other miscellaneous expenses.
Interfund Transactions — The fund may enter into security transactions with other American Century Investments funds and other client accounts of the investment advisor, in accordance with the 1940 Act rules and procedures adopted by the Board of Directors. The rules and procedures require, among other things, that these transactions be effected at the independent current market price of the security. During the period, the interfund sales were $342,101 and there were no interfund purchases. The effect of interfund transactions on the Statement of Operations was $(81,291) in net realized gain (loss) on investment transactions.
4. Investment Transactions
Purchases and sales of investment securities, excluding short-term investments, for the period ended November 30, 2024 were $1,581,979,758 and $1,862,793,681, respectively.
5. Capital Share Transactions
Transactions in shares of the fund were as follows:
| | | | | | | | | | | | | | |
| Year ended November 30, 2024 | Year ended November 30, 2023 |
| Shares | Amount | Shares | Amount |
| Investor Class/Shares Authorized | 1,250,000,000 | | | 1,250,000,000 | | |
| Sold | 993,273 | | $ | 12,400,565 | | 5,034,273 | | $ | 57,254,810 | |
| Issued in reinvestment of distributions | 330,978 | | 4,233,210 | | — | | — | |
| Redeemed | (9,907,077) | | (124,406,068) | | (10,453,580) | | (121,780,199) | |
| (8,582,826) | | (107,772,293) | | (5,419,307) | | (64,525,389) | |
| I Class/Shares Authorized | 300,000,000 | | | 300,000,000 | | |
| Sold | 2,227,113 | | 27,787,944 | | 1,981,790 | | 22,596,027 | |
| Issued in reinvestment of distributions | 160,661 | | 2,038,788 | | — | | — | |
| Redeemed | (1,891,670) | | (23,741,631) | | (2,854,292) | | (32,440,009) | |
| 496,104 | | 6,085,101 | | (872,502) | | (9,843,982) | |
| Y Class/Shares Authorized | 40,000,000 | | | 40,000,000 | | |
| Sold | 2,196,873 | | 28,462,476 | | 903,775 | | 10,364,996 | |
| Issued in reinvestment of distributions | 36,752 | | 466,755 | | — | | — | |
| Redeemed | (2,246,298) | | (28,158,363) | | (1,209,253) | | (14,166,235) | |
| (12,673) | | 770,868 | | (305,478) | | (3,801,239) | |
| A Class/Shares Authorized | 80,000,000 | | | 80,000,000 | | |
| Sold | 269,029 | | 3,373,466 | | 422,314 | | 4,870,116 | |
| Issued in reinvestment of distributions | 12,422 | | 159,746 | | — | | — | |
| Redeemed | (1,676,176) | | (21,177,794) | | (799,056) | | (9,293,280) | |
| (1,394,725) | | (17,644,582) | | (376,742) | | (4,423,164) | |
| C Class/Shares Authorized | 20,000,000 | | | 20,000,000 | | |
| Sold | 1,019 | | 11,877 | | 1,057 | | 11,435 | |
| Redeemed | (11,159) | | (133,066) | | (35,891) | | (391,329) | |
| (10,140) | | (121,189) | | (34,834) | | (379,894) | |
| R Class/Shares Authorized | 25,000,000 | | | 25,000,000 | | |
| Sold | 86,450 | | 1,087,938 | | 179,185 | | 2,093,889 | |
| Redeemed | (130,294) | | (1,634,442) | | (155,230) | | (1,749,459) | |
| (43,844) | | (546,504) | | 23,955 | | 344,430 | |
| R5 Class/Shares Authorized | 20,000,000 | | | 20,000,000 | | |
| Issued in reinvestment of distributions | 4 | | 55 | | — | | — | |
| R6 Class/Shares Authorized | 45,000,000 | | | 45,000,000 | | |
| Sold | 818,397 | | 10,238,232 | | 864,536 | | 9,867,063 | |
| Issued in reinvestment of distributions | 15,560 | | 197,451 | | — | | — | |
| Redeemed | (660,849) | | (8,252,709) | | (1,356,933) | | (15,642,883) | |
| 173,108 | | 2,182,974 | | (492,397) | | (5,775,820) | |
| G Class/Shares Authorized | 1,500,000,000 | | | 1,500,000,000 | | |
| Sold | 14,228,789 | | 179,231,906 | | 23,293,156 | | 268,627,206 | |
| Issued in reinvestment of distributions | 2,085,129 | | 26,731,354 | | — | | — | |
| Redeemed | (24,977,429) | | (317,710,539) | | (17,441,413) | | (202,431,097) | |
| (8,663,511) | | (111,747,279) | | 5,851,743 | | 66,196,109 | |
| Net increase (decrease) | (18,038,503) | | $ | (228,792,849) | | (1,625,562) | | $ | (22,208,949) | |
6. Fair Value Measurements
The fund's investments valuation process is based on several considerations and may use multiple inputs to determine the fair value of the investments held by the fund. In conformity with accounting principles generally accepted in the United States of America, the inputs used to determine a valuation are classified into three broad levels.
•Level 1 valuation inputs consist of unadjusted quoted prices in an active market for identical investments.
•Level 2 valuation inputs consist of direct or indirect observable market data (including quoted prices for comparable investments, evaluations of subsequent market events, interest rates, prepayment speeds, credit risk, etc.). These inputs also consist of quoted prices for identical investments initially expressed in local currencies that are adjusted through translation into U.S. dollars.
•Level 3 valuation inputs consist of unobservable data (including a fund’s own assumptions).
The level classification is based on the lowest level input that is significant to the fair valuation measurement. The valuation inputs are not necessarily an indication of the risks associated with investing in these securities or other financial instruments.
The following is a summary of the level classifications as of period end. The Schedule of Investments provides additional information on the fund's portfolio holdings.
| | | | | | | | | | | |
| Level 1 | Level 2 | Level 3 |
| Assets | | | |
| Investment Securities | | | |
| Common Stocks | | | |
| Brazil | $ | 12,009,880 | | — | | — | |
| Canada | 15,279,240 | | $ | 91,541,961 | | — | |
| China | 24,836,744 | | — | | — | |
| India | 15,053,888 | | — | | — | |
| Israel | 16,172,818 | | — | | — | |
| Switzerland | 42,030,848 | | 120,631,560 | | — | |
| United States | 39,190,887 | | — | | — | |
| Other Countries | — | | 2,389,097,345 | | — | |
| Short-Term Investments | 36,258,830 | | 53,354,103 | | — | |
| $ | 200,833,135 | | $ | 2,654,624,969 | | — | |
7. Risk Factors
The value of the fund’s shares will go up and down, sometimes rapidly or unpredictably, based on the performance of the securities owned by the fund and other factors generally affecting the securities market. Market risks, including political, regulatory, economic and social developments, can affect the value of the fund’s investments. Natural disasters, public health emergencies, war, terrorism and other unforeseeable events may lead to increased market volatility and may have adverse long-term effects on world economies and markets generally.
There are certain risks involved in investing in foreign securities. These risks include those resulting from political events (such as civil unrest, national elections and imposition of exchange controls), social and economic events (such as labor strikes and rising inflation), and natural disasters. Securities of foreign issuers may be less liquid and more volatile. Investing in emerging markets or a significant portion of assets in one country or region may accentuate these risks.
8. Federal Tax Information
On December 17, 2024, the fund declared and paid the following per-share distributions from net investment income to shareholders of record on December 16, 2024:
| | | | | | | | | | | | | | | | | | | | | | | | | | |
| Investor Class | I Class | Y Class | A Class | C Class | R Class | R5 Class | R6 Class | G Class |
| $0.0629 | $0.0830 | $0.0981 | $0.0378 | — | $0.0127 | $0.0830 | $0.0981 | $0.1844 |
The tax character of distributions paid during the years ended November 30, 2024 and November 30, 2023 were as follows:
| | | | | | | | |
| 2024 | 2023 |
| Distributions Paid From | | |
| Ordinary income | $ | 34,005,432 | | — | |
| Long-term capital gains | — | | — | |
The book-basis character of distributions made during the year from net investment income or net realized gains may differ from their ultimate characterization for federal income tax purposes. These differences reflect the differing character of certain income items and net realized gains and losses for financial statement and tax purposes, and may result in reclassification among certain capital accounts on the financial statements.
As of period end, the federal tax cost of investments and the components of distributable earnings on a tax-basis were as follows:
| | | | | |
| Federal tax cost of investments | $ | 2,111,935,764 | |
| Gross tax appreciation of investments | $ | 795,958,189 | |
| Gross tax depreciation of investments | (52,435,849) | |
| Net tax appreciation (depreciation) of investments | 743,522,340 | |
| Net tax appreciation (depreciation) on translation of assets and liabilities in foreign currencies | (176,148) | |
| Net tax appreciation (depreciation) | $ | 743,346,192 | |
| Undistributed ordinary income | $ | 28,624,322 | |
| Accumulated short-term capital losses | $ | (176,962,044) | |
The difference between book-basis and tax-basis unrealized appreciation (depreciation) is attributable primarily to the tax deferral of losses on wash sales.
Accumulated capital losses represent net capital loss carryovers that may be used to offset future realized capital gains for federal income tax purposes. The capital loss carryovers may be carried forward for an unlimited period. Future capital loss carryover utilization in any given year may be subject to Internal Revenue Code limitations.
| | | | | | | | | | | | | | | | | | | | | | | | | | | | | | | | | | | | | | | | | | | | | | | | | | |
| For a Share Outstanding Throughout the Years Ended November 30 (except as noted) |
| Per-Share Data | | | | | | | Ratios and Supplemental Data | |
| | Income From Investment Operations*: | Distributions From: | | | Ratio to Average Net Assets of†: | | |
| Net Asset Value, Beginning of Period | Net Investment Income (Loss)(1) | Net
Realized
and
Unrealized
Gain (Loss) | Total From
Investment
Operations | Net
Investment
Income | Net
Realized
Gains | Tax
Return
of
Capital | Total
Distributions | Net Asset
Value,
End
of Period | Total Return(2) | Operating
Expenses | Operating
Expenses
(before
expense
waiver) | Net
Investment
Income
(Loss) | Net
Investment
Income
(Loss)
(before
expense
waiver) | Portfolio
Turnover
Rate | Net
Assets,
End of
Period
(in
thousands) |
| Investor Class | | | | | | | | | | | | | |
| 2024 | $11.54 | 0.04 | 1.25 | 1.29 | (0.06) | — | — | (0.06) | $12.77 | 11.19% | 1.24% | 1.24% | 0.34% | 0.34% | 56% | $840,891 | |
| 2023 | $11.13 | 0.06 | 0.35 | 0.41 | — | — | — | — | $11.54 | 3.68% | 1.26% | 1.26% | 0.48% | 0.48% | 54% | $859,014 | |
| 2022 | $16.24 | 0.14 | (3.17) | (3.03) | (0.38) | (1.67) | (0.03) | (2.08) | $11.13 | (20.99)% | 1.36% | 1.36% | 1.09% | 1.09% | 38% | $888,748 | |
| 2021 | $15.32 | 0.09 | 1.51 | 1.60 | —(3) | (0.68) | — | (0.68) | $16.24 | 10.83% | 1.21% | 1.21% | 0.56% | 0.56% | 51% | $1,163,803 | |
| 2020 | $12.35 | 0.01 | 3.01 | 3.02 | (0.01) | (0.04) | — | (0.05) | $15.32 | 24.57% | 1.18% | 1.18% | 0.06% | 0.06% | 51% | $1,243,217 | |
| I Class | | | | | | | | | | | | | |
| 2024 | $11.46 | 0.07 | 1.24 | 1.31 | (0.09) | — | — | (0.09) | $12.68 | 11.41% | 1.04% | 1.04% | 0.54% | 0.54% | 56% | $306,768 | |
| 2023 | $11.03 | 0.08 | 0.35 | 0.43 | — | — | — | — | $11.46 | 3.90% | 1.06% | 1.06% | 0.68% | 0.68% | 54% | $271,586 | |
| 2022 | $16.13 | 0.16 | (3.14) | (2.98) | (0.42) | (1.67) | (0.03) | (2.12) | $11.03 | (20.86)% | 1.16% | 1.16% | 1.29% | 1.29% | 38% | $271,018 | |
| 2021 | $15.22 | 0.14 | 1.48 | 1.62 | (0.03) | (0.68) | — | (0.71) | $16.13 | 11.07% | 1.01% | 1.01% | 0.76% | 0.76% | 51% | $265,248 | |
| 2020 | $12.27 | 0.03 | 3.00 | 3.03 | (0.04) | (0.04) | — | (0.08) | $15.22 | 24.82% | 0.98% | 0.98% | 0.26% | 0.26% | 51% | $82,222 | |
| Y Class | | | | | | | | | | | | | |
| 2024 | $11.49 | 0.09 | 1.24 | 1.33 | (0.11) | — | — | (0.11) | $12.71 | 11.54% | 0.89% | 0.89% | 0.69% | 0.69% | 56% | $54,627 | |
| 2023 | $11.04 | 0.10 | 0.35 | 0.45 | — | — | — | — | $11.49 | 4.08% | 0.91% | 0.91% | 0.83% | 0.83% | 54% | $49,523 | |
| 2022 | $16.15 | 0.16 | (3.12) | (2.96) | (0.45) | (1.67) | (0.03) | (2.15) | $11.04 | (20.73)% | 1.01% | 1.01% | 1.44% | 1.44% | 38% | $50,967 | |
| 2021 | $15.24 | 0.16 | 1.49 | 1.65 | (0.06) | (0.68) | — | (0.74) | $16.15 | 11.23% | 0.86% | 0.86% | 0.91% | 0.91% | 51% | $47,542 | |
| 2020 | $12.29 | 0.05 | 2.99 | 3.04 | (0.05) | (0.04) | — | (0.09) | $15.24 | 24.97% | 0.83% | 0.83% | 0.41% | 0.41% | 51% | $29,299 | |
| A Class | | | | | | | | | | | | | | |
| 2024 | $11.58 | 0.01 | 1.25 | 1.26 | (0.03) | — | — | (0.03) | $12.81 | 10.87% | 1.49% | 1.49% | 0.09% | 0.09% | 56% | $53,978 | |
| 2023 | $11.19 | 0.03 | 0.36 | 0.39 | — | — | — | — | $11.58 | 3.49% | 1.51% | 1.51% | 0.23% | 0.23% | 54% | $64,930 | |
| 2022 | $16.31 | 0.11 | (3.19) | (3.08) | (0.34) | (1.67) | (0.03) | (2.04) | $11.19 | (21.24)% | 1.61% | 1.61% | 0.84% | 0.84% | 38% | $66,993 | |
| 2021 | $15.42 | 0.05 | 1.52 | 1.57 | — | (0.68) | — | (0.68) | $16.31 | 10.53% | 1.46% | 1.46% | 0.31% | 0.31% | 51% | $87,967 | |
| 2020 | $12.45 | (0.02) | 3.03 | 3.01 | — | (0.04) | — | (0.04) | $15.42 | 24.27% | 1.43% | 1.43% | (0.19)% | (0.19)% | 51% | $81,088 | |
| C Class | | | | | | | | | | | | | | |
| 2024 | $10.76 | (0.08) | 1.17 | 1.09 | — | — | — | — | $11.85 | 10.13% | 2.24% | 2.24% | (0.66)% | (0.66)% | 56% | $316 | |
| 2023 | $10.48 | (0.05) | 0.33 | 0.28 | — | — | — | — | $10.76 | 2.67% | 2.26% | 2.26% | (0.52)% | (0.52)% | 54% | $396 | |
| 2022 | $15.41 | 0.03 | (3.02) | (2.99) | (0.24) | (1.67) | (0.03) | (1.94) | $10.48 | (21.81)% | 2.36% | 2.36% | 0.09% | 0.09% | 38% | $751 | |
| 2021 | $14.71 | (0.08) | 1.46 | 1.38 | — | (0.68) | — | (0.68) | $15.41 | 9.72% | 2.21% | 2.21% | (0.44)% | (0.44)% | 51% | $1,462 | |
| 2020 | $11.97 | (0.11) | 2.89 | 2.78 | — | (0.04) | — | (0.04) | $14.71 | 23.32% | 2.18% | 2.18% | (0.94)% | (0.94)% | 51% | $1,855 | |
| | | | | | | | | | | | | | | | | | | | | | | | | | | | | | | | | | | | | | | | | | | | | | | | | | |
| For a Share Outstanding Throughout the Years Ended November 30 (except as noted) |
| Per-Share Data | | | | | | | Ratios and Supplemental Data | |
| | Income From Investment Operations*: | Distributions From: | | | Ratio to Average Net Assets of†: | | |
| Net Asset Value, Beginning of Period | Net Investment Income (Loss)(1) | Net
Realized
and
Unrealized
Gain (Loss) | Total From
Investment
Operations | Net
Investment
Income | Net
Realized
Gains | Tax
Return
of
Capital | Total
Distributions | Net Asset
Value,
End
of Period | Total Return(2) | Operating
Expenses | Operating
Expenses
(before
expense
waiver) | Net
Investment
Income
(Loss) | Net
Investment
Income
(Loss)
(before
expense
waiver) | Portfolio
Turnover
Rate | Net
Assets,
End of
Period
(in
thousands) |
| R Class | | | | | | | | | | | | | |
| 2024 | $11.63 | (0.02) | 1.26 | 1.24 | — | — | — | — | $12.87 | 10.66% | 1.74% | 1.74% | (0.16)% | (0.16)% | 56% | $7,160 | |
| 2023 | $11.27 | —(3) | 0.36 | 0.36 | — | — | — | — | $11.63 | 3.19% | 1.76% | 1.76% | (0.02)% | (0.02)% | 54% | $6,982 | |
| 2022 | $16.40 | 0.07 | (3.21) | (3.14) | (0.29) | (1.67) | (0.03) | (1.99) | $11.27 | (21.45)% | 1.86% | 1.86% | 0.59% | 0.59% | 38% | $6,498 | |
| 2021 | $15.54 | 0.01 | 1.53 | 1.54 | — | (0.68) | — | (0.68) | $16.40 | 10.25% | 1.71% | 1.71% | 0.06% | 0.06% | 51% | $7,589 | |
| 2020 | $12.58 | (0.06) | 3.06 | 3.00 | — | (0.04) | — | (0.04) | $15.54 | 24.04% | 1.68% | 1.68% | (0.44)% | (0.44)% | 51% | $6,701 | |
| R5 Class | | | | | | | | | | | | | | | |
| 2024 | $11.47 | 0.06 | 1.25 | 1.31 | (0.09) | — | — | (0.09) | $12.69 | 11.40% | 1.04% | 1.04% | 0.54% | 0.54% | 56% | $8 | |
| 2023 | $11.04 | 0.08 | 0.35 | 0.43 | — | — | — | — | $11.47 | 3.99% | 1.06% | 1.06% | 0.68% | 0.68% | 54% | $7 | |
| 2022 | $16.14 | 0.16 | (3.14) | (2.98) | (0.42) | (1.67) | (0.03) | (2.12) | $11.04 | (20.92)% | 1.16% | 1.16% | 1.29% | 1.29% | 38% | $7 | |
| 2021 | $15.23 | 0.11 | 1.51 | 1.62 | (0.03) | (0.68) | — | (0.71) | $16.14 | 11.06% | 1.01% | 1.01% | 0.76% | 0.76% | 51% | $9 | |
| 2020 | $12.28 | 0.03 | 3.00 | 3.03 | (0.04) | (0.04) | — | (0.08) | $15.23 | 24.80% | 0.98% | 0.98% | 0.26% | 0.26% | 51% | $11 | |
| R6 Class | | | | | | | | | | | | | | | |
| 2024 | $11.47 | 0.08 | 1.25 | 1.33 | (0.11) | — | — | (0.11) | $12.69 | 11.56% | 0.89% | 0.89% | 0.69% | 0.69% | 56% | $27,306 | |
| 2023 | $11.03 | 0.09 | 0.35 | 0.44 | — | — | — | — | $11.47 | 3.99% | 0.91% | 0.91% | 0.83% | 0.83% | 54% | $22,695 | |
| 2022 | $16.14 | 0.18 | (3.14) | (2.96) | (0.45) | (1.67) | (0.03) | (2.15) | $11.03 | (20.75)% | 1.01% | 1.01% | 1.44% | 1.44% | 38% | $27,243 | |
| 2021 | $15.23 | 0.14 | 1.51 | 1.65 | (0.06) | (0.68) | — | (0.74) | $16.14 | 11.23% | 0.86% | 0.86% | 0.91% | 0.91% | 51% | $31,350 | |
| 2020 | $12.28 | 0.05 | 2.99 | 3.04 | (0.05) | (0.04) | — | (0.09) | $15.23 | 24.99% | 0.83% | 0.83% | 0.41% | 0.41% | 51% | $55,137 | |
| G Class | | | | | | | | | | | | | | | |
| 2024 | $11.66 | 0.20 | 1.26 | 1.46 | (0.22) | — | — | (0.22) | $12.90 | 12.54% | 0.02% | 0.89% | 1.56% | 0.69% | 56% | $1,536,733 | |
| 2023 | $11.10 | 0.20 | 0.36 | 0.56 | — | — | — | — | $11.66 | 5.05% | 0.02% | 0.91% | 1.72% | 0.83% | 54% | $1,489,943 | |
2022(4) | $12.81 | 0.15 | (1.54) | (1.39) | (0.29) | — | (0.03) | (0.32) | $11.10 | (11.03)% | 0.07% | 0.95% | 2.20% | 1.32% | 38%(5) | $1,354,224 | |
| | |
| Notes to Financial Highlights |
(1)Computed using average shares outstanding throughout the period.
(2)Total returns are calculated based on the net asset value of the last business day and do not reflect applicable sales charges, if any. Total returns for periods less than one year are not annualized.
(3)Per-share amount was less than $0.005.
(4)April 1, 2022 (commencement of sale) through November 30, 2022.
(5)Portfolio turnover is calculated at the fund level. Percentage indicated was calculated for the year ended November 30, 2022.
*The amount shown for a share outstanding throughout the period may not correlate with the Statement(s) of Operations or precisely reflect the class expense differentials due to the timing of transactions in shares of a fund in relation to income earned and/or fluctuations in the fair value of a fund's investments.
†Ratios for periods less than one year are annualized. Zero balances may reflect amounts less than 0.005%.
See Notes to Financial Statements.
| | |
| Report of Independent Registered Public Accounting Firm |
To the shareholders of the International Growth Fund and the Board of Directors of American Century World Mutual Funds, Inc.
Opinion on the Financial Statements and Financial Highlights
We have audited the accompanying statement of assets and liabilities, including the schedule of investments, of International Growth Fund (the “Fund”), one of the funds constituting the American Century World Mutual Funds, Inc., as of November 30, 2024, the related statement of operations for the year then ended, the statements of changes in net assets for each of the two years in the period then ended, the financial highlights for each of the five years in the period then ended, and the related notes. In our opinion, the financial statements and financial highlights present fairly, in all material respects, the financial position of the Fund as of November 30, 2024, and the results of its operations for the year then ended, the changes in its net assets for each of the two years in the period then ended, and the financial highlights for each of the five years in the period then ended, in conformity with accounting principles generally accepted in the United States of America.
Basis for Opinion
These financial statements and financial highlights are the responsibility of the Fund's management. Our responsibility is to express an opinion on the Fund’s financial statements and financial highlights based on our audits. We are a public accounting firm registered with the Public Company Accounting Oversight Board (United States) (PCAOB) and are required to be independent with respect to the Fund in accordance with the U.S. federal securities laws and the applicable rules and regulations of the Securities and Exchange Commission and the PCAOB.
We conducted our audits in accordance with the standards of the PCAOB. Those standards require that we plan and perform the audit to obtain reasonable assurance about whether the financial statements and financial highlights are free of material misstatement, whether due to error or fraud. The Fund is not required to have, nor were we engaged to perform, an audit of its internal control over financial reporting. As part of our audits, we are required to obtain an understanding of internal control over financial reporting but not for the purpose of expressing an opinion on the effectiveness of the Fund’s internal control over financial reporting. Accordingly, we express no such opinion.
Our audits included performing procedures to assess the risks of material misstatement of the financial statements and financial highlights, whether due to error or fraud, and performing procedures that respond to those risks. Such procedures included examining, on a test basis, evidence regarding the amounts and disclosures in the financial statements and financial highlights. Our audits also included evaluating the accounting principles used and significant estimates made by management, as well as evaluating the overall presentation of the financial statements and financial highlights. Our procedures included confirmation of securities owned as of November 30, 2024, by correspondence with the custodian and brokers; when replies were not received from brokers, we performed other auditing procedures. We believe that our audits provide a reasonable basis for our opinion.
/s/ Deloitte & Touche LLP
Kansas City, Missouri
January 16, 2025
We have served as the auditor of one or more American Century investment companies since 1997.
| | |
| Approval of Management Agreement |
At a meeting held on June 27, 2024, the Fund’s Board of Directors (the “Board”) unanimously approved the renewal of the management agreement pursuant to which American Century Investment Management, Inc. (the “Advisor”) acts as the investment advisor for the Fund. Under the Investment Company Act of 1940 (the “Investment Company Act”), contracts for investment advisory services are required to be reviewed, evaluated, and approved by a majority of a fund’s Directors, including a majority of the independent Directors.
Prior to its consideration of the renewal of the management agreement, the Directors requested and reviewed data and information compiled by the Advisor and certain independent consultants and data providers concerning the Fund. This review was in addition to the oversight and evaluation undertaken by the Board and its committees on a continual basis and the information received was supplemental to the information that the Board and its committees receive and consider over time.
In connection with its consideration of the renewal of the management agreement, the Board’s review and evaluation of the services provided by the Advisor and its affiliates included, but was not limited to
•the nature, extent, and quality of investment management, shareholder services, distribution services, and other services provided to the Fund;
•the wide range of programs and services the Advisor and other service providers provide to the Fund and its shareholders on a routine and non-routine basis;
•the Fund’s investment performance compared to appropriate benchmarks and/or peer groups of other mutual funds with similar investment objectives and strategies;
•the cost of owning the Fund compared to the cost of owning similarly-managed funds;
•the Advisor’s compliance policies, procedures, and regulatory experience and those of certain other service providers;
•the Advisor’s strategic plans, generally, and with respect to the Advisor’s response to investment management industry challenges;
•the Advisor’s business continuity plans, vendor management practices, and information security practices;
•the cost of services provided to the Fund, the profitability of the Fund to the Advisor, and the Advisor’s financial results of operation;
•possible economies of scale associated with the Advisor’s management of the Fund;
•any collateral benefits derived by the Advisor from the management of the Fund;
•fees and expenses associated with any investment by the Fund in other funds;
•payments to intermediaries by the Fund and the Advisor and services provided by intermediaries in connection therewith; and
•services provided and charges to the Advisor’s other investment management clients.
The Board held two meetings to consider the renewal. The independent Directors also met in private session multiple times to review and discuss the information provided in response to their request. The independent Directors held active discussions with the Advisor regarding the renewal of the management agreement, requesting supplemental information, and reviewing information provided by the Advisor in response thereto. The independent Directors had the benefit of the advice of their independent counsel throughout the process.
Factors Considered
The Directors considered all of the information provided by the Advisor, the independent consultant and data providers, and the independent Directors’ independent counsel in connection with the approval. They determined that the information was sufficient for them to evaluate the management agreement for the Fund. In connection with their review, the Directors did not identify any single factor as being all-important or controlling, and each Director may have attributed different levels of importance to different factors. In deciding to renew the management agreement, the Board based its decision on a number of factors, including without limitation the following:
Nature, Extent and Quality of Services — Generally. Under the management agreement, the Advisor is responsible for providing or arranging for all services necessary for the operation of the Fund. The Board noted that the Advisor provides or arranges at its own expense a wide variety of services which include, without limitation, the following:
•constructing and designing the Fund
•portfolio research and security selection
•initial capitalization/funding
•securities trading
•Fund administration
•custody of Fund assets
•daily valuation of the Fund’s portfolio
•liquidity monitoring and management
•risk management, including information security
•shareholder servicing and transfer agency, including shareholder confirmations, recordkeeping, and communications
•legal services (except the independent Directors’ counsel)
•regulatory and portfolio compliance
•financial reporting
•marketing and distribution (except amounts paid by the Fund under Rule 12b-1 plans)
The Board noted that many of these services have expanded over time in terms of both quantity and complexity in response to shareholder demands, competition in the industry, changing distribution channels, and the changing regulatory environment.
Investment Management Services. The nature of the investment management services provided to the Fund is quite complex and allows Fund shareholders access to professional money management, instant diversification of their investments, the opportunity to easily diversify among asset classes by investing in or exchanging among various American Century Investments funds, and liquidity. In evaluating investment performance, the Board expects the Advisor to manage the Fund in accordance with its investment objectives and principal investment strategies. Further, the Directors recognize that the Advisor has an obligation to monitor trading activities, and in particular to seek the best execution of fund trades, and to evaluate the use of and payment for research. In providing these services, the Advisor utilizes teams of investment professionals who require extensive information technology, research, training, compliance, and other systems to conduct their business. The Board, directly and through its Fund Performance Review Committee, provides oversight of the investment performance process. It regularly reviews investment performance information for the Fund, together with comparative information for appropriate benchmarks and/or peer groups of similarly-managed funds, over different time horizons. The Directors also review investment performance information from both the Advisor and an independent third party during the management agreement renewal process. If performance concerns are identified, the Board discusses with the Advisor the reasons for such results and any actions being taken to improve performance and may conduct special reviews until performance improves. The Fund’s performance was above its benchmark for the five- and ten-year periods and below its benchmark for the one- and three-year periods reviewed by the Board. In relation to industry peers, the Fund was below the median of its peer performance universe as identified by a third-party service provider for the one-, three-, five-, and ten-year periods. The Board discussed the Fund’s performance with the Advisor, including steps being taken to address underperformance, and was satisfied with the efforts being undertaken by the Advisor. The Board found the investment management services provided by the Advisor to the Fund to be satisfactory and consistent with the management agreement.
Shareholder and Other Services. Under the management agreement, the Advisor provides the Fund with a comprehensive package of transfer agency, shareholder, and other services. The Board, directly and through its various committees, regularly reviews reports and evaluations of such services at its regular meetings. These reports include, but are not limited to, information regarding the operational efficiency and accuracy of the shareholder and transfer agency services provided, staffing levels, shareholder satisfaction, technology support (including information security), new products and services offered to Fund shareholders, securities trading activities, portfolio valuation services, auditing services, and legal and operational compliance activities. The Board found the services provided by the Advisor to the Fund under the management agreement to be competitive and of high quality.
Costs of Services and Profitability. The Advisor provides detailed information concerning its cost of providing various services to the Fund, its profitability in managing the Fund (pre- and post-distribution), and its financial results of operation. The Directors have reviewed with the Advisor the methodology used to prepare this financial information and arranged for an independent consultant to confirm the reasonableness of the allocation methodology used. This information is considered in evaluating the Advisor’s financial condition, its ability to continue to provide services under the management agreement, and the reasonableness of the terms of the current management agreement. The Board concluded that the Advisor’s profits were reasonable in light of the services provided to the Fund.
Ethics. The Board generally considers the Advisor’s commitment to providing quality services to shareholders and to conducting its business ethically. They noted that the Advisor’s practices generally meet or exceed industry best practices.
Economies of Scale. The Board also reviewed information provided by the Advisor regarding the possible existence of economies of scale in connection with the management of the Fund. The Board concluded that economies of scale are difficult to measure and predict with precision, especially on a fund-by-fund basis. The Board concluded that the Advisor is sharing economies of scale, to the extent they exist, through its fee structure, and through reinvestment in its business, infrastructure, investment capabilities and initiatives to provide shareholders enhanced and expanded content and services. The Board also noted that economies of scale are shared with the Fund and its shareholders through management fee breakpoints that serve to reduce the effective management fee as the assets of the Fund grow. Assets of various classes of the same Fund or similarly-managed products are combined with the assets of the Fund to help achieve those breakpoints.
Comparison to Other Funds’ Fees. The management agreement provides that the Fund pays the Advisor a single, all-inclusive (or unified) management fee for providing all services necessary for the management and operation of the Fund, other than brokerage and other transaction fees and expenses relating to acquisition and disposition of portfolio securities, acquired fund fees and expenses, taxes, interest, extraordinary expenses, fund litigation expenses, fees and expenses of the Fund’s independent Directors (including their independent legal counsel), and expenses incurred in connection with the provision of shareholder services and distribution services under a plan adopted pursuant to Investment Company Act Rule 12b-1. Under the unified fee structure, the Advisor is responsible for providing all investment advisory, custody, audit, administrative, compliance, recordkeeping, marketing and shareholder services, or arranging and supervising third parties to provide such services. By contrast, most other funds are charged a variety of fees, including an investment advisory fee, a transfer agency fee, an
administrative fee, distribution charges, and other expenses. Other than their investment advisory fees and any applicable Rule 12b-1 distribution fees, all other components of the total fees charged by these other funds may be increased without shareholder approval. The Board believes the unified fee structure is a benefit to Fund shareholders because it clearly discloses to shareholders the cost of owning Fund shares, and, since the unified fee cannot be increased without a vote of Fund shareholders, it shifts to the Advisor the risk of increased costs of operating the Fund and provides a direct incentive to minimize administrative inefficiencies. Part of the Board’s analysis of fee levels involves reviewing certain evaluative data compiled by an independent provider comparing the Fund’s unified fee to the total expense ratios of its peers. The unified fee charged to shareholders of the Fund was above the median of the total expense ratios of the Fund’s peer expense universe. In addition, the Board reviewed the Fund’s position relative to the narrower set of its expense group peers. The Board and the Advisor agreed to a change in the fee schedule for the Fund that should result in a reduction of the Fund’s management fee beginning August 1, 2024. The Board concluded that the management fee paid by the Fund to the Advisor under the management agreement is reasonable in light of the services provided to the Fund.
Comparison to Fees and Services Provided to Other Clients of the Advisor. The Board also requested and received information from the Advisor concerning the nature of the services, fees, costs, and profitability of its advisory services to advisory clients other than the Fund. They observed that these varying types of client accounts require different services and involve different regulatory and entrepreneurial risks than the management of the Fund. The Board analyzed this information and concluded that the fees charged and services provided to the Fund were reasonable by comparison.
Payments to Intermediaries. The Directors also requested and received a description of payments made to intermediaries by the Fund and the Advisor and services provided in response thereto. These payments include various payments made by the Fund or the Advisor to different types of intermediaries and recordkeepers for distribution and service activities provided for the Fund. The Directors reviewed such information and received representations from the Advisor that all such payments by the Fund were made pursuant to the Fund’s Rule 12b-1 Plan and that all such payments by the Advisor were made from the Advisor’s resources and reasonable profits.
Collateral or “Fall-Out” Benefits Derived by the Advisor. The Board considered the possible existence of collateral benefits the Advisor may receive as a result of its relationship with the Fund. They concluded that the Advisor’s primary business is managing funds and it generally does not use fund or shareholder information to generate profits in other lines of business, and therefore does not derive any significant collateral benefits from them. To the extent there are potential collateral benefits, the Board has been advised and has taken this into consideration in its review of the management contract with the Fund. The Board noted that additional assets from other clients may offer the Advisor some benefit from increased leverage with prospective clients, service providers, and counterparties. Additionally, the Advisor may receive proprietary research from broker-dealers that execute fund portfolio transactions, which the Board concluded is likely to benefit other clients of the Advisor, as well as Fund shareholders. The Board also determined that the Advisor is able to provide investment management services to certain clients other than the Fund, at least in part, due to its existing infrastructure built to serve the fund complex. The Board concluded that appropriate allocation methodologies had been employed to assign resources and the cost of those resources to these other clients and these other client assets are included with the assets of the Fund to determine breakpoints in the management fee schedule.
Existing Relationship. The Board also considered whether there was any reason for not continuing the existing arrangement with the Advisor. In this regard, the Board was mindful of the potential disruptions of the Fund’s operations and various risks, uncertainties, and other effects that could occur as a result of a decision not to continue such relationship. In particular, the Board recognized that most shareholders have invested in the Fund on the strength of the Advisor’s industry standing and reputation and in the expectation that the Advisor will have a continuing role in providing advisory services to the Fund.
Conclusion of the Directors. As a result of this process, the Board, including all of the independent Directors, taking into account all of the factors discussed above and the information provided by the Advisor and others in connection with its review and received over time, determined that the terms of the management agreement are fair and reasonable and that the management fee charged to the Fund is reasonable in light of the services provided and that the management agreement between the Fund and the Advisor should be renewed for an additional one-year period.
Other Tax Information
The following information is provided pursuant to provisions of the Internal Revenue Code.
The fund hereby designates up to the maximum amount allowable as qualified dividend income for the fiscal year ended November 30, 2024.
For the fiscal year ended November 30, 2024, the fund intends to pass through to shareholders foreign source income of $43,780,037 and foreign taxes paid of $2,972,308, or up to the maximum amount allowable, as a foreign tax credit. Foreign source income and foreign tax expense per outstanding share on November 30, 2024 are $0.1986 and $0.0135, respectively.
| | | | | | | | |
| Contact Us | americancentury.com | |
| Automated Information Line | 1-800-345-8765 | |
| Investor Services Representative | 1-800-345-2021
or 816-531-5575 | |
| Banks and Trust Companies, Broker-Dealers, Financial Professionals, Insurance Companies | 1-800-345-6488 | |
| | |
| This report and the statements it contains are submitted for the general information of our shareholders. The report is not authorized for distribution to prospective investors unless preceded or accompanied by an effective prospectus. | |
| | |
©2025 American Century Proprietary Holdings, Inc. All rights reserved.
CL-ANN-91027 2501 | |
| | | | | |
| |
| Annual Financial Statements and Other Information |
| |
| November 30, 2024 |
| |
| International Opportunities Fund |
| Investor Class (AIOIX) |
| I Class (ACIOX) |
| A Class (AIVOX) |
| C Class (AIOCX) |
| R Class (AIORX) |
| | | | | |
| Schedule of Investments | |
| Statement of Assets and Liabilities | |
| Statement of Operations | |
| Statement of Changes in Net Assets | |
| Notes to Financial Statements | |
| Financial Highlights | |
| Report of Independent Registered Public Accounting Firm | |
| Approval of Management Agreement | |
| |
| Other Tax Information | |
NOVEMBER 30, 2024
| | | | | | | | |
| Shares | Value |
| COMMON STOCKS — 99.6% | | |
| Argentina — 1.6% | | |
Vista Energy SAB de CV, ADR(1) | 143,977 | | $ | 7,663,896 | |
| Australia — 7.5% | | |
| ALS Ltd. | 489,549 | | 4,994,326 | |
| CAR Group Ltd. | 130,485 | | 3,546,496 | |
NEXTDC Ltd.(1) | 547,536 | | 5,840,687 | |
| Pro Medicus Ltd. | 23,221 | | 3,832,235 | |
| SGH Ltd. | 192,393 | | 6,237,215 | |
Telix Pharmaceuticals Ltd.(1) | 330,199 | | 5,352,636 | |
Zip Co. Ltd.(1) | 2,500,681 | | 5,614,711 | |
| | | 35,418,306 | |
| Brazil — 3.3% | | |
| Direcional Engenharia SA | 671,800 | | 3,210,054 | |
Embraer SA, ADR(1) | 222,835 | | 8,518,982 | |
| Marcopolo SA, Preference Shares | 2,888,800 | | 4,028,226 | |
| | | 15,757,262 | |
| Canada — 13.1% | | |
| Alamos Gold, Inc., Class A | 280,249 | | 5,326,543 | |
Aritzia, Inc.(1) | 75,689 | | 2,521,435 | |
| AtkinsRealis Group, Inc. | 150,783 | | 8,187,225 | |
Capstone Copper Corp.(1) | 676,601 | | 4,678,046 | |
Cargojet, Inc.(2) | 33,620 | | 2,903,223 | |
| Chartwell Retirement Residences | 408,836 | | 4,716,047 | |
Descartes Systems Group, Inc.(1) | 46,663 | | 5,502,704 | |
| Element Fleet Management Corp. | 186,524 | | 3,956,832 | |
| FirstService Corp. | 27,691 | | 5,377,315 | |
| Hammond Power Solutions, Inc. | 38,928 | | 3,948,270 | |
| Hudbay Minerals, Inc. | 420,563 | | 3,751,889 | |
Kinaxis, Inc.(1) | 13,445 | | 1,761,904 | |
| Lundin Gold, Inc. | 229,543 | | 5,338,324 | |
TransAlta Corp.(2) | 346,987 | | 3,933,205 | |
| | | 61,902,962 | |
| China — 3.8% | | |
| AAC Technologies Holdings, Inc. | 828,000 | | 3,742,644 | |
Bosideng International Holdings Ltd.(2) | 7,954,000 | | 4,153,239 | |
GDS Holdings Ltd., ADR(1) | 243,475 | | 4,794,023 | |
| Tongcheng Travel Holdings Ltd. | 2,200,000 | | 5,408,604 | |
| | | 18,098,510 | |
| Denmark — 1.6% | | |
Ambu AS, Class B(1) | 123,091 | | 1,941,170 | |
| Royal Unibrew AS | 42,465 | | 3,205,400 | |
Zealand Pharma AS(1) | 21,128 | | 2,188,777 | |
| | | 7,335,347 | |
| Finland — 0.3% | | |
| Kemira OYJ | 69,786 | | 1,372,112 | |
| France — 0.7% | | |
| SPIE SA | 36,559 | | 1,152,277 | |
VusionGroup(2) | 15,783 | | 2,383,206 | |
| | | 3,535,483 | |
| | | | | | | | |
| Shares | Value |
| Germany — 3.7% | | |
| Bilfinger SE | 35,003 | | $ | 1,616,393 | |
| CTS Eventim AG & Co. KGaA | 35,323 | | 3,126,200 | |
Nordex SE(1) | 272,648 | | 3,455,113 | |
Redcare Pharmacy NV(1) | 31,997 | | 5,049,510 | |
| Scout24 SE | 32,245 | | 2,907,442 | |
TAG Immobilien AG(1) | 85,205 | | 1,417,932 | |
| | | 17,572,590 | |
| Greece — 0.5% | | |
| National Bank of Greece SA | 308,091 | | 2,174,951 | |
| India — 9.5% | | |
Amber Enterprises India Ltd.(1) | 61,361 | | 4,415,198 | |
| Anant Raj Ltd. | 307,537 | | 2,460,561 | |
| Coforge Ltd. | 36,442 | | 3,760,480 | |
| Kalyan Jewellers India Ltd. | 489,384 | | 4,208,063 | |
Kaynes Technology India Ltd.(1) | 49,289 | | 3,503,654 | |
| KEI Industries Ltd. | 101,107 | | 5,179,815 | |
Max Financial Services Ltd.(1) | 234,632 | | 3,155,525 | |
| Max Healthcare Institute Ltd. | 440,713 | | 5,121,403 | |
| Prestige Estates Projects Ltd. | 196,159 | | 3,846,554 | |
| Rainbow Children's Medicare Ltd. | 195,307 | | 3,677,799 | |
| Supreme Industries Ltd. | 56,914 | | 3,136,600 | |
| Varun Beverages Ltd. | 329,377 | | 2,421,516 | |
| | | 44,887,168 | |
| Israel — 1.5% | | |
CyberArk Software Ltd.(1) | 14,517 | | 4,696,395 | |
Nova Ltd.(1) | 11,794 | | 2,167,265 | |
| | | 6,863,660 | |
| Japan — 20.4% | | |
| Asics Corp. | 370,800 | | 7,491,408 | |
| BayCurrent, Inc. | 169,000 | | 6,128,321 | |
CyberAgent, Inc.(2) | 209,100 | | 1,457,770 | |
| Furukawa Electric Co. Ltd. | 29,100 | | 1,201,406 | |
GENDA, Inc.(1) | 265,700 | | 4,527,062 | |
GMO Payment Gateway, Inc.(2) | 23,800 | | 1,259,263 | |
| Japan Elevator Service Holdings Co. Ltd. | 165,400 | | 3,007,963 | |
| Kakaku.com, Inc. | 102,500 | | 1,720,516 | |
Kinden Corp.(2) | 174,700 | | 3,604,798 | |
| Kyushu Railway Co. | 115,400 | | 3,038,096 | |
| Lifedrink Co., Inc. | 138,800 | | 2,315,388 | |
| Maruwa Co. Ltd. | 13,800 | | 3,949,261 | |
Micronics Japan Co. Ltd.(2) | 105,000 | | 2,639,920 | |
| Miura Co. Ltd. | 204,900 | | 5,135,268 | |
Money Forward, Inc.(1) | 75,500 | | 2,388,862 | |
PeptiDream, Inc.(1) | 251,500 | | 4,961,136 | |
Rakuten Bank Ltd.(1) | 168,500 | | 4,824,262 | |
| Ryohin Keikaku Co. Ltd. | 151,900 | | 3,125,567 | |
| Sanrio Co. Ltd. | 224,700 | | 7,442,523 | |
| Santen Pharmaceutical Co. Ltd. | 258,800 | | 2,980,328 | |
| Sanwa Holdings Corp. | 163,800 | | 4,947,230 | |
| SWCC Corp. | 59,000 | | 2,977,044 | |
Tokyo Ohka Kogyo Co. Ltd.(2) | 197,600 | | 4,741,824 | |
| Tokyo Tatemono Co. Ltd. | 178,400 | | 3,084,676 | |
| Toyo Suisan Kaisha Ltd. | 54,400 | | 3,821,829 | |
| | | | | | | | |
| Shares | Value |
| Yokogawa Electric Corp. | 144,300 | | $ | 3,224,424 | |
| | 95,996,145 | |
| Mexico — 0.9% | | |
BBB Foods, Inc., Class A(1) | 149,079 | | 4,207,009 | |
| Netherlands — 2.6% | | |
| Arcadis NV | 64,300 | | 4,239,108 | |
| Fugro NV | 161,035 | | 2,920,067 | |
InPost SA(1) | 284,562 | | 4,983,202 | |
| | 12,142,377 | |
| Norway — 0.7% | | |
DOF Group ASA(1) | 415,529 | | 3,204,042 | |
| Singapore — 1.5% | | |
| SATS Ltd. | 2,582,900 | | 7,256,620 | |
| South Korea — 2.7% | | |
| Douzone Bizon Co. Ltd. | 51,482 | | 2,628,681 | |
| HYBE Co. Ltd. | 14,815 | | 2,075,624 | |
| Hyundai Rotem Co. Ltd. | 67,087 | | 2,449,053 | |
Sanil Electric Co. Ltd.(1) | 120,907 | | 5,395,326 | |
| | 12,548,684 | |
| Spain — 1.3% | | |
Fluidra SA(2) | 144,509 | | 3,777,682 | |
Indra Sistemas SA(2) | 129,347 | | 2,277,740 | |
| | | 6,055,422 | |
| Sweden — 3.8% | | |
| AAK AB | 189,021 | | 5,122,722 | |
| Beijer Ref AB | 109,870 | | 1,733,399 | |
BoneSupport Holding AB(1) | 78,658 | | 2,645,137 | |
Camurus AB(1) | 23,090 | | 1,208,261 | |
| Hemnet Group AB | 102,743 | | 3,088,252 | |
| Saab AB, Class B | 63,897 | | 1,401,012 | |
Yubico AB(1)(2) | 110,513 | | 2,739,159 | |
| | | 17,937,942 | |
| Switzerland — 2.8% | | |
| Belimo Holding AG | 4,376 | | 2,933,851 | |
Siegfried Holding AG(1) | 4,413 | | 5,582,492 | |
| Swissquote Group Holding SA | 11,368 | | 4,473,129 | |
| | | 12,989,472 | |
| Taiwan — 6.5% | | |
| ASPEED Technology, Inc. | 39,000 | | 4,971,493 | |
| Elan Microelectronics Corp. | 246,000 | | 1,115,315 | |
| Elite Material Co. Ltd. | 171,000 | | 2,487,916 | |
| King Yuan Electronics Co. Ltd. | 1,178,000 | | 4,648,814 | |
| Kinik Co. | 288,000 | | 2,670,682 | |
| Lai Yih Footwear Co. Ltd. | 342,000 | | 4,153,760 | |
| Lotes Co. Ltd. | 85,000 | | 4,732,847 | |
| Nien Made Enterprise Co. Ltd. | 188,000 | | 2,331,200 | |
| Tong Yang Industry Co. Ltd. | 899,000 | | 3,299,479 | |
| | | 30,411,506 | |
| Turkey — 0.5% | | |
| Migros Ticaret AS | 176,947 | | 2,468,754 | |
| United Kingdom — 8.3% | | |
| Balfour Beatty PLC | 818,463 | | 4,689,502 | |
| Diploma PLC | 119,224 | | 6,772,478 | |
| Greggs PLC | 84,422 | | 2,905,035 | |
| | | | | | | | |
| Shares | Value |
| Intermediate Capital Group PLC | 194,702 | | $ | 5,246,856 | |
| Marks & Spencer Group PLC | 1,097,246 | | 5,348,686 | |
| Persimmon PLC | 222,926 | | 3,571,167 | |
| St. James's Place PLC | 274,909 | | 3,158,775 | |
| UNITE Group PLC | 85,942 | | 963,594 | |
Watches of Switzerland Group PLC(1) | 191,538 | | 1,134,072 | |
| Weir Group PLC | 195,163 | | 5,521,679 | |
| | | 39,311,844 | |
| United States — 0.5% | | |
| TechnipFMC PLC | 75,356 | | 2,363,918 | |
TOTAL COMMON STOCKS (Cost $382,338,526) | | 469,475,982 | |
| EXCHANGE-TRADED FUNDS — 0.3% | | |
Schwab International Small-Cap Equity ETF (Cost $1,420,926) | 38,377 | | 1,411,122 | |
| SHORT-TERM INVESTMENTS — 1.9% | | |
| Money Market Funds — 1.6% | | |
State Street Navigator Securities Lending Government Money Market Portfolio(3) | 7,314,576 | | 7,314,576 | |
| Repurchase Agreements — 0.3% | | |
| BMO Capital Markets Corp., (collateralized by various U.S. Treasury obligations, 3.625%, 2/15/44, valued at $131,503), in a joint trading account at 4.56%, dated 11/29/24, due 12/2/24 (Delivery value $129,196) | | 129,147 | |
| Fixed Income Clearing Corp., (collateralized by various U.S. Treasury obligations, 2.00%, 2/15/50, valued at $1,304,658), at 4.57%, dated 11/29/24, due 12/2/24 (Delivery value $1,279,487) | | 1,279,000 | |
| | | 1,408,147 | |
TOTAL SHORT-TERM INVESTMENTS (Cost $8,722,723) | | 8,722,723 | |
TOTAL INVESTMENT SECURITIES — 101.8% (Cost $392,482,175) | | 479,609,827 | |
| OTHER ASSETS AND LIABILITIES — (1.8)% | | (8,286,538) | |
| TOTAL NET ASSETS — 100.0% | | $ | 471,323,289 | |
| | | | | |
| MARKET SECTOR DIVERSIFICATION |
(as a % of net assets) | |
| Industrials | 29.9% |
| Information Technology | 16.1% |
| Consumer Discretionary | 13.6% |
| Health Care | 9.4% |
| Consumer Staples | 7.2% |
| Financials | 6.4% |
| Materials | 6.0% |
| Communication Services | 3.8% |
| Real Estate | 3.6% |
| Energy | 2.8% |
| Utilities | 0.8% |
| Exchange-Traded Funds | 0.3% |
| Short-Term Investments | 1.9% |
| Other Assets and Liabilities | (1.8)% |
| | | | | | | | |
| NOTES TO SCHEDULE OF INVESTMENTS |
| ADR | – | American Depositary Receipt |
(1)Non-income producing.
(2)Security, or a portion thereof, is on loan. At the period end, the aggregate value of securities on loan was $15,918,815. The amount of securities on loan indicated may not correspond with the securities on loan identified because securities with pending sales are in the process of recall from the brokers.
(3)Investment of cash collateral from securities on loan. At the period end, the aggregate value of the collateral held by the fund was $16,726,143, which includes securities collateral of $9,411,567.
See Notes to Financial Statements.
| | |
| Statement of Assets and Liabilities |
| | | | | |
| NOVEMBER 30, 2024 | |
| Assets | |
| Investment securities, at value (cost of $385,167,599) — including $15,918,815 of securities on loan | $ | 472,295,251 | |
| Investment made with cash collateral received for securities on loan, at value (cost of $7,314,576) | 7,314,576 | |
| Total investment securities, at value (cost of $392,482,175) | 479,609,827 | |
| Cash | 5,518 | |
| Foreign currency holdings, at value (cost of $924,045) | 924,322 | |
| Receivable for investments sold | 2,678,509 | |
| Receivable for capital shares sold | 86,219 | |
| Dividends and interest receivable | 1,030,076 | |
| Securities lending receivable | 38,787 | |
| Other assets | 127,852 | |
| | 484,501,110 | |
| |
| Liabilities | |
| Payable for collateral received for securities on loan | 7,314,576 | |
| Payable for investments purchased | 2,563,030 | |
| Payable for capital shares redeemed | 177,914 | |
| Accrued management fees | 532,570 | |
| Distribution and service fees payable | 1,426 | |
| Accrued foreign taxes | 2,331,089 | |
| Accrued IRS compliance fees | 257,216 | |
| | 13,177,821 | |
| |
| Net Assets | $ | 471,323,289 | |
| |
| Net Assets Consist of: | |
| Capital (par value and paid-in surplus) | $ | 502,711,245 | |
| Distributable earnings (loss) | (31,387,956) | |
| | $ | 471,323,289 | |
| | | | | | | | | | | |
| Net Assets | Shares Outstanding | Net Asset Value Per Share* |
| Investor Class, $0.01 Par Value | $332,565,083 | 35,045,351 | $9.49 |
| I Class, $0.01 Par Value | $132,952,016 | 13,776,096 | $9.65 |
| A Class, $0.01 Par Value | $4,781,333 | 511,472 | $9.35 |
| C Class, $0.01 Par Value | $120,468 | 14,076 | $8.56 |
| R Class, $0.01 Par Value | $904,389 | 98,961 | $9.14 |
*Maximum offering price per share was equal to the net asset value per share for all share classes, except A Class, for which the maximum offering price per share was $9.92 (net asset value divided by 0.9425). A contingent deferred sales charge may be imposed on redemptions of A Class and C Class.
See Notes to Financial Statements.
| | | | | |
| YEAR ENDED NOVEMBER 30, 2024 | |
| Investment Income (Loss) | |
| Income: | |
| Dividends (net of foreign taxes withheld of $673,974) | $ | 6,016,133 | |
| Securities lending, net | 183,909 | |
| Interest | 90,467 | |
| | 6,290,509 | |
| |
| Expenses: | |
| Management fees | 6,648,924 | |
| Distribution and service fees: | |
| A Class | 12,494 | |
| C Class | 1,671 | |
| R Class | 5,123 | |
| Directors' fees and expenses | 13,265 | |
| Other expenses | 31,174 | |
| | 6,712,651 | |
Fees waived(1) | (75,798) | |
| 6,636,853 | |
| |
| Net investment income (loss) | (346,344) | |
| |
| Realized and Unrealized Gain (Loss) | |
| Net realized gain (loss) on: | |
| Investment transactions (net of foreign tax expenses paid (refunded) of $1,783,726) | 13,655,021 | |
| Foreign currency translation transactions | (217,672) | |
| 13,437,349 | |
| |
| Change in net unrealized appreciation (depreciation) on: | |
| Investments (includes (increase) decrease in accrued foreign taxes of $(717,924)) | 35,357,527 | |
| Translation of assets and liabilities in foreign currencies | (40,262) | |
| 35,317,265 | |
| |
| Net realized and unrealized gain (loss) | 48,754,614 | |
| |
| Net Increase (Decrease) in Net Assets Resulting from Operations | $ | 48,408,270 | |
(1)Amount consists of $56,134, $18,689, $801, $21 and $153 for Investor Class, I Class, A Class, C Class and R Class, respectively.
See Notes to Financial Statements.
| | |
| Statement of Changes in Net Assets |
| | | | | | | | |
| YEARS ENDED NOVEMBER 30, 2024 AND NOVEMBER 30, 2023 |
| Increase (Decrease) in Net Assets | November 30, 2024 | November 30, 2023 |
| Operations | | |
| Net investment income (loss) | $ | (346,344) | | $ | 257,057 | |
| Net realized gain (loss) | 13,437,349 | | (44,478,751) | |
| Change in net unrealized appreciation (depreciation) | 35,317,265 | | 36,832,093 | |
| Net increase (decrease) in net assets resulting from operations | 48,408,270 | | (7,389,601) | |
| | |
| Distributions to Shareholders | | |
| From earnings: | | |
| Investor Class | (749,060) | | (883,194) | |
| I Class | (354,084) | | (395,627) | |
| Decrease in net assets from distributions | (1,103,144) | | (1,278,821) | |
| | |
| Capital Share Transactions | | |
| Net increase (decrease) in net assets from capital share transactions (Note 5) | 1,205,750 | | (45,954,756) | |
| | |
| Net increase (decrease) in net assets | 48,510,876 | | (54,623,178) | |
| | |
| Net Assets | | |
| Beginning of period | 422,812,413 | | 477,435,591 | |
| End of period | $ | 471,323,289 | | $ | 422,812,413 | |
See Notes to Financial Statements.
| | |
| Notes to Financial Statements |
NOVEMBER 30, 2024
1. Organization
American Century World Mutual Funds, Inc. (the corporation) is registered under the Investment Company Act of 1940, as amended (the 1940 Act), as an open-end management investment company and is organized as a Maryland corporation. International Opportunities Fund (the fund) is one fund in a series issued by the corporation. The fund's investment objective is to seek capital growth.
The fund offers the Investor Class, I Class, A Class, C Class and R Class. The A Class may incur an initial sales charge. The A Class and C Class may be subject to a contingent deferred sales charge.
2. Significant Accounting Policies
The following is a summary of significant accounting policies consistently followed by the fund in preparation of its financial statements. The fund is an investment company and follows accounting and reporting guidance in accordance with accounting principles generally accepted in the United States of America. This may require management to make certain estimates and assumptions at the date of the financial statements. Actual results could differ from these estimates. Management evaluated the impact of events or transactions occurring through the date the financial statements were issued that would merit recognition or disclosure.
Investment Valuations — The fund determines the fair value of its investments and computes its net asset value (NAV) per share at the close of regular trading (usually 4 p.m. Eastern time) on the New York Stock Exchange (NYSE) on each day the NYSE is open. The value of investments of the fund is determined by American Century Investment Management, Inc. (ACIM) (the investment advisor), as the valuation designee, pursuant to its valuation policies and procedures. The Board of Directors oversees the valuation designee and reviews its valuation policies and procedures at least annually.
Equity securities that are listed or traded on a domestic securities exchange are valued at the last reported sales price or at the official closing price as provided by the exchange. Equity securities traded on foreign securities exchanges are generally valued at the closing price of such securities on the exchange where primarily traded or at the close of the NYSE, if that is earlier. If no last sales price is reported, or if local convention or regulation so provides, the mean of the latest bid and asked prices may be used. Securities traded over-the-counter are valued at the mean of the latest bid and asked prices, the last sales price, or the official closing price.
Open-end management investment companies are valued at the reported NAV per share. Repurchase agreements are valued at cost, which approximates fair value.
If the valuation designee determines that the market price for a portfolio security is not readily available or is believed by the valuation designee to be unreliable, such security is valued at fair value as determined in good faith by the valuation designee, in accordance with its policies and procedures. Circumstances that may cause the fund to determine that market quotations are not available or reliable include, but are not limited to: when there is a significant event subsequent to the market quotation; trading in a security has been halted during the trading day; or trading in a security is insufficient or did not take place due to a closure or holiday.
The valuation designee monitors for significant events occurring after the close of an investment’s primary exchange but before the fund’s NAV per share is determined. Significant events may include, but are not limited to: corporate announcements and transactions; regulatory news, governmental action and political unrest that could impact a specific investment or an investment sector; or armed conflicts, natural disasters and similar events that could affect investments in a specific country or region. The valuation designee also monitors for significant fluctuations between domestic and foreign markets, as evidenced by the U.S. market or such other indicators that it deems appropriate. The valuation designee may apply a model-derived factor to the closing price of equity securities traded on foreign securities exchanges. The factor is based on observable market data as provided by an independent pricing service.
Foreign Currency Translations — All assets and liabilities, including investment securities and other financial instruments, initially expressed in foreign currencies are translated into U.S. dollars each day at the mean of the appropriate currency exchange rate at the close of the NYSE as provided by an independent pricing service. The fund may enter into spot foreign currency exchange contracts to facilitate transactions denominated in a foreign currency. Purchases and sales of investment securities, dividend and interest income, spot foreign currency exchange contracts, and expenses are translated at the rates of exchange prevailing on the respective dates of such transactions. Net realized and unrealized foreign currency exchange gains or losses related to investment securities are a component of net realized gain (loss) on investment transactions and change in net unrealized appreciation (depreciation) on investments, respectively.
Security Transactions — Security transactions are accounted for as of the trade date. Net realized gains and losses are determined on the identified cost basis, which is also used for federal income tax purposes. Certain countries impose taxes on realized gains on the sale of securities registered in their country. The fund records the foreign tax expense, if any, on an accrual basis. The foreign tax expense on realized gains and unrealized appreciation reduces the net realized gain (loss) on investment transactions and net unrealized appreciation (depreciation) on investments, respectively.
Investment Income — Dividend income less foreign taxes withheld, if any, is recorded as of the ex-dividend date. Distributions received on securities that represent a return of capital or long-term capital gain are recorded as a reduction of cost of investments and/or as a realized gain. The fund may estimate the components of distributions received that may be considered nontaxable distributions or long-term capital gain distributions for income tax purposes. Interest income is recorded on the accrual basis and includes accretion of discounts and amortization of premiums. Securities lending income is net of fees and rebates earned by the lending agent for its services.
Repurchase Agreements — The fund may enter into repurchase agreements with institutions that ACIM has determined are creditworthy pursuant to criteria adopted by the Board of Directors. The fund requires that the collateral, represented by securities, received in a repurchase transaction be transferred to the custodian in a manner sufficient to enable the fund to obtain those securities in the event of a default under the repurchase agreement. ACIM monitors, on a daily basis, the securities transferred to ensure the value, including accrued interest, of the securities under each repurchase agreement is equal to or greater than amounts owed to the fund under each repurchase agreement.
Joint Trading Account — Pursuant to an Exemptive Order issued by the Securities and Exchange Commission, the fund, along with certain other funds in the American Century Investments family of funds, may transfer uninvested cash balances into a joint trading account. These balances are invested in one or more repurchase agreements that are collateralized by U.S. Treasury or Agency obligations.
Income Tax Status — It is the fund's policy to distribute substantially all net investment income and net realized gains to shareholders and to otherwise qualify as a regulated investment company under provisions of the Internal Revenue Code. Accordingly, no provision has been made for income taxes. The fund files U.S. federal, state, local and non-U.S. tax returns as applicable. The fund's tax returns are subject to examination by the relevant taxing authority until expiration of the applicable statute of limitations, which is generally three years from the date of filing but can be longer in certain jurisdictions. At this time, management believes there are no uncertain tax positions which, based on their technical merit, would not be sustained upon examination and for which it is reasonably possible that the total amounts of unrecognized tax benefits will significantly change in the next twelve months.
Multiple Class — All shares of the fund represent an equal pro rata interest in the net assets of the class to which such shares belong, and have identical voting, dividend, liquidation and other rights and the same terms and conditions, except for class specific expenses and exclusive rights to vote on matters affecting only individual classes. Income, non-class specific expenses, and realized and unrealized capital gains and losses of the fund are allocated to each class of shares based on their relative net assets.
Distributions to Shareholders — Distributions from net investment income and net realized gains, if any, are generally declared and paid annually. The fund may make distributions on a more frequent basis to comply with the distribution requirements of the Internal Revenue Code, in all events in a manner consistent with provisions of the 1940 Act.
Indemnifications — Under the corporation’s organizational documents, its officers and directors are indemnified against certain liabilities arising out of the performance of their duties to the fund. In addition, in the normal course of business, the fund enters into contracts that provide general indemnifications. The maximum exposure under these arrangements is unknown as this would involve future claims that may be made against a fund. The risk of material loss from such claims is considered by management to be remote.
Securities Lending — Securities are lent to qualified financial institutions and brokers. State Street Bank & Trust Co. serves as securities lending agent to the fund pursuant to a Securities Lending Agreement. The lending of securities exposes the fund to risks such as: the borrowers may fail to return the loaned securities, the borrowers may not be able to provide additional collateral, the fund may experience delays in recovery of the loaned securities or delays in access to collateral, or the fund may experience losses related to the investment collateral. To minimize certain risks, loan counterparties pledge collateral in the form of cash and/or securities. The lending agent has agreed to indemnify the fund in the case of default of any securities borrowed. Cash collateral received is invested in the State Street Navigator Securities Lending Government Money Market Portfolio, a money market mutual fund registered under the 1940 Act. The loans may also be secured by U.S. government securities in an amount at least equal to the market value of the securities loaned, plus accrued interest and dividends, determined on a daily basis and adjusted accordingly. By lending securities, the fund seeks to increase its net investment income through the receipt of interest and fees. Such income is reflected separately within the Statement of Operations. The value of loaned securities and related collateral outstanding at period end, if any, are shown on a gross basis within the Schedule of Investments and Statement of Assets and Liabilities.
The following table reflects a breakdown of transactions accounted for as secured borrowings, the gross obligation by the type of collateral pledged, and the remaining contractual maturity of those transactions as of November 30, 2024.
| | | | | | | | | | | | | | | | | |
| Remaining Contractual Maturity of Agreements |
| Overnight and
Continuous | <30 days | Between
30 & 90 days | >90 days | Total |
Securities Lending Transactions(1) | | | | |
| Common Stocks | $ | 7,314,576 | | — | | — | | — | | $ | 7,314,576 | |
| Gross amount of recognized liabilities for securities lending transactions | $ | 7,314,576 | |
(1)Amount represents the payable for cash collateral received for securities on loan. This will generally be in the Overnight and Continuous column as the securities are typically callable on demand.
3. Fees and Transactions with Related Parties
Certain officers and directors of the corporation are also officers and/or directors of American Century Companies, Inc. (ACC). The corporation's investment advisor, ACIM, the corporation's distributor, American Century Investment Services, Inc. (ACIS), and the corporation's transfer agent, American Century Services, LLC, are wholly owned, directly or indirectly, by ACC.
Management Fees — The corporation has entered into a management agreement with ACIM, under which ACIM provides the fund with investment advisory and management services in exchange for a single, unified management fee (the fee) per class. The agreement provides that ACIM will pay all expenses of managing and operating the fund, except brokerage expenses, taxes, interest, fees and expenses of the independent directors (including legal counsel fees), extraordinary expenses, and expenses incurred in connection with the provision of shareholder services and distribution services under a plan adopted pursuant to Rule 12b-1 under the 1940 Act. The fee is computed and accrued daily based on each class's daily net assets and paid monthly in arrears. The difference in the fee among the classes is a result of their separate arrangements for non-Rule 12b-1 shareholder services. It is not the result of any difference in advisory or custodial fees or other expenses related to the management of the fund's assets, which do not vary by class. The rate of the fee is determined by applying a fee rate calculation formula. This formula takes into account the fund's assets as well as certain assets, if any, of other clients of the investment advisor outside the American Century Investments family of funds (such as subadvised funds and separate accounts), as well as exchange-traded funds managed by the investment advisor, that use very similar investment teams and strategies (strategy assets). Effective August 1, 2024, the investment advisor agreed to waive 0.05% of the fund's management fee. The investment advisor expects this waiver to continue until July 31, 2025 and cannot terminate it prior to such date without the approval of the Board of Directors.
The management fee schedule range and the effective annual management fee before and after waiver for each class for the period ended November 30, 2024 are as follows:
| | | | | | | | | | | |
| | Effective Annual Management Fee |
| Management Fee Schedule Range* | Before Waiver | After Waiver |
| Investor Class | 1.200% to 1.500% | 1.53% | 1.52% |
| I Class | 1.000% to 1.300% | 1.33% | 1.32% |
| A Class | 1.200% to 1.500% | 1.53% | 1.52% |
| C Class | 1.200% to 1.500% | 1.53% | 1.52% |
| R Class | 1.200% to 1.500% | 1.53% | 1.52% |
*Prior to August 1, 2024, the management fee schedule range was 1.200% to 1.550% for Investor Class, A Class, C Class and R Class and 1.000% to 1.350% for I Class.
Distribution and Service Fees — The Board of Directors has adopted a separate Master Distribution and Individual Shareholder Services Plan for each of the A Class, C Class and R Class (collectively the plans), pursuant to Rule 12b-1 of the 1940 Act. The plans provide that the A Class will pay ACIS an annual distribution and service fee of 0.25%. The plans provide that the C Class will pay ACIS an annual distribution and service fee of 1.00%, of which 0.25% is paid for individual shareholder services and 0.75% is paid for distribution services. The plans provide that the R Class will pay ACIS an annual distribution and service fee of 0.50%. The fees are computed and accrued daily based on each class’s daily net assets and paid monthly in arrears. The fees are used to pay financial intermediaries for distribution and individual shareholder services. Fees incurred under the plans during the period ended November 30, 2024 are detailed in the Statement of Operations.
Directors' Fees and Expenses — The Board of Directors is responsible for overseeing the investment advisor’s management and operations of the fund. The directors receive detailed information about the fund and its investment advisor regularly throughout the year, and meet at least quarterly with management of the investment advisor to review reports about fund operations. The fund's officers do not receive compensation from the fund.
Other Expenses — A fund’s other expenses may include interest charges, clearing exchange fees, proxy solicitation expenses, fees associated with the recovery of foreign tax reclaims and other miscellaneous expenses.
Interfund Transactions — The fund may enter into security transactions with other American Century Investments funds and other client accounts of the investment advisor, in accordance with the 1940 Act rules and procedures adopted by the Board of Directors. The rules and procedures require, among other things, that these transactions be effected at the independent current market price of the security. During the period, the interfund purchases were $112,918 and there were no interfund sales.
4. Investment Transactions
Purchases and sales of investment securities, excluding short-term investments, for the period ended November 30, 2024 were $603,997,910 and $603,130,660, respectively.
5. Capital Share Transactions
Transactions in shares of the fund were as follows:
| | | | | | | | | | | | | | |
| Year ended November 30, 2024 | Year ended November 30, 2023 |
| Shares | Amount | Shares | Amount |
| Investor Class/Shares Authorized | 670,000,000 | | | 670,000,000 | | |
| Sold | 782,044 | | $ | 7,199,798 | | 1,013,081 | | $ | 8,768,619 | |
| Issued in reinvestment of distributions | 75,554 | | 706,427 | | 97,008 | | 833,302 | |
| Redeemed | (5,852,458) | | (53,895,839) | | (5,278,674) | | (45,813,227) | |
| | (4,994,860) | | (45,989,614) | | (4,168,585) | | (36,211,306) | |
| I Class/Shares Authorized | 120,000,000 | | | 120,000,000 | | |
| Sold | 7,407,107 | | 71,910,522 | | 2,128,189 | | 18,499,251 | |
| Issued in reinvestment of distributions | 37,272 | | 354,083 | | 45,265 | | 394,713 | |
| Redeemed | (2,541,960) | | (23,984,174) | | (3,221,450) | | (27,924,308) | |
| | 4,902,419 | | 48,280,431 | | (1,047,996) | | (9,030,344) | |
| A Class/Shares Authorized | 35,000,000 | | | 35,000,000 | | |
| Sold | 49,470 | | 449,428 | | 90,793 | | 731,925 | |
| Redeemed | (124,046) | | (1,120,962) | | (98,863) | | (828,741) | |
| | (74,576) | | (671,534) | | (8,070) | | (96,816) | |
| C Class/Shares Authorized | 25,000,000 | | | 25,000,000 | | |
| Sold | 339 | | 2,886 | | 1,909 | | 15,094 | |
| Redeemed | (13,952) | | (116,262) | | (7,441) | | (59,422) | |
| | (13,613) | | (113,376) | | (5,532) | | (44,328) | |
| R Class/Shares Authorized | 25,000,000 | | | 25,000,000 | | |
| Sold | 33,028 | | 296,518 | | 38,883 | | 330,925 | |
| Redeemed | (66,882) | | (596,675) | | (112,767) | | (902,887) | |
| | (33,854) | | (300,157) | | (73,884) | | (571,962) | |
| Net increase (decrease) | (214,484) | | $ | 1,205,750 | | (5,304,067) | | $ | (45,954,756) | |
6. Fair Value Measurements
The fund's investments valuation process is based on several considerations and may use multiple inputs to determine the fair value of the investments held by the fund. In conformity with accounting principles generally accepted in the United States of America, the inputs used to determine a valuation are classified into three broad levels.
•Level 1 valuation inputs consist of unadjusted quoted prices in an active market for identical investments.
•Level 2 valuation inputs consist of direct or indirect observable market data (including quoted prices for comparable investments, evaluations of subsequent market events, interest rates, prepayment speeds, credit risk, etc.). These inputs also consist of quoted prices for identical investments initially expressed in local currencies that are adjusted through translation into U.S. dollars.
•Level 3 valuation inputs consist of unobservable data (including a fund’s own assumptions).
The level classification is based on the lowest level input that is significant to the fair valuation measurement. The valuation inputs are not necessarily an indication of the risks associated with investing in these securities or other financial instruments.
The following is a summary of the level classifications as of period end. The Schedule of Investments provides additional information on the fund's portfolio holdings.
| | | | | | | | | | | |
| Level 1 | Level 2 | Level 3 |
| Assets | | | |
| Investment Securities | | | |
| Common Stocks | | | |
| Argentina | $ | 7,663,896 | | — | | — | |
| Brazil | 8,518,982 | | $ | 7,238,280 | | — | |
| Canada | 5,377,315 | | 56,525,647 | | — | |
| China | 4,794,023 | | 13,304,487 | | — | |
| Israel | 6,863,660 | | — | | — | |
| Mexico | 4,207,009 | | — | | — | |
| United States | 2,363,918 | | — | | — | |
| Other Countries | — | | 352,618,765 | | — | |
| Exchange-Traded Funds | 1,411,122 | | — | | — | |
| Short-Term Investments | 7,314,576 | | 1,408,147 | | — | |
| | $ | 48,514,501 | | $ | 431,095,326 | | — | |
7. Risk Factors
The value of the fund’s shares will go up and down, sometimes rapidly or unpredictably, based on the performance of the securities owned by the fund and other factors generally affecting the securities market. Market risks, including political, regulatory, economic and social developments, can affect the value of the fund’s investments. Natural disasters, public health emergencies, war, terrorism and other unforeseeable events may lead to increased market volatility and may have adverse long-term effects on world economies and markets generally.
There are certain risks involved in investing in foreign securities. These risks include those resulting from political events (such as civil unrest, national elections and imposition of exchange controls), social and economic events (such as labor strikes and rising inflation), and natural disasters. Securities of foreign issuers may be less liquid and more volatile. Investing in emerging markets or a significant portion of assets in one country or region may accentuate these risks.
The fund invests in common stocks of small companies. Because of this, the fund may be subject to greater risk and market fluctuations than a fund investing in larger, more established companies.
The fund's investment process may result in high portfolio turnover, which could mean high transaction costs, affecting both performance and capital gains tax liabilities to investors.
8. Federal Tax Information
On December 17, 2024, the fund declared and paid the following per-share distributions from net investment income to shareholders of record on December 16, 2024:
| | | | | | | | | | | | | | |
| Investor Class | I Class | A Class | C Class | R Class |
| $0.0098 | $0.0245 | — | — | — |
The tax character of distributions paid during the years ended November 30, 2024 and November 30, 2023 were as follows:
| | | | | | | | |
| 2024 | 2023 |
| Distributions Paid From | | |
| Ordinary income | $ | 1,103,144 | | $ | 1,278,821 | |
| Long-term capital gains | — | | — | |
The book-basis character of distributions made during the year from net investment income or net realized gains may differ from their ultimate characterization for federal income tax purposes. These differences reflect the differing character of certain income items and net realized gains and losses for financial statement and tax purposes, and may result in reclassification among certain capital accounts on the financial statements.
As of period end, the federal tax cost of investments and the components of distributable earnings on a tax-basis were as follows:
| | | | | |
| Federal tax cost of investments | $ | 398,488,867 | |
| Gross tax appreciation of investments | $ | 90,864,015 | |
| Gross tax depreciation of investments | (9,743,055) | |
| Net tax appreciation (depreciation) of investments | 81,120,960 | |
| Net tax appreciation (depreciation) on translation of assets and liabilities in foreign currencies | (2,481,466) | |
| Net tax appreciation (depreciation) | $ | 78,639,494 | |
| Undistributed ordinary income | $ | 673,876 | |
| Accumulated short-term capital losses | $ | (110,701,326) | |
The difference between book-basis and tax-basis unrealized appreciation (depreciation) is attributable primarily to the tax deferral of losses on wash sales.
Accumulated capital losses represent net capital loss carryovers that may be used to offset future realized capital gains for federal income tax purposes. The capital loss carryovers may be carried forward for an unlimited period. Future capital loss carryover utilization in any given year may be subject to Internal Revenue Code limitations.
| | | | | | | | | | | | | | | | | | | | | | | | | | | | | | | | | | | | | | | | | | | | | | | |
| For a Share Outstanding Throughout the Years Ended November 30 (except as noted) |
| Per-Share Data | | | | | | Ratios and Supplemental Data | |
| | Income From Investment Operations*: | Distributions From: | | | Ratio to Average Net Assets of†: | | | |
| Net Asset
Value,
Beginning
of Period | Net Investment Income (Loss)(1) | Net
Realized
and
Unrealized
Gain (Loss) | Total From
Investment
Operations | Net
Investment
Income | Net
Realized
Gains | Total
Distributions | Net Asset
Value,
End
of Period | Total Return(2) | Operating
Expenses | Operating
Expenses
(before
expense
waiver) | Net
Investment
Income
(Loss) | Net
Investment
Income
(Loss)
(before
expense
waiver) | Portfolio
Turnover
Rate | Net
Assets,
End of
Period (in thousands) |
| Investor Class | | | | | | | | | | | | |
| 2024 | $8.49 | (0.01) | 1.03 | 1.02 | (0.02) | — | (0.02) | $9.49 | 12.01% | 1.53% | 1.54% | (0.12)% | (0.13)% | 135% | $332,565 | |
| 2023 | $8.66 | —(3) | (0.15) | (0.15) | (0.02) | — | (0.02) | $8.49 | (1.73)% | 1.53% | 1.53% | 0.03% | 0.03% | 110% | $339,990 | |
| 2022 | $13.79 | 0.01 | (3.00) | (2.99) | (0.05) | (2.09) | (2.14) | $8.66 | (25.53)% | 1.48% | 1.48% | 0.15% | 0.15% | 108% | $382,973 | |
| 2021 | $12.95 | (0.04) | 1.31 | 1.27 | — | (0.43) | (0.43) | $13.79 | 10.01% | 1.37% | 1.37% | (0.30)% | (0.30)% | 127% | $576,312 | |
| 2020 | $10.17 | (0.01) | 2.89 | 2.88 | (0.10) | — | (0.10) | $12.95 | 28.52% | 1.40% | 1.40% | (0.12)% | (0.12)% | 131% | $565,150 | |
| I Class | | | | | | | | | | | |
| 2024 | $8.63 | 0.01 | 1.05 | 1.06 | (0.04) | — | (0.04) | $9.65 | 12.27% | 1.33% | 1.34% | 0.08% | 0.07% | 135% | $132,952 | |
| 2023 | $8.81 | 0.02 | (0.16) | (0.14) | (0.04) | — | (0.04) | $8.63 | (1.62)% | 1.33% | 1.33% | 0.23% | 0.23% | 110% | $76,614 | |
| 2022 | $13.98 | 0.04 | (3.05) | (3.01) | (0.07) | (2.09) | (2.16) | $8.81 | (25.29)% | 1.28% | 1.28% | 0.35% | 0.35% | 108% | $87,392 | |
| 2021 | $13.10 | (0.01) | 1.32 | 1.31 | — | (0.43) | (0.43) | $13.98 | 10.12% | 1.17% | 1.17% | (0.10)% | (0.10)% | 127% | $141,573 | |
| 2020 | $10.29 | 0.01 | 2.92 | 2.93 | (0.12) | — | (0.12) | $13.10 | 28.84% | 1.20% | 1.20% | 0.08% | 0.08% | 131% | $94,818 | |
| A Class | | | | | | | | | | | | | |
| 2024 | $8.37 | (0.03) | 1.01 | 0.98 | — | — | — | $9.35 | 11.71% | 1.78% | 1.79% | (0.37)% | (0.38)% | 135% | $4,781 | |
| 2023 | $8.54 | (0.02) | (0.15) | (0.17) | — | — | — | $8.37 | (1.99)% | 1.78% | 1.78% | (0.22)% | (0.22)% | 110% | $4,905 | |
| 2022 | $13.62 | (0.01) | (2.97) | (2.98) | (0.01) | (2.09) | (2.10) | $8.54 | (25.68)% | 1.73% | 1.73% | (0.10)% | (0.10)% | 108% | $5,073 | |
| 2021 | $12.83 | (0.08) | 1.30 | 1.22 | — | (0.43) | (0.43) | $13.62 | 9.70% | 1.62% | 1.62% | (0.55)% | (0.55)% | 127% | $8,220 | |
| 2020 | $10.07 | (0.04) | 2.87 | 2.83 | (0.07) | — | (0.07) | $12.83 | 28.28% | 1.65% | 1.65% | (0.37)% | (0.37)% | 131% | $7,214 | |
| C Class | | | | | | | | | | | | | |
| 2024 | $7.72 | (0.10) | 0.94 | 0.84 | — | — | — | $8.56 | 10.88% | 2.53% | 2.54% | (1.12)% | (1.13)% | 135% | $120 | |
| 2023 | $7.93 | (0.08) | (0.13) | (0.21) | — | — | — | $7.72 | (2.65)% | 2.53% | 2.53% | (0.97)% | (0.97)% | 110% | $214 | |
| 2022 | $12.87 | (0.09) | (2.76) | (2.85) | — | (2.09) | (2.09) | $7.93 | (26.27)% | 2.48% | 2.48% | (0.85)% | (0.85)% | 108% | $264 | |
| 2021 | $12.23 | (0.17) | 1.24 | 1.07 | — | (0.43) | (0.43) | $12.87 | 8.93% | 2.37% | 2.37% | (1.30)% | (1.30)% | 127% | $667 | |
| 2020 | $9.61 | (0.11) | 2.73 | 2.62 | — | — | — | $12.23 | 27.26% | 2.40% | 2.40% | (1.12)% | (1.12)% | 131% | $981 | |
| R Class | | | | | | | | | | | | | |
| 2024 | $8.20 | (0.05) | 0.99 | 0.94 | — | — | — | $9.14 | 11.46% | 2.03% | 2.04% | (0.62)% | (0.63)% | 135% | $904 | |
| 2023 | $8.39 | (0.04) | (0.15) | (0.19) | — | — | — | $8.20 | (2.26)% | 2.03% | 2.03% | (0.47)% | (0.47)% | 110% | $1,089 | |
| 2022 | $13.43 | (0.03) | (2.92) | (2.95) | — | (2.09) | (2.09) | $8.39 | (25.85)% | 1.98% | 1.98% | (0.35)% | (0.35)% | 108% | $1,734 | |
| 2021 | $12.69 | (0.11) | 1.28 | 1.17 | — | (0.43) | (0.43) | $13.43 | 9.41% | 1.87% | 1.87% | (0.80)% | (0.80)% | 127% | $1,954 | |
| 2020 | $9.96 | (0.07) | 2.84 | 2.77 | (0.04) | — | (0.04) | $12.69 | 27.96% | 1.90% | 1.90% | (0.62)% | (0.62)% | 131% | $1,398 | |
| | |
| Notes to Financial Highlights |
(1)Computed using average shares outstanding throughout the period.
(2)Total returns are calculated based on the net asset value of the last business day and do not reflect applicable sales charges, if any. Total returns for periods less than one year are not annualized.
(3)Per-share amount was less than $0.005.
*The amount shown for a share outstanding throughout the period may not correlate with the Statement(s) of Operations or precisely reflect the class expense differentials due to the timing of transactions in shares of a fund in relation to income earned and/or fluctuations in the fair value of a fund's investments.
†Ratios for periods less than one year are annualized. Zero balances may reflect amounts less than 0.005%.
See Notes to Financial Statements.
| | |
| Report of Independent Registered Public Accounting Firm |
To the shareholders of the International Opportunities Fund and the Board of Directors of American Century World Mutual Funds, Inc.
Opinion on the Financial Statements and Financial Highlights
We have audited the accompanying statement of assets and liabilities, including the schedule of investments, of International Opportunities Fund (the “Fund”), one of the funds constituting the American Century World Mutual Funds, Inc., as of November 30, 2024, the related statement of operations for the year then ended, the statements of changes in net assets for each of the two years in the period then ended, the financial highlights for each of the five years in the period then ended, and the related notes. In our opinion, the financial statements and financial highlights present fairly, in all material respects, the financial position of the Fund as of November 30, 2024, and the results of its operations for the year then ended, the changes in its net assets for each of the two years in the period then ended, and the financial highlights for each of the five years in the period then ended, in conformity with accounting principles generally accepted in the United States of America.
Basis for Opinion
These financial statements and financial highlights are the responsibility of the Fund's management. Our responsibility is to express an opinion on the Fund’s financial statements and financial highlights based on our audits. We are a public accounting firm registered with the Public Company Accounting Oversight Board (United States) (PCAOB) and are required to be independent with respect to the Fund in accordance with the U.S. federal securities laws and the applicable rules and regulations of the Securities and Exchange Commission and the PCAOB.
We conducted our audits in accordance with the standards of the PCAOB. Those standards require that we plan and perform the audit to obtain reasonable assurance about whether the financial statements and financial highlights are free of material misstatement, whether due to error or fraud. The Fund is not required to have, nor were we engaged to perform, an audit of its internal control over financial reporting. As part of our audits, we are required to obtain an understanding of internal control over financial reporting but not for the purpose of expressing an opinion on the effectiveness of the Fund’s internal control over financial reporting. Accordingly, we express no such opinion.
Our audits included performing procedures to assess the risks of material misstatement of the financial statements and financial highlights, whether due to error or fraud, and performing procedures that respond to those risks. Such procedures included examining, on a test basis, evidence regarding the amounts and disclosures in the financial statements and financial highlights. Our audits also included evaluating the accounting principles used and significant estimates made by management, as well as evaluating the overall presentation of the financial statements and financial highlights. Our procedures included confirmation of securities owned as of November 30, 2024, by correspondence with the custodian and brokers; when replies were not received from brokers, we performed other auditing procedures. We believe that our audits provide a reasonable basis for our opinion.
/s/ Deloitte & Touche LLP
Kansas City, Missouri
January 16, 2025
We have served as the auditor of one or more American Century investment companies since 1997.
| | |
| Approval of Management Agreement |
At a meeting held on June 27, 2024, the Fund’s Board of Directors (the “Board”) unanimously approved the renewal of the management agreement pursuant to which American Century Investment Management, Inc. (the “Advisor”) acts as the investment advisor for the Fund. Under the Investment Company Act of 1940 (the “Investment Company Act”), contracts for investment advisory services are required to be reviewed, evaluated, and approved by a majority of a fund’s Directors, including a majority of the independent Directors.
Prior to its consideration of the renewal of the management agreement, the Directors requested and reviewed data and information compiled by the Advisor and certain independent consultants and data providers concerning the Fund. This review was in addition to the oversight and evaluation undertaken by the Board and its committees on a continual basis and the information received was supplemental to the information that the Board and its committees receive and consider over time.
In connection with its consideration of the renewal of the management agreement, the Board’s review and evaluation of the services provided by the Advisor and its affiliates included, but was not limited to
•the nature, extent, and quality of investment management, shareholder services, distribution services, and other services provided to the Fund;
•the wide range of programs and services the Advisor and other service providers provide to the Fund and its shareholders on a routine and non-routine basis;
•the Fund’s investment performance compared to appropriate benchmarks and/or peer groups of other mutual funds with similar investment objectives and strategies;
•the cost of owning the Fund compared to the cost of owning similarly-managed funds;
•the Advisor’s compliance policies, procedures, and regulatory experience and those of certain other service providers;
•the Advisor’s strategic plans, generally, and with respect to the Advisor’s response to investment management industry challenges;
•the Advisor’s business continuity plans, vendor management practices, and information security practices;
•the cost of services provided to the Fund, the profitability of the Fund to the Advisor, and the Advisor’s financial results of operation;
•possible economies of scale associated with the Advisor’s management of the Fund;
•any collateral benefits derived by the Advisor from the management of the Fund;
•fees and expenses associated with any investment by the Fund in other funds;
•payments to intermediaries by the Fund and the Advisor and services provided by intermediaries in connection therewith; and
•services provided and charges to the Advisor’s other investment management clients.
The Board held two meetings to consider the renewal. The independent Directors also met in private session multiple times to review and discuss the information provided in response to their request. The independent Directors held active discussions with the Advisor regarding the renewal of the management agreement, requesting supplemental information, and reviewing information provided by the Advisor in response thereto. The independent Directors had the benefit of the advice of their independent counsel throughout the process.
Factors Considered
The Directors considered all of the information provided by the Advisor, the independent consultant and data providers, and the independent Directors’ independent counsel in connection with the approval. They determined that the information was sufficient for them to evaluate the management agreement for the Fund. In connection with their review, the Directors did not identify any single factor as being all-important or controlling, and each Director may have attributed different levels of importance to different factors. In deciding to renew the management agreement, the Board based its decision on a number of factors, including without limitation the following:
Nature, Extent and Quality of Services — Generally. Under the management agreement, the Advisor is responsible for providing or arranging for all services necessary for the operation of the Fund. The Board noted that the Advisor provides or arranges at its own expense a wide variety of services which include, without limitation, the following:
•constructing and designing the Fund
•portfolio research and security selection
•initial capitalization/funding
•securities trading
•Fund administration
•custody of Fund assets
•daily valuation of the Fund’s portfolio
•liquidity monitoring and management
•risk management, including information security
•shareholder servicing and transfer agency, including shareholder confirmations, recordkeeping, and communications
•legal services (except the independent Directors’ counsel)
•regulatory and portfolio compliance
•financial reporting
•marketing and distribution (except amounts paid by the Fund under Rule 12b-1 plans)
The Board noted that many of these services have expanded over time in terms of both quantity and complexity in response to shareholder demands, competition in the industry, changing distribution channels, and the changing regulatory environment.
Investment Management Services. The nature of the investment management services provided to the Fund is quite complex and allows Fund shareholders access to professional money management, instant diversification of their investments, the opportunity to easily diversify among asset classes by investing in or exchanging among various American Century Investments funds, and liquidity. In evaluating investment performance, the Board expects the Advisor to manage the Fund in accordance with its investment objectives and principal investment strategies. Further, the Directors recognize that the Advisor has an obligation to monitor trading activities, and in particular to seek the best execution of fund trades, and to evaluate the use of and payment for research. In providing these services, the Advisor utilizes teams of investment professionals who require extensive information technology, research, training, compliance, and other systems to conduct their business. The Board, directly and through its Fund Performance Review Committee, provides oversight of the investment performance process. It regularly reviews investment performance information for the Fund, together with comparative information for appropriate benchmarks and/or peer groups of similarly-managed funds, over different time horizons. The Directors also review investment performance information from both the Advisor and an independent third party during the management agreement renewal process. If performance concerns are identified, the Board discusses with the Advisor the reasons for such results and any actions being taken to improve performance and may conduct special reviews until performance improves. The Fund’s performance was above its benchmark for the five- and ten-year periods and below its benchmark for the one- and three-year periods reviewed by the Board. In relation to industry peers, the Fund was below the median of its peer performance universe as identified by a third-party service provider for the one-, three-, five-, and ten-year periods. The Board discussed the Fund’s performance with the Advisor, including steps being taken to address underperformance, and was satisfied with the efforts being undertaken by the Advisor. The Board found the investment management services provided by the Advisor to the Fund to be satisfactory and consistent with the management agreement.
Shareholder and Other Services. Under the management agreement, the Advisor provides the Fund with a comprehensive package of transfer agency, shareholder, and other services. The Board, directly and through its various committees, regularly reviews reports and evaluations of such services at its regular meetings. These reports include, but are not limited to, information regarding the operational efficiency and accuracy of the shareholder and transfer agency services provided, staffing levels, shareholder satisfaction, technology support (including information security), new products and services offered to Fund shareholders, securities trading activities, portfolio valuation services, auditing services, and legal and operational compliance activities. The Board found the services provided by the Advisor to the Fund under the management agreement to be competitive and of high quality.
Costs of Services and Profitability. The Advisor provides detailed information concerning its cost of providing various services to the Fund, its profitability in managing the Fund (pre- and post-distribution), and its financial results of operation. The Directors have reviewed with the Advisor the methodology used to prepare this financial information and arranged for an independent consultant to confirm the reasonableness of the allocation methodology used. This information is considered in evaluating the Advisor’s financial condition, its ability to continue to provide services under the management agreement, and the reasonableness of the terms of the current management agreement. The Board concluded that the Advisor’s profits were reasonable in light of the services provided to the Fund.
Ethics. The Board generally considers the Advisor’s commitment to providing quality services to shareholders and to conducting its business ethically. They noted that the Advisor’s practices generally meet or exceed industry best practices.
Economies of Scale. The Board also reviewed information provided by the Advisor regarding the possible existence of economies of scale in connection with the management of the Fund. The Board concluded that economies of scale are difficult to measure and predict with precision, especially on a fund-by-fund basis. The Board concluded that the Advisor is sharing economies of scale, to the extent they exist, through its fee structure, and through reinvestment in its business, infrastructure, investment capabilities and initiatives to provide shareholders enhanced and expanded content and services. The Board also noted that economies of scale are shared with the Fund and its shareholders through management fee breakpoints that serve to reduce the effective management fee as the assets of the Fund grow. Assets of various classes of the same Fund or similarly-managed products are combined with the assets of the Fund to help achieve those breakpoints.
Comparison to Other Funds’ Fees. The management agreement provides that the Fund pays the Advisor a single, all-inclusive (or unified) management fee for providing all services necessary for the management and operation of the Fund, other than brokerage and other transaction fees and expenses relating to acquisition and disposition of portfolio securities, acquired fund fees and expenses, taxes, interest, extraordinary expenses, fund litigation expenses, fees and expenses of the Fund’s independent Directors (including their independent legal counsel), and expenses incurred in connection with the provision of shareholder services and distribution services under a plan adopted pursuant to Investment Company Act Rule 12b-1. Under the unified fee structure, the Advisor is responsible for providing all investment advisory, custody, audit, administrative, compliance, recordkeeping, marketing and shareholder services, or arranging and supervising third parties to provide such services. By contrast, most other funds are charged a variety of fees, including an investment advisory fee, a transfer agency fee, an
administrative fee, distribution charges, and other expenses. Other than their investment advisory fees and any applicable Rule 12b-1 distribution fees, all other components of the total fees charged by these other funds may be increased without shareholder approval. The Board believes the unified fee structure is a benefit to Fund shareholders because it clearly discloses to shareholders the cost of owning Fund shares, and, since the unified fee cannot be increased without a vote of Fund shareholders, it shifts to the Advisor the risk of increased costs of operating the Fund and provides a direct incentive to minimize administrative inefficiencies. Part of the Board’s analysis of fee levels involves reviewing certain evaluative data compiled by an independent provider comparing the Fund’s unified fee to the total expense ratios of its peers. The unified fee charged to shareholders of the Fund was above the median of the total expense ratios of the Fund’s peer expense universe. In addition, the Board reviewed the Fund’s position relative to the narrower set of its expense group peers. The Board and the Advisor agreed to a change in the fee schedule for the Fund that should result in a reduction of the Fund’s management fee beginning August 1, 2024. The Board and the Advisor also agreed to a temporary reduction of the Fund’s annual unified management fee of 0.05% for at least one year beginning August 1, 2024. The Board concluded that the management fee paid by the Fund to the Advisor under the management agreement is reasonable in light of the services provided to the Fund.
Comparison to Fees and Services Provided to Other Clients of the Advisor. The Board also requested and received information from the Advisor concerning the nature of the services, fees, costs, and profitability of its advisory services to advisory clients other than the Fund. They observed that these varying types of client accounts require different services and involve different regulatory and entrepreneurial risks than the management of the Fund. The Board analyzed this information and concluded that the fees charged and services provided to the Fund were reasonable by comparison.
Payments to Intermediaries. The Directors also requested and received a description of payments made to intermediaries by the Fund and the Advisor and services provided in response thereto. These payments include various payments made by the Fund or the Advisor to different types of intermediaries and recordkeepers for distribution and service activities provided for the Fund. The Directors reviewed such information and received representations from the Advisor that all such payments by the Fund were made pursuant to the Fund’s Rule 12b-1 Plan and that all such payments by the Advisor were made from the Advisor’s resources and reasonable profits.
Collateral or “Fall-Out” Benefits Derived by the Advisor. The Board considered the possible existence of collateral benefits the Advisor may receive as a result of its relationship with the Fund. They concluded that the Advisor’s primary business is managing funds and it generally does not use fund or shareholder information to generate profits in other lines of business, and therefore does not derive any significant collateral benefits from them. To the extent there are potential collateral benefits, the Board has been advised and has taken this into consideration in its review of the management contract with the Fund. The Board noted that additional assets from other clients may offer the Advisor some benefit from increased leverage with prospective clients, service providers, and counterparties. Additionally, the Advisor may receive proprietary research from broker-dealers that execute fund portfolio transactions, which the Board concluded is likely to benefit other clients of the Advisor, as well as Fund shareholders. The Board also determined that the Advisor is able to provide investment management services to certain clients other than the Fund, at least in part, due to its existing infrastructure built to serve the fund complex. The Board concluded that appropriate allocation methodologies had been employed to assign resources and the cost of those resources to these other clients[and these other client assets are included with the assets of the Fund to determine breakpoints in the management fee schedule.
Existing Relationship. The Board also considered whether there was any reason for not continuing the existing arrangement with the Advisor. In this regard, the Board was mindful of the potential disruptions of the Fund’s operations and various risks, uncertainties, and other effects that could occur as a result of a decision not to continue such relationship. In particular, the Board recognized that most shareholders have invested in the Fund on the strength of the Advisor’s industry standing and reputation and in the expectation that the Advisor will have a continuing role in providing advisory services to the Fund.
Conclusion of the Directors. As a result of this process, the Board, including all of the independent Directors, taking into account all of the factors discussed above and the information provided by the Advisor and others in connection with its review and received over time, determined that the terms of the management agreement are fair and reasonable and that the management fee charged to the Fund is reasonable in light of the services provided and that the management agreement between the Fund and the Advisor should be renewed for an additional one-year period.
Other Tax Information
The following information is provided pursuant to provisions of the Internal Revenue Code.
The fund hereby designates up to the maximum amount allowable as qualified dividend income for the fiscal year ended November 30, 2024.
For the fiscal year ended November 30, 2024, the fund intends to pass through to shareholders foreign source income of $5,910,319 and foreign taxes paid of $2,335,917, or up to the maximum amount allowable, as a foreign tax credit. Foreign source income and foreign tax expense per outstanding share on November 30, 2024 are $0.1195 and $0.0472, respectively.
| | | | | | | | |
| Contact Us | americancentury.com | |
| Automated Information Line | 1-800-345-8765 | |
| Investor Services Representative | 1-800-345-2021
or 816-531-5575 | |
| Banks and Trust Companies, Broker-Dealers, Financial Professionals, Insurance Companies | 1-800-345-6488 | |
| | |
| This report and the statements it contains are submitted for the general information of our shareholders. The report is not authorized for distribution to prospective investors unless preceded or accompanied by an effective prospectus. | |
| | |
©2025 American Century Proprietary Holdings, Inc. All rights reserved.
CL-ANN-91032 2501 | |
| | | | | |
| |
| Annual Financial Statements and Other Information |
| |
| November 30, 2024 |
| |
| International Small-Mid Cap Fund |
| Investor Class (ANTSX) |
| G Class (ANTMX) |
| | | | | |
| Schedule of Investments | |
| Statement of Assets and Liabilities | |
| Statement of Operations | |
| Statement of Changes in Net Assets | |
| Notes to Financial Statements | |
| Financial Highlights | |
| Report of Independent Registered Public Accounting Firm | |
| Approval of Management Agreement | |
| |
| Other Tax Information | |
NOVEMBER 30, 2024
| | | | | | | | |
| Shares | Value |
| COMMON STOCKS — 98.4% | | |
| Australia — 14.4% | | |
| ALS Ltd. | 556,571 | | $ | 5,678,078 | |
Breville Group Ltd.(1) | 73,065 | | 1,606,730 | |
| CAR Group Ltd. | 187,309 | | 5,090,934 | |
| Charter Hall Retail REIT | 2,249,788 | | 5,050,237 | |
| GQG Partners, Inc. | 1,785,293 | | 2,747,889 | |
Guzman y Gomez Ltd.(1)(2) | 107,884 | | 3,032,319 | |
| JB Hi-Fi Ltd. | 59,901 | | 3,564,754 | |
NEXTDC Ltd.(2) | 634,952 | | 6,773,172 | |
| Pro Medicus Ltd. | 27,155 | | 4,481,475 | |
| Reliance Worldwide Corp. Ltd. | 1,968,463 | | 7,039,653 | |
Sandfire Resources Ltd.(2) | 1,040,478 | | 7,091,649 | |
SGH Ltd.(1) | 198,602 | | 6,438,506 | |
Telix Pharmaceuticals Ltd.(2) | 399,989 | | 6,483,955 | |
| Ventia Services Group Pty. Ltd. | 2,403,019 | | 7,153,810 | |
Zip Co. Ltd.(2) | 3,083,604 | | 6,923,532 | |
| | 79,156,693 | |
| Belgium — 1.7% | | |
| Aedifica SA | 62,559 | | 3,841,408 | |
D'ieteren Group(1) | 13,223 | | 2,827,990 | |
| Solvay SA | 72,919 | | 2,530,532 | |
| | 9,199,930 | |
| Canada — 10.7% | | |
| Alamos Gold, Inc., Class A | 292,025 | | 5,550,363 | |
Aritzia, Inc.(2) | 86,661 | | 2,886,946 | |
| AtkinsRealis Group, Inc. | 147,743 | | 8,022,159 | |
Bombardier, Inc., Class B(2) | 61,492 | | 4,250,263 | |
Brookfield Infrastructure Corp., Class A(1) | 134,419 | | 6,034,069 | |
Capstone Copper Corp.(2) | 804,804 | | 5,564,446 | |
Cargojet, Inc.(1) | 34,801 | | 3,005,208 | |
| Colliers International Group, Inc. | 18,839 | | 2,888,319 | |
Descartes Systems Group, Inc.(2) | 47,148 | | 5,559,898 | |
| Element Fleet Management Corp. | 165,875 | | 3,518,794 | |
| FirstService Corp. | 33,233 | | 6,453,516 | |
| Hudbay Minerals, Inc. | 296,360 | | 2,643,860 | |
Kinaxis, Inc.(2) | 15,630 | | 2,048,238 | |
| | 58,426,079 | |
| Denmark — 1.9% | | |
ALK-Abello AS(2) | 170,965 | | 3,932,779 | |
| H Lundbeck AS | 424,106 | | 2,646,399 | |
| Royal Unibrew AS | 54,304 | | 4,099,048 | |
| | 10,678,226 | |
| Finland — 1.2% | | |
| Konecranes OYJ | 100,840 | | 6,825,834 | |
| France — 3.1% | | |
| Elis SA | 89,347 | | 1,820,525 | |
Gaztransport Et Technigaz SA(1) | 36,497 | | 5,314,138 | |
| Nexans SA | 43,587 | | 4,946,600 | |
| SPIE SA | 85,503 | | 2,694,908 | |
| | | | | | | | |
| Shares | Value |
| Virbac SACA | 7,248 | | $ | 2,483,977 | |
| | 17,260,148 | |
| Germany — 4.1% | | |
| CTS Eventim AG & Co. KGaA | 40,783 | | 3,609,427 | |
Nordex SE(2) | 333,653 | | 4,228,195 | |
Redcare Pharmacy NV(2) | 37,637 | | 5,939,570 | |
| Scout24 SE | 48,601 | | 4,382,217 | |
| Stroeer SE & Co. KGaA | 31,198 | | 1,611,170 | |
TAG Immobilien AG(2) | 162,145 | | 2,698,323 | |
| | 22,468,902 | |
| Israel — 1.7% | | |
CyberArk Software Ltd.(2) | 19,683 | | 6,367,647 | |
Nova Ltd.(2) | 14,847 | | 2,728,285 | |
| | 9,095,932 | |
| Italy — 1.0% | | |
BPER Banca SpA(1) | 898,452 | | 5,483,213 | |
| Japan — 28.6% | | |
| Asics Corp. | 418,000 | | 8,445,007 | |
| BayCurrent, Inc. | 208,800 | | 7,571,558 | |
| BIPROGY, Inc. | 89,900 | | 2,803,855 | |
CyberAgent, Inc.(1) | 245,000 | | 1,708,053 | |
| Daiei Kankyo Co. Ltd. | 306,700 | | 6,173,801 | |
Fukuoka Financial Group, Inc.(1) | 269,900 | | 7,477,653 | |
| Furukawa Electric Co. Ltd. | 33,000 | | 1,362,419 | |
GENDA, Inc.(2) | 297,700 | | 5,072,286 | |
| Integral Corp. | 109,700 | | 2,629,779 | |
| Isetan Mitsukoshi Holdings Ltd. | 188,300 | | 2,687,762 | |
| Kinden Corp. | 297,500 | | 6,138,681 | |
| Kyushu Railway Co. | 208,900 | | 5,499,638 | |
| Lifedrink Co., Inc. | 228,500 | | 3,811,715 | |
| Maruwa Co. Ltd. | 20,600 | | 5,895,274 | |
| Mebuki Financial Group, Inc. | 1,776,100 | | 7,888,646 | |
Micronics Japan Co. Ltd.(1) | 120,300 | | 3,024,594 | |
| Miura Co. Ltd. | 156,900 | | 3,932,277 | |
Money Forward, Inc.(2) | 99,900 | | 3,160,891 | |
| MonotaRO Co. Ltd. | 186,900 | | 3,339,221 | |
| Nippon Gas Co. Ltd. | 114,100 | | 1,571,589 | |
| Organo Corp. | 80,700 | | 4,621,755 | |
PeptiDream, Inc.(2) | 293,600 | | 5,791,608 | |
| Round One Corp. | 758,200 | | 5,261,055 | |
| Ryohin Keikaku Co. Ltd. | 277,500 | | 5,709,973 | |
| Sanrio Co. Ltd. | 248,900 | | 8,244,077 | |
| Santen Pharmaceutical Co. Ltd. | 394,000 | | 4,537,285 | |
| Sanwa Holdings Corp. | 194,100 | | 5,862,377 | |
| Tokyo Ohka Kogyo Co. Ltd. | 231,000 | | 5,543,327 | |
| Tokyo Tatemono Co. Ltd. | 409,300 | | 7,077,117 | |
| Tomy Co. Ltd. | 210,900 | | 5,982,185 | |
| Toyo Suisan Kaisha Ltd. | 62,800 | | 4,411,964 | |
| Yokogawa Electric Corp. | 168,400 | | 3,762,945 | |
| | 157,000,367 | |
| Netherlands — 2.8% | | |
| Arcadis NV | 82,893 | | 5,464,889 | |
| Fugro NV | 224,530 | | 4,071,430 | |
InPost SA(2) | 328,790 | | 5,757,715 | |
| | 15,294,034 | |
| | | | | | | | |
| Shares | Value |
| New Zealand — 1.0% | | |
| Infratil Ltd. | 714,096 | | $ | 5,422,974 | |
| Norway — 1.6% | | |
DOF Group ASA(2) | 401,355 | | 3,094,750 | |
| Subsea 7 SA | 347,376 | | 5,500,663 | |
| | 8,595,413 | |
| Singapore — 1.5% | | |
| SATS Ltd. | 3,019,500 | | 8,483,242 | |
| Spain — 2.4% | | |
Bankinter SA(1) | 343,541 | | 2,717,633 | |
| Fluidra SA | 170,075 | | 4,446,015 | |
Indra Sistemas SA(1) | 155,094 | | 2,731,133 | |
| Logista Integral SA | 102,076 | | 3,266,776 | |
| | 13,161,557 | |
| Sweden — 5.0% | | |
| AAK AB | 216,340 | | 5,863,103 | |
Beijer Ref AB(1) | 183,319 | | 2,892,190 | |
Camurus AB(2) | 26,370 | | 1,379,899 | |
| Hemnet Group AB | 133,751 | | 4,020,291 | |
| MIPS AB | 83,596 | | 3,714,825 | |
| Munters Group AB | 169,257 | | 2,694,959 | |
| Saab AB, Class B | 120,567 | | 2,643,564 | |
| Thule Group AB | 136,453 | | 4,298,229 | |
| | 27,507,060 | |
| Switzerland — 3.4% | | |
Flughafen Zurich AG(1) | 23,618 | | 5,622,399 | |
| PSP Swiss Property AG | 21,009 | | 3,063,599 | |
| Swissquote Group Holding SA | 17,373 | | 6,836,002 | |
| Ypsomed Holding AG | 7,142 | | 2,905,459 | |
| | 18,427,459 | |
| United Kingdom — 11.8% | | |
| Bellway PLC | 173,412 | | 5,536,211 | |
| Bytes Technology Group PLC | 259,590 | | 1,498,025 | |
| Diploma PLC | 127,589 | | 7,247,649 | |
| Gamma Communications PLC | 195,648 | | 3,930,440 | |
| Greggs PLC | 147,159 | | 5,063,870 | |
| Howden Joinery Group PLC | 156,376 | | 1,626,177 | |
| Intermediate Capital Group PLC | 258,993 | | 6,979,379 | |
| Just Group PLC | 2,450,199 | | 4,466,562 | |
| Marks & Spencer Group PLC | 1,448,306 | | 7,059,979 | |
| Savills PLC | 280,023 | | 3,831,435 | |
| St. James's Place PLC | 402,748 | | 4,627,678 | |
| Tritax Big Box REIT PLC | 2,314,255 | | 4,091,124 | |
| UNITE Group PLC | 245,743 | | 2,755,305 | |
| Weir Group PLC | 209,932 | | 5,939,534 | |
| | 64,653,368 | |
| United States — 0.5% | | |
| TechnipFMC PLC | 92,579 | | 2,904,203 | |
TOTAL COMMON STOCKS (Cost $446,958,423) | | 540,044,634 | |
| EXCHANGE-TRADED FUNDS — 0.7% | | |
iShares MSCI EAFE Small-Cap ETF (Cost $3,488,111) | 55,384 | | 3,543,468 | |
| | | | | | | | |
| Shares | Value |
| SHORT-TERM INVESTMENTS — 3.5% | | |
| Money Market Funds — 2.6% | | |
State Street Navigator Securities Lending Government Money Market Portfolio(3) | 14,262,983 | | $ | 14,262,983 | |
| Repurchase Agreements — 0.9% | | |
| BMO Capital Markets Corp., (collateralized by various U.S. Treasury obligations, 3.625%, 2/15/44, valued at $462,335), in a joint trading account at 4.56%, dated 11/29/24, due 12/2/24 (Delivery value $454,225) | | 454,052 | |
| Fixed Income Clearing Corp., (collateralized by various U.S. Treasury obligations, 4.125%, 7/31/31, valued at $4,586,071), at 4.57%, dated 11/29/24, due 12/2/24 (Delivery value $4,497,712) | | 4,496,000 | |
| | 4,950,052 | |
TOTAL SHORT-TERM INVESTMENTS (Cost $19,213,035) | | 19,213,035 | |
TOTAL INVESTMENT SECURITIES — 102.6% (Cost $469,659,569) | | 562,801,137 | |
| OTHER ASSETS AND LIABILITIES — (2.6)% | | (14,216,401) | |
| TOTAL NET ASSETS — 100.0% | | $ | 548,584,736 | |
| | | | | |
| MARKET SECTOR DIVERSIFICATION |
| (as a % of net assets) | |
| Industrials | 31.0% |
| Consumer Discretionary | 13.5% |
| Financials | 11.7% |
| Information Technology | 8.4% |
| Real Estate | 7.6% |
| Health Care | 6.3% |
| Consumer Staples | 5.7% |
| Materials | 5.3% |
| Communication Services | 4.4% |
| Energy | 3.1% |
| Utilities | 1.4% |
| Exchange-Traded Funds | 0.7% |
| Short-Term Investments | 3.5% |
| Other Assets and Liabilities | (2.6)% |
| | | | | | | | |
| NOTES TO SCHEDULE OF INVESTMENTS |
(1)Security, or a portion thereof, is on loan. At the period end, the aggregate value of securities on loan was $29,039,248. The amount of securities on loan indicated may not correspond with the securities on loan identified because securities with pending sales are in the process of recall from the brokers.
(2)Non-income producing.
(3)Investment of cash collateral from securities on loan. At the period end, the aggregate value of the collateral held by the fund was $30,288,641, which includes securities collateral of $16,025,658.
See Notes to Financial Statements.
| | |
| Statement of Assets and Liabilities |
| | | | | |
| NOVEMBER 30, 2024 |
| Assets |
| Investment securities, at value (cost of $455,396,586) — including $29,039,248 of securities on loan | $ | 548,538,154 | |
| Investment made with cash collateral received for securities on loan, at value (cost of $14,262,983) | 14,262,983 | |
| Total investment securities, at value (cost of $469,659,569) | 562,801,137 | |
| Cash | 20,059 | |
| Foreign currency holdings, at value (cost of $102,123) | 103,410 | |
| Receivable for investments sold | 1,239,909 | |
| Receivable for capital shares sold | 33,889 | |
| Dividends and interest receivable | 1,976,602 | |
| Securities lending receivable | 17,207 | |
| 566,192,213 | |
| |
| Liabilities | |
| Payable for collateral received for securities on loan | 14,262,983 | |
| Payable for investments purchased | 3,223,045 | |
| Payable for capital shares redeemed | 14,682 | |
| Accrued management fees | 106,767 | |
| 17,607,477 | |
| |
| Net Assets | $ | 548,584,736 | |
| |
| Net Assets Consist of: | |
| Capital (par value and paid-in surplus) | $ | 535,716,359 | |
| Distributable earnings (loss) | 12,868,377 | |
| $ | 548,584,736 | |
| | | | | | | | | | | |
| Net Assets | Shares Outstanding | Net Asset Value Per Share |
| Investor Class, $0.01 Par Value | $94,685,761 | 9,400,770 | $10.07 |
| G Class, $0.01 Par Value | $453,898,975 | 43,510,989 | $10.43 |
See Notes to Financial Statements.
| | | | | |
| YEAR ENDED NOVEMBER 30, 2024 |
| Investment Income (Loss) |
| Income: | |
| Dividends (net of foreign taxes withheld of $1,124,372) | $ | 10,349,407 | |
| Interest | 201,782 | |
| Securities lending, net | 79,596 | |
| 10,630,785 | |
| |
| Expenses: | |
| Management fees | 6,224,138 | |
| Directors' fees and expenses | 16,322 | |
| Other expenses | 17,136 | |
| 6,257,596 | |
Fees waived(1) | (4,916,235) | |
| 1,341,361 | |
| |
| Net investment income (loss) | 9,289,424 | |
| |
| Realized and Unrealized Gain (Loss) | |
| Net realized gain (loss) on: | |
| Investment transactions | 34,185,649 | |
| Foreign currency translation transactions | 333,309 | |
| 34,518,958 | |
| |
| Change in net unrealized appreciation (depreciation) on: | |
| Investments | 40,848,808 | |
| Translation of assets and liabilities in foreign currencies | (47,677) | |
| 40,801,131 | |
| |
| Net realized and unrealized gain (loss) | 75,320,089 | |
| |
| Net Increase (Decrease) in Net Assets Resulting from Operations | $ | 84,609,513 | |
(1)Amount consists of $9,533 and $4,906,702 for Investor Class and G Class, respectively.
See Notes to Financial Statements.
| | |
| Statement of Changes in Net Assets |
| | | | | | | | |
| YEARS ENDED NOVEMBER 30, 2024 AND NOVEMBER 30, 2023 |
| Increase (Decrease) in Net Assets | November 30, 2024 | November 30, 2023 |
| Operations | | |
| Net investment income (loss) | $ | 9,289,424 | | $ | 8,095,161 | |
| Net realized gain (loss) | 34,518,958 | | (45,354,758) | |
| Change in net unrealized appreciation (depreciation) | 40,801,131 | | 22,871,731 | |
| Net increase (decrease) in net assets resulting from operations | 84,609,513 | | (14,387,866) | |
| | |
| Distributions to Shareholders | | |
| From earnings: | | |
| Investor Class | (954,896) | | — | |
| G Class | (9,336,856) | | (2,818,350) | |
| Decrease in net assets from distributions | (10,291,752) | | (2,818,350) | |
| | |
| Capital Share Transactions | | |
| Net increase (decrease) in net assets from capital share transactions (Note 5) | (39,745,326) | | 62,229,419 | |
| | |
| Net increase (decrease) in net assets | 34,572,435 | | 45,023,203 | |
| | |
| Net Assets | | |
| Beginning of period | 514,012,301 | | 468,989,098 | |
| End of period | $ | 548,584,736 | | $ | 514,012,301 | |
See Notes to Financial Statements.
| | |
| Notes to Financial Statements |
NOVEMBER 30, 2024
1. Organization
American Century World Mutual Funds, Inc. (the corporation) is registered under the Investment Company Act of 1940, as amended (the 1940 Act), as an open-end management investment company and is organized as a Maryland corporation. International Small-Mid Cap Fund (the fund) is one fund in a series issued by the corporation. The fund’s investment objective is to seek capital growth. The fund offers the Investor Class and G Class.
2. Significant Accounting Policies
The following is a summary of significant accounting policies consistently followed by the fund in preparation of its financial statements. The fund is an investment company and follows accounting and reporting guidance in accordance with accounting principles generally accepted in the United States of America. This may require management to make certain estimates and assumptions at the date of the financial statements. Actual results could differ from these estimates. Management evaluated the impact of events or transactions occurring through the date the financial statements were issued that would merit recognition or disclosure.
Investment Valuations — The fund determines the fair value of its investments and computes its net asset value (NAV) per share at the close of regular trading (usually 4 p.m. Eastern time) on the New York Stock Exchange (NYSE) on each day the NYSE is open. The value of investments of the fund is determined by American Century Investment Management, Inc. (ACIM) (the investment advisor), as the valuation designee, pursuant to its valuation policies and procedures. The Board of Directors oversees the valuation designee and reviews its valuation policies and procedures at least annually.
Equity securities that are listed or traded on a domestic securities exchange are valued at the last reported sales price or at the official closing price as provided by the exchange. Equity securities traded on foreign securities exchanges are generally valued at the closing price of such securities on the exchange where primarily traded or at the close of the NYSE, if that is earlier. If no last sales price is reported, or if local convention or regulation so provides, the mean of the latest bid and asked prices may be used. Securities traded over-the-counter are valued at the mean of the latest bid and asked prices, the last sales price, or the official closing price.
Open-end management investment companies are valued at the reported NAV per share. Repurchase agreements are valued at cost, which approximates fair value.
If the valuation designee determines that the market price for a portfolio security is not readily available or is believed by the valuation designee to be unreliable, such security is valued at fair value as determined in good faith by the valuation designee, in accordance with its policies and procedures. Circumstances that may cause the fund to determine that market quotations are not available or reliable include, but are not limited to: when there is a significant event subsequent to the market quotation; trading in a security has been halted during the trading day; or trading in a security is insufficient or did not take place due to a closure or holiday.
The valuation designee monitors for significant events occurring after the close of an investment’s primary exchange but before the fund’s NAV per share is determined. Significant events may include, but are not limited to: corporate announcements and transactions; regulatory news, governmental action and political unrest that could impact a specific investment or an investment sector; or armed conflicts, natural disasters and similar events that could affect investments in a specific country or region. The valuation designee also monitors for significant fluctuations between domestic and foreign markets, as evidenced by the U.S. market or such other indicators that it deems appropriate. The valuation designee may apply a model-derived factor to the closing price of equity securities traded on foreign securities exchanges. The factor is based on observable market data as provided by an independent pricing service.
Foreign Currency Translations — All assets and liabilities, including investment securities and other financial instruments, initially expressed in foreign currencies are translated into U.S. dollars each day at the mean of the appropriate currency exchange rate at the close of the NYSE as provided by an independent pricing service. The fund may enter into spot foreign currency exchange contracts to facilitate transactions denominated in a foreign currency. Purchases and sales of investment securities, dividend and interest income, spot foreign currency exchange contracts, and expenses are translated at the rates of exchange prevailing on the respective dates of such transactions. Net realized and unrealized foreign currency exchange gains or losses related to investment securities are a component of net realized gain (loss) on investment transactions and change in net unrealized appreciation (depreciation) on investments, respectively.
Security Transactions — Security transactions are accounted for as of the trade date. Net realized gains and losses are determined on the identified cost basis, which is also used for federal income tax purposes.
Investment Income — Dividend income less foreign taxes withheld, if any, is recorded as of the ex-dividend date. Distributions received on securities that represent a return of capital or long-term capital gain are recorded as a reduction of cost of investments and/or as a realized gain. The fund may estimate the components of distributions received that may be considered nontaxable distributions or long-term capital gain distributions for income tax purposes. Interest income is recorded on the accrual basis and includes accretion of discounts and amortization of premiums. Securities lending income is net of fees and rebates earned by the lending agent for its services.
Repurchase Agreements — The fund may enter into repurchase agreements with institutions that ACIM has determined are creditworthy pursuant to criteria adopted by the Board of Directors. The fund requires that the collateral, represented by securities, received in a repurchase transaction be transferred to the custodian in a manner sufficient to enable the fund to obtain those securities in the event of a default under the repurchase agreement. ACIM monitors, on a daily basis, the securities transferred to ensure the value, including accrued interest, of the securities under each repurchase agreement is equal to or greater than amounts owed to the fund under each repurchase agreement.
Joint Trading Account — Pursuant to an Exemptive Order issued by the Securities and Exchange Commission, the fund, along with certain other funds in the American Century Investments family of funds, may transfer uninvested cash balances into a joint trading account. These balances are invested in one or more repurchase agreements that are collateralized by U.S. Treasury or Agency obligations.
Income Tax Status — It is the fund's policy to distribute substantially all net investment income and net realized gains to shareholders and to otherwise qualify as a regulated investment company under provisions of the Internal Revenue Code. Accordingly, no provision has been made for income taxes. The fund files U.S. federal, state, local and non-U.S. tax returns as applicable. The fund's tax returns are subject to examination by the relevant taxing authority until expiration of the applicable statute of limitations, which is generally three years from the date of filing but can be longer in certain jurisdictions. At this time, management believes there are no uncertain tax positions which, based on their technical merit, would not be sustained upon examination and for which it is reasonably possible that the total amounts of unrecognized tax benefits will significantly change in the next twelve months.
Multiple Class — All shares of the fund represent an equal pro rata interest in the net assets of the class to which such shares belong, and have identical voting, dividend, liquidation and other rights and the same terms and conditions, except for class specific expenses and exclusive rights to vote on matters affecting only individual classes. Income, non-class specific expenses, and realized and unrealized capital gains and losses of the fund are allocated to each class of shares based on their relative net assets.
Distributions to Shareholders — Distributions from net investment income and net realized gains, if any, are generally declared and paid annually. The fund may make distributions on a more frequent basis to comply with the distribution requirements of the Internal Revenue Code, in all events in a manner consistent with provisions of the 1940 Act.
Indemnifications — Under the corporation’s organizational documents, its officers and directors are indemnified against certain liabilities arising out of the performance of their duties to the fund. In addition, in the normal course of business, the fund enters into contracts that provide general indemnifications. The maximum exposure under these arrangements is unknown as this would involve future claims that may be made against a fund. The risk of material loss from such claims is considered by management to be remote.
Securities Lending — Securities are lent to qualified financial institutions and brokers. State Street Bank & Trust Co. serves as securities lending agent to the fund pursuant to a Securities Lending Agreement. The lending of securities exposes the fund to risks such as: the borrowers may fail to return the loaned securities, the borrowers may not be able to provide additional collateral, the fund may experience delays in recovery of the loaned securities or delays in access to collateral, or the fund may experience losses related to the investment collateral. To minimize certain risks, loan counterparties pledge collateral in the form of cash and/or securities. The lending agent has agreed to indemnify the fund in the case of default of any securities borrowed. Cash collateral received is invested in the State Street Navigator Securities Lending Government Money Market Portfolio, a money market mutual fund registered under the 1940 Act. The loans may also be secured by U.S. government securities in an amount at least equal to the market value of the securities loaned, plus accrued interest and dividends, determined on a daily basis and adjusted accordingly. By lending securities, the fund seeks to increase its net investment income through the receipt of interest and fees. Such income is reflected separately within the Statement of Operations. The value of loaned securities and related collateral outstanding at period end, if any, are shown on a gross basis within the Schedule of Investments and Statement of Assets and Liabilities.
The following table reflects a breakdown of transactions accounted for as secured borrowings, the gross obligation by the type of collateral pledged, and the remaining contractual maturity of those transactions as of November 30, 2024.
| | | | | | | | | | | | | | | | | |
| Remaining Contractual Maturity of Agreements |
| Overnight and Continuous | <30 days | Between 30 & 90 days | >90 days | Total |
Securities Lending Transactions(1) | | | | |
| Common Stocks | $ | 14,262,983 | | — | | — | | — | | $ | 14,262,983 | |
| Gross amount of recognized liabilities for securities lending transactions | $ | 14,262,983 | |
(1)Amount represents the payable for cash collateral received for securities on loan. This will generally be in the Overnight and Continuous column as the securities are typically callable on demand.
3. Fees and Transactions with Related Parties
Certain officers and directors of the corporation are also officers and/or directors of American Century Companies, Inc. (ACC). The corporation's investment advisor, ACIM, the corporation's distributor, American Century Investment Services, Inc., and the corporation's transfer agent, American Century Services, LLC, are wholly owned, directly or indirectly, by ACC. Various funds issued by American Century Asset Allocation Portfolios, Inc. own, in aggregate, 53% of the shares of the fund. Related parties do not invest in the fund for the purpose of exercising management or control.
Management Fees — The corporation has entered into a management agreement with ACIM, under which ACIM provides the fund with investment advisory and management services in exchange for a single, unified management fee (the fee) per class. The agreement provides that ACIM will pay all expenses of managing and operating the fund, except brokerage expenses, taxes, interest, fees and expenses of the independent directors (including legal counsel fees), and extraordinary expenses. The fee is computed and accrued daily based on each class's daily net assets and paid monthly in arrears. The difference in the fee among the classes is a result of their separate arrangements for non-Rule 12b-1 shareholder services. It is not the result of any difference in advisory or custodial fees or other expenses related to the management of the fund’s assets, which do not vary by class. Effective August 1, 2024, the investment advisor agreed to waive 0.03% of the fund's management fee. The investment advisor expects this waiver to continue until July 31, 2025 and cannot terminate it prior to such date without the approval of the Board of Directors. The investment advisor agreed to waive the G Class's management fee in its entirety. The investment advisor expects this waiver to remain in effect permanently and cannot terminate it without the approval of the Board of Directors.
The annual management fee and the effective annual management fee after waiver for each class for the period ended November 30, 2024 are as follows:
| | | | | | | | |
| Annual Management Fee | Effective Annual Management Fee After Waiver |
| Investor Class | 1.43% | 1.42% |
| G Class | 1.08% | 0.00% |
Directors' Fees and Expenses — The Board of Directors is responsible for overseeing the investment advisor’s management and operations of the fund. The directors receive detailed information about the fund and its investment advisor regularly throughout the year, and meet at least quarterly with management of the investment advisor to review reports about fund operations. The fund's officers do not receive compensation from the fund.
Other Expenses — A fund’s other expenses may include interest charges, clearing exchange fees, proxy solicitation expenses, fees associated with the recovery of foreign tax reclaims and other miscellaneous expenses.
Interfund Transactions — The fund may enter into security transactions with other American Century Investments funds and other client accounts of the investment advisor, in accordance with the 1940 Act rules and procedures adopted by the Board of Directors. The rules and procedures require, among other things, that these transactions be effected at the independent current market price of the security. During the period, the interfund purchases and sales were $141,006 and $356,761, respectively. The effect of interfund transactions on the Statement of Operations was $3,441 in net realized gain (loss) on investment transactions.
4. Investment Transactions
Purchases and sales of investment securities, excluding short-term investments, for the period ended November 30, 2024 were $593,262,571 and $634,762,473, respectively.
5. Capital Share Transactions
Transactions in shares of the fund were as follows:
| | | | | | | | | | | | | | |
| Year ended
November 30, 2024 | Year ended
November 30, 2023 |
| Shares | Amount | Shares | Amount |
| Investor Class/Shares Authorized | 120,000,000 | | | 120,000,000 | | |
| Sold | 113,436 | | $ | 1,012,985 | | 851,862 | | $ | 7,722,842 | |
| Issued in reinvestment of distributions | 105,165 | | 954,896 | | — | | — | |
| Redeemed | (142,208) | | (1,328,450) | | (77,887) | | (720,167) | |
| 76,393 | | 639,431 | | 773,975 | | 7,002,675 | |
| G Class/Shares Authorized | 500,000,000 | | | 500,000,000 | | |
| Sold | 4,102,796 | | 41,720,151 | | 8,197,516 | | 75,190,723 | |
| Issued in reinvestment of distributions | 1,006,127 | | 9,336,856 | | 303,048 | | 2,818,350 | |
| Redeemed | (9,035,852) | | (91,441,764) | | (2,416,150) | | (22,782,329) | |
| (3,926,929) | | (40,384,757) | | 6,084,414 | | 55,226,744 | |
| Net increase (decrease) | (3,850,536) | | $ | (39,745,326) | | 6,858,389 | | $ | 62,229,419 | |
6. Fair Value Measurements
The fund's investments valuation process is based on several considerations and may use multiple inputs to determine the fair value of the investments held by the fund. In conformity with accounting principles generally accepted in the United States of America, the inputs used to determine a valuation are classified into three broad levels.
•Level 1 valuation inputs consist of unadjusted quoted prices in an active market for identical investments.
•Level 2 valuation inputs consist of direct or indirect observable market data (including quoted prices for comparable investments, evaluations of subsequent market events, interest rates, prepayment speeds, credit risk, etc.). These inputs also consist of quoted prices for identical investments initially expressed in local currencies that are adjusted through translation into U.S. dollars.
•Level 3 valuation inputs consist of unobservable data (including a fund’s own assumptions).
The level classification is based on the lowest level input that is significant to the fair valuation measurement. The valuation inputs are not necessarily an indication of the risks associated with investing in these securities or other financial instruments.
The following is a summary of the level classifications as of period end. The Schedule of Investments provides additional information on the fund's portfolio holdings.
| | | | | | | | | | | |
| Level 1 | Level 2 | Level 3 |
| Assets | | | |
| Investment Securities | | | |
| Common Stocks | | | |
| Canada | $ | 12,487,585 | | $ | 45,938,494 | | — | |
| Israel | 9,095,932 | | — | | — | |
| United States | 2,904,203 | | — | | — | |
| Other Countries | — | | 469,618,420 | | — | |
| Exchange-Traded Funds | 3,543,468 | | — | | — | |
| Short-Term Investments | 14,262,983 | | 4,950,052 | | — | |
| $ | 42,294,171 | | $ | 520,506,966 | | — | |
7. Risk Factors
The value of the fund’s shares will go up and down, sometimes rapidly or unpredictably, based on the performance of the securities owned by the fund and other factors generally affecting the securities market. Market risks, including political, regulatory, economic and social developments, can affect the value of the fund’s investments. Natural disasters, public health emergencies, war, terrorism and other unforeseeable events may lead to increased market volatility and may have adverse long-term effects on world economies and markets generally.
The majority of the fund is owned by a relatively small number of shareholders. To the extent that a large shareholder (including a fund of funds) invests in the fund, the fund may experience relatively large redemptions as such shareholder reallocates its assets. In the event of a large shareholder redemption, the ongoing operations of the fund may be at risk.
There are certain risks involved in investing in foreign securities. These risks include those resulting from political events (such as civil unrest, national elections and imposition of exchange controls), social and economic events (such as labor strikes and rising inflation), and natural disasters. Securities of foreign issuers may be less liquid and more volatile. Investing a significant portion of assets in one country or region may accentuate these risks.
The fund invests in common stocks of small companies. Because of this, the fund may be subject to greater risk and market fluctuations than a fund investing in larger, more established companies.
The fund's investment process may result in high portfolio turnover, which could mean high transaction costs, affecting both performance and capital gains tax liabilities to investors.
8. Federal Tax Information
On December 17, 2024, the fund declared and paid the following per-share distributions from net investment income to shareholders of record on December 16, 2024:
| | | | | |
| Investor Class | G Class |
| $0.1521 | $0.2915 |
The tax character of distributions paid during the years ended November 30, 2024 and November 30, 2023 were as follows:
| | | | | | | | |
| 2024 | 2023 |
| Distributions Paid From | | |
| Ordinary income | $ | 10,291,752 | | $ | 2,818,350 | |
| Long-term capital gains | — | | — | |
The book-basis character of distributions made during the year from net investment income or net realized gains may differ from their ultimate characterization for federal income tax purposes. These differences reflect the differing character of certain income items and net realized gains and losses for financial statement and tax purposes, and may result in reclassification among certain capital accounts on the financial statements.
As of period end, the federal tax cost of investments and the components of distributable earnings on a tax-basis were as follows:
| | | | | |
| Federal tax cost of investments | $ | 476,464,229 | |
| Gross tax appreciation of investments | $ | 96,928,364 | |
| Gross tax depreciation of investments | (10,591,456) | |
| Net tax appreciation (depreciation) of investments | 86,336,908 | |
| Net tax appreciation (depreciation) on translation of assets and liabilities in foreign currencies | (47,679) | |
| Net tax appreciation (depreciation) | $ | 86,289,229 | |
| Undistributed ordinary income | $ | 14,090,925 | |
| Accumulated short-term capital losses | $ | (87,511,777) | |
The difference between book-basis and tax-basis unrealized appreciation (depreciation) is attributable primarily to the realization to ordinary income for tax purposes of unrealized gains on investments in passive foreign investment companies.
Accumulated capital losses represent net capital loss carryovers that may be used to offset future realized capital gains for federal income tax purposes. The capital loss carryovers may be carried forward for an unlimited period. Future capital loss carryover utilization in any given year may be subject to Internal Revenue Code limitations.
| | | | | | | | | | | | | | | | | | | | | | | | | | | | | | | | | | | | | | | | | | | | | | | |
| For a Share Outstanding Throughout the Years Ended November 30 (except as noted) | |
| Per-Share Data | | | | | | Ratios and Supplemental Data | |
| | Income From Investment Operations*: | Distributions From: | | | Ratio to Average Net Assets of†: | |
| Net Asset
Value,
Beginning
of Period | Net Investment
Income (Loss)(1) | Net
Realized
and
Unrealized
Gain (Loss) | Total From
Investment
Operations | Net
Investment
Income | Net
Realized
Gains | Total
Distributions | Net
Asset
Value,
End
of Period | Total Return(2) | Operating
Expenses | Operating
Expenses
(before
expense
waiver) | Net
Investment
Income
(Loss) | Net
Investment
Income (Loss)
(before expense waiver) | Portfolio
Turnover
Rate | Net
Assets,
End of
Period
(in thousands) |
| Investor Class | | | | | | | | | | | | | | |
| 2024 | $8.82 | 0.05 | 1.30 | 1.35 | (0.10) | — | (0.10) | $10.07 | 15.45% | 1.43% | 1.44% | 0.52% | 0.51% | 109% | $94,686 | |
| 2023 | $9.21 | 0.04 | (0.43) | (0.39) | — | — | — | $8.82 | (4.23)% | 1.43% | 1.46% | 0.45% | 0.42% | 123% | $82,247 | |
| 2022 | $15.01 | 0.02 | (3.12) | (3.10) | (0.10) | (2.60) | (2.70) | $9.21 | (24.94)% | 1.44% | 1.48% | 0.20% | 0.16% | 107% | $78,762 | |
| 2021 | $13.16 | (0.06) | 2.34 | 2.28 | — | (0.43) | (0.43) | $15.01 | 17.70% | 1.44% | 1.48% | (0.39)% | (0.43)% | 113% | $105,938 | |
| 2020 | $10.61 | (0.03) | 2.76 | 2.73 | (0.18) | — | (0.18) | $13.16 | 26.24% | 1.47% | 1.48% | (0.25)% | (0.26)% | 131% | $97,901 | |
| G Class | | | | | | | | | | | | | | |
| 2024 | $9.10 | 0.20 | 1.33 | 1.53 | (0.20) | — | (0.20) | $10.43 | 17.12% | 0.01% | 1.09% | 1.94% | 0.86% | 109% | $453,899 | |
| 2023 | $9.44 | 0.18 | (0.45) | (0.27) | (0.07) | — | (0.07) | $9.10 | (2.92)% | 0.00% | 1.11% | 1.88% | 0.77% | 123% | $431,766 | |
| 2022 | $15.34 | 0.17 | (3.16) | (2.99) | (0.31) | (2.60) | (2.91) | $9.44 | (23.82)% | 0.01% | 1.13% | 1.63% | 0.51% | 107% | $390,227 | |
| 2021 | $13.36 | 0.16 | 2.35 | 2.51 | (0.10) | (0.43) | (0.53) | $15.34 | 19.45% | 0.01% | 1.13% | 1.04% | (0.08)% | 113% | $430,778 | |
| 2020 | $10.77 | 0.13 | 2.80 | 2.93 | (0.34) | — | (0.34) | $13.36 | 28.03% | 0.01% | 1.13% | 1.21% | 0.09% | 131% | $397,066 | |
| | | | | | | | |
| Notes to Financial Highlights |
(1)Computed using average shares outstanding throughout the period.
(2)Total returns are calculated based on the net asset value of the last business day. Total returns for periods less than one year are not annualized.
*The amount shown for a share outstanding throughout the period may not correlate with the Statement(s) of Operations or precisely reflect the class expense differentials due to the timing of transactions in shares of a fund in relation to income earned and/or fluctuations in the fair value of a fund's investments.
†Ratios for periods less than one year are annualized. Zero balances may reflect amounts less than 0.005%.
See Notes to Financial Statements.
| | |
| Report of Independent Registered Public Accounting Firm |
To the shareholders of the International Small-Mid Cap Fund and the Board of Directors of American Century World Mutual Funds, Inc.
Opinion on the Financial Statements and Financial Highlights
We have audited the accompanying statement of assets and liabilities, including the schedule of investments, of International Small-Mid Cap Fund (the “Fund”), one of the funds constituting American Century World Mutual Funds, Inc., as of November 30, 2024, the related statement of operations for the year then ended, the statements of changes in net assets for each of the two years in the period then ended, the financial highlights for each of the five years in the period then ended, and the related notes. In our opinion, the financial statements and financial highlights present fairly, in all material respects, the financial position of the Fund as of November 30, 2024, and the results of its operations for the year then ended, the changes in its net assets for each of the two years in the period then ended, and the financial highlights for each of the five years in the period then ended, in conformity with accounting principles generally accepted in the United States of America.
Basis for Opinion
These financial statements and financial highlights are the responsibility of the Fund's management. Our responsibility is to express an opinion on the Fund’s financial statements and financial highlights based on our audits. We are a public accounting firm registered with the Public Company Accounting Oversight Board (United States) (PCAOB) and are required to be independent with respect to the Fund in accordance with the U.S. federal securities laws and the applicable rules and regulations of the Securities and Exchange Commission and the PCAOB.
We conducted our audits in accordance with the standards of the PCAOB. Those standards require that we plan and perform the audit to obtain reasonable assurance about whether the financial statements and financial highlights are free of material misstatement, whether due to error or fraud. The Fund is not required to have, nor were we engaged to perform, an audit of its internal control over financial reporting. As part of our audits, we are required to obtain an understanding of internal control over financial reporting but not for the purpose of expressing an opinion on the effectiveness of the Fund’s internal control over financial reporting. Accordingly, we express no such opinion.
Our audits included performing procedures to assess the risks of material misstatement of the financial statements and financial highlights, whether due to error or fraud, and performing procedures that respond to those risks. Such procedures included examining, on a test basis, evidence regarding the amounts and disclosures in the financial statements and financial highlights. Our audits also included evaluating the accounting principles used and significant estimates made by management, as well as evaluating the overall presentation of the financial statements and financial highlights. Our procedures included confirmation of securities owned as of November 30, 2024, by correspondence with the custodian and brokers; when replies were not received from brokers, we performed other auditing procedures. We believe that our audits provide a reasonable basis for our opinion.
/s/ Deloitte & Touche LLP
Kansas City, Missouri
January 16, 2025
We have served as the auditor of one or more American Century investment companies since 1997.
| | |
| Approval of Management Agreement |
At a meeting held on June 27, 2024, the Fund’s Board of Directors (the “Board”) unanimously approved the renewal of the management agreement pursuant to which American Century Investment Management, Inc. (the “Advisor”) acts as the investment advisor for the Fund. Under the Investment Company Act of 1940 (the “Investment Company Act”), contracts for investment advisory services are required to be reviewed, evaluated, and approved by a majority of a fund’s Directors, including a majority of the independent Directors.
Prior to its consideration of the renewal of the management agreement, the Directors requested and reviewed data and information compiled by the Advisor and certain independent consultants and data providers concerning the Fund. This review was in addition to the oversight and evaluation undertaken by the Board and its committees on a continual basis and the information received was supplemental to the information that the Board and its committees receive and consider over time.
In connection with its consideration of the renewal of the management agreement, the Board’s review and evaluation of the services provided by the Advisor and its affiliates included, but was not limited to
•the nature, extent, and quality of investment management, shareholder services, distribution services, and other services provided to the Fund;
•the wide range of programs and services the Advisor and other service providers provide to the Fund and its shareholders on a routine and non-routine basis;
•the Fund’s investment performance compared to appropriate benchmarks and/or peer groups of other mutual funds with similar investment objectives and strategies;
•the cost of owning the Fund compared to the cost of owning similarly-managed funds;
•the Advisor’s compliance policies, procedures, and regulatory experience and those of certain other service providers;
•the Advisor’s strategic plans, generally, and with respect to the Advisor’s response to investment management industry challenges;
•the Advisor’s business continuity plans, vendor management practices, and information security practices;
•the cost of services provided to the Fund, the profitability of the Fund to the Advisor, and the Advisor’s financial results of operation;
•possible economies of scale associated with the Advisor’s management of the Fund;
•any collateral benefits derived by the Advisor from the management of the Fund;
•fees and expenses associated with any investment by the Fund in other funds;
•payments to intermediaries by the Fund and the Advisor and services provided by intermediaries in connection therewith; and
•services provided and charges to the Advisor’s other investment management clients.
The Board held two meetings to consider the renewal. The independent Directors also met in private session multiple times to review and discuss the information provided in response to their request. The independent Directors held active discussions with the Advisor regarding the renewal of the management agreement, requesting supplemental information, and reviewing information provided by the Advisor in response thereto. The independent Directors had the benefit of the advice of their independent counsel throughout the process.
Factors Considered
The Directors considered all of the information provided by the Advisor, the independent consultant and data providers, and the independent Directors’ independent counsel in connection with the approval. They determined that the information was sufficient for them to evaluate the management agreement for the Fund. In connection with their review, the Directors did not identify any single factor as being all-important or controlling, and each Director may have attributed different levels of importance to different factors. In deciding to renew the management agreement, the Board based its decision on a number of factors, including without limitation the following:
Nature, Extent and Quality of Services — Generally. Under the management agreement, the Advisor is responsible for providing or arranging for all services necessary for the operation of the Fund. The Board noted that the Advisor provides or arranges at its own expense a wide variety of services which include, without limitation, the following:
•constructing and designing the Fund
•portfolio research and security selection
•initial capitalization/funding
•securities trading
•Fund administration
•custody of Fund assets
•daily valuation of the Fund’s portfolio
•liquidity monitoring and management
•risk management, including information security
•shareholder servicing and transfer agency, including shareholder confirmations, recordkeeping, and communications
•legal services (except the independent Directors’ counsel)
•regulatory and portfolio compliance
•financial reporting
•marketing and distribution (except amounts paid by the Fund under Rule 12b-1 plans)
The Board noted that many of these services have expanded over time in terms of both quantity and complexity in response to shareholder demands, competition in the industry, changing distribution channels, and the changing regulatory environment.
Investment Management Services. The nature of the investment management services provided to the Fund is quite complex and allows Fund shareholders access to professional money management, instant diversification of their investments, the opportunity to easily diversify among asset classes by investing in or exchanging among various American Century Investments funds, and liquidity. In evaluating investment performance, the Board expects the Advisor to manage the Fund in accordance with its investment objectives and principal investment strategies. Further, the Directors recognize that the Advisor has an obligation to monitor trading activities, and in particular to seek the best execution of fund trades, and to evaluate the use of and payment for research. In providing these services, the Advisor utilizes teams of investment professionals who require extensive information technology, research, training, compliance, and other systems to conduct their business. The Board, directly and through its Fund Performance Review Committee, provides oversight of the investment performance process. It regularly reviews investment performance information for the Fund, together with comparative information for appropriate benchmarks and/or peer groups of similarly-managed funds, over different time horizons. The Directors also review investment performance information from both the Advisor and an independent third party during the management agreement renewal process. If performance concerns are identified, the Board discusses with the Advisor the reasons for such results and any actions being taken to improve performance and may conduct special reviews until performance improves. The Fund’s performance was above its benchmark for the five-year period and below its benchmark for the one- and three-year periods reviewed by the Board. In relation to industry peers, the Fund was above the median of its peer performance universe as identified by a third-party service provider for the five-year period and below the median for the one- and three-year periods. The Board discussed the Fund’s performance with the Advisor, including steps being taken to address underperformance, and was satisfied with the efforts being undertaken by the Advisor. The Board found the investment management services provided by the Advisor to the Fund to be satisfactory and consistent with the management agreement.
Shareholder and Other Services. Under the management agreement, the Advisor provides the Fund with a comprehensive package of transfer agency, shareholder, and other services. The Board, directly and through its various committees, regularly reviews reports and evaluations of such services at its regular meetings. These reports include, but are not limited to, information regarding the operational efficiency and accuracy of the shareholder and transfer agency services provided, staffing levels, shareholder satisfaction, technology support (including information security), new products and services offered to Fund shareholders, securities trading activities, portfolio valuation services, auditing services, and legal and operational compliance activities. The Board found the services provided by the Advisor to the Fund under the management agreement to be competitive and of high quality.
Costs of Services and Profitability. The Advisor provides detailed information concerning its cost of providing various services to the Fund, its profitability in managing the Fund (pre- and post-distribution), and its financial results of operation. The Directors have reviewed with the Advisor the methodology used to prepare this financial information and arranged for an independent consultant to confirm the reasonableness of the allocation methodology used. This information is considered in evaluating the Advisor’s financial condition, its ability to continue to provide services under the management agreement, and the reasonableness of the terms of the current management agreement. The Board concluded that the Advisor’s profits were reasonable in light of the services provided to the Fund.
Ethics. The Board generally considers the Advisor’s commitment to providing quality services to shareholders and to conducting its business ethically. They noted that the Advisor’s practices generally meet or exceed industry best practices.
Economies of Scale. The Board also reviewed information provided by the Advisor regarding the possible existence of economies of scale in connection with the management of the Fund. The Board concluded that economies of scale are difficult to measure and predict with precision, especially on a fund-by-fund basis. The Board concluded that the Advisor is sharing economies of scale, to the extent they exist, through its fee structure, and through reinvestment in its business, infrastructure, investment capabilities and initiatives to provide shareholders enhanced and expanded content and services.
Comparison to Other Funds’ Fees. The management agreement provides that the Fund pays the Advisor a single, all-inclusive (or unified) management fee for providing all services necessary for the management and operation of the Fund, other than brokerage and other transaction fees and expenses relating to acquisition and disposition of portfolio securities, acquired fund fees and expenses, taxes, interest, extraordinary expenses, fund litigation expenses, fees and expenses of the Fund’s independent Directors (including their independent legal counsel), and expenses incurred in connection with the provision of shareholder services and distribution services under a plan adopted pursuant to Investment Company Act Rule 12b-1. Under the unified fee structure, the Advisor is responsible for providing all investment advisory, custody, audit, administrative, compliance, recordkeeping, marketing and shareholder services, or arranging and supervising third parties to provide such services. By contrast, most other funds are charged a variety of fees, including an investment advisory fee, a transfer agency fee, an administrative fee, distribution charges, and other expenses. Other than their investment advisory fees and any applicable Rule 12b-1 distribution fees, all other components of the total fees charged by these other funds may be increased without shareholder approval. The Board believes
the unified fee structure is a benefit to Fund shareholders because it clearly discloses to shareholders the cost of owning Fund shares, and, since the unified fee cannot be increased without a vote of Fund shareholders, it shifts to the Advisor the risk of increased costs of operating the Fund and provides a direct incentive to minimize administrative inefficiencies. Part of the Board’s analysis of fee levels involves reviewing certain evaluative data compiled by an independent provider comparing the Fund’s unified fee to the total expense ratios of its peers. The unified fee charged to shareholders of the Fund was above the median of the total expense ratios of the Fund’s peer expense universe. In addition, the Board reviewed the Fund’s position relative to the narrower set of its expense group peers. The Board and the Advisor agreed to a temporary reduction of the Fund’s annual unified management fee of 0.03% (e.g., the Investor Class unified fee will be reduced from 1.43% to 1.40%) for at least one year beginning August 1, 2024. The Board concluded that the management fee paid by the Fund to the Advisor under the management agreement is reasonable in light of the services provided to the Fund.
Comparison to Fees and Services Provided to Other Clients of the Advisor. The Board also requested and received information from the Advisor concerning the nature of the services, fees, costs, and profitability of its advisory services to advisory clients other than the Fund. They observed that these varying types of client accounts require different services and involve different regulatory and entrepreneurial risks than the management of the Fund. The Board analyzed this information and concluded that the fees charged and services provided to the Fund were reasonable by comparison.
Payments to Intermediaries. The Directors also requested and received a description of payments made to intermediaries by the Fund and the Advisor and services provided in response thereto. These payments include various payments made by the Fund or the Advisor to different types of intermediaries and recordkeepers for distribution and service activities provided for the Fund. The Directors reviewed such information and received representations from the Advisor that all such payments by the Fund were made pursuant to the Fund’s Rule 12b-1 Plan and that all such payments by the Advisor were made from the Advisor’s resources and reasonable profits.
Collateral or “Fall-Out” Benefits Derived by the Advisor. The Board considered the possible existence of collateral benefits the Advisor may receive as a result of its relationship with the Fund. They concluded that the Advisor’s primary business is managing funds and it generally does not use fund or shareholder information to generate profits in other lines of business, and therefore does not derive any significant collateral benefits from them. To the extent there are potential collateral benefits, the Board has been advised and has taken this into consideration in its review of the management contract with the Fund. The Board noted that additional assets from other clients may offer the Advisor some benefit from increased leverage with prospective clients, service providers, and counterparties. Additionally, the Advisor may receive proprietary research from broker-dealers that execute fund portfolio transactions, which the Board concluded is likely to benefit other clients of the Advisor, as well as Fund shareholders. The Board also determined that the Advisor is able to provide investment management services to certain clients other than the Fund, at least in part, due to its existing infrastructure built to serve the fund complex. The Board concluded that appropriate allocation methodologies had been employed to assign resources and the cost of those resources to these other clients.
Existing Relationship. The Board also considered whether there was any reason for not continuing the existing arrangement with the Advisor. In this regard, the Board was mindful of the potential disruptions of the Fund’s operations and various risks, uncertainties, and other effects that could occur as a result of a decision not to continue such relationship. In particular, the Board recognized that most shareholders have invested in the Fund on the strength of the Advisor’s industry standing and reputation and in the expectation that the Advisor will have a continuing role in providing advisory services to the Fund.
Conclusion of the Directors. As a result of this process, the Board, including all of the independent Directors, taking into account all of the factors discussed above and the information provided by the Advisor and others in connection with its review and received over time, determined that the terms of the management agreement are fair and reasonable and that the management fee charged to the Fund is reasonable in light of the services provided and that the management agreement between the Fund and the Advisor should be renewed for an additional one-year period.
Other Tax Information
The following information is provided pursuant to provisions of the Internal Revenue Code.
The fund hereby designates up to the maximum amount allowable as qualified dividend income for the fiscal year ended November 30, 2024.
For corporate taxpayers, the fund hereby designates $187,794, or up to the maximum amount allowable, of ordinary income distributions paid during the fiscal year ended November 30, 2024 as qualified for the corporate dividends received deduction.
For the fiscal year ended November 30, 2024, the fund intends to pass through to shareholders foreign source income of $9,247,943 and foreign taxes paid of $806,361, or up to the maximum amount allowable, as a foreign tax credit. Foreign source income and foreign tax expense per outstanding share on November 30, 2024 are $0.1748 and $0.0152, respectively.
| | | | | | | | |
| Contact Us | americancentury.com | |
| Automated Information Line | 1-800-345-8765 | |
| Investor Services Representative | 1-800-345-2021
or 816-531-5575 | |
| Banks and Trust Companies, Broker-Dealers, Financial Professionals, Insurance Companies | 1-800-345-6488 | |
| | |
| This report and the statements it contains are submitted for the general information of our shareholders. The report is not authorized for distribution to prospective investors unless preceded or accompanied by an effective prospectus. | |
| | |
©2025 American Century Proprietary Holdings, Inc. All rights reserved.
CL-ANN-91025 2501 | |
| | | | | |
| |
| Annual Financial Statements and Other Information |
| |
| November 30, 2024 |
| |
| International Value Fund |
| Investor Class (ACEVX) |
| I Class (ACVUX) |
| A Class (MEQAX) |
| C Class (ACCOX) |
| R Class (ACVRX) |
| R6 Class (ACVDX) |
| G Class (ACAFX) |
| | | | | |
| Schedule of Investments | |
| Statement of Assets and Liabilities | |
| Statement of Operations | |
| Statement of Changes in Net Assets | |
| Notes to Financial Statements | |
| Financial Highlights | |
| Report of Independent Registered Public Accounting Firm | |
| Approval of Management Agreement | |
| |
| Other Tax Information | |
NOVEMBER 30, 2024
| | | | | | | | |
| | Shares | Value |
| COMMON STOCKS — 97.7% | | |
| Australia — 4.8% | | |
Ampol Ltd.(1) | 111,000 | | $ | 2,109,664 | |
| ANZ Group Holdings Ltd. | 626,217 | | 12,763,169 | |
| Aristocrat Leisure Ltd. | 133,328 | | 5,912,597 | |
| BHP Group Ltd. | 923,599 | | 24,354,592 | |
| BlueScope Steel Ltd. | 114,199 | | 1,654,727 | |
| Dexus | 430,103 | | 2,046,239 | |
| GPT Group | 572,413 | | 1,780,361 | |
| Origin Energy Ltd. | 811,010 | | 5,761,775 | |
| QBE Insurance Group Ltd. | 130,818 | | 1,709,071 | |
| Rio Tinto Ltd. | 25,712 | | 1,990,280 | |
| Scentre Group | 1,838,749 | | 4,423,519 | |
| Vicinity Ltd. | 2,887,536 | | 4,076,567 | |
| Westpac Banking Corp. | 78,799 | | 1,720,355 | |
| | | 70,302,916 | |
| Austria — 1.2% | | |
| Erste Group Bank AG | 336,306 | | 18,459,984 | |
| Belgium — 0.8% | | |
| Ageas SA | 149,316 | | 7,547,600 | |
| Anheuser-Busch InBev SA | 70,317 | | 3,778,991 | |
| | | 11,326,591 | |
| Canada — 3.7% | | |
| AltaGas Ltd. | 76,323 | | 1,866,576 | |
Great-West Lifeco, Inc.(1) | 137,072 | | 4,935,395 | |
| iA Financial Corp., Inc. | 31,327 | | 2,994,530 | |
| Manulife Financial Corp. | 333,688 | | 10,741,986 | |
| Nutrien Ltd. | 208,799 | | 9,753,548 | |
| Power Corp. of Canada | 436,676 | | 14,709,218 | |
| RioCan Real Estate Investment Trust | 208,005 | | 2,824,310 | |
| Suncor Energy, Inc. | 188,719 | | 7,509,400 | |
| | | 55,334,963 | |
| Finland — 1.6% | | |
| Nokia OYJ | 5,053,969 | | 21,228,888 | |
| UPM-Kymmene OYJ | 101,268 | | 2,664,069 | |
| | | 23,892,957 | |
| France — 12.3% | | |
| BNP Paribas SA | 296,253 | | 17,708,732 | |
| Cie de Saint-Gobain SA | 315,824 | | 28,837,691 | |
| Credit Agricole SA | 578,392 | | 7,746,323 | |
| Danone SA | 110,286 | | 7,543,526 | |
| Eiffage SA | 46,375 | | 4,187,224 | |
| Engie SA | 1,295,739 | | 20,655,297 | |
| L'Oreal SA | 15,705 | | 5,464,487 | |
| Publicis Groupe SA | 85,917 | | 9,333,153 | |
| Renault SA | 20,149 | | 864,711 | |
| Rexel SA | 300,671 | | 7,771,832 | |
| Sanofi SA | 318,520 | | 30,936,948 | |
| Societe Generale SA | 301,254 | | 7,986,981 | |
| Sodexo SA | 74,408 | | 6,187,950 | |
| | | | | | | | |
| | Shares | Value |
| STMicroelectronics NV | 96,575 | | $ | 2,476,468 | |
| Teleperformance SE | 26,902 | | 2,533,224 | |
| TotalEnergies SE | 212,750 | | 12,365,059 | |
| Veolia Environnement SA | 229,812 | | 6,699,167 | |
| Vinci SA | 22,367 | | 2,364,054 | |
| | | 181,662,827 | |
| Germany — 8.7% | | |
| Allianz SE | 70,008 | | 21,671,982 | |
| BASF SE | 276,238 | | 12,413,631 | |
| Bayerische Motoren Werke AG | 35,902 | | 2,670,229 | |
| Commerzbank AG | 281,141 | | 4,314,209 | |
| Deutsche Telekom AG | 322,271 | | 10,309,746 | |
| E.ON SE | 1,448,299 | | 18,666,933 | |
| Evonik Industries AG | 224,413 | | 4,125,666 | |
Fresenius SE & Co. KGaA(2) | 380,313 | | 13,387,339 | |
| Heidelberg Materials AG | 52,317 | | 6,615,654 | |
| Henkel AG & Co. KGaA, Preference Shares | 112,660 | | 9,619,397 | |
| Mercedes-Benz Group AG | 242,820 | | 13,651,161 | |
| RWE AG | 219,929 | | 7,419,739 | |
| Siemens AG | 16,887 | | 3,280,428 | |
| | | 128,146,114 | |
| Hong Kong — 3.8% | | |
| BOC Hong Kong Holdings Ltd. | 3,743,000 | | 11,549,035 | |
| CK Hutchison Holdings Ltd. | 2,460,000 | | 12,864,576 | |
| CK Infrastructure Holdings Ltd. | 231,000 | | 1,595,457 | |
| CLP Holdings Ltd. | 638,000 | | 5,373,892 | |
| Link REIT | 2,165,800 | | 9,473,526 | |
| Power Assets Holdings Ltd. | 747,000 | | 4,910,302 | |
| Swire Pacific Ltd., Class A | 256,500 | | 2,111,995 | |
| WH Group Ltd. | 10,254,000 | | 8,174,046 | |
| | | 56,052,829 | |
| Ireland — 0.1% | | |
| Bank of Ireland Group PLC | 177,780 | | 1,558,520 | |
| Italy — 4.7% | | |
| Banco BPM SpA | 554,605 | | 4,226,036 | |
| Enel SpA | 2,300,116 | | 16,564,256 | |
Generali(1) | 670,486 | | 19,182,698 | |
Intesa Sanpaolo SpA(1) | 6,124,043 | | 23,507,366 | |
Mediobanca Banca di Credito Finanziario SpA(1) | 361,555 | | 5,276,576 | |
| UniCredit SpA | 20,584 | | 790,669 | |
| | | 69,547,601 | |
| Japan — 19.1% | | |
| AGC, Inc. | 24,400 | | 765,785 | |
| Asahi Group Holdings Ltd. | 472,600 | | 5,154,897 | |
| Asahi Kasei Corp. | 395,000 | | 2,822,973 | |
| Brother Industries Ltd. | 102,200 | | 1,801,924 | |
Canon, Inc.(1) | 392,700 | | 12,793,293 | |
| ENEOS Holdings, Inc. | 1,002,000 | | 5,425,668 | |
| Honda Motor Co. Ltd. | 787,100 | | 6,791,088 | |
| Idemitsu Kosan Co. Ltd. | 483,800 | | 3,232,268 | |
| Inpex Corp. | 513,400 | | 6,728,617 | |
| ITOCHU Corp. | 328,100 | | 16,233,750 | |
Japan Post Bank Co. Ltd.(1) | 534,400 | | 5,056,630 | |
| JFE Holdings, Inc. | 399,800 | | 4,574,750 | |
| | | | | | | | |
| | Shares | Value |
Kansai Electric Power Co., Inc.(1) | 172,400 | | $ | 2,221,259 | |
| Kawasaki Kisen Kaisha Ltd. | 141,400 | | 1,884,110 | |
| Kirin Holdings Co. Ltd. | 289,500 | | 4,045,364 | |
| Komatsu Ltd. | 510,300 | | 13,816,916 | |
| Marubeni Corp. | 480,500 | | 7,252,394 | |
| Mitsubishi Chemical Group Corp. | 1,118,800 | | 5,886,123 | |
Mitsubishi Corp.(1) | 864,500 | | 14,639,508 | |
| Mitsubishi Electric Corp. | 662,700 | | 11,252,213 | |
| Mitsubishi UFJ Financial Group, Inc. | 304,200 | | 3,630,903 | |
Mitsui & Co. Ltd.(1) | 337,200 | | 7,086,047 | |
| Mizuho Financial Group, Inc. | 486,700 | | 12,288,942 | |
| MS&AD Insurance Group Holdings, Inc. | 1,011,000 | | 22,641,305 | |
Nippon Steel Corp.(1) | 689,600 | | 14,126,009 | |
Nippon Yusen KK(1) | 292,400 | | 9,374,541 | |
| ORIX Corp. | 673,600 | | 15,162,848 | |
| Osaka Gas Co. Ltd. | 118,900 | | 2,610,943 | |
| Otsuka Holdings Co. Ltd. | 82,000 | | 4,764,673 | |
| Renesas Electronics Corp. | 544,500 | | 7,141,709 | |
| SCSK Corp. | 37,600 | | 761,900 | |
| Seiko Epson Corp. | 114,200 | | 2,034,751 | |
| Sekisui Chemical Co. Ltd. | 97,000 | | 1,570,621 | |
| Shionogi & Co. Ltd. | 137,800 | | 1,954,654 | |
| SoftBank Group Corp. | 101,800 | | 6,102,613 | |
| Sompo Holdings, Inc. | 208,600 | | 5,511,683 | |
| Sumitomo Corp. | 322,200 | | 6,915,742 | |
| Sumitomo Mitsui Financial Group, Inc. | 560,100 | | 13,823,724 | |
| TIS, Inc. | 48,600 | | 1,191,826 | |
| Tokyo Gas Co. Ltd. | 49,500 | | 1,492,098 | |
| Toyota Motor Corp. | 234,200 | | 4,001,654 | |
| Toyota Tsusho Corp. | 358,900 | | 6,140,676 | |
| | | 282,709,392 | |
| Netherlands — 4.3% | | |
| ABN AMRO Bank NV, CVA | 261,655 | | 4,056,490 | |
| ASR Nederland NV | 198,487 | | 9,486,358 | |
| ING Groep NV | 965,436 | | 14,903,778 | |
| Koninklijke Ahold Delhaize NV | 711,207 | | 24,548,721 | |
| NN Group NV | 219,340 | | 10,179,219 | |
| | | 63,174,566 | |
| Norway — 0.9% | | |
| DNB Bank ASA | 82,874 | | 1,734,351 | |
| Equinor ASA | 323,991 | | 7,852,733 | |
| Telenor ASA | 269,768 | | 3,180,726 | |
| | | 12,767,810 | |
| Spain — 3.7% | | |
| Banco Bilbao Vizcaya Argentaria SA | 2,596,070 | | 24,522,853 | |
| Banco Santander SA | 2,748,492 | | 12,688,710 | |
| Endesa SA | 190,598 | | 4,178,328 | |
| Iberdrola SA | 161,970 | | 2,309,628 | |
| Repsol SA | 202,318 | | 2,532,375 | |
Telefonica SA(1) | 1,731,196 | | 7,842,668 | |
| | | 54,074,562 | |
| Sweden — 1.4% | | |
| Industrivarden AB, C Shares | 39,473 | | 1,293,737 | |
| Investor AB, B Shares | 176,721 | | 4,848,610 | |
| | | | | | | | |
| | Shares | Value |
Securitas AB, B Shares(1) | 398,073 | | $ | 5,044,396 | |
| SKF AB, B Shares | 228,745 | | 4,397,879 | |
| Svenska Handelsbanken AB, A Shares | 127,258 | | 1,323,535 | |
| Volvo AB, B Shares | 144,404 | | 3,596,737 | |
| | | 20,504,894 | |
| Switzerland — 6.6% | | |
| Novartis AG | 443,800 | | 47,051,404 | |
| Roche Holding AG | 49,036 | | 14,247,445 | |
| Sandoz Group AG | 65,731 | | 3,003,928 | |
| Swiss Re AG | 79,074 | | 11,685,548 | |
| Zurich Insurance Group AG | 33,372 | | 21,181,677 | |
| | | 97,170,002 | |
| United Kingdom — 20.0% | | |
| 3i Group PLC | 324,234 | | 15,321,753 | |
| Aviva PLC | 1,414,659 | | 8,712,334 | |
| Barclays PLC | 8,212,548 | | 27,528,476 | |
| Barratt Redrow PLC | 1,072,928 | | 5,843,224 | |
| BP PLC | 5,821,751 | | 28,509,382 | |
| DCC PLC | 57,017 | | 4,158,074 | |
Glencore PLC(2) | 3,565,121 | | 17,263,059 | |
| GSK PLC | 426,910 | | 7,252,477 | |
| HSBC Holdings PLC | 2,492,660 | | 23,229,783 | |
| J Sainsbury PLC | 1,723,079 | | 5,730,212 | |
| Kingfisher PLC | 2,311,217 | | 7,289,560 | |
| Land Securities Group PLC | 217,719 | | 1,669,753 | |
| Lloyds Banking Group PLC | 13,285,454 | | 8,956,890 | |
| M&G PLC | 711,768 | | 1,795,811 | |
| NatWest Group PLC | 5,287,745 | | 27,122,666 | |
| Rio Tinto PLC | 317,386 | | 19,954,975 | |
| Shell PLC | 965,389 | | 31,024,774 | |
| Standard Chartered PLC | 839,271 | | 10,375,890 | |
| Taylor Wimpey PLC | 886,195 | | 1,478,776 | |
| Tesco PLC | 4,769,021 | | 22,244,998 | |
| Vodafone Group PLC | 21,401,551 | | 19,309,366 | |
| | | 294,772,233 | |
TOTAL COMMON STOCKS (Cost $1,239,017,373) | | 1,441,458,761 | |
| SHORT-TERM INVESTMENTS — 2.2% | | |
| Money Market Funds — 1.0% | | |
State Street Navigator Securities Lending Government Money Market Portfolio(3) | 14,900,866 | | 14,900,866 | |
| Repurchase Agreements — 1.2% | | |
| BMO Capital Markets Corp., (collateralized by various U.S. Treasury obligations, 3.625%, 2/15/44, valued at $1,685,468), in a joint trading account at 4.56%, dated 11/29/24, due 12/2/24 (Delivery value $1,655,900) | | 1,655,271 | |
| Fixed Income Clearing Corp., (collateralized by various U.S. Treasury obligations, 4.125%, 10/31/31, valued at $16,720,920), at 4.57%, dated 11/29/24, due 12/2/24 (Delivery value $16,399,243) | | 16,393,000 | |
| | 18,048,271 | |
TOTAL SHORT-TERM INVESTMENTS (Cost $32,949,137) | | 32,949,137 | |
TOTAL INVESTMENT SECURITIES — 99.9% (Cost $1,271,966,510) | | 1,474,407,898 | |
| OTHER ASSETS AND LIABILITIES — 0.1% | | 908,853 | |
| TOTAL NET ASSETS — 100.0% | | $ | 1,475,316,751 | |
| | | | | |
| MARKET SECTOR DIVERSIFICATION |
| (as a % of net assets) | |
| Financials | 35.3% |
| Industrials | 12.0% |
| Materials | 8.7% |
| Health Care | 8.3% |
| Energy | 7.3% |
| Utilities | 6.9% |
| Consumer Staples | 6.5% |
| Consumer Discretionary | 3.8% |
| Communication Services | 3.8% |
| Information Technology | 3.3% |
| Real Estate | 1.8% |
| Short-Term Investments | 2.2% |
| Other Assets and Liabilities | 0.1% |
| | | | | | | | |
| NOTES TO SCHEDULE OF INVESTMENTS |
| CVA | – | Certificaten Van Aandelen |
(1)Security, or a portion thereof, is on loan. At the period end, the aggregate value of securities on loan was $50,815,410. The amount of securities on loan indicated may not correspond with the securities on loan identified because securities with pending sales are in the process of recall from the brokers.
(2)Non-income producing.
(3)Investment of cash collateral from securities on loan. At the period end, the aggregate value of the collateral held by the fund was $53,565,657, which includes securities collateral of $38,664,791.
See Notes to Financial Statements.
| | |
| Statement of Assets and Liabilities |
| | | | | |
| NOVEMBER 30, 2024 | |
| Assets | |
| Investment securities, at value (cost of $1,257,065,644) — including $50,815,410 of securities on loan | $ | 1,459,507,032 | |
| Investment made with cash collateral received for securities on loan, at value (cost of $14,900,866) | 14,900,866 | |
| Total investment securities, at value (cost of $1,271,966,510) | 1,474,407,898 | |
| Cash | 70,548 | |
| Foreign currency holdings, at value (cost of $399,131) | 402,079 | |
| Receivable for capital shares sold | 3,168,055 | |
| Dividends and interest receivable | 12,432,984 | |
| Securities lending receivable | 47,488 | |
| 1,490,529,052 | |
| |
| Liabilities | |
| Payable for collateral received for securities on loan | 14,900,866 | |
| Payable for capital shares redeemed | 113,785 | |
| Accrued management fees | 195,926 | |
| Distribution and service fees payable | 1,724 | |
| 15,212,301 | |
| |
| Net Assets | $ | 1,475,316,751 | |
| |
| Net Assets Consist of: | |
| Capital (par value and paid-in surplus) | $ | 1,342,559,134 | |
| Distributable earnings (loss) | 132,757,617 | |
| $ | 1,475,316,751 | |
| | | | | | | | | | | |
| Net Assets | Shares Outstanding | Net Asset Value Per Share* |
| Investor Class, $0.01 Par Value | $167,587,795 | 18,941,744 | $8.85 |
| I Class, $0.01 Par Value | $51,062,103 | 5,779,474 | $8.84 |
| A Class, $0.01 Par Value | $6,473,324 | 727,394 | $8.90 |
| C Class, $0.01 Par Value | $204,230 | 23,118 | $8.83 |
| R Class, $0.01 Par Value | $543,147 | 61,393 | $8.85 |
| R6 Class, $0.01 Par Value | $267,718 | 30,296 | $8.84 |
| G Class, $0.01 Par Value | $1,249,178,434 | 140,158,857 | $8.91 |
*Maximum offering price per share was equal to the net asset value per share for all share classes, except A Class, for which the maximum offering price per share was $9.44 (net asset value divided by 0.9425). A contingent deferred sales charge may be imposed on redemptions of A Class and C Class.
See Notes to Financial Statements.
| | | | | |
| YEAR ENDED NOVEMBER 30, 2024 | |
| Investment Income (Loss) | |
| Income: | |
| Dividends (net of foreign taxes withheld of $6,914,411) | $ | 64,324,213 | |
| Interest | 631,407 | |
| Securities lending, net | 386,194 | |
| 65,341,814 | |
| |
| Expenses: | |
| Management fees | 11,981,974 | |
| Distribution and service fees: | |
| A Class | 16,747 | |
| C Class | 2,342 | |
| R Class | 2,644 | |
| Directors' fees and expenses | 44,869 | |
| Other expenses | 49,946 | |
| 12,098,522 | |
| Fees waived - G Class | (9,448,283) | |
| 2,650,239 | |
| |
| Net investment income (loss) | 62,691,575 | |
| |
| Realized and Unrealized Gain (Loss) | |
| Net realized gain (loss) on: | |
| Investment transactions | 80,121,619 | |
| Foreign currency translation transactions | (770,784) | |
| 79,350,835 | |
| |
| Change in net unrealized appreciation (depreciation) on: | |
| Investments | 39,310,220 | |
| Translation of assets and liabilities in foreign currencies | (297,458) | |
| 39,012,762 | |
| |
| Net realized and unrealized gain (loss) | 118,363,597 | |
| |
| Net Increase (Decrease) in Net Assets Resulting from Operations | $ | 181,055,172 | |
See Notes to Financial Statements.
| | |
| Statement of Changes in Net Assets |
| | | | | | | | |
| YEARS ENDED NOVEMBER 30, 2024 AND NOVEMBER 30, 2023 |
| Increase (Decrease) in Net Assets | November 30, 2024 | November 30, 2023 |
| Operations | | |
| Net investment income (loss) | $ | 62,691,575 | | $ | 68,343,907 | |
| Net realized gain (loss) | 79,350,835 | | 19,861,194 | |
| Change in net unrealized appreciation (depreciation) | 39,012,762 | | 109,123,985 | |
| Net increase (decrease) in net assets resulting from operations | 181,055,172 | | 197,329,086 | |
| | |
| Distributions to Shareholders | | |
| From earnings: | | |
| Investor Class | (8,156,532) | | (5,178,587) | |
| I Class | (2,664,629) | | (1,348,681) | |
| A Class | (272,135) | | (126,749) | |
| C Class | (10,921) | | (6,798) | |
| R Class | (17,081) | | (11,230) | |
| R6 Class | (37,427) | | (21,073) | |
| G Class | (66,665,893) | | (37,229,430) | |
| Decrease in net assets from distributions | (77,824,618) | | (43,922,548) | |
| | |
| Capital Share Transactions | | |
| Net increase (decrease) in net assets from capital share transactions (Note 5) | (73,080,724) | | (31,753,133) | |
| | |
| Net increase (decrease) in net assets | 30,149,830 | | 121,653,405 | |
| | |
| Net Assets | | |
| Beginning of period | 1,445,166,921 | | 1,323,513,516 | |
| End of period | $ | 1,475,316,751 | | $ | 1,445,166,921 | |
See Notes to Financial Statements.
| | |
| Notes to Financial Statements |
NOVEMBER 30, 2024
1. Organization
American Century World Mutual Funds, Inc. (the corporation) is registered under the Investment Company Act of 1940, as amended (the 1940 Act), as an open-end management investment company and is organized as a Maryland corporation. International Value Fund (the fund) is one fund in a series issued by the corporation. The fund’s investment objective is to seek long-term capital growth.
The fund offers the Investor Class, I Class, A Class, C Class, R Class, R6 Class and G Class. The A Class may incur an initial sales charge. The A Class and C Class may be subject to a contingent deferred sales charge.
2. Significant Accounting Policies
The following is a summary of significant accounting policies consistently followed by the fund in preparation of its financial statements. The fund is an investment company and follows accounting and reporting guidance in accordance with accounting principles generally accepted in the United States of America. This may require management to make certain estimates and assumptions at the date of the financial statements. Actual results could differ from these estimates. Management evaluated the impact of events or transactions occurring through the date the financial statements were issued that would merit recognition or disclosure.
Investment Valuations — The fund determines the fair value of its investments and computes its net asset value (NAV) per share at the close of regular trading (usually 4 p.m. Eastern time) on the New York Stock Exchange (NYSE) on each day the NYSE is open. The value of investments of the fund is determined by American Century Investment Management, Inc. (ACIM) (the investment advisor), as the valuation designee, pursuant to its valuation policies and procedures. The Board of Directors oversees the valuation designee and reviews its valuation policies and procedures at least annually.
Equity securities that are listed or traded on a domestic securities exchange are valued at the last reported sales price or at the official closing price as provided by the exchange. Equity securities traded on foreign securities exchanges are generally valued at the closing price of such securities on the exchange where primarily traded or at the close of the NYSE, if that is earlier. If no last sales price is reported, or if local convention or regulation so provides, the mean of the latest bid and asked prices may be used. Securities traded over-the-counter are valued at the mean of the latest bid and asked prices, the last sales price, or the official closing price.
Open-end management investment companies are valued at the reported NAV per share. Repurchase agreements are valued at cost, which approximates fair value.
If the valuation designee determines that the market price for a portfolio security is not readily available or is believed by the valuation designee to be unreliable, such security is valued at fair value as determined in good faith by the valuation designee, in accordance with its policies and procedures. Circumstances that may cause the fund to determine that market quotations are not available or reliable include, but are not limited to: when there is a significant event subsequent to the market quotation; trading in a security has been halted during the trading day; or trading in a security is insufficient or did not take place due to a closure or holiday.
The valuation designee monitors for significant events occurring after the close of an investment’s primary exchange but before the fund’s NAV per share is determined. Significant events may include, but are not limited to: corporate announcements and transactions; regulatory news, governmental action and political unrest that could impact a specific investment or an investment sector; or armed conflicts, natural disasters and similar events that could affect investments in a specific country or region. The valuation designee also monitors for significant fluctuations between domestic and foreign markets, as evidenced by the U.S. market or such other indicators that it deems appropriate. The valuation designee may apply a model-derived factor to the closing price of equity securities traded on foreign securities exchanges. The factor is based on observable market data as provided by an independent pricing service.
Foreign Currency Translations — All assets and liabilities, including investment securities and other financial instruments, initially expressed in foreign currencies are translated into U.S. dollars each day at the mean of the appropriate currency exchange rate at the close of the NYSE as provided by an independent pricing service. The fund may enter into spot foreign currency exchange contracts to facilitate transactions denominated in a foreign currency. Purchases and sales of investment securities, dividend and interest income, spot foreign currency exchange contracts, and expenses are translated at the rates of exchange prevailing on the respective dates of such transactions. Net realized and unrealized foreign currency exchange gains or losses related to investment securities are a component of net realized gain (loss) on investment transactions and change in net unrealized appreciation (depreciation) on investments, respectively.
Security Transactions — Security transactions are accounted for as of the trade date. Net realized gains and losses are determined on the identified cost basis, which is also used for federal income tax purposes.
Investment Income — Dividend income less foreign taxes withheld, if any, is recorded as of the ex-dividend date. Distributions received on securities that represent a return of capital or long-term capital gain are recorded as a reduction of cost of investments and/or as a realized gain. The fund may estimate the components of distributions received that may be considered nontaxable distributions or long-term capital gain distributions for income tax purposes. Interest income is recorded on the accrual basis and includes accretion of discounts and amortization of premiums. Securities lending income is net of fees and rebates earned by the lending agent for its services.
Repurchase Agreements — The fund may enter into repurchase agreements with institutions that ACIM has determined are creditworthy pursuant to criteria adopted by the Board of Directors. The fund requires that the collateral, represented by securities, received in a repurchase transaction be transferred to the custodian in a manner sufficient to enable the fund to obtain those securities in the event of a default under the repurchase agreement. ACIM monitors, on a daily basis, the securities transferred to ensure the value, including accrued interest, of the securities under each repurchase agreement is equal to or greater than amounts owed to the fund under each repurchase agreement.
Joint Trading Account — Pursuant to an Exemptive Order issued by the Securities and Exchange Commission, the fund, along with certain other funds in the American Century Investments family of funds, may transfer uninvested cash balances into a joint trading account. These balances are invested in one or more repurchase agreements that are collateralized by U.S. Treasury or Agency obligations.
Income Tax Status — It is the fund's policy to distribute substantially all net investment income and net realized gains to shareholders and to otherwise qualify as a regulated investment company under provisions of the Internal Revenue Code. Accordingly, no provision has been made for income taxes. The fund files U.S. federal, state, local and non-U.S. tax returns as applicable. The fund's tax returns are subject to examination by the relevant taxing authority until expiration of the applicable statute of limitations, which is generally three years from the date of filing but can be longer in certain jurisdictions. At this time, management believes there are no uncertain tax positions which, based on their technical merit, would not be sustained upon examination and for which it is reasonably possible that the total amounts of unrecognized tax benefits will significantly change in the next twelve months.
Multiple Class — All shares of the fund represent an equal pro rata interest in the net assets of the class to which such shares belong, and have identical voting, dividend, liquidation and other rights and the same terms and conditions, except for class specific expenses and exclusive rights to vote on matters affecting only individual classes. Income, non-class specific expenses, and realized and unrealized capital gains and losses of the fund are allocated to each class of shares based on their relative net assets.
Distributions to Shareholders — Distributions from net investment income and net realized gains, if any, are generally declared and paid annually. The fund may make distributions on a more frequent basis to comply with the distribution requirements of the Internal Revenue Code, in all events in a manner consistent with provisions of the 1940 Act.
Indemnifications — Under the corporation’s organizational documents, its officers and directors are indemnified against certain liabilities arising out of the performance of their duties to the fund. In addition, in the normal course of business, the fund enters into contracts that provide general indemnifications. The maximum exposure under these arrangements is unknown as this would involve future claims that may be made against a fund. The risk of material loss from such claims is considered by management to be remote.
Securities Lending — Securities are lent to qualified financial institutions and brokers. State Street Bank & Trust Co. serves as securities lending agent to the fund pursuant to a Securities Lending Agreement. The lending of securities exposes the fund to risks such as: the borrowers may fail to return the loaned securities, the borrowers may not be able to provide additional collateral, the fund may experience delays in recovery of the loaned securities or delays in access to collateral, or the fund may experience losses related to the investment collateral. To minimize certain risks, loan counterparties pledge collateral in the form of cash and/or securities. The lending agent has agreed to indemnify the fund in the case of default of any securities borrowed. Cash collateral received is invested in the State Street Navigator Securities Lending Government Money Market Portfolio, a money market mutual fund registered under the 1940 Act. The loans may also be secured by U.S. government securities in an amount at least equal to the market value of the securities loaned, plus accrued interest and dividends, determined on a daily basis and adjusted accordingly. By lending securities, the fund seeks to increase its net investment income through the receipt of interest and fees. Such income is reflected separately within the Statement of Operations. The value of loaned securities and related collateral outstanding at period end, if any, are shown on a gross basis within the Schedule of Investments and Statement of Assets and Liabilities.
The following table reflects a breakdown of transactions accounted for as secured borrowings, the gross obligation by the type of collateral pledged, and the remaining contractual maturity of those transactions as of November 30, 2024.
| | | | | | | | | | | | | | | | | |
| Remaining Contractual Maturity of Agreements |
| Overnight and Continuous | <30 days | Between 30 & 90 days | >90 days | Total |
Securities Lending Transactions(1) | | | | |
| Common Stocks | $ | 14,900,866 | | — | | — | | — | | $ | 14,900,866 | |
| Gross amount of recognized liabilities for securities lending transactions | $ | 14,900,866 | |
(1)Amount represents the payable for cash collateral received for securities on loan. This will generally be in the Overnight and Continuous column as the securities are typically callable on demand.
3. Fees and Transactions with Related Parties
Certain officers and directors of the corporation are also officers and/or directors of American Century Companies, Inc. (ACC). The corporation's investment advisor, ACIM, the corporation's distributor, American Century Investment Services, Inc. (ACIS), and the corporation's transfer agent, American Century Services, LLC, are wholly owned, directly or indirectly, by ACC. Various funds issued by American Century Asset Allocation Portfolios, Inc. own, in aggregate, 49% of the shares of the fund. Related parties do not invest in the fund for the purpose of exercising management or control.
Management Fees — The corporation has entered into a management agreement with ACIM, under which ACIM provides the fund with investment advisory and management services in exchange for a single, unified management fee (the fee) per class. The agreement provides that ACIM will pay all expenses of managing and operating the fund, except brokerage expenses, taxes, interest, fees and expenses of the independent directors (including legal counsel fees), extraordinary expenses, and expenses incurred in connection with the provision of shareholder services and distribution services under a plan adopted pursuant to Rule 12b-1 under the 1940 Act. The fee is computed and accrued daily based on each class's daily net assets and paid monthly in arrears. The difference in the fee among the classes is a result of their separate arrangements for non-Rule 12b-1 shareholder services. It is not the result of any difference in advisory or custodial fees or other expenses related to the management of the fund’s assets, which do not vary by class. The investment advisor agreed to waive the G Class's management fee in its entirety. The investment advisor expects this waiver to remain in effect permanently and cannot terminate it without the approval of the Board of Directors.
The annual management fee for each class is as follows:
| | | | | | | | | | | | | | | | | | | | |
| Investor Class | I Class | A Class | C Class | R Class | R6 Class | G Class |
| 1.10% | 0.90% | 1.10% | 1.10% | 1.10% | 0.75% | 0.00%(1) |
(1)Annual management fee before waiver was 0.75%.
Distribution and Service Fees — The Board of Directors has adopted a separate Master Distribution and Individual Shareholder Services Plan for each of the A Class, C Class and R Class (collectively the plans), pursuant to Rule 12b-1 of the 1940 Act. The plans provide that the A Class will pay ACIS an annual distribution and service fee of 0.25%. The plans provide that the C Class will pay ACIS an annual distribution and service fee of 1.00%, of which 0.25% is paid for individual shareholder services and 0.75% is paid for distribution services. The plans provide that the R Class will pay ACIS an annual distribution and service fee of 0.50%. The fees are computed and accrued daily based on each class’s daily net assets and paid monthly in arrears. The fees are used to pay financial intermediaries for distribution and individual shareholder services. Fees incurred under the plans during the period ended November 30, 2024 are detailed in the Statement of Operations.
Directors' Fees and Expenses — The Board of Directors is responsible for overseeing the investment advisor’s management and operations of the fund. The directors receive detailed information about the fund and its investment advisor regularly throughout the year, and meet at least quarterly with management of the investment advisor to review reports about fund operations. The fund's officers do not receive compensation from the fund.
Other Expenses — A fund’s other expenses may include interest charges, clearing exchange fees, proxy solicitation expenses, fees associated with the recovery of foreign tax reclaims and other miscellaneous expenses.
Interfund Transactions — The fund may enter into security transactions with other American Century Investments funds and other client accounts of the investment advisor, in accordance with the 1940 Act rules and procedures adopted by the Board of Directors. The rules and procedures require, among other things, that these transactions be effected at the independent current market price of the security. During the period, the interfund purchases and sales were $4,652,149 and $448,093, respectively. The effect of interfund transactions on the Statement of Operations was $(18,704) in net realized gain (loss) on investment transactions.
4. Investment Transactions
Purchases and sales of investment securities, excluding short-term investments, for the period ended November 30, 2024 were $1,009,006,489 and $1,111,706,404, respectively.
5. Capital Share Transactions
Transactions in shares of the fund were as follows:
| | | | | | | | | | | | | | |
| Year ended
November 30, 2024 | Year ended
November 30, 2023 |
| Shares | Amount | Shares | Amount |
| Investor Class/Shares Authorized | 500,000,000 | | | 500,000,000 | | |
| Sold | 343,887 | | $ | 3,009,793 | | 894,111 | | $ | 6,952,626 | |
| Issued in reinvestment of distributions | 991,651 | | 8,141,458 | | 709,366 | | 5,171,278 | |
| Redeemed | (4,884,595) | | (42,709,546) | | (7,105,614) | | (57,002,444) | |
| (3,549,057) | | (31,558,295) | | (5,502,137) | | (44,878,540) | |
| I Class/Shares Authorized | 100,000,000 | | | 100,000,000 | | |
| Sold | 2,298,223 | | 20,536,979 | | 1,427,983 | | 11,224,745 | |
| Issued in reinvestment of distributions | 325,749 | | 2,664,629 | | 185,361 | | 1,347,573 | |
| Redeemed | (3,546,913) | | (30,364,565) | | (1,833,240) | | (14,350,344) | |
| (922,941) | | (7,162,957) | | (219,896) | | (1,778,026) | |
| A Class/Shares Authorized | 25,000,000 | | | 25,000,000 | | |
| Sold | 43,122 | | 372,804 | | 97,914 | | 757,861 | |
| Issued in reinvestment of distributions | 32,645 | | 270,299 | | 17,125 | | 125,866 | |
| Redeemed | (109,982) | | (970,570) | | (86,860) | | (685,997) | |
| (34,215) | | (327,467) | | 28,179 | | 197,730 | |
| C Class/Shares Authorized | 25,000,000 | | | 25,000,000 | | |
| Sold | 1,849 | | 15,942 | | 1,826 | | 14,651 | |
| Issued in reinvestment of distributions | 1,321 | | 10,921 | | 925 | | 6,798 | |
| Redeemed | (19,713) | | (165,682) | | (13,697) | | (102,669) | |
| (16,543) | | (138,819) | | (10,946) | | (81,220) | |
| R Class/Shares Authorized | 25,000,000 | | | 25,000,000 | | |
| Sold | 26,253 | | 224,417 | | 34,064 | | 266,406 | |
| Issued in reinvestment of distributions | 2,062 | | 17,011 | | 1,528 | | 11,197 | |
| Redeemed | (16,629) | | (145,580) | | (89,153) | | (680,082) | |
| 11,686 | | 95,848 | | (53,561) | | (402,479) | |
| R6 Class/Shares Authorized | 30,000,000 | | | 30,000,000 | | |
| Sold | 24,209 | | 209,443 | | 14,846 | | 114,980 | |
| Issued in reinvestment of distributions | 4,581 | | 37,427 | | 2,903 | | 21,073 | |
| Redeemed | (109,328) | | (953,071) | | (10,660) | | (81,333) | |
| (80,538) | | (706,201) | | 7,089 | | 54,720 | |
| G Class/Shares Authorized | 1,750,000,000 | | | 1,750,000,000 | | |
| Sold | 19,195,075 | | 164,928,438 | | 24,815,675 | | 190,331,839 | |
| Issued in reinvestment of distributions | 8,149,865 | | 66,665,893 | | 5,120,967 | | 37,229,430 | |
| Redeemed | (30,007,635) | | (264,877,164) | | (27,331,085) | | (212,426,587) | |
| (2,662,695) | | (33,282,833) | | 2,605,557 | | 15,134,682 | |
| Net increase (decrease) | (7,254,303) | | $ | (73,080,724) | | (3,145,715) | | $ | (31,753,133) | |
6. Fair Value Measurements
The fund's investments valuation process is based on several considerations and may use multiple inputs to determine the fair value of the investments held by the fund. In conformity with accounting principles generally accepted in the United States of America, the inputs used to determine a valuation are classified into three broad levels.
•Level 1 valuation inputs consist of unadjusted quoted prices in an active market for identical investments.
•Level 2 valuation inputs consist of direct or indirect observable market data (including quoted prices for comparable investments, evaluations of subsequent market events, interest rates, prepayment speeds, credit risk, etc.). These inputs also consist of quoted prices for identical investments initially expressed in local currencies that are adjusted through translation into U.S. dollars.
•Level 3 valuation inputs consist of unobservable data (including a fund’s own assumptions).
The level classification is based on the lowest level input that is significant to the fair valuation measurement. The valuation inputs are not necessarily an indication of the risks associated with investing in these securities or other financial instruments.
The following is a summary of the level classifications as of period end. The Schedule of Investments provides additional information on the fund's portfolio holdings.
| | | | | | | | | | | |
| Level 1 | Level 2 | Level 3 |
| Assets | | | |
| Investment Securities | | | |
| Common Stocks | — | | $ | 1,441,458,761 | | — | |
| Short-Term Investments | $ | 14,900,866 | | 18,048,271 | | — | |
| $ | 14,900,866 | | $ | 1,459,507,032 | | — | |
7. Risk Factors
The value of the fund’s shares will go up and down, sometimes rapidly or unpredictably, based on the performance of the securities owned by the fund and other factors generally affecting the securities market. Market risks, including political, regulatory, economic and social developments, can affect the value of the fund’s investments. Natural disasters, public health emergencies, war, terrorism and other unforeseeable events may lead to increased market volatility and may have adverse long-term effects on world economies and markets generally.
The majority of the fund is owned by a relatively small number of shareholders. To the extent that a large shareholder (including a fund of funds) invests in the fund, the fund may experience relatively large redemptions as such shareholder reallocates its assets. In the event of a large shareholder redemption, the ongoing operations of the fund may be at risk.
There are certain risks involved in investing in foreign securities. These risks include those resulting from political events (such as civil unrest, national elections and imposition of exchange controls), social and economic events (such as labor strikes and rising inflation), and natural disasters. Securities of foreign issuers may be less liquid and more volatile. Investing in emerging markets or a significant portion of assets in one country or region may accentuate these risks.
The fund invests in common stocks of small companies. Because of this, the fund may be subject to greater risk and market fluctuations than a fund investing in larger, more established companies.
8. Federal Tax Information
On December 17, 2024, the fund declared and paid the following per-share distributions from net investment income to shareholders of record on December 16, 2024:
| | | | | | | | | | | | | | | | | | | | |
| Investor Class | I Class | A Class | C Class | R Class | R6 Class | G Class |
| $0.3298 | $0.3473 | $0.3078 | $0.2419 | $0.2858 | $0.3605 | $0.4264 |
The tax character of distributions paid during the years ended November 30, 2024 and November 30, 2023 were as follows:
| | | | | | | | |
| 2024 | 2023 |
| Distributions Paid From | | |
| Ordinary income | $ | 77,824,618 | | $ | 43,922,548 | |
| Long-term capital gains | — | | — | |
The book-basis character of distributions made during the year from net investment income or net realized gains may differ from their ultimate characterization for federal income tax purposes. These differences reflect the differing character of certain income items and net realized gains and losses for financial statement and tax purposes, and may result in reclassification among certain capital accounts on the financial statements.
As of period end, the federal tax cost of investments and the components of distributable earnings on a tax-basis were as follows:
| | | | | |
| Federal tax cost of investments | $ | 1,286,681,069 | |
| Gross tax appreciation of investments | $ | 240,427,360 | |
| Gross tax depreciation of investments | (52,700,531) | |
| Net tax appreciation (depreciation) of investments | 187,726,829 | |
| Net tax appreciation (depreciation) on translation of assets and liabilities in foreign currencies | (311,394) | |
| Net tax appreciation (depreciation) | $ | 187,415,435 | |
| Undistributed ordinary income | $ | 69,905,465 | |
| Accumulated short-term capital losses | $ | (115,350,294) | |
| Accumulated long-term capital losses | $ | (9,212,989) | |
The difference between book-basis and tax-basis unrealized appreciation (depreciation) is attributable primarily to the realization to ordinary income for tax purposes of unrealized gains on investments in passive foreign investment companies.
Accumulated capital losses represent net capital loss carryovers that may be used to offset future realized capital gains for federal income tax purposes. The capital loss carryovers may be carried forward for an unlimited period. Future capital loss carryover utilization in any given year may be subject to Internal Revenue Code limitations.
| | | | | | | | | | | | | | | | | | | | | | | | | | | | | | | | | | | | | | | | | |
| For a Share Outstanding Throughout the Years Ended November 30 (except as noted) |
| Per-Share Data | | | | | Ratios and Supplemental Data | | |
| | Income From Investment Operations*: | | Ratio to Average Net Assets of†: | | |
| Net Asset
Value,
Beginning
of Period | Net Investment Income (Loss)(1) | Net
Realized
and
Unrealized
Gain (Loss) | Total From
Investment
Operations | Distributions
From
Net
Investment
Income | Net Asset
Value,
End
of Period | Total Return(2) | Operating
Expenses | Operating
Expenses
(before
expense
waiver) | Net
Investment
Income
(Loss) | Net
Investment
Income
(Loss)
(before
expense
waiver) | Portfolio
Turnover
Rate | Net
Assets,
End of
Period
(in
thousands) |
| Investor Class | | | | | | | | | | | | |
| 2024 | $8.30 | 0.29 | 0.64 | 0.93 | (0.38) | $8.85 | 11.57% | 1.11% | 1.11% | 3.25% | 3.25% | 68% | $167,588 | |
| 2023 | $7.49 | 0.32 | 0.68 | 1.00 | (0.19) | $8.30 | 13.64% | 1.11% | 1.11% | 3.96% | 3.96% | 77% | $186,766 | |
| 2022 | $8.37 | 0.35 | (0.84) | (0.49) | (0.39) | $7.49 | (6.24)% | 1.14% | 1.14% | 4.89% | 4.89% | 151% | $209,685 | |
| 2021 | $7.82 | 0.23 | 0.50 | 0.73 | (0.18) | $8.37 | 9.30% | 1.10% | 1.10% | 2.57% | 2.57% | 124% | $14,827 | |
| 2020 | $7.57 | 0.15 | 0.33 | 0.48 | (0.23) | $7.82 | 6.69% | 1.21% | 1.22% | 2.16% | 2.15% | 91% | $12,633 | |
| I Class | | | | | | | | | | | | | |
| 2024 | $8.29 | 0.31 | 0.64 | 0.95 | (0.40) | $8.84 | 11.69% | 0.91% | 0.91% | 3.45% | 3.45% | 68% | $51,062 | |
| 2023 | $7.48 | 0.33 | 0.68 | 1.01 | (0.20) | $8.29 | 13.82% | 0.91% | 0.91% | 4.16% | 4.16% | 77% | $55,583 | |
| 2022 | $8.36 | 0.33 | (0.80) | (0.47) | (0.41) | $7.48 | (6.04)% | 0.94% | 0.94% | 5.09% | 5.09% | 151% | $51,756 | |
| 2021 | $7.81 | 0.24 | 0.51 | 0.75 | (0.20) | $8.36 | 9.54% | 0.90% | 0.90% | 2.77% | 2.77% | 124% | $46,842 | |
| 2020 | $7.57 | 0.16 | 0.33 | 0.49 | (0.25) | $7.81 | 6.93% | 1.01% | 1.02% | 2.36% | 2.35% | 91% | $29,898 | |
| A Class | | | | | | | | | | | | | |
| 2024 | $8.35 | 0.26 | 0.65 | 0.91 | (0.36) | $8.90 | 11.21% | 1.36% | 1.36% | 3.00% | 3.00% | 68% | $6,473 | |
| 2023 | $7.54 | 0.30 | 0.68 | 0.98 | (0.17) | $8.35 | 13.35% | 1.36% | 1.36% | 3.71% | 3.71% | 77% | $6,359 | |
| 2022 | $8.42 | 0.30 | (0.81) | (0.51) | (0.37) | $7.54 | (6.46)% | 1.39% | 1.39% | 4.64% | 4.64% | 151% | $5,527 | |
| 2021 | $7.86 | 0.20 | 0.52 | 0.72 | (0.16) | $8.42 | 9.10% | 1.35% | 1.35% | 2.32% | 2.32% | 124% | $6,407 | |
| 2020 | $7.60 | 0.13 | 0.33 | 0.46 | (0.20) | $7.86 | 6.32% | 1.46% | 1.47% | 1.91% | 1.90% | 91% | $6,176 | |
| C Class | | | | | | | | | | | | | |
| 2024 | $8.29 | 0.18 | 0.66 | 0.84 | (0.30) | $8.83 | 10.32% | 2.11% | 2.11% | 2.25% | 2.25% | 68% | $204 | |
| 2023 | $7.50 | 0.23 | 0.69 | 0.92 | (0.13) | $8.29 | 12.55% | 2.11% | 2.11% | 2.96% | 2.96% | 77% | $329 | |
| 2022 | $8.37 | 0.23 | (0.80) | (0.57) | (0.30) | $7.50 | (7.13)% | 2.14% | 2.14% | 3.89% | 3.89% | 151% | $379 | |
| 2021 | $7.82 | 0.12 | 0.52 | 0.64 | (0.09) | $8.37 | 8.19% | 2.10% | 2.10% | 1.57% | 1.57% | 124% | $734 | |
| 2020 | $7.51 | 0.07 | 0.34 | 0.41 | (0.10) | $7.82 | 5.65% | 2.21% | 2.22% | 1.16% | 1.15% | 91% | $926 | |
| | | | | | | | | | | | | | | | | | | | | | | | | | | | | | | | | | | | | | | | | |
| For a Share Outstanding Throughout the Years Ended November 30 (except as noted) |
| Per-Share Data | | | | | Ratios and Supplemental Data | | |
| | Income From Investment Operations*: | | Ratio to Average Net Assets of†: | | |
| Net Asset
Value,
Beginning
of Period | Net Investment Income (Loss)(1) | Net
Realized
and
Unrealized
Gain (Loss) | Total From
Investment
Operations | Distributions
From
Net
Investment
Income | Net Asset
Value,
End
of Period | Total Return(2) | Operating
Expenses | Operating
Expenses
(before
expense
waiver) | Net
Investment
Income
(Loss) | Net
Investment
Income
(Loss)
(before
expense
waiver) | Portfolio
Turnover
Rate | Net
Assets,
End of
Period
(in
thousands) |
| R Class | | | | | | | | | | | | | |
| 2024 | $8.30 | 0.24 | 0.65 | 0.89 | (0.34) | $8.85 | 11.00% | 1.61% | 1.61% | 2.75% | 2.75% | 68% | $543 | |
| 2023 | $7.50 | 0.28 | 0.68 | 0.96 | (0.16) | $8.30 | 13.09% | 1.61% | 1.61% | 3.46% | 3.46% | 77% | $413 | |
| 2022 | $8.38 | 0.27 | (0.81) | (0.54) | (0.34) | $7.50 | (6.74)% | 1.64% | 1.64% | 4.39% | 4.39% | 151% | $775 | |
| 2021 | $7.83 | 0.18 | 0.51 | 0.69 | (0.14) | $8.38 | 8.73% | 1.60% | 1.60% | 2.07% | 2.07% | 124% | $893 | |
| 2020 | $7.55 | 0.12 | 0.33 | 0.45 | (0.17) | $7.83 | 6.16% | 1.71% | 1.72% | 1.66% | 1.65% | 91% | $848 | |
| R6 Class | | | | | | | | | | | | | |
| 2024 | $8.30 | 0.30 | 0.65 | 0.95 | (0.41) | $8.84 | 11.86% | 0.76% | 0.76% | 3.60% | 3.60% | 68% | $268 | |
| 2023 | $7.48 | 0.35 | 0.67 | 1.02 | (0.20) | $8.30 | 14.08% | 0.76% | 0.76% | 4.31% | 4.31% | 77% | $919 | |
| 2022 | $8.36 | 0.34 | (0.80) | (0.46) | (0.42) | $7.48 | (5.89)% | 0.79% | 0.79% | 5.24% | 5.24% | 151% | $776 | |
| 2021 | $7.81 | 0.27 | 0.49 | 0.76 | (0.21) | $8.36 | 9.71% | 0.75% | 0.75% | 2.92% | 2.92% | 124% | $786 | |
| 2020 | $7.58 | 0.18 | 0.32 | 0.50 | (0.27) | $7.81 | 7.08% | 0.86% | 0.87% | 2.51% | 2.50% | 91% | $1,027 | |
| G Class | | | | | | | | | | | | | |
| 2024 | $8.37 | 0.38 | 0.63 | 1.01 | (0.47) | $8.91 | 12.63% | 0.01% | 0.76% | 4.35% | 3.60% | 68% | $1,249,178 | |
| 2023 | $7.52 | 0.40 | 0.69 | 1.09 | (0.24) | $8.37 | 15.02% | 0.01% | 0.76% | 5.06% | 4.31% | 77% | $1,194,798 | |
2022(3) | $8.18 | 0.28 | (0.83) | (0.55) | (0.11) | $7.52 | (6.80)% | 0.03% | 0.78% | 6.05% | 5.30% | 151%(4) | $1,054,615 | |
| | |
| Notes to Financial Highlights |
(1)Computed using average shares outstanding throughout the period.
(2)Total returns are calculated based on the net asset value of the last business day and do not reflect applicable sales charges, if any. Total returns for periods less than one year are not annualized.
(3)April 1, 2022 (commencement of sale) through November 30, 2022.
(4)Portfolio turnover is calculated at the fund level. Percentage indicated was calculated for the year ended November 30, 2022.
*The amount shown for a share outstanding throughout the period may not correlate with the Statement(s) of Operations or precisely reflect the class expense differentials due to the timing of transactions in shares of a fund in relation to income earned and/or fluctuations in the fair value of a fund's investments.
†Ratios for periods less than one year are annualized. Zero balances may reflect amounts less than 0.005%.
See Notes to Financial Statements.
| | |
| Report of Independent Registered Public Accounting Firm |
To the shareholders of the International Value Fund and the Board of Directors of American Century World Mutual Funds, Inc.
Opinion on the Financial Statements and Financial Highlights
We have audited the accompanying statement of assets and liabilities, including the schedule of investments, of International Value Fund (the “Fund”), one of the funds constituting the American Century World Mutual Funds, Inc., as of November 30, 2024, the related statement of operations for the year then ended, the statements of changes in net assets for each of the two years in the period then ended, the financial highlights for each of the five years in the period then ended, and the related notes. In our opinion, the financial statements and financial highlights present fairly, in all material respects, the financial position of the Fund as of November 30, 2024, and the results of its operations for the year then ended, the changes in its net assets for each of the two years in the period then ended, and the financial highlights for each of the five years in the period then ended, in conformity with accounting principles generally accepted in the United States of America.
Basis for Opinion
These financial statements and financial highlights are the responsibility of the Fund's management. Our responsibility is to express an opinion on the Fund’s financial statements and financial highlights based on our audits. We are a public accounting firm registered with the Public Company Accounting Oversight Board (United States) (PCAOB) and are required to be independent with respect to the Fund in accordance with the U.S. federal securities laws and the applicable rules and regulations of the Securities and Exchange Commission and the PCAOB.
We conducted our audits in accordance with the standards of the PCAOB. Those standards require that we plan and perform the audit to obtain reasonable assurance about whether the financial statements and financial highlights are free of material misstatement, whether due to error or fraud. The Fund is not required to have, nor were we engaged to perform, an audit of its internal control over financial reporting. As part of our audits, we are required to obtain an understanding of internal control over financial reporting but not for the purpose of expressing an opinion on the effectiveness of the Fund’s internal control over financial reporting. Accordingly, we express no such opinion.
Our audits included performing procedures to assess the risks of material misstatement of the financial statements and financial highlights, whether due to error or fraud, and performing procedures that respond to those risks. Such procedures included examining, on a test basis, evidence regarding the amounts and disclosures in the financial statements and financial highlights. Our audits also included evaluating the accounting principles used and significant estimates made by management, as well as evaluating the overall presentation of the financial statements and financial highlights. Our procedures included confirmation of securities owned as of November 30, 2024, by correspondence with the custodian and brokers; when replies were not received from brokers, we performed other auditing procedures. We believe that our audits provide a reasonable basis for our opinion.
/s/ Deloitte & Touche LLP
Kansas City, Missouri
January 16, 2025
We have served as the auditor of one or more American Century investment companies since 1997.
| | |
| Approval of Management Agreement |
At a meeting held on June 27, 2024, the Fund’s Board of Directors (the “Board”) unanimously approved the renewal of the management agreement pursuant to which American Century Investment Management, Inc. (the “Advisor”) acts as the investment advisor for the Fund. Under the Investment Company Act of 1940 (the “Investment Company Act”), contracts for investment advisory services are required to be reviewed, evaluated, and approved by a majority of a fund’s Directors, including a majority of the independent Directors.
Prior to its consideration of the renewal of the management agreement, the Directors requested and reviewed data and information compiled by the Advisor and certain independent consultants and data providers concerning the Fund. This review was in addition to the oversight and evaluation undertaken by the Board and its committees on a continual basis and the information received was supplemental to the information that the Board and its committees receive and consider over time.
In connection with its consideration of the renewal of the management agreement, the Board’s review and evaluation of the services provided by the Advisor and its affiliates included, but was not limited to
•the nature, extent, and quality of investment management, shareholder services, distribution services, and other services provided to the Fund;
•the wide range of programs and services the Advisor and other service providers provide to the Fund and its shareholders on a routine and non-routine basis;
•the Fund’s investment performance compared to appropriate benchmarks and/or peer groups of other mutual funds with similar investment objectives and strategies;
•the cost of owning the Fund compared to the cost of owning similarly-managed funds;
•the Advisor’s compliance policies, procedures, and regulatory experience and those of certain other service providers;
•the Advisor’s strategic plans, generally, and with respect to the Advisor’s response to investment management industry challenges;
•the Advisor’s business continuity plans, vendor management practices, and information security practices;
•the cost of services provided to the Fund, the profitability of the Fund to the Advisor, and the Advisor’s financial results of operation;
•possible economies of scale associated with the Advisor’s management of the Fund;
•any collateral benefits derived by the Advisor from the management of the Fund;
•fees and expenses associated with any investment by the Fund in other funds;
•payments to intermediaries by the Fund and the Advisor and services provided by intermediaries in connection therewith; and
•services provided and charges to the Advisor’s other investment management clients.
The Board held two meetings to consider the renewal. The independent Directors also met in private session multiple times to review and discuss the information provided in response to their request. The independent Directors held active discussions with the Advisor regarding the renewal of the management agreement, requesting supplemental information, and reviewing information provided by the Advisor in response thereto. The independent Directors had the benefit of the advice of their independent counsel throughout the process.
Factors Considered
The Directors considered all of the information provided by the Advisor, the independent consultant and data providers, and the independent Directors’ independent counsel in connection with the approval. They determined that the information was sufficient for them to evaluate the management agreement for the Fund. In connection with their review, the Directors did not identify any single factor as being all-important or controlling, and each Director may have attributed different levels of importance to different factors. In deciding to renew the management agreement, the Board based its decision on a number of factors, including without limitation the following:
Nature, Extent and Quality of Services — Generally. Under the management agreement, the Advisor is responsible for providing or arranging for all services necessary for the operation of the Fund. The Board noted that the Advisor provides or arranges at its own expense a wide variety of services which include, without limitation, the following:
•constructing and designing the Fund
•portfolio research and security selection
•initial capitalization/funding
•securities trading
•Fund administration
•custody of Fund assets
•daily valuation of the Fund’s portfolio
•liquidity monitoring and management
•risk management, including information security
•shareholder servicing and transfer agency, including shareholder confirmations, recordkeeping, and communications
•legal services (except the independent Directors’ counsel)
•regulatory and portfolio compliance
•financial reporting
•marketing and distribution (except amounts paid by the Fund under Rule 12b-1 plans)
The Board noted that many of these services have expanded over time in terms of both quantity and complexity in response to shareholder demands, competition in the industry, changing distribution channels, and the changing regulatory environment.
Investment Management Services. The nature of the investment management services provided to the Fund is quite complex and allows Fund shareholders access to professional money management, instant diversification of their investments, the opportunity to easily diversify among asset classes by investing in or exchanging among various American Century Investments funds, and liquidity. In evaluating investment performance, the Board expects the Advisor to manage the Fund in accordance with its investment objectives and principal investment strategies. Further, the Directors recognize that the Advisor has an obligation to monitor trading activities, and in particular to seek the best execution of fund trades, and to evaluate the use of and payment for research. In providing these services, the Advisor utilizes teams of investment professionals who require extensive information technology, research, training, compliance, and other systems to conduct their business. The Board, directly and through its Fund Performance Review Committee, provides oversight of the investment performance process. It regularly reviews investment performance information for the Fund, together with comparative information for appropriate benchmarks and/or peer groups of similarly-managed funds, over different time horizons. The Directors also review investment performance information from both the Advisor and an independent third party during the management agreement renewal process. If performance concerns are identified, the Board discusses with the Advisor the reasons for such results and any actions being taken to improve performance and may conduct special reviews until performance improves. The Fund’s performance was above its benchmark for the one-, five-, and ten-year periods and below its benchmark for the three-year period reviewed by the Board. In relation to industry peers, the Fund was above the median of its peer performance universe as identified by a third-party service provider for the one- and five-year periods, near the median for the three-year period, and below the median for the ten-year period. The Board discussed the Fund’s performance with the Advisor, including steps being taken to address underperformance, and was satisfied with the efforts being undertaken by the Advisor. The Board found the investment management services provided by the Advisor to the Fund to be satisfactory and consistent with the management agreement.
Shareholder and Other Services. Under the management agreement, the Advisor provides the Fund with a comprehensive package of transfer agency, shareholder, and other services. The Board, directly and through its various committees, regularly reviews reports and evaluations of such services at its regular meetings. These reports include, but are not limited to, information regarding the operational efficiency and accuracy of the shareholder and transfer agency services provided, staffing levels, shareholder satisfaction, technology support (including information security), new products and services offered to Fund shareholders, securities trading activities, portfolio valuation services, auditing services, and legal and operational compliance activities. The Board found the services provided by the Advisor to the Fund under the management agreement to be competitive and of high quality.
Costs of Services and Profitability. The Advisor provides detailed information concerning its cost of providing various services to the Fund, its profitability in managing the Fund (pre- and post-distribution), and its financial results of operation. The Directors have reviewed with the Advisor the methodology used to prepare this financial information and arranged for an independent consultant to confirm the reasonableness of the allocation methodology used. This information is considered in evaluating the Advisor’s financial condition, its ability to continue to provide services under the management agreement, and the reasonableness of the terms of the current management agreement. The Board concluded that the Advisor’s profits were reasonable in light of the services provided to the Fund.
Ethics. The Board generally considers the Advisor’s commitment to providing quality services to shareholders and to conducting its business ethically. They noted that the Advisor’s practices generally meet or exceed industry best practices.
Economies of Scale. The Board also reviewed information provided by the Advisor regarding the possible existence of economies of scale in connection with the management of the Fund. The Board concluded that economies of scale are difficult to measure and predict with precision, especially on a fund-by-fund basis. The Board concluded that the Advisor is sharing economies of scale, to the extent they exist, through its fee structure, and through reinvestment in its business, infrastructure, investment capabilities and initiatives to provide shareholders enhanced and expanded content and services.
Comparison to Other Funds’ Fees. The management agreement provides that the Fund pays the Advisor a single, all-inclusive (or unified) management fee for providing all services necessary for the management and operation of the Fund, other than brokerage and other transaction fees and expenses relating to acquisition and disposition of portfolio securities, acquired fund fees and expenses, taxes, interest, extraordinary expenses, fund litigation expenses, fees and expenses of the Fund’s independent Directors (including their independent legal counsel), and expenses incurred in connection with the provision of shareholder services and distribution services under a plan adopted pursuant to Investment Company Act Rule 12b-1. Under the unified fee structure, the Advisor is responsible for providing all investment advisory, custody, audit, administrative, compliance, recordkeeping, marketing and shareholder services, or arranging and supervising third parties to provide such
services. By contrast, most other funds are charged a variety of fees, including an investment advisory fee, a transfer agency fee, an administrative fee, distribution charges, and other expenses. Other than their investment advisory fees and any applicable Rule 12b-1 distribution fees, all other components of the total fees charged by these other funds may be increased without shareholder approval. The Board believes the unified fee structure is a benefit to Fund shareholders because it clearly discloses to shareholders the cost of owning Fund shares, and, since the unified fee cannot be increased without a vote of Fund shareholders, it shifts to the Advisor the risk of increased costs of operating the Fund and provides a direct incentive to minimize administrative inefficiencies. Part of the Board’s analysis of fee levels involves reviewing certain evaluative data compiled by an independent provider comparing the Fund’s unified fee to the total expense ratios of its peers. The unified fee charged to shareholders of the Fund was below the median of the total expense ratios of the Fund’s peer expense universe. In addition, the Board reviewed the Fund’s position relative to the narrower set of its expense group peers. The Board concluded that the management fee paid by the Fund to the Advisor under the management agreement is reasonable in light of the services provided to the Fund.
Comparison to Fees and Services Provided to Other Clients of the Advisor. The Board also requested and received information from the Advisor concerning the nature of the services, fees, costs, and profitability of its advisory services to advisory clients other than the Fund. They observed that these varying types of client accounts require different services and involve different regulatory and entrepreneurial risks than the management of the Fund. The Board analyzed this information and concluded that the fees charged and services provided to the Fund were reasonable by comparison.
Payments to Intermediaries. The Directors also requested and received a description of payments made to intermediaries by the Fund and the Advisor and services provided in response thereto. These payments include various payments made by the Fund or the Advisor to different types of intermediaries and recordkeepers for distribution and service activities provided for the Fund. The Directors reviewed such information and received representations from the Advisor that all such payments by the Fund were made pursuant to the Fund’s Rule 12b-1 Plan and that all such payments by the Advisor were made from the Advisor’s resources and reasonable profits.
Collateral or “Fall-Out” Benefits Derived by the Advisor. The Board considered the possible existence of collateral benefits the Advisor may receive as a result of its relationship with the Fund. They concluded that the Advisor’s primary business is managing funds and it generally does not use fund or shareholder information to generate profits in other lines of business, and therefore does not derive any significant collateral benefits from them. To the extent there are potential collateral benefits, the Board has been advised and has taken this into consideration in its review of the management contract with the Fund. The Board noted that additional assets from other clients may offer the Advisor some benefit from increased leverage with prospective clients, service providers, and counterparties. Additionally, the Advisor may receive proprietary research from broker-dealers that execute fund portfolio transactions, which the Board concluded is likely to benefit other clients of the Advisor, as well as Fund shareholders. The Board also determined that the Advisor is able to provide investment management services to certain clients other than the Fund, at least in part, due to its existing infrastructure built to serve the fund complex. The Board concluded that appropriate allocation methodologies had been employed to assign resources and the cost of those resources to these other clients.
Existing Relationship. The Board also considered whether there was any reason for not continuing the existing arrangement with the Advisor. In this regard, the Board was mindful of the potential disruptions of the Fund’s operations and various risks, uncertainties, and other effects that could occur as a result of a decision not to continue such relationship. In particular, the Board recognized that most shareholders have invested in the Fund on the strength of the Advisor’s industry standing and reputation and in the expectation that the Advisor will have a continuing role in providing advisory services to the Fund.
Conclusion of the Directors. As a result of this process, the Board, including all of the independent Directors, taking into account all of the factors discussed above and the information provided by the Advisor and others in connection with its review and received over time, determined that the terms of the management agreement are fair and reasonable and that the management fee charged to the Fund is reasonable in light of the services provided and that the management agreement between the Fund and the Advisor should be renewed for an additional one-year period.
Other Tax Information
The following information is provided pursuant to provisions of the Internal Revenue Code.
The fund hereby designates up to the maximum amount allowable as qualified dividend income for the fiscal year ended November 30, 2024.
For the fiscal year ended November 30, 2024, the fund intends to pass through to shareholders foreign source income of $52,842,869 and foreign taxes paid of $4,318,422, or up to the maximum amount allowable, as a foreign tax credit. Foreign source income and foreign tax expense per outstanding share on November 30, 2024 are $0.3189 and $0.0261, respectively.
| | | | | | | | |
| Contact Us | americancentury.com | |
| Automated Information Line | 1-800-345-8765 | |
| Investor Services Representative | 1-800-345-2021
or 816-531-5575 | |
| Banks and Trust Companies, Broker-Dealers, Financial Professionals, Insurance Companies | 1-800-345-6488 | |
| | |
| This report and the statements it contains are submitted for the general information of our shareholders. The report is not authorized for distribution to prospective investors unless preceded or accompanied by an effective prospectus. | |
| | |
©2025 American Century Proprietary Holdings, Inc. All rights reserved.
CL-ANN-91029 2501 | |
| | | | | |
| |
| Annual Financial Statements and Other Information |
| |
| November 30, 2024 |
| |
| Non-U.S. Intrinsic Value Fund |
| Investor Class (ANTUX) |
| I Class (ANVHX) |
| A Class (ANVLX) |
| R Class (ANVRX) |
| R6 Class (ANVMX) |
| G Class (ANTGX) |
| | | | | |
| Schedule of Investments | |
| Statement of Assets and Liabilities | |
| Statement of Operations | |
| Statement of Changes in Net Assets | |
| Notes to Financial Statements | |
| Financial Highlights | |
| Report of Independent Registered Public Accounting Firm | |
| Approval of Management Agreement | |
| |
| Other Tax Information | |
NOVEMBER 30, 2024
| | | | | | | | |
| Shares | Value |
| COMMON STOCKS — 98.5% | | |
| Brazil — 1.2% | | |
| Ambev SA | 1,988,200 | | $ | 4,166,867 | |
| Vale SA | 279,700 | | 2,747,817 | |
| | 6,914,684 | |
| Canada — 3.8% | | |
ERO Copper Corp.(1) | 126,730 | | 1,936,184 | |
| Linamar Corp. | 178,376 | | 7,831,701 | |
| Open Text Corp. | 133,885 | | 4,077,609 | |
| Parkland Corp. | 296,692 | | 7,660,738 | |
| | 21,506,232 | |
| China — 5.5% | | |
| Alibaba Group Holding Ltd. | 1,048,600 | | 11,452,011 | |
| Autohome, Inc., ADR | 253,243 | | 6,966,715 | |
| Tencent Holdings Ltd. | 259,200 | | 13,385,933 | |
| | 31,804,659 | |
| France — 20.3% | | |
| Arkema SA | 98,249 | | 7,795,706 | |
| BNP Paribas SA | 69,440 | | 4,150,825 | |
| Eiffage SA | 158,532 | | 14,313,940 | |
| Orange SA | 1,712,941 | | 18,256,563 | |
| Rexel SA | 443,906 | | 11,474,212 | |
| Sanofi SA | 246,004 | | 23,893,674 | |
| Teleperformance SE | 187,606 | | 17,665,897 | |
| Verallia SA | 638,238 | | 16,996,269 | |
Worldline SA(1) | 269,019 | | 1,894,442 | |
| | 116,441,528 | |
| Germany — 8.7% | | |
| Bayerische Motoren Werke AG | 188,054 | | 13,986,608 | |
| Continental AG | 210,000 | | 13,820,307 | |
| Daimler Truck Holding AG | 203,987 | | 7,731,932 | |
| Mercedes-Benz Group AG | 259,796 | | 14,605,539 | |
| | 50,144,386 | |
| Italy — 1.0% | | |
| Eni SpA | 187,195 | | 2,648,655 | |
| Stellantis NV | 221,173 | | 2,935,827 | |
| | 5,584,482 | |
| Japan — 3.5% | | |
| SUMCO Corp. | 2,449,000 | | 19,800,258 | |
| Mexico — 0.7% | | |
| Bolsa Mexicana de Valores SAB de CV | 2,479,734 | | 3,893,277 | |
| Netherlands — 5.7% | | |
| ING Groep NV | 698,827 | | 10,788,040 | |
| NN Group NV | 306,799 | | 14,238,052 | |
| Signify NV | 355,524 | | 7,948,625 | |
| | 32,974,717 | |
Russia(2) — 0.0% | | |
| GMK Norilskiy Nickel PAO | 7,693,300 | | 72 | |
| | | | | | | | |
| Shares | Value |
| South Korea — 11.2% | | |
| BGF retail Co. Ltd. | 64,064 | | $ | 4,980,964 | |
| Hyundai Mobis Co. Ltd. | 79,407 | | 13,674,144 | |
| Kia Corp. | 105,120 | | 7,039,135 | |
| KT&G Corp. | 63,643 | | 5,570,540 | |
| LG Corp. | 146,302 | | 7,886,467 | |
| Samsung Electronics Co. Ltd. | 645,936 | | 25,400,268 | |
| | 64,551,518 | |
| Spain — 0.5% | | |
| Repsol SA | 218,693 | | 2,737,338 | |
| Sweden — 0.8% | | |
Volvo Car AB, Class B(1) | 2,101,593 | | 4,608,622 | |
| Switzerland — 7.0% | | |
| Adecco Group AG | 614,468 | | 16,408,506 | |
| Roche Holding AG | 81,984 | | 23,820,511 | |
| | 40,229,017 | |
| United Kingdom — 26.7% | | |
| Barclays PLC | 4,739,757 | | 15,887,674 | |
| Barratt Redrow PLC | 1,104,399 | | 6,014,616 | |
| British American Tobacco PLC | 689,967 | | 26,205,179 | |
| GSK PLC | 1,334,330 | | 22,668,005 | |
| Hikma Pharmaceuticals PLC | 294,959 | | 7,222,768 | |
| Mondi PLC | 567,590 | | 8,598,849 | |
| Nomad Foods Ltd. | 216,701 | | 3,967,795 | |
| Prudential PLC | 1,404,682 | | 11,512,344 | |
| Reckitt Benckiser Group PLC | 351,519 | | 21,804,757 | |
| Shell PLC | 87,120 | | 2,799,782 | |
| Taylor Wimpey PLC | 6,377,577 | | 10,642,139 | |
| WPP PLC | 1,485,229 | | 16,245,537 | |
| | 153,569,445 | |
| United States — 1.9% | | |
| CNH Industrial NV | 864,438 | | 10,857,341 | |
TOTAL COMMON STOCKS (Cost $590,771,527) | | 565,617,576 | |
| SHORT-TERM INVESTMENTS — 0.9% | | |
| Repurchase Agreements — 0.9% | | |
| BMO Capital Markets Corp., (collateralized by various U.S. Treasury obligations, 3.625%, 2/15/44, valued at $489,885), in a joint trading account at 4.56%, dated 11/29/24, due 12/2/24 (Delivery value $481,292) | | 481,109 | |
| Fixed Income Clearing Corp., (collateralized by various U.S. Treasury obligations, 4.125%, 7/31/31, valued at $4,859,369), at 4.57%, dated 11/29/24, due 12/2/24 (Delivery value $4,765,814) | | 4,764,000 | |
TOTAL SHORT-TERM INVESTMENTS (Cost $5,245,109) | | 5,245,109 | |
TOTAL INVESTMENT SECURITIES — 99.4% (Cost $596,016,636) | | 570,862,685 | |
| OTHER ASSETS AND LIABILITIES — 0.6% | | 3,381,722 | |
| TOTAL NET ASSETS — 100.0% | | $ | 574,244,407 | |
| | | | | |
| MARKET SECTOR DIVERSIFICATION |
| (as a % of net assets) | |
| Consumer Discretionary | 18.6% |
| Industrials | 16.4% |
| Health Care | 13.5% |
| Consumer Staples | 11.6% |
| Financials | 10.9% |
| Communication Services | 9.5% |
| Information Technology | 8.6% |
| Materials | 6.6% |
| Energy | 2.8% |
| Short-Term Investments | 0.9% |
| Other Assets and Liabilities | 0.6% |
| | | | | | | | |
| NOTES TO SCHEDULE OF INVESTMENTS |
| ADR | – | American Depositary Receipt |
(1)Non-income producing.
(2)Securities may be subject to resale, redemption or transferability restrictions.
See Notes to Financial Statements.
| | |
| Statement of Assets and Liabilities |
| | | | | |
| NOVEMBER 30, 2024 | |
| Assets | |
| Investment securities, at value (cost of $596,016,636) | $ | 570,862,685 | |
| Cash | 21,169 | |
| Foreign currency holdings, at value (cost of $1,387,196) | 1,291 | |
| Receivable for capital shares sold | 400,497 | |
| Dividends and interest receivable | 3,075,274 | |
| 574,360,916 | |
| |
| Liabilities | |
| Payable for capital shares redeemed | 19,950 | |
| Accrued management fees | 96,504 | |
| Distribution and service fees payable | 55 | |
| 116,509 | |
| |
| Net Assets | $ | 574,244,407 | |
| |
| Net Assets Consist of: | |
| Capital (par value and paid-in surplus) | $ | 546,038,585 | |
| Distributable earnings (loss) | 28,205,822 | |
| $ | 574,244,407 | |
| | | | | | | | | | | |
| Net Assets | Shares Outstanding | Net Asset Value Per Share* |
| Investor Class, $0.01 Par Value | $87,009,417 | 9,325,163 | $9.33 |
| I Class, $0.01 Par Value | $17,388,624 | 1,861,612 | $9.34 |
| A Class, $0.01 Par Value | $131,868 | 14,173 | $9.30 |
| R Class, $0.01 Par Value | $54,911 | 5,919 | $9.28 |
| R6 Class, $0.01 Par Value | $5,927 | 621 | $9.54 |
| G Class, $0.01 Par Value | $469,653,660 | 49,612,860 | $9.47 |
*Maximum offering price per share was equal to the net asset value per share for all share classes, except A Class, for which the maximum offering price per share was $9.87 (net asset value divided by 0.9425). A contingent deferred sales charge may be imposed on redemptions of A Class.
See Notes to Financial Statements.
| | | | | |
| YEAR ENDED NOVEMBER 30, 2024 | |
| Investment Income (Loss) | |
| Income: | |
| Dividends (net of foreign taxes withheld of $2,411,459) | $ | 24,776,963 | |
| Interest | 342,555 | |
| 25,119,518 | |
| |
| Expenses: | |
| Management fees | 5,090,432 | |
| Distribution and service fees: | |
| A Class | 358 | |
| R Class | 487 | |
| Directors' fees and expenses | 17,750 | |
| Foreign withholding tax reclaim expenses | 99,249 | |
| Other expenses | 12,346 | |
| 5,220,622 | |
| Fees waived - G Class | (3,852,559) | |
| 1,368,063 | |
| |
| Net investment income (loss) | 23,751,455 | |
| |
| Realized and Unrealized Gain (Loss) | |
| Net realized gain (loss) on: | |
| Investment transactions | 49,708,409 | |
| Foreign currency translation transactions | (271,451) | |
| 49,436,958 | |
| |
| Change in net unrealized appreciation (depreciation) on: | |
| Investments | (23,912,677) | |
| Translation of assets and liabilities in foreign currencies | (42,682) | |
| (23,955,359) | |
| |
| Net realized and unrealized gain (loss) | 25,481,599 | |
| |
| Net Increase (Decrease) in Net Assets Resulting from Operations | $ | 49,233,054 | |
See Notes to Financial Statements.
| | |
| Statement of Changes in Net Assets |
| | | | | | | | |
| YEARS ENDED NOVEMBER 30, 2024 AND NOVEMBER 30, 2023 |
| Increase (Decrease) in Net Assets | November 30, 2024 | November 30, 2023 |
| Operations | | |
| Net investment income (loss) | $ | 23,751,455 | | $ | 21,503,899 | |
| Net realized gain (loss) | 49,436,958 | | 48,457,400 | |
| Change in net unrealized appreciation (depreciation) | (23,955,359) | | 18,898,022 | |
| Net increase (decrease) in net assets resulting from operations | 49,233,054 | | 88,859,321 | |
| | |
| Distributions to Shareholders | | |
| From earnings: | | |
| Investor Class | (12,641,256) | | (4,999,905) | |
| I Class | (56,925) | | (65,407) | |
| A Class | (14,422) | | (593) | |
| R Class | (11,877) | | (3,141) | |
| R6 Class | (663) | | (228) | |
| G Class | (57,386,258) | | (24,116,165) | |
| Decrease in net assets from distributions | (70,111,401) | | (29,185,439) | |
| | |
| Capital Share Transactions | | |
| Net increase (decrease) in net assets from capital share transactions (Note 5) | 11,123,807 | | (81,376,559) | |
| | |
| Net increase (decrease) in net assets | (9,754,540) | | (21,702,677) | |
| | |
| Net Assets | | |
| Beginning of period | 583,998,947 | | 605,701,624 | |
| End of period | $ | 574,244,407 | | $ | 583,998,947 | |
See Notes to Financial Statements.
| | |
| Notes to Financial Statements |
NOVEMBER 30, 2024
1. Organization
American Century World Mutual Funds, Inc. (the corporation) is registered under the Investment Company Act of 1940, as amended (the 1940 Act), as an open-end management investment company and is organized as a Maryland corporation. Non-U.S. Intrinsic Value Fund (the fund) is one fund in a series issued by the corporation. The fund’s investment objective is to seek capital appreciation.
The fund offers the Investor Class, I Class, A Class, R Class, R6 Class and G Class. The A Class may incur an initial sales charge and may be subject to a contingent deferred sales charge.
2. Significant Accounting Policies
The following is a summary of significant accounting policies consistently followed by the fund in preparation of its financial statements. The fund is an investment company and follows accounting and reporting guidance in accordance with accounting principles generally accepted in the United States of America. This may require management to make certain estimates and assumptions at the date of the financial statements. Actual results could differ from these estimates. Management evaluated the impact of events or transactions occurring through the date the financial statements were issued that would merit recognition or disclosure.
Investment Valuations — The fund determines the fair value of its investments and computes its net asset value (NAV) per share at the close of regular trading (usually 4 p.m. Eastern time) on the New York Stock Exchange (NYSE) on each day the NYSE is open. The value of investments of the fund is determined by American Century Investment Management, Inc. (ACIM) (the investment advisor), as the valuation designee, pursuant to its valuation policies and procedures. The Board of Directors oversees the valuation designee and reviews its valuation policies and procedures at least annually.
Equity securities that are listed or traded on a domestic securities exchange are valued at the last reported sales price or at the official closing price as provided by the exchange. Equity securities traded on foreign securities exchanges are generally valued at the closing price of such securities on the exchange where primarily traded or at the close of the NYSE, if that is earlier. If no last sales price is reported, or if local convention or regulation so provides, the mean of the latest bid and asked prices may be used. Securities traded over-the-counter are valued at the mean of the latest bid and asked prices, the last sales price, or the official closing price.
Open-end management investment companies are valued at the reported NAV per share. Repurchase agreements are valued at cost, which approximates fair value.
If the valuation designee determines that the market price for a portfolio security is not readily available or is believed by the valuation designee to be unreliable, such security is valued at fair value as determined in good faith by the valuation designee, in accordance with its policies and procedures. Circumstances that may cause the fund to determine that market quotations are not available or reliable include, but are not limited to: when there is a significant event subsequent to the market quotation; trading in a security has been halted during the trading day; or trading in a security is insufficient or did not take place due to a closure or holiday.
The valuation designee monitors for significant events occurring after the close of an investment’s primary exchange but before the fund’s NAV per share is determined. Significant events may include, but are not limited to: corporate announcements and transactions; regulatory news, governmental action and political unrest that could impact a specific investment or an investment sector; or armed conflicts, natural disasters and similar events that could affect investments in a specific country or region. The valuation designee also monitors for significant fluctuations between domestic and foreign markets, as evidenced by the U.S. market or such other indicators that it deems appropriate. The valuation designee may apply a model-derived factor to the closing price of equity securities traded on foreign securities exchanges. The factor is based on observable market data as provided by an independent pricing service.
Foreign Currency Translations — All assets and liabilities, including investment securities and other financial instruments, initially expressed in foreign currencies are translated into U.S. dollars each day at the mean of the appropriate currency exchange rate at the close of the NYSE as provided by an independent pricing service. The fund may enter into spot foreign currency exchange contracts to facilitate transactions denominated in a foreign currency. Purchases and sales of investment securities, dividend and interest income, spot foreign currency exchange contracts, and expenses are translated at the rates of exchange prevailing on the respective dates of such transactions. Net realized and unrealized foreign currency exchange gains or losses related to investment securities are a component of net realized gain (loss) on investment transactions and change in net unrealized appreciation (depreciation) on investments, respectively.
Security Transactions — Security transactions are accounted for as of the trade date. Net realized gains and losses are determined on the identified cost basis, which is also used for federal income tax purposes.
Investment Income — Dividend income less foreign taxes withheld, if any, is recorded as of the ex-dividend date. Distributions received on securities that represent a return of capital or long-term capital gain are recorded as a reduction of cost of investments and/or as a realized gain. The fund may estimate the components of distributions received that may be considered nontaxable distributions or long-term capital gain distributions for income tax purposes. Interest income is recorded on the accrual basis and includes accretion of discounts and amortization of premiums.
Repurchase Agreements — The fund may enter into repurchase agreements with institutions that ACIM has determined are creditworthy pursuant to criteria adopted by the Board of Directors. The fund requires that the collateral, represented by securities, received in a repurchase transaction be transferred to the custodian in a manner sufficient to enable the fund to obtain those securities in the event of a default under the repurchase agreement. ACIM monitors, on a daily basis, the securities transferred to ensure the value, including accrued interest, of the securities under each repurchase agreement is equal to or greater than amounts owed to the fund under each repurchase agreement.
Joint Trading Account — Pursuant to an Exemptive Order issued by the Securities and Exchange Commission, the fund, along with certain other funds in the American Century Investments family of funds, may transfer uninvested cash balances into a joint trading account. These balances are invested in one or more repurchase agreements that are collateralized by U.S. Treasury or Agency obligations.
Income Tax Status — It is the fund's policy to distribute substantially all net investment income and net realized gains to shareholders and to otherwise qualify as a regulated investment company under provisions of the Internal Revenue Code. Accordingly, no provision has been made for income taxes. The fund files U.S. federal, state, local and non-U.S. tax returns as applicable. The fund's tax returns are subject to examination by the relevant taxing authority until expiration of the applicable statute of limitations, which is generally three years from the date of filing but can be longer in certain jurisdictions. At this time, management believes there are no uncertain tax positions which, based on their technical merit, would not be sustained upon examination and for which it is reasonably possible that the total amounts of unrecognized tax benefits will significantly change in the next twelve months.
Multiple Class — All shares of the fund represent an equal pro rata interest in the net assets of the class to which such shares belong, and have identical voting, dividend, liquidation and other rights and the same terms and conditions, except for class specific expenses and exclusive rights to vote on matters affecting only individual classes. Income, non-class specific expenses, and realized and unrealized capital gains and losses of the fund are allocated to each class of shares based on their relative net assets.
Distributions to Shareholders — Distributions from net investment income and net realized gains, if any, are generally declared and paid annually. The fund may make distributions on a more frequent basis to comply with the distribution requirements of the Internal Revenue Code, in all events in a manner consistent with provisions of the 1940 Act. The fund may elect to treat a portion of its payment to a redeeming shareholder, which represents the pro rata share of undistributed net investment income and net realized gains, as a distribution for federal income tax purposes (tax equalization).
Indemnifications — Under the corporation’s organizational documents, its officers and directors are indemnified against certain liabilities arising out of the performance of their duties to the fund. In addition, in the normal course of business, the fund enters into contracts that provide general indemnifications. The maximum exposure under these arrangements is unknown as this would involve future claims that may be made against a fund. The risk of material loss from such claims is considered by management to be remote.
3. Fees and Transactions with Related Parties
Certain officers and directors of the corporation are also officers and/or directors of American Century Companies, Inc. (ACC). The corporation's investment advisor, ACIM, the corporation's distributor, American Century Investment Services, Inc. (ACIS), and the corporation's transfer agent, American Century Services, LLC, are wholly owned, directly or indirectly, by ACC. Various funds issued by American Century Asset Allocation Portfolios, Inc. own, in aggregate, 49% of the shares of the fund. Related parties do not invest in the fund for the purpose of exercising management or control.
Management Fees — The corporation has entered into a management agreement with ACIM, under which ACIM provides the fund with investment advisory and management services in exchange for a single, unified management fee (the fee) per class. The agreement provides that ACIM will pay all expenses of managing and operating the fund, except brokerage expenses, taxes, interest, fees and expenses of the independent directors (including legal counsel fees), extraordinary expenses, and expenses incurred in connection with the provision of shareholder services and distribution services under a plan adopted pursuant to Rule 12b-1 under the 1940 Act. The fee is computed and accrued daily based on each class's daily net assets and paid monthly in arrears. The difference in the fee among the classes is a result of their separate arrangements for non-Rule 12b-1 shareholder services. It is not the result of any difference in advisory or custodial fees or other expenses related to the management of the fund’s assets, which do not vary by class. The investment advisor agreed to waive the G Class's management fee in its entirety. The investment advisor expects this waiver to remain in effect permanently and cannot terminate it without the approval of the Board of Directors.
The annual management fee for each class is as follows:
| | | | | | | | | | | | | | | | | |
| Investor Class | I Class | A Class | R Class | R6 Class | G Class |
| 1.15% | 0.95% | 1.15% | 1.15% | 0.80% | 0.00%(1) |
(1)Annual management fee before waiver was 0.80%.
Distribution and Service Fees — The Board of Directors has adopted a separate Master Distribution and Individual Shareholder Services Plan for each of the A Class and R Class (collectively the plans), pursuant to Rule 12b-1 of the 1940 Act. The plans provide that the A Class will pay ACIS an annual distribution and service fee of 0.25%. The plans provide that the R Class will pay ACIS an annual distribution and service fee of 0.50%. The fees are computed and accrued daily based on each class’s daily net assets and paid monthly in arrears. The fees are used to pay financial intermediaries for distribution and individual shareholder services. Fees incurred under the plans during the period ended November 30, 2024 are detailed in the Statement of Operations.
Directors' Fees and Expenses — The Board of Directors is responsible for overseeing the investment advisor’s management and operations of the fund. The directors receive detailed information about the fund and its investment advisor regularly throughout the year, and meet at least quarterly with management of the investment advisor to review reports about fund operations. The fund's officers do not receive compensation from the fund.
Foreign Withholding Tax Reclaim Expenses — The fund may file withholding tax reclaims in certain jurisdictions to recover a portion of amounts previously withheld. The fund may incur expenses in association with recovery of such taxes. The impact of foreign withholding tax reclaim expenses to the ratio of operating expenses to average net assets was 0.02% for the period ended November 30, 2024.
Other Expenses — A fund’s other expenses may include interest charges, clearing exchange fees, proxy solicitation expenses, fees associated with the recovery of foreign tax reclaims and other miscellaneous expenses.
Interfund Transactions — The fund may enter into security transactions with other American Century Investments funds and other client accounts of the investment advisor, in accordance with the 1940 Act rules and procedures adopted by the Board of Directors. The rules and procedures require, among other things, that these transactions be effected at the independent current market price of the security. During the period, the interfund purchases and sales were $448,093 and $317,405, respectively. The effect of interfund transactions on the Statement of Operations was $16,303 in net realized gain (loss) on investment transactions.
4. Investment Transactions
Purchases and sales of investment securities, excluding short-term investments, for the period ended November 30, 2024 were $374,652,613 and $403,187,322, respectively.
5. Capital Share Transactions
Transactions in shares of the fund were as follows:
| | | | | | | | | | | | | | |
| Year ended
November 30, 2024 | Year ended
November 30, 2023 |
| Shares | Amount | Shares | Amount |
| Investor Class/Shares Authorized | 150,000,000 | | | 150,000,000 | | |
| Sold | 149,033 | | $ | 1,393,891 | | 1,401,342 | | $ | 13,564,751 | |
| Issued in reinvestment of distributions | 1,383,983 | | 12,635,761 | | 585,447 | | 4,999,719 | |
| Redeemed | (3,843,704) | | (35,605,759) | | (5,940,162) | | (54,813,895) | |
| (2,310,688) | | (21,576,107) | | (3,953,373) | | (36,249,425) | |
| I Class/Shares Authorized | 40,000,000 | | | 40,000,000 | | |
| Sold | 2,380,197 | | 21,529,456 | | 301,057 | | 2,879,298 | |
| Issued in reinvestment of distributions | 4,875 | | 44,464 | | 1,418 | | 12,093 | |
| Redeemed | (570,780) | | (5,447,057) | | (410,073) | | (3,954,832) | |
| 1,814,292 | | 16,126,863 | | (107,598) | | (1,063,441) | |
| A Class/Shares Authorized | 35,000,000 | | | 35,000,000 | | |
| Sold | 3,523 | | 32,926 | | 12,750 | | 117,156 | |
| Issued in reinvestment of distributions | 1,581 | | 14,422 | | 70 | | 593 | |
| Redeemed | (5,180) | | (50,966) | | (122) | | (1,203) | |
| (76) | | (3,618) | | 12,698 | | 116,546 | |
| R Class/Shares Authorized | 35,000,000 | | | 35,000,000 | | |
| Sold | 6,576 | | 61,861 | | 26,800 | | 253,974 | |
| Issued in reinvestment of distributions | 1,302 | | 11,877 | | 368 | | 3,141 | |
| Redeemed | (12,228) | | (113,869) | | (25,497) | | (235,798) | |
| (4,350) | | (40,131) | | 1,671 | | 21,317 | |
| R6 Class/Shares Authorized | 35,000,000 | | | 35,000,000 | | |
| Issued in reinvestment of distributions | 71 | | 663 | | 26 | | 228 | |
| G Class/Shares Authorized | 600,000,000 | | | 600,000,000 | | |
| Sold | 7,631,079 | | 72,743,003 | | 3,863,635 | | 36,695,588 | |
| Issued in reinvestment of distributions | 6,264,875 | | 57,386,258 | | 2,817,309 | | 24,116,165 | |
| Redeemed | (11,475,672) | | (113,513,124) | | (11,289,069) | | (105,013,537) | |
| 2,420,282 | | 16,616,137 | | (4,608,125) | | (44,201,784) | |
| Net increase (decrease) | 1,919,531 | | $ | 11,123,807 | | (8,654,701) | | $ | (81,376,559) | |
6. Fair Value Measurements
The fund's investments valuation process is based on several considerations and may use multiple inputs to determine the fair value of the investments held by the fund. In conformity with accounting principles generally accepted in the United States of America, the inputs used to determine a valuation are classified into three broad levels.
•Level 1 valuation inputs consist of unadjusted quoted prices in an active market for identical investments.
•Level 2 valuation inputs consist of direct or indirect observable market data (including quoted prices for comparable investments, evaluations of subsequent market events, interest rates, prepayment speeds, credit risk, etc.). These inputs also consist of quoted prices for identical investments initially expressed in local currencies that are adjusted through translation into U.S. dollars.
•Level 3 valuation inputs consist of unobservable data (including a fund’s own assumptions).
The level classification is based on the lowest level input that is significant to the fair valuation measurement. The valuation inputs are not necessarily an indication of the risks associated with investing in these securities or other financial instruments.
The following is a summary of the level classifications as of period end. The Schedule of Investments provides additional information on the fund's portfolio holdings.
| | | | | | | | | | | |
| Level 1 | Level 2 | Level 3 |
| Assets | | | |
| Investment Securities | | | |
| Common Stocks | $ | 21,791,851 | | $ | 543,825,725 | | — | |
| Short-Term Investments | — | | 5,245,109 | | — | |
| $ | 21,791,851 | | $ | 549,070,834 | | — | |
7. Risk Factors
The value of the fund’s shares will go up and down, sometimes rapidly or unpredictably, based on the performance of the securities owned by the fund and other factors generally affecting the securities market. Market risks, including political, regulatory, economic and social developments, can affect the value of the fund’s investments. Natural disasters, public health emergencies, war, terrorism and other unforeseeable events may lead to increased market volatility and may have adverse long-term effects on world economies and markets generally.
There are certain risks involved in investing in foreign securities. These risks include those resulting from political events (such as civil unrest, national elections and imposition of exchange controls), social and economic events (such as labor strikes and rising inflation), and natural disasters. Securities of foreign issuers may be less liquid and more volatile. Investing in emerging markets or a significant portion of assets in one country or region may accentuate these risks.
The majority of the fund is owned by a relatively small number of shareholders. To the extent that a large shareholder (including a fund of funds) invests in the fund, the fund may experience relatively large redemptions as such shareholder reallocates its assets. In the event of a large shareholder redemption, the ongoing operations of the fund may be at risk.
8. Federal Tax Information
On December 17, 2024, the fund declared and paid a per-share distribution from net realized gains to shareholders of record on December 16, 2024 of $0.7445 for the Investor Class, I Class, A Class, R Class, R6 Class and G Class.
On December 17, 2024, the fund declared and paid the following per-share distributions from net investment income to shareholders of record on December 16, 2024:
| | | | | | | | | | | | | | | | | |
| Investor Class | I Class | A Class | R Class | R6 Class | G Class |
| $0.2539 | $0.2722 | $0.2310 | $0.2081 | $0.2859 | $0.3591 |
The tax character of distributions paid during the years ended November 30, 2024 and November 30, 2023 were as follows:
| | | | | | | | |
| 2024 | 2023 |
| Distributions Paid From | | |
| Ordinary income | $ | 45,412,555 | | $ | 29,185,439 | |
| Long-term capital gains | $ | 24,698,846 | | — | |
The book-basis character of distributions made during the year from net investment income or net realized gains may differ from their ultimate characterization for federal income tax purposes. These differences reflect the differing character of certain income items and net realized gains and losses for financial statement and tax purposes, and may result in reclassification among certain capital accounts on the financial statements.
As of period end, the federal tax cost of investments and the components of distributable earnings on a tax-basis were as follows:
| | | | | |
| Federal tax cost of investments | $ | 610,249,869 | |
| Gross tax appreciation of investments | $ | 38,764,234 | |
| Gross tax depreciation of investments | (78,151,418) | |
| Net tax appreciation (depreciation) of investments | (39,387,184) | |
| Net tax appreciation (depreciation) on translation of assets and liabilities in foreign currencies | (1,389,631) | |
| Net tax appreciation (depreciation) | $ | (40,776,815) | |
| Undistributed ordinary income | $ | 36,391,749 | |
| Accumulated long-term gains | $ | 32,590,888 | |
The difference between book-basis and tax-basis unrealized appreciation (depreciation) is attributable primarily to the tax deferral of losses on wash sales.
| | | | | | | | | | | | | | | | | | | | | | | | | | | | | | | | | | | | | | | | | | | | | | | |
| For a Share Outstanding Throughout the Years Ended November 30 (except as noted) | | | | | |
| Per-Share Data | | | | | | | Ratios and Supplemental Data |
| | Income From Investment Operations*: | Distributions From: | | | Ratio to Average Net Assets of†: | | |
| Net Asset
Value,
Beginning
of Period | Net Investment Income (Loss)(1) | Net
Realized
and
Unrealized
Gain (Loss) | Total From
Investment
Operations | Net
Investment
Income | Net
Realized
Gains | Total
Distributions | Net Asset
Value,
End
of Period | Total Return(2) | Operating
Expenses | Operating
Expenses
(before
expense
waiver) | Net
Investment
Income
(Loss) | Net Investment Income (Loss) (before expense waiver) | Portfolio
Turnover
Rate | Net Assets,
End of
Period
(in
thousands) |
| Investor Class |
| 2024 | $9.81 | 0.28 | 0.41 | 0.69 | (0.28) | (0.89) | (1.17) | $9.33 | 7.28% | 1.17% | 1.17% | 3.07% | 3.07% | 64% | $87,009 | |
| 2023 | $8.88 | 0.28 | 1.05 | 1.33 | (0.34) | (0.06) | (0.40) | $9.81 | 15.84% | 1.19% | 1.19% | 2.84% | 2.84% | 62% | $114,111 | |
| 2022 | $9.76 | 0.32 | (0.76) | (0.44) | (0.16) | (0.28) | (0.44) | $8.88 | (5.03)% | 1.16% | 1.16% | 3.59% | 3.59% | 67% | $138,382 | |
| 2021 | $8.98 | 0.18 | 0.72 | 0.90 | (0.12) | — | (0.12) | $9.76 | 10.15% | 1.25% | 1.25% | 1.76% | 1.76% | 54% | $152,993 | |
| 2020 | $10.61 | 0.13 | (1.31) | (1.18) | (0.32) | (0.13) | (0.45) | $8.98 | (11.75)% | 1.31% | 1.31% | 1.60% | 1.60% | 68% | $107,655 | |
| I Class |
| 2024 | $9.82 | 0.37 | 0.34 | 0.71 | (0.30) | (0.89) | (1.19) | $9.34 | 7.51% | 0.97% | 0.97% | 3.27% | 3.27% | 64% | $17,389 | |
| 2023 | $8.89 | 0.38 | 0.97 | 1.35 | (0.36) | (0.06) | (0.42) | $9.82 | 15.93% | 0.99% | 0.99% | 3.04% | 3.04% | 62% | $464 | |
| 2022 | $9.78 | 0.33 | (0.76) | (0.43) | (0.18) | (0.28) | (0.46) | $8.89 | (4.81)% | 0.96% | 0.96% | 3.79% | 3.79% | 67% | $1,377 | |
| 2021 | $8.99 | 0.19 | 0.74 | 0.93 | (0.14) | — | (0.14) | $9.78 | 10.47% | 1.05% | 1.05% | 1.96% | 1.96% | 54% | $194 | |
2020(3) | $10.45 | 0.15 | (1.16) | (1.01) | (0.32) | (0.13) | (0.45) | $8.99 | (10.29)% | 1.11% | 1.11% | 1.80% | 1.80% | 68%(4) | $4 | |
| A Class |
| 2024 | $9.78 | 0.28 | 0.39 | 0.67 | (0.26) | (0.89) | (1.15) | $9.30 | 7.01% | 1.42% | 1.42% | 2.82% | 2.82% | 64% | $132 | |
| 2023 | $8.85 | 0.16 | 1.15 | 1.31 | (0.32) | (0.06) | (0.38) | $9.78 | 15.46% | 1.44% | 1.44% | 2.59% | 2.59% | 62% | $139 | |
| 2022 | $9.73 | 0.29 | (0.76) | (0.47) | (0.13) | (0.28) | (0.41) | $8.85 | (5.28)% | 1.41% | 1.41% | 3.34% | 3.34% | 67% | $14 | |
| 2021 | $8.96 | 0.16 | 0.71 | 0.87 | (0.10) | — | (0.10) | $9.73 | 9.89% | 1.50% | 1.50% | 1.51% | 1.51% | 54% | $13 | |
2020(3) | $10.45 | 0.11 | (1.15) | (1.04) | (0.32) | (0.13) | (0.45) | $8.96 | (10.62)% | 1.56% | 1.56% | 1.35% | 1.35% | 68%(4) | $4 | |
| R Class |
| 2024 | $9.75 | 0.24 | 0.41 | 0.65 | (0.23) | (0.89) | (1.12) | $9.28 | 6.85% | 1.67% | 1.67% | 2.57% | 2.57% | 64% | $55 | |
| 2023 | $8.83 | 0.25 | 1.03 | 1.28 | (0.30) | (0.06) | (0.36) | $9.75 | 15.09% | 1.69% | 1.69% | 2.34% | 2.34% | 62% | $100 | |
| 2022 | $9.71 | 0.26 | (0.75) | (0.49) | (0.11) | (0.28) | (0.39) | $8.83 | (5.43)% | 1.66% | 1.66% | 3.09% | 3.09% | 67% | $76 | |
| 2021 | $8.93 | 0.15 | 0.71 | 0.86 | (0.08) | — | (0.08) | $9.71 | 9.65% | 1.75% | 1.75% | 1.26% | 1.26% | 54% | $31 | |
2020(3) | $10.45 | 0.09 | (1.16) | (1.07) | (0.32) | (0.13) | (0.45) | $8.93 | (10.93)% | 1.81% | 1.81% | 1.10% | 1.10% | 68%(4) | $6 | |
| R6 Class |
| 2024 | $10.00 | 0.33 | 0.42 | 0.75 | (0.32) | (0.89) | (1.21) | $9.54 | 7.75% | 0.82% | 0.82% | 3.42% | 3.42% | 64% | $6 | |
| 2023 | $9.04 | 0.32 | 1.07 | 1.39 | (0.37) | (0.06) | (0.43) | $10.00 | 16.17% | 0.84% | 0.84% | 3.19% | 3.19% | 62% | $6 | |
| 2022 | $9.94 | 0.35 | (0.78) | (0.43) | (0.19) | (0.28) | (0.47) | $9.04 | (4.70)% | 0.81% | 0.81% | 3.94% | 3.94% | 67% | $5 | |
| 2021 | $9.14 | 0.22 | 0.73 | 0.95 | (0.15) | — | (0.15) | $9.94 | 10.57% | 0.90% | 0.90% | 2.11% | 2.11% | 54% | $5 | |
2020(3) | $10.60 | 0.16 | (1.16) | (1.00) | (0.33) | (0.13) | (0.46) | $9.14 | (10.12)% | 0.96% | 0.96% | 1.95% | 1.95% | 68%(4) | $4 | |
| | | | | | | | | | | | | | | | | | | | | | | | | | | | | | | | | | | | | | | | | | | | | | | |
| For a Share Outstanding Throughout the Years Ended November 30 (except as noted) | | | | | |
| Per-Share Data | | | | | | | Ratios and Supplemental Data |
| | Income From Investment Operations*: | Distributions From: | | | Ratio to Average Net Assets of†: | | |
| Net Asset
Value,
Beginning
of Period | Net Investment Income (Loss)(1) | Net
Realized
and
Unrealized
Gain (Loss) | Total From
Investment
Operations | Net
Investment
Income | Net
Realized
Gains | Total
Distributions | Net Asset
Value,
End
of Period | Total Return(2) | Operating
Expenses | Operating
Expenses
(before
expense
waiver) | Net
Investment
Income
(Loss) | Net Investment Income (Loss) (before expense waiver) | Portfolio
Turnover
Rate | Net Assets,
End of
Period
(in
thousands) |
| G Class |
| 2024 | $9.94 | 0.41 | 0.41 | 0.82 | (0.40) | (0.89) | (1.29) | $9.47 | 8.65% | 0.02% | 0.82% | 4.22% | 3.42% | 64% | $469,654 | |
| 2023 | $8.99 | 0.38 | 1.07 | 1.45 | (0.44) | (0.06) | (0.50) | $9.94 | 17.10% | 0.04% | 0.84% | 3.99% | 3.19% | 62% | $469,178 | |
| 2022 | $9.90 | 0.42 | (0.77) | (0.35) | (0.28) | (0.28) | (0.56) | $8.99 | (3.94)% | 0.01% | 0.81% | 4.74% | 3.94% | 67% | $465,848 | |
| 2021 | $9.11 | 0.31 | 0.72 | 1.03 | (0.24) | — | (0.24) | $9.90 | 11.56% | 0.00% | 0.90% | 3.01% | 2.11% | 54% | $497,745 | |
| 2020 | $10.76 | 0.24 | (1.29) | (1.05) | (0.47) | (0.13) | (0.60) | $9.11 | (10.58)% | 0.01% | 0.96% | 2.90% | 1.95% | 68% | $463,081 | |
| | |
| Notes to Financial Highlights |
(1)Computed using average shares outstanding throughout the period.
(2)Total returns are calculated based on the net asset value of the last business day and do not reflect applicable sales charges, if any. Total returns for periods less than one year are not annualized.
(3)December 3, 2019 (commencement of sale) through November 30, 2020.
(4)Portfolio turnover is calculated at the fund level. Percentage indicated was calculated for the year ended November 30, 2020.
*The amount shown for a share outstanding throughout the period may not correlate with the Statement(s) of Operations or precisely reflect the class expense differentials due to the timing of transactions in shares of a fund in relation to income earned and/or fluctuations in the fair value of a fund's investments.
†Ratios for periods less than one year are annualized. Zero balances may reflect amounts less than 0.005%.
See Notes to Financial Statements.
| | |
| Report of Independent Registered Public Accounting Firm |
To the shareholders of the Non-U.S. Intrinsic Value Fund and the Board of Directors of American Century World Mutual Funds, Inc.
Opinion on the Financial Statements and Financial Highlights
We have audited the accompanying statement of assets and liabilities, including the schedule of investments, of Non-U.S. Intrinsic Value Fund (the “Fund”), one of the funds constituting the American Century World Mutual Funds, Inc., as of November 30, 2024, the related statement of operations for the year then ended, the statements of changes in net assets for each of the two years in the period then ended, the financial highlights for each of the five years in the period then ended, and the related notes. In our opinion, the financial statements and financial highlights present fairly, in all material respects, the financial position of the Fund as of November 30, 2024, and the results of its operations for the year then ended, the changes in its net assets for each of the two years in the period then ended, and the financial highlights for each of the five years in the period then ended, in conformity with accounting principles generally accepted in the United States of America.
Basis for Opinion
These financial statements and financial highlights are the responsibility of the Fund's management. Our responsibility is to express an opinion on the Fund’s financial statements and financial highlights based on our audits. We are a public accounting firm registered with the Public Company Accounting Oversight Board (United States) (PCAOB) and are required to be independent with respect to the Fund in accordance with the U.S. federal securities laws and the applicable rules and regulations of the Securities and Exchange Commission and the PCAOB.
We conducted our audits in accordance with the standards of the PCAOB. Those standards require that we plan and perform the audit to obtain reasonable assurance about whether the financial statements and financial highlights are free of material misstatement, whether due to error or fraud. The Fund is not required to have, nor were we engaged to perform, an audit of its internal control over financial reporting. As part of our audits, we are required to obtain an understanding of internal control over financial reporting but not for the purpose of expressing an opinion on the effectiveness of the Fund’s internal control over financial reporting. Accordingly, we express no such opinion.
Our audits included performing procedures to assess the risks of material misstatement of the financial statements and financial highlights, whether due to error or fraud, and performing procedures that respond to those risks. Such procedures included examining, on a test basis, evidence regarding the amounts and disclosures in the financial statements and financial highlights. Our audits also included evaluating the accounting principles used and significant estimates made by management, as well as evaluating the overall presentation of the financial statements and financial highlights. Our procedures included confirmation of securities owned as of November 30, 2024, by correspondence with the custodian and brokers; when replies were not received from brokers, we performed other auditing procedures. We believe that our audits provide a reasonable basis for our opinion.
/s/ Deloitte & Touche LLP
Kansas City, Missouri
January 16, 2025
We have served as the auditor of one or more American Century investment companies since 1997.
| | |
| Approval of Management Agreement |
At a meeting held on June 27, 2024, the Fund’s Board of Directors (the “Board”) unanimously approved the renewal of the management agreement pursuant to which American Century Investment Management, Inc. (the “Advisor”) acts as the investment advisor for the Fund. Under the Investment Company Act of 1940 (the “Investment Company Act”), contracts for investment advisory services are required to be reviewed, evaluated, and approved by a majority of a fund’s Directors, including a majority of the independent Directors.
Prior to its consideration of the renewal of the management agreement, the Directors requested and reviewed data and information compiled by the Advisor and certain independent consultants and data providers concerning the Fund. This review was in addition to the oversight and evaluation undertaken by the Board and its committees on a continual basis and the information received was supplemental to the information that the Board and its committees receive and consider over time.
In connection with its consideration of the renewal of the management agreement, the Board’s review and evaluation of the services provided by the Advisor and its affiliates included, but was not limited to
•the nature, extent, and quality of investment management, shareholder services, distribution services, and other services provided to the Fund;
•the wide range of programs and services the Advisor and other service providers provide to the Fund and its shareholders on a routine and non-routine basis;
•the Fund’s investment performance compared to appropriate benchmarks and/or peer groups of other mutual funds with similar investment objectives and strategies;
•the cost of owning the Fund compared to the cost of owning similarly-managed funds;
•the Advisor’s compliance policies, procedures, and regulatory experience and those of certain other service providers;
•the Advisor’s strategic plans, generally, and with respect to the Advisor’s response to investment management industry challenges;
•the Advisor’s business continuity plans, vendor management practices, and information security practices;
•the cost of services provided to the Fund, the profitability of the Fund to the Advisor, and the Advisor’s financial results of operation;
•possible economies of scale associated with the Advisor’s management of the Fund;
•any collateral benefits derived by the Advisor from the management of the Fund;
•fees and expenses associated with any investment by the Fund in other funds;
•payments to intermediaries by the Fund and the Advisor and services provided by intermediaries in connection therewith; and
•services provided and charges to the Advisor’s other investment management clients.
The Board held two meetings to consider the renewal. The independent Directors also met in private session multiple times to review and discuss the information provided in response to their request. The independent Directors held active discussions with the Advisor regarding the renewal of the management agreement, requesting supplemental information, and reviewing information provided by the Advisor in response thereto. The independent Directors had the benefit of the advice of their independent counsel throughout the process.
Factors Considered
The Directors considered all of the information provided by the Advisor, the independent consultant and data providers, and the independent Directors’ independent counsel in connection with the approval. They determined that the information was sufficient for them to evaluate the management agreement for the Fund. In connection with their review, the Directors did not identify any single factor as being all-important or controlling, and each Director may have attributed different levels of importance to different factors. In deciding to renew the management agreement, the Board based its decision on a number of factors, including without limitation the following:
Nature, Extent and Quality of Services — Generally. Under the management agreement, the Advisor is responsible for providing or arranging for all services necessary for the operation of the Fund. The Board noted that the Advisor provides or arranges at its own expense a wide variety of services which include, without limitation, the following:
•constructing and designing the Fund
•portfolio research and security selection
•initial capitalization/funding
•securities trading
•Fund administration
•custody of Fund assets
•daily valuation of the Fund’s portfolio
•liquidity monitoring and management
•risk management, including information security
•shareholder servicing and transfer agency, including shareholder confirmations, recordkeeping, and communications
•legal services (except the independent Directors’ counsel)
•regulatory and portfolio compliance
•financial reporting
•marketing and distribution (except amounts paid by the Fund under Rule 12b-1 plans)
The Board noted that many of these services have expanded over time in terms of both quantity and complexity in response to shareholder demands, competition in the industry, changing distribution channels, and the changing regulatory environment.
Investment Management Services. The nature of the investment management services provided to the Fund is quite complex and allows Fund shareholders access to professional money management, instant diversification of their investments, the opportunity to easily diversify among asset classes by investing in or exchanging among various American Century Investments funds, and liquidity. In evaluating investment performance, the Board expects the Advisor to manage the Fund in accordance with its investment objectives and principal investment strategies. Further, the Directors recognize that the Advisor has an obligation to monitor trading activities, and in particular to seek the best execution of fund trades, and to evaluate the use of and payment for research. In providing these services, the Advisor utilizes teams of investment professionals who require extensive information technology, research, training, compliance, and other systems to conduct their business. The Board, directly and through its Fund Performance Review Committee, provides oversight of the investment performance process. It regularly reviews investment performance information for the Fund, together with comparative information for appropriate benchmarks and/or peer groups of similarly-managed funds, over different time horizons. The Directors also review investment performance information from both the Advisor and an independent third party during the management agreement renewal process. If performance concerns are identified, the Board discusses with the Advisor the reasons for such results and any actions being taken to improve performance and may conduct special reviews until performance improves. The Fund’s performance was above its benchmark for the one- and three-year periods and below its benchmark for the five-year period reviewed by the Board. In relation to industry peers, the Fund was above the median of its peer performance universe as identified by a third-party service provider for the three-year period and below the median for the one- and five-year periods. The Board found the investment management services provided by the Advisor to the Fund to be satisfactory and consistent with the management agreement.
Shareholder and Other Services. Under the management agreement, the Advisor provides the Fund with a comprehensive package of transfer agency, shareholder, and other services. The Board, directly and through its various committees, regularly reviews reports and evaluations of such services at its regular meetings. These reports include, but are not limited to, information regarding the operational efficiency and accuracy of the shareholder and transfer agency services provided, staffing levels, shareholder satisfaction, technology support (including information security), new products and services offered to Fund shareholders, securities trading activities, portfolio valuation services, auditing services, and legal and operational compliance activities. The Board found the services provided by the Advisor to the Fund under the management agreement to be competitive and of high quality.
Costs of Services and Profitability. The Advisor provides detailed information concerning its cost of providing various services to the Fund, its profitability in managing the Fund (pre- and post-distribution), and its financial results of operation. The Directors have reviewed with the Advisor the methodology used to prepare this financial information and arranged for an independent consultant to confirm the reasonableness of the allocation methodology used. This information is considered in evaluating the Advisor’s financial condition, its ability to continue to provide services under the management agreement, and the reasonableness of the terms of the current management agreement. The Board concluded that the Advisor’s profits were reasonable in light of the services provided to the Fund.
Ethics. The Board generally considers the Advisor’s commitment to providing quality services to shareholders and to conducting its business ethically. They noted that the Advisor’s practices generally meet or exceed industry best practices.
Economies of Scale. The Board also reviewed information provided by the Advisor regarding the possible existence of economies of scale in connection with the management of the Fund. The Board concluded that economies of scale are difficult to measure and predict with precision, especially on a fund-by-fund basis. The Board concluded that the Advisor is sharing economies of scale, to the extent they exist, through its fee structure, and through reinvestment in its business, infrastructure, investment capabilities and initiatives to provide shareholders enhanced and expanded content and services.
Comparison to Other Funds’ Fees. The management agreement provides that the Fund pays the Advisor a single, all-inclusive (or unified) management fee for providing all services necessary for the management and operation of the Fund, other than brokerage and other transaction fees and expenses relating to acquisition and disposition of portfolio securities, acquired fund fees and expenses, taxes, interest, extraordinary expenses, fund litigation expenses, fees and expenses of the Fund’s independent Directors (including their independent legal counsel), and expenses incurred in connection with the provision of shareholder services and distribution services under a plan adopted pursuant to Investment Company Act Rule 12b-1. Under the unified fee structure, the Advisor is responsible for providing all investment advisory, custody, audit, administrative, compliance, recordkeeping, marketing and shareholder services, or arranging and supervising third parties to provide such services. By contrast, most other funds are charged a variety of fees, including an investment advisory fee, a transfer agency fee, an administrative fee, distribution charges, and other expenses. Other than their investment advisory fees and any applicable Rule 12b-1 distribution fees, all other components of the total fees charged by these other funds may be increased without shareholder approval. The Board believes the unified fee structure is a benefit to Fund shareholders because it clearly discloses to shareholders the cost of owning Fund shares, and,
since the unified fee cannot be increased without a vote of Fund shareholders, it shifts to the Advisor the risk of increased costs of operating the Fund and provides a direct incentive to minimize administrative inefficiencies. Part of the Board’s analysis of fee levels involves reviewing certain evaluative data compiled by an independent provider comparing the Fund’s unified fee to the total expense ratios of its peers. The unified fee charged to shareholders of the Fund was near the median of the total expense ratios of the Fund’s peer expense universe. In addition, the Board reviewed the Fund’s position relative to the narrower set of its expense group peers. The Board concluded that the management fee paid by the Fund to the Advisor under the management agreement is reasonable in light of the services provided to the Fund.
Comparison to Fees and Services Provided to Other Clients of the Advisor. The Board also requested and received information from the Advisor concerning the nature of the services, fees, costs, and profitability of its advisory services to advisory clients other than the Fund. They observed that these varying types of client accounts require different services and involve different regulatory and entrepreneurial risks than the management of the Fund. The Board analyzed this information and concluded that the fees charged and services provided to the Fund were reasonable by comparison.
Payments to Intermediaries. The Directors also requested and received a description of payments made to intermediaries by the Fund and the Advisor and services provided in response thereto. These payments include various payments made by the Fund or the Advisor to different types of intermediaries and recordkeepers for distribution and service activities provided for the Fund. The Directors reviewed such information and received representations from the Advisor that all such payments by the Fund were made pursuant to the Fund’s Rule 12b-1 Plan and that all such payments by the Advisor were made from the Advisor’s resources and reasonable profits.
Collateral or “Fall-Out” Benefits Derived by the Advisor. The Board considered the possible existence of collateral benefits the Advisor may receive as a result of its relationship with the Fund. They concluded that the Advisor’s primary business is managing funds and it generally does not use fund or shareholder information to generate profits in other lines of business, and therefore does not derive any significant collateral benefits from them. To the extent there are potential collateral benefits, the Board has been advised and has taken this into consideration in its review of the management contract with the Fund. The Board noted that additional assets from other clients may offer the Advisor some benefit from increased leverage with prospective clients, service providers, and counterparties. Additionally, the Advisor may receive proprietary research from broker-dealers that execute fund portfolio transactions, which the Board concluded is likely to benefit other clients of the Advisor, as well as Fund shareholders. The Board also determined that the Advisor is able to provide investment management services to certain clients other than the Fund, at least in part, due to its existing infrastructure built to serve the fund complex. The Board concluded that appropriate allocation methodologies had been employed to assign resources and the cost of those resources to these other clients.
Existing Relationship. The Board also considered whether there was any reason for not continuing the existing arrangement with the Advisor. In this regard, the Board was mindful of the potential disruptions of the Fund’s operations and various risks, uncertainties, and other effects that could occur as a result of a decision not to continue such relationship. In particular, the Board recognized that most shareholders have invested in the Fund on the strength of the Advisor’s industry standing and reputation and in the expectation that the Advisor will have a continuing role in providing advisory services to the Fund.
Conclusion of the Directors. As a result of this process, the Board, including all of the independent Directors, taking into account all of the factors discussed above and the information provided by the Advisor and others in connection with its review and received over time, determined that the terms of the management agreement are fair and reasonable and that the management fee charged to the Fund is reasonable in light of the services provided and that the management agreement between the Fund and the Advisor should be renewed for an additional one-year period.
Other Tax Information
The following information is provided pursuant to provisions of the Internal Revenue Code.
The fund hereby designates up to the maximum amount allowable as qualified dividend income for the fiscal year ended November 30, 2024.
The fund hereby designates $25,504,206 as qualified short-term capital gain distributions for purposes of Internal Revenue Code Section 871 for the fiscal year ended November 30, 2024.
The fund hereby designates $26,821,702, or up to the maximum amount allowable, as long-term capital gain distributions (20% rate gain distributions) for the fiscal year ended November 30, 2024.
For the fiscal year ended November 30, 2024, the fund intends to pass through to shareholders foreign source income of $26,464,231 and foreign taxes paid of $2,048,910, or up to the maximum amount allowable, as a foreign tax credit. Foreign source income and foreign tax expense per outstanding share on November 30, 2024 are $0.4351 and $0.0337, respectively.
The fund utilized earnings and profits of $4,626,880 distributed to shareholders on redemption of shares as part of the dividends paid deduction (tax equalization).
| | | | | | | | |
| Contact Us | americancentury.com | |
| Automated Information Line | 1-800-345-8765 | |
| Investor Services Representative | 1-800-345-2021
or 816-531-5575 | |
| Banks and Trust Companies, Broker-Dealers, Financial Professionals, Insurance Companies | 1-800-345-6488 | |
| | |
| This report and the statements it contains are submitted for the general information of our shareholders. The report is not authorized for distribution to prospective investors unless preceded or accompanied by an effective prospectus. | |
| | |
©2025 American Century Proprietary Holdings, Inc. All rights reserved.
CL-ANN-95207 2501 | |
(b) The information required by Item 13 of Form N-1A is included as part of the financial statements filed under Item 7(a) of this Form.
ITEM 8. CHANGES IN AND DISAGREEMENTS WITH ACCOUNTANTS FOR OPEN-END MANAGEMENT INVESTMENT COMPANIES.
None.
ITEM 9. PROXY DISCLOSURES FOR OPEN-END MANAGEMENT INVESTMENT COMPANIES.
None.
ITEM 10. REMUNERATION PAID TO DIRECTORS, OFFICERS, AND OTHERS OF OPEN-END MANAGEMENT INVESTMENT COMPANIES.
The remuneration paid to directors, officers and others is included as part of the report to stockholders filed under Item 7 of this Form.
ITEM 11. STATEMENT REGARDING BASIS FOR APPROVAL OF INVESTMENT ADVISORY CONTRACT.
| | |
|
| A statement regarding the basis for the board of directors’ approval of the investment advisory contract is included as part of the reports to stockholders filed under Item 7 of this Form. |
|
ITEM 12. DISCLOSURE OF PROXY VOTING POLICIES AND PROCEDURES FOR CLOSED-END MANAGEMENT INVESTMENT COMPANIES.
Not applicable.
ITEM 13. PORTFOLIO MANAGERS OF CLOSED-END MANAGEMENT INVESTMENT COMPANIES.
Not applicable.
ITEM 14. PURCHASES OF EQUITY SECURITIES BY CLOSED-END MANAGEMENT INVESTMENT COMPANY AND AFFILIATED PURCHASERS.
Not applicable.
ITEM 15. SUBMISSION OF MATTERS TO A VOTE OF SECURITY HOLDERS.
During the reporting period, there were no material changes to the procedures by which shareholders may recommend nominees to the registrant’s board.
ITEM 16. CONTROLS AND PROCEDURES.
(a) The registrant's principal executive officer and principal financial officer have concluded that the registrant's disclosure controls and procedures (as defined in Rule 30a-3(c) under the Investment Company Act of 1940) are effective based on their evaluation of these controls and procedures as of a date within 90 days of the filing date of this report.
(b) There were no changes in the registrant's internal control over financial reporting (as defined in Rule 30a-3(d) under the Investment Company Act of 1940) that occurred during the period covered by this report that have materially affected, or are reasonably likely to materially affect, the registrant's internal control over financial reporting.
ITEM 17. DISCLOSURE OF SECURITIES LENDING ACTIVITIES FOR CLOSED-END MANAGEMENT INVESTMENT COMPANIES.
Not applicable.
ITEM 18. RECOVERY OF ERRONEOUSLY AWARDED COMPENSATION.
(a) Not applicable.
(b) Not applicable.
ITEM 19. EXHIBITS.
(a)(1) Registrant’s Code of Ethics for Senior Financial Officers, which is the subject of the disclosure required by Item 2 of Form N-CSR, was filed as Exhibit 12(a)(1) to American Century Asset Allocation Portfolios, Inc.’s Certified Shareholder Report on Form N-CSR, File No. 811-21591, on September 29, 2005.
(a)(2) Not applicable.
(a)(4) Not applicable.
(a)(5) Not applicable.
SIGNATURES
Pursuant to the requirements of the Securities Exchange Act of 1934 and the Investment Company Act of 1940, the registrant has duly caused this report to be signed on its behalf by the undersigned, thereunto duly authorized.
| | | | | | | | | | | |
| Registrant: | American Century World Mutual Funds, Inc. |
| | | |
| By: | /s/ Patrick Bannigan |
| Name: | Patrick Bannigan |
| Title: | President |
| | |
| Date: | January 24, 2025 |
Pursuant to the requirements of the Securities Exchange Act of 1934 and the Investment Company Act of 1940, this report has been signed below by the following persons on behalf of the registrant and in the capacities and on the dates indicated.
| | | | | | | | | | | |
| By: | /s/ Patrick Bannigan |
| Name: | Patrick Bannigan | |
| Title: | President | |
| | (principal executive officer) | |
| | |
| Date: | January 24, 2025 | |
| | | | | | | | | | | |
| By: | /s/ R. Wes Campbell |
| Name: | R. Wes Campbell | |
| Title: | Treasurer and | |
| | Chief Financial Officer | |
| | (principal financial officer) |
| | |
| Date: | January 24, 2025 | |