Table of Contents
| | |
Consolidated Financial Highlights | | 1 |
Letter to Shareholders | | 3 |
Selected Consolidated Financial Data | | 5 |
Management’s Discussion and Analysis of Financial Condition and Results of Operations | | 6 |
Consolidated Financial Statements | | 28 |
Notes to Consolidated Financial Statements | | 33 |
Report of Independent Registered Public Accounting Firm | | 66 |
Management’s Reports to ESB Financial Corporation Shareholders | | 67 |
Stock and Dividend Information | | 68 |
Corporate Information | | 71 |
Board of Directors | | 72 |
Corporate Officers, Advisory Board and Bank Officers | | 73 |
Office Locations and Financial Services Managers | | inside back cover |
Company Profile
| | |
| |

| | ESB Financial Corporation (NASDAQ: ESBF), a publicly traded financial services company, provides a wide range of retail and commercial financial products and services to customers in Western Pennsylvania through its wholly owned subsidiary, ESB Bank. ESB Bank is a Pennsylvania chartered, FDIC insured stock savings bank which, as of December 31, 2007, conducted business through 23 offices in Allegheny, Beaver, Butler and Lawrence counties, Pennsylvania. To compliment retail and commercial operations conducted through its bank offices, the Company invests in U.S. Government, municipal and mortgage-backed securities through its subsidiary savings bank and through its investment subsidiary, PennFirst Financial Services, Inc., a Delaware corporation. |
Mission Statement
The mission of ESB Financial Corporation and its subsidiaries is to effectively provide for the financial service needs of our customers and community while creating value for our shareholders. Our mission will be accomplished by growing in a profitable and controlled manner; by identifying and meeting the financial needs of our customers; by offering quality products and services that are competitively priced and serviced by a knowledgeable, attentive and friendly staff; and by creating a positive work environment that maximizes the alignment of customer and employee objectives.
Consolidated Financial Highlights
(Dollar amounts in thousands, except share data)
| | | | | | | | | | | |
| | | As of or for the
year ended December 31, | |
| | | 2007 | | | 2006 | | | Change | |
Total assets | | $ | 1,880,235 | | | $ | 1,922,722 | | | (2 | %) |
Securities available for sale | | | 1,059,972 | | | | 1,143,924 | | | (7 | %) |
Loans receivable, net | | | 624,251 | | | | 589,642 | | | 6 | % |
Total deposits | | | 842,854 | | | | 823,644 | | | 2 | % |
Borrowed funds, including junior subordinated notes | | | 876,727 | | | | 951,153 | | | (8 | %) |
Stockholders’ equity | | | 132,845 | | | | 128,535 | | | 3 | % |
Net interest income | | | 24,983 | | | | 28,667 | | | (13 | %) |
Net income | | | 7,661 | | | | 10,616 | | | (28 | %) |
Net income per share (diluted) | | $ | 0.61 | | | $ | 0.83 | | | (27 | %) |
Cash dividends declared per share | | $ | 0.40 | | | $ | 0.40 | | | — | |
Return on average assets | | | 0.40 | % | | | 0.56 | % | | (29 | %) |
Return on average stockholders’ equity | | | 5.98 | % | | | 8.55 | % | | (30 | %) |
| | | | |
| ESB Financial Corporation | | 1 | | 2007 Annual Report |
Consolidated Financial Highlights (continued)
| | |
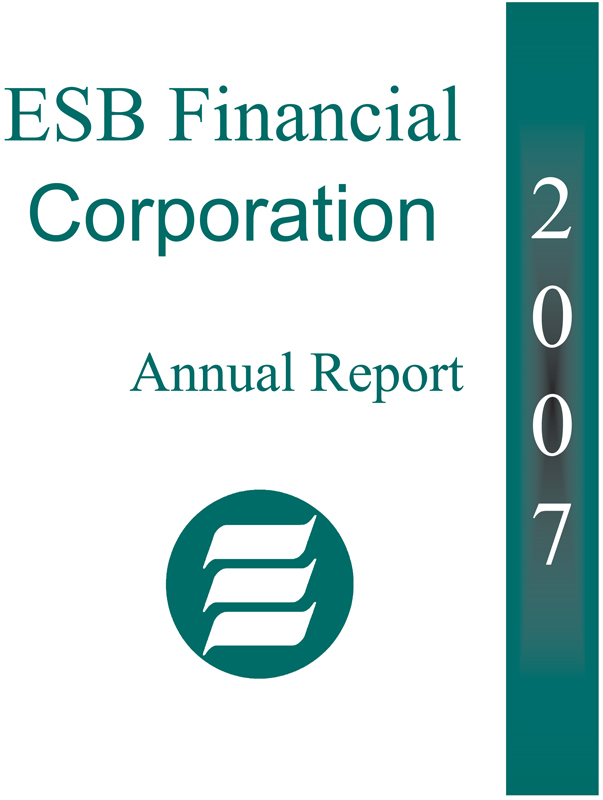
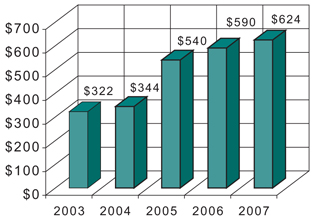
Net Loans Receivable (in millions) | | Noninterest Expense to Average Assets |
| |
 | |  |
| |
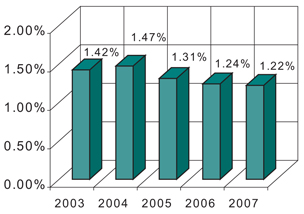
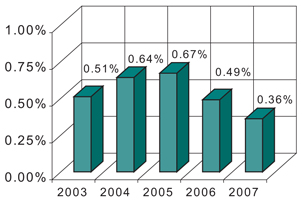
| Non-performing loans to total loans | | Total Deposits (in millions) |
| |
 | | 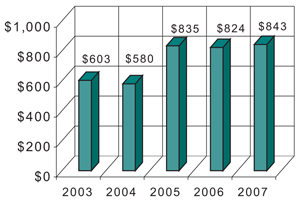 |
| | | | |
| ESB Financial Corporation | | 2 | | 2007 Annual Report |
Letter to Shareholders
Dear Fellow Shareholders:
The year 2007 reflected a continuation of events that challenged financial institutions and provided a very difficult banking climate. The inverted yield curve and intense competition on deposit pricing pressured net interest margins. Additionally, the sub-prime mortgage financial crisis of 2007 has resulted in a significant slowdown in the housing market, growth in mortgage foreclosures, and financial losses for several of our competitors. Despite these challenges, I believe ESB will emerge from this hostile environment as a stronger more productive Company, well positioned for continued success.
As with most financial institutions, our interest rate margins continued to decrease based on the pressures of the current economic environment resulting in a decline in income from the previous year. During 2007, the Company posted earnings per diluted share of $0.61 on net income of $7.7 million compared to net income of $10.6 million or $0.83 per diluted share for 2006. While disappointed in the year end results, I am encouraged by the actions taken by Management and the Board in 2007 to continue to work towards higher net interest margins and better operating performance in future periods.
As appropriate responses to these external circumstances, we have initiated or reinforced actions in accordance with our fundamental business strategies that have provided sustained results to our shareholders since 1990. These strategies include prudent asset and liability risk management, operational productivity and efficiency, strong credit quality, a managed risk profile, application of enhanced technology, and meeting the needs of our customers and communities.
The actions we have taken to navigate in this environment include:
| | • | | Maintaining and reinforcing our high credit standards as evidenced by our favorable asset quality ratios detailed in this report. Despite the turmoil in the residential real estate market in 2007 and in the face of extraordinary market conditions, I am pleased to report that we have been successful in maintaining asset quality and have been minimally impacted by the sub-prime mortgage and credit issues that are currently impacting other financial institutions; |
| | • | | Constantly monitoring all aspects of the Company’s operations for cost management and reductions including the review of all vendor relationships, employee benefits, and personnel staffing requirements. These efforts have maintained our low level of non-interest expenses over the last three years; |
| | • | | We continually seek sound revenue enhancing opportunities through the further development of our affiliation with Raymond James Financial Services and Nationwide Insurance, selective expansion of our real estate joint venture activities and the development and introduction of new deposit and loan related products and services; |
| | • | | Continuing to make investments and enhancements in technology that allow us to offer many new and competitive products and services, to function more efficiently, and to enhance the customer service experience. I encourage you to visit us atwww.esbbank.com to be aware of the current and proposed enhanced customer products and services available to meet your financial services needs;and |
| | • | | Defining success more broadly than just the financial results. We also define it by our community involvement, both financially and through volunteerism. Through our “Casual for Charity Day” program, nearly $25,000 was donated in 2007 to organizations including Project Bundle-Up, Habitat for Humanity, Girls Hope and The American Heart Association. We also support and encourage our employees to actively participate in community programs. During 2007, 126 employees donated a total of approximately 4,600 community service hours to organizations ranging from schools, churches and volunteer fire departments to youth organizations and participation in charitable fundraisers. |
| | | | |
| ESB Financial Corporation | | 3 | | 2007 Annual Report |
Letter to Shareholders (continued)
Dividends
I am pleased to report that during 2007, the Company maintained the current $0.10 per share quarterly cash dividend, which extends our record of paying cash dividends to 70 consecutive quarters. As in previous years, the Board of Directors approved a common stock repurchase program and, for the year, the Company repurchased approximately 509,000 shares at a cost of $5.4 million.
Branch Office
In May, the Bank relocated its branch office in Shenango Township, New Castle, Pennsylvania to an expanded free standing facility located directly across from the Bank’s previous location in Lawrence Village Plaza. This full service facility will afford our customers a large lobby, safe deposit boxes, six teller windows, three drive thru lanes, a full service 24-hour ATM machine and night drop box.
In Appreciation
We offer special thanks to Thomas F. Angotti, Group Senior Vice President of Administration, on his retirement from the Company in December 2007. We thank Tom for over 20 years of service, contributions, guidance and accomplishments to the Company and its predecessors. His leadership, keen insights, and his interpersonal skills will be missed, as will be his good humor. He has provided exemplary service to our Bank, our community, and our shareholders and we extend our cordial best wishes for the future.
The Year Ahead
With the current difficulties facing the financial industry expected to continue into 2008, we believe net income may remain under pressure for the immediate future. However, given the Bank’s capital position and strong asset quality, we believe we are well positioned to successfully endure the current interest rate environment.
We sincerely thank our shareholders for their confidence, our customers for their loyalty and patronage, our employees for their dedication and efforts, our Officers for their leadership, and the Board of Directors for serving our shareholders well in this challenging business environment.
|
| Sincerely, |
|
| /s/ Charlotte A. Zuschlag |
| Charlotte A. Zuschlag |
| President and Chief Executive Officer |
| | | | |
| ESB Financial Corporation | | 4 | | 2007 Annual Report |
Selected Consolidated Financial Data
(Dollar amounts in thousands, except share data)
| | | | | | | | | | | | | | | | | | | | |
| | | As of December 31, | |
| | | 2007 | | | 2006 | | | 2005 (1) | | | 2004 | | | 2003 | |
Financial Condition Data | | | | | | | | | | | | | | | | | | | | |
Total assets | | $ | 1,880,235 | | | $ | 1,922,722 | | | $ | 1,852,779 | | | $ | 1,394,515 | | | $ | 1,365,780 | |
Securities | | | 1,059,972 | | | | 1,143,924 | | | | 1,117,063 | | | | 929,794 | | | | 928,936 | |
Loans receivable, net | | | 624,251 | | | | 589,642 | | | | 540,277 | | | | 343,524 | | | | 322,454 | |
Deposits | | | 842,854 | | | | 823,644 | | | | 834,530 | | | | 580,346 | | | | 603,046 | |
Borrowed funds, including subordinated debt | | | 876,727 | | | | 951,153 | | | | 869,242 | | | | 702,773 | | | | 652,489 | |
Stockholders’ equity | | | 132,845 | | | | 128,535 | | | | 126,877 | | | | 97,801 | | | | 96,871 | |
Stockholders’ equity per common share | | $ | 10.71 | | | $ | 10.00 | | | $ | 9.58 | | | $ | 9.16 | | | $ | 8.98 | |
| |
| | | For the year ended December 31, | |
| | | 2007 | | | 2006 | | | 2005(1) | | | 2004 | | | 2003 | |
Operations Data | | | | | | | | | | | | | | | | | | | | |
Net interest income | | $ | 24,983 | | | $ | 28,667 | | | $ | 30,530 | | | $ | 25,229 | | | $ | 21,615 | |
Provision for (recovery of) loan losses | | | 865 | | | | 1,113 | | | | 568 | | | | 206 | | | | (106 | ) |
| | | | | | | | | | | | | | | | | | | | |
Net interest income after provision for (recovery of) loan losses | | | 24,118 | | | | 27,554 | | | | 29,962 | | | | 25,023 | | | | 21,721 | |
Noninterest income | | | 7,216 | | | | 7,786 | | | | 3,142 | | | | 6,960 | | | | 7,791 | |
Noninterest expense | | | 23,273 | | | | 23,407 | | | | 23,115 | | | | 20,157 | | | | 19,177 | |
| | | | | | | | | | | | | | | | | | | | |
Income before income taxes | | | 8,061 | | | | 11,933 | | | | 9,989 | | | | 11,826 | | | | 10,335 | |
Provision for income taxes | | | 400 | | | | 1,317 | | | | 810 | | | | 1,836 | | | | 1,811 | |
| | | | | | | | | | | | | | | | | | | | |
Net income | | $ | 7,661 | | | $ | 10,616 | | | $ | 9,179 | | | $ | 9,990 | | | $ | 8,524 | |
| | | | | | | | | | | | | | | | | | | | |
Net income per common share: | | | | | | | | | | | | | | | | | | | | |
Basic | | $ | 0.62 | | | $ | 0.84 | | | $ | 0.73 | | | $ | 0.98 | | | $ | 0.84 | |
Diluted | | $ | 0.61 | | | $ | 0.83 | | | $ | 0.71 | | | $ | 0.94 | | | $ | 0.80 | |
| |
| | | As of or for the year ended December 31, | |
| | | 2007 | | | 2006 | | | 2005 (1) | | | 2004 | | | 2003 | |
Other Data | | | | | | | | | | | | | | | | | | | | |
Performance Ratios (for the year ended) | | | | | | | | | | | | | | | | | | | | |
Return on average assets | | | 0.40 | % | | | 0.56 | % | | | 0.52 | % | | | 0.73 | % | | | 0.63 | % |
Return on average equity | | | 5.98 | % | | | 8.55 | % | | | 7.16 | % | | | 10.38 | % | | | 8.75 | % |
Average equity to average assets | | | 6.74 | % | | | 6.57 | % | | | 7.28 | % | | | 6.99 | % | | | 7.22 | % |
Interest rate spread (2) | | | 1.38 | % | | | 1.63 | % | | | 1.93 | % | | | 2.04 | % | | | 1.77 | % |
Net interest margin (2) | | | 1.57 | % | | | 1.79 | % | | | 2.06 | % | | | 2.15 | % | | | 1.89 | % |
Efficiency ratio | | | 63.88 | % | | | 57.27 | % | | | 55.84 | % | | | 56.71 | % | | | 59.94 | % |
Noninterest expense to average assets | | | 1.22 | % | | | 1.24 | % | | | 1.31 | % | | | 1.47 | % | | | 1.42 | % |
Dividend payout ratio (3) | | | 65.57 | % | | | 48.19 | % | | | 56.34 | % | | | 42.55 | % | | | 45.83 | % |
Asset Quality Ratios (as of year end) | | | | | | | | | | | | | | | | | | | | |
Non-performing loans to total loans | | | 0.36 | % | | | 0.49 | % | | | 0.67 | % | | | 0.64 | % | | | 0.51 | % |
Non-performing assets to total assets | | | 0.23 | % | | | 0.22 | % | | | 0.27 | % | | | 0.26 | % | | | 0.22 | % |
Allowance for loan losses to total loans | | | 0.85 | % | | | 0.84 | % | | | 0.86 | % | | | 1.06 | % | | | 1.17 | % |
Allowance for loan losses to non-performing loans | | | 236.21 | % | | | 171.75 | % | | | 127.26 | % | | | 165.20 | % | | | 228.20 | % |
Capital Ratios (as of year end) | | | | | | | | | | | | | | | | | | | | |
Stockholders’ equity to assets | | | 7.07 | % | | | 6.69 | % | | | 6.85 | % | | | 7.01 | % | | | 7.09 | % |
Tangible stockholders’ equity to tangible assets | | | 4.78 | % | | | 4.71 | % | | | 4.72 | % | | | 6.13 | % | | | 5.96 | % |
| (1) | Selected consolidated financial data for 2005 reflects increases due to the acquisition of PHSB Financial Corporation. |
| (2) | Interest income utilized in calculation is on a fully tax equivalent basis, which is deemed to be the most prevalent industry standard for measuring interest rate spread and net interest margin. |
| (3) | Dividend payout ratio calculation utilizes diluted net income per share for all periods. |
| | | | |
| ESB Financial Corporation | | 5 | | 2007 Annual Report |
Management’s Discussion and Analysis of
Financial Condition and Results of Operations
Overview
ESB Financial Corporation (the Company) is a Pennsylvania corporation and thrift holding company that provides a wide range of retail and commercial financial products and services to customers in Western Pennsylvania through its wholly-owned subsidiary, ESB Bank (ESB or the Bank). The Company is also the parent company of PennFirst Financial Services, Inc., a Delaware corporation engaged in the management of certain investment activities on behalf of the Company, ESB Capital Trust II (Trust II), ESB Statutory Trust III (Trust III) and ESB Capital Trust IV (Trust IV), Delaware statutory business trusts established to facilitate the issuance of trust preferred securities to the public by the Company, and THF, Inc., a Pennsylvania corporation established as a title agency to provide residential and commercial loan closing services and title closing services.
ESB is a Pennsylvania chartered, Federal Deposit Insurance Corporation (FDIC) insured stock savings bank, which, at December 31, 2007, conducted business through 23 offices in Allegheny, Beaver, Butler and Lawrence counties, Pennsylvania. ESB operates two wholly-owned subsidiaries: (i) AMSCO, Inc., which engages in the management of certain real estate development partnerships on behalf of the Company, and (ii) ESB Financial Services, Inc., a Delaware corporation which holds loans and other investments.
ESB is a financial intermediary whose principal business consists of attracting deposits from the general public and investing such deposits in real estate loans secured by liens on residential and commercial properties, consumer loans, commercial business loans, securities and interest-earning deposits.
The Company is subject to examination and regulation by the Office of Thrift Supervision as a savings and loan holding company. The Bank is subject to examination and comprehensive regulation by the FDIC and the Pennsylvania Department of Banking. ESB is a member of the Federal Home Loan Bank (FHLB) of Pittsburgh, which is one of the twelve regional banks comprising the FHLB System. ESB is further subject to regulations of the Board of Governors of the Federal Reserve System, which governs the reserves required to be maintained against deposits and certain other matters.
During the year ended December 31, 2007, the Company reported a decrease to overall earnings of $2.9 million, or 27.8%, compared to the year ended December 31, 2006. The income for the year reflects compression to the net interest margin which is the effect of a sustained inverted yield curve which existed for the greater portion of 2007. Although the Company realized an increase to interest income of approximately $3.1 million, or 3.3%, over last year, interest expense increased by approximately $6.8 million, or 10.3% during the same period. The result was a decrease of 22 basis points to the Company’s net interest margin. The Federal Reserve reduced its federal funds target rate 100 basis points in 2007 to 4.25%. However, this reduction did not occur until September 2007 and followed an extended period, since June 2004, of increases to short term rates resulting in a net increase of 300 basis points to the federal funds target rate. Traditionally as short term interest rates rise, the Company’s cost of funds rises accordingly and subsequently causes compression to the Company’s net interest margin. The Company’s cost of funds primarily consists of the interest bearing demand and time deposits which incurred an increase of 48 basis points to a cost of 3.54% for 2007 as compared to 3.06% for 2006. During 2006, that same cost increased 75 basis points as compared to 2.31% for 2005. The cost of funds also consists of wholesale borrowings which increased 37 basis points to 4.82% for 2007, as compared to 4.45% for 2006. During 2006 the cost of wholesale borrowings had increased 62 basis points as compared to 3.83% for 2005.
The Company is continuing efforts to stabilize the net interest margin by employing strategies to minimize the impact on the cost of funds, while attempting to increase the yield from the investment portfolio. The Company employs a strategy of purchasing cash-flowing fixed and variable rate mortgage-backed securities funded by wholesale borrowings, which are comprised of FHLB advances and repurchase agreements.
| | | | |
| ESB Financial Corporation | | 6 | | 2007 Annual Report |
Management’s Discussion and Analysis of
Financial Condition and Results of Operations (continued)
The Company has utilized a wholesale strategy since its initial public offering in 1990. The Company manages this strategy through its interest rate risk management on a macro level. The wholesale strategy operates with a lower cost of operations, although with lower interest rate spreads and, therefore, at a lower margin than the retail operations of the Company. This strategy historically produces wider margins during periods of lower short-term interest rates, reflected in a steep yield curve and can be susceptible to net interest margin strain in rapidly rising rates and rapidly declining rates as well as a sustained inverted yield curve. During 2007, this wholesale leverage strategy accounted for $4.6 million, on a tax equivalent basis, of the Company’s tax equivalent net interest income of $27.8 million.
Management continues to pursue methods of insulating this wholesale strategy from significant fluctuations in interest rates by: (1) incorporating a laddered maturity schedule of up to three years on the wholesale borrowings; (2) purchasing interest rate caps; (3) providing structure in the investment portfolio in the form of corporate bonds and municipals securities; (4) utilizing cash flows from fixed and adjustable rate mortgage-backed securities; and (5) including the Company’s securities in the available for sale portfolio thereby creating the flexibility to change the composition of the portfolio through restructuring as management deems it necessary due to interest rate fluctuations. Management believes that this insulation affords them the ability to react to measured changes in interest rates and restructure the Company’s balance sheet accordingly. This strategy is continually evaluated by management on an ongoing basis.
In addition to managing the net interest margin in the current rate environment, management was diligent in controlling operating expenses in 2007. Operating expenses, without the effect of the minority interest from joint ventures, were held below the 2006 and 2005 levels. Finally, management was successful in maintaining asset quality as the Company has only been minimally impacted by the sub prime mortgage and credit issues that are currently affecting the financial industry. Our percentage of non performing loans to total loans was 0.36% for 2007 compared to 0.49% for 2006 and our non performing assets to total assets was 0.23% in 2007 compared to 0.22% in 2006.
This Management Discussion and Analysis section of the Annual Report contains certain forward-looking statements (as defined in the Private Securities Litigation Reform Act of 1995). In the normal course of business, we, in an effort to help keep our shareholders and the public informed about our operations, may from time to time issue or make certain statements, either in writing or orally, that are or contain forward-looking statements, as that term is defined in the U.S. federal securities laws. Generally, these statements relate to business plans or strategies, projected or anticipated benefits from acquisitions made by or to be made by us, projections involving anticipated revenues, earnings, profitability or other aspects of operating results or other future developments in our affairs or the industry in which we conduct business. Forward-looking statements may be identified by reference to a future period or periods or by the use of forward-looking terminology such as “anticipate,” “believe,” “expect,” “intend,” “plan,” “estimate” or similar expressions.
Although we believe that the anticipated results or other expectations reflected in our forward-looking statements are based on reasonable assumptions, we can give no assurance that those results or expectations will be attained. Forward-looking statements involve risks, uncertainties and assumptions (some of which are beyond our control), and as a result actual results may differ materially from those expressed in forward-looking statements. Factors that could cause actual results to differ from forward-looking statements include, but are not limited to, the following, as well as those discussed elsewhere herein:
| | • | | our investments in our businesses and in related technology could require additional incremental spending, and might not produce expected deposit and loan growth and anticipated contributions to our earnings; |
| | | | |
| ESB Financial Corporation | | 7 | | 2007 Annual Report |
Management’s Discussion and Analysis of
Financial Condition and Results of Operations (continued)
| | • | | general economic or industry conditions could be less favorable than expected, resulting in a deterioration in credit quality, a change in the allowance for loan and lease losses or a reduced demand for credit or fee-based products and services; |
| | • | | changes in the interest rate environment could reduce net interest income and could increase credit losses; |
| | • | | the conditions of the securities markets could change, which could adversely affect, among other things, the value or credit quality of our assets, the availability and terms of funding necessary to meet our liquidity needs and our ability to originate loans and leases; |
| | • | | changes in the extensive laws, regulations and policies governing financial holding companies and their subsidiaries could alter our business environment or affect our operations; |
| | • | | the potential need to adapt to industry changes in information technology systems, on which we are highly dependent, could present operational issues or require significant capital spending; |
| | • | | competitive pressures could intensify and affect our profitability, including as a result of continued industry consolidation, the increased availability of financial services from non-banks, technological developments such as the internet or bank regulatory reform; |
| | • | | acquisitions may result in one-time charges to income, may not produce revenue enhancements or cost savings at levels or within time frames originally anticipated and may result in unforeseen integration difficulties; and |
| | • | | acts or threats of terrorism and actions taken by the United States or other governments as a result of such acts or threats, including possible military action, could further adversely affect business and economic conditions in the United States generally and in our principal markets, which could have an adverse effect on our financial performance and that of our borrowers and on the financial markets and the price of our common stock. |
You should not put undue reliance on any forward-looking statements. Forward-looking statements speak only as of the date they are made, and we undertake no obligation to update them in light of new information or future events except to the extent required by federal securities laws.
Significant Financial Events in 2007
In April 2007, the Company terminated its cash flow hedge by selling the interest rate caps and repaying the associated borrowings. The loss on the sale of the interest rate caps of approximately $690,000 was offset by gains of approximately $706,000 recognized on the sale of securities. The Company expects this transaction to positively impact the net interest margin over the next two to three years.
Significant Financial Events in 2006
Sale of VISA Credit Card Portfolio
During 2006, the Company sold its credit card portfolio. The portfolio had a balance of approximately $2.0 million and was sold at a 10% premium, with the exception of the Company’s business accounts, delinquent accounts and a recourse reserve. In connection with the sale, the Company reported a gain of approximately $177,000.
| | | | |
| ESB Financial Corporation | | 8 | | 2007 Annual Report |
Management’s Discussion and Analysis of
Financial Condition and Results of Operations (continued)
Restructuring of Investment Portfolio
During 2006, the Company restructured approximately $73.8 million of fixed and adjustable rate mortgage-backed securities as well as municipal bonds in an attempt to improve the net interest margin and reduce interest rate sensitivity. The proceeds were reinvested primarily into twenty and thirty year fixed rate mortgage-backed securities. The Company continued to purchase a limited amount of municipal bonds which add structure to the portfolio in the event that rates decline. In connection with the restructuring, the Company incurred a net pre-tax gain of approximately $480,000.
Critical Accounting Policies and Estimates
The Company’s consolidated financial statements are prepared in accordance with U.S. generally accepted accounting principles and follow general practices within the industry in which it operates. Application of these principles requires management to make estimates, assumptions and judgments that affect the amounts reported in the financial statements and accompanying notes. These estimates, assumptions and judgments are based on information available as of the date of the financial statements; accordingly, as this information changes, the financial statements could reflect different estimates, assumptions and judgments. Certain policies inherently have a greater reliance on the use of estimates, assumptions and judgments and as such have a greater possibility of producing results that could be materially different than originally reported. Estimates, assumptions and judgments are necessary when assets and liabilities are required to be recorded at fair value, when a decline in the value of an asset not carried on the financial statements at fair value warrants an impairment write-down or valuation reserve to be established, or when an asset or liability needs to be recorded contingent upon a future event. Carrying assets and liabilities at fair value inherently results in more financial statement volatility. The fair values and the information used to record valuation adjustments for certain assets and liabilities are based either on quoted market prices or are provided by other third-party sources, when available. When third-party information is not available, valuation adjustments are estimated in good faith by management primarily through the use of internal cash flow modeling techniques.
The Company’s most significant accounting policies are presented in Note 1 to the consolidated financial statements. These policies along with the disclosures presented in the other financial statement notes and in this financial review, provide information on how significant assets and liabilities are valued in the financial statements and how those values are determined. Based on the valuation techniques used and the sensitivity of financial statement amounts to the methods, assumptions and estimates underlying those amounts, management has identified the determination of the fair value of securities, the allowance for loan losses and the valuation of goodwill and intangible assets to be the accounting areas that require the most subjective or complex judgments.
Securities
Securities are reported at fair value adjusted for premiums and discounts which are recognized in interest income using the interest method over the period to maturity. Declines in the fair value of individual securities below their amortized cost, and that are deemed to be other than temporary, will be written down to current market value and included in earnings as realized losses. For a discussion on the determination of an other than temporary decline, please refer to Note 1 of the consolidated financial statements. Management systematically evaluates securities for other than temporary declines in fair value on a quarterly basis. The Company recognized other than temporary impairment losses on securities available for sale of $141,000 in 2007. The Company did not recognize any other than temporary impairment losses on securities in 2006.
| | | | |
| ESB Financial Corporation | | 9 | | 2007 Annual Report |
Management’s Discussion and Analysis of
Financial Condition and Results of Operations (continued)
Allowance for loan losses
The allowance for loan losses is increased by charges to income and decreased by charge-offs (net of recoveries). The Company’s periodic evaluation of the adequacy of the allowance for loan losses is determined by management through evaluation of the loss exposure on individual non-performing, delinquent and high-dollar loans; review of economic conditions and business trends; historical loss experience and growth and composition of the loan portfolio, as well as other relevant factors.
A quantitative analysis is utilized to support the adequacy of the allowance for loan losses. This analysis includes review of historical charge-off rates for loan categories, fluctuations and trends in the amount of classified loans and economic factors. Significant to this analysis are any changes in observable trends that may be occurring relative to loans to assess potential weaknesses within the credit. Current economic factors and trends in risk ratings are considered in the determination and allocation of the allowance for loan losses.
The allowance for loan losses at December 31, 2007 was $5.4 million, compared to $5.1 million at December 31, 2006, allocated as follows: $1.8 million, or 33.0%, for residential loans, $1.7 million, or 31.1%, for commercial real estate, $349,000, or 6.5%, for commercial business loans, and $1.6 million, or 29.4%, for consumer loans. The variance in the allowance from 2007 to 2006 is primarily the result of an increase in the allowance related to real estate loans and commercial loans. The primary reason for this increase was growth in the residential and commercial loan portfolios.
Goodwill and other intangible assets
Statement of Financial Accounting Standards No. 142 (FAS No. 142) “Goodwill and Other Intangible Assets”, establishes standards for the amortization of acquired intangible assets and the non-amortization and impairment assessment of goodwill. At December 31, 2007, the Company had $2.4 million of core deposit intangible assets subject to amortization and $41.6 million in goodwill, which was not subject to periodic amortization.
Goodwill arising from business combinations represents the value attributable to unidentifiable intangible elements in the business acquired. The Company’s goodwill relates to value inherent in the banking business and the value is dependent upon the Company’s ability to provide quality, cost effective services in a competitive market place. As such, goodwill value is supported ultimately by revenue that is driven by the volume of business transacted. A decline in earnings as a result of a lack of growth or the inability to deliver cost effective services over sustained periods can lead to impairment of goodwill that could adversely impact earnings in future periods.
FAS No. 142 requires an annual evaluation of goodwill for impairment. The fair value of the Company and the implied fair value of goodwill at the respective reporting unit level are estimated using the market value approach utilizing industry comparable information. At December 31, 2007, the Company concluded that the recorded value of goodwill was not impaired as a result of the evaluation.
Income taxes
The Company files a consolidated federal income tax return. Deferred tax assets and liabilities are computed based on the difference between the financial statement and the income tax basis of assets and liabilities using the enacted marginal tax rates. Deferred income taxes or benefits are based on changes in the deferred tax asset or liability from period to period. Deferred tax assets and liabilities are reflected at currently enacted income tax rates applicable to the period in which such items are expected to be realized or settled. As changes in tax rates are enacted, deferred tax assets and liabilities are adjusted through the provision for income taxes.
| | | | |
| ESB Financial Corporation | | 10 | | 2007 Annual Report |
Management’s Discussion and Analysis of
Financial Condition and Results of Operations (continued)
Changes in Financial Condition
General.The Company’s total assets decreased $42.5 million, or 2.2%, to $1.88 billion at December 31, 2007 from $1.92 billion at December 31, 2006. This decrease was primarily composed of net decreases in cash and cash equivalents, securities available for sale, loans held for sale, accrued interest receivable, Federal Home Loan Bank (FHLB) stock, intangible assets and prepaid expenses and other assets of $3.4 million, $84.0 million, $190,000, $232,000, $2.9 million, $746,000 and $3.9 million, respectively. Partially offset by increases in loans receivable, premises and equipment, real estate acquired through foreclosure, real estate held for investment and bank owned life insurance (BOLI) of $34.6 million, $716,000, $609,000, $16.4 million and $473,000, respectively.
The decrease in the Company’s total assets reflects a corresponding decrease in total liabilities of $46.8 million, or 2.6%, to $1.75 billion at December 31, 2007 compared to $1.79 billion at December 31, 2006 and an increase in total stockholders’ equity of $4.3 million, or 3.4%, to $132.8 million at December 31, 2007 from $128.5 million at December 31, 2006. The decrease in total liabilities was primarily due to decreases in FHLB advances, repurchase agreements and accrued expenses and other liabilities of $69.6 million, $5.0 million and $956,000, respectively. These decreases were partially offset by increases to deposits, other borrowings, junior subordinated notes, advance payments by borrowers for taxes and insurance and accounts payable for land development of $19.2 million, $65,000, $75,000, $152,000 and $9.2 million, respectively. The net increase in total stockholders’ equity can be attributed primarily to increases in additional paid in capital, retained earnings and accumulated other comprehensive income of $173,000, $2.2 million and $5.5 million, respectively as well as decreases in unearned employee stock ownership plan (ESOP) and unvested shares held by the management recognition plan (MRP) of $941,000 and $50,000, respectively. These items were partially offset by an increase in treasury stock of $4.6 million.
Cash on hand, Interest-earning deposits and Federal funds sold.Cash on hand, interest-earning deposits and federal funds sold represent cash equivalents which decreased a combined $3.4 million, or 15.2%, to $19.3 million at December 31, 2007 from $22.7 million at December 31, 2006. Deposits from customers into savings and checking accounts, loan and security repayments and proceeds from borrowed funds typically increase these accounts. Decreases result from customer withdrawals, new loan originations, security purchases and repayments of borrowed funds.
Securities. The Company’s securities and loan portfolios represent its two largest balance sheet asset classifications. The Company’s securities portfolio decreased a net $84.0 million or 7.3% to $1.1 billion at December 31, 2007. During 2007, the Company recorded purchases of available for sale securities of $150.3 million consisting primarily of $122.8 million of mortgage-backed securities, $23.5 million of municipal bonds, $3.8 million of corporate bonds and $206,000 of equity securities. Offsetting the purchases were $165.1 million of maturities and repayments of principal, and $77.0 million of securities sold consisting primarily of $48.8 million of mortgage-backed securities, $1.2 million of equity securities, and $27.0 million of municipal bonds, an increase in the market value on securities available for sale of $8.0 million (before taxes) during the year and $1.0 million due to the amortization of premiums and a gain on sale of securities of $735,000. Unrealized pre-tax gains/losses (fair value adjustments) on available for sale securities was a $1.4 million gain as of December 31, 2007 compared to a $6.6 million loss as of December 31, 2006. These fair value adjustments represent temporary fluctuations resulting from changes in market rates in relation to average yields in the available for sale portfolio. If securities are held to their respective maturity dates, no fair value gain or loss is realized.
The Company’s investment strategy for 2007 was to de-leverage a portion of its wholesale strategy using repayments on securities to repay short term borrowings. This strategy was intended to reduce the Company’s balance sheet while strengthening its capital position. The Company continued to purchase a blend of fixed and adjustable rate product when the ten year treasury bond was in a favorable position. This strategy was consistent with the Company’s business plan which depicted a de-leveraging strategy as part of the Company’s plan to operate in a sustained inverted yield curve.
| | | | |
| ESB Financial Corporation | | 11 | | 2007 Annual Report |
Management’s Discussion and Analysis of
Financial Condition and Results of Operations (continued)
Loans receivable.The loans receivable category consists primarily of single family mortgage loans used to purchase or refinance personal residences located within the Company’s market area and commercial real estate loans used to finance properties that are used in the borrowers’ businesses or to finance investor-owned rental properties, and to a lesser extent commercial and consumer loans. Net loans receivable increased $34.6 million, or 5.9%, to $624.3 million at December 31, 2007 from $589.6 million at December 31, 2006. Included in this increase were increases in mortgage loans and other loans of $23.2 million, or 5.1%, and $6.6 million, or 4.3%, respectively and a decrease in loans in process of $5.2 million, or 30.7%, partially offset by increases in the allowance for loan losses of approximately $301,000, or 5.9%. Additionally, the increase in net loans receivable is reflected in originations of $148.9 million, partially offset by repayments of $114.1 million that occurred on both fixed and adjustable rate loans. The yield on the loan portfolio increased to 6.31% at December 31, 2007 from 6.20% at December 31, 2006.
Non-performing assets.Non-performing assets include non-accrual loans, repossessed vehicles, real estate acquired through foreclosure (REO) and troubled debt restructuring (TDR). Non-performing assets increased slightly to $4.3 million, or 0.23%, of total assets at December 31, 2007 from $4.2 million, or 0.22%, of total assets at December 31, 2006. Non-performing assets consisted of non-performing loans, REO, repossessed vehicles and TDR of $2.0 million, $1.7 million, $270,000 and $266,000, respectively, at December 31, 2007 and $2.7 million, $1.1 million, $189,000 and $268,000, respectively, at December 31, 2006. Of the $1.7 million in REO at December 31, 2007, $1.3 million relates to three unfinished spec homes and a residential building lot that the Company acquired via judicial sale in 2006. The Company has contracted to have the unfinished spec homes completed and these homes are being marketed through a local real estate agency.
Accrued interest receivable. Accrued interest receivable decreased by $232,000, or 2.4%, to $9.6 million at December 31, 2007 as compared to $9.9 million at December 31, 2006. This decrease was a result of the decrease in the balance and yields on the securities available for sale portfolio, partially offset by increases in balance and yields on the loans receivable portfolios.
FHLB stock.FHLB stock decreased $2.9 million, or 8.4%, to $31.5 million at December 31, 2007 from $34.3 million at December 31, 2006. The decrease is the result of a decrease in the outstanding balance of the FHLB advances to $628.7 million at December 31, 2007 from $698.2 million at December 31, 2006. The Bank is required to maintain an investment in capital stock of the FHLB of approximately 5.0% of its outstanding notes payable to the FHLB of Pittsburgh.
Premises and equipment.Premises and equipment increased $716,000, or 6.4%, to $11.9 million at December 31, 2007 from $11.2 million at December 31, 2006. During 2007, the Company completed construction of a branch office in Shenango Township to replace the existing location in a local strip mall. The Company incurred costs of approximately $844,000 in 2007 related to this construction. Additionally, the Company had purchases of data processing equipment of approximately $170,000 for improvements to its core system, regulatory and accounting software.
Real estate held for investment.The Company’s real estate held for investment increased $16.4 million, or 82.5%, to $36.3 million at December 31, 2007 from $19.9 million at December 31, 2006. This increase is the result of the origination in 2007 of an additional joint venture Belle Vue Park, partially offset by sales activity in the joint ventures in which the Company has a 51% ownership. For a complete description of the existing projects see “Item 1. Business –Subsidiaries” in the Company’s Annual Report on Form 10-K for the year ended December 31, 2007.
| | | | |
| ESB Financial Corporation | | 12 | | 2007 Annual Report |
Management’s Discussion and Analysis of
Financial Condition and Results of Operations (continued)
Intangible assets. Intangible assets decreased $746,000, or 23.1%, to $2.5 million at December 31, 2007 from $3.2 million at December 31, 2006. The decrease primarily resulted from amortization of the core deposit intangible created through acquisitions of approximately $715,000. Additionally, the mortgage servicing asset, resulting from the loan sale and securitization in 2002 experienced amortization of approximately $31,000 in 2007.
Prepaid expenses and other assets. Prepaid expenses and other assets decreased $3.9 million, or 22.0%, to $13.6 million at December 31, 2007 from $17.5 million at December 31, 2006. The decrease resulted primarily from decreases to deferred tax asset, interest rate cap contracts, miscellaneous receivable, advanced costs for joint ventures and prepaid federal income taxes of $3.1 million, $308,000, $378,000, $238,000 and $1.1 million, respectively.
Bank owned life insurance. Bank owned life insurance (BOLI) is universal life insurance, purchased by the Bank, on the lives of the Bank’s employees. The beneficial aspects of these universal life insurance policies are tax-free earnings and a tax-free death benefit, which are realized by ESB as the owner of the policies. The Company purchased the $15.0 million universal life insurance policies on December 29, 1998. In 2001, the policy was increased by the addition of Workingmens Savings Bank’s BOLI of $1.3 million and an addition to the original policy of $3.5 million. The cash surrender value of the BOLI as of December 31, 2007 was $28.0 million.
Deposits.The Company considers various sources when evaluating funding needs, including but not limited to deposits, which are a significant source of funds totaling $842.9 million, or 49.0%, of the Company’s total funding sources at December 31, 2007. Total deposits increased $19.2 million, or 2.3%, to $842.9 million at December 31, 2007 from $823.6 million at December 31, 2006. For the year, the Company’s interest-bearing demand and savings deposits increased $315,000, or 0.1%, time deposits increased $18.0 million, or 3.3%, and noninterest-bearing deposits increased $869,000, or 1.6%.
Advance payments by borrowers for taxes and insurance. Advance payments by borrowers for taxes and insurance increased $152,000, or 6.3%, to $2.6 million at December 31, 2007 from $2.4 million at December 31, 2006 due to the increase in the net loans receivable as well as changes in assessed values of the properties held as collateral.
Borrowed funds.The Company utilizes short and long-term borrowings as another source of funding used for asset growth and liquidity needs. These borrowings primarily include FHLB advances and repurchase agreement borrowings. Borrowed funds decreased $74.4 million, or 7.8%, to $876.7 million at December 31, 2007 from $951.2 million at December 31, 2006. FHLB advances decreased $69.6 million, or 10.0%, repurchase agreements decreased $5.0 million, or 2.7%, other borrowings increased $65,000, or 0.5%, and junior subordinated notes increased $75,000, or 0.2%.
Accrued expenses and other liabilities.Accrued expenses and other liabilities decreased $956,000, or 7.1%, to $12.6 million at December 31, 2007 from $13.5 million at December 31, 2006. These decreases are primarily due to decreases in payables related to the joint ventures, accrued interest on borrowings and accrued interest on deposits of approximately $583,000, $393,000 and $22,000, respectively.
Accounts payable for land development.Accounts payable for land development increased by $9.2 million to $12.7 million at December 31, 2007. This account represents the unpaid portion of the development costs for the Company’s joint ventures. The increase is primarily due to the Company’s Belle Vue Park joint venture which was added in 2007.
| | | | |
| ESB Financial Corporation | | 13 | | 2007 Annual Report |
Management’s Discussion and Analysis of
Financial Condition and Results of Operations (continued)
Stockholders’ equity. Stockholders’ equity increased by $4.3 million, or 3.4%, to $132.8 million at December 31, 2007 from $128.5 million at December 31, 2006. The net increase in total stockholders’ equity can be attributed primarily to increases in additional paid in capital, retained earnings and accumulated other comprehensive income of $173,000, $2.2 million and $5.5 million, respectively as well as decreases in unearned employee stock ownership plan (ESOP) and unvested shares held by the management recognition plan (MRP) of $941,000 and $50,000, respectively. These items were partially offset by an increase in treasury stock of $4.6 million.
Results of Operations
General.The Company reported net income of $7.7 million, $10.6 million and $9.2 million in 2007, 2006, and 2005, respectively.
Average Balance Sheet and Yield/Rate Analysis. The following table sets forth, for the periods indicated, information concerning the total dollar amounts of interest income from interest-earning assets and the resultant average yields, the total dollar amounts of interest expense on interest-bearing liabilities and the resultant average costs, net interest income, interest rate spread and the net interest margin earned on average interest-earning assets. For purposes of this table, average balances are calculated using monthly averages and the average loan balances include non-accrual loans and exclude the allowance for loan losses, and interest income includes accretion of net deferred loan fees. Yields on tax-exempt securities and loans (tax-exempt for federal income tax purposes) are shown on a fully tax equivalent basis utilizing a federal tax rate of 34%.
| | | | |
| ESB Financial Corporation | | 14 | | 2007 Annual Report |
Management’s Discussion and Analysis of
Financial Condition and Results of Operations (continued)
| | | | | | | | | | | | | | | | | | | | | | | | | | | |
(Dollar amounts in thousands) | | Year ended December 31, | |
| | 2007 | | | 2006 | | | 2005 | |
| | Average
Balance | | Interest | | Yield /
Rate | | | Average
Balance | | Interest | | Yield /
Rate | | | Average
Balance | | Interest | | Yield /
Rate | |
Interest-earning assets: | | | | | | | | | | | | | | | | | | | | | | | | | | | |
Taxable securities available for sale | | $ | 950,433 | | $ | 48,848 | | 5.14 | % | | $ | 982,294 | | $ | 48,790 | | 4.97 | % | | $ | 923,901 | | $ | 42,031 | | 4.55 | % |
Taxable adjustable corporate bonds AFS | | | 48,604 | | | 3,090 | | 6.36 | % | | | 51,270 | | | 3,062 | | 5.97 | % | | | 51,255 | | | 2,133 | | 4.16 | % |
Tax-exempt securities available for sale | | | 109,024 | | | 4,927 | | 6.85 | % | | | 112,506 | | | 5,328 | | 7.18 | % | | | 114,677 | | | 5,605 | | 7.41 | % |
| | | | | | | | | | | | | | | | | | | | | | | | | | | |
| | | 1,108,061 | | | 56,865 | | 5.36 | % | | | 1,146,070 | | | 57,180 | | 5.23 | % | | | 1,089,833 | | | 49,769 | | 4.83 | % |
| | | | | | | | | | | | | | | | | | | | | | | | | | | |
Mortgage loans | | | 451,331 | | | 27,785 | | 6.16 | % | | | 412,968 | | | 25,166 | | 6.09 | % | | | 344,217 | | | 20,556 | | 5.97 | % |
Other loans | | | 148,375 | | | 9,897 | | 6.67 | % | | | 147,463 | | | 9,468 | | 6.42 | % | | | 136,896 | | | 8,270 | | 6.04 | % |
Tax-exempt loans | | | 11,977 | | | 586 | | 7.41 | % | | | 12,796 | | | 595 | | 7.05 | % | | | 13,089 | | | 614 | | 7.11 | % |
| | | | | | | | | | | | | | | | | | | | | | | | | | | |
| | | 611,683 | | | 38,268 | | 6.31 | % | | | 573,227 | | | 35,229 | | 6.20 | % | | | 494,202 | | | 29,440 | | 6.02 | % |
| | | | | | | | | | | | | | | | | | | | | | | | | | | |
Cash equivalents | | | 17,727 | | | 464 | | 2.62 | % | | | 14,093 | | | 348 | | 2.47 | % | | | 17,541 | | | 230 | | 1.31 | % |
FHLB stock | | | 33,052 | | | 1,987 | | 6.01 | % | | | 34,709 | | | 1,714 | | 4.94 | % | | | 34,403 | | | 914 | | 2.66 | % |
| | | | | | | | | | | | | | | | | | | | | | | | | | | |
| | | 50,779 | | | 2,451 | | 4.83 | % | | | 48,802 | | | 2,062 | | 4.23 | % | | | 51,944 | | | 1,144 | | 2.20 | % |
| | | | | | | | | | | | | | | | | | | | | | | | | | | |
Total interest-earning assets | | | 1,770,523 | | | 97,584 | | 5.67 | % | | | 1,768,099 | | | 94,471 | | 5.52 | % | | | 1,635,979 | | | 80,353 | | 5.11 | % |
Other noninterest-earning assets | | | 129,907 | | | — | | — | | | | 123,171 | | | — | | — | | | | 126,263 | | | — | | — | |
| | | | | | | | | | | | | | | | | | | | | | | | | | | |
Total assets | | $ | 1,900,430 | | $ | 97,584 | | 5.28 | % | | $ | 1,891,270 | | $ | 94,471 | | 5.16 | % | | $ | 1,762,242 | | $ | 80,353 | | 4.74 | % |
| | | | | | | | | | | | | | | | | | | | | | | | | | | |
Interest-bearing liabilities: | | | | | | | | | | | | | | | | | | | | | | | | | | | |
Interest-bearing demand deposits | | $ | 224,099 | | $ | 1,779 | | 0.79 | % | | $ | 235,197 | | $ | 1,470 | | 0.63 | % | | $ | 261,233 | | $ | 1,433 | | 0.55 | % |
Time deposits | | | 557,808 | | | 25,927 | | 4.65 | % | | | 528,435 | | | 21,882 | | 4.14 | % | | | 484,828 | | | 15,813 | | 3.26 | % |
| | | | | | | | | | | | | | | | | | | | | | | | | | | |
| | | 781,907 | | | 27,706 | | 3.54 | % | | | 763,632 | | | 23,352 | | 3.06 | % | | | 746,061 | | | 17,246 | | 2.31 | % |
| | | | | | | | | | | | | | | | | | | | | | | | | | | |
FHLB advances | | | 657,267 | | | 31,274 | | 4.76 | % | | | 709,690 | | | 30,854 | | 4.35 | % | | | 675,819 | | | 25,771 | | 3.81 | % |
Repurchase agreements | | | 188,458 | | | 9,371 | | 4.97 | % | | | 148,292 | | | 7,114 | | 4.80 | % | | | 77,833 | | | 2,812 | | 3.61 | % |
Other borrowings | | | 14,410 | | | 776 | | 5.39 | % | | | 18,297 | | | 1,058 | | 5.78 | % | | | 18,895 | | | 1,042 | | 5.51 | % |
| | | | | | | | | | | | | | | | | | | | | | | | | | | |
| | | 860,135 | | | 41,421 | | 4.82 | % | | | 876,279 | | | 39,026 | | 4.45 | % | | | 772,547 | | | 29,625 | | 3.83 | % |
| | | | | | | | | | | | | | | | | | | | | | | | | | | |
Preferred securities- fixed | | | 36,083 | | | 2,111 | | 5.85 | % | | | 36,083 | | | 2,118 | | 5.87 | % | | | 31,573 | | | 1,940 | | 6.14 | % |
Preferred securities- adjustable | | | 15,399 | | | 1,363 | | 8.85 | % | | | 15,324 | | | 1,308 | | 8.54 | % | | | 15,249 | | | 1,012 | | 6.64 | % |
| | | | | | | | | | | | | | | | | | | | | | | | | | | |
| | | 51,482 | | | 3,474 | | 6.75 | % | | | 51,407 | | | 3,426 | | 6.66 | % | | | 46,822 | | | 2,952 | | 6.30 | % |
| | | | | | | | | | | | | | | | | | | | | | | | | | | |
Total interest-bearing liabilities | | | 1,693,524 | | | 72,601 | | 4.29 | % | | | 1,691,318 | | | 65,804 | | 3.89 | % | | | 1,565,430 | | | 49,823 | | 3.18 | % |
Noninterest-bearing demand deposits | | | 58,549 | | | — | | | | | | 55,857 | | | — | | — | | | | 49,587 | | | — | | — | |
Other noninterest-bearing liabilities | | | 20,237 | | | — | | — | | | | 19,909 | | | — | | — | | | | 19,010 | | | — | | — | |
| | | | | | | | | | | | | | | | | | | | | | | | | | | |
Total liabilities | | | 1,772,310 | | | 72,601 | | 4.10 | % | | | 1,767,084 | | | 65,804 | | 3.72 | % | | | 1,634,027 | | | 49,823 | | 3.05 | % |
Stockholders’ equity | | | 128,120 | | | — | | — | | | | 124,186 | | | — | | — | | | | 128,215 | | | — | | — | |
| | | | | | | | | | | | | | | | | | | | | | | | | | | |
Total liabilities and equity | | $ | 1,900,430 | | $ | 72,601 | | 3.82 | % | | $ | 1,891,270 | | $ | 65,804 | | 3.48 | % | | $ | 1,762,242 | | $ | 49,823 | | 2.83 | % |
| | | | | | | | | | | | | | | | | | | | | | | | | | | |
Net interest income | | | | | $ | 24,983 | | | | | | | | $ | 28,667 | | | | | | | | $ | 30,530 | | | |
| | | | | | | | | | | | | | | | | | | | | | | | | | | |
Interest rate spread(difference between weighted average rate on interest-earning assets and interest-bearing liabilities) | | | | | | | | 1.38 | % | | | | | | | | 1.63 | % | | | | | | | | 1.93 | % |
| | | | | | | | | | | | | | | | | | | | | | | | | | | |
| | | | | | | | | | | | | | | | | | | | | | | | | | | |
Net interest margin(net interest income as a percentage of average interest-earning assets) | | | | | | | | 1.57 | % | | | | | | | | 1.79 | % | | | | | | | | 2.06 | % |
| | | | | | | | | | | | | | | | | | | | | | | | | | | |
| | | | |
| ESB Financial Corporation | | 15 | | 2007 Annual Report |
Management’s Discussion and Analysis of
Financial Condition and Results of Operations (continued)
Analysis of Changes in Net Interest Income.The following table analyzes the changes in interest income and interest expense in terms of: (i) changes in volume of interest-earning assets and interest-bearing liabilities and (ii) changes in yield and rates. The table reflects the extent to which changes in the Company’s interest income and interest expense are attributable to changes in rate (change in rate multiplied by prior year volume), changes in volume (changes in volume multiplied by prior year rate) and changes attributable to the combined impact of volume/rate (change in rate multiplied by change in volume). The changes attributable to the combined impact of volume/rate are allocated on a consistent basis between the volume and rate variances.
| | | | | | | | | | | | | | | | | | | | | | | | |
(Dollar amounts in thousands) | | 2007 vs. 2006 | | | 2006 vs. 2005 | |
| | Increase (decrease) due to | | | Increase (decrease) due to | |
| | Volume | | | Rate | | | Total | | | Volume | | | Rate | | | Total | |
Interest income: | | | | | | | | | | | | | | | | | | | | | | | | |
Securities | | $ | (1,925 | ) | | $ | 1,610 | | | $ | (315 | ) | | $ | 2,653 | | | $ | 4,758 | | | $ | 7,411 | |
Loans | | | 2,397 | | | | 642 | | | | 3,039 | | | | 4,832 | | | | 957 | | | | 5,789 | |
Cash equivalents | | | 94 | | | | 22 | | | | 116 | | | | (52 | ) | | | 170 | | | | 118 | |
FHLB stock | | | (85 | ) | | | 358 | | | | 273 | | | | 8 | | | | 792 | | | | 800 | |
| | | | | | | | | | | | | | | | | | | | | | | | |
Total interest-earning assets | | | 481 | | | | 2,632 | | | | 3,113 | | | | 7,441 | | | | 6,677 | | | | 14,118 | |
| | | | | | | | | | | | | | | | | | | | | | | | |
Interest expense: | | | | | | | | | | | | | | | | | | | | | | | | |
Deposits | | | 570 | | | | 3,784 | | | | 4,354 | | | | 415 | | | | 5,691 | | | | 6,106 | |
FHLB advances | | | (2,374 | ) | | | 2,794 | | | | 420 | | | | 1,339 | | | | 3,744 | | | | 5,083 | |
Repurchase agreements | | | 1,989 | | | | 268 | | | | 2,257 | | | | 3,158 | | | | 1,144 | | | | 4,302 | |
Other borrowings | | | (213 | ) | | | (69 | ) | | | (282 | ) | | | (34 | ) | | | 50 | | | | 16 | |
Subordinated debt | | | 5 | | | | 43 | | | | 48 | | | | 300 | | | | 174 | | | | 474 | |
| | | | | | | | | | | | | | | | | | | | | | | | |
Total interest-bearing liabilities | | | (23 | ) | | | 6,820 | | | | 6,797 | | | | 5,178 | | | | 10,803 | | | | 15,981 | |
| | | | | | | | | | | | | | | | | | | | | | | | |
Net interest income | | $ | 504 | | | $ | (4,188 | ) | | $ | (3,684 | ) | | $ | 2,263 | | | $ | (4,126 | ) | | $ | (1,863 | ) |
| | | | | | | | | | | | | | | | | | | | | | | | |
2007 Results Compared to 2006 Results
General.The Company reported net income of $7.7 million and $10.6 million for 2007 and 2006, respectively. The $2.9 million, or 27.8%, decrease in net income between 2007 and 2006 can primarily be attributed to an increase in interest expense of $6.8 million and a decrease in noninterest income of $570,000, partially offset by an increase in interest income of $3.1 million and decreases in provision for loan losses, noninterest expense and provision for income taxes of $248,000, $134,000 and $917,000, respectively.
Net interest income.Net interest income, the primary source of revenue for the Company, is determined by the Company’s interest rate spread, which is defined as the difference between income on earning assets and the cost of funds supporting those assets, and the relative amounts of interest earning assets and interest bearing liabilities. Management periodically adjusts the mix of assets and liabilities, as well as the rates earned or paid on those assets and liabilities in order to manage and improve net interest income. The level of interest rates and changes in the amount and composition of interest earning assets and liabilities affect the Company’s net interest income. Historically from an interest rate risk perspective, it has been management’s perception that differing interest rate environments can cause sensitivity to the Company’s net interest income, these being extended low long-term interest rates or rapidly rising short-term interest rates as well as a sustained inverted yield curve. As a result of the inverted yield curve net interest income decreased by $3.7 million, or 12.9%, to $25.0 million for 2007, compared to $28.7 million for 2006. This decrease in net interest income can be attributed to an increase in interest expense of $6.8 million, or 10.3%, which was only partially offset by an increase in interest income of $3.1 million, or 3.3%. The increase to interest expense reflects a steadily rising cost of funds as the Company continues to operate in an increasingly competitive rate environment.
| | | | |
| ESB Financial Corporation | | 16 | | 2007 Annual Report |
Management’s Discussion and Analysis of
Financial Condition and Results of Operations (continued)
Interest income.Interest income increased $3.1 million, or 3.3%, to $97.6 million for 2007, compared to $94.5 million for 2006. This increase in interest income can be attributed to an increase in interest earned on loans receivable, FHLB stock and cash equivalents of $3.0 million, $273,000, and $116,000, respectively. Cash equivalents include cash on hand and in banks, interest-earning deposits and federal funds sold. Partially offsetting these increases was a decrease in interest earned on securities available for sale of $315,000.
Interest earned on loans receivable increased $3.0 million, or 8.6%, to $38.3 million for 2007, compared to $35.2 million for 2006. This increase was attributable to an increase in the average balance of loans outstanding of $38.5 million, or 6.7%, to $611.7 million for the year ended December 31, 2007, as compared to $573.2 million for the year ended December 31, 2006. Additionally, the yield on the portfolio increased to 6.31% at December 31, 2007 as compared to 6.20% at December 31, 2006. The increase in loans is primarily attributed to growth in the residential mortgage loan portfolio.
Interest earned on securities decreased $315,000, or 0.6%, to $56.9 million for 2007 compared to $57.2 million for 2006. This decrease was primarily attributable to a decrease in the average balance of securities of $38.0 million, or 3.3%, partially offset by an increase in the tax equivalent yield on the portfolio of 13 basis points to 5.36% for 2007, compared to 5.23% for 2006. The reduction to the average balance of the securities portfolio is due to the Company’s investment strategy for 2007 which was to de-leverage a portion of its wholesale strategy by using repayments on securities to repay short term borrowings. This strategy was intended to reduce the Company’s balance sheet while strengthening its capital position. The Company continued to purchase a limited blend of fixed and adjustable rate product when the ten year treasury bond was in a favorable position.
Income from FHLB stock increased $273,000, or 15.9%, to $2.0 million for 2007, compared to $1.7 million for 2006. This increase can be primarily attributed to an increase in the yield of 107 basis points on FHLB stock to 6.01% for 2007 compared to 4.94% for 2006, partially offset by a decrease in the average balance of $1.6 million to $33.1 million at December 31, 2007 from $34.7 million at December 31, 2006.
Interest earned on cash equivalents increased $116,000, or 33.3%, to $464,000 for 2007, compared to $348,000 for 2006 as the average balance increased $3.6 million to $17.7 million at December 31, 2007 compared to $14.1 million at December 31, 2006 and the yield increased to 2.62% for 2007, compared to 2.47% for 2006.
Interest expense. Interest expense increased $6.8 million, or 10.3%, to $72.6 million for 2007, compared to $65.8 million for 2006. This increase in interest expense can be attributed to increases in interest incurred on deposits, borrowed funds and junior subordinated notes of $4.4 million, $2.4 million and $48,000, respectively.
Interest incurred on deposits increased $4.4 million, or 18.7%, to $27.7 million for 2007, compared to $23.4 million for 2006. This increase was primarily attributable to an increase in the cost of deposits to 3.54% in 2007 from 3.06% in 2006, and to a lesser extent, an increase of $18.3 million, or 2.4%, in the average balance of interest-bearing deposits to $781.9 million for 2007 as compared to $763.6 million for 2006. The Company manages its cost of interest-bearing deposits by diligently monitoring the interest rates on its products as well as the rates being offered by its competition through weekly interest rate committee meetings and utilizing rate surveys and hence subsequently adjusting rates accordingly.
Interest incurred on borrowings, which includes FHLB advances and repurchase agreements, the largest components of the Company’s interest-bearing liabilities, increased $2.4 million, or 6.1%, to $41.4 million for 2007, compared to $39.0 million for 2006. This increase was primarily attributable to an increase in the cost of these funds to 4.82% for 2007 compared to 4.45% for 2006 partially offset by a decrease in the average balance of borrowed funds of $16.1 million, or 1.8%, to $860.1 million for 2007, compared to $876.3 million for 2006. The Company, as part of its wholesale strategy, continues to manage its cost of funds through its long-standing policy of laddering the maturities of borrowings up to a three year period. This strategy allows the Company the
| | | | |
| ESB Financial Corporation | | 17 | | 2007 Annual Report |
Management’s Discussion and Analysis of
Financial Condition and Results of Operations (continued)
flexibility to alter its borrowing structure quarterly. During 2007, the Bank had maturing long-term borrowings, defined as borrowings with original terms greater than one year, of $238.7 million at an average rate of 3.75% replaced with borrowings of $230.0 million at an average rate of 4.78% which caused an increase in the cost of those borrowings by 103 basis points.
Interest expense on junior subordinated notes increased $48,000, or 1.4%, to $3.5 million at December 31, 2007 from $3.4 million at December 31, 2006. This increase was primarily attributable to an increase in the cost of these funds to 6.75% for 2007, compared to 6.66% for 2006.
Provision for loan losses.The Company records provisions for loan losses to bring the total allowance for loan losses to a level deemed adequate to cover probable losses in the loan portfolio. In determining the appropriate level of allowance for loan losses, management considers historical loss experience, the financial condition of borrowers, economic conditions (particularly as they relate to markets where the Company originates loans), the status of non-performing assets, the estimated underlying value of the collateral and other factors related to the collectibility of the loan portfolio. The provision for loan losses decreased $248,000 to $865,000 for the year ended December 31, 2007 compared to $1.1 million for the same period last year. These provisions were part of the normal operations of the Company for 2007. As a result of the provision for loan losses during 2007 and 2006, the Company’s allowance for loan losses amounted to $5.4 million, or 0.85%, of the Company’s total loan portfolio at December 31, 2007, compared to $5.1 million, or 0.84%, at December 31, 2006. The Company’s allowance for loan losses as a percentage of non-performing loans at December 31, 2007 and December 31, 2006 was 236.21% and 171.75%, respectively.
Noninterest income.Noninterest income decreased $570,000, or 7.3%, to $7.2 million for 2007, compared to $7.8 million for 2006. This decrease can be attributed to decreases to net gain on sale of loans, net realized gain on sale of securities available for sale and income from real estate joint ventures of $179,000, $576,000 and $75,000, respectively, partially offset by increases in fees and service charges, cash surrender value of bank owned life insurance and other income of $89,000, $97,000 and $74,000, respectively.
Net gain on sale of loans decreased $179,000 to $7,000 for 2007, compared to $186,000 for 2006. During 2006 the Company sold its credit card portfolio which resulted in a gain of approximately $177,000. The portfolio had a balance of approximately $2.0 million and was sold at a 10% premium, with the exception of the Company’s business accounts, delinquent accounts and a recourse reserve.
Net realized gain (loss) on sale of investments increased by $114,000 and net loss on sale of derivatives increased by $690,000 to reflect an overall loss of $96,000 for 2007 as compared to a gain of $480,000 for 2006. In 2007 the Company terminated its cash flow hedge. During 2006, the Company restructured approximately $73.8 million of its investment portfolio consisting of both fixed and adjustable rate mortgage-backed securities as well as municipal bonds. The proceeds were reinvested primarily into twenty and thirty year fixed rate mortgage-backed securities and, to a lesser extent, adjustable rate mortgage-backed securities.
Income from real estate joint ventures decreased a nominal $75,000, or 3.9%, to $1.8 million for 2007 compared to $1.9 million for 2006. The joint ventures originated in 2007 should begin to experience sales activity in 2008.
Fees and service charges increased a nominal $89,000, or 2.4%, to $3.8 million for 2007, compared to $3.7 million for 2006. These increases are primarily attributed to increase in fees on our checking and savings products of approximately $148,000, or 5.8%, over last year. Included in the $148,000 increase in fees was an increase of $411,000 to fees on NOW accounts primarily due to increased participation in our platinum overdraft program and ESB Rewards program for debit card holders, partially offset by decreases to ATM fees of $263,000. The platinum overdraft program is a service provided by the Bank which enables customers limited ability to overdraft their checking accounts without the Bank returning the check. The ESB Rewards program offers customers the ability to earn points, based on debit card usage, which can be redeemed for prizes.
| | | | |
| ESB Financial Corporation | | 18 | | 2007 Annual Report |
Management’s Discussion and Analysis of
Financial Condition and Results of Operations (continued)
Offsetting the increase to fees related to checking and savings were decreases to various loan fees, primarily due to the decrease in loan originations of $35.2 million when compared to 2006.
Noninterest expense.Noninterest expenses decreased $134,000, or 0.6%, to $23.3 million for 2007, compared to $23.4 million for 2006. This decrease can be primarily attributed to decreases in amortization of intangible assets, minority interest and other expenses of $117,000, $31,000 and $133,000, respectively. Partially offsetting these decreases was an increase in data processing of $170,000.
Amortization of intangible assets decreased $117,000, or 14.1%, to $715,000 for 2007, compared to $832,000 for 2006. The decrease was to the normal amortization of the core deposit intangible of prior acquisitions. Amortization is expected to total $601,000, $494,000, $413,000, $332,000, $251,000 and $264,000 for the years 2008, 2009, 2010, 2011, 2012 and thereafter, respectively.
Minority interest decreased $31,000, or 4.9%, to $606,000 for 2007, compared to $637,000 for 2006. This decrease is directly related to the decrease in income from real estate joint ventures and represents the portion of the profits on the consolidated joint ventures earned by the partners.
Miscellaneous other expenses which consist primarily of professional fees, forms and supplies, bank charges, postage, insurance expenses, organizational dues, ATM expenses and net carrying costs associated with real estate owned decreased by $133,000, or 3.4%, to $3.8 million for 2007 as compared to $4.0 million for 2006. The decrease is primarily related to decreases in provision for losses associated with real estate owned.
Data processing expense increased $170,000, or 9.8%, to $1.9 million for 2007, compared to $1.7 million for 2006. This increase is primarily related to increases in software service contracts, depreciation and data processing fees of $52,000, $14,000 and $99,000, respectively.
Provision for income taxes. The provision for income taxes decreased $917,000, or 69.6%, to $400,000 for 2007 as compared to $1.3 million in 2006. The effective tax rate for 2007 was 5.0% compared to 11.0% for 2006. This is primarily due to the $3.9 million, or 32.5%, decrease in pre-tax income. The tax rate was further decreased by approximately 7.2% as a result of the percentage of tax-free income in 2007 as compared to 2006.
2006 Results Compared to 2005 Results
General.The Company reported net income of $10.6 million and $9.2 million for 2006 and 2005, respectively. The $1.4 million, or 15.7%, increase in net income between 2006 and 2005 can primarily be attributed to an increase in noninterest income of $4.6 million, partially offset by a decrease of $1.9 million in net interest income and increases to provision for loan losses, noninterest expense and provision for income taxes of $545,000, $292,000 and $507,000, respectively.
Net interest income.Net interest income, the primary source of revenue for the Company, is determined by the Company’s interest rate spread, which is defined as the difference between income on earning assets and the cost of funds supporting those assets, and the relative amounts of interest earning assets and interest bearing liabilities. Management periodically adjusts the mix of assets and liabilities, as well as the rates earned or paid on those assets and liabilities in order to manage and improve net interest income. The level of interest rates and changes in the amount and composition of interest earning assets and liabilities affect the Company’s net interest income. Historically from an interest rate risk perspective, it has been management’s perception that differing interest rate environments can cause sensitivity to the Company’s net interest income, these being extended low long-term interest rates or rapidly rising short-term interest rates as well as a sustained inverted yield curve. As a result of the inverted yield curve net interest income decreased by $1.9 million, or 6.1%, to $28.7 million for 2006, compared to $30.5 million for 2005. This decrease in net interest income can be attributed to an increase
| | | | |
| ESB Financial Corporation | | 19 | | 2007 Annual Report |
Management’s Discussion and Analysis of
Financial Condition and Results of Operations (continued)
in interest expense of $16.0 million, or 32.1%, which was only partially offset by an increase in interest income of $14.1 million, or 17.6%. The increase to interest expense reflects a steadily rising cost of funds as the Company continues to operate in an increasingly competitive rate environment.
Interest income. Interest income increased $14.1 million, or 17.6%, to $94.5 million for 2006, compared to $80.4 million for 2005. This increase in interest income can be attributed to an increase in interest earned on loans receivable, securities available for sale, FHLB stock and cash equivalents of $5.8 million, $7.4 million, $800,000 and $118,000, respectively. Cash equivalents include cash on hand and in banks, interest-earning deposits and federal funds sold.
Interest earned on loans receivable increased $5.8 million, or 19.7%, to $35.2 million for 2006, compared to $29.4 million for 2005. This increase was attributable to an increase in the average balance of loans outstanding of $79.0 million, or 16.0%, to $573.2 million for the year ended December 31, 2006, as compared to $494.2 million for the year ended December 31, 2005. Additionally, the yield on the portfolio increased to 6.20% at December 31, 2006 as compared to 6.02% at December 31, 2005. The increase in loans is primarily attributed to growth in the residential mortgage loan portfolio.
Interest earned on securities increased $7.4 million, or 14.9%, to $57.2 million for 2006 compared to $49.8 million for 2005. This increase was primarily attributable to an increase in the tax equivalent yield on the portfolio of 40 basis points to 5.23% for 2006, compared to 4.83% for 2005, as well as an increase in the average balance of securities of $56.2 million, or 5.2%, to $1.1 billion for the year ended December 31, 2006.
Income from FHLB stock increased $800,000, or 87.5%, to $1.7 million for 2006, compared to $914,000 for 2005. This increase can be primarily attributed to an increase in the yield of 228 basis points on FHLB stock to 4.94% for 2006 compared to 2.66% for 2005 and to a nominal increase in the average balance of $306,000 to $34.7 million at December 31, 2006 from $34.4 million at December 31, 2005.
Interest earned on cash equivalents increased $118,000, or 51.3%, to $348,000 for 2006, compared to $230,000 for 2005 as the yield increased to 2.47% for 2006, compared to 1.31% for 2005. Partially offsetting this increase was a decrease in the average balance of $3.4 million to $14.1 million at December 31, 2006 compared to $17.5 million at December 31, 2005.
Interest expense.Interest expense increased $16.0 million, or 32.1%, to $65.8 million for 2006, compared to $49.8 million for 2005. This increase in interest expense can be attributed to increases in interest incurred on deposits, FHLB advances and repurchase agreements and junior subordinated notes of $6.1 million, $9.4 million and $474,000, respectively.
Interest incurred on deposits increased $6.1 million, or 35.4%, to $23.4 million for 2006, compared to $17.2 million for 2005. This increase was primarily attributable to an increase in the cost of deposits to 3.06% in 2006 from 2.31% in 2005, and to a lesser extent an increase of $17.6 million, or 2.4%, in the average balance of interest-bearing deposits to $763.6 million for 2006 as compared to $746.1 million for 2005. The Company manages its cost of interest-bearing deposits by diligently monitoring the interest rates on its products as well as the rates being offered by its competition through weekly interest rate committee meetings and utilizing rate surveys and hence subsequently adjusting rates accordingly.
Interest incurred on FHLB advances and repurchase agreements, the largest components of the Company’s interest-bearing liabilities, increased $9.4 million, or 31.7%, to $39.0 million for 2006, compared to $29.6 million for 2005. This increase was primarily attributable to an increase in the cost of these funds to 4.45% for 2006 compared to 3.83% for 2005 and to a lesser extent an increase in the average balance of borrowed funds of $103.7 million, or 13.4%, to $876.3 million for 2006, compared to $772.5 million for 2005. The Company, as
| | | | |
| ESB Financial Corporation | | 20 | | 2007 Annual Report |
Management’s Discussion and Analysis of
Financial Condition and Results of Operations (continued)
part of its wholesale strategy, continues to manage its cost of funds through its long-standing policy of laddering the maturities of borrowings up to a three year period. This strategy allows the Company the flexibility to alter its borrowing structure quarterly. During 2006, the Bank had maturing long-term borrowings, defined as borrowings with original terms greater than one year, of $203.0 million at an average rate of 3.81% replaced with borrowings of $203.0 million at an average rate of 5.24% which caused an increase in the cost of those borrowings by 143 basis points.
Interest expense on junior subordinated notes increased $474,000, or 16.1%, to $3.4 million at December 31, 2006 from $3.0 million at December 31, 2005. This increase was primarily attributable to an increase in the average balance of the subordinated debt of $4.6 million to $51.4 million at December 31, 2006 from $46.8 million at December 31, 2005 and to a lesser extent to an increase in the cost of these funds to 6.66% for 2006, compared to 6.30% for 2005. These increases were the result of the Company’s issuance of $35.0 million fixed/floating rate preferred securities at a rate of 6.03% in conjunction with the acquisition of PHSB in February 2005, which existed for the entire period in 2006 as opposed to a partial period in 2005.
Provision for loan losses.The Company records provisions for loan losses to bring the total allowance for loan losses to a level deemed adequate to cover probable losses in the loan portfolio. In determining the appropriate level of allowance for loan losses, management considers historical loss experience, the financial condition of borrowers, economic conditions (particularly as they relate to markets where the Company originates loans), the status of non-performing assets, the estimated underlying value of the collateral and other factors related to the collectibility of the loan portfolio. The provision for loan losses increased $545,000 to $1.1 million for the year ended December 31, 2006 compared to $568,000 for the same period last year. These provisions were part of the normal operations of the Company for 2006. As a result of the provision for loan losses during 2006 and 2005, the Company’s allowance for loan losses amounted to $5.1 million, or 0.84%, of the Company’s total loan portfolio at December 31, 2006, compared to $4.9 million or 0.86% at December 31, 2005. The Company’s allowance for loan losses as a percentage of non-performing loans at December 31, 2006 and December 31, 2005 were 171.75% and 127.26%, respectively.
Noninterest income.Noninterest income increased $4.6 million, or 147.8%, to $7.8 million for 2006, compared to $3.1 million for 2005. This increase can be attributed to increases to fees and service charges, net gain on sale of loans, cash surrender value of bank owned life insurance, net realized gain on sale of securities available for sale and income from real estate joint ventures of $261,000, $167,000, $75,000, $3.4 million and $838,000, respectively, partially offset by a decrease of $86,000 in various other categories.
Fees and service charges increased $261,000, or 7.6%, to $3.7 million for 2006, compared to $3.4 million for 2005. These increases are primarily attributed to increase in fees on our checking and savings products of approximately $313,000, or 48.8%, over last year. This increase is primarily due to increased participation in our platinum overdraft program partially offset by decreases to ATM fees. The platinum overdraft program is a service provided by the Bank which enables customers limited ability to overdraft their checking accounts without the Bank returning the check. Offsetting the increase to fees related to checking and savings were decreases to VISA interchange fees, due to the sale of the portfolio, of approximately $42,000, and an increase to the amortization of the loan servicing rights of approximately $20,000.
Net gain on sale of loans increased $167,000 to $186,000 for 2006, compared to $19,000 for 2005. The increase is primarily related to the sale of the Company’s credit card portfolio which resulted in a gain of approximately $177,000. The portfolio had a balance of approximately $2.0 million and was sold at a 10% premium, with the exception of the Company’s business accounts, delinquent accounts and a recourse reserve.
Net realized gain on sale of investments increased by $3.4 million to reflect a gain of $480,000 for 2006 as compared to a loss of $2.9 million for 2005. During 2006, the Company restructured approximately $73.8 million of its investment portfolio consisting of both fixed and adjustable rate mortgage-backed securities as well as
| | | | |
| ESB Financial Corporation | | 21 | | 2007 Annual Report |
Management’s Discussion and Analysis of
Financial Condition and Results of Operations (continued)
municipal bonds. The proceeds were reinvested primarily into twenty and thirty year fixed rate mortgage-backed securities and, to a lesser extent, adjustable rate mortgage-backed securities. During 2005, the Company restructured a portion of its securities portfolio by selling approximately $78.7 million of adjustable rate mortgage-backed securities (MBS), with a weighted average interest rate of 4.20%, that were originally purchased at a premium, and approximately $10.1 million of fixed rate MBS, with a weighted average interest rate of 4.39%, also purchased at a premium. The Company also sold approximately $7.3 million of municipal bonds.
Income from real estate joint ventures increased by $838,000, or 78.8%, to $1.9 million for 2006 compared to $1.1 million for 2005. During 2005, some of the Company’s seasoned projects were reaching their final stages therefore resulting in decreased sales. In the latter part of 2005, the Company entered into three new joint ventures which experienced sales activity in 2006 and contributed to the increase in income over the prior year.
Noninterest expense.Noninterest expenses increased $292,000, or 1.3%, to $23.4 million for 2006, compared to $23.1 million for 2005. This increase can be primarily attributed to increases in compensation and employee benefits and minority interest of $522,000 and $334,000, respectively. Partially offsetting these increases were decreases in premises and equipment, data processing, amortization of intangible assets, advertising and other expenses of $121,000, $177,000, $22,000, $18,000 and $222,000, respectively.
Compensation and employee benefits expense increased $522,000, or 4.1%, to $13.2 million for 2006, compared to $12.7 million for 2005. The increases between the periods were primarily related to compensation and related taxes, health benefits, retirement plans and stock options of $380,000, $144,000, $107,000 and $60,000, respectively, partially offset by decreases related to the MRP and ESOP of $30,000 and $156,000, respectively.
Premises and equipment expense decreased $121,000, or 4.7%, to $2.4 million for 2006 as compared to $2.6 million for 2005. This decrease is primarily due to decreases in impairment charges that the Company recognized on its properties held for sale in 2005 that did not exist in 2006. These properties were sold in 2006.
Data processing expense decreased $177,000, or 9.3%, to $1.7 million for 2006, compared to $1.9 million for 2005. This decrease is primarily related to decreases in depreciation of $160,000.
Amortization of intangible assets decreased $22,000, or 2.6%, to $832,000 for 2006, compared to $854,000 for 2005. The decrease was to the normal amortization of the core deposit intangible of prior acquisitions. Amortization is expected to total $715,000, $601,000, $494,000, $413,000, $332,000 and $515,000 for the years 2007, 2008, 2009, 2010, 2011 and thereafter, respectively.
Minority interest increased $334,000, or 110.2%, to $637,000 for 2006, compared to $303,000 for 2005. This increase is directly related to the increase in income from real estate joint ventures and represents the portion of the profits on the consolidated joint ventures earned by the partners.
Miscellaneous other expenses which consist primarily of professional fees, forms and supplies, bank charges, postage, insurance expenses, organizational dues, ATM expenses and net carrying costs associated with real estate owned decreased by $222,000, or 5.3%, to $4.0 million for 2006 as compared to $4.2 million for 2005. The decrease is primarily related to decreases in legal fees, audit and accounting, and VISA expenses. The decrease to VISA expense is a result of the sale of the credit card portfolio in 2006.
Provision for income taxes.The provision for income taxes increased $507,000, or 62.6%, to $1.3 million for 2006 as compared to $810,000 in 2005. The effective tax rate for 2006 was 11.0% compared to 8.1% for 2005. This is primarily due to the $1.9 million, or 19.5%, increase in pre-tax income. The tax rate was further increased by approximately 4.3% as a result of reduced tax-free income in 2006 as compared to 2005. The tax-free income generated by the municipal securities and tax-free loans portfolio decreased by approximately $424,000 in 2006.
| | | | |
| ESB Financial Corporation | | 22 | | 2007 Annual Report |
Management’s Discussion and Analysis of
Financial Condition and Results of Operations (continued)
Asset and Liability Management
The primary objective of the Company’s asset and liability management function is to maximize the Company’s net interest income while simultaneously maintaining an acceptable level of interest rate risk given the Company’s operating environment, capital and liquidity requirements, performance objectives and overall business focus. The principal determinant of the exposure of the Company’s earnings to interest rate risk is the timing difference between the repricing or maturity of interest-earning assets and the repricing or maturity of its interest-bearing liabilities. The Company’s asset and liability management policies are designed to decrease interest rate sensitivity primarily by shortening the maturities of interest-earning assets while at the same time extending the maturities of interest-bearing liabilities. The Board of Directors of the Company continues to believe in strong asset/liability management in order to insulate the Company from material and prolonged increases in interest rates. As a result of this policy, the Company emphasizes a larger, more diversified portfolio of residential mortgage loans in the form of mortgage-backed securities. Mortgage-backed securities generally increase the quality of the Company’s assets by virtue of the insurance or guarantees that back them, are more liquid than individual mortgage loans and may be used to collateralize borrowings or other obligations of the Company.
The Company’s Board of Directors has established an Asset and Liability Management Committee consisting of outside directors, the President and Chief Executive Officer, Group Senior Vice President/Chief Financial Officer, Group Senior Vice President/Operations and Group Senior Vice President/Lending. This committee, which meets quarterly, generally monitors various asset and liability management policies and strategies, which were implemented by the Company over the past few years. These strategies have included: (i) an emphasis on the investment in adjustable-rate and shorter duration mortgage-backed securities, (ii) an emphasis on the origination of single-family residential adjustable-rate mortgages (ARMs), residential construction loans and commercial real estate loans, which generally have adjustable or floating interest rates and/or shorter maturities than traditional single-family residential loans, and consumer loans, which generally have shorter terms and higher interest rates than mortgage loans and (iii) increase the duration of the liability base of the Company by extending the maturities of savings deposits, borrowed funds and repurchase agreements.
As of December 31, 2007, the implementation of these asset and liability initiatives resulted in the following: (i) $190.2 million or 29.8% of the Company’s total loan portfolio had adjustable interest rates or maturities of 12 months or less; (ii) $91.5 million or 27.0% of the Company’s portfolio of single-family residential mortgage loans (including residential construction loans) consisted of ARMs and (iii) $303.2 million or 33.9% of the Company’s portfolio of mortgage-backed securities were secured by ARMs.
Interest Rate Sensitivity Gap Analysis
The implementation of the foregoing asset and liability initiatives and strategies, combined with other external factors such as demand for the Company’s products and economic and interest rate environments in general, has resulted in the Company historically being able to maintain a one-year interest rate sensitivity gap ranging between 0.0% of total assets to a negative 20.0% of total assets. The one-year interest rate sensitivity gap is defined as the difference between the Company’s interest-earning assets, which are scheduled to mature or reprice within one year and its interest-bearing liabilities, which are scheduled to mature or reprice within one year. At December 31, 2007, the Company’s interest-earning assets maturing or repricing within one year totaled $478.4 million while the Company’s interest-bearing liabilities maturing or repricing within one-year totaled $890.8 million, providing a deficiency of interest-earning assets over interest-bearing liabilities of $412.4 million or a negative 21.9% of total assets. At December 31, 2007, the percentage of the Company’s assets to liabilities maturing or repricing within one year was 53.7%. The Company strives to maintain its one-year interest rate sensitivity gap between a range of 0.0% and a negative 20.0% of total assets.
| | | | |
| ESB Financial Corporation | | 23 | | 2007 Annual Report |
Management’s Discussion and Analysis of
Financial Condition and Results of Operations (continued)
The following table presents the amounts of interest-earning assets and interest-bearing liabilities outstanding as of December 31, 2007 which are expected to mature, prepay or reprice in each of the future time periods presented:
| | | | | | | | | | | | | | | | | | | | | | | |
(Dollar amounts in thousands) | | Due in
six months
or less | | | Due within
six months
to one year | | | Due within
one to
three years | | | Due within
three to
five years | | | Due in
over
five years | | | Total |
Total interest-earning assets | | $ | 324,392 | | | $ | 154,031 | | | $ | 501,909 | | | $ | 280,480 | | | $ | 466,732 | | | $ | 1,727,544 |
Total interest-bearing liabilities | | | 683,886 | | | | 206,892 | | | | 615,608 | | | | 75,904 | | | | 134,791 | | | | 1,717,081 |
| | | | | | | | | | | | | | | | | | | | | | | |
Maturity or repricing gap during the period | | $ | (359,494 | ) | | $ | (52,861 | ) | | $ | (113,699 | ) | | $ | 204,576 | | | $ | 331,941 | | | $ | 10,463 |
| | | | | | | | | | | | | | | | | | | | | | | |
Cumulative gap | | $ | (359,494 | ) | | $ | (412,355 | ) | | $ | (526,054 | ) | | $ | (321,478 | ) | | $ | 10,463 | | | | |
| | | | | | | | | | | | | | | | | | | | | | | |
Ratio of gap during the period to total assets | | | (19.12 | %) | | | (2.81 | %) | | | (6.05 | %) | | | 10.88 | % | | | 17.65 | % | | | |
| | | | | | | | | | | | | | | | | | | | | | | |
Ratio of cumulative gap to total assets | | | (19.12 | %) | | | (21.93 | %) | | | (27.98 | %) | | | (17.10 | %) | | | 0.56 | % | | | |
| | | | | | | | | | | | | | | | | | | | | | | |
Total assets | | | | | | | | | | | | | | | | | | | | | | $ | 1,880,235 |
| | | | | | | | | | | | | | | | | | | | | | | |
The one-year interest rate sensitivity gap has been the most common industry standard used to measure an institution’s interest rate risk position. In recent years, in addition to utilizing interest rate sensitivity gap analysis, the Company has increased its emphasis on the utilization of interest rate sensitivity simulation analysis to evaluate and manage interest rate risk.
Interest Rate Sensitivity Simulation Analysis
The Company also utilizes income simulation modeling in measuring its interest rate risk and managing its interest rate sensitivity. The Asset and Liability Management Committee (ALCO) of the Company believes that simulation modeling enables the Company to more accurately evaluate and manage the possible effects on net interest income due to the exposure to changing market interest rates, the slope of the yield curve and different loan and mortgage-backed security prepayment and deposit decay assumptions under various interest rate scenarios.
As with gap analysis and earnings simulation modeling, assumptions about the timing and variability of cash flows are critical in economic value of equity (EVE) valuation analysis. Particularly important are the assumptions driving mortgage prepayments and the assumptions about expected attrition of the core deposit portfolios. These assumptions are based on the Company’s historical experience and industry standards and are applied consistently across the different rate risk measures.
The Company has established the following guidelines for assessing interest rate risk:
Net interest income simulation.Given a 200 basis point parallel and gradual increase or decrease in market interest rates, the Company strives to maintain the change in net interest income to no more than approximately 10% for a one-year period.
| | | | |
| ESB Financial Corporation | | 24 | | 2007 Annual Report |
Management’s Discussion and Analysis of
Financial Condition and Results of Operations (continued)
Economic Value of Equity (EVE).EVE is the net present value of the Company’s existing assets and liabilities. Given a 200 basis point immediate and permanent increase or decrease in market interest rates, the Company strives to maintain the EVE increase or decrease to no more than approximately 50% of stockholders equity.
The following table presents the simulated impact of a 100 basis point or 200 basis point upward or downward shift of market interest rates on net interest income, return on average equity, diluted earnings per share and the change in EVE. This analysis was done assuming that the interest-earning asset and interest-bearing liability levels at December 31, 2007 remained constant. The impact of the market rate movements was developed by simulating the effects of rates changing gradually over a one-year period from the December 31, 2007 levels for net interest income, return on average equity and diluted earnings per share. The impact of market rate movements was developed by simulating the effects of an immediate and permanent change in rates at December 31, 2007 for the change in EVE:
| | | | | | | | | | | | |
| | | Increase | | | Decrease | |
| | | +100
BP | | | +200
BP | | | -100
BP | | | -200
BP | |
Net interest income - increase (decrease) | | (1.24 | %) | | (2.91 | %) | | (0.48 | %) | | (4.43 | %) |
Return on average equity - increase (decrease) | | (2.24 | %) | | (5.83 | %) | | (1.05 | %) | | (9.12 | %) |
Diluted earnings per share - increase (decrease) | | (2.45 | %) | | (5.98 | %) | | (1.22 | %) | | (9.51 | %) |
EVE - increase (decrease) | | (25.19 | %) | | (56.52 | %) | | 9.15 | % | | 5.25 | % |
The following table presents the simulated impact of a 100 basis point or 200 basis point upward or downward shift of market interest rates on net interest income, return on average equity, diluted earnings per share and the change in EVE. This analysis was done assuming that the interest-earning asset and interest-bearing liability levels at December 31, 2006 remained constant. The impact of the market rate movements was developed by simulating the effects of rates changing gradually over a one-year period from the December 31, 2006 levels for net interest income, return on average equity and diluted earnings per share. The impact of market rate movements was developed by simulating the effects of an immediate and permanent change in rates at December 31, 2006 for the change in EVE:
| | | | | | | | | | | | |
| | | Increase | | | Decrease | |
| | | +100
BP | | | +200
BP | | | -100
BP | | | -200
BP | |
Net interest income - increase (decrease) | | 0.17 | % | | (0.08 | %) | | (1.81 | %) | | (3.98 | %) |
Return on average equity - increase (decrease) | | (0.03 | %) | | (0.62 | %) | | (4.24 | %) | | (9.16 | %) |
Diluted earnings per share - increase (decrease) | | 0.00 | % | | (0.55 | %) | | (4.40 | %) | | (9.37 | %) |
EVE - increase (decrease) | | (27.69 | %) | | (59.06 | %) | | 9.57 | % | | (3.09 | %) |
Liquidity and Capital Resources
The Company’s goal in liquidity management is to ensure that sufficient cash flow exists to address deposit fluctuation, loan demand and debt service requirements. Liquidity is the availability of funds, or assurance that funds will be available, to honor all cash outflow commitments as they come due. These commitments are generally met through cash inflows. The Company’s primary sources of funds generally have been deposits obtained through the offices of the Bank, borrowings from the FHLB, repurchase agreement borrowings and amortization and prepayments of outstanding loans and maturing investment securities. While payments of principal and interest on loans and other investments are relatively predictable sources of funds, deposit flows are much less predictable since they are greatly influenced by the level of interest rates, the state of the economy,
| | | | |
| ESB Financial Corporation | | 25 | | 2007 Annual Report |
Management’s Discussion and Analysis of
Financial Condition and Results of Operations (continued)
competition and industry conditions. Liquidity risk is the risk of not being able to obtain funds at a reasonable price within a reasonable period of time to meet financial commitments when due. The Company measures its liquidity position on an ongoing basis and estimates how funding requirements are likely to evolve over time. Liquidity management is integral to other key elements such as capital adequacy, asset quality and profitability and is a fundamental component in the safe and sound management of the Company. The Company supports the process of liquidity planning by assessing potential future liquidity needs and taking into account various possible changes in economic, market, political, regulatory and other external or internal conditions. Such planning involves identifying known, expected and potential cash outflows and weighing alternative business management strategies to ensure adequate cash inflows. The Board of Directors has approved a Liquidity Policy and has designated the ALCO to oversee compliance of this policy. The ALCO has assigned responsibility of the management and supervision of the overall liquidity to the Investment Committee.
Net cash provided by operating activities totaled $12.7 million for the year ended December 31, 2007. Net cash provided by operating activities was primarily comprised of net income of $7.7 million and depreciation for premises and equipment, provision for loan losses, amortization of premiums, proceeds from sale of loans available for sale, amortization of intangible assets and compensation expense on ESOP and MRP of $1.0 million, $865,000, $1.9 million, $390,000, $715,000 and $965,000, respectively, partially offset by a decrease in accrued expenses and other liabilities of $1.6 million.
Funds provided by investing activities totaled $49.2 million during the year ended December 31, 2007. Primary sources of funds during the period included repayments of loans and securities of $114.1 million and $165.1 million, respectively, proceeds from the sale of securities of $77.0 million and proceeds from real estate held for investment of $12.3 million. These sources were offset by uses of $148.9 million for loan originations and purchases, $150.3 million for purchases of securities and $21.7 million for funding of real estate held for investment.
Funds used by financing activities totaled $65.4 million for the year ended December 31, 2007. The primary uses of funds were for repayments of long and short term borrowings, fund dividends paid and purchase treasury stock of $230.9 million, $95.9 million, $5.1 million and $5.4 million, respectively. The primary sources of funds included proceeds from long-term borrowings of $252.3 million and an increase in deposits of $19.2 million. Included in the repayment of long-tem debt is approximately $945,000 of principal payments on the loan for the Company’s leveraged ESOP.
At December 31, 2007, the total approved loan commitments outstanding amounted to $39.2 million. At the same date, commitments under unused lines of credit and credit card lines amounted to $69.3 million and the unadvanced portion of construction loans approximated $11.7 million. Certificates of deposit scheduled to mature in one year or less at December 31, 2007 totaled $439.0 million.
Historically, the Company used its sources of funds primarily to meet its ongoing commitments to pay maturing savings certificates and savings withdrawals, fund loan commitments and maintain a substantial portfolio of investment securities. The Company has been able to generate sufficient cash through the retail deposit market, its traditional funding source, and through FHLB advances and other borrowings, to provide the cash utilized in investing activities. Management believes that the Company currently has adequate liquidity available to respond to liquidity demands.
| | | | |
| ESB Financial Corporation | | 26 | | 2007 Annual Report |
Management’s Discussion and Analysis of
Financial Condition and Results of Operations (continued)
The Company’s contractual obligations at December 31, 2007 are as follows:
| | | | | | | | | | | | | | | |
| | | Payment due by period |
(Dollar amounts in thousands) Contractual Obligations | | Total | | Less than
1 year | | 1-3 Years | | 3-5 Years | | More than
5 years |
Long-term debt obligations (1) | | $ | 819,784 | | $ | 282,015 | | $ | 458,640 | | $ | 2,564 | | $ | 76,565 |
Time deposits (1) | | | 242,581 | | | 114,994 | | | 120,580 | | | 5,796 | | | 1,211 |
Operating lease obligations | | | 372 | | | 160 | | | 212 | | | — | | | — |
Supplemental executive retirement plan | | | 3,412 | | | 45 | | | 170 | | | 170 | | | 3,027 |
Directors’ retirement plan | | | 951 | | | 87 | | | 221 | | | 290 | | | 353 |
| | | | | | | | | | | | | | | |
Total Contractual Obligations | | $ | 1,067,100 | | $ | 397,301 | | $ | 579,823 | | $ | 8,820 | | $ | 81,156 |
| | | | | | | | | | | | | | | |
The sources of liquidity and capital resources discussed above are believed by management to be sufficient to fund outstanding loan commitments and meet other obligations.
Current regulatory requirements specify that ESB and similar institutions must maintain, tier one leverage capital equal to 3.0% of adjusted total assets and total capital equal to 8.0% of risk-weighted assets. The Office of the Comptroller of the Currency and the FDIC have adopted more stringent core capital requirements which require that all banks, except for the most highly rated banks, have at least an additional 100 to 200 basis points over those levels to be considered well capitalized. Therefore, an absolute minimum leverage ratio of not less than 4.0% must be maintained by those banks that are not highly rated or that are anticipating or experiencing significant growth. The FDIC reserves the right to apply this higher standard to any insured financial institution when considering an institution’s capital adequacy. At December 31, 2007, ESB was in compliance with all regulatory capital requirements with tier one leverage capital and risk-based capital ratios of 7.3% and 15.0%, respectively.
Impact of Inflation and Changing Prices
The consolidated financial statements of the Company and related notes presented herein have been prepared in accordance with U.S. generally accepted accounting principles which require the measurement of financial condition and operating results in terms of historical dollars, without considering changes in the relative purchasing power of money over time due to inflation.
Unlike most industrial companies, substantially all of the assets and liabilities of a financial institution are monetary in nature. As a result, interest rates have a more significant impact on a financial institution’s performance than the effects of general levels of inflation. Interest rates do not necessarily move in the same direction or in the same magnitude as the prices of goods and services since such prices are affected by inflation to a larger degree than interest rates. In the current interest rate environment, liquidity and the maturity structure of the Company’s assets and liabilities are critical to the maintenance of acceptable performance levels.
Recent Accounting and Regulatory Pronouncements
The Company’s discussion of recent accounting and regulatory pronouncements can be found in Note 1 of the Company’s consolidated financial statements.
| | | | |
| ESB Financial Corporation | | 27 | | 2007 Annual Report |
Consolidated Statements of Financial Condition
(Dollar amounts in thousands, except share data)
| | | | | | | | |
| | | December 31, | |
| | | 2007 | | | 2006 | |
| Assets | | | | | | | | |
Cash on hand and in banks | | $ | 5,229 | | | $ | 4,777 | |
Interest-earning deposits | | | 13,795 | | | | 17,811 | |
Federal funds sold | | | 234 | | | | 113 | |
| | | | | | | | |
Cash and cash equivalents | | | 19,258 | | | | 22,701 | |
Securities available for sale; cost of $1,058,538 and $1,150,555 | | | 1,059,972 | | | | 1,143,924 | |
Loans receivable, net of allowance for loan losses of $5,414 and $5,113 | | | 624,251 | | | | 589,642 | |
Loans held for sale | | | — | | | | 190 | |
Accrued interest receivable | | | 9,639 | | | | 9,871 | |
Federal Home Loan Bank (FHLB) stock | | | 31,450 | | | | 34,343 | |
Premises and equipment, net | | | 11,945 | | | | 11,229 | |
Real estate acquired through foreclosure, net | | | 1,692 | | | | 1,083 | |
Real estate held for investment | | | 36,318 | | | | 19,902 | |
Goodwill | | | 41,599 | | | | 41,599 | |
Intangible assets | | | 2,485 | | | | 3,231 | |
Bank owned life insurance | | | 27,998 | | | | 27,525 | |
Prepaid expenses and other assets | | | 13,628 | | | | 17,482 | |
| | | | | | | | |
Total assets | | $ | 1,880,235 | | | $ | 1,922,722 | |
| | | | | | | | |
| Liabilities and Stockholders’ Equity | | | | | | | | |
Liabilities: | | | | | | | | |
Deposits | | $ | 842,854 | | | $ | 823,644 | |
FHLB advances | | | 628,666 | | | | 698,232 | |
Repurchase agreements | | | 182,000 | | | | 187,000 | |
Other borrowings | | | 14,542 | | | | 14,477 | |
Junior subordinated notes | | | 51,519 | | | | 51,444 | |
Advance payments by borrowers for taxes and insurance | | | 2,579 | | | | 2,427 | |
Accrued expenses and other liabilities | | | 12,550 | | | | 13,506 | |
Accounts payable for land development | | | 12,680 | | | | 3,457 | |
| | | | | | | | |
Total liabilities | | | 1,747,390 | | | | 1,794,187 | |
| | | | | | | | |
Stockholders’ Equity: | | | | | | | | |
Preferred stock, $.01 par value, 5,000,000 shares authorized; none issued | | | — | | | | — | |
Common stock, $.01 par value, 30,000,000 shares authorized; | | | | | | | | |
13,806,812 and 13,806,812 shares issued; | | | | | | | | |
12,407,064 and 12,852,705 shares outstanding | | | 138 | | | | 138 | |
Additional paid-in capital | | | 101,020 | | | | 100,847 | |
Treasury stock, at cost; 1,399,748 and 954,107 shares | | | (16,688 | ) | | | (12,126 | ) |
Unearned Employee Stock Ownership Plan (ESOP) shares | | | (2,571 | ) | | | (3,512 | ) |
Unvested shares held by Management Recognition Plan (MRP) | | | (136 | ) | | | (186 | ) |
Retained earnings | | | 50,818 | | | | 48,626 | |
Accumulated other comprehensive income (loss), net | | | 264 | | | | (5,252 | ) |
| | | | | | | | |
Total stockholders’ equity | | | 132,845 | | | | 128,535 | |
| | | | | | | | |
Total liabilities and stockholders’ equity | | $ | 1,880,235 | | | $ | 1,922,722 | |
| | | | | | | | |
See accompanying notes to consolidated financial statements.
| | | | |
| ESB Financial Corporation | | 28 | | 2007 Annual Report |
Consolidated Statements of Operations
(Dollar amounts in thousands, except share data)
| | | | | | | | | | | |
| | | Year ended December 31, | |
| | | 2007 | | | 2006 | | 2005 | |
Interest income: | | | | | | | | | | | |
Loans receivable | | $ | 38,268 | | | $ | 35,229 | | $ | 29,440 | |
Taxable securities available for sale | | | 51,938 | | | | 51,852 | | | 44,164 | |
Tax-exempt securities available for sale | | | 4,927 | | | | 5,328 | | | 5,605 | |
FHLB stock | | | 1,987 | | | | 1,714 | | | 914 | |
Interest-earning deposits and federal funds sold | | | 464 | | | | 348 | | | 230 | |
| | | | | | | | | | | |
Total interest income | | | 97,584 | | | | 94,471 | | | 80,353 | |
| | | | | | | | | | | |
Interest expense: | | | | | | | | | | | |
Deposits | | | 27,706 | | | | 23,352 | | | 17,246 | |
FHLB advances and repurchase agreements | | | 41,421 | | | | 39,026 | | | 29,625 | |
Junior subordinated notes | | | 3,474 | | | | 3,426 | | | 2,952 | |
| | | | | | | | | | | |
Total interest expense | | | 72,601 | | | | 65,804 | | | 49,823 | |
| | | | | | | | | | | |
Net interest income | | | 24,983 | | | | 28,667 | | | 30,530 | |
Provision for loan losses | | | 865 | | | | 1,113 | | | 568 | |
| | | | | | | | | | | |
Net interest income after provision for loan losses | | | 24,118 | | | | 27,554 | | | 29,962 | |
| | | | | | | | | | | |
Noninterest income: | | | | | | | | | | | |
Fees and service charges | | | 3,787 | | | | 3,698 | | | 3,437 | |
Net gain on sale of loans | | | 7 | | | | 186 | | | 19 | |
Increase of cash surrender value of bank owned life insurance | | | 1,104 | | | | 1,007 | | | 932 | |
Net realized gain (loss) on sale of securities available for sale | | | 594 | | | | 480 | | | (2,909 | ) |
Net realized loss on sale of derivatives | | | (690 | ) | | | — | | | — | |
Income from real estate joint ventures | | | 1,827 | | | | 1,902 | | | 1,064 | |
Other | | | 587 | | | | 513 | | | 599 | |
| | | | | | | | | | | |
Total noninterest income | | | 7,216 | | | | 7,786 | | | 3,142 | |
| | | | | | | | | | | |
Noninterest expense: | | | | | | | | | | | |
Compensation and employee benefits | | | 13,236 | | | | 13,249 | | | 12,727 | |
Premises and equipment | | | 2,465 | | | | 2,443 | | | 2,564 | |
Data processing | | | 1,906 | | | | 1,736 | | | 1,913 | |
Amortization of intangible assets | | | 715 | | | | 832 | | | 854 | |
Minority interest | | | 606 | | | | 637 | | | 303 | |
Advertising | | | 424 | | | | 450 | | | 468 | |
Other | | | 3,921 | | | | 4,060 | | | 4,286 | |
| | | | | | | | | | | |
Total noninterest expense | | | 23,273 | | | | 23,407 | | | 23,115 | |
| | | | | | | | | | | |
Income before provision for income taxes | | | 8,061 | | | | 11,933 | | | 9,989 | |
Provision for income taxes | | | 400 | | | | 1,317 | | | 810 | |
| | | | | | | | | | | |
Net income | | $ | 7,661 | | | $ | 10,616 | | $ | 9,179 | |
| | | | | | | | | | | |
Net income per share: | | | | | | | | | | | |
Basic | | $ | 0.62 | | | $ | 0.84 | | $ | 0.73 | |
Diluted | | $ | 0.61 | | | $ | 0.83 | | $ | 0.71 | |
Cash dividends declared per share | | $ | 0.40 | | | $ | 0.40 | | $ | 0.40 | |
Weighted average shares outstanding | | | 12,403,495 | | | | 12,670,216 | | | 12,598,842 | |
Weighted average shares and share equivalents outstanding | | | 12,529,668 | | | | 12,849,602 | | | 12,853,836 | |
See accompanying notes to consolidated financial statements.
| | | | |
| ESB Financial Corporation | | 29 | | 2007 Annual Report |
Consolidated Statements of Changes in Stockholders’ Equity
(Dollar amounts in thousands, except share data)
| | | | | | | | | | | | | | | | | | | | | | | | | | | | | | | |
| | | Common
stock | | Additional
paid-in
capital | | | Treasury
stock | | | Unearned
ESOP
shares | | | Unvested
MRP
shares | | | Retained
earnings | | | Accumulated other
comprehensive
income (loss), net
of tax | | | Total
stockholders’
equity | |
Balance at January 1, 2005 | | $ | 109 | | $ | 60,940 | | | $ | (3,394 | ) | | $ | (5,518 | ) | | $ | (332 | ) | | $ | 40,408 | | | $ | 5,588 | | | $ | 97,801 | |
Comprehensive results: | | | | | | | | | | | | | | | | | | | | | | | | | | | | | | | |
Net income | | | — | | | — | | | | — | | | | — | | | | — | | | | 9,179 | | | | — | | | | 9,179 | |
Other comprehensive results, net | | | — | | | — | | | | — | | | | — | | | | — | | | | — | | | | (11,218 | ) | | | (11,218 | ) |
Reclassification adjustment | | | — | | | — | | | | — | | | | — | | | | — | | | | — | | | | 365 | | | | 365 | |
| | | | | | | | | | | | | | | | | | | | | | | | | | | | | | | |
Total comprehensive results | | | — | | | — | | | | — | | | | — | | | | — | | | | 9,179 | | | | (10,853 | ) | | | (1,674 | ) |
Common stock issued as a result of the acquisition of PHSB. | | | 29 | | | 39,473 | | | | — | | | | — | | | | — | | | | — | | | | — | | | | 39,502 | |
Cash dividends at $0.40 per share | | | — | | | — | | | | — | | | | — | | | | — | | | | (5,164 | ) | | | — | | | | (5,164 | ) |
Purchase of treasury stock, at cost (400,031 shares) | | | — | | | — | | | | (5,302 | ) | | | — | | | | — | | | | — | | | | — | | | | (5,302 | ) |
Reissuance of treasury stock for stock option exercises | | | — | | | — | | | | 1,262 | | | | — | | | | — | | | | (944 | ) | | | — | | | | 318 | |
Compensation expense on ESOP | | | — | | | 170 | | | | — | | | | 1,024 | | | | — | | | | — | | | | — | | | | 1,194 | |
Tax effect of compensatory stock options | | | — | | | 98 | | | | — | | | | — | | | | — | | | | — | | | | — | | | | 98 | |
Issuance of MRP shares | | | — | | | 9 | | | | — | | | | — | | | | (9 | ) | | | — | | | | — | | | | — | |
Accrued compensation expense MRP | | | — | | | — | | | | — | | | | — | | | | 104 | | | | — | | | | — | | | | 104 | |
| | | | | | | | | | | | | | | | | | | | | | | | | | | | | | | |
Balance at December 31, 2005 | | | 138 | | | 100,690 | | | | (7,434 | ) | | | (4,494 | ) | | | (237 | ) | | | 43,479 | | | | (5,265 | ) | | | 126,877 | |
| | | | | | | | |
Comprehensive results: | | | | | | | | | | | | | | | | | | | | | | | | | | | | | | | |
Net income | | | — | | | — | | | | — | | | | — | | | | — | | | | 10,616 | | | | — | | | | 10,616 | |
Other comprehensive results, net | | | — | | | — | | | | — | | | | — | | | | — | | | | — | | | | 736 | | | | 736 | |
Reclassification adjustment | | | — | | | — | | | | — | | | | — | | | | — | | | | — | | | | (163 | ) | | | (163 | ) |
| | | | | | | | | | | | | | | | | | | | | | | | | | | | | | | |
Total comprehensive results | | | — | | | — | | | | — | | | | — | | | | — | | | | 10,616 | | | | 573 | | | | 11,189 | |
Cumulative effect of change in accounting for post-retirement benefits, net of taxes of $288 | | | — | | | — | | | | — | | | | — | | | | — | | | | — | | | | (560 | ) | | | (560 | ) |
Cash dividends at $0.40 per share | | | — | | | — | | | | — | | | | — | | | | — | | | | (5,027 | ) | | | — | | | | (5,027 | ) |
Purchase of treasury stock, at cost (441,395 shares) | | | — | | | — | | | | (5,311 | ) | | | — | | | | — | | | | — | | | | — | | | | (5,311 | ) |
Reissuance of treasury stock for stock option exercises | | | — | | | — | | | | 619 | | | | — | | | | — | | | | (442 | ) | | | — | | | | 177 | |
Compensation expense on ESOP | | | — | | | 54 | | | | — | | | | 982 | | | | — | | | | — | | | | — | | | | 1,036 | |
Tax effect of compensatory stock options | | | — | | | 45 | | | | — | | | | — | | | | — | | | | — | | | | — | | | | 45 | |
Effect of compensation expense for stock options | | | — | | | 61 | | | | — | | | | — | | | | — | | | | — | | | | — | | | | 61 | |
Forfeitures of MRP shares | | | — | | | (3 | ) | | | — | | | | — | | | | 3 | | | | — | | | | — | | | | — | |
Accrued compensation expense MRP | | | — | | | — | | | | — | | | | — | | | | 48 | | | | — | | | | — | | | | 48 | |
| | | | | | | | | | | | | | | | | | | | | | | | | | | | | | | |
Balance at December 31, 2006 | | | 138 | | | 100,847 | | | | (12,126 | ) | | | (3,512 | ) | | | (186 | ) | | | 48,626 | | | | (5,252 | ) | | | 128,535 | |
| | | | | | | | |
Comprehensive results: | | | | | | | | | | | | | | | | | | | | | | | | | | | | | | | |
Net income | | | — | | | — | | | | — | | | | — | | | | — | | | | 7,661 | | | | — | | | | 7,661 | |
Other comprehensive results, net | | | — | | | — | | | | — | | | | — | | | | — | | | | — | | | | 5,908 | | | | 5,908 | |
Reclassification adjustment | | | — | | | — | | | | — | | | | — | | | | — | | | | — | | | | (392 | ) | | | (392 | ) |
| | | | | | | | | | | | | | | | | | | | | | | | | | | | | | | |
Total comprehensive results | | | — | | | — | | | | — | | | | — | | | | — | | | | 7,661 | | | | 5,516 | | | | 13,177 | |
Cash dividends at $0.40 per share | | | — | | | — | | | | — | | | | — | | | | — | | | | (4,946 | ) | | | — | | | | (4,946 | ) |
Purchase of treasury stock, at cost (508,834 shares) | | | — | | | — | | | | (5,374 | ) | | | — | | | | — | | | | — | | | | — | | | | (5,374 | ) |
Reissuance of treasury stock for stock option exercises | | | — | | | — | | | | 812 | | | | — | | | | — | | | | (523 | ) | | | — | | | | 289 | |
Compensation expense on ESOP | | | — | | | (26 | ) | | | — | | | | 941 | | | | — | | | | — | | | | — | | | | 915 | |
Tax effect of compensatory stock options | | | — | | | 97 | | | | — | | | | — | | | | — | | | | — | | | | — | | | | 97 | |
Effect of compensation expense for stock options | | | — | | | 102 | | | | — | | | | — | | | | — | | | | — | | | | — | | | | 102 | |
Accrued compensation expense MRP | | | — | | | — | | | | — | | | | — | | | | 50 | | | | — | | | | — | | | | 50 | |
| | | | | | | | | | | | | | | | | | | | | | | | | | | | | | | |
Balance at December 31, 2007 | | $ | 138 | | $ | 101,020 | | | $ | (16,688 | ) | | $ | (2,571 | ) | | $ | (136 | ) | | $ | 50,818 | | | $ | 264 | | | $ | 132,845 | |
| | | | | | | | | | | | | | | | | | | | | | | | | | | | | | | |
See accompanying notes to consolidated financial statements.
| | | | |
| ESB Financial Corporation | | 30 | | 2007 Annual Report |
Consolidated Statements of Cash Flows
(Dollar amounts in thousands)
| | | | | | | | | | | | |
| | | Year ended December 31, | |
| | | 2007 | | | 2006 | | | 2005 | |
Operating activities: | | | | | | | | | | | | |
Net income | | $ | 7,661 | | | $ | 10,616 | | | $ | 9,179 | |
Adjustments to reconcile net income to net cash provided by operating activities: | | | | | | | | | | | | |
Depreciation for premises and equipment | | | 1,027 | | | | 1,036 | | | | 1,221 | |
Provision for loan losses | | | 865 | | | | 1,113 | | | | 568 | |
Amortization of premiums | | | 1,885 | | | | 2,248 | | | | 3,767 | |
Origination of loans held for sale | | | (193 | ) | | | (573 | ) | | | (1,319 | ) |
Proceeds from sale of loans available for sale | | | 390 | | | | 392 | | | | 1,338 | |
(Gain) loss on sale of securities available for sale | | | (594 | ) | | | (480 | ) | | | 2,909 | |
Gain on sale of loans available for sale | | | (7 | ) | | | (9 | ) | | | (19 | ) |
Loss on sale of derivatives | | | 690 | | | | — | | | | — | |
Amortization of intangible assets | | | 715 | | | | 868 | | | | 872 | |
Compensation expense on ESOP and MRP | | | 965 | | | | 1,084 | | | | 1,271 | |
Compensation expense on stock options | | | 102 | | | | 61 | | | | — | |
Increases in Bank Owned Life Insurance | | | (838 | ) | | | (1,007 | ) | | | (694 | ) |
Decrease (increase) in accrued interest receivable | | | 232 | | | | (181 | ) | | | (1,847 | ) |
Decrease (increase) in prepaid expenses and other assets | | | 1,336 | | | | (849 | ) | | | 4,449 | |
Decrease in accrued expenses and other liabilities | | | (1,646 | ) | | | (2,925 | ) | | | (1,512 | ) |
Other | | | 104 | | | | 708 | | | | 541 | |
| | | | | | | | | | | | |
Net cash provided by operating activities | | | 12,694 | | | | 12,102 | | | | 20,724 | |
| | | | | | | | | | | | |
Investing activities: | | | | | | | | | | | | |
Loan originations and purchases | | | (148,932 | ) | | | (184,164 | ) | | | (206,820 | ) |
Purchases of: | | | | | | | | | | | | |
Securities available for sale | | | (150,282 | ) | | | (285,810 | ) | | | (493,903 | ) |
FHLB stock | | | (9,201 | ) | | | (9,579 | ) | | | — | |
Premises and equipment | | | (1,758 | ) | | | (1,271 | ) | | | (438 | ) |
Principal repayments of: | | | | | | | | | | | | |
Loans receivable | | | 114,107 | | | | 129,261 | | | | 157,125 | |
Securities available for sale | | | 165,098 | | | | 184,660 | | | | 218,846 | |
Proceeds from the sale of: | | | | | | | | | | | | |
Securities available for sale | | | 76,973 | | | | 73,900 | | | | 212,831 | |
Loans available for sale | | | — | | | | 2,228 | | | | — | |
Real Estate acquired through foreclosure | | | 157 | | | | 1,156 | | | | 127 | |
Premises and equipment | | | — | | | | 94 | | | | 1,459 | |
Proceeds from Bank Owned Life Insurance | | | 365 | | | | — | | | | — | |
Redemption of FHLB stock | | | 12,094 | | | | 8,145 | | | | 1,880 | |
Payment for purchase of PHSB, net of cash acquired | | | — | | | | — | | | | (16,338 | ) |
Funding of real estate held for investment | | | (21,708 | ) | | | (8,174 | ) | | | (29,867 | ) |
Proceeds from real estate held for investment | | | 12,326 | | | | 11,313 | | | | 23,189 | |
| | | | | | | | | | | | |
Net cash provided by (used in) investing activities | | | 49,239 | | | | (78,241 | ) | | | (131,909 | ) |
| | | | | | | | | | | | |
Financing activities: | | | | | | | | | | | | |
Net increase (decrease) in deposits | | | 19,210 | | | | (10,886 | ) | | | 10,624 | |
Proceeds from long-term borrowings | | | 252,328 | | | | 301,570 | | | | 290,140 | |
Repayments of long-term borrowings | | | (230,945 | ) | | | (209,823 | ) | | | (146,830 | ) |
Net decrease in short-term borrowings | | | (95,884 | ) | | | (9,911 | ) | | | (58,254 | ) |
Issuance of junior subordinated notes | | | — | | | | — | | | | 36,083 | |
Proceeds received from exercise of stock options | | | 386 | | | | 222 | | | | 318 | |
Dividends paid | | | (5,097 | ) | | | (5,236 | ) | | | (5,082 | ) |
Payments to acquire treasury stock | | | (5,374 | ) | | | (5,311 | ) | | | (5,302 | ) |
| | | | | | | | | | | | |
Net cash (used in) provided by financing activities | | | (65,376 | ) | | | 60,625 | | | | 121,697 | |
| | | | | | | | | | | | |
Net (decrease) increase in cash and cash equivalents | | | (3,443 | ) | | | (5,514 | ) | | | 10,512 | |
Cash and cash equivalents at beginning of period | | | 22,701 | | | | 28,215 | | | | 17,703 | |
| | | | | | | | | | | | |
Cash and cash equivalents at end of period | | $ | 19,258 | | | $ | 22,701 | | | $ | 28,215 | |
| | | | | | | | | | | | |
Continued
| | | | |
| ESB Financial Corporation | | 31 | | 2007 Annual Report |
Consolidated Statements of Cash Flows
(Dollar amounts in thousands)
| | | | | | | | | | |
| | | Year ended December 31, | |
| | | 2007 | | 2006 | | 2005 | |
Supplemental information: | | | | | | | | | | |
| | | |
Interest paid | | $ | 73,020 | | $ | 64,968 | | $ | 52,255 | |
Income taxes paid | | | 1,507 | | | 1,997 | | | 1,863 | |
| | | |
Supplemental schedule of non-cash investing and financing activities: | | | | | | | | | | |
Transfers from loans receivable to real estate acquired through foreclosure | | | 477 | | | 1,222 | | | 118 | |
Dividends declared but not paid | | | 1,255 | | | 1,253 | | | 1,325 | |
| | | |
The Company purchased all of the common stock of PHSB for $79.7 million. In conjunction with the acquisition, the assets acquired and liabilities assumed were as follows: | | | | | | | | | | |
Fair value of assets acquired | | $ | — | | $ | — | | $ | 338,146 | |
Stock issued for the purchase of PHSB common stock | | | — | | | — | | | (39,502 | ) |
Cash paid for PHSB common stock | | | — | | | — | | | (40,238 | ) |
Liabilities assumed | | | — | | | — | | | (292,878 | ) |
| | | | | | | | | | |
| | $ | — | | $ | — | | $ | (34,472 | ) |
| | | | | | | | | | |
See accompanying notes to consolidated financial statements.
| | | | |
| ESB Financial Corporation | | 32 | | 2007 Annual Report |
Notes to Consolidated Financial Statements
| 1. | Summary of Significant Accounting Policies |
Principles of Consolidation
ESB Financial Corporation (the Company) is a publicly traded Pennsylvania thrift holding company. The consolidated financial statements include the accounts of the Company and its direct and indirect wholly owned subsidiaries, ESB Bank (ESB or the Bank), PennFirst Financial Services, Inc., THF, Inc. (THF), AMSCO, Inc. (AMSCO) and ESB Financial Services, Inc. ESB is a Pennsylvania chartered Federal Deposit Insurance Corporation (FDIC) insured stock savings bank.
AMSCO is engaged in real estate development and construction of 1- 4 family residential units independently or in conjunction with its joint ventures. The Bank has provided all development and construction financing. The joint ventures which are 51% owned or greater by AMSCO have been included in the consolidated financial statements and are reflected within other noninterest income or expense. The Bank’s loans to AMSCO and related interest have been eliminated in consolidation.
In addition to the elimination of the loans and interest to the joint ventures described above, all other significant intercompany transactions and balances have been eliminated in consolidation.
Basis of Presentation
The preparation of financial statements in conformity with U.S. generally accepted accounting principles requires management to make some estimates and assumptions that affect the reported amounts in the consolidated financial statements and accompanying notes. Actual results could differ from those estimates. Certain amounts previously reported have been reclassified to conform to the current year financial statement presentation. The reclassification had no effect on net income.
Operating Segments
An operating segment is defined as a component of an enterprise that engages in business activities that generate revenue and incur expense, the operating results of which are reviewed by management and for which discrete financial information is available. At December 31, 2007, the Company was doing business through 23 full service banking branches, one loan production office, and its various other subsidiaries. Loans and deposits are primarily generated from the areas where banking branches are located. The Company derives its income predominantly from interest on loans and securities and to a lesser extent, noninterest income. The Company’s principal expenses are interest paid on deposits and borrowed funds and normal operating costs. The Company’s operations are principally in the savings and loan industry. Consistent with internal reporting, the Company’s operations are reported in one operating segment, which is community banking.
Cash Equivalents
Cash equivalents include cash on hand and in banks, interest-earning deposits with original maturities of 90 days or less and federal funds sold. The Board of Governors of the Federal Reserve System imposes certain reserve requirements on all depository institutions. These reserves are maintained in the form of vault cash or as a noninterest bearing balance with the Federal Reserve Bank. Required reserves at the Federal Reserve Bank averaged $626,000 and $2.5 million during the year 2007 and 2006, respectively.
| | | | |
| ESB Financial Corporation | | 33 | | 2007 Annual Report |
Notes to Consolidated Financial Statements (continued)
Securities Available for Sale and Held for Maturity
Securities include investments primarily in bonds, notes and to a lesser extent equity securities and are classified as either available for sale or held to maturity at the time of purchase based on management’s intent. Such intent includes consideration of the interest rate environment, prepayment risk, credit risk, maturity and repricing characteristics, liquidity considerations, investment and asset/liability management policies and other pertinent factors. Unrealized holding gains and losses, net of applicable income taxes, on available for sale securities are reported as accumulated other comprehensive income until realized. Gains and losses on the sale of securities are determined using the specific identification method and are included in operations in the period sold.
Declines in the fair value of equity securities below their cost that are determined to be other than temporary result in the security being written down to fair value on an individual basis. Any related write-downs are included in operations as realized losses.
Declines in the fair value of marketable debt securities that are determined to be other than temporary due to a decline in the credit of the issuer are written down to fair value accordingly, with a resulting charge to realized loss and an adjustment to the cost basis of the security. With respect to the other-than-temporary impairments of marketable debt securities where the decline in the market value is solely attributable to an increase in market interest rates, this would not trigger an other-than-temporary impairment charge if the Company has the intent and ability to hold the debt security until recovery. At each reporting date, management will re-challenge their intent and ability to hold such debt security until recovery and document the basis for this assertion. To the extent that market conditions have changed and management can no longer assert that they have the intent and ability to hold a debt security until the market value recovers, the Company will recognize an other-than-temporary impairment at that time.
Yields and carrying values for certain mortgage-backed securities are subject to normal interest rate and prepayment risks. Premiums and discounts on securities are recognized in interest income using the interest method over the period to maturity.
Loans Receivable
Loans receivable, for which management has the intent and the Company has the ability to hold for the foreseeable future or until maturity or payoff, are reported at their outstanding unpaid principal balances reduced by any charge-offs and net of any deferred fees or costs on loans originated, unamortized premiums or discounts on loans purchased and the allowance for loan losses.
Interest income on loans is accrued and credited to operations as earned. Interest income is not accrued for loans delinquent 90 days or greater. Interest on impaired loans is discontinued when, in management’s opinion, the borrower may be unable to meet contractual payments. When interest accrual is discontinued, all unpaid accrued interest is reversed. Interest receipts on nonaccrual and impaired loans are recognized as interest revenue or applied to principal when management believes the ultimate collectibility of principal is in doubt.
Discounts and premiums on purchased loans are recognized in interest income using the interest method over the remaining period to contractual maturity, adjusted for prepayments. Loan origination fees and certain direct origination costs are capitalized and recognized as an adjustment to the yield of the related loan over the loan’s period to maturity. Loans originated and intended for sale are carried at the lower of cost or estimated market value in the aggregate.
| | | | |
| ESB Financial Corporation | | 34 | | 2007 Annual Report |
Notes to Consolidated Financial Statements (continued)
Impaired loans are commercial and commercial real estate loans for which it is probable the Company will not be able to collect all amounts due according to the contractual terms of the loan agreement. The Company individually evaluates such loans for impairment and does not aggregate loans by major risk classifications. The definition of impaired loans is not the same as the definition of nonaccrual loans, although the two categories overlap. The Company may choose to place a loan on nonaccrual status due to payment delinquency or uncertain collectibility, while not classifying the loan as impaired. Factors considered by management in determining impairment include payment status and collateral value. The amount of impairment for these types of impaired loans is determined by the difference between the present value of the expected cash flows related to the loan, using current interest rates, and its recorded value, or, as a practical expedient in the case of collateralized loans, the difference between the fair value of the collateral and the recorded amount of the loans. When foreclosure is probable, impairment is measured based on the fair value of the collateral.
Mortgage loans on one-to four family properties and all consumer loans are large groups of smaller balance homogeneous loans and are measured for impairment collectively. Loans that experience insignificant payment delays, which are defined as less than 90 days, generally are not classified as impaired. Management determines the significance of payment delays on a case-by-case basis, taking into consideration all circumstances surrounding the loan and the borrower including the length of the delay, the borrower’s prior payment record and the amount of shortfall in relation to the principal and interest owed.
The allowance for loan losses is maintained at a level believed to be adequate by management to absorb probable losses inherent in the portfolio and is based on the size and current risk characteristics of the loan portfolio, an assessment of individual problem loans and actual loss experience, current economic events in specific industries and other pertinent factors such as regulatory guidance and general economic conditions. Determination of the allowance is inherently subjective as it requires significant estimates, including the amounts and timing of expected future cash flows on impaired loans, estimated losses on pools of homogeneous loans based on historical loss experience and consideration of current economic trends, all of which may be susceptible to significant change. Loan losses are charged off against the allowance, while recoveries of amounts previously charged off are credited to the allowance. A provision for loan losses is charged to operations based on management’s periodic evaluation of the factors previously mentioned, as well as other pertinent factors. Evaluations are conducted quarterly, during which loans may be charged off upon reaching various stages of delinquency and depending upon the loan type. The components of the allowance for loan losses represent an estimation pursuant to FAS No. 5, “Accounting for Contingencies” or FAS No. 114, “Accounting by Creditors for Impairment of a Loan”.
Real Estate Acquired Through Foreclosure
Real estate properties acquired through foreclosure are initially recorded at the lower of cost or fair value at the date of foreclosure, establishing a new cost basis. After foreclosure, management periodically performs valuations and the real estate is carried at the lower of cost or fair value less estimated costs to sell. Revenue and expenses from operations of the properties, gains and losses on sales and additions to the valuation allowance are included in operating results.
Premises and Equipment
Land is carried at cost. Premises, furniture and equipment, and leasehold improvements are carried at cost less accumulated depreciation or amortization. Depreciation is calculated on a straight-line basis over the estimated useful lives of the related assets, which are twenty-five to fifty years for buildings and three to ten years for furniture and equipment. Amortization of leasehold improvements is computed using the straight-line method over the term of the related lease.
| | | | |
| ESB Financial Corporation | | 35 | | 2007 Annual Report |
Notes to Consolidated Financial Statements (continued)
Goodwill and Intangible Assets
Goodwill consisted of $41.6 million at December 31, 2007 and 2006, respectively. The Company adopted the provisions of FAS No. 142, under which the Company ceased amortizing goodwill and instead evaluates goodwill for impairment. This impairment assessment is performed at least annually. The fair value of the Company and the implied fair value of goodwill at the respective reporting unit level were estimated as of October 31, 2007 using the market value approach, utilizing industry comparable information. The Company concluded that the recorded value of goodwill was not impaired as a result of the evaluation. Core deposit intangible was $2.5 million and $3.2 million at December 31, 2007 and 2006, respectively. The core deposit intangible assets are amortized on a sum of the year’s digit basis over the estimated useful life, generally up to ten years. Amortization of finite lived assets is expected to total, $601,000, $494,000, $413,000, $332,000, $251,000 and $264,000 for the years 2008, 2009, 2010, 2011, 2012 and thereafter, respectively.
Mortgage Servicing Assets
The servicing asset recorded in connection with the whole loan sale and securitization of a portion of the Company’s 1- 4 family residential mortgage loan portfolio during 2002 was $1.2 million. At December 31, 2007, the remaining balance and fair value of the servicing asset was $106,000, which is recorded in other assets. Servicing assets are amortized in proportion to, and over the period of, estimated net servicing revenues. Impairment of servicing assets is based on fair value of those assets, estimated using discounted cash flows and prepayment assumptions for the market area of the servicing portfolio. For purposes of measuring impairment, the servicing asset is stratified based on interest rate. The amount of impairment recognized is the amount by which the capitalized servicing asset for a stratum exceeds the fair value of that stratum. There was no impairment valuation at December 31, 2007 and 2006, respectively. The amortization taken on the servicing asset for the year ended December 31, 2007 and 2006 was $31,000 and $37,000, respectively. The Company had total loans serviced for others of $23.2 million, $25.2 million and $30.0 million at December 31, 2007, 2006 and 2005, respectively.
Income Taxes
Deferred tax assets and liabilities are reflected at currently enacted income tax rates applicable to the period in which the deferred tax assets or liabilities are expected to be realized or settled. As changes in tax laws or rates are enacted, deferred tax assets and liabilities are adjusted through the provision for income taxes.
Bank-Owned Life Insurance (BOLI)
The Company owns insurance on the lives of a certain group of key employees. The policies were purchased to help offset the increases in the costs of various fringe benefit plans including healthcare. The cash surrender value of these policies is included as an asset on the consolidated statements of financial condition, and any increases in cash surrender value are recorded as noninterest income on the consolidated statement of income. In the event of the death of an insured individual under these policies, the Company would receive a death benefit.
Financial Instruments
Statement of Financial Accounting Standards No. 133 (FAS No. 133),Accounting for Derivative Instruments and Hedging Activities, as amended and interpreted, establishes accounting and reporting standards for derivative instruments, including certain derivative instruments embedded in other contracts, and for hedging activities. As required by FAS No. 133, the Company records all derivatives on the consolidated statement of financial condition at fair value. The accounting for changes in the fair value of
| | | | |
| ESB Financial Corporation | | 36 | | 2007 Annual Report |
Notes to Consolidated Financial Statements (continued)
derivatives depends on the intended use of the derivative and the resulting designation. Derivatives used to hedge the exposure to changes in the fair value of an asset, liability, or firm commitment attributable to a particular risk, such as interest rate risk, are considered fair value hedges. Derivatives used to hedge the exposure to variability in expected future cash flows, or other types of forecasted transactions, are considered cash flow hedges.
For derivatives designated as fair value hedges, changes in the fair value of the derivative and the hedged item related to the hedged risk are recognized in earnings. For derivatives designated as cash flow hedges, the effective portion of changes in the fair value of the derivative is initially reported in other comprehensive income (outside of earnings) and subsequently reclassified to earnings when the hedged transaction affects earnings, and the ineffective portion of changes in the fair value of the derivative is recognized directly in earnings. The Company assesses the effectiveness of each hedging relationship by comparing the changes in fair value or cash flows of the derivative hedging instrument with the changes in fair value or cash flows of the designated hedged item or transaction. For derivatives not designated as hedges, changes in fair value are recognized in earnings.
In April 2007, the Company terminated its cash flow hedge by selling the interest rate caps and repaying the associated borrowings. The loss on the sale of the interest rate caps of approximately $690,000 was offset by gains of approximately $706,000 recognized on the sale of securities. The Company expects this transaction to positively impact the net interest margin over the next two to three years.
Stock-Based Compensation
In December 2004, the Financial Accounting Standards Board (FASB) issued No. 123R (FAS No. 123R),
Share-Based Paymentwhich revised FAS No. 123,Accounting for Stock-Based Compensation,and superseded Accounting Principles Bulletin (APB) Opinion No. 25,Accounting for Stock Issued to Employees (APB 25) and related interpretations. FAS No. 123R requires the grant-date fair value of all share-based payment awards that are expected to vest, including employee share options to be recognized as employee compensation expense over the requisite service period. The Company adopted FAS No. 123R on January 1, 2006 and applied the modified prospective transition method. Under this transition method, the Company (1) did not restate any prior periods and (2) are recognizing compensation expense for all share-based payment awards that were outstanding, but not yet vested, as of January 1, 2006, based upon the same estimated grant-date fair values and service periods used to prepare FAS No. 123 pro-forma disclosures.
Prior to adopting FAS No. 123R, the Company accounted for share-based payment awards using the intrinsic value method of APB 25 and related interpretations. Under APB 25, the Company did not record compensation expense for employee share options, unless the awards were modified, because the share options were granted with exercise prices equal to or greater that the fair value of our stock on the date of the grant. The following table illustrates the effect on reported net income and earnings per share applicable to common shareholders for the year ended December 31, 2005, had we accounted for our share-based compensation plans using the fair value method of FAS No. 123:
| | | | |
| ESB Financial Corporation | | 37 | | 2007 Annual Report |
Notes to Consolidated Financial Statements (continued)
| | | | |
(Dollar amounts in thousands, except share data) | | 2005 | |
Net income, as reported | | $ | 9,179 | |
Compensation expense, under FAS 123, net of tax | | | (194 | ) |
| | | | |
Net Income | | $ | 8,985 | |
Basic net income per share, as reported | | $ | 0.73 | |
Pro-Forma basic net income per share | | $ | 0.71 | |
| |
Diluted net income per share, as reported | | $ | 0.71 | |
Pro-Forma diluted net income per share | | $ | 0.70 | |
| | | | |
During the years ended December 31, 2007 and 2006, the Company recorded $102,000 and $61,000, respectively, in compensation expense and tax benefits of $11,000 and $7,000, respectively, related to our share-based compensation awards. As of December 31, 2007, there was approximately $160,000 of unrecognized compensation cost related to unvested share-based compensation awards granted in 2006. That cost is expected to be recognized over the next three years. Additionally, there was approximately $201,000 of unrecognized compensation cost related to unvested share-based compensation awards granted in 2007. That cost is expected to be recognized over the next four years.
FAS 123R requires that the cash flows from the tax benefits resulting from tax deductions in excess of the compensation cost recognized for stock-based awards (excess tax benefits) be classified as financing cash flows. Prior to the adoption of FAS 123R, such excess tax benefits were presented as operating cash flows. Accordingly, $97,000 and $45,000 in excess tax benefits has been classified as a financing cash inflow for the years ended December 31, 2007 and 2006 in the Consolidated Statement of Cash Flows. Such excess tax benefits amounted to $98,000 for the year ended December 31, 2005 and are included in operating cash flows.
For purposes of computing results, the Company estimated the fair values of stock options using the Black-Scholes option-pricing model. The model requires the use of subjective assumptions that can materially affect fair value estimates. Therefore, the pro forma results are estimates of results of operations as if compensation expense had been recognized for the stock option plans. The fair value of each option is amortized into compensation expense on a straight line basis between the grant date for the option and each vesting date. The fair value of each stock option granted was estimated using the following weighted-average assumptions:
| | | | | | | | | |
| | | 2007 | | | 2006 | | | 2005 | |
Assumptions | | | | | | | | | |
Volatility | | 35.80 | % | | 34.85 | % | | 22.00 | % |
Interest Rates | | 3.63 | % | | 4.70 | % | | 4.98 | % |
Dividend Yields | | 3.96 | % | | 3.72 | % | | 3.38 | % |
Weighted Average Life ( in years) | | 6.6 | | | 5.4 | | | 5.6 | |
| | | | | | | | | |
The weighted average fair value of each stock option granted for 2007, 2006 and 2005 was $2.69, $2.93 and $2.92, respectively. The total intrinsic value of options exercised during the years ended December 31, 2007, 2006 and 2005, was $281,000, $179,000 and $362,000, respectively
| | | | |
| ESB Financial Corporation | | 38 | | 2007 Annual Report |
Notes to Consolidated Financial Statements (continued)
Net Income Per Share
The following table summarizes the Company’s net income per share for the years ended December 31:
| | | | | | | | | |
(Amounts in thousands, except per share data) | | 2007 | | 2006 | | 2005 |
Net income | | $ | 7,661 | | $ | 10,616 | | $ | 9,179 |
Weighted-average common shares outstanding | | | 12,403 | | | 12,670 | | | 12,599 |
| | | | | | | | | |
Basic earnings per share | | $ | 0.62 | | $ | 0.84 | | $ | 0.73 |
| | | | | | | | | |
Weighted-average common shares outstanding | | | 12,403 | | | 12,670 | | | 12,599 |
Common stock equivalents due to effect of stock options | | | 127 | | | 180 | | | 255 |
| | | | | | | | | |
Total weighted-average common shares and equivalents | | | 12,530 | | | 12,850 | | | 12,854 |
| | | | | | | | | |
Diluted earnings per share | | $ | 0.61 | | $ | 0.83 | | $ | 0.71 |
| | | | | | | | | |
The unallocated shares controlled by the ESOP of 234,809 and 320,723 at December 31, 2007 and December 31, 2006, respectively, are not considered in the weighted average shares outstanding until the shares are committed for allocation to an employee’s individual account.
Options to purchase 97,092 shares of common stock at a weighted average exercise price of $10.83 per share expiring November 2012, 85,010 shares of common stock at a weighted average exercise price of $15.35 per share expiring November 2013, 88,740 shares of common stock at a weighted average exercise price of $14.50 per share expiring November 2014, 82,300 shares of common stock at a weighted average exercise price of $12.20 per share expiring June 2015, 16,660 shares of common stock at a weighted average exercise price of $12.40 per share expiring June 2015 and 94,480 shares of common stock at a weighted average exercise price of $10.75 per share expiring November 2016 were outstanding as of December 31, 2007 but were not included in the computation of diluted earnings per share for 2007 because the options’ exercise price was greater than the average market price of the common shares.
Options to purchase 88,910 shares of common stock at a weighted average exercise price of $15.35 per share expiring November 2013, 89,790 shares at common stock at a weighted average exercise price of $14.50 per share expiring November 2014, 82,300 shares of common stock at a weighted average exercise price of $12.20 per share expiring June 2015 and 17,760 shares of common stock at a weighted average exercise price of $12.40 per share expiring June 2015 were outstanding as of December 31, 2006 but were not included in the computation of diluted earnings per share for 2006 because the options’ exercise price was greater than the average market price of the common shares.
Options to purchase 89,660 shares of common stock at a weighted average exercise price of $15.35 per share expiring November 2013, 90,120 shares of common stock at a weighted average exercise price of $14.50 per share expiring November 2014, 82,300 shares at a weighted average exercise price of $12.20 per share expiring June 2015 and 17,960 shares at a weighted average exercise price of $12.40 per share expiring June 2015 were outstanding as of December 31, 2005 but were not included in the computation of diluted earnings per share for 2005 because the options’ exercise price was greater than the average market price of the common shares.
| | | | |
| ESB Financial Corporation | | 39 | | 2007 Annual Report |
Notes to Consolidated Financial Statements (continued)
Effect of Recent Accounting and Regulatory Pronouncements
In December 2007, the FASB issued FAS No. 141 (revised 2007),Business Combinations (“FAS 141(R)”), which establishes principles and requirements for how an acquirer recognizes and measures in its financial statements the identifiable assets acquired, the liabilities assumed, and any noncontrolling interest in an acquiree, including the recognition and measurement of goodwill acquired in a business combination. FAS No. 141(R) is effective for fiscal years beginning on or after December 15, 2008. Earlier adoption is prohibited. The adoption of this standard is not expected to have a material effect on the Company’s results of operations or financial position.
In September 2006, the FASB issued FAS No. 157,Fair Value Measurements, which provides enhanced guidance for using fair value to measure assets and liabilities. The standard applies whenever other standards require or permit assets or liabilities to be measured at fair value. The Standard does not expand the use of fair value in any new circumstances. FAS No. 157 is effective for financial statements issued for fiscal years beginning after November 15, 2007 and interim periods within those fiscal years. Early adoption is permitted. The Company is currently evaluating the impact the adoption of the standard will have on the Company’s results of operations.
In February 2007, the FASB issued FAS No. 159,The Fair Value Option for Financial Assets and Financial Liabilities – Including an amendment of FASB Statement No. 115, which provides all entities with an option to report selected financial assets and liabilities at fair value. The objective of the FAS No. 159 is to improve financial reporting by providing entities with the opportunity to mitigate volatility in earnings caused by measuring related assets and liabilities differently without having to apply the complex provisions of hedge accounting. FAS No. 159 is effective as of the beginning of an entity’s first fiscal year beginning after November 15, 2007. Early adoption is permitted as of the beginning of a fiscal year that begins on or before November 15, 2007 provided the entity also elects to apply the provisions of FAS No. 157,Fair Value Measurements. The adoption of this standard is not expected to have a material effect on the Company’s results of operations or financial position.
In December 2007, the FASB issued FAS No. 160,Noncontrolling Interests in Consolidated Financial Statements — an amendment of ARB No. 51. FAS No. 160 amends ARB No. 51 to establish accounting and reporting standards for the noncontrolling interest in a subsidiary and for the deconsolidation of a subsidiary. It clarifies that a noncontrolling interest in a subsidiary, which is sometimes referred to as minority interest, is an ownership interest in the consolidated entity that should be reported as equity in the consolidated financial statements. Among other requirements, this statement requires consolidated net income to be reported at amounts that include the amounts attributable to both the parent and the noncontrolling interest. It also requires disclosure, on the face of the consolidated income statement, of the amounts of consolidated net income attributable to the parent and to the noncontrolling interest. FAS No. 160 is effective for fiscal years beginning on or after December 15, 2008. Earlier adoption is prohibited. The Company is currently evaluating the impact the adoption of the standard will have on the Company’s results of operations.
In September 2006, the FASB reached consensus on the guidance provided by Emerging Issues Task Force Issue 06-4 (“EITF 06-4”),Accounting for Deferred Compensation and Postretirement Benefit Aspects of Endorsement Split-Dollar Life Insurance Arrangements. The guidance is applicable to endorsement split-dollar life insurance arrangements, whereby the employer owns and controls the insurance policy, that are associated with a postretirement benefit. EITF 06-4 requires that for a split-dollar life insurance arrangement within the scope of the Issue, an employer should recognize a liability for future benefits in accordance with FAS No. 106 (if, in substance, a postretirement benefit plan exists) or Accounting Principles Board Opinion No. 12 (if the arrangement is, in substance, an individual deferred compensation contract) based on the
| | | | |
| ESB Financial Corporation | | 40 | | 2007 Annual Report |
Notes to Consolidated Financial Statements (continued)
substantive agreement with the employee. EITF 06-4 is effective for fiscal years beginning after December 15, 2007. The adoption of this EITF will not have a material effect on the Company’s results of operations or financial position.
In March 2007, the FASB ratified Emerging Issues Task Force Issue No. 06-10 (“EITF 06-10”),Accounting for Collateral Assignment Split-Dollar Life Insurance Agreements. EITF 06-10 provides guidance for determining a liability for the postretirement benefit obligation as well as recognition and measurement of the associated asset on the basis of the terms of the collateral assignment agreement. EITF 06-10 is effective for fiscal years beginning after December 15, 2007. The Company is currently evaluating the impact the adoption of the EITF will have on the Company’s results of operations.
In June 2007, the FASB ratified Emerging Issues Task Force Issue No. 06-11 (“EITF 06-11”),Accounting for Income Tax Benefits of Dividends on Share-Based Payment Awards. EITF 06-11 applies to share-based payment arrangements with dividend protection features that entitle employees to receive (a) dividends on equity-classified nonvested shares, (b) dividend equivalents on equity-classified nonvested share units, or (c) payments equal to the dividends paid on the underlying shares while an equity-classified share option is outstanding, when those dividends or dividend equivalents are charged to retained earnings under FAS No. 123R,Share-Based Payment, and result in an income tax deduction for the employer. A consensus was reached that a realized income tax benefit from dividends or dividend equivalents that are charged to retained earnings and are paid to employees for equity-classified nonvested equity shares, nonvested equity share units, and outstanding equity share options should be recognized as an increase in additional paid-in capital. EITF 06-11 is effective for fiscal years beginning after December 15, 2007, and interim periods within those fiscal years. The Company is currently evaluating the impact the adoption of the EITF will have on the Company’s results of operations.
The following table summarizes the Company’s securities as of December 31:
| | | | | | | | | | | | | |
(Dollar amounts in thousands) | | Amortized
cost | | Unrealized
gains | | Unrealized
losses | | | Fair
value |
December 31, 2007: | | | | | | | | | | | | | |
Trust Preferred securities | | $ | 500 | | $ | — | | $ | (16 | ) | | $ | 484 |
Municipal securities | | | 107,499 | | | 2,374 | | | (172 | ) | | | 109,701 |
Equity securities | | | 794 | | | 51 | | | (31 | ) | | | 814 |
Corporate bonds | | | 59,381 | | | 148 | | | (4,982 | ) | | | 54,547 |
Mortgage-backed securities | | | 890,364 | | | 7,407 | | | (3,345 | ) | | | 894,426 |
| | | | | | | | | | | | | |
| | $ | 1,058,538 | | $ | 9,980 | | $ | (8,546 | ) | | $ | 1,059,972 |
| | | | | | | | | | | | | |
December 31, 2006: | | | | | | | | | | | | | |
Trust Preferred securities | | $ | 500 | | $ | — | | $ | (3 | ) | | $ | 497 |
Municipal securities | | | 109,817 | | | 4,094 | | | (13 | ) | | | 113,898 |
Equity securities | | | 1,555 | | | 542 | | | (8 | ) | | | 2,089 |
Corporate bonds | | | 65,097 | | | 131 | | | (1,294 | ) | | | 63,934 |
Mortgage-backed securities | | | 973,586 | | | 2,503 | | | (12,583 | ) | | | 963,506 |
| | | | | | | | | | | | | |
| | $ | 1,150,555 | | $ | 7,270 | | $ | (13,901 | ) | | $ | 1,143,924 |
| | | | | | | | | | | | | |
The proceeds from the sale of securities as of December 31, 2007, 2006, and 2005 were $77.0 million, $73.9 million and $212.8 million, respectively. Gross realized gains and gross realized losses on sales of securities available for sale were $1.7 million and $944,000, respectively, in 2007, $1.7 million and $1.2 million, respectively, in 2006, $1.1 million and $4.0 million, respectively, in 2005. In addition, there were gross unrealized losses on sales of interest rate caps of $690,000 in 2007. In addition, impairment charges on available for sale securities of $141,000 and $44,000 were recorded for the years ended 2007
| | | | |
| ESB Financial Corporation | | 41 | | 2007 Annual Report |
Notes to Consolidated Financial Statements (continued)
and 2005, respectively, on equity securities that were deemed to be other-than temporarily impaired, no impairment charges were taken in the year ended December 31, 2006.
At December 31, 2007 and 2006, the Company did not have any municipal bonds, corporate bonds, equities or trust preferred securities whose book value exceeded 10% of equity.
The following table shows the Company’s investments’ gross unrealized losses and fair value aggregated by investment category and length of time that individual securities have been in a continuous unrealized loss position, at December 31, 2007:
As of December 31, 2007
| | | | | | | | | | | | | | | | | | | | | | | | |
| | | Less than 12 Months | | 12 Months or more | | Total |
(Dollar amounts in thousands) | | # of
Securities | | Fair Value | | Unrealized
losses | | # of
Securities | | Fair Value | | Unrealized
losses | | # of
Securities | | Fair Value | | Unrealized
losses |
Trust Preferred Securities | | — | | $ | — | | $ | — | | 1 | | $ | 484 | | $ | 16 | | 1 | | $ | 484 | | $ | 16 |
Municipal securities | | 14 | | | 12,475 | | | 141 | | 2 | | | 1,742 | | | 31 | | 16 | | | 14,217 | | | 172 |
Equity Securities | | 3 | | | 302 | | | 12 | | 1 | | | 138 | | | 19 | | 4 | | | 440 | | | 31 |
Corporate bonds | | 1 | | | 2,456 | | | 44 | | 8 | | | 38,903 | | | 4,938 | | 9 | | | 41,359 | | | 4,982 |
Mortgage-backed securities | | 2 | | | 5,346 | | | 25 | | 129 | | | 391,413 | | | 3,320 | | 131 | | | 396,759 | | | 3,345 |
| | | | | | | | | | | | | | | | | | | | | | | | |
| | 20 | | $ | 20,579 | | $ | 222 | | 141 | | $ | 432,680 | | $ | 8,324 | | 161 | | $ | 453,259 | | $ | 8,546 |
| | | | | | | | | | | | | | | | | | | | | | | | |
The following table shows the Company’s investments’ gross unrealized losses and fair value aggregated by investment category and length of time that individual securities have been in a continuous unrealized loss position, at December 31, 2006:
As of December 31, 2006
| | | | | | | | | | | | | | | | | | | | | | | | |
| | | Less than 12 Months | | 12 Months or more | | Total |
(Dollar amounts in thousands) | | # of
Securities | | Fair Value | | Unrealized
losses | | # of
Securities | | Fair Value | | Unrealized
losses | | # of
Securities | | Fair Value | | Unrealized
losses |
Trust Preferred Securities | | — | | $ | — | | $ | — | | 1 | | $ | 497 | | $ | 3 | | 1 | | $ | 497 | | $ | 3 |
Municipal securities | | 3 | | | 2,424 | | | 5 | | 2 | | | 1,507 | | | 8 | | 5 | | | 3,931 | | | 13 |
Equity Securities | | — | | | — | | | — | | 1 | | | 197 | | | 8 | | 1 | | | 197 | | | 8 |
Corporate bonds | | 1 | | | 2,500 | | | — | | 8 | | | 42,536 | | | 1,294 | | 9 | | | 45,036 | | | 1,294 |
Mortgage-backed securities | | 22 | | | 70,457 | | | 184 | | 172 | | | 572,807 | | | 12,399 | | 194 | | | 643,264 | | | 12,583 |
| | | | | | | | | | | | | | | | | | | | | | | | |
| | 26 | | $ | 75,381 | | $ | 189 | | 184 | | $ | 617,544 | | $ | 13,712 | | 210 | | $ | 692,925 | | $ | 13,901 |
| | | | | | | | | | | | | | | | | | | | | | | | |
The Company primarily invests in mortgage-backed securities, variable and fixed rate corporate bonds, municipal bonds, government bonds and to a lesser extent equity securities. The policy of the Company is to recognize an other than temporary impairment on equity securities where the fair value has been significantly below cost for three consecutive quarters. Declines in the fair value of the corporate bonds that can be attributed to specific adverse conditions affecting the credit quality of the investment would be
| | | | |
| ESB Financial Corporation | | 42 | | 2007 Annual Report |
Notes to Consolidated Financial Statements (continued)
recorded as other than temporary impairment losses, and charged to earnings. In order to determine if a decline in fair value is other than temporary, the Company reviews corporate ratings of the investment, analyst reports and SEC filings of the issuers. For fixed maturity investments with unrealized losses due to interest rates where the Company has the positive intent and ability to hold the investment for a period of time sufficient to allow a market recovery, declines in value below cost are not assumed to be other than temporary. The Company reviews its position quarterly and has asserted that at December 31, 2007, the declines outlined in the above table represent temporary declines due to changes in interest rates and are not reflections of an impairment in the credit quality of the securities, additionally, the Company does have the intent and ability to hold those securities either to maturity or to allow a market recovery.
The following table summarizes scheduled maturities of the Company’s securities as of December 31, 2007, excluding equity securities which have no maturity dates:
| | | | | | | | | |
| | | Available for sale |
(Dollar amounts in thousands) | | Weighted
Average Yield | | | Amortized
cost | | Fair
value |
Due in one year or less | | 5.99 | % | | $ | 11,038 | | $ | 11,091 |
Due from one year to five years | | 5.17 | % | | | 7,870 | | | 8,076 |
Due from five to ten years | | 4.76 | % | | | 36,849 | | | 36,777 |
Due after ten years | | 5.22 | % | | | 1,001,987 | | | 1,003,214 |
| | | | | | | | | |
| | 5.21 | % | | $ | 1,057,744 | | $ | 1,059,158 |
| | | | | | | | | |
For purposes of the maturity table, mortgage-backed securities, which are not due at a single maturity date, have been allocated over maturity groupings based on weighted-average contractual maturities of underlying collateral. The mortgage-backed securities may mature earlier than their weighted-average contractual maturities because of principal prepayments.
Securities, with carrying values of $92.0 million and $61.0 million as of December 31, 2007 and 2006, respectively, were pledged to secure public deposits and for other purposes required or permitted by law.
| | | | |
| ESB Financial Corporation | | 43 | | 2007 Annual Report |
Notes to Consolidated Financial Statements (continued)
The following table summarizes the Company’s loans receivable as of December 31:
| | | | | | | | |
(Dollar amounts in thousands) | | 2007 | | | 2006 | |
Mortgage loans: | | | | | | | | |
Residential - single family | | $ | 314,438 | | | $ | 281,017 | |
Residential - multi family | | | 33,196 | | | | 34,382 | |
Commercial real estate | | | 80,141 | | | | 82,019 | |
Construction | | | 51,391 | | | | 58,504 | |
| | | | | | | | |
Subtotal mortgage loans | | | 479,166 | | | | 455,922 | |
| | |
Other loans: | | | | | | | | |
Consumer loans | | | | | | | | |
Home equity loans | | | 67,550 | | | | 66,977 | |
Dealer auto and RV loans | | | 51,593 | | | | 52,449 | |
Other loans | | | 11,336 | | | | 12,987 | |
Commercial business | | | 29,164 | | | | 20,620 | |
| | | | | | | | |
Subtotal other loans | | | 159,643 | | | | 153,033 | |
| | | | | | | | |
Total Loans Receivable | | | 638,809 | | | | 608,955 | |
| | |
Less: | | | | | | | | |
Allowance for loan losses | | | 5,414 | | | | 5,113 | |
Deferred loan fees and net discounts | | | (2,576 | ) | | | (2,709 | ) |
Loans in process | | | 11,720 | | | | 16,909 | |
| | | | | | | | |
Net Loans Receivable | | $ | 624,251 | | | $ | 589,642 | |
| | | | | | | | |
Loans held for sale | | | | | | | | |
| | |
Mortgage loans: | | | | | | | | |
Residential - single family | | $ | — | | | $ | 190 | |
| �� | | | | | | | |
Non-performing loans, which include non-accrual loans and troubled debt restructuring, were $2.4 million and $3.0 million at December 31, 2007 and 2006, respectively.
For non-performing loans, the interest income that would have been recorded under the original terms of such loans and the interest income actually recognized for the years ended December 31 are summarized below:
| | | | | | | | | |
(Dollar amounts in thousands) | | 2007 | | 2006 | | 2005 |
Interest income that would have been recorded | | $ | 171 | | $ | 236 | | $ | 355 |
Interest income recognized | | | 88 | | | 113 | | | 193 |
| | | | | | | | | |
Interest income foregone | | $ | 83 | | $ | 123 | | $ | 162 |
| | | | | | | | | |
The Company is not committed to lend additional funds to debtors whose loans are on non-accrual status.
| | | | |
| ESB Financial Corporation | | 44 | | 2007 Annual Report |
Notes to Consolidated Financial Statements (continued)
| 3. | Loans Receivable (continued) |
The following is a summary of the changes in the allowance for loan losses:
| | | | |
(Dollar amounts in thousands) | | Totals | |
Balance, December 31, 2004 | | $ | 3,940 | |
Allowance for loan losses of PHSB | | | 1,406 | |
Provision for loan losses | | | 568 | |
Charge offs | | | (1,151 | ) |
Recoveries | | | 101 | |
| | | | |
Balance, December 31, 2005 | | | 4,864 | |
Provision for loan losses | | | 1,113 | |
Charge offs | | | (1,022 | ) |
Recoveries | | | 158 | |
| | | | |
Balance, December 31, 2006 | | | 5,113 | |
Provision for loan losses | | | 865 | |
Charge offs | | | (841 | ) |
Recoveries | | | 277 | |
| | | | |
Balance, December 31, 2007 | | $ | 5,414 | |
| | | | |
The following table is a summary of the loans considered to be impaired as of December 31:
| | | | | | | | | |
(Dollar amounts in thousands) | | 2007 | | 2006 | | 2005 |
Impaired loans with an allocated allowance | | $ | 419 | | $ | 670 | | $ | 1,479 |
Impaired loans without an allocated allowance | | | 440 | | | 365 | | | 175 |
| | | | | | | | | |
Total impaired loans | | $ | 859 | | $ | 1,035 | | $ | 1,654 |
| | | | | | | | | |
Allocated allowance on impaired loans | | $ | 20 | | $ | 88 | | $ | 105 |
Portion of impaired loans on non-accrual | | | 859 | | | 1,035 | | | 1,654 |
Average impaired loans | | | 688 | | | 1,409 | | | 1,420 |
Income recognized on impaired loans | | | 82 | | | 56 | | | 86 |
FAS No. 114 does not apply to large groups of smaller balance homogenous loans that are collectively evaluated for impairment. The Company collectively reviews all residential real estate and consumer loans for impairment.
At December 31, 2007 and 2006, the Company conducted its business through 23 offices in Allegheny, Beaver, Butler and Lawrence counties, Pennsylvania which also serves as its primary lending area. Management does not believe it has significant concentrations of credit risk to any one group of borrowers given its underwriting and collateral requirements.
| | | | |
| ESB Financial Corporation | | 45 | | 2007 Annual Report |
Notes to Consolidated Financial Statements (continued)
| 4. | Investment Required by Regulation |
The Company’s subsidiary bank is a member of the FHLB System. As a member, the Bank maintains an investment in the capital stock of the FHLB of Pittsburgh, at cost, in an amount not less than 1.0% of the unpaid principal balances of residential mortgage loans, 0.3% of total assets or approximately 5.0% of outstanding advances, if any due to the FHLB, whichever is greater, as calculated periodically by the FHLB. Purchases and redemptions of FHLB stock are made directly with the FHLB at par.
Premises and equipment at December 31 are summarized by major classification as follows:
| | | | | | |
(Dollar amounts in thousands) | | 2007 | | 2006 |
Land | | $ | 2,880 | | $ | 2,680 |
Buildings and improvements | | | 15,925 | | | 14,764 |
Leasehold improvements | | | 836 | | | 1,025 |
Furniture, fixtures and equipment | | | 9,089 | | | 10,407 |
| | | | | | |
| | | 28,730 | | | 28,876 |
Less accumulated depreciation and amortization | | | 16,785 | | | 17,647 |
| | | | | | |
| | $ | 11,945 | | $ | 11,229 |
| | | | | | |
Depreciation expense for the years December 31, 2007, 2006 and 2005 were $1.0 million, $1.0 million, and $1.2 million, respectively.
The Company is obligated under non-cancelable long term operating lease agreements for certain branch offices. These lease agreements, each having renewal options and none expiring later than 2010, have approximate aggregate rentals of $160,422, $147,922 and $63,337 for the years ended December 31, 2008, 2009 and 2010, respectively. Rent expense for the years ended December 31, 2007, 2006 and 2005 was $131,000, $169,000 and $132,000, respectively.
| | | | |
| ESB Financial Corporation | | 46 | | 2007 Annual Report |
Notes to Consolidated Financial Statements (continued)
The following table summarizes the Company’s deposits as of December 31:
| | | | | | | | | | | | |
(Dollar amounts in thousands) Type of accounts | | 2007 | | | 2006 | |
| | | Amount | | % | | | Amount | | % | |
Noninterest-bearing deposits | | $ | 55,775 | | 6.6 | % | | $ | 54,906 | | 6.7 | % |
NOW account deposits | | | 96,566 | | 11.5 | % | | | 82,204 | | 10.0 | % |
Money Market deposits | | | 25,509 | | 3.0 | % | | | 33,007 | | 4.0 | % |
Passbook account deposits | | | 98,460 | | 11.7 | % | | | 105,009 | | 12.7 | % |
Time deposits | | | 566,544 | | 67.2 | % | | | 548,518 | | 66.6 | % |
| | | | | | | | | | | | |
| | $ | 842,854 | | 100.0 | % | | $ | 823,644 | | 100.0 | % |
| | | | | | | | | | | | |
Time deposits mature as follows: | | | | | | | | | | | | |
| | | | |
Within one year | | $ | 438,957 | | 52.1 | % | | $ | 430,405 | | 52.3 | % |
After one year through two years | | | 78,601 | | 9.3 | % | | | 75,719 | | 9.2 | % |
After two years through three years | | | 41,979 | | 5.0 | % | | | 31,049 | | 3.8 | % |
After three years through four years | | | 4,305 | | 0.5 | % | | | 5,695 | | 0.7 | % |
After four years through five years | | | 1,491 | | 0.2 | % | | | 4,164 | | 0.5 | % |
Thereafter | | | 1,211 | | 0.1 | % | | | 1,486 | | 0.2 | % |
| | | | | | | | | | | | |
| | $ | 566,544 | | 67.2 | % | | $ | 548,518 | | 66.6 | % |
| | | | | | | | | | | | |
The Company had a total of $149.9 million and $138.8 million in time deposits of $100,000 or more at December 31, 2007 and 2006, respectively. The Company had a total of $3.3 million and $2.8 million in Individual Retirement Account’s (IRA) of $250,000 or more at December 31, 2007 and 2006, respectively. Certificate of deposits in excess of $100,000 and individual retirement accounts in excess of $250,000 are not federally insured.
Interest expense by type of deposit account for the year ended December 31 is as follows:
| | | | | | | | | |
(Dollar amounts in thousands) | | 2007 | | 2006 | | 2005 |
NOW account deposits | | $ | 1,235 | | $ | 752 | | $ | 580 |
Money Market deposits | | | 128 | | | 215 | | | 309 |
Passbook account deposits | | | 417 | | | 503 | | | 545 |
Time deposits | | | 25,926 | | | 21,882 | | | 15,812 |
| | | | | | | | | |
| | $ | 27,706 | | $ | 23,352 | | $ | 17,246 |
| | | | | | | | | |
| | | | |
| ESB Financial Corporation | | 47 | | 2007 Annual Report |
Notes to Consolidated Financial Statements (continued)
Borrowed funds, which include FHLB advances, repurchase agreements, ESOP borrowings, corporate borrowings and treasury tax and loan notes payable, as of December 31 are summarized as follows:
| | | | | | | | | | | | |
(Dollar amounts in thousands) | | 2007 | | 2006 |
| | Weighted
average
rate | | | Amount | | Weighted
average
rate | | | Amount |
FHLB advances: | | | | | | | | | | | | |
Due within 12 months | | 4.40 | % | | $ | 231,870 | | 4.04 | % | | $ | 269,361 |
Due beyond 12 months but within 2 years | | 5.15 | % | | | 231,750 | | 4.41 | % | | | 227,070 |
Due beyond 2 years but within 3 years | | 4.98 | % | | | 165,000 | | 5.24 | % | | | 181,750 |
Due beyond 3 years but within 4 years | | — | | | | — | | 6.09 | % | | | 20,000 |
Due beyond 5 years | | 1.00 | % | | | 46 | | 1.00 | % | | | 51 |
| | | | | | | | | | | | |
| | | | | $ | 628,666 | | | | | $ | 698,232 |
| | | | | | | | | | | | |
Repurchase agreements: | | | | | | | | | | | | |
Due within 12 months | | 4.93 | % | | $ | 97,000 | | 4.98 | % | | $ | 67,000 |
Due beyond 12 months but within 2 years | | 5.16 | % | | | 50,000 | | 4.77 | % | | | 70,000 |
Due beyond 2 years but within 3 years | | 5.02 | % | | | 10,000 | | 5.16 | % | | | 50,000 |
Due beyond 5 years | | 4.28 | % | | | 25,000 | | — | | | | — |
| | | | | | | | | | | | |
| | | | | $ | 182,000 | | | | | $ | 187,000 |
| | | | | | | | | | | | |
Other borrowings: | | | | | | | | | | | | |
| | | | |
ESOP borrowings | | | | | | | | | | | | |
Due within 12 months | | 5.25 | % | | $ | 945 | | 5.25 | % | | $ | 945 |
Due beyond 12 months but within 2 years | | 5.25 | % | | | 945 | | 5.25 | % | | | 945 |
Due beyond 2 years but within 3 years | | 5.25 | % | | | 945 | | 5.25 | % | | | 945 |
Due beyond 3 years but within 4 years | | — | | | | — | | 5.25 | % | | | 945 |
| | | | | | | | | | | | |
| | | | | $ | 2,835 | | | | | $ | 3,780 |
| | | | | | | | | | | | |
Corporate borrowings | | | | | | | | | | | | |
Due within 12 months | | 5.55 | % | | $ | 9,000 | | 5.55 | % | | $ | 1,500 |
Due beyond 12 months but within 2 years | | — | | | | — | | 5.55 | % | | | 9,000 |
| | | | | | | | | | | | |
| | | | | $ | 9,000 | | | | | $ | 10,500 |
| | | | | | | | | | | | |
Treasury tax and loan note payable | | 4.00 | % | | $ | 143 | | 5.04 | % | | $ | 197 |
| | | | | | | | | | | | |
Borrowings for joint ventures | | 7.75 | % | | $ | 2,564 | | — | | | $ | — |
| | | | | | | | | | | | |
Junior subordinated notes | | | | | | | | | | | | |
Due beyond 5 years | | 6.65 | % | | $ | 51,519 | | 6.73 | % | | $ | 51,444 |
| | | | | | | | | | | | |
Included in the $628.7 million of FHLB advances at December 31, 2007 is approximately $45.0 million of convertible select advances. These advances reset to the three month LIBOR index and have various spreads and call dates. At the reset date, if the three month LIBOR plus the spread is lower than the contract rate on the advance, the advance will remain at the contracted rate. The FHLB has the right to call any convertible select advance on its call date or quarterly thereafter. Should the advance be called, the Company has the right to pay off the advance without penalty. It has historically been the Company’s position to pay off the borrowing and replace it with fixed rate funding.
| | | | |
| ESB Financial Corporation | | 48 | | 2007 Annual Report |
Notes to Consolidated Financial Statements (continued)
| 7. | Borrowed Funds (continued) |
Included in the $182.0 million of repurchase agreements (REPO) is a $25.0 million structured REPO in which the Company pays a fixed rate of interest. After two years starting in April 2009 and every quarterly period thereafter, the counterparty has the right to terminate the transaction.
FHLB Advances are secured by FHLB stock, qualifying residential mortgage loans and mortgage-backed securities to the extent that the fair value of such pledged collateral must be at least equal to the advances outstanding. At December 31, 2007, the Company had a maximum borrowing capacity with the FHLB of $886.5 million, with $257.8 million available for use.
The Company enters into sales of securities under agreements to repurchase. Such repurchase agreements are treated as borrowed funds. The dollar amount of the securities underlying the agreements remain in their respective asset accounts.
Repurchase agreements are collateralized by various securities that are either held in safekeeping at the FHLB or delivered to the dealer who arranged the transaction, and the Company maintains control of these securities.
The market value of such securities exceeded the amortized cost of the securities sold under agreements to repurchase. The market value of the securities as of December 31, 2007 was $201.4 million with an amortized cost of $200.2 million. The market value of the securities as of December 31, 2006 was $202.3 million with an amortized cost of $205.0 million. The average maturity date of the mortgage backed securities sold under agreements to repurchase was greater than 90 days for the year ended December 31, 2007 and 2006.
As of December 31, 2007, and 2006, the Company had repurchase agreements outstanding with CitiGroup of $182.0 million and $167.0 million, respectively. As of December 31, 2006 the Company had outstanding repurchase agreements with Mellon of $20 million.
As of December 31, 2007, the market value of the collateral on the repurchase agreements with CitiGroup was greater than the borrowing leaving $19.4 million at risk with a weighted average maturity of 24 months.
Borrowings under repurchase agreements averaged $188.3 million, $151.0 million and $79.5 million during 2007, 2006 and 2005, respectively. The maximum amount outstanding at any month-end was $202.0 million, $193.0 million and $107.0 million during 2007, 2006 and 2005, respectively.
The Company, through ESB, has an agreement with the Federal Reserve Bank of Cleveland whereby ESB is an authorized treasury tax loan depository. Under the terms of the note agreement, funds deposited to the Company’s treasury tax and loan account (limited to $150,000 per deposit) accrue interest at a rate of .25% below the overnight federal funds rate.
| 8. | Junior Subordinated Notes |
On April 10, 2003, ESB Capital Trust II (Trust II), a statutory business trust established under Delaware law that is a subsidiary of the Company, issued $10.0 million variable rate preferred securities with a stated value and liquidation preference of $1,000 per share. The Company purchased $310,000 of common securities of Trust II. The preferred securities reset quarterly to equal the LIBOR index plus 3.25%. Trust II’s obligations under the preferred securities issued are fully and unconditionally guaranteed by the Company. The proceeds from the sale of the preferred securities and the common securities were utilized
| | | | |
| ESB Financial Corporation | | 49 | | 2007 Annual Report |
Notes to Consolidated Financial Statements (continued)
| 8. | Junior Subordinated Notes (continued) |
by the Trust II to invest in $10.3 million of variable rate subordinated debt of the Company. The subordinated debt is unsecured and ranks subordinate and junior in right of payment to all indebtedness, liabilities and obligations of the Company. The subordinated debt primarily represents the sole assets of the Trust II. Interest on the preferred securities is cumulative and payable quarterly in arrears. The Company has the right to optionally redeem the Subordinated Debt prior to the maturity date of April 24, 2033, on or after April 24, 2008, at the redemption price, plus accrued and unpaid distributions, if any, at the redemption date. Under the occurrence of certain events, specifically, a tax event, investment company event or capital treatment event as more fully defined in the Indenture dated April 10, 2003, the Company may redeem in whole, but not in part, the subordinated debt at any time within 90 days following the occurrence of such event. Proceeds from any redemption of the subordinated debt would cause a mandatory redemption of the preferred securities and the common securities having an aggregate liquidation amount equal to the principal amount of the subordinated debt redeemed. Unamortized deferred debt issuance costs associated with the preferred securities amounted to $15,000 and $75,000 at December 31, 2007 and December 31, 2006, respectively, and are amortized on a level yield basis.
On December 17, 2003, ESB Statutory Trust (Trust III), a statutory business trust established under Delaware law that is a subsidiary of the Company, issued $5.0 million variable rate preferred securities with a stated value and liquidation preference of $1,000 per share. The Company purchased $155,000 of common securities of Trust III. The preferred securities reset quarterly to equal the LIBOR Index plus 2.95%. Trust III’s obligations under the preferred securities issued are fully and unconditionally guaranteed by the Company. The proceeds from the sale of the preferred securities and the common securities were utilized by Trust III to invest in $5.2 million of variable rate subordinated debt of the Company. The subordinated debt is unsecured and ranks subordinate and junior in right of payment to all indebtedness, liabilities and obligations of the Company. The subordinated debt primarily represents the sole assets of Trust III. Interest on the preferred securities is cumulative and payable quarterly in arrears. The Company has the right to optionally redeem the subordinated debt prior to the maturity date of December 17, 2033, on or after December 17, 2008, at the redemption price, plus accrued and unpaid distributions, if any, at the redemption date. Under the occurrence of certain events, specifically, a tax event, investment company event or capital treatment event as more fully defined in the Indenture dated December 17, 2003, the Company may redeem in whole, but not in part, the subordinated debt at any time within 90 days following the occurrence of such event. Proceeds from any redemption of the subordinated debt would cause a mandatory redemption of the preferred securities and the common securities having an aggregate liquidation amount equal to the principal amount of the subordinated debt redeemed. Unamortized deferred debt issuance costs associated with the preferred securities amounted to $13,750 and $28,750 at December 31, 2007 and December 31, 2006, respectively, and are amortized on a level yield basis.
On February 10, 2005, ESB Capital Trust IV (Trust IV), a statutory business trust established under Delaware law that is a subsidiary of the Company, issued $35.0 million fixed/variable rate preferred securities. The Company purchased $1.1 million of common securities of Trust IV. The preferred securities are fixed at a rate of 6.03% for six years and then are variable at three month LIBOR index plus 1.82%. The preferred securities have a stated maturity of thirty years. Trust IV’s obligations under the preferred securities issued are fully and unconditionally guaranteed by the Company. The proceeds from the sale of the preferred securities and the common securities were utilized by Trust IV to invest in $36.1 million of fixed/variable rate subordinated debt of the Company. The subordinated debt is unsecured and ranks subordinate and junior in right of payment to all indebtedness, liabilities and obligations of the Company. The subordinated debt primarily represents the sole assets of Trust IV. Interest on the preferred securities is cumulative and payable quarterly in arrears. The Company has the right to optionally redeem the subordinated debt prior to the maturity date of February 10, 2035, on or after February 10, 2011, at the
| | | | |
| ESB Financial Corporation | | 50 | | 2007 Annual Report |
Notes to Consolidated Financial Statements (continued)
| 8. | Junior Subordinated Notes (continued) |
redemption price, which is equal to the liquidation amount, plus accrued and unpaid distributions, if any, at the redemption date. Under the occurrence of certain events, specifically, a tax event, investment company event or capital treatment event as more fully defined in the Indenture dated February 10, 2005, the Company may redeem in whole, but not in part, the subordinated debt at any time within 90 days following the occurrence of such event. Proceeds from any redemption of the subordinated debt would cause a mandatory redemption of the preferred securities and the common securities having an aggregate liquidation amount equal to the principal amount of the subordinated debt redeemed. The Company did not have any deferred debt issuance costs associated with the preferred securities.
The provision for income taxes for the years ended December 31, is comprised of the following:
| | | | | | | | | | | | |
(Dollar amounts in thousands) | | 2007 | | | 2006 | | | 2005 | |
Current expense: | | | | | | | | | | | | |
Federal | | $ | 1,738 | | | $ | 1,815 | | | $ | 1,527 | |
State | | | 42 | | | | 1 | | | | 39 | |
| | | | | | | | | | | | |
| | | 1,780 | | | | 1,816 | | | | 1,566 | |
| | | |
Deferred benefit: | | | | | | | | | | | | |
Federal | | | (1,380 | ) | | | (499 | ) | | | (756 | ) |
| | | | | | | | | | | | |
| | $ | 400 | | | $ | 1,317 | | | $ | 810 | |
| | | | | | | | | | | | |
In addition to income taxes applicable to income before taxes in the consolidated statements of operations, the following income tax amounts were recorded to stockholders’ equity during the years ended December 31:
| | | | | | | | | | | |
(Dollar amounts in thousands) | | 2007 | | | 2006 | | | 2005 |
Net (gain) loss on securities available for sale | | $ | (3,099 | ) | | $ | (137 | ) | | $ | 5,594 |
Net loss on interest rate cap contracts | | | — | | | | 32 | | | | — |
Cumulative effect of change in accounting for post-retirement benefits | | | — | | | | 288 | | | | — |
Compensation expense for tax purposes in excess of amounts recognized for financial statement purposes | | | 97 | | | | 45 | | | | 98 |
| | | | | | | | | | | |
| | $ | (3,002 | ) | | $ | 228 | | | $ | 5,692 |
| | | | | | | | | | | |
| | | | |
| ESB Financial Corporation | | 51 | | 2007 Annual Report |
Notes to Consolidated Financial Statements (continued)
| 9. | Income Taxes (continued) |
The tax effects of temporary differences between the financial reporting basis and income tax basis of assets and liabilities that are included in the net deferred tax asset as of December 31 relate to the following:
| | | | | | |
(Dollar amounts in thousands) | | 2007 | | 2006 |
Deferred tax assets: | | | | | | |
Allowances for losses on loans and real estate owned | | $ | 1,841 | | $ | 1,738 |
General business credit | | | 1,961 | | | 1,697 |
Minimum tax credit carry forward | | | 3,787 | | | 3,303 |
Writedown of debt | | | 58 | | | 109 |
Real estate acquired through foreclosure, net | | | 159 | | | 127 |
Investment in securities available for sale | | | — | | | 2,254 |
Interest rate cap contracts | | | — | | | 358 |
Federal net operating loss carryover | | | — | | | 6 |
State net operating loss carryover | | | 235 | | | 235 |
Defined benefit plans | | | 352 | | | 288 |
Other | | | 865 | | | 701 |
| | | | | | |
Gross deferred tax assets | | | 9,258 | | | 10,816 |
Deferred tax liabilities: | | | | | | |
Investment in securities available for sale | | | 487 | | | — |
Accretion of discounts | | | 15 | | | 24 |
Core deposit intangible | | | 809 | | | 1,024 |
Purchase price adjustments | | | 284 | | | 361 |
Mortgage servicing rights | | | 4 | | | 6 |
Other | | | 180 | | | 267 |
| | | | | | |
Gross deferred tax liabilities | | | 1,779 | | | 1,682 |
| | |
Net deferred tax asset | | $ | 7,479 | | $ | 9,134 |
| | | | | | |
The Company determined that it was not required to establish a valuation allowance for deferred tax assets in accordance with FAS No. 109 since it is more likely than not that the deferred tax asset will be realized through carry-back to taxable income in prior years, future reversals of existing taxable temporary differences and, to a lesser extent, future taxable income.
The general business credit of $2.0 million will be available to reduce future federal income tax up to the year 2027. The alternative minimum tax credit of $3.8 million is available to reduce future regular income taxes over an indefinite period.
The deferred tax assets relating to the federal and state net operating loss carryforwards were recorded as part of the purchase price allocation of the acquisition of PHSB Financial Corporation and its wholly owned subsidiary Peoples Home Savings Bank during 2005. The state net operating loss carryforward of $3.6 million expires in 2024. These net operating losses were generated by Peoples Home Savings Bank and PHSB Financial Corporation in their final tax returns.
| | | | |
| ESB Financial Corporation | | 52 | | 2007 Annual Report |
Notes to Consolidated Financial Statements (continued)
| 9. | Income Taxes (continued) |
A reconciliation between the provision for income taxes and the amount computed by multiplying operating results before income taxes by the statutory federal income tax rate of 34% for the years ended December 31 is as follows:
| | | | | | | | | |
| | | 2007 | | | 2006 | | | 2005 | |
Tax at statutory rate | | 34.0 | % | | 34.0 | % | | 34.0 | % |
(Decrease) increase resulting from: | | | | | | | | | |
Tax free income, net of interest disallowance | | (20.0 | %) | | (14.6 | %) | | (18.9 | %) |
State income taxes, net of Federal income tax benefit | | 0.3 | % | | — | | | 0.3 | % |
Earnings of BOLI | | (4.7 | %) | | (2.9 | %) | | (3.2 | %) |
Other, net | | (4.6 | %) | | (5.5 | %) | | (4.1 | %) |
| | | | | | | | | |
Effective rate | | 5.0 | % | | 11.0 | % | | 8.1 | % |
| | | | | | | | | |
The Company and its subsidiaries file a consolidated federal income tax return. Prior to 1996, the Bank was permitted under the Internal Revenue Code to deduct an annual addition to a reserve for bad debts in determining taxable income, subject to certain limitations. Subsequent to 1995, the Bank’s bad debt deduction is based on actual net charge-offs. Bad debt deductions for income tax purposes are included in taxable income of later years only if the Bank’s base year bad debt reserve is used subsequently for purposes other than to absorb bad debt losses. Because the Bank does not intend to use the reserve for purposes other than to absorb losses, no deferred income taxes have been provided prior to 1987. Retained earnings at December 31, 2006 (the most recent date for which a tax return has been filed) include approximately $17.7 million, representing such bad debt deductions for which no deferred income taxes have been provided.
The Company adopted the provisions of FIN No. 48,Accounting for Uncertainty in Income Taxes, an interpretation of FASB Statement 109,effective January 1, 2007. FIN No. 48 prescribes a recognition threshold and a measurement attribute for the financial statement recognition and measurement of a tax position taken or expected to be taken in a tax return. Benefits from tax positions should be recognized in the financial statements only when it is more likely than not that the tax position will be sustained upon examination by the appropriate taxing authority that would have full knowledge of all relevant information. A tax position that meets the more-likely-than-not recognition threshold is measured at the largest amount of benefit that is greater than fifty percent likely of being realized upon ultimate settlement. Tax positions that previously failed to meet the more-likely-than-not recognition threshold should be recognized in the first subsequent financial reporting period in which that threshold is met. Previously recognized tax positions that no longer meet the more-likely-than-not recognition threshold should be derecognized in the first subsequent financial reporting period in which that threshold is no longer met. FIN No. 48 also provides guidance on the accounting for and disclosure of unrecognized tax benefits, interest and penalties. Adoption of FIN No. 48 did not have a significant impact on the Company’s financial statements.
| 10. | Employee Benefit Plans |
Retirement Savings Plan
The Company has a defined contribution employee retirement plan for the benefit of substantially all employees. The plan provides for regular employer payments that match each participating employee’s contribution to their individual tax-deferred retirement account. Employees can contribute up to 100% of
| | | | |
| ESB Financial Corporation | | 53 | | 2007 Annual Report |
Notes to Consolidated Financial Statements (continued)
| 10. | Employee Benefit Plans (continued) |
their compensation, less required deductions, to the plan, and the Company matches 100% of the first 1% and 50% of the remaining 2% through 6% of employee contributions in stock of the Company. The Company contributed $248,000, $239,000 and $191,000 to the plan during 2007, 2006 and 2005, respectively.
Employee Stock Ownership Plan
The Company has a tax qualified Employee Stock Ownership Plan (ESOP) for the benefit of its employees. Employees begin to participate in the plan January 1 of the year following their date of hire. Participants become 25% vested in their accounts after two years of service, 50% after three years of service, 75% after four years of service and 100% after five years of service or, if earlier, upon death, disability or attainment of normal retirement age.
The purchase of shares of the Company’s stock by the ESOP is funded by a loan. Unreleased ESOP shares collateralize the loan payable, and the cost of these shares is recorded as a contra-equity account in stockholders’ equity of the Company. The ESOP’s loan payable bears a weighted-average interest rate of 5.25% and matures within the next 3 years. Shares released as debt payments are made by the ESOP to the loan. The ESOP’s sources of repayment of the loans can include dividends, if any, on the unallocated stock held by the ESOP and discretionary contributions from the Company to the ESOP and earnings thereon.
Dividends received on unallocated ESOP shares during 2007, 2006 and 2005 amounted to $119,698, $155,201 and $192,000, respectively. All of the unallocated dividends were used for debt service on the loan. The Company contributed $1.0 million, $1.0 million and $1.0 million for the years ended December 31, 2007, 2006 and 2005, respectively. The ESOP incurred interest on the loan of $180,000, $230,000 and $279,000 for the years ended December 31, 2007, 2006 and 2005, respectively.
The Company accounts for the ESOP in accordance with, the American Institute of Certified Public Accountants issued Statement of Position (SOP) No. 93-6, “Employers’ Accounting for Employee Stock Ownership Plans”, which prescribes comprehensive accounting guidance for ESOPs. The major requirements of SOP No. 93-6 provide, among other provisions, that compensation is recognized under the shares released method and compensation expense is equal to the fair value of the shares committed to be released and unallocated ESOP shares are excluded from outstanding shares for purposes of computing EPS.
During 2007, 2006 and 2005, the Company recognized compensation expense related to the ESOP of $915,000, $1.0 million and $1.2 million, respectively.
As of December 31, 2007 and 2006, the ESOP held a total of 1,604,618 and 1,605,354 shares, respectively, of the Company’s stock, and there were 234,809 and 320,723 unallocated shares, respectively, with a fair value of $2.3 million and $3.5 million, respectively. During 2007 and 2006, 85,914 and 89,726 shares were released for allocation, respectively.
| | | | |
| ESB Financial Corporation | | 54 | | 2007 Annual Report |
Notes to Consolidated Financial Statements (continued)
| 10. | Employee Benefit Plans (continued) |
Stock Option Plans
The Company maintains various stock option plans (Option Plans), which provide for the grant of stock options to directors, officers and other key employees. The Option Plans provide for the grant of both incentive stock options and compensatory stock options. Stock options are granted at an exercise price equal to the market price at the date of grant, the options vest over a specified time and are exercisable on the date they vest and have a maximum term of ten years. These terms are discretionary. Stock option activities under the Option Plans for the years ended December 31 are as follows:
| | | | | | | | | | | | | | | | | | |
| | | 2007 | | 2006 | | 2005 |
| | | Options | | | Weighted
Average
Exercise
Price/Share | | Options | | | Weighted
Average
Exercise
Price/Share | | Options | | | Weighted
Average
Exercise
Price/Share |
Outstanding at beginning of year | | 945,104 | | | $ | 9.89 | | 921,401 | | | $ | 9.55 | | 946,018 | | | $ | 8.88 |
Granted | | 95,150 | | | | 10.11 | | 95,345 | | | | 10.75 | | 100,910 | | | | 12.24 |
Exercised | | (63,193 | ) | | | 6.41 | | (46,949 | ) | | | 6.35 | | (88,095 | ) | | | 6.20 |
Expired | | (28,911 | ) | | | 7.61 | | (24,693 | ) | | | 7.22 | | (37,432 | ) | | | 7.65 |
| | | | | | | | | | | | | | | | | | |
Outstanding at end of year | | 948,150 | | | | 10.21 | | 945,104 | | | | 9.89 | | 921,401 | | | | 9.55 |
| | | | | | | | | | | | | | | | | | |
Exercisable at end of year | | 815,342 | | | $ | 10.19 | | 868,960 | | | $ | 9.89 | | 921,401 | | | $ | 9.55 |
| | | | | | | | | | | | | | | | | | |
The weighted-average fair values of options granted during 2007, 2006 and 2005 utilizing the Black-Scholes Valuation Model were $2.69, $2.93 and $ 2.92, respectively.
The following table summarizes certain characteristics of issued stock options as of December 31, 2007:
| | | | | | | |
Year Issued | | Options
Outstanding | | Exercise
Price | | Average
Remaining
Contractual
Life (in years) |
1998 | | 74,839 | | | 9.47 | | 0.5 |
1998 | | 17,393 | | | 4.05 | | 0.9 |
1999 | | 94,827 | | | 7.37 | | 1.5 |
2000 | | 111,828 | | | 6.01 | | 2.4 |
2001 | | 89,831 | | | 7.83 | | 3.9 |
2002 | | 97,092 | | | 10.83 | | 4.9 |
2003 | | 85,010 | | | 15.35 | | 5.9 |
2004 | | 88,740 | | | 14.50 | | 6.9 |
2005 | | 82,300 | | | 12.20 | | 7.3 |
2005 | | 16,660 | | | 12.40 | | 7.3 |
2006 | | 94,480 | | | 10.75 | | 8.9 |
2007 | | 95,150 | | | 10.11 | | 9.9 |
| | | | | | | |
| | 948,150 | | $ | 10.21 | | 5.2 |
| | | | | | | |
Management Recognition Plan
In connection with previous acquisitions, the Company acquired shares of stock held in trust for potential future distribution to management and key employees for compensation purposes. As of December 31, 2007, there were 11,646 shares held in the Management Recognition Plan (MRP) trust.
In November 2001, the Company awarded 13,000 shares to eligible individuals, 2,600 shares vested on the date of the grant. The remaining 10,400 shares vested over a four year period ending in 2005. This grant was adjusted for two 20% stock splits that occurred on October 25, 2002 and May 15, 2003.
| | | | |
| ESB Financial Corporation | | 55 | | 2007 Annual Report |
Notes to Consolidated Financial Statements (continued)
| 10. | Employee Benefit Plans (continued) |
In May 2004, the Company awarded 31,450 shares to eligible individuals, 4,820 shares vested on the date of the grant, 2,220 shares have been forfeited and the remaining 24,410 vest over a scheduled vesting period ending in 2011.
In May 2005, the Company awarded 700 shares to eligible individuals, 75 shares vested on the date of the grant and the remaining 625 shares vest over a scheduled vesting period ending in 2011.
Compensation expense recognized in 2007, 2006 and 2005 was $49,000, $49,000 and $79,000, respectively. The Company is expected to recognize compensation expense of $50,000, $39,000, $39,000 and $39,000 for the years 2008, 2009, 2010 and 2011, respectively.
Excess Benefit Plan
The Company has adopted an excess benefit plan for the purpose of permitting an executive officer, and any other employees of the Company who may be designated pursuant to the plan, to receive certain benefits that the executive officer and any other employees of the Company otherwise would be eligible to receive under the Company’s retirement and profit sharing plan and ESOP but for the limitations set forth in Section 401(a)(17), 402(g) and 415 of the Internal Revenue Code of 1986, as amended (the “Code”). Pursuant to the excess benefit plan, during any plan year the Company shall make matching contributions on behalf of the participant in an amount equal to the amount of matching contributions that would have been made by the Company on behalf of the participant but for limitations in the Code, less the actual amount of matching contributions actually made by the Company on behalf of the participant. Finally, the excess benefit plan generally provides that during any plan year a participant shall receive a supplemental ESOP allocation in an amount equal to the amount which would have been allocated to the participant but for limitations in the Code, less the amount actually allocated to the participant pursuant to the ESOP. The supplemental benefits to be received by a participant pursuant to the excess benefit plan shall be credited to an account maintained pursuant to the plan within 180 days after the end of each plan year. In connection with its adoption of the excess benefit plan, the Company established a trust which currently holds 42,293 shares of common stock to fund its obligation under the excess benefit plan.
Supplemental Executive Retirement Plan and Directors’ Retirement Plan
The Company has adopted a Supplemental Executive Benefit Plan (SERP) in order to provide supplemental retirement and death benefits for certain key employees of the Company. Under the SERP, participants shall receive an annual retirement benefit following retirement at age 65 equal to 25% of the participant’s final average pay multiplied by a target retirement benefit percentage. Final average pay is based upon the participant’s last three year’s compensation and the target benefit percentage is equal to the fraction resulting from the participant’s years of credited service divided by 20, this targeted percentage is capped at 100%. Benefits under the plan are payable in ten equal annual payments and a lesser benefit is payable upon early retirement at age 50 with at least twelve years of service. If a participant dies prior to retirement, the participant’s estate will receive a lump sum payment equal to the net present value of future benefit payments under the plan. At December 31, 2007, the participants in the plan had credited service under the SERP ranging from 17 to 29 years.
The Company and the Bank have adopted the ESB Financial Corporation Directors’ Retirement Plan and entered into director retirement agreements with each director of the Company and the Bank. The plan provides that any retiring director with a minimum of five or more years of service with the Company or the Bank and a minimum of 10 total years of service, including years of service with any bank acquired by the Company or the Bank, that remains in continuous service as a board member until age 75 will be
| | | | |
| ESB Financial Corporation | | 56 | | 2007 Annual Report |
Notes to Consolidated Financial Statements (continued)
| 10. | Employee Benefit Plans (continued) |
entitled to receive an annual retirement benefit equal to his or her director’s fees earned during the last full calendar year prior to his or her retirement date, multiplied by a ratio, ranging from 25% to 80%, based on the director’s total years of service. The maximum ratio of 80% of fees requires 20 or more years of service and the minimum ratio of 25% of fees requires 10 years of service. Retirement benefits may also be payable under the plan if a director retires from service as a director prior to attaining age 75. Two directors are currently receiving monthly benefits under the plan.
The following table sets forth the obligation and funded status as of December 31:
| | | | | | | | | | | | | | | | |
(Dollar amounts in thousands) | | Directors’ Retirement Plan
December 31, | | | SERP
December 31, | |
| | 2007 | | | 2006 | | | 2007 | | | 2006 | |
Change in benefit obligation | | | | | | | | | | | | | | | | |
Benefit obligation at beginning of year | | $ | 577 | | | $ | 570 | | | $ | 1,541 | | | $ | 1,564 | |
Service Cost | | | 7 | | | | 12 | | | | 51 | | | | 56 | |
Interest Cost | | | 33 | | | | 31 | | | | 96 | | | | 97 | |
Amendments | | | 226 | | | | (9 | ) | | | — | | | | — | |
Actuarial losses (gains) | | | (11 | ) | | | 2 | | | | 93 | | | | (176 | ) |
Benefits paid | | | (29 | ) | | | (29 | ) | | | — | | | | — | |
| | | | | | | | | | | | | | | | |
Benefit obligation at end of year | | | 803 | | | | 577 | | | | 1,781 | | | | 1,541 | |
| | | | | | | | | | | | | | | | |
Change in plan assets | | | | | | | | | | | | | | | | |
Fair value of plan assets at beginning of year | | | — | | | | — | | | | — | | | | — | |
Employer contributions | | | 29 | | | | 29 | | | | — | | | | — | |
Benefits paid | | | (29 | ) | | | (29 | ) | | | — | | | | — | |
| | | | | | | | | | | | | | | | |
Fair value of plan assets at end of year | | | — | | | | — | | | | — | | | | — | |
| | | | | | | | | | | | | | | | |
Funded Status | | $ | (803 | ) | | $ | (577 | ) | | $ | (1,781 | ) | | $ | (1,541 | ) |
| | | | | | | | | | | | | | | | |
Amounts not yet recognized as a component of net periodic pension cost: | | | | | | | | | | | | | | | | |
Amounts recognized in accumulated other comprehensive loss consist of: | | | | | | | | | | | | | | | | |
Net loss | | $ | 12 | | | $ | 19 | | | $ | 176 | | | $ | 125 | |
Prior service cost | | | 251 | | | | 144 | | | | 244 | | | | 271 | |
| | | | | | | | | | | | | | | | |
Total | | $ | 263 | | | $ | 163 | | | $ | 420 | | | $ | 396 | |
| | | | | | | | | | | | | | | | |
The accumulated benefit obligation for the director’s retirement plan was $753 and $530 at December 31, 2007 and 2006, respectively and for the SERP was $1.5 million and $1.3 million at December 31, 2007 and 2006, respectively. Information for pension plans with an accumulated benefit obligation in excess of plan assets at December 31 is as follows:
| | | | | | | | | | | | |
| | | Directors’ Retirement Plan
December 31, | | SERP
December 31, |
| | | 2007 | | 2006 | | 2007 | | 2006 |
Projected benefit obligation | | $ | 803 | | $ | 577 | | $ | 1,781 | | $ | 1,541 |
Accumulated benefit obligation | | | 753 | | | 530 | | | 1,518 | | | 1,259 |
Fair value of plan assets | | | — | | | — | | | — | | | — |
| | | | |
| ESB Financial Corporation | | 57 | | 2007 Annual Report |
Notes to Consolidated Financial Statements (continued)
| 10. | Employee Benefit Plans (continued) |
| | | | | | | | | | | | | | | | | | |
(Dollar amounts in thousands) | | Directors’ Retirement Plan
December 31, | | SERP
December 31, |
| | 2007 | | 2006 | | 2005 | | 2007 | | 2006 | | 2005 |
Net Periodic Pension Cost | | | | | | | | | | | | | | | | | | |
Service cost | | $ | 7 | | $ | 12 | | $ | 16 | | $ | 51 | | $ | 56 | | $ | 43 |
Interest cost | | | 33 | | | 31 | | | 26 | | | 96 | | | 97 | | | 75 |
Amortization of transition obligation | | | — | | | — | | | — | | | 58 | | | 74 | | | 52 |
Amortization of prior service cost | | | 63 | | | 63 | | | 59 | | | — | | | — | | | — |
| | | | | | | | | | | | | | | | | | |
Net periodic pension cost | | $ | 103 | | $ | 106 | | $ | 101 | | $ | 205 | | $ | 227 | | $ | 170 |
| | | | | | | | | | | | | | | | | | |
The estimated net loss and prior service cost for the SERP and director’s retirement plan plans that will be amortized from accumulated other comprehensive loss into net periodic benefit cost over the next fiscal year are $65,514 and $86,945, respectively.
The weighted average assumptions used to determine benefit obligations and net periodic pension cost at the measurement dates were as follows:
| | | | | | | | | | | | |
| | | Directors’ Retirement Plan | | | SERP | |
| | | 2007 | | | 2006 | | | 2007 | | | 2006 | |
Discount rate | | 6.00 | % | | 6.00 | % | | 6.00 | % | | 6.00 | % |
Rate of compensation increase | | n/a | | | n/a | | | 4.00 | % | | 4.00 | % |
The long-term rate of return on plan assets gives consideration to returns currently being earned on plan assets, as well as future rates expected to be earned.
The Company expects to contribute $86,658 to the director’s retirement plan in 2008.
At December 31, 2007 the projected benefit payments for the director’s retirement plan were $86,658, $101,007, $119,838, $145,377, $145,090 and $352,932 for years 2008, 2009, 2010, 2011, 2012 and thereafter, respectively. At December 31, 2007, the projected benefit payments for the SERP were $45,000, $85,000, $85,000, $85,000, $85,000 and $3.0 million for years 2008, 2009, 2010, 2011, 2012 and thereafter. The projected payments were calculated using the same assumptions as those used to calculate the benefit obligations listed above.
| | | | |
| ESB Financial Corporation | | 58 | | 2007 Annual Report |
Notes to Consolidated Financial Statements (continued)
| 11. | Other Comprehensive Income (loss) (continued) |
| 11. | Other Comprehensive Income (loss) |
In complying with FAS No. 130, “Reporting Comprehensive Income”, the Company has developed the following table which includes the tax effects of the components of other comprehensive (loss) income. Other comprehensive (loss) income consists of net unrealized gain (loss) on securities available for sale and the net fair value adjustment on derivatives. Other comprehensive income and related tax effects for the years ended December 31 consists of:
| | | | | | | | | | | | |
(Dollar amounts in thousands) | | 2007 | | | 2006 | | | 2005 | |
Net Income: | | $ | 7,661 | | | $ | 10,616 | | | $ | 9,179 | |
Other Comprehensive income (loss) - net of tax (benefit) expense | | | | | | | | | | | | |
Fair value adjustment on securities available for sale, net of tax expense (benefit) of $3,302 in 2007, $368 in 2006 and ($5,712) in 2005 | | | 6,409 | | | | 715 | | | | (11,088 | ) |
Securities gains reclassified into earnings, net of tax (benefit) expense of ($202) in 2007, ($84) in 2006 and $188 in 2005 | | | (392 | ) | | | (163 | ) | | | 365 | |
Pension and postretirement amortization, net of tax expense of $41 in 2007 | | | 80 | | | | — | | | | — | |
Adjustment to minimum pension liability of the SERP plan, net of tax | | | | | | | | | | | | |
(benefit) expense of ($105) in 2007, $43 in 2006 and ($43) in 2005 | | | (203 | ) | | | 84 | | | | (84 | ) |
Fair value adjustment on derivatives, net of tax (benefit) of ($195) in 2007, ($32) in 2006 and ($24) in 2005 | | | (378 | ) | | | (63 | ) | | | (46 | ) |
| | | | | | | | | | | | |
Other Comprehensive income (loss) | | | 5,516 | | | | 573 | | | | (10,853 | ) |
| | | | | | | | | | | | |
Comprehensive income (loss) | | $ | 13,177 | | | $ | 11,189 | | | $ | (1,674 | ) |
| | | | | | | | | | | | |
| 12. | Commitments and Contingencies |
In the ordinary course of business, the Company has various outstanding commitments and contingent liabilities that are not reflected in the accompanying consolidated financial statements. In addition, the Company is involved in certain claims and legal actions arising in the ordinary course of business. The outcome of these claims and actions are not presently determinable; however, in the opinion of the Company’s management, after consulting legal counsel, the ultimate disposition of these matters will not have a material adverse effect on the Company’s financial position. The following table presents the notional amount of the Company’s off-balance sheet financial instruments as of December 31:
| | | | | | |
(Dollar amounts in thousands) | | 2007 | | 2006 |
Loans in process and commitments: | | | | | | |
Fixed interest rate | | $ | 12,180 | | $ | 14,432 |
Variable interest rate | | | 27,040 | | | 32,528 |
Lines of credit (unfunded): | | | | | | |
Commercial | | | 23,912 | | | 20,935 |
Consumer | | | 45,352 | | | 45,087 |
Letters of credit: | | | | | | |
Standby | | | 13,240 | | | 6,130 |
Interest Rate Cap Contracts | | | — | | | 50,000 |
Commitments to extend credit involve, to a varying degree, elements of credit and interest rate risk in excess of amounts recognized in the consolidated statement of financial condition. The Company’s exposure to credit loss in the event of non-performance by the other party for commitments to extend credit is represented by the contractual amount of these commitments, less any collateral value obtained. The Company uses the same credit policies in making commitments as for on-balance sheet instruments. The Company’s distribution of commitments to extend credit approximates the distribution of loans receivable outstanding. The fair value of the off balance sheet items approximated the carrying value of those items at those dates.
| | | | |
| ESB Financial Corporation | | 59 | | 2007 Annual Report |
Notes to Consolidated Financial Statements (continued)
In the ordinary course of business, the Company has entered into off-balance sheet financial instruments, consisting of commitments to extend credit, commitments under line of credit lending arrangements and letters of credit. Such financial instruments are recorded in the financial statements when they are funded or related fees are received.
The following methods and assumptions were used in estimating fair values of financial instruments.
Cash and cash equivalents – The carrying amounts of cash equivalents approximate their fair values.
Securities – Fair values for securities are based on quoted market prices.
Accrued interest receivable and payable – The carrying amounts of accrued interest approximate their fair values.
Loans receivable– For variable-rate loans that reprice frequently and have no significant change in credit risk, fair values are based on carrying values. Fair values for certain residential mortgage and consumer loans are based on quoted market prices of similar loans sold in conjunction with securitization transactions, adjusted for differences in loan characteristics. Fair values of commercial real estate and commercial business loans are estimated using discounted cash flow analyses, using interest rates currently being offered for loans with similar terms to borrowers of similar credit quality. Fair values of impaired loans are estimated using discounted cash flow analyses or underlying collateral values, where applicable.
Loans held for sale – The carrying amount for loans held for sale is a reasonable estimate of fair value.
FHLB stock– FHLB stock is restricted for trading purposes, and thus, the carrying value approximates fair value.
Deposits – The fair values disclosed for demand deposits are, by definition, equal to the amount payable on demand at the reporting date. Fair values for certificates of deposit are estimated using a discounted cash flow calculation that applies current market interest rates to a schedule of aggregated expected monthly maturities.
Borrowed funds and subordinated debt– For variable rate borrowings, fair values are based on carrying values. For fixed rate borrowings, fair values are based on the discounted value of contractual cash flows and on the Company’s current incremental borrowing rates for similar types of borrowing arrangements.
Advance payments by borrowers for taxes and insurance-The fair value of the advance payments by borrowers for taxes and insurance approximated the carrying value of those commitments at those dates.
Loan commitments – The fair value of loan commitments at December 31, 2007 and 2006 approximated the carrying value of those commitments at those dates.
Interest rate cap contracts- Estimated fair values of interest rate cap contracts are based on quoted market prices, dealer quotes and prices obtained from independent pricing services.
Bank owned life insurance (BOLI) – The fair value of BOLI at December 31, 2007 and 2006 approximated the cash surrender value of the policies at those dates.
| | | | |
| ESB Financial Corporation | | 60 | | 2007 Annual Report |
Notes to Consolidated Financial Statements (continued)
| 13. | Financial Instruments (continued) |
The following table sets forth the carrying amount and fair value of the Company’s financial instruments included in the consolidated statement of financial condition as of December 31:
| | | | | | | | | | | | |
(Dollar amounts in thousands) | | 2007 | | 2006 |
| | Carrying
amount | | Fair
value | | Carrying
amount | | Fair
value |
Financial assets: | | | | | | | | | | | | |
Cash and cash equivalents | | $ | 19,258 | | $ | 19,258 | | $ | 22,701 | | $ | 22,701 |
Securities | | | 1,059,972 | | | 1,059,972 | | | 1,143,924 | | | 1,143,924 |
Loans receivable and held for sale | | | 624,251 | | | 630,400 | | | 589,832 | | | 583,636 |
Accrued interest receivable | | | 9,639 | | | 9,639 | | | 9,871 | | | 9,871 |
FHLB stock | | | 31,450 | | | 31,450 | | | 34,343 | | | 34,343 |
Bank owned life insurance | | | 27,998 | | | 27,998 | | | 27,525 | | | 27,525 |
Interest rate cap contracts | | | — | | | — | | | 1,338 | | | 286 |
Financial liabilities: | | | | | | | | | | | | |
Deposits | | | 842,854 | | | 848,216 | | | 823,644 | | | 826,914 |
Borrowed funds | | | 825,208 | | | 834,013 | | | 899,709 | | | 895,112 |
Junior subordinated notes | | | 51,519 | | | 50,045 | | | 51,444 | | | 46,778 |
Advance payment by borrowers for taxes and insurance | | | 2,579 | | | 2,579 | | | 2,427 | | | 2,427 |
Accrued interest payable | | | 5,168 | | | 5,168 | | | 5,587 | | | 5,587 |
| 14. | Regulatory Matters and Insurance of Accounts |
The Company’s subsidiary bank, ESB Bank, is subject to various regulatory capital requirements administered by the federal banking agencies. Failure to meet minimum capital requirements could result in certain mandatory – and possibly additional discretionary – actions by regulators that, if undertaken, could have a direct material effect on the Company’s consolidated financial statements. Under capital adequacy guidelines and the regulatory framework for prompt corrective action, the Bank must meet specific capital guidelines that involve quantitative measures of assets, liabilities and certain off-balance sheet items as calculated under regulatory accounting practices. The capital amounts and their related classification for the Bank are also subject to qualitative judgments by the regulators about components, risk weightings and other factors. Quantitative measures established by regulation to ensure capital adequacy requires the Bank to maintain minimum amounts and ratios (set forth in the table below) of total capital (as defined in the regulations), tier 1 leverage capital (as defined) and tier 1 risk-based capital (as defined). As of December 31, 2007, the Bank meets all capital adequacy requirements to which it is subject.
As of December 31, 2007 and 2006, the most recent notification from the FDIC categorized the Bank as well capitalized under the regulatory framework for prompt corrective action. To be categorized as well capitalized, the Bank must maintain minimum total, tier 1 leverage and tier 1 risk-based capital ratios as set forth in the following table. As of December 31, 2007, there are no conditions or events since that notification that have changed the categorization.
Tier 1 leverage capital level in the following table is presented as a percentage of total adjusted assets (as defined in the regulations); total capital and tier 1 risk based capital levels are shown as a percentage of risk-weighted assets (as defined).
| | | | |
| ESB Financial Corporation | | 61 | | 2007 Annual Report |
Notes to Consolidated Financial Statements (continued)
| 14. | Regulatory Matters and Insurance of Accounts (continued) |
The minimum required regulatory capital percentages to be well capitalized under prompt corrective action provisions is 5%, 6% and 10% for tier 1 leverage, tier I risk-based and total capital ratios, respectively.
The FDIC through the Deposit Insurance Fund insures deposits of account holders up to $100,000 per insured depositor. To provide for this insurance, the Bank must pay an annual premium.
The following table sets forth certain information concerning regulatory capital of the Bank:
| | | | | | | | | | | | | | | | | | | |
| | | Actual | | | For Capital
Adequacy
Purposes: | | To Be Well
Capitalized Under
Prompt Corrective
Action Provisions: | |
(Dollar amounts in thousands) | | Amount | | Ratio | | | Amount | | Ratio | | Amount | | Ratio | |
As of December 31, 2007: | | | | | | | | | | | | | | | | | |
Total Capital
(to Risk Weighted Assets) | | $ | 138,612 | | 15.60 | % | | $ | 71,082 | | 8.00% | | $ | 88,853 | | 10.00 | % |
Tier 1 Leverage Capital
(to Adjusted Tangible Assets) | | $ | 133,195 | | 7.33 | % | | $ | 72,699 | | 4.00% | | $ | 90,874 | | 5.00 | % |
Tier 1 Risk Based Capital
(to Risk Weighted Assets) | | $ | 133,195 | | 14.99 | % | | $ | 35,541 | | 4.00% | | $ | 53,312 | | 6.00 | % |
| | | | | | |
As of December 31, 2006: | | | | | | | | | | | | | | | | | |
Total Capital
(to Risk Weighted Assets) | | $ | 137,278 | | 15.70 | % | | $ | 69,937 | | 8.00% | | $ | 87,421 | | 10.00 | % |
Tier 1 Leverage Capital
(to Adjusted Tangible Assets) | | $ | 132,152 | | 7.21 | % | | $ | 73,286 | | 4.00% | | $ | 91,608 | | 5.00 | % |
Tier 1 Risk Based Capital
(to Risk Weighted Assets) | | $ | 132,152 | | 15.12 | % | | $ | 34,968 | | 4.00% | | $ | 52,453 | | 6.00 | % |
| | | | |
| ESB Financial Corporation | | 62 | | 2007 Annual Report |
Notes to Consolidated Financial Statements (continued)
| 15. | Quarterly Financial Data (unaudited) |
Quarterly earnings per share data may vary from annual earnings due to rounding.
| | | | | | | | | | | | | | |
(Dollar amounts in thousands, except share data) | | First
Quarter | | Second
Quarter | | | Third
Quarter | | Fourth
Quarter | |
2007: | | | | | | | | | | | | | | |
Interest income | | $ | 24,314 | | $ | 24,271 | | | $ | 24,552 | | $ | 24,447 | |
Interest expense | | | 17,764 | | | 17,952 | | | | 18,437 | | | 18,448 | |
| | | | | | | | | | | | | | |
Net interest income | | | 6,550 | | | 6,319 | | | | 6,115 | | | 5,999 | |
Provision for loan losses | | | 326 | | | 185 | | | | 156 | | | 198 | |
| | | | | | | | | | | | | | |
Net interest income after provision for loan losses | | | 6,224 | | | 6,134 | | | | 5,959 | | | 5,801 | |
Net realized gain (loss) on sale of securities available for sale | | | — | | | (2 | ) | | | 28 | | | (122 | ) |
Other noninterest income | | | 1,816 | | | 1,944 | | | | 2,055 | | | 1,497 | |
Noninterest expense | | | 5,998 | | | 5,918 | | | | 5,895 | | | 5,462 | |
| | | | | | | | | | | | | | |
Income before income taxes | | | 2,042 | | | 2,158 | | | | 2,147 | | | 1,714 | |
Provision for income taxes | | | 109 | | | 148 | | | | 116 | | | 27 | |
| | | | | | | | | | | | | | |
Net income | | $ | 1,933 | | $ | 2,010 | | | $ | 2,031 | | $ | 1,687 | |
| | | | | | | | | | | | | | |
Net income per share | | | | | | | | | | | | | | |
Basic | | $ | 0.15 | | $ | 0.16 | | | $ | 0.16 | | $ | 0.14 | |
Diluted | | $ | 0.15 | | $ | 0.16 | | | $ | 0.16 | | $ | 0.14 | |
| | | | |
2006: | | | | | | | | | | | | | | |
Interest income | | $ | 22,455 | | $ | 23,419 | | | $ | 24,204 | | $ | 24,393 | |
Interest expense | | | 14,646 | | | 16,026 | | | | 17,202 | | | 17,930 | |
| | | | | | | | | | | | | | |
Net interest income | | | 7,809 | | | 7,393 | | | | 7,002 | | | 6,463 | |
Provision for loan losses | | | 193 | | | 102 | | | | 274 | | | 544 | |
| | | | | | | | | | | | | | |
Net interest income after provision for loan losses | | | 7,616 | | | 7,291 | | | | 6,728 | | | 5,919 | |
Net realized gain on sale of securities available for sale | | | — | | | 113 | | | | 367 | | | — | |
Other noninterest income | | | 1,378 | | | 1,986 | | | | 2,159 | | | 1,783 | |
Noninterest expense | | | 5,717 | | | 5,845 | | | | 6,004 | | | 5,841 | |
| | | | | | | | | | | | | | |
Income before income taxes | | | 3,277 | | | 3,545 | | | | 3,250 | | | 1,861 | |
Provision for (benefit of) income taxes | | | 482 | | | 535 | | | | 515 | | | (215 | ) |
| | | | | | | | | | | | | | |
Net income | | $ | 2,795 | | $ | 3,010 | | | $ | 2,735 | | $ | 2,076 | |
| | | | | | | | | | | | | | |
Net income per share | | | | | | | | | | | | | | |
Basic | | $ | 0.22 | | $ | 0.24 | | | $ | 0.22 | | $ | 0.16 | |
Diluted | | $ | 0.22 | | $ | 0.23 | | | $ | 0.21 | | $ | 0.16 | |
| | | | |
| ESB Financial Corporation | | 63 | | 2007 Annual Report |
Notes to Consolidated Financial Statements (continued)
| 16. | ESB Financial Corporation – Condensed Financial Statements (Parent Company Only) |
Following are condensed financial statements for the parent company as of and for the years ended December 31:
Condensed Statements of Financial Condition
| | | | | | |
(Dollar amounts in thousands) | | 2007 | | 2006 |
Assets: | | | | | | |
Interest-earning deposits | | $ | 647 | | $ | 818 |
Securities available for sale | | | 2,204 | | | 2,601 |
Equity in net assets of subsidiaries | | | 199,373 | | | 200,795 |
Other assets | | | 5,418 | | | 5,188 |
| | | | | | |
Total assets | | $ | 207,642 | | $ | 209,402 |
| | | | | | |
Liabilities and stockholders’ equity: | | | | | | |
Subordinated debt, net | | $ | 51,519 | | $ | 51,444 |
Payable to subsidiaries | | | 9,250 | | | 12,750 |
Accrued expenses and other liabilities | | | 14,028 | | | 16,673 |
Stockholders’ equity | | | 132,845 | | | 128,535 |
| | | | | | |
Total liabilities and stockholders’ equity | | $ | 207,642 | | $ | 209,402 |
| | | | | | |
Condensed Statements of Operations
| | | | | | | | | | | | |
(Dollar amounts in thousands) | | 2007 | | | 2006 | | | 2005 | |
Income: | | | | | | | | | | | | |
Equity in undistributed net income of subsidiaries | | $ | 1,553 | | | $ | 5,935 | | | $ | 2,947 | |
Dividends from subsidiaries | | | 9,000 | | | | 7,500 | | | | 9,000 | |
Management fee income, from subsidiaries | | | 24 | | | | 24 | | | | 176 | |
Net realized gain (loss) on sale of securities available for sale | | | 274 | | | | 47 | | | | (44 | ) |
Interest and other income | | | 266 | | | | 306 | | | | 196 | |
| | | | | | | | | | | | |
Total income | | | 11,117 | | | | 13,812 | | | | 12,275 | |
| | | |
Expense: | | | | | | | | | | | | |
Interest expense, to subsidiary | | | 4,787 | | | | 4,975 | | | | 4,492 | |
Compensation and employee benefits | | | 181 | | | | 70 | | | | 70 | |
Other | | | 140 | | | | 162 | | | | 213 | |
| | | | | | | | | | | | |
Total expense | | | 5,108 | | | | 5,207 | | | | 4,775 | |
| | | | | | | | | | | | |
Income before benefit from income taxes | | | 6,009 | | | | 8,605 | | | | 7,500 | |
Benefit from income taxes | | | (1,652 | ) | | | (2,011 | ) | | | (1,679 | ) |
| | | | | | | | | | | | |
Net income | | $ | 7,661 | | | $ | 10,616 | | | $ | 9,179 | |
| | | | | | | | | | | | |
| | | | |
| ESB Financial Corporation | | 64 | | 2007 Annual Report |
Notes to Consolidated Financial Statements (continued)
| 16. | ESB Financial Corporation – Condensed Financial Statements (Parent Company Only) (continued) |
Condensed Statements of Cash Flows
| | | | | | | | | | | | |
(In thousands) | | 2007 | | | 2006 | | | 2005 | |
Operating activities: | | | | | | | | | | | | |
Net income | | $ | 7,661 | | | $ | 10,616 | | | $ | 9,179 | |
Adjustments to reconcile net income to net cash provided by (used in)operating activities: | | | | | | | | | | | | |
Equity in undistributed net income of subsidiaries | | | (1,553 | ) | | | (5,935 | ) | | | (2,947 | ) |
Gain on sale of securities available for sale | | | (414 | ) | | | — | | | | — | |
Compensation expense on ESOP | | | 941 | | | | 982 | | | | 1,024 | |
Other, net | | | 5,223 | | | | 3,378 | | | | (10,006 | ) |
| | | | | | | | | | | | |
Net cash provided by (used in) operating activities | | | 11,858 | | | | 9,041 | | | | (2,750 | ) |
| | | | | | | | | | | | |
Investing activities: | | | | | | | | | | | | |
Purchases of securities | | | (206 | ) | | | — | | | | — | |
Principal repayments of securities | | | 446 | | | | 513 | | | | — | |
Proceeds from the sale of securities available for sale | | | 1,241 | | | | — | | | | — | |
Net assets of PHSB acquired | | | — | | | | — | | | | (16,338 | ) |
| | | | | | | | | | | | |
Net cash provided by (used in) investing activities | | | 1,481 | | | | 513 | | | | (16,338 | ) |
| | | | | | | | | | | | |
Financing activities: | | | | | | | | | | | | |
(Decrease) increase in payable to subsidiaries | | | (3,500 | ) | | | 750 | | | | (8,000 | ) |
Issuance of junior subordinated notes | | | 75 | | | | 75 | | | | 36,158 | |
Proceeds received from exercise of stock options | | | 386 | | | | 177 | | | | 318 | |
Dividends paid | | | (5,097 | ) | | | (5,236 | ) | | | (5,082 | ) |
Payments to acquire treasury stock | | | (5,374 | ) | | | (5,311 | ) | | | (5,302 | ) |
| | | | | | | | | | | | |
Net cash (used in) provided by financing activities | | | (13,510 | ) | | | (9,545 | ) | | | 18,092 | |
| | | | | | | | | | | | |
(Decrease) increase in cash equivalents | | | (171 | ) | | | 9 | | | | (996 | ) |
Cash equivalents at beginning of period | | | 818 | | | | 809 | | | | 1,805 | |
| | | | | | | | | | | | |
Cash equivalents at end of period | | $ | 647 | | | $ | 818 | | | $ | 809 | |
| | | | | | | | | | | | |
| | | | |
| ESB Financial Corporation | | 65 | | 2007 Annual Report |
Report of Independent Registered Public Accounting Firm
Board of Directors and Shareholders
ESB Financial Corporation
We have audited the consolidated statements of financial condition of ESB Financial Corporation and subsidiaries as of December 31, 2007 and 2006, and the related consolidated statements of operation, changes in stockholders’ equity, and cash flows for each of the years in the three-year period ended December 31, 2007. We have also audited ESB Financial Corporation’s internal control over financial reporting as of December 31, 2007, based on criteria established inInternal Control—Integrated Framework issued by the Committee of Sponsoring Organizations of the Treadway Commission (COSO). Management is responsible for these consolidated financial statements, for maintaining effective internal control over financial reporting, and for its assessment of the effectiveness of internal control over financial reporting included in the accompanyingReport on Management’s Assessment of Internal Control over Financial Reporting. Our responsibility is to express an opinion on these consolidated financial statements and an opinion on the company’s internal control over financial reporting based on our audits.
We conducted our audits in accordance with the standards of the Public Company Accounting Oversight Board (United States). Those standards require that we plan and perform the audits to obtain reasonable assurance about whether the financial statements are free of material misstatement and whether effective internal control over financial reporting was maintained in all material respects. Our audits of the consolidated financial statements include examining, on a test basis, evidence supporting the amounts and disclosures in the financial statements, assessing the accounting principles used and significant estimates made by management, and evaluating the overall financial statement presentation. Our audit of internal control over financial reporting included obtaining an understanding of internal control over financial reporting, assessing the risk that a material weakness exists, and testing and evaluating the design and operating effectiveness of internal control bases on the assessed risk. Our audits also included performing such other procedures as we considered necessary in the circumstances. We believe that our audits provide a reasonable basis for our opinion.
A company’s internal control over financial reporting is a process designed to provide reasonable assurance regarding the reliability of financial reporting and the preparation of financial statements for external purposes in accordance with generally accepted accounting principles. A company’s internal control over financial reporting includes those policies and procedures that (1) pertain to the maintenance of records that, in reasonable detail, accurately and fairly reflect the transactions and dispositions of the assets of the company; (2) provide reasonable assurance that transactions are recorded as necessary to permit preparation of financial statements in accordance with generally accepted accounting principles, and that receipts and expenditures of the company are being made only in accordance with authorizations of management and directors of the company; and (3) provide reasonable assurance regarding prevention or timely detection of unauthorized acquisition, use, or disposition of the company’s assets that could have a material effect on the financial statements.
Because of its inherent limitations, internal control over financial reporting may not prevent or detect misstatements. Also, projections of any evaluation of effectiveness to future periods are subject to the risk that controls may become inadequate because of changes in conditions, or that the degree of compliance with the policies or procedures may deteriorate.
In our opinion, the consolidated financial statements referred to above present fairly, in all material respects, the consolidated financial position of ESB Financial Corporation and subsidiaries as of December 31, 2007 and 2006, and the consolidated results of their operations and cash flows for each of the years in the three-year period ended December 31, 2007, in conformity with U.S. generally accepted accounting principles. Also in our opinion, ESB Financial Corporation maintained, in all material respects, effective internal control over financial reporting as of December 31, 2007, based on criteria established inInternal Control - Integrated Framework issued by the Committee of Sponsoring Organizations of the Treadway Commission (COSO).
|
| /s/ S.R Snodgrass, A.C. |
| Wexford, Pennsylvania |
| March 7, 2008 |
| | | | |
| ESB Financial Corporation | | 66 | | 2007 Annual Report |
Management’s Reports to ESB Financial Corporation Shareholders
Management’s Report on Financial Statements and Practices
ESB Financial Corporation is responsible for the preparation, integrity, and fair presentation of the consolidated financial statements included in this annual report. The consolidated financial statements and notes included in this annual report have been prepared in conformity with United States generally accepted accounting principles and necessarily include some amounts that are based on management’s best estimates and judgments.
The system of internal control over financial reporting as it relates to the financial statements is evaluated for effectiveness by management and tested for reliability through a program of internal audits. Actions are taken to correct potential deficiencies as they are identified. Any system of internal control, no matter how well designed, has inherent limitations, including the possibility that a control could be circumvented or overridden and misstatements due to error or fraud may occur and not be detected. Also, because of changes in conditions, internal control effectiveness may vary over time. Accordingly, even an effective system of internal control will provide only reasonable assurance with respect to financial statement preparation.
The Audit Committee, consisting entirely of independent directors, meets regularly with management, internal auditors and the independent registered public accounting firm, and reviews audit plans and results, as well as management’s actions taken in discharging responsibilities for accounting, financial reporting, and internal control. S.R. Snodgrass, independent registered public accounting firm, and the internal auditors have direct and confidential access to the Audit Committee at all times to discuss the results of their examinations.
Report on Management’s Assessment of Internal Control Over Financial Reporting
We, as management of ESB Financial Corporation, are responsible for establishing and maintaining effective internal control over financial reporting that is designed to produce reliable financial statements in conformity with United States generally accepted accounting principles. Management assessed the Corporation’s system of internal control over financial reporting as of December 31, 2007, in relation to criteria for effective internal control over financial reporting as described in “Internal Control – Integrated Framework,” issued by the Committee of Sponsoring Organizations of the Treadway Commission. Based on this assessment, management concludes that, as of December 31, 2007, its system of internal control over financial reporting is effective and meets the criteria of the “Internal Control – Integrated Framework”. S.R. Snodgrass, independent registered public accounting firm, has issued an attestation report on management’s assessment of the Corporation’s internal control over financial reporting.
|
| /s/ Charlotte A. Zuschlag |
| Charlotte A. Zuschlag |
| President and Chief Executive Officer |
|
| /s/ Charles P. Evanoski |
| Charles P. Evanoski |
| Group Senior Vice President and Chief Financial Officer |
|
| March 7, 2008 |
| | | | |
| ESB Financial Corporation | | 67 | | 2007 Annual Report |
Stock and Dividend Information
Listings and Markets
ESB Financial Corporation common stock is traded on the NASDAQ Global Select Stock Market under the symbol “ESBF”. Some of the listed market makers for the Company’s common stock include:
| | | | |
| | |
Stanford Group Company 5051 Westheimer Houston, Texas 77056 Telephone: (800) 958-0009 | | Keefe, Bruyette & Woods, Inc. 787 7th Avenue, 4th Flr New York, NY 10019 Telephone: (800) 966-1559 | |  |
Stifel Nicolaus & Co., Inc. 220 Livingston Orange Avenue Livingston, NJ 07039 Telephone: (800) 223-8969 | | UBS Financial Services One North Wacker Drive, 35th Flr Chicago, IL 60606 Telephone: (800) 525-4313 | |
Number of Stockholders and Shares Outstanding
As of December 31, 2007, there were 2,728 registered stockholders of record and 12,407,064 shares of common stock outstanding entitled to vote, receive dividends and considered outstanding for financial reporting purposes. The number of stockholders of record does not include the number of persons or entities who hold their stock in nominee or “street” name.
Dividend Reinvestment Plan
Common stockholders may have cash dividends reinvested to purchase additional shares. Participants may also make optional cash purchases of common stock through the reinvestment plan and pay no brokerage commissions or fees. To obtain a plan prospectus and authorization card call (800) 368-5948.
Registrar and Transfer Agent
Registrar and Transfer Company
10 Commerce Drive
Cranford, NJ 07016
Cash Dividends
The Company has paid regular quarterly cash dividends since its inception in June 1990. During the past two years ended December 31, 2007, the Company declared cash dividends with the following record and payment dates:
| | | | | |
Record Date | | Payment Date | | Cash Dividends
per Share |
December 31, 2007 | | January 25, 2008 | | $ | 0.10 |
September 28, 2007 | | October 25, 2007 | | $ | 0.10 |
June 29, 2007 | | July 25, 2007 | | $ | 0.10 |
March 30, 2007 | | April 25, 2007 | | $ | 0.10 |
| | |
December 29, 2006 | | January 25, 2007 | | $ | 0.10 |
September 29, 2006 | | October 25, 2006 | | $ | 0.10 |
June 30, 2006 | | July 25, 2006 | | $ | 0.10 |
March 31, 2006 | | April 25, 2006 | | $ | 0.10 |
| | | | |
| ESB Financial Corporation | | 68 | | 2007 Annual Report |
Stock and Dividend Information (continued)
Stock Splits and Dividends
The Company has declared the following stock splits or dividends since its inception:
| | | | | |
Record Date | | Payment Date | | Percentage
Issued | |
May 1, 2003 | | May 15, 2003 | | 20 | % |
September 30, 2002 | | October 25, 2002 | | 20 | % |
May 18, 2001 | | May 30, 2001 | | 20 | % |
May 17, 2000 | | May 31, 2000 | | 10 | % |
May 15, 1998 | | May 29, 1998 | | 10 | % |
July 31, 1997 | | August 25, 1997 | | 10 | % |
December 31, 1994 | | January 25, 1995 | | 20 | % |
December 31, 1993 | | January 25, 1994 | | 20 | % |
May 12, 1993 | | June 7, 1993 | | 20 | % |
December 31, 1992 | | January 25, 1993 | | 20 | % |
June 30, 1992 | | July 25, 1992 | | 20 | % |
December 31, 1991 | | January 25, 1992 | | 20 | % |
Stock Price Information
The bid and ask price of the Company’s common stock were $10.17 and $10.19, respectively, as of January 31, 2008.
The following table sets forth the high and low sale market prices of the Company’s common stock as of and during the quarterly periods presented:
| | | | | | | | | |
| | | Market Price |
| | | High | | Low | | Close |
2007 Quarter Ended | | | | | | | | | |
December 31 | | $ | 10.78 | | $ | 9.90 | | $ | 10.00 |
September 30 | | | 11.10 | | | 9.57 | | | 10.60 |
June 30 | | | 11.31 | | | 10.60 | | | 11.03 |
March 31 | | | 11.50 | | | 10.65 | | | 10.88 |
| | | |
2006 Quarter Ended | | | | | | | | | |
December 31 | | $ | 11.79 | | $ | 10.30 | | $ | 11.00 |
September 30 | | | 12.05 | | | 10.60 | | | 11.00 |
June 30 | | | 12.49 | | | 11.56 | | | 11.56 |
March 31 | | | 13.00 | | | 10.81 | | | 12.00 |
| | | | |
| ESB Financial Corporation | | 69 | | 2007 Annual Report |
Stock and Dividend Information (continued)
Performance Graph
The following graph compared the yearly cumulative total return on the common stock over a five-year measurement period with the yearly cumulative total return on the stocks included in (i) the NASDAQ – Total US companies and (ii) the SNL Securities All Banks and Thrifts Index. All of these cumulative returns are computed assuming the reinvestment of dividends at the frequency with which dividends were paid during the applicable year.
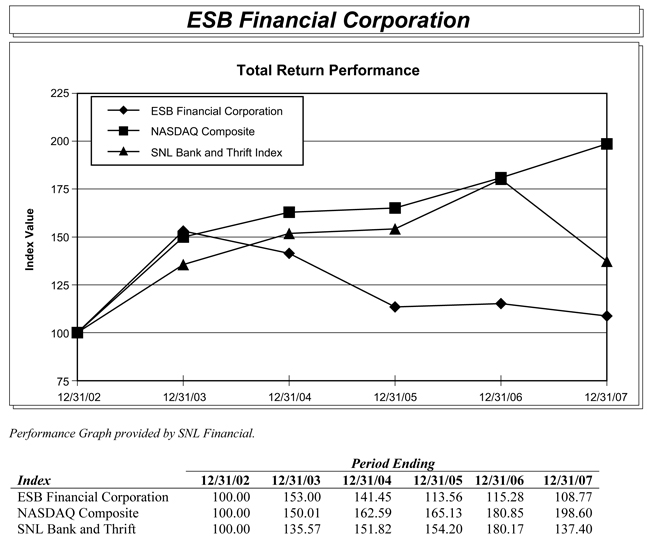
| | | | |
| ESB Financial Corporation | | 70 | | 2007 Annual Report |
Corporate Information
Annual Meeting
The annual meeting of the Company’s stockholders will be held at 4:00 p.m., on Wednesday, April 16, 2008, at the Connoquenessing Country Club, 1512 Mercer Road, Ellwood City, PA 16117.
Stockholder and Investor Information
Copies of annual reports on Form 10-K, quarterly reports on Form 10-Q, current reports on Form 8-K and related stockholder literature are available upon written request without charge to stockholders. Requests should be addressed to Frank D. Martz, Group Senior Vice President of Operations and Corporate Secretary, ESB Financial Corporation, 600 Lawrence Avenue, Ellwood City, PA 16117.
We make available on our website,www.esbbank.com, our annual report on Form 10-K, quarterly reports on Form 10-Q and current reports on Form 8-K, on the date which we electronically file these reports with the Securities and Exchange Commission, as well as our code of ethics. Investors are encouraged to access these reports and the other information about our business and operations on our web site.
Equal Employment Opportunity
ESB Financial Corporation has adopted an affirmative action program to assure equal opportunity for every employee and hires, trains, promotes, compensates and makes all other employment decisions without regard to race, color, religion, sex, age, national origin, disability or veteran status.
Corporate Headquarters
ESB Financial Corporation
600 Lawrence Avenue
Ellwood City, PA 16117
Phone: (724) 758-5584
Subsidiary Companies
| | |
ESB Bank | | PennFirst Financial Services, Inc. |
ESB Financial Services, Inc. | | ESB Capital Trust II |
AMSCO, Inc. | | ESB Statutory Trust III |
AMS Ventures, LLC | | ESB Capital Trust IV |
Madison Woods Joint Venture | | THF, Inc d/b/a Elite Settlement Services |
The Links at Deer Run Associates, LLC | | |
McCormick Farms, LLC | | |
Brandy One, LLC | | |
The Vineyards at Brandywine, LP | | |
Cobblestone Village, LP | | |
The Meadows at Hampton, LP | | |
Springfield Partners, LP | | |
Belle Vue Park | | |
MW 42 | | |
| |
| Independent Registered Public Accounting Firm | | Special Counsel |
| |
S.R. Snodgrass, A.C. | | Elias, Matz, Tiernan & Herrick L.L.P. |
2100 Corporate Drive, Suite 400 | | 734 15th Street, NW |
Wexford, PA 15090 | | Washington, DC 20005 |
| | | | |
| ESB Financial Corporation | | 71 | | 2007 Annual Report |
Board of Directors
| | |
|
| ESB FINANCIAL CORPORATION |
| |
| William B. Salsgiver | | Charles Delman |
Chairman of the Board | | Retired Chairman, President & CEO - ESB Bancorp, Inc. |
A Principal - Perry Homes | | |
| |
| Herbert S. Skuba | | Mario J. Manna |
Vice Chairman of the Board | | Retired Tax Collector - Borough of Coraopolis |
Director, President & CEO - Ellwood City Hospital | | |
| |
| Charlotte A. Zuschlag | | Lloyd L. Kildoo |
President & Chief Executive Officer | | Owner & Funeral Director - Glenn-Kildoo Funeral Homes |
| |
| | James P. Wetzel, Jr. |
| | Retired President & CEO - PHSB Financial Corporation |
|
| ESB BANK |
| |
| William B. Salsgiver | | Johanna C. Guehl |
Chairman of the Board | | Owner- Law Offices of Johanna C. Guehl |
A Principal - Perry Homes | | Affiliate - Kathy L. Hess & Associates, CPA’s |
| |
| Herbert S. Skuba | | Lloyd L. Kildoo |
Vice Chairman of the Board | | Owner & Funeral Director - Glenn-Kildoo Funeral Homes |
Director, President & CEO - Ellwood City Hospital | | |
| |
| Charlotte A. Zuschlag | | Mario J. Manna |
President & Chief Executive Officer | | Retired Tax Collector - Borough of Coraopolis |
| |
| Raymond K. Aiken | | Joseph W. Snyder |
Retired President & COO - Lockhart Chemical Co. | | Sourcing Agent - Equitable Resources, Inc. |
| |
| Joseph D. Belas | | Jefrey F. Wall |
Retired Director- PHSB Financial Corporation | | Business Manager, Rochester Area School District |
| |
| Charles Delman | | James P. Wetzel, Jr. |
Retired Chairman, President & CEO - ESB Bancorp, Inc. | | Retired President & CEO - PHSB Financial Corporation |
|
| ESB BANK- DIRECTOR EMERITUS |
| |
| Guy Dille, CPA | | Edward W. Preskar, RA |
Retired Chief Financial Officer - Williams & Company, Inc. | | Retired Director of Facilities- School District of Pittsburgh |
| | | | |
| ESB Financial Corporation | | 72 | | 2007 Annual Report |
Corporate Officers, Advisory Board and Bank Officers
| | |
ESB FINANCIAL CORPORATION | | ESB BANK, (continued) |
William B. Salsgiver | | Senior Vice Presidents(continued) |
Chairman of the Board | | John T. Stunda |
Charlotte A. Zuschlag | | Bonita L. Wadding |
President & Chief Executive Officer | | |
| | Vice Presidents |
Group Senior Vice Presidents | | Deborah A. Allen |
Thomas F. Angotti - Administration | | Kathleen A. Bender |
Charles P. Evanoski - Chief Financial Officer | | Charlotte M. Bolinger |
Frank D. Martz- Operations & Corporate Secretary | | Thomas E. Campbell |
Todd F. Palkovich - Lending | | Louis C. Frischkorn |
| | Nancy A. Glitsch |
Senior Vice Presidents | | Deborah S. Goehring |
Robert A. Ackerman- Audit & Loan Review | | Peter J. Greco |
Richard E. Canonge- Treasurer | | Paul F. Hoyson |
Robert J. Colalella- Marketing | | Brian W. Hulme |
John W. Donaldson II- Lending | | Mary Ann Leonardo |
Teresa Krukenberg- Operations | | Sally A. Mannarino |
Ronald J. Mannarino- Asset/Liability Management | | Larry Mastrean |
Mark A. Platz- Information Technology | | John J. Mottes |
Ronald E. Pompeani- Lending | | Joseph R. Pollock, III |
Marilyn Scripko- Lending and CRA Officer | | Pamela K. Zikeli |
John T. Stunda- Human Resources | | |
Bonita L. Wadding- Controller | | Assistant Vice Presidents |
| | Susan B. Antolic |
ESB BANK, ADVISORY BOARD | | Kelley J. Avena |
Charles Delman | | Janet S. Barletta |
Retired Chairman, President & CEO - ESB Bancorp, Inc. | |
James D. Bish |
George C. Dorsch | | Judy L. Diesing |
Retired Engineer - | | Susan C. Fisher |
Dept. of Transportation, Commonwealth of Pennsylvania | |
Theresa A. Gerst |
Dr. Allan Gastfriend | | Christine L. Gillen |
Retired Dentist | | Margaret A. Haefele |
Watson F. McGaughey, Jr. | | G. Fred Knopp, Jr. |
Retired President - McGaughey Buses, Inc. | | Penny K. Koch |
Donald R. Miller | | David L. Kramer |
Retired President - Miller & Sons Chevrolet | | Mary C. Magestro |
| | Barbara E. Martinelli |
ESB BANK | | Beth A. McClymonds |
William B. Salsgiver | | Kristin E. McKelvey |
Chairman of the Board | | Marianne L. Mills |
Charlotte A. Zuschlag | | Ann R. Nelson |
President & Chief Executive Officer | | Jonathan D. Newell |
| | James P. Perenovich |
Group Senior Vice Presidents | | Deborah F. Pagley |
Thomas F. Angotti | | Timothy S. Robinson |
Charles P. Evanoski | | Cynthia L. Scaramazza |
Frank D. Martz | | Jackie A. Smith |
Todd F. Palkovich | | Kathy A. Smyth |
| | Sharon L. Speicher |
Senior Vice Presidents | | Karla L. Spinelli |
Robert A. Ackerman | | Joyce A. Stellitano |
Richard E. Canonge | | Robert Tatka |
Robert J. Colalella | | Volynda Teets |
John W. Donaldson II | | Janice L. Voynik |
Teresa Krukenberg | | |
Ronald J. Mannarino | | Assistant Secretaries |
Mark A. Platz | | Linda A. MacMurdo |
Ronald E. Pompeani | | Dana M. Martz |
Marilyn Scripko | | Robin Scheffler |
| | THF, Inc. |
| | Rocco Abbatangelo - President |
| | | | |
| ESB Financial Corporation | | 73 | | 2007 Annual Report |
Board of Directors
[Photo Omitted]
Board of Directors of ESB Bank are seated from left, William B. Salsgiver, Lloyd L. Kildoo, Mario J. Manna, Jefrey F. Wall and Charles Delman. Standing from the left are Herbert S. Skuba, Charlotte A. Zuschlag, Joseph W. Snyder, James P. Wetzel, Johanna C. Guehl, Raymond K. Aiken and Joseph D. Belas.
| | | | |
| ESB Financial Corporation | | 74 | | 2007 Annual Report |
A Very Special Thank You
[Photo Omitted]
The ESB Financial Corporation Board of Directors and its employees wish to express their appreciation and warmest thank you toThomas F. Angotti, who retired from our organization this past year.
Joining Spring Hill Savings Bank in 1987, Tom was named its President in 1989 and played an instrumental role in negotiating Spring Hill Savings Bank’s merger with ESB Bank in 2000. Joining ESB Bank as the Group Senior Vice President of Administration, Tom assumed responsibility to oversee the Bank’s Marketing, Facilities, CRA, Compliance, Human Resources and other Financial Services affiliations.
During the past twenty years, Tom has been an advocate for our industry and has consistently demonstrated a commitment to excellence and professional ethics. Please join us in extending our sincere gratitude to Tom for his devoted service to ESB Financial Corporation.
| | | | |
| ESB Financial Corporation | | 75 | | 2007 Annual Report |
Office Locations and Financial Services Managers
| | | | |
| ALIQUIPPA | | CORAOPOLIS | | NEW BRIGHTON |
| Janet Barletta, Financial Services Manager | | Jackie Smith, Financial Services Manager | | G. Fredd Knopp Jr, Financial Services Manager |
| Phone: 724-378-4436 | | Phone: 412-264-8862 | | Phone: 724-846-4920 |
| Fax: 724-378-1204 | | Fax: 412-264-5960 | | Fax: 724-846-7805 |
| 2301 Sheffield Road | | 900 Fifth Avenue | | 800 Third Avenue |
| Aliquippa, PA 15001 | | Coraopolis, PA 15108 | | New Brighton, PA 15066 |
| | |
| AMBRIDGE | | DARLINGTON | | NORTH SHORE |
| Sharon Speicher, Financial Services Manager | | Christine Gillen, Financial Services Manager | | Jan Orr, Assistant Financial Services Manager |
| Phone: 724-266-5002 | | Phone: 724-827-8500 | | Phone: 412-231-7297 |
| Fax: 724-266-6178 | | Fax: 724-827-8502 | | Fax: 412-231-4097 |
| 506 Merchant Street | | 233 Second Street, PO Box 305 | | 807 Middle Street |
| Ambridge, PA 15003 | | Darlington, PA 16115 | | Pittsburgh, PA 15212 |
| | |
| BALDWIN | | ELLWOOD CITY | | NORTHERN LIGHTS |
| Theresa Gerst, Financial Services Manager | | Pamela Zikeli, Regional Financial Services Manager | | David Kramer, Financial Services Manager |
| Phone: 412-655-8670 | | Phone: 724-758-5584 | | Phone: 724-869-2193 |
| Fax: 412-655-8116 | | Fax: 724-758-0576 | | Fax: 724-869-2196 |
| 5035 Curry Road | | 600 Lawrence Avenue | | 1555 Beaver Road |
| Pittsburgh, PA 15236 | | Ellwood City, PA 16117 | | Baden, PA 15005 |
| | |
| BEAVER | | FOX CHAPEL | | SHENANGO TOWNSHIP |
| Larry Mastrean, Regional Financial Services Manager | | Joyce Stellitano, Financial Services Manager | | Charlotte Bolinger, Financial Services Manager |
| Phone: 724-775-1052 | | Phone: 412-782-6500 | | Phone: 724-654-7781 |
| Fax: 724-775-6687 | | Fax: 412-782-1279 | | Fax: 724-654-1643 |
| 701 Corporation Street | | 1060 Freeport Road | | 2656 Ellwood Road |
| Beaver, PA 15009 | | Pittsburgh, PA 15238 | | New Castle, PA 16101 |
| | |
| BEAVER FALLS | | FRANKLIN TOWNSHIP | | SPRING HILL |
| Susan Fisher, Financial Services Manager | | Thomas Campbell, Financial Services Manager | | Marianne Mills, Financial Services Manager |
| Phone: 724-847-4004 | | Phone: 724-752-2500 | | Phone: 412-231-0819 |
| Fax: 724-846-0718 | | Fax: 724-752-2502 | | Fax: 412-231-0822 |
| 1427 Seventh Avenue | | 1793 Mercer Road | | Itin & Rhine Streets |
| Beaver Falls, PA 15010 | | Ellwood City, PA 16117 | | Pittsburgh, PA 15212 |
| | |
| BEECHVIEW | | HOPEWELL TOWNSHIP | | TROY HILL |
| Barbara Martinelli, Financial Services Manager | | Karla Spinelli, Financial Services Manager | | Margaret Haefele, Financial Services Manager |
| Phone: 412-344-7211 | | Phone: 724-378-0505 | | Phone: 412-231-8238 |
| Fax: 412-344-7213 | | Fax: 724-378-0530 | | Fax: 412-231-1910 |
| 1550 Beechview Avenue | | 2293 Broadhead Road | | 1706 Lowrie Street |
| Pittsburgh, PA 15216 | | Aliquippa, PA 15001 | | Pittsburgh, PA 15212 |
| | |
| CENTER TOWNSHIP | | NESHANNOCK TOWNSHIP | | WEXFORD |
| Judy Diesing, Financial Services Manager | | Cynthia Scaramazza, Financial Services Manager | | Deborah Allen, Regional Financial Services Manager |
| Phone: 724-774-0332 | | Phone: 724-658-8825 | | Phone: 724-934-8989 |
| Fax: 724-774-7869 | | Fax: 724-658-5483 | | Fax: 724-934-3026 |
| 3531 Broadhead Road | | 3360 Wilmington Road | | 101 Wexford-Bayne Road |
| Monaca, PA 15061 | | New Castle, PA 16105 | | Wexford, PA 15090 |
| | |
| CHIPPEWA TOWNSHIP | | | | ZELIENOPLE |
| Deborah Goehring, Financial Services Manager | | | | Kelley Avena, Financial Services Manager |
| Phone: 724-846-6200 | | | | Phone: 724-452-6500 |
| Fax: 724-846-6242 | | | | Fax: 724-452-6503 |
| 2521 Darlington Road | | | | 17 Northgate Plaza Unit 22 |
| Beaver Falls, PA 15010 | | | | Harmony, PA 16037 |

ESB FINANCIAL CORPORATION
600 Lawrence Ave
Ellwood City, PA 16117
Phone (724) 758-5584
www.esbbank.com