2004
ESB
FINANCIAL CORPORATION
| | |
 | | ANNUAL REPORT |
VALUES WE SHARE
CUSTOMER SATISFACTION
| | • | | Strive to exceed customer expectations |
| | • | | Listen, understand and respond to customer needs |
| | • | | Serve in a friendly, professional, caring way, adding that personal touch |
| | • | | Earn confidence and loyalty of customers through exceptional service |
INTEGRITY
| | • | | Uncompromising, adhere to highest professional and personal ethics |
| | • | | Accept responsibility, fulfill commitments and maintain credibility |
| | • | | Actions founded on honesty, fairness and trust |
EXCELLENCE
| | • | | Approach responsibilities with passion and commitment |
| | • | | Consistently endeavor to do the best job possible |
| | • | | Committed to the concept of rising expectations and continual improvement |
| | • | | Set challenging goals, learn from mistakes, demonstrate innovation and creativity and attention to detail |
TEAMWORK
| | • | | Value diversity and the contributions of others |
| | • | | Share information and expertise |
| | • | | Build trust and relationships through open candid communication |
| | • | | Enthusiastically work together to achieve common goals |
COMMUNITY INVOLVEMENT
| | • | | Give time, skills and resources to improve our communities |
| | • | | Be a positive role model; strive to make a difference |
LEADERSHIP
| | • | | Lead by example in both words and actions |
| | • | | Stimulate and relish opportunities for positive change |
| | • | | Recognize performance, effectively plan and communicate, demand quality |
| | • | | Respect others and encourage a balanced life approach |
Table of Contents
| | |
Consolidated Financial Highlights | | 1 |
Letter to Shareholders | | 3 |
Selected Consolidated Financial Data | | 6 |
Management’s Discussion and Analysis of Financial Condition and Results of Operations | | 7 |
Consolidated Financial Statements | | 26 |
Notes to Consolidated Financial Statements | | 31 |
Management’s Reports to ESB Financial Corporation Shareholders | | 62 |
Report of Independent Registered Public Accounting Firm | | 63 |
Stock and Dividend Information | | 65 |
Corporate Information | | 67 |
Board of Directors | | 68 |
Corporate Officers, Advisory Board and Bank Officers | | 69 |
Office Locations and Branch Managers | | 72 |
| | |
| Company Profile |
| |
 | | ESB Financial Corporation (Nasdaq: ESBF), a publicly traded financial services company, provides a wide range of retail and commercial financial products and services to customers in Western Pennsylvania through its wholly owned subsidiary bank, ESB Bank. ESB Bank, is a Pennsylvania chartered, FDIC insured stock savings bank which, as of December 31, 2004, conducted business through 16 offices in Allegheny, Beaver, Butler and Lawrence counties, Pennsylvania. To compliment retail and commercial operations conducted through its bank offices, the Company invests in U.S. Government, municipal and mortgage-backed securities through its subsidiary savings bank and through its investment subsidiary, PennFirst Financial Services, Inc., a Delaware corporation. |
Mission Statement |
| |
| | | The mission of ESB Financial Corporation and its subsidiaries is to effectively provide for the financial service needs of our customers and community while creating value for our shareholders. Our mission will be accomplished by growing in a profitable and controlled manner; by identifying and meeting the financial needs of our customers; by offering quality products and services that are competitively priced and serviced by a knowledgeable, attentive and friendly staff; and by creating a positive work environment that maximizes the alignment of customer and employee objectives. |
Consolidated Financial Highlights
(Dollar amounts in thousands, except share data)
| | | | | | | | | | | |
| | | As of or for the year ended December 31,
| | | | |
| | | 2004
| | | 2003
| | | Change
| |
Total assets | | $ | 1,394,515 | | | $ | 1,365,780 | | | 2 | % |
Loans receivable, net | | | 343,524 | | | | 322,454 | | | 7 | % |
Securities available for sale | | | 929,794 | | | | 928,936 | | | — | |
Total deposits | | | 580,346 | | | | 603,046 | | | (4 | )% |
Borrowed funds, including subordinated debt | | | 702,773 | | | | 652,489 | | | 8 | % |
Stockholders’ equity | | | 97,801 | | | | 96,871 | | | 1 | % |
Net interest income | | | 25,229 | | | | 21,615 | | | 17 | % |
Net income | | | 9,990 | | | | 8,524 | | | 17 | % |
Net income per share (diluted) (1) | | $ | 0.94 | | | $ | 0.80 | | | 18 | % |
Cash dividends declared per share (1) | | $ | 0.40 | | | $ | 0.38 | | | 5 | % |
Return on average assets | | | 0.73 | % | | | 0.63 | % | | 16 | % |
Return on average stockholders’ equity | | | 10.38 | % | | | 8.75 | % | | 19 | % |
| (1) | All per share amounts have been adjusted to reflect the six-for-five stock split paid in May of 2003. |
| | | | |
ESB Financial Corporation | | 1 | | 2004 Annual Report |
Consolidated Financial Highlights(continued)
| | |
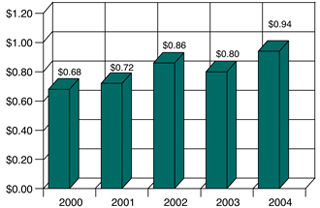
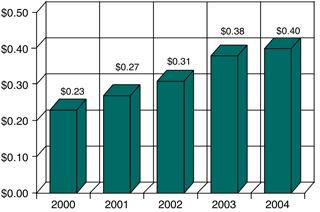
| Earnings Per Share Growth (diluted) | | Cash Dividends Declared Per Share |
| |
 | |  |
| | |
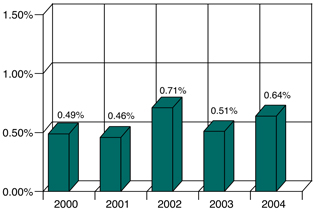
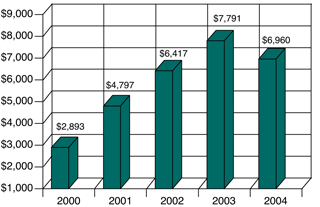
| Non-performing loans to total loans | | Noninterest income (in thousands) |
| |
 | |  |
| | | | |
ESB Financial Corporation | | 2 | | 2004 Annual Report |
Letter to Shareholders
| | |
| Dear Fellow Shareholders: | | |
| |
Thanks to the dedicated efforts of our employees and the guidance of our Board of Directors, the loyalty of our customers and the support of our shareholders, I am pleased to report that 2004 was another successful year for ESB Financial Corporation. Fiscal 2004 produced record earnings, growth through acquisition, a charter conversion, a new branch office, community recognition and the continued mutual respect among our employees. We achieved our successes while maintaining a resolute commitment to the business strategies that have delivered strong financial results since going public in 1990: customer satisfaction, prudent asset management, operational productivity and efficiency, enhanced technology, community service and the maintenance of the highest standards of ethics and business integrity. Our primary objective continues to be to create and maintain shareholder value while we pursue opportunities that will make ESB a better company going forward, building on the success of our past efforts. | |  |
Financial Performance
During the past year, our Company posted record earnings per diluted share of $0.94 on net income of $10.0 million, which represents a 17.5% increase in net income per diluted share as compared to earnings of $0.80 per diluted share on net income of $8.5 million for the year ended December 31, 2003. Our stock has returned a compounded rate of return of 19.35% since our conversion in 1990, including the reinvestment of dividends. During 2004, the Company maintained the current payout of $0.10 per share quarterly cash dividend, which extends our record of paying cash dividends to 58 consecutive quarters.
As in previous years, the Board of Directors approved a common stock repurchase program and, for the year, the Company repurchased approximately 230,958 shares with a market value of $3.1 million.
Acquisition of PHSB
In February 2005, we completed the acquisition of PHSB Financial Corporation and its subsidiary Peoples Home Savings Bank, which had assets of approximately $331.0 million, deposits of approximately $243.0 million and ten offices located in Beaver County and Lawrence County. ESB is now the largest locally owned community bank in both Beaver and Lawrence counties with the consummation of this transaction.
This acquisition represents the fifth acquisition since 1994 totaling approximately $727.0 million in asset growth, approximately $518.0 million in deposits and the addition of 18 branch locations in Allegheny and Beaver counties. These acquisitions are critical to our ability to fuel earnings growth, which enabled us to declare nine 20% stock splits and three 10% stock dividends, to leverage our operating efficiencies, to grow our network of branches, to expand our product line and to introduce new technologies that create work efficiencies and enable better customer service throughout the Bank. These strategies, in turn, are essential to our achieving our primary objective of creating shareholder value. I am confident that this merger will be accretive to the Company’s shareholders within the first year.
| | | | |
ESB Financial Corporation | | 3 | | 2004 Annual Report |
Letter to Shareholders(continued)
Conversion to a Pennsylvania Savings Bank
Effective January 23, 2004, the Bank converted from a federal savings bank to a Pennsylvania Chartered Bank. This conversion was advanced primarily for economic reasons in terms of the savings to be derived from reduced regulatory assessments as a state chartered institution with relatively no impact or additional restrictions in terms of operational capacity or regulatory oversight. As a result of the conversion, the primary regulator for the Bank changed from the Office of Thrift Supervision to the Pennsylvania Department of Banking and the Federal Deposit Insurance Corporation.
Branch Offices
Our newest community office, Neshannock Township, opened in August 2004. It is a full-service facility with a large lobby, safe deposit vault, six teller windows, a two-lane drive-up window with a 24-hour drive-up ATM and a night deposit box. This facility also provides private customer service offices to discuss loan alternatives and to provide brokerage and financial advisory services offered through ESB Financial Services Group, a division of the Bank.
In December, the Company closed its Springdale Office for cost efficiency reasons and consolidated the accounts with our nearby Fox Chapel Office.
Standards and Values
We continue to maintain the highest ethical standards and we place our values at the forefront of each and every business decision and strategic initiative. Our web site (www.esbbank.com) provides ready public access to our Code of Ethics and Values We Share statements, both of which convey the Company’s organizational and individual commitment to employees, customers, shareholders and our communities. These principles are ingrained in our Company’s structure and provide the impetus for initiatives to improve our business and drive shareholder values, while providing simple and clear ethical standards and guidelines for our operations.
Recognition
I am very proud to report that in September 2004, ESB Bank was named a “2004 Best Place to Work” as presented by thePittsburgh Business Times. ESB Bank earned recognition as one of the best medium size companies with 100 to 1,000 employees and was one of only thirty workplaces to be recognized in Western Pennsylvania.
I am also proud to report that two employees of the Bank were recipients of prestigious awards in 2004 given by the Federal Home Loan Bank Affordable Housing Advisory Council and the Pittsburgh Community Reinvestment Group for their extensive efforts and commitment relating to affordable housing and community reinvestment and revitalization initiatives.
Director Retirement
We express our sincere thanks to George William “Bill” Blank, Jr., who retired from the Board of Directors in 2004 with over thirty years of dedicated service. We appreciate the guidance Mr. Blank provided as a member of our Board and we wish him the best in his retirement.
| | | | |
ESB Financial Corporation | | 4 | | 2004 Annual Report |
Letter to Shareholders(continued)
The Year Ahead
In 2005, ESB Bank will be 90 years old, a milestone few banks have been able to achieve. Over the years, we have continued to change and improve in order to continuously realign our objectives and redefine our strategies to address a dynamic and competitive operating environment and to meet the emerging needs of our customers. In response to these changes, we will respond rapidly and decisively to focus on our customer’s needs, to execute our business strategies and to continuously improve our technology and service. With this resolve and with a sound and focused business strategy, we are confident that we will achieve another year of strong financial performance.
We invite our shareholders to join us at our annual shareholders’ meeting to be held on Wednesday, April 20, 2005 at 4:00 p.m. at the Connoquenessing Country Club, 1512 Mercer Road, Ellwood City, PA.
|
| Sincerely, |
|
 |
|
Charlotte A.Zuschlag |
| President and Chief Executive Officer |
| | | | |
ESB Financial Corporation | | 5 | | 2004 Annual Report |
Selected Consolidated Financial Data
(Dollar amounts in thousands, except share data)
| | | | | | | | | | | | | | | | | | | | |
| | | As of December 31,
| |
| | 2004
| | | 2003
| | | 2002
| | | 2001 (1)
| | | 2000 (1)
| |
Financial Condition Data | | | | | | | | | | | | | | | | | | | | |
Total assets | | $ | 1,394,515 | | | $ | 1,365,780 | | | $ | 1,319,695 | | | $ | 1,263,068 | | | $ | 1,200,150 | |
Securities | | | 929,794 | | | | 928,936 | | | | 865,135 | | | | 640,282 | | | | 605,414 | |
Loans receivable, net | | | 343,524 | | | | 322,454 | | | | 340,892 | | | | 523,131 | | | | 512,228 | |
Deposits | | | 580,346 | | | | 603,046 | | | | 589,826 | | | | 591,999 | | | | 508,913 | |
Borrowed funds, including subordinated debt | | | 702,773 | | | | 652,489 | | | | 621,526 | | | | 577,802 | | | | 612,204 | |
Stockholders’ equity | | | 97,801 | | | | 96,871 | | | | 96,371 | | | | 79,903 | | | | 68,263 | |
Stockholders’ equity per common share (2) | | $ | 9.16 | | | $ | 8.98 | | | $ | 9.17 | | | $ | 7.58 | | | $ | 6.58 | |
| |
| | | For the year ended December 31,
| |
| | | 2004
| | | 2003
| | | 2002
| | | 2001 (1)
| | | 2000 (1)
| |
Operations Data | | | | | | | | | | | | | | | | | | | | |
Net interest income | | $ | 25,229 | | | $ | 21,615 | | | $ | 21,659 | | | $ | 19,877 | | | $ | 19,366 | |
Provision for (recovery of) loan losses | | | 206 | | | | (106 | ) | | | (410 | ) | | | 47 | | | | (55 | ) |
| | |
|
|
| |
|
|
| |
|
|
| |
|
|
| |
|
|
|
Net interest income after provision for (recovery of) loan losses | | | 25,023 | | | | 21,721 | | | | 22,069 | | | | 19,830 | | | | 19,421 | |
Noninterest income | | | 6,960 | | | | 7,791 | | | | 6,417 | | | | 4,797 | | | | 2,893 | |
Noninterest expense | | | 20,157 | | | | 19,177 | | | | 17,709 | | | | 16,123 | | | | 14,338 | |
| | |
|
|
| |
|
|
| |
|
|
| |
|
|
| |
|
|
|
Income before income taxes | | | 11,826 | | | | 10,335 | | | | 10,777 | | | | 8,504 | | | | 7,976 | |
Provision for income taxes | | | 1,836 | | | | 1,811 | | | | 1,817 | | | | 1,275 | | | | 1,243 | |
| | |
|
|
| |
|
|
| |
|
|
| |
|
|
| |
|
|
|
Net income (3) | | $ | 9,990 | | | $ | 8,524 | | | $ | 8,960 | | | $ | 7,229 | | | $ | 6,733 | |
| | |
|
|
| |
|
|
| |
|
|
| |
|
|
| |
|
|
|
Net income per common share: (2) | | | | | | | | | | | | | | | | | | | | |
Basic | | $ | 0.98 | | | $ | 0.84 | | | $ | 0.88 | | | $ | 0.73 | | | $ | 0.68 | |
Diluted | | $ | 0.94 | | | $ | 0.80 | | | $ | 0.86 | | | $ | 0.72 | | | $ | 0.68 | |
| |
| | | As of or for the year ended December 31,
| |
| | | 2004
| | | 2003
| | | 2002
| | | 2001 (1)
| | | 2000 (1)
| |
Other Data | | | | | | | | | | | | | | | | | | | | |
Performance Ratios (for the year ended) | | | | | | | | | | | | | | | | | | | | |
Return on average assets | | | 0.73 | % | | | 0.63 | % | | | 0.69 | % | | | 0.59 | % | | | 0.59 | % |
Return on average equity | | | 10.38 | % | | | 8.75 | % | | | 10.10 | % | | | 9.49 | % | | | 11.71 | % |
Average equity to average assets | | | 6.99 | % | | | 7.22 | % | | | 6.85 | % | | | 6.23 | % | | | 5.03 | % |
Interest rate spread (4) | | | 2.04 | % | | | 1.77 | % | | | 1.81 | % | | | 1.71 | % | | | 1.74 | % |
Net interest margin (4) | | | 2.15 | % | | | 1.89 | % | | | 1.98 | % | | | 1.91 | % | | | 1.97 | % |
Efficiency ratio | | | 56.71 | % | | | 59.94 | % | | | 55.73 | % | | | 58.58 | % | | | 55.36 | % |
Noninterest expense to average assets | | | 1.47 | % | | | 1.42 | % | | | 1.37 | % | | | 1.32 | % | | | 1.25 | % |
Dividend payout ratio (5) | | | 42.55 | % | | | 45.83 | % | | | 34.01 | % | | | 35.61 | % | | | 31.28 | % |
Asset Quality Ratios (as of year end) | | | | | | | | | | | | | | | | | | | | |
Non-performing loans to total loans | | | 0.64 | % | | | 0.51 | % | | | 0.71 | % | | | 0.46 | % | | | 0.49 | % |
Non-performing assets to total assets | | | 0.26 | % | | | 0.22 | % | | | 0.28 | % | | | 0.32 | % | | | 0.37 | % |
Allowance for loan losses to total loans | | | 1.06 | % | | | 1.17 | % | | | 1.19 | % | | | 0.95 | % | | | 0.92 | % |
Allowance for loan losses to non-performing loans | | | 165.20 | % | | | 228.20 | % | | | 166.68 | % | | | 205.72 | % | | | 188.96 | % |
Capital Ratios (as of year end) | | | | | | | | | | | | | | | | | | | | |
Stockholders’ equity to assets | | | 7.01 | % | | | 7.09 | % | | | 7.30 | % | | | 6.33 | % | | | 5.69 | % |
Tangible stockholders’ equity to tangible assets | | | 6.13 | % | | | 5.96 | % | | | 5.87 | % | | | 5.54 | % | | | 5.29 | % |
| (1) | Selected consolidated financial data for 2001 and 2000 reflects increases due to the acquisitions of WSB and Spring Hill Savings Bank respectively. |
| (2) | Stockholders’ equity, basic net income and diluted net income per common share for the years ended December 31, 2002, December 31, 2001 and December 31, 2000 have been adjusted to reflect the six-for-five stock split declared and paid in 2003. Years ended December 31, 2001 and December 31, 2000 have been adjusted for the six-for-five stock split declared and paid in 2002. Also the year ended December 31, 2000 has been adjusted for the six-for-five stock split declared and paid in the second quarter of 2001. |
| (3) | Reported net income for 2004, 2003 and 2002 reflects the adoption of Financial Accounting Standard No. 142, whereby goodwill is no longer amortized. See note 1 to the financial statements. |
| (4) | Interest income utilized in calculation is on a fully tax equivalent basis, which is deemed to be the most prevalent industry standard for measuring interest rate spread and net interest margin. |
| (5) | Dividend payout ratio calculation utilizes diluted net income per share for all periods. |
| | | | |
ESB Financial Corporation | | 6 | | 2004 Annual Report |
Management’s Discussion and Analysis of
Financial Condition and Results of Operations
Overview
ESB Financial Corporation (the Company) is a Pennsylvania corporation and thrift holding company that provides a wide range of retail and commercial financial products and services to customers in Western Pennsylvania through its wholly-owned subsidiary bank, ESB Bank (ESB or the Bank). At December 31, 2004, ESB Bank operated 16 offices. The Company is also the parent company of PennFirst Financial Services, Inc., a Delaware corporation engaged in the management of certain investment activities on behalf of the Company, ESB Capital Trust II (Trust II) and ESB Statutory Trust III (Trust III), Delaware statutory business trusts established to facilitate the issuance of trust preferred securities to the public by the Company and THF, Inc., a Pennsylvania corporation established as a title agency to provide residential and commercial loan closing services and title closing services.
ESB is a Pennsylvania chartered, Federal Deposit Insurance Corporation (FDIC) insured stock savings bank, which, at December 31, 2004, conducted business through 16 offices in Allegheny, Beaver, Butler and Lawrence counties, Pennsylvania. ESB operates two wholly-owned subsidiaries: (i) AMSCO, Inc., which engages in the management of certain real estate development partnerships on behalf of the Company, and (ii) ESB Financial Services, Inc., a Delaware corporation which holds loans and other investments.
ESB is a financial intermediary whose principal business consists of attracting deposits from the general public and investing such deposits in real estate loans secured by liens on residential and commercial properties, consumer loans, commercial business loans, securities and interest-earning deposits.
The Company is subject to examination and regulation by the Office of Thrift Supervision as a savings and loan holding company and for purposes of regulation as a savings and loan holding company the Bank is deemed to be a savings association. The Bank is subject to examination and comprehensive regulation by the FDIC and the Pennsylvania Department of Banking. ESB is a member of the Federal Home Loan Bank (FHLB) of Pittsburgh, which is one of the twelve regional banks comprising the FHLB System. ESB is further subject to regulations of the Board of Governors of the Federal Reserve System, which governs the reserves required to be maintained against deposits and certain other matters.
During the year ended December 31, 2004, the Company experienced a 17.2% increase in earnings over the same period last year, which is a reflection of the Company’s ability to reduce its overall cost of funds due in part to the historically low level of interest rates. The net interest margin was further enhanced by the restructuring and call of a significant portion of the Company’s trust preferred securities in the first quarter of 2004.
The increase in interest rates in 2004 has had a positive effect on net loans receivable due to significantly lower prepayments which decreased $69.4 million to $136.3 million for the year ended December 31, 2004 as compared to $205.7 million for the same period in the prior year.
The enhancement to the net interest margin was primarily the result of strategies employed by the Company to lower the cost of funds, while stabilizing the yield from the investment portfolio. The Company employs a strategy of purchasing cash-flowing fixed and variable rate mortgage-backed securities funded by the wholesale borrowings, which are comprised of FHLB advances and repurchase agreements. This is referred to as the Company’s wholesale strategy. During the period of low interest rates, the Company was able to reprice a substantial portion of its wholesale borrowings which declined by 74 basis points to 3.62% compared to 4.36% for the year ended December 31, 2004 and December 31, 2003, respectively. The Company, as part of its interest rate risk strategy, continues to pursue the policy of locking in long-term advances during periods of low interest rates. Management expects that as rates rise at a measured pace, the Company’s wholesale borrowings cost will rise accordingly and possibly cause some compression to the net interest margin.
| | | | |
ESB Financial Corporation | | 7 | | 2004 Annual Report |
Management’s Discussion and Analysis of
Financial Condition and Results of Operations(continued)
The wholesale strategy operates with a lower cost of operations, although with lower interest rate spreads and therefore at a lower margin than the retail operations of the Company. The Company has utilized this strategy since its initial public offering in 1990. The Company manages this strategy through its interest rate risk management on a macro level. This strategy historically produces wider margins during periods of lower short-term interest rates, reflected in a steep yield curve and can be susceptible to net interest margin strain in both rapidly rising rates and rapidly declining long-term rates, which can cause compression to the net interest margin.
Management continues to pursue methods of insulating this wholesale strategy from significant fluctuations in interest rates by: (1) incorporating a laddered maturity schedule of up to three to four years on the wholesale borrowings; (2) purchasing interest rate caps hedged against short term borrowings; (3) providing structure in the investment portfolio in the form of corporate bonds and municipals securities; (4) utilizing cash flows from fixed and adjustable rate mortgage-backed securities; and (5) the placing of the Company’s securities in the available for sale portfolio thereby creating the flexibility to change the composition of the portfolio through restructuring as management deems it necessary due to interest rate fluctuations. Management believes that this insulation affords them the ability to react to measured changes in interest rates and restructure the Company’s balance sheet accordingly. This strategy is continually evaluated by management on an ongoing basis.
This Management Discussion and Analysis section of the Annual Report contains certain forward-looking statements (as defined in the Private Securities Litigation Reform Act of 1995). These forward-looking statements may involve significant risks and uncertainties. Although the Company believes that the expectations reflected in such forward-looking statements are reasonable, actual results may differ materially from the results in these forward-looking statements.
Significant Financial Events in 2004
Redemption of Trust Preferred Securities
In January 2004, the Company redeemed the remaining $20.1 million of preferred securities of PennFirst Capital Trust I. Management’s decision to redeem these securities, which had a total cost of 9.20%, and replace them with variable rate preferred securities and corporate debt with an overall weighted average cost of 5.24%, resulted in a cost savings of approximately $660,000 in 2004. This strategy is one example of the Company’s commitment to grow earnings in the current historically low interest rate environment.
Merger of PHSB Holding Company
On August 12, 2004, the Company entered into an Agreement and Plan of Reorganization with PHSB Financial Corporation (PHSB), parent company of Peoples Home Savings Bank, pursuant to which PHSB was merged with and into the Company in February 2005.
Under the terms of the agreement, each stockholder of PHSB had the right to elect to receive either $27.00 in cash or 1.966 shares of Company common stock for each share of PHSB common stock owned. The total merger consideration was payable 50% in Company common stock and 50% in cash.
At December 31, 2004, PHSB had total consolidated assets of $331.4 million, total consolidated liabilities of $284.8 million, including total consolidated deposits of $229.7 million and consolidated stockholders’ equity of $46.6 million.
| | | | |
ESB Financial Corporation | | 8 | | 2004 Annual Report |
Management’s Discussion and Analysis of
Financial Condition and Results of Operations(continued)
Significant Financial Events in 2003
Stock Split and Cash Dividend
On April 15, 2003, the Board of Directors declared a six-for-five stock split to stockholders of record on May 1, 2003 and payable May 15, 2003. This stock split, combined with the Company’s maintaining the current quarterly cash dividend of $0.10 per share, effectively increased the cash payout to stockholders by 20%. All share and related price and dividend amounts discussed herein have been adjusted to reflect this stock split where applicable.
Redemption of Trust Preferred Securities
During 2003, the Company redeemed $5.0 million (liquidation amount) of the Preferred Securities of PennFirst Capital Trust I at a redemption price equal to the liquidation amount of $10.00 plus accrued and unpaid distributions thereon to April 17, 2003. The Company also established the Trust II and Trust III that issued $10.0 million and $5.0 million, respectively of variable rate Preferred Securities with a stated value and liquidation preference of $1,000 per share.
Critical Accounting Policies and Estimates
The Company’s consolidated financial statements are prepared in accordance with U.S. generally accepted accounting principles and follow general practices within the industry in which it operates. Application of these principles requires management to make estimates, assumptions and judgments that affect the amounts reported in the financial statements and accompanying notes. These estimates, assumptions and judgments are based on information available as of the date of the financial statements; accordingly, as this information changes, the financial statements could reflect different estimates, assumptions and judgments. Certain policies inherently have a greater reliance on the use of estimates, assumptions and judgments and as such have a greater possibility of producing results that could be materially different than originally reported. Estimates, assumptions and judgments are necessary when assets and liabilities are required to be recorded at fair value, when a decline in the value of an asset not carried on the financial statements at fair value warrants an impairment write-down or valuation reserve to be established, or when an asset or liability needs to be recorded contingent upon a future event. Carrying assets and liabilities at fair value inherently results in more financial statement volatility. The fair values and the information used to record valuation adjustments for certain assets and liabilities are based either on quoted market prices or are provided by other third-party sources, when available. When third-party information is not available, valuation adjustments are estimated in good faith by management primarily through the use of internal cash flow modeling techniques.
The Company’s most significant accounting policies are presented in Note 1 to the consolidated financial statements. These policies along with the disclosures presented in the other financial statement notes and in this financial review, provide information on how significant assets and liabilities are valued in the financial statements and how those values are determined. Based on the valuation techniques used and the sensitivity of financial statement amounts to the methods, assumptions and estimates underlying those amounts, management has identified the determination of the fair value of securities, the allowance for loan losses and the valuation of goodwill and intangible assets to be the accounting areas that require the most subjective or complex judgments.
Securities
Securities are reported at fair value adjusted for premiums and discounts which are recognized in interest income using the interest method over the period to maturity. Declines in the fair value of individual securities below their amortized cost, and that are deemed to be other than temporary, will be written down to current market value and included in earnings as realized losses. For a discussion on the determination of an other than temporary decline, please refer to Note 1 of the consolidated financial statements. Management systematically evaluates
| | | | |
ESB Financial Corporation | | 9 | | 2004 Annual Report |
Management’s Discussion and Analysis of
Financial Condition and Results of Operations(continued)
securities for other than temporary declines in fair value on a quarterly basis. The Company did not recognize any other than temporary impairment losses on securities available for sale for the years ended December 31, 2004 and 2003. The Company recognized impairment losses on securities available for sale of $446,000 for the year ended December 31, 2002.
Allowance for loan losses
The allowance for loan losses is increased by charges to income and decreased by charge-offs (net of recoveries). The Company’s periodic evaluation of the adequacy of the allowance for loan losses is determined by management through evaluation of the loss exposure on individual non-performing, delinquent and high-dollar loans; review of economic conditions and business trends; historical loss experience and growth and composition of the loan portfolio, as well as other relevant factors.
A quantitative analysis is utilized to support the adequacy of the allowance for loan losses. This analysis includes review of historical charge-off rates for loan categories, fluctuations and trends in the amount of classified loans and economic factors. Significant to this analysis are any changes in observable trends that may be occurring relative to loans to assess potential weaknesses within the credit. Current economic factors and trends in risk ratings are considered in the determination and allocation of the allowance for loan losses.
The allowance for loan losses at December 31, 2004 was $3.9 million, compared to $4.1 million at December 31, 2003, allocated as follows: $1.4 million, or 36.4%, for residential loans, $1.6 million, or 39.8%, for commercial real estate, $181,000, or 4.6%, for commercial business loans, and $756,000, or 19.2%, for consumer loans. The variance in the allowance from 2003 to 2004 is primarily the result of commercial real estate loans that became current during the period as well as a decrease in the valuation allowance related to REO properties. The ability for customers to repay commercial loans is more dependent upon the success of their business, continuing income and general economic conditions. Accordingly, the risk of loss is higher on such loans than residential real estate loans, which generally incur fewer losses as the collateral value typically exceeds the loan amounts in the event of foreclosure.
Goodwill and other intangible assets
Statement of Financial Accounting Standards No. 142, (FAS 142) “Goodwill and Other Intangible Assets”, establishes standards for the amortization of acquired intangible assets and the non-amortization and impairment assessment of goodwill. At December 31, 2004, the Company had $309,000 of core deposit intangible assets subject to amortization and $7.1 million in goodwill, which was not subject to periodic amortization.
Goodwill arising from business combinations represents the value attributable to unidentifiable intangible elements in the business acquired. The Company’s goodwill relates to value inherent in the banking business and the value is dependent upon the Company’s ability to provide quality, cost effective services in a competitive market place. As such, goodwill value is supported ultimately by revenue that is driven by the volume of business transacted. A decline in earnings as a result of a lack of growth or the inability to deliver cost effective services over sustained periods can lead to impairment of goodwill that could adversely impact earnings in future periods.
FAS 142 requires an annual evaluation of goodwill for impairment. The fair value of the Company and the implied fair value of goodwill at the respective reporting unit level are estimated using the market value approach utilizing industry comparable information. The Company has concluded that the recorded value of goodwill was not impaired as a result of the evaluation.
| | | | |
ESB Financial Corporation | | 10 | | 2004 Annual Report |
Management’s Discussion and Analysis of
Financial Condition and Results of Operations(continued)
Changes in Financial Condition
General.The Company’s total assets increased $28.7 million or 2.1% to $1.4 billion at December 31, 2004 from $1.4 billion at December 31, 2003. This increase was composed of net increases in cash and cash equivalents, securities available for sale, loans receivable, accrued interest receivable, Federal Home Loan Bank (FHLB) stock, premises and equipment, real estate acquired through foreclosure, real estate acquired for investment, prepaid expenses and other assets and bank owned life insurance (BOLI) of $2.4 million, $858,000, $21.1 million, $213,000, $929,000, $116,000, $139,000, $1.2 million, $1.1 million and $941,000, respectively. Partially offsetting these increases was a slight decrease to intangible assets of $205,000.
The increase in the Company’s total assets reflects a corresponding increase in total liabilities of $27.8 million or 2.2% to $1.3 billion at December 31, 2004 from $1.3 billion at December 31, 2003 and an increase in total stockholders’ equity of $930,000 or 1.0% to $97.8 million at December 31, 2004 from $96.9 million at December 31, 2003. The increase in total liabilities was primarily due to increases in borrowed funds of $70.3 million and accrued expenses and other liabilities of $416,000. These increases were offset by decreases to deposits, guaranteed preferred beneficial interest in subordinated debt, and advance payments by borrowers for taxes and insurance of $22.7 million, $20.0 million and $195,000, respectively. The net increase in total stockholders’ equity can be attributed primarily to increases in additional paid in capital and retained earnings of $738,000 and $4.5 million, respectively, as well as a decrease in unearned employee stock ownership plan (ESOP) of $986,000. These items were partially offset by an increase in treasury stock and unvested shares held by management recognition plan (MRP) of $1.3 million and $136,000, respectively, and a decrease to accumulated other comprehensive income of $3.9 million.
Cash on hand, Interest-earning deposits and Federal funds sold.Cash on hand, interest-earning deposits and federal funds sold represent cash equivalents which increased a combined $2.4 million or 15.5% to $17.7 million at December 31, 2004 from $15.3 million at December 31, 2003. Deposits from customers into savings and checking accounts, loan and security repayments and proceeds from borrowed funds typically increase these accounts. Decreases result from customer withdrawals, new loan originations, security purchases and repayments of borrowed funds. The net increase in 2004 can be attributed principally to proceeds from borrowed funds.
Securities. The Company’s securities and loan portfolios represent its two largest balance sheet asset classifications, respectively. The Company’s securities portfolio increased a net $858,000 or 0.1% to $929.8 million at December 31, 2004 from $928.9 million at December 31, 2003. During 2004, the Company recorded purchases of available for sale securities of $230.9 million, consisting primarily of $190.3 million of mortgage-backed securities, $16.6 million of municipal bonds and $24.0 million of collateralized mortgage obligations (CMO). Partially offsetting the purchases were $213.1 million of maturities and repayments of principal and $9.6 million of securities sold consisting of $9.6 million of corporate bonds, a decrease in the market value on securities available for sale of $5.1 million (before taxes) during the year and $3.1 million due to the amortization of premiums. Unrealized pre-tax gains/losses (fair value adjustments) on available for sale securities was a $9.4 million gain as of December 31, 2004 compared to a $14.5 million gain as of December 31, 2003. These fair value adjustments represent temporary fluctuations resulting from changes in market rates in relation to average yields in the available for sale portfolio. If securities are held to their respective maturity dates, no fair value gain or loss is realized.
During 2004 the Company’s investment strategy was contingent upon the movement in the ten year treasury bond as it began the year at 4.27% dropped to a low of 3.70% in the first quarter, climbed to a high of 4.89% in the second quarter then experienced another decline to 4.00% late in the third quarter and then finally finished the year at 4.24%. During the year as the ten year treasury rate was declining the Company was primarily focused on the purchasing of adjustable rate securities, as the ten year treasury rate rose, the Company purchased some fixed rate mortgage backed securities with terms from 15 to 20 years. Throughout all of the rate cycles, the Company continued to purchase municipal bonds which add structure to the portfolio in the event that rates decline to previous low levels.
| | | | |
ESB Financial Corporation | | 11 | | 2004 Annual Report |
Management’s Discussion and Analysis of
Financial Condition and Results of Operations(continued)
The securities portfolio is primarily funded by the Company’s borrowings. During 2004, this wholesale leverage strategy accounted for $7.9 million, on a tax equivalent basis, of the Company’s tax equivalent net interest income of $27.8 million.
Loans receivable.The loans receivable category consists primarily of single family mortgage loans used to purchase or refinance personal residences located within the Company’s market area and commercial real estate loans used to finance properties that are used in the borrowers’ businesses or to finance investor-owned rental properties, and to a lesser extent commercial and consumer loans. Net loans receivable increased $21.1 million or 6.5% to $343.5 million at December 31, 2004 from $322.5 million at December 31, 2003. Included in this increase were increases in mortgage loans of $29.2 million or 10.5%, partially offset by a decrease in other loans of $3.7 million or 5.3%, in addition to increases in deferred loan fees and loans in process of $98,000 and $4.4 million, respectively, which were partially offset by a decrease in allowance for loan losses of $122,000. This increase in net loans receivable reflects originations of $158.1 million offset by prepayments of $136.3 million that occurred on both higher rate fixed and adjustable rate loans as our customers continued to capitalize on the record low interest rates. The result was a decrease to the yield on the Company’s loan portfolio from 6.51% in 2003 to 6.01% in 2004.
Non-performing assets.Non-performing assets include non-accrual loans, real estate acquired through foreclosure (REO) and troubled debt restructuring (TDR). Non-performing assets increased $743,000 to $3.7 million or 0.26% of total assets at December 31, 2004 from $3.0 million or 0.22% of total assets at December 31, 2003. Non-performing assets consisted of non-performing loans, REO and TDR of $1.5 million, $1.3 million and $915,000, respectively, at December 31, 2004 and non-performing loans and REO of $1.8 million and $1.2 million, respectively, at December 31, 2003. The increase in non-performing assets resulted primarily from the troubled debt restructuring in which the Bank granted an extension to the interest only portion of a loan for an additional year, partially offset by previous non-performing loans becoming current during the year.
Accrued interest receivable.Accrued interest receivable increased by $213,000 or 2.8% to $7.8 million for the year 2004 as compared to $7.6 million for the year 2003. This increase was a result of the increase in securities available for sale and loans receivable between the periods, partially offset by the overall decrease to the yield on the loan and securities portfolio.
FHLB stock. FHLB stock increased $929,000 or 3.0% to $31.6 million at December 31, 2004 from $30.7 million at December 31, 2003, primarily as a result of the increase in FHLB advances to $601.2 million at December 31, 2004 from $570.2 million at December 31, 2003.
Premises and equipment.Premises and equipment increased $116,000 or 1.2% to $9.6 million at December 31, 2004 from $9.5 million at December 31, 2003. This increase can primarily be attributed to the completion of the Company’s branch in Neshannock Township which opened in the third quarter of 2004.
Real estate held for investment.The Company’s real estate held for investment increased $1.2 million or 10.4% to $12.6 million at December 31, 2004 from $11.4 million at December 31, 2003 as a result the Company adding an additional joint venture in the fourth quarter of 2004, partially offset by sales activity in the existing joint ventures in which the Company has a 51% ownership.
Intangible assets. Intangible assets decreased $205,000 or 29.1% to $500,000 at December 31, 2004 from $705,000 at December 31, 2003. The decrease resulted from amortization of $111,000 of the servicing asset, associated with the whole loan sale and securitization completed in 2002, as well as amortization of the core deposit intangible created through acquisitions of $164,000. Partially offsetting these decreases was a recovery of the valuation allowance associated with the servicing asset of $70,000.
| | | | |
ESB Financial Corporation | | 12 | | 2004 Annual Report |
Management’s Discussion and Analysis of
Financial Condition and Results of Operations(continued)
Prepaid expenses and other assets.Prepaid expenses and other assets increased $1.1 million or 18.0 % to $7.3 million at December 31, 2004 from $6.2 million at December 31, 2003. The increase resulted primarily from a change in the deferred tax balance, resulting from a decrease in the unrealized gain on the securities portfolio.
Bank owned life insurance. Bank owned life insurance (BOLI) is universal life insurance, purchased by the Bank, on the lives of the Bank’s employees. The beneficial aspects of these universal life insurance policies are tax-free earnings and a tax-free death benefit, which are realized by ESB as the owner of the policies. The Company purchased the $15.0 million universal life insurance policies on December 29, 1998. In 2001, the policy was increased by the addition of WSB’s BOLI of $1.3 million and an addition to the original policy of $3.5 million. The cash surrender value as of December 31, 2004 is $25.6 million.
Deposits.The Company considers various sources when evaluating funding needs, including but not limited to deposits, which are a significant source of funds totaling $580.3 million or 45.2% of the Company’s total funding sources at December 31, 2004.Total deposits decreased $22.7 million or 3.8% to $580.3 million at December 31, 2004 from $603.0 million at December 31, 2003. For the year, the Company’s interest-bearing demand deposits decreased $18.9 million or 8.5%, time deposits decreased $6.1 million or 1.7%, and noninterest-bearing deposits increased $2.3 million or 10.9%.
Advance payments by borrowers for taxes and insurance. Advance payments by borrowers for taxes and insurance decreased $195,000 or 10.6% to $1.6 million at December 31, 2004 from $1.8 million at December 31, 2003.
Borrowed funds.The Company utilizes short and long-term borrowings as another source of funding used for asset growth and liquidity needs. These borrowings primarily include FHLB advances and repurchase agreement borrowings. Borrowed funds increased $70.3 million or 11.4% to $687.6 million at December 31, 2004 from $617.3 million at December 31, 2003. FHLB advances increased $31.0 million or 5.4% and repurchase agreements increased $20.0 million or 42.6%, while other borrowings increased $19.3 million. The increase to other borrowings resulted from the Company entering into a loan agreement with First Tennessee Bank National Association (FTN) to borrow $15.0 million at an interest rate of 5.55% with a stated maturity of 5 years. The Company is required to make four annual payments of $1.5 million, with the remaining balance due in the fifth year. The current balance on the loan with FTN is $13.5 million. The proceeds of the loan were used to redeem the remaining $20.3 million of the outstanding preferred securities of PennFirst Capital Trust I. Additionally, the Company refinanced its ESOP loan with a third party.
Accrued expenses and other liabilities.Accrued expenses and other liabilities increased $416,000 or 3.6% to $11.9 million at December 31, 2004 from $11.5 million at December 31, 2003.
Stockholders’ equity.Stockholders’ equity increased by $930,000 or 1.0% to $97.8 million at December 31, 2004 from $96.9 million at December 31, 2003. The net increase in total stockholders’ equity can be attributed primarily to increases in additional paid in capital and retained earnings of $738,000 and $4.5 million, respectively, as well as a decrease in unearned employee stock ownership plan (ESOP) of $986,000. These items were partially offset by an increase in treasury stock and unvested shares held by management recognition plan (MRP) of $1.3 million and $136,000, respectively and a decrease to accumulated other comprehensive income of $3.9 million.
| | | | |
ESB Financial Corporation | | 13 | | 2004 Annual Report |
Management’s Discussion and Analysis of
Financial Condition and Results of Operations(continued)
Changes in Results of Operations
General.The Company reported net income of $10.0 million, $8.5 million and $9.0 million in 2004, 2003 and 2002, respectively.
Average Balance Sheet and Yield/Rate Analysis. The following table sets forth, for the periods indicated, information concerning the total dollar amounts of interest income from interest-earning assets and the resultant average yields, the total dollar amounts of interest expense on interest-bearing liabilities and the resultant average costs, net interest income, interest rate spread and the net interest margin earned on average interest-earning assets. For purposes of this table, average balances are calculated using monthly averages and the average loan balances include non-accrual loans and exclude the allowance for loan losses, and interest income includes accretion of net deferred loan fees. Yields on tax-exempt securities (tax-exempt for federal income tax purposes) are shown on a fully tax equivalent basis utilizing a federal tax rate of 34%.
| | | | | | | | | | | | | | | | | | | | | | | | | | | |
(Dollar amounts in thousands)
| | Year ended December 31,
| |
| | 2004
| | | 2003
| | | 2002
| |
| | Average
Balance
| | Interest
| | Yield /
Rate
| | | Average
Balance
| | Interest
| | Yield /
Rate
| | | Average
Balance
| | Interest
| | Yield /
Rate
| |
Interest-earning assets: | | | | | | | | | | | | | | | | | | | | | | | | | | | |
Taxable securities available for sale | | $ | 761,096 | | $ | 33,623 | | 4.42 | % | | $ | 749,507 | | $ | 34,563 | | 4.61 | % | | $ | 618,333 | | $ | 35,652 | | 5.77 | % |
Taxable adjustable corporate bonds AFS | | | 51,240 | | | 1,175 | | 2.29 | % | | | 51,225 | | | 1,065 | | 2.08 | % | | | 54,237 | | | 1,489 | | 2.75 | % |
Tax-exempt securities available for sale | | | 100,163 | | | 4,984 | | 7.54 | % | | | 86,708 | | | 4,475 | | 7.82 | % | | | 90,607 | | | 4,728 | | 7.91 | % |
| | |
|
| |
|
| |
|
| |
|
| |
|
| |
|
| |
|
| |
|
| |
|
|
| | | | 912,499 | | | 39,782 | | 4.64 | % | | | 887,440 | | | 40,103 | | 4.78 | % | | | 763,177 | | | 41,869 | | 5.81 | % |
| | |
|
| |
|
| |
|
| |
|
| |
|
| |
|
| |
|
| |
|
| |
|
|
Mortgage loans | | | 268,044 | | | 16,271 | | 6.07 | % | | | 258,079 | | | 17,024 | | 6.60 | % | | | 343,781 | | | 24,821 | | 7.22 | % |
Other loans | | | 71,166 | | | 4,142 | | 5.82 | % | | | 73,988 | | | 4,593 | | 6.21 | % | | | 76,294 | | | 5,285 | | 6.93 | % |
| | |
|
| |
|
| |
|
| |
|
| |
|
| |
|
| |
|
| |
|
| |
|
|
| | | | 339,210 | | | 20,413 | | 6.02 | % | | | 332,067 | | | 21,617 | | 6.51 | % | | | 420,075 | | | 30,106 | | 7.17 | % |
| | |
|
| |
|
| |
|
| |
|
| |
|
| |
|
| |
|
| |
|
| |
|
|
Cash equivalents | | | 10,722 | | | 83 | | 0.77 | % | | | 12,554 | | | 78 | | 0.62 | % | | | 10,418 | | | 133 | | 1.28 | % |
FHLB stock | | | 31,732 | | | 520 | | 1.64 | % | | | 30,399 | | | 669 | | 2.20 | % | | | 24,280 | | | 852 | | 3.51 | % |
| | |
|
| |
|
| |
|
| |
|
| |
|
| |
|
| |
|
| |
|
| |
|
|
| | | | 42,454 | | | 603 | | 1.42 | % | | | 42,953 | | | 747 | | 1.74 | % | | | 34,698 | | | 985 | | 2.84 | % |
| | |
|
| |
|
| |
|
| |
|
| |
|
| |
|
| |
|
| |
|
| |
|
|
Total interest-earning assets | | | 1,294,163 | | | 60,798 | | 4.90 | % | | | 1,262,460 | | | 62,467 | | 5.13 | % | | | 1,217,950 | | | 72,960 | | 6.19 | % |
Other noninterest-earning assets | | | 81,687 | | | — | | — | | | | 87,324 | | | — | | — | | | | 76,608 | | | — | | — | |
| | |
|
| |
|
| |
|
| |
|
| |
|
| |
|
| |
|
| |
|
| |
|
|
Total assets | | $ | 1,375,850 | | $ | 60,798 | | 4.61 | % | | $ | 1,349,784 | | $ | 62,467 | | 4.80 | % | | $ | 1,294,558 | | $ | 72,960 | | 5.82 | % |
| | |
|
| |
|
| |
|
| |
|
| |
|
| |
|
| |
|
| |
|
| |
|
|
Interest-bearing liabilities: | | | | | | | | | | | | | | | | | | | | | | | | | | | |
Interest-bearing demand deposits | | $ | 215,979 | | $ | 1,006 | | 0.47 | % | | $ | 217,970 | | $ | 1,670 | | 0.77 | % | | $ | 210,950 | | $ | 2,896 | | 1.37 | % |
Time deposits | | | 345,042 | | | 9,829 | | 2.85 | % | | | 361,517 | | | 11,405 | | 3.15 | % | | | 365,386 | | | 15,301 | | 4.19 | % |
| | |
|
| |
|
| |
|
| |
|
| |
|
| |
|
| |
|
| |
|
| |
|
|
| | | | 561,021 | | | 10,835 | | 1.93 | % | | | 579,487 | | | 13,075 | | 2.26 | % | | | 576,336 | | | 18,197 | | 3.16 | % |
FHLB advances | | | 604,607 | | | 22,010 | | 3.64 | % | | | 564,063 | | | 24,125 | | 4.28 | % | | | 476,678 | | | 25,814 | | 5.42 | % |
Repurchase agreements | | | 48,583 | | | 1,024 | | 2.11 | % | | | 44,017 | | | 1,287 | | 2.92 | % | | | 93,639 | | | 5,002 | | 5.34 | % |
Other borrowings | | | 14,655 | | | 845 | | 5.77 | % | | | 1,257 | | | 66 | | 5.25 | % | | | 1,182 | | | 62 | | 5.25 | % |
| | |
|
| |
|
| |
|
| |
|
| |
|
| |
|
| |
|
| |
|
| |
|
|
| | | | 1,228,866 | | | 34,714 | | 2.82 | % | | | 1,188,824 | | | 38,553 | | 3.24 | % | | | 1,147,835 | | | 49,075 | | 4.28 | % |
Preferred securities- fixed | | | 835 | | | 69 | | 8.26 | % | | | 20,858 | | | 1,915 | | 9.18 | % | | | 24,181 | | | 2,226 | | 9.21 | % |
Preferred securities- adjustable | | | 15,174 | | | 786 | | 5.18 | % | | | 7,112 | | | 384 | | 5.40 | % | | | — | | | — | | — | |
| | |
|
| |
|
| |
|
| |
|
| |
|
| |
|
| |
|
| |
|
| |
|
|
Total interest-bearing liabilities | | | 1,244,875 | | | 35,569 | | 2.85 | % | | | 1,216,794 | | | 40,852 | | 3.36 | % | | | 1,172,016 | | | 51,301 | | 4.38 | % |
Noninterest-bearing demand deposits | | | 23,798 | | | — | | — | | | | 24,230 | | | — | | — | | | | 20,885 | | | — | | — | |
Other noninterest-bearing liabilities | | | 10,966 | | | — | | — | | | | 11,347 | | | — | | — | | | | 12,982 | | | — | | — | |
| | |
|
| |
|
| |
|
| |
|
| |
|
| |
|
| |
|
| |
|
| |
|
|
Total liabilities | | | 1,279,639 | | | 35,569 | | 2.77 | % | | | 1,252,371 | | | 40,852 | | 3.26 | % | | | 1,205,883 | | | 51,301 | | 4.25 | % |
Stockholders’ equity | | | 96,211 | | | — | | — | | | | 97,413 | | | — | | — | | | | 88,675 | | | — | | — | |
| | |
|
| |
|
| |
|
| |
|
| |
|
| |
|
| |
|
| |
|
| |
|
|
Total liabilities and equity | | $ | 1,375,850 | | $ | 35,569 | | 2.58 | % | | $ | 1,349,784 | | $ | 40,852 | | 3.03 | % | | $ | 1,294,558 | | $ | 51,301 | | 3.96 | % |
| | |
|
| |
|
| |
|
| |
|
| |
|
| |
|
| |
|
| |
|
| |
|
|
Net interest income | | | | | $ | 25,229 | | | | | | | | $ | 21,615 | | | | | | | | $ | 21,659 | | | |
| | | | | |
|
| | | | | | | |
|
| | | | | | | |
|
| | | |
Interest rate spread
(difference between weighted average rate on interest-earning assets and interest-bearing liabilities) | | | | | | | | 2.04 | % | | | | | | | | 1.77 | % | | | | | | | | 1.81 | % |
| | | | | | | | |
|
| | | | | | | |
|
| | | | | | | |
|
|
Net interest margin
(net interest income as a percentage of average interest-earning assets) | | | | | | | | 2.15 | % | | | | | | | | 1.89 | % | | | | | | | | 1.98 | % |
| | | | | | | | |
|
| | | | | | | |
|
| | | | | | | |
|
|
| | | | |
ESB Financial Corporation | | 14 | | 2004 Annual Report |
Management’s Discussion and Analysis of
Financial Condition and Results of Operations(continued)
Analysis of Changes in Net Interest Income.The following table analyzes the changes in interest income and interest expense in terms of: (i) changes in volume of interest-earning assets and interest-bearing liabilities and (ii) changes in yield and rates. The table reflects the extent to which changes in the Company’s interest income and interest expense are attributable to changes in rate (change in rate multiplied by prior year volume), changes in volume (changes in volume multiplied by prior year rate) and changes attributable to the combined impact of volume/rate (change in rate multiplied by change in volume). The changes attributable to the combined impact of volume/rate are allocated on a consistent basis between the volume and rate variances.
| | | | | | | | | | | | | | | | | | | | | | | | |
(Dollar amounts in thousands)
| | 2004 vs. 2003 Increase (decrease) due to
| | | 2003 vs. 2002 Increase (decrease) due to
| |
| | Volume
| | | Rate
| | | Total
| | | Volume
| | | Rate
| | | Total
| |
Interest income: | | | | | | | | | | | | | | | | | | | | | | | | |
Securities | | $ | 1,115 | | | $ | (1,436 | ) | | $ | (321 | ) | | $ | 6,240 | | | $ | (8,006 | ) | | $ | (1,766 | ) |
Loans | | | 457 | | | | (1,661 | ) | | | (1,204 | ) | | | (5,905 | ) | | | (2,584 | ) | | | (8,489 | ) |
Cash equivalents | | | (12 | ) | | | 17 | | | | 5 | | | | 23 | | | | (78 | ) | | | (55 | ) |
FHLB stock | | | 28 | | | | (177 | ) | | | (149 | ) | | | 182 | | | | (365 | ) | | | (183 | ) |
| | |
|
|
| |
|
|
| |
|
|
| |
|
|
| |
|
|
| |
|
|
|
Total interest-earning assets | | | 1,588 | | | | (3,257 | ) | | | (1,669 | ) | | | 540 | | | | (11,033 | ) | | | (10,493 | ) |
| | |
|
|
| |
|
|
| |
|
|
| |
|
|
| |
|
|
| |
|
|
|
Interest expense: | | | | | | | | | | | | | | | | | | | | | | | | |
Deposits | | | (406 | ) | | | (1,834 | ) | | | (2,240 | ) | | | 99 | | | | (5,221 | ) | | | (5,122 | ) |
FHLB advances | | | 1,650 | | | | (3,765 | ) | | | (2,115 | ) | | | 4,269 | | | | (5,958 | ) | | | (1,689 | ) |
Repurchase agreements | | | 123 | | | | (386 | ) | | | (263 | ) | | | (2,004 | ) | | | (1,711 | ) | | | (3,715 | ) |
Other borrowings | | | 772 | | | | 7 | | | | 779 | | | | 4 | | | | — | | | | 4 | |
Subordinated debt | | | (794 | ) | | | (650 | ) | | | (1,444 | ) | | | 327 | | | | (254 | ) | | | 73 | |
| | |
|
|
| |
|
|
| |
|
|
| |
|
|
| |
|
|
| |
|
|
|
Total interest-bearing liabilities | | | 1,345 | | | | (6,628 | ) | | | (5,283 | ) | | | 2,695 | | | | (13,144 | ) | | | (10,449 | ) |
| | |
|
|
| |
|
|
| |
|
|
| |
|
|
| |
|
|
| |
|
|
|
Net interest income | | $ | 243 | | | $ | 3,371 | | | $ | 3,614 | | | $ | (2,155 | ) | | $ | 2,111 | | | $ | (44 | ) |
| | |
|
|
| |
|
|
| |
|
|
| |
|
|
| |
|
|
| |
|
|
|
2004 Results Compared to 2003 Results
General.The Company reported net income of $10.0 million and $8.5 million for 2004 and 2003, respectively. The $1.5 million or 17.2% increase in net income between 2004 and 2003 can primarily be attributed to an increase in net interest income of $3.6 million, partially offset by an increase to provision for loan losses of $312,000, a decrease in noninterest income of $831,000 and increases in noninterest expense and provision for income taxes of $980,000 and $25,000, respectively.
Net interest income.Net interest income, the primary source of revenue for the Company, is determined by the Company’s interest rate spread, which is defined as the difference between income on earning assets and the cost of funds supporting those assets, and the relative amounts of interest earning assets and interest bearing liabilities. Management periodically adjusts the mix of assets and liabilities, as well as the rates earned or paid on those assets and liabilities in order to manage and improve net interest income. The level of interest rates and changes in the amount and composition of interest earning assets and liabilities affect the Company’s net interest income. Historically from an interest rate risk perspective, it has been management’s perception that differing interest rate environments can cause sensitivity to the Company’s net interest income, these being extended low long-term interest rates or rapidly rising short-term interest rates. Net interest income increased by $3.6 million or 16.7% to $25.2 million for 2004, compared to $21.6 million for 2003. This increase in net interest income can be attributed to a decrease in interest expense of approximately $5.3 million, offset partially by a decrease in interest income of $1.7 million.
The Company was able to enhance its margin during 2004 by refinancing borrowings as they matured at lower interest rates. This strategy combined with the redemption of $20.3 million of the Company’s fixed rate trust preferred securities early in the first quarter of 2004 resulted in a decline in the cost of these funds of 74 basis points to 3.62% for 2004 compared to 4.36% for 2003.
| | | | |
ESB Financial Corporation | | 15 | | 2004 Annual Report |
Management’s Discussion and Analysis of
Financial Condition and Results of Operations(continued)
Interest income.Interest income decreased $1.7 million or 2.7% to $60.8 million for 2004, compared to $62.5 million for 2003. This decrease in interest income can be attributed to a decrease in interest earned on loans receivable, securities available for sale and FHLB stock of $1.2 million, $321,000 and $149,000, respectively.
Interest earned on loans receivable decreased $1.2 million or 5.6% to $20.4 million for 2004, compared to $21.6 million for 2003. This decrease was primarily attributable to a decline in the yield on loans to 6.02% for 2004 compared to 6.51% for 2003. Partially offsetting the decline in the yield was an increase in the average balance of loans outstanding of $7.1 million or 2.2% to $339.2 million for the year ended December 31, 2004 as compared to $332.1 million for the year ended December 31, 2003.
Interest earned on securities decreased $321,000 or 0.8% to $39.8 million for 2004, compared to $40.1 million for 2003. This decrease was primarily attributable to a decrease in the tax equivalent yield on securities to 4.64% for 2004, compared to 4.78% for 2003. This decrease in yield is a reflection of the low interest rate environment that resulted in increased prepayments of securities and led to an increase in the amortization of premiums on the securities. Partially offsetting this decrease in yield was an increase in the average balance of securities of $25.1 million, or 2.8%, to $912.5 million for the year ended December 31, 2004 as compared to $887.4 million for the year ended December 31, 2003.
Income from FHLB stock decreased $149,000 or 22.3% to $520,000 for 2004, compared to $669,000 for 2003. This decrease can be primarily attributed to a decrease in the yield on FHLB stock to 1.64% for 2004, compared to 2.20% for 2003. Partially offsetting this decrease was an increase in the average balance of FHLB stock of $1.3 million or 4.4% to $31.7 million for 2004, compared to $30.4 million for 2003.
Interest earned on cash equivalents increased $5,000 or 6.4% to $83,000 for 2004, compared to $78,000 for 2003 as the yield increased to 0.77% for 2004, compared to 0.62% for 2003. Partially offsetting the increase in yields, was a decrease in the average balance of cash equivalents of $1.8 million or 14.6% to $10.7 million for 2004 compared to $12.6 million for 2003.
Interest expense.Interest expense decreased $5.3 million or 12.9% to $35.6 million for 2004, compared to $40.9 million for 2003. This decrease in interest expense can be attributed to decreases in interest incurred on deposits, borrowed funds and junior subordinated notes of $2.2 million, $1.6 million and $1.4 million, respectively.
Interest incurred on deposits decreased $2.2 million or 17.1% to $10.8 million for 2004, compared to $13.1 million for 2003. This decrease was primarily attributable to a decrease in the cost of deposits to 1.93% in 2004 from 2.26% in 2003, and to a lesser extent to a decrease in the average balance of interest-bearing deposits of $18.5 million or 3.2% to $561.0 million for 2004, compared to $579.5 million for 2003. The Company was able to decrease its cost of interest bearing deposits by diligently monitoring the interest rates on its products as well as the rates being offered by its competition through weekly interest rate committee meetings and utilizing rate surveys and hence subsequently lowering rates accordingly.
Interest incurred on FHLB advances, repurchase agreements and other borrowings, the largest components of the Company’s interest-bearing liabilities, decreased $1.6 million or 6.3% to $23.9 million for 2004, compared to $25.5 million for 2003. This decrease was primarily attributable to a decrease in the cost of these funds to 3.58% for 2004, compared to 4.18% for 2003. Partially offsetting the decrease in the cost of funds, was an increase in the average balance of FHLB advances, repurchase agreements and other borrowings of $58.5 million or 9.6% to $667.8 million for 2004, compared to $609.3 million for 2003. The Company, as part of its wholesale strategy, was able to minimize its cost of funds through its long-standing policy of laddering the maturities of borrowings up to and over a three to four year period. This strategy allows the Company the flexibility to alter its borrowing structure quarterly. During the year 2004, the Bank had maturing long-term borrowings, defined as borrowings with original terms greater than one year, of $155.6 million at an average rate of 3.83% replaced with borrowings of $155.6 million at an average rate of 3.08% and was able to lower the cost of those borrowings by 75 basis points.
| | | | |
ESB Financial Corporation | | 16 | | 2004 Annual Report |
Management’s Discussion and Analysis of
Financial Condition and Results of Operations(continued)
Interest expense on subordinated debt decreased $1.4 million to $855,000 at December 31, 2004 from $2.3 million for 2003. This decrease was primarily attributable to a decline in the average balance of the subordinated debt of $12.0 million or 42.8% to $16.0 million at December 31, 2004 from $28.0 million at December 31, 2003 and to a lesser extent to a decrease in the cost of these funds to 5.34% for 2004, compared to 8.22% for 2003.
The decrease in the cost of these funds was primarily the result of the Company restructuring the debt associated with the trust preferred securities of the Trust I. In the second quarter of 2003 the Company redeemed $5.0 million of the Preferred Securities of Trust I at a fixed rate of 8.625% and issued $10.0 million of variable rate preferred securities that reset quarterly to the 3 month London Interbank Offer Rate Index (LIBOR). Subsequently, in the fourth quarter of 2003 the Company issued an additional $5.0 million of variable rate preferred securities that also reset to LIBOR. In January of 2004 the Company entered into a loan agreement with First Tennessee Bank, National Association to borrow $15.0 million at a fixed interest rate of 5.55% and a stated maturity of five years. The proceeds were used to redeem the remaining $20.3 million of the preferred securities of Trust I, which were at an interest rate of 8.625%. Management’s decision to redeem these securities, over the past year, resulted in a total cost savings at the time of the restructuring of 374 basis points or a potential $660,000 annually.
Provision for (recovery of) loan losses. The Company records provisions for loan losses to bring the total allowance for loan losses to a level deemed adequate to cover embedded losses in the loan portfolio. In determining the appropriate level of allowance for loan losses, management considers historical loss experience, the financial condition of borrowers, economic conditions (particularly as they relate to markets where the Company originates loans), the status of non-performing assets, the estimated underlying value of the collateral and other factors related to the collectibility of the loan portfolio.
The Company recorded a provision for loan losses of $206,000 for 2004, compared to a recovery of loan losses of $106,000 for 2003. The provision for loan losses for the year ended December 31, 2004 is the result of provisions recorded in 2004 offset by operating recoveries from the normal operations of the Company. As a result of the provision for and recovery of loan losses during 2004 and 2003, the Company’s allowance for loan losses amounted to $3.9 million, or 1.06%, of the Company’s total loan portfolio at December 31, 2004, compared to $4.1 million or 1.17% at December 31, 2003. The Company’s allowance for loan losses as a percentage of non-performing loans at December 31, 2004 and December 31, 2003 was 165.20% and 228.20%, respectively.
Noninterest income.Noninterest income decreased $831,000 or 10.7% to $7.0 million for 2004, compared to $7.8 million for 2003. This decrease can be attributed to decreases in the net gain on sale of loans, the cash surrender value of the BOLI, net gain on sale of securities available for sale, income from real estate joint ventures and other noninterest income of $404,000, $14,000, $356,000, $582,000 and $127,000, respectively. Partially offsetting these decreases was an increase to fees and service charges of $652,000.
Fees and service charges increased $652,000 or 39.3% to $2.3 million for 2004, compared to $1.7 million for 2003. This increase can primarily be attributed to a decrease in the amortization of the servicing rights, net of the valuation allowance, of approximately $398,000, and increases to prepayment fees on loans and fees on NOW accounts of $219,000 and $335,000, respectively. The increase to the fees on NOW accounts resulted from the Company introducing a new overdraft service in the fourth quarter of 2003. These increases were partially offset by nominal decreases to other fees and service charges.
Net gain on sale of loans decreased $404,000 or 90.0% to $45,000 for 2004, compared to $449,000 for 2003. The decrease to the gain on sale of loans is a result of the recent increase in interest rates which has slowed down originations of mortgage loans available for sale to $2.8 million for the year ended December 31, 2004, compared to $34.0 million for the same period in the prior year.
| | | | |
ESB Financial Corporation | | 17 | | 2004 Annual Report |
Management’s Discussion and Analysis of
Financial Condition and Results of Operations(continued)
Income from real estate joint ventures decreased by $582,000 to $2.3 million for 2004 compared to $2.9 million for 2003. In two of the joint ventures the Company participates in developing the land as well as constructing and selling duplexes and quad homes. This decrease over the same period last year is a result of more units with higher profit margins being sold during 2003 than in 2004. The higher profit margins that the Company recognized in 2003 were primarily due to sales of a limited number of duplexes at one of the Company’s real estate joint ventures.
Noninterest expense.Noninterest expenses increased $980,000 or 5.1% to $20.2 million for 2004, compared to $19.2 million for 2003. This increase can be primarily attributed to increases in compensation and employee benefits, premises and equipment, data processing and loss on early extinguishment of debt of $520,000, $106,000, $142,000 and $629,000, respectively, partially offset by decreases in amortization of intangible assets, minority interest and other expense of $33,000, $261,000 and $116,000, respectively.
Compensation and employee benefits expense increased $520,000, or 4.7%, to $11.6 million for 2004, compared to $11.0 million for 2003. This increase can be attributed to normal salary increases between the years, the cost of health benefits and increases to the compensation related to the MRP of $414,000, $81,000 and $98,000, respectively. Partially offsetting these increases was a decrease to the compensation expense related to the ESOP of $97,000.
Premises and equipment expense increased $106,000, or 6.2%, to $1.8 million for 2004 as compared to 2003 at $1.7 million. Included in this expense was an impairment charge that the Company recognized on its Springdale office, which was closed on December 31, 2004, of $67,000.
Data processing expense increased $142,000 or 10.1% to $1.6 million for 2004, compared to $1.4 million for 2003. These increases are primarily related to new web-based services being offered to customers of the Bank, such as internet banking, bill pay and mortgage originations, as well as enhancements to applications utilized to manage the daily operations of the Company. The implementation of these enhancements will provide the customer 24 hour access to their accounts and provide a competitive edge to the Company. Additionally, after the completion of a technology review, the Company accelerated the depreciation on some of its data processing equipment and software applications to position itself for future technology enhancements that will be available through our data processing provider.
Amortization of intangible assets decreased $33,000 or 16.8% to $164,000 for 2004, compared to $197,000 for 2003. This amortization is related to the core deposit intangible that was recorded with the acquisition of WSB in 2001.
Loss on early extinguishment of debt increased $629,000 to $844,000 for 2004 from $215,000 for 2003. This expense was incurred to write off the deferred debt issuance costs associated with the remaining $20.3 million trust preferred debt of PennFirst Capital Trust I in January 2004.
Other expenses decreased $116,000 or 3.5% to $3.2 million for 2004, compared to $3.3 million for 2003. The decrease to other noninterest expense is a result of a decrease to various other expense accounts, partially offset by an increase to audit and accounting fees of $134,000 related to the Company’s compliance with the provisions of the Sarbanes-Oxley Act.
Provision for income taxes.The provision for income taxes remained relatively stable at $1.8 million for 2004. The provision for income taxes remained steady despite an increase of $1.5 million in pre-tax net income due to tax benefits the Company realized as a result of amended tax returns that were filed on behalf of the Company. The amended tax returns effectively reduced the Company’s provision as well as the effective tax rate to 15.5% from 18.0%, without the amendments, for the year ended December 31, 2004. The effective tax rate for the year ended December 31, 2003 was 17.5%.
| | | | |
ESB Financial Corporation | | 18 | | 2004 Annual Report |
Management’s Discussion and Analysis of
Financial Condition and Results of Operations(continued)
2003 Results Compared to 2002 Results
General. The Company reported net income of $8.5 million and $9.0 million for 2003 and 2002, respectively. The $436,000 or 4.9% decrease in net income between 2003 and 2002 can primarily be attributed to a decrease in interest income of $10.5 million, recovery of loan losses of $304,000 and an increase in noninterest expense of $1.5 million, which were partially offset by a decrease in interest expense of $10.4 million and an increase in noninterest income of $1.4 million.
Net interest income. Net interest income, which is the Company’s largest revenue source, is the difference between interest income on earning assets and interest expense paid on liabilities. Net interest income is affected by the changes in interest rates and the composition of interest earning assets and liabilities. Net interest income decreased slightly by $44,000 or 0.2% to $21.6 million for 2003, compared to $21.7 million for 2002. This decrease in net interest income can be attributed to a decrease in interest income of approximately $10.5 million, offset partially by a decrease in interest expense of $10.4 million.
Interest income.Interest income decreased $10.5 million or 14.4% to $62.5 million for 2003, compared to $73.0 million for 2002. This decrease in interest income can be attributed to a decrease in interest earned on loans receivable of $8.5 million and interest earned on securities available for sale of $1.8 million.
Interest earned on loans receivable decreased $8.5 million or 28.2% to $21.6 million for 2003, compared to $30.1 million for 2002. This decrease was primarily attributable to a decrease in the average balance of loans outstanding of $88.0 million or 21.0% to $332.1 million for the year ended December 31, 2003 as compared to $420.1 million for the year ended December 31, 2002. Also contributing to the decrease was a decline in the yield on loans to 6.51% for 2003, compared to 7.17% for 2002.
Interest earned on securities decreased $1.8 million or 4.2% to $40.1 million for 2003, compared to $41.9 million for 2002. This decrease was primarily attributable to a decrease in the tax equivalent yield on securities to 4.78% for 2003, compared to 5.81% for 2002. This decrease in yield is a reflection of the low interest rate environment that resulted in increased prepayments of securities and led to an increase in the amortization of premiums on the securities. Partially offsetting this decrease in yield was an increase in the average balance of securities of $124.3 million to $887.4 million for the year ended December 31, 2003 as compared to $763.2 million for the year ended December 31, 2002.
Income from FHLB stock decreased $183,000 or 21.5% to $669,000 for 2003, compared to $852,000 for 2002. This decrease can be primarily attributed to a decrease in the yield on FHLB stock to 2.20% for 2003, compared to 3.51% for 2002. Partially offsetting this decrease was an increase in the average balance of FHLB stock of $6.1 million or 25.2% to $30.4 million for 2003, compared to $24.3 million for 2002.
Interest earned on cash equivalents decreased $55,000 or 41.4% to $78,000 for 2003, compared to $133,000 for 2002 as the yield decreased to 0.62% for 2003, compared to 1.28% for 2002. Partially offsetting the decrease in yields, was an increase in the average balance of cash equivalents of $2.1 million or 20.5% to $12.6 million for 2003 compared to $10.4 million for 2002.
Interest expense. Interest expense decreased $10.4 million or 20.4% to $40.9 million for 2003, compared to $51.3 million for 2002. This decrease in interest expense can be attributed to decreases in interest incurred on deposits and FHLB advances, repurchase agreements and other borrowings of $5.1 million and $5.3 million, respectively.
Interest incurred on deposits decreased $5.1 million or 28.2% to $13.1 million for 2003, compared to $18.2 million for 2002. This decrease was primarily attributable to a decrease in the cost of deposits to 2.26% in 2003 from 3.16% in 2002. Partially offsetting the decrease in the cost of the deposits was an increase in the average balance of interest-bearing deposits of $3.2 million or 0.55% to $579.5 million for 2003, compared to $576.3 million for 2002.
| | | | |
ESB Financial Corporation | | 19 | | 2004 Annual Report |
Management’s Discussion and Analysis of
Financial Condition and Results of Operations(continued)
Interest incurred on FHLB advances, repurchase agreements and other borrowings decreased $5.4 million or 17.5% to $25.5 million for 2003, compared to $30.9 million for 2002. This decrease was primarily attributable to a decrease in the cost of these funds to 4.18% for 2003, compared to 5.41% for 2002. Partially offsetting the decrease in the cost of funds, was an increase in the average balance of FHLB advances, repurchase agreements and other borrowings of $37.8 million or 6.6% to $609.3 million for 2003, compared to $571.5 million for 2002.
Interest expense on subordinated debt increased $73,000 to $2.3 million at December 31, 2003 from $2.2 million for 2002. This increase was primarily attributable to an increase in the average balance of the subordinated debt of $3.8 million or 15.7% to $28.0 million at December 31, 2003 from $24.2 million at December 31, 2002. Partially offsetting the increase in the average balance was a decrease in the cost of these funds to 8.22% for 2003, compared to 9.21% for 2002. This decrease in the cost of the funds is the result of the Company calling a portion of the fixed rate subordinated debt and replacing it with lower cost variable rate funding.
(Recovery of) provision for loan losses. The Company records provisions for loan losses to bring the total allowance for loan losses to a level deemed adequate to cover embedded losses in the loan portfolio. In determining the appropriate level of allowance for loan losses, management considers historical loss experience, the financial condition of borrowers, economic conditions (particularly as they relate to markets where the Company originates loans), the status of non-performing assets, the estimated underlying value of the collateral and other factors related to the collectibility of the loan portfolio.
The Company recorded a recovery of loan losses of $106,000 for 2003, compared to a recovery for loan losses of $410,000 for 2002. The recovery of the loan losses for the year ended December 31, 2003 is the result of operating recoveries offset by provisions recorded in 2003 from the normal operations of the Company as well as an overall reduction to the loan portfolio. The recovery for loan losses for the year ended December 31, 2002 includes a final recovery of $404,000 on the Company’s Bennett lease pools and a reduction to the provision for loan losses of approximately $150,000, which resulted from the whole loan sale and securitization of a portion of the Company’s 1-4 family residential mortgage loans. As a result of the recovery of and provision for loan losses during 2003 and 2002, the Company’s allowance for loan losses amounted to $4.1 million or 1.17% of the Company’s total loan portfolio at December 31, 2003, compared to $4.2 million or 1.19% at December 31, 2002. The Company’s allowance for loan losses as a percentage of non-performing loans at December 31, 2003 and December 31, 2002 was 228.20% and 166.68%, respectively.
Noninterest income.Noninterest income increased $1.4 million, or 21.4%, to $7.8 million for 2003, compared to $6.4 million for 2002. This increase can be attributed to increases in fees and service charges, the net realized gain on sales of securities available for sale and net income from real estate joint ventures of $206,000, $254,000 and $2.1 million, respectively. Partially offsetting these increases were a decrease in net gain on sale of loans of $370,000 and a decline in the income from the cash surrender value of the BOLI of $213,000.
Fees and service charges increased $206,000 or 14.2% to $1.7 million for 2003, compared to $1.5 million for 2002. This increase can be attributed to a decrease in the amortization of the servicing rights, net of the valuation allowance, of approximately $96,000, an increase to loan servicing fees of $76,000 and an increase to fees on NOW accounts of $61,000. The increase to the fees on NOW accounts resulted from the Company introducing a new overdraft service in the fourth quarter of 2003. These increases were partially offset by nominal decreases to other fees and service charges.
Net gain on the sale of loans decreased $370,000 or 45.2% to $449,000 for 2003, compared to $819,000 for 2002. The gain on the sale of loans for 2003 is comprised of loans sold through normal operations, while the year ended December 31, 2002 included a gain of $510,000 in connection with the whole loan sale, $265,000 of which relates to servicing rights retained by the Company on the loans.
| | | | |
ESB Financial Corporation | | 20 | | 2004 Annual Report |
Management’s Discussion and Analysis of
Financial Condition and Results of Operations(continued)
The cash surrender value of the BOLI increased by $213,000, which is equal to the income generated by the BOLI for 2003. This income declined $213,000 from $1.2 million in 2002, which is a reflection of the lower interest rate environment that affected the BOLI’s underlying collateral.
Income from the real estate joint ventures increased by $1.4 million to $2.9 million for 2003 compared to $1.4 million for 2002. In the latter part of 2001, the Company formed two joint ventures in which the Company participates in the land acquisition and development phase as well as the building of single family homes, duplexes and quadplexes. The land acquisition and development phase of these projects was substantially complete in 2002 and the Company began to realize income from the sale of the respective units, this income increased substantially in 2003 as the sales activity increased. These projects have been a successful source of noninterest income for the Company and management will continue to look for opportunities to enter into new joint ventures as the existing projects are completed.
Noninterest expense.Noninterest expenses increased $1.5 million or 8.3% to $19.2 million for 2003, compared to $17.7 million for 2002. This increase can be primarily attributed to increases in compensation and employee benefits of $1.3 million offset by a decrease in other noninterest expense of $299,000.
Compensation and employee benefits expense increased $1.3 million or 12.9% to $11.0 million for 2003, compared to $9.8 million for 2002. This increase can be attributed to increases to ESOP expenses, the cost of health benefits and retirement expenses of $500,000, $248,000 and $133,000, respectively. These increases were in addition to normal salary increases between the years.
Premises and equipment expense remained relatively stable for 2003 as compared to 2002 at $1.7 million.
Data processing expense increased $69,000 or 5.2% to $1.4 million for 2003, compared to $1.3 million for 2002. The increase to data processing expense is a reflection of the Company’s commitment to continually improve technology in order to enhance service to its customer base.
Amortization of intangible assets decreased $28,000 or 12.4% to $197,000 for 2003, compared to $225,000 for 2002. This amortization is related to the core deposit intangible that was recorded with the acquisition of WSB in 2001.
Loss on early extinguishment of debt increased $215,000 for 2003 from $0 for 2002. This increase is the result of the expense to write off the deferred debt issuance costs associated with the trust preferred debt of PennFirst Capital Trust I, a portion of which was redeemed in 2003.
Other expenses decreased $514,000 or 13.4% to $3.3 million for 2003, compared to $3.8 million for 2002. The decrease to other noninterest expense is a result of a decrease to the provision for loss on real estate owned of $417,000, offset by nominal increases and decreases in other expenses.
Provision for income taxes.The provision for income taxes remained relatively stable at $1.8 million for 2003, this is a result of an increase to the Company’s effective tax rate to 17.5% for 2003 compared to 16.9% in 2002.
Asset and Liability Management
The primary objective of the Company’s asset and liability management function is to maximize the Company’s net interest income while simultaneously maintaining an acceptable level of interest rate risk given the Company’s operating environment, capital and liquidity requirements, performance objectives and overall business focus. The principal determinant of the exposure of the Company’s earnings to interest rate risk is the timing difference between the repricing or maturity of interest-earning assets and the repricing or maturity of its interest-bearing liabilities. The Company’s asset and liability management policies are designed to decrease interest rate sensitivity primarily by shortening the maturities of interest-earning assets while at the same time extending the maturities of interest-bearing liabilities. The Board of Directors of the Company continues to
| | | | |
ESB Financial Corporation | | 21 | | 2004 Annual Report |
Management’s Discussion and Analysis of
Financial Condition and Results of Operations(continued)
believe in strong asset/liability management in order to insulate the Company from material and prolonged increases in interest rates. As a result of this policy, the Company emphasizes a larger, more diversified portfolio of residential mortgage loans in the form of mortgage-backed securities. Mortgage-backed securities generally increase the quality of the Company’s assets by virtue of the insurance or guarantees that back them, are more liquid than individual mortgage loans and may be used to collateralize borrowings or other obligations of the Company.
The Company’s Board of Directors has established an Asset and Liability Management Committee consisting of outside directors, the President and Chief Executive Officer, Group Senior Vice President/Chief Financial Officer, Group Senior Vice President/Operations, Group Senior Vice President/Lending and Group Senior Vice President/Administration. This committee, which meets quarterly, generally monitors various asset and liability management policies and strategies, which were implemented by the Company over the past few years. These strategies have included: (i) an emphasis on the investment in adjustable-rate and shorter duration mortgage-backed securities, (ii) an emphasis on the origination of single-family residential adjustable-rate mortgages (ARMs), residential construction loans and commercial real estate loans, which generally have adjustable or floating interest rates and/or shorter maturities than traditional single-family residential loans, and consumer loans, which generally have shorter terms and higher interest rates than mortgage loans; (iii) increase the duration of the liability base of the Company by extending the maturities of savings deposits, borrowed funds and repurchase agreements and (iv) the purchase of off-balance sheet interest rate caps which help to insulate the Bank’s interest rate risk position from increases in interest rates.
As of December 31, 2004, the implementation of these asset and liability initiatives resulted in the following: (i) $173.1 million or 46.5% of the Company’s total loan portfolio had adjustable interest rates or maturities of 12 months or less; (ii) $75.2 million or 39.9% of the Company’s portfolio of single-family residential mortgage loans (including residential construction loans) consisted of ARMs; (iii) $349.0 million or 49.2% of the Company’s portfolio of mortgage-backed securities were secured by ARMs and (iv) the Company had $50.0 million in notional amount of interest rate caps.
Interest Rate Sensitivity Gap Analysis
The implementation of the foregoing asset and liability initiatives and strategies, combined with other external factors such as demand for the Company’s products and economic and interest rate environments in general, has resulted in the Company being able to maintain a one-year interest rate sensitivity gap ranging between a positive 5.0% of total assets to a negative 15.0% of total assets. The one-year interest rate sensitivity gap is defined as the difference between the Company’s interest-earning assets, which are scheduled to mature or reprice within one year and its interest-bearing liabilities, which are scheduled to mature or reprice within one year. At December 31, 2004, the Company’s interest-earning assets maturing or repricing within one year totaled $461.6 million while the Company’s interest-bearing liabilities maturing or repricing within one-year totaled $639.6 million, providing a deficiency of interest-earning assets over interest-bearing liabilities of $178.0 million or a negative 12.8% of total assets. At December 31, 2004, the percentage of the Company’s assets to liabilities maturing or repricing within one year was 72.2%. The Company does not presently anticipate that its one-year interest rate sensitivity gap will fluctuate beyond a range of a positive 5.0% of total assets to a negative 15.0% of total assets.
| | | | |
ESB Financial Corporation | | 22 | | 2004 Annual Report |
Management’s Discussion and Analysis of
Financial Condition and Results of Operations(continued)
The following table presents the amounts of interest-earning assets and interest-bearing liabilities outstanding as of December 31, 2004 which are expected to mature, prepay or reprice in each of the future time periods presented:
| | | | | | | | | | | | | | | | | | | | | | | |
(Dollar amounts in thousands)
| | Due in six months
or less
| | | Due within
six months
to one year
| | | Due within
one to three years
| | | Due within
three to five years
| | | Due in
over five years
| | | Total
|
Total interest-earning assets | | $ | 319,009 | | | $ | 142,605 | | | $ | 363,059 | | | $ | 202,988 | | | $ | 276,562 | | | $ | 1,304,223 |
Total interest-bearing liabilities | | | 462,827 | | | | 176,813 | | | | 439,603 | | | | 110,001 | | | | 93,912 | | | | 1,283,156 |
| | |
|
|
| |
|
|
| |
|
|
| |
|
|
| |
|
|
| |
|
|
Maturity or repricing gap during the period | | $ | (143,818 | ) | | $ | (34,208 | ) | | $ | (76,544 | ) | | $ | 92,987 | | | $ | 182,650 | | | $ | 21,067 |
| | |
|
|
| |
|
|
| |
|
|
| |
|
|
| |
|
|
| |
|
|
Cumulative gap | | $ | (143,818 | ) | | $ | (178,026 | ) | | $ | (254,570 | ) | | $ | (161,583 | ) | | $ | 21,067 | | | | |
| | |
|
|
| |
|
|
| |
|
|
| |
|
|
| |
|
|
| | | |
Ratio of gap during the period to total assets | | | (10.31 | )% | | | (2.45 | )% | | | (5.49 | )% | | | 6.67 | % | | | 13.10 | % | | | |
| | |
|
|
| |
|
|
| |
|
|
| |
|
|
| |
|
|
| | | |
Ratio of cumulative gap to total assets | | | (10.31 | )% | | | (12.77 | )% | | | (18.26 | )% | | | (11.59 | )% | | | 1.51 | % | | | |
| | |
|
|
| |
|
|
| |
|
|
| |
|
|
| |
|
|
| | | |
Total assets | | | | | | | | | | | | | | | | | | | | | | $ | 1,394,515 |
| | | | | | | | | | | | | | | | | | | | | | |
|
|
The one-year interest rate sensitivity gap has been the most common industry standard used to measure an institution’s interest rate risk position. In recent years, in addition to utilizing interest rate sensitivity gap analysis, the Company has increased its emphasis on the utilization of interest rate sensitivity simulation analysis to evaluate and manage interest rate risk.
Interest Rate Sensitivity Simulation Analysis
The Company also utilizes income simulation modeling in measuring its interest rate risk and managing its interest rate sensitivity. The Asset and Liability Management Committee of the Company believes that simulation modeling enables the Company to more accurately evaluate and manage the possible effects on net interest income due to the exposure to changing market interest rates, the slope of the yield curve and different loan and mortgage-backed security prepayment and deposit decay assumptions under various interest rate scenarios.
As with gap analysis and earnings simulation modeling, assumptions about the timing and variability of cash flows are critical in economic value of equity (EVE) valuation analysis. Particularly important are the assumptions driving mortgage prepayments and the assumptions about expected attrition of the core deposit portfolios. These assumptions are based on the Company’s historical experience and industry standards and are applied consistently across the different rate risk measures.
The Company has established the following guidelines for assessing interest rate risk:
Net interest income simulation.Given a 200 basis point parallel and gradual increase or decrease in market interest rates, net interest income may not change by more than 10% for a one-year period.
Economic Value of Equity (EVE).EVE is the net present value of the Company’s existing assets and liabilities. Given a 200 basis point immediate and permanent increase or decrease in market interest rates, EVE may not correspondingly decrease or increase by more than 50% of stockholders’ equity.
The following table presents the simulated impact of a 100 basis point or 200 basis point upward or downward shift of market interest rates on net interest income, return on average equity, diluted earnings per share and the change in EVE. This analysis was done assuming that the interest-earning asset and interest-bearing liability levels at December 31, 2004 remained constant. The impact of the market rate movements was developed by simulating the effects of rates changing gradually over a one-year period from the December 31, 2004 levels for net interest income, return on average equity and diluted earnings per share. The impact of market rate movements was developed by simulating the effects of an immediate and permanent change in rates at December 31, 2004 for the change in EVE:
| | | | | | | | | | | |
| | | Increase
| | | Decrease
|
| | | +100
BP
| | | +200
BP
| | | -100
BP
| | | -200
BP
|
Net interest income - increase (decrease) | | (0.76 | )% | | (1.74 | )% | | (2.32 | )% | | N/A |
Return on average equity - increase (decrease) | | (1.21 | )% | | (2.79 | )% | | (3.87 | )% | | N/A |
Diluted earnings per share - increase (decrease) | | (1.16 | )% | | (2.84 | )% | | (3.99 | )% | | N/A |
EVE - increase (decrease) | | (26.90 | )% | | (56.62 | )% | | 6.34 | % | | N/A |
| | | | |
ESB Financial Corporation | | 23 | | 2004 Annual Report |
Management’s Discussion and Analysis of
Financial Condition and Results of Operations(continued)
The following table presents the simulated impact of a 100 basis point or 200 basis point upward or downward shift of market interest rates on net interest income, return on average equity, diluted earnings per share and the change in EVE. This analysis was done assuming that the interest-earning asset and interest-bearing liability levels at December 31, 2003 remained constant. The impact of the market rate movements was developed by simulating the effects of rates changing gradually over a one-year period from the December 31, 2003 levels for net interest income, return on average equity and diluted earnings per share. The impact of market rate movements was developed by simulating the effects of an immediate and permanent change in rates at December 31, 2003 for the change in EVE:
| | | | | | | | | | | |
| | | Increase
| | | Decrease
|
| | | +100
BP
| | | +200
BP
| | | -100
BP
| | | -200
BP
|
Net interest income - increase (decrease) | | 1.10 | % | | 1.08 | % | | (3.56 | )% | | N/A |
Return on average equity - increase (decrease) | | 1.90 | % | | 1.94 | % | | (5.96 | )% | | N/A |
Diluted earnings per share - increase (decrease) | | 1.98 | % | | 2.08 | % | | (6.13 | )% | | N/A |
EVE - increase (decrease) | | (10.91 | )% | | (30.83 | )% | | (4.72 | )% | | N/A |
Liquidity and Capital Resources
The Company’s primary sources of funds are deposits, advances from the FHLB, loan and security repayments and funds provided by operations. While payments of principal and interest on loans and other investments are relatively predictable sources of funds, deposit flows are much less predictable since they are greatly influenced by the level of interest rates, the state of the economy, competition and industry conditions. For a discussion on issues that may affect the liquidity of the Company, including outstanding commitments, contingent liabilities, legal actions and off balance sheet items, please refer to notes 12 and 13 of the consolidated financial statements. The Company’s contractual obligations at December 31, 2004 are as follows:
| | | | | | | | | | | | | | | |
(Dollar amounts in thousands) | | Payment due by period
|
Contractual Obligations
| | Total
| | Less than 1
year
| | 1-3 Years
| | 3-5 Years
| | More than
5 years
|
Long-term debt obligations (1) | | $ | 372,749 | | $ | — | | $ | 296,113 | | $ | 75,630 | | $ | 1,006 |
Operating lease obligations | | | 828 | | | 156 | | | 310 | | | 263 | | | 99 |
Purchase obligations | | | — | | | — | | | — | | | — | | | — |
| | |
|
| |
|
| |
|
| |
|
| |
|
|
Total Contractual Obligations | | $ | 373,577 | | $ | 156 | | $ | 296,423 | | $ | 75,893 | | $ | 1,105 |
| | |
|
| |
|
| |
|
| |
|
| |
|
|
| | | | |
ESB Financial Corporation | | 24 | | 2004 Annual Report |
Management’s Discussion and Analysis of
Financial Condition and Results of Operations(continued)
The sources of liquidity and capital resources discussed above are believed by management to be sufficient to fund outstanding loan commitments and meet other obligations.
Current regulatory requirements specify that ESB and similar institutions must maintain, tier one leverage capital equal to 3.0% of adjusted total assets and total capital equal to 8.0% of risk-weighted assets. The Office of the Comptroller of the Currency and the FDIC have adopted more stringent core capital requirements which require that all banks, except for the most highly rated banks, have at least an additional 100 to 200 basis point cushion above this minimum. Therefore, an absolute minimum leverage ratio of not less than 4.0% must be maintained by those banks that are not highly rated or that are anticipating or experiencing significant growth. The FDIC reserves the right to apply this higher standard to any insured financial institution when considering an institution’s capital adequacy. At December 31, 2004, ESB was in compliance with all regulatory capital requirements with tier one leverage capital and risk-based capital ratios of 7.3% and 15.6%, respectively.
Impact of Inflation and Changing Prices
The consolidated financial statements of the Company and related notes presented herein have been prepared in accordance with U.S. generally accepted accounting principles which require the measurement of financial condition and operating results in terms of historical dollars, without considering changes in the relative purchasing power of money over time due to inflation.
Unlike most industrial companies, substantially all of the assets and liabilities of a financial institution are monetary in nature. As a result, interest rates have a more significant impact on a financial institution’s performance than the effects of general levels of inflation. Interest rates do not necessarily move in the same direction or in the same magnitude as the prices of goods and services since such prices are affected by inflation to a larger degree than interest rates. In the current interest rate environment, liquidity and the maturity structure of the Company’s assets and liabilities are critical to the maintenance of acceptable performance levels.
Recent Accounting and Regulatory Pronouncements
The Company’s discussion of recent accounting and regulatory pronouncements can be found in Note 1 of the Company’s consolidated financial statements.
| | | | |
ESB Financial Corporation | | 25 | | 2004 Annual Report |
Consolidated Statements of Financial Condition
(Dollar amounts in thousands, except share data)
| | | | | | | | |
| | | December 31,
| |
| | 2004
| | | 2003
| |
| Assets | | | | | | | | |
Cash on hand and in banks | | $ | 6,100 | | | $ | 6,351 | |
Interest-earning deposits | | | 7,470 | | | | 7,472 | |
Federal funds sold | | | 4,133 | | | | 1,507 | |
| | |
|
|
| |
|
|
|
Cash and cash equivalents | | | 17,703 | | | | 15,330 | |
Securities available for sale; cost of $920,443 and $ 914,459 | | | 929,794 | | | | 928,936 | |
Loans receivable, net of allowance for loan losses of $3,940 and $ 4,062 | | | 343,524 | | | | 322,454 | |
Accrued interest receivable | | | 7,843 | | | | 7,630 | |
Federal Home Loan Bank (FHLB) stock | | | 31,607 | | | | 30,678 | |
Premises and equipment, net | | | 9,592 | | | | 9,476 | |
Real estate acquired through foreclosure, net | | | 1,303 | | | | 1,164 | |
Real estate held for investment | | | 12,612 | | | | 11,429 | |
Goodwill | | | 7,127 | | | | 7,127 | |
Intangible assets | | | 500 | | | | 705 | |
Prepaid expenses and other assets | | | 7,324 | | | | 6,206 | |
Bank owned life insurance | | | 25,586 | | | | 24,645 | |
| | |
|
|
| |
|
|
|
Total assets | | $ | 1,394,515 | | | $ | 1,365,780 | |
| | |
|
|
| |
|
|
|
| Liabilities and Stockholders’ Equity | | | | | | | | |
Liabilities: | | | | | | | | |
Deposits | | $ | 580,346 | | | $ | 603,046 | |
FHLB advances | | | 601,242 | | | | 570,240 | |
Repurchase agreements | | | 67,000 | | | | 47,000 | |
Other borrowings | | | 19,320 | | | | 62 | |
Junior subordinated notes | | | 15,211 | | | | 35,187 | |
Advance payments by borrowers for taxes and insurance | | | 1,642 | | | | 1,837 | |
Accrued expenses and other liabilities | | | 11,953 | | | | 11,537 | |
| | |
|
|
| |
|
|
|
Total liabilities | | | 1,296,714 | | | | 1,268,909 | |
| | |
|
|
| |
|
|
|
Stockholders’ Equity: | | | | | | | | |
Preferred stock, $.01 par value, 5,000,000 shares authorized; none issued | | | — | | | | — | |
Common stock, $.01 par value, 30,000,000 shares authorized;
10,930,281 and 10,930,393 shares issued;
10,682,556 and 10,785,399 shares outstanding | | | 109 | | | | 109 | |
Additional paid-in capital | | | 60,940 | | | | 60,202 | |
Treasury stock, at cost; 247,725 and 144,994 shares | | | (3,394 | ) | | | (2,083 | ) |
Unearned Employee Stock Ownership Plan (ESOP) shares | | | (5,518 | ) | | | (6,504 | ) |
Unvested shares held by Management Recognition Plan (MRP) | | | (332 | ) | | | (196 | ) |
Retained earnings | | | 40,408 | | | | 35,879 | |
Accumulated other comprehensive income, net | | | 5,588 | | | | 9,464 | |
| | |
|
|
| |
|
|
|
Total stockholders’ equity | | | 97,801 | | | | 96,871 | |
| | |
|
|
| |
|
|
|
Total liabilities and stockholders’ equity | | $ | 1,394,515 | | | $ | 1,365,780 | |
| | |
|
|
| |
|
|
|
See accompanying notes to consolidated financial statements.
| | | | |
ESB Financial Corporation | | 26 | | 2004 Annual Report |
Consolidated Statements of Operations
(Dollar amounts in thousands, except share data)
| | | | | | | | | | | |
| | | Year ended December 31,
| |
| | 2004
| | 2003
| | | 2002
| |
Interest income: | | | | | | | | | | | |
Loans receivable | | $ | 20,413 | | $ | 21,617 | | | $ | 30,106 | |
Taxable securities available for sale | | | 34,798 | | | 35,628 | | | | 37,141 | |
Tax-exempt securities available for sale | | | 4,984 | | | 4,475 | | | | 4,728 | |
FHLB stock | | | 520 | | | 669 | | | | 852 | |
Interest-earning deposits and federal funds sold | | | 83 | | | 78 | | | | 133 | |
| | |
|
| |
|
|
| |
|
|
|
Total interest income | | | 60,798 | | | 62,467 | | | | 72,960 | |
| | |
|
| |
|
|
| |
|
|
|
Interest expense: | | | | | | | | | | | |
Deposits | | | 10,835 | | | 13,075 | | | | 18,197 | |
Borrowed funds | | | 23,879 | | | 25,478 | | | | 30,878 | |
Junior subordinated notes | | | 855 | | | 2,299 | | | | 2,226 | |
| | |
|
| |
|
|
| |
|
|
|
Total interest expense | | | 35,569 | | | 40,852 | | | | 51,301 | |
| | |
|
| |
|
|
| |
|
|
|
Net interest income | | | 25,229 | | | 21,615 | | | | 21,659 | |
Provision for (recovery of) loan losses | | | 206 | | | (106 | ) | | | (410 | ) |
| | |
|
| |
|
|
| |
|
|
|
Net interest income after provision for (recovery of) loan losses | | | 25,023 | | | 21,721 | | | | 22,069 | |
| | |
|
| |
|
|
| |
|
|
|
Noninterest income: | | | | | | | | | | | |
Fees and service charges | | | 2,312 | | | 1,660 | | | | 1,454 | |
Net gain on sale of loans | | | 45 | | | 449 | | | | 819 | |
Increase of cash surrender value of bank owned life insurance | | | 940 | | | 954 | | | | 1,167 | |
Net realized gain on sale of securities available for sale | | | 943 | | | 1,299 | | | | 1,045 | |
Income from real estate joint ventures | | | 2,284 | | | 2,866 | | | | 1,446 | |
Other | | | 436 | | | 563 | | | | 486 | |
| | |
|
| |
|
|
| |
|
|
|
Total noninterest income | | | 6,960 | | | 7,791 | | | | 6,417 | |
| | |
|
| |
|
|
| |
|
|
|
Noninterest expense: | | | | | | | | | | | |
Compensation and employee benefits | | | 11,557 | | | 11,037 | | | | 9,779 | |
Premises and equipment | | | 1,827 | | | 1,721 | | | | 1,726 | |
Federal deposit insurance premiums | | | 89 | | | 96 | | | | 103 | |
Data processing | | | 1,552 | | | 1,410 | | | | 1,341 | |
Amortization of intangible assets | | | 164 | | | 197 | | | | 225 | |
Minority Interest | | | 908 | | | 1,169 | | | | 689 | |
Loss on early extinguishment of debt | | | 844 | | | 215 | | | | — | |
Other | | | 3,216 | | | 3,332 | | | | 3,846 | |
| | |
|
| |
|
|
| |
|
|
|
Total noninterest expense | | | 20,157 | | | 19,177 | | | | 17,709 | |
| | |
|
| |
|
|
| |
|
|
|
Income before provision for income taxes | | | 11,826 | | | 10,335 | | | | 10,777 | |
Provision for income taxes | | | 1,836 | | | 1,811 | | | | 1,817 | |
| | |
|
| |
|
|
| |
|
|
|
Net income | | $ | 9,990 | | $ | 8,524 | | | $ | 8,960 | |
| | |
|
| |
|
|
| |
|
|
|
Net income per share: | | | | | | | | | | | |
Basic | | $ | 0.98 | | $ | 0.84 | | | $ | 0.88 | |
Diluted | | $ | 0.94 | | $ | 0.80 | | | $ | 0.86 | |
| | | |
Cash dividends declared per share | | $ | 0.40 | | $ | 0.38 | | | $ | 0.31 | |
Weighted average shares outstanding | | | 10,191,687 | | | 10,177,449 | | | | 10,134,335 | |
Weighted average shares and share equivalents outstanding | | | 10,575,220 | | | 10,696,419 | | | | 10,449,356 | |
See accompanying notes to consolidated financial statements.
| | | | |
ESB Financial Corporation | | 27 | | 2004 Annual Report |
Consolidated Statements of Changes in Stockholders’ Equity
(Dollar amounts in thousands, except share data)
| | | | | | | | | | | | | | | | | | | | | | | | | | | | | | | |
| | | Common
stock
| | Additional
paid-in
capital
| | | Treasury
stock
| | | Unearned
ESOP
shares
| | | Unvested
MRP
shares
| | | Retained
earnings
| | | Accumulated other
comprehensive
income (loss), net of tax
| | | Total
stockholders’
equity
| |
Balance at January 1, 2002 | | $ | 77 | | $ | 57,906 | | | $ | (4,318 | ) | | $ | (2,912 | ) | | $ | (255 | ) | | $ | 27,117 | | | $ | 2,288 | | | $ | 79,903 | |
Comprehensive results: | | | | | | | | | | | | | | | | | | | | | | | | | | | | | | | |
Net income | | | — | | | — | | | | — | | | | — | | | | — | | | | 8,960 | | | | — | | | | 8,960 | |
Other comprehensive results, net | | | — | | | — | | | | — | | | | — | | | | — | | | | — | | | | 10,727 | | | | 10,727 | |
Reclassification adjustment | | | — | | | — | | | | — | | | | — | | | | — | | | | — | | | | (192 | ) | | | (192 | ) |
| | |
|
| |
|
|
| |
|
|
| |
|
|
| |
|
|
| |
|
|
| |
|
|
| |
|
|
|
Total comprehensive results | | | — | | | — | | | | — | | | | — | | | | — | | | | 8,960 | | | | 10,535 | | | | 19,495 | |
Cash dividends at $0.31 per share | | | — | | | — | | | | — | | | | — | | | | — | | | | (3,092 | ) | | | — | | | | (3,092 | ) |
Six-for-five stock split | | | 15 | | | — | | | | — | | | | — | | | | — | | | | (15 | ) | | | — | | | | — | |
Payment of cash in lieu of fractional shares for six-for-five stock split | | | — | | | (6 | ) | | | — | | | | — | | | | — | | | | — | | | | — | | | | (6 | ) |
Purchase of treasury stock, at cost (119,130 shares) | | | — | | | — | | | | (1,486 | ) | | | — | | | | — | | | | — | | | | — | | | | (1,486 | ) |
Reissuance of treasury stock for stock option exercises | | | — | | | — | | | | 1,035 | | | | — | | | | — | | | | (512 | ) | | | — | | | | 523 | |
Principal payments on ESOP debt | | | — | | | 231 | | | | — | | | | 607 | | | | — | | | | — | | | | — | | | | 838 | |
Effect of compensatory stock options | | | — | | | 166 | | | | — | | | | | | | | — | | | | — | | | | — | | | | 166 | |
Accrued compensation expense MRP | | | — | | | — | | | | — | | | | — | | | | 30 | | | | — | | | | — | | | | 30 | |
| | |
|
| |
|
|
| |
|
|
| |
|
|
| |
|
|
| |
|
|
| |
|
|
| |
|
|
|
Balance at December 31, 2002 | | $ | 92 | | $ | 58,297 | | | $ | (4,769 | ) | | $ | (2,305 | ) | | $ | (225 | ) | | $ | 32,458 | | | $ | 12,823 | | | $ | 96,371 | |
Comprehensive results: | | | | | | | | | | | | | | | | | | | | | | | | | | | | | | | |
Net income | | | — | | | — | | | | — | | | | — | | | | — | | | | 8,524 | | | | — | | | | 8,524 | |
Other comprehensive results, net | | | — | | | — | | | | — | | | | — | | | | — | | | | — | | | | (2,249 | ) | | | (2,249 | ) |
Reclassification adjustment | | | — | | | — | | | | — | | | | — | | | | — | | | | — | | | | (1,110 | ) | | | (1,110 | ) |
| | |
|
| |
|
|
| |
|
|
| |
|
|
| |
|
|
| |
|
|
| |
|
|
| |
|
|
|
Total comprehensive results | | | — | | | — | | | | — | | | | — | | | | — | | | | 8,524 | | | | (3,359 | ) | | | 5,165 | |
Cash dividends at $0.38 per share | | | — | | | — | | | | — | | | | — | | | | — | | | | (3,896 | ) | | | — | | | | (3,896 | ) |
Six-for-five stock split | | | 17 | | | — | | | | — | | | | — | | | | — | | | | (17 | ) | | | — | | | | — | |
Payment of cash in lieu of fractional shares for six-for-five stock split | | | — | | | (10 | ) | | | — | | | | — | | | | — | | | | — | | | | — | | | | (10 | ) |
Purchase of treasury stock, at cost (220,826 shares) | | | — | | | — | | | | (3,181 | ) | | | — | | | | — | | | | — | | | | — | | | | (3,181 | ) |
Reissuance of treasury stock for stock option exercises | | | — | | | — | | | | 1,884 | | | | — | | | | — | | | | (1,190 | ) | | | — | | | | 694 | |
Principal payments on ESOP debt | | | — | | | 528 | | | | — | | | | 801 | | | | — | | | | — | | | | — | | | | 1,329 | |
Purchase of treasury stock, for ESOP (342,465 shares) | | | — | | | 1,017 | | | | 3,983 | | | | (5,000 | ) | | | — | | | | — | | | | — | | | | — | |
Effect of compensatory stock options | | | — | | | 370 | | | | — | | | | — | | | | — | | | | — | | | | — | | | | 370 | |
Accrued compensation expense MRP | | | — | | | — | | | | — | | | | — | | | | 29 | | | | — | | | | — | | | | 29 | |
| | |
|
| |
|
|
| |
|
|
| |
|
|
| |
|
|
| |
|
|
| |
|
|
| |
|
|
|
Balance at December 31, 2003 | | $ | 109 | | $ | 60,202 | | | $ | (2,083 | ) | | $ | (6,504 | ) | | $ | (196 | ) | | $ | 35,879 | | | $ | 9,464 | | | $ | 96,871 | |
Comprehensive results: | | | | | | | | | | | | | | | | | | | | | | | | | | | | | | | |
Net income | | | — | | | — | | | | — | | | | — | | | | — | | | | 9,990 | | | | — | | | | 9,990 | |
Other comprehensive results, net | | | — | | | — | | | | — | | | | — | | | | — | | | | — | | | | (3,262 | ) | | | (3,262 | ) |
Reclassification adjustment | | | — | | | — | | | | — | | | | — | | | | — | | | | — | | | | (614 | ) | | | (614 | ) |
| | |
|
| |
|
|
| |
|
|
| |
|
|
| |
|
|
| |
|
|
| |
|
|
| |
|
|
|
Total comprehensive results | | | — | | | — | | | | — | | | | — | | | | — | | | | 9,990 | | | | (3,876 | ) | | | 6,114 | |
Cash dividends at $0.40 per share | | | — | | | — | | | | — | | | | — | | | | — | | | | (4,063 | ) | | | — | | | | (4,063 | ) |
Purchase of treasury stock, at cost (230,958 shares) | | | — | | | — | | | | (3,139 | ) | | | — | | | | — | | | | — | | | | — | | | | (3,139 | ) |
Reissuance of treasury stock for stock option exercises | | | — | | | — | | | | 1,828 | | | | — | | | | — | | | | (1,398 | ) | | | — | | | | 430 | |
Principal payments on ESOP debt | | | — | | | 257 | | | | — | | | | 986 | | | | — | | | | — | | | | — | | | | 1,243 | |
Effect of compensatory stock options | | | — | | | 218 | | | | — | | | | — | | | | — | | | | — | | | | — | | | | 218 | |
Unvested shares in MRP | | | — | | | 263 | | | | — | | | | — | | | | (199 | ) | | | — | | | | | | | | 64 | |
Accrued compensation expense MRP | | | — | | | — | | | | — | | | | — | | | | 63 | | | | — | | | | — | | | | 63 | |
| | |
|
| |
|
|
| |
|
|
| |
|
|
| |
|
|
| |
|
|
| |
|
|
| |
|
|
|
Balance at December 31, 2004 | | $ | 109 | | $ | 60,940 | | | $ | (3,394 | ) | | $ | (5,518 | ) | | $ | (332 | ) | | $ | 40,408 | | | $ | 5,588 | | | $ | 97,801 | |
| | |
|
| |
|
|
| |
|
|
| |
|
|
| |
|
|
| |
|
|
| |
|
|
| |
|
|
|
See accompanying notes to consolidated financial statements.
| | | | |
ESB Financial Corporation | | 28 | | 2004 Annual Report |
Consolidated Statements of Cash Flows
(Dollar amounts in thousands)
| | | | | | | | | | | | |
| | | Year ended December 31,
| |
| | 2004
| | | 2003
| | | 2002
| |
Operating activities: | | | | | | | | | | | | |
Net income | | $ | 9,990 | | | $ | 8,524 | | | $ | 8,960 | |
Adjustments to reconcile net income to net cash provided by operating activities: | | | | | | | | | | | | |
Depreciation and amortization for premises and equipment | | | 1,021 | | | | 976 | | | | 968 | |
Provision for (recovery of) loan losses and loss on REO | | | 206 | | | | (106 | ) | | | (410 | ) |
Amortization of premiums/discounts | | | 3,117 | | | | 4,417 | | | | 1,572 | |
Origination of loans held for sale | | | (2,821 | ) | | | (34,000 | ) | | | (25,082 | ) |
Proceeds from sale of loans held for sale | | | 2,821 | | | | 35,568 | | | | 58,672 | |
Gain on sale of securities available for sale | | | (943 | ) | | | (1,299 | ) | | | (1,045 | ) |
Amortization of intangible assets | | | 205 | | | | 637 | | | | 226 | |
Compensation expense on ESOP and MRP | | | 1,370 | | | | 1,368 | | | | 868 | |
(Increase) decrease in accrued interest receivable | | | (213 | ) | | | 775 | | | | (186 | ) |
Decrease (increase) in prepaid expenses and other assets | | | 346 | | | | 1,017 | | | | (4,867 | ) |
(Increase) decrease in accrued expenses and other liabilities | | | (1,493 | ) | | | 2,968 | | | | (2,268 | ) |
Other | | | (577 | ) | | | (119 | ) | | | (3,528 | ) |
| | |
|
|
| |
|
|
| |
|
|
|
Net cash provided by operating activities | | | 13,029 | | | | 20,726 | | | | 33,880 | |
| | |
|
|
| |
|
|
| |
|
|
|
Investing activities: | | | | | | | | | | | | |
Loan originations and purchases | | | (158,090 | ) | | | (188,586 | ) | | | (163,247 | ) |
Purchases of: | | | | | | | | | | | | |
Securities available for sale | | | (230,935 | ) | | | (489,965 | ) | | | (368,056 | ) |
Interest Rate Cap Contracts | | | (215 | ) | | | (1,123 | ) | | | — | |
FHLB Stock | | | (929 | ) | | | (791 | ) | | | (7,998 | ) |
Fixed Assets | | | (1,127 | ) | | | (1,173 | ) | | | (351 | ) |
Principal repayments of: | | | | | | | | | | | | |
Loans receivable | | | 136,307 | | | | 205,733 | | | | 178,076 | |
Securities available for sale | | | 213,129 | | | | 386,210 | | | | 238,256 | |
Proceeds from the sale of: | | | | | | | | | | | | |
Securities available for sale | | | 9,601 | | | | 31,888 | | | | 54,680 | |
REO | | | 380 | | | | 149 | | | | 47 | |
Reductions (additions) to real estate held for investment | | | 726 | | | | 462 | | | | (3,107 | ) |
| | |
|
|
| |
|
|
| |
|
|
|
Net cash used in investing activities | | | (31,153 | ) | | | (57,196 | ) | | | (71,700 | ) |
| | |
|
|
| |
|
|
| |
|
|
|
Financing activities: | | | | | | | | | | | | |
Net (decrease) increase in deposits | | | (22,700 | ) | | | 13,220 | | | | (2,173 | ) |
Proceeds from long-term borrowings | | | 176,310 | | | | 160,000 | | | | 193,543 | |
Repayments of long-term borrowings | | | (114,555 | ) | | | (123,081 | ) | | | (171,757 | ) |
Net increase (decrease) in short-term borrowings | | | 8,505 | | | | (16,940 | ) | | | 21,894 | |
Issuance of Preferred Debt | | | — | | | | 14,625 | | | | — | |
Redemption of Preferred Debt | | | (20,052 | ) | | | (4,785 | ) | | | — | |
Proceeds received from exercise of stock options | | | 430 | | | | 694 | | | | 523 | |
Dividends paid | | | (4,302 | ) | | | (3,885 | ) | | | (3,070 | ) |
Net proceeds from (payments to acquire) re-issuance or sale of treasury stock | | | (3,139 | ) | | | 1,819 | | | | (1,486 | ) |
Stock purchased by ESOP | | | — | | | | (5,000 | ) | | | — | |
| | |
|
|
| |
|
|
| |
|
|
|
Net cash provided by financing activities | | | 20,497 | | | | 36,667 | | | | 37,474 | |
| | |
|
|
| |
|
|
| |
|
|
|
Net increase (decrease) in cash equivalents | | | 2,373 | | | | 197 | | | | (346 | ) |
Cash equivalents at beginning of period | | | 15,330 | | | | 15,133 | | | | 15,479 | |
| | |
|
|
| |
|
|
| |
|
|
|
Cash equivalents at end of period | | $ | 17,703 | | | $ | 15,330 | | | $ | 15,133 | |
| | |
|
|
| |
|
|
| |
|
|
|
| | | |
Continued | | | | | | | | | | | | |
| | | | |
ESB Financial Corporation | | 29 | | 2004 Annual Report |
Consolidated Statements of Cash Flows(continued)
(Dollar amounts in thousands, except share data)
| | | | | | | | | |
| | | Year ended December 31,
|
| | 2004
| | 2003
| | 2002
|
Supplemental information: | | | | | | | | | |
| | | |
Interest paid | | $ | 35,595 | | $ | 40,227 | | $ | 49,332 |
Income taxes paid | | | 1,971 | | | 1,585 | | | 3,141 |
| | | |
Supplemental schedule of non-cash investing and financing activities: | | | | | | | | | |
Transfers from loans receivable to real estate acquired through foreclosure | | | 598 | | | 275 | | | 26 |
Transfers from loans receivable to loans held for sale | | | — | | | — | | | 33,100 |
Dividends declared but not paid | | | 1,068 | | | 1,079 | | | 777 |
See accompanying notes to consolidated financial statements.
| | | | |
ESB Financial Corporation | | 30 | | 2004 Annual Report |
Notes to Consolidated Financial Statements
| 1. | Summary of Significant Accounting Policies |
Principles of Consolidation
ESB Financial Corporation (the Company) is a publicly traded Pennsylvania thrift holding company. The consolidated financial statements include the accounts of the Company and its direct and indirect wholly owned subsidiaries, ESB Bank, (ESB or the Bank), PennFirst Financial Services, Inc., THF, Inc. (THF), AMSCO, Inc.(AMSCO) and ESB Financial Services, Inc. ESB is a Pennsylvania chartered Federal Deposit Insurance Corporation (FDIC) insured stock savings bank.
AMSCO is engaged in real estate development and construction of 1- 4 family residential units independently or in conjunction with its joint ventures. Five of the joint ventures are 51% owned or greater by AMSCO and the Bank has provided all development and construction financing. The five joint ventures have been included in the consolidated financial statements and are reflected within other noninterest income or expense. The Bank’s loans to AMSCO and related interest have been eliminated in consolidation.
In addition to the elimination of the loans and interest to the joint ventures described above, all other significant intercompany transactions and balances have been eliminated in consolidation.
Basis of Presentation
The preparation of financial statements in conformity with U.S. generally accepted accounting principles requires management to make some estimates and assumptions that affect the reported amounts in the consolidated financial statements and accompanying notes. Actual results could differ from those estimates. Certain amounts previously reported for 2003 and 2002 have been reclassified to conform with the financial statement presentation for 2004. The reclassification had no effect on net income. All share and related price and dividend amounts presented herein have been restated to reflect prior period stock dividends and stock splits.
Operating Segments
An operating segment is defined as a component of an enterprise that engages in business activities that generate revenue and incur expense, the operating results of which are reviewed by management and for which discrete financial information is available. At December 31, 2004, the Company was doing business through 16 full service banking branches, one loan production office and its various other subsidiaries. Loans and deposits are primarily generated from the areas where banking branches are located. The Company derives its income predominantly from interest on loans and securities and to a lesser extent, noninterest income. The Company’s principal expenses are interest paid on deposits and borrowed funds and normal operating costs. The Company’s operations are principally in the savings and loan industry. Consistent with internal reporting, the Company’s operations are reported in one operating segment, which is community banking.
Cash Equivalents
Cash equivalents include cash on hand and in banks, interest-earning deposits and federal funds sold. The Board of Governors of the Federal Reserve System imposes certain reserve requirements on all depository institutions. These reserves are maintained in the form of vault cash or as a noninterest-bearing balance with the Federal Reserve Bank. Required reserves averaged $5.1 million during the year 2004.
| | | | |
ESB Financial Corporation | | 31 | | 2004 Annual Report |
Notes to Consolidated Financial Statements(continued)
| 1. | Summary of Significant Accounting Policies(continued) |
Securities Available for Sale and Held for Maturity
Securities include investments primarily in bonds, notes and to a lesser extent equity securities and are classified as either available for sale or held to maturity at the time of purchase based on management’s intent. Such intent includes consideration of the interest rate environment, prepayment risk, credit risk, maturity and repricing characteristics, liquidity considerations, investment and asset/liability management policies and other pertinent factors. Unrealized holding gains and losses, net of applicable income taxes, on available for sale securities are reported as accumulated other comprehensive income until realized. Gains and losses on the sale of securities are determined using the specific identification method and are included in operations in the period sold.
Declines in the fair value of equity securities below their cost that are determined to be other than temporary result in the security being written down to fair value on an individual basis. Any related write-downs are included in operations as realized losses.
Declines in the fair value of marketable debt securities that are determined to be other than temporary due to a decline in the credit of the issuer are written down to fair value accordingly, with a resulting charge to realized loss and an adjustment to the cost basis of the security. With respect to the other-than-temporary impairments of marketable debt securities where the decline in the market value is solely attributable to an increase in market interest rates, this would not trigger an other-than-temporary impairment charge if the Company has the intent and ability to hold the debt security until recovery. At each reporting date, management will re-challenge their intent and ability to hold such debt security until recovery and document the basis for this assertion. To the extent that market conditions have changed and management can no longer assert that they have the intent and ability to hold a debt security until the market value recovers, the Company will recognize an other-than-temporary impairment at that time.
Yields and carrying values for certain mortgage-backed securities are subject to normal interest rate and prepayment risks. Premiums and discounts on securities are recognized in interest income using the interest method over the period to maturity.
Loans Receivable
Loans receivable, for which management has the intent and the Company has the ability to hold for the foreseeable future or until maturity or payoff, are reported at their outstanding unpaid principal balances reduced by any charge-offs and net of any deferred fees or costs on loans originated, unamortized premiums or discounts on loans purchased and the allowance for loan losses.
Interest income on loans is accrued and credited to operations as earned. Interest income is not accrued for loans delinquent 90 days or greater. Interest on impaired loans is discontinued when, in management’s opinion, the borrower may be unable to meet contractual payments. When interest accrual is discontinued, all unpaid accrued interest is reversed. Interest receipts on nonaccrual and impaired loans are recognized as interest revenue or applied to principal when management believes the ultimate collectibility of principal is in doubt.
Discounts and premiums on purchased loans are recognized in interest income using the interest method over the remaining period to contractual maturity, adjusted for prepayments. Loan origination fees and certain direct origination costs are capitalized and recognized as an adjustment to the yield of the related loan over the loan’s period to maturity. Loans originated and intended for sale are carried at the lower of cost or estimated market value in the aggregate.
| | | | |
ESB Financial Corporation | | 32 | | 2004 Annual Report |
Notes to Consolidated Financial Statements(continued)
| 1. | Summary of Significant Accounting Policies(continued) |
Impaired loans consist of non-homogeneous loans, which based on the evaluation of current information and events, management has determined that it is probable the Company will not be able to collect amounts due according to the contractual terms of the loan agreement. The Company evaluates all commercial and commercial real estate loans which have been classified for regulatory reporting purposes, including non-accrual and restructured loans, in determining impaired loans.
The allowance for loan losses is maintained at a level believed to be adequate by management to absorb probable losses inherent in the portfolio and is based on the size and current risk characteristics of the loan portfolio, an assessment of individual problem loans and actual loss experience, current economic events in specific industries and other pertinent factors such as regulatory guidance and general economic conditions. Determination of the allowance is inherently subjective as it requires significant estimates, including the amounts and timing of expected future cash flows on impaired loans, estimated losses on pools of homogeneous loans based on historical loss experience and consideration of current economic trends, all of which may be susceptible to significant change. Loan losses are charged off against the allowance, while recoveries of amounts previously charged off are credited to the allowance. A provision for loan losses is charged to operations based on management’s periodic evaluation of the factors previously mentioned, as well as other pertinent factors. Evaluations are conducted quarterly, during which loans may be charged off upon reaching various stages of delinquency and depending upon the loan type. The components of the allowance for loan losses represent an estimation pursuant to FAS No. 5, “Accounting for Contingencies” or FAS No. 114, “Accounting by Creditors for Impairment of a Loan”.
Real Estate Acquired Through Foreclosure
Real estate properties acquired through foreclosure are initially recorded at the lower of cost or fair value at the date of foreclosure, establishing a new cost basis. After foreclosure, management periodically performs valuations and the real estate is carried at the lower of cost or fair value less estimated costs to sell. Revenue and expenses from operations of the properties, gains and losses on sales and additions to the valuation allowance are included in operating results.
Premises and Equipment
Land is carried at cost. Premises, furniture and equipment, and leasehold improvements are carried at cost less accumulated depreciation or amortization. Depreciation is calculated on a straight-line basis over the estimated useful lives of the related assets, which are twenty-five to fifty years for buildings and three to ten years for furniture and equipment. Amortization of leasehold improvements is computed using the straight-line method over the term of the related lease.
Goodwill and Intangible Assets
Goodwill consisted of $7.1 million at December 31, 2004 and 2003. The Company adopted the provisions of FAS 142, under which the Company ceased amortizing goodwill and instead evaluates goodwill or impairment. This impairment assessment is performed at least annually. The fair value of the Company and the implied fair value of goodwill at the respective reporting unit level was estimated as of December 31, 2004 using the market value approach, utilizing industry comparable information. The Company concluded that the recorded value of goodwill was not impaired as a result of the evaluation. Core deposit intangible was $309,000 and $473,000 at December 31, 2004 and 2003, respectively. The core deposit intangible assets are amortized on a sum of the year’s digit basis over the estimated useful life, generally up to ten years. Amortization of finite lived assets is expected to total, $124,000, $91,000, $58,000 and $25,000 for 2005, 2006, 2007 and 2008, respectively.
| | | | |
ESB Financial Corporation | | 33 | | 2004 Annual Report |
Notes to Consolidated Financial Statements(continued)
| 1. | Summary of Significant Accounting Policies(continued) |
Mortgage Servicing Assets
The servicing asset recorded in connection with the whole loan sale and securitization of a portion of the Company’s 1- 4 family residential mortgage loan portfolio during 2002 was $1.2 million. At December 31, 2004, the remaining balance of the servicing asset was $226,000, the fair value of the servicing asset at December 31, 2004 was $192,000. Servicing assets are amortized in proportion to, and over the period of, estimated net servicing revenues. Impairment of servicing assets is based on fair value of those assets, estimated using discounted cash flows and prepayment assumptions for the market area of the servicing portfolio. For purposes of measuring impairment, the servicing asset is stratified based on interest rate. The amount of impairment recognized is the amount by which the capitalized servicing asset for a stratum exceeds the fair value of that stratum. The impairment valuation at December 31, 2004 and 2003 was $35,000 and $105,000, respectively. The amortization taken on the servicing asset for the year ended December 31, 2004 and 2003 was $111,000 and $526,000, respectively. The Company had recoveries of impairment valuations during 2004 and 2003 of $70,000 and $87,000, respectively, and an impairment valuation of $191,000 during 2002. The Company had total loans serviced for others of $38.7 million, $54.0 million and $125.3 million at December 31, 2004, 2003 and 2002, respectively.
Income Taxes
Deferred tax assets and liabilities are reflected at currently enacted income tax rates applicable to the period in which the deferred tax assets or liabilities are expected to be realized or settled. As changes in tax laws or rates are enacted, deferred tax assets and liabilities are adjusted through the provision for income taxes.
Financial Instruments
Statement of Financial Accounting Standards No. 133,Accounting for Derivative Instruments and Hedging Activities (FAS 133), as amended and interpreted, establishes accounting and reporting standards for derivative instruments, including certain derivative instruments embedded in other contracts, and for hedging activities. As required by SFAS 133, the Company records all derivatives on the consolidated balance sheet at fair value. The accounting for changes in the fair value of derivatives depends on the intended use of the derivative and the resulting designation. Derivatives used to hedge the exposure to changes in the fair value of an asset, liability, or firm commitment attributable to a particular risk, such as interest rate risk, are considered fair value hedges. Derivatives used to hedge the exposure to variability in expected future cash flows, or other types of forecasted transactions, are considered cash flow hedges.
For derivatives designated as fair value hedges, changes in the fair value of the derivative and the hedged item related to the hedged risk are recognized in earnings. For derivatives designated as cash flow hedges, the effective portion of changes in the fair value of the derivative is initially reported in other comprehensive income (outside of earnings) and subsequently reclassified to earnings when the hedged transaction affects earnings, and the ineffective portion of changes in the fair value of the derivative is recognized directly in earnings. The Company assesses the effectiveness of each hedging relationship by comparing the changes in fair value or cash flows of the derivative hedging instrument with the changes in fair value or cash flows of the designated hedged item or transaction. For derivatives not designated as hedges, changes in fair value are recognized in earnings.
The Company’s objective in using derivatives is to add stability to net interest income and to manage its exposure to interest rate movements or other identified risks. To accomplish this objective, the Company primarily uses interest rate caps as part of its cash flow hedging strategy. Interest rate caps designated as cash flow hedges involve the receipt of variable rate amounts over the life of the agreement if the LIBOR interest rate increases above a certain rate. During 2004, such derivatives were used to hedge the variable cash flows associated with $50.0 million of existing variable-rate debt.
| | | | |
ESB Financial Corporation | | 34 | | 2004 Annual Report |
Notes to Consolidated Financial Statements(continued)
| 1. | Summary of Significant Accounting Policies(continued) |
In the event the Company terminates a derivative designated as a cash flow hedge, the treatment of the gain or loss on the derivative on the termination date depends on the probability of the hedged forecasted transactions occurring. If the forecasted transactions are probable of not occurring, the gain or loss on the termination of the derivative is recognized immediately in earnings. Otherwise, the gain or loss is reclassified out of other comprehensive income into earnings as the forecasted transactions occur.
If the hedged item in a cash flow hedge fails to occur or is probable of not occurring, cash flow hedge accounting is no longer applied to that hedging relationship and amounts classified in other comprehensive income are reclassified to earnings immediately. All future changes in the fair value of the derivative will be classified in earnings until the derivative matures or is re-designated in a new hedging relationship.
As of December 31, 2004, no derivatives were designated as fair value hedges or hedges of net investments in foreign operations. Additionally, the Company does not use derivatives for trading or speculative purposes and currently does not have any derivatives that are not designated as hedges.
At December 31, 2004 and 2003, derivatives with a fair value of $451,000 and $1.0 million, respectively, were included in other assets. The change in unrealized losses of $749,000 in 2004 for derivatives designated as cash flow hedges is separately disclosed, net of tax, in other comprehensive income in Note 11. No hedge ineffectiveness on cash flow hedges was recognized during 2004 or 2003.
Amounts reported in accumulated other comprehensive income related to derivatives will be reclassified to interest expense as interest payments are made on the Company’s variable-rate debt. During 2004, approximately $2,335 was reclassified from other comprehensive income to interest expense. The Company estimates that during 2005, $90,000 will be reclassified from other comprehensive income to interest expense.
Stock-Based Compensation
The Company accounts for stock based compensation using the intrinsic value method in accordance with APB Opinion 25, “Accounting for Stock Issued to Employees” and has adopted the disclosure provisions of FAS 148, “Accounting for Stock Based Compensation”. Under APB No. 25, because the exercise price of the Company’s stock options equals the market price of the underlying stock on the date of grant, no compensation expense is recognized. The disclosure provisions of FAS 148 require the presentation of net income and earnings per share assuming the reporting of compensation expense under FAS 123, whereby the estimated fair value of the options is amortized to expense over the vesting period. The fair value of these options was estimated at the date of grant using the Black-Scholes Option Pricing Model with the following weighted-average assumptions for 2004: risk-free interest rates of 3.74%; dividend yields of 2.75%; volatility factors of the expected market price of the Company’s stock of 24.2%; and a weighted average life of the option of 5.8 years. The year 2003 was modeled with the following assumptions: risk-free interest rates of 3.49%; dividend yields of 2.75%; volatility factors of the expected market price of the company’s stock of 21.9%; and a weighted average life of the option of 5.6 years. The year 2002 was modeled with the following assumptions: risk-free interest rates of 4.4%; dividend yields of 3.5%; volatility factors of the expected market price of the Company’s stock of 20.9%; and a weighted average life of the option of nine years. The following pro forma information regarding compensation expense, net of tax, net income and earnings per share assumes the adoption of FAS 123 for stock options granted subsequent to December 31, 1994:
| | | | | | | | | | | | |
(Dollar amounts in thousands, except share data)
| | 2004
| | | 2003
| | | 2002
| |
Net income, as reported | | $ | 9,990 | | | $ | 8,524 | | | $ | 8,960 | |
Compensation expense, under FAS 123, net of tax | | | (218 | ) | | | (180 | ) | | | (175 | ) |
| | |
|
|
| |
|
|
| |
|
|
|
Pro forma net income | | $ | 9,772 | | | $ | 8,344 | | | $ | 8,785 | |
| | | |
Basic net income per share, as reported | | $ | 0.98 | | | $ | 0.84 | | | $ | 0.88 | |
Pro forma basic net income per share | | $ | 0.96 | | | $ | 0.82 | | | $ | 0.87 | |
| | | |
Diluted net income per share, as reported | | $ | 0.94 | | | $ | 0.80 | | | $ | 0.86 | |
Pro forma diluted net income per share | | $ | 0.92 | | | $ | 0.78 | | | $ | 0.83 | |
| | | | |
ESB Financial Corporation | | 35 | | 2004 Annual Report |
Notes to Consolidated Financial Statements(continued)
| 1. | Summary of Significant Accounting Policies(continued) |
The Black-Scholes Valuation Model was developed for use in estimating the fair value of traded options which have no vesting restrictions and are fully transferable. In addition, option valuation models require the input of highly subjective assumptions including the expected stock price volatility. Because the Company’s stock options have characteristics significantly different from those of traded options and because changes in the subjective input assumptions can materially affect the fair value estimate, in management’s opinion, the existing models do not necessarily provide a reliable single measure of the fair value of its stock options. For the purpose of pro forma disclosure, the estimated fair value of the options is amortized to expense over the option’s vesting period.
Net Income Per Share
The following table summarizes the Company’s net income per share for the years ended December 31:
| | | | | | | | | |
(Amounts in thousands, except per share data)
| | 2004
| | 2003
| | 2002
|
Net income | | $ | 9,990 | | $ | 8,524 | | $ | 8,960 |
Weighted-average common shares outstanding | | | 10,192 | | | 10,177 | | | 10,134 |
| | |
|
| |
|
| |
|
|
Basic earnings per share | | $ | 0.98 | | $ | 0.84 | | $ | 0.88 |
| | |
|
| |
|
| |
|
|
Weighted-average common shares outstanding | | | 10,192 | | | 10,177 | | | 10,134 |
| | | |
Common stock equivalents due to effect of stock options | | | 383 | | | 519 | | | 315 |
| | |
|
| |
|
| |
|
|
Total weighted-average common shares and equivalents | | | 10,575 | | | 10,696 | | | 10,449 |
| | |
|
| |
|
| |
|
|
Diluted earnings per share | | $ | 0.94 | | $ | 0.80 | | $ | 0.86 |
| | |
|
| |
|
| |
|
|
The shares controlled by the ESOP of 503,929 and 593,938 at December 31, 2004 and December 31, 2003, respectively, are not considered in the weighted average shares outstanding until the shares are committed for allocation to an employee’s individual account. Options to purchase 94,310 shares of common stock at $15.35 per share of common stock and 90,220 at $14.50 per share of common stock, were outstanding as of December 31, 2004 but were not included in the computation of diluted earnings per share for 2004 because the options’ exercise price was greater than the average market price of the common shares. The options expire in November of 2013 and 2014. All of the options outstanding at December 31, 2003 were included in the computation of diluted earnings per share for 2003 because the options’ exercise price was less than the average market price of the common shares. Options to purchase 117,612 shares of common stock at $10.83 per share of common stock, were outstanding as of December 31, 2002 but were not included in the computation of diluted earnings per share for 2002 because the options’ exercise price was greater than the average market price of the common shares. The options expire on November 18, 2012.
| | | | |
ESB Financial Corporation | | 36 | | 2004 Annual Report |
Notes to Consolidated Financial Statements(continued)
| 1. | Summary of Significant Accounting Policies(continued) |
Effect of Recent Accounting and Regulatory Pronouncements
In March 2004, the Financial Accounting Standards Board (“FASB”) reached consensus on the guidance provided by Emerging Issues Task Force Issue 03-1 (“EITF 03-1”),The Meaning of Other-Than-Temporary Impairment and its Application to Certain Investments. The guidance is applicable to debt and equity securities that are within the scope of FASB Statement of Financial Accounting Standard (FAS) No. 115,Accounting for Certain Investments In Debt and Equity Securities and certain other investments. EITF 03-1 specifies that an impairment would be considered other-than-temporary unless (a) the investor has the ability and intent to hold an investment for a reasonable period of time sufficient for the recovery of the fair value up to (or beyond) the cost of the investment and (b) evidence indicating the cost of the investment is recoverable within a reasonable period of time outweighs evidence to the contrary. EITF 03-1 cost method investment and disclosure provisions were effective for reporting periods ending after June 15, 2004. The measurement and recognition provisions relating to debt securities have been delayed until the FASB issues additional guidance. The Company adopted cost method investment and disclosure provisions of EITF 03-1 on June 30, 2004. The adoption did not have a material impact on the consolidated financial statements, results of operations or liquidity of the Company.
The Company accounts for interest rate lock commitments (IRLCs) for mortgage loans which it intends to sell as derivatives, in accordance with the requirements of SFAS No. 133. In March 2004, the SEC staff released Staff Accounting Bulletin (SAB) No. 105 that requires all registrants to exclude the future cash flows for servicing loans from the fair value of IRLCs. ESB enters into such commitments with customers in connection with residential mortgage loan applications. This statement delays the recognition of any servicing revenues related to these commitments until such time as the loan is sold, however, the pronouncement would have no effect on the ultimate amount of revenue or cash flows recognized over time. This pronouncement was effective April 1, 2004. The adoption of SAB 105 did not have a material impact on the Company’s financial condition or results of operations.
In January 2003 and December 2003, the FASB issued FIN No. 46, “Consolidation of Variable Interest Entities”, (or VIEs) an interpretation of Accounting Research Bulletin No. 51, “Consolidated Financial Statements” and FIN No. 46-R, a revision of FIN No. 46. Both FIN No. 46 and FIN No. 46-R (“the interpretations”) require consolidation of entities in which an enterprise absorbs a majority of the entity’s expected losses, receives a majority of the entity’s residual returns, or both, as a result of ownership, contractual or other financial interests in the entity. Prior to the interpretations, entities were generally consolidated by an enterprise when it had a controlling financial interest through ownership of a majority voting interest in the entity.
During 2003, the Company adopted FIN No. 46. The result of this adoption was the deconsolidation of its subsidiary grantor trusts, as the Company concluded that the primary beneficiaries of the subsidiary grantor trusts were the investors, not the Company. During 2004, management evaluated its investments in low income housing partnerships in connection with the criteria established under the interpretations. The Company was not determined to be the primary beneficiary of these projects; therefore the interpretations did not have an impact on the Company’s accounting for these partnerships.
During 1998 the Company’s wholly-owned subsidiary Amsco, Inc. formed a joint venture named Madison Woods for the purpose of developing a 57 acre tract of land in Moon Township, Allegheny County, PA into a 56-lot subdivision for the purpose of selling the lots for single-family residential construction. The joint venture was financed with a $26,000 initial equity contribution from the Company and $38,000 from the other partners and a loan from ESB Bank for the mortgage.
| | | | |
ESB Financial Corporation | | 37 | | 2004 Annual Report |
Notes to Consolidated Financial Statements(continued)
| 1. | Summary of Significant Accounting Policies(continued) |
The Company has a 40% ownership interest in this joint venture and accounts for the operating results using the equity method. At December 31, 2004 the Company determined that it does not have any loss exposure as a result of its involvement with Madison Woods, due to the fact that the project is substantially complete, the loan to ESB Bank has been repaid and the joint venture is not projected to incur any losses from now until its completion. As a result of this determination the Company concluded that it had no effect from the issuance of the Interpretation on the accounting for its ownership in the Madison Woods joint venture.
In December 2003, the American Institute of Certified Public Accountants issued Statement of Position (SOP) 03-3 “Accounting for Certain Loans or Debt Securities Acquired in a Transfer”. This SOP addresses accounting for differences between contractual cash flows and cash flows expected to be collected from an investor’s initial investment in loans or debt securities acquired in a transfer if those differences are attributable, at least in part, to credit quality. It includes such loans acquired in purchase business combinations and applies to all nongovernmental entities, including not-for-profit organizations. This SOP does not apply to loans originated by the entity. SOP 03-3 prohibits the carrying over or creation of valuation allowances in the initial accounting of all loans acquired in a transfer that are within the scope of this SOP. The prohibition of the valuation allowance carryover applies to the purchase of an individual loan, a pool of loans, a group of loans and loans acquired in a purchase business combination. This SOP is effective for loans acquired in fiscal years beginning after December 15, 2004. As such SOP 03-3 will affect the Company in the first quarter or 2005 with the acquisition of loans from PHSB Financial Corporation (PHSB). The Company has reviewed the loans held by PHSB and does not anticipate that the adoption of SOP 03-3 will have a material impact on the Company.
In December 2004, the Financial Accounting Standards Board (FASB) issued Statement of Financial Accounting Standards (FAS) No. 123 (Revised 2004), “Share Based Payment”. The statement requires that compensation cost relating to share-based payment transactions be recognized in financial statements and that this cost be measured based on the fair value of the equity or liability instruments issued, FAS No. 123 (Revised 2004) covers a wide range of share-based compensation arrangements including share options, restricted share plans, performance-based awards, share appreciation rights, and employee share purchase plans. The Company will adopt FAS 123R on July 1, 2005 and is currently evaluating the impact the adoption of the standard will have on the Company’s results of operations. For purposes of historical comparison of the compensation expense of options, see footnote 1 “Summary of Significant Accounting Policies”—Stock Based Compensation.
| | | | |
ESB Financial Corporation | | 38 | | 2004 Annual Report |
Notes to Consolidated Financial Statements(continued)
The following table summarizes the Company’s securities as of December 31:
| | | | | | | | | | | | | |
(Dollar amounts in thousands)
| | Amortized
cost
| | Unrealized
gains
| | Unrealized
losses
| | | Fair value
|
December 31, 2004: | | | | | | | | | | | | | |
Trust Preferred securities | | $ | 500 | | $ | — | | $ | (18 | ) | | $ | 482 |
U.S. Government securities | | | 5,986 | | | 487 | | | — | | | | 6,473 |
Municipal securities | | | 106,622 | | | 6,012 | | | (193 | ) | | | 112,441 |
Equity securities | | | 973 | | | 352 | | | — | | | | 1,325 |
Corporate bonds | | | 99,290 | | | 1,948 | | | (1,770 | ) | | | 99,468 |
Mortgage-backed securities | | | 707,072 | | | 6,287 | | | (3,754 | ) | | | 709,605 |
| | |
|
| |
|
| |
|
|
| |
|
|
| | | $ | 920,443 | | $ | 15,086 | | $ | (5,735 | ) | | $ | 929,794 |
| | |
|
| |
|
| |
|
|
| |
|
|
December 31, 2003: | | | | | | | | | | | | | |
Trust Preferred securities | | $ | 500 | | $ | — | | $ | (79 | ) | | $ | 421 |
U.S. Government securities | | | 5,982 | | | 662 | | | — | | | | 6,644 |
Municipal securities | | | 93,857 | | | 5,152 | | | (326 | ) | | | 98,683 |
Equity securities | | | 1,013 | | | 330 | | | — | | | | 1,343 |
Corporate bonds | | | 112,067 | | | 4,973 | | | (3,357 | ) | | | 113,683 |
Mortgage-backed securities | | | 701,040 | | | 9,912 | | | (2,790 | ) | | | 708,162 |
| | |
|
| |
|
| |
|
|
| |
|
|
| | | $ | 914,459 | | $ | 21,029 | | $ | (6,552 | ) | | $ | 928,936 |
| | |
|
| |
|
| |
|
|
| |
|
|
The proceeds from the sale of securities as of December 31, 2004, 2003 and 2002 were $9.6 million, $31.9 million and $54.7 million, respectively. Gross realized gains and gross realized losses on sales of securities available for sale were $943,000 and $0, respectively in 2004, $1.3 million and $1,500, respectively in 2003 and $1.9 million and $412,000, respectively in 2002. In addition, impairment charges on available for sale securities of $446,000 were recorded for the year ended 2002, on equity securities that were deemed to be other-than-temporarily impaired.
At December 31, 2004 and 2003 the Company did not have any corporate bonds whose book value exceeded 10% of equity.
The following table shows the Company’s investments’ gross unrealized losses and fair value aggregated by investment category and length of time that individual securities have been in a continuous unrealized loss position, at December 31, 2004:
| | | | | | | | | | | | | | | | | | | | | | | | |
As of December 31, 2004 | | | | | | | | | | | | | | | | | | |
| | Less than 12 Months
| | 12 Months or more
| | Total
|
(Dollar amounts in thousands)
| | # of
Securities
| | Fair Value
| | Unrealized
losses
| | # of
Securities
| | Fair Value
| | Unrealized
losses
| | # of
Securities
| | Fair Value
| | Unrealized
losses
|
Municipal securities | | 5 | | $ | 3,739 | | $ | 31 | | 12 | | $ | 8,786 | | $ | 162 | | 17 | | $ | 12,525 | | $ | 193 |
Corporate bonds | | — | | | — | | | — | | 10 | | | 47,460 | | | 1,788 | | 10 | | | 47,460 | | | 1,788 |
Mortgage-backed securities | | 48 | | | 184,898 | | | 961 | | 33 | | | 172,194 | | | 2,793 | | 81 | | | 357,092 | | | 3,754 |
| | |
| |
|
| |
|
| |
| |
|
| |
|
| |
| |
|
| |
|
|
| | | 53 | | $ | 188,637 | | $ | 992 | | 55 | | $ | 228,440 | | $ | 4,743 | | 108 | | $ | 417,077 | | $ | 5,735 |
| | |
| |
|
| |
|
| |
| |
|
| |
|
| |
| |
|
| |
|
|
| | | | |
ESB Financial Corporation | | 39 | | 2004 Annual Report |
Notes to Consolidated Financial Statements(continued)
The following table shows the Company’s investments’ gross unrealized losses and fair value aggregated by investment category and length of time that individual securities have been in a continuous unrealized loss position, at December 31, 2003:
| | | | | | | | | | | | | | | | | | | | | | | | |
As of December 31, 2003 | | Less than 12 Months
| | 12 Months or more
| | Total
|
(Dollar amounts in thousands)
| | # of
Securities
| | Fair Value
| | Unrealized
losses
| | # of
Securities
| | Fair Value
| | Unrealized
losses
| | # of
Securities
| | Fair Value
| | Unrealized
losses
|
Municipal securities | | 15 | | $ | 10,966 | | $ | 326 | | 0 | | $ | — | | $ | — | | 15 | | $ | 10,966 | | $ | 326 |
Corporate bonds | | — | | | — | | | — | | 10 | | | 45,797 | | | 3,436 | | 10 | | | 45,797 | | | 3,436 |
Mortgage-backed securities | | 45 | | | 265,988 | | | 2,789 | | 1 | | | 4,087 | | | 1 | | 46 | | | 270,075 | | | 2,790 |
| | |
| |
|
| |
|
| |
| |
|
| |
|
| |
| |
|
| |
|
|
| | | 60 | | $ | 276,954 | | $ | 3,115 | | 11 | | $ | 49,884 | | $ | 3,437 | | 71 | | $ | 326,838 | | $ | 6,552 |
| | |
| |
|
| |
|
| |
| |
|
| |
|
| |
| |
|
| |
|
|
The Company primarily invests in mortgage-backed securities, variable and fixed rate corporate bonds, municipal bonds, government bonds and to a lesser extent equity securities. The policy of the Company is to recognize an other than temporary impairment on equity securities where the fair value has been significantly below cost for three consecutive quarters. Declines in the fair value of the corporate bonds that can be attributed to specific adverse conditions affecting the credit quality of the investment would be recorded as other than temporary impairment losses, and charged to earnings. In order to determine if a decline in fair value is other than temporary, the Company reviews corporate ratings of the investment, analyst reports and SEC filings of the issuers. For fixed maturity investments with unrealized losses due to interest rates where the Company has the positive intent and ability to hold the investment for a period of time sufficient to allow a market recovery, declines in value below cost are not assumed to be other than temporary. The Company reviews its position quarterly and has asserted that at December 31, 2004, the declines outlined in the above table represent temporary declines due to changes in interest rates and are not a reflection of an impairment in the credit quality of the securities, additionally, the Company does have the intent and ability to hold those securities either to maturity or to allow a market recovery.
The following table summarizes scheduled maturities of the Company’s securities as of December 31, 2004, excluding equity securities which have no maturity dates:
| | | | | | | | | |
(Dollar amounts in thousands)
| | Available for sale
|
| | Weighted
Average Yield
| | | Amortized
cost
| | Fair value
|
Due in one year or less | | 7.35 | % | | $ | 14,448 | | $ | 14,659 |
Due from one year to five years | | 6.28 | % | | | 44,022 | | | 46,454 |
Due from five to ten years | | 4.09 | % | | | 42,178 | | | 42,382 |
Due after ten years | | 4.08 | % | | | 818,822 | | | 824,974 |
| | |
|
| |
|
| |
|
|
| | | 4.24 | % | | $ | 919,470 | | $ | 928,469 |
| | |
|
| |
|
| |
|
|
| | | | |
ESB Financial Corporation | | 40 | | 2004 Annual Report |
Notes to Consolidated Financial Statements(continued)
For purposes of the maturity table, mortgage-backed securities, which are not due at a single maturity date, have been allocated over maturity groupings based on weighted-average contractual maturities of underlying collateral. The mortgage-backed securities may mature earlier than their weighted-average contractual maturities because of principal prepayments.
Securities, with carrying values of $52.0 million and $73.5 million as of December 31, 2004 and 2003, respectively, were pledged to secure public deposits and for other purposes required or permitted by law.
The following table summarizes the Company’s loans receivable as of December 31:
| | | | | | |
(Dollar amounts in thousands)
| | 2004
| | 2003
|
Mortgage loans: | | | | | | |
Residential - single family | | $ | 155,971 | | $ | 142,244 |
Residential - multi family | | | 35,565 | | | 42,057 |
Commercial real estate | | | 53,446 | | | 46,502 |
Construction | | | 61,061 | | | 46,072 |
| | |
|
| |
|
|
| | | | 306,043 | | | 276,875 |
| | |
Other loans: | | | | | | |
Consumer loans | | | 58,066 | | | 59,222 |
Commercial business | | | 8,271 | | | 10,802 |
| | |
|
| |
|
|
| | | | 372,380 | | | 346,899 |
| | |
Less: | | | | | | |
Allowance for loan losses | | | 3,940 | | | 4,062 |
Deferred loan fees and net discounts | | | 248 | | | 150 |
Loans in process | | | 24,668 | | | 20,233 |
| | |
|
| |
|
|
| | | $ | 343,524 | | $ | 322,454 |
| | |
|
| |
|
|
Non-performing loans, which include only non-accrual loans, were $1.5 million and $1.8 million at December 31, 2004 and 2003, respectively.
For non-performing loans, the interest income that would have been recorded under the original terms of such loans and the interest income actually recognized for the years ended December 31 are summarized below:
| | | | | | | | | |
(Dollar amounts in thousands)
| | 2004
| | 2003
| | 2002
|
Interest income that would have been recorded | | $ | 153 | | $ | 164 | | $ | 218 |
Interest income recognized | | | 68 | | | 86 | | | 79 |
| | |
|
| |
|
| |
|
|
Interest income foregone | | $ | 85 | | $ | 78 | | $ | 139 |
| | |
|
| |
|
| |
|
|
The Company is not committed to lend additional funds to debtors whose loans are on non-accrual status.
| | | | |
ESB Financial Corporation | | 41 | | 2004 Annual Report |
Notes to Consolidated Financial Statements(continued)
| 3. | Loans Receivable(continued) |
The following is a summary of the changes in the allowance for loan losses:
| | | | |
(Dollar amounts in thousands)
| | Totals
| |
Balance, January 1, 2002 | | $ | 5,147 | |
Recovery of loan losses | | | (410 | ) |
Charge offs | | | (542 | ) |
Recoveries | | | 42 | |
| | |
|
|
|
Balance, December 31, 2002 | | | 4,237 | |
Recovery of loan losses | | | (106 | ) |
Charge offs | | | (87 | ) |
Recoveries | | | 18 | |
| | |
|
|
|
Balance, December 31, 2003 | | | 4,062 | |
| |
Provision for loan losses | | | 206 | |
Charge offs | | | (383 | ) |
Recoveries | | | 55 | |
| | |
|
|
|
Balance, December 31, 2004 | | $ | 3,940 | |
| | |
|
|
|
The following table is a summary of the loans considered to be impaired as of December 31:
| | | | | | | | | |
(Dollar amounts in thousands)
| | 2004
| | 2003
| | 2002
|
Impaired loans with an allocated allowance | | $ | 1,131 | | $ | 80 | | $ | 502 |
Impaired loans without an allocated allowance | | | — | | | — | | | 10 |
| | |
|
| |
|
| |
|
|
Total impaired loans | | $ | 1,131 | | $ | 80 | | $ | 512 |
| | |
|
| |
|
| |
|
|
Allocated allowance on impaired loans | | $ | 260 | | $ | 80 | | $ | 210 |
Portion of impaired loans on non-accrual | | | 198 | | | 79 | | | 512 |
Average impaired loans | | | 960 | | | 268 | | | 787 |
Income recognized on impaired loans | | | 52 | | | — | | | 3 |
FAS No. 114 does not apply to large groups of smaller balance homogenous loans that are collectively evaluated for impairment. The Company collectively reviews all residential real estate and consumer loans for impairment.
At December 31, 2004, the Company conducted its business through 16 offices in Allegheny, Beaver, Butler and Lawrence counties, Pennsylvania and primarily lends in this geographical area. Management does not believe it has significant concentrations of credit risk to any one group of borrowers given its underwriting and collateral requirements.
| 4. | Investment Required by Regulation |
The Company’s subsidiary bank is a member of the FHLB System. As a member, the Bank maintains an investment in the capital stock of the FHLB of Pittsburgh, at cost, in an amount not less than 1.0% of the unpaid principal balances of residential mortgage loans, 0.3% of total assets or 5.0% of outstanding advances, if any due to the FHLB, whichever is greater, as calculated periodically by the FHLB. Purchases and sales of FHLB stock are made directly with the FHLB at par.
| | | | |
ESB Financial Corporation | | 42 | | 2004 Annual Report |
Notes to Consolidated Financial Statements(continued)
Premises and equipment at December 31 are summarized by major classification as follows:
| | | | | | |
(Dollar amounts in thousands)
| | 2004
| | 2003
|
Land | | $ | 1,461 | | $ | 1,273 |
Buildings and improvements | | | 11,322 | | | 10,815 |
Leasehold improvements | | | 622 | | | 577 |
Furniture, fixtures and equipment | | | 8,247 | | | 7,951 |
| | |
|
| |
|
|
| | | | 21,652 | | | 20,616 |
Less accumulated depreciation and amortization | | | 12,060 | | | 11,140 |
| | |
|
| |
|
|
| | | $ | 9,592 | | $ | 9,476 |
| | |
|
| |
|
|
Depreciation expense for the years December 31, 2004, 2003 and 2002 were $1.0 million, $976,000 and $968,000, respectively.
The Company is obligated under non-cancelable long term operating lease agreements for certain branch offices. These lease agreements, each having renewal options and none expiring later than 2010, have approximate aggregate rentals of $155,660, $155,660, $154,160, $137,660, $125,466 and $98,940 for the years ended December 31, 2005, 2006, 2007, 2008, 2009 and thereafter, respectively. Rent expense for the years ended December 31, 2004, 2003 and 2002 was $122,000, $129,000 and $138,000, respectively.
As of December 31, 2004, the Company closed its Springdale branch office. The Company recognized an impairment of $67,000 to adjust the asset to its most recent fair market valuation.
The following table summarizes the Company’s deposits as of December 31:
| | | | | | | | | | | | |
(Dollar amounts in thousands) | | 2004
| | | 2003
| |
Type of accounts
| | Amount
| | %
| | | Amount
| | %
| |
Noninterest-bearing deposits | | $ | 23,563 | | 4.1 | % | | $ | 21,252 | | 3.5 | % |
NOW account deposits | | | 58,553 | | 10.1 | % | | | 62,780 | | 10.4 | % |
Money Market deposits | | | 49,332 | | 8.5 | % | | | 57,681 | | 9.6 | % |
Passbook account deposits | | | 94,439 | | 16.3 | % | | | 100,749 | | 16.7 | % |
Time deposits | | | 354,459 | | 61.0 | % | | | 360,584 | | 59.8 | % |
| | |
|
| |
|
| |
|
| |
|
|
| | | $ | 580,346 | | 100.0 | % | | $ | 603,046 | | 100.0 | % |
| | |
|
| |
|
| |
|
| |
|
|
Time deposits mature as follows: | | | | | | | | | | | | |
| | | | |
Within one year | | $ | 226,726 | | 39.0 | % | | $ | 204,688 | | 33.9 | % |
After one year through two years | | | 64,381 | | 11.1 | % | | | 88,358 | | 14.6 | % |
After two years through three years | | | 48,173 | | 8.3 | % | | | 39,696 | | 6.6 | % |
After three years through four years | | | 4,667 | | 0.8 | % | | | 22,667 | | 3.8 | % |
After four years through five years | | | 7,484 | | 1.3 | % | | | 3,959 | | 0.7 | % |
Thereafter | | | 3,028 | | 0.5 | % | | | 1,216 | | 0.2 | % |
| | |
|
| |
|
| |
|
| |
|
|
| | | $ | 354,459 | | 61.0 | % | | $ | 360,584 | | 59.8 | % |
| | |
|
| |
|
| |
|
| |
|
|
The Company had a total of $70.5 million and $82.3 million in time deposits of $100,000 or more at December 31, 2004 and 2003, respectively.
| | | | |
ESB Financial Corporation | | 43 | | 2004 Annual Report |
Notes to Consolidated Financial Statements(continued)
Interest expense by type of deposit account for the year ended December 31 is as follows:
| | | | | | | | | |
(Dollar amounts in thousands)
| | 2004
| | 2003
| | 2002
|
NOW account deposits | | $ | 272 | | $ | 250 | | $ | 112 |
Money Market deposits | | | 270 | | | 594 | | | 1,404 |
Passbook account deposits | | | 464 | | | 825 | | | 1,380 |
Time deposits | | | 9,829 | | | 11,406 | | | 15,301 |
| | |
|
| |
|
| |
|
|
| | | $ | 10,835 | | $ | 13,075 | | $ | 18,197 |
| | |
|
| |
|
| |
|
|
Borrowed funds, which include FHLB advances, repurchase agreements, ESOP borrowings, corporate borrowings and treasury tax and loan notes payable, as of December 31 are summarized as follows:
| | | | | | | | | | | | |
| | | 2004
| | 2003
|
(Dollar amounts in thousands)
| | Weighted
average
rate
| | | Amount
| | Weighted
average
rate
| | | Amount
|
FHLB advances: | | | | | | | | | | | | |
Due within 12 months | | 3.63 | % | | $ | 256,718 | | 3.51 | % | | $ | 261,955 |
Due beyond 12 months but within 2 years | | 3.77 | % | | | 136,491 | | 3.87 | % | | | 93,885 |
Due beyond 2 years but within 3 years | | 3.47 | % | | | 147,732 | | 3.96 | % | | | 106,607 |
Due beyond 3 years but within 4 years | | 3.35 | % | | | 60,060 | | 3.96 | % | | | 77,487 |
Due beyond 4 years but within 5 years | | 8.39 | % | | | 180 | | 3.06 | % | | | 30,060 |
Due beyond 5 years | | 1.00 | % | | | 61 | | 6.41 | % | | | 246 |
| | | | | |
|
| | | | |
|
|
| | | | | | $ | 601,242 | | | | | $ | 570,240 |
| | | | | |
|
| | | | |
|
|
Repurchase agreements: | | | | | | | | | | | | |
Due within 12 months | | 2.14 | % | | $ | 57,000 | | 3.01 | % | | $ | 37,000 |
Due beyond 12 months but within 2 years | | — | | | | — | | 1.78 | % | | | 10,000 |
Due beyond 2 years but within 3 years | | 3.81 | % | | | 10,000 | | — | | | | — |
| | | | | |
|
| | | | |
|
|
| | | | | | $ | 67,000 | | | | | $ | 47,000 |
| | | | | |
|
| | | | |
|
|
Other borrowings: | | | | | | | | | | | | |
| | | | |
ESOP borrowings | | | | | | | | | | | | |
Due within 12 months | | 5.25 | % | | $ | 945 | | — | | | | — |
Due beyond 12 months but within 2 years | | 5.25 | % | | | 945 | | — | | | | — |
Due beyond 2 years but within 3 years | | 5.25 | % | | | 945 | | — | | | | — |
Due beyond 3 years but within 4 years | | 5.25 | % | | | 945 | | — | | | | — |
Due beyond 4 years but within 5 years | | 5.25 | % | | | 945 | | — | | | | — |
Due beyond 5 years | | 5.25 | % | | | 945 | | — | | | | — |
| | | | | |
|
| | | | |
|
|
| | | | | | $ | 5,670 | | | | | $ | — |
| | | | | |
|
| | | | |
|
|
Corporate borrowings | | | | | | | | | | | | |
Due beyond 4 years but within 5 years | | 5.55 | % | | $ | 13,500 | | — | | | $ | — |
| | | | | |
|
| | | | |
|
|
Treasury tax and loan note payable | | 2.03 | % | | $ | 150 | | 0.82 | % | | $ | 62 |
| | | | | |
|
| | | | |
|
|
| | | | |
ESB Financial Corporation | | 44 | | 2004 Annual Report |
Notes to Consolidated Financial Statements(continued)
| 7. | Borrowed Funds(continued) |
Included in the $601.2 million of FHLB advances is approximately $65.5 million of convertible select advances. These advances reset to the 3 month London Interbank Offer Rate Index (LIBOR) and have various spreads and call dates. At the reset date if the 3 month LIBOR plus the spread is lower than the contract rate on the advance, the advance will remain at the contracted rate. The FHLB has the right to call any convertible select advance on its call date or quarterly thereafter. Should the advance be called, the Company has the right to pay off the advance without penalty. It has historically been the Company’s position to pay off the advance and replace it with fixed-rate funding. FHLB advances are secured by FHLB stock, qualifying residential mortgage loans and mortgage-backed securities to the extent that the fair value of such pledged collateral must be at least equal to the advances outstanding. At December 31, 2004 the Company had a maximum borrowing capacity with the FHLB of $700.5 million, with $99.1 million available for use.
The Company enters into sales of securities under agreements to repurchase. Such repurchase agreements are treated as borrowed funds. The dollar amount of the securities underlying the agreements remain in their respective asset accounts.
Repurchase agreements are collateralized by various securities that are either held in safekeeping at the FHLB or delivered to the dealer who arranged the transaction, and the Company maintains control of these securities.
The market value of such securities exceeded the amortized cost of the securities sold under agreements to repurchase. The market value of the securities as of December 31, 2004 was $75.6 million with an amortized cost of $73.1 million. The market value of the securities as of December 31, 2003 was $52.1 million with an amortized cost of $51.2 million. The average maturity date of the mortgage backed securities sold under agreements to repurchase was greater than 90 days for the years ended December 31, 2004 and 2003.
As of December 31, 2004 and 2003 the Company had repurchase agreements outstanding with Citigroup of $47.0 million and $47.0 million, respectively and with Morgan Stanley and Co. of $20.0 million and $0, respectively.
As of December 31, 2004, the Company had repurchase agreements with Citigroup with $3.9 million at risk, which relates to the market value of the collateral in excess of the borrowing, with a weighted average maturity of nine months and a repurchase agreement outstanding with Morgan Stanley and Co. with $2.8 million at risk with a weighted average maturity of two months.
Borrowings under repurchase agreements averaged $49.4 million, $44.0 million and $93.6 million during 2004, 2003 and 2002, respectively. The maximum amount outstanding at any month-end was $67.0 million, $77.0 million and $119.6 million during 2004, 2003 and 2002, respectively.
The Company, through ESB, has an agreement with the Federal Reserve Bank of Cleveland whereby ESB is an authorized treasury tax loan depository. Under the terms of the note agreement, funds deposited to the Company’s treasury tax and loan account (limited to $150,000 per deposit) accrue interest at a rate of 0.25% below the overnight federal funds rate.
| | | | |
ESB Financial Corporation | | 45 | | 2004 Annual Report |
Notes to Consolidated Financial Statements(continued)
| 8. | Guaranteed Preferred Beneficial Interest in Subordinated Debt |
On January 15, 2004, the Company redeemed the remaining $20.3 million (liquidation amount) outstanding of the 8.625% Trust Preferred Securities of PennFirst Capital Trust I (Trust I) at a redemption price equal to the liquidation amount of $10.00 plus accrued and unpaid distributions thereon. The Company also redeemed $20.3 million principal amount of the related Subordinated Debt. In connection with this redemption the Company took a charge of approximately $844,000, representing unamortized issuance costs on the Company’s trust preferred securities.
On April 10, 2003, ESB Capital Trust II (Trust II), a statutory business trust established under Delaware law that is a subsidiary of the Company, issued $10.0 million variable rate Preferred Securities with a stated value and liquidation preference of $1,000 per share. The Company purchased $310,000 of common securities of the Trust II. The Preferred Securities reset quarterly to equal the London Interbank Offer Rate Index (LIBOR) plus 3.25%. The Trust II’s obligations under the Preferred Securities issued are fully and unconditionally guaranteed by the Company. The proceeds from the sale of the Preferred Securities and the common securities were utilized by the Trust II to invest in $10.3 million of variable rate Subordinated Debt of the Company. The Subordinated Debt is unsecured and ranks subordinate and junior in right of payment to all indebtedness, liabilities and obligations of the Company. The Subordinated Debt primarily represents the sole assets of the Trust II. Interest on the Preferred Securities is cumulative and payable quarterly in arrears. The Company has the right to optionally redeem the Subordinated Debt prior to the maturity date of April 24, 2033, on or after April 24, 2008, at the redemption price, plus accrued and unpaid distributions, if any, at the redemption date. Under the occurrence of certain events, specifically, a tax event, investment company event or capital treatment event as more fully defined in the Indenture dated April 10, 2003, the Company may redeem in whole, but not in part, the Subordinated Debt at any time within 90 days following the occurrence of such event. Proceeds from any redemption of the Subordinated Debt would cause a mandatory redemption of the Preferred Securities and the common securities having an aggregate liquidation amount equal to the principal amount of the Subordinated Debt redeemed. Unamortized deferred debt issuance costs associated with the Preferred Securities amounted to $195,000 and $255,000 at December 31, 2004 and December 31, 2003, respectively, and are amortized on a level yield basis.
On December 17, 2003, ESB Statutory Trust III (Trust III), a statutory business trust established under Delaware law that is a subsidiary of the Company, issued $5.0 million variable rate preferred securities with a stated value and liquidation preference of $1,000 per share. The Company purchased $155,000 of common securities of the Trust III. The preferred securities reset quarterly to equal the LIBOR Index plus 2.95%. The Trust III’s obligations under the preferred securities issued are fully and unconditionally guaranteed by the Company. The proceeds from the sale of the preferred securities and the common securities were utilized by the Trust III to invest in $5.2 million of variable rate subordinated debt of the Company. The subordinated debt is unsecured and ranks subordinate and junior in right of payment to all indebtedness, liabilities and obligations of the Company. The subordinated debt primarily represents the sole assets of the Trust III. Interest on the preferred securities is cumulative and payable quarterly in arrears. The Company has the right to optionally redeem the subordinated debt prior to the maturity date of December 17, 2033, on or after December 17, 2008, at the redemption price, plus accrued and unpaid distributions, if any, at the redemption date. Under the occurrence of certain events, specifically, a tax event, investment company event or capital treatment event as more fully defined in the Indenture dated December 17, 2003, the Company may redeem in whole, but not in part, the subordinated debt at any time within 90 days following the occurrence of such event. Proceeds from any redemption of the subordinated debt would cause a mandatory redemption of the preferred securities and the common securities having an aggregate liquidation amount equal to the principal amount of the subordinated debt redeemed. Unamortized deferred debt issuance costs associated with the preferred securities amounted to $58,750 and $73,750 at December 31, 2004 and December 31, 2003, respectively, and are amortized on a level yield basis.
| | | | |
ESB Financial Corporation | | 46 | | 2004 Annual Report |
Notes to Consolidated Financial Statements(continued)
The provision for income taxes for the years ended December 31, is comprised of the following:
| | | | | | | | | | | | |
(Dollar amounts in thousands)
| | 2004
| | | 2003
| | | 2002
| |
Current expense: | | | | | | | | | | | | |
Federal | | $ | 2,036 | | | $ | 2,905 | | | $ | 1,908 | |
State | | | 232 | | | | 95 | | | | 10 | |
| | |
|
|
| |
|
|
| |
|
|
|
| | | | 2,268 | | | | 3,000 | | | | 1,918 | |
| | | |
Deferred benefit: | | | | | | | | | | | | |
Federal | | | (432 | ) | | | (1,189 | ) | | | (101 | ) |
| | |
|
|
| |
|
|
| |
|
|
|
| | | | (432 | ) | | | (1,189 | ) | | | (101 | ) |
| | |
|
|
| |
|
|
| |
|
|
|
| | | $ | 1,836 | | | $ | 1,811 | | | $ | 1,817 | |
| | |
|
|
| |
|
|
| |
|
|
|
In addition to income taxes applicable to income before taxes in the consolidated statements of operations, the following income tax amounts were recorded to stockholders’ equity during the years ended December 31:
| | | | | | | | | | |
(Dollar amounts in thousands)
| | 2004
| | 2003
| | 2002
| |
Net gain on securities available for sale | | $ | 1,998 | | $ | 1,731 | | $ | (5,427 | ) |
Compensation expense for tax purposes in excess of amounts recognized for financial statement purposes | | | 216 | | | — | | | 166 | |
| | |
|
| |
|
| |
|
|
|
| | | $ | 2,214 | | $ | 1,731 | | $ | (5,261 | ) |
| | |
|
| |
|
| |
|
|
|
The tax effects of temporary differences between the financial reporting basis and income tax basis of assets and liabilities that are included in the net deferred tax asset as of December 31 relate to the following:
| | | | | | | |
(Dollar amounts in thousands)
| | 2004
| | 2003
| |
Deferred tax assets: | | | | | | | |
Allowances for losses on loans and real estate owned | | $ | 1,339 | | $ | 1,381 | |
Interest and fees on loans | | | 1 | | | 3 | |
General business credit | | | 902 | | | 781 | |
Minimum tax credit carry forward | | | 1,346 | | | 1,293 | |
Writedown of debt | | | 100 | | | 100 | |
OREO | | | 170 | | | 187 | |
Other | | | 349 | | | 196 | |
| | |
|
| |
|
|
|
Gross deferred tax assets | | | 4,207 | | | 3,941 | |
Deferred tax liabilities: | | | | | | | |
Investment in securities available for sale | | | 2,877 | | | 4,875 | |
Accretion of discounts | | | 31 | | | 32 | |
Core deposit intangible | | | 105 | | | 161 | |
Purchase Price Adjustments | | | 73 | | | 105 | |
OMSR | | | 11 | | | 17 | |
Other | | | 135 | | | 206 | |
| | |
|
| |
|
|
|
Gross deferred tax liabilities | | | 3,232 | | | 5,396 | |
| | |
Net deferred tax asset (liability) | | $ | 975 | | $ | (1,455 | ) |
| | |
|
| |
|
|
|
| | | | |
ESB Financial Corporation | | 47 | | 2004 Annual Report |
Notes to Consolidated Financial Statements(continued)
| 9. | Income Taxes(continued) |
The Company determined that it was not required to establish a valuation allowance for deferred tax assets in accordance with FAS 109 since it is more likely than not that the deferred tax asset will be realized through carry-back to taxable income in prior years, future reversals of existing taxable temporary differences and, to a lesser extent, future taxable income.
The general business credit of $902,000 will be available to reduce future federal income tax up to the year 2024. The alternative minimum tax credit of $1,346,000 is available to reduce future regular income taxes over an indefinite period.
A reconciliation between the provision for income taxes and the amount computed by multiplying operating results before income taxes by the statutory federal income tax rate of 34% for the years ended December 31 is as follows:
| | | | | | | | | |
| | | 2004
| | | 2003
| | | 2002
| |
Tax at statutory rate | | 34.0 | % | | 34.0 | % | | 34.0 | % |
(Decrease) increase resulting from: | | | | | | | | | |
Tax free income, net of interest disallowance | | (15.6 | )% | | (16.1 | )% | | (15.9 | )% |
State income taxes, net of Federal income tax benefit | | 1.3 | % | | 0.6 | % | | 0.1 | % |
Effect of amended tax returns | | (2.5 | )% | | — | | | — | |
Other, net | | (1.7 | )% | | (1.0 | )% | | (1.3 | )% |
| | |
|
| |
|
| |
|
|
Reported rate | | 15.5 | % | | 17.5 | % | | 16.9 | % |
| | |
|
| |
|
| |
|
|
The Company and its subsidiaries file a consolidated federal income tax return. Prior to 1996, the Bank was permitted under the Internal Revenue Code to deduct an annual addition to a reserve for bad debts in determining taxable income, subject to certain limitations. Subsequent to 1995, the Bank’s bad debt deduction is based on actual net charge-offs. Bad debt deductions for income tax purposes are included in taxable income of later years only if the Bank’s base year bad debt reserve is used subsequently for purposes other than to absorb bad debt losses. Because the Bank does not intend to use the reserve for purposes other than to absorb losses, no deferred income taxes have been provided prior to 1987. Retained earnings at December 31, 2003 (the most recent date for which a tax return has been filed) include approximately $15.2 million representing such bad debt deductions for which no deferred income taxes have been provided.
| 10. | Employee Benefit Plans |
Retirement Savings Plan
The Company has a defined contribution employee retirement plan for the benefit of substantially all employees. The plan provides for regular employer payments that match each participating employee’s contribution to their individual tax-deferred retirement account. Employees can contribute up to 100% of their compensation, less required deductions, to the plan, and the Company matches 100% of the first 1% and 50% of the remaining 2% through 6% of employee contributions in stock of the Company. The Company contributed $203,000, $194,000 and $169,000 to the plan during 2004, 2003 and 2002, respectively.
| | | | |
ESB Financial Corporation | | 48 | | 2004 Annual Report |
Notes to Consolidated Financial Statements(continued)
| 10. | Employee Benefit Plans(continued) |
Employee Stock Ownership Plan
The Company has a tax qualified Employee Stock Ownership Plan (ESOP) for the benefit of its employees. All employees who complete one year of service are eligible to participate in the ESOP.
Participants become 100% vested in their accounts in the ESOP after five years of service or, if earlier, upon death, disability or attainment of normal retirement age.
The purchase of shares of the Company’s stock by the ESOP is funded by a loan. Unreleased ESOP shares collateralize the loan payable, and the cost of these shares is recorded as a contra-equity account in stockholders’ equity of the Company. The ESOP’s loan payable bears a weighted-average interest rate of 5.25% and matures within the next 5 years. Shares released as debt payments are made by the ESOP to the loan. The ESOP’s sources of repayment of the loans can include dividends, if any, on the unallocated stock held by the ESOP and discretionary contributions from the Company to the ESOP and earnings thereon. Dividends received on unallocated ESOP shares during 2004, 2003 and 2002 amounted to $229,000, $191,000 and $126,000, respectively. All of the unallocated dividends were used for debt service on the loan. The Company contributed $958,000, $755,000 and $557,000 for the years ended December 31, 2004, 2003 and 2002, respectively. The ESOP incurred interest on the loan of $315,000, $217,000 and $182,000 for the years ended December 31, 2004, 2003 and 2002, respectively.
In November 1993, the American Institute of Certified Public Accountants issued Statement of Position (SOP) No. 93-6, “Employers’ Accounting for Employee Stock Ownership Plans”, which prescribes comprehensive accounting guidance for ESOPs. The major requirements of SOP No. 93-6 provide, among other provisions, that compensation is recognized under the shares released method and compensation expense is equal to the fair value of the shares committed to be released and unallocated ESOP shares are excluded from outstanding shares for purposes of computing EPS. The Company adopted SOP No. 93-6 on January 1, 1994 for shares acquired by the ESOP after that date. The Company currently accounts for its ESOP under the guidance of SOP No. 93-6.
During 2004, 2003 and 2002, the Company recognized compensation expense related to the ESOP of $1.2 million, $1.3 million and $838,000, respectively
As of December 31, 2004 and 2003 the ESOP held a total of 1,669,573 and 1,703,529 shares, respectively, of the Company’s stock, and there were 503,929 and 593,938 unallocated shares, respectively, with a fair value of $7.3 million and $9.6 million, respectively. During 2004, 90,006 shares were released for allocation.
| | | | |
ESB Financial Corporation | | 49 | | 2004 Annual Report |
Notes to Consolidated Financial Statements(continued)
| 10. | Employee Benefit Plans(continued) |
Stock Option Plans
The Company maintains Stock Option Plans (Option Plans), which provide for the grant of stock options to directors, officers and other key employees. The Option Plans provide for the grant of both incentive stock options and compensatory stock options. Stock options are granted at an exercise price equal to the market price at the date of grant, the options vest immediately, are exercisable on the date of the grant and have a maximum term of ten years. Stock option activities under the Option Plans for the years ended December 31 are as follows:
| | | | | | | | | | | | | | | | | | |
| | | 2004
| | 2003
| | 2002
|
| | | Options
| | | Weighted
Average
Exercise
Price/Share
| | Options
| | | Weighted
Average
Exercise
Price/Share
| | Options (1)
| | | Weighted
Average
Exercise
Price/Share (1)
|
Outstanding at beginning of year | | 1,021,461 | | | $ | 7.88 | | 1,117,001 | | | $ | 6.90 | | 1,133,422 | | | $ | 6.23 |
| | | | | | |
Granted | | 90,220 | | | | 14.50 | | 94,510 | | | | 15.35 | | 117,612 | | | | 10.83 |
Exercised | | (163,113 | ) | | | 5.76 | | (161,269 | ) | | | 5.48 | | (121,838 | ) | | | 4.52 |
Expired | | (2,550 | ) | | | 8.71 | | (28,781 | ) | | | 7.55 | | (12,195 | ) | | | 6.16 |
| | |
|
| | | | |
|
| | | | |
|
| | | |
Outstanding at end of year | | 946,018 | | | | 8.88 | | 1,021,461 | | | | 7.88 | | 1,117,001 | | | | 6.90 |
| | |
|
| | | | |
|
| | | | |
|
| | | |
Exercisable at end of year | | 946,018 | | | $ | 8.88 | | 1,021,461 | | | $ | 7.88 | | 1,081,970 | | | $ | 6.93 |
| | |
|
| | | | |
|
| | | | |
|
| | | |
| (1) | Options and price/share data for the year ended December 31, 2002 has adjusted to reflect the stock split paid on May 15, 2003. |
The weighted-average fair values of options granted during 2004, 2003 and 2002 utilizing the Black-Scholes Valuation Model were $3.67, $2.88 and $2.70, respectively.
The following table summarizes certain characteristics of issued stock options as of December 31, 2004:
| | | | | | | |
Year Issued
| | Options
Outstanding
| | Exercise
Price
| | Average
Remaining
Contractual
Life (in years)
|
1995 | | 6,201 | | $ | 5.68 | | 0.5 |
1995 | | 3,268 | | | 3.50 | | 0.8 |
1996 | | 48,522 | | | 5.65 | | 1.5 |
1997 | | 76,988 | | | 6.14 | | 2.5 |
1998 | | 98,037 | | | 9.47 | | 3.5 |
1998 | | 60,668 | | | 4.05 | | 3.8 |
1999 | | 110,846 | | | 7.37 | | 4.5 |
2000 | | 142,365 | | | 6.01 | | 5.5 |
2001 | | 107,391 | | | 7.83 | | 7.0 |
2002 | | 107,202 | | | 10.83 | | 8.0 |
2003 | | 94,310 | | | 15.35 | | 9.0 |
2004 | | 90,220 | | | 14.50 | | 10.0 |
| | |
| | | | | |
| | | 946,018 | | $ | 8.88 | | 5.8 |
| | |
| | | | | |
| | | | |
ESB Financial Corporation | | 50 | | 2004 Annual Report |
Notes to Consolidated Financial Statements(continued)
| 10. | Employee Benefit Plans(continued) |
Management Recognition Plan
In connection with previous acquisitions, the Company acquired shares of stock held in trust for potential future distribution to management and key employees for compensation purposes. As of December 31, 2004, there were 11,187 shares held in the Management Recognition Plan (MRP) trust. During 2004, 31,450 shares were distributed, 8,564 shares vested with an associated compensation expense of $127,000. The remaining shares will vest over a scheduled vesting period. As of December 31, 2003, there were 41,926 shares held in the MRP trust. During 2003, 3,744 shares were distributed with an associated compensation expense of $30,000. During 2002, 3,744 shares were distributed with an associated compensation expense of $30,000.
Excess Benefit Plan
The Company has adopted an excess benefit plan for the purpose of permitting an executive officer, and any other employees of the Company who may be designated pursuant to the plan, to receive certain benefits that the executive officer and any other employees of the Company otherwise would be eligible to receive under the Company’s retirement and profit sharing plan and ESOP but for the limitations set forth in Section 401(a)(17), 402(g) and 415 of the Internal Revenue Code of 1986, as amended (the “Code”). Pursuant to the excess benefit plan, during any plan year the Company shall make matching contributions on behalf of the participant in an amount equal to the amount of matching contributions that would have been made by the Company on behalf of the participant but for limitations in the Code, less the actual amount of matching contributions actually made by the Company on behalf of the participant. Finally, the excess benefit plan generally provides that during any plan year a participant shall receive a supplemental ESOP allocation in an amount equal to the amount which would have been allocated to the participant but for limitations in the Code, less the amount actually allocated to the participant pursuant to the ESOP. The supplemental benefits to be received by a participant pursuant to the excess benefit plan shall be credited to an account maintained pursuant to the plan within 180 days after the end of each plan year. In connection with its adoption of the excess benefit plan, the Company established a trust which currently holds 27,113 shares of common stock to fund its obligation under the excess benefit plan.
Supplemental Executive Retirement Plan and Directors’ Retirement Plan
The Company has adopted a Supplemental Executive Benefit Plan (SERP) in order to provide supplemental retirement and death benefits for certain key employees of the Company. Under the SERP, participants shall receive an annual retirement benefit following retirement at age 65 equal to 25% of the participant’s final average pay multiplied by a target retirement benefit percentage. Final average pay is based upon the participant’s last three year’s compensation and the target benefit percentage is equal to the fraction resulting from the participant’s years of credited service divided by 20, this targeted percentage is capped at 100%. Benefits under the plan are payable in ten equal annual payments and a lesser benefit is payable upon early retirement at age 55 with at least ten years of service. If a participant dies prior to retirement, the participant’s estate will receive a lump sum payment equal to the net present value of future benefit payments under the plan. At December 31, 2004, the participants in the plan had credited service under the SERP ranging from 17 to 26 years.
| | | | |
ESB Financial Corporation | | 51 | | 2004 Annual Report |
Notes to Consolidated Financial Statements(continued)
| 10. | Employee Benefit Plans(continued) |
The Company and the Bank have adopted the ESB Financial Corporation Directors’ Retirement Plan and entered into director retirement agreements with each director of the Company and the Bank. The plan provides that any retiring director with a minimum of 5 or more years of service with the Company or the Bank and a minimum of 10 total years of service, including years of service with any bank acquired by the Company or the Bank, that remains in continuous service as a board member until age 75 will be entitled to receive an annual retirement benefit equal to his or her director’s fees earned during the last full calendar year prior to his or her retirement date, multiplied by a ratio, ranging from 25% to 50%, based on the director’s total years of service. The maximum ratio of 50% of fees requires 20 or more years of service and the minimum ratio of 25% of fees requires 10 years of service. Retirement benefits may also be payable under the plan if a director retires from service as a director prior to attaining age 75. Two directors are currently receiving monthly benefits under the plan.
The following tables illustrate the components of the net periodic pension cost for the Directors’ Retirement Plan and SERP as of the measurement dates December 31, 2004 and December 31, 2003:
| | | | | | | | | | | | |
| | | Directors’ Retirement Plan
| | SERP
|
(Dollar amounts in thousands) | | December 31,
| | December 31,
|
| | 2004
| | 2003
| | 2004
| | 2003
|
Components of net periodic pension cost | | | | | | | | | | | | |
Service cost | | $ | 16 | | $ | 16 | | $ | 39 | | $ | 37 |
Interest cost | | | 27 | | | 27 | | | 68 | | | 61 |
Expected return on plan assets | | | — | | | — | | | — | | | — |
Amortization of transition obligation (asset) | | | — | | | — | | | 42 | | | 41 |
Amortization of prior service cost | | | 59 | | | 59 | | | — | | | — |
Amortization of actuarial (gains)/losses | | | — | | | — | | | — | | | — |
| | |
|
| |
|
| |
|
| |
|
|
Net periodic pension cost | | $ | 102 | | $ | 102 | | $ | 149 | | $ | 139 |
| | |
|
| |
|
| |
|
| |
|
|
Other Comprehensive Income (Cost) | | $ | — | | $ | — | | $ | — | | $ | — |
| | |
|
| |
|
| |
|
| |
|
|
| | | | |
ESB Financial Corporation | | 52 | | 2004 Annual Report |
Notes to Consolidated Financial Statements(continued)
| 10. | Employee Benefit Plans(continued) |
The following table presents a reconciliation of prior and ending balances of the projected benefit obligation and the fair market value of plan assets for the periods ended December 31, 2004 and December 31, 2003:
| | | | | | | | | | | | | | |
| | | Directors’ Retirement Plan
| | | SERP
|
(Dollar amounts in thousands) | | December 31,
| | | December 31,
|
| | 2004
| | | 2003
| | | 2004
| | 2003
|
Change in benefit obligation | | | | | | | | | | | | | | |
Benefit obligation at beginning of year | | $ | 439 | | | $ | 425 | | | $ | 933 | | $ | 832 |
Service Cost | | | 16 | | | | 16 | | | | 39 | | | 37 |
Interest Cost | | | 27 | | | | 27 | | | | 68 | | | 61 |
Actuarial (gains)/losses | | | 19 | | | | (19 | ) | | | 158 | | | 3 |
Benefits paid | | | (24 | ) | | | (10 | ) | | | — | | | |
| | |
|
|
| |
|
|
| |
|
| |
|
|
Benefit obligation at end of year | | $ | 477 | | | $ | 439 | | | $ | 1,198 | | $ | 933 |
| | |
|
|
| |
|
|
| |
|
| |
|
|
Change in plan assets | | | | | | | | | | | | | | |
Fair value of plan assets at beginning of year | | $ | — | | | $ | — | | | $ | — | | $ | — |
Actual return on plan assets | | | — | | | | — | | | | — | | | — |
Employer contributions | | | 24 | | | | 10 | | | | — | | | — |
Benefits paid | | | (24 | ) | | | (10 | ) | | | — | | | — |
| | |
|
|
| |
|
|
| |
|
| |
|
|
Fair value of plan assets at end of year | | $ | — | | | $ | — | | | $ | — | | $ | — |
| | |
|
|
| |
|
|
| |
|
| |
|
|
The following table shows the funded status of the plan as of the measurement dates of December 31, 2004 and December 31, 2003, as well as amounts recognized and not recognized in the statement of financial position.
| | | | | | | | | | | | | | | | |
| | | Directors’ Retirement Plan
| | | SERP
| |
(Dollar amounts in thousands) | | December 31,
| | | December 31,
| |
| | 2004
| | | 2003
| | | 2004
| | | 2003
| |
Projected Benefit Obligation | | $ | (477 | ) | | $ | (439 | ) | | $ | 1,198 | | | $ | 933 | |
Fair Value of Plan Assets | | | — | | | | — | | | | — | | | | — | |
| | |
|
|
| |
|
|
| |
|
|
| |
|
|
|
Funded Status | | $ | (477 | ) | | $ | (439 | ) | | $ | 1,198 | | | $ | 933 | |
Unrecognized transition obligation (asset) | | | — | | | | — | | | | 493 | | | | 534 | |
Unrecognized prior service cost | | | 298 | | | | 357 | | | | — | | | | | |
Unrecognized net actuarial (gain)/loss | | | (1 | ) | | | (19 | ) | | | 162 | | | | 4 | |
| | |
|
|
| |
|
|
| |
|
|
| |
|
|
|
(Accrued)/prepaid pension cost | | $ | (180 | ) | | $ | (101 | ) | | $ | 543 | | | $ | 395 | |
| | |
|
|
| |
|
|
| |
|
|
| |
|
|
|
Amounts recognized in the statement of financial position consist of: | | | | | | | | | | | | | | | | |
Prepaid Benefit Cost | | $ | — | | | $ | — | | | $ | — | | | $ | — | |
Accrued Benefit Liability | | | (477 | ) | | | (439 | ) | | | (949 | ) | | | (669 | ) |
Intangible Asset | | | 298 | | | | 338 | | | | 406 | | | | 274 | |
Accumulated Other Comprehensive Income | | | — | | | | — | | | | — | | | | — | |
| | |
|
|
| |
|
|
| |
|
|
| |
|
|
|
Net Amount Recognized | | $ | (179 | ) | | $ | (101 | ) | | $ | (543 | ) | | $ | (395 | ) |
| | |
|
|
| |
|
|
| |
|
|
| |
|
|
|
| | | | |
ESB Financial Corporation | | 53 | | 2004 Annual Report |
Notes to Consolidated Financial Statements(continued)
The weighted average assumptions used to determine benefit obligations at the measurement dates were as follows:
| | | | | | | | | | | | |
| | | Directors’ Retirement Plan
| | | SERP
| |
| | | 2004
| | | 2003
| | | 2004
| | | 2003
| |
Discount rate | | 5.75 | % | | 6.25 | % | | 6.00 | % | | 7.00 | % |
Rate of compensation increase | | n/a | | | n/a | | | 4.00 | % | | 4.00 | % |
Expected return on plan assets | | n/a | | | n/a | | | n/a | | | n/a | |
At December 31, 2004, the projected benefit payments for the DRP were $48,456 in 2005, $49,568 in 2006, $50,915 in 2007, $43,326 in 2008, $54,044 in 2009 and $245,326 in years 2010 through 2014. The projected payments were calculated using the same assumptions as those used to calculate the benefit obligations listed above.
| 11. | Other Comprehensive (Loss) Income |
In complying with FAS No. 130, “Reporting Comprehensive Income”, the Company has developed the following table which includes the tax effects of the components of other comprehensive (loss) income. Other comprehensive (loss) income consists of net unrealized gain (loss) on securities available for sale and the net fair value adjustment on derivatives. Other comprehensive income and related tax effects for the years ended December 31 consists of:
| | | | | | | | | | | | |
(Dollar amounts in thousands)
| | 2004
| | | 2003
| | | 2002
| |
Net Income: | | $ | 9,990 | | | $ | 8,524 | | | $ | 8,960 | |
Other Comprehensive income - net of tax | | | | | | | | | | | | |
Fair value adjustment on securities available for sale, net of tax (benefit) expense of ($1,425) in 2004, ($1,111) in 2003 and $5,526 in 2002. | | | (2,768 | ) | | | (2,157 | ) | | | 10,727 | |
Securities gains reclassified into earnings, net of tax benefit of ($316) in 2004, ($572) in 2003 and ($99) in 2002 | | | (614 | ) | | | (1,110 | ) | | | (192 | ) |
Fair value adjustment on derivatives, net of tax benefit of ($254) in 2004 and ($47) in 2003 | | | (494 | ) | | | (92 | ) | | | — | |
| | |
|
|
| |
|
|
| |
|
|
|
Other Comprehensive (loss) income | | | (3,876 | ) | | | (3,359 | ) | | | 10,535 | |
| | |
|
|
| |
|
|
| |
|
|
|
Comprehensive Income | | $ | 6,114 | | | $ | 5,165 | | | $ | 19,495 | |
| | |
|
|
| |
|
|
| |
|
|
|
| 12. | Commitments and Contingencies |
In the ordinary course of business, the Company has various outstanding commitments and contingent liabilities that are not reflected in the accompanying consolidated financial statements. In addition, the Company is involved in certain claims and legal actions arising in the ordinary course of business. The outcome of these claims and actions are not presently determinable; however, in the opinion of the Company’s management, after consulting legal counsel, the ultimate disposition of these matters will not have a material adverse effect on the Company’s financial position.
In the ordinary course of business, the Company has entered into off-balance sheet financial instruments, consisting of commitments to extend credit, commitments under line of credit lending arrangements and letters of credit. Such financial instruments are recorded in the financial statements when they are funded or related fees are received.
| | | | |
ESB Financial Corporation | | 54 | | 2004 Annual Report |
Notes to Consolidated Financial Statements(continued)
| 13. | Financial Instruments(continued) |
The following methods and assumptions were used in estimating fair values of financial instruments.
Cash equivalents – The carrying amounts of cash equivalents approximate their fair values.
Securities – Fair values for securities are based on quoted market prices.
Accrued interest receivable and payable – The carrying amounts of accrued interest approximate their fair values.
Loans receivable– For variable-rate loans that reprice frequently and have no significant change in credit risk, fair values are based on carrying values. Fair values for certain residential mortgage and consumer loans are based on quoted market prices of similar loans sold in conjunction with securitization transactions, adjusted for differences in loan characteristics. Fair values of commercial real estate and commercial business loans are estimated using discounted cash flow analyses, using interest rates currently being offered for loans with similar terms to borrowers of similar credit quality. Fair values of impaired loans are estimated using discounted cash flow analyses or underlying collateral values, where applicable.
Loans held for sale – The carrying amount for loans held for sale is a reasonable estimate of fair value.
FHLB stock– FHLB stock is restricted for trading purposes, and thus, the carrying value approximates fair value.
Deposits – The fair values disclosed for demand deposits are, by definition, equal to the amount payable on demand at the reporting date. Fair values for certificates of deposit are estimated using a discounted cash flow calculation that applies current market interest rates to a schedule of aggregated expected monthly maturities.
Borrowed funds and subordinated debt – For variable rate borrowings, fair values are based on carrying values. For fixed rate borrowings, fair values are based on the discounted value of contractual cash flows and on the Company’s current incremental borrowing rates for similar types of borrowing arrangements.
Loan commitments – The fair value of loan commitments at December 31, 2004 and 2003 approximated the carrying value of those commitments at those dates.
Interest rate cap contracts- Estimated fair values of interest rate cap contracts are based on quoted market prices, dealer quotes and prices obtained from independent pricing services.
Bank owned life insurance (BOLI) – The fair value of BOLI at December 31, 2004 and 2003 approximated the cash surrender value of the policies at those dates.
| | | | |
ESB Financial Corporation | | 55 | | 2004 Annual Report |
Notes to Consolidated Financial Statements(continued)
| 13. | Financial Instruments(continued) |
The following table sets forth the carrying amount and fair value of the Company’s financial instruments included in the consolidated statement of financial condition as of December 31:
| | | | | | | | | | | | |
(Dollar amounts in thousands)
| | 2004
| | 2003
|
| | Carrying
amount
| | Fair value
| | Carrying
amount
| | Fair value
|
Financial assets: | | | | | | | | | | | | |
Cash and cash equivalents | | $ | 17,703 | | $ | 17,703 | | $ | 15,330 | | $ | 15,330 |
Securities | | | 929,794 | | | 929,794 | | | 928,936 | | | 928,936 |
Loans receivable and held for sale | | | 343,524 | | | 346,600 | | | 322,454 | | | 325,805 |
Accrued interest receivable | | | 7,843 | | | 7,843 | | | 7,630 | | | 7,630 |
FHLB stock | | | 31,607 | | | 31,607 | | | 30,678 | | | 30,678 |
Bank owned life insurance | | | 25,586 | | | 25,586 | | | 24,645 | | | 24,645 |
Interest rate cap contracts | | | 1,338 | | | 451 | | | 1,123 | | | 985 |
| | | | |
Financial liabilities: | | | | | | | | | | | | |
Deposits | | | 580,346 | | | 583,657 | | $ | 630,046 | | $ | 609,731 |
Borrowed funds | | | 687,562 | | | 686,792 | | | 617,302 | | | 627,669 |
Junior subordinated notes | | | 15,211 | | | 15,152 | | | 35,187 | | | 35,032 |
Accrued interest payable | | | 2,567 | | | 2,567 | | | 2,587 | | | 2,587 |
The following table presents the notional amount of the Company’s off-balance sheet financial instruments as of December 31:
| | | | | | |
(Dollar amounts in thousands)
| | 2004
| | 2003
|
Loans in process and commitments: | | | | | | |
Fixed interest rate | | $ | 18,523 | | $ | 16,676 |
Variable interest rate | | | 31,309 | | | 24,306 |
Lines of credit (unfunded): | | | | | | |
Commercial | | | 18,836 | | | 14,285 |
Consumer | | | 17,005 | | | 16,860 |
Letters of credit: | | | | | | |
Commercial | | | — | | | — |
Standby | | | 6,066 | | | 5,883 |
Interest Rate Cap Contracts | | | 50,000 | | | 40,000 |
Commitments to extend credit involve, to a varying degree, elements of credit and interest rate risk in excess of amounts recognized in the consolidated statement of financial condition. The Company’s exposure to credit loss in the event of non-performance by the other party for commitments to extend credit is represented by the contractual amount of these commitments, less any collateral value obtained. The Company uses the same credit policies in making commitments as for on-balance sheet instruments. The Company’s distribution of commitments to extend credit approximates the distribution of loans receivable outstanding. The fair value of the off balance sheet items approximated the carrying value of those items at those dates.
| 14. | Regulatory Matters and Insurance of Accounts |
The Company’s subsidiary bank, ESB Bank, is subject to various regulatory capital requirements administered by the federal banking agencies. Failure to meet minimum capital requirements could result in certain mandatory – and possibly additional discretionary – actions by regulators that, if undertaken, could have a direct material effect on the Company’s consolidated financial statements. Under capital adequacy
| | | | |
ESB Financial Corporation | | 56 | | 2004 Annual Report |
Notes to Consolidated Financial Statements(continued)
| 14. | Regulatory Matters and Insurance of Accounts(continued) |
guidelines and the regulatory framework for prompt corrective action, the Bank must meet specific capital guidelines that involve quantitative measures of assets, liabilities and certain off-balance sheet items as calculated under regulatory accounting practices. The capital amounts and their related classification for the Bank is also subject to qualitative judgments by the regulators about components, risk weightings and other factors.
Quantitative measures established by regulation to ensure capital adequacy requires the Bank to maintain minimum amounts and ratios (set forth in the table below) of total capital (as defined in the regulations), tier 1 leverage capital (as defined) and tier 1 risk-based capital (as defined). As of December 31, 2004 the Bank meets all capital adequacy requirements to which it is subject.
As of December 31, 2004 and 2003, the most recent notification from the FDIC categorized the Bank as well capitalized under the regulatory framework for prompt corrective action. To be categorized as well capitalized, the Bank must maintain minimum total, tier 1 leverage and tier 1 risk-based capital ratios as set forth in the following table. As of December 31, 2004, there are no conditions or events since that notification that have changed the categorization.
Tier 1 leverage capital level in the following table is presented as a percentage of total adjusted assets (as defined in the regulations); total capital and tier 1 risk based capital levels are shown as a percentage of risk-weighted assets (as defined).
The minimum required regulatory capital percentages to be well capitalized under prompt corrective action provisions is 5%, 6% and 10% for tier 1 leverage, tier I risk-based and total capital ratios, respectively.
The FDIC through the Savings Association Insurance Fund insures deposits of account holders up to $100,000 per insured depositor. To provide for this insurance, the Bank must pay an annual premium.
The following table sets forth certain information concerning regulatory capital of the Bank:
| | | | | | | | | | | | | | | | | | |
(Dollar amounts in thousands)
| | Actual
| | | For Capital
Adequacy Purposes:
| | | To Be Well
Capitalized Under
Prompt Corrective
Action Provisions:
| |
| | Amount
| | Ratio
| | | Amount
| | Ratio
| | | Amount
| | Ratio
| |
As of December 31, 2004: | | | | | | | | | | | | | | | | | | |
Total Capital
(to Risk Weighted Assets) | | $ | 101,286 | | 16.26 | % | | $ | 49,846 | | 8.00 | % | | $ | 62,308 | | 10.00 | % |
Tier 1 Leverage Capital
(to Adjusted Tangible Assets) | | $ | 97,346 | | 7.33 | % | | $ | 53,096 | | 4.00 | % | | $ | 66,370 | | 5.00 | % |
Tier 1 Risk Based Capital
(to Risk Weighted Assets) | | $ | 97,346 | | 15.62 | % | | $ | 24,923 | | 4.00 | % | | $ | 37,385 | | 6.00 | % |
| | | | | | |
As of December 31, 2003: | | | | | | | | | | | | | | | | | | |
Total Capital
(to Risk Weighted Assets) | | $ | 91,882 | | 15.47 | % | | $ | 47,524 | | 8.00 | % | | $ | 59,405 | | 10.00 | % |
Core Capital
(to Adjusted Tangible Assets) | | $ | 88,077 | | 6.85 | % | | $ | 51,415 | | 4.00 | % | | $ | 64,268 | | 5.00 | % |
Tangible Capital
(to Tangible Assets) | | $ | 88,077 | | 6.85 | % | | $ | 19,281 | | 1.50 | % | | | N/A | | N/A | |
Tier I Capital
(to Risk Weighted Assets) | | $ | 88,077 | | 14.83 | % | | | N/A | | N/A | | | $ | 35,643 | | 6.00 | % |
| | | | |
ESB Financial Corporation | | 57 | | 2004 Annual Report |
Notes to Consolidated Financial Statements(continued)
| 15. | Quarterly Financial Data (unaudited) |
On January 23, 2004, ESB Bank converted from a federal savings bank to a Pennsylvania chartered savings bank.
Quarterly earnings per share data may vary from annual earnings due to rounding.
| | | | | | | | | | | | | | | |
(Dollar amounts in thousands, except share data)
| | First Quarter
| | | Second Quarter
| | Third Quarter
| | | Fourth Quarter
| |
2004: | | | | | | | | | | | | | | | |
Interest income | | $ | 15,200 | | | $ | 14,819 | | $ | 15,143 | | | $ | 15,636 | |
Interest expense | | | 8,730 | | | | 8,598 | | | 9,042 | | | | 9,199 | |
| | |
|
|
| |
|
| |
|
|
| |
|
|
|
Net interest income | | | 6,470 | | | | 6,221 | | | 6,101 | | | | 6,437 | |
Provision for (recovery of) loan losses | | | 33 | | | | 138 | | | 127 | | | | (92 | ) |
| | |
|
|
| |
|
| |
|
|
| |
|
|
|
Net interest income after provision for (recovery of) loan losses | | | 6,437 | | | | 6,083 | | | 5,974 | | | | 6,529 | |
Net realized gain on sale of securities available for sale | | | 943 | | | | — | | | — | | | | — | |
Other noninterest income | | | 1,119 | | | | 1,634 | | | 1,561 | | | | 1,703 | |
Noninterest expense | | | 5,540 | | | | 4,895 | | | 4,729 | | | | 4,993 | |
| | |
|
|
| |
|
| |
|
|
| |
|
|
|
Income before income taxes | | | 2,959 | | | | 2,822 | | | 2,806 | | | | 3,239 | |
Provision for income taxes | | | 521 | | | | 461 | | | 205 | | | | 649 | |
| | |
|
|
| |
|
| |
|
|
| |
|
|
|
Net income | | $ | 2,438 | | | $ | 2,361 | | $ | 2,601 | | | $ | 2,590 | |
| | |
|
|
| |
|
| |
|
|
| |
|
|
|
Diluted net income per share | | $ | 0.23 | | | $ | 0.22 | | $ | 0.25 | | | $ | 0.25 | |
| | |
|
|
| |
|
| |
|
|
| |
|
|
|
2003: | | | | | | | | | | | | | | | |
Interest income | | $ | 16,748 | | | $ | 15,743 | | $ | 14,648 | | | $ | 15,328 | |
Interest expense | | | 11,043 | | | | 10,740 | | | 9,756 | | | | 9,313 | |
| | |
|
|
| |
|
| |
|
|
| |
|
|
|
Net interest income | | | 5,705 | | | | 5,003 | | | 4,892 | | | | 6,015 | |
(Recovery of) provision for loan losses | | | (182 | ) | | | 152 | | | (237 | ) | | | 161 | |
| | |
|
|
| |
|
| |
|
|
| |
|
|
|
Net interest income after (recovery of) provision for loan losses | | | 5,887 | | | | 4,851 | | | 5,129 | | | | 5,854 | |
Net realized gain on sale of securities available for sale | | | 435 | | | | 331 | | | 460 | | | | 73 | |
Other noninterest income | | | 996 | | | | 1,344 | | | 1,549 | | | | 1,434 | |
Noninterest expense | | | 4,397 | | | | 4,612 | | | 4,494 | | | | 4,505 | |
| | |
|
|
| |
|
| |
|
|
| |
|
|
|
Income before income taxes | | | 2,921 | | | | 1,914 | | | 2,644 | | | | 2,856 | |
Provision for income taxes | | | 557 | | | | 243 | | | 478 | | | | 533 | |
| | |
|
|
| |
|
| |
|
|
| |
|
|
|
Net income | | $ | 2,364 | | | $ | 1,671 | | $ | 2,166 | | | $ | 2,323 | |
| | |
|
|
| |
|
| |
|
|
| |
|
|
|
Diluted net income per share | | $ | 0.23 | | | $ | 0.15 | | $ | 0.20 | | | $ | 0.22 | |
| | |
|
|
| |
|
| |
|
|
| |
|
|
|
| | | | |
ESB Financial Corporation | | 58 | | 2004 Annual Report |
Notes to Consolidated Financial Statements(continued)
| 16. | ESB Financial Corporation – Condensed Financial Statements (Parent Company Only) |
Following are condensed financial statements for the parent company as of and for the years ended December 31:
| | | | | | | | |
Condensed Statements of Financial Condition | | | | | | |
| | |
(Dollar amounts in thousands)
| | 2004
| | 2003
|
Assets: | | | | | | |
Interest-earning deposits | | $ | 1,805 | | $ | 6,669 |
Equity in net assets of subsidiaries | | | 146,810 | | | 147,930 |
Other assets | | | 4,874 | | | 4,010 |
| | | | |
|
| |
|
|
Total assets | | $ | 153,489 | | $ | 158,609 |
| | | | |
|
| |
|
|
Liabilities and stockholders’ equity: | | | | | | |
Subordinated debt, net | | $ | 15,211 | | $ | 35,187 |
Payable to subsidiaries | | | 20,000 | | | 26,542 |
Accrued expenses and other liabilities | | | 20,477 | | | 9 |
Stockholders’ equity | | | 97,801 | | | 96,871 |
| | | | |
|
| |
|
|
Total liabilities and stockholders’ equity | | $ | 153,489 | | $ | 158,609 |
| | | | |
|
| |
|
|
| | | | | | | | | | | | |
Condensed Statements of Operations | | | | | | | | | | | | |
| | | |
(Dollar amounts in thousands)
| | 2004
| | | 2003
| | | 2002
| |
Income: | | | | | | | | | | | | |
Equity in undistributed net income of subsidiaries | | $ | 11,992 | | | $ | 9,090 | | | $ | 9,803 | |
Management fee income, from subsidiaries | | | 1,893 | | | | 3,753 | | | | 3,495 | |
Interest and other income | | | 161 | | | | 184 | | | | 33 | |
| | |
|
|
| |
|
|
| |
|
|
|
Total income | | | 14,046 | | | | 13,027 | | | | 13,331 | |
| | | |
Expense: | | | | | | | | | | | | |
Interest expense, to subsidiary | | | 2,371 | | | | 2,900 | | | | 3,086 | |
Compensation and employee benefits | | | 1,920 | | | | 1,718 | | | | 1,672 | |
Other | | | 1,076 | | | | 463 | | | | 294 | |
| | |
|
|
| |
|
|
| |
|
|
|
Total expense | | | 5,367 | | | | 5,081 | | | | 5,052 | |
| | |
|
|
| |
|
|
| |
|
|
|
Income before benefit from income taxes | | | 8,679 | | | | 7,946 | | | | 8,279 | |
| | | |
Benefit from income taxes | | | (1,311 | ) | | | (578 | ) | | | (681 | ) |
| | |
|
|
| |
|
|
| |
|
|
|
Net income | | $ | 9,990 | | | $ | 8,524 | | | $ | 8,960 | |
| | |
|
|
| |
|
|
| |
|
|
|
| | | | |
ESB Financial Corporation | | 59 | | 2004 Annual Report |
Notes to Consolidated Financial Statements(continued)
| 16. | ESB Financial Corporation – Condensed Financial Statements (Parent Company Only)(continued) |
| | | | | | | | | | | | |
Condensed Statements of Cash Flows | | | | | | | | | | | | |
| | | |
(In thousands)
| | 2004
| | | 2003
| | | 2002
| |
Operating activities: | | | | | | | | | | | | |
Net income | | $ | 9,990 | | | $ | 8,524 | | | $ | 8,960 | |
Adjustments to reconcile net income to net cash provided by (used in) operating activities: | | | | | | | | | | | | |
Equity in undistributed net income of subsidiaries | | | (11,992 | ) | | | (9,090 | ) | | | (9,803 | ) |
(Gain) loss on sale of securities available for sale | | | (85 | ) | | | 101 | | | | 173 | |
Dividends from subsidiaries | | | 9,000 | | | | 8,000 | | | | 7,000 | |
Other, net | | | 1,471 | | | | (8,432 | ) | | | 1,936 | |
| | |
|
|
| |
|
|
| |
|
|
|
Net cash provided by (used in) operating activities | | | 8,384 | | | | (897 | ) | | | 8,266 | |
| | |
|
|
| |
|
|
| |
|
|
|
Investing activities: | | | | | | | | | | | | |
Proceeds from the sale of securities available for sale | | | 125 | | | | 1,368 | | | | 1,218 | |
| | |
|
|
| |
|
|
| |
|
|
|
Net cash provided by investing activities | | | 125 | | | | 1,368 | | | | 1,218 | |
| | |
|
|
| |
|
|
| |
|
|
|
Financing activities: | | | | | | | | | | | | |
Decrease in payable to subsidiaries | | | (6,542 | ) | | | (458 | ) | | | (5,750 | ) |
(Decrease) increase in subordinated debt, net | | | (19,976 | ) | | | 10,984 | | | | 44 | |
Proceeds from long term borrowings | | | 19,170 | | | | — | | | | — | |
Proceeds received from exercise of stock options | | | 430 | | | | 694 | | | | 523 | |
Dividends paid | | | (4,302 | ) | | | (3,885 | ) | | | (3,070 | ) |
Net proceeds from (payments to acquire) re-issuance or sale of treasury stock | | | (3,139 | ) | | | 1,819 | | | | (1,486 | ) |
Stock purchased by ESOP | | | — | | | | (5,000 | ) | | | — | |
Principal repayment of ESOP loan | | | 986 | | | | 801 | | | | 607 | |
| | |
|
|
| |
|
|
| |
|
|
|
Net cash (used in) provided by financing activities | | | (13,373 | ) | | | 4,955 | | | | (9,132 | ) |
| | |
|
|
| |
|
|
| |
|
|
|
(Decrease) increase in cash equivalents | | | (4,864 | ) | | | 5,426 | | | | 352 | |
Cash equivalents at beginning of period | | | 6,669 | | | | 1,243 | | | | 891 | |
| | |
|
|
| |
|
|
| |
|
|
|
Cash equivalents at end of period | | $ | 1,805 | | | $ | 6,669 | | | $ | 1,243 | |
| | |
|
|
| |
|
|
| |
|
|
|
| | | | |
ESB Financial Corporation | | 60 | | 2004 Annual Report |
Notes to Consolidated Financial Statements(continued)
| 17. | Subsequent Events (Unaudited) |
Acquisition of PHSB
Effective February 11, 2005, the Company completed its business acquisition of PHSB Financial Corporation (PHSB), a Pennsylvania corporation and bank holding company for Peoples Home Savings Bank. PHSB is primarily engaged in the business of attracting deposits from the general public and offering traditional mortgage loan products, commercial loans and consumer loans, which primarily consist of automobile loans. The merger is expected to create a resultant banking institution with increased presence in Lawrence and Beaver counties in western Pennsylvania. Each share of PHSB common stock is scheduled to be exchanged for either $27.00 in cash or 1.966 shares of Company common stock. The total merger consideration is to be paid 50% in Company common stock and 50% in cash. The election period for PHSB shareholders expires March 17, 2005. The Company does expect to issue approximately 2.9 million shares. In exchange for all of the outstanding common stock of PHSB, the Company expects to pay $79.0 million. The transaction was funded primarily through the issuance of $35.0 million fixed rate Preferred Securities. The transaction will be accounted for as a purchase transaction whereby the identifiable tangible and intangible assets and liabilities of PHSB will be recorded at their fair values as of the acquisition date. The amount of contractual obligations, severance or other plan payments, which are estimated to be $4.9 million, are expected to be capitalized and included in the calculation of goodwill associated with the acquisition. The preliminary purchase accounting estimates goodwill at approximately $38.0 million and the core deposit intangible to be approximately $4.5 million. The purchase accounting will be completed upon the final determination valuation of the loans and the core deposit intangible, in the first quarter of 2005. As prescribed under the purchase method of accounting, the results of operations of PHSB from the date of acquisition will be included in the Company’s financial statements for the first quarter of 2005.
Trust Preferred Issuance
On February 10, 2005, ESB Capital Trust IV (Trust IV), a statutory business trust established under Delaware law that is a subsidiary of the Company, issued $35.0 million fixed rate Preferred Securities. The Company purchased $1.1 million of common securities of the Trust IV. The Preferred Securities are fixed at a rate of 6.03% for six years and then are callable at three month London Interbank Offer Rate Index (LIBOR) plus 1.80%. The Preferred Securities have a stated maturity of thirty years. The Trust IV’s obligations under the Preferred Securities issued are fully and unconditionally guaranteed by the Company.
| | | | |
ESB Financial Corporation | | 61 | | 2004 Annual Report |
Management’s Reports to ESB Financial Corporation Shareholders
Management’s Report on Financial Statements and Practices
ESB Financial Corporation is responsible for the preparation, integrity, and fair presentation of the consolidated financial statements included in this annual report. The consolidated financial statements and notes included in this annual report have been prepared in conformity with United States generally accepted accounting principles and necessarily include some amounts that are based on management’s best estimates and judgments.
The system of internal control over financial reporting as it relates to the financial statements is evaluated for effectiveness by management and tested for reliability through a program of internal audits. Actions are taken to correct potential deficiencies as they are identified. Any system of internal control, no matter how well designed, has inherent limitations, including the possibility that a control could be circumvented or overridden and misstatements due to error or fraud may occur and not be detected. Also, because of changes in conditions, internal control effectiveness may vary over time. Accordingly, even an effective system of internal control will provide only reasonable assurance with respect to financial statement preparation.
The Audit Committee, consisting entirely of independent directors, meets regularly with management, internal auditors and the independent registered public accounting firm, and reviews audit plans and results, as well as management’s actions taken in discharging responsibilities for accounting, financial reporting, and internal control. Ernst & Young LLP, independent registered public accounting firm, and the internal auditors have direct and confidential access to the Audit Committee at all times to discuss the results of their examinations.
Report on Management’s Assessment of Internal Control Over Financial Reporting
We, as management of ESB Financial Corporation, are responsible for establishing and maintaining effective internal control over financial reporting that is designed to produce reliable financial statements in conformity with United States generally accepted accounting principles. Management assessed the Corporation’s system of internal control over financial reporting as of December 31, 2004, in relation to criteria for effective internal control over financial reporting as described in “Internal Control – Integrated Framework,” issued by the Committee of Sponsoring Organizations of the Treadway Commission. Based on this assessment, management concludes that, as of December 31, 2004, its system of internal control over financial reporting is effective and meets the criteria of the “Internal Control – Integrated Framework”. Ernst & Young LLP, independent registered public accounting firm, has issued an attestation report on management’s assessment of the Corporation’s internal control over financial reporting.

Charlotte A. Zuschlag
President and Chief Executive Officer

Charles P. Evanoski
Group Senior Vice President and Chief Financial Officer
March 8, 2005
| | | | |
ESB Financial Corporation | | 62 | | 2004 Annual Report |
Report of Independent Registered Public Accounting Firm
The Board of Directors and Stockholders
ESB Financial Corporation
We have audited management’s assessment, included in the accompanying Report on Management’s Assessment of Internal Control Over Financial Reporting, that ESB Financial Corporation maintained effective internal control over financial reporting as of December 31, 2004, based on criteria established in Internal Control—Integrated Framework issued by the Committee of Sponsoring Organizations of the Treadway Commission (the COSO criteria). ESB Financial Corporation’s management is responsible for maintaining effective internal control over financial reporting and for its assessment of the effectiveness of internal control over financial reporting. Our responsibility is to express an opinion on management’s assessment and an opinion on the effectiveness of the company’s internal control over financial reporting based on our audit.
We conducted our audit in accordance with the standards of the Public Company Accounting Oversight Board (United States). Those standards require that we plan and perform the audit to obtain reasonable assurance about whether effective internal control over financial reporting was maintained in all material respects. Our audit included obtaining an understanding of internal control over financial reporting, evaluating management’s assessment, testing and evaluating the design and operating effectiveness of internal control, and performing such other procedures as we considered necessary in the circumstances. We believe that our audit provides a reasonable basis for our opinion.
A company’s internal control over financial reporting is a process designed to provide reasonable assurance regarding the reliability of financial reporting and the preparation of financial statements for external purposes in accordance with generally accepted accounting principles. A company’s internal control over financial reporting includes those policies and procedures that (1) pertain to the maintenance of records that, in reasonable detail, accurately and fairly reflect the transactions and dispositions of the assets of the company; (2) provide reasonable assurance that transactions are recorded as necessary to permit preparation of financial statements in accordance with generally accepted accounting principles, and that receipts and expenditures of the company are being made only in accordance with authorizations of management and directors of the company; and (3) provide reasonable assurance regarding prevention or timely detection of unauthorized acquisition, use, or disposition of the company’s assets that could have a material effect on the financial statements.
Because of its inherent limitations, internal control over financial reporting may not prevent or detect misstatements. Also, projections of any evaluation of effectiveness to future periods are subject to the risk that controls may become inadequate because of changes in conditions, or that the degree of compliance with the policies or procedures may deteriorate.
In our opinion, management’s assessment that ESB Financial Corporation maintained effective internal control over financial reporting as of December 31, 2004, is fairly stated, in all material respects, based on the COSO criteria. Also, in our opinion, ESB Financial Corporation maintained, in all material respects, effective internal control over financial reporting as of December 31, 2004, based on the COSO criteria.
We also have audited, in accordance with the standards of the Public Company Accounting Oversight Board (United States), the consolidated balance sheets of ESB Financial Corporation as of December 31, 2004 and 2003, and the related consolidated statements of income, stockholders’ equity, and cash flows for each of the three years in the period ended December 31, 2004, and our report dated March 8, 2005, expressed an unqualified opinion thereon.

Pittsburgh, PA
March 8, 2005
| | | | |
ESB Financial Corporation | | 63 | | 2004 Annual Report |
Report of Independent Registered Public Accounting Firm
The Board of Directors and Stockholders of ESB Financial Corporation
We have audited the accompanying consolidated balance sheets of ESB Financial Corporation and subsidiaries as of December 31, 2004 and 2003, and the related consolidated statements of income, stockholders’ equity, and cash flows for each of the three years in the period ended December 31, 2004. These financial statements are the responsibility of the Company’s management. Our responsibility is to express an opinion on these financial statements based on our audits.
We conducted our audits in accordance with the standards of the Public Company Accounting Oversight Board (United States). Those standards require that we plan and perform the audit to obtain reasonable assurance about whether the financial statements are free of material misstatement. An audit includes examining, on a test basis, evidence supporting the amounts and disclosures in the financial statements. An audit also includes assessing the accounting principles used and significant estimates made by management, as well as evaluating the overall financial statement presentation. We believe that our audits provide a reasonable basis for our opinion.
In our opinion, the financial statements referred to above present fairly, in all material respects, the consolidated financial position of ESB Financial Corporation and subsidiaries at December 31, 2004 and 2003, and the consolidated results of their operations and their cash flows for each of the three years in the period ended December 31, 2004, in conformity with U. S. generally accepted accounting principles.
We also have audited, in accordance with the standards of the Public Company Accounting Oversight Board (United States), the effectiveness of ESB Financial Corporation’s internal control over financial reporting as of December 31, 2004, based on criteria established in Internal Control – Integrated Framework issued by the Committee of Sponsoring Organizations of the Treadway Commission and our report dated March 8, 2005 expressed an unqualified opinion thereon.

Pittsburgh, PA
March 8, 2005
| | | | |
ESB Financial Corporation | | 64 | | 2004 Annual Report |
Stock and Dividend Information
Listings and Markets
ESB Financial Corporation common stock is traded on the Nasdaq National Stock Market under the symbol “ESBF”. Some of the listed market makers for the Company’s common stock include:
| | | | |
Goldman Sachs Research 85 Broad Street New York, NY 10004 Telephone: (212) 902-1000 Ryan Beck & Co., Inc. 220 Livingston Orange Avenue Livingston, NJ 07039 Telephone: (800) 223-8969 | | RBC Dain Rauscher 500 West Madison Chicago, Il 60661 Telephone: (888) 655-4135 Sandler O’Neill & Partners, LP 919 Third Avenue, 6th Floor New York, NY 10022 Telephone: (800) 635-6851 | |  |
Number of Stockholders and Shares Outstanding
As of December 31, 2004, there were 2,339 registered stockholders of record and 10,682,556 shares of common stock entitled to vote, receive dividends and considered outstanding for financial reporting purposes. The number of stockholders of record does not include the number of persons or entities who hold their stock in nominee or “street” name.
Dividend Reinvestment Plan
Common stockholders may have Company dividends reinvested to purchase additional shares. Participants may also make optional cash purchases of common stock through the reinvestment plan and pay no brokerage commissions or fees. To obtain a plan prospectus and authorization card call (800) 368-5948.
Registrar and Transfer Agent
Registrar and Transfer Company
10 Commerce Drive
Cranford, NJ 07016
Cash Dividends
The Company has paid regular quarterly cash dividends since its inception in June 1990. During the past two years ended December 31, 2004, the Company declared cash dividends with the following record and payment dates:
| | | | | |
Record Date
| | Payment Date
| | Cash Dividends
per Share
|
December 31, 2004 | | January 25, 2005 | | $ | 0.100 |
September 30, 2004 | | October 25, 2004 | | $ | 0.100 |
June 30, 2004 | | July 23, 2004 | | $ | 0.100 |
March 31, 2004 | | April 23, 2004 | | $ | 0.100 |
| | |
December 31, 2003 | | January 23, 2004 | | $ | 0.100 |
September 30, 2003 | | October 24, 2003 | | $ | 0.100 |
June 30, 2003 | | July 25, 2003 | | $ | 0.100 |
March 31, 2003 | | April 25, 2003 | | $ | 0.083 |
| | | | |
ESB Financial Corporation | | 65 | | 2004 Annual Report |
Stock and Dividend Information(continued)
Stock Splits and Dividends
The Company has declared the following stock splits or dividends since its inception:
| | | | | |
Record Date
| | Payment Date
| | Percentage
Issued
| |
May 1, 2003 | | May 15, 2003 | | 20 | % |
September 30, 2002 | | October 25, 2002 | | 20 | % |
May 18, 2001 | | May 30, 2001 | | 20 | % |
May 17, 2000 | | May 31, 2000 | | 10 | % |
May 15, 1998 | | May 29, 1998 | | 10 | % |
July 31, 1997 | | August 25, 1997 | | 10 | % |
December 31, 1994 | | January 25, 1995 | | 20 | % |
December 31, 1993 | | January 25, 1994 | | 20 | % |
May 12, 1993 | | June 7, 1993 | | 20 | % |
December 31, 1992 | | January 25, 1993 | | 20 | % |
June 30, 1992 | | July 25, 1992 | | 20 | % |
December 31, 1991 | | January 25, 1992 | | 20 | % |
Stock Price Information
The bid and ask price of the Company’s common stock were $13.52 and $13.60, respectively, as of January 31, 2004.
The following table sets forth the high and low sale market prices of the Company’s common stock as of and during the quarterly periods presented:
| | | | | | | | | |
| | | Market Price
|
| | | High
| | Low
| | Close
|
2004 Quarter Ended | | | | | | | | | |
December 31 | | $ | 15.65 | | $ | 13.39 | | $ | 14.45 |
September 30 | | | 14.02 | | | 10.63 | | | 13.76 |
June 30 | | | 15.26 | | | 12.05 | | | 12.53 |
March 31 | | | 16.67 | | | 13.60 | | | 14.10 |
| | | |
2003 Quarter Ended | | | | | | | | | |
December 31 | | $ | 16.86 | | $ | 14.92 | | $ | 16.10 |
September 30 | | | 15.12 | | | 12.62 | | | 14.56 |
June 30 | | | 17.82 | | | 13.50 | | | 13.50 |
March 31 | | | 15.27 | | | 10.57 | | | 14.83 |
| | | | |
ESB Financial Corporation | | 66 | | 2004 Annual Report |
Corporate Information
Annual Meeting
The annual meeting of the Company’s stockholders will be held at 4:00 p.m., on Wednesday, April 20, 2005, at the Connoquenessing Country Club, 1512 Mercer Road, Ellwood City, PA 16117.
Stockholder and Investor Information
Copies of annual reports on Form 10-K, quarterly reports on Form 10-Q, current reports on Form 8-K and related stockholder literature are available upon written request without charge to stockholders. Requests should be addressed to Frank D. Martz, Group Senior Vice President of Operations and Corporate Secretary, ESB Financial Corporation, 600 Lawrence Avenue, Ellwood City, PA 16117.
We make available on our website,www.esbbank.com, our annual report on Form 10-K, quarterly reports on Form 10-Q and current reports on Form 8-K, on the date which we electronically file these reports with the Securities and Exchange Commission, as well as our code of ethics. Investors are encouraged to access these reports and the other information about our business and operations on our web site.
Equal Employment Opportunity
ESB Financial Corporation has adopted an affirmative action program to assure equal opportunity for every employee and hires, trains, promotes, compensates and makes all other employment decisions without regard to race, color, religion, sex, age, national origin, disability or veteran status.
Corporate Headquarters
ESB Financial Corporation
600 Lawrence Avenue
Ellwood City, PA 16117
Phone: (724) 758-5584
Subsidiary Companies
| | |
ESB Bank | | ESB Capital Trust II |
ESB Financial Services, Inc. | | ESB Statutory Trust III |
AMSCO, Inc. | | THF, Inc d/b/a Elite Settlement Services |
ESB Bank Building Associates | | |
Madison Woods Joint Venture | | |
McCormick Farms, LLC | | |
The Links at Deer Run Associates, LLC | | |
Brandy One, LLC | | |
The Vineyards at Brandywine, LLP | | |
PennFirst Financial Services, Inc. | | |
| | |
| Independent Registered Public Accounting Firm | | Special Counsel |
| |
Ernst & Young LLP | | Elias, Matz, Tiernan & Herrick L.L.P. |
One Oxford Centre | | 734 15th Street, NW |
Pittsburgh, PA 15219 | | Washington, DC 20005 |
| | | | |
ESB Financial Corporation | | 67 | | 2004 Annual Report |
Board of Directors
ESB FINANCIAL CORPORATION
| | |
| William B. Salsgiver | | Charles Delman |
Chairman of the Board | | Retired Chairman, President & CEO - ESB Bancorp, Inc. |
A Principal - Perry Homes | | |
| |
| Herbert S. Skuba | | Mario J. Manna |
Vice Chairman of the Board | | Retired Tax Collector - Borough of Coraopolis |
Director, President & CEO - Ellwood City Hospital | | |
| |
| Charlotte A. Zuschlag | | Lloyd L. Kildoo |
President & Chief Executive Officer | | Owner & Funeral Director - Glenn-Kildoo Funeral Homes |
ESB BANK
| | |
| William B. Salsgiver | | Lloyd L. Kildoo |
Chairman of the Board | | Owner & Funeral Director - Glenn-Kildoo Funeral Homes |
A Principal - Perry Homes | | |
| |
| Herbert S. Skuba | | Mario J. Manna |
Vice Chairman of the Board | | Retired Tax Collector - Borough of Coraopolis |
Director, President & CEO - Ellwood City Hospital | | |
| |
| Charlotte A. Zuschlag | | Edward W. Preskar, RA |
President & Chief Executive Officer | | Retired Director of Facilities- School District of Pittsburgh |
| |
| Raymond K. Aiken | | Joseph W. Snyder |
Retired President & COO - Lockhart Chemical Co. | | Sourcing Agent - Equitable Resources, Inc. |
| |
| Charles Delman | | Guy Dille, CPA |
Retired Chairman, President & CEO - ESB Bancorp, Inc. | | Retired Chief Financial Officer - Williams & Company, Inc. |
| |
| Johanna C. Guehl | | Jefrey F. Wall |
Owner- Law Offices of Johanna C. Guehl | | Vice President/Operations - R.J. Rhodes Transit, Inc. |
Affiliate - Kathy L. Hess & Associates, CPA’s | | |
| | | | |
ESB Financial Corporation | | 68 | | 2004 Annual Report |
Corporate Officers, Advisory Board and Bank Officers
| | |
| ESB FINANCIAL CORPORATION | | ESB BANK |
William B. Salsgiver | | William B. Salsgiver |
Chairman of the Board | | Chairman of the Board |
Charlotte A. Zuschlag | | Charlotte A. Zuschlag |
President & Chief Executive Officer | | President & Chief Executive Officer |
Thomas F. Angotti | | |
Group Senior Vice President/Administration | | Group Senior Vice Presidents |
Charles P. Evanoski | | Thomas F. Angotti |
Group Senior Vice President, Chief Financial Officer & Treasurer | | Charles P. Evanoski |
Frank D. Martz | | Frank D. Martz |
Group Senior Vice President/Operations & Corporate Secretary | | Todd F. Palkovich |
Todd F. Palkovich | | |
Group Senior Vice President/Lending | | Senior Vice Presidents |
Robert J. Colalella | | Robert J. Colalella |
Senior Vice President/Marketing, Facilities & CRA | | John W. Donaldson II |
John W. Donaldson II | | Peter J. Greco |
Senior Vice President/Lending | | Teresa Krukenberg |
Peter J. Greco | | Ronald J. Mannarino |
Senior Vice President/Lending | | Beth A. McClymonds |
Teresa Krukenberg | | Mark A. Platz |
Senior Vice President/Operations | | Ronald E. Pompeani |
Ronald J. Mannarino | | Marilyn Scripko |
Senior Vice President/Asset Liability Management | | John T. Stunda |
Beth A. McClymonds | | Bonita L. Wadding |
Senior Vice President/Audit & Loan Review | | |
Mark A. Platz | | Vice Presidents |
Senior Vice President/Information Technology | | Robert A. Ackerman |
Ronald E. Pompeani | | Deborah A. Allen |
Senior Vice President/Lending | | Kathleen A. Bender |
Marilyn Scripko | | Charlotte M. Bolinger |
Senior Vice President/Lending | | Thomas E. Campbell |
John T. Stunda | | Nancy A. Glitsch |
Senior Vice President/Human Resources | | Deborah S. Goehring |
Bonita L. Wadding | | Paul F. Hoyson |
Senior Vice President/Controller | | Brian Hulme |
| | | Mary Ann Leonardo |
| ESB BANK, ADVISORY BOARD | | Sally A. Mannarino |
Charles Delman | | Larry Mastrean |
Retired Chairman, President & CEO - ESB Bancorp, Inc. | | Joanne C. Wienand |
George C. Dorsch | | Wayne G. Zerishnek |
Retired Engineer - | | Pamela K. Zikeli |
Dept. of Transportation, Commonwealth of Pennsylvania | | |
Dr. Allan Gastfriend | | Assistant Vice Presidents |
Retired Dentist | | Susan Antolic |
Charles W. Hergenroeder, III | | David Barletta |
Partner - Hergenroeder, Rega, Sommer, L.L.C. | | Janet S. Barletta |
Watson F. McGaughey, Jr. | | Judy L. Diesing |
President - McGaughey Buses, Inc. | | John R. Fogg |
Donald R. Miller | | Margaret A. Haefele |
Retired President - Miller & Sons Chevrolet | | Barbara E. Martinelli |
| | | Louise P. Massung |
| THF, Inc. | | Christopher McCaw |
Rocco Abbatangelo - President | | Marianne L. Mills |
| | | Ann R. Nelson |
| | | Deborah F. Pagley |
| | | Carol E. Poleno |
| | | Timothy S. Robinson |
| | | Cynthia Scaramazza |
| | | Patricia Schramm |
| | | Jackie A. Smith |
| | | Kathy Smyth |
| | | Sharon Speicher |
| | | Joyce A. Stellitano |
| | | Robert Tatka |
| | | Volynda Teets |
| | | Sara F. Vattimo |
| |
| | | Assistant Secretaries |
| | | Linda A. MacMurdo |
| | | Dana M. Martz |
| | | Robin Scheffler |
| | | | |
ESB Financial Corporation | | 69 | | 2004 Annual Report |
Board of Directors

Board of Directors of ESB Bank, are, seated from left, William B. Salsgiver, Charles Delman, Mario J. Manna, Lloyd L. Kildoo and Raymond K. Aiken. Standing from left are Herbert S. Skuba, Charlotte A. Zuschlag, Joseph W. Snyder, Guy Dille, Johanna C. Guehl, Jefrey F. Wall, Edward W. Preskar.
| | | | |
ESB Financial Corporation | | 70 | | 2004 Annual Report |
Officers

The management team of ESB Financial Corporation with an impressive combined years of service to the Corporation of 995 years and an average length of service of 16.3 years.
| | | | |
ESB Financial Corporation | | 71 | | 2004 Annual Report |
Office Locations and Branch Managers
| | |
| Our Newest Office | |  |
| NESHANNOCK TOWNSHIP | |
| DEBBIE GOEHRING- Manager | |
| 3360 Wilmington Road | |
| New Castle, PA 16105 | |
| 724.658.8825 | |
| ALIQUIPPA - JANET BARLETTA | |
| 2301 Sheffield Road, Aliquippa, PA 15001 | |
| 724.378.4436 | |
| AMBRIDGE - JACKIE SMITH | |
| 506 Merchant Street, Ambridge, PA 15003 | |
| 724.266.5002 | |
| BALDWIN - PATRICIA SCHRAMM | |
| 5035 Curry Road - Pittsburgh, PA 15236 | |
| 412.655.8670 | |
| BEECHVIEW - BARBARA MARTINELLI | |
| 1609 Broadway Avenue, Pittsburgh, PA 15216 | |
| 412.344.7211 | |
| CENTER TWP -JUDY DIESING | |
| 3531 Brodhead Road, Monaca, PA 15061 | |
| 724.774.0332 | |
| CORAOPOLIS - LARRY MASTREAN | |
| 900 Fifth Avenue, Coraopolis, PA 15108 | |
| 412.264.8862 | |
| ELLWOOD CITY - PAMELA ZIKELI | |
| 600 Lawrence Avenue, Ellwood City, PA 16117 | |
| 724.758.5584 | |
| FOX CHAPEL -JOYCE STELLITANO | |
| 1060 Freeport Road, Pittsburgh, PA 15238 | |
| 412.782.6500FRANKLIN TWP - TOM CAMPBELL | |
| 1793 Mercer Road, Ellwood City, PA 16117 | |
| 724.758.2500NORTH SHORE - SHARON SPEICHER | |
| 807 Middle Street, Pittsburgh, PA 15212 | |
| 412.231.7297 | |
| SHENANGO TOWNSHIP - CHARLOTTE BOLINGER | |
| Lawrence Village Plaza, New Castle, PA 16101 | |
| 724.654.7781 | |
| SPRING HILL - MARIANNE MILLS | |
| Itin & Rhine Streets, Pittsburgh, PA 15212 | |
| 412.231.0819 | |
| TROY HILL - PEGGY HAEFELE | |
| 1706 Lowrie Street, Pittsburgh, PA 15212 | |
| 412.231.8238 | |
| WEXFORD - DEBBIE ALLEN | |
| 101 Wexford-Bayne Road, Wexford, PA 15090 | |
| 724.934.8989 | |
| ZELIENOPLE - CINDY SCARAMAZZA | |
| Northgate Plaza, Zelienople, PA 16063 | |
| 724.452.6500 | |
| | | | |
ESB Financial Corporation | | 72 | | 2004 Annual Report |
A VERY SPECIAL THANK YOU

The Board of Directors of ESB Financial Corporation and all of its employees wish to express our deepest appreciation and warmest thank you to G. William Blank, Jr. who retired from the Board of Directors this past year.
Bill served the Company and the banking industry for over thirty years since the beginning of his career in the savings and loan business in 1972 when he first became a director of Ellwood City Federal Savings Association. Bill served on the Executive Committee of the Board and for twelve years was a valued member of the Audit Committee, including serving as Audit Committee Chairman for eight years.
Bill demonstrated his belief of corporate responsibility by being actively involved in his community by giving a tremendous amount of personal time and talents to a number of service groups in the local area.
Bill, please accept the sincere gratitude of the entire ESB Financial Corporation family for your years of devoted service to the Company.

ESB FINANCIAL CORPORATION
600 Lawrence Ave
Ellwood City, PA 16117
Phone: (724) 758.5584
www.esbbank.com