UNITED STATES
SECURITIES AND EXCHANGE COMMISSION
Washington, D.C. 20549
Form 10-K
(Mark One)
| |
☑ | ANNUAL REPORT PURSUANT TO SECTION 13 OR 15(d) OF THE SECURITIES EXCHANGE ACT OF 1934 |
For the fiscal year ended December 31, 2024
OR
| |
☐ | TRANSITION REPORT PURSUANT TO SECTION 13 OR 15(d) OF THE SECURITIES EXCHANGE ACT OF 1934 |
For the transition period from __________ to __________
Commission File Number 1-4601

Schlumberger N.V. (Schlumberger Limited)
(Exact name of registrant as specified in its charter)
| | |
Curaçao |
| 52-0684746 |
(State or other jurisdiction of incorporation or organization) |
| (IRS Employer Identification No.) |
|
|
|
42 rue Saint-Dominique
Paris, France |
| 75007 |
|
|
|
5599 San Felipe, 17th Floor
Houston, Texas, United States of America |
| 77056 |
|
|
|
62 Buckingham Gate London, United Kingdom | | SW1E 6AJ |
| | |
Parkstraat 83
The Hague, The Netherlands |
| 2514 JG |
(Addresses of principal executive offices) |
| (Zip Codes) |
Registrant’s telephone number including area code: (713) 513-2000
Securities registered pursuant to Section 12(b) of the Act:
| | |
Title of each class | Trading Symbol(s) | Name of each exchange on which registered |
Common Stock, par value $0.01 per share | SLB | New York Stock Exchange |
Securities registered pursuant to Section 12(g) of the Act: None
Indicate by check mark if the registrant is a well-known seasoned issuer, as defined in Rule 405 of the Securities Act. Yes ☑ No ☐
Indicate by check mark if the registrant is not required to file reports pursuant to Section 13 or Section 15(d) of the Act. Yes ☐ No ☑
Indicate by check mark whether the registrant (1) has filed all reports required to be filed by Section 13 or 15(d) of the Securities Exchange Act of 1934 during the preceding 12 months (or for such shorter period that the registrant was required to file such reports), and (2) has been subject to such filing requirements for the past 90 days. Yes ☑ No☐
Indicate by check mark whether the registrant has submitted electronically every Interactive Data File required to be submitted pursuant to Rule 405 of Regulation S-T during the preceding 12 months (or for such shorter period that the registrant was required to submit such files.) Yes ☑ No ☐
Indicate by check mark whether the registrant is a large accelerated filer, an accelerated filer, a non-accelerated filer, a smaller reporting company, or an emerging growth company. See the definitions of “large accelerated filer”, “accelerated filer”, “smaller reporting company”, and “emerging growth company” in Rule 12b-2 of the Exchange Act.
| | | | | | |
Large accelerated filer |
| ☒ |
| Accelerated filer |
| ☐ |
Non-accelerated filer |
| ☐ |
| Smaller reporting company |
| ☐ |
Emerging growth company | | ☐ | | | | |
If an emerging growth company, indicate by check mark if the registrant has elected not to use the extended transition period for complying with any new or revised financial accounting standards provided pursuant to Section 13(a) of the Exchange Act. ☐
Indicate by check mark whether the registrant has filed a report on and attestation to its management’s assessment of the effectiveness of its internal control over financial reporting under Section 404(b) of the Sarbanes-Oxley Act (15 U.S.C. 7262(b)) by the registered public accounting firm that prepared or issued its audit report. ☒
If securities are registered pursuant to Section 12(b) of the Act, indicate by check mark whether the financial statements of the registrant included in the filing reflect the correction of an error to previously issued financial statements. ☐
Indicate by check mark whether any of those error corrections are restatements that required a recovery analysis of incentive-based compensation received by any of the registrant’s executive officers during the relevant recovery period pursuant to § 240.10D-1(b). ☐
Indicate by check mark whether the registrant is a shell company (as defined in Rule 12b-2 of the Act). YES ☐ NO ☑
As of June 30, 2024, the aggregate market value of the common stock of the registrant held by non-affiliates of the registrant was approximately $66.86 billion.
As of December 31, 2024, the number of shares of common stock outstanding was 1,400,850,420.
DOCUMENTS INCORPORATED BY REFERENCE
Certain information required to be furnished pursuant to Part III of this Form 10-K is set forth in, and is incorporated by reference from, the registrant’s definitive proxy statement for its 2025 Annual General Meeting of Shareholders, to be filed by the registrant with the Securities and Exchange Commission (“SEC”) pursuant to Regulation 14A within 120 days after December 31, 2024 (the “2025 Proxy Statement”).
SCHLUMBERGER LIMITED
Table of Contents
Form 10-K
PART I
Item 1. Business.
All references in this report to “Registrant,” “Company,” “SLB,” “we” or “our” are to Schlumberger Limited (Schlumberger N.V.) and its consolidated subsidiaries.
We are SLB, a global technology company driving energy innovation for a balanced planet. With a global presence in more than 100 countries and employees representing almost twice as many nationalities, we work each day on innovating energy technology, delivering digital at scale, decarbonizing industries, and developing and scaling new energy systems that accelerate the energy transition.
Today, the world faces the challenge of providing secure and affordable energy to meet growing demand, while rapidly decarbonizing for a sustainable future. With nearly a century of market and technology leadership, SLB is well positioned and committed to being a leader in providing solutions to address this trilemma.
In October 2022, we changed our brand name to SLB and unveiled a new logo that underscores our vision for a decarbonized energy future. This bold change highlighted our leadership as a global technology company focused on driving energy innovation within traditional energy sources and beyond. The SLB brand builds on nearly a century of technology innovation and industrialization. Our identity symbolizes SLB's commitment to moving farther and faster in facilitating the world's energy needs today and forging the road ahead for a sustainable future.
SLB is organized under four Divisions that combine and integrate SLB’s technologies, enhancing our ability to support the emerging long-term growth opportunities in each of these market segments. The four Divisions are:
Digital & Integration – Combines SLB’s industry-leading digital solutions and data products with its integrated offering of Asset Performance Solutions (“APS”). This Division enables greater performance for our customers by reducing cycle times and risk, accelerating returns, increasing productivity, and lowering costs and carbon emissions.
The primary offerings comprising this Division are:
•Digital Solutions: Includes products, services, and solutions that span the energy value chain from subsurface characterization through field development and hydrocarbon production to carbon management and the integration of adjacent energy systems. Offerings are founded upon proprietary and open-source data platform technologies, industry-leading simulators, and workflow tools, and include domain-specific application of innovative digital capabilities, such as artificial intelligence ("AI") and machine learning. Solutions are deployable on traditional on-premise IT infrastructures, the cloud, and the edge, allowing for full market coverage irrespective of customer constraints. Digital Solutions also provides comprehensive reservoir interpretation and data processing services, enabled by a scientifically advanced platform and innovative subsurface imaging techniques for exploration data, and includes one of the industry’s most extensive exploration data libraries.
•Asset Performance Solutions: Offers an integrated business model for field production projects. Combines SLB’s services and products with drilling rig management and specialized engineering and project management expertise, to provide a complete solution from well construction to production improvement. As of December 31, 2024, SLB’s APS portfolio primarily consisted of three field production projects in Ecuador and one in Canada.
Reservoir Performance – Consists of reservoir-centric technologies and services that are critical to optimizing reservoir productivity and performance. Reservoir Performance develops and deploys innovative technologies and services to evaluate, intervene, and stimulate reservoirs providing customers with greater insights into their assets and maximizing their return on investment.
The primary offerings comprising this Division are:
•Evaluation: Provides the measurement, interpretation, and insights necessary to understand the subsurface geology and fluids through wireline logging, downhole testing and rock and fluid analysis services.
•Stimulation: Provides services to restore or enhance well productivity through hydraulic fracturing, matrix stimulation, and water treatment.
•Intervention: Provides a comprehensive approach to oil and gas operators to increase their intervention success rates and maximize recovery from brownfields through cased hole wireline and perforations, coiled-tubing interventions, slickline, and reservoir monitoring.
Well Construction – Combines the full portfolio of products and services to optimize well placement and performance, maximize drilling efficiency, and improve wellbore assurance. Well Construction provides operators and drilling rig manufacturers with services and products related to the design and construction of a well.
The primary offerings comprising this Division are:
•Measurements: Provides services and associated engineering support for mud logging for geological and drilling surveillance, directional drilling, measurement-while-drilling, and logging-while-drilling services for all well profiles.
•Drilling Fluids: Supplies individually engineered drilling fluid systems that improve drilling performance and maintain well control and wellbore stability throughout drilling operations as well as products and services that secure and protect well casings while isolating fluid zones and maximizing wellbore activity.
•Equipment: Provides drilling equipment, including pressure control equipment and rotary drilling equipment, and services for drilling contractors, operators, and rental tool companies, and shipyards as well as land drilling rigs and related services.
•Drilling: Designs, manufactures, and markets roller cone and fixed cutter drill bits for all drilling environments, as well as a wide variety of bottomhole assembly and borehole enlargement technologies for drilling operations.
•Integrated Well Construction: Provides integrated solutions to construct or change the architecture of wells, including well planning, well drilling (including autonomous drilling), engineering, supervision, logistics, procurement and contracting of third parties, and drilling rig management.
Production Systems – Develops technologies and provides expertise that enhances production and recovery from subsurface reservoirs to the surface, into pipelines, and to refineries. Production Systems provides a comprehensive portfolio of equipment and services including subsurface production systems, subsea and surface equipment and services, and midstream production systems.
The primary offerings comprising this Division are:
•Subsea Production Systems: Through its OneSubsea™ joint venture, provides integrated solutions, products, systems, and services for the subsea market, including wellheads, subsea trees, manifolds and flowline connectors, control systems, connectors and services designed to maximize reservoir recovery and extend the life of each field.
•Artificial Lift: Provides lifting solutions using electrical submersible pumps, gas lift equipment, progressing cavity pumps, and surface horizontal pumping systems.
•Completions: Supplies well completion services and equipment that includes packers, safety valves, and sand control technology, as well as a range of intelligent systems that enable real-time visibility and performance monitoring.
•Surface Production Systems: Designs and manufactures onshore and offshore systems including wellheads, valves, chokes, actuators, and surface trees, and provides fracturing and flow back services to operators.
•Midstream Production Systems: Enables efficient monetization of subsurface assets using standard and custom-designed onshore, offshore, and downstream processing and chemical treatment systems, as well as unique, reservoir-driven, fit-for-purpose integrated production systems for accelerating first production and maximizing project economics.
•Valves: Serves the upstream, midstream, and downstream markets with a broad portfolio of valves that are primarily used to control and direct the flow of hydrocarbons as they are moved from wellheads through flow lines, gathering lines, and transmission systems to refineries, petrochemical plants, and industrial centers for processing.
SLB's four Divisions operate through a geographical structure of four Basins that are aligned with critical concentrations of activity: Americas Land, Offshore Atlantic, Middle East & North Africa, and Asia. The Basins are configured around common regional characteristics that enable us to deploy fit-for-purpose technologies, operating models, and skills to meet the specific customer needs in each Basin. The Basins are further organized into GeoUnits, which can be a region, a single country, or comprise several countries. With a strong focus on customers, the Basins identify opportunities for growth, and are focused on agility, responsiveness, and competitiveness.
Supporting the Divisions is a global network of research and development centers. Through these centers we advance SLB’s technology programs to enhance industry efficiency, lower finding and producing costs, improve productivity, maximize reserve recovery, and increase asset value safely, securely, and sustainably. These centers also support SLB's investments in lower carbon energy sources and carbon capture technologies.
ChampionX Transaction
On April 2, 2024, SLB announced a definitive agreement to purchase ChampionX Corporation ("ChampionX") in an all-stock transaction. ChampionX is a global leader in chemistry solutions, artificial lift systems, and highly engineered equipment and technologies that help companies drill for and produce oil and gas safely, efficiently, and sustainably around the world. Under the terms of the agreement, ChampionX shareholders will receive 0.735 shares of SLB common stock in exchange for each ChampionX share. At the closing of the transaction ChampionX shareholders will own approximately 9% of SLB's outstanding shares of common stock. ChampionX reported revenue of approximately $2.7 billion for the nine months ended September 30, 2024. The transaction, which is subject to regulatory approvals and other customary closing conditions, received the approval of the ChampionX stockholders at a special meeting held on June 18, 2024. It is anticipated that the transaction will close in the first quarter of 2025.
Corporate Strategy
The evolving marketplace will require bold new technologies and ideas, digital transformation and a deep commitment to sustainability. With a balanced energy transition in mind, our strategy is focused on three engines of growth: Core, Digital, and New Energy.
Core
Consisting of our Reservoir Performance, WeIl Construction and Production Systems Divisions, Core remains SLB’s largest engine of growth. Building on decades of technology advancement, we will continue innovating new products, services and technologies that make the exploration, development and production of oil and gas assets cleaner, more cost effective, and more efficient, with lower carbon emissions and less impact on the environment.
We continue to build on our fit-for-basin approach and technology access initiatives, developing bespoke and custom technology tailored to the regions and environments in which we operate. This strategy allows us to address the rapid evolution of our industry into more regional markets, each with distinct resource plays and economics.
With the continued growth of digitally enabled technologies that improve efficiency and performance, including our Transition Technologies™ portfolio and our SLB End-to-end Emissions Solutions (SEES) methane elimination business, SLB provides solutions that enable customers to increase production from their reserves at a competitive cost and at a lower carbon intensity per barrel equivalent.
Digital
Digital capabilities continue to grow throughout the energy industry as a key element of the complex systems required to meet current energy demand, improve efficiency and to harness the promise of a lower-carbon future. SLB is uniquely positioned to support customers on their digital journeys by providing an offering which spans planning and operational workflows, underpinned by a data platform which allows customers to realize efficiency gains through AI.
SLB’s customers have access to leading digital products that help to meet their sustainability goals by driving transparency, better measurement, more effective planning, and more impactful and reliable outcomes. To continue elevating customer offerings, we are accelerating the adoption of our proprietary Delfi™ offering, an open, scalable, and secure cloud-based software environment.
Our cloud-based solutions allow our customers to transition from our established software applications to our Delfi digital platform, and shift from a user-based license model to software-as-a-service (SaaS) subscriptions. This enables customers to evolve from legacy infrastructure and deliver new levels of value creation, with access to key resources such as storage and increased computing power from our cloud partners and our industry-leading simulators. Our evolving offering of on-premises solutions allows us to support the digital transition journey of customers that prefer or are required to maintain data solutions locally.
Through our LumiTM data and AI platform, we also enable data-driven decision making for our customers across the energy industry. Data from a wide variety of sources across the subsurface and operations value chain can be accessed, facilitating AI-driven decision making at scale. The platform can connect diverse industry data sources, inclusive of on-premises data platforms and customer data infrastructure.
We are also focused on using digital technology to enhance operational performance for our customers. Our software products sold directly to customers, which are agnostic to equipment provider, enable automation and autonomy to reduce cost and improve performance. However, we also provide digital services to enhance the SLB equipment and service offering in our Core Divisions. Many of these services use embedded AI to automate insights and differentiate our service delivery offering.
New Energy
New Energy offers a significant opportunity to use SLB’s experience and scale to drive innovation for a low-carbon economy spanning industries beyond oil and gas. We are building a broad, diverse portfolio across New Energy sectors, selected for their materiality and adjacency to existing SLB strengths and our ability to offer differentiated technology.
Our New Energy portfolio builds on several fundamental SLB strengths: our unique subsurface domain expertise, applicable beyond oil and gas; our ability to design and deploy complex processing and production systems as an original equipment manufacturer; our differentiated track record for innovation and industrialization; and our ability to deploy at scale in any region of the world with local knowledge and talent.
SLB will continue building businesses and forging partnerships across various industries to focus on three key areas: Industrial Decarbonization, Renewables and Energy Efficiency, and Critical Minerals.
Industrial Decarbonization focuses on providing technology and business solutions in the field of carbon capture and sequestration (“CCS”) and low-carbon hydrogen for hard-to-abate industries.
•SLB has been in the CCS business for more than three decades and is actively progressing technologies to enable widespread adoption of CCS at scale. Our expertise extends beyond subsurface characterization and well construction to include capture technology, project economics, technology selection, and permitting. This includes the recent establishment of SLB Capturi, offering a modular product platform of industrial-scale carbon capture solutions. In addition, SLB is developing digital platforms to support emissions management for carbon and methane that will allow clients to measure, monitor, and plan abatement strategies.
•SLB has also invested in Genvia, a unique private-public partnership that combines SLB’s expertise and experience with that of the French Atomic Energy and Alternative Energies Commission and partners. Genvia aims to deliver the most efficient and cost-effective solid oxide electrolyzer technology for producing clean hydrogen in hard-to-abate industrial settings—a key component of the energy transition.
Renewables and Energy Efficiency refers to our technology and business solutions designed to enable renewable energy expansion and greater energy efficiency, with a focus on geothermal, geoenergy, and energy storage.
•Geothermal power leverages the heat of the earth to generate electricity or provide heat directly, by tapping into subsurface hot water and steam zones.
•Geoenergy uses the ambient temperatures beneath the earth's surface to act as a thermal battery and dramatically reduce energy consumption from heating and cooling buildings, driving both efficiency and decarbonization.
•Stationary energy storage is a key enabler to make variable renewable energy sources (such as solar or wind) a larger component of the world’s electricity systems enabling power to be delivered in the right place, at the right time, to meet demand. As renewables become a greater percentage of the energy mix, the need increases for additional long-duration energy storage to ensure the efficiency of renewable assets and the reliability of electricity systems.
Critical Minerals is a business area where SLB is applying its knowledge of extraction technologies and processing to the location and sourcing of critical minerals, such as lithium from brine deposits, which will be required to support the energy transition. An example of this is our demonstration plant in Clayton Valley, Nevada, which integrates direct lithium extraction, concentration and conversion technologies to more sustainably produce lithium at scale. This is achieved much faster than conventional methods, while using significantly less land, water and chemical reagents.
Sustainability
SLB’s emissions reduction strategy is at the center of our identity and vision, and our commitment to a sustainable future is underscored by bold science-backed targets aligned with the Paris Agreement. In 2021, SLB became the first company in the energy services industry to commit to a 2050 net-zero greenhouse gas (“GHG”) emissions target including all three emission scopes.
By setting targets based on SLB’s total 2019 baseline GHG footprint—inclusive of Scope 3 emissions (which accounted for approximately 95% of SLB’s baseline)—and not just its Scope 1 and 2 footprint, SLB’s comprehensive emissions reduction roadmap addresses the entire energy value chain.
SLB’s 2050 net-zero target is supported by the following interim milestones, using 2019 as the baseline year:
- by 2025, a 30% reduction in Scope 1 and Scope 2 emissions;
- by 2030, a 50% reduction in Scope 1 and Scope 2 emissions; and
- by 2030, a 30% reduction in Scope 3 emissions.
SLB’s Scope 1 and 2 emissions primarily come from fuel use and electricity consumption. SLB’s Scope 3 emissions are indirect, such as emissions from customers’ use of SLB technology and emissions from our use of third-party goods and services.
There are three key components to SLB achieving the 2050 net-zero target: reducing operational emissions, reducing customer emissions that occur while using SLB technology, and taking carbon-negative actions of sufficient scale to offset any residual operating and technology emissions that SLB may have in 2050.
In tandem with our 2050 net-zero commitment, SLB introduced a portfolio of Transition Technologies™ in 2021. This portfolio includes a select group of products and services that quantifiably reduce our customers’ GHG emissions footprint, while continuing to drive high performance, reliability, and efficiency. This portfolio is supported by an impact quantification framework and will continue to grow as sustainability is further embedded in SLB’s research and development process.
Human Capital
As a leading global technology company that operates in more than 100 countries with a workforce of approximately 110,000 people from diverse backgrounds, cultures, and nationalities, one of SLB’s greatest strengths is the diversity of our people. We believe that our ability to attract, develop, motivate, and retain a highly competent and diverse workforce has been paramount to our success for many decades. We recognize that cultivating diversity and promoting inclusion are essential to attracting the best talent from around the world and enabling creativity and innovation to drive business success. We believe our strong culture focused on workforce diversity, inclusivity, and learning and development results in the best possible working environment for all our people.
Workforce Diversity
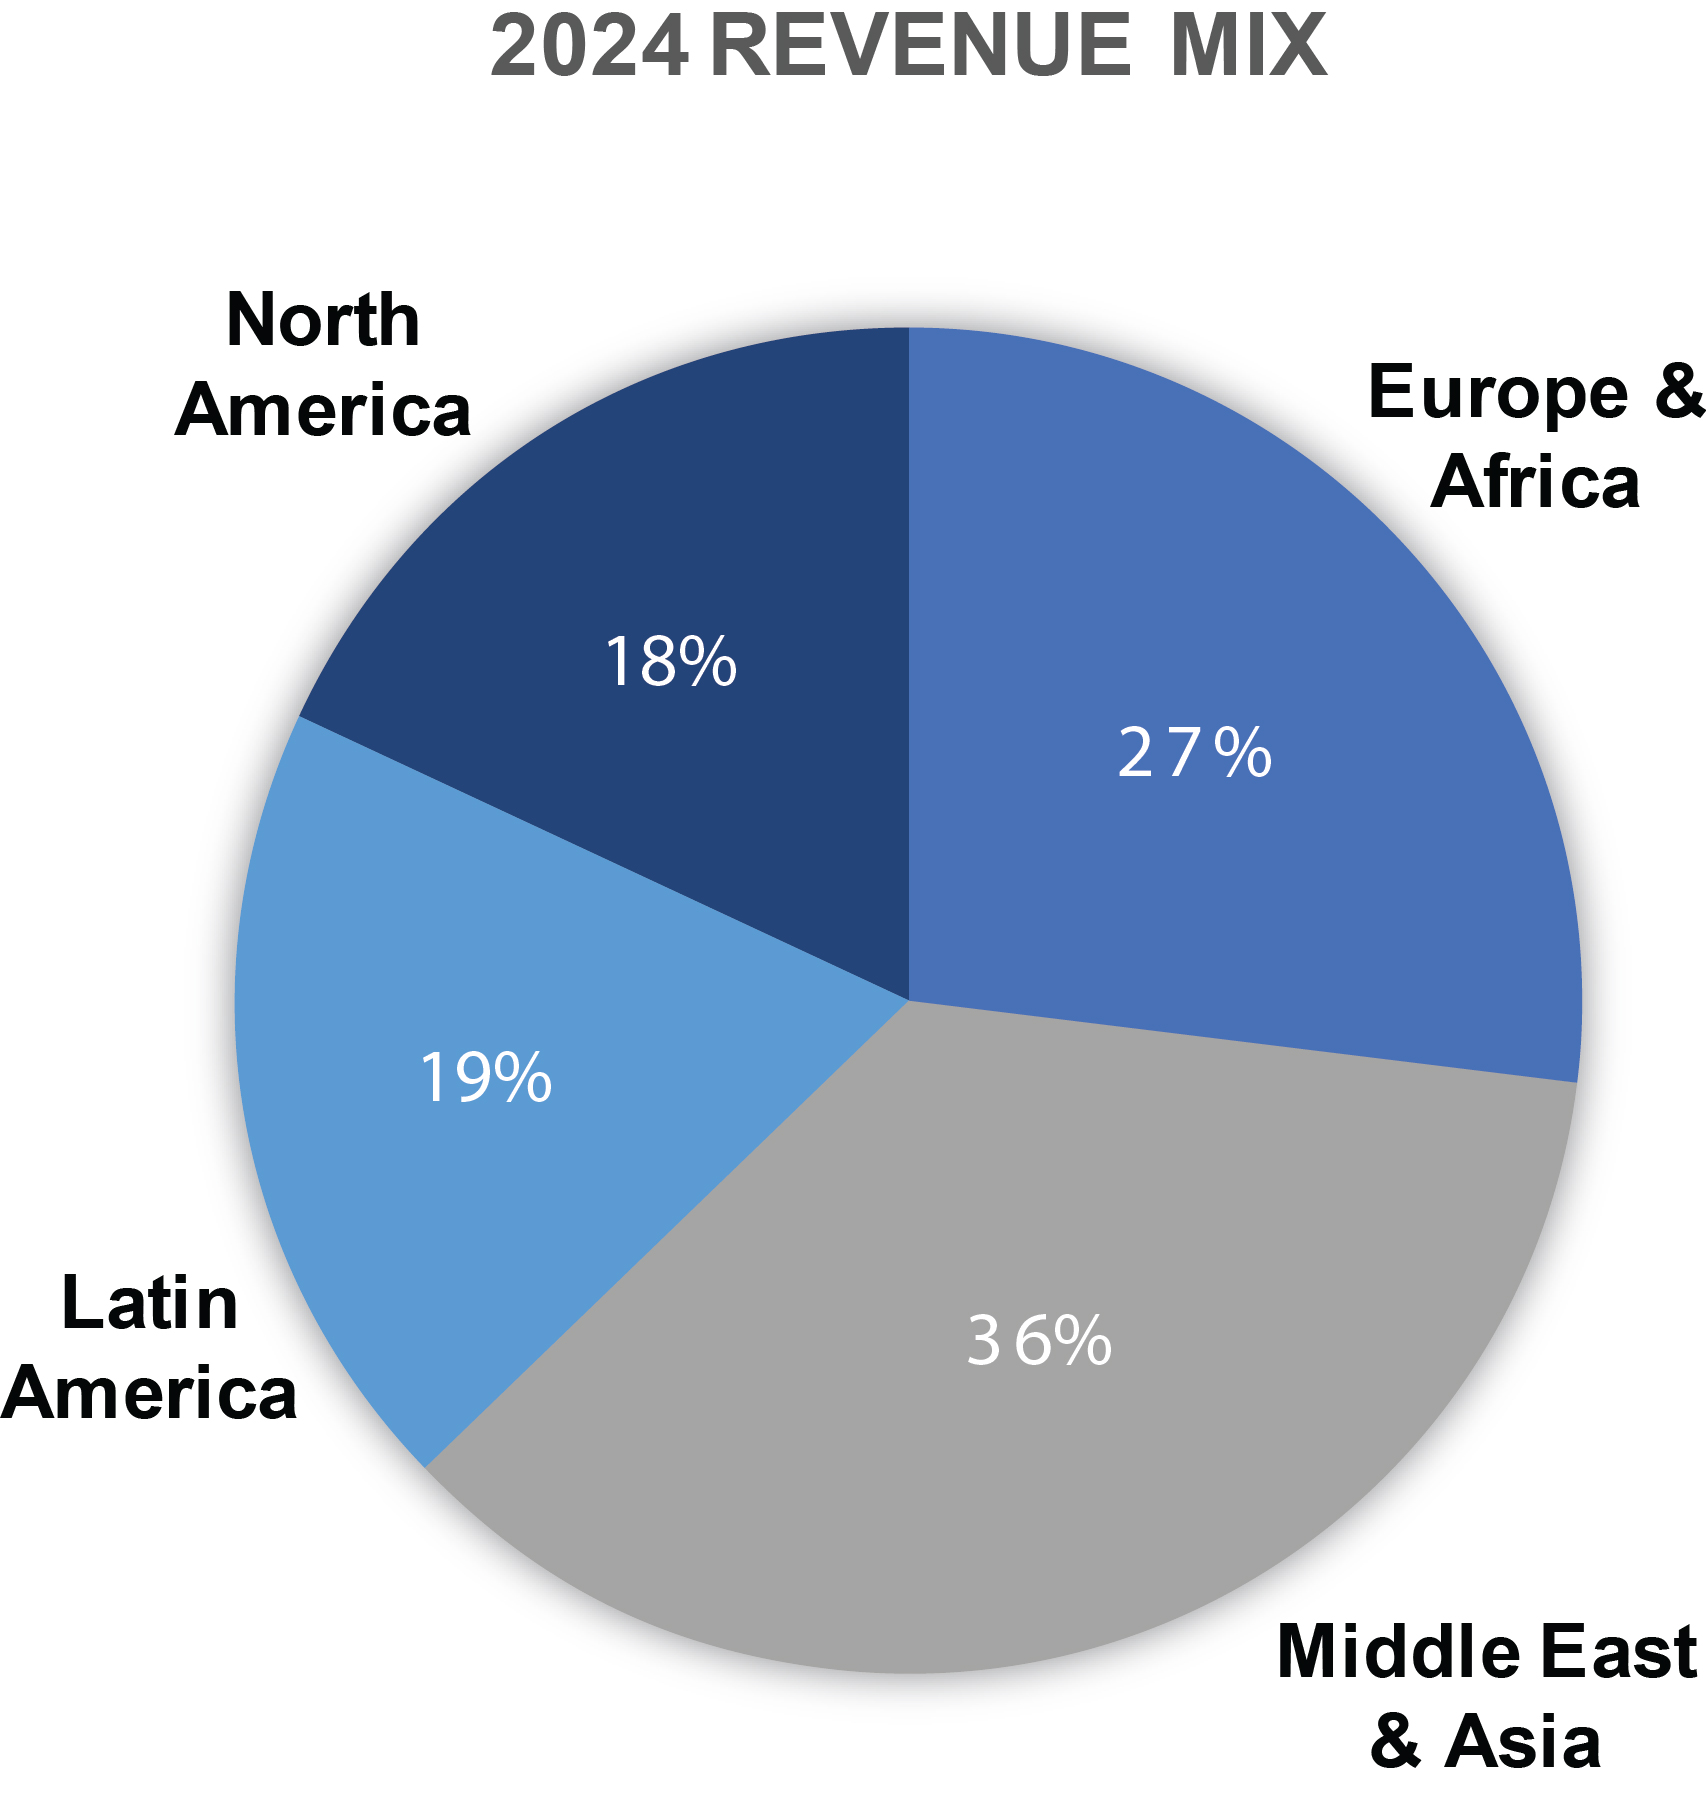
SLB's long-standing commitment to national and cultural diversity is reflected in our workforce composition and our philosophy to recruit and develop people from the communities in which we operate. Our workforce nationality mix generally aligns with the revenue derived from the countries in which we work, as reflected in the charts below. This fosters a culture that is global in outlook, yet local in practice.
SLB also recognizes the importance of gender diversity as a source of creativity, innovation, and competitive advantage. We are committed to leading our industry in this area and, in this regard, a number of years ago we established goals of having women represent 25% of our salaried workforce by 2025 and 30% by 2030. We reached our first milestone ahead of schedule, as women represented 25% of our salaried workforce as of December 31, 2024.
Inclusivity
We are building on our diversity to foster a strong culture of inclusion, in which each person can feel accepted, respected, and empowered to perform at their best. SLB has numerous global policies and programs to support our inclusive culture, including:
•a Code of Conduct that outlines the standards of behavior and ethics that all employees are expected to follow, and that prohibits any form of discrimination, harassment, or retaliation;
•a diversity, equity, and inclusion (“DEI”) strategy supported by a network of inclusion champions that promote DEI awareness and best practices; and
•a mobility program that enables employees to gain international exposure and experience and develop cross-cultural competencies.
Learning and Development
SLB invests significantly in the learning and development of our people. We encourage a growth mindset and provide opportunities to our people for continuous learning throughout their career. This investment allows us to accelerate personal development while maximizing performance, fostering an agile workforce with the skills necessary to lead SLB today and into the future.
SLB believes that through diversity, inclusivity, and growth mindset, we can support our people to reach their full potential, which unlocks value for all of our stakeholders.
Competition
The principal methods of competition within the energy services industry are technological innovation, quality of service, and price differentiation. These factors vary geographically and are dependent upon the different services and products that SLB offers. SLB has numerous competitors, both large and small.
Intellectual Property
SLB owns or controls one of the industry’s leading portfolios of intellectual property, including but not limited to patents, proprietary information, trade secrets, and software tools and applications that, in the aggregate, are material to SLB’s business. While SLB seeks and holds a significant number of patents covering various products and processes, no particular patent or group of patents is material to SLB’s business.
Seasonality
Seasonal changes in weather and significant weather events can temporarily affect the delivery of SLB’s products and services. For example, the spring thaw in Canada and other Northern climates and consequent road restrictions can affect activity levels, while the winter months in the North Sea, Russia, and China can produce severe weather conditions that can temporarily reduce levels of activity. In addition, hurricanes and typhoons can disrupt coastal and offshore operations. Furthermore, customer spending patterns for exploration data, software, and other products may result in higher activity in the fourth quarter of the year as clients seek to fully utilize their annual budgets. Conversely, customer budget constraints in North America may lead to lower demand for our services and products in the fourth quarter of the year.
Customers
SLB’s primary customers are national oil companies, large integrated oil companies, and independent operators. No single customer exceeded 10% of SLB's consolidated revenue during each of 2024, 2023, and 2022.
Governmental Regulations
SLB is subject to numerous environmental and other governmental and regulatory requirements related to its operations worldwide. For additional details, see “Item 1(a). Risk Factors – Legal and Regulatory Risks,” which is incorporated by reference in this Item 1.
Corporate Information
SLB was founded in 1926. Schlumberger Limited, the NYSE-listed parent of the SLB family of companies, is incorporated under the laws of Curaçao and has executive offices in Paris, Houston, London, and The Hague. The Company changed its brand name to SLB in 2022 but did not change the legal name of its listed parent company, which remains Schlumberger Limited.
Available Information
The SLB website is www.slb.com. SLB uses its Investor Relations website, https://investorcenter.slb.com/, as a routine channel for distribution of important information, including news releases, analyst presentations, and financial information. SLB makes available, free of charge through its Investor Relations website at https://investorcenter.slb.com/, access to its Annual Reports on Form 10-K, Quarterly Reports on Form 10-Q, Current Reports on Form 8-K, proxy statements and Forms 3, 4 and 5 filed on behalf of directors and executive officers, and amendments to each of those reports, as soon as reasonably practicable after such material is filed with or furnished to the SEC. Alternatively, you may access these reports at the SEC’s website at www.sec.gov. Copies are also available, without charge, from SLB Investor Relations, 5599 San Felipe, Houston, Texas 77056. Unless expressly noted, the information on its website or any other website is not incorporated by reference in this Form 10-K and should not be considered part of this Form 10-K or any other filing SLB makes with the SEC.
Information About Our Executive Officers
The following table sets forth, as of January 22, 2025, the names and ages of SLB’s executive officers, including all offices and positions held by each executive officer during the past five years.
| | |
Name | Age | Current Position and Five-Year Business Experience |
|
|
|
Olivier Le Peuch | 61 | Chief Executive Officer and Director, since August 2019. |
|
|
|
Khaled Al Mogharbel | 54 | Executive Vice President, Geographies, since July 2020; and Executive Vice President, Operations, April 2019 to June 2020. |
|
|
|
Stephane Biguet | 56 | Executive Vice President and Chief Financial Officer, since January 2020. |
|
|
|
Abdellah Merad | 51 | Executive Vice President, Core Services and Equipment, since April 2022; and Executive Vice President, Performance Management, May 2019 to March 2022. |
|
|
|
Demosthenis Pafitis | 57 | Chief Technology Officer, since February 2020; and Senior Vice President, SLB 4.0 Platforms, December 2017 to January 2020. |
|
|
|
Dianne Ralston | 58 | Chief Legal Officer, since December 2020, and Secretary, since April 2021; and Executive Vice President, Chief Legal Officer, and Secretary, TechnipFMC plc (a global oilfield services company), January 2017 to September 2020. |
|
|
|
Carmen Rando Bejar | 47 | Chief People Officer, since April 2022; and Vice President, Global Business Services, September 2019 to March 2022. |
|
|
|
Rakesh Jaggi | 55 | President, Digital and Integration, since April 2023; and Senior Vice President, Sales & Commercial, May 2019 to March 2023. |
| | |
|
|
|
Gavin Rennick | 50 | President, New Energy, since April 2022; and Vice President, Human Resources, February 2019 to March 2022. |
|
|
|
Kevin Fyfe | 51 | Vice President and Treasurer, since July 2022; and Vice President and Controller, October 2017 to June 2022. |
|
|
|
Howard Guild | 53 | Chief Accounting Officer, since July 2005. |
|
|
|
Ugo Prechner | 47 | Vice President and Controller, since August 2022; Well Construction Controller, July 2020 to July 2022; and Controller Operations, August 2019 to June 2020. |
|
|
|
Vijay Kasibhatla | 61 | Director, Mergers and Acquisitions, since January 2013. |
Item 1A. Risk Factors.
The following discussion of risk factors known to us contains important information for the understanding of our “forward-looking statements,” which are discussed immediately following Item 7A. of this Form 10-K and elsewhere. These risk factors should also be read in conjunction with Item 7. Management’s Discussion and Analysis of Financial Condition and Results of Operations, and the Consolidated Financial Statements and related notes included in Item 8. Financial Statements and Supplementary Data of this Form 10-K.
Please carefully consider the risks described below, which discuss the material factors that make an investment in our securities speculative or risky, other material included or incorporated by reference in this Form 10-K, and other reports and materials that we file with the SEC. Additional risks and uncertainties not currently known to us or that we currently deem immaterial could also materially adversely affect our business, reputation, financial condition, results of operations, cash flows and prospects.
Business and Operational Risks
Demand for our products and services is substantially dependent on the levels of expenditures by our customers, which can change based on many factors, including fluctuations in oil and gas prices. Oil and gas industry downturns have resulted in reduced demand for oilfield products and services and lower expenditures by our customers, which has in the past had, and may in the future have, a material adverse effect on our financial condition, results of operations and cash flows.
Demand for our products and services depends substantially on expenditures by our customers for the exploration, development and production of oil and gas reserves. These expenditures are generally dependent on our customers’ views of future demand for oil and gas and future oil and gas prices, as well as our customers’ ability to access capital. In addition, the transition of the global energy sector from a primarily fossil fuel-based system to a diverse system which includes renewable energy sources could affect our customers’ levels of expenditures.
Actual and anticipated declines in oil and gas prices have in the past resulted in, and may in the future result in, lower capital expenditures, project modifications, delays or cancellations, general business disruptions, and delays in payment of, or nonpayment of, amounts that are owed to us. These effects have had, and may in the future have, a material adverse effect on our financial condition, results of operations and cash flows.
Historically, oil and gas prices have experienced significant volatility and can be affected by a variety of factors, including:
•changes in the supply of and demand for hydrocarbons, which are affected by general economic and business conditions;
•the costs of exploring for, producing, and delivering oil and gas;
•the ability or willingness of the Organization of Petroleum Exporting Countries (OPEC) and the expanded alliance known as OPEC+ to set and maintain production levels for oil;
•the level of oil and gas exploration and production activity;
•the level of excess production capacity;
•the level of refining and storage capacity;
•the level of oil and gas inventories;
•access to potential resources;
•political and economic uncertainty and geopolitical unrest;
•governmental laws, policies, regulations, subsidies, and other actions, including initiatives to promote the use of renewable energy sources;
•speculation as to the future price of oil and the speculative trading of oil and gas futures contracts;
•technological advances affecting energy consumption; and
•extreme weather conditions, natural disasters, and public health or similar issues, such as pandemics and epidemics.
The oil and gas industry has historically experienced periodic downturns, which have been characterized by diminished demand for our products and services and downward pressure on the prices that we are able to charge. Sustained market uncertainty can also result in lower demand and pricing for our products and services. A significant industry downturn, sustained market uncertainty, or increased availability of economical alternative energy sources could result in a reduction in demand for our products and services, which could adversely affect our business, financial condition, results of operations, cash flows and prospects.
Disruptions in the political, regulatory, economic, and social environments of the countries in which we operate or globally could adversely affect our reputation, financial condition, results of operations and cash flows.
We are a global technology company, and our non-US operations accounted for approximately 85% of our consolidated revenue in 2024, and 84% in 2023 and 2022. Geopolitical instability and unforeseen changes in any of the markets in which we operate could result in business disruptions or operational challenges that may adversely affect the demand for our products and services, or our reputation, our financial condition, and our results of operations and cash flows. These factors include, but are not limited to, the following:
•uncertain or volatile political, social, and economic conditions;
•exposure to expropriation, nationalization, deprivation or confiscation of our assets or the assets of our customers, or other governmental actions;
•social unrest, acts of terrorism, war, or other armed conflict;
•confiscatory taxation or other adverse tax policies;
•theft of, or lack of sufficient legal protection for, proprietary technology and other intellectual property;
•deprivation of contract rights;
•trade and economic sanctions or other restrictions imposed by the European Union, the United States, the United Kingdom, China, or other regions or countries that could restrict or curtail our ability to operate in certain markets;
•local content and other similar regional requirements;
•unexpected changes in legal and regulatory requirements, including changes in interpretation or enforcement of existing laws;
•restrictions on the repatriation of income or capital;
•supply chain disruptions;
•currency exchange controls;
•currency exchange rate fluctuations and devaluations; and
As an example of a risk resulting from our global operations, in March 2022 we decided to immediately suspend new investment and technology deployment to our Russia operations. In July 2023, we announced that we were halting shipments of products into Russia from all our facilities worldwide in response to the continued expansion of international sanctions. Russia represented approximately 4% of our worldwide revenue during 2024. The carrying value of our net assets in Russia was approximately $0.6 billion as of December 31, 2024. This consisted of $0.1 billion of cash and short-term investments, $0.3 billion of receivables, $0.2 billion of fixed assets, $0.3 billion of other assets, and $0.3 billion of current liabilities.
We continue to actively monitor the dynamic situation in Russia and Ukraine and applicable laws, sanctions and trade control restrictions resulting from the conflict. The extent to which our reputation, operations, financial results and cash flows, including the ability to repatriate cash, may be affected by the ongoing conflict in Ukraine will depend on various factors, including the extent and duration of the conflict; the effects of the conflict on regional and global economic and geopolitical conditions; the effect of further laws, sanctions and trade control restrictions on our business, the global economy and global supply chains; and the impact of fluctuations in the exchange rate of the ruble. Continuation or escalation of the conflict may also exacerbate this and other risk factors identified in this Form 10-K, including cybersecurity, regulatory, and reputational risks.
Failure to effectively and timely address the energy transition could adversely affect our reputation, business, results of operations, and cash flows.
Our long-term success depends on our ability to effectively address the energy transition, which will require adapting our technology portfolio to changing customer preferences and government requirements, developing solutions to decarbonize oil and gas operations, and scaling innovative low-carbon and carbon-neutral technologies. If the energy transition landscape changes faster than anticipated or in a manner that we do not anticipate, demand for our products and services, as well as our relationships with various stakeholders, could be adversely affected. Furthermore, if we fail or are perceived to not effectively implement an energy transition strategy, or if investors or financial institutions shift funding away from companies in fossil fuel-related industries, our access to capital or the market for our securities could be negatively impacted.
Our operations are subject to cyber incidents that could have a material adverse effect on our reputation, business, financial condition, results of operations, and cash flows.
Our success depends in part on our ability to provide effective cybersecurity protection in connection with our digital technologies and services as well as our internal digital infrastructure. We operate information technology networks and systems for internal purposes that incorporate third-party software and technologies. We also connect to and exchange data with external networks that may be operated by our customers, suppliers, alliance partners, or other third parties. We provide digital technologies that allow us or our customers to remotely perform wellsite and field operations. We also develop software and other digital products and services that store, retrieve, manipulate, and manage our customers’ information and data, external data, personal data, and our own data.
Our digital technologies and services, as well as third-party products, services and technologies that we rely on (including emerging technologies, such as AI programs), are subject to the risk of cyberattacks and, given the nature of such attacks, some incidents can remain undetected for a period of time despite efforts to detect and respond to them in a timely manner. Cyberattacks are expected to accelerate on a global basis in both frequency and magnitude as threat actors are becoming increasingly sophisticated in using techniques and tools (including AI) that circumvent controls, evade detection and even remove forensic evidence of the infiltration. There can be no assurance that our cybersecurity risk management program, processes, or systems we have designed to prevent or limit the effects of cyber incidents or attacks will be sufficient to prevent or detect material consequences arising from such incidents or attacks, or to avoid a material adverse impact on our systems after such incidents or attacks do occur. We have experienced and will continue to experience varying degrees of cyber incidents in the normal conduct of our business, including attacks resulting from social engineering such as phishing and ransomware infections. Even if we successfully defend our own digital technologies and services, we also rely on providers of third-party products, services, and networks, with whom we may share data and services, and who may be unable to effectively defend their digital technologies and services against attack.
Unauthorized access to or modification of, or actions disabling our ability to obtain authorized access to, our customers’ data, other external data, personal data, or our own data, as a result of a cyber incident, attack or exploitation of a security vulnerability, or loss of
control of our clients’ operations could result in significant damage to our reputation or disruption of the services we provide to our customers or of our customers’ businesses. In addition, allegations, reports, or concerns regarding vulnerabilities affecting our digital products or services could damage our reputation. This could lead to fewer customers using our digital products and services, which could have a material adverse impact on our financial condition, results of operations, cash flows, and future prospects. In addition, if our systems or third-party products, services, and network systems for protecting against cybersecurity risks prove to be insufficient, we could be adversely affected by, among other things, loss of or damage to our intellectual property, proprietary or confidential information; loss of customer, supplier, or our employee data; breach of personal data; interruption of our business operations; disruption of our customers’ businesses; increased legal and regulatory exposure, including fines and remediation costs; and increased costs required to prevent, respond to, or mitigate cybersecurity attacks. These risks could harm our reputation and our relationships with our employees, our customers, our suppliers, our alliance partners and other third parties, and may result in claims against us.
We operate in a highly competitive environment. If we are unable to maintain technology leadership, this could adversely affect any competitive advantage we hold.
The energy industry is highly competitive and rapidly evolving. Our business may be adversely affected if we fail to continue developing and producing innovative technologies in response to changes in the market, including customer and government requirements, or if we fail to deliver such technologies to our customers in a timely and cost-competitive manner. If we are unable to maintain technology leadership in our industry, our ability to maintain market share, defend, maintain, or increase prices for our products and services, and negotiate acceptable contract terms with our customers could be adversely affected. Furthermore, competing or new technologies may accelerate the obsolescence of our products or services and reduce the value of our intellectual property.
Limitations on our ability to obtain, maintain, protect, or enforce our intellectual property rights, including our trade secrets, could cause a loss in revenue and any competitive advantage we hold.
There can be no assurance that the steps we take to obtain, maintain, protect, and enforce our intellectual property rights will be adequate. Some of our products or services, and the processes we use to produce or provide them, have been granted patent protection, have patent applications pending, or are trade secrets. Our business may be adversely affected when our patents are unenforceable, the claims allowed under our patents are not sufficient to protect our technology, our patent applications are denied, or our trade secrets are not adequately protected. Patent protection on some types of technology, such as software or machine learning processes, may not be available in certain countries in which we operate. Our competitors may also be able to develop technology independently that is similar to ours without infringing on our patents or gaining access to our trade secrets.
Third parties may claim that we have infringed upon or otherwise violated their intellectual property rights.
The tools, techniques, methodologies, programs, and components we use to provide our services and products may infringe upon or otherwise violate the intellectual property rights of others or be challenged on that basis. Regardless of the merits, any such claims generally result in significant legal and other costs, including reputational harm, and may distract management from running our business. Resolving such claims could increase our costs, including through royalty payments to acquire licenses, if available, from third parties and through the development of replacement technologies. If a license to resolve a claim were not available, we might not be able to continue providing a particular service or product.
Legal and Regulatory Risks
Our operations require us to comply with numerous laws and regulations, violations of which could have a material adverse effect on our reputation, financial condition, results of operations or cash flows.
Our operations are subject to international, regional, national, and local laws and regulations in every place where we operate, relating to matters such as environmental protection, health and safety, labor and employment, human rights, import/export controls, currency, emissions reporting, exchange, bribery and corruption, anti-money laundering, data privacy and cybersecurity, intellectual property, immigration, antitrust, and taxation. These laws and regulations are complex, frequently change, have tended to become more stringent over time, and could conflict among one another. In the event the scope of these laws and regulations expands in the future, the incremental cost of compliance could adversely affect our financial condition, results of operations, or cash flows.
Our operations are subject to anti-corruption and anti-bribery laws and regulations, such as the Foreign Corrupt Practices Act, the UK Bribery Act, and other similar laws. We are also subject to trade control regulations and trade sanctions laws that restrict the movement of certain goods to, and certain operations in, various countries or with certain persons. Our ability to transfer people, products, and data among certain countries is subject to maintaining required licenses and complying with these laws and regulations.
The internal controls, policies and procedures, and employee training and compliance programs we have implemented to deter prohibited practices may not be effective in preventing employees, contractors, or agents from violating or circumventing such internal policies or from material violations of applicable laws and regulations. Any determination that we have violated or are responsible for violations of applicable laws, including securities, environmental, trade control, trade sanctions, or anti-corruption laws, could have a material adverse effect on our financial condition. Violations of international and US laws and regulations or the loss of any required licenses may result in fines and penalties, criminal sanctions, administrative remedies, or restrictions on business conduct, and could have a material adverse effect on our business, operations, and financial condition. In addition, any major violations could have a significant effect on our reputation and consequently on our ability to win future business and maintain existing customer and supplier relationships.
Existing or future laws, regulations, court orders or other public- or private-sector initiatives to limit greenhouse gas emissions or relating to climate change may reduce demand for our products and services.
Continuing political and social attention to the issue of climate change has resulted in both existing and proposed international agreements and national, regional, and local legislation and regulatory measures to limit GHG emissions and mitigate the effects of climate change. The implementation of these agreements, including the Paris Agreement, the Europe Climate Law, and other existing or future regulatory mandates, may adversely affect the demand for our products and services, impose taxes on us or our customers, require us or our customers to reduce GHG emissions from our technologies or operations, or accelerate the obsolescence of our products or services.
In addition, increasing attention to the risks of climate change has resulted in an increased possibility of litigation or investigations brought by public and private entities against oil and gas companies in connection with their GHG emissions, as well as descriptions of their sustainable products and services. As a result, we or our customers may become subject to court orders compelling a reduction of GHG emissions or requiring mitigation of the effects of climate change, or requiring other mitigation actions.
There is also increased focus by our customers, investors and other stakeholders on climate change, sustainability, and energy transition matters. Actions to address these concerns or negative perceptions of our industry or fossil fuel products and their relationship to the environment have led to initiatives to conserve energy and promote the use of alternative energy sources, which may reduce the demand for and production of oil and gas in areas of the world where our customers operate, and thus reduce future demand for our products and services. In addition, initiatives by investors and financial institutions to limit funding to companies in fossil fuel-related industries may adversely affect our liquidity or access to capital. Any of these initiatives may, in turn, adversely affect our financial condition, results of operations, and cash flows.
Environmental compliance costs and liabilities arising as a result of environmental laws and regulations could have a material adverse effect on our business, financial condition, results of operations, and cash flows.
We are subject to numerous laws and regulations relating to environmental protection, including those governing GHG and other air emissions, water discharges and waste management, as well as the importation and use of hazardous materials, radioactive materials, chemicals, and explosives. The technical requirements of these laws and regulations are becoming increasingly complex, stringent, and expensive to implement. These laws sometimes provide for “strict liability” for remediation costs, damages to natural resources or threats to public health and safety. Strict liability can render us liable for damages without regard to our degree of care or fault. Some environmental laws provide for joint and several strict liability for remediation of spills and releases of hazardous substances, and, as a result, we could be liable for the actions of others.
We use and generate hazardous substances and wastes in our operations. In addition, many of our current and former properties are, or have been, used for industrial purposes. Accordingly, we could become subject to material liabilities relating to the investigation and cleanup of potentially contaminated properties, and to claims alleging personal injury or property damage as a result of exposures to, or releases of, hazardous substances. In addition, stricter enforcement or changing interpretations of existing laws and regulations, the enactment of new laws and regulations, the discovery of previously unknown contamination, or the imposition of new or increased requirements could require us to incur costs or become the basis for new or increased liabilities that could have a material adverse effect on our business, operations, and financial condition.
We could be subject to substantial liability claims, including as a result of well incidents, which could adversely affect our reputation, financial condition, results of operations, and cash flows.
The technical complexities of our operations expose us to a wide range of significant health, safety, and environmental risks. Our operations involve the use of radioactive materials, chemicals, explosives and other equipment and services that are deployed in challenging exploration, development, and production environments. Accidents or acts of malfeasance involving these services (including remotely operated services) or equipment, or a failure of a product or service (including as a result of a cyberattack), could cause personal injury, loss of life, damage to or destruction of property, equipment or the environment, or suspension of operations, which could materially adversely affect us. Any well incidents, including blowouts at a well site or any loss of containment or well control, may expose us to additional liabilities, which could be material. Generally, we rely on contractual indemnities, releases, and limitations on liability with our customers and insurance to protect us from potential liability related to such events. However, our insurance may not protect us against liability for certain kinds of events, including events involving pollution, or against losses resulting from business interruption. Moreover, we may not be able to maintain insurance at levels of risk coverage or policy limits that we deem adequate. Any damages caused by our services or products that are not covered by insurance or are in excess of policy limits or subject to substantial deductibles, could adversely affect our financial condition, results of operations, and cash flows.
Risks Related to the Proposed Acquisition of ChampionX
We may be unable to complete the proposed acquisition of ChampionX.
We or ChampionX may terminate the merger agreement between the parties (the “merger agreement”) in certain circumstances as described in our Current Report on Form 8-K filed with the SEC on April 2, 2024. If the proposed acquisition is not completed for any reason, including as a result of failure to obtain required regulatory approvals, the market price of our common stock may be adversely affected; we may experience negative reactions from the financial markets, customers, suppliers and other constituencies; we will be required to pay certain costs relating to the acquisition; and we may be required to pay a termination fee under certain circumstances set forth in the merger agreement.
We may fail to realize the anticipated benefits of the proposed acquisition of ChampionX.
If the acquisition is completed, the success of the acquisition will depend on, among other things, our ability to combine our business with that of ChampionX in a manner that facilitates growth opportunities and realizes anticipated synergies. If we are not able to successfully achieve these objectives, the anticipated benefits of the acquisition may not be realized fully, or at all, or may take longer to realize than expected.
General Risk Factors
Our aspirations, goals, and initiatives related to sustainability and emissions reduction, and our public statements and disclosures regarding them, expose us to numerous risks.
We have developed, and will continue to develop and set, goals, targets, and other objectives related to sustainability matters, including our net-zero emissions target and our energy transition strategy. Statements related to these goals, targets, and objectives reflect our current plans and aspirations and do not constitute a guarantee that they will be achieved. Our efforts to research, establish, accomplish, and accurately report on these goals, targets, and objectives expose us to numerous operational, reputational, financial, legal, and other risks. Our ability to achieve any stated goal, target, or objective, including with respect to emissions reduction, is subject to numerous factors and conditions, some of which are outside of our control. Our targets are based on empirical data and estimates that reflect our understanding of current best practices for measuring or estimating emissions or other metrics, but we anticipate that future innovations in both measurement technologies and estimation methodologies could cause us to revise our baseline as well as re-calculate progress toward our targets.
Our business faces increased scrutiny from certain investors and other stakeholders related to our sustainability activities, including the goals, targets, and objectives that we announce, and our methodologies and timelines for pursuing them. If our sustainability practices do not meet investor or other stakeholder expectations and standards, including any third-party ratings used by stakeholders, which continue to evolve, our reputation, our ability to attract or retain employees, our ability to access capital, and our attractiveness as an investment or business partner could be negatively affected. Similarly, our failure or perceived failure to pursue or fulfill our sustainability-focused goals, targets, and objectives, to comply with ethical, environmental, or other standards, regulations, or expectations, or to satisfy various reporting standards with respect to these matters, within the timelines we announce, or at all, could adversely affect our business or reputation, as well as expose us to government enforcement actions and private litigation.
Failure to attract and retain qualified personnel could impede our operations.
Our future success depends on our ability to recruit, train, and retain qualified personnel. We require highly skilled personnel to operate and provide technical services and support for our business. Competition for the personnel necessary for our businesses intensifies as activity increases, technology evolves and customer demands change. In periods of high utilization, it is often more difficult to find and retain qualified individuals. This could increase our costs or have other material adverse effects on our operations.
Severe weather events, including extreme weather conditions associated with climate change, have in the past and may in the future adversely affect our operations and financial results.
Our business has been, and in the future will be, affected by severe weather events in areas where we operate, which could materially affect our operations and financial results. Extreme weather conditions such as hurricanes, flooding, landslides, and heat waves have in the past resulted in, and may in the future result in, the evacuation of personnel, stoppage of services and activity disruptions at our facilities, in our supply chain, or at well-sites, or result in disruptions to our customers’ operations. Particularly severe weather events affecting platforms or structures may result in a suspension of activities. Climate change may impact the frequency and/or intensity of such events. In addition, acute or chronic physical impacts of climate change, such as sea level rise, coastal storm surge, inland flooding from intense rainfall, and hurricane-strength winds may damage our facilities. Any such extreme weather events may result in increased operating costs or decreases in revenue.
None.
Item 1C. Cybersecurity.
SLB maintains a cyber risk management program designed to identify, assess, manage, mitigate, and respond to cybersecurity threats. This program is integrated within the Company’s enterprise risk management system and addresses both the corporate information technology environment and customer-facing products and services.
The underlying controls of the cyber risk management program are based on recognized best practices and standards for cybersecurity and information technology, including the National Institute of Standards and Technology (“NIST”) Cybersecurity Framework (“CSF”) and the International Organization Standardization (“ISO”) 27001 Information Security Management System Requirements. SLB has an annual assessment, performed by a third party, of the Company’s cyber risk management program against the NIST CSF.
SLB has a Cybersecurity Operations Center operating in three locations to provide 24/7 monitoring of its global cybersecurity environment and to coordinate the investigation and remediation of alerts. A program for staging incident response drills is in place to prepare support teams in the event of a significant incident.
Cyber partners are a key part of SLB’s cybersecurity infrastructure. SLB partners with leading cybersecurity companies and organizations, leveraging third-party technology and expertise. SLB engages with these partners to monitor and maintain the performance and effectiveness of products and services that are deployed in SLB’s environment as well as, if necessary, assist in responding to cyber attacks.
SLB’s Cybersecurity Director reports to SLB’s Chief Information Officer and is the head of the Company’s cybersecurity team. The Cyber Security Director is responsible for assessing and managing SLB’s cyber risk management program, informs senior management regarding the prevention, detection, mitigation, and remediation of cybersecurity incidents and supervises such efforts. The cybersecurity team has decades of experience selecting, deploying, and operating cybersecurity technologies, initiatives, and processes around the world, and relies on threat intelligence as well as other information obtained from governmental, public, and private sources, including external consultants engaged by SLB.
The Audit Committee of the Board of Directors oversees SLB’s cybersecurity risk exposures and the steps taken by management to monitor and mitigate cybersecurity risks. The cybersecurity team briefs the Audit Committee on the effectiveness of SLB’s cyber risk management program, typically on a quarterly basis. In addition, cybersecurity risks are reviewed by the SLB Board of Directors, at least annually, as part of the Company’s enterprise risk management process.
SLB faces risks from cybersecurity threats that could have a material adverse effect on its business, financial condition, results of operations, cash flows or reputation. SLB has experienced, and will continue to experience, cyber incidents in the normal course of its business. However, prior cybersecurity incidents have not had a material adverse effect on SLB’s business, financial condition, results of operations, or cash flows. See “Risk Factors – Business and Operational Risks – Our operations are subject to cyber incidents that could have a material adverse effect on our reputation, business, financial condition, results of operations, and cash flows.”
Item 2. Properties.
SLB owns or leases numerous manufacturing facilities, administrative offices, service centers, research centers, data processing centers, mines, and other facilities throughout the world, none of which are individually material.
Item 3. Legal Proceedings.
The information with respect to this Item 3. Legal Proceedings is set forth in Note 15 – Contingencies, in the accompanying Consolidated Financial Statements.
Item 4. Mine Safety Disclosures.
Information concerning mine safety violations or other regulatory matters required by section 1503(a) of the Dodd-Frank Wall Street Reform and Consumer Protection Act and Item 104 of Regulation S-K is included in Exhibit 95 to this Form 10-K.
PART II
Item 5. Market for Registrant’s Common Equity, Related Stockholder Matters and Issuer Purchases of Equity Securities.
As of December 31, 2024, there were 20,762 stockholders of record. The principal US market for SLB’s common stock is the New York Stock Exchange (“NYSE”), where it is traded under the symbol “SLB.”
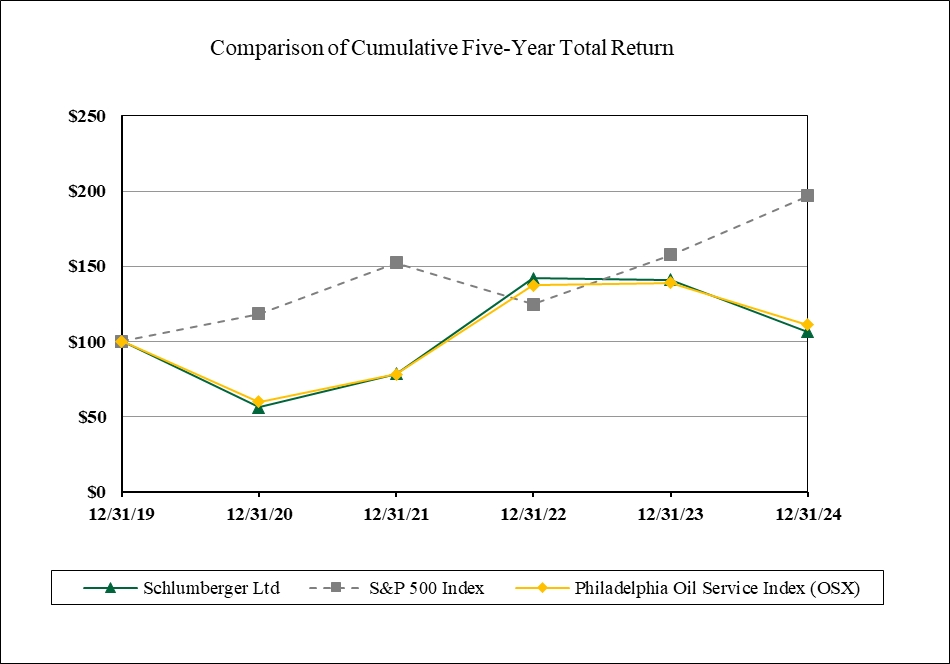
The following graph compares the cumulative total stockholder return on SLB common stock with the cumulative total return on the Standard & Poor’s 500 Index (“S&P 500 Index”) and the cumulative total return on the Philadelphia Oil Service Index. It assumes $100 was invested on December 31, 2019 in SLB common stock, in the S&P 500 Index and in the Philadelphia Oil Service Index, as well as the reinvestment of dividends on the last day of the month of payment. The stockholder return set forth below is not necessarily indicative of future performance. The following graph and related information shall not be deemed “soliciting material” or to be “filed” with the SEC, nor shall such information be incorporated by reference into any future filing under the Securities Act of 1933, as amended, or the Securities Exchange Act of 1934, as amended, except to the extent that SLB specifically incorporates it by reference into such filing.
Comparison of Five-Year Cumulative Total Return Among
SLB Common Stock, the S&P 500 Index and the
Philadelphia Oil Service Index
Share Repurchases
On January 21, 2016, the SLB Board of Directors approved a $10 billion share repurchase program for SLB common stock. SLB cumulatively repurchased $3.5 billion of its common stock under this program as of December 31, 2024.
SLB's common stock repurchase program activity for the three months ended December 31, 2024 was as follows:
| | | | | | | | | | | | | | | |
| (Stated in thousands, except per share amounts) | |
| | | | | | | | | | | |
| Total number of shares purchased | |
| Average price paid per share | |
| Total number of shares purchased as part of publicly announced plans or programs | |
| Maximum value of shares that may yet be purchased under the plans or programs | |
October 2024 | | 5,545.1 | |
| $ | 42.80 | |
| | 5,545.1 | |
| $ | 6,805,195 | |
November 2024 | | 2,992.6 | |
| $ | 42.47 | |
| | 2,992.6 | |
| $ | 6,678,093 | |
December 2024 | | 3,221.6 | |
| $ | 42.45 | |
| | 3,221.6 | |
| $ | 6,541,326 | |
| | 11,759.3 | |
| $ | 42.62 | |
| | 11,759.3 | |
|
| |
Unregistered Sales of Equity Securities
None.
Item 6. [Reserved].
Item 7. Management’s Discussion and Analysis of Financial Condition and Results of Operations.
The following discussion and analysis contains forward-looking statements, including, without limitation, statements relating to our plans, strategies, objectives, expectations, intentions, and resources. Such forward-looking statements should be read in conjunction with our disclosures under “Item 1A. Risk Factors” of this Annual Report on Form 10-K.
This section of the Form 10-K generally discusses 2024 and 2023 items and year-to-year comparisons between 2024 and 2023. Discussions of 2022 items and year-to-year comparison between 2023 and 2022 that are not included in this Form 10-K can be found in “Management’s Discussion and Analysis of Financial Condition and Results of Operations” in Part II, Item 7 of SLB’s Annual Report on Form 10-K for the fiscal year ended December 31, 2023.
2024 Executive Overview
2024 was a strong year for SLB as we successfully navigated evolving market conditions to deliver revenue growth, margin expansion, and solid free cash flow. Year on year, revenue increased by 10% and pretax segment operating income grew by 12%, while we generated $6.6 billion in cash flow from operations and $4.0 billion in free cash flow, enabling us to return $3.3 billion to shareholders and reduce net debt by $571 million. These results demonstrate SLB’s ability to deliver consistent financial performance despite moderating upstream investment growth, driven by our global scale, unmatched digital offerings and ongoing focus on cost optimization.
Our full-year results were highlighted by 12% international revenue growth. This performance was led by the Middle East & Asia and Europe & Africa, which grew 18% and 13%, respectively. The Middle East & Asia achieved record revenues, while growth in Europe & Africa was bolstered by the Aker subsea business, which was acquired in the fourth quarter of 2023. Excluding this acquired business, international revenue increased 7% year over year, outperforming the rig count over the same period.
Our Core divisions — Reservoir Performance, Well Construction and Production Systems — delivered 9% revenue growth compared to the prior year, led by 24% growth in Production Systems, largely due to the subsea acquisition. Production Systems grew 9% organically due to double-digit increases in surface systems, completions and artificial lift. Reservoir Performance also delivered 9% growth, underpinned by strong stimulation and intervention activity in the production space.
Digital & Integration revenue increased 10% year on year, driven by 20% growth in digital, which reached $2.44 billion for the year. Accelerated adoption of our digital technologies marked a milestone year, highlighted by strategic collaborations with cross-industry leaders, the launch of the Lumi™ data and AI platform, new Performance Live™ centers to enable remote operations, and the achievement of fully autonomous drilling operations.
Our fit-for-basin approach, domain expertise and integration capabilities have established us as the performance partner of choice for addressing the operating challenges our customers face throughout the life cycle of their assets. As operators across the industry increasingly prioritize production and recovery, our strengths are more critical than ever. With the anticipated completion of our announced acquisition of ChampionX, we are set to further strengthen our production and recovery capabilities, enabling us to deliver even greater value to our customers. This strategic acquisition will also enhance the resilience of the SLB portfolio, providing some stability against the cycles in the years to come.
While upstream investment growth will remain subdued in the short term due to global oversupply, we anticipate that the oil supply imbalance will gradually abate. Global economic growth and a heightened focus on energy security, coupled with rising energy demand from AI and data centers will support the investment outlook for the oil and gas industry throughout the rest of the decade.
In our Core business, we are making unmatched contributions to the discovery, development and extraction of oil and gas reserves, fueling global energy supply. We have the leading offering in digital. And we are pursuing a meaningful opportunity in New Energy and decarbonization, where we have established a differentiated market position. Together, this is laying a strong foundation for our business.
Given our confidence in the business outlook and our ability to continue generating strong cash flows, in January 2025 our Board of Directors approved a 3.6% increase to our quarterly dividend. Additionally, we entered into accelerated share repurchase transactions to repurchase $2.3 billion of SLB common stock. This positions us to increase total return to shareholders, in the form of dividends and share repurchases, from $3.3 billion in 2024 to at least $4 billion in 2025.
Fourth Quarter 2024 Results
| | | | | | | | | | | | | | | |
| | | | (Stated in millions) | |
| | | | | | | | | | | |
| Fourth Quarter 2024 | |
| Third Quarter 2024 | |
| | | | Pretax | | | | | | Pretax | |
| Revenue | | | Income | | | Revenue | | | Income | |
Digital & Integration | $ | 1,156 | | | $ | 442 | |
| $ | 1,088 | | | $ | 386 | |
Reservoir Performance | | 1,810 | | | | 370 | |
| | 1,823 | | | | 367 | |
Well Construction | | 3,267 | | | | 681 | |
| | 3,312 | | | | 714 | |
Production Systems | | 3,197 | | | | 506 | | | | 3,103 | | | | 519 | |
Eliminations & other | | (146 | ) | | | (81 | ) |
| | (167 | ) | | | (84 | ) |
Pretax segment operating income | | | | | 1,918 | |
| | | | | 1,902 | |
Corporate & other (1) | | | | | (177 | ) |
| | | | | (187 | ) |
Interest income (2) | | | | | 36 | |
| | | | | 36 | |
Interest expense (3) | | | | | (128 | ) |
| | | | | (132 | ) |
Charges & credits (4) | | | | | (262 | ) | | | | | | (112 | ) |
| $ | 9,284 | |
| $ | 1,387 | |
| $ | 9,159 | |
| $ | 1,507 | |
(1)Comprised principally of certain corporate expenses not allocated to the segments, stock-based compensation costs, amortization expense associated with certain intangible assets, certain centrally managed initiatives, and other nonoperating items.
(2)Excludes interest income included in the segments’ income (fourth quarter 2024: $10 million; third quarter 2024: $16 million).
(3)Excludes interest expense included in the segments’ income (fourth quarter 2024: $3 million; third quarter 2024: $4 million).
(4)Charges and credits are described in detail in Note 3 to the Consolidated Financial Statements.
Fourth-quarter revenue of $9.3 billion increased 1% sequentially, driven by digital sales in North America and higher activity in the Middle East, Europe and North Africa. On a divisional basis, Digital & Integration led the growth, driven by increased demand for digital products and solutions, while Production Systems benefited from strong backlog conversion as customers continued to invest in maximizing recovery from existing assets.
International revenue of $7.5 billion increased 1% sequentially driven by the Middle East & Asia and Europe & Africa. The Middle East & Asia grew 2% sequentially driven by strong activity in the United Arab Emirates, higher drilling in Egypt, and increased stimulation, intervention, and evaluation activity in Qatar. These gains were offset by weaker performance in Saudi Arabia and Australia. Europe & Africa also grew 2% sequentially largely driven by increased activity in Europe and North Africa. Revenue in Latin America declined 3% sequentially primarily due to reduced drilling activity in Mexico.
North America revenue of $1.8 billion increased 4% sequentially due to higher digital sales, increased sales of production systems, and increased drilling activity in U.S. land and Canada.
Digital & Integration
Digital & Integration revenue of $1.2 billion increased 6% sequentially driven by 10% growth in digital revenue, supported by greater adoption of digital technologies and higher sales of exploration data, particularly in the U.S. Gulf of Mexico. Asset Performance Solutions (“APS”) revenue was flat sequentially.
Digital & Integration pretax operating margin of 38% expanded 274 basis points (“bps”) sequentially, reflecting improved profitability in digital from higher sales and cost efficiencies.
Reservoir Performance
Reservoir Performance revenue of $1.8 billion declined 1% sequentially driven by reduced intervention and stimulation activity, partially offset by stronger evaluation activity. Revenue was impacted by lower stimulation and intervention work in Saudi Arabia, which was offset by increased activity in the rest of the Middle East & Asia and North America.
Reservoir Performance pretax operating margin of 20% expanded 35 bps sequentially, primarily reflecting improved profitability in evaluation services.
Well Construction
Well Construction revenue of $3.3 billion declined 1% sequentially due to reduced drilling activity in Mexico and Saudi Arabia, partially mitigated by higher activity across the rest of the Middle East & Asia.
Well Construction pretax operating margin of 21% declined 70 bps sequentially due to the reduced activity.
Production Systems
Production Systems revenue of $3.2 billion increased 3% sequentially with growth led by higher international sales of artificial lift, midstream production systems and completions, partially offset by reduced sales of subsea production systems.
Production Systems pretax operating margin of 16% decreased 93 bps sequentially primarily due to lower profitability in subsea production systems.
Full-Year 2024 Results
| | | | | | | | | | | | | | | |
| | | | (Stated in millions) | |
| | | | | | | | | | | |
| 2024 | |
| 2023 | |
| | | | Pretax | | | | | | Pretax | |
| Revenue | | | Income | | | Revenue | | | Income | |
Digital & Integration | $ | 4,247 | | | $ | 1,408 | |
| $ | 3,871 | | | $ | 1,257 | |
Reservoir Performance | | 7,177 | | | | 1,452 | |
| | 6,561 | | | | 1,263 | |
Well Construction | | 13,357 | | | | 2,826 | |
| | 13,478 | | | | 2,932 | |
Production Systems | | 12,143 | | | | 1,898 | | | | 9,831 | | | | 1,245 | |
Eliminations & other | | (635 | ) | | | (263 | ) |
| | (606 | ) | | | (174 | ) |
Pretax segment operating income | | | | | 7,321 | |
| | | | | 6,523 | |
Corporate & other (1) | | | | | (744 | ) |
| | | | | (729 | ) |
Interest income (2) | | | | | 134 | |
| | | | | 87 | |
Interest expense (3) | | | | | (498 | ) |
| | | | | (489 | ) |
Charges & credits (4) | | | | | (541 | ) |
| | | | | (110 | ) |
| $ | 36,289 | |
| $ | 5,672 | |
| $ | 33,135 | |
| $ | 5,282 | |
(1)Comprised principally of certain corporate expenses not allocated to the segments, stock-based compensation costs, amortization expense associated with certain intangible assets, certain centrally managed initiatives, and other nonoperating items.
(2)Excludes interest income included in the segments’ income (2024: $40 million; 2023: $13 million).
(3)Excludes interest expense included in the segments’ income (2024: $14 million; 2023: $14 million).
(4)Charges and credits are described in detail in Note 3 to the Consolidated Financial Statements.
Full-year 2024 revenue of $36.3 billion increased 10% year on year. Approximately 46% of the year-on-year revenue increase came from the acquisition of the Aker Solutions subsea business ("Aker") in the fourth quarter of 2023 (see Note 6 to the Consolidated Financial Statements).
International revenue grew by 12% year on year. Excluding the contribution of the acquired Aker subsea business, international revenue increased 7% primarily driven by higher activity in the Middle East & Asia. North America revenue decreased 1% due to lower drilling in US land.
Digital & Integration
Digital & Integration revenue of $4.2 billion increased 10% year on year due to growth in digital revenue as APS revenue was essentially flat.
Digital & Integration pretax operating margin of 33% increased 67 bps year on year primarily due to the growth in digital revenue partially offset by effects of higher APS amortization expense and lower gas prices.
Reservoir Performance
Reservoir Performance revenue of $7.2 billion increased 9% year on year due to increased stimulation and intervention activity, with approximately 75% of the revenue growth coming from the Middle East & Asia.
Reservoir Performance pretax operating margin of 20% expanded 99 bps year on year due to improved profitability in the international markets driven by higher activity and improved pricing from increased technology intensity.
Well Construction
Well Construction revenue of $13.4 billion decreased 1% year on year. North America revenue declined 13% due to lower drilling activity in US land largely offset by a 2% increase in international revenue, primarily in the Middle East & Asia.
Well Construction pretax operating margin of 21% decreased 59 bps year on year driven by the reduced activity in North America.
Production Systems
Production Systems revenue of $12.1 billion increased 24% year on year mainly due to the acquisition of the Aker subsea business. Excluding the effects of the Aker subsea acquisition, revenue grew by 9% year on year driven by strong international sales across the portfolio.
Production Systems pretax operating margin of 16% expanded 297 bps year on year driven by a favorable activity mix, execution efficiency, and conversion of improved-price backlog.
Interest & Other Income, Net
Interest & other income, net consisted of the following:
| | | | | | | |
| | | | (Stated in millions) | |
| | | | | |
| 2024 | | | 2023 | |
Earnings of equity method investments | $ | 182 | | | $ | 206 | |
Interest income | | 174 | | | | 100 | |
Gain on sale of investment | | 24 | | | | - | |
Gain on sale of Liberty shares | | - | | | | 36 | |
| $ | 380 | | | $ | 342 | |
Interest income increased $74 million primarily due to higher average cash and short-term investment balances.
Other
Research & engineering and General & administrative expenses, as a percentage of Revenue, were as follows:
| | | | | | | |
| 2024 | | | 2023 | |
Research & engineering | | 2.1 | % | | | 2.1 | % |
General & administrative | | 1.1 | % | | | 1.1 | % |
Charges and Credits
SLB recorded charges and credits during 2024 and 2023. These charges and credits, which are summarized below, are more fully described in Note 3 to the Consolidated Financial Statements.
The following is a summary of the 2024 charges and credits:
| | | | | | | | | | | | | | | |
| (Stated in millions) | |
| | | | | | | | | | | |
| Pretax Charge (Credit) | | | Tax Benefit (Expense) | | | Noncontrolling Interest | | | Net | |
First quarter: | | | | | | | | | | | |
Merger & integration | $ | 25 | | | $ | 6 | | | $ | 5 | | | $ | 14 | |
Second quarter: | | | | | | | | | | | |
Workforce reductions | | 111 | | | | 17 | | | | - | | | | 94 | |
Merger & integration | | 31 | | | | 5 | | | | 8 | | | | 18 | |
Third quarter | | | | | | | | | | | - | |
Workforce reductions | | 65 | | | | 10 | | | | - | | | | 55 | |
Merger & integration | | 47 | | | | 10 | | | | 7 | | | | 30 | |
Fourth quarter | | | | | | | | | | | - | |
Asset impairments | | 162 | | | | 23 | | | | - | | | | 139 | |
Merger & integration | | 63 | | | | 6 | | | | 7 | | | | 50 | |
Workforce reductions | | 61 | | | | 10 | | | | - | | | | 51 | |
Gain on sale of investment | | (24 | ) | | | - | |
| | - | |
| | (24 | ) |
| $ | 541 | | | $ | 87 | |
| $ | 27 | |
| $ | 427 | |
The following is a summary of the 2023 charges and credits:
| | | | | | | | | | | | | | | |
| (Stated in millions) | |
| | | | | | | | | | | |
| Pretax Charge (Credit) | | | Tax Benefit (Expense) | | | Noncontrolling Interests | | | Net | |
First quarter: | | | | | | | | | | | |
Gain on sale of Liberty shares | $ | (36 | ) | | $ | (8 | ) | | $ | - | | | $ | (28 | ) |
Fourth quarter: | | | | | | | | | | | |
Merger and integration | | 56 | | | | 8 | | | | 8 | | | | 40 | |
Currency devaluation loss in Argentina | | 90 | | | | - | | | | - | | | | 90 | |
| $ | 110 | | | $ | - | | | $ | 8 | |
| $ | 102 | |
Liquidity and Capital Resources
Details of the components of liquidity as well as changes in liquidity follow:
| | | | | | | |
| | | | (Stated in millions) | |
| | | | | |
| Dec. 31, | |
| Dec. 31, | |
Components of Liquidity: | 2024 | |
| 2023 | |
Cash | $ | 3,544 | |
| $ | 2,900 | |
Short-term investments | | 1,125 | |
| | 1,089 | |
Short-term borrowings and current portion of long-term debt | | (1,051 | ) | | | (1,123 | ) |
Long-term debt | | (11,023 | ) |
| | (10,842 | ) |
Net debt (1) | $ | (7,405 | ) |
| $ | (7,976 | ) |
| | | | | | | |
Changes in Liquidity: | 2024 | | | 2023 | |
Net income | $ | 4,579 | | | $ | 4,275 | |
Charges and credits | | 541 | | | | 110 | |
Depreciation and amortization (2) | | 2,519 | | | | 2,312 | |
Stock-based compensation expense | | 316 | | | | 293 | |
Earnings of equity method investments, less dividends received | | (18 | ) | | | (132 | ) |
Increase in working capital | | (1,379 | ) | | | (215 | ) |
US federal tax refund | | - | | | | 85 | |
Other | | 44 | | | | (91 | ) |
Cash flow from operations | | 6,602 | | | | 6,637 | |
Capital expenditures | | (1,931 | ) | | | (1,939 | ) |
APS investments | | (483 | ) | | | (507 | ) |
Exploration data capitalized | | (198 | ) | | | (153 | ) |
Free cash flow (3) | | 3,990 | | | | 4,038 | |
Dividends paid | | (1,533 | ) | | | (1,317 | ) |
Stock repurchase program | | (1,737 | ) | | | (694 | ) |
Proceeds from employee stock purchase plan | | 219 | | | | 191 | |
Proceeds from exercise of stock options | | 29 | | | | 90 | |
Taxes paid on net-settled stock-based compensation awards | | (90 | ) | | | (169 | ) |
Business acquisitions and investments, net of cash acquired plus debt assumed | | (553 | ) | | | (330 | ) |
Proceeds from sale of Liberty shares | | - | | | | 137 | |
Purchases of Blue Chip Swap securities | | (207 | ) | | | (185 | ) |
Proceeds from sales of Blue Chip Swap securities | | 152 | | | | 97 | |
Other | | 53 | | | | (195 | ) |
Change in net debt before impact of changes in foreign exchange rates | | 323 | | | | 1,663 | |
Impact of changes in foreign exchange rates | | 248 | | | | (307 | ) |
Decrease in Net Debt | | 571 | | | | 1,356 | |
Net Debt, Beginning of period | | (7,976 | ) | | | (9,332 | ) |
Net Debt, End of period | $ | (7,405 | ) | | $ | (7,976 | ) |
(1)“Net debt” represents gross debt less cash and short-term investments. Management believes that Net debt provides useful information to investors and management regarding the level of SLB’s indebtedness by reflecting cash and investments that could be used to repay debt. Net debt is a non-GAAP financial measure that should be considered in addition to, not as a substitute for or superior to, total debt.
(2)Includes depreciation of fixed assets and amortization of intangible assets, exploration data costs and APS investments.
(3)“Free cash flow” represents cash flow from operations less capital expenditures, APS investments and exploration data costs capitalized. Management believes that free cash flow is an important liquidity measure for the company and that it is useful to investors and management as a measure of our ability to generate cash. Once business needs and obligations are met, this cash can be used to reinvest in the company for future growth or to return to shareholders through dividend payments or share repurchases. Free cash flow does not represent the residual cash flow available for discretionary expenditures. Free cash flow is a non-GAAP financial measure that should be considered in addition to, not as a substitute for or superior to, cash flow from operations.
Key liquidity events during 2024 and 2023 included:
•In January 2024, SLB announced a 10% increase to its quarterly cash dividend from $0.25 per share of outstanding common stock to $0.275 per share, beginning with the dividend paid in April 2024. In January 2023, SLB announced a 43% increase to its quarterly cash dividend from $0.175 per share of outstanding common stock to $0.25 per share, beginning with the dividend paid in April 2023. Dividends paid during 2024 and 2023 were $1.5 billion and $1.3 billion, respectively.
In January 2025, SLB announced a 3.6% increase to its quarterly dividend from $0.275 per share of outstanding common stock to $0.285 per share, beginning with the dividend payable in April 2025.
•As of December 31, 2024, SLB cumulatively repurchased $3.5 billion of its common stock under its $10 billion share repurchase program.
The following table summarizes the activity under the share repurchase program:
| | | | | | | | | | | |
(Stated in millions, except per share amounts) | |
| | | | | | | | |
| Total Cost | | | Total Number | |
| Average Price | |
| of Shares | | | of Shares | |
| Paid per | |
| Purchased | | | Purchased | |
| Share | |
2024 | $ | 1,737 | |
| | 38.4 | |
| $ | 45.29 | |
2023 | $ | 694 | |
| | 13.3 | |
| $ | 52.05 | |
SLB has entered into accelerated share repurchase (“ASR”) transactions to repurchase $2.3 billion of its common stock. Under the terms of the ASR agreements, on January 13, 2025, SLB received an initial share delivery of approximately 80% of the shares to be repurchased, based on the closing price per share of its common stock on the preceding day. SLB expects the remainder of the shares to be delivered no later than the end of May 2025. Under certain circumstances, SLB may be required to deliver shares or pay cash, at its option, upon settlement of the ASR agreements. The total number of shares ultimately purchased under the ASR agreements will depend upon the final settlement and will be based on volume-weighted average prices of SLB’s common stock during the terms of the ASR transactions, less a discount.
•Capital investments (consisting of capital expenditures, APS investments, and exploration data capitalized) were $2.6 billion in both 2024 and 2023. Capital investments during 2025 are expected to be approximately $2.3 billion.
•During the fourth quarter of 2024, SLB repaid its €0.6 billion of 0.00% Notes that were outstanding.
•During the second quarter of 2024, SLB issued $500 million of 5.00% Senior Notes due 2027, $500 million of 5.00% Senior Notes due 2029, and $500 million of 5.00% Senior Notes due 2034.
•During the second quarter of 2024, SLB and Aker Carbon Capture ASA (“ACC”) announced the closing of their previously announced joint venture. The new company, SLB Capturi, combines technology portfolios, expertise, and operation platforms to support accelerated carbon capture adoption for industrial decarbonization at scale. At closing, SLB paid NOK 4.1 billion ($0.4 billion) in cash to ACC for the purchase of 80% of the shares in Aker Carbon Capture Holdings AS (“ACCH”), which held the business of ACC. ACC is also entitled to performance-based payments of up to NOK 1.4 billion if certain targets are met over the period from 2025 to 2027.
After a lock-up period of three years, ACC is entitled to sell its 20% interest in ACCH to SLB during a period of six months for a price based on the fair market value of the combined business subject to a floor of NOK 1.0 billion and a ceiling of NOK 2.1 billion (the “put option”). Additionally, after the expiration of the put option, SLB has the right to purchase ACC’s 20% interest in the combined business during the following six months for a price based on the fair market value of the combined business subject to a floor of NOK 1.5 billion and a ceiling of NOK 2.6 billion.
•During the first quarter of 2023, SLB sold all of its remaining approximately 9 million shares of Liberty and received net proceeds of $137 million. As a result, SLB recognized a gain of $36 million.
•During the second quarter of 2023, SLB issued $500 million of 4.50% Senior Notes due 2028 and $500 million of 4.85% Senior Notes due 2033.
•During the fourth quarter of 2023, SLB repaid its $1.5 billion of 3.65% Senior Notes that were outstanding.
As of December 31, 2024, SLB had $4.67 billion of cash and short-term investments and committed credit facility agreements with commercial banks aggregating $5.0 billion, all of which was available. SLB believes these amounts, along with cash generated by ongoing operations, will be sufficient to meet future business requirements for the next 12 months and beyond.
On October 17, 2024, SLB entered into a definitive agreement to sell its interest in the Palliser APS project in Canada. Under the terms of the agreement, SLB will receive cash proceeds of approximately $430 million, subject to closing adjustments that are typical for such a transaction. The transaction, which is subject to regulatory approval and other customary closing conditions, is expected to close in the first quarter of 2025. SLB recorded revenue of approximately $0.5 billion relating to this project during 2024.
The following table reflects the carrying amounts of SLB’s debt at December 31, 2024 by year of maturity:
| | | | | | | | | | | | | | | | | | | | | | | | | | | | | | | | | | | | | | | |
| | | | | | | | | | | | | | | | | | | | | | | | | (Stated in millions) | |
| | | | | | | | | | | | | | | | | | | | | | | | | | | | | |
| | | | | | | | | | | | | | | | | | | | | | | | | After | | | | |
| 2025 | | | 2026 | | | 2027 | | | 2028 | | | 2029 | | | 2030 | | | 2031 | | | 2032 | | | 2032 | | | Total | |
Fixed rate debt | | | | | | | | | | | | | | | | | | | | | | | | | | |
| | |
4.00% Senior Notes | $ | 523 | | | | | | | | | | | | | | | | | | | | | | | | | | | | 523 | |
1.40% Senior Notes | | 500 | | | | | | | | | | | | | | | | | | | | | | | | | | | | 500 | |
1.375% Guaranteed Notes | | | | $ | 1,040 | | | | | | | | | | | | | | | | | | | | | | | | | 1,040 | |
1.00% Guaranteed Notes | | | | | 624 | | | | | | | | | | | | | | | | | | | | | | | | | 624 | |
0.25% Notes | | | | | | | $ | 936 | | | | | | | | | | | | | | | | | | | | | | 936 | |
5.00% Senior Notes | | | | | | | | 495 | | | | | | | | | | | | | | | | | | | | | | 495 | |
3.90% Senior Notes | | | | | | | | | | $ | 1,478 | | | | | | | | | | | | | | | | | | | 1,478 | |
4.50% Senior Notes | | | | | | | | | | | 497 | | | | | | | | | | | | | | | | | | | 497 | |
4.30% Senior Notes | | | | | | | | | | | | | $ | 848 | | | | | | | | | | | | | | | | 848 | |
5.00% Senior Notes | | | | | | | | | | | | | | 493 | | | | | | | | | | | | | | | | 493 | |
2.65% Senior Notes | | | | | | | | | | | | | | | | $ | 1,250 | | | | | | | | | | | | | 1,250 | |
0.50% Notes | | | | | | | | | | | | | | | | | | | $ | 935 | | | | | | | | | | 935 | |
2.00% Guaranteed Notes | | | | | | | | | | | | | | | | | | | | | | $ | 1,034 | | | | | | | 1,034 | |
4.85% Senior Notes | | | | | | | | | | | | | | | | | | | | | | | | | $ | 498 | | | | 498 | |
5.00% Senior Notes | | | | | | | | | | | | | | | | | | | | | | | | | | 489 | | | | 489 | |
7.00% Notes | | | | | | | | | | | | | | | | | | | | | | | | | | 197 | | | | 197 | |
5.95% Notes | | | | | | | | | | | | | | | | | | | | | | | | | | 111 | | | | 111 | |
5.13% Notes | | | | | | | | | | | | | | | | | | | | | | | | | | 98 | |
| | 98 | |
Total fixed rate debt | $ | 1,023 | | | $ | 1,664 | | | $ | 1,431 | | | $ | 1,975 | | | $ | 1,341 | | | $ | 1,250 | | | $ | 935 | | | $ | 1,034 | | | $ | 1,393 | |
| $ | 12,046 | |
Variable rate debt | | 28 | | | | - | | | | - | | | | - | | | | - | | | | - | | | | - | | | | - | | | | - | |
| | 28 | |
Total | $ | 1,051 | | | $ | 1,664 | | | $ | 1,431 | | | $ | 1,975 | | | $ | 1,341 | | | $ | 1,250 | | | $ | 935 | | | $ | 1,034 | | | $ | 1,393 | |
| $ | 12,074 | |
Interest payments on fixed rate debt obligations by year are as follows:
| | | |
(Stated in millions) | |
| | |
2025 | $ | 421 | |
2026 | | 387 | |
2027 | | 341 | |
2028 | | 262 | |
2029 | | 192 | |
Thereafter | | 584 | |
| $ | 2,187 | |
See Note 14, Leases of the Consolidated Financial Statements for details regarding SLB’s lease obligations.
SLB has outstanding letters of credit/guarantees that relate to business performance bonds, customs/excise tax commitments, facility lease/rental obligations, etc. These were entered into in the ordinary course of business and are customary practices in the various countries where SLB operates.
Critical Accounting Estimates
The preparation of financial statements and related disclosures in conformity with accounting principles generally accepted in the United States requires SLB to make estimates and assumptions that affect the reported amounts of assets and liabilities, the disclosure of contingent liabilities and the reported amounts of revenue and expenses. The following accounting policies involve “critical accounting
estimates” because they are particularly dependent on estimates and assumptions made by SLB about matters that are inherently uncertain.
SLB bases its estimates on historical experience and on various assumptions that are believed to be reasonable under the circumstances, the results of which form the basis for making judgments about the carrying values of assets and liabilities that are not readily apparent from other sources. Actual results may differ from these estimates under different assumptions or conditions.
Allowance for Doubtful Accounts
SLB maintains an allowance for doubtful accounts in order to record accounts receivable at their net realizable value. Judgment is involved in recording and making adjustments to this reserve. Allowances have been recorded for receivables believed to be uncollectible, including amounts for the resolution of potential credit and other collection issues such as disputed invoices. Adjustments to the allowance may be required in future periods depending on how such potential issues are resolved, or if the financial condition of SLB’s customers were to deteriorate resulting in an impairment of their ability to make payments.
As a large multinational company with a long history of operating in a cyclical industry, SLB has extensive experience in working with its customers during difficult times to manage its accounts receivable. During weak economic environments or when there is an extended period of weakness in oil and gas prices, SLB typically experiences delays in the payment of its receivables. However, except for a $469 million write-off during 2017 as a result of the political and economic conditions in Venezuela, SLB has not historically had material write-offs due to uncollectible accounts receivable. SLB has a global footprint in more than 100 countries. As of December 31, 2024, three of those countries individually accounted for greater than 5% of SLB’s net accounts receivable balance, of which only one (the United States) accounted for greater than 10% of such receivables.
As of December 31, 2024, the United States represented 11% of SLB’s net accounts receivable balance. As of December 31, 2024, Mexico represented 9.7% of SLB's net accounts receivable balance. (See Note 10 to the Consolidated Financial Statements). SLB’s receivables from its primary customer in Mexico are not in dispute and SLB has not historically had any material write-offs due to uncollectible accounts receivable relating to this customer.
Goodwill, Intangible Assets and Long-Lived Assets
SLB records the excess of purchase price over the fair value of the tangible and identifiable intangible assets acquired and liabilities assumed as goodwill. The goodwill relating to each of SLB’s reporting units is tested for impairment annually as well as when an event, or change in circumstances, indicates an impairment may have occurred.
Under generally accepted accounting principles, SLB has the option to first assess qualitative factors to determine whether the existence of events or circumstances leads to a determination that it is more likely than not that the fair value of one or more of its reporting units is greater than its carrying amount. If, after assessing the totality of events or circumstances, SLB determines it is more likely than not that the fair value of a reporting unit is greater than its carrying amount, there is no need to perform any further testing. However, if SLB concludes otherwise, then it is required to perform a quantitative impairment test by calculating the fair value of the reporting unit and comparing the fair value with the carrying amount of the reporting unit. If the fair value of the reporting unit is less than its carrying value, an impairment loss is recorded based on that difference.
SLB has the option to bypass the qualitative assessment for any reporting unit in any period and proceed directly to performing the quantitative goodwill impairment test.
SLB elected to perform the qualitative assessment described above for purposes of its annual goodwill impairment test in 2024. Based on this assessment, SLB concluded it was more likely than not that the fair value of each of its reporting units was greater than its carrying amount. Accordingly, no further testing was required.
Long-lived assets, including fixed assets, intangible assets, and investments in APS projects, are reviewed for impairment whenever events or changes in circumstances indicate that the carrying value may not be recoverable. In reviewing for impairment, the carrying value of such assets is compared to the estimated undiscounted future cash flows expected from the use of the assets and their eventual disposition. If such cash flows are not sufficient to support the asset’s recorded value, an impairment charge is recognized to reduce the carrying value of the long-lived asset to its estimated fair value. The determination of future cash flows as well as the estimated fair value of long-lived assets involves significant estimates on the part of management. If there is a material change in economic conditions or other circumstances influencing the estimate of future cash flows or fair value, SLB could be required to recognize impairment charges in the future.
Income Taxes
SLB conducts business in more than 100 tax jurisdictions, a number of which have tax laws that are not fully defined and are evolving. SLB’s tax filings are subject to regular audits by the tax authorities. These audits may result in assessments for additional taxes that are resolved with the authorities or, potentially, through the courts. SLB recognizes the impact of a tax position in its financial statements if that position is more likely than not of being sustained on audit, based on the technical merits of the position. Tax liabilities are recorded based on estimates of additional taxes that will be due upon the conclusion of these audits. Estimates of these tax liabilities are judgmental and are made based upon prior experience and are updated in light of changes in facts and circumstances. However, due to the uncertain and complex application of tax regulations, the ultimate resolution of audits may result in liabilities that could be materially different from these estimates. In such an event, SLB will record additional tax expense or tax benefit in the period in which such resolution occurs.
Revenue Recognition for Certain Long-term Construction-type Contracts
SLB recognizes revenue for certain long-term construction-type contracts over time. These contracts involve significant design and engineering efforts in order to satisfy custom designs for customer-specific applications. Under this method, revenue is recognized as work progresses on each contract. Progress is measured by the ratio of actual costs incurred to date on the project in relation to total estimated project costs. Approximately 9% of SLB’s revenue in 2024, 6% in 2023, and 5% in 2022, was recognized under this method.
The estimate of total project costs has a significant impact on both the amount of revenue recognized as well as the related profit on a project. Revenue and profits on contracts can also be significantly affected by change orders and claims. Profits are recognized based on the estimated project profit multiplied by the percentage complete. Due to the nature of these projects, adjustments to estimates of contract revenue and total contract costs are often required as work progresses. Any expected losses on a project are recorded in full in the period in which they become probable.
Pension and Postretirement Benefits
SLB’s pension and postretirement benefit obligations are described in detail in Note 17 to the Consolidated Financial Statements. The obligations and related costs are calculated using actuarial concepts, which include critical assumptions related to the discount rate and the expected rate of return on plan assets. These assumptions are important elements of expense and/or liability measurement and are updated on an annual basis, or upon the occurrence of significant events.
The discount rate that SLB uses reflects the prevailing market rate of a portfolio of high-quality debt instruments with maturities matching the expected timing of payment of the related benefit obligations. The following summarizes the discount rates utilized by SLB for its various pension and postretirement benefit plans:
•The discount rate utilized to determine the liability for SLB’s United States pension plans and postretirement medical plan was 5.70% at December 31, 2024 and 5.25% at December 31, 2023.
•The weighted-average discount rate utilized to determine the liability for SLB’s international pension plans was 5.67% at December 31, 2024 and 5.14% at December 31, 2023.
•The discount rate utilized to determine expense for SLB’s United States pension plans and postretirement medical plan was 5.25% in 2024 and 5.50% in 2023.
•The weighted-average discount rate utilized to determine expense for SLB’s international pension plans was 5.14% in 2024 and 5.41% in 2023.
The expected rate of return for SLB’s retirement benefit plans represents the long-term average rate of return expected to be earned on plan assets based on expectations regarding future rates of return for the portfolio considering the asset allocation and related historical rate of return. The average expected rate of return on plan assets for the United States pension plans was 6.00% in both 2024 and 2023. The weighted average expected rate of return on plan assets for the international pension plans was 5.91% in 2024 and 6.00% in 2023. A higher expected rate of return decreases pension expense.
The following illustrates the sensitivity to changes in certain assumptions, holding all other assumptions constant, for SLB’s United States and international pension plans:
| | | |
(Stated in millions) |
| | | |
| | | Effect on |
| Effect on 2024 | | Dec. 31, 2024 |
Change in Assumption | Pretax Expense | | Obligation |
25 basis point decrease in discount rate | -$1 |
| +$324 |
25 basis point increase in discount rate | +$3 | | -$308 |
25 basis point decrease in expected return on plan assets | +$31 |
| - |
25 basis point increase in expected return on plan assets | -$31 |
| - |
The following illustrates the sensitivity to changes in certain assumptions, holding all other assumptions constant, for SLB’s United States postretirement medical plans:
| | | |
(Stated in millions) |
| | | |
| | | Effect on |
| Effect on 2024 | | Dec. 31, 2024 |
Change in Assumption | Pretax Expense | | Obligation |
25 basis point decrease in discount rate | +$2 |
| +$22 |
25 basis point increase in discount rate | -$2 | | -$21 |
Item 7A. Quantitative and Qualitative Disclosures About Market Risk.
SLB is subject to market risks primarily associated with changes in foreign currency exchange rates.
SLB’s functional currency is primarily the US dollar. Approximately 70% of SLB’s revenue in 2024 was denominated in US dollars. However, outside the United States, a significant portion of SLB’s expenses is incurred in foreign currencies. Therefore, when the US dollar weakens in relation to the foreign currencies of the countries in which SLB conducts business, the US dollar-reported expenses will increase.
SLB is exposed to risks on future cash flows relating to its fixed rate debt denominated in currencies other than the functional currency. SLB uses cross-currency interest rate swaps to provide a hedge against these cash flow risks and effectively convert the debt to US-dollar denominated fixed rate debt.
SLB maintains a foreign currency risk management strategy that uses derivative instruments to manage the impact of changes in foreign exchange rates on its earnings. SLB enters into foreign currency forward contracts to provide a hedge against currency fluctuations on certain monetary assets and liabilities, and certain expenses denominated in currencies other than the functional currency.
A 10% appreciation in the US dollar from the December 31, 2024 market rates would decrease the unrealized value of SLB’s forward contracts by $121 million. Conversely, a 10% depreciation in the US dollar from the December 31, 2024 market rates would increase the unrealized value of SLB’s forward contracts by $133 million. In either scenario, the gain or loss on the forward contract would be offset by the gain or loss on the underlying transaction, and therefore, would have no impact on future earnings.
At December 31, 2024, forward contracts for the US dollar equivalent of $10.0 billion in various foreign currencies were outstanding, of which $4.5 billion related to hedges of debt balances denominated in currencies other than the functional currency.
Forward-Looking Statements
This Form 10-K, as well as other statements we make, contains “forward-looking statements” within the meaning of the federal securities laws, which include any statements that are not historical facts. Such statements often contain words such as “expect,” “may,” “can,” “believe,” “predict,” “plan,” “potential,” “projected,” “projections,” “precursor,” “forecast,” “outlook,” “expectations,” “estimate,” “intend,” “anticipate,” “ambition,” “goal,” “target,” “scheduled,” “think,” “should,” “could,” “would,” “will,” “see,” “likely,” and other similar words. Forward-looking statements address matters that are, to varying degrees, uncertain, such as statements about SLB’s financial and performance targets and other forecasts or expectations regarding, or dependent on, its business outlook; growth for SLB as a whole and for each of its Divisions (and for specified business lines, geographic areas or technologies within each Division); oil and natural gas demand and production growth; oil and natural gas prices; forecasts or expectations regarding energy transition and global climate change; improvements in operating procedures and technology; capital expenditures by SLB and the oil and gas industry; the business strategies of SLB, including digital and “fit for basin,” as well as the strategies of SLB’s customers; SLB’s capital allocation plans, including dividend plans and share repurchase programs; SLB’s APS projects, joint ventures, and other alliances; the impact of the ongoing conflict in Ukraine on global energy supply; access to raw materials; future global economic and geopolitical conditions; future liquidity, including free cash flow; and future results of operations, such as margin levels. These statements are subject to risks and uncertainties, including, but not limited to, changing global economic and geopolitical conditions; changes in exploration and production spending by SLB’s customers and changes in the level of oil and natural gas exploration and development; the results of operations and financial condition of SLB’s customers and suppliers; SLB’s inability to achieve its financial and performance targets and other forecasts and expectations; SLB’s inability to achieve net-zero carbon emissions goals or interim emissions reduction goals; general economic, geopolitical and business conditions in key regions of the world; the ongoing conflict in Ukraine; foreign currency risk; inflation; changes in monetary policy by governments; pricing pressure; weather and seasonal factors; unfavorable effects of health pandemics; availability and cost of raw materials; operational modifications, delays or cancellations; challenges in SLB’s supply chain; production declines; the extent of future charges; SLB’s inability to recognize efficiencies and other intended benefits from its business strategies and initiatives, such as digital or new energy, as well as its cost reduction strategies; changes in government regulations and regulatory requirements, including those related to offshore oil and gas exploration, radioactive sources, explosives, chemicals and climate-related initiatives; the inability of technology to meet new challenges in exploration; the competitiveness of alternative energy sources or product substitutes; and other risks and uncertainties detailed in this Form 10-K and other filings that we make with the SEC.
This Form 10-K also includes forward-looking statements relating to the proposed transaction between SLB and ChampionX, including statements regarding the benefits of the transaction and the anticipated timing of the transaction. Factors and risks that may impact future results and performance include, but are not limited to, and in each case as a possible result of the proposed transaction on each of SLB and ChampionX: the ultimate outcome of the proposed transaction between SLB and ChampionX; the ability to operate the SLB and ChampionX respective businesses, including business disruptions; difficulties in retaining and hiring key personnel and employees; the ability to maintain favorable business relationships with customers, suppliers and other business partners; the terms and timing of the proposed transaction; the occurrence of any event, change or other circumstance that could give rise to the termination of the proposed transaction; the anticipated or actual tax treatment of the proposed transaction; the ability to satisfy closing conditions to the completion of the proposed transaction; other risks related to the completion of the proposed transaction and actions related thereto; the ability of SLB and ChampionX to integrate the business successfully and to achieve anticipated synergies and value creation from the proposed transaction; the ability to secure government regulatory approvals on the terms expected, at all or in a timely manner; litigation and regulatory proceedings, including any proceedings that may be instituted against SLB or ChampionX related to the proposed transaction,
as well as the risk factors discussed in SLB’s and ChampionX’s most recent Forms 10-K, 10-Q, and 8-K filed with or furnished to the SEC.
If one or more of these or other risks or uncertainties materialize (or the consequences of any such development changes), or should our underlying assumptions prove incorrect, actual results or outcomes may vary materially from those reflected in our forward-looking statements. Forward-looking and other statements in this Form 10-K regarding our environmental, social, and other sustainability plans and goals are not an indication that these statements are necessarily material to investors or required to be disclosed in our filings with the SEC. In addition, historical, current, and forward-looking environmental, social, and sustainability-related statements may be based on standards for measuring progress that are still developing, internal controls and processes that continue to evolve, and assumptions that are subject to change in the future. Statements in this Form 10-K are made as of January 22, 2025, and SLB disclaims any intention or obligation to update publicly or revise such statements, whether as a result of new information, future events or otherwise.
Item 8. Financial Statements and Supplementary Data.
SCHLUMBERGER LIMITED AND SUBSIDIARIES
CONSOLIDATED STATEMENT OF INCOME
| | | | | | | | | | | |
| (Stated in millions, except per share amounts) | |
| | | | | | | | |
Year Ended December 31, | 2024 | |
| 2023 | |
| 2022 | |
Revenue | | | | | | | | |
Services | $ | 23,297 | | | $ | 22,439 | | | $ | 19,552 | |
Product sales | | 12,992 | | | | 10,696 | | | | 8,539 | |
Total Revenue | | 36,289 | | | | 33,135 | | | | 28,091 | |
Interest & other income, net | | 380 | | | | 342 | | | | 610 | |
Expenses | | | | | | | | |
Cost of services | | 17,847 | | | | 17,231 | | | | 15,233 | |
Cost of sales | | 10,982 | | | | 9,341 | | | | 7,697 | |
Research & engineering | | 749 | | | | 711 | | | | 634 | |
General & administrative | | 385 | | | | 364 | | | | 376 | |
Restructuring & other | | 399 | | | | - | | | | - | |
Merger & integration | | 123 | | | | 45 | | | | - | |
Interest | | 512 | | | | 503 | | | | 490 | |
Income before taxes | | 5,672 | | | | 5,282 | | | | 4,271 | |
Tax expense | | 1,093 | | | | 1,007 | | | | 779 | |
Net income | | 4,579 | | | | 4,275 | | | | 3,492 | |
Net income attributable to noncontrolling interests | | 118 | | | | 72 | | | | 51 | |
Net income attributable to SLB | $ | 4,461 | | | $ | 4,203 | | | $ | 3,441 | |
| | | | | | | | |
Basic earnings per share of SLB | $ | 3.14 | | | $ | 2.95 | | | $ | 2.43 | |
| | | | | | | | |
Diluted earnings per share of SLB | $ | 3.11 | | | $ | 2.91 | | | $ | 2.39 | |
| | | | | | | | |
Average shares outstanding: | | | | | | | | |
Basic | | 1,421 | | | | 1,425 | | | | 1,416 | |
Assuming dilution | | 1,436 | | | | 1,443 | | | | 1,437 | |
See the Notes to Consolidated Financial Statements
SCHLUMBERGER LIMITED AND SUBSIDIARIES
CONSOLIDATED STATEMENT OF COMPREHENSIVE INCOME
| | | | | | | | | | | |
(Stated in millions) | |
| | | | | | | | |
Year Ended December 31, | 2024 | |
| 2023 | |
| 2022 | |
Net income | $ | 4,579 | |
| $ | 4,275 | |
| $ | 3,492 | |
Currency translation adjustments: |
| |
|
| |
|
| |
Net change arising during the period | | (138 | ) |
| | (113 | ) |
| | (26 | ) |
Cash flow hedges: |
| |
|
| |
|
| |
Net gain (loss) on cash flow hedges | | 8 | |
| | 177 | |
| | (148 | ) |
Reclassification to net income of net realized (gain) loss | | (4 | ) |
| | (19 | ) |
| | 117 | |
Pension and other postretirement benefit plans: |
| |
|
| |
|
| |
Actuarial loss arising during the period | | (582 | ) | | | (437 | ) | | | (305 | ) |
Amortization to net income of net actuarial losses | | (3 | ) |
| | (12 | ) |
| | 75 | |
Amortization to net income of net prior service credit | | (23 | ) |
| | (23 | ) |
| | (23 | ) |
Income taxes on pension and other postretirement benefit plans | | 42 | |
| | 58 | |
| | 24 | |
Other | | 4 | |
| | (30 | ) |
| | 1 | |
Comprehensive income | | 3,883 | |
| | 3,876 | |
| | 3,207 | |
Comprehensive income attributable to noncontrolling interests | | 118 | |
| | 72 | |
| | 51 | |
Comprehensive income attributable to SLB | $ | 3,765 | |
| $ | 3,804 | |
| $ | 3,156 | |
See the Notes to Consolidated Financial Statements
SCHLUMBERGER LIMITED AND SUBSIDIARIES
CONSOLIDATED BALANCE SHEET
| | | | | | | | |
(Stated in millions) | |
| | | | | | |
December 31, | | 2024 | | | 2023 | |
ASSETS | | | | | | |
Current Assets | | | | | | |
Cash | | $ | 3,544 | | | $ | 2,900 | |
Short-term investments | | | 1,125 | | | | 1,089 | |
Receivables less allowance for doubtful accounts (2024 - $325; 2023 - $337) | | | 8,011 | | | | 7,812 | |
Inventories | | | 4,375 | | | | 4,387 | |
Other current assets | | | 1,515 | | | | 1,530 | |
| | | 18,570 | | | | 17,718 | |
Investments in Affiliated Companies | | | 1,635 | | | | 1,624 | |
Fixed Assets less accumulated depreciation | | | 7,359 | | | | 7,240 | |
Goodwill | | | 14,593 | | | | 14,084 | |
Intangible Assets | | | 3,012 | | | | 3,239 | |
Other Assets | | | 3,766 | | | | 4,052 | |
| | $ | 48,935 | | | $ | 47,957 | |
LIABILITIES AND EQUITY | |
| | |
| |
Current Liabilities | | | | | | |
Accounts payable and accrued liabilities | | | 10,375 | | | | 10,904 | |
Estimated liability for taxes on income | | | 982 | | | | 994 | |
Short-term borrowings and current portion of long-term debt | | | 1,051 | | | | 1,123 | |
Dividends payable | | | 403 | | | | 374 | |
| | | 12,811 | | | | 13,395 | |
Long-term Debt | | | 11,023 | | | | 10,842 | |
Postretirement Benefits | | | 512 | | | | 175 | |
Deferred Taxes | | | 67 | | | | 140 | |
Other Liabilities | | | 2,172 | | | | 2,046 | |
| | | 26,585 | | | | 26,598 | |
Equity | |
| | |
| |
Common stock | | | 11,458 | | | | 11,624 | |
Treasury stock | | | (1,773 | ) | | | (678 | ) |
Retained earnings | | | 16,395 | | | | 13,497 | |
Accumulated other comprehensive loss | | | (4,950 | ) | | | (4,254 | ) |
SLB stockholders' equity | | | 21,130 | | | | 20,189 | |
Noncontrolling interests | | | 1,220 | | | | 1,170 | |
| | | 22,350 | | | | 21,359 | |
| | $ | 48,935 | | | $ | 47,957 | |
See the Notes to Consolidated Financial Statements
SCHLUMBERGER LIMITED AND SUBSIDIARIES
CONSOLIDATED STATEMENT OF CASH FLOWS
| | | | | | | | | | | |
(Stated in millions) | |
| | | | | | | | |
Year Ended December 31, | 2024 | | | 2023 | | | 2022 | |
Cash flows from operating activities: |
| | |
| | |
| |
Net income | $ | 4,579 | | | $ | 4,275 | | | $ | 3,492 | |
Adjustments to reconcile net income to cash provided by operating activities: | | | | | | | | |
Charges and credits | | 541 | | | | 110 | | | | (347 | ) |
Depreciation and amortization (1) | | 2,519 | | | | 2,312 | | | | 2,147 | |
Deferred taxes | | (41 | ) | | | 28 | | | | (39 | ) |
Stock-based compensation expense | | 316 | | | | 293 | | | | 313 | |
Earnings of equity method investments, less dividends received | | (18 | ) | | | (132 | ) | | | (96 | ) |
Change in assets and liabilities: (2) | | | | | | | | |
Increase in receivables | | (236 | ) | | | (659 | ) | | | (1,728 | ) |
Increase in inventories | | (101 | ) | | | (254 | ) | | | (737 | ) |
Decrease (increase) in other current assets | | 3 | | | | 121 | | | | (44 | ) |
Decrease (increase) in other assets | | 13 | | | | (10 | ) | | | (45 | ) |
(Decrease) increase in accounts payable and accrued liabilities | | (994 | ) | | | 724 | | | | 704 | |
(Decrease) increase in estimated liability for taxes on income | | (51 | ) | | | (62 | ) | | | 96 | |
Increase (decrease) in other liabilities | | 32 | | | | (76 | ) | | | 23 | |
Other | | 40 | | | | (33 | ) | | | (19 | ) |
NET CASH PROVIDED BY OPERATING ACTIVITIES | | 6,602 | | | | 6,637 | | | | 3,720 | |
Cash flows from investing activities: |
| | |
| | |
| |
Capital expenditures | | (1,931 | ) | | | (1,939 | ) | | | (1,618 | ) |
APS investments | | (483 | ) | | | (507 | ) | | | (587 | ) |
Exploration data capitalized | | (198 | ) | | | (153 | ) | | | (97 | ) |
Business acquisitions and investments, net of cash acquired | | (553 | ) | | | (242 | ) | | | (58 | ) |
(Purchase) sale of short-term investments, net | | (32 | ) | | | 117 | | | | 138 | |
Purchases of Blue Chip Swap securities | | (207 | ) | | | (185 | ) | | | (259 | ) |
Proceeds from sales of Blue Chip Swap securities | | 152 | | | | 97 | | | | 111 | |
Proceeds from sale of Liberty shares | | - | | | | 137 | | | | 732 | |
Proceeds from sale of ADC shares | | - | | | | - | | | | 223 | |
Proceeds from sale of real estate | | - | | | | - | | | | 120 | |
Other | | 107 | | | | (108 | ) | | | (93 | ) |
NET CASH USED IN INVESTING ACTIVITIES | | (3,145 | ) | | | (2,783 | ) | | | (1,388 | ) |
Cash flows from financing activities: |
| | |
| | |
| |
Dividends paid | | (1,533 | ) | | | (1,317 | ) | | | (848 | ) |
Stock repurchase program | | (1,737 | ) | | | (694 | ) | | | - | |
Proceeds from employee stock purchase plan | | 219 | | | | 191 | | | | 142 | |
Proceeds from exercise of stock options | | 29 | | | | 90 | | | | 81 | |
Taxes paid on net-settled stock-based compensation awards | | (90 | ) | | | (169 | ) | | | (93 | ) |
Proceeds from issuance of long-term debt | | 1,475 | | | | 994 | | | | - | |
Repayment of long-term debt | | (955 | ) | | | (1,578 | ) | | | (1,650 | ) |
Net (decrease) increase in short-term borrowings | | (115 | ) | | | 2 | | | | 37 | |
Other | | (65 | ) | | | (31 | ) | | | (51 | ) |
NET CASH USED IN FINANCING ACTIVITIES | | (2,772 | ) | | | (2,512 | ) | | | (2,382 | ) |
Net increase (decrease) in cash before translation effect | | 685 | | | | 1,342 | | | | (50 | ) |
Impact of changes in exchange rates on cash | | (41 | ) | | | (97 | ) | | | (52 | ) |
Cash, beginning of period | | 2,900 | | | | 1,655 | | | | 1,757 | |
Cash, end of period | $ | 3,544 | | | $ | 2,900 | | | $ | 1,655 | |
(1)Includes depreciation of fixed assets and amortization of intangible assets, exploration data costs and APS investments.
(2)Net of the effect of business acquisitions and divestitures.
See the Notes to Consolidated Financial Statements
SCHLUMBERGER LIMITED AND SUBSIDIARIES
CONSOLIDATED STATEMENT OF STOCKHOLDERS’ EQUITY
| | | | | | | | | | | | | | | | | | | | | | | | |
| | (Stated in millions) | |
| |
| |
|
| |
|
| |
| Accumulated | |
|
| |
|
| |
| |
| |
|
| |
|
| |
| Other | |
|
| |
|
| |
| | Common Stock | |
| Retained | |
| Comprehensive | |
| Noncontrolling | |
|
| |
| | Issued | | | In Treasury | |
| Earnings | |
| Loss | |
| Interests | |
| Total | |
Balance, January 1, 2022 | | $ | 12,608 | | | $ | (2,233 | ) | | $ | 8,199 | | | $ | (3,570 | ) | | $ | 282 | | | $ | 15,286 | |
Net income | |
| |
|
| |
| | 3,441 | |
|
| |
| | 51 | | | | 3,492 | |
Currency translation adjustments | |
| |
|
| |
|
| |
| | (26 | ) |
| | | | | (26 | ) |
Changes in fair value of cash flow hedges | |
| |
|
| |
|
| |
| | (31 | ) |
|
| | | | (31 | ) |
Pension and other postretirement benefit plans | |
| |
|
| |
|
| |
| | (229 | ) |
|
| | | | (229 | ) |
Vesting of restricted stock, net of taxes withheld | | | (795 | ) |
| | 702 | |
|
| |
|
| |
|
| | | | (93 | ) |
Employee stock purchase plan | | | (222 | ) |
| | 364 | |
|
| |
|
| |
|
| | | | 142 | |
Stock-based compensation expense | | | 313 | |
|
| |
|
| |
|
| |
|
| | | | 313 | |
Shares sold to optionees, less shares exchanged | | | (67 | ) |
| | 148 | |
| | |
|
| |
|
| | | | 81 | |
Dividends declared ($0.65 per share) | | | | | | | | | (921 | ) | | | | | | | | | (921 | ) |
Other | | | |
| | 3 | |
| | |
| | 1 | |
| | (29 | ) | | | (25 | ) |
Balance, December 31, 2022 | | | 11,837 | | | | (1,016 | ) | | | 10,719 | | | | (3,855 | ) | | | 304 | | | | 17,989 | |
Net income | |
| |
|
| |
| | 4,203 | |
|
| |
| | 72 | | | | 4,275 | |
Currency translation adjustments | |
| |
|
| |
|
| |
| | (113 | ) |
| | | | | (113 | ) |
Changes in fair value of cash flow hedges | |
| |
|
| |
|
| |
| | 158 | |
|
| | | | 158 | |
Pension and other postretirement benefit plans | |
| |
|
| |
|
| |
| | (414 | ) |
|
| | | | (414 | ) |
Vesting of restricted stock, net of taxes withheld | | | (702 | ) |
| | 533 | |
|
| |
|
| |
|
| | | | (169 | ) |
Employee stock purchase plan | | | (162 | ) |
| | 353 | |
|
| |
|
| |
|
| | | | 191 | |
Stock repurchase program | |
| |
| | (694 | ) |
|
| |
|
| |
|
| | | | (694 | ) |
Stock-based compensation expense | | | 293 | |
|
| |
|
| |
|
| |
|
| | | | 293 | |
Shares sold to optionees, less shares exchanged | | | (53 | ) | | | 143 | | | | | | | | | | | | | 90 | |
Dividends declared ($1.00 per share) | |
| |
|
| |
| | (1,425 | ) |
|
| |
|
| | | | (1,425 | ) |
Acquisition of Aker Subsea | | | 413 | | | | | | | | | | | | | 841 | | | | 1,254 | |
Other | | | (2 | ) |
| | 3 | |
| | |
| | (30 | ) |
| | (47 | ) | | | (76 | ) |
Balance, December 31, 2023 | | | 11,624 | | | | (678 | ) | | | 13,497 | | | | (4,254 | ) | | | 1,170 | | | | 21,359 | |
Net income | |
| |
|
| |
| | 4,461 | |
|
| |
| | 118 | |
| | 4,579 | |
Currency translation adjustments | |
| |
|
| |
|
| |
| | (138 | ) |
| | |
| | (138 | ) |
Changes in fair value of cash flow hedges | |
| |
|
| |
|
| |
| | 4 | |
|
| |
| | 4 | |
Pension and other postretirement benefit plans | |
| |
|
| |
|
| |
| | (566 | ) |
|
| |
| | (566 | ) |
Vesting of restricted stock, net of taxes withheld | | | (407 | ) |
| | 317 | |
|
| |
|
| |
|
| |
| | (90 | ) |
Employee stock purchase plan | | | (65 | ) |
| | 284 | |
|
| |
|
| |
|
| |
| | 219 | |
Stock repurchase program | |
| |
| | (1,737 | ) |
|
| |
|
| |
|
| |
| | (1,737 | ) |
Stock-based compensation expense | | | 316 | |
|
| |
|
| |
|
| |
|
| |
| | 316 | |
Shares sold to optionees, less shares exchanged | | | (10 | ) | | | 39 | | | | | | | | | | | | | 29 | |
Dividends declared ($1.10 per share) | |
| |
|
| |
| | (1,563 | ) |
|
| |
|
| |
| | (1,563 | ) |
Other | | | |
| | 2 | |
| | |
| | 4 | |
| | (68 | ) |
| | (62 | ) |
Balance, December 31, 2024 | | $ | 11,458 | |
| $ | (1,773 | ) |
| $ | 16,395 | |
| $ | (4,950 | ) |
| $ | 1,220 | |
| $ | 22,350 | |
See the Notes to Consolidated Financial Statements
SCHLUMBERGER LIMITED AND SUBSIDIARIES
SHARES OF COMMON STOCK
| | | | | | | | | | | |
|
| |
| (Stated in millions) | |
| | | | | | | | |
|
| |
|
| |
| Shares | |
| Issued | |
| In Treasury | |
| Outstanding | |
Balance, January 1, 2022 | | 1,434 | | | | (31 | ) |
| | 1,403 | |
Employee stock purchase plan | | - | |
| | 5 | | | | 5 | |
Vesting of restricted stock, net of taxes withheld | | - | |
| | 10 | | | | 10 | |
Shares sold to optionees, less shares exchanged | | - | |
| | 2 | | | | 2 | |
Balance, December 31, 2022 | | 1,434 | | | | (14 | ) | | | 1,420 | |
Employee stock purchase plan | | - | |
| | 5 | | | | 5 | |
Vesting of restricted stock, net of taxes withheld | | - | |
| | 8 | | | | 8 | |
Shares sold to optionees, less shares exchanged | | - | |
| | 2 | | | | 2 | |
Stock repurchase program | | - | |
| | (13 | ) | | | (13 | ) |
Acquisition of Aker Subsea | | 5 | | | | - | | | | 5 | |
Balance, December 31, 2023 | | 1,439 | | | | (12 | ) | | | 1,427 | |
Employee stock purchase plan | | - | |
| | 5 | |
| | 5 | |
Vesting of restricted stock, net of taxes withheld | | - | |
| | 6 | |
| | 6 | |
Shares sold to optionees, less shares exchanged | | - | |
| | 1 | |
| | 1 | |
Stock repurchase program | | - | |
| | (38 | ) |
| | (38 | ) |
Balance, December 31, 2024 | | 1,439 | |
| | (38 | ) |
| | 1,401 | |
See the Notes to Consolidated Financial Statements
Notes to Consolidated Financial Statements
1. Business Description
Schlumberger Limited (Schlumberger N.V., incorporated in Curaçao) and its consolidated subsidiaries (collectively, “SLB”) form a global technology company that drives energy innovation for a balanced planet. With a global footprint in more than 100 countries and employees representing almost twice as many nationalities, SLB works each day on innovating energy technology, delivering digital at scale, decarbonizing industries, and developing and scaling new energy systems that accelerate the energy transition.
Recently Announced Transaction
On April 2, 2024, SLB announced a definitive agreement to purchase ChampionX Corporation ("ChampionX") in an all-stock transaction. ChampionX is a global leader in chemistry solutions, artificial lift systems, and highly engineered equipment and technologies that help companies drill for and produce oil and gas safely, efficiently, and sustainably around the world. Under the terms of the agreement, ChampionX shareholders will receive 0.735 shares of SLB common stock in exchange for each ChampionX share. At the closing of the transaction ChampionX shareholders will own approximately 9% of SLB's outstanding shares of common stock. ChampionX reported revenue of approximately $2.7 billion for the nine months ended September 30, 2024. The transaction, which is subject to regulatory approvals and other customary closing conditions, received the approval of the ChampionX stockholders at a special meeting held on June 18, 2024. It is anticipated that the transaction will close in the first quarter of 2025.
2. Summary of Accounting Policies
The Consolidated Financial Statements of SLB have been prepared in accordance with accounting principles generally accepted in the United States of America.
Use of Estimates
The preparation of financial statements requires management to make estimates and assumptions that affect the reported amounts of assets and liabilities, the disclosure of contingent liabilities at the date of the financial statements and the reported amounts of revenue and expenses during the reporting period. On an ongoing basis, SLB evaluates its estimates, including those related to collectibility of accounts receivable; revenue recognized for certain long-term construction-type contracts over time; recoverability of fixed assets, goodwill, intangible assets, Asset Performance Solutions investments, and investments in affiliates; income taxes; exploration data; contingencies and actuarial assumptions for employee benefit plans. SLB bases its estimates on historical experience and other assumptions that are believed to be reasonable under the circumstances, the results of which form the basis for making judgments about the carrying values of assets and liabilities that are not readily apparent from other sources. Actual results may differ from these estimates under different assumptions or conditions.
Revenue Recognition
SLB recognizes revenue upon the transfer of control of promised products or services to customers at an amount that reflects the consideration it expects to receive in exchange for these products or services. The vast majority of SLB’s services and product offerings are short-term in nature. The time between invoicing and when payment is due under these arrangements is generally between 30 to 60 days.
Revenue is recognized for certain long-term construction-type contracts over time. These contracts involve significant design and engineering efforts in order to satisfy custom designs for customer-specific applications. Revenue is recognized as work progresses on each contract. Progress is measured by the ratio of actual costs incurred to date on the project in relation to total estimated project costs. The estimate of total project costs has a significant impact on both the amount of revenue recognized as well as the related profit on a project. Revenue and profits on contracts can also be significantly affected by change orders and claims. Due to the nature of these projects, adjustments to estimates of contract revenue and total contract costs may be required as work progresses. Progress billings are generally issued upon completion of certain phases of work as stipulated in the contract. Any expected losses on a project are recorded in full in the period in which they become probable.
Total backlog was $5.4 billion at December 31, 2024, of which approximately 55% is expected to be recognized as revenue during 2025.
Short-term Investments
Short-term investments are comprised primarily of money market funds, time deposits, certificates of deposit, commercial paper, bonds, and notes, substantially all of which are denominated in US dollars and are stated at cost plus accrued interest, which approximates fair value.
For purposes of the Consolidated Statement of Cash Flows, SLB does not consider Short-term investments to be cash equivalents.
Investments in Affiliated Companies
Investments in companies in which SLB does not have a controlling financial interest, but over which it has significant influence, are accounted for using the equity method. SLB’s share of the after-tax earnings of equity method investees is included in Interest & other income. Investments in privately held companies in which SLB does not have the ability to exercise significant influence are accounted for using the cost method. Investments in publicly traded companies in which SLB does not have the ability to exercise significant influence are reported at fair value, with unrealized gains and losses reported as a component of Interest & other income.
Exploration Data
SLB’s exploration data library consists of completed and in-process seismic surveys that are licensed on a nonexclusive basis. SLB capitalizes costs directly incurred in acquiring and processing the exploration data. Such costs are charged to Cost of services based on the percentage of the total costs to the estimated total revenue that SLB expects to receive from the sales of such data. However, an individual survey generally will not carry a net book value greater than a 4-year, straight-line amortized value.
The carrying value of the exploration data library is reviewed for impairment annually as well as when an event or change in circumstance indicating impairment may have occurred. Adjustments to the carrying value are recorded when it is determined that estimated future cash flows, which involve significant judgment on the part of SLB, would not be sufficient to recover the carrying value of the surveys. Significant adverse changes in SLB’s estimated future cash flows could result in impairment charges in a future period.
Asset Performance Solutions
Asset Performance Solutions (“APS”) projects are generally focused on developing and co-managing production of customers’ assets under long-term agreements. SLB invests its own services and products into the field development activities and operations and is compensated on a fee-per-barrel basis or based on cash flow generated. This includes certain arrangements whereby SLB is only compensated based on incremental production that it helps deliver above a mutually agreed baseline.
SLB capitalizes its investments in a project including the direct costs associated with providing its services or products. These capitalized investments are amortized to the Consolidated Statement of Income as the related production is achieved based on the units of production method, whereby each unit produced is assigned a pro-rata portion of the unamortized costs based on estimated total production, resulting in a matching of revenue with the applicable costs.
Concentration of Credit Risk
SLB is exposed to concentrations of credit risk primarily relating to cash, short-term investments, receivables from clients, and derivative financial instruments. SLB places its cash and short-term investments with financial institutions and corporations and limits the amount of credit exposure with any one of them. SLB regularly evaluates the creditworthiness of the issuers in which it invests. By using derivative financial instruments to hedge certain exposures, SLB exposes itself to some credit risk. SLB minimizes this credit risk by entering into transactions with high-quality counterparties, limiting the exposure to each counterparty and monitoring the financial condition of its counterparties.
As a large multinational company, SLB’s accounts receivable are spread over many countries and customers. The United States represented 11% of SLB’s net accounts receivable balance at December 31, 2024. No other country accounted for greater than 10% of SLB’s accounts receivable balance. SLB maintains an allowance for uncollectible accounts receivable based on expected collectibility and performs ongoing credit evaluations of its customers’ financial condition. If the financial condition of SLB’s customers were to deteriorate resulting in an impairment of their ability to make payments, adjustments to the allowance may be required.
See Note 10 - Derivative Instruments and Hedging Activities for details regarding outstanding credit default swaps that SLB has issued to certain financial institutions.
Earnings per Share
The following is a reconciliation from basic to diluted earnings per share of SLB:
| | | | | | | | | | | | |
(Stated in millions, except per share amounts) | |
| | | | | | | | | |
| | Net Income Attributable to SLB | | | Average
Shares
Outstanding | | | Earnings per Share | |
2024: |
|
| |
|
| |
|
| |
Basic |
| $ | 4,461 | |
| | 1,421 | |
| $ | 3.14 | |
Dilutive impact of stock options and restricted stock |
| | - | |
| | 15 | |
|
| |
Diluted |
| $ | 4,461 | |
| | 1,436 | |
| $ | 3.11 | |
2023: |
|
| |
|
| |
|
| |
Basic |
| $ | 4,203 | |
| | 1,425 | |
| $ | 2.95 | |
Dilutive impact of stock options and restricted stock |
| | - | |
| | 18 | |
|
| |
Diluted |
| $ | 4,203 | |
| | 1,443 | |
| $ | 2.91 | |
2022: |
|
| |
|
| |
|
| |
Basic |
| $ | 3,441 | |
| | 1,416 | |
| $ | 2.43 | |
Dilutive impact of stock options and restricted stock |
| | - | |
| | 21 | |
|
| |
Diluted |
| $ | 3,441 | |
| | 1,437 | |
| $ | 2.39 | |
The number of outstanding employee stock options to purchase shares of SLB common stock that were not included in the computation of diluted earnings per share, because to do so would have had an anti-dilutive effect, were as follows:
| | | | | | | | | | | |
(Stated in millions) | |
| | | | | | | |
| 2024 | | | 2023 | | | 2022 | |
Employee stock options | | 16 | | | | 21 | | | | 25 | |
3. Charges and Credits
2024
SLB recorded the following charges and credits during 2024:
| | | | | | | | | | | | | | | |
| (Stated in millions) | |
| | | | | | | | | | | |
| Pretax Charge (Credit) | | | Tax Benefit (Expense) | | | Noncontrolling Interest | | | Net | |
First quarter: | | | | | | | | | | | |
Merger & integration | $ | 25 | | | $ | 6 | | | $ | 5 | | | $ | 14 | |
Second quarter: | | | | | | | | | | | |
Workforce reductions | | 111 | | | | 17 | | | | - | | | | 94 | |
Merger & integration | | 31 | | | | 5 | | | | 8 | | | | 18 | |
Third quarter | | | | | | | | | | | - | |
Workforce reductions | | 65 | | | | 10 | | | | - | | | | 55 | |
Merger & integration | | 47 | | | | 10 | | | | 7 | | | | 30 | |
Fourth quarter | | | | | | | | | | | - | |
Asset impairments | | 162 | | | | 23 | | | | - | | | | 139 | |
Merger & integration | | 63 | | | | 6 | | | | 7 | | | | 50 | |
Workforce reductions | | 61 | | | | 10 | | | | - | | | | 51 | |
Gain on sale of investment | | (24 | ) | | | - | |
| | - | |
| | (24 | ) |
| $ | 541 | | | $ | 87 | |
| $ | 27 | |
| $ | 427 | |
During the second quarter of 2024, SLB commenced a program to realign and optimize its support and service delivery structure in certain parts of its organization. As a result, SLB recorded severance charges of $111 million during the second quarter, $65 million during the third quarter, and $61 million during the fourth quarter which are classified in Restructuring & other in the Consolidated Statement of Income. SLB may record additional charges relating to workforce reductions in 2025 as it continues to realign and optimize its structure.
In connection with the October 2023 acquisition of the Aker Solutions ("Aker") subsea business (see Note 6 - Acquisition) and the pending ChampionX transaction, SLB recorded $165 million of charges during 2024, consisting of: $43 million relating to the amortization of
purchase accounting adjustments associated with the write-up of acquired inventories to its estimated fair value (classified in Cost of sales in the Consolidated Statement of Income), and $122 million of other merger and integration-related costs which are classified in Merger & integration.
During the fourth quarter of 2024, SLB recorded other restructuring charges consisting of $93 million of impairments relating to equity investments and $69 million of fixed asset impairments. These charges are classified in Restructuring & other in the Consolidated Statement of Income.
During the fourth quarter of 2024, SLB sold an investment accounted for under the equity method. SLB received proceeds of $51 million and recognized a gain of $24 million, which is classified in Interest & other, net in the Consolidated Statement of Income.
2023
SLB recorded the following charges and credits during 2023:
| | | | | | | | | | | | | | | |
| (Stated in millions) | |
| | | | | | | | | | | |
| Pretax Charge (Credit) | | | Tax Benefit (Expense) | | | Noncontrolling Interests | | | Net | |
First quarter: | | | | | | | | | | | |
Gain on sale of Liberty shares | $ | (36 | ) | | $ | (8 | ) | | $ | - | | | $ | (28 | ) |
Fourth quarter: | | | | | | | | | | | |
Merger and integration | | 56 | | | | 8 | | | | 8 | | | | 40 | |
Currency devaluation loss in Argentina | | 90 | | | | - | | | | - | | | | 90 | |
| $ | 110 | | | $ | - | | | $ | 8 | |
| $ | 102 | |
First quarter 2023:
•On December 31, 2020, SLB contributed its onshore hydraulic fracturing business in the United States and Canada, including its pressure pumping, pumpdown perforating and Permian frac sand business, to Liberty Energy Inc. (“Liberty”) in exchange for an equity interest in Liberty. During the first quarter of 2023, SLB sold all of its remaining approximately 9 million shares of Liberty and received net proceeds of $137 million. As a result, SLB recognized a gain of $36 million which is classified in Interest & other income, net in the Consolidated Statement of Income.
Fourth quarter 2023:
•In connection with SLB’s acquisition of the Aker subsea business, SLB recorded the following charges: $23 million of acquisition-related transaction costs, including advisory and legal fees; $11 million relating to the amortization of purchase accounting adjustments associated with the write-up of acquired inventories to its estimated fair value; and $22 million of other merger and integration-related costs. $45 million of these costs are classified in Merger & integration in the Consolidated Statement of Income with the remaining $11 million classified in Cost of sales.
•Although SLB’s functional currency in Argentina is the US dollar, a portion of its transactions are denominated in pesos. During the fourth quarter of 2023, Argentina devalued its peso relative to the US dollar by approximately 55%. As a result, SLB recorded a $90 million devaluation charge. $61 million of this charge is classified in Cost of services in the Consolidated Statement of Income, with the remaining $29 million classified in Cost of sales.
2022
SLB recorded the following charges and credits during 2022, all of which are classified in Interest & other income, net in the Consolidated Statement of Income:
| | | | | | | | | | | |
| (Stated in millions) | |
| | | | | | | | |
| Pretax Charge (Credit) | | | Tax Benefit (Expense) | | | Net | |
First quarter: | | | | | | | | |
Gain on sale of Liberty shares | $ | (26 | ) | | $ | (4 | ) | | $ | (22 | ) |
Second quarter: | | | | | | | | |
Gain on sale of Liberty shares | | (215 | ) | | | (14 | ) | | | (201 | ) |
Gain on sale of real estate | | (43 | ) | | | (2 | ) | | | (41 | ) |
Fourth quarter: | | | | | | | | |
Gain on sale of Liberty shares | | (84 | ) | | | (19 | ) | | | (65 | ) |
Loss on Blue Chip Swap transactions | | 139 | | | | - | | | | 139 | |
Gain on ADC equity investment | | (107 | ) | | | (3 | ) | | | (104 | ) |
Gain on repurchase of bonds | | (11 | ) | | | (2 | ) | | | (9 | ) |
| $ | (347 | ) | | $ | (44 | ) |
| $ | (303 | ) |
•During 2022, SLB sold 47.8 million of its shares of Liberty and received proceeds of $730 million. These transactions resulted in gains of $325 million.
•The Central Bank of Argentina maintains certain currency controls that limit SLB’s ability to access US dollars in Argentina and remit cash from its operations in Argentina. A legal indirect foreign exchange mechanism exists, in the form of capital market transactions known as Blue Chip Swaps, which effectively results in a parallel US dollar exchange rate. During the fourth quarter of 2022, SLB entered into Blue Chip Swap transactions that resulted in a loss of $139 million.
•During the fourth quarter of 2022, SLB repurchased $395 million of its 3.75% Senior Notes due 2024, and $409 million of its 4.00% Senior Notes due 2025 for $790 million, resulting in a gain of $11 million after considering the write-off of the related deferred financing fees and other costs.
•SLB accounts for its investment in the Arabian Drilling Company (“ADC”), an onshore and offshore gas and oil rig drilling company in Saudi Arabia, under the equity method. During the fourth quarter of 2022, ADC completed an initial public offering (“IPO”). In connection with the IPO, SLB sold a portion of its interest in a secondary offering that resulted in SLB receiving net proceeds of $223 million. As a result of these transactions, SLB’s ownership interest in ADC decreased from 49% to approximately 34%. SLB recognized a gain of $107 million, representing the gain on the sale of a portion of its interest as well as the effect of the ownership dilution of its equity investment due to the IPO. As of December 31, 2024, the fair value of SLB’s investment in ADC, based on the quoted market price of ADC’s shares, was approximately $0.9 billion and the carrying value of its investment was $0.6 billion. SLB accounts for its share of ADC’s net income on a one-quarter lag.
•During the second quarter of 2022, SLB sold certain real estate and received proceeds of $120 million. As a result of this transaction, SLB recognized a gain of $43 million.
4. Inventories
Inventories, which are stated at the lower of average cost or net realizable value, consist of the following:
| | | | | | | |
(Stated in millions) | |
| | | | | |
| 2024 | | | 2023 | |
Raw materials & field materials | $ | 2,387 | |
| $ | 2,296 | |
Work in progress | | 786 | | | | 762 | |
Finished goods | | 1,202 | |
| | 1,329 | |
| $ | 4,375 | |
| $ | 4,387 | |
5. Fixed Assets
Fixed assets consist of the following:
| | | | | | | |
(Stated in millions) | |
| | | | | |
| 2024 | | | 2023 | |
Land | $ | 315 | |
| $ | 323 | |
Buildings & improvements | | 4,510 | | | | 4,569 | |
Machinery & equipment | | 24,748 | | | | 25,073 | |
| | 29,573 | | | | 29,965 | |
Less: Accumulated depreciation | | 22,214 | |
| | 22,725 | |
| $ | 7,359 | |
| $ | 7,240 | |
The estimated useful lives of Buildings & improvements are primarily 25 to 30 years. The estimated useful lives of Machinery & equipment are primarily 5 to 10 years.
Depreciation expense, which is recorded on a straight-line basis, was $1.6 billion in 2024 and $1.4 billion in each of 2023 and 2022.
6. Acquisition
On October 2, 2023, SLB, Aker, and Subsea7 closed their previously announced joint venture. The new business, OneSubsea, will drive innovation and efficiency in subsea production by helping customers unlock reserves and reduce cycle time. OneSubsea now comprises SLB’s and Aker’s subsea businesses, which include an extensive complementary subsea production and processing technology portfolio, world-class manufacturing scale and capacity, access to industry-leading reservoir and digital domain expertise, unique pore-to-process integration capabilities, and strengthened research and development capabilities.
In addition to contributing its subsea business to the joint venture, at closing SLB issued 5.1 million shares of its common stock valued at $306.5 million to Aker. Concurrently, Subsea7 purchased a 10% interest in exchange for $306.5 million in cash to Aker. The joint venture also issued a promissory note valued at $87.5 million to Aker. SLB owns 70% of the joint venture, while Aker owns 20% and Subsea7 owns 10%.
The formation of the joint venture was accounted for as a business combination. As the majority owner and controlling entity, SLB is considered the acquirer and reflects OneSubsea as a consolidated subsidiary in its Consolidated Financial Statements. The transfer of the SLB subsea business to the joint venture was accounted for at historical cost, while the Aker subsea business was recorded based on the fair value of the assets acquired and liabilities assumed of approximately $1.3 billion.
The combination of the historical cost and fair value, discussed above, resulted in net assets of the joint venture of approximately $2.8 billion upon formation. Aker and Subsea7’s combined 30% interest in the initial net assets of OneSubsea of $0.8 billion was recognized in Noncontrolling interests in the Consolidated Balance Sheet. The $0.1 billion difference between the noncontrolling interest recognized and the fair value of Aker’s net assets acquired less the fair value of the SLB shares of common stock issued to Aker was recorded as an increase to Common stock in the Consolidated Balance Sheet.
The following amounts represent the estimated fair value of assets acquired and liabilities assumed in connection with the formation of the joint venture.
| | | |
(Stated in millions) | |
| | |
Cash | $ | 48 | |
Accounts receivable | | 355 | |
Inventories (1) | | 192 | |
Other current assets | | 237 | |
Fixed assets | | 168 | |
Intangible assets (weighted average life of 18 years) | | 390 | |
Accounts payable and accrued liabilities | | (915 | ) |
Deferred taxes | | (127 | ) |
Other liabilities | | (1 | ) |
Total identifiable net assets | $ | 347 | |
Goodwill (2) | | 966 | |
Total consideration transferred | $ | 1,313 | |
(1)SLB recorded an adjustment of $54 million to write-up the acquired inventory to its estimated fair value. SLB’s Cost of sales reflected this increased valuation as the acquired inventory was sold. $11 million of this adjustment was expensed as of December 31, 2023 and the remaining $43 million was expensed in 2024. See Note 3 – Charges and Credits.
(2)The goodwill recognized is primarily attributable to intangible assets that do not qualify for separate recognition as well as expected synergies from combining the subsea operations of SLB and Aker. None of the goodwill is deductible for income tax purposes.
For the period from October 2, 2023 to December 31, 2023, the subsea business acquired from Aker contributed revenue of approximately $0.5 billion. The acquired Aker subsea business’ contribution to Net income attributable to SLB for the same period was not material.
Aker reported revenue for its subsea business of approximately $1.5 billion for the year ended December 31, 2022 and $1.4 billion for the nine months ended September 30, 2023. Assuming SLB had acquired Aker’s subsea business as of January 1, 2022, Net income attributable to SLB and diluted earnings per share on a pro forma basis would not be materially different from SLB’s reported results for the years ended December 31, 2023 and 2022, respectively.
7. Goodwill
The changes in the carrying amount of goodwill by segment were as follows:
| | | | | | | | | | | | | | | | | | | | | | | |
| (Stated in millions) | |
| | | | | | | | | | | | | | | | | |
| Digital & | |
| Reservoir | |
| Well | |
| Production | |
| | |
|
| |
| Integration | |
| Performance | |
| Construction | |
| Systems | |
| Other | |
| Total | |
Balance, December 31, 2022 | $ | 2,044 | | | $ | 3,804 | | | $ | 6,281 | | | $ | 853 | | | $ | - | | | $ | 12,982 | |
Acquisitions | | - | | | | - | | | | 136 | | | | 966 | | | | - | | | | 1,102 | |
Balance, December 31, 2023 | | 2,044 | | | | 3,804 | | | | 6,417 | | | | 1,819 | | | | - | | | | 14,084 | |
Acquisitions | | - | | | | - | | | | 5 | | | | 22 | | | | 482 | | | | 509 | |
Balance, December 31, 2024 | $ | 2,044 | |
| $ | 3,804 | |
| $ | 6,422 | |
| $ | 1,841 | |
| $ | 482 | |
| $ | 14,593 | |
8. Intangible Assets
Intangible assets consist of the following:
| | | | | | | | | | | | | | | | | | | | | | | |
| (Stated in millions) | |
| | |
| 2024 | |
| 2023 | |
| Gross | |
| Accumulated | | | Net Book | |
| Gross | |
| Accumulated | | | Net Book | |
| Book Value | |
| Amortization | | | Value | |
| Book Value | |
| Amortization | | | Value | |
Customer relationships | $ | 1,887 | |
| $ | 799 | |
| $ | 1,088 | |
| $ | 1,887 | |
| $ | 709 | |
| $ | 1,178 | |
Technology/technical know-how | | 1,588 | | | | 872 | |
| | 716 | |
| | 1,516 | | | | 770 | |
| | 746 | |
Trade names | | 795 | |
| | 299 | |
| | 496 | |
| | 795 | |
| | 265 | |
| | 530 | |
Other | | 1,604 | |
| | 892 | |
| | 712 | |
| | 1,582 | |
| | 797 | |
| | 785 | |
| $ | 5,874 | |
| $ | 2,862 | |
| $ | 3,012 | |
| $ | 5,780 | |
| $ | 2,541 | |
| $ | 3,239 | |
Customer relationships are generally amortized over periods ranging from 18 to 28 years, technology/technical know-how are generally amortized over periods ranging from 10 to 18 years, and trade names are generally amortized over periods ranging from 15 to 30 years.
Amortization expense was $334 million in 2024, $314 million in 2023, and $301 million in 2022.
Based on the carrying value of intangible assets at December 31, 2024, amortization expense for the subsequent five years is estimated to be as follows: 2025: $322 million, 2026: $312 million, 2027: $308 million, 2028: $298 million and 2029: $285 million.
9. Long-term Debt and Debt Facility Agreements
Long-term Debt consists of the following:
| | | | | | | |
(Stated in millions) | |
| | | | | |
| 2024 | | | 2023 | |
3.90% Senior Notes due 2028 | $ | 1,478 | |
| $ | 1,469 | |
2.65% Senior Notes due 2030 | | 1,250 | | | | 1,250 | |
1.375% Guaranteed Notes due 2026 | | 1,040 | | | | 1,104 | |
2.00% Guaranteed Notes due 2032 | | 1,034 | | | | 1,098 | |
0.25% Notes due 2027 | | 936 | | | | 994 | |
0.50% Notes due 2031 | | 935 | | | | 992 | |
4.30% Senior Notes due 2029 | | 848 | |
| | 847 | |
1.00% Guaranteed Notes due 2026 | | 624 | |
| | 662 | |
4.85% Senior Notes due 2033 | | 498 | | | | 497 | |
4.50% Senior Notes due 2028 | | 497 | | | | 497 | |
5.00% Senior Notes due 2027 | | 495 | | | | - | |
5.00% Senior Notes due 2029 | | 493 | | | | - | |
5.00% Senior Notes due 2034 | | 489 | | | | - | |
7.00% Notes due 2038 | | 197 | |
| | 200 | |
5.95% Notes due 2041 | | 111 | |
| | 112 | |
5.13% Notes due 2043 | | 98 | | | | 98 | |
4.00% Senior Notes due 2025 | | - | |
| | 523 | |
1.40% Senior Notes due 2025 | | - | | | | 499 | |
Other | | - | |
| | - | |
| $ | 11,023 | |
| $ | 10,842 | |
Long-term Debt as of December 31, 2024 is due as follows: $1.7 billion in 2026, $1.4 billion in 2027, $2.0 billion in 2028, $1.3 billion in 2029, $1.3 billion in 2030 and $3.3 billion thereafter.
The estimated fair value of SLB’s Long-term Debt at December 31, 2024 and December 31, 2023 was $10.4 billion and $10.2 billion, respectively, and was estimated based on quoted market prices.
At December 31, 2024, SLB had committed credit facility agreements with commercial banks aggregating $5.0 billion, of which $2.0 billion matures in February 2028 and $3.0 billion matures in December 2029. These committed facilities support commercial paper programs in the United States and Europe. There were no borrowings under these facilities at December 31, 2024 and 2023.
Commercial paper borrowings are classified as long-term debt to the extent they are backed up by available and unused committed credit facilities maturing in more than one year and to the extent it is SLB’s intent to maintain these obligations for longer than one year. There were no borrowings under the commercial paper programs at December 31, 2024 and 2023.
Schlumberger Limited fully and unconditionally guarantees the securities issued by certain of its subsidiaries, including securities issued by Schlumberger Investment SA and Schlumberger Finance Canada Ltd., both indirect wholly-owned subsidiaries of Schlumberger Limited.
10. Derivative Instruments and Hedging Activities
SLB’s functional currency is primarily the US dollar. Approximately 70% of SLB’s revenues in 2024 were denominated in US dollars. However, outside the United States, a significant portion of SLB’s expenses is incurred in foreign currencies. Therefore, when the US dollar weakens (strengthens) in relation to the foreign currencies of the countries in which SLB conducts business, the US dollar-reported expenses will increase (decrease).
Changes in foreign currency exchange rates expose SLB to risks on future cash flows relating to its fixed rate debt denominated in currencies other than the functional currency. SLB uses cross-currency interest rate swaps to provide a hedge against these risks. These contracts are accounted for as cash flow hedges, with the fair value of the derivative recorded on the Consolidated Balance Sheet and in Accumulated other comprehensive loss. Amounts recorded in Accumulated other comprehensive loss are reclassified into earnings in the same period or periods that the hedged item is recognized in earnings.
Details regarding SLB’s outstanding cross-currency interest rate swaps as of December 31, 2024, were as follows:
•During 2019, SLB entered into cross-currency interest rate swaps in order to hedge changes in the fair value of its €0.5 billion 0.25% Notes due 2027 and €0.5 billion 0.50% Notes due 2031 that were issued by a US-dollar functional currency subsidiary. These cross-currency interest rate swaps effectively convert the Euro-denominated notes to US-dollar denominated debt with fixed annual interest rates of 2.51% and 2.76%, respectively.
•During 2020, a US-dollar functional currency subsidiary of SLB issued €0.8 billion of Euro-denominated debt. SLB entered into cross-currency interest rate swaps to hedge changes in the fair value of its €0.4 billion of 0.25% Notes due 2027 and €0.4 billion of 0.50% Notes due 2031. These cross-currency interest rate swaps effectively convert the Euro-denominated notes to US-dollar denominated debt with fixed annual interest rates of 1.87% and 2.20%, respectively.
•During 2020, a US-dollar functional currency subsidiary of SLB issued €2.0 billion of Euro-denominated debt. SLB entered into cross-currency interest rate swaps to hedge changes in the fair value of its €1.0 billion of 1.375% Guaranteed Notes due 2026 and €1.0 billion of 2.00% Guaranteed Notes due 2032. These cross-currency interest rate swaps effectively convert the Euro-denominated notes to US-dollar denominated debt with fixed annual interest rates of 2.77% and 3.49%, respectively.
•During 2020, a Canadian dollar functional currency subsidiary of SLB issued $0.5 billion of US dollar denominated debt. SLB entered into cross-currency interest rate swaps to hedge changes in the fair value of its $0.5 billion 1.40% Senior Notes due 2025. These cross-currency interest rate swaps effectively convert the US dollar notes to Canadian dollar denominated debt with a fixed annual interest rate of 1.73%.
A summary of the amounts included in the Consolidated Balance Sheet relating to cross currency interest rate swaps follows:
| | | | | | | |
| (Stated in millions) | |
| | | | | |
| Dec. 31, 2024 | | | Dec. 31, 2023 | |
Other current assets | $ | 37 | | | $ | - | |
Other Assets | $ | 2 | | | $ | 36 | |
Other Liabilities | $ | 183 | |
| $ | 67 | |
The fair values were determined using a model with inputs that are observable in the market or can be derived or corroborated by observable data.
SLB is exposed to risks on future cash flows to the extent that the local currency is not the functional currency and expenses denominated in local currency are not equal to revenues denominated in local currency. SLB uses foreign currency forward contracts to provide a hedge against a portion of these cash flow risks. These contracts are accounted for as cash flow hedges.
SLB is also exposed to changes in the fair value of assets and liabilities denominated in currencies other than the functional currency. While SLB uses foreign currency forward contracts to economically hedge this exposure as it relates to certain currencies, these contracts are not designated as hedges for accounting purposes. Instead, the fair value of the derivative is recorded on the Consolidated Balance Sheet and changes in the fair value are recognized in the Consolidated Statement of Income, as are changes in the fair value of the hedged item. Transaction losses of $139 million in 2024, $154 million (including $90 million related to the Argentina devaluation; see Note 3 – Charges and credits for further details) in 2023, and $96 million in 2022 were recognized in the Consolidated Statement of Income net of related hedging activities.
Foreign currency forward contracts were outstanding for the US dollar equivalent of $5.5 billion and $5.4 billion in various foreign currencies as of December 31, 2024 and 2023, respectively.
Other than the previously mentioned cross-currency interest rate swaps, the fair value of the other outstanding derivatives was not material as of December 31, 2024 and 2023.
The effect of derivative instruments designated as hedges and those not designated as hedges on the Consolidated Statement of Income was as follows:
| | | | | | | | | | | | | |
| | | | (Stated in millions) | | |
|
| | | | | | | | | | |
| Gain (Loss) Recognized in Income | | | Consolidated Statement |
| 2024 | |
| 2023 | |
| 2022 | | | of Income Classification |
Derivatives designated as cash flow hedges: | | | | | | | | | | |
Cross-currency interest rate swaps | $ | (199 | ) | | $ | 173 | | | $ | (254 | ) | | Cost of services/sales |
Cross-currency interest rate swaps | | (85 | ) | | | (88 | ) | | | (88 | ) | | Interest expense |
Commodity contracts | | (7 | ) | | | 3 | | | | (87 | ) | | Revenue |
Foreign currency forward contracts | | 23 | | | | 15 | | | | (30 | ) | | Cost of services/sales |
Foreign exchange contract | | (12 | ) | | | - | | | | - | | | Revenue |
| $ | (280 | ) | | $ | 103 | | | $ | (459 | ) | | |
Derivatives not designated as hedges: |
| |
|
| |
|
| | |
|
Foreign currency forward contracts | $ | 5 | | | $ | (9 | ) | | $ | 42 | | | Cost of services/sales |
| | | | | | | | | | |
SLB has issued credit default swaps (“CDSs”) to certain financial institutions that have an aggregate notional amount outstanding of approximately $1.15 billion as of December 31, 2024. The CDSs relate to borrowings provided by the financial institutions to SLB’s primary customer in Mexico. The borrowings were used by this customer to pay certain of SLB’s outstanding receivables. Approximately $350 million of the outstanding CDSs reduces on a monthly basis over its remaining 14-month term while the remaining $800 million reduces on a monthly basis over its remaining 18-month term. The fair value of these derivative liabilities was not material at December 31, 2024.
11. Stockholders’ Equity
SLB is authorized to issue 4,500,000,000 shares of common stock, par value $0.01 per share, of which 1,400,850,420 and 1,427,394,843 shares were outstanding on December 31, 2024 and 2023, respectively. Holders of common stock are entitled to one vote for each share of stock held. SLB is also authorized to issue 200,000,000 shares of preferred stock, par value $0.01 per share, which may be issued in series with terms and conditions determined by the SLB Board of Directors. No shares of preferred stock have been issued.
Accumulated Other Comprehensive Loss consists of the following:
| | | | | | | | | | | |
| | | | | | | (Stated in millions) | |
| | | | | | | | |
| 2024 | | | 2023 | | | 2022 | |
Currency translation adjustments | $ | (2,697 | ) | | $ | (2,557 | ) | | $ | (2,444 | ) |
Pension and other postretirement benefit plans | | (2,275 | ) |
| | (1,709 | ) |
| | (1,295 | ) |
Cash flow hedges | | 46 | |
| | 42 | |
| | (116 | ) |
Other | | (24 | ) |
| | (30 | ) |
| | - | |
| $ | (4,950 | ) |
| $ | (4,254 | ) |
| $ | (3,855 | ) |
12. Stock-based Compensation Plans
SLB has three types of stock-based compensation programs: (i) a restricted stock unit and performance share unit program (collectively referred to as “restricted stock”), (ii) a discounted stock purchase plan (“DSPP”), and (iii) stock options.
Restricted Stock
SLB grants performance share units to certain key employees. The number of shares earned is determined at the end of each performance period based on SLB’s achievement of certain predefined targets as described in the underlying performance share unit agreement. In the event SLB exceeds the predefined target, shares for up to a maximum of 250% of the target award may be awarded. In the event SLB falls below the predefined target, a reduced number of shares may be awarded. If SLB falls below the threshold award performance level, no shares will be awarded. As of December 31, 2024, 2.4 million performance share units were outstanding assuming the achievement of 100% of target.
Restricted stock awards do not pay dividends or have voting rights prior to vesting and generally vest at the end of three years or ratably in equal tranches over a three-year period. The fair value of a restricted stock award is generally the quoted market price of SLB’s stock on the date of grant less the present value of the expected dividends not received prior to vesting.
The following table summarizes information related to restricted stock activity:
| | | | | | | | | | | | | | | | | | | | | | | |
| (Shares stated in millions) | |
| | |
| 2024 | | | 2023 | | | 2022 | |
| | |
| Weighted- | | | | |
| Weighted- | | | | |
| Weighted- | |
| | | | Average | | | | | | Average | | | | | | Average | |
| Restricted | | | Grant Date | | | Restricted | | | Grant Date | | | Restricted | | | Grant Date | |
| Stock | |
| Fair Value | | | Stock | |
| Fair Value | | | Stock | |
| Fair Value | |
Unvested at beginning of year | | 14 | | | $ | 39.88 | |
| | 18 | | | $ | 30.24 | |
| | 22 | | | $ | 29.03 | |
Granted | | 6 | | | $ | 45.44 | |
| | 5 | | | $ | 56.24 | |
| | 7 | | | $ | 36.16 | |
Adjustments for performance achieved | | 1 | | | $ | 22.85 | | | | 2 | | | $ | 32.47 | | | | 2 | | | $ | 35.55 | |
Vested | | (8 | ) | | $ | 32.50 | | | | (11 | ) | | $ | 29.82 | | | | (13 | ) | | $ | 32.42 | |
Unvested at year-end | | 13 | |
| $ | 46.12 | |
| | 14 | |
| $ | 39.88 | |
| | 18 | |
| $ | 30.24 | |
Discounted Stock Purchase Plan
Under the terms of the DSPP, employees can choose to have a portion of their earnings withheld, subject to certain restrictions, to purchase SLB common stock. Until July 1, 2022, the purchase price of the stock was 92.5% of the lower of the stock price at the beginning
or end of the plan period at six-month intervals. Effective July 1, 2022, the purchase price of the stock was changed to 85% of the lower of the stock price at the beginning or end of the plan period at six-month intervals.
The fair value of the employees’ purchase rights under the DSPP was estimated using the Black-Scholes model with the following assumptions and resulting weighted-average fair value per share:
| | | | | | | | | | | |
| 2024 | | | 2023 | | | 2022 | |
Dividend yield | | 2.1 | % | | | 1.7 | % | | | 1.8 | % |
Expected volatility | | 31 | % | | | 50 | % | | | 47 | % |
Risk-free interest rate | | 5.31 | % | | | 5.13 | % | | | 1.32 | % |
Weighted-average fair value per share | $ | 12.02 | | | $ | 14.93 | | | $ | 8.05 | |
Stock Options
Key employees may be granted stock options under SLB stock option plans. The exercise price equals the average of the high and low sales prices of SLB stock on the date of grant. The maximum term is 10 years, and the options generally vest in increments over five years.
The following table summarizes stock option activity:
| | | | | | | | | | | | | | | | | | | | | | | |
| (Shares stated in millions) | |
| | |
| 2024 | | | 2023 | | | 2022 | |
| | |
| Weighted- | | | | |
| Weighted- | | | | |
| Weighted- | |
| | | | Average | | | | | | Average | | | | | | Average | |
| | | | Exercise | | | | | | Exercise | | | | | | Exercise | |
| Shares | |
| Price | | | Shares | |
| Price | | | Shares | |
| Price | |
Outstanding at beginning of year | | 28 | | | $ | 72.33 | |
| | 35 | | | $ | 70.31 | |
| | 42 | | | $ | 68.95 | |
Exercised | | (1 | ) | | $ | 39.91 | | | | (2 | ) | | $ | 40.02 | | | | (2 | ) | | $ | 40.04 | |
Forfeited / expired | | (5 | ) | | $ | 91.55 | |
| | (5 | ) | | $ | 73.18 | |
| | (5 | ) | | $ | 71.45 | |
Outstanding at year-end | | 22 | |
| $ | 69.20 | |
| | 28 | |
| $ | 72.33 | |
| | 35 | |
| $ | 70.31 | |
The following table summarizes information related to options outstanding and options exercisable as of December 31, 2024:
| | | | | | | | | | | | | | | | | | | |
| (Shares stated in millions) | |
| | |
| Options Outstanding | |
| Options Exercisable | |
| | | | Weighted- | | | | | | | | | | |
| | | | Average | | | Weighted- | | | | | | Weighted- | |
| Options | | | Remaining Life | | | Average | | | Options | | | Average | |
Exercise prices range | Outstanding | |
| (in years) | | | Exercise Price | |
| Exercisable | | | Exercise Price | |
$38.75 - $41.47 | | 6 | |
| | 4.7 | |
| $ | 39.75 | |
| | 5 | |
| $ | 40.00 | |
$47.55 - $77.10 | | 5 | |
| | 1.8 | |
| $ | 70.54 | |
| | 5 | |
| $ | 70.54 | |
$77.80 - $84.22 | | 5 | | | | 1.0 | | | $ | 80.09 | | | | 5 | | | $ | 80.09 | |
$87.38 - $91.74 | | 6 | |
| | 1.2 | |
| $ | 89.44 | |
| | 6 | |
| $ | 89.44 | |
| | 22 | |
| | 2.3 | |
| $ | 69.20 | |
| | 21 | |
| $ | 71.08 | |
The weighted-average remaining contractual life of stock options exercisable as of December 31, 2024 was 2.1 years.
Stock options outstanding as of December 31, 2024 had no intrinsic value.
Total Stock-based Compensation Expense
The following summarizes stock-based compensation expense recognized in income:
| | | | | | | | | | | |
(Stated in millions) | |
| | | | | | | | |
| 2024 | | | 2023 | | | 2022 | |
Restricted stock | $ | 250 | | | $ | 225 | | | $ | 255 | |
DSPP | | 59 | | | | 56 | | | | 41 | |
Stock options | | 7 | | | | 12 | | | | 17 | |
| $ | 316 | | | $ | 293 | | | $ | 313 | |
At December 31, 2024, there was $292 million of total unrecognized compensation cost related to nonvested stock-based compensation arrangements, of which $172 million is expected to be recognized in 2025, $100 million in 2026, $17 million in 2027, and $3 million in 2028.
As of December 31, 2024, approximately 18 million shares of SLB common stock were available for future grants under SLB’s stock-based compensation programs.
13. Income Taxes
Income before taxes subject to United States and non-United States income taxes was as follows:
| | | | | | | | | | | |
(Stated in millions) | |
| | | | | | | | |
| 2024 | | | 2023 | | | 2022 | |
United States | $ | 641 | | | $ | 355 | | | $ | 600 | |
Outside United States | | 5,031 | | | | 4,927 | | | | 3,671 | |
| $ | 5,672 | | | $ | 5,282 | |
| $ | 4,271 | |
SLB recorded net pretax charges of $540 million in 2024 ($188 million of charges in the US and $352 million of net charges outside the US); $110 million in 2023 ($2 million of net credits in the US and $112 million of charges outside the US); and $347 million in 2022 ($379 million of net credits in the US and $32 million of net charges outside the US). These charges and credits are included in the table above and are more fully described in Note 3 – Charges and Credits.
The components of net deferred tax liabilities were as follows:
| | | | | | | |
(Stated in millions) | |
| | | | | |
| 2024 | | | 2023 | |
Intangible assets | $ | (788 | ) | | $ | (844 | ) |
Net operating losses | | 123 | | | | 214 | |
Fixed assets, net | | 173 | | | | 190 | |
Research and development credits | | 158 | | | | 162 | |
Capitalized research and development costs | | 216 | | | | 155 | |
Pension and other postretirement benefits | | (62 | ) | | | (94 | ) |
Other, net | | 113 | | | | 77 | |
| $ | (67 | ) | | $ | (140 | ) |
Approximately $97 million of the $123 million deferred tax asset relating to net operating losses at December 31, 2024 can be carried forward indefinitely. The majority of the remaining balance expires at various dates between 2037 and 2042.
The deferred tax balance at December 31, 2024 and 2023 was net of valuation allowances relating to the following:
| | | | | | | |
(Stated in millions) | |
| | | | | |
| 2024 | | | 2023 | |
US foreign tax credits | $ | 162 | | | $ | 188 | |
Net operating losses | $ | 62 | | | $ | 106 | |
The vast majority of the $162 million of US foreign tax credits will expire by 2026.
The components of Tax expense were as follows:
| | | | | | | | | | | |
(Stated in millions) | |
| | | | | | | | |
| 2024 | | | 2023 | | | 2022 | |
Current: | | | | | | | | |
United States-Federal | $ | 10 | | | $ | (23 | ) | | $ | 2 | |
United States-State | | 7 | | | | 5 | | | | 3 | |
Outside United States | | 1,117 | | | | 997 | | | | 813 | |
| | 1,134 | | | | 979 | | | | 818 | |
Deferred: |
| | |
| | |
| |
United States-Federal | $ | 88 | | | $ | (77 | ) | | $ | 98 | |
United States-State | | 2 | | | | 6 | | | | 13 | |
Outside United States | | (61 | ) | | | 104 | | | | (70 | ) |
Valuation allowance | | (70 | ) | | | (5 | ) | | | (80 | ) |
| | (41 | ) | | | 28 | | | | (39 | ) |
| $ | 1,093 | | | $ | 1,007 | | | $ | 779 | |
A reconciliation of the United States statutory federal tax rate to the consolidated effective tax rate follows:
| | | | | | | | | | | |
| 2024 | | | 2023 | | | 2022 | |
US federal statutory rate | | 21 | % | | | 21 | % | | | 21 | % |
Charges and credits (See Note 3) | | - | | | | - | | | | (1 | ) |
Change in valuation allowance | | (1 | ) | | | - | | | | (2 | ) |
Other | | (1 | ) | | | (2 | ) | | | - | |
| | 19 | % | | | 19 | % | | | 18 | % |
A number of the jurisdictions in which SLB operates have tax laws that are not fully defined and are evolving. SLB’s tax filings are subject to regular audit by the tax authorities. These audits may result in assessments for additional taxes that are resolved with the tax authorities or, potentially, through the courts. Tax liabilities are recorded based on estimates of additional taxes that will be due upon the conclusion of these audits. Due to the uncertain and complex application of tax regulations, the ultimate resolution of audits may result in liabilities which could be materially different from these estimates.
A reconciliation of the beginning and ending amount of liabilities associated with uncertain tax positions is as follows:
| | | | | | | | | | | |
(Stated in millions) | |
| | | | | | | | |
| 2024 | | | 2023 | | | 2022 | |
Balance at beginning of year | $ | 783 | | | $ | 893 | | | $ | 1,001 | |
Additions based on tax positions related to the current year | | 79 | | | | 66 | | | | 41 | |
Additions for tax positions of prior years | | 150 | | | | 91 | | | | 64 | |
Impact of changes in exchange rates | | (23 | ) | | | (25 | ) | | | (38 | ) |
Settlements with tax authorities | | (75 | ) | | | (36 | ) | | | (37 | ) |
Reductions for tax positions of prior years | | (104 | ) | | | (176 | ) | | | (94 | ) |
Reductions due to the lapse of statute of limitations | | (95 | ) | | | (30 | ) | | | (44 | ) |
| $ | 715 | | | $ | 783 | | | $ | 893 | |
The amounts above exclude accrued interest and penalties of $116 million at December 31, 2024 and $155 million at December 31, 2023. SLB classifies interest and penalties relating to uncertain tax positions within Tax expense in the Consolidated Statement of Income.
The following table summarizes the tax years that are either currently under audit or remain open and subject to examination by the tax authorities in the most significant jurisdictions in which SLB operates:
| |
Ecuador | 2020 - 2024 |
Mexico | 2019 - 2024 |
Norway | 2019 - 2024 |
Russia | 2022 - 2024 |
Saudi Arabia | 2019 - 2024 |
United Kingdom | 2020 - 2024 |
United States | 2021 - 2024 |
14. Leases
SLB’s leasing activities primarily consist of operating leases for administrative offices, manufacturing facilities, research centers, service centers, sales offices, and certain equipment. Total operating lease expense, which approximates cash paid and includes short-term leases, was $1.4 billion in each of 2024 and 2023 and $1.2 billion in 2022.
Maturities of operating lease liabilities as of December 31, 2024 were as follows:
| | | |
(Stated in millions) | |
| | |
2025 | $ | 193 | |
2026 | | 142 | |
2027 | | 118 | |
2028 | | 96 | |
2029 | | 72 | |
Thereafter | | 249 | |
Total lease payments | $ | 870 | |
Less: Interest | | (128 | ) |
| $ | 742 | |
Amounts recognized in balance sheet: | | |
Accounts payable and accrued liabilities | $ | 186 | |
Other Liabilities | | 556 | |
| $ | 742 | |
The weighted-average remaining lease term as of December 31, 2024 was 8 years. The weighted-average discount rate used to determine the operating lease liability as of December 31, 2024 was 3.8%.
15. Contingencies
SLB is party to various legal proceedings from time to time. A liability is accrued when a loss is both probable and can be reasonably estimated. Management believes that the probability of a material loss with respect to any currently pending legal proceeding is remote. However, litigation is inherently uncertain, and it is not possible to predict the ultimate disposition of any of these proceedings.
16. Segment Information
SLB is organized under four Divisions that combine and integrate SLB’s technologies, enhancing the Company’s ability to support the emerging long-term growth opportunities in each of these market segments.
The four Divisions, representing SLB’s segments, are:
•Digital & Integration – Combines SLB’s industry-leading digital solutions and data products with its integrated offering of Asset Performance Solutions.
•Reservoir Performance – Consists of reservoir-centric technologies and services that are critical to optimizing reservoir productivity and performance.
•Well Construction – Combines the full portfolio of products and services to optimize well placement and performance, maximize drilling efficiency, and improve wellbore assurance.
•Production Systems – Develops technologies and provides expertise that enhance production and recovery from subsurface reservoirs to the surface, into pipelines, and to refineries.
Financial information by segment is as follows:
| | | | | | | | | | | | | | | | | | | |
| | | | (Stated in millions) | |
| | | | | | | | | | | | | | |
| 2024 | |
| | |
| | |
| | | | Depreciation | |
| | |
| | | | Pretax | | | | | | and | | | Capital | |
| Revenue | | | Income | | | Assets | | | Amortization | | | Investments | |
Digital & Integration | $ | 4,247 | | | $ | 1,408 | |
| $ | 3,117 | | | $ | 654 | |
| $ | 682 | |
Reservoir Performance | | 7,177 | | | | 1,452 | |
| | 3,802 | | | | 403 | |
| | 624 | |
Well Construction | | 13,357 | | | | 2,826 | |
| | 6,741 | | | | 649 | |
| | 745 | |
Production Systems | | 12,143 | | | | 1,898 | | | | 7,116 | | | | 348 | | | | 418 | |
Eliminations & other | | (635 | ) | | | (263 | ) |
| | 1,247 | | | | 287 | |
| | 143 | |
Goodwill and intangible assets | | | | | | | | 17,605 | | | | | | | |
Cash and short-term investments | | | | | | | | 4,669 | | | | | | | |
All other assets | | | | | | | | 4,638 | | | | | | | |
Corporate & other (1) | | | | | (744 | ) |
| | | | | 178 | |
| | |
Interest income (2) | | | | | 134 | |
| | | | | |
| | |
Interest expense (3) | | | | | (498 | ) | | | | | | | | | |
Charges & credits (4) | | | | | (541 | ) |
| | | | | |
| | |
| $ | 36,289 | |
| $ | 5,672 | |
| $ | 48,935 | | | $ | 2,519 | |
| $ | 2,612 | |
| | | | | | | | | | | | | | | | | | | |
| | | | (Stated in millions) | |
| | | | | | | | | | | | | | |
| 2023 | |
| | |
| | |
| | | | Depreciation | |
| | |
| | | | Pretax | | | | | | and | | | Capital | |
| Revenue | | | Income | | | Assets | | | Amortization | | | Investments | |
Digital & Integration | $ | 3,871 | | | $ | 1,257 | |
| $ | 3,089 | | | $ | 578 | |
| $ | 660 | |
Reservoir Performance | | 6,561 | | | | 1,263 | |
| | 3,491 | | | | 387 | |
| | 514 | |
Well Construction | | 13,478 | | | | 2,932 | |
| | 7,129 | | | | 587 | |
| | 908 | |
Production Systems | | 9,831 | | | | 1,245 | | | | 6,640 | | | | 325 | | | | 384 | |
Eliminations & other | | (606 | ) | | | (174 | ) |
| | 1,352 | | | | 277 | |
| | 133 | |
Goodwill and intangible assets | | | | | | | | 17,323 | | | | | | | |
Cash and short-term investments | | | | | | | | 3,989 | | | | | | | |
All other assets | | | | | | | | 4,944 | | | | | | | |
Corporate & other (1) | | | | | (729 | ) |
| | | | | 158 | |
| | |
Interest income (2) | | | | | 87 | |
| | | | | |
| | |
Interest expense (3) | | | | | (489 | ) | | | | | | | | | |
Charges & credits (4) | | | | | (110 | ) |
| | | | | |
| | |
| $ | 33,135 | |
| $ | 5,282 | |
| $ | 47,957 | | | $ | 2,312 | |
| $ | 2,599 | |
| | | | | | | | | | | | | | | | | | | |
| | | | (Stated in millions) | |
| | | | | | | | | | | | | | |
| 2022 | |
| | |
| | |
| | | | Depreciation | |
| | |
| | | | Pretax | | | | | | and | | | Capital | |
| Revenue | | | Income | | | Assets | | | Amortization | | | Investments | |
Digital & Integration | $ | 3,725 | | | $ | 1,357 | |
| $ | 3,132 | | | $ | 504 | |
| $ | 689 | |
Reservoir Performance | | 5,553 | | | | 881 | |
| | 3,159 | | | | 386 | |
| | 478 | |
Well Construction | | 11,397 | | | | 2,202 | |
| | 6,481 | | | | 524 | |
| | 687 | |
Production Systems | | 7,862 | | | | 748 | | | | 5,603 | | | | 311 | | | | 346 | |
Eliminations & other | | (446 | ) | | | (177 | ) |
| | 1,426 | | | | 271 | |
| | 102 | |
Goodwill and intangible assets | | | | | | | | 15,974 | | | | | | | |
Cash and short-term investments | | | | | | | | 2,897 | | | | | | | |
All other assets | | | | | | | | 4,463 | | | | | | | |
Corporate & other (1) | | | | | (637 | ) |
| | | | | 151 | |
| | |
Interest income (2) | | | | | 27 | |
| | | | | |
| | |
Interest expense (3) | | | | | (477 | ) | | | | | | | | | |
Charges & credits (4) | | | | | 347 | |
| | | | | |
| | |
| $ | 28,091 | |
| $ | 4,271 | |
| $ | 43,135 | | | $ | 2,147 | |
| $ | 2,302 | |
(1)Comprised principally of certain corporate expenses not allocated to the segments, stock-based compensation costs, amortization expense associated with certain intangible assets, certain centrally managed initiatives and other nonoperating items.
(2)Interest income excludes amounts which are included in the segments’ income (2024: $39 million; 2023: $12 million; 2022: $72 million).
(3)Interest expense excludes amounts which are included in the segments’ income (2024: $14 million; 2023: $14 million; 2022: $13 million).
(4)See Note 3 – Charges and Credits.
Segment assets consist of receivables, inventories, fixed assets, exploration data, and APS investments.
Capital investments includes capital expenditures, APS investments, and exploration data cost capitalized.
Depreciation and amortization includes depreciation of fixed assets and amortization of intangible assets, exploration data costs, and APS investments.
Revenue by geographic area for the years ended December 31, 2024, 2023, and 2022 was as follows:
| | | | | | | | | | | |
(Stated in millions) | |
| | | | | | | | |
| 2024 | | | 2023 | | | 2022 | |
North America | $ | 6,680 | | | $ | 6,727 | | | $ | 5,995 | |
Latin America | | 6,719 | | | | 6,645 | | | | 5,661 | |
Europe & Africa * | | 9,671 | | | | 8,524 | | | | 7,201 | |
Middle East & Asia | | 13,026 | | | | 11,019 | | | | 9,033 | |
Eliminations & other | | 193 | | | | 220 | | | | 201 | |
| $ | 36,289 | | | $ | 33,135 | | | $ | 28,091 | |
* Includes Russia and the Caspian region
Revenue is based on the location where services are provided and products are sold.
SLB did not have revenue from third-party customers in its country of domicile during the last three years. Revenue in the United States in 2024, 2023, and 2022 was $5.3 billion, $5.4 billion, and $4.6 billion, respectively.
North America and International revenue disaggregated by segment was as follows:
| | | | | | | | | | | | | | | |
(Stated in millions) | |
| | | | | | | | | | | |
| 2024 | |
| North America | | | International | | | Other | | | Total | |
Digital & Integration | $ | 1,115 | | | $ | 3,127 | | | $ | 5 | | | $ | 4,247 | |
Reservoir Performance | | 548 | | | | 6,622 | | | | 7 | | | | 7,177 | |
Well Construction | | 2,359 | | | | 10,776 | | | | 222 | | | | 13,357 | |
Production Systems | | 2,725 | | | | 9,386 | | | | 32 | | | | 12,143 | |
Eliminations & other | | (67 | ) | | | (496 | ) | | | (72 | ) | | | (635 | ) |
| $ | 6,680 | | | $ | 29,415 | | | $ | 194 | | | $ | 36,289 | |
| | | | | | | | | | | | | | | |
(Stated in millions) | |
| | | | | | | | | | | |
| 2023 | |
| North America | | | International | | | Other | | | Total | |
Digital & Integration | $ | 984 | | | $ | 2,881 | | | $ | 6 | | | $ | 3,871 | |
Reservoir Performance | | 498 | | | | 6,057 | | | | 6 | | | | 6,561 | |
Well Construction | | 2,709 | | | | 10,530 | | | | 239 | | | | 13,478 | |
Production Systems | | 2,598 | | | | 7,219 | | | | 14 | | | | 9,831 | |
Eliminations & other | | (62 | ) | | | (499 | ) | | | (45 | ) | | | (606 | ) |
| $ | 6,727 | | | $ | 26,188 | | | $ | 220 | | | $ | 33,135 | |
| | | | | | | | | | | | | | | |
(Stated in millions) | |
| | | | | | | | | | | |
| 2022 | |
| North America | | | International | | | Other | | | Total | |
Digital & Integration | $ | 1,069 | | | $ | 2,651 | | | $ | 5 | | | $ | 3,725 | |
Reservoir Performance | | 455 | | | | 5,091 | | | | 7 | | | | 5,553 | |
Well Construction | | 2,311 | | | | 8,875 | | | | 211 | | | | 11,397 | |
Production Systems | | 2,176 | | | | 5,675 | | | | 11 | | | | 7,862 | |
Eliminations & other | | (16 | ) | | | (397 | ) | | | (33 | ) | | | (446 | ) |
| $ | 5,995 | | | $ | 21,895 | | | $ | 201 | | | $ | 28,091 | |
Fixed Assets less accumulated depreciation by geographic area was as follows:
| | | | | | | |
(Stated in millions) | |
| | | | | |
| 2024 | | | 2023 | |
North America | $ | 1,805 | | | $ | 1,728 | |
Latin America | | 1,044 | | | | 1,079 | |
Europe & Africa | | 1,721 | | | | 1,804 | |
Middle East & Asia | | 2,789 | | | | 2,629 | |
| $ | 7,359 | | | $ | 7,240 | |
Significant segment expenses, which represents the difference between segment revenue and pretax segment income, consist of the following:
| | | | | | | | | | | | | | | |
(Stated in millions) | |
| | | | | | | | | | | |
| 2024 | |
| Digital & | | | Reservoir | | | Well | | | Production | |
| Integration | | | Performance | | | Construction | | | Systems | |
Compensation | $ | 811 | | | $ | 1,638 | | | $ | 2,587 | | | $ | 1,043 | |
Cost of products, materials, and supplies | | - | | | | 1,232 | | | | 3,579 | | | | 7,610 | |
Depreciation and amortization | | 654 | | | | 403 | | | | 649 | | | | 348 | |
Allocations | | 426 | | | | 668 | | | | 1,011 | | | | 529 | |
Other | | 948 | | | | 1,784 | | | | 2,705 | | | | 715 | |
| $ | 2,839 | | | $ | 5,725 | | | $ | 10,531 | | | $ | 10,245 | |
| | | | | | | | | | | | | | | |
(Stated in millions) | |
| | | | | | | | | | | |
| 2023 | |
| Digital & | | | Reservoir | | | Well | | | Production | |
| Integration | | | Performance | | | Construction | | | Systems | |
Compensation | $ | 806 | | | $ | 1,501 | | | $ | 2,526 | | | $ | 1,104 | |
Cost of products, materials, and supplies | | - | | | | 1,157 | | | | 3,673 | | | | 5,946 | |
Depreciation and amortization | | 578 | | | | 387 | | | | 587 | | | | 325 | |
Allocations | | 424 | | | | 605 | | | | 943 | | | | 492 | |
Other | | 806 | | | | 1,648 | | | | 2,817 | | | | 719 | |
| $ | 2,614 | | | $ | 5,298 | | | $ | 10,546 | | | $ | 8,586 | |
| | | | | | | | | | | | | | | |
(Stated in millions) | |
| | | | | | | | | | | |
| 2022 | |
| Digital & | | | Reservoir | | | Well | | | Production | |
| Integration | | | Performance | | | Construction | | | Systems | |
Compensation | $ | 751 | | | $ | 1,366 | | | $ | 2,247 | | | $ | 976 | |
Cost of products, materials, and supplies | | - | | | | 977 | | | | 3,273 | | | | 4,732 | |
Depreciation and amortization | | 504 | | | | 386 | | | | 524 | | | | 311 | |
Allocations | | 406 | | | | 571 | | | | 828 | | | | 470 | |
Other | | 707 | | | | 1,372 | | | | 2,323 | | | | 625 | |
| $ | 2,368 | | | $ | 4,672 | | | $ | 9,195 | | | $ | 7,114 | |
Other segment expenses include transportation, mobilization, lease, occupancy, professional, and other costs.
SLB's chief operating decision maker is its Chief Executive Officer who uses pretax segment income to assess the performance of each segment.
17. Pension and Other Postretirement Benefit Plans
Pension Plans
SLB sponsors several defined benefit pension plans that cover substantially all US employees hired prior to October 1, 2004. The benefits are based on years of service and compensation, on a career-average pay basis.
In addition to the US defined benefit pension plans, SLB sponsors several other international defined benefit pension plans. The most significant of these international plans are the International Staff Pension Plan and the UK pension plan (collectively, the “International plans”). The International Staff Pension Plan covers certain international employees hired prior to July 1, 2014 and is based on years of service and compensation on a career-average pay basis. The UK plan covers employees hired prior to April 1, 1999, and is based on years of service and compensation, on a final salary basis.
The weighted-average assumed discount rate, compensation increases and expected long-term rate of return on plan assets used to determine the net pension cost for the US and International plans were as follows:
| | | | | | | | | | | | | | | | | | | | | | | |
| |
| | | | | | | | | | | | | | | | | |
| US | | | International | |
| 2024 | | | 2023 | | | 2022 | | | 2024 | | | 2023 | | | 2022 | |
Discount rate | | 5.25 | % | | | 5.50 | % | | | 3.00 | % |
| | 5.14 | % | | | 5.41 | % | | | 2.83 | % |
Compensation increases | | 4.00 | % | | | 4.00 | % | | | 4.00 | % |
| | 4.84 | % | | | 4.84 | % | | | 4.83 | % |
Return on plan assets | | 6.00 | % | | | 6.00 | % | | | 4.40 | % |
| | 5.91 | % | | | 6.00 | % | | | 5.05 | % |
Net pension cost (credit) included the following components:
| | | | | | | | | | | | | | | | | | | | | | | |
(Stated in millions) | |
| | | | | | | | | | | | | | | | | |
| US | | | International | |
| 2024 | | | 2023 | | | 2022 | | | 2024 | | | 2023 | | | 2022 | |
Service cost | $ | 23 | | | $ | 23 | | | $ | 37 | |
| $ | 56 | | | $ | 54 | | | $ | 101 | |
Interest cost | | 173 | | | | 178 | | | | 137 | |
| | 413 | | | | 407 | | | | 298 | |
Expected return on plan assets | | (200 | ) | | | (198 | ) | | | (202 | ) |
| | (553 | ) | | | (607 | ) | | | (530 | ) |
Amortization of net loss | | - | | | | - | | | | 5 | |
| | 10 | | | | - | | | | 80 | |
| $ | (4 | ) | | $ | 3 | | | $ | (23 | ) |
| $ | (74 | ) | | $ | (146 | ) |
| $ | (51 | ) |
The weighted-average assumed discount rate and compensation increases used to determine the projected benefit obligations for the US and International plans were as follows:
| | | | | | | | | | | | | | | |
| |
| US | | | International | |
| 2024 | | | 2023 | | | 2024 | | | 2023 | |
Discount rate | | 5.70 | % | | | 5.25 | % |
| | 5.67 | % | | | 5.14 | % |
Compensation increases | | 4.00 | % | | | 4.00 | % |
| | 4.85 | % | | | 4.84 | % |
The changes in the projected benefit obligation, plan assets and funded status of the plans were as follows:
| | | | | | | | | | | | | | | |
(Stated in millions) | |
| | | | | | | | | | | |
| US | | | International | |
| 2024 | | | 2023 | |
| 2024 | | | 2023 | |
Change in Projected Benefit Obligations: | | | | | | | | | | | |
Projected benefit obligation at beginning of year | $ | 3,413 | | | $ | 3,315 | |
| $ | 8,109 | | | $ | 7,598 | |
Service cost | | 23 | | | | 23 | | | | 56 | | | | 54 | |
Interest cost | | 173 | | | | 178 | | | | 413 | | | | 407 | |
Contribution by plan participants | | - | | | | - | | | | 61 | | | | 52 | |
Actuarial losses (gains) | | (160 | ) | | | 117 | | | | (457 | ) | | | 302 | |
Currency effect | | - | | | | - | | | | (2 | ) | | | 56 | |
Benefits paid | | (224 | ) | | | (220 | ) | | | (384 | ) | | | (360 | ) |
Projected benefit obligation at end of year | $ | 3,225 | | | $ | 3,413 | | | $ | 7,796 | | | $ | 8,109 | |
Change in Plan Assets: | | | | | | | | | | | |
Plan assets at fair value at beginning of year | $ | 3,427 | | | $ | 3,396 | | | $ | 8,390 | | | $ | 8,126 | |
Actual return on plan assets | | (38 | ) | | | 242 | | | | (408 | ) | | | 494 | |
Currency effect | | - | | | | - | | | | (2 | ) | | | 71 | |
Company contributions | | 10 | | | | 9 | | | | 17 | | | | 7 | |
Contributions by plan participants | | - | | | | - | | | | 61 | | | | 52 | |
Benefits paid | | (224 | ) | | | (220 | ) | | | (384 | ) | | | (360 | ) |
Plan assets at fair value at end of year | $ | 3,175 | | | $ | 3,427 | | | $ | 7,674 | | | $ | 8,390 | |
Asset / (Unfunded Liability) | $ | (50 | ) | | $ | 14 | | | $ | (122 | ) | | $ | 281 | |
Amounts Recognized in Balance Sheet: | | | | | | | | | | | |
Postretirement Benefits | $ | (154 | ) | | $ | (159 | ) | | $ | (358 | ) | | $ | (16 | ) |
Other Assets | | 104 | | | | 173 | | | | 236 | | | | 297 | |
| $ | (50 | ) | | $ | 14 | | | $ | (122 | ) | | $ | 281 | |
Amounts Recognized in Accumulated Other Comprehensive Loss: | | | | | | | | | | | |
Actuarial losses | $ | 405 | | | $ | 328 | | | $ | 2,296 | | | $ | 1,804 | |
| | | | | | | | | | | |
Accumulated benefit obligation | $ | 3,137 | | | $ | 3,313 | |
| $ | 7,634 | | | $ | 7,942 | |
The asset represents the difference between the plan assets and the projected benefit obligation (“PBO”). The PBO represents the actuarial present value of benefits based on employee service and compensation and includes an assumption about future compensation levels. The accumulated benefit obligation represents the actuarial present value of benefits based on employee service and compensation but does not include an assumption about future compensation levels.
Actuarial gains and losses arising during 2024 and 2023 were primarily attributable to changes in the discount rate used to determine the PBO.
The weighted-average allocation of plan assets as of December 31, 2024 and 2023 and the target allocations by asset category as of December 31, 2024 were as follows:
| | | | | | | | | | | | | | | | | | | | | | | | | | | | | |
| | |
| | | | | | | | | | | | | | | | | | | | | | | |
| US | | | | International | | |
| Target | | | | 2024 | | | | 2023 | | | | Target | | | | 2024 | | | | 2023 | | |
Cash and cash equivalents | 0 - 3 | | % | | | 1 | | % | | | 1 | | % | | 0 - 5 | | % | | | 1 | | % | | | 3 | | % |
Equity securities | 0 - 5 | | | | | 2 | | | | | - | | | | 0 - 5 | | | | | 3 | | | | | 1 | | |
Debt securities | 80 - 90 | | | | | 82 | | | | | 84 | |
| | 60 - 70 | | | | | 69 | |
| | | 69 | | |
Private equity and real estate | 5 - 12 | | | | | 9 | | | | | 10 | |
| | 15 - 20 | | | | | 17 | |
| | | 17 | | |
Private debt | 2 - 8 | | | | | 6 | | | | | 5 | |
| | 9 - 15 | | | | | 10 | |
| | | 10 | | |
| | 100 | | % | | | 100 | | % | | | 100 | | % | | | 100 | | % | | | 100 | | % | | | 100 | | % |
The expected rate of return on assets assumptions reflect the long-term average rate of return expected to be earned on plan assets. The assumptions have been determined based on expectations regarding future rates of return for the portfolio considering the asset allocation and related historical rates of return. The appropriateness of the assumptions is reviewed annually.
The fair value of SLB’s pension plan assets at December 31, 2024 and 2023, by asset category, is presented below and was determined based on valuation techniques categorized as follows:
•Level One: The use of quoted prices in active markets for identical instruments.
•Level Two: The use of quoted prices for similar instruments in active markets or quoted prices for identical or similar instruments in markets that are not active or other inputs that are observable in the market or can be corroborated by observable market data.
•Level Three: The use of significant unobservable inputs that typically require the use of management’s estimates of assumptions that market participants would use in pricing.
| | | | | | | | | | | | | | | | | | | | | | | | | | | | | | | |
(Stated in millions) | |
| | | | | | | | | | | | | | | | | | | | | | | |
| US Plan Assets | |
| 2024 | | | 2023 | |
| | | | Level | | | Level | | | Level | | | | | | Level | | | Level | | | Level | |
| Total | | | One | | | Two | | | Three | | | Total | | | One | | | Two | | | Three | |
Asset Category: | | | | | | | | | | | | | | | | | | | | | | | |
Cash and Cash Equivalents | $ | 33 | | | $ | 33 | | | $ | - | | | $ | - | | | $ | 33 | | | $ | 33 | | | $ | - | | | $ | - | |
Equity Securities | | 70 | | | | 58 | | | | 12 | | | | - | | | | 6 | | | | - | | | | 6 | | | | - | |
Debt Securities: | | | | | | | | | | | | | | | | | | | | | | | |
Corporate bonds | | 1,713 | | | | - | | | | 1,713 | | | | - | | | | 1,540 | | | | - | | | | 1,540 | | | | - | |
Government and related debt securities | | 861 | | | | 13 | | | | 848 | | | | - | | | | 1,334 | | | | 163 | | | | 1,171 | | | | - | |
Other | | 13 | | | | - | | | | 13 | | | | - | | | | 12 | | | | - | | | | 12 | | | | - | |
Alternative Investments: | | | | | | | | | | | | | | | | | | | | | | | |
Private equity | | 234 | | | | - | | | | - | | | | 234 | | | | 287 | | | | - | | | | - | | | | 287 | |
Private debt | | 186 | | | | - | | | | - | | | | 186 | | | | 148 | | | | - | | | | - | | | | 148 | |
Real estate | | 65 | | | | - | | | | - | | | | 65 | | | | 67 | | | | - | | | | - | | | | 67 | |
Total | $ | 3,175 | | | $ | 104 | | | $ | 2,586 | | | $ | 485 | |
| $ | 3,427 | | | $ | 196 | | | $ | 2,729 | | | $ | 502 | |
| | | | | | | | | | | | | | | | | | | | | | | | | | | | | | | |
(Stated in millions) | |
| | | | | | | | | | | | | | | | | | | | | | | |
| International Plan Assets | |
| 2024 | | | 2023 | |
| | | | Level | | | Level | | | Level | | | | | | Level | | | Level | | | Level | |
| Total | | | One | | | Two | | | Three | | | Total | | | One | | | Two | | | Three | |
Asset Category: | | | | | | | | | | | | | | | | | | | | | | | |
Cash and Cash Equivalents | $ | 90 | | | $ | 89 | | | $ | 1 | | | $ | - | | | $ | 267 | | | $ | 260 | | | $ | 7 | | | $ | - | |
Equity Securities | | 264 | | | | 264 | | | | | | | | | | 122 | | | | 122 | | | | | | | |
Debt Securities: | | | | | | | | | | | | | | | | | | | | | | | |
Corporate bonds | | 2,948 | | | | - | | | | 2,948 | | | | - | | | | 3,001 | | | | - | | | | 3,001 | | | | - | |
Government and related debt securities | | 1,969 | | | | 448 | | | | 1,521 | | | | - | | | | 2,466 | | | | 563 | | | | 1,903 | | | | - | |
Other | | 390 | | | | - | | | | 390 | | | | - | | | | 292 | | | | - | | | | 292 | | | | - | |
Alternative Investments: | | | | | | | | | | | | | | | | | | | | | | | |
Private equity | | 1,136 | | | | - | | | | - | | | | 1,136 | | | | 1,269 | | | | - | | | | - | | | | 1,269 | |
Private debt | | 738 | | | | - | | | | - | | | | 738 | | | | 805 | | | | - | | | | - | | | | 805 | |
Real estate | | 139 | | | | - | | | | - | | | | 139 | | | | 168 | | | | - | | | | - | | | | 168 | |
Total | $ | 7,674 | | | $ | 801 | | | $ | 4,860 | | | $ | 2,013 | |
| $ | 8,390 | | | $ | 945 | | | $ | 5,203 | | | $ | 2,242 | |
SLB’s funding policy is to contribute amounts that are based upon a number of factors including the funded status of the plans, amounts that are deductible for income tax purposes, legal funding requirements, and available cash flow. SLB does not expect to make any material contributions to its postretirement benefit plans in 2025.
Postretirement Benefits Other Than Pensions
SLB provides healthcare benefits to certain former US employees who have retired.
The actuarial assumptions used to determine the accumulated postretirement benefit obligation and net periodic benefit cost for the US postretirement medical plan were as follows:
| | | | | | | | | | | | | | | | | | | |
| |
| | | | | | | | | | | | | | |
| Benefit Obligation | | | Net Periodic Benefit | |
| At December 31, | | | Cost for the Year | |
| 2024 | | | 2023 | | | 2024 | | | 2023 | | | 2022 | |
Discount rate | | 5.25 | % | | | 5.25 | % | | | 5.25 | % | | | 5.50 | % | | | 3.00 | % |
Return on plan assets | - | | | - | | | | 4.43 | % | | | 4.41 | % | | | 2.94 | % |
Current medical cost trend rate | | 7.25 | % | | | 7.50 | % | | | 7.25 | % | | | 7.50 | % | | | 6.75 | % |
Ultimate medical cost trend rate | | 4.50 | % | | | 4.50 | % | | | 4.50 | % | | | 4.50 | % | | | 4.50 | % |
Year that the rate reaches the ultimate trend rate | | 2035 | | | | 2035 | | | | 2035 | | | | 2035 | | | | 2031 | |
The net credit for the US postretirement medical plan included the following components:
| | | | | | | | | | | |
(Stated in millions) | |
| | | | | | | | |
| 2024 | | | 2023 | | | 2022 | |
Service cost | $ | 19 | | | $ | 16 | | | $ | 23 | |
Interest cost | | 41 | | | | 42 | | | | 33 | |
Expected return on plan assets | | (42 | ) | | | (41 | ) | | | (38 | ) |
Amortization of prior service credit | | (23 | ) | | | (23 | ) | | | (23 | ) |
Amortization of net gain | | (13 | ) | | | (12 | ) | | | (10 | ) |
| $ | (18 | ) | | $ | (18 | ) | | $ | (15 | ) |
The changes in the accumulated postretirement benefit obligation, plan assets and funded status were as follows:
| | | | | | | |
(Stated in millions) | |
| | | | | |
| 2024 | | | 2023 | |
Change in Accumulated Postretirement Benefit Obligation: | | | | | |
Benefit obligation at beginning of year | $ | 805 | | | $ | 808 | |
Service cost | | 19 | | | | 16 | |
Interest cost | | 41 | | | | 42 | |
Contribution by plan participants | | 6 | | | | 7 | |
Actuarial gains | | (37 | ) | | | (7 | ) |
Benefits paid | | (53 | ) | | | (61 | ) |
Benefit obligation at end of year | $ | 781 | | | $ | 805 | |
Change in Plan Assets: | | | | | |
Plan assets at fair value at beginning of year | $ | 964 | | | $ | 938 | |
Actual return on plan assets | | 1 | | | | 87 | |
Contributions by plan participants | | 6 | | | | 7 | |
Benefits paid | | (58 | ) | | | (68 | ) |
Plan assets at fair value at end of year | $ | 913 | | | $ | 964 | |
Asset | $ | 132 | | | $ | 159 | |
Amounts Recognized in Accumulated Other Comprehensive Loss: | | | | | |
Actuarial gains | $ | 224 | | | $ | 239 | |
Prior service credit | | 13 | | | | 36 | |
| $ | 237 | | | $ | 275 | |
The asset balance relating to this plan was included in Other Assets in the Consolidated Balance Sheet.
The assets of the US postretirement medical plan are invested 85% in debt securities and 15% in equity securities at December 31, 2024. The fair value of these assets was primarily determined based on Level Two valuation techniques.
Other Information
The expected benefits to be paid under the US and International pension plans as well as the postretirement medical plan are as follows:
| | | | | | | | | | | |
(Stated in millions) | |
| | | | | | | | |
| Pension Plans | | | Postretirement | |
| US | | | International | | | Medical Plan | |
2025 | $ | 230 | | | $ | 423 | | | $ | 49 | |
2026 | $ | 233 | | | $ | 437 | | | $ | 50 | |
2027 | $ | 232 | | | $ | 454 | | | $ | 51 | |
2028 | $ | 233 | | | $ | 469 | | | $ | 53 | |
2029 | $ | 234 | | | $ | 475 | | | $ | 55 | |
2030-2034 | $ | 1,180 | | | $ | 2,591 | | | $ | 310 | |
18. Supplementary Information
Cash paid for interest and income taxes was as follows:
| | | | | | | | | | | |
(Stated in millions) | |
| | | | | | | | |
| 2024 | | | 2023 | | | 2022 | |
Interest | $ | 510 | | | $ | 503 | | | $ | 562 | |
Income taxes | $ | 1,140 | | | $ | 1,064 | | | $ | 716 | |
Interest and other income, net includes the following:
| | | | | | | | | | | |
(Stated in millions) | |
| | | | | | | | |
| 2024 | | | 2023 | | | 2022 | |
Earnings of equity method investments | $ | 182 | | | $ | 206 | | | $ | 164 | |
Interest income | | 174 | | | | 100 | | | | 99 | |
Gain on sale of investment * | | 24 | | | | - | | | | - | |
Gain on sale of Liberty shares * | | - | | | | 36 | | | | 325 | |
Loss on Blue Chip Swap transactions * | | - | | | | - | | | | (139 | ) |
Gain on ADC equity investment * | | - | | | | - | | | | 107 | |
Gain on sale of real estate * | | - | | | | - | | | | 43 | |
Gain on repurchase of bonds * | | - | | | | - | | | | 11 | |
| $ | 380 | | | $ | 342 | | | $ | 610 | |
* See Note 3 – Charges and Credits
The components of depreciation and amortization expense were as follows:
| | | | | |
(Stated in millions) |
| | | | | |
| 2024 | | 2023 | | 2022 |
Depreciation of fixed assets | $1,551 | | $1,445 | | $1,368 |
Amortization of APS investments | 481 | | 410 | | 368 |
Amortization of intangible assets | 334 | | 314 | | 301 |
Amortization of exploration data costs | 153 | | 143 | | 110 |
| $2,519 | | $2,312 | | $2,147 |
The change in Allowance for doubtful accounts was as follows:
| | | | | | | | | | | |
(Stated in millions) | |
| | | | | | | | |
| 2024 | | | 2023 | | | 2022 | |
Balance at beginning of year | $ | 337 | | | $ | 340 | | | $ | 319 | |
Additions | | 6 | | | | 18 | | | | 54 | |
Amounts written off | | (18 | ) | | | (21 | ) | | | (33 | ) |
Balance at end of year | $ | 325 | | | $ | 337 | | | $ | 340 | |
Revenue in excess of billings related to contracts where revenue is recognized over time was $0.5 billion at December 31, 2024 and $0.4 billion at December 31, 2023. Such amounts are included within Receivables less allowance for doubtful accounts in the Consolidated Balance Sheet.
Other Assets consist of the following:
| | | | | | | |
(Stated in millions) | |
| | | | | |
| 2024 | | | 2023 | |
Investments in APS projects | $ | 2,083 | | | $ | 2,111 | |
Pension and other postretirement plan assets | | 472 | | | | 629 | |
Operating lease assets | | 702 | | | | 718 | |
Exploration data costs capitalized | | 196 | | | | 151 | |
Fair value of hedge contracts | | 14 | | | | 65 | |
Other | | 299 | | | | 378 | |
| $ | 3,766 | | | $ | 4,052 | |
Accounts payable and accrued liabilities consist of the following:
| | | | | | | |
(Stated in millions) | |
| | | | | |
| 2024 | | | 2023 | |
Trade | $ | 4,230 | | | $ | 4,613 | |
Payroll, vacation, and employee benefits | | 1,475 | | | | 1,625 | |
Billings and cash collections in excess of revenue | | 2,007 | | | | 1,996 | |
Other | | 2,663 | | | | 2,670 | |
| $ | 10,375 | | | $ | 10,904 | |
Management’s Report on Internal Control Over Financial Reporting
SLB management is responsible for establishing and maintaining adequate internal control over financial reporting as defined in Rule 13a–15(f) of the Securities Exchange Act of 1934, as amended (the “Exchange Act”). SLB’s internal control over financial reporting is a process designed to provide reasonable assurance regarding the reliability of financial reporting and the preparation of financial statements for external purposes in accordance with generally accepted accounting principles.
Because of its inherent limitations, internal control over financial reporting may not prevent or detect misstatements. Also, projections of any evaluation of effectiveness to future periods are subject to the risk that controls may become inadequate because of changes in conditions, or that the degree of compliance with the policies or procedures may deteriorate.
SLB management assessed the effectiveness of its internal control over financial reporting as of December 31, 2024. In making this assessment, it used the criteria set forth in 2013 by the Committee of Sponsoring Organizations of the Treadway Commission in Internal Control—Integrated Framework. Based on this assessment SLB’s management has concluded that, as of December 31, 2024, its internal control over financial reporting is effective based on those criteria.
The effectiveness of SLB’s internal control over financial reporting as of December 31, 2024 has been audited by PricewaterhouseCoopers LLP, an independent registered public accounting firm, as stated in their report which appears herein.
Report of Independent Registered Public Accounting Firm
To the Board of Directors and Stockholders
of Schlumberger Limited
Opinions on the Financial Statements and Internal Control over Financial Reporting
We have audited the accompanying consolidated balance sheet of Schlumberger Limited and its subsidiaries (the “Company”) as of December 31, 2024 and 2023, and the related consolidated statements of income, comprehensive income, stockholders’ equity and cash flows for each of the three years in the period ended December 31, 2024, including the related notes (collectively referred to as the “consolidated financial statements”). We also have audited the Company's internal control over financial reporting as of December 31, 2024, based on criteria established in Internal Control - Integrated Framework (2013) issued by the Committee of Sponsoring Organizations of the Treadway Commission (COSO).
In our opinion, the consolidated financial statements referred to above present fairly, in all material respects, the financial position of the Company as of December 31, 2024 and 2023 and the results of its operations and its cash flows for each of the three years in the period ended December 31, 2024 in conformity with accounting principles generally accepted in the United States of America. Also in our opinion, the Company maintained, in all material respects, effective internal control over financial reporting as of December 31, 2024, based on criteria established in Internal Control - Integrated Framework (2013) issued by the COSO.
Basis for Opinions
The Company's management is responsible for these consolidated financial statements, for maintaining effective internal control over financial reporting, and for its assessment of the effectiveness of internal control over financial reporting, included in the accompanying Management's Report on Internal Control Over Financial Reporting. Our responsibility is to express opinions on the Company’s consolidated financial statements and on the Company's internal control over financial reporting based on our audits. We are a public accounting firm registered with the Public Company Accounting Oversight Board (United States) (PCAOB) and are required to be independent with respect to the Company in accordance with the U.S. federal securities laws and the applicable rules and regulations of the Securities and Exchange Commission and the PCAOB.
We conducted our audits in accordance with the standards of the PCAOB. Those standards require that we plan and perform the audits to obtain reasonable assurance about whether the consolidated financial statements are free of material misstatement, whether due to error or fraud, and whether effective internal control over financial reporting was maintained in all material respects.
Our audits of the consolidated financial statements included performing procedures to assess the risks of material misstatement of the consolidated financial statements, whether due to error or fraud, and performing procedures that respond to those risks. Such procedures included examining, on a test basis, evidence regarding the amounts, and disclosures in the consolidated financial statements. Our audits also included evaluating the accounting principles used and significant estimates made by management, as well as evaluating the overall presentation of the consolidated financial statements. Our audit of internal control over financial reporting included obtaining an understanding of internal control over financial reporting, assessing the risk that a material weakness exists, and testing and evaluating the design and operating effectiveness of internal control based on the assessed risk. Our audits also included performing such other procedures as we considered necessary in the circumstances. We believe that our audits provide a reasonable basis for our opinions.
Definition and Limitations of Internal Control over Financial Reporting
A company’s internal control over financial reporting is a process designed to provide reasonable assurance regarding the reliability of financial reporting and the preparation of financial statements for external purposes in accordance with generally accepted accounting principles. A company’s internal control over financial reporting includes those policies and procedures that (i) pertain to the maintenance of records that, in reasonable detail, accurately and fairly reflect the transactions and dispositions of the assets of the company; (ii) provide reasonable assurance that transactions are recorded as necessary to permit preparation of financial statements in accordance with generally accepted accounting principles, and that receipts and expenditures of the company are being made only in accordance with authorizations of management and directors of the company; and (iii) provide reasonable assurance regarding prevention or timely detection of unauthorized acquisition, use, or disposition of the company’s assets that could have a material effect on the financial statements.
Because of its inherent limitations, internal control over financial reporting may not prevent or detect misstatements. Also, projections of any evaluation of effectiveness to future periods are subject to the risk that controls may become inadequate because of changes in conditions, or that the degree of compliance with the policies or procedures may deteriorate.
Critical Audit Matters
The critical audit matter communicated below is a matter arising from the current period audit of the consolidated financial statements that was communicated or required to be communicated to the audit committee and that (i) relates to accounts or disclosures that are material to the consolidated financial statements and (ii) involved our especially challenging, subjective, or complex judgments. The communication of critical audit matters does not alter in any way our opinion on the consolidated financial statements, taken as a whole, and we are not, by communicating the critical audit matter below, providing a separate opinion on the critical audit matter or on the accounts or disclosures to which it relates.
Uncertain Tax Positions
As described in Note 13 to the consolidated financial statements, the Company’s tax filings are subject to regular audit by the tax authorities, and those audits may result in assessments for additional taxes that are resolved with the tax authorities or, potentially, through the courts. Tax liabilities are recorded based on estimates of additional taxes that will be due upon the conclusion of these audits.
The principal considerations for our determination that performing procedures relating to uncertain tax positions is a critical audit matter are the significant judgment applied by management in determining these liabilities including a high degree of estimation uncertainty due to the uncertain and complex application of tax regulations, which in turn led to a high degree of auditor judgment, subjectivity, and effort in performing procedures to evaluate management’s estimates.
Addressing the matter involved performing procedures and evaluating audit evidence in connection with forming our overall opinion on the consolidated financial statements. These procedures included testing the effectiveness of controls relating to the identification and recognition of uncertain tax positions. These procedures also included, among others (i) evaluating management’s process for determining the estimated liabilities for uncertain tax positions, (ii) testing the completeness and reasonableness of uncertain tax positions recorded in the consolidated financial statements, and (iii) evaluating assessments received from the relevant tax authorities. Professionals with specialized skill and knowledge were used to assist in evaluating the reasonableness of assumptions used by management, including management's assessment of whether tax positions are more likely than not of being sustained.
|
/s/ PricewaterhouseCoopers LLP |
|
Houston, Texas |
January 22, 2025 |
We have served as the Company’s auditor since 1952.
Item 9. Changes in and Disagreements with Accountants on Accounting and Financial Disclosure.
None.
Item 9A. Controls and Procedures.
SLB has carried out an evaluation under the supervision and with the participation of SLB’s management, including the Chief Executive Officer (“CEO”) and the Chief Financial Officer (“CFO”), of the effectiveness of SLB’s “disclosure controls and procedures” (as such term is defined in Rules 13a-15(e) and 15d-15(e) under the Exchange Act) as of the end of the period covered by this report. Based on this evaluation, the CEO and the CFO have concluded that, as of the end of the period covered by this report, SLB’s disclosure controls and procedures were effective to provide reasonable assurance that information required to be disclosed in the reports that SLB files or submits under the Exchange Act is recorded, processed, summarized, and reported within the time periods specified in the Securities and Exchange Commission’s rules and forms. SLB’s disclosure controls and procedures include controls and procedures designed so that information required to be disclosed in reports filed or submitted under the Exchange Act is accumulated and communicated to its management, including the CEO and the CFO, as appropriate, to allow timely decisions regarding required disclosure. There has been no change in SLB’s internal control over financial reporting that occurred during the fourth quarter of 2024 that has materially affected, or is reasonably likely to materially affect, SLB’s internal control over financial reporting.
Item 9B. Other Information.
In 2013, SLB completed the wind-down of its service operations in Iran. Prior to this, certain non-US subsidiaries provided oilfield services to the National Iranian Oil Company and certain of its affiliates (“NIOC”).
SLB’s residual transactions or dealings with the government of Iran in 2024 consisted of payments of taxes and other typical governmental charges. Certain non-US subsidiaries of SLB maintained depository accounts at the Dubai branch of Bank Saderat Iran (“Saderat”), and at Bank Tejarat (“Tejarat”) in Tehran and in Kish for the deposit by NIOC of amounts owed to non-US subsidiaries of SLB for services rendered in Iran prior to the wind-down and for the maintenance of such amounts previously received. One non-US subsidiary also maintained an account at Tejarat for payment of local expenses such as taxes. SLB anticipates that it will discontinue dealings with Saderat and Tejarat following the receipt of all amounts owed to SLB for prior services rendered in Iran.
Item 9C. Disclosure Regarding Foreign Jurisdictions that Prevent Inspections.
None.
PART III
Item 10. Directors, Executive Officers and Corporate Governance.
See “Item 1. Business—Information About Our Executive Officers” of this Report for information regarding SLB’s executive officers. The information set forth under the captions “Election of Directors,” “Corporate Governance—Process for Selecting New Directors,” and “Corporate Governance—Board Committees” in SLB’s 2025 Proxy Statement is incorporated herein by reference. The information set forth under the caption “Stock Ownership Information—Delinquent Section 16(a) Reports” in SLB’s 2025 Proxy Statement is incorporated herein by reference to the extent any disclosure is required.
SLB has a Code of Conduct that applies to all of its directors, officers and employees, including its principal executive, financial and accounting officers, or persons performing similar functions. SLB’s Code of Conduct is posted on its website at https://www.slb.com/about/who-we-are/our-code-of-conduct. SLB will provide, without charge, upon request, copies of our Code of Conduct. Requests for copies of our Code of Conduct should be sent in writing to SLB, Chief Legal Officer and Secretary, 5599 San Felipe, Houston, Texas 77056. SLB intends to disclose future amendments to the Code of Conduct and any grant of a waiver from a provision of the Code of Conduct requiring disclosure under applicable SEC rules at https://www.slb.com/about/who-we-are/our-code-of-conduct.
SLB has a securities transactions policy governing the purchase, sale and other dispositions of its securities by directors, officers, and employees. SLB believes that its securities transactions policy is reasonably designed to promote compliance with insider trading laws, rules and regulations, and any applicable listing standards. A copy of SLB’s securities transactions policy is filed as Exhibit 19 to this Form 10-K.
The table below sets forth information regarding SLB’s directors:
| |
Name |
|
Peter Coleman | Former Chief Executive Officer and Managing Director, Woodside Petroleum Ltd. |
Patrick de La Chevardière | Former Chief Financial Officer, TotalEnergies S.A. |
Miguel M. Galuccio | Chairman and Chief Executive Officer, Vista |
James Hackett | President, Tessellation Services |
Olivier Le Peuch | Chief Executive Officer, SLB |
Samuel Leupold | Former Chief Executive Officer, Ørsted Wind Power A/S |
Tatiana A. Mitrova | Director, New Energy Advancement Hub |
Maria Moræus Hanssen | Former Deputy Chief Executive Officer & Chief Operating Officer, Wintershall Dea GmbH |
Vanitha Narayanan | Former Chairman and Managing Director, IBM India |
Jeff W. Sheets | Former Chief Financial Officer, ConocoPhillips Company |
Ulrich Spiesshofer | Senior Advisor, The Blackstone Group |
Item 11. Executive Compensation.
The information set forth under the captions “Compensation Committee Report,” “Compensation Discussion and Analysis,” “Executive Compensation Tables,” “Pay vs. Performance Comparison,” and “Director Compensation” in SLB’s 2025 Proxy Statement is incorporated herein by reference.
Item 12. Security Ownership of Certain Beneficial Owners and Management and Related Stockholder Matters.
The information under the captions “Stock Ownership Information—Security Ownership by Management and Our Board,” “Stock Ownership Information—Security Ownership by Certain Beneficial Owners,” and “Executive Compensation Tables—Equity Compensation Plan Information” in SLB’s 2025 Proxy Statement is incorporated herein by reference.
Item 13. Certain Relationships and Related Transactions, and Director Independence.
The information under the captions “Corporate Governance—Director Independence” and “Corporate Governance—Certain Relationships and Related Person Transactions” in SLB’s 2025 Proxy Statement is incorporated herein by reference.
Item 14. Principal Accounting Fees and Services.
The information under the caption “Ratification of Appointment of Independent Auditors for 2025” in SLB’s 2025 Proxy Statement is incorporated herein by reference.
PART IV
Item 15. Exhibits and Financial Statement Schedules.
(a) The following documents are filed as part of this Report:
Financial statements of companies accounted for under the equity method and unconsolidated subsidiaries have been omitted because they do not meet the materiality tests for assets or income.
| | |
(2) | Financial Statement Schedules not required. |
|
(3) | Exhibits: See exhibits listed under Part (b) below. |
|
(b) Exhibits
INDEX TO EXHIBITS
| | |
|
| Exhibit |
| | |
Agreement and Plan of Merger among Schlumberger Limited, Sodium Holdco, Inc., Sodium Merger Sub, Inc., and ChampionX Corporation, dated April 2, 2024 (incorporated by reference to Exhibit 2 to SLB’s Current Report on Form 8-K/A filed on April 2, 2024) (***) | | 2 |
| | |
Articles of Incorporation of Schlumberger Limited (Schlumberger N.V.) (incorporated by reference to Exhibit 3.1 to SLB’s Current Report on Form 8-K filed on April 6, 2016) |
| 3.1 |
|
|
|
Amended and Restated By-Laws of Schlumberger Limited (Schlumberger N.V.) (incorporated by reference to Exhibit 3 to SLB’s Current Report on Form 8-K filed on April 21, 2023) |
| 3.2 |
|
|
|
Description of Common Stock of Schlumberger Limited (incorporated by reference to Exhibit 4.1 to SLB’s Annual Report on Form 10-K filed on January 27, 2021) | | 4.1 |
| | |
Indenture dated as of December 3, 2013, by and among Schlumberger Investment S.A., as issuer, Schlumberger Limited, as guarantor, and The Bank of New York Mellon, as trustee (incorporated by reference to Exhibit 4.1 to SLB’s Current Report on Form 8-K filed on December 3, 2013) |
| 4.2 |
| | |
Second Supplemental Indenture dated as of June 26, 2020, by and among Schlumberger Investment S.A., as issuer, Schlumberger Limited, as guarantor, and The Bank of New York Mellon, as trustee (including form of global notes representing 2.650% Senior Notes due 2030) (incorporated by reference to Exhibit 4.1 to SLB’s Current Report on Form 8-K filed on June 26, 2020) | | 4.3 |
| | |
Third Supplemental Indenture dated as of May 15, 2023, by and among Schlumberger Investment S.A.as issuer, Schlumberger Limited, as guarantor, and The Bank of New York Mellon, as trustee (including form of global notes representing 4.500% Senior Notes due 2028 and form of global notes representing 4.850% Senior Notes due 2033) (incorporated by reference to Exhibit 4.1 to SLB’s Current Report on Form 8-K filed on May 15, 2023) | | 4.4 |
| | |
Fourth Supplemental Indenture dated as of May 29, 2024, by and among Schlumberger Investment S.A., as issuer, Schlumberger Limited, as guarantor, and The Bank of New York Mellon, as trustee (including form of global notes representing 5.000% Senior Notes due 2034) (incorporated by reference to Exhibit 4.1 to SLB’s Current Report on Form 8-K filed on May 29, 2024) | | 4.5 |
| | |
| | |
|
| Exhibit |
Officers’ Certificate dated as of August 11, 2020, executed by Schlumberger Investment S.A., as issuer, and Schlumberger Limited, as guarantor (including form of global notes representing 2.650% Senior Notes due 2030) (incorporated by reference to Exhibit 4.1 to SLB’s Current Report on Form 8-K filed on August 11, 2020) | | 4.6 |
| | |
Indenture dated as of September 18, 2020, by and among Schlumberger Finance Canada Ltd., as issuer, Schlumberger Limited, as guarantor, and The Bank of New York Mellon, as trustee (incorporated by reference to Exhibit 4.1 to SLB’s Current Report on Form 8-K filed on September 18, 2020) | | 4.7 |
| | |
First Supplemental Indenture dated as of September 18, 2020, by and among Schlumberger Finance Canada Ltd., as issuer, Schlumberger Limited, as guarantor, and The Bank of New York Mellon, as trustee (including form of global notes representing 1.400% Senior Notes due 2025) (incorporated by reference to Exhibit 4.2 to SLB’s Current Report on Form 8-K filed on September 18, 2020) | | 4.8 |
| | |
Schlumberger Limited Supplementary Benefit Plan, as amended and restated effective November 1, 2020 and conformed to include amendments effective through January 1, 2023 (incorporated by reference to Exhibit 10.1 to SLB’s Quarterly Report on Form 10-Q for the quarter ended September 30, 2023) (+) |
| 10.1 |
|
|
|
Schlumberger Limited Restoration Savings Plan, as amended and restated effective January 1, 2023 (incorporated by reference to Exhibit 10.2 to SLB’s Quarterly Report on Form 10-Q for the quarter ended September 30, 2023) (+) | | 10.2 |
| | |
Schlumberger Technology Corporation Supplementary Benefit Plan, as established effective January 1, 1995 and conformed to include amendments through January 1, 2023 (incorporated by reference to Exhibit 10.3 to SLB’s Annual Report on Form 10-K for the year ended December 31, 2023) (+) | | 10.3 |
| | |
2010 Omnibus Stock Incentive Plan, as amended and restated as of July 19, 2017 (incorporated by reference to Exhibit 10.8 to SLB’s Annual Report on Form 10-K for the year ended December 31, 2018) (+) |
| 10.4 |
| | |
Form of Option Agreement (Employees in France), Incentive Stock Option, under SLB’s 2010 Omnibus Stock Incentive Plan (incorporated by reference to Exhibit 10.10 to SLB’s Quarterly Report on Form 10-Q for the quarter ended June 30, 2013) (+) | | 10.5 |
| | |
Form of Option Agreement (Employees in France), Non-Qualified Stock Option, under SLB’s 2010 Omnibus Stock Incentive Plan (incorporated by reference to Exhibit 10.11 to SLB’s Quarterly Report on Form 10-Q for the quarter ended June 30, 2013) (+) |
| 10.6 |
|
|
|
2018 Rules of SLB’s 2010, 2013 and 2017 Omnibus Incentive Plans for Employees in France (incorporated by reference to Appendix B to SLB’s Definitive Proxy Statement on Schedule 14A filed with the SEC on March 2, 2018) (+) |
| 10.7 |
| | |
2013 Omnibus Stock Incentive Plan, as amended and restated as of July 19, 2017 (incorporated by reference to Exhibit 10.15 to SLB’s Annual Report on Form 10-K for the year ended December 31, 2018) (+) | | 10.8 |
| | |
Form of Option Agreement, Incentive Stock Option, under SLB’s 2013 Omnibus Stock Incentive Plan (incorporated by reference to Exhibit 10.1 to the SLB’s Quarterly Report on Form 10-Q for the quarter ended June 30, 2015) (+) | | 10.9 |
| | |
Form of Restricted Stock Unit Award Agreement under SLB’s 2013 Omnibus Stock Incentive Plan (ratable vesting) (incorporated by reference to Exhibit 10.15 to SLB’s Annual Report on Form 10-K filed on January 27, 2021) (+) | | 10.10 |
| | |
Form of Restricted Stock Unit Award Agreement under SLB’s 2017 Omnibus Stock Incentive Plan (incorporated by reference to Exhibit 10.4 to SLB’s Quarterly Report on Form 10-Q for the quarter ended March 31, 2017) (+) | | 10.11 |
| | |
Addendum to Restricted Stock Unit Award Agreements, Performance Share Unit Agreements, Incentive Stock Option Agreements, and Non-Qualified Stock Option Agreements Issued Prior to July 19, 2017 (incorporated by reference to Exhibit 10.27 to SLB’s Annual Report on Form 10-K for the year ended December 31, 2018) (+) | | 10.12 |
| | |
Form of Performance Share Unit Award Agreement (Based on Free Cash Flow Margin Performance) under SLB’s 2017 Omnibus Stock Incentive Plan (incorporated by reference to Exhibit 10.3 to SLB’s Quarterly Report on Form 10-Q for the quarter ended March 31, 2022) (+) | | 10.13 |
| | |
| | |
|
| Exhibit |
Form of Performance Share Unit Award Agreement (Based on Return on Capital Employed Performance) under SLB’s 2017 Omnibus Stock Incentive Plan (incorporated by reference to Exhibit 10.4 to SLB’s Quarterly Report on Form 10-Q for the quarter ended March 31, 2022) (+) | | 10.14 |
| | |
Form of Performance Share Unit Award Agreement (Based on Relative TSR Performance) under SLB’s 2017 Omnibus Stock Incentive Plan (incorporated by reference to Exhibit 10.5 to SLB’s Quarterly Report on Form 10-Q for the quarter ended March 31, 2022) (+) | | 10.15 |
| | |
2017 Omnibus Stock Incentive Plan, as amended and restated effective January 21, 2021 (incorporated by reference to Exhibit 10.1 to SLB’s Current Report on Form 8-K filed on April 7, 2021) (+) | | 10.16 |
| | |
Discounted Stock Purchase Plan, as amended and restated effective July 1, 2022 (incorporated by reference to Exhibit 10.1 to SLB’s Current Report on Form 10-Q filed on July 27, 2022) (+) | | 10.17 |
| | |
2004 Stock and Deferral Plan for Non-Employee Directors, as amended and restated effective January 21, 2021 (incorporated by reference to Exhibit 10.3 to SLB’s Current Report on Form 8-K filed on April 7, 2021) (+) | | 10.18 |
| | |
Form of Indemnification Agreement (incorporated by reference to Exhibit 10.19 to SLB’s Annual Report on Form 10-K for the year ended December 31, 2023) (+) | | 10.19 |
| | |
Securities Transactions Policy (*) | | 19 |
| | |
Significant Subsidiaries (*) |
| 21 |
| | |
Issuers of Registered Guaranteed Debt Securities (*) | | 22 |
| | |
Consent of Independent Registered Public Accounting Firm (*) |
| 23 |
| | |
Powers of Attorney (*) |
| 24 |
| | |
Certification of Chief Executive Officer pursuant to Rule 13a-14(a) as adopted pursuant to Section 302 of the Sarbanes-Oxley Act of 2002 (*) |
| 31.1 |
|
|
|
Certification of Chief Financial Officer pursuant to Rule 13a-14(a) as adopted pursuant to Section 302 of the Sarbanes-Oxley Act of 2002 (*) |
| 31.2 |
|
|
|
Certification of Chief Executive Officer pursuant to 18 U.S.C. Section 1350, as adopted pursuant to Section 906 of the Sarbanes-Oxley Act of 2002 (**) |
| 32.1 |
| | |
Certification of Chief Financial Officer pursuant to 18 U.S.C. Section 1350, as adopted pursuant to Section 906 of the Sarbanes-Oxley Act of 2002 (**) |
| 32.2 |
|
|
|
Mine Safety Disclosure (*) |
| 95 |
| | |
Policy for Recovery of Performance-Based Incentive Compensation from Executive Officers (incorporated by reference to Exhibit 97 to SLB’s Annual Report on Form 10-K for the year ended December 31, 2023) | | 97 |
|
|
|
Inline XBRL Instance Document (*) |
| 101.INS |
|
|
|
Inline XBRL Taxonomy Extension Schema Document (*) | | 101.SCH |
| | |
Inline XBRL Taxonomy Extension Calculation Linkbase Document (*) | | 101.CAL |
| | |
Inline XBRL Taxonomy Extension Definition Linkbase Document (*) | | 101.DEF |
| | |
Inline XBRL Taxonomy Extension Label Linkbase Document (*) | | 101.LAB |
| | |
Inline XBRL Taxonomy Extension Presentation Linkbase Document (*) | | 101.PRE |
| | |
Cover Page Interactive Data File (formatted as inline XBRL and contained in Exhibit 101) | | 104 |
| | |
|
| Exhibit |
(*) Filed with this Form 10-K |
| |
(**) Furnished with this Form 10-K | | |
(***) Certain of the exhibits and schedules to this exhibit have been omitted in accordance with Regulation S-K Item 601(b)(2). SLB agrees to furnish supplementally a copy of all omitted exhibits and schedules to the SEC upon its request. | | |
(+) Management contracts or compensatory plans or arrangements |
| |
| | |
The Exhibits filed herewith do not include certain instruments with respect to long-term debt of Schlumberger Limited and its subsidiaries, inasmuch as the total amount of debt authorized under any such instrument does not exceed 10 percent of the total assets of Schlumberger Limited and its subsidiaries on a consolidated basis. SLB agrees, pursuant to Item 601(b)(4)(iii) of Regulation S-K, that it will furnish a copy of any such instrument to the SEC upon request. |
Item 16. Form 10-K Summary.
None.
SIGNATURES
Pursuant to the requirements of Section 13 or 15(d) of the Securities Exchange Act of 1934, the Registrant has duly caused this Report to be signed on its behalf by the undersigned, thereunto duly authorized.
| | | | | |
Date: | | January 22, 2025 |
| | SCHLUMBERGER LIMITED |
| | | | | |
| | | By: | | /s/ Howard Guild |
| | |
| | Howard Guild |
| | |
| | Chief Accounting Officer |
Pursuant to the requirements of the Securities Exchange Act of 1934, this Report has been signed below by the following persons on behalf of the Registrant and in the capacities and on the dates indicated.
| | |
Name |
| Title |
|
|
|
* |
| Chief Executive Officer and Director (Principal Executive Officer) |
Olivier Le Peuch |
|
|
|
|
/s/ Stephane Biguet |
| Executive Vice President and Chief Financial Officer (Principal Financial Officer) |
Stephane Biguet |
|
|
|
|
/s/ Howard Guild |
| Chief Accounting Officer (Principal Accounting Officer) |
Howard Guild |
|
|
|
|
* |
| Director |
Peter Coleman |
|
|
|
|
|
* |
| Director |
Patrick de La Chevardière |
|
|
|
|
|
* |
| Director |
Miguel M. Galuccio |
|
|
|
|
|
* |
| Chairman of the Board |
James Hackett |
|
|
|
|
|
* |
| Director |
Samuel Leupold |
|
|
|
|
|
* |
| Director |
Tatiana A. Mitrova |
|
|
|
|
|
* |
| Director |
Maria Moræus Hanssen |
|
|
|
|
|
* |
| Director |
Vanitha Narayanan |
|
|
|
|
|
* |
| Director |
Jeff W. Sheets |
|
|
|
|
|
* |
| Director |
Ulrich Spiesshofer |
|
|
|
|
|
/s/ Dianne B. Ralston |
| January 22, 2025 |
*By Dianne B. Ralston, Attorney-in-Fact |
|
|