UNITED STATES
SECURITIES AND EXCHANGE COMMISSION
Washington, D.C. 20549
FORM N-CSR
CERTIFIED SHAREHOLDER REPORT OF REGISTERED
MANAGEMENT INVESTMENT COMPANIES
Investment Company Act file number | 811-06292 |
|
UBS Investment Trust |
(Exact name of registrant as specified in charter) |
|
1285 Avenue of the Americas, New York, New York | | 10019-6028 |
(Address of principal executive offices) | | (Zip code) |
|
Mark F. Kemper, Esq. UBS Asset Management 1285 Avenue of the Americas New York, NY 10019-6028 |
(Name and address of agent for service) |
|
Copy to: Jack W. Murphy, Esq. Dechert LLP 1900 K Street, N.W. Washington, DC 20006 |
|
Registrant’s telephone number, including area code: | 212-821 3000 | |
|
Date of fiscal year end: | August 31 | |
|
Date of reporting period: | August 31, 2016 | |
| | | | | | | | |
Item 1. Reports to Stockholders.

UBS U.S. Allocation Fund
Annual Report | August 31, 2016
October 17, 2016
Dear shareholder,
We present you with the annual report for UBS U.S. Allocation Fund (the "Fund") for the 12 months ended August 31, 2016.
Performance
Over the 12 months ended August 31, 2016, the Fund's Class A shares returned 7.03% before deducting the maximum sales charge and returned 1.15% after deducting the maximum sales charge. During the same period, the Fund's primary benchmark, the S&P 500 Index, which tracks large cap US equities, gained 12.55%. Since the Fund invests in both stocks and bonds, we believe it is appropriate to also compare its performance to the UBS U.S. Allocation Fund Benchmark (the Fund's secondary benchmark),1 which returned 9.87% during the period. (Returns for all share classes over various time periods and descriptions of the indices are shown in "Performance at a glance" on page 6; please note that the returns shown do not reflect the deduction of taxes that a shareholder would pay on Fund distributions or on the redemption of Fund shares.)
Market commentary
The US economy was resilient and continued to expand during the reporting period. The US Commerce Department reported that gross domestic product ("GDP") expanded at a 2.0% seasonally adjusted annualized rate during the third quarter of 2015. Economic activity in the US then moderated, as GDP growth was a revised 0.9% during the fourth quarter of 2015 and 0.8% for the first quarter of 2016, respectively. However, the pace of growth then accelerated, as second-quarter 2016 GDP growth was 1.4%.2
After taking its first step toward normalizing monetary policy in late 2015, the US Federal Reserve Board (the "Fed") has since been in a holding pattern. Looking back, in December 2015 the Fed raised the fed funds rate from a range of 0% to 0.25% to a range between 0.25% and 0.50%.3 This marked the Fed's first rate hike in almost a decade. However, the Fed remained on hold during its first five meetings in 2016. In its official statement following its July 2016 meeting, the Fed said: "The Committee expects that economic conditions will evolve in a manner that will warrant only gradual increases in the federal funds rate; the federal funds rate is likely to remain, for some time, below levels that are expected to prevail in the longer run. However, the actual path of the federal funds rate will depend on the economic outlook as informed by incoming data."
The global equity market was highly volatile at times during the reporting period. Investors in both the US and abroad were confronted with mixed economic data, questions regarding future monetary policy, fluctuating oil prices and the United Kingdom's vote to leave the European Union ("Brexit"). All told, the US stock market, as measured by the S&P 500 Index,4 gained 12.55% for the 12 months ended August 31, 2016. Meanwhile, international developed equities generated weak results, as they were unable to overcome several bouts of investor risk
UBS U.S. Allocation Fund
Investment Objective:
Total return, consisting of long-term capital appreciation and current income
Portfolio Manager:
Andreas Koester
UBS Asset Management (Americas) Inc.
Commencement:
Class A—May 10, 1993
Class C—July 22, 1992
Class P (formerly Class Y)—May 10, 1993
Dividend payments:
Annually, if any
1 The UBS U.S. Allocation Fund Benchmark is an unmanaged benchmark compiled by the Advisor, constructed as follows: from July 22, 1992 (the Fund's inception) until February 29, 2004: 100% S&P 500 Index; from March 1, 2004 until May 31, 2005: 65% Russell 3000 Index, 30% Barclays US Aggregate Index and 5% BofA Merrill Lynch US High Yield Cash Pay Index; and from June 1, 2005 until present: 65% Russell 3000 Index, 30% Barclays US Aggregate Index and 5% BofA Merrill Lynch US High Yield Cash Pay Constrained Index. Investors should note that indices do not reflect the deduction of fees and expenses.
2 Based on the Commerce Department's third reading for second quarter 2016 GDP announced on September 29, 2016, after the reporting period had ended.
3 The federal funds rate, or the "fed funds rate," is the rate banks charge one another for funds they borrow on an overnight basis.
4 The S&P 500 Index is an unmanaged, weighted index composed of 500 widely held common stocks varying in composition and is not available for direct investment. Investors should note that indices do not reflect the deduction of fees and expenses.
1
aversion. International developed equities, as measured by the MSCI EAFE Index (net),5 fell 0.12% during the period. However, emerging markets equities posted strong results, as measured by the MSCI Emerging Markets Index (net),6 as they rose 11.83% over the same period.
Many of the issues holding back equities triggered a number of "flights to quality" that supported global fixed income markets. The yield on the US 10-year Treasury fell from 2.21% to 1.58% during the reporting period (bond yields and prices move in opposite directions). Demand for US Treasuries was generally strong from both domestic and international investors. In addition, at the Fed's June 2016 meeting they lowered their projections of how much they expect to raise rates in the coming years. The overall US bond market, as measured by the Bloomberg Barclays US Aggregate Index,7 gained 5.97% for the 12 months ended August 31, 2016. Returns of riskier fixed income securities were even stronger. High yield bonds, as measured by the BofA Merrill Lynch US High Yield Cash Pay Constrained Index8 gained 9.21%. Meanwhile, emerging market debt, as measured by the J.P. Morgan Emerging Markets Bond Index Global (EMBI Global),9 rose 14.82% during the reporting period.
Portfolio commentary
What worked
• Overall, asset allocation added value during the reporting period, largely driven by the Fund's fixed income position.10
—We tactically adjusted the portfolio during the 12-month period given the changing economic and market environment. We began the reporting period overweight equities versus the Index, with a 66.0% allocation, while we were underweight fixed income, with a 15.0% allocation to US investment grade bonds. Elsewhere, we had a 5.0% allocation to US high yield bonds and a 14.0% cash position.
—At the end of the reporting period, the Fund was allocated as follows: US equities—65.0%; US investment grade bonds—23.3%; US high yield bonds—6.0%; cash—5.7%. For comparison purposes, neutral Index weights for the Fund are 65.0% equities and 35.0% fixed income.
Throughout the reporting period, we maintained an underweight to US fixed income, as we found the asset class to be extremely overvalued. We added to our Treasury Inflation-Protected Security ("TIPS") allocation, as we believed inflation would rise in the US over the medium term. Additionally, we maintained our allocation to investment grade corporate bonds.
5 The MSCI EAFE Index (net) is an index of stocks designed to measure the investment returns of developed economies outside of North America. Net total return indices reinvest dividends after the deduction of withholding taxes, using a tax rate applicable to non-resident institutional investors who do not benefit from double taxation treaties. The index is constructed and managed with a view to being fully investable from the perspective of international institutional investors. Investors should note that indices do not reflect the deduction of fees and expenses.
6 The MSCI Emerging Markets Index (net) is a market-capitalization-weighted index composed of different emerging market countries in Europe, Latin America and the Pacific Basin. Net total return indices reinvest dividends after the deduction of withholding taxes, using a tax rate applicable to non-resident institutional investors who do not benefit from double taxation treaties. The index is constructed and managed with a view to being fully investable from the perspective of international institutional investors. Investors should note that indices do not reflect the deduction of fees and expenses.
7 The Bloomberg Barclays US Aggregate Index is an unmanaged-broad-based index designed to measure the US dollar-denominated, investment grade, taxable bond market. The index includes bonds from the Treasury, government-related, corporate, mortgage-backed, asset-backed and commercial mortgage-backed sectors. Investors should note that indices do not reflect the deduction of fees and expenses.
8 The BofA Merrill Lynch US High Yield Cash Pay Constrained Index is an unmanaged index of publicly placed, non-convertible, coupon-bearing US dollar denominated, below investment grade corporate debt with a term to maturity of at least one year. The index is market-capitalization-weighted, so that larger bond issuers have a greater effect on the index's return. However, the representation of any single bond issuer is restricted to a maximum of 2% of the total index. Investors should note that indices do not reflect the deduction of fees and expenses.
9 The J.P. Morgan Emerging Markets Bond Index Global (EMBI Global) is an unmanaged index which is designed to track total returns for US dollar-denominated debt instruments issued by emerging market sovereign and quasi-sovereign entities: Brady bonds, loans and Eurobonds. Investors should note that indices do not reflect the deduction of fees and expenses.
10 Allocations include derivative exposure.
2
• The use of equity futures improved the Fund's results. These derivative instruments, which were utilized to manage the Fund's equity exposure, added to performance.
• In the US equity research portion of the Fund, stock selection in the consumer discretionary, financials and utilities sectors contributed to results.
– HeartWare International, Inc. was the top contributor in the US equity research portion of the Fund. The company was purchased by Medtronic during the reporting period at a large premium. The HeartWare Ventricular Assist Device System offered strategic value to a large established cardio player. This was an acquisition that made sense for Medtronic and benefited HeartWare International shareholders.
– Digital Realty Trust is a unique holding in that it is both a technology and a real estate investment trust ("REIT") play. Digital Realty sells data storage space. It has a strong franchise and benefited from increased demand for data storage and positive network benefits from its co-location platform.
– SM Energy Corp. is an independent energy company engaged in the exploration, exploitation, development, acquisition and production of natural gas and crude oil. The company has operations in the Mid-Continent, Rocky Mountains, Permian Basin and Gulf Coast regions. Investor sentiment for the company improved along with rising oil prices.
– In the US equity research portion of the Fund, overweights to the information technology and energy sectors were positive for relative performance.
• In the US growth equity portion of the Fund, stock selection in the consumer discretionary and materials sectors were additive for performance.
– Facebook, Inc. is the world's leading social media company. Its shares rallied as Facebook reported revenues and earnings that exceeded expectations. This was driven by the company's mobile and desktop advertising business which continues to take market share from traditional platforms, such as television, newspapers and radio.
– Amazon.com, Inc. is a leading ecommerce company. Investor sentiment for Amazon.com was buoyed by increased margins and market share gains. In particular, Amazon Web Services ("AWS") has performed well. AWS offers a suite of cloud-computing services that make up an on-demand computing platform.
– The Cooper Cos., Inc. is a health care company that manufactures and sells contact lenses. Its shares rose as Cooper Companies benefited from consolidation in the industry and pricing power that has led to earnings growth.
• In the US growth equity portion of the Fund, an overweight to information technology, an underweight to energy and an overweight to materials was beneficial for relative performance.
What didn't work
• The Fund's strategic cash overweight detracted from relative performance during the 12-month reporting period.
• The Fund's equity allocation slightly detracted from performance during the period. From a strategy perspective, we ended the reporting period with a neutral equity exposure. That said, we maintained our preference for US equities over bonds and held some cash on the sidelines. Overall, we felt that equities were neutral to over-
3
valued, but that they could generate positive results given continued accommodative monetary policy and investor demand. Within US equities, our preference for small cap equities versus large cap equities was not favorable for results. We opted to close this position in December 2015 after discouraging earnings trends and merger and acquisition ("M&A") activity among smaller cap companies.
• Certain fixed income derivative instruments, including interest rate futures, were used to facilitate specific duration and yield curve strategies. US Treasury futures were used to adjust the Fund's duration positioning and achieve specific exposure. Our use of fixed income derivatives was a slight detractor from performance during the period.
• Stock selection, overall, was the primary detractor of performance during the reporting period. In the US growth equity portion of the Fund, holdings in the health care, information technology and financials sectors were the largest detractors from results.
– Allergan plc. is a health care company whose key product is Botox. During the reporting period, a deal for Allergan to be acquired by Pfizer was effectively blocked by the US Treasury Department, and Allergan's share price subsequently declined. We took this as an opportunity to add to our position, as we believe the company offers compelling risk/reward characteristics.
– Vertex Pharmaceuticals, Inc. is a biotechnology company whose key drug Orkambi is used in the treatment of cystic fibrosis. Its shares were negatively impacted as the timing for reimbursements in the European Union was slightly delayed. We maintain our position in the company and find its current valuation to be attractive.
– Gilead Sciences, Inc. is a biotechnology company that has experienced success with its products to treat AIDS and Hepatitis C. Its shares fell due to concerns over competition for its Hepatitis C product. We continue to own the company, as we believe it is attractively valued and has the ability to gain market share.
• Sector positioning, overall, also detracted from results in the US growth equity portion of the Fund. In particular, an underweight to consumer staples, an overweight to health care and the portfolio's modest cash position were the largest detractors from relative results.
• Stock selection, overall, was negative for performance in the US equity research portion of the Fund, with holdings in the health care, materials and industrials sectors being the largest detractors from results.
– Chimerix, Inc. was the top detractor from results in the US equity research portion of the portfolio. In particular, its shares fell sharply following the release of disappointing clinical data in December 2015. We liquidated the position during the reporting period to pursue more compelling price-to-value opportunities.
– Alnylam Pharmaceuticals, Inc. is a biotechnology company focused on the discovery, development and commercialization of novel therapeutics based on RNA interference. It was a top detractor as biotechnology performed poorly due to periods of investor risk aversion. We believe the company's RNA interference (RNAi) technology has the potential to effectively silence disease-causing genes. While it is still early in development, there have been significant value-creating advances over the past two years.
– Cobalt International Energy is an oil exploration and production company with oil portfolios in North America and West Africa. In our view, the company is very well positioned from an asset value perspective. However, investors were concerned about if or when the company's Angola asset sale would take place. We believe Cobalt International Energy should be able to meet its near-term capital plans even without the Angola sale. We closed our position in the stock in August, prior to the end of the reporting period.
4
• Sector positioning, overall, detracted from results in the US equity research portion of the Fund. In particular, underweights to telecommunication services and utilities were the largest detractors from results.
Outlook
We continue to prefer US equities over US bonds and are holding some cash on the sidelines. We currently have a neutral allocation to US equities, as our analysis shows US equities as being overvalued in a historical context.
We hold an underweight to US fixed income and maintain a neutral duration stance among fixed income holdings in the strategy. While we see nominal US government bonds as fully valued, we maintain our position in US TIPS to benefit from our belief that investors may be underestimating medium-term US inflation risks. We also continue to prefer global investment grade corporate bonds over sovereigns, which is largely predicated on yield pick-up. We do not believe that a sharp rise in defaults at the higher-quality end of corporate debt is likely in the current backdrop.
Political risk is likely to be one of the biggest drivers of market sentiment, with the US presidential elections rapidly approaching. Meanwhile, the market continues to wrestle with the economic implications following the "Brexit" vote, which has created vast uncertainty for Britain, the European Union and beyond. While fears about a slowing Chinese economy have faded on account of improving economic data, we believe that long-term challenges remain a concern and need to be monitored closely.
We thank you for your continued support and welcome any comments or questions you may have. For additional information on the UBS family of funds,* please contact your financial advisor or visit us at www.ubs.com/am-us.
Sincerely,


Mark E. Carver
President
UBS U.S. Allocation Fund
Managing Director
UBS Asset Management
(Americas) Inc. | | Andreas Koester
Portfolio Manager
UBS U.S. Allocation Fund
Managing Director
UBS Asset Management
(Americas) Inc. | |
This letter is intended to assist shareholders in understanding how the Fund performed during the 12 months ended August 31, 2016. The views and opinions in the letter were current as of October 17, 2016. They are not guarantees of future performance or investment results and should not be taken as investment advice. Investment decisions reflect a variety of factors, and we reserve the right to change our views about individual securities, sectors and markets at any time. As a result, the views expressed should not be relied upon as a forecast of the Fund's future investment intent. We encourage you to consult your financial advisor regarding your personal investment program.
* Mutual funds are sold by prospectus only. You should read it carefully and consider a fund's investment objectives, risks, charges, expenses and other important information contained in the prospectus before investing. The prospectus contains this and other information about the fund. Prospectuses for most of our funds can be obtained from your Financial Advisor, by calling UBS Funds at 800-647 1568 or by visiting our Web site at www.ubs.com/am-us.
5
Performance at a glance (unaudited)
Average annual total returns for periods ended 08/31/2016 | | 1 year | | 5 years | | 10 years | |
Before deducting maximum sales charge | |
Class A1 | | | 7.03 | % | | | 10.02 | % | | | 5.22 | % | |
Class C2 | | | 6.24 | | | | 9.19 | | | | 4.43 | | |
Class P3 | | | 7.32 | | | | 10.33 | | | | 5.54 | | |
After deducting maximum sales charge | |
Class A1 | | | 1.15 | | | | 8.78 | | | | 4.62 | | |
Class C2 | | | 5.24 | | | | 9.19 | | | | 4.43 | | |
S&P 500 Index4 | | | 12.55 | | | | 14.69 | | | | 7.51 | | |
UBS U.S. Allocation Fund Benchmark5 | | | 9.87 | | | | 10.80 | | | | 7.08 | | |
Lipper Flexible Portfolio Funds median | | | 5.13 | | | | 5.31 | | | | 4.49 | | |
Most recent calendar quarter-end returns (unaudited)
Average annual total returns for periods ended 09/30/2016 | | 1 year | | 5 years | | 10 years | |
Before deducting maximum sales charge | |
Class A1 | | | 10.79 | % | | | 11.36 | % | | | 5.03 | % | |
Class C2 | | | 9.94 | | | | 10.52 | | | | 4.24 | | |
Class P3 | | | 11.11 | | | | 11.67 | | | | 5.36 | | |
After deducting maximum sales charge | |
Class A1 | | | 4.70 | | | | 10.11 | | | | 4.44 | | |
Class C2 | | | 8.94 | | | | 10.52 | | | | 4.24 | | |
The annualized gross and net expense ratios, respectively, for each class of shares as in the December 29, 2015 prospectuses, were as follows: Class A—1.02% and 1.02%; Class C—1.78% and 1.78%; and Class P—0.76% and 0.76%.
Net expenses reflect fee waivers and/or expense reimbursements, if any, pursuant to an agreement that is in effect to cap the expenses. The Fund and UBS Asset Management (Americas) Inc. (formerly, UBS Global Asset Management (Americas) Inc.) have entered into a written agreement, separate from UBS AM's investment advisory agreement with the Fund, whereby UBS AM has agreed to permanently reduce its management fees based on the Fund's average daily net assets to the following rates: $0 to $250 million: 0.50%; in excess of $250 million up to $500 million: 0.45%; in excess of $500 million up to $2 billion: 0.40%; over $2 billion: 0.35%. Effective December 29, 2015, UBS AM has contractually undertaken to waive fees/reimburse a portion of the Fund's expenses, when necessary, so that the ordinary total annual operating expenses of each class through December 31, 2016 (excluding dividend expense, borrowing costs and interest expense relating to short sales, and expenses attributable to investments in other investment companies, interest, taxes, brokerage commissions and extraordinary expenses, if any) would not exceed 1.15% for Class A, 1.90% for Class C and 0.90% for Class P.
1 Maximum sales charge for Class A shares is 5.5%. Class A shares bear ongoing 12b-1 service fees.
2 Maximum contingent deferred sales charge for Class C shares is 1% imposed on redemptions and is reduced to 0% after one year. Class C shares bear ongoing 12b-1 distribution and service fees.
3 Class P shares do not bear initial or contingent deferred sales charges or ongoing 12b-1 service and distribution fees, but Class P shares held through advisory programs may be subject to a program fee, which, if included, would have reduced performance.
4 The S&P 500 Index is an unmanaged, weighted index comprising 500 widely held common stocks varying in composition and is not available for direct investment. Investors should note that indices do not reflect the deduction of fees and expenses.
5 The UBS U.S. Allocation Fund Benchmark is an unmanaged benchmark compiled by the Advisor, constructed as follows: from July 22, 1992 (the Fund's inception) until February 29, 2004: 100% S&P 500 Index; from March 1, 2004 until May 31, 2005: 65% Russell 3000 Index, 30% Barclays US Aggregate Index, and 5% BofA Merrill Lynch US High Yield Cash Pay Index; and from June 1, 2005 until present: 65% Russell 3000 Index, 30% Barclays US Aggregate Index, and 5% BofA Merrill Lynch US High Yield Cash Pay Constrained Index. Investors should note that indices do not reflect the deduction of fees and expenses.
Prior to February 17, 2015, if an investor sold or exchanged shares less than 90 days after purchase, a redemption fee of 1.00% of the amount sold or exchanged was deducted at the time of the transaction, except as noted otherwise in the prospectus. For sales or exchanges taking place on or after February 17, 2015 but prior to August 3, 2015, there was a reduction in the redemption holding period from 90 days to 30 days. Effective August 3, 2015, the 1.00% redemption fee imposed on sales or exchanges of any class of shares of the funds made during the holding periods specified in the prospectus was eliminated. Please refer to the prospectus for further information.
Past performance does not predict future performance, and the performance information provided does not reflect the deduction of taxes that a shareholder would pay on Fund distributions or the redemption of Fund shares. The return and principal value of an investment will fluctuate, so that an investor's shares, when redeemed, may be worth more or less than their original cost. Performance results assume reinvestment of all dividends and capital gain distributions at net asset value on the ex-dividend dates. Current performance may be higher or lower than the performance data quoted. For month-end performance figures, please visit http://www.ubs.com/us-mutualfundperformance.
Lipper peer group data calculated by Lipper Inc.; used with permission. The Lipper median is the return of the fund that places in the middle of a Lipper peer group.
6
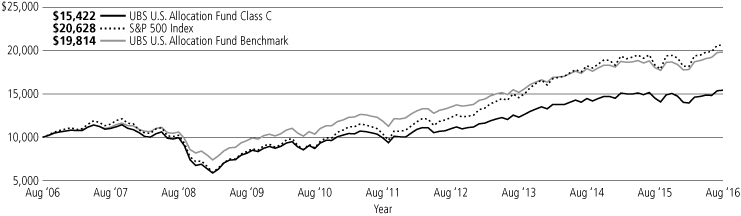
Illustration of an assumed investment of $10,000 in Class C shares of the Fund (unaudited)
The following graph depicts the performance of UBS U.S. Allocation Fund Class C shares versus the S&P 500 Index and the UBS U.S. Allocation Fund Benchmark over the 10 years ended August 31, 2016. The performance of the other classes will vary based upon the different class specific expenses and sales charges. The performance provided does not reflect the deduction of taxes that a shareholder would pay on Fund distributions or the redemption of Fund shares. Past performance is no guarantee of future results. Share price and returns will vary with market conditions; investors may realize a gain or loss upon redemption. It is important to note that the Fund is a professionally managed portfolio while the Indices are not available for investment and are unmanaged. The comparison is shown for illustration purposes only.
UBS U.S. Allocation Fund
7
Understanding your Fund's expenses (unaudited)
As a shareholder of the Fund, you incur two types of costs: (1) transactional costs (as applicable), including sales charges (loads); and (2) ongoing costs, including management fees; service and/or distribution (12b-1) fees (if applicable); and other Fund expenses. This example is intended to help you understand your ongoing costs (in dollars) of investing in the Fund and to compare these costs with the ongoing costs of investing in other mutual funds.
The example below is based on an investment of $1,000 invested at the beginning of the period and held for the entire period, March 1, 2016 to August 31, 2016.
Actual expenses (unaudited)
The first line for each class of shares in the table below provides information about actual account values and actual expenses. You may use the information in this line, together with the amount you invested, to estimate the expenses that you paid over a period. Simply divide your account value by $1,000 (for example, an $8,600 account value divided by $1,000 = 8.6), then multiply the result by the number in the first line for each class of shares under the heading entitled "Expenses paid during period" to estimate the expenses you paid on your account during this period.
Hypothetical example for comparison purposes (unaudited)
The second line for each class of shares in the table below provides information about hypothetical account values and hypothetical expenses based on the Fund's actual expense ratios for each class of shares and an assumed rate of return of 5% per year before expenses, which is not the Fund's actual return for each class of shares. The hypothetical account values and expenses may not be used to estimate the actual ending account balance or expenses you paid for the period. You may use this information to compare the ongoing costs of investing in the Fund and other funds. To do so, compare this 5% hypothetical example with the 5% hypothetical examples that appear in the shareholder reports of other funds.
Please note that the expenses shown in the table are meant to highlight your ongoing Fund costs only and do not reflect any transactional costs (as applicable), such as sales charges (loads). Therefore, the second line in the table for each class of shares is useful in comparing ongoing Fund costs only, and will not help you determine the relative total costs of owning different funds. In addition, if these transactional costs were included, your costs would have been higer.
| | | | | Beginning
account value
March 1, 2016 | | Ending
account value
August 31, 2016 | | Expenses paid
during period1
03/01/16 to 08/31/16 | | Expense
ratio during
the period | |
Class A | | Actual | | $ | 1,000.00 | | | $ | 1,109.50 | | | $ | 5.41 | | | | 1.02 | % | |
| | | Hypothetical (5% annual return before expenses) | | | 1,000.00 | | | | 1,020.01 | | | | 5.18 | | | | 1.02 | | |
Class C | | Actual | | | 1,000.00 | | | | 1,105.40 | | | | 9.42 | | | | 1.78 | | |
| | | Hypothetical (5% annual return before expenses) | | | 1,000.00 | | | | 1,016.19 | | | | 9.02 | | | | 1.78 | | |
Class P | | Actual | | | 1,000.00 | | | | 1,111.00 | | | | 3.98 | | | | 0.75 | | |
| | | Hypothetical (5% annual return before expenses) | | | 1,000.00 | | | | 1,021.37 | | | | 3.81 | | | | 0.75 | | |
1 Expenses are equal to the Fund's annualized net expense ratio, multiplied by the average account value over the period, multiplied by 184 divided by 366 (to reflect the one-half year period).
8
Portfolio statistics (unaudited)
Characteristics | | 08/31/16 | | | | 02/29/16 | | | | 08/31/15 | |
Net assets (mm) | | $ | 247.3 | | | | | $ | 235.4 | | | | | $ | 255.0 | | |
Number of securities | | | 549 | | | | | | 459 | | | | | | 440 | | |
Portfolio composition1 | | 08/31/16 | | | | 02/29/16 | | | | 08/31/15 | |
Stocks & investment company | | | 45.2 | % | | | | | 44.3 | % | | | | | 49.2 | % | |
Bonds and notes | | | 31.3 | | | | | | 32.0 | | | | | | 27.6 | | |
Futures | | | 1.1 | | | | | | (1.2 | ) | | | | | (1.5 | ) | |
Swaps | | | 0.1 | | | | | | 0.02 | | | | | | — | | |
Cash equivalents and
other assets less liabilities | | | 22.3 | | | | | | 24.9 | | | | | | 24.7 | | |
Total | | | 100.0 | % | | | | | 100.0 | % | | | | | 100.0 | % | |
Top five equity sectors1 | | 08/31/16 | | | | 02/29/16 | | | | 08/31/15 | |
Information technology | | | 13.2 | % | | Information technology | | | 12.5 | % | | Information technology | | | 13.1 | % | |
Consumer discretionary | | | 8.2 | | | Consumer discretionary | | | 8.4 | | | Health care | | | 8.9 | | |
Health care | | | 6.0 | | | Health care | | | 6.8 | | | Consumer discretionary | | | 8.7 | | |
Industrials | | | 4.4 | | | Industrials | | | 4.0 | | | Financials | | | 4.2 | | |
Financials | | | 3.8 | | | Financials | | | 3.4 | | | Industrials | | | 4.2 | | |
Total | | | 35.6 | % | | | | | 35.1 | % | | | | | 39.1 | % | |
Top ten equity securities1 | | 08/31/16 | | | | 02/29/16 | | | | 08/31/15 | |
Facebook, Inc., Class A | | | 2.0 | % | | Facebook, Inc., Class A | | | 2.0 | % | | Apple, Inc. | | | 2.4 | % | |
Amazon.com, Inc. | | | 1.8 | | | Amazon.com, Inc. | | | 1.4 | | | Facebook, Inc., Class A | | | 1.6 | | |
Microsoft Corp. | | | 1.6 | | | Alphabet, Inc., Class A | | | 1.3 | | | Amazon.com, Inc. | | | 1.3 | | |
Alphabet, Inc., Class A | | | 1.3 | | | Apple, Inc. | | | 1.3 | | | Allergan PLC | | | 1.1 | | |
The Home Depot, Inc. | | | 1.1 | | | Microsoft Corp. | | | 1.3 | | | Google, Inc., Class A | | | 1.1 | | |
Apple, Inc. | | | 0.9 | | | The Home Depot, Inc. | | | 1.2 | | | The Home Depot, Inc. | | | 1.1 | | |
Allergan PLC | | | 0.9 | | | Allergan PLC | | | 1.1 | | | Visa, Inc., Class A | | | 1.0 | | |
Broadcom Ltd. | | | 0.9 | | | The TJX Cos., Inc. | | | 0.9 | | | MasterCard, Inc., Class A | | | 1.0 | | |
Salesforce.com, Inc. | | | 0.8 | | | Starbucks Corp. | | | 0.8 | | | The TJX Cos., Inc. | | | 0.9 | | |
The TJX Cos., Inc. | | | 0.8 | | | Salesforce.com, Inc. | | | 0.8 | | | Starbucks Corp. | | | 0.8 | | |
Total | | | 12.1 | % | | | | | 12.1 | % | | | | | 12.3 | % | |
1 Weightings represent percentages of the Fund's net assets as of the dates indicated. The Fund's portfolio is actively managed and its composition will vary over time.
2 Weighting represents less than 0.05% of the Fund's net assets as of the dates indicated.
9
Portfolio statistics (unaudited) (concluded)
Long-term fixed income
sector allocation1 | | 08/31/16 | | | | 02/29/16 | | | | 08/31/15 | |
US government obligations | | | 11.6 | % | | | | | 15.0 | % | | | | | 11.6 | % | |
Corporate bonds | | | 9.4 | | | | | | 7.9 | | | | | | 8.3 | | |
Mortgage & agency debt securities | | | 6.8 | | | | | | 6.0 | | | | | | 4.8 | | |
Asset-backed securities | | | 1.5 | | | | | | 1.1 | | | | | | 0.9 | | |
Commercial mortgage-backed
securities | | | 1.3 | | | | | | 1.3 | | | | | | 1.3 | | |
Non-US government obligations | | | 0.4 | | | | | | 0.4 | | | | | | 0.3 | | |
Municipal bonds and notes | | | 0.3 | | | | | | 0.3 | | | | | | 0.4 | | |
Collateralized mortgage obligations | | | — | | | | | | 0.02 | | | | | | 0.02 | | |
Total | | | 31.3 | % | | | | | 32.0 | % | | | | | 27.6 | % | |
Top ten fixed income
securities1 | | 08/31/16 | | | | 02/29/16 | | | | 08/31/15 | |
US Treasury Inflation Index Notes (TIPS),
0.375%, due 07/15/25 | | | 6.7 | % | | US Treasury Inflation Index Notes (TIPS),
0.375%, due 07/15/25 | | | 6.8 | % | | US Treasury Inflation Index Notes (TIPS),
0.375%, due 07/15/25 | | | 6.9 | % | |
FHLMC Certificate,
3.000%, TBA | | | 1.7 | | | US Treasury Inflation Index Notes (TIPS),
0.125%, due 04/15/20 | | | 4.7 | | | FNMA Certificate,
3.500%, TBA | | | 1.2 | | |
FNMA Certificate,
4.500%, due 09/14/46 | | | 1.3 | | | FNMA Certificate,
3.500%, TBA | | | 1.9 | | | US Treasury Notes,
1.125%, due 06/15/18 | | | 0.9 | | |
FNMA Certificate,
3.000%, TBA | | | 1.1 | | | US Treasury Notes,
2.125%, due 12/31/22 | | | 1.0 | | | FNMA Certificate,
3.000%, TBA | | | 0.6 | | |
US Treasury Inflation Index Notes (TIPS),
0.125%, due 04/15/20 | | | 1.0 | | | FNMA Certificate,
3.000%, TBA | | | 0.8 | | | US Treasury Notes,
1.625%, due 06/30/20 | | | 0.6 | | |
FHLMC Certificate,
3.500%, due 09/14/46 | | | 0.9 | | | FNMA Certificate,
4.500%, TBA | | | 0.7 | | | US Treasury Notes,
1.625%, due 07/31/20 | | | 0.6 | | |
US Treasury Notes,
0.875%, due 05/31/18 | | | 0.7 | | | GNMA Certificates II,
4.000%, TBA | | | 0.5 | | | US Treasury Notes,
2.125%, due 05/15/25 | | | 0.5 | | |
US Treasury Bonds,
2.500%, due 05/15/46 | | | 0.5 | | | GNMA Certificates II,
3.500%, TBA | | | 0.5 | | | GNMA Certificates I,
4.000%, TBA | | | 0.5 | | |
US Treasury Inflation Index Notes (TIPS),
0.625%, due 01/15/26 | | | 0.4 | | | US Treasury Notes,
2.250%, due 11/15/25 | | | 0.5 | | | GNMA Certificates II,
3.500%, TBA | | | 0.4 | | |
US Treasury Notes,
1.125%, due 06/30/21 | | | 0.4 | | | US Treasury Notes,
1.000%, due 08/15/18 | | | 0.4 | | | US Treasury Notes,
2.125%, due 06/30/22 | | | 0.4 | | |
Total | | | 14.7 | % | | | | | 17.8 | % | | | | | 12.6 | % | |
1 Weightings represent percentages of the Fund's net assets as of the dates indicated. The Fund's portfolio is actively managed and its composition will vary over time.
2 Weighting represents less than 0.05% of the Fund's net assets as of the dates indicated.
10
UBS U.S. Allocation Fund
Portfolio of investments—August 31, 2016
| | | Shares | | Value | |
Common stocks—40.68% | |
Aerospace & defense—1.44% | |
Honeywell International, Inc. | | | 14,288 | | | $ | 1,667,552 | | |
TransDigm Group, Inc.*,1 | | | 4,109 | | | | 1,171,846 | | |
United Technologies Corp. | | | 6,767 | | | | 720,212 | | |
| | | | | | 3,559,610 | | |
Auto components—0.25% | |
Delphi Automotive PLC | | | 8,842 | | | | 624,776 | | |
Automobiles—0.32% | |
General Motors Co. | | | 24,682 | | | | 787,849 | | |
Banks—0.13% | |
U.S. Bancorp | | | 7,278 | | | | 321,324 | | |
Beverages—0.47% | |
PepsiCo, Inc. | | | 10,838 | | | | 1,156,956 | | |
Biotechnology—2.35% | |
Alnylam Pharmaceuticals, Inc.*,1 | | | 8,970 | | | | 626,555 | | |
Atara Biotherapeutics, Inc.*,1 | | | 4,583 | | | | 89,552 | | |
Bio-Rad Laboratories, Inc., Class A*,1 | | | 1,020 | | | | 151,786 | | |
Celgene Corp.* | | | 16,406 | | | | 1,751,176 | | |
Emergent BioSolutions, Inc.* | | | 6,764 | | | | 180,261 | | |
Gilead Sciences, Inc. | | | 14,718 | | | | 1,153,597 | | |
Lexicon Pharmaceuticals, Inc.*,1 | | | 46,708 | | | | 648,307 | | |
MacroGenics, Inc.*,1 | | | 2,809 | | | | 83,736 | | |
TG Therapeutics, Inc.*,1 | | | 7,712 | | | | 48,971 | | |
Vertex Pharmaceuticals, Inc.* | | | 11,379 | | | | 1,075,429 | | |
| | | | | | 5,809,370 | | |
Capital markets—0.19% | |
Morgan Stanley | | | 14,848 | | | | 476,027 | | |
Chemicals—1.46% | |
Ecolab, Inc. | | | 12,476 | | | | 1,535,172 | | |
The Dow Chemical Co. | | | 10,970 | | | | 588,431 | | |
The Sherwin-Williams Co. | | | 5,268 | | | | 1,494,584 | | |
| | | | | | 3,618,187 | | |
Communications equipment—0.12% | |
Arista Networks, Inc.*,1 | | | 3,776 | | | | 300,872 | | |
Construction materials—0.15% | |
Martin Marietta Materials, Inc. | | | 2,032 | | | | 371,917 | | |
Consumer finance—0.63% | |
American Express Co. | | | 5,380 | | | | 352,820 | | |
Synchrony Financial | | | 43,635 | | | | 1,214,362 | | |
| | | | | | 1,567,182 | | |
Diversified financial services—0.40% | |
JPMorgan Chase & Co. | | | 14,583 | | | | 984,352 | | |
Electric utilities—0.28% | |
NextEra Energy, Inc. | | | 5,627 | | | | 680,529 | | |
Electronic equipment, instruments & components—0.13% | |
Jabil Circuit, Inc. | | | 14,611 | | | | 309,607 | | |
| | | Shares | | Value | |
Common stocks—(continued) | |
Energy equipment & services—0.32% | |
Halliburton Co. | | | 6,723 | | | $ | 289,156 | | |
McDermott International, Inc.* | | | 77,923 | | | | 407,537 | | |
Noble Corp. PLC1 | | | 15,230 | | | | 87,725 | | |
| | | | | | 784,418 | | |
Food & staples retailing—0.20% | |
Walgreens Boots Alliance, Inc. | | | 6,281 | | | | 506,940 | | |
Food products—0.39% | |
Mondelez International, Inc., Class A | | | 21,607 | | | | 972,747 | | |
Health care equipment & supplies—0.70% | |
The Cooper Cos., Inc.1 | | | 4,245 | | | | 789,230 | | |
Zimmer Biomet Holdings, Inc. | | | 7,334 | | | | 950,560 | | |
| | | | | | 1,739,790 | | |
Health care providers & services—1.01% | |
Centene Corp.* | | | 12,938 | | | | 883,536 | | |
Envision Healthcare Holdings, Inc.* | | | 10,818 | | | | 232,154 | | |
Express Scripts Holding Co.* | | | 12,054 | | | | 876,326 | | |
UnitedHealth Group, Inc. | | | 3,775 | | | | 513,589 | | |
| | | | | | 2,505,605 | | |
Hotels, restaurants & leisure—0.97% | |
Starbucks Corp. | | | 31,145 | | | | 1,751,283 | | |
Yum! Brands, Inc. | | | 7,119 | | | | 645,765 | | |
| | | | | | 2,397,048 | | |
Household durables—0.29% | |
Newell Brands, Inc. | | | 13,384 | | | | 710,423 | | |
Industrial conglomerates—0.84% | |
Danaher Corp. | | | 16,992 | | | | 1,383,319 | | |
General Electric Co. | | | 22,182 | | | | 692,965 | | |
| | | | | | 2,076,284 | | |
Insurance—1.50% | |
Aflac, Inc. | | | 6,106 | | | | 452,943 | | |
Aon PLC | | | 3,950 | | | | 439,833 | | |
Lincoln National Corp. | | | 10,632 | | | | 510,655 | | |
Marsh & McLennan Cos., Inc. | | | 17,225 | | | | 1,164,927 | | |
MetLife, Inc. | | | 8,806 | | | | 382,180 | | |
The Allstate Corp. | | | 11,154 | | | | 769,180 | | |
| | | | | | 3,719,718 | | |
Internet & catalog retail—2.48% | |
Amazon.com, Inc.* | | | 5,703 | | | | 4,386,519 | | |
Expedia, Inc.1 | | | 2,840 | | | | 309,901 | | |
The Priceline Group, Inc.* | | | 314 | | | | 444,853 | | |
TripAdvisor, Inc.* | | | 16,106 | | | | 982,466 | | |
| | | | | | 6,123,739 | | |
Internet software & services—4.15% | |
Alphabet, Inc., Class A* | | | 4,152 | | | | 3,279,457 | | |
Alphabet, Inc., Class C* | | | 2,331 | | | | 1,787,994 | | |
Facebook, Inc., Class A* | | | 39,031 | | | | 4,922,590 | | |
Instructure, Inc.*,1 | | | 11,585 | | | | 277,229 | | |
| | | | | | 10,267,270 | | |
11
UBS U.S. Allocation Fund
Portfolio of investments—August 31, 2016
| | | Shares | | Value | |
Common stocks—(continued) | |
IT services—1.60% | |
Cognizant Technology Solutions Corp., Class A* | | | 15,812 | | | $ | 908,241 | | |
First Data Corp., Class A* | | | 13,702 | | | | 190,732 | | |
MasterCard, Inc., Class A | | | 10,995 | | | | 1,062,447 | | |
Visa, Inc., Class A1 | | | 22,093 | | | | 1,787,324 | | |
| | | | | | 3,948,744 | | |
Machinery—0.62% | |
Caterpillar, Inc.1 | | | 4,847 | | | | 397,212 | | |
Colfax Corp.*,1 | | | 12,117 | | | | 359,632 | | |
Fortive Corp. | | | 14,883 | | | | 783,888 | | |
| | | | | | 1,540,732 | | |
Media—0.78% | |
CBS Corp., Class B1 | | | 10,633 | | | | 542,602 | | |
The Walt Disney Co. | | | 7,472 | | | | 705,805 | | |
Time Warner, Inc. | | | 8,651 | | | | 678,325 | | |
| | | | | | 1,926,732 | | |
Oil, gas & consumable fuels—1.05% | |
Chevron Corp. | | | 1,485 | | | | 149,361 | | |
EOG Resources, Inc. | | | 6,176 | | | | 546,514 | | |
Gulfport Energy Corp.* | | | 6,193 | | | | 177,120 | | |
Laredo Petroleum, Inc.* | | | 35,567 | | | | 436,763 | | |
Oasis Petroleum, Inc.* | | | 44,029 | | | | 417,395 | | |
PDC Energy, Inc.* | | | 4,827 | | | | 320,513 | | |
SM Energy Co.1 | | | 14,805 | | | | 560,813 | | |
| | | | | | 2,608,479 | | |
Personal products—0.52% | |
The Estee Lauder Cos., Inc., Class A | | | 14,360 | | | | 1,281,343 | | |
Pharmaceuticals—1.90% | |
Allergan PLC* | | | 9,492 | | | | 2,226,254 | | |
Biogen, Inc.* | | | 1,018 | | | | 311,131 | | |
Catalent, Inc.* | | | 15,164 | | | | 382,588 | | |
Eli Lilly & Co. | | | 5,779 | | | | 449,317 | | |
Impax Laboratories, Inc.* | | | 4,947 | | | | 119,668 | | |
Mallinckrodt PLC* | | | 5,897 | | | | 439,562 | | |
Teva Pharmaceutical Industries Ltd., ADR | | | 4,630 | | | | 233,306 | | |
The Medicines Co.*,1 | | | 13,509 | | | | 529,148 | | |
| | | | | | 4,690,974 | | |
Professional services—0.97% | |
S&P Global, Inc. | | | 8,262 | | | | 1,020,688 | | |
Verisk Analytics, Inc.* | | | 16,709 | | | | 1,387,682 | | |
| | | | | | 2,408,370 | | |
Real estate investment trusts—0.51% | |
Digital Realty Trust, Inc.1 | | | 6,810 | | | | 674,803 | | |
Simon Property Group, Inc. | | | 2,750 | | | | 592,542 | | |
| | | | | | 1,267,345 | | |
Road & rail—0.90% | |
Canadian Pacific Railway Ltd. | | | 8,972 | | | | 1,373,703 | | |
Norfolk Southern Corp.1 | | | 3,433 | | | | 322,359 | | |
Union Pacific Corp. | | | 5,644 | | | | 539,171 | | |
| | | | | | 2,235,233 | | |
| | | Shares | | Value | |
Common stocks—(concluded) | |
Semiconductors & semiconductor equipment—2.68% | |
Broadcom Ltd. | | | 12,057 | | | $ | 2,127,096 | | |
Integrated Device Technology, Inc.* | | | 15,426 | | | | 309,908 | | |
Lam Research Corp. | | | 3,823 | | | | 356,763 | | |
Marvell Technology Group Ltd. | | | 24,960 | | | | 309,504 | | |
Maxim Integrated Products, Inc. | | | 8,038 | | | | 327,307 | | |
Micron Technology, Inc.* | | | 40,374 | | | | 665,767 | | |
NVIDIA Corp.1 | | | 9,589 | | | | 588,189 | | |
NXP Semiconductors NV* | | | 3,432 | | | | 302,085 | | |
ON Semiconductor Corp.* | | | 27,550 | | | | 297,540 | | |
Qorvo, Inc.* | | | 5,692 | | | | 326,892 | | |
Silicon Laboratories, Inc.* | | | 5,524 | | | | 316,525 | | |
Skyworks Solutions, Inc.1 | | | 4,744 | | | | 355,136 | | |
Xilinx, Inc.1 | | | 6,385 | | | | 346,131 | | |
| | | | | | 6,628,843 | | |
Software—3.49% | |
Activision Blizzard, Inc. | | | 7,834 | | | | 324,093 | | |
Atlassian Corp. PLC, Class A* | | | 19,100 | | | | 563,068 | | |
Electronic Arts, Inc.* | | | 4,302 | | | | 349,451 | | |
Microsoft Corp. | | | 68,038 | | | | 3,909,463 | | |
Salesforce.com, Inc.* | | | 26,169 | | | | 2,078,342 | | |
ServiceNow, Inc.* | | | 15,092 | | | | 1,096,736 | | |
Take-Two Interactive Software, Inc.*,1 | | | 7,104 | | | | 308,811 | | |
| | | | | | 8,629,964 | | |
Specialty retail—1.85% | |
The Home Depot, Inc. | | | 19,760 | | | | 2,650,211 | | |
The TJX Cos., Inc. | | | 24,706 | | | | 1,913,233 | | |
| | | | | | 4,563,444 | | |
Technology hardware, storage & peripherals—1.05% | |
Apple, Inc. | | | 21,229 | | | | 2,252,397 | | |
Western Digital Corp.1 | | | 7,297 | | | | 340,551 | | |
| | | | | | 2,592,948 | | |
Textiles, apparel & luxury goods—0.68% | |
Nike, Inc., Class B | | | 18,466 | | | | 1,064,380 | | |
Under Armour, Inc., Class A*,1 | | | 8,110 | | | | 321,400 | | |
Under Armour, Inc., Class C* | | | 8,168 | | | | 291,189 | | |
| | | | | | 1,676,969 | | |
Tobacco—0.41% | |
Philip Morris International, Inc. | | | 10,094 | | | | 1,008,693 | | |
Wireless telecommunication services—0.50% | |
SBA Communications Corp., Class A* | | | 7,981 | | | | 911,031 | | |
T-Mobile US, Inc.*,1 | | | 6,997 | | | | 324,241 | | |
| | | | | | 1,235,272 | | |
Total common stocks
(cost—$89,528,491) | | | 100,616,625 | | |
Investment company—4.54% | |
iShares iBoxx $ Investment Grade
Corporate Bond ETF
(cost—$10,994,228) | | | 90,700 | | | | 11,236,823 | | |
12
UBS U.S. Allocation Fund
Portfolio of investments—August 31, 2016
| | | Face
amount | | Value | |
US government obligations—11.64% | | | |
US Treasury Bonds
2.500%, due 02/15/46 | | $ | 185,000 | | | $ | 195,421 | | |
2.500%, due 05/15/46 | | | 1,215,000 | | | | 1,285,717 | | |
2.750%, due 11/15/42 | | | 425,000 | | | | 472,082 | | |
3.125%, due 08/15/44 | | | 550,000 | | | | 655,080 | | |
3.750%, due 11/15/43 | | | 375,000 | | | | 497,974 | | |
4.500%, due 02/15/36 | | | 25,000 | | | | 35,723 | | |
US Treasury Inflation Index Notes (TIPS)
0.125%, due 04/15/20 | | | 2,444,279 | | | | 2,466,680 | | |
0.375%, due 07/15/25 | | | 16,144,593 | | | | 16,498,078 | | |
0.625%, due 01/15/26 | | | 1,029,525 | | | | 1,072,727 | | |
US Treasury Notes
0.750%, due 07/15/19 | | | 550,000 | | | | 547,314 | | |
0.875%, due 03/31/18 | | | 275,000 | | | | 275,354 | | |
0.875%, due 05/31/18 | | | 1,725,000 | | | | 1,726,954 | | |
1.125%, due 06/30/21 | | | 1,025,000 | | | | 1,021,316 | | |
1.125%, due 07/31/21 | | | 425,000 | | | | 423,290 | | |
1.375%, due 06/30/23 | | | 275,000 | | | | 273,840 | | |
1.500%, due 02/28/23 | | | 130,000 | | | | 130,701 | | |
1.500%, due 08/15/26 | | | 225,000 | | | | 223,348 | | |
1.625%, due 05/15/26 | | | 330,000 | | | | 330,954 | | |
1.750%, due 01/31/23 | | | 300,000 | | | | 306,258 | | |
2.125%, due 12/31/22 | | | 325,000 | | | | 339,181 | | |
Total US government obligations
(cost—$27,975,355) | | | 28,777,992 | | |
Mortgage & agency debt securities—6.83% | | | |
Federal Home Loan Mortgage
Corporation Certificates,
3.500%, due 09/14/46 | | | 2,125,000 | | | | 2,236,894 | | |
5.000%, due 03/01/38 | | | 42,269 | | | | 46,876 | | |
5.000%, due 11/01/38 | | | 4,963 | | | | 5,469 | | |
5.500%, due 05/01/37 | | | 244,791 | | | | 279,904 | | |
5.500%, due 08/01/40 | | | 36,811 | | | | 41,593 | | |
6.500%, due 08/01/28 | | | 94,233 | | | | 109,948 | | |
| 3.000% TBA | | | 4,150,000 | | | | 4,303,679 | | |
Federal National Mortgage
Association Certificates,
4.000%, due 12/01/39 | | | 135,382 | | | | 144,893 | | |
4.000%, due 02/01/41 | | | 73,042 | | | | 78,463 | | |
4.000%, due 08/01/45 | | | 287,210 | | | | 312,847 | | |
4.500%, due 09/01/37 | | | 369,081 | | | | 406,108 | | |
4.500%, due 09/14/46 | | | 2,950,000 | | | | 3,221,723 | | |
5.000%, due 10/01/39 | | | 21,071 | | | | 23,336 | | |
5.000%, due 05/01/40 | | | 30,721 | | | | 34,123 | | |
5.500%, due 08/01/39 | | | 117,566 | | | | 132,104 | | |
7.000%, due 08/01/32 | | | 172,719 | | | | 209,779 | | |
7.500%, due 02/01/33 | | | 3,597 | | | | 4,193 | | |
| 2.500% TBA | | | 325,000 | | | | 327,773 | | |
| 3.000% TBA | | | 2,500,000 | | | | 2,595,458 | | |
| 3.500% TBA | | | 175,000 | | | | 184,352 | | |
Government National Mortgage
Association Certificates I,
4.000%, due 07/15/42 | | | 111,014 | | | | 120,994 | | |
Government National Mortgage
Association Certificates II,
3.000%, due 08/20/46 | | | 425,000 | | | | 445,560 | | |
| | | Face
amount | | Value | |
Mortgage & agency debt securities—(concluded) | | | |
6.000%, due 11/20/28 | | $ | 935 | | | $ | 1,073 | | |
6.000%, due 02/20/29 | | | 2,217 | | | | 2,605 | | |
6.000%, due 02/20/34 | | | 295,138 | | | | 324,475 | | |
| 2.500% TBA | | | 550,000 | | | | 560,420 | | |
| 3.000% TBA | | | 25,000 | | | | 26,175 | | |
| 3.500% TBA | | | 675,000 | | | | 716,212 | | |
Total mortgage & agency debt securities
(cost—$16,745,526) | | | 16,897,029 | | |
Asset-backed securities—1.47% | | | |
AmeriCredit Automobile Receivables Trust,
Series 2012-2, Class D,
3.380%, due 04/09/18 | | | 81,825 | | | | 81,855 | | |
Series 2012-3, Class C,
2.420%, due 05/08/18 | | | 10,519 | | | | 10,521 | | |
Series 2014-1, Class B,
1.680%, due 07/08/19 | | | 100,000 | | | | 100,137 | | |
Series 2014-1, Class D,
2.540%, due 06/08/20 | | | 200,000 | | | | 201,295 | | |
Series 2016-1, Class A2B,
1.248%, due 06/10/192 | | | 117,391 | | | | 117,648 | | |
Series 2016-3, Class D,
2.710%, due 09/08/22 | | | 225,000 | | | | 225,439 | | |
Capital Auto Receivables Asset Trust,
Series 2013-3, Class A4,
1.680%, due 04/20/18 | | | 184,612 | | | | 184,730 | | |
Series 2013-3, Class B,
2.320%, due 07/20/18 | | | 225,000 | | | | 225,667 | | |
Series 2016-1, Class D,
4.030%, due 08/21/23 | | | 320,000 | | | | 326,271 | | |
Series 2016-2, Class D,
3.160%, due 11/20/23 | | | 175,000 | | | | 173,871 | | |
Drive Auto Receivables Trust,
Series 2015-BA, Class D,
3.840%, due 07/15/213 | | | 300,000 | | | | 302,555 | | |
Series 2015-CA, Class D,
4.200%, due 09/15/213 | | | 225,000 | | | | 224,503 | | |
Series 2015-DA, Class D,
4.590%, due 01/17/233 | | | 200,000 | | | | 206,874 | | |
Series 2016-BA, Class A2,
1.380%, due 08/15/183 | | | 125,000 | | | | 124,947 | | |
Series 2016-BA, Class C,
3.190%, due 07/15/223 | | | 100,000 | | | | 100,700 | | |
Ford Credit Auto Owner Trust,
Series 2014-A, Class C,
1.900%, due 09/15/19 | | | 250,000 | | | | 250,768 | | |
Santander Drive Auto Receivables Trust,
Series 2012-2, Class D,
3.870%, due 02/15/18 | | | 242,244 | | | | 242,474 | | |
Series 2012-4, Class D,
3.500%, due 06/15/18 | | | 249,615 | | | | 250,201 | | |
Series 2014-1, Class C,
2.360%, due 04/15/20 | | | 250,000 | | | | 251,581 | | |
Series 2015-4, Class A2A,
1.200%, due 12/17/18 | | | 39,017 | | | | 39,020 | | |
Total asset-backed securities
(cost—$3,624,954) | | | 3,641,057 | | |
13
UBS U.S. Allocation Fund
Portfolio of investments—August 31, 2016
| | | Face
amount | | Value | |
Commercial mortgage-backed securities—1.30% | |
Americold LLC Trust,
Series 2010-ARTA, Class C,
6.811%, due 01/14/293 | | $ | 125,000 | | | $ | 140,107 | | |
CDGJ Commercial Mortgage Trust,
Series 2014-BXCH, Class DPA,
3.508%, due 12/15/272,3 | | | 94,791 | | | | 93,720 | | |
CG-CCRE Commercial Mortgage Trust,
Series 2014-FL1, Class C,
2.258%, due 06/15/312,3 | | | 150,000 | | | | 148,485 | | |
COMM Mortgage Trust,
Series 2014-CR21, Class B,
4.339%, due 12/10/47 | | | 145,000 | | | | 160,147 | | |
Extended Stay America Trust,
Series 2013-ESH7, Class B7,
3.604%, due 12/05/313 | | | 225,000 | | | | 225,136 | | |
FDIC Structured Sale Guaranteed Notes,
Series 2010-C1, Class A,
2.980%, due 12/06/203 | | | 75,681 | | | | 76,578 | | |
FREMF Mortgage Trust,
Series 2015-K45, Class B,
3.714%, due 04/25/482,3 | | | 250,000 | | | | 249,062 | | |
Series 2015-K48, Class B,
3.761%, due 08/25/482,3 | | | 200,000 | | | | 198,592 | | |
Series 2015-K49, Class B,
3.848%, due 10/25/482,3 | | | 139,000 | | | | 138,106 | | |
Series 2015-K50, Class B,
3.908%, due 10/25/482,3 | | | 300,000 | | | | 300,311 | | |
Series 2016-K55, Class B,
4.294%, due 04/25/492,3 | | | 175,000 | | | | 177,596 | | |
GAHR Commericial Mortgage Trust,
Series 2015-NRF, Class CFX,
3.495%, due 12/15/342,3 | | | 250,000 | | | | 254,889 | | |
GS Mortgage Securities Trust,
Series 2014-GSFL, Class D,
4.408%, due 07/15/312,3 | | | 300,000 | | | | 291,051 | | |
JP Morgan Chase Commercial Mortgage
Securities Trust, Series 2014-FL5, Class D,
4.008%, due 07/15/312,3 | | | 300,000 | | | | 291,875 | | |
Morgan Stanley Bank of America Merrill
Lynch Trust, Series 2015-C24, Class A4,
3.732%, due 05/15/48 | | | 250,000 | | | | 275,686 | | |
Wells Fargo Commercial Mortgage Trust,
Series 2016-C34, Class A4,
3.096%, due 06/15/49 | | | 100,000 | | | | 104,965 | | |
WFCG Commercial Mortgage Trust,
Series 2015-BXRP, Class D,
3.079%, due 11/15/292,3 | | | 100,428 | | | | 99,261 | | |
Total commercial mortgage-backed securities
(cost—$3,226,330) | | | 3,225,567 | | |
Corporate bonds—9.39% | |
Aerospace & defense—0.05% | |
Huntington Ingalls Industries, Inc.
5.000%, due 11/15/253 | | | 25,000 | | | | 26,844 | | |
TransDigm, Inc.
6.000%, due 07/15/22 | | | 100,000 | | | | 104,000 | | |
| | | | | | 130,844 | | |
| | | Face
amount | | Value | |
Corporate bonds—(continued) | |
Auto loans—0.03% | |
General Motors Financial Co., Inc.
3.700%, due 11/24/20 | | $ | 60,000 | | | $ | 62,504 | | |
Automobile OEM—0.08% | |
Ford Motor Co.
7.450%, due 07/16/31 | | | 61,000 | | | | 82,812 | | |
General Motors Co.
6.250%, due 10/02/43 | | | 50,000 | | | | 59,922 | | |
6.600%, due 04/01/36 | | | 40,000 | | | | 49,322 | | |
| | | | | | 192,056 | | |
Automotive parts—0.20% | |
Meritor, Inc.
6.250%, due 02/15/24 | | | 50,000 | | | | 46,770 | | |
Schaeffler Finance BV
4.750%, due 05/15/233 | | | 200,000 | | | | 208,000 | | |
Schaeffler Holding Finance BV
6.875%, due 08/15/183,4 | | | 200,000 | | | | 205,000 | | |
The Goodyear Tire & Rubber Co.
5.125%, due 11/15/23 | | | 25,000 | | | | 26,125 | | |
| | | | | | 485,895 | | |
Banking-non-US—0.11% | |
Australia & New Zealand Banking
Group Ltd. MTN
2.700%, due 11/16/20 | | | 50,000 | | | | 51,579 | | |
HSBC Holdings PLC
6.500%, due 09/15/37 | | | 100,000 | | | | 129,646 | | |
Royal Bank of Scotland Group PLC
6.000%, due 12/19/23 | | | 75,000 | | | | 79,330 | | |
| | | | | | 260,555 | | |
Banking-US—0.96% | |
BB&T Corp. MTN
2.625%, due 06/29/20 | | | 140,000 | | | | 144,356 | | |
Capital One Bank USA N.A.
3.375%, due 02/15/23 | | | 70,000 | | | | 71,921 | | |
Capital One Financial Corp.
4.200%, due 10/29/25 | | | 60,000 | | | | 62,675 | | |
CIT Group, Inc.
5.500%, due 02/15/193 | | | 100,000 | | | | 105,875 | | |
Citigroup, Inc.
1.632%, due 07/30/182 | | | 110,000 | | | | 110,683 | | |
5.500%, due 09/13/25 | | | 255,000 | | | | 288,884 | | |
JPMorgan Chase & Co.
3.875%, due 09/10/24 | | | 110,000 | | | | 116,109 | | |
4.625%, due 05/10/21 | | | 260,000 | | | | 288,258 | | |
Morgan Stanley
4.875%, due 11/01/22 | | | 170,000 | | | | 188,426 | | |
Morgan Stanley MTN
4.350%, due 09/08/26 | | | 100,000 | | | | 107,012 | | |
5.625%, due 09/23/19 | | | 100,000 | | | | 111,151 | | |
SunTrust Bank
7.250%, due 03/15/18 | | | 100,000 | | | | 108,174 | | |
SunTrust Banks, Inc.
2.900%, due 03/03/21 | | | 95,000 | | | | 98,466 | | |
14
UBS U.S. Allocation Fund
Portfolio of investments—August 31, 2016
| | | Face
amount | | Value | |
Corporate bonds—(continued) | |
Banking-US—(concluded) | |
The Goldman Sachs Group, Inc.
2.875%, due 02/25/21 | | $ | 120,000 | | | $ | 123,439 | | |
5.150%, due 05/22/45 | | | 80,000 | | | | 88,183 | | |
5.750%, due 01/24/22 | | | 100,000 | | | | 115,963 | | |
The Goldman Sachs Group, Inc. MTN
1.917%, due 11/15/182 | | | 170,000 | | | | 171,881 | | |
Wells Fargo & Co.
5.375%, due 11/02/43 | | | 60,000 | | | | 72,074 | | |
| | | | | | 2,373,530 | | |
Building materials—0.11% | |
Boise Cascade Co.
5.625%, due 09/01/243 | | | 28,000 | | | | 28,560 | | |
Builders FirstSource, Inc.
5.625%, due 09/01/243 | | | 38,000 | | | | 38,760 | | |
Eagle Materials, Inc.
4.500%, due 08/01/26 | | | 50,000 | | | | 50,845 | | |
Masco Corp.
4.450%, due 04/01/25 | | | 100,000 | | | | 107,150 | | |
Summit Materials LLC/
Summit Materials Finance Corp.
6.125%, due 07/15/23 | | | 50,000 | | | | 50,750 | | |
| | | | | | 276,065 | | |
Chemicals—0.09% | |
CF Industries, Inc.
3.450%, due 06/01/23 | | | 80,000 | | | | 79,853 | | |
LYB International Finance BV
4.875%, due 03/15/44 | | | 70,000 | | | | 76,249 | | |
Valspar Corp.
4.200%, due 01/15/22 | | | 60,000 | | | | 63,775 | | |
| | | | | | 219,877 | | |
Commercial services—0.07% | |
AECOM
5.875%, due 10/15/24 | | | 100,000 | | | | 109,375 | | |
Prime Security Services Borrower LLC/
Prime Finance, Inc.
9.250%, due 05/15/233 | | | 25,000 | | | | 27,250 | | |
The ADT Corp.
6.250%, due 10/15/21 | | | 25,000 | | | | 27,375 | | |
| | | | | | 164,000 | | |
Consumer products—0.13% | |
Kimberly-Clark Corp.
3.200%, due 07/30/46 | | | 40,000 | | | | 40,085 | | |
3.625%, due 08/01/20 | | | 45,000 | | | | 48,492 | | |
Party City Holdings, Inc.
6.125%, due 08/15/233 | | | 50,000 | | | | 53,125 | | |
Reynolds Group Issuer, Inc./
Reynolds Group Issuer LLC/
Reynolds Group Issuer (Luxembourg) SA
5.125%, due 07/15/233 | | | 75,000 | | | | 77,812 | | |
Spectrum Brands, Inc.
6.625%, due 11/15/22 | | | 100,000 | | | | 107,000 | | |
| | | | | | 326,514 | | |
| | | Face
amount | | Value | |
Corporate bonds—(continued) | |
Consumer services—0.10% | |
United Rentals North America, Inc.
4.625%, due 07/15/23 | | $ | 50,000 | | | $ | 51,153 | | |
6.125%, due 06/15/23 | | | 150,000 | | | | 157,687 | | |
XLIT Ltd.
6.375%, due 11/15/24 | | | 40,000 | | | | 48,032 | | |
| | | | | | 256,872 | | |
Diversified manufacturing—0.06% | |
Eaton Corp.
2.750%, due 11/02/22 | | | 70,000 | | | | 72,244 | | |
Illinois Tool Works, Inc.
3.500%, due 03/01/24 | | | 60,000 | | | | 65,668 | | |
| | | | | | 137,912 | | |
Electric-generation—0.13% | |
Calpine Corp.
6.000%, due 01/15/223 | | | 100,000 | | | | 104,875 | | |
NRG Energy, Inc.
6.250%, due 07/15/22 | | | 75,000 | | | | 76,594 | | |
Tennessee Valley Authority
2.875%, due 09/15/24 | | | 120,000 | | | | 129,961 | | |
| | | | | | 311,430 | | |
Electric-integrated—0.58% | |
Alabama Power Co.
6.000%, due 03/01/39 | | | 30,000 | | | | 40,078 | | |
Berkshire Hathaway Energy Co.
3.750%, due 11/15/23 | | | 80,000 | | | | 87,421 | | |
Consolidated Edison Co. of New York, Inc.
5.850%, due 03/15/36 | | | 35,000 | | | | 45,737 | | |
DTE Electric Co.
3.700%, due 03/15/45 | | | 50,000 | | | | 53,989 | | |
Duke Energy Indiana LLC
6.350%, due 08/15/38 | | | 30,000 | | | | 42,551 | | |
Duke Energy Progress LLC
3.000%, due 09/15/21 | | | 240,000 | | | | 254,419 | | |
Edison International
2.950%, due 03/15/23 | | | 50,000 | | | | 51,436 | | |
Exelon Corp.
3.400%, due 04/15/26 | | | 70,000 | | | | 73,688 | | |
Exelon Generation Co. LLC
2.950%, due 01/15/20 | | | 170,000 | | | | 174,795 | | |
Florida Power & Light Co.
5.950%, due 02/01/38 | | | 50,000 | | | | 69,446 | | |
Indiana Michigan Power Co., Series K
4.550%, due 03/15/46 | | | 40,000 | | | | 45,874 | | |
National Rural Utilities Cooperative
Finance Corp.
2.300%, due 11/01/20 | | | 50,000 | | | | 51,239 | | |
Northern States Power Co.
2.600%, due 05/15/23 | | | 50,000 | | | | 51,624 | | |
3.600%, due 05/15/46 | | | 30,000 | | | | 32,056 | | |
Oncor Electric Delivery Co. LLC
3.750%, due 04/01/453,5 | | | 30,000 | | | | 32,107 | | |
Pacific Gas & Electric Co.
2.950%, due 03/01/26 | | | 30,000 | | | | 31,288 | | |
5.800%, due 03/01/37 | | | 40,000 | | | | 53,157 | | |
15
UBS U.S. Allocation Fund
Portfolio of investments—August 31, 2016
| | | Face
amount | | Value | |
Corporate bonds—(continued) | |
Electric-integrated—(concluded) | |
PacifiCorp
6.000%, due 01/15/39 | | $ | 30,000 | | | $ | 41,317 | | |
Southern California Edison Co.
5.950%, due 02/01/38 | | | 55,000 | | | | 75,891 | | |
Southern Power Co.
5.250%, due 07/15/43 | | | 60,000 | | | | 66,455 | | |
Virginia Electric & Power Co.
3.450%, due 09/01/22 | | | 60,000 | | | | 64,301 | | |
| | | | | | 1,438,869 | | |
Energy-independent—0.32% | |
Anadarko Finance Co., Series B
7.500%, due 05/01/31 | | | 20,000 | | | | 24,239 | | |
Anadarko Petroleum Corp.
4.500%, due 07/15/44 | | | 55,000 | | | | 49,875 | | |
Apache Corp.
4.750%, due 04/15/43 | | | 15,000 | | | | 15,481 | | |
California Resources Corp.
8.000%, due 12/15/223 | | | 10,000 | | | | 6,750 | | |
Carrizo Oil & Gas, Inc.
6.250%, due 04/15/23 | | | 20,000 | | | | 19,750 | | |
Chesapeake Energy Corp.
6.625%, due 08/15/20 | | | 50,000 | | | | 44,500 | | |
8.000%, due 12/15/223 | | | 50,000 | | | | 47,625 | | |
ConocoPhillips Co.
4.200%, due 03/15/21 | | | 40,000 | | | | 43,134 | | |
5.950%, due 03/15/46 | | | 50,000 | | | | 63,753 | | |
Continental Resources, Inc.
4.500%, due 04/15/23 | | | 25,000 | | | | 23,563 | | |
5.000%, due 09/15/22 | | | 50,000 | | | | 48,375 | | |
Devon Energy Corp.
4.000%, due 07/15/21 | | | 50,000 | | | | 52,235 | | |
Gulfport Energy Corp.
7.750%, due 11/01/20 | | | 50,000 | | | | 52,000 | | |
Murphy Oil Corp.
4.700%, due 12/01/225 | | | 25,000 | | | | 23,613 | | |
Newfield Exploration Co.
5.625%, due 07/01/24 | | | 25,000 | | | | 25,813 | | |
5.750%, due 01/30/22 | | | 25,000 | | | | 25,937 | | |
Occidental Petroleum Corp.
3.400%, due 04/15/26 | | | 50,000 | | | | 52,850 | | |
Parsley Energy LLC/Parsley Finance Corp.
6.250%, due 06/01/243 | | | 30,000 | | | | 30,975 | | |
QEP Resources, Inc.
5.250%, due 05/01/23 | | | 25,000 | | | | 24,500 | | |
Range Resources Corp.
5.750%, due 06/01/21 | | | 50,000 | | | | 50,750 | | |
SM Energy Co.
6.125%, due 11/15/22 | | | 50,000 | | | | 48,625 | | |
Whiting Petroleum Corp.
5.750%, due 03/15/21 | | | 15,000 | | | | 13,350 | | |
WPX Energy, Inc.
7.500%, due 08/01/20 | | | 15,000 | | | | 15,403 | | |
| | | | | | 803,096 | | |
| | | Face
amount | | Value | |
Corporate bonds—(continued) | |
Energy-integrated—0.17% | |
BP Capital Markets PLC
3.062%, due 03/17/22 | | $ | 90,000 | | | $ | 94,476 | | |
Cenovus Energy, Inc.
5.700%, due 10/15/19 | | | 50,000 | | | | 53,706 | | |
Chevron Corp.
3.191%, due 06/24/23 | | | 50,000 | | | | 53,481 | | |
Exxon Mobil Corp.
4.114%, due 03/01/46 | | | 60,000 | | | | 69,066 | | |
Petro-Canada
6.050%, due 05/15/18 | | | 60,000 | | | | 64,250 | | |
Shell International Finance BV
4.000%, due 05/10/46 | | | 40,000 | | | | 41,910 | | |
Total Capital International SA
3.750%, due 04/10/24 | | | 40,000 | | | | 43,966 | | |
| | | | | | 420,855 | | |
Energy-refining & marketing—0.02% | |
Calumet Specialty Products Partners LP/
Calumet Finance Corp.
6.500%, due 04/15/21 | | | 25,000 | | | | 20,750 | | |
Valero Energy Corp.
6.625%, due 06/15/37 | | | 35,000 | | | | 41,030 | | |
| | | | | | 61,780 | | |
Finance-diversified—0.18% | |
Bank of America Corp.
6.110%, due 01/29/37 | | | 100,000 | | | | 124,451 | | |
Bank of America Corp. GMTN
2.625%, due 04/19/21 | | | 90,000 | | | | 91,766 | | |
Bank of America Corp. MTN
4.200%, due 08/26/24 | | | 120,000 | | | | 127,284 | | |
Quicken Loans, Inc.
5.750%, due 05/01/253 | | | 100,000 | | | | 99,780 | | |
| | | | | | 443,281 | | |
Finance-non-captive diversified—0.07% | |
Ally Financial, Inc.
4.125%, due 02/13/22 | | | 100,000 | | | | 102,750 | | |
General Electric Co.
6.750%, due 03/15/32 | | | 50,000 | | | | 71,505 | | |
| | | | | | 174,255 | | |
Finance-other—0.54% | |
GE Capital International Funding Co.
Unlimited Co.
2.342%, due 11/15/20 | | | 200,000 | | | | 205,806 | | |
General Electric Co. MTN
4.650%, due 10/17/21 | | | 50,000 | | | | 57,080 | | |
International Lease Finance Corp.
5.875%, due 04/01/19 | | | 200,000 | | | | 215,750 | | |
5.875%, due 08/15/22 | | | 160,000 | | | | 180,800 | | |
KCG Holdings, Inc.
6.875%, due 03/15/203 | | | 100,000 | | | | 98,000 | | |
KfW
0.000%, due 04/18/36 | | | 105,000 | | | | 63,942 | | |
16
UBS U.S. Allocation Fund
Portfolio of investments—August 31, 2016
| | | Face
amount | | Value | |
Corporate bonds—(continued) | |
Finance-other—(concluded) | |
Navient Corp. MTN
8.000%, due 03/25/20 | | $ | 100,000 | | | $ | 108,500 | | |
Private Export Funding Corp.
2.300%, due 09/15/20 | | | 250,000 | | | | 257,471 | | |
Springleaf Finance Corp.
5.250%, due 12/15/19 | | | 125,000 | | | | 127,813 | | |
SquareTwo Financial Corp.
11.625%, due 04/01/176 | | | 100,000 | | | | 10,000 | | |
| | | | | | 1,325,162 | | |
Food/beverage—0.36% | |
Agrokor D.D.
8.875%, due 02/01/203 | | | 200,000 | | | | 211,700 | | |
Albertsons Cos. LLC/Safeway, Inc./
New Albertson's, Inc./Albertson's LLC
6.625%, due 06/15/243 | | | 45,000 | | | | 48,312 | | |
Anheuser-Busch InBev Finance, Inc.
4.700%, due 02/01/36 | | | 100,000 | | | | 115,909 | | |
4.900%, due 02/01/46 | | | 80,000 | | | | 96,741 | | |
Aramark Services, Inc.
5.125%, due 01/15/243 | | | 50,000 | | | | 51,843 | | |
Dean Foods Co.
6.500%, due 03/15/233 | | | 50,000 | | | | 53,125 | | |
Kraft Heinz Foods Co.
5.000%, due 06/04/42 | | | 40,000 | | | | 46,620 | | |
5.200%, due 07/15/45 | | | 20,000 | | | | 23,975 | | |
PepsiCo, Inc.
4.875%, due 11/01/40 | | | 60,000 | | | | 74,752 | | |
Post Holdings, Inc.
5.000%, due 08/15/263 | | | 38,000 | | | | 37,905 | | |
The Kroger Co.
3.850%, due 08/01/23 | | | 110,000 | | | | 120,196 | | |
| | | | | | 881,078 | | |
Gaming—0.14% | |
MGM Growth Properties Operating
Partnership LP/MGP Finance Co-Issuer, Inc.
4.500%, due 09/01/263 | | | 28,000 | | | | 27,982 | | |
Scientific Games International, Inc.
10.000%, due 12/01/22 | | | 75,000 | | | | 69,375 | | |
Shingle Springs Tribal Gaming Authority
9.750%, due 09/01/213 | | | 100,000 | | | | 109,500 | | |
Wynn Las Vegas LLC/
Wynn Las Vegas Capital Corp.
5.375%, due 03/15/22 | | | 125,000 | | | | 129,844 | | |
| | | | | | 336,701 | | |
Gas distributors—0.06% | |
Phillips 66 Partners LP
3.605%, due 02/15/25 | | | 50,000 | | | | 49,929 | | |
Sempra Energy
9.800%, due 02/15/19 | | | 90,000 | | | | 107,131 | | |
| | | | | | 157,060 | | |
| | | Face
amount | | Value | |
Corporate bonds—(continued) | |
Gas pipelines—0.34% | |
Blue Racer Midstream LLC/
Blue Racer Finance Corp.
6.125%, due 11/15/223 | | $ | 75,000 | | | $ | 72,187 | | |
DCP Midstream LLC
5.350%, due 03/15/203 | | | 25,000 | | | | 25,375 | | |
9.750%, due 03/15/193 | | | 20,000 | | | | 22,300 | | |
Energy Transfer Partners LP
9.000%, due 04/15/19 | | | 110,000 | | | | 125,244 | | |
Enterprise Products Operating LLC
2.850%, due 04/15/21 | | | 40,000 | | | | 41,336 | | |
5.100%, due 02/15/45 | | | 10,000 | | | | 11,049 | | |
Genesis Energy LP/Genesis Energy
Finance Corp.
6.000%, due 05/15/23 | | | 50,000 | | | | 49,750 | | |
Kinder Morgan Energy Partners LP
5.000%, due 10/01/21 | | | 85,000 | | | | 92,334 | | |
Kinder Morgan, Inc.
5.550%, due 06/01/45 | | | 40,000 | | | | 41,268 | | |
NuStar Logistics LP
4.750%, due 02/01/22 | | | 15,000 | | | | 14,738 | | |
ONEOK, Inc.
7.500%, due 09/01/23 | | | 15,000 | | | | 16,612 | | |
Sabine Pass Liquefaction LLC
5.625%, due 02/01/215 | | | 100,000 | | | | 105,000 | | |
Sunoco LP/Sunoco Finance Corp.
5.500%, due 08/01/203 | | | 100,000 | | | | 101,510 | | |
Targa Resources Partners LP/
Targa Resources Partners Finance Corp.
6.875%, due 02/01/21 | | | 25,000 | | | | 25,875 | | |
The Williams Cos., Inc.
4.550%, due 06/24/24 | | | 25,000 | | | | 25,562 | | |
Williams Partners LP
4.300%, due 03/04/24 | | | 60,000 | | | | 61,424 | | |
| | | | | | 831,564 | | |
Health care—0.38% | |
CHS/Community Health Systems, Inc.
7.125%, due 07/15/20 | | | 25,000 | | | | 22,360 | | |
DaVita HealthCare Partners, Inc.
5.000%, due 05/01/25 | | | 125,000 | | | | 126,687 | | |
HCA, Inc.
7.500%, due 02/15/22 | | | 200,000 | | | | 228,320 | | |
Hologic, Inc.
5.250%, due 07/15/223 | | | 50,000 | | | | 53,187 | | |
inVentiv Health, Inc.
10.000%, due 08/15/183,4 | | | 35,000 | | | | 36,313 | | |
Medtronic, Inc.
4.375%, due 03/15/35 | | | 115,000 | | | | 132,117 | | |
MPH Acquisition Holdings LLC
7.125%, due 06/01/243 | | | 30,000 | | | | 32,250 | | |
Tenet Healthcare Corp.
6.000%, due 10/01/20 | | | 100,000 | | | | 105,750 | | |
UnitedHealth Group, Inc.
4.625%, due 07/15/35 | | | 90,000 | | | | 106,780 | | |
Universal Health Services, Inc.
5.000%, due 06/01/263 | | | 25,000 | | | | 25,875 | | |
17
UBS U.S. Allocation Fund
Portfolio of investments—August 31, 2016
| | | Face
amount | | Value | |
Corporate bonds—(continued) | |
Health care—(concluded) | |
WellCare Health Plans, Inc.
5.750%, due 11/15/20 | | $ | 25,000 | | | $ | 25,844 | | |
Zimmer Biomet Holdings, Inc.
2.700%, due 04/01/20 | | | 50,000 | | | | 51,157 | | |
| | | | | | 946,640 | | |
Home construction—0.13% | |
CalAtlantic Group, Inc.
5.250%, due 06/01/26 | | | 100,000 | | | | 101,500 | | |
K. Hovnanian Enterprises, Inc.
7.250%, due 10/15/203 | | | 40,000 | | | | 35,800 | | |
KB Home
7.000%, due 12/15/21 | | | 100,000 | | | | 106,750 | | |
PulteGroup, Inc.
5.500%, due 03/01/26 | | | 75,000 | | | | 80,016 | | |
| | | | | | 324,066 | | |
Insurance-life—0.10% | |
Aon PLC
3.500%, due 06/14/24 | | | 60,000 | | | | 62,921 | | |
CNA Financial Corp.
4.500%, due 03/01/26 | | | 40,000 | | | | 43,266 | | |
Hartford Financial Services Group, Inc.
5.950%, due 10/15/36 | | | 40,000 | | | | 48,068 | | |
MetLife, Inc.
4.125%, due 08/13/42 | | | 30,000 | | | | 30,461 | | |
Principal Financial Group, Inc.
8.875%, due 05/15/19 | | | 50,000 | | | | 59,105 | | |
| | | | | | 243,821 | | |
Insurance-personal & casualty—0.03% | |
HUB International Ltd.
7.875%, due 10/01/213 | | | 75,000 | | | | 76,688 | | |
Leisure—0.05% | |
NCL Corp. Ltd.
4.625%, due 11/15/203 | | | 35,000 | | | | 35,381 | | |
Royal Caribbean Cruises Ltd.
5.250%, due 11/15/22 | | | 75,000 | | | | 81,750 | | |
| | | | | | 117,131 | | |
Lodging—0.10% | |
Hilton Escrow Issuer LLC/
Hilton Escrow Issuer Corp.
4.250%, due 09/01/243 | | | 35,000 | | | | 35,656 | | |
Starwood Hotels & Resorts Worldwide, Inc.
4.500%, due 10/01/34 | | | 80,000 | | | | 83,178 | | |
Wyndham Worldwide Corp.
5.625%, due 03/01/21 | | | 118,000 | | | | 132,973 | | |
| | | | | | 251,807 | | |
Machinery-diversified—0.03% | |
John Deere Capital Corp. MTN
2.450%, due 09/11/20 | | | 40,000 | | | | 41,172 | | |
SPX FLOW, Inc.
5.625%, due 08/15/243 | | | 29,000 | | | | 29,797 | | |
| | | | | | 70,969 | | |
| | | Face
amount | | Value | |
Corporate bonds—(continued) | |
Media-broadcast/outdoor—0.23% | |
21st Century Fox America, Inc.
4.950%, due 10/15/45 | | $ | 40,000 | | | $ | 46,921 | | |
Clear Channel Worldwide Holdings, Inc.,
Series B
7.625%, due 03/15/20 | | | 50,000 | | | | 50,375 | | |
iHeartCommunications, Inc.
9.000%, due 12/15/19 | | | 75,000 | | | | 60,656 | | |
Netflix, Inc.
5.875%, due 02/15/25 | | | 100,000 | | | | 108,500 | | |
Sirius XM Radio, Inc.
5.375%, due 04/15/253 | | | 100,000 | | | | 104,750 | | |
5.375%, due 07/15/263 | | | 25,000 | | | | 25,719 | | |
The Walt Disney Co. GMTN
2.150%, due 09/17/20 | | | 50,000 | | | | 51,505 | | |
4.125%, due 06/01/44 | | | 40,000 | | | | 45,904 | | |
Time Warner, Inc.
2.950%, due 07/15/26 | | | 80,000 | | | | 81,599 | | |
| | | | | | 575,929 | | |
Media-cable—0.42% | |
Altice SA
7.750%, due 05/15/223 | | | 200,000 | | | | 212,875 | | |
Comcast Corp.
6.950%, due 08/15/37 | | | 80,000 | | | | 118,585 | | |
DISH DBS Corp.
5.875%, due 11/15/24 | | | 75,000 | | | | 73,969 | | |
7.750%, due 07/01/263 | | | 50,000 | | | | 53,349 | | |
NBCUniversal Media LLC
4.375%, due 04/01/21 | | | 40,000 | | | | 44,725 | | |
SFR Group SA
6.250%, due 05/15/243 | | | 200,000 | | | | 201,500 | | |
TCI Communications, Inc.
7.875%, due 02/15/26 | | | 50,000 | | | | 71,241 | | |
Time Warner Entertainment Co. LP
8.375%, due 03/15/23 | | | 35,000 | | | | 45,559 | | |
Unitymedia Hessen GmbH & Co. KG/
Unitymedia NRW GmbH
5.500%, due 01/15/233 | | | 100,000 | | | | 105,250 | | |
WideOpenWest Finance LLC/
WideOpenWest Capital Corp.
10.250%, due 07/15/19 | | | 100,000 | | | | 105,250 | | |
| | | | | | 1,032,303 | | |
Media-diversified—0.04% | |
TEGNA, Inc.
6.375%, due 10/15/23 | | | 100,000 | | | | 108,250 | | |
Media-non cable—0.04% | |
Intelsat Jackson Holdings SA
5.500%, due 08/01/23 | | | 100,000 | | | | 68,250 | | |
8.000%, due 02/15/243 | | | 30,000 | | | | 30,150 | | |
| | | | | | 98,400 | | |
Media-publishing—0.02% | |
The McClatchy Co.
9.000%, due 12/15/22 | | | 50,000 | | | | 50,750 | | |
18
UBS U.S. Allocation Fund
Portfolio of investments—August 31, 2016
| | | Face
amount | | Value | |
Corporate bonds—(continued) | |
Metals & mining—0.23% | |
Alcoa, Inc.
5.125%, due 10/01/24 | | $ | 15,000 | | | $ | 15,825 | | |
ArcelorMittal
7.250%, due 02/25/225 | | | 50,000 | | | | 56,250 | | |
10.850%, due 06/01/195 | | | 25,000 | | | | 29,812 | | |
Barrick North America Finance LLC
4.400%, due 05/30/21 | | | 25,000 | | | | 27,316 | | |
BHP Billiton Finance USA Ltd.
3.850%, due 09/30/23 | | | 30,000 | | | | 32,751 | | |
First Quantum Minerals Ltd.
6.750%, due 02/15/203 | | | 30,000 | | | | 26,250 | | |
FMG Resources August 2006 Pty Ltd.
6.875%, due 04/01/223 | | | 15,000 | | | | 15,450 | | |
9.750%, due 03/01/223 | | | 20,000 | | | | 23,100 | | |
Freeport-McMoran Oil & Gas LLC/
FCX Oil & Gas, Inc.
6.875%, due 02/15/23 | | | 15,000 | | | | 14,588 | | |
Freeport-McMoRan, Inc.
4.550%, due 11/14/24 | | | 25,000 | | | | 21,875 | | |
5.450%, due 03/15/43 | | | 20,000 | | | | 15,300 | | |
Rio Tinto Finance USA Ltd.
3.750%, due 06/15/25 | | | 40,000 | | | | 42,361 | | |
Steel Dynamics, Inc.
5.250%, due 04/15/23 | | | 50,000 | | | | 52,000 | | |
Teck Resources Ltd.
6.250%, due 07/15/41 | | | 25,000 | | | | 20,672 | | |
8.000%, due 06/01/213 | | | 25,000 | | | | 27,063 | | |
8.500%, due 06/01/243 | | | 25,000 | | | | 28,125 | | |
TMS International Corp.
7.625%, due 10/15/213,6 | | | 50,000 | | | | 42,875 | | |
Vale Overseas Ltd.
4.375%, due 01/11/22 | | | 65,000 | | | | 63,277 | | |
5.875%, due 06/10/21 | | | 25,000 | | | | 25,906 | | |
| | | | | | 580,796 | | |
Oil & gas—0.11% | |
Petroleos Mexicanos
3.500%, due 07/18/18 | | | 100,000 | | | | 102,010 | | |
3.500%, due 01/30/23 | | | 110,000 | | | | 106,898 | | |
Statoil ASA
4.800%, due 11/08/43 | | | 50,000 | | | | 60,304 | | |
| | | | | | 269,212 | | |
Oil field equipment & services—0.05% | |
Ensco PLC
5.200%, due 03/15/25 | | | 25,000 | | | | 18,000 | | |
Pride International, Inc.
6.875%, due 08/15/20 | | | 20,000 | | | | 19,648 | | |
Rowan Cos., Inc.
4.750%, due 01/15/24 | | | 25,000 | | | | 21,000 | | |
5.000%, due 09/01/17 | | | 10,000 | | | | 10,100 | | |
SESI LLC
7.125%, due 12/15/21 | | | 50,000 | | | | 48,875 | | |
Weatherford International Ltd.
7.000%, due 03/15/38 | | | 25,000 | | | | 18,812 | | |
| | | | | | 136,435 | | |
| | | Face
amount | | Value | |
Corporate bonds—(continued) | |
Packaging & containers—0.05% | |
Berry Plastics Corp.
5.125%, due 07/15/23 | | $ | 50,000 | | | $ | 51,438 | | |
Owens-Brockway Glass Container, Inc.
5.875%, due 08/15/233 | | | 75,000 | | | | 82,031 | | |
| | | | | | 133,469 | | |
Paper & forest products—0.03% | |
Georgia-Pacific LLC
8.000%, due 01/15/24 | | | 20,000 | | | | 26,623 | | |
International Paper Co.
3.800%, due 01/15/26 | | | 50,000 | | | | 52,787 | | |
| | | | | | 79,410 | | |
Pharmaceuticals—0.43% | |
AbbVie, Inc.
2.500%, due 05/14/20 | | | 120,000 | | | | 122,745 | | |
3.200%, due 05/14/26 | | | 30,000 | | | | 30,713 | | |
Actavis Funding SCS
3.000%, due 03/12/20 | | | 50,000 | | | | 51,681 | | |
3.800%, due 03/15/25 | | | 90,000 | | | | 94,977 | | |
Biogen, Inc.
4.050%, due 09/15/25 | | | 50,000 | | | | 54,391 | | |
Capsugel SA
7.000%, due 05/15/193,4 | | | 135,000 | | | | 136,350 | | |
Endo Finance LLC & Endo Finco, Inc.
7.250%, due 01/15/223,5 | | | 25,000 | | | | 24,187 | | |
Gilead Sciences, Inc.
4.750%, due 03/01/46 | | | 90,000 | | | | 104,716 | | |
Pfizer, Inc.
7.200%, due 03/15/39 | | | 70,000 | | | | 107,415 | | |
Teva Pharmaceutical Finance IV BV
3.650%, due 11/10/21 | | | 41,000 | | | | 43,632 | | |
Teva Pharmaceutical Finance
Netherlands III BV
3.150%, due 10/01/26 | | | 70,000 | | | | 70,477 | | |
Valeant Pharmaceuticals International
7.000%, due 10/01/203 | | | 50,000 | | | | 48,750 | | |
Valeant Pharmaceuticals International, Inc.
6.750%, due 08/15/183 | | | 100,000 | | | | 100,290 | | |
7.500%, due 07/15/213 | | | 75,000 | | | | 73,711 | | |
| | | | | | 1,064,035 | | |
Railroads—0.08% | |
Burlington Northern Santa Fe LLC
5.150%, due 09/01/43 | | | 30,000 | | | | 37,903 | | |
6.150%, due 05/01/37 | | | 25,000 | | | | 34,193 | | |
Norfolk Southern Corp.
3.250%, due 12/01/21 | | | 50,000 | | | | 52,838 | | |
Union Pacific Corp.
4.050%, due 11/15/45 | | | 70,000 | | | | 77,978 | | |
| | | | | | 202,912 | | |
Real estate investment trusts—0.16% | |
AvalonBay Communities, Inc. MTN
3.450%, due 06/01/25 | | | 70,000 | | | | 73,648 | | |
19
UBS U.S. Allocation Fund
Portfolio of investments—August 31, 2016
| | | Face
amount | | Value | |
Corporate bonds—(continued) | |
Real estate investment trusts—(concluded) | |
Boston Properties LP
2.750%, due 10/01/26 | | $ | 40,000 | | | $ | 39,582 | | |
ERP Operating LP
4.750%, due 07/15/20 | | | 35,000 | | | | 38,601 | | |
Ventas Realty LP
3.500%, due 02/01/25 | | | 35,000 | | | | 36,264 | | |
3.750%, due 05/01/24 | | | 90,000 | | | | 94,390 | | |
VEREIT Operating Partnership LP
4.600%, due 02/06/24 | | | 50,000 | | | | 52,625 | | |
4.875%, due 06/01/26 | | | 50,000 | | | | 53,875 | | |
| | | | | | 388,985 | | |
Restaurants—0.03% | |
McDonald's Corp. MTN
2.100%, due 12/07/18 | | | 40,000 | | | | 40,708 | | |
4.875%, due 12/09/45 | | | 20,000 | | | | 23,658 | | |
| | | | | | 64,366 | | |
Retail-specialty—0.29% | |
Beacon Roofing Supply, Inc.
6.375%, due 10/01/23 | | | 25,000 | | | | 26,875 | | |
CVS Health Corp.
3.500%, due 07/20/22 | | | 60,000 | | | | 64,435 | | |
4.750%, due 12/01/22 | | | 100,000 | | | | 113,158 | | |
5.125%, due 07/20/45 | | | 25,000 | | | | 31,168 | | |
Dollar General Corp.
3.250%, due 04/15/23 | | | 80,000 | | | | 82,604 | | |
Dollar Tree, Inc.
5.750%, due 03/01/23 | | | 25,000 | | | | 26,906 | | |
FBM Finance, Inc.
8.250%, due 08/15/213 | | | 53,000 | | | | 55,517 | | |
JC Penney Corp., Inc.
5.875%, due 07/01/233 | | | 25,000 | | | | 26,085 | | |
Lowe's Cos., Inc.
4.650%, due 04/15/42 | | | 60,000 | | | | 70,964 | | |
Michaels Stores, Inc.
5.875%, due 12/15/203 | | | 100,000 | | | | 103,625 | | |
The Home Depot, Inc.
3.350%, due 09/15/25 | | | 40,000 | | | | 43,809 | | |
Wal-Mart Stores, Inc.
4.300%, due 04/22/44 | | | 60,000 | | | | 71,721 | | |
| | | | | | 716,867 | | |
Technology-hardware—0.16% | |
Cisco Systems, Inc.
5.900%, due 02/15/39 | | | 80,000 | | | | 110,161 | | |
Equinix, Inc.
5.375%, due 04/01/23 | | | 100,000 | | | | 105,750 | | |
NCR Corp.
6.375%, due 12/15/23 | | | 75,000 | | | | 79,312 | | |
NXP BV/NXP Funding LLC
5.750%, due 02/15/213 | | | 100,000 | | | | 104,250 | | |
| | | | | | 399,473 | | |
| | | Face
amount | | Value | |
Corporate bonds—(continued) | |
Technology-software—0.44% | |
Apple, Inc.
3.850%, due 05/04/43 | | $ | 80,000 | | | $ | 83,032 | | |
Diamond 1 Finance Corp./
Diamond 2 Finance Corp.
4.420%, due 06/15/213 | | | 50,000 | | | | 52,310 | | |
5.875%, due 06/15/213 | | | 25,000 | | | | 26,463 | | |
7.125%, due 06/15/243 | | | 25,000 | | | | 27,070 | | |
First Data Corp.
5.750%, due 01/15/243 | | | 30,000 | | | | 30,713 | | |
7.000%, due 12/01/233 | | | 75,000 | | | | 78,656 | | |
Infor US, Inc.
6.500%, due 05/15/22 | | | 100,000 | | | | 101,375 | | |
International Business Machines Corp.
2.250%, due 02/19/21 | | | 50,000 | | | | 51,476 | | |
Iron Mountain, Inc.
6.000%, due 10/01/203 | | | 50,000 | | | | 53,125 | | |
Juniper Networks, Inc.
3.300%, due 06/15/20 | | | 70,000 | | | | 72,598 | | |
Microsoft Corp.
2.375%, due 02/12/22 | | | 80,000 | | | | 82,512 | | |
4.450%, due 11/03/45 | | | 80,000 | | | | 93,041 | | |
MSCI, Inc.
4.750%, due 08/01/263 | | | 36,000 | | | | 36,945 | | |
5.750%, due 08/15/253 | | | 50,000 | | | | 54,187 | | |
Oracle Corp.
2.500%, due 05/15/22 | | | 80,000 | | | | 82,029 | | |
5.375%, due 07/15/40 | | | 70,000 | | | | 87,741 | | |
Texas Instruments, Inc.
1.650%, due 08/03/19 | | | 30,000 | | | | 30,367 | | |
1.850%, due 05/15/22 | | | 40,000 | | | | 39,807 | | |
| | | | | | 1,083,447 | | |
Telecom-wireless—0.11% | |
America Movil SAB de CV
3.125%, due 07/16/22 | | | 40,000 | | | | 41,405 | | |
Rogers Communications, Inc.
5.000%, due 03/15/44 | | | 30,000 | | | | 35,866 | | |
Sprint Corp.
7.250%, due 09/15/21 | | | 125,000 | | | | 123,594 | | |
7.625%, due 02/15/25 | | | 75,000 | | | | 71,039 | | |
| | | | | | 271,904 | | |
Telephone-integrated—0.53% | |
AT&T, Inc.
2.800%, due 02/17/21 | | | 50,000 | | | | 51,528 | | |
3.800%, due 03/15/22 | | | 130,000 | | | | 139,439 | | |
4.350%, due 06/15/45 | | | 40,000 | | | | 40,320 | | |
6.000%, due 08/15/40 | | | 70,000 | | | | 84,794 | | |
CenturyLink, Inc.
6.750%, due 12/01/23 | | | 125,000 | | | | 131,563 | | |
Cogent Communications Group, Inc.
5.375%, due 03/01/223 | | | 50,000 | | | | 51,500 | | |
Frontier Communications Corp.
8.500%, due 04/15/20 | | | 125,000 | | | | 134,844 | | |
10.500%, due 09/15/22 | | | 25,000 | | | | 27,203 | | |
11.000%, due 09/15/25 | | | 50,000 | | | | 54,000 | | |
20
UBS U.S. Allocation Fund
Portfolio of investments—August 31, 2016
| | | Face
amount | | Value | |
Corporate bonds—(concluded) | |
Telephone-integrated—(concluded) | |
Sprint Communications, Inc.
9.000%, due 11/15/183 | | $ | 175,000 | | | $ | 192,719 | | |
Verizon Communications, Inc.
4.500%, due 09/15/20 | | | 200,000 | | | | 220,708 | | |
4.522%, due 09/15/48 | | | 105,000 | | | | 111,337 | | |
Windstream Services LLC
7.750%, due 10/01/21 | | | 75,000 | | | | 74,813 | | |
| | | | | | 1,314,768 | | |
Textiles & apparel—0.03% | |
The William Carter Co.
5.250%, due 08/15/21 | | | 75,000 | | | | 79,031 | | |
Tobacco—0.15% | |
Altria Group, Inc.
9.250%, due 08/06/19 | | | 110,000 | | | | 134,291 | | |
9.950%, due 11/10/38 | | | 21,000 | | | | 38,540 | | |
Philip Morris International, Inc.
2.900%, due 11/15/21 | | | 130,000 | | | | 136,745 | | |
Reynolds American, Inc.
5.700%, due 08/15/35 | | | 60,000 | | | | 74,545 | | |
| | | | | | 384,121 | | |
Transportation services—0.04% | |
FedEx Corp.
2.625%, due 08/01/22 | | | 40,000 | | | | 41,144 | | |
Navios Maritime Acquisition Corp./
Navios Acquisition Finance US, Inc.
8.125%, due 11/15/213 | | | 75,000 | | | | 57,000 | | |
| | | | | | 98,144 | | |
Total corporate bonds
(cost—$22,582,985) | | | 23,235,884 | | |
Non-US government obligations—0.41% | |
Chile Government International Bond
3.250%, due 09/14/21 | | | 100,000 | | | | 107,875 | | |
Colombia Government International Bond
8.125%, due 05/21/24 | | | 75,000 | | | | 98,813 | | |
Israel Government International Bond
5.500%, due 09/18/33 | | | 175,000 | | | | 248,059 | | |
Mexico Government International Bond
4.000%, due 10/02/23 | | | 160,000 | | | | 173,800 | | |
Mexico Government International Bond MTN
6.750%, due 09/27/34 | | | 45,000 | | | | 62,550 | | |
Panama Government International Bond
8.875%, due 09/30/27 | | | 10,000 | | | | 15,100 | | |
Peruvian Government International Bond
7.350%, due 07/21/25 | | | 100,000 | | | | 138,625 | | |
| | | Face
amount | | Value | |
Non-US government obligations—(concluded) | |
Poland Government International Bond
5.000%, due 03/23/22 | | $ | 35,000 | | | $ | 40,031 | | |
Turkey Government International Bond
4.875%, due 10/09/26 | | | 115,000 | | | | 118,450 | | |
Total non-US government obligations
(cost—$946,605) | | | 1,003,303 | | |
Municipal bonds and notes—0.24% | |
California—0.12% | |
California (Build America Bonds)
7.550%, due 04/01/39 | | | 180,000 | | | | 291,967 | | |
Illinois—0.10% | |
State of Illinois
5.877%, due 03/01/19 | | | 225,000 | | | | 243,702 | | |
New York—0.02% | |
Metropolitan Transportation Authority
Revenue (Build America Bonds)
6.668%, due 11/15/39 | | | 40,000 | | | | 58,573 | | |
Total municipal bonds and notes
(cost—$535,406) | | | 594,242 | | |
Short-term US government obligation—9.70% | |
US Treasury Bill
0.241%, due 09/08/167
(cost—$23,998,878) | | | 24,000,000 | | | | 23,999,040 | | |
Repurchase agreement—18.26% | |
Repurchase agreement dated 08/31/16
with State Street Bank and Trust Co.,
0.010% due 09/01/16, collateralized
by $44,417,551 US Treasury Notes,
1.625% to 3.375% due 04/30/19 to
11/15/19; (value—$46,056,884);
proceeds: $45,153,038
(cost—$45,153,000) | | | 45,153,000 | | | | 45,153,000 | | |
| | | Number of
shares | | | |
Investment of cash collateral from securities loaned—0.80% | |
Money market fund—0.80% | |
State Street Institutional U.S. Government
Money Market Fund
(cost—$1,979,349) | | | 1,979,349 | | | | 1,979,349 | | |
Total investments
(cost—$247,291,107)—105.26% | | | 260,359,911 | | |
Liabilities in excess of other assets—(5.26)% | | | | | (13,011,968 | ) | |
Net assets—100.00% | | $ | 247,347,943 | | |
21
UBS U.S. Allocation Fund
Portfolio of investments—August 31, 2016
For a listing of defined portfolio acronyms that are used throughout the Portfolio of investments as well as the tables that follow, please refer to page 25.
Aggregate cost for federal income tax purposes was $248,183,320; and net unrealized appreciation consisted of:
Gross unrealized appreciation | | $ | 16,115,937 | | |
Gross unrealized depreciation | | | (3,939,346 | ) | |
Net unrealized appreciation | | $ | 12,176,591 | | |
Futures contracts
Number of
contracts | | | | Expiration
date | | Cost | | Current
value | | Unrealized
appreciation
(depreciation) | |
Index futures buy contracts: | | | |
| | 88 | | | Russell 2000 Mini Index Futures | | September 2016 | | $ | 10,201,171 | | | $ | 10,901,440 | | | $ | 700,269 | | |
| | 457 | | | S&P 500 E-Mini Index Futures | | September 2016 | | | 47,694,691 | | | | 49,573,075 | | | | 1,878,384 | | |
US Treasury futures buy contracts: | | | |
| | 10 | | | US Treasury Note 2 Year Futures | | December 2016 | | | 2,184,977 | | | | 2,183,125 | | | | (1,852 | ) | |
| | | | | | | | | $ | 60,080,839 | | | $ | 62,657,640 | | | $ | 2,576,801 | | |
| | | | | | | Proceeds | | | | | |
US Treasury futures sell contracts: | | | |
| | 9 | | | US Treasury Note 5 Year Futures | | December 2016 | | | 1,093,401 | | | | 1,091,250 | | | | 2,151 | | |
| | 164 | | | US Treasury Note 10 Year Futures | | December 2016 | | | 21,525,167 | | | | 21,471,187 | | | | 53,980 | | |
| | | | | | | | | $ | 22,618,568 | | | $ | 22,562,437 | | | $ | 56,131 | | |
| | | | | | | | | | | | | $ | 2,632,932 | | |
Total return swap agreements6
Counterparty | | Notional
amount | | Termination
date | | Payments
made by
the Portfolio8 | | Payments
received by
the Portfolio8 | | Upfront
payments
received | | Value | | Unrealized
appreciation | |
BOA | | | 1,200,000 | | | 12/20/16 | | 3 month USD LIBOR | | IBOXX Liquid High Yield Index | | $ | 474 | | | $ | 20,340 | | | $ | 20,814 | | |
GSI | | | 700,000 | | | 12/20/16 | | 3 month USD LIBOR | | IBOXX Liquid High Yield Index | | | 376 | | | | 41,595 | | | | 41,971 | | |
JPMCB | | | 1,800,000 | | | 12/20/16 | | 3 month USD LIBOR | | IBOXX Liquid High Yield Index | | | 2,307 | | | | 98,847 | | | | 101,154 | | |
JPMCB | | | 700,000 | | | 09/20/16 | | 3 month USD LIBOR | | IBOXX Liquid High Yield Index | | | 315 | | | | 52,895 | | | | 53,210 | | |
| | | | | | | | | | | $ | 3,472 | | | $ | 213,677 | | | $ | 217,149 | | |
22
UBS U.S. Allocation Fund
Portfolio of investments—August 31, 2016
Fair valuation summary
The following is a summary of the fair valuations according to the inputs used as of August 31, 2016 in valuing the Fund's investments:
Description | | Unadjusted
quoted prices in
active markets for
identical investments
(Level 1) | | Other significant
observable inputs
(Level 2) | | Unobservable
inputs
(Level 3) | | Total | |
Assets | |
Common stocks | | $ | 100,616,625 | | | $ | — | | | $ | — | | | $ | 100,616,625 | | |
Investment company | | | 11,236,823 | | | | — | | | | — | | | | 11,236,823 | | |
US government obligations | | | — | | | | 28,777,992 | | | | — | | | | 28,777,992 | | |
Mortgage & agency debt securities | | | — | | | | 16,897,029 | | | | — | | | | 16,897,029 | | |
Asset-backed securities | | | — | | | | 3,641,057 | | | | — | | | | 3,641,057 | | |
Commercial mortgage-backed securities | | | — | | | | 3,225,567 | | | | — | | | | 3,225,567 | | |
Corporate bonds | | | — | | | | 23,235,884 | | | | — | | | | 23,235,884 | | |
Non-US government obligations | | | — | | | | 1,003,303 | | | | — | | | | 1,003,303 | | |
Municipal bonds and notes | | | — | | | | 594,242 | | | | — | | | | 594,242 | | |
Short-term US government obligation | | | — | | | | 23,999,040 | | | | — | | | | 23,999,040 | | |
Repurchase agreement | | | — | | | | 45,153,000 | | | | — | | | | 45,153,000 | | |
Investment of cash collateral from securities loaned | | | — | | | | 1,979,349 | | | | — | | | | 1,979,349 | | |
Futures contracts | | | 2,634,784 | | | | — | | | | — | | | | 2,634,784 | | |
Swap agreements | | | — | | | | 213,677 | | | | — | | | | 213,677 | | |
Total | | $ | 114,488,232 | | | $ | 148,720,140 | | | $ | — | | | $ | 263,208,372 | | |
Liabilities | |
Futures contracts | | $ | (1,852 | ) | | $ | — | | | $ | — | | | $ | (1,852 | ) | |
At August 31, 2016, there were no transfers between Level 1 and Level 2.
23
UBS U.S. Allocation Fund
Portfolio of investments—August 31, 2016
Issuer breakdown by country or territory of origin (unaudited)
| | | Percentage of
total investments | |
United States | | | 94.6 | % | |
Ireland | | | 1.1 | | |
Singapore | | | 0.8 | | |
Canada | | | 0.7 | | |
United Kingdom | | | 0.6 | | |
Netherlands | | | 0.4 | | |
Luxembourg | | | 0.3 | | |
Jersey | | | 0.2 | | |
Mexico | | | 0.2 | | |
Israel | | | 0.2 | | |
Panama | | | 0.2 | | |
Bermuda | | | 0.1 | | |
France | | | 0.1 | | |
Croatia | | | 0.1 | | |
Germany | | | 0.1 | | |
Australia | | | 0.1 | | |
Peru | | | 0.1 | | |
Cayman Islands | | | 0.1 | | |
Turkey | | | 0.0 | † | |
Chile | | | 0.0 | † | |
Colombia | | | 0.0 | † | |
Liberia | | | 0.0 | † | |
Norway | | | 0.0 | † | |
Marshall Islands | | | 0.0 | † | |
Curacao | | | 0.0 | † | |
Poland | | | 0.0 | † | |
Venezuela | | | 0.0 | † | |
Total | | | 100.0 | % | |
† Amount represents less than 0.05%
Portfolio footnotes
* Non-income producing security.
1 Security, or portion thereof, was on loan at August 31, 2016.
2 Variable or floating rate security. The interest rate shown is the current rate as of August 31, 2016 and changes periodically. The maturity date reflects earlier of reset date or stated maturity date.
3 Security exempt from registration pursuant to Rule 144A under the Securities Act of 1933. These securities, which represent 3.34% of net assets as of August 31, 2016, are considered liquid and may be resold in transactions exempt from registration, normally to qualified institutional buyers.
4 Payment-in-kind security for which interest may be paid in cash or additional principal, at the discretion of the issuer.
5 Step bond that converts to the noted fixed rate at a designated future date.
6 Illiquid investment as of August 31, 2016.
7 Rates shown are the discount rates at date of purchase unless otherwise noted.
8 Payments made or received are based on the notional amount.
24
UBS U.S. Allocation Fund
Portfolio of investments—August 31, 2016
Portfolio acronyms
ADR American Depositary Receipt
BOA Bank of America
ETF Exchange Traded Fund
FDIC Federal Deposit Insurance Corporation
FHLMC Federal Home Loan Mortgage Corporation
FNMA Federal National Mortgage Association
GMTN Global Medium Term Note
GNMA Government National Mortgage Association
GSI Goldman Sachs International
JPMCB JPMorgan Chase Bank
MSCI Morgan Stanley Capital International
MTN Medium Term Note
OEM Original Equipment Manufacturer
TBA (To Be Announced) Security is purchased on a forward commitment basis with an approximate principal amount (generally +/- 1.0%) and no definite maturity date. The actual principal amount and maturity date will be determined upon settlement when the specific mortgage pools are assigned.
TIPS Treasury inflation protected securities ("TIPS") are debt securities issued by the US Treasury whose principal and/or interest payments are adjusted for inflation, unlike debt securities that make fixed principal and interest payments. The interest rate paid by the TIPS is fixed, while the principal value rises or falls based on changes in a published Consumer Price Index ("CPI"). Thus, if inflation occurs, the principal and interest payments on TIPS are adjusted accordingly to protect investors from inflationary loss. During a deflationary period, the principal and interest payments decrease, although the TIPS principal amounts will not drop below their face amounts at maturity. In exchange for the inflation protection, the TIPS generally pay lower interest rates than typical US Treasury securities. Only if inflation occurs will TIPS offer a higher real yield than a conventional Treasury bond of the same maturity.
See accompanying notes to financial statements.
25
Statement of assets and liabilities
August 31, 2016
Assets: | |
Investments, at value (cost—$202,138,107)1 | | $ | 215,206,911 | | |
Repurchase agreement, at value (cost—$45,153,000) | | | 45,153,000 | | |
Total investments in securities, at value (cost—$247,291,107) | | $ | 260,359,911 | | |
Cash | | | 122,390 | | |
Cash collateral on futures | | | 2,627,450 | | |
Receivable for investments sold | | | 4,201,707 | | |
Receivable for shares of beneficial interest sold | | | 41,035 | | |
Receivable for dividends and interest | | | 527,459 | | |
Swap agreements, at value | | | 213,677 | | |
Receivable for variation margin on futures contracts | | | 2,634,750 | | |
Other assets | | | 17,850 | | |
Total assets | | | 270,746,229 | | |
Liabilities: | |
Payable for investments purchased | | | 18,371,188 | | |
Due to broker | | | 2,139,373 | | |
Payable for cash collateral from securities loaned | | | 1,979,349 | | |
Payable for shares of beneficial interest repurchased | | | 515,086 | | |
Payable to affiliates | | | 195,260 | | |
Payable for foreign withholding taxes | | | 394 | | |
Accrued expenses and other liabilities | | | 197,636 | | |
Total liabilities | | | 23,398,286 | | |
Net assets: | |
Beneficial interest shares of $0.001 par value (unlimited amount authorized) | | | 247,896,649 | | |
Accumulated undistributed net investment income | | | 630,999 | | |
Accumulated net realized loss | | | (17,098,590 | ) | |
Net unrealized appreciation | | | 15,918,885 | | |
Net assets | | $ | 247,347,943 | | |
Class A | |
Net assets | | $ | 157,979,319 | | |
Shares outstanding | | | 3,668,983 | | |
Net asset value per share | | $ | 43.06 | | |
Maximum offering price per share (net asset value plus maximum sales charge of 5.50%) | | $ | 42.57 | | |
Class C | |
Net assets | | $ | 65,751,911 | | |
Shares outstanding | | | 1,582,602 | | |
Net asset value and offering price per share | | $ | 41.55 | | |
Class P | |
Net assets | | $ | 23,616,713 | | |
Shares outstanding | | | 538,696 | | |
Net asset value and offering price per share | | $ | 43.84 | | |
1 Includes $11,284,606 of investments in securities on loan, at value, plus accrued interest and dividends, if any.
See accompanying notes to financial statements.
26
Statement of operations
For the year ended August 31, 2016
Investment income: | |
Dividends (net of foreign withholding taxes of $2,871) | | $ | 1,496,934 | | |
Interest | | | 1,999,936 | | |
Securities lending income (includes $11,816 earned from an affiliated entity) | | | 52,228 | | |
| | | | 3,549,098 | | |
Expenses: | |
Investment management and administration fees | | | 1,231,360 | | |
Service fees–Class A | | | 390,888 | | |
Service and distribution fees–Class C | | | 665,004 | | |
Transfer agency and related services fees–Class A | | | 133,941 | | |
Transfer agency and related services fees–Class C | | | 58,517 | | |
Transfer agency and related services fees–Class P | | | 14,924 | | |
Professional fees | | | 166,270 | | |
Custody and accounting fees | | | 101,596 | | |
Reports and notices to shareholders | | | 75,084 | | |
State registration fees | | | 44,359 | | |
Trustees' fees | | | 22,707 | | |
Insurance expense | | | 7,233 | | |
Other expenses | | | 30,841 | | |
Total expenses | | | 2,942,724 | | |
Net investment income | | | 606,374 | | |
Net realized and unrealized gains (losses) from investment activities: | |
Net realized gains from: | |
Investments | | | 1,551,429 | | |
Futures | | | (238,617 | ) | |
Swaps | | | 44,589 | | |
Foreign currency transactions | | | (76 | ) | |
Net realized gain | | | 1,357,325 | | |
Net change in unrealized appreciation/depreciation of: | |
Investments | | | 7,500,116 | | |
Futures | | | 6,389,714 | | |
Swaps | | | 217,149 | | |
Net change in unrealized appreciation/depreciation | | | 14,106,979 | | |
Net realized and unrealized gain from investment activities | | | 15,464,304 | | |
Contribution from Advisor | | | 71,624 | | |
Net increase in net assets resulting from operations | | $ | 16,142,302 | | |
See accompanying notes to financial statements.
27
Statement of changes in net assets
| | | For the years ended August 31, | |
| | | 2016 | | 2015 | |
From operations: | |
Net investment income (loss) | | $ | 606,374 | | | $ | (46,702 | ) | |
Net realized gains | | | 1,357,325 | | | | 26,106,950 | | |
Net change in unrealized appreciation/depreciation | | | 14,106,979 | | | | (23,109,349 | ) | |
Contribution from Advisor | | | 71,624 | | | | — | | |
Net increase in net assets resulting from operations | | | 16,142,302 | | | | 2,950,899 | | |
Dividends to shareholders from: | |
Net investment income–Class A | | | — | | | | (381,594 | ) | |
Net investment income–Class P | | | — | | | | (105,340 | ) | |
Total dividends to shareholders | | | — | | | | (486,934 | ) | |
From beneficial interest transactions: | |
Net proceeds from shares sold | | | 3,738,037 | | | | 5,835,770 | | |
Cost of shares repurchased | | | (27,490,390 | ) | | | (28,585,394 | ) | |
Proceeds from dividends reinvested | | | — | | | | 439,095 | | |
Net decrease in net assets from beneficial interest transactions | | | (23,752,353 | ) | | | (22,310,529 | ) | |
Redemption fees | | | — | | | | 2,512 | | |
Net decrease in net assets | | | (7,610,051 | ) | | | (19,844,052 | ) | |
Net assets: | |
Beginning of year | | | 254,957,994 | | | | 274,802,046 | | |
End of year | | $ | 247,347,943 | | | $ | 254,957,994 | | |
Accumulated undistributed net investment income | | $ | 630,999 | | | $ | 1,945 | | |
See accompanying notes to financial statements.
28
UBS U.S. Allocation Fund
Financial highlights
Selected data for a share of beneficial interest outstanding throughout each year is presented below :
Class A
| | | Years ended August 31, | |
| | | 2016 | | 2015 | | 2014 | | 2013 | | 2012 | |
Net asset value, beginning of year | | $ | 40.23 | | | $ | 39.87 | | | $ | 33.85 | | | $ | 30.13 | | | $ | 27.34 | | |
Net investment income1 | | | 0.17 | | | | 0.07 | | | | 0.13 | | | | 0.16 | | | | 0.15 | | |
Net realized and unrealized gains | | | 2.65 | | | | 0.38 | | | | 6.06 | | | | 3.72 | | | | 2.94 | | |
Net increase from payment by Advisor | | | 0.01 | | | | — | | | | — | | | | — | | | | — | | |
Net increase from operations | | | 2.83 | | | | 0.45 | | | | 6.19 | | | | 3.88 | | | | 3.09 | | |
Dividends from net investment income | | | — | | | | (0.09 | ) | | | (0.17 | ) | | | (0.16 | ) | | | (0.30 | ) | |
Net asset value, end of year | | $ | 43.06 | | | $ | 40.23 | | | $ | 39.87 | | | $ | 33.85 | | | $ | 30.13 | | |
Total investment return2 | | | 7.03 | %3 | | | 1.13 | % | | | 18.35 | % | | | 12.92 | % | | | 11.42 | % | |
Ratios to average net assets: | |
Expenses | | | 1.02 | % | | | 0.99 | % | | | 1.00 | % | | | 1.03 | % | | | 1.03 | % | |
Net investment income | | | 0.42 | % | | | 0.16 | % | | | 0.35 | % | | | 0.51 | % | | | 0.53 | % | |
Supplemental data: | |
Net assets, end of year (000's) | | $ | 157,979 | | | $ | 161,437 | | | $ | 175,249 | | | $ | 167,031 | | | $ | 173,218 | | |
Portfolio turnover | | | 260 | % | | | 283 | % | | | 240 | % | | | 148 | % | | | 150 | % | |
Class C
| | | Years ended August 31, | |
| | | 2016 | | 2015 | | 2014 | | 2013 | | 2012 | |
Net asset value, beginning of year | | $ | 39.11 | | | $ | 38.97 | | | $ | 33.17 | | | $ | 29.60 | | | $ | 26.83 | | |
Net investment loss1 | | | (0.13 | ) | | | (0.24 | ) | | | (0.15 | ) | | | (0.08 | ) | | | (0.06 | ) | |
Net realized and unrealized gains | | | 2.56 | | | | 0.38 | | | | 5.95 | | | | 3.65 | | | | 2.89 | | |
Net increase from payment by Advisor | | | 0.01 | | | | — | | | | — | | | | — | | | | — | | |
Net increase from operations | | | 2.44 | | | | 0.14 | | | | 5.80 | | | | 3.57 | | | | 2.83 | | |
Dividends from net investment income | | | — | | | | — | | | | — | | | | — | | | | (0.06 | ) | |
Net asset value, end of year | | $ | 41.55 | | | $ | 39.11 | | | $ | 38.97 | | | $ | 33.17 | | | $ | 29.60 | | |
Total investment return2 | | | 6.24 | %3 | | | 0.36 | % | | | 17.49 | % | | | 12.06 | % | | | 10.59 | % | |
Ratios to average net assets: | |
Expenses | | | 1.77 | % | | | 1.75 | % | | | 1.75 | % | | | 1.79 | % | | | 1.79 | % | |
Net investment loss | | | (0.33 | )% | | | (0.59 | )% | | | (0.41 | )% | | | (0.25 | )% | | | (0.23 | )% | |
Supplemental data: | |
Net assets, end of year (000's) | | $ | 65,752 | | | $ | 68,772 | | | $ | 74,707 | | | $ | 68,735 | | | $ | 70,215 | | |
Portfolio turnover | | | 260 | % | | | 283 | % | | | 240 | % | | | 148 | % | | | 150 | % | |
1 Calculated using the average shares method.
2 Total investment return is calculated assuming a $10,000 investment on the first day of each year reported, reinvestment of all dividends and other distributions, if any, at net asset value on the ex-dividend dates, and a sale at net asset value on the last day of each year reported. The figures do not include any applicable sales charges or redemption fees; results would be lower if they were included. Returns do not reflect the deduction of taxes that a shareholder would pay on Fund distributions or the redemption of Fund shares.
3 During the year ended August 31, 2016, the Advisor reimbursed the Fund for a trading error in the amount of $71,624. If payment from Advisor was not made, total return would have been 7.01% and 6.19% for Class A and Class C, respectively.
See accompanying notes to financial statements.
29
UBS U.S. Allocation Fund
Financial highlights (concluded)
Selected data for a share of beneficial interest outstanding throughout each year is presented below :
Class P4
| | | Years ended August 31, | |
| | | 2016 | | 2015 | | 2014 | | 2013 | | 2012 | |
Net asset value, beginning of year | | $ | 40.85 | | | $ | 40.45 | | | $ | 34.32 | | | $ | 30.54 | | | $ | 27.72 | | |
Net investment income1 | | | 0.29 | | | | 0.18 | | | | 0.24 | | | | 0.26 | | | | 0.24 | | |
Net realized and unrealized gains | | | 2.69 | | | | 0.38 | | | | 6.15 | | | | 3.76 | | | | 2.97 | | |
Net increase from payment by Advisor | | | 0.01 | | | | — | | | | — | | | | — | | | | — | | |
Net increase from operations | | | 2.99 | | | | 0.56 | | | | 6.39 | | | | 4.02 | | | | 3.21 | | |
Dividends from net investment income | | | — | | | | (0.16 | ) | | | (0.26 | ) | | | (0.24 | ) | | | (0.39 | ) | |
Net asset value, end of year | | $ | 43.84 | | | $ | 40.85 | | | $ | 40.45 | | | $ | 34.32 | | | $ | 30.54 | | |
Total investment return2 | | | 7.32 | %3 | | | 1.40 | % | | | 18.71 | % | | | 13.24 | % | | | 11.74 | % | |
Ratios to average net assets: | |
Expenses | | | 0.74 | % | | | 0.73 | % | | | 0.72 | % | | | 0.75 | % | | | 0.75 | % | |
Net investment income | | | 0.69 | % | | | 0.43 | % | | | 0.63 | % | | | 0.78 | % | | | 0.81 | % | |
Supplemental data: | |
Net assets, end of year (000's) | | $ | 23,617 | | | $ | 24,749 | | | $ | 24,846 | | | $ | 19,054 | | | $ | 18,911 | | |
Portfolio turnover | | | 260 | % | | | 283 | % | | | 240 | % | | | 148 | % | | | 150 | % | |
1 Calculated using the average shares method.
2 Total investment return is calculated assuming a $10,000 investment on the first day of each year reported, reinvestment of all dividends and other distributions, if any, at net asset value on the ex-dividend dates, and a sale at net asset value on the last day of each year reported. The figures do not include any applicable sales charges or redemption fees; results would be lower if they were included. Returns do not reflect the deduction of taxes that a shareholder would pay on Fund distributions or the redemption of Fund shares.
3 During the year ended August 31, 2016, the Advisor reimbursed the Fund for a trading error in the amount of $71,624. If payment from Advisor was made, total return would have been 7.29% for Class P.
4 Effective July 28, 2014, Class Y shares were redesignated as Class P shares.
See accompanying notes to financial statements.
30
UBS U.S. Allocation Fund
Notes to financial statements
Organization and significant accounting policies
UBS U.S. Allocation Fund (the "Fund") is a series of UBS Investment Trust (the "Trust") and is registered with the US Securities and Exchange Commission ("SEC") under the Investment Company Act of 1940 (the "1940 Act"), as amended, as an open-end, diversified management investment company. The Trust was organized on March 28, 1991, as a business trust under the laws of the Commonwealth of Massachusetts and currently has one operating series.
UBS Asset Management (Americas) Inc. ("UBS AM" or the "Advisor") serves as the investment advisor and administrator for the Fund. UBS AM is an indirect asset management subsidiary of UBS Group AG. UBS Group AG is an internationally diversified organization with headquarters in Zurich, Switzerland. UBS Group AG operates in many areas of the financial services industry.
The Fund offers Class A, Class C and Class P shares (formerly Class Y shares). Each class represents interests in the same assets of the Fund, and the classes are identical except for differences in their sales charge structures, ongoing service and distribution charges and certain transfer agency and related services expenses. All classes of shares have equal voting privileges except that Class A and Class C shares each have exclusive voting rights with respect to their respective service and/or distribution plans. Class P shares have no service or distribution plan.
In the normal course of business the Fund may enter into contracts that contain a variety of representations or that provide indemnification for certain liabilities. The Fund's maximum exposure under these arrangements is unknown, as this would involve future claims that may be made against the Fund that have not yet occurred. However, the Fund has not had such claims or losses through August 31, 2016 pursuant to these contracts and expects the risk of loss to be remote.
The Financial Accounting Standards Board ("FASB") Accounting Standards Codification ("ASC") is the exclusive reference of authoritative US generally accepted accounting principles ("US GAAP") recognized by the FASB to be applied by nongovernmental entities. Rules and interpretive releases of the SEC under authority of federal laws are also sources of authoritative US GAAP for SEC registrants. The Fund's financial statements are prepared in accordance with US GAAP, which may require the use of management estimates and assumptions. Actual results could differ from those estimates.
In August 2014, the FASB issued Accounting Standard Update No. 2014-15, Presentation of Financial Statements—Going Concern (Subtopic 205-40): "Disclosure of Uncertainties about an Entity's Ability to Continue as a Going Concern" ("ASU 2014-15"). The update provides guidance about management's responsibility to evaluate whether there is substantial doubt about the entity's ability to continue as a going concern and to provide related footnote disclosure. ASU 2014-15 is effective for annual reporting periods ending after December 15, 2016, and for annual and interim periods thereafter. Management is currently evaluating the impact of the guidance on the disclosures in the financial statements.
The following is a summary of significant accounting policies:
Valuation of investments
The Fund generally calculates its net asset value on days that the New York Stock Exchange ("NYSE") is open. The Fund calculates net asset value separately for each class as of the close of regular trading on the NYSE (generally, 4:00 p.m., Eastern time). The NYSE normally is not open, and the Fund does not price its shares, on most national holidays and Good Friday. To the extent that the Fund's assets are traded in other markets on days when the NYSE is not open, the value of the Fund's assets may be affected on those days. If trading on the NYSE is halted for the day before 4:00 p.m., Eastern time, the Fund's net asset value per share generally will still be calculated as of the close of regular trading on the NYSE. The time at which the Fund calculates its net asset value and until which purchase, sale or exchange orders are accepted may be changed as permitted by the SEC.
31
UBS U.S. Allocation Fund
Notes to financial statements
The Fund calculates its net asset value based on the current market value, where available, for its portfolio securities. The Fund normally obtains market values for its investments from independent pricing sources and broker-dealers. Independent pricing sources may use reported last sale prices, official market closing prices, current market quotations or valuations from computerized "evaluation" systems that derive values based on comparable investments. An evaluation system incorporates parameters such as security quality, maturity and coupon, and/ or research and evaluations by its staff, including review of broker-dealer market price quotations, if available, in determining the valuation of the portfolio investments. Investments also may be valued based on appraisals derived from information concerning the investment or similar investments received from recognized dealers in those holdings.
Investments traded in the over-the-counter ("OTC") market and listed on The NASDAQ Stock Market, Inc. ("NASDAQ") normally are valued at the NASDAQ Official Closing Price. Other OTC securities are valued at the last bid price on the valuation date available prior to valuation. Investments which are listed on US and foreign stock exchanges normally are valued at the market closing price, the last sale price on the day the securities are valued or, lacking any sales on such day, at the last available bid price. Investments listed on foreign stock exchanges may be fair valued based on significant events that have occurred subsequent to the close of the foreign markets. In cases where investments are traded on more than one exchange, the investments are valued on the exchange designated as the primary market by UBS AM. If a market value is not readily available from an independent pricing source for a particular investment, that investment is valued at fair value as determined in good faith by or under the direction of the Fund's Board of Trustees (the "Board"). Foreign currency exchange rates are generally determined as of the close of the NYSE.
Certain investments in which the Fund invests may be traded in markets that close before 4:00 p.m., Eastern time. Normally, developments that occur between the close of the foreign markets and 4:00 p.m., Eastern time, will not be reflected in the Fund's net asset value. However, if the Fund determines that such developments are so significant that they will materially affect the value of the Fund's investments, the Fund may adjust the previous closing prices to reflect what is believed to be the fair value of these investments as of 4:00 p.m., Eastern time.
The amortized cost method of valuation, which approximates market value, generally is used to value short-term debt instruments with 60 days or less remaining to maturity, unless the Board determines that this does not represent fair value.
Investments in open-end investment companies are valued at the daily closing net asset value of the respective investment company. Pursuant to the Fund's use of the practical expedient within ASC Topic 820, investments in investment companies without publicly published prices are also valued at the daily net asset value. All investments quoted in foreign currencies are valued daily in US dollars on the basis of the foreign currency exchange rates prevailing at the time such valuation is determined by the Fund's custodian.
Futures contracts are generally valued at the settlement price established each day on the exchange on which they are traded. Forward foreign currency contracts, if any, are valued daily using forward exchange rates quoted by independent pricing services.
OTC swaps are marked-to-market daily based upon values from third party vendors or quotations from market makers to the extent available. In the event that market quotations are not readily available or deemed unreliable, the swap is valued at fair value as determined in good faith by or under the direction of the Board. Centrally cleared swaps, if any, are valued using prices from the central counterparty clearing houses.
The Board has delegated to the Equities, Fixed Income, and Multi-Asset Valuation Committee ("VC") (formerly UBS AM Global Valuation Committee or GVC) the responsibility for making fair value determinations with respect to the Fund's portfolio holdings. The VC is comprised of representatives of management. The VC provides reports to the Board at each quarterly meeting regarding any investments that have been fair valued, valued pursuant to standing
32
UBS U.S. Allocation Fund
Notes to financial statements
instructions approved by the VC, or where non-vendor pricing sources had been used to make fair value determinations when sufficient information exists during the prior quarter. Fair valuation determinations are subject to review at least monthly by the VC during scheduled meetings. Pricing decisions, processes, and controls over fair value determinations are subject to internal and external reviews, including annual internal compliance reviews and periodic internal audit reviews.
The types of investments for which such fair value pricing may be necessary include, but are not limited to: foreign investments under some circumstances, securities of an issuer that has entered into a restructuring; investments whose trading has been halted or suspended; fixed income securities that are in default and for which there is no current market value quotation; and investments that are restricted as to transfer or resale. The need to fair value a Fund's portfolio investments may also result from low trading volume in foreign markets or thinly traded domestic investments, and when a security that is subject to a trading limit or collar on the exchange or market on which it is primarily traded reaches the "limit up" or "limit down" price and no trading has taken place at that price. Various factors may be reviewed in order to make a good faith determination of an investment's fair value. These factors include, but are not limited to, fundamental analytical data relating to the investment; the nature and duration of restrictions on disposition of the investment; and the evaluation of forces which influence the market in which the investment is purchased and sold. Valuing investments at fair value involves greater reliance on judgment than valuing investments that have readily available market quotations. Fair value determinations can also involve reliance on quantitative models employed by a fair value pricing service.
US GAAP requires disclosure regarding the various inputs that are used in determining the value of the Fund's investments. These inputs are summarized into the three broad levels listed below:
Level 1—Unadjusted quoted prices in active markets for identical investments.
Level 2—Other significant observable inputs, including but not limited to, quoted prices for similar investments, interest rates, prepayment speeds and credit risks.
Level 3—Unobservable inputs inclusive of the Fund's own assumptions in determining the fair value of investments.
In May 2015, the FASB issued Accounting Standards Update No. 2015-07, Fair Value Measurement (Topic 820): "Disclosures for Investments in Certain Entities That Calculate Net Asset Value per Share (or Its Equivalent)" ("ASU 2015-07"). The modification removes the requirement to categorize within the fair value hierarchy all investments for which fair value is measured using the NAV per share practical expedient. Early application is permitted and the Fund has elected to adopt ASU 2015-07 early. In the event the Fund holds investments for which fair value is measured using the NAV per share practical expedient, a separate column will be added to the fair value hierarchy table; this is intended to permit reconciliation to the amounts presented in the Portfolio of investments.
A fair value hierarchy table has been included near the end of the Fund's Portfolio of investments.
The provisions of ASC Topic 815 "Derivatives and Hedging" ("ASC Topic 815") require qualitative disclosures about objectives and strategies for using derivatives, quantitative disclosures about fair value amounts of gains and losses on derivative instruments and disclosures about credit-risk related contingent features in derivative agreements. Since investment companies value their derivatives at fair value and recognize changes in fair value through the Statement of operations, they do not qualify for hedge accounting under ASC Topic 815. Accordingly, even though a Fund's investments in derivatives may represent economic hedges, they are considered to be non-hedge transactions for purposes of disclosure under ASC Topic 815. ASC Topic 815 requires (1) objectives for using derivative instruments be disclosed in terms of underlying risk and accounting designation, (2) the fair values of derivative instruments and their gains and losses be disclosed in a tabular format, and (3) information be disclosed about credit-risk contingent features of derivatives contracts. The Fund may enter into derivative contracts that may contain credit-risk related
33
UBS U.S. Allocation Fund
Notes to financial statements
contingent features that could be triggered subject to certain circumstances. Such circumstances include agreed upon net asset value thresholds. If triggered, the derivative counterparty could request additional cash margin and/or terminate the derivative contract. Details of this disclosure can be found below as well as in the Portfolio of investments. The volume of derivatives that is presented in the Portfolio of investments of the Fund is consistent with the derivative activity during the year ended August 31, 2016.
At August 31, 2016, the Fund had the following derivatives categorized by underlying risk:
Asset derivatives1
| | Interest
rate risk | | Equity
risk | | Total | |
Futures contracts | | $ | 56,131 | | | $ | 2,578,653 | | | $ | 2,634,784 | | |
Swap agreements | | | — | | | | 213,677 | | | | 213,677 | | |
Total value | | $ | 56,131 | | | $ | 2,792,330 | | | $ | 2,848,461 | | |
Liability derivatives1
| | Interest
rate risk | | Equity
risk | | Total | |
Futures contracts | | $ | 1,852 | | | $ | — | | | $ | 1,852 | | |
1 In the Statement of assets and liabilities, swap agreements are shown within swap agreements at value. Futures contracts are reported in the table above using the cumulative appreciation (depreciation) as detailed in the futures contract table at the end of the Portfolio of investments, but only the variation margin to be received or paid, if any, is reported within the Statement of assets and liabilities.
Net realized and unrealized gains (losses) from derivative instruments during the period ended August 31, 2016, were as follows:
| | Interest
rate risk | | Equity
risk | | Total | |
Net realized gain (loss)2 | |
Futures contracts | | $ | (243,813 | ) | | $ | 5,196 | | | $ | (238,617 | ) | |
Swap agreements | | | — | | | | 44,589 | | | | 44,589 | | |
Total net realized gain (loss) | | $ | (243,813 | ) | | $ | 49,785 | | | $ | (194,028 | ) | |
Net change in unrealized appreciation/depreciation3 | |
Futures contracts | | $ | 1,895 | | | $ | 6,387,819 | | | $ | 6,389,714 | | |
Swap agreements | | | — | | | | 217,149 | | | | 217,149 | | |
Total net change in unrealized appreciation/depreciation | | $ | 1,895 | | | $ | 6,604,968 | | | $ | 6,606,863 | | |
2 The net realized gains (losses) are shown in the Statement of operations in net realized gains from futures and swaps.
3 The net change in unrealized appreciation/depreciation is shown in the Statement of operations in net change in unrealized appreciation/depreciation of futures and swaps.
In January 2013, Accounting Standards Update 2013-01 ("ASU 2013-01"), "Clarifying the Scope of Disclosures about Offsetting Assets and Liabilities", replaced Accounting Standards Update 2011-11 ("ASU 2011-11"), "Disclosures about Offsetting Assets and Liabilities". ASU 2013-01 limits the scope of the new balance sheet offsetting disclosures to derivatives, repurchase and reverse repurchase agreements, and securities lending and securities borrowing transactions to the extent that they are (1) offset in the financial statements or (2) subject to an enforceable master netting agreement ("MNA") or similar agreement.
34
UBS U.S. Allocation Fund
Notes to financial statements
The Fund typically enters into International Swaps and Derivatives Association, Inc. Master Agreements ("ISDA Master Agreements") or similar master agreements (collectively, "Master Agreements") with its OTC derivative contract counterparties in order to, among other things, reduce its credit risk to counterparties. ISDA Master Agreements include provisions for general obligations, representations, collateral and events of default or termination. Under an ISDA Master Agreement, the Portfolios typically may offset with the counterparty certain derivative financial instrument's payables and/or receivables with collateral held and/or posted and create one single net payment (close-out netting) in the event of default or termination. The statement of assets and liabilities is presented gross of any netting.
At August 31, 2016, derivative assets and liabilities (by type) on a gross basis were as follows:
Derivative Financial Instruments: | | Assets | | Liabilities | |
Futures contracts | | $ | 2,634,784 | | | $ | (1,852 | ) | |
Swap agreements | | | 213,677 | | | | — | | |
Total gross amount of derivative assets and liabilities in the Statement of Assets and Liabilities | | | 2,848,461 | | | | (1,852 | ) | |
Derivatives not subject to MNA or similar agreements | | | (2,634,784 | ) | | | 1,852 | | |
Total gross amount of assets and liabilities subject to MNA or similar agreements | | $ | 213,677 | | | $ | — | | |
The following tables present the Fund's derivative assets and liabilities by counterparty net of amounts available for offset under a MNA and net of the related collateral received/pledged by the Fund as of August 31, 2016.
| Counterparty | | Gross Amount of
Assets | | Financial
Instruments
and Derivatives
Available for
Offset | | Collateral
Received | | Net Amount
of Assets | |
BOA | | $ | 20,340 | | | $ | — | | | $ | — | | | $ | 20,340 | | |
GSI | | | 41,595 | | | | — | | | | — | | | | 41,595 | | |
JPMCB | | | 151,742 | | | | — | | | | — | | | | 151,742 | | |
Total | | $ | 213,677 | | | $ | — | | | $ | — | | | $ | 213,677 | | |
Repurchase agreements—The Fund may purchase securities or other obligations from a bank or securities dealer (or its affiliate), subject to the seller's agreement to repurchase them at an agreed upon date (or upon demand) and price. The Fund maintains custody of the underlying obligations prior to their repurchase, either through its regular custodian or through a special "tri-party" custodian or sub-custodian that maintains a separate account for both the Fund and its counterparty. The underlying collateral is valued daily in an effort to ensure that the value, including accrued interest, is at least equal to the repurchase price. In the event of default of the obligation to repurchase, the Fund generally has the right to liquidate the collateral and apply the proceeds in satisfaction of the obligation. Repurchase agreements involving obligations other than US government securities (such as commercial paper, corporate bonds, equities and mortgage loans) may be subject to special risks and may not have the benefit of certain protections in the event of counterparty insolvency. If the seller (or seller's guarantor, if any) becomes insolvent, the Fund may suffer delays, costs and possible losses in connection with the disposition or retention of the collateral. Under certain circumstances, in the event of default or bankruptcy by the other party to the agreement, realization and/or retention of the collateral may be subject to legal proceedings. The Fund may participate in joint repurchase agreement transactions with other funds managed or advised by UBS AM in accordance with an exemptive order granted by the SEC pursuant to Section 17(d) of the 1940 Act and Rule 17d-1 thereunder.
The Fund may engage in a repurchase agreement transaction with a yield of zero in order to invest cash amounts remaining in its portfolio at the end of the day in order to avoid having the Fund potentially exposed to a fee for uninvested cash held in a business account at a bank.
35
UBS U.S. Allocation Fund
Notes to financial statements
Restricted securities—The Fund may invest in securities that are subject to legal or contractual restrictions on resale. These securities generally may be resold in transactions exempt from registration or to the public if the securities are registered. Disposal of these securities may involve time-consuming negotiations and expense, and prompt sale at an acceptable price may be difficult. Information regarding restricted securities, if any, is included at the end of the Fund's Portfolio of investments.
Investment transactions, investment income and expenses—Investment transactions are recorded on the trade date. Realized gains and losses from investment transactions are calculated using the identified cost method. Dividend income and expense are recorded net of withholding taxes on the ex-dividend date ("ex-date") (except in the case of certain dividends from foreign securities which are recorded as soon after the ex-date as the Fund, using reasonable diligence, becomes aware of such dividends). Interest income is recorded on an accrual basis. Discounts are accreted and premiums are amortized as adjustments to interest income and the identified cost of investments.
Income, expenses (excluding class-specific expenses) and realized/unrealized gains/losses are allocated proportionately to each class of shares based upon the relative net asset value of outstanding shares (or the value of dividend eligible shares, as appropriate) of each class at the beginning of the day (after adjusting for current capital share activity of the respective classes). Class-specific expenses are charged directly to the applicable class of shares.
Mortgage-backed securities—The Fund may invest in mortgage-backed securities ("MBS"), representing direct or indirect interests in pools of underlying mortgage loans that are secured by real property. These securities provide investors with payments consisting of both principal and interest as the mortgages in the underlying mortgage pools are paid.
The timely payment of principal and interest (but not the market value) on MBS issued or guaranteed by Ginnie Mae (formally known as the Government National Mortgage Association or GNMA) is backed by Ginnie Mae and the full faith and credit of the US government. Obligations issued by Fannie Mae (formally known as the Federal National Mortgage Association or FNMA) and Freddie Mac (formally known as the Federal Home Loan Mortgage Company or FHLMC) are historically supported only by the credit of the issuer, but currently are guaranteed by the US government in connection with such agencies being placed temporarily into conservatorship by the US government.
Some MBS are sponsored or issued by private entities. Payments of principal and interest (but not the market value) of such private MBS may be supported by pools of mortgage loans or other MBS that are guaranteed, directly or indirectly, by the US government or one of its agencies or instrumentalities, or they may be issued without any government guarantee of the underlying mortgage assets but with some form of non-government credit enhancement.
Collateralized mortgage obligations ("CMO") are a type of MBS. A CMO is a debt security that may be collateralized by whole mortgage loans or mortgage pass-through securities. The mortgage loans or mortgage pass-through securities are divided into classes or tranches with each class having its own characteristics. Investors typically receive payments out of the interest and principal on the underlying mortgages. The portions of these payments that investors receive, as well as the priority of their rights to receive payments, are determined by the specific terms of the CMO class.
The yield characteristics of MBS differ from those of traditional debt securities. Among the major differences are that interest and principal payments are made more frequently, usually monthly, and that principal may be prepaid at any time because the underlying mortgage loans or other obligations generally may be prepaid at any time. Prepayments on a pool of mortgage loans are influenced by a variety of economic, geographic, social and other factors. Generally, prepayments on fixed-rate mortgage loans will increase during a period of falling interest rates and decrease during a period of rising interest rates.
36
UBS U.S. Allocation Fund
Notes to financial statements
Asset-backed securities—The Fund may invest in asset-backed securities ("ABS"), representing interests in pools of certain types of underlying installment loans, home equity loans, leases of various types of real and personal property and receivables from revolving lines of credit (credit cards). Such assets are securitized through the use of trusts or special purpose corporations. The yield characteristics of ABS differ from those of traditional debt securities. One such major difference is that principal may be prepaid at any time because the underlying obligations generally may be prepaid at any time. ABS may decrease in value as a result of increases in interest rates and may benefit less than other fixed-income securities from declining interest rates because of the risk of prepayment.
Securities traded on to-be-announced basis—The Fund may from time to time purchase securities on a to-be-announced ("TBA") basis. In a TBA transaction, the Fund commits to purchasing or selling securities for which all specific information is not yet known at the time of the trade, particularly the face amount and maturity date of the underlying security transactions. Securities purchased on a TBA basis are not settled until they are delivered to the Fund, normally 15 to 45 days later. Beginning on the date the Fund enters into a TBA transaction, cash, US government securities or other liquid securities are segregated in an amount equal in value to the purchase price of the TBA security. These transactions are subject to market fluctuations, and their current value is determined in the same manner as for other securities.
Purchased options—The Fund may purchase put and call options. Purchasing call options tends to increase exposure to the underlying instrument. Purchasing put options tends to decrease exposure to the underlying instrument. The Fund pays a premium which is included on the Statement of assets and liabilities as an investment and subsequently marked to market to reflect the current value of the option. Premiums paid for purchasing options which expire are treated as realized losses. The risk associated with purchasing put and call options is limited to the premium paid. Premiums paid for purchasing options which are exercised or closed are added to the amounts paid or offset against the proceeds on the underlying future, security or currency transaction to determine the realized gain or loss. Purchased options are shown as fund holdings within the Portfolio of investments and are included in the Statement of assets and liabilities in investments, at value. At August 31, 2016 the Fund did not hold purchased options.
Futures contracts—The Fund may use futures contracts as part of its investment strategy, for hedging purposes to adjust exposure to US and foreign markets in connection with a reallocation of the Fund's assets or to manage the average duration of the Fund. In addition, the Fund may purchase or sell futures contracts or purchase options thereon to increase or reduce its exposure to an asset class without purchasing or selling the underlying securities, either as a hedge or to enhance performance. Using futures contracts involves various market risks, including interest rate and equity risk. Risks of entering into futures contracts include the possibility that there may be an illiquid market or that a change in the value of the contract may not correlate with changes in the value of the underlying securities. To the extent that market prices move in an unexpected direction, there is a risk that the Fund will not achieve the anticipated benefits of the futures contract or may realize a loss.
Upon entering into a futures contract, the Fund is required to deliver to a broker an amount of cash and/or government securities equal to a certain percentage of the contract amount. This amount is known as the "initial margin." Subsequent payments, known as "variation margin", generally are made or received by the Fund each day, depending on the fluctuations in the value of the underlying futures contracts, except that in the case of certain futures contracts payments may be made or received at settlement. Such variation margin is recorded for financial statement purposes on a daily basis as an unrealized gain or loss on futures until the futures contract is closed, at which time the net gain or loss is reclassified to realized gain or loss on futures.
Swap agreements—The Fund may engage in swap agreements, including, but not limited to, total return swap agreements. The Fund expects to enter into these transactions to preserve a return or spread on a particular investment or to hedge a portion of the portfolio's duration, to protect against any increase in the price of securities the
37
UBS U.S. Allocation Fund
Notes to financial statements
Fund anticipates purchasing at a later date, to gain exposure to certain markets in the most economical way possible or in an attempt to enhance income or gains.
The Fund accrues for interim payments on swap agreements on a daily basis, with the net amount recorded within unrealized appreciation or depreciation of swap agreements. Once interim payments are settled in cash, the net amount is recorded as realized gain/loss on swap agreements, in addition to realized gain/loss recorded upon the termination of swap agreements on the Statement of operations. Fluctuations in the value of swap agreements are recorded for financial statement purposes as unrealized appreciation or depreciation on swap agreements.
Total return swap agreements involve commitments to pay or receive interest in exchange for a market-linked return based on notional amounts. To the extent the total return of the security or index underlying the transactions exceeds or falls short of the offsetting interest rate obligation, the Fund will receive a payment from or make a payment to the counterparty, respectively. Total return swap agreements are marked-to-market daily, and the change, if any, is recorded as unrealized appreciation or depreciation. Total return swap agreements are subject to general market risk, liquidity risk, counterparty risk, interest risk, credit risk and the risk that there may be unfavorable changes in the underlying investments or instruments.
The use of swap agreements involves investment techniques and risks different from those associated with ordinary portfolio security transactions. If UBS AM is incorrect in its forecast of market values, interest rates and other applicable factors, the investment performance of the Fund will be less favorable than it would have been if this investment technique was never used. OTC swap agreements do not involve the delivery of securities and are subject to counterparty risk. If the other party to a swap agreement defaults and fails to consummate the transaction, the Fund's risk of loss will consist of the net amount of interest or other payments that the Fund is contractually entitled to receive. Therefore, the Fund would consider the creditworthiness of the counterparty to a swap agreement in evaluating potential credit risk.
Certain clearinghouses currently offer clearing for limited types of derivatives transactions, such as interest and credit derivatives. In a cleared derivative transaction, a Fund typically enters into the transaction with a financial institution counterparty, and performance of the transaction is effectively guaranteed by a central clearinghouse, thereby reducing or eliminating the Fund's exposure to the credit risk of its original counterparty. The Fund will be required to post specified levels of margin with the clearinghouse or at the instruction of the clearinghouse; the margin required by a clearinghouse may be greater than the margin the Fund would be required to post in an uncleared transaction. Centrally cleared swaps, if any, are reported on the Statement of assets and liabilities based on variation margin received or paid, if any.
Dividends and distributions—Dividends and distributions to shareholders are recorded on the ex-dividend date. The amounts of dividends and distributions are determined in accordance with federal income tax regulations, which may differ from US GAAP. These "book/tax" differences are either considered temporary or permanent in nature. To the extent these differences are permanent in nature, such amounts are reclassified within the capital accounts based on their federal tax-basis treatment; temporary differences do not require reclassification.
Concentration of risk—Investing in securities of foreign issuers and currency transactions may involve certain considerations and risks not typically associated with investments in the United States. These risks include revaluation of currencies, adverse fluctuations in foreign currency values and possible adverse political, social and economic developments, including those particular to a specific industry, country or region, which could cause the securities and their markets to be less liquid and prices more volatile than those of comparable US companies and US government securities. These risks are greater with respect to securities of issuers located in emerging market countries. The ability of the issuers of the debt securities held by the Fund to meet their obligations may be affected by economic developments, including those particular to a specific industry, country, state or region.
38
UBS U.S. Allocation Fund
Notes to financial statements
Investment advisor and administrator fees and other transactions with affiliates
The Board has approved an Investment Advisory and Administration Contract (the "Advisory Contract"), under which UBS AM serves as investment advisor and administrator of the Fund. In accordance with the Advisory Contract, the Fund is to pay UBS AM an investment advisory and administration fee, which is to be accrued daily and paid monthly, at an annual rate of 0.50% of the Fund's average daily net assets up to $250 million and 0.45% thereafter.
UBS AM has agreed to permanently reduce its advisory and administration fee based on the Fund's average daily net assets so that it is assessed as follows: $0 to $250 million—0.50%; in excess of $250 million up to $500 million—0.45%; in excess of $500 million up to $2 billion—0.40%; and over $2 billion—0.35%. Accordingly, for the year ended August 31, 2016, UBS AM did not waive any investment advisory and administration fees. At August 31, 2016, the Fund owed UBS AM $105,337 for investment advisory and administration fees.
UBS AM has contractually undertaken to waive fees/reimburse a portion of the Fund's expenses, when necessary, to maintain the total annual operating expenses (excluding (1) dividend expense, borrowing costs and interest expense relating to short sales, and (2) investments in other investment companies, interest, taxes, brokerage commissions and extraordinary expenses, if any) of Class A, Class C and Class P shares at a level not to exceed 1.15%, 1.90% and 0.90%, respectively through December 31, 2016. The Fund will repay UBS AM for any previously waived fees/reimbursed expenses during the three-year period following August 31, 2013, to the extent that operating expenses (with certain exclusions such as dividend expense, borrowing costs, and interest expense relating to short sales, and interest, taxes, brokerage commissions and extraordinary expenses, if any) are otherwise below the expense caps in effect at the time the fees or expenses were waived/reimbursed. For the year ended August 31, 2016, the Fund had no fee waivers/expense reimbursements subject to repayment.
For the year ended August 31, 2016, the Fund paid $714 in brokerage commissions to UBS Securities LLC, an indirect wholly owned subsidiary of UBS AG, for transactions executed on behalf of the Fund.
During the year ended August 31, 2016, the Fund could invest cash collateral from securities lending activities into an affiliated private money market fund, UBS Private Money Market Fund, LLC ("Private Money Market"), which operated in compliance with most of the substantive provisions of Rule 2a-7 of the 1940 Act. Private Money Market was managed by UBS AM and was offered only to mutual funds and certain other accounts managed by the Advisor. UBS AM acted as managing member of Private Money Market and received a management fee from Private Money Market payable monthly in arrears at the annual rate of 0.10% of Private Money Market's average daily members' equity, minus the aggregate operating expenses of, and incurred by, Private Money Market during each such related month, not including investment expenses (including brokerage commissions, taxes, interest charges and other costs with respect to transactions in securities) and extraordinary expenses including litigation expenses, if any. UBS AM might have, in its sole discretion, waived all or any portion of the management fee to which it might have been entitled from time to time in order to maintain operating expenses at a certain level.
On May 25, 2016, the Board approved changing the Fund's reinvestment option for cash collateral from securities lending activities from Private Money Market to State Street Institutional U.S. Government Money Market Fund; the change went into effect on June 17, 2016. Distributions received from Private Money Market and State Street Institutional U.S. Government Money Market Fund, net of fee rebates paid to borrowers, are included in securities lending income in the Statement of operations.
39
UBS U.S. Allocation Fund
Notes to financial statements
Amounts relating to the investment of cash collateral from securities lending activities for the year ended August 31, 2016 were as follows:
Security description | | Value at
08/31/15 | | Purchases
during the
year ended
08/31/16 | | Sales
during the
year ended
08/31/16 | | Value at
08/31/16 | | Net income
earned from
affiliate for the
year ended
08/31/16 | |
UBS Private Money Market Fund LLC | | $ | 13,553,435 | | | $ | 224,302,893 | | | $ | 237,856,328 | | | $ | — | | | $ | 11,816 | | |
Additional information regarding compensation to affiliate of a board member
Professor Meyer Feldberg serves as a senior advisor to Morgan Stanley, a financial services firm with which the Fund may conduct transactions, resulting in him being an interested trustee of the Fund. The Fund has been informed that Professor Feldberg's role at Morgan Stanley does not involve matters directly affecting any UBS funds. Portfolio transactions are executed through Morgan Stanley based on that firm's ability to provide best execution of the transactions. During the year ended August 31, 2016, the Fund paid brokerage commissions to Morgan Stanley in the amount of $1,916.
During the year ended August 31, 2016, the Fund purchased and sold certain securities (e.g., fixed income securities) in principal trades with Morgan Stanley, having an aggregate value of $68,244,695. Morgan Stanley received compensation in connection with these trades, which may have been in the form of a "mark-up" or "mark-down" of the price of the securities, a fee from the issuer for maintaining a commercial paper program, or some other form of compensation. Although the precise amount of this compensation is not generally known by the Fund's investment advisor, it is believed that under normal circumstances it represents a small portion of the total value of the transactions.
Service and distribution plans
UBS Asset Management (US) Inc. ("UBS AM (US)") is the principal underwriter of the Fund's shares. Under separate plans of service and/or distribution pertaining to Class A and Class C shares, the Fund pays UBS AM (US) monthly service fees at an annual rate of 0.25% of the average daily net assets of Class A and Class C shares and monthly distribution fees at the annual rate of 0.75% of the average daily net assets of Class C shares. At August 31, 2016, the Fund owed UBS AM (US) $89,923 for service and distribution fees.
UBS AM (US) also receives the proceeds of the initial sales charges paid by shareholders upon the purchase of Class A shares and the contingent deferred sales charges paid by shareholders upon certain redemptions of Class A and Class C shares. UBS AM (US) has informed the Fund that for the year ended August 31, 2016, it earned $22,694 in initial sales charges on Class A shares and $87 in deferred sales charges on Class C shares.
Transfer agency and related services fees
UBS Financial Services Inc. provides certain services to the Fund pursuant to a delegation of authority from BNY Mellon Investment Servicing (US) Inc. ("BNY Mellon"), the Fund's transfer agent, and is compensated for these services by BNY Mellon, not the Fund.
For the year ended August 31, 2016, UBS Financial Services Inc. received from BNY Mellon, not the Fund, $78,700 of the total transfer agency and related service fees paid by the Fund to BNY Mellon.
Securities lending
The Fund may lend securities up to 331/3% of its total assets to qualified broker-dealers or institutional investors. The loans are secured at all times by cash, US government securities or irrevocable letters of credit in an amount at least equal to the market value of the securities loaned, plus accrued interest and dividends, determined on a daily basis and adjusted accordingly.
40
UBS U.S. Allocation Fund
Notes to financial statements
The Fund will regain ownership of loaned securities to exercise certain beneficial rights; however, the Fund may bear the risk of delay in recovery of, or even loss of rights in, the securities loaned should the borrower fail financially. The Fund receives compensation for lending its securities from interest or dividends earned on the cash, US government securities or irrevocable letters of credit held as collateral, net of fee rebates paid to the borrower plus reasonable administrative and custody fees. Effective June 17, 2016, cash collateral received is invested in State Street Institutional U.S. Government Money Market Fund, which is included in the Fund's Portfolio of investments. Prior to that, cash collateral received was invested in Private Money Market. State Street Bank and Trust Company serves as the Fund's lending agent.
At August 31, 2016, the Fund had securities on loan at value, cash collateral and non-cash collateral as follows:
Value of securities
on loan | | Cash collateral | | Non-cash
collateral* | | Total collateral | | Security type held
as non-cash
collateral | |
| $ | 11,284,606 | | | $ | 1,979,349 | | | $ | 9,633,336 | | | $ | 11,612,685 | | | US Treasury Notes
and US Treasury Bills | |
* These securities are held for the benefit of the Fund at the Fund's custodian. The Fund cannot repledge or resell this collateral. As such, this collateral is excluded from the Statement of assets and liabilities
Pursuant to Accounting Standards Update ("ASU") No.2014-11, Transfers & Servicing (Topic 860): "Repurchase-to-Maturity Transactions, Repurchase Financings, and Disclosures" ("ASU 2014-11"), the gross amount of recognized liabilities for securities lending transactions at August 31, 2016 was $1,979,349. As the securities loaned are subject to termination by the Fund or the borrower at any time, the remaining contractual maturities of the equity securities on loan are considered to be overnight and continuous.
Bank line of credit
The Fund participates with other funds managed or advised by UBS AM in a $75 million committed credit facility with State Street Bank and Trust Company ("Committed Credit Facility"), to be utilized for temporary financing until the settlement of sales or purchases of portfolio securities, the repurchase or redemption of shares of the Fund at the request of shareholders and other temporary or emergency purposes. Under the Committed Credit Facility arrangement, the Fund has agreed to pay a commitment fee on the average daily balance of the Committed Credit Facility not utilized. Effective November 18, 2015, commitment fees have been allocated among the funds in the Committed Credit Facility as follows: 50% of the allocation is based on the relative asset size of funds and the other 50% of the allocation is based on utilization. Prior to November 18, 2015, commitment fees were allocated among the funds in the Committed Credit Facility pro rata, based on the relative asset size of funds. For the year ended August 31, 2016, the Fund did not borrow under the Committed Credit Facility.
Purchases and sales of securities
For the year ended August 31, 2016, aggregate purchases and sales of portfolio securities, excluding short-term securities and US Government securities, were $74,152,921 and $92,693,398, respectively.
For the year ended August 31, 2016, aggregate purchases and sales of US Government securities, excluding short-term securities, were $416,162,135 and $414,222,473, respectively.
41
UBS U.S. Allocation Fund
Notes to financial statements
Shares of beneficial interest
There is an unlimited amount of $0.001 par value shares of beneficial interest authorized. Transactions in shares of beneficial interest were as follows:
For the year ended August 31, 2016:
| | | Class A | | Class C | | Class P | |
| | | Shares | | Amount | | Shares | | Amount | | Shares | | Amount | |
Shares sold | | | 47,994 | | | $ | 1,974,756 | | | | 16,075 | | | $ | 635,348 | | | | 27,311 | | | $ | 1,127,933 | | |
Shares repurchased | | | (392,003 | ) | | | (15,969,531 | ) | | | (191,999 | ) | | | (7,605,762 | ) | | | (94,524 | ) | | | (3,915,097 | ) | |
Dividends reinvested | | | — | | | | — | | | | — | | | | — | | | | — | | | | — | | |
Net decrease | | | (344,009 | ) | | $ | (13,994,775 | ) | | | (175,924 | ) | | $ | (6,970,414 | ) | | | (67,213 | ) | | $ | (2,787,164 | ) | |
For the year ended August 31, 2015:
| | | Class A | | Class C | | Class P | |
| | | Shares | | Amount | | Shares | | Amount | | Shares | | Amount | |
Shares sold | | | 51,608 | | | $ | 2,082,018 | | | | 11,623 | | | $ | 460,717 | | | | 79,699 | | | $ | 3,293,035 | | |
Shares repurchased | | | (442,614 | ) | | | (18,067,839 | ) | | | (170,283 | ) | | | (6,754,555 | ) | | | (90,519 | ) | | | (3,763,000 | ) | |
Dividends reinvested | | | 8,549 | | | | 340,057 | | | | — | | | | — | | | | 2,457 | | | | 99,038 | | |
Net decrease | | | (382,457 | ) | | $ | (15,645,764 | ) | | | (158,660 | ) | | $ | (6,293,838 | ) | | | (8,363 | ) | | $ | (370,927 | ) | |
Redemption fees
Effective August 3, 2015, the redemption fee of 1.00% imposed by each class of the Fund was eliminated. Prior to August 3, 2015 for purchases of shares on or after February 17, 2015, the redemption fee was calculated as a percentage of the amount redeemed within 30 days of purchase, if applicable. This amount was paid to the Fund. Redemption fees retained by the Fund during the year ended August 31, 2015 are disclosed in the Statement of changes in net assets.
Contribution from Advisor
During the year ended August 31, 2016, the Advisor reimbursed the Fund in the amount of $71,624 for a trading error.
Federal tax status
The Fund intends to distribute substantially all of its income and to comply with the other requirements of the Internal Revenue Code applicable to regulated investment companies. Accordingly, no provision for federal income taxes is required. In addition, by distributing during each calendar year substantially all of its net investment income, net realized capital gains and certain other amounts, if any, the Fund intends not to be subject to a federal excise tax.
The tax character of distributions paid during the fiscal years ended August 31, 2016 and August 31, 2015 were as follows:
Distributions paid from: | | 2016 | | 2015 | |
Ordinary Income | | $ | — | | | | 486,934 | | |
At August 31, 2016, the components of accumulated deficit on a tax basis were as follows:
Undistributed ordinary income | | $ | 843,367 | | |
Accumulated realized capital and other losses | | | (13,571,662 | ) | |
Net unrealized appreciation of investments | | | 12,179,589 | | |
Total accumulated deficit | | $ | (548,706 | ) | |
42
UBS U.S. Allocation Fund
Notes to financial statements
The differences between book-basis and tax-basis unrealized appreciation/depreciation is attributable primarily to the tax deferral of losses on wash sales and tax treatment of certain derivative instruments.
To reflect reclassifications arising from permanent "book/tax" differences for the year ending August 31, 2016, accumulated undistributed net investment income was increased by $22,680, and accumulated net realized loss was increased by $14,957 and paid-in-capital was decreased by $7,723. These differences are primarily due to income reallocation from real estate investments trusts, and paydown reclasses.
Under the Regulated Investment Company Modernization Act of 2010 (the "Act"), net capital losses recognized by the Fund after December 22, 2010, may be carried forward indefinitely, and retain their character as short-term and/or long-term losses. The Act requires that post-enactment net capital losses be used before pre-enactment net capital losses.
At August 31, 2016, the Fund had a pre-enactment net capital loss carryforward of $13,433,002. This pre-enactment capital loss carryforward is available as a reduction, to the extent provided in the regulations, of any future net realized capital gains and the full amount will expire on August 31, 2018. To the extent that such losses are used to offset future net realized capital gains, it is probable these gains will not be distributed. During the current fiscal year, the Fund utilized $7,891,036 of capital loss carryforwards to offset current year realized gains.
ASC 740-10 "Income Taxes-Overall" sets forth a minimum threshold for financial statement recognition of the benefit of a tax position taken or expected to be taken. The Fund has analyzed as of August 31, 2016 that there are no significant uncertain tax positions taken or expected to be taken that would require recognition in financial statements. The Fund recognizes interest and penalties, if any, related to uncertain tax positions as income tax expense in Statement of operations. During the year ended August 31, 2016 the Fund did not incur any interest or penalties.
Under the applicable foreign tax laws, gains on certain securities held in certain foreign countires may be subject to taxes that will be paid by the Fund.
Each of the tax years in the four year period ended August 31, 2016, remains subject to examination by the Internal Revenue Service and state taxing authorities.
43
UBS U.S. Allocation Fund
Report of Ernst & Young LLP, independent registered public accounting firm
The Board of Trustees and Shareholders of
UBS U.S. Allocation Fund
We have audited the accompanying statement of assets and liabilities, including the portfolio of investments, of UBS U.S. Allocation Fund (the sole series comprising UBS Investment Trust) (the "Fund") as of August 31, 2016, and the related statement of operations for the year then ended, the statements of changes in net assets for each of the two years in the period then ended, and the financial highlights for each of the five years in the period then ended. These financial statements and financial highlights are the responsibility of the Fund's management. Our responsibility is to express an opinion on these financial statements and financial highlights based on our audits.
We conducted our audits in accordance with the standards of the Public Company Accounting Oversight Board (United States). Those standards require that we plan and perform the audit to obtain reasonable assurance about whether the financial statements and financial highlights are free of material misstatement. We were not engaged to perform an audit of the Fund's internal control over financial reporting. Our audits included consideration of internal control over financial reporting as a basis for designing audit procedures that are appropriate in the circumstances, but not for the purpose of expressing an opinion on the effectiveness of the Fund's internal control over financial reporting. Accordingly, we express no such opinion. An audit also includes examining, on a test basis, evidence supporting the amounts and disclosures in the financial statements and financial highlights, assessing the accounting principles used and significant estimates made by management and evaluating the overall financial statement presentation. Our procedures included confirmation of securities owned as of August 31, 2016 by correspondence with the custodian and others or by other appropriate auditing procedures where replies from others were not received. We believe that our audits provide a reasonable basis for our opinion.
In our opinion, the financial statements and financial highlights referred to above present fairly, in all material respects, the financial position of UBS U.S. Allocation Fund at August 31, 2016, the results of its operations for the year then ended, the changes in its net assets for each of the two years in the period then ended, and the financial highlights for each of the five years in the period then ended, in conformity with U.S. generally accepted accounting principles.

New York, New York
October 28, 2016
44
UBS U.S. Allocation Fund
General information (unaudited)
Quarterly Form N-Q portfolio schedule
The Fund will file its complete schedule of portfolio holdings with the Securities and Exchange Commission ("SEC") for the first and third quarters of each fiscal year on Form N-Q. The Fund's Forms N-Q are available on the SEC's Web site at http://www.sec.gov. The Fund's Forms N-Q may be reviewed and copied at the SEC's Public Reference Room in Washington, D.C. Information on the operation of the SEC's Public Reference Room may be obtained by calling 1-800-SEC 0330. Additionally, you may obtain copies of Forms N-Q from the Fund upon request by calling 1-800-647 1568.
Proxy voting policies, procedures and record
You may obtain a description of the Fund's (1) proxy voting policies, (2) proxy voting procedures and (3) information regarding how the Fund voted any proxies related to portfolio securities during the most recent 12-month period ended June 30 for which an SEC filing has been made, without charge, upon request by contacting the Fund directly at 1-800-647 1568, online on the Fund's Web site: www.ubs.com/ubsam-proxy, or on the EDGAR Database on the SEC's Web site (http://www.sec.gov).
45
UBS U.S. Allocation Fund
Tax information (unaudited)
We are required by Subchapter M of the Internal Revenue Code of 1986, as amended, to advise you in writing as to the federal tax status of distributions received by shareholders during such fiscal year.
Dividends received by tax-exempt recipients (e.g., IRAs and Keoghs) need not be reported as taxable income. Some retirement trusts (e.g., corporate, Keogh and 403(b)(7) plans) may need this information for their annual information reporting.
Shareholders should not use the above information to prepare their tax returns. Since the Fund's fiscal year is not the calendar year, another notification will be sent in respect of calendar year 2016. The second notification, which will reflect the amount to be used by calendar year taxpayers on their federal income tax returns, will be made in conjunction with Form 1099 DIV and will be mailed in January 2017. Shareholders are advised to consult their own tax advisers with respect to the tax consequences of their investment in the Fund.
46
UBS U.S. Allocation Fund
Board approval of investment advisory and administration
agreement (unaudited)
Background—At a meeting of the board of UBS Investment Trust (the "Trust") on July 12-13, 2016, the members of the board, including the trustees who are not "interested persons" of the Trust ("Independent Trustees"), as defined in the Investment Company Act of 1940, as amended, considered and approved the continuance of the investment advisory and administration agreement (the "Investment Advisory and Administration Agreement") of the Trust with respect to its series, UBS U.S. Allocation Fund (the "Fund"), with UBS Asset Management (Americas) Inc. ("UBS AM"). In preparing for the meeting, the Independent Trustees had requested and received extensive information from UBS AM to assist them, including information about UBS AM, as well as the advisory, administrative and distribution arrangements for the Fund. The board reviewed and discussed with management the materials initially provided by UBS AM prior to the scheduled board meeting. The Independent Trustees also met in executive session after management's presentation was completed to review the disclosure that had been made to them at the meeting. At these sessions the Independent Trustees were joined by their independent legal counsel. The Independent Trustees also received a memorandum from their independent legal counsel discussing the duties of board members in considering the approval of advisory, administration and distribution agreements.
In its consideration of the approval of the Investment Advisory and Administration Agreement, the board reviewed the following factors:
Nature, extent and quality of the services under the Investment Advisory and Administration Agreement—The board received and considered information regarding the nature, extent and quality of advisory services provided to the Fund by UBS AM under the Investment Advisory and Administration Agreement during the past year. The board also considered the nature, extent and quality of administrative, distribution and shareholder services performed by UBS AM and its affiliates for the Fund and the resources devoted to, and the record of compliance with, the Fund's compliance policies and procedures. The board noted that it received information at regular meetings throughout the year regarding the services rendered by UBS AM concerning the management of the Fund's affairs and UBS AM's role in coordinating and overseeing providers of other services to the Fund. The board's evaluation of the services provided by UBS AM took into account the board's knowledge and familiarity gained as board members of funds in the UBS New York fund complex, including the scope and quality of UBS AM's investment advisory and other capabilities and the quality of its administrative and other services. The board observed that the scope of services provided by UBS AM had expanded over time as a result of regulatory and other developments, including maintaining and monitoring its own and the Fund's expanded compliance programs.
The board had available to it the qualifications, backgrounds and responsibilities of the senior personnel at UBS AM responsible for the Fund and had previously met with and received information regarding the persons primarily responsible for the day-to-day management of the Fund. The board recognized that the Fund's senior personnel at UBS AM report to the board regularly and that at each regular meeting the board receives a detailed report from UBS AM on the Fund's performance. The board also considered, based on its knowledge of UBS AM and its affiliates, the financial resources available to UBS AM and its parent organization, UBS Group AG. In that regard, the board received extensive financial information regarding UBS AM and noted that it was a wholly owned, indirect subsidiary of one of the largest financial services firms in the world. It also was noted that UBS AM had approximately $143 billion in assets under management as of March 31, 2016 and was part of the UBS Asset Management Division, which had approximately $653 billion in assets under management worldwide as of March 31, 2016. The board also was cognizant of, and considered, the regulatory and litigation actions and investigations occurring in the past few years involving UBS Group AG, UBS AM and certain of their affiliates.
The board concluded that, overall, it was satisfied with the nature, extent and quality of services provided (and expected to be provided) to the Fund under the Investment Advisory and Administration Agreement.
Advisory fees and expense ratios—The board reviewed and considered the contractual management fee (the "Contractual Management Fee") payable by the Fund to UBS AM in light of the nature, extent and quality of the
47
UBS U.S. Allocation Fund
Board approval of investment advisory and administration
agreement (unaudited)
advisory and administrative services provided by UBS AM. The board also reviewed and considered the written agreement between UBS AM and the Fund, which is separate from UBS AM's investment advisory agreement with the Fund, whereby UBS AM has agreed to permanently reduce its management fee based on the Fund's average daily net assets, which is discussed in more detail in the "Economies of Scale" section, and considered the actual fee rate (after taking this agreement into account) (the "Actual Management Fee"). Additionally, the board received and considered information comparing the Fund's Contractual Management Fee, Actual Management Fee and total expenses with those of funds in a group of funds selected and provided by Broadridge ("Broadridge"), an independent provider of investment company data (the "Expense Group").
In addition, pursuant to a written fee waiver/expense reimbursement agreement, UBS AM is contractually obligated to waive its management fees and/or reimburse the Fund so that the Fund's ordinary total annual operating expenses through December 31, 2016 (excluding dividend expense, borrowing costs, and interest expense relating to short sales, and investments in other investment companies, interest, taxes, brokerage commissions and extraordinary expenses) would not exceed 1.15% for Class A shares, 1.90% for Class C shares and 0.90% for Class P (formerly Class Y) shares. The board also considered that the Fund has agreed to repay UBS AM for those waived fees and/or reimbursed expenses if the Fund can do so over the following three fiscal years without causing its expenses in any of those years to exceed the expense caps.
In connection with its consideration of the Fund's management fees, the board also received information on UBS AM's standard institutional account fees for accounts of a similar investment type to the Fund. The board noted management's explanation that comparisons with such accounts may be of limited relevance given the different structures and regulatory requirements of mutual funds, such as the Fund, versus those accounts and the differences in the levels of services required by the Fund and those accounts. The board also received information on fees charged to other mutual funds managed by UBS AM.
The comparative Broadridge information showed that the Fund's Contractual Management Fee, Actual Management Fee and total expenses were below the respective medians in the Fund's Expense Group (lowest in the Expense Group) for the comparison periods utilized in the Broadridge report. (Below median fees or expenses represent fees or expenses that are lower relative to the median, and above median fees or expenses represent fees or expenses that are higher relative to the median of the funds in the Expense Group.)
In light of the foregoing, the board determined that the management fee was reasonable in light of the nature, extent and quality of services provided to the Fund under the Investment Advisory and Administration Agreement.
Fund performance—The board received and considered (a) annualized total return information of the Fund compared to other funds (the "Performance Universe") selected by Broadridge over the one-, three-, five-, ten-year and since inception periods ended April 30, 2016 and (b) annualized performance information for each year in the ten-year period ended April 30, 2016. Although the board received information for the ten-year and since inception periods, in its analysis, it generally placed greater emphasis on the one-, three- and five-year periods. The board was provided with a description of the methodology Broadridge used to determine the similarity of the Fund with the funds included in its Performance Universe. The board also received updated supplemental data showing the Fund's performance through May 31, 2016. The board also noted that it had received information throughout the year at periodic intervals with respect to the Fund's performance, including with respect to its benchmark index.
The comparative Broadridge information showed that the Fund's performance was above the median for all comparative periods. (Below median performance represents performance that is worse relative to the median, and above median performance represents performance that is better relative to the median.) Based on its review, the board concluded that the Fund's investment performance was acceptable.
48
UBS U.S. Allocation Fund
Board approval of investment advisory and administration
agreement (unaudited)
Advisor profitability—The board received and considered a profitability analysis of UBS AM and its affiliates in providing services to the Fund. The board also received profitability information with respect to the UBS New York fund complex as a whole. UBS AM's profitability was considered not excessive in light of the nature, extent and quality of the services provided to the Fund.
Economies of scale—The board received and considered information from management regarding whether UBS AM realized economies of scale as the Fund's assets grew, whether the Fund has appropriately benefited from any economies of scale, and whether there is potential for realization of any further economies of scale for the Fund. The board considered whether economies of scale in the provision of services to the Fund were being passed along to the shareholders. The board noted that the Fund's Contractual Management Fee contained a single breakpoint and that the Fund's assets did not exceed the breakpoint as of April 30, 2016.
While the Fund's Contractual Management Fee contained a single breakpoint, the board recognized that the Fund had entered into a separate agreement with UBS AM, whereby UBS AM agreed to permanently reduce its Contractual Management Fee by utilizing several additional breakpoints based on the Fund's average daily net assets, thereby achieving the same effect as if the Contractual Management Fee contained multiple breakpoints.
Generally, in light of UBS AM's profitability data and the Contractual Management Fee and Actual Management Fee currently in place, the board believed that UBS AM's sharing of current economies of scale with the Fund was acceptable.
Other benefits to UBS AM—The board considered other benefits received by UBS AM and its affiliates as a result of its relationship with the Fund, including the opportunity to offer additional products and services to Fund shareholders. In light of the costs of providing investment advisory, administrative and other services to the Fund and UBS AM's ongoing commitment to the Fund, the profits and other ancillary benefits that UBS AM and its affiliates received were considered reasonable.
In light of all of the foregoing, the board approved the Investment Advisory and Administration Agreement. No single factor reviewed by the board was identified by the board as the principal factor in determining whether to approve the Investment Advisory and Administration Agreement. The Independent Trustees were advised by separate independent legal counsel throughout the process. The board discussed the proposed continuance of the Investment Advisory and Administration Agreement in private sessions with its independent legal counsel at which no representatives of UBS AM were present.
49
UBS U.S. Allocation Fund
Supplemental information (unaudited)
Board of Trustees & Officers
The Trust is governed by a Board of Trustees which oversees the Fund's operations. Each trustee serves an indefinite term of office. Officers are appointed by the trustees and serve at the pleasure of the Board. The table below shows, for each trustee and officer, his or her name, address and age, the position held with the Trust, the length of time served as a trustee or officer of the Trust, the trustee's or officer's principal occupations during the last five years, the number of portfolios in the UBS fund complex overseen by the trustee or for which a person served as an officer, and other directorships held by the trustee.
The Fund's Statement of Additional Information contains additional information about the trustees and is available, without charge, upon request by calling 1-800-647 1568.
Interested Trustees:
Name,
address,
and age | | Position(s)
held with
Trust | | Term of office1
and length of
time served | | Principal
occupation(s)
during past
5 years | | Number of
portfolios in fund
complex overseen
by Trustee | | Other
directorships
held by
Trustee | |
Meyer Feldberg2;
74
Morgan Stanley
1585 Broadway
36th Floor
New York, NY 10036 | | Trustee | | Since 2001 | | Professor Feldberg is Dean Emeritus and Professor of Leadership and Ethics at Columbia Business School, although on an extended leave of absence. He is also a senior advisor to Morgan Stanley (financial services) (since 2005). Professor Feldberg also served as president of New York City Global Partners (an organization located in part of the Office of the Mayor of the City of New York that promoted interaction with other cities around the world) (2007-2014). Prior to 2004, he was Dean and Professor of Management and Ethics of the Graduate School of Business at Columbia University (since 1989). | | Professor Feldberg is a director or trustee of 18 investment companies (consisting of 60 portfolios) for which UBS Asset Management (Americas) Inc. ("UBS AM") or one of its affiliates serves as investment advisor or manager. | | Professor Feldberg is also a director of Macy's, Inc. (operator of department stores), Revlon, Inc. (cosmetics), and the New York City Ballet. | |
50
UBS U.S. Allocation Fund
Supplemental information (unaudited)
Independent Trustees:
Name,
address,
and age | | Position(s)
held with
Trust | | Term of office1
and length of
time served | | Principal
occupation(s)
during past
5 years | | Number of
portfolios in fund
complex overseen
by Trustee | | Other
directorships
held by
Trustee | |
Richard Q. Armstrong;
81
c/o Keith Weller Assistant
Fund Secretary
UBS Asset Management
(Americas) Inc.
1285 Avenue of the
Americas
New York, NY 10019 | | Trustee and Chairman of the Board of Trustees | | Since 2001 (Trustee) Since 2004 (Chairman of the Board of Trustees) | | Mr. Armstrong is chairman and principal of R.Q.A. Enterprises (management consulting firm) (since 1991 and principal occupation since 1995). Mr. Armstrong was president or chairman of a number of international packaged goods companies (responsible for such brands as Canada Dry, Dr. Pepper, Adirondack Beverages and Moët Hennessy, among many others) (from 1982 until 1995). | | Mr. Armstrong is a director or trustee of 10 investment companies (consisting of 52 portfolios) for which UBS AM serves as investment advisor or manager. | | None | |
Alan S. Bernikow;
75
207 Benedict Ave.
Staten Island, NY 10314 | | Trustee | | Since 2005 | | Mr. Bernikow is retired. Previously, he was deputy chief executive officer at Deloitte & Touche (international accounting and consulting firm). | | Mr. Bernikow is a director or trustee of 10 investment companies (consisting of 52 portfolios) for which UBS AM serves as investment advisor or manager. | | Mr. Bernikow is also a director of Revlon, Inc. (cosmetics) (and serves as the chair of its audit committee and as the chair of the compensation committee), the lead director of Mack-Cali Realty Corporation (real estate investment trust) (and serves as the chair of its audit committee); and a director of the Destination XL Group, Inc. (menswear) (and serves as a member of its nominating and corporate governance committee). He is also a director of Florida Community Bank, N.A. (and serves as the chair of its audit committee). | |
Richard R. Burt;
69
McLarty Associates
900 17th Street
Washington, D.C. 20006 | | Trustee | | Since 2001 | | Mr. Burt is a managing director to McLarty Associates (a consulting firm) (since 2007). He was chairman of IEP Advisors (international investments and consulting firm) until 2009. Prior to 2007, he was chairman of Diligence Inc. (international information and risk management firm). | | Mr. Burt is a director or trustee of 10 investment companies (consisting of 52 portfolios) for which UBS AM serves as investment advisor or manager. | | Mr. Burt is also a director of The Central Europe & Russia Fund, Inc., The European Equity Fund, Inc. and The New Germany Fund, Inc. (and serves as a member of each such fund's audit, nominating and governance committees). | |
51
UBS U.S. Allocation Fund
Supplemental information (unaudited)
Independent Trustees (concluded):
Name,
address,
and age | | Position(s)
held with
Trust | | Term of office1
and length of
time served | | Principal
occupation(s)
during past
5 years | | Number of
portfolios in fund
complex overseen
by Trustee | | Other
directorships
held by
Trustee | |
Bernard H. Garil;
76
6754 Casa Grande Way
Delray Beach, FL 33446 | | Trustee | | Since 2005 | | Mr. Garil is retired (since 2001). He was a managing director at PIMCO Advisory Services (from 1999 to 2001) where he served as president of closed-end funds and vice-president of the variable insurance product funds advised by OpCap Advisors (until 2001). | | Mr. Garil is a director or trustee of 10 investment companies (consisting of 52 portfolios) for which UBS AM serves as investment advisor or manager. | | Mr. Garil is also a director of OFI Global Trust Company (commercial trust company), The Leukemia and Lymphoma Society (voluntary health organization) and a trustee for the Brooklyn College Foundation, Inc. (charitable foundation). | |
Heather R. Higgins;
57
c/o Keith A. Weller
Assistant Fund Secretary
UBS Asset Management
(Americas) Inc.
1285 Avenue of the
Americas
New York, NY 10019 | | Trustee | | Since 2005 | | Ms. Higgins is the president and director of The Randolph Foundation (charitable foundation) (since 1991). Ms. Higgins also serves (or has served) on the boards of several non-profit charitable groups, including the Independent Women's Forum (chairman) and the Philanthropy Roundtable (vice chairman). She also serves on the board of the Hoover Institution (from 2001 to 2007 and since 2009). | | Ms. Higgins is a director or trustee of 10 investment companies (consisting of 52 portfolios) for which UBS AM serves as investment advisor or manager. | | None | |
David Malpass;
60
Encima Global, LLC
645 Madison Avenue,
5th Floor,
New York, NY 10022 | | Trustee | | Since 2014 | | Mr. Malpass is the president and founder of Encima Global, LLC (economic research and consulting firm) (since 2008). From 1993 until 2008, he was Chief Economist and Senior Managing Director of Bear, Stearns & Co. (financial services firm). | | Mr. Malpass is a director or trustee of 10 investment companies (consisting of 52 portfolios) for which UBS AM serves as investment advisor or manager. | | Mr. Malpass is also a director of New Mountain Finance Corporation (business development company) (and serves as a member of its audit committee). | |
52
UBS U.S. Allocation Fund
Supplemental information (unaudited)
Officers:
Name,
address,
and age | | Position(s)
held with
Trust | | Term of office1
and length of
time served | | Principal occupation(s) during past 5 years; number of portfolios in
fund complex for which person serves as officer | |
Joseph Allessie*;
51 | | Chief Compliance Officer | | Since 2014 | | Mr. Allessie is a managing director (since 2015) (prior to which he was an executive director (from 2007 to 2015)) at UBS AM and UBS Asset Management (US) Inc. (collectively, "UBS AM—Americas region"). Mr. Allessie is head of compliance and operational risk control for the UBS Asset Management Division in the Americas with oversight for traditional and alternative investment businesses in Canada, the US and Cayman Islands. Prior to that he served as deputy general counsel of USA AM—Americas region (from 2005 to 2014). Mr. Allessie is the chief compliance officer (prior to which he was interim chief compliance officer (from January to July 2014)) and had served as a vice president and assistant secretary (from 2005 to 2016) of 13 investment companies (consisting of 76 portfolios) for which UBS AM serves as investment advisor or manager. | |
Rose Ann Bubloski*;
48 | | Vice President and Assistant Treasurer | | Since 2011 | | Ms. Bubloski is a director (since 2012) (prior to which she was an associate director (from 2008 to 2012)) and senior manager of registered fund product control of UBS AM—Americas region. She is vice president and assistant treasurer of 13 investment companies (consisting of 76 portfolios) for which UBS AM serves as investment advisor or manager. | |
Mark E. Carver*;
53 | | President | | Since 2010 | | Mr. Carver is a managing director and head of product development and management for UBS AM—Americas region (since 2008). In this role, he oversees product development and management for both wholesale and institutional businesses. He is a member of the Americas Management Committee (since 2008) and the Regional Operating Committee (since 2008). Mr. Carver is president of 13 investment companies (consisting of 76 portfolios) for which UBS AM serves as investment advisor or manager. | |
Thomas Disbrow*;
50 | | Vice President and Treasurer | | Since 2000 (Vice President) Since 2004 (Treasurer) | | Mr. Disbrow is a managing director (since 2011) (prior to which he was an executive director (from 2007 to 2011)) and is global head of registered fund product control (since January 2016) (prior to which he was head of the North America fund treasury administration department of UBS AM—Americas region (from 2011-2015)). Mr. Disbrow is a vice president and treasurer and/or principal accounting officer of 13 investment companies (consisting of 76 portfolios) for which UBS AM serves as investment advisor or manager. | |
Mark F. Kemper**;
58 | | Vice President and Secretary | | Since 2004 | | Mr. Kemper is a managing director (since 2006) and head of the legal department of UBS AM—Americas region (since 2004). He has been secretary of UBS AM—Americas region (since 2004), and assistant secretary of UBS Asset Management Trust Company (since 1993). Mr. Kemper is vice president and secretary of 13 investment companies (consisting of 76 portfolios) for which UBS AM serves as investment advisor or manager. | |
Joanne M. Kilkeary*;
48 | | Vice President and Assistant Treasurer | | Since 1999 | | Ms. Kilkeary is an executive director (since 2013) (prior to which she was a director (since 2008)) and a senior manager (since 2004) of registered fund product control of UBS AM—Americas region. Ms. Kilkeary is a vice president and assistant treasurer of 13 investment companies (consisting of 76 portfolios) for which UBS AM serves as investment advisor or manager. | |
Tammie Lee*;
45 | | Vice President and Assistant Secretary | | Since 2005 | | Ms. Lee is an executive director (since 2010) (prior to which she was a director (from 2005 to 2010)) and associate general counsel of UBS AM—Americas region (since 2005). Ms. Lee is a vice president and assistant secretary of 13 investment companies (consisting of 76 portfolios) for which UBS AM serves as investment advisor or manager. | |
53
UBS U.S. Allocation Fund
Supplemental information (unaudited)
Officers (continued):
Name,
address,
and age | | Position(s)
held with
Trust | | Term of office1
and length of
time served | | Principal occupation(s) during past 5 years; number of portfolios in
fund complex for which person serves as officer | |
Joshua M. Lindauer*;
28 | | Vice President and Assistant Secretary | | Since 2016 | | Mr. Lindauer is an associate director and associate general counsel of UBS AM—Americas region (since May 2016). Prior to joining UBS AM—Americas region, Mr. Lindauer was an associate counsel at Fred Alger Management, Inc. (from 2015 to 2016) and a paralegal (from 2014 to 2015). From 2010 to 2014, Mr. Lindauer was a law student. Mr. Lindauer is a vice president and assistant secretary of 10 investment companies (consisting of 73 portfolios) for which UBS AM serves as investment advisor or manager. | |
William T. MacGregor*;
41 | | Vice President and Assistant Secretary | | Since September 2015 | | Mr. MacGregor is an executive director and deputy general counsel at UBS AM—Americas region. From June 2012 through July 2015, Mr. MacGregor was Senior Vice President, Secretary and Associate General Counsel of AXA Equitable Funds Management Group, LLC and from May 2008 through July 2015, Mr. MacGregor was Lead Director and Associate General Counsel of AXA Equitable Life Insurance Company. Mr. MacGregor is a vice president and assistant secretary of 13 investment companies (consisting of 76 portfolios) for which UBS AM serves as investment advisor or manager. | |
Nancy D. Osborn*;
50 | | Vice President and Assistant Treasurer | | Since 2007 | | Mrs. Osborn is a director (since 2010) (prior to which she was an associate director) and a senior manager of registered fund product control of UBS AM—Americas region (since 2006). Mrs. Osborn is a vice president and assistant treasurer of 13 investment companies (consisting of 76 portfolios) for which UBS AM serves as investment advisor or manager. | |
Eric Sanders*;
51 | | Vice President and Assistant Secretary | | Since 2005 | | Mr. Sanders is a director and associate general counsel of UBS AM—Americas region (since 2005). Mr. Sanders is a vice president and assistant secretary of 13 investment companies (consisting of 76 portfolios) for which UBS AM serves as investment advisor or manager. | |
Keith A. Weller*;
55 | | Vice President and Assistant Secretary | | Since 2000 | | Mr. Weller is an executive director and senior associate general counsel of UBS AM—Americas region (since 2005) and has been an attorney with affiliated entities since 1995. Mr. Weller is a vice president and assistant secretary of 13 investment companies (consisting of 76 portfolios) for which UBS AM serves as investment advisor or manager. | |
Mandy Yu*;
33 | | Vice President | | Since 2013 | | Ms. Yu is an associate director (since 2015) (prior to which she was an authorized officer (from 2012 to 2015)) and tax compliance manager (since 2013) of registered fund product control of UBS AM—Americas region. She was a fund treasury manager (from 2012 to 2013) and a mutual fund administrator (from 2007 to 2012) for UBS AM—Americas region. Ms. Yu is a vice president of 13 investment companies (consisting of 76 portfolios) for which UBS AM serves as investment advisor or manager. | |
* This person's business address is 1285 Avenue of the Americas, New York, New York 10019-6028.
** This person's business address is One North Wacker Drive, Chicago, Illinois 60606.
1 Each trustee holds office for an indefinite term.
2 Professor Feldberg is deemed an "interested person" of the Trust as defined in the Investment Company Act because he is a senior advisor to Morgan Stanley, a financial services firm with which the Fund may conduct transactions.
54
This page intentionally left blank.
55
This page intentionally left blank.
56
Trustees
Richard Q. Armstrong
Chairman
Alan S. Bernikow
Richard R. Burt
Meyer Feldberg
Bernard H. Garil
Heather R. Higgins
David Malpass
Principal Officers
Mark E. Carver
President
Mark F. Kemper
Vice President and Secretary
Thomas Disbrow
Vice President and Treasurer
Investment Advisor and
Administrator
UBS Asset Management (Americas) Inc.
1285 Avenue of the Americas
New York, New York 10019-6028
Principal Underwriter
UBS Asset Management (US) Inc.
1285 Avenue of the Americas
New York, New York 10019-6028
This report is not to be used in connection with the offering of shares of the Fund unless accompanied or preceded by an effective prospectus.
©UBS 2016. All rights reserved.
UBS Asset Management (Americas) Inc.
PRESORTED
STANDARD
U.S. POSTAGE
PAID
COMPUTERSHARE

UBS Asset Management (Americas) Inc.
1285 Avenue of the Americas
New York, NY 10019-6028
Item 2. Code of Ethics.
The registrant has adopted a code of ethics that applies to its principal executive officer, principal financial officer, principal accounting officer or controller, or persons performing similar functions pursuant to Section 406 of the Sarbanes-Oxley Act of 2002. (The registrant has designated the code of ethics adopted pursuant to Sarbanes-Oxley as a “Code of Conduct” to lessen the risk of confusion with its separate code of ethics adopted pursuant to Rule 17j-1 under the Investment Company Act of 1940, as amended.)
Item 3. Audit Committee Financial Expert.
The registrant’s Board has determined that the following person serving on the registrant’s Audit committee is an “audit committee financial expert” as defined in item 3 of Form N-CSR: Alan S. Bernikow. Mr. Bernikow is independent as defined in item 3 of Form N-CSR.
Item 4. Principal Accountant Fees and Services.
(a) Audit Fees:
For the fiscal years ended August 31, 2016 and August 31, 2015, the aggregate Ernst & Young LLP (E&Y) audit fees for professional services rendered to the registrant were approximately $68,212 and $69,698, respectively.
Fees included in the audit fees category are those associated with the annual audits of financial statements and services that are normally provided in connection with statutory and regulatory filings.
(b) Audit-Related Fees:
In each of the fiscal years ended August 31, 2016 and August 31, 2015, the aggregate audit-related fees billed by E&Y for services rendered to the registrant that are reasonably related to the performance of the audits of the financial statements, but not reported as audit fees, were approximately $2,910 and $3,000, respectively.
Fees included in the audit-related category are those associated with (1) the reading and providing of comments on the 2016 and 2015 semiannual financial statements and (2) review of the consolidated 2014 reports on the profitability of the UBS Funds to UBS Asset Management (US) Inc. and its affiliates to assist the board members in their annual advisory/administration contract and service/distribution plan reviews.
There were no audit-related fees required to be approved pursuant to paragraph (c)(7)(ii) of Rule 2-01 of Regulation S-X during the fiscal years indicated above.
(c) Tax Fees:
In each of the fiscal years ended August 31, 2016 and August 31, 2015, the aggregate tax fees billed by E&Y for professional services rendered to the registrant were approximately $16,580 and $16,900, respectively.
Fees included in the tax fees category comprise all services performed by professional staff in the independent accountant’s tax division except those services related to the audits. This category comprises fees for review of tax compliance, tax return preparation and excise tax calculations.
There were no tax fees required to be approved pursuant to paragraph (c)(7)(ii) of Rule 2-01 of Regulation S-X during the fiscal years indicated above.
(d) All Other Fees:
In each of the fiscal years ended August 31, 2016 and August 31, 2015, there were no fees billed by E&Y for products and services, other than the services reported in Item 4(a)-(c) above, rendered to the registrant.
Fees included in the all other fees category would consist of services related to internal control reviews, strategy and other consulting, financial information systems design and implementation, consulting on other information systems, and other tax services unrelated to the registrant.
There were no “all other fees” required to be approved pursuant to paragraph (c)(7)(ii) of Rule 2-01 of Regulation S-X during the fiscal years indicated above.
(e) (1) Audit Committee Pre-Approval Policies and Procedures:
The registrant’s Audit Committee (“audit committee”) has adopted an “Audit Committee Charter (Amended and Restated as of May 12, 2004 — with revisions through July 2013)” (the “charter”). The charter contains the audit committee’s pre-approval policies and procedures. Reproduced below is an excerpt from the charter regarding pre-approval policies and procedures:
The [audit]Committee shall:
…
2. Pre-approve (a) all audit and permissible non-audit services (1) to be provided to the Fund and (b) all permissible non-audit services to be provided by the Fund’s independent auditors to UBS [Asset Management (Americas) Inc. (“UBS AM”)] and any Covered Service Providers, if the engagement relates directly to the operations and financial reporting of the Fund. In carrying out this responsibility, the Committee shall seek periodically from UBS [AM] and from the independent auditors a list of such audit and permissible non-audit services that can be expected to be rendered to the Fund, UBS [AM] or any Covered Service Providers by the Fund’s independent auditors, and an estimate of the fees sought to be paid in connection with such services. The Committee may delegate its responsibility to pre-approve any such audit and permissible non-audit services to a sub-committee consisting of the Chairperson of the Committee and two other members of the Committee as
the Chairperson, from time to time, may determine and appoint, and such sub-committee shall report to the Committee, at its next regularly scheduled meeting after the sub-committee’s meeting, its decision(s). From year to year, the Committee shall report to the Board whether this system of pre-approval has been effective and efficient or whether this Charter should be amended to allow for pre-approval pursuant to such policies and procedures as the Committee shall approve, including the delegation of some or all of the Committee’s pre-approval responsibilities to other persons (other than UBS [AM] or the Fund’s officers).
(1) The Committee will not approve non-audit services that the Committee believes may taint the independence of the auditors. Currently, permissible non-audit services include any professional services (including tax services) that are not prohibited services as described below, provided to the Fund by the independent auditors, other than those provided to the Fund in connection with an audit or a review of the financial statements of the Fund. Permissible non-audit services may not include: (i) bookkeeping or other services related to the accounting records or financial statements of the Fund; (ii) financial information systems design and implementation; (iii) appraisal or valuation services, fairness opinions or contribution-in-kind reports; (iv) actuarial services; (v) internal audit outsourcing services; (vi) management functions or human resources; (vii) broker or dealer, investment adviser or investment banking services; (viii) legal services and expert services unrelated to the audit; and (ix) any other service the Public Company Accounting Oversight Board determines, by regulation, is impermissible.
Pre-approval by the Committee of any permissible non-audit services is not required so long as: (i) the aggregate amount of all such permissible non-audit services provided to the Fund, UBS [AM] and any service providers controlling, controlled by or under common control with UBS [AM] that provide ongoing services to the Fund (“Covered Service Providers”) constitutes not more than 5% of the total amount of revenues paid to the independent auditors (during the fiscal year in which the permissible non-audit services are provided) by (a) the Fund, (b) its investment adviser and (c) any entity controlling, controlled by, or under common control with the investment adviser that provides ongoing services to the Fund during the fiscal year in which the services are provided that would have to be approved by the Committee; (ii) the permissible non-audit services were not recognized by the Fund at the time of the engagement to be non-audit services; and (iii) such services are promptly brought to the attention of the Committee and approved by the Committee (or its delegate(s)) prior to the completion of the audit.
(e) (2) Services approved pursuant to paragraph (c)(7)(i)(C) of Rule 2-01 of Regulation S-X:
Audit-Related Fees:
There were no amounts that were approved by the audit committee pursuant to the de minimis exception for the fiscal years ended August 31, 2016 and August 31, 2015 on behalf of the registrant.
There were no amounts that were required to be approved by the audit committee pursuant to the de minimis exception for the fiscal years ended August 31, 2016 and August 31, 2015 on behalf of the registrant’s service providers that relate directly to the operations and financial reporting of the registrant.
Tax Fees:
There were no amounts that were approved by the audit committee pursuant to the de minimis exception for the fiscal years ended August 31, 2016 and August 31, 2015 on behalf of the registrant.
There were no amounts that were required to be approved by the audit committee pursuant to the de minimis exception for the fiscal years ended August 31, 2016 and August 31, 2015 on behalf of the registrant’s service providers that relate directly to the operations and financial reporting of the registrant.
All Other Fees:
There were no amounts that were approved by the audit committee pursuant to the de minimis exception for the fiscal years ended August 31, 2016 and August 31, 2015 on behalf of the registrant.
There were no amounts that were required to be approved by the audit committee pursuant to the de minimis exception for the fiscal years ended August 31, 2016 and August 31, 2015 on behalf of the registrant’s service providers that relate directly to the operations and financial reporting of the registrant.
(a) For the fiscal year ended August 31, 2016, if greater than 50%, specify the percentage of hours spent on the audit of the registrant’s financial statements for the most recent fiscal year that were attributed to work performed by persons who are not full-time, permanent employees of E&Y. According to E&Y, such amount was below 50%; therefore, disclosure item not applicable for this filing.
(b) For the fiscal years ended August 31, 2016 and August 31, 2015, the aggregate fees billed by E&Y of $271,730 and $322,436, respectively, for non-audit services rendered on behalf of the registrant (“covered”), its investment adviser (not including any sub-adviser whose role is primarily portfolio management and is subcontracted with or overseen by another investment adviser) and any entity controlling, controlled by, or under common control with the adviser (“non-covered”) that provides (or provided during the relevant fiscal period) services to the registrant for each of the last two fiscal years of the registrant is shown in the table below:
| | 2016 | | 2015 | |
Covered Services | | $ | 19,490 | | $ | 19,900 | |
Non-Covered Services | | 252,240 | | 302,536 | |
| | | | | | | |
(h) The registrant’s audit committee was required to consider whether the provision of non-audit services that were rendered to the registrant’s investment adviser (not including any sub-adviser whose role is primarily portfolio management and is subcontracted with or overseen
by another investment adviser), and any entity controlling, controlled by, or under common control with the investment adviser that provides ongoing services to the registrant that were not pre- approved pursuant to paragraph (c)(7)(ii) of Rule 2-01 of Regulation S-X is compatible with maintaining the principal accountant’s independence.
Item 5. Audit Committee of Listed Registrants.
Not applicable to the registrant.
Item 6. Schedule of Investments.
(a) Included as part of the report to shareholders filed under Item 1 of this form.
(b) Not applicable.
Item 7. Disclosure of Proxy Voting Policies and Procedures for Closed-End Management Investment Companies.
Not applicable to the registrant.
Item 8. Portfolio Managers of Closed-End Management Investment Companies.
Not applicable to the registrant.
Item 9. Purchases of Equity Securities by Closed-End Management Investment Company and Affiliated Purchasers.
Not applicable to the registrant.
Item 10. Submission of Matters to a Vote of Security Holders.
The registrant’s Board has established a Nominating and Corporate Governance Committee. The Nominating and Corporate Governance Committee will consider nominees recommended by shareholders if a vacancy occurs among those board members who are not “interested persons” as defined in Section 2(a)(19) of the Investment Company Act of 1940, as amended. In order to recommend a nominee, a shareholder should send a letter to the chairperson of the Nominating and Corporate Governance Committee, Richard R. Burt, care of the Secretary of the registrant at UBS Asset Management, UBS Building, One North Wacker Drive, Chicago, IL 60606, Attn: Mark Kemper, Secretary, and indicate on the envelope “Nominating and Corporate Governance Committee.�� The shareholder’s letter should state the nominee’s name and should include the nominee’s resume or curriculum vitae, and must be accompanied by a written consent of the individual to stand for election if nominated for the Board and to serve if elected by shareholders.
Item 11. Controls and Procedures.
(a) The registrant’s principal executive officer and principal financial officer have concluded that the registrant’s disclosure controls and procedures (as defined in Rule 30a-3(c) under the Investment Company Act of 1940, as amended) are effective based on their evaluation of these controls and procedures as of a date within 90 days of the filing date of this document.
(b) The registrant’s principal executive officer and principal financial officer are aware of no changes in the registrant’s internal control over financial reporting that occurred during the registrant’s most recent fiscal half-year that has materially affected, or is reasonably likely to materially affect, the registrant’s internal control over financial reporting.
Item 12. Exhibits.
(a) (1) Code of Ethics as required pursuant to Section 406 of the Sarbanes-Oxley Act of 2002 (and designated by the registrant as a “Code of Conduct”) is filed herewith as Exhibit Ex-99.CODE ETH.
(a) (2) Certifications of principal executive officer and principal financial officer pursuant to Section 302 of the Sarbanes-Oxley Act of 2002 are attached hereto as Exhibit EX-99.CERT.
(a) (3) Written solicitation to purchase securities under Rule 23c-1 under the Investment Company Act of 1940 sent or given during the period covered by the report by or on behalf of the registrant to 10 or more persons — not applicable to the registrant.
(b) Certifications of principal executive officer and principal financial officer pursuant to Section 906 of the Sarbanes-Oxley Act of 2002 are attached hereto as Exhibit EX-99.906CERT.
(c) Disclosure pursuant to Section 13(r) of the Securities Exchange Act of 1934, as amended, is attached hereto as Exhibit EX-99.IRANNOTICE.
SIGNATURES
Pursuant to the requirements of the Securities Exchange Act of 1934 and the Investment Company Act of 1940, the registrant has duly caused this report to be signed on its behalf by the undersigned, thereunto duly authorized.
UBS Investment Trust
By: | /s/ Mark E. Carver | |
| Mark E. Carver | |
| President | |
| | |
Date: | November 07, 2016 | |
Pursuant to the requirements of the Securities Exchange Act of 1934 and the Investment Company Act of 1940, this report has been signed below by the following persons on behalf of the registrant and in the capacities and on the dates indicated.
By: | /s/ Mark E. Carver | |
| Mark E. Carver | |
| President | |
| | |
Date: | November 07, 2016 | |
| | |
By: | /s/ Thomas Disbrow | |
| Thomas Disbrow | |
| Vice President and Treasurer | |
| | |
Date: | November 07, 2016 | |