UNITED STATES
SECURITIES AND EXCHANGE COMMISSION
Washington, D.C. 20549
FORM N-CSR
CERTIFIED SHAREHOLDER REPORT OF REGISTERED
MANAGEMENT INVESTMENT COMPANIES
Investment Company Act file number: 811-06292
______________________________________________
| UBS Investment Trust |
| |
| (Exact name of registrant as specified in charter) |
| |
| 1285 Avenue of the Americas, New York, New York 10019-6028 |
| |
| (Address of principal executive offices) (Zip code) |
Mark F. Kemper, Esq.
UBS Global Asset Management
1285 Avenue of the Americas
New York, NY 10019-6028
(Name and address of agent for service)
Copy to:
Jack W. Murphy, Esq.
Dechert LLP
1900 K Street, N.W.
Washington, DC 20006
Registrant’s telephone number, including area code: 212-821 3000
Date of fiscal year end: August 31
Date of reporting period: August 31, 2013
Item 1. Reports to Stockholders.

| Asset Allocation | August 31, 2013 |
UBS U.S. Allocation Fund
Annual Report
August 31, 2013
UBS U.S. Allocation Fund
October 15, 2013
Dear shareholder,
We present you with the annual report for UBS U.S. Allocation Fund (the “Fund”) for the 12 months ended August 31, 2013.
Performance
Over the 12 months ended August 31, 2013, the Fund’s Class A shares returned 12.92% before deducting the maximum sales charge, and 6.73% after deducting the maximum sales charge. During the same period, the Fund’s benchmark, the S&P 500 Index, which tracks large cap US equities, returned 18.70%. Since the Fund invests in both stocks and bonds, we believe it is appropriate to also compare its performance to the UBS U.S. Allocation Fund Index (the “Index”),1 which returned 12.47% during the period. (Returns for all share classes over various time periods and descriptions of the indexes are shown in “Performance at a glance” on pages 7 to 8; please note that the returns shown do not reflect the deduction of taxes that a shareholder would pay on Fund distributions or on the redemption of Fund shares.)
An interview with Lead Portfolio Manager Curt Custard |
| Q. | | How would you describe the economic environment during the reporting period? |
| A. | | While the overall US economy continued to grow during the reporting period, the pace of the expansion was far from robust. The Commerce Department reported that gross domestic product (“GDP”) growth was 2.8% during the third quarter of 2012 and decelerated to 0.1% in the fourth quarter. However, the economy regained some traction, as GDP grew 1.1% during the first three months of 2013. The Commerce Department’s third estimate for second quarter 2013 GDP growth was 2.5%, 2 which was the same as its previous estimate. |
UBS U.S. Allocation Fund
Investment goal:
Total return, consisting of
long-term capital appreciation
and current income
Portfolio Managers:
Portfolio Management Team,
including Curt Custard,
Andreas Koester and
Jon Adams
UBS Global Asset
Management (Americas) Inc.
Commencement:
Class A—May 10, 1993
Class C—July 22, 1992
Class Y—May 10, 1993
Dividend payments:
Annually, if any
| Q. | | How did the Federal Reserve Board (the “Fed”) react to the economic environment? |
| A. | | The Fed took a number of actions during the reporting period, as it looked to meet its dual mandate of price stability and maximum employment. Throughout the reporting period, the Fed kept the federal funds rate at an extremely low level between 0% and 0.25% and, on several occasions, extended the period it expected to keep the fed funds rate on hold. In September 2012, the Fed launched a third round of quantitative easing (“QE3”), which involved purchasing $40 billion of agency mortgage-backed securities (“MBS”) on an open-ended basis each month. |
| |
| | At its final meeting of 2012, in December, the Fed said it would continue buying $40 billion a month of agency MBS, as well as purchase $45 billion a month of longer-term Treasuries. The Fed also said that it would keep the federal funds rate on hold “…as long as the unemployment rate remains above 6.5%,” provided inflation remains well-contained.” |
1 The UBS U.S. Allocation Fund Index is an unmanaged index compiled by the Advisor, constructed as follows: from July 22, 1992 (the Fund’s inception) until February 29, 2004: 100% S&P 500 Index; from March 1, 2004 until May 31, 2005: 65% Russell 3000 Index, 30% Barclays US Aggregate Index, and 5% BofA Merrill Lynch US High Yield Cash Pay Index; and from June 1, 2005 until present: 65% Russell 3000 Index, 30% Barclays US Aggregate Index, and 5% BofA Merrill Lynch US High Yield Cash Pay Constrained Index. Investors should note that indices do not reflect the deduction of fees and expenses.
2 Based on the Commerce Department’s third estimate announced on September 26, 2013, after the Fund’s reporting period had ended.
UBS U.S. Allocation Fund
| | While the Fed has not materially changed its official policy stance thus far in 2013, in his press conference following the Fed’s meeting in June, Fed Chairman Ben Bernanke said “…the Committee currently anticipates that it would be appropriate to moderate the monthly pace of purchases later this year; and if the subsequent data remain broadly aligned with our current expectations for the economy, we would continue to reduce the pace of purchases in measured steps through the first half of next year, ending purchases around midyear.” This triggered a substantial sell-off in the fixed income market, as Treasury yields rose sharply and bond prices declined. However, at its meeting that concluded on September 18, 2013, after the reporting period ended, the Fed chose to delay the tapering of its asset purchases, saying that it “…decided to await more evidence that progress will be sustained before adjusting the pace of its purchases.” |
| |
| Q. | | How did the stock market perform during the reporting period? |
| A. | | Despite periods of heightened volatility and a late setback, US equities produced very strong results during the reporting period. Continued positive economic growth, overall solid corporate profits and largely robust demand supported the market. While US equities initially sold off after the Fed’s comments about tapering its asset purchase program, it quickly regained its footing. However, the market experienced another modest setback late in the reporting period, given renewed concerns about Fed monetary policy and several geopolitical issues. All told, the US stock market, as measured by the S&P 500 Index, returned 18.70% during the 12 months ended August 31, 2013. |
| |
| Q. | | How did the bond market perform during the reporting period? |
| A. | | US Treasury yields moved higher during the reporting period and negatively impacted the overall bond market (yields and bond prices move in the opposite direction). Increasing investor concerns about the commitment of the Fed to its quantitative easing program caused yields to move sharply higher over the last four months of the reporting period. Against this backdrop, a number of US taxable spread sectors (non-US Treasury fixed income securities) produced either negative returns or only modest gains during the reporting period. The overall US bond market, as measured by the Barclays US Aggregate Index, declined 2.47% during the reporting period. In contrast, riskier high yield bonds generated strong results, with the BofA Merrill Lynch US High Yield Cash Pay Constrained Index returning 7.44% during the 12 months ended August 31, 2013 |
| |
| Q. | | How was the Fund allocated during the reporting period?3 |
| A. | | Throughout the reporting period, we adjusted the portfolio given changing economic and market conditions. We began the period underweight to equities versus the Index, with a 60% allocation, as we believed that the asset class was, in general, overvalued. At the same time, we were underweight fixed income, with a 24% allocation to US investment grade bonds, a 7% allocation to US high yield bonds and a 9% cash position. |
| |
| | At the end of the reporting period, the Fund was allocated as follows: US equities—66%; US investment grade bonds—19.5%; US high yield bonds—7%; cash—7.5%. For comparison purposes, neutral Index weights for the Fund are 65% equities and 35% fixed income. |
| |
| | From a strategy perspective, we increased the Fund’s equity exposure early in the reporting period, as Fed policy accommodation continued and global growth expectations improved. At its peak, our equity exposure was 67.5% from the end of December 2012 through mid-February 2013 and again from June 2013 until the end of the 12-month period. Given the market’s strong performance, during the second half of the reporting period we chose to pare the Fund’s equity exposure at times to somewhat reduce the Fund’s overall risk exposure. |
| |
| | Throughout the period under review, we maintained an underweight in US fixed income, as we found it to be overvalued. Within the asset class, we maintained our bias to investment grade corporate bonds versus Treasuries. Elsewhere, we maintained an overweight to high yield bonds given their attractive yields, generally solid fundamentals and low defaults. |
3 Allocations include derivative exposure.
UBS U.S. Allocation Fund
| | Overall, asset allocation contributed to performance during the reporting period, largely driven by the Fund’s investment grade fixed income and, to a lesser extent, our equity positioning. In contrast, our strategic cash overweight was a drag on performance during the period. |
| |
| | Certain derivative instruments were used during the period. S&P 500 Index futures were used to manage our equity exposure. We used US Treasury futures to manage bond exposure and duration positioning. |
| |
| Q. | | What were positive contributors to Fund performance, and what were negative contributors? |
| A. | | In the US Equity Research portion of the Fund, stock selection contributed the most to performance. Sector positioning was also beneficial, albeit to a lesser extent. In terms of stock selection, our holdings in the healthcare, information technology and industrials sectors were the most beneficial for performance. However, this was partially offset by negative stock selection in the consumer discretionary sector. |
| |
| | The largest stock contributors in the portfolio were Morgan Stanley, Citigroup, Inc. and Hertz Global Holdings, Inc. Shares of global financial services companies Morgan Stanley and Citigroup sharply rallied, as investment sentiment for both firms improved during the reporting period. This was triggered by strengthening balance sheets, an improving housing market and rising expectations that the federal government would soon allow the companies to return capital to investors in the form of increased dividends and share buybacks. An overweight position in car rental company Hertz Global Holdings was beneficial for results as its shares moved higher during the reporting period. The market continued to positively react to Hertz Global Holdings’ acquisition of Dollar Thrifty Automotive Group in November 2012. In addition, Hertz Global Holdings forecast increased future revenues, declining per-unit fleet costs, increased free cash flow and higher margins. Furthermore, Hertz Global Holdings announced that it had come to an agreement to invest in China Auto Rental, China’s domestic market leader in short and long-term car rentals. On the downside, overweight positions in McDermott International, American Capital Agency and Coach Inc. were among the largest detractors from results. McDermott International offers a wide range of engineering and construction services to the offshore oil and gas industry. Its core business is building and installing production platforms anchored to the ground in shallow waters. Its shares declined amid repeated cost overruns at various projects. The company has acknowledged underperforming its own expectations and is taking steps to remedy its business, including bolstering its project oversight and management, and as such, we continue to hold our position in McDermott International. American Capital Agency is a mortgage real estate investment trust (“REIT”). Its shares, along with the overall REIT market, fell sharply after the Fed indicated that it may soon begin tapering its asset purchase program. We continue to hold this stock as it trades at an attractive valuation and still yields a high dividend. Coach, Inc. is an American luxury leather goods company. Coach, Inc.’s shares declined as the company reported that its fiscal fourth quarter profits fell 12% due, in part, to increasing competition. We continue to hold our position in Coach, Inc. as we believe the long-term value in the business is still strong. |
| |
| | From a sector positioning perspective, underweights to information technology and consumer staples, along with an overweight to consumer discretionary were the largest contributors to relative performance. Conversely, an underweight to financials slightly detracted from relative results. |
| |
| | In the US Growth Equity portion of the Fund, stock selection contributed to performance, while sector positioning modesty detracted from results. In terms of stock selection, the Fund’s holdings in the information technology, healthcare and energy sectors were the most beneficial for performance. However, this was partially offset by negative stock selection in the consumer discretionary, industrials and telecommunication services sectors. |
UBS U.S. Allocation Fund
| | Looking at individual stocks, Gilead Sciences, Inc., Facebook, Inc. and Visa, Inc. were the largest contributors to results. Shares of healthcare company Gilead Sciences rallied, as investor enthusiasm increased around the company’s all oral hepatitis C virus product, as well as solid early demand for its new HIV product. Shares of social media leader Facebook performed well after the company released a strong second quarter 2013 earnings report that showed acceleration in mobile advertisement revenue. Additionally, increasing likelihood of video advertising at Facebook could bolster the company’s advertising platform. Visa is the leading provider of debit processing to US card issuers. Visa’s shares rallied due to positive data on card-based consumer spending within the US, along with a positive outlook for long-term growth opportunities that were outlined by the company. |
| |
| | Monster Beverage Corp., Realogy Holdings Corp. and Baidu, Inc. were among the largest detractors from results during the reporting period. Monster Beverage markets and distributes energy drinks under the Monster brand. Its shares performed poorly due to increased scrutiny in the energy drink market and allegations around the safety of Monster’s beverages. Despite its poor performance, we continue to hold our position in Monster as we believe the regulator overhand is lifting, which should allow for valuations to improve as investors pay more attention to the company’s earnings, growth and durability of future cash flows. Realogy Holdings operates and franchises residential real estate brokerages that primarily deal with existing home sales. The company’s shares declined after several builders indicated a moderate softening of demand in the entry level buyer category in response to sharply rising mortgage rates in May and June 2013. However, Realogy Holdings did not observe any weakness in its business and forecasted that third quarter transaction volume would likely grow nearly 20% year-over-year. We initiated our position in Realogy in May 2013 and have been adding to it ever since, at attractive risk/rewards, as we believe that the company will benefit from a multi-year recovery in housing unit sales. Operating leverage, net operating losses, declining interest expense and low capital intensity will enable Realogy to generate a high level of free cash relative to its share price under a range of scenarios. Baidu is a Chinese web services company that saw its shares fall on worries over China’s economic slowdown and increased competition from browser/security company Qihoo 360’s. Baidu’s shares further declined as US regulators raised issues with certain Chinese accounting practices. We sold out of our position in Baidu during the fourth quarter of 2012 in an effort to manage risk, as we viewed regulatory issues as increasing the changes for a binary event. |
| |
| | From a sector positioning perspective, an overweight to information technology and underweights to financials and materials were the largest detractors from relative results. Conversely, overweights to consumer discretionary and healthcare, and an underweight to consumer staples, contributed to relative performance. |
| |
| Q. | | How did you manage the Fund’s fixed income exposure during the reporting period? |
| A. | | The Fund’s fixed income exposure was positive for performance during the 12-month period. In particular, the portfolio benefited from its overweight exposure to high yield corporate bonds. The sector delivered positive excess returns versus comparable duration Treasuries during the reporting period. On the downside, the Fund’s US Treasury exposure was a negative for performance, as yields rose across the curve during the 12-month period. The Fund’s cash position was also a drag on results. Elsewhere, duration and yield curve positioning did not significantly impact the Fund’s results. (Duration measures the price sensitivity of a portfolio to interest rate change, and the yield curve plots the interest rates, at a set point in time, of bonds having equal credit quality, but differing maturity dates.) |
| |
| | Certain derivative instruments, including interest rate futures, were used to facilitate specific duration and yield curve strategies. US Treasury futures were used to adjust the Fund’s duration positioning. In addition, we implemented an inflation-linked swap position in October 2012 to express our view that market expectations for inflation in the US were too high. Our usage of fixed income derivatives positively contributed to performance during the reporting period. Specifically, our short duration positioning (through bond futures) was beneficial for performance. Our inflation-linked swap position also positively contributed to performance as inflation expectations in the US came down. However, we closed our inflation-linked swap position at the end of May 2013. |
UBS U.S. Allocation Fund
| Q. | | What is your outlook for the US economy? |
| A. | | The US economy is clearly on better footing than was the case a year ago. In particular, the housing market shows continued signs of improvement and the unemployment rate has moderated somewhat. That said, we will continue to closely monitor incoming economic data to determine the impact of higher interest rates on consumer and business spending. Moderating global growth could also negatively impact US exports. Against this backdrop, we believe that the economy will continue to expand, albeit at a modest pace. |
| |
| | We continue to weigh political uncertainty in the US against the backdrop of very easy monetary policy, which has been supportive of risk assets. We expect periods of elevated volatility around the debt ceiling and continuing resolution talks in the fall. |
| |
| | We currently view US equities as being modestly overvalued and fixed income as being significantly overvalued. Given uncertainties related to the timing and magnitude of the Fed’s asset purchasing tapering and a number of global macro issues, we expect to see periods of continued market volatility as the year progresses. |
We thank you for your continued support and welcome any comments or questions you may have. For additional information on the UBS family of funds,* please contact your financial advisor or visit us at www.ubs.com/globalam-us.
Sincerely,
 | |  |
| Mark E. Carver | | Curt Custard |
| President | | Lead Portfolio Manager |
| UBS U.S. Allocation Fund | | UBS U.S. Allocation Fund |
| Managing Director | | Head of Asset Allocation |
| UBS Global Asset Management | | UBS Global Asset Management |
| (Americas) Inc. | | (Americas) Inc. |
This letter is intended to assist shareholders in understanding how the Fund performed during the 12 months ended August 31, 2013. The views and opinions in the letter were current as of October 15, 2013. They are not guarantees of future performance or investment results and should not be taken as investment advice. Investment decisions reflect a variety of factors, and we reserve the right to change our views about individual securities, sectors and markets at any time. As a result, the views expressed should not be relied upon as a forecast of the Fund’s future investment intent. We encourage you to consult your financial advisor regarding your personal investment program.
* Mutual funds are sold by prospectus only. You should read it carefully and consider a fund’s investment objectives, risks, charges, expenses and other important information contained in the prospectus before investing. The prospectus contains this and other information about the fund. Prospectuses for most of our funds can be obtained from your Financial Advisor, by calling UBS Funds at 800-647 1568 or by visiting our Web site at www.ubs.com/globalam-us.
UBS U.S. Allocation Fund
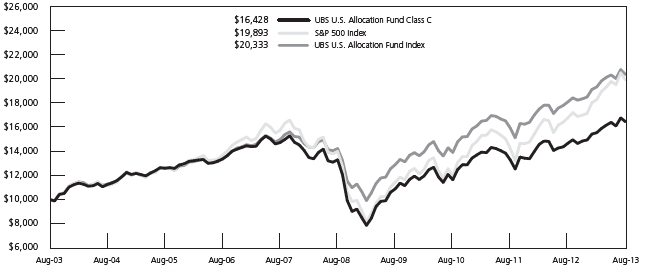
Illustration of an assumed investment of $10,000 in Class C shares of the Fund (unaudited)
The following graph depicts the performance of UBS U.S. Allocation Fund Class C shares versus the S&P 500 Index and the UBS U.S. Allocation Fund Index over the 10 years ended August 31, 2013. The performance of the other classes will vary based upon the different class specific expenses and sales charges. The performance provided does not reflect the deduction of taxes that a shareholder would pay on Fund distributions or the redemption of Fund shares. Past performance is no guarantee of future results. Share price and returns will vary with market conditions; investors may realize a gain or loss upon redemption. It is important to note that the Fund is a professionally managed portfolio while the Indices are not available for investment and are unmanaged. The comparison is shown for illustration purposes only.
UBS U.S. Allocation Fund
Performance at a glance (unaudited)
Average annual total returns for periods ended 08/31/13
| | | | 1 year | | 5 years | | 10 years |
| | Class A1 | | | 12.92 | % | | | 5.14 | % | | | 5.88 | % |
| Before deducting maximum sales charge | | Class C2 | | | 12.06 | | | | 4.34 | | | | 5.09 | |
| | Class Y3 | | | 13.24 | | | | 5.47 | | | | 6.23 | |
| After deducting maximum sales charge | | Class A1 | | | 6.73 | | | | 3.96 | | | | 5.29 | |
| | | Class C2 | | | 11.06 | | | | 4.34 | | | | 5.09 | |
| S&P 500 Index4 | | | | | 18.70 | | | | 7.32 | | | | 7.12 | |
| UBS U.S. Allocation Fund Index5 | | | | | 12.47 | | | | 7.42 | | | | 7.35 | |
| Lipper Flexible Portfolio Funds median | | | | | 4.14 | | | | 5.13 | | | | 6.37 | |
| |
Most recent quarter-end returns (unaudited)
Average annual total returns for periods ended 09/30/13 |
| | | | | | | | | | | | | | | |
| | | | 1 year | | 5 years | | 10 years |
| | Class A1 | | | 13.76 | % | | | 7.75 | % | | | 6.29 | % |
| Before deducting maximum sales charge | | Class C2 | | | 12.93 | | | | 6.95 | | | | 5.50 | |
| | Class Y3 | | | 14.13 | | | | 8.10 | | | | 6.64 | |
| After deducting maximum sales charge | | Class A1 | | | 7.50 | | | | 6.54 | | | | 5.69 | |
| | Class C2 | | | 11.93 | | | | 6.95 | | | | 5.50 | |
The annualized gross and net expense ratios, respectively, for each class of shares as in the December 29, 2012 prospectus, were as follows: Class A— 1.03% and 1.03%; Class C— 1.79% and 1.79%; and Class Y— 0.75% and 0.75%.
Net expenses reflect fee waivers and/or expense reimbursements, if any, pursuant to an agreement that is in effect to cap the expenses. The Fund and UBS Global Asset Management (Americas) Inc. (“UBS Global AM”) have entered into a written agreement, separate from UBS Global AM’s investment advisory agreement with the Fund, whereby UBS Global AM has agreed to permanently reduce its management fees based on the Fund’s average daily net assets to the following rates: $0 to $250 million: 0.50%; in excess of $250 million up to $500 million: 0.45%; in excess of $500 million up to $2 billion: 0.40%; over $2 billion: 0.35%. Effective December 29, 2012, UBS Global AM has contractually undertaken to waive fees/reimburse a portion of the Fund’s expenses, when necessary, so that the ordinary total annual operating expenses of each class through December 31, 2013 (excluding dividend expense, borrowing costs and interest expense relating to short sales, and expenses attributable to investments in other investment companies, interest, taxes, brokerage commissions and extraordinary expenses, if any) would not exceed 1.15% for Class A, 1.90% for Class C and 0.90% for Class Y.
1 Maximum sales charge for Class A shares is 5.5%. Class A shares bear ongoing 12b-1 service fees.
2 Maximum contingent deferred sales charge for Class C shares is 1% imposed on redemptions and is reduced to 0% after one year. Class C shares bear ongoing 12b-1 distribution and service fees. Prior to September 30, 2003, Class C shares were subject to a maximum front-end sales charge of 1.00%; this front-end sales charge is not reflected in the average annual total return presented for the Class C shares shown above.
3 The Fund offers Class Y shares to a limited group of eligible investors, including certain qualifying retirement plans. Class Y shares do not bear initial or contingent deferred sales charges or ongoing 12b-1 distribution and service fees.
4 The S&P 500 Index is an unmanaged, weighted index comprising 500 widely held common stocks varying in composition and is not available for direct investment. Investors should note that indices do not reflect the deduction of fees and expenses.
5 The UBS U.S. Allocation Fund Index is an unmanaged index compiled by the Advisor, constructed as follows: from July 22, 1992 (the Fund’s inception) until February 29, 2004: 100% S&P 500 Index; from March 1, 2004 until May 31, 2005: 65% Russell 3000 Index, 30% Barclays US Aggregate Index, and 5% BofA Merrill Lynch US High Yield Cash Pay Index; and from June 1, 2005 until present: 65% Russell 3000 Index, 30% Barclays US Aggregate Index, and 5% BofA Merrill Lynch US High Yield Cash Pay Constrained Index. Investors should note that indices do not reflect the deduction of fees and expenses.
UBS U.S. Allocation Fund
Performance at a glance (unaudited) (concluded)
If an investor sells or exchanges shares less than 90 days after purchase, a redemption fee of 1.00% of the amount sold or exchanged will be deducted at the time of the transaction, except as noted otherwise in the prospectus.
Past performance does not predict future performance, and the performance information provided does not reflect the deduction of taxes that a shareholder would pay on Fund distributions or the redemption of Fund shares. The return and principal value of an investment will fluctuate, so that an investor’s shares, when redeemed, may be worth more or less than their original cost. Performance results assume reinvestment of all dividends and capital gain distributions at net asset value on the ex-dividend dates. Current performance may be higher or lower than the performance data quoted. For month-end performance figures, please visit http://globalam-us.ubs.com/corpweb/performance.do.
Lipper peer group data calculated by Lipper Inc.; used with permission. The Lipper median is the return of the fund that places in the middle of a Lipper peer group.
UBS U.S. Allocation Fund
Understanding your Fund’s expenses (unaudited)
As a shareholder of the Fund, you incur two types of costs: (1) transactional costs (as applicable), including sales charges (loads); and (2) ongoing costs, including management fees; service and/or distribution (12b-1) fees (if applicable); and other Fund expenses. This example is intended to help you understand your ongoing costs (in dollars) of investing in the Fund and to compare these costs with the ongoing costs of investing in other mutual funds.
The example below is based on an investment of $1,000 invested at the beginning of the period and held for the entire period, March 1, 2013 to August 31, 2013.
Actual expenses (unaudited)
The first line for each class of shares in the table below provides information about actual account values and actual expenses. You may use the information in this line, together with the amount you invested, to estimate the expenses that you paid over a period. Simply divide your account value by $1,000 (for example, an $8,600 account value divided by $1,000 = 8.6), then multiply the result by the number in the first line for each class of shares under the heading entitled “Expenses paid during period” to estimate the expenses you paid on your account during this period.
Hypothetical example for comparison purposes (unaudited)
The second line for each class of shares in the table below provides information about hypothetical account values and hypothetical expenses based on the Fund’s actual expense ratios for each class of shares and an assumed rate of return of 5% per year before expenses, which is not the Fund’s actual return for each class of shares. The hypothetical account values and expenses may not be used to estimate the actual ending account balance or expenses you paid for the period. You may use this information to compare the ongoing costs of investing in the Fund and other funds. To do so, compare this 5% hypothetical example with the 5% hypothetical examples that appear in the shareholder reports of other funds.
Please note that the expenses shown in the table are meant to highlight your ongoing Fund costs only and do not reflect any transactional costs (as applicable), such as sales charges (loads). Therefore, the second line in the table for each class of shares is useful in comparing ongoing Fund costs only, and will not help you determine the relative total costs of owning different funds. In addition, if these transactional costs were included, your costs would have been higher.
| Beginning
account value
March 1,
2013 | | Ending
account value
August 31,
2013 | | Expenses paid
during period1
03/01/13 to
08/31/13 | | Expense
ratio
during the
period |
| Class A Actual | | $1,000.00 | | | | $1,062.10 | | | | $5.30 | | | | 1.02 | % | |
| Hypothetical (5% annual return before expenses) | | 1,000.00 | | | | 1,020.06 | | | | 5.19 | | | | 1.02 | | |
| Class C Actual | | 1,000.00 | | | | 1,058.10 | | | | 9.23 | | | | 1.78 | | |
| Hypothetical (5% annual return before expenses) | | 1,000.00 | | | | 1,016.23 | | | | 9.05 | | | | 1.78 | | |
| Class Y Actual | | 1,000.00 | | | | 1,063.50 | | | | 3.90 | | | | 0.75 | | |
| Hypothetical (5% annual return before expenses) | | 1,000.00 | | | | 1,021.42 | | | | 3.82 | | | | 0.75 | | |
1 Expenses are equal to the Fund’s annualized net expense ratio, multiplied by the average account value over the period, multiplied by 184 divided by 365 (to reflect the one-half year period).
UBS U.S. Allocation Fund
Portfolio statistics (unaudited)
| Characteristics | | 08/31/13 | | | | 02/28/13 | | | | 08/31/12 |
| Net assets (mm) | | $254.8 | | | | $255.9 | | | | $262.3 |
| Number of securities | | 501 | | | | 589 | | | | 637 |
| |
| Portfolio composition1 | | 08/31/13 | | | | 02/28/13 | | | | 08/31/12 |
| Stocks | | 37.9 | % | | | | 51.9 | % | | | | 55.8 | % |
| Bonds and notes | | 25.4 | | | | | 25.2 | | | | | 24.7 | |
| Investment companies | | — | | | | | 4.5 | | | | | 4.2 | |
| Futures | | 0.2 | | | | | 0.9 | | | | | 0.2 | |
| Options and swaps | | — | | | | | 0.0 | 2 | | | | 0.1 | |
| Cash equivalents and other | | | | | | | | | | | | | |
| assets less liabilities | | 36.5 | | | | | 17.5 | | | | | 15.0 | |
| Total | | 100.0 | % | | | | 100.0 | % | | | | 100.0 | % |
| |
| Top five equity sectors1 | | 08/31/13 | | | | 02/28/13 | | | | 08/31/12 |
| Information technology | | 9.0 | % | | Information technology | | 14.0 | % | | Information technology | | 16.8 | % |
| Consumer discretionary | | 6.5 | | | Consumer discretionary | | 9.5 | | | Consumer discretionary | | 10.7 | |
| Industrials | | 5.5 | | | Health care | | 6.8 | | | Health care | | 6.8 | |
| Health care | | 5.2 | | | Industrials | | 6.7 | | | Industrials | | 6.0 | |
| Financials | | 4.4 | | | Energy | | 4.6 | | | Energy | | 5.2 | |
| Total | | 30.6 | % | | | | 41.6 | % | | | | 45.5 | % |
| |
| Top ten equity securities1 | | 08/31/13 | | | | 02/28/13 | | | | 08/31/12 |
| Apple, Inc. | | 1.6 | % | | Apple, Inc. | | 2.2 | % | | Apple, Inc. | | 4.2 | % |
| Mondelez International, Inc., Class A | | 0.8 | | | Amazon.com, Inc. | | 1.1 | | | Amazon.com, Inc. | | 1.7 | |
| Danaher Corp. | | 0.8 | | | Visa, Inc., Class A | | 1.1 | | | Visa, Inc., Class A | | 1.4 | |
| Amazon.com, Inc. | | 0.7 | | | Google, Inc., Class A | | 1.1 | | | Ralph Lauren Corp. | | 1.2 | |
| Gilead Sciences, Inc. | | 0.7 | | | QUALCOMM, Inc. | | 1.0 | | | QUALCOMM, Inc. | | 1.2 | |
| Citigroup, Inc. | | 0.6 | | | Gilead Sciences, Inc. | | 1.0 | | | NetApp, Inc. | | 1.1 | |
| Google, Inc., Class A | | 0.6 | | | UnitedHealth Group, Inc. | | 1.0 | | | Gilead Sciences, Inc. | | 1.1 | |
| Ralph Lauren Corp. | | 0.6 | | | Ralph Lauren Corp. | | 0.9 | | | Google, Inc., Class A | | 1.1 | |
| Check Point Software Technologies Ltd. | | 0.6 | | | Allergan, Inc. | | 0.9 | | | Allergan, Inc. | | 1.1 | |
| Halliburton Co. | | 0.6 | | | Dollar General Corp. | | 0.8 | | | UnitedHealth Group, Inc. | | 1.1 | |
| Total | | 7.6 | % | | | | 11.1 | % | | | | 15.2 | % |
1 Weightings represent percentages of the Fund’s net assets as of the dates indicated. The Fund’s portfolio is actively managed and its composition will vary over time.
2 Weighting represents less than 0.05% of the Fund’s net assets as of the dates indicated.
UBS U.S. Allocation Fund
Portfolio statistics (unaudited) (concluded)
Long-term fixed income
sector allocation1 | | 08/31/13 | | | | 02/28/13 | | | | 08/31/12 |
| Corporate bonds | | 11.0 | % | | | | 11.4 | % | | | | 11.1 | % |
| Mortgage & agency debt securities | | 7.4 | | | | | 6.7 | | | | | 6.5 | |
| US government obligations | | 4.9 | | | | | 4.7 | | | | | 5.1 | |
| Commercial mortgage-backed securities | | 1.2 | | | | | 1.5 | | | | | 1.2 | |
| Municipal bonds and notes | | 0.5 | | | | | 0.3 | | | | | 0.1 | |
| Collateralized mortgage obligations | | 0.3 | | | | | 0.6 | | | | | 0.6 | |
| Asset-backed security | | 0.1 | | | | | — | | | | | — | |
| Non-US government obligation | | — | | | | | — | | | | | 0.1 | |
| Total | | 25.4 | % | | | | 25.2 | % | | | | 24.7 | % |
| |
Top ten fixed income
securities1 | | 08/31/13 | | | | 02/28/13 | | | | 08/31/12 |
| US Treasury Notes, | | | | | US Treasury Notes, | | | | | US Treasury Notes, | | | |
| 0.250%, due 05/31/15 | | 1.6 | % | | 0.125%, due 12/31/14 | | 1.9 | % | | 0.250%, due 05/31/14 | | 3.3 | % |
| FNMA Certificate, | | | | | US Treasury Notes, | | | | | US Treasury Bonds, | | | |
| 3.500%, TBA | | 1.1 | | | 0.250%, due 11/30/14 | | 1.8 | | | 3.000%, due 05/15/42 | | 0.6 | |
| US Treasury Notes, | | | | | FNMA Certificates, | | | | | US Treasury Notes, | | | |
| 0.250%, due 11/30/14 | | 0.8 | | | 3.500%, TBA | | 0.6 | | | 0.500%, due 07/31/17 | | 0.6 | |
| US Treasury Notes, | | | | | US Treasury Bonds, | | | | | FHLMC Certificates, | | | |
| 1.000%, due 05/31/18 | | 0.4 | | | 3.125%, due 02/15/43 | | 0.6 | | | 3.000%, TBA | | 0.5 | |
| FNMA Certificate, | | | | | GNMA Certificates II, | | | | | FNMA Certificates, | | | |
| 4.500%, TBA | | 0.4 | | | 3.500%, due 08/20/42 | | 0.4 | | | 4.500%, due 09/01/37 | | 0.5 | |
| US Treasury Notes, | | | | | FNMA Certificates, | | | | | FHLMC Certificates, | | | |
| 0.125%, due 12/31/14 | | 0.4 | | | 4.500%, due 09/01/37 | | 0.4 | | | 5.500%, due 05/01/37 | | 0.4 | |
| GNMA Certificates I, | | | | | FHLMC Certificates, | | | | | FNMA Certificates, | | | |
| 4.500%, TBA | | 0.4 | | | 5.500%, due 05/01/37 | | 0.4 | | | 3.500%, TBA | | 0.4 | |
| US Treasury Bond, | | | | | FNMA Certificates, | | | | | GNMA Certificates II, | | | |
| 2.875%, due 05/15/43 | | 0.4 | | | 3.000%, TBA | | 0.3 | | | 3.500%, due 08/20/42 | | 0.4 | |
| FHLMC Certificate, | | | | | GNMA Certificates II, | | | | | FNMA Certificates, | | | |
| 4.000%, TBA | | 0.3 | | | 6.000%, due 02/20/34 | | 0.3 | | | 4.000%, TBA | | 0.3 | |
| US Treasury Notes, | | | | | GNMA Certificates I, | | | | | GNMA Certificates II, | | | |
| 1.875%, due 06/30/20 | | 0.3 | | | 4.500%, TBA | | 0.3 | | | 6.000%, due 02/20/34 | | 0.3 | |
| Total | | 6.1 | % | | | | 7.0 | % | | | | 7.3 | % |
1 Weightings represent percentages of the Fund’s net assets as of the dates indicated. The Fund’s portfolio is actively managed and its composition will vary over time.
UBS U.S. Allocation Fund
Portfolio of investments—August 31, 2013
| Security description | Shares | | Value |
| Common stocks—37.92% | | | | |
| Aerospace & defense—1.23% | | | | |
| General Dynamics Corp. | 12,100 | | $ | 1,007,325 |
| Precision Castparts Corp. | 4,700 | | | 992,828 |
| The Boeing Co. | 2,900 | | | 301,368 |
| United Technologies Corp. | 8,200 | | | 820,820 |
| | | | 3,122,341 |
| Airlines—0.33% | | | | |
| Spirit Airlines, Inc.* | 27,200 | | | 847,824 |
| Beverages—0.23% | | | | |
| Monster Beverage Corp.* | 10,200 | | | 585,378 |
| Biotechnology—1.79% | | | | |
| Acorda Therapeutics, Inc.* | 13,500 | | | 456,165 |
| Alexion Pharmaceuticals, Inc.* | 4,100 | | | 441,816 |
| Alnylam Pharmaceuticals, Inc.* | 5,800 | | | 300,440 |
| Biogen Idec, Inc.* | 3,200 | | | 681,664 |
| Bluebird Bio, Inc.*,1 | 3,600 | | | 89,640 |
| Epizyme, Inc.*,1 | 3,100 | | | 86,025 |
| Gilead Sciences, Inc.* | 29,600 | | | 1,783,992 |
| Lexicon Pharmaceuticals, Inc.* | 123,300 | | | 307,017 |
| Ligand Pharmaceuticals, Inc., Class B* | 5,700 | | | 274,113 |
| Quintiles Transnational Holdings, Inc.* | 3,500 | | | 151,410 |
| | | | 4,572,282 |
| Capital markets—0.70% | | | | |
| Invesco Ltd. | 13,100 | | | 397,716 |
| Morgan Stanley | 53,600 | | | 1,380,736 |
| | | | 1,778,452 |
| Chemicals—0.67% | | | | |
| The Dow Chemical Co. | 27,000 | | | 1,009,800 |
| The Sherwin-Williams Co. | 4,000 | | | 689,600 |
| | | | 1,699,400 |
| Commercial banks—0.65% | | | | |
| U.S. Bancorp | 25,000 | | | 903,250 |
| Wells Fargo & Co. | 18,600 | | | 764,088 |
| | | | 1,667,338 |
| Commercial services & supplies—0.20% | | | | |
| Waste Management, Inc. | 12,600 | | | 509,544 |
| Communications equipment—0.49% | | | | |
| QUALCOMM, Inc. | 19,000 | | | 1,259,320 |
| Computers & peripherals—2.00% | | | | |
| Apple, Inc. | 8,500 | | | 4,139,925 |
| NetApp, Inc. | 22,700 | | | 942,958 |
| | | | 5,082,883 |
| Consumer finance—0.39% | | | | |
| Capital One Financial Corp. | 6,600 | | | 426,030 |
| Discover Financial Services | 11,900 | | | 562,275 |
| | | | 988,305 |
| Diversified financial services—1.21% | | | | |
| Citigroup, Inc. | 33,847 | | | 1,635,825 |
| JPMorgan Chase & Co. | 28,400 | | | 1,435,052 |
| | | | 3,070,877 |
| Electric utilities—0.32% | | | | |
| Edison International | 9,100 | | | 417,599 |
| NextEra Energy, Inc. | 5,100 | | | 409,836 |
| | | | 827,435 |
| Electrical equipment—0.24% | | | | |
| AMETEK, Inc. | 14,100 | | | 605,172 |
| Energy equipment & services—1.93% | | | | |
| Baker Hughes, Inc. | 24,500 | | | 1,139,005 |
| FMC Technologies, Inc.* | 6,000 | | | 321,780 |
| Halliburton Co. | 30,300 | | | 1,454,400 |
| IHS, Inc., Class A* | 1,500 | | | 160,725 |
| McDermott International, Inc.* | 84,900 | | | 636,750 |
| Noble Corp. | 22,100 | | | 822,120 |
| Schlumberger Ltd. | 4,700 | | | 380,418 |
| | | | 4,915,198 |
| Food products—1.16% | | | | |
| Kellogg Co. | 14,600 | | | 886,366 |
| Mondelez International, Inc., Class A | 67,600 | | | 2,073,292 |
| | | | 2,959,658 |
| Health care equipment & supplies—0.50% | | | |
| Baxter International, Inc. | 12,700 | | | 883,412 |
| Intuitive Surgical, Inc.* | 1,040 | | | 401,981 |
| | | | 1,285,393 |
| Health care providers & services—1.33% | | | |
| Cardinal Health, Inc. | 17,500 | | | 879,900 |
| Catamaran Corp.* | 13,100 | | | 719,321 |
| Envision Healthcare Holdings, Inc.* | 15,300 | | | 401,472 |
| UnitedHealth Group, Inc. | 19,200 | | | 1,377,408 |
| | | | 3,378,101 |
| Hotels, restaurants & leisure—0.87% | | | | |
| Las Vegas Sands Corp. | 13,000 | | | 732,550 |
| Starbucks Corp. | 8,000 | | | 564,160 |
| Yum! Brands, Inc. | 13,200 | | | 924,264 |
| | | | 2,220,974 |
| Household durables—0.18% | | | | |
| Mohawk Industries, Inc.* | 3,800 | | | 446,462 |
| Industrial conglomerates—1.11% | | | | |
| 3M Co. | 6,800 | | | 772,344 |
| Danaher Corp. | 31,500 | | | 2,063,880 |
| | | | 2,836,224 |
| Insurance—0.74% | | | | |
| Lincoln National Corp. | 22,400 | | | 941,696 |
| MetLife, Inc. | 15,300 | | | 706,707 |
| The Progressive Corp. | 9,700 | | | 243,179 |
| | | | 1,891,582 |
| Internet & catalog retail—1.20% | | | | |
| Amazon.com, Inc.* | 6,500 | | | 1,826,370 |
| Priceline.com, Inc.* | 1,300 | | | 1,220,089 |
| | | | 3,046,459 |
UBS U.S. Allocation Fund
Portfolio of investments—August 31, 2013
| Security description | Shares | | Value |
| Common stocks—(continued) | | | | |
| Internet software & services—1.46% | | | | |
| eBay, Inc.* | 22,300 | | $ | 1,114,777 |
| Facebook, Inc., Class A* | 27,300 | | | 1,126,944 |
| Google, Inc., Class A* | 1,750 | | | 1,482,075 |
| | | | 3,723,796 |
| IT services—1.34% | | | | |
| MasterCard, Inc., Class A | 1,200 | | | 727,296 |
| ServiceSource International, Inc.* | 86,200 | | | 1,043,882 |
| Teradata Corp.* | 13,300 | | | 778,848 |
| Visa, Inc., Class A | 5,000 | | | 872,100 |
| | | | 3,422,126 |
| Life sciences tools & services—0.12% | | | | |
| Bio-Rad Laboratories, Inc., Class A* | 2,700 | | | 307,827 |
| Machinery—1.25% | | | | |
| Cummins, Inc. | 4,500 | | | 554,400 |
| Illinois Tool Works, Inc. | 18,700 | | | 1,336,489 |
| Parker Hannifin Corp. | 13,000 | | | 1,299,350 |
| | | | 3,190,239 |
| Media—1.34% | | | | |
| Comcast Corp., Class A | 29,600 | | | 1,245,864 |
| Liberty Global PLC, Class A* | 5,300 | | | 411,704 |
| Time Warner, Inc. | 15,600 | | | 944,268 |
| Viacom, Inc., Class B | 10,100 | | | 803,556 |
| | | | 3,405,392 |
| Metals & mining—0.12% | | | | |
| Commercial Metals Co. | 20,000 | | | 297,600 |
| Multi-utilities—0.36% | | | | |
| PG&E Corp. | 22,100 | | | 914,056 |
| Multiline retail—0.79% | | | | |
| Dollar General Corp.* | 15,300 | | | 825,741 |
| JC Penney Co., Inc.*,1 | 39,600 | | | 494,208 |
| Macy’s, Inc. | 15,400 | | | 684,222 |
| | | | 2,004,171 |
| Oil, gas & consumable fuels—1.15% | | | | |
| Cabot Oil & Gas Corp. | 5,800 | | | 226,954 |
| Concho Resources, Inc.* | 6,500 | | | 627,315 |
| EOG Resources, Inc. | 6,200 | | | 973,710 |
| Hess Corp. | 14,700 | | | 1,100,295 |
| | | | 2,928,274 |
| Paper & forest products—0.22% | | | | |
| International Paper Co. | 12,000 | | | 566,520 |
| Personal products—0.31% | | | | |
| The Estee Lauder Cos., Inc., Class A | 12,000 | | | 784,320 |
| Pharmaceuticals—1.47% | | | | |
| Allergan, Inc. | 10,400 | | | 919,152 |
| Eli Lilly & Co. | 11,200 | | | 575,680 |
| Hospira, Inc.* | 20,900 | | | 815,727 |
| Impax Laboratories, Inc.* | 17,200 | | | 350,536 |
| Salix Pharmaceuticals Ltd.* | 6,300 | | | 421,722 |
| Teva Pharmaceutical | | | | |
| Industries Ltd., ADR | 8,700 | | | 332,514 |
| Zoetis, Inc. | 11,500 | | | 335,225 |
| | | | 3,750,556 |
| Real estate investment trusts—0.47% | | | | |
| American Capital Agency Corp. | 18,600 | | | 423,336 |
| Digital Realty Trust, Inc.1 | 14,000 | | | 778,400 |
| | | | 1,201,736 |
| Real estate management & development—0.19% | | | |
| Realogy Holdings Corp.* | 11,500 | | | 486,795 |
| Road & rail—1.16% | | | | |
| Hertz Global Holdings, Inc.* | 49,800 | | | 1,196,694 |
| Norfolk Southern Corp. | 16,100 | | | 1,161,776 |
| Union Pacific Corp. | 3,900 | | | 598,806 |
| | | | 2,957,276 |
| Semiconductors & semiconductor equipment—1.46% |
| Atmel Corp.* | 69,000 | | | 500,940 |
| Avago Technologies Ltd. | 12,800 | | | 492,928 |
| Broadcom Corp., Class A | 34,500 | | | 871,470 |
| Freescale Semiconductor Ltd.*,1 | 15,300 | | | 219,096 |
| Micron Technology, Inc.* | 41,300 | | | 560,441 |
| NXP Semiconductors NV* | 15,000 | | | 557,550 |
| Skyworks Solutions, Inc.* | 20,800 | | | 527,488 |
| | | | 3,729,913 |
| Software—2.27% | | | | |
| Adobe Systems, Inc.* | 24,400 | | | 1,116,300 |
| Check Point Software | | | | |
| Technologies Ltd.*,1 | 26,100 | | | 1,463,427 |
| Salesforce.com, Inc.* | 21,200 | | | 1,041,556 |
| ServiceNow, Inc.* | 7,900 | | | 370,352 |
| Symantec Corp. | 38,300 | | | 980,863 |
| VMware, Inc., Class A* | 9,500 | | | 799,425 |
| | | | 5,771,923 |
| Textiles, apparel & luxury goods—1.84% | | | |
| Coach, Inc. | 13,600 | | | 718,216 |
| Lululemon Athletica, Inc.*,1 | 9,800 | | | 694,232 |
| Michael Kors Holdings Ltd.* | 12,900 | | | 955,761 |
| Nike, Inc., Class B | 13,600 | | | 854,352 |
| Ralph Lauren Corp. | 8,900 | | | 1,472,149 |
| | | | 4,694,710 |
| Tobacco—0.49% | | | | |
| Philip Morris International, Inc. | 15,100 | | | 1,259,944 |
| Wireless telecommunication services—0.64% | | | |
| Crown Castle International Corp.* | 10,400 | | | 721,968 |
| NII Holdings, Inc.*,1 | 152,600 | | | 912,548 |
| | | | 1,634,516 |
| Total common stocks | | | | |
| (cost—$80,587,995) | | | | 96,628,292 |
| Preferred stock—0.00% | | | | |
| Consumer finance—0.00% | | | | |
| Ally Financial, Inc.2,3 (cost—$98) | 5 | | | 4,679 |
UBS U.S. Allocation Fund
Portfolio of investments—August 31, 2013
| Security description | Face
amount | Value |
| US government obligations—4.88% | | | | | |
| US Treasury Bond | | | | | |
| 2.875%, due 05/15/43 | $ | 1,095,000 | | $ | 932,119 |
| US Treasury Notes | | | | | |
| 0.125%, due 12/31/14 | | 995,000 | | | 993,756 |
| 0.125%, due 04/30/15 | | 275,000 | | | 274,162 |
| 0.250%, due 11/30/14 | | 1,990,000 | | | 1,991,089 |
| 0.250%, due 01/31/15 | | 75,000 | | | 75,009 |
| 0.250%, due 02/28/15 | | 800,000 | | | 799,750 |
| 0.250%, due 03/31/15 | | 625,000 | | | 624,585 |
| 0.250%, due 05/31/15 | | 4,105,000 | | | 4,099,068 |
| 0.625%, due 04/30/18 | | 100,000 | | | 96,094 |
| 0.875%, due 01/31/18 | | 95,000 | | | 92,825 |
| 1.000%, due 05/31/18 | | 1,125,000 | | | 1,098,281 |
| 1.375%, due 07/31/18 | | 350,000 | | | 346,664 |
| 1.875%, due 06/30/15 | | 160,000 | | | 164,400 |
| 1.875%, due 06/30/20 | | 875,000 | | | 858,799 |
| Total US government obligations | | | | | |
| (cost—$12,485,273) | | | | | 12,446,601 |
| Mortgage & agency debt securities—7.41% | | | |
| Federal Home Loan Mortgage | | | | | |
| Corporation Certificates,** | | | | | |
| 1.250%, due 10/02/19 | | 250,000 | | | 234,658 |
| 5.000%, due 03/01/38 | | 110,392 | | | 117,967 |
| 5.000%, due 11/01/38 | | 8,913 | | | 9,525 |
| 5.000%, due 12/01/38 | | 66,668 | | | 71,242 |
| 5.500%, due 05/01/37 | | 627,778 | | | 676,057 |
| 5.500%, due 08/01/40 | | 67,591 | | | 73,094 |
| 6.000%, due 10/01/36 | | 105,018 | | | 115,979 |
| 6.500%, due 08/01/28 | | 174,477 | | | 198,891 |
| 3.500% TBA | | 250,000 | | | 249,170 |
| 4.000% TBA | | 850,000 | | | 876,297 |
| Federal National Mortgage | | | | | |
| Association Certificates,** | | | | | |
| 0.375%, due 12/21/15 | | 630,000 | | | 627,184 |
| 0.500%, due 05/20/16 | | 600,000 | | | 595,400 |
| 0.625%, due 08/26/16 | | 300,000 | | | 297,714 |
| 3.000%, due 03/01/27 | | 169,902 | | | 174,075 |
| 3.000%, due 08/01/27 | | 227,048 | | | 232,646 |
| 3.000%, due 09/01/27 | | 595,498 | | | 610,181 |
| 3.500%, due 10/01/42 | | 350,632 | | | 351,008 |
| 4.000%, due 12/01/39 | | 240,053 | | | 248,249 |
| 4.000%, due 02/01/41 | | 119,829 | | | 123,839 |
| 4.000%, due 09/01/41 | | 301,466 | | | 311,544 |
| 4.500%, due 09/01/37 | | 707,002 | | | 748,966 |
| 4.500%, due 07/01/41 | | 270,240 | | | 285,950 |
| 4.500%, due 09/01/41 | | 247,809 | | | 262,072 |
| 5.000%, due 10/01/39 | | 49,733 | | | 53,472 |
| 5.000%, due 05/01/40 | | 62,334 | | | 67,320 |
| 5.000%, due 09/01/41 | | 280,839 | | | 303,419 |
| 5.500%, due 08/01/39 | | 239,063 | | | 260,798 |
| 6.000%, due 06/01/33 | | 5,715 | | | 6,359 |
| 6.000%, due 08/01/37 | | 112,154 | | | 123,714 |
| 7.000%, due 08/01/32 | | 296,892 | | | 331,682 |
| 7.500%, due 02/01/33 | | 7,535 | | | 8,603 |
| 3.500% TBA | | 2,800,000 | | | 2,860,930 |
| 4.000% TBA | | 550,000 | | | 566,500 |
| 4.500% TBA | | 1,000,000 | | | 1,056,289 |
| 5.000% TBA | | 625,000 | | | 672,070 |
| Government National Mortgage | | | | | |
| Association Certificates I, | | | | | |
| 4.000%, due 07/15/42 | | 155,737 | | | 164,184 |
| 4.000%, due 08/15/42 | | 73,477 | | | 77,465 |
| 6.500%, due 10/15/28 | | 3,243 | | | 3,607 |
| 4.000% TBA | | 775,000 | | | 806,726 |
| 4.500% TBA | | 900,000 | | | 957,235 |
| Government National Mortgage | | | | | |
| Association Certificates II, | | | | | |
| 3.500%, due 12/20/26 | | 418,825 | | | 440,670 |
| 3.500%, due 08/20/42 | | 641,738 | | | 651,120 |
| 3.500%, due 09/20/42 | | 90,182 | | | 91,429 |
| 4.000%, due 07/20/26 | | 245,717 | | | 259,724 |
| 4.000%, due 06/20/42 | | 113,757 | | | 119,944 |
| 6.000%, due 11/20/28 | | 1,716 | | | 1,889 |
| 6.000%, due 02/20/29 | | 3,990 | | | 4,518 |
| 6.000%, due 02/20/34 | | 589,122 | | | 650,961 |
| 4.500% TBA | | 800,000 | | | 849,500 |
| Total mortgage & agency debt | | | | | |
| securities (cost—$18,879,107) | | | | | 18,881,836 |
| Collateralized mortgage obligations—0.33% | | | |
| Arkle Master Issuer PLC, | | | | | |
| Series 2012-1A, Class 2A1, | | | | | |
| 1.963%, due 05/17/602,4 | | 255,000 | | | 259,999 |
| First Horizon Mortgage Pass-Through | | | | |
| Trust, Series 2004-FL1, Class 1A1, | | | | | |
| 0.454%, due 02/25/354 | | 144,815 | | | 129,266 |
| Holmes Master Issuer PLC, | | | | | |
| Series 2010-1A, Class A2, | | | | | |
| 1.668%, due 10/15/542,4 | | 60,000 | | | 60,269 |
| Series 2012-1A, Class A2, | | | | | |
| 1.918%, due 10/15/542,4 | | 375,000 | | | 380,302 |
| Total collateralized mortgage | | | | | |
| obligations (cost—$839,401) | | | | | 829,836 |
| Asset-backed security—0.09% | | | | | |
| Capital Auto Receivables Asset Trust, | | | | |
| Series 2013-3, Class B, 2.320%, | | | | | |
| due 07/20/18 (cost—$224,925) | | 225,000 | | | 224,277 |
| Commercial mortgage-backed securities—1.19% | | | |
| Banc of America Commercial | | | | | |
| Mortgage, Inc., | | | | | |
| Series 2007-4, Class AM, | | | | | |
| 6.001%, due 02/10/514 | | 250,000 | | | 270,496 |
| Commercial Mortgage Loan Trust, | | | | | |
| Series 2008-LS1, Class A4B, | | | | | |
| 6.209%, due 12/10/494 | | 300,000 | | | 337,105 |
| Commercial Mortgage Trust, | | | | | |
| Series 2007-GG11, Class A4, | | | | | |
| 5.736%, due 12/10/49 | | 100,000 | | | 111,354 |
UBS U.S. Allocation Fund
Portfolio of investments—August 31, 2013
| Security description | Face
amount | | Value |
| Commercial mortgage-backed securities—(concluded) | | | |
| Extended Stay America Trust, | | | | | |
| Series 2013-ESH7, Class B7, | | | | | |
| 3.604%, due 12/05/312 | $ | 225,000 | | $ | 217,071 |
| FDIC Structured Sale Guaranteed | | | | | |
| Notes, Series 2010-C1, Class A, | | | | | |
| 2.980%, due 12/06/202 | | 177,103 | | | 182,214 |
| GS Mortgage Securities Trust, | | | | | |
| Series 2007-GG10, Class A4, | | | | | |
| 5.995%, due 08/10/454 | | 100,000 | | | 110,095 |
| JP Morgan Chase Commercial | | | | | |
| Mortgage Securities Corp., | | | | | |
| Series 2007-LD11, Class A4, | | | | | |
| 6.003%, due 06/15/494 | | 425,000 | | | 473,392 |
| Morgan Stanley Bank of America | | | | | |
| Merrill Lynch Trust, | | | | | |
| Series 2013-C7, Class B, | | | | | |
| 3.769%, due 02/15/46 | | 50,000 | | | 46,540 |
| Series 2013-C8, Class B, | | | | | |
| 3.815%, due 12/15/484 | | 250,000 | | | 231,790 |
| Morgan Stanley Re-REMIC Trust, | | | | | |
| Series 2009-GG10, Class A4B, | | | | | |
| 5.995%, due 08/12/452,4 | | 375,000 | | | 408,487 |
| Wachovia Bank Commercial | | | | | |
| Mortgage Trust, | | | | | |
| Series 2007-C32, Class A3, | | | | | |
| 5.920%, due 06/15/494 | | 200,000 | | | 221,749 |
| Series 2007-C34, Class AM, | | | | | |
| 5.818%, due 05/15/464 | | 175,000 | | | 190,424 |
| WF-RBS Commercial Mortgage Trust, | | | | | |
| Series 2013-C11, Class B, | | | | | |
| 3.714%, due 03/15/454 | | 50,000 | | | 46,864 |
| Series 2013-C12, Class B, | | | | | |
| 3.863%, due 03/15/484 | | 200,000 | | | 186,166 |
| Total commercial mortgage-backed | | | | | |
| securities (cost—$3,094,393) | | | | | 3,033,747 |
| Corporate bonds—11.03% | | | | | |
| Aerospace & defense—0.02% | | | | | |
| BE Aerospace, Inc. | | | | | |
| 6.875%, due 10/01/20 | | 50,000 | | | 54,000 |
| Automobile OEM—0.11% | | | | | |
| Chrysler Group LLC/CG Co-Issuer, Inc. | | | | | |
| 8.000%, due 06/15/19 | | 80,000 | | | 86,900 |
| Ford Motor Co. | | | | | |
| 7.450%, due 07/16/31 | | 150,000 | | | 180,777 |
| | | | | 267,677 |
| Automotive parts—0.12% | | | | | |
| American Axle & Manufacturing, Inc. | | | | | |
| 6.625%, due 10/15/22 | | 100,000 | | | 102,250 |
| Meritor, Inc. | | | | | |
| 10.625%, due 03/15/181 | | 30,000 | | | 32,550 |
| Tenneco, Inc. | | | | | |
| 7.750%, due 08/15/18 | | 100,000 | | | 107,250 |
| TRW Automotive, Inc. | | | | | |
| 4.500%, due 03/01/212 | | 75,000 | | | 72,188 |
| | | | | 314,238 |
| Banking-non-US—0.32% | | | | | |
| Barclays Bank PLC | | | | | |
| 5.140%, due 10/14/20 | | 100,000 | | | 103,796 |
| BNP Paribas SA MTN | | | | | |
| 2.700%, due 08/20/18 | | 100,000 | | | 99,596 |
| Caixa Economica Federal | | | | | |
| 2.375%, due 11/06/172 | | 150,000 | | | 139,125 |
| Lloyds TSB Bank PLC | | | | | |
| 6.500%, due 09/14/202 | | 205,000 | | | 223,036 |
| RBS Capital Trust II | | | | | |
| 6.425%, due 01/03/344,5 | | 50,000 | | | 42,000 |
| Royal Bank of Scotland Group PLC | | | | | |
| 6.125%, due 12/15/22 | | 100,000 | | | 96,268 |
| Santander US Debt SAU | | | | | |
| 3.724%, due 01/20/152 | | 100,000 | | | 101,339 |
| | | | | 805,160 |
| Banking-US—0.86% | | | | | |
| Bank of America Corp. | | | | | |
| 5.625%, due 07/01/20 | | 85,000 | | | 93,548 |
| Capital One Financial Corp. | | | | | |
| 2.150%, due 03/23/15 | | 75,000 | | | 76,203 |
| CIT Group, Inc. | | | | | |
| 5.250%, due 03/15/18 | | 50,000 | | | 51,625 |
| 5.500%, due 02/15/192 | | 200,000 | | | 205,000 |
| Citigroup, Inc. | | | | | |
| 5.375%, due 08/09/20 | | 40,000 | | | 44,346 |
| 5.500%, due 02/15/17 | | 325,000 | | | 352,754 |
| 8.500%, due 05/22/19 | | 70,000 | | | 88,735 |
| JPMorgan Chase & Co. | | | | | |
| 3.150%, due 07/05/16 | | 190,000 | | | 198,519 |
| Morgan Stanley | | | | | |
| 3.750%, due 02/25/23 | | 75,000 | | | 71,261 |
| 4.875%, due 11/01/22 | | 60,000 | | | 59,238 |
| 7.300%, due 05/13/19 | | 300,000 | | | 355,137 |
| The Goldman Sachs Group, Inc. | | | | | |
| 5.750%, due 01/24/22 | | 110,000 | | | 120,807 |
| 6.150%, due 04/01/18 | | 175,000 | | | 197,845 |
| 7.500%, due 02/15/19 | | 80,000 | | | 95,440 |
| Wells Fargo Bank N.A. | | | | | |
| 5.950%, due 08/26/36 | | 160,000 | | | 180,978 |
| | | | | 2,191,436 |
| Building materials—0.09% | | | | | |
| Hanson Ltd. | | | | | |
| 6.125%, due 08/15/16 | | 40,000 | | | 43,400 |
| Owens Corning, Inc. | | | | | |
| 6.500%, due 12/01/166 | | 25,000 | | | 27,904 |
| Ply Gem Industries, Inc. | | | | | |
| 8.250%, due 02/15/181 | | 45,000 | | | 48,150 |
| Vulcan Materials Co. | | | | | |
| 7.500%, due 06/15/21 | | 100,000 | | | 111,279 |
| | | | | 230,733 |
| Business services/office equipment—0.05% | | | |
| West Corp. | | | | | |
| 7.875%, due 01/15/19 | | 120,000 | | | 128,700 |
UBS U.S. Allocation Fund
Portfolio of investments—August 31, 2013
| Security description | Face
amount | | Value |
| Corporate bonds—(continued) | | | | | |
| Cable—0.06% | | | | | |
| Comcast Corp. | | | | | |
| 6.300%, due 11/15/17 | $ | 60,000 | | $ | 70,520 |
| 6.950%, due 08/15/37 | | 60,000 | | | 75,489 |
| | | | | 146,009 |
| Chemicals—0.29% | | | | | |
| Celanese US Holdings LLC | | | | | |
| 5.875%, due 06/15/21 | | 145,000 | | | 148,625 |
| CF Industries, Inc. | | | | | |
| 3.450%, due 06/01/23 | | 180,000 | | | 167,252 |
| INEOS Group Holdings SA | | | | | |
| 6.125%, due 08/15/182 | | 200,000 | | | 193,500 |
| Montell America Finance Co. | | | | | |
| 8.100%, due 03/15/272 | | 100,000 | | | 126,467 |
| Valspar Corp. | | | | | |
| 4.200%, due 01/15/22 | | 100,000 | | | 100,002 |
| | | | | 735,846 |
| Coal—0.03% | | | | | |
| Arch Coal, Inc. | | | | | |
| 9.875%, due 06/15/192 | | 100,000 | | | 87,000 |
| Commercial services—0.11% | | | | | |
| Interactive Data Corp. | | | | | |
| 10.250%, due 08/01/18 | | 5,000 | | | 5,562 |
| RR Donnelley & Sons Co. | | | | | |
| 7.875%, due 03/15/211 | | 100,000 | | | 107,250 |
| The ADT Corp. | | | | | |
| 3.500%, due 07/15/22 | | 120,000 | | | 100,346 |
| United Rentals North America, Inc. | | | | | |
| 5.750%, due 07/15/18 | | 50,000 | | | 53,375 |
| | | | | 266,533 |
| Consumer products—0.13% | | | | | |
| Revlon Consumer Products Corp. | | | | | |
| 5.750%, due 02/15/212 | | 100,000 | | | 95,250 |
| Reynolds Group Issuer, Inc./Reynolds | | | | | |
| Group Issuer LLC/Reynolds Group | | | | | |
| Issuer (Luxembourg) SA | | | | | |
| 7.875%, due 08/15/19 | | 100,000 | | | 110,000 |
| 9.875%, due 08/15/19 | | 125,000 | | | 132,813 |
| | | | | 338,063 |
| Consumer services—0.09% | | | | | |
| Marsh & McLennan Cos., Inc. | | | | | |
| 9.250%, due 04/15/19 | | 90,000 | | | 116,005 |
| ServiceMaster Co. | | | | | |
| 7.000%, due 08/15/20 | | 125,000 | | | 114,375 |
| | | | | 230,380 |
| Diversified manufacturing—0.08% | | | | | |
| Bombardier, Inc. | | | | | |
| 7.750%, due 03/15/202 | | 125,000 | | | 139,531 |
| SPX Corp. | | | | | |
| 7.625%, due 12/15/14 | | 65,000 | | | 69,225 |
| | | | | 208,756 |
| Electric-generation—0.26% | | | | | |
| Calpine Corp. | | | | | |
| 7.875%, due 07/31/202 | | 113,000 | | | 122,040 |
| Energy Future Intermediate Holding | | | | | |
| Co. LLC/EFIH Finance, Inc. | | | | | |
| 10.000%, due 12/01/20 | | 60,000 | | | 63,225 |
| NRG Energy, Inc. | | | | | |
| 7.625%, due 05/15/19 | | 50,000 | | | 52,875 |
| 8.250%, due 09/01/20 | | 125,000 | | | 137,187 |
| 8.500%, due 06/15/19 | | 80,000 | | | 86,200 |
| The AES Corp. | | | | | |
| 8.000%, due 06/01/20 | | 175,000 | | | 198,625 |
| | | | | 660,152 |
| Electric-integrated—0.10% | | | | | |
| E.ON International Finance BV | | | | | |
| 5.800%, due 04/30/182 | | 80,000 | | | 91,939 |
| FirstEnergy Corp. | | | | | |
| 7.375%, due 11/15/31 | | 50,000 | | | 50,593 |
| Southwestern Electric Power Co. | | | | | |
| 3.550%, due 02/15/22 | | 105,000 | | | 100,990 |
| Texas Competitive Electric Holdings | | | | | |
| Co. LLC/TCEH Finance, Inc. | | | | | |
| 11.500%, due 10/01/202 | | 25,000 | | | 17,407 |
| | | | | 260,929 |
| Electronics—0.05% | | | | | |
| Freescale Semiconductor, Inc. | | | | | |
| 9.250%, due 04/15/182 | | 25,000 | | | 27,000 |
| 10.750%, due 08/01/20 | | 100,000 | | | 110,500 |
| | | | | 137,500 |
| Energy-exploration & production—0.51% | | | |
| Alta Mesa Holdings/Alta Mesa | | | | | |
| Finance Services Corp. | | | | | |
| 9.625%, due 10/15/18 | | 100,000 | | | 104,750 |
| Antero Resources Finance Corp. | | | | | |
| 6.000%, due 12/01/20 | | 100,000 | | | 99,750 |
| Apache Corp. | | | | | |
| 5.250%, due 02/01/42 | | 90,000 | | | 92,352 |
| Berry Petroleum Co. | | | | | |
| 6.750%, due 11/01/20 | | 50,000 | | | 50,750 |
| Continental Resources, Inc. | | | | | |
| 4.500%, due 04/15/23 | | 75,000 | | | 73,687 |
| EPE Holdings LLC/EP | | | | | |
| Energy Bond Co., Inc. | | | | | |
| 8.125%, due 12/15/172,7 | | 52,144 | | | 53,187 |
| Forest Oil Corp. | | | | | |
| 7.250%, due 06/15/191 | | 75,000 | | | 74,437 |
| Hilcorp Energy I LP/Hilcorp Finance Co. | | | | | |
| 7.625%, due 04/15/212 | | 25,000 | | | 26,625 |
| 8.000%, due 02/15/202 | | 20,000 | | | 21,750 |
| Linn Energy LLC/Linn | | | | | |
| Energy Finance Corp. | | | | | |
| 7.750%, due 02/01/21 | | 50,000 | | | 48,500 |
| 8.625%, due 04/15/20 | | 75,000 | | | 75,375 |
UBS U.S. Allocation Fund
Portfolio of investments—August 31, 2013
| Security description | Face
amount | | Value |
| Corporate bonds—(continued) | | | | | |
| Energy-exploration & production—(concluded) | | | |
| Memorial Production Partners | | | | | |
| LP/Memorial Production | | | | | |
| Finance Corp. | | | | | |
| 7.625%, due 05/01/21 | $ | 50,000 | | $ | 48,250 |
| Midstates Petroleum Co., Inc./ | | | | | |
| Midstates Petroleum Co. LLC | | | | | |
| 10.750%, due 10/01/202 | | 200,000 | | | 203,000 |
| Quicksilver Resources, Inc. | | | | | |
| 7.125%, due 04/01/16 | | 50,000 | | | 45,375 |
| Range Resources Corp. | | | | | |
| 5.750%, due 06/01/21 | | 25,000 | | | 26,188 |
| 8.000%, due 05/15/19 | | 175,000 | | | 188,125 |
| SandRidge Energy, Inc. | | | | | |
| 8.750%, due 01/15/20 | | 45,000 | | | 47,025 |
| Swift Energy Co. | | | | | |
| 7.875%, due 03/01/22 | | 25,000 | | | 24,250 |
| | | | | 1,303,376 |
| Energy-independent—0.24% | | | | | |
| Anadarko Petroleum Corp. | | | | | |
| 5.950%, due 09/15/16 | | 110,000 | | | 123,370 |
| 6.450%, due 09/15/36 | | 85,000 | | | 99,229 |
| Key Energy Services, Inc. | | | | | |
| 6.750%, due 03/01/21 | | 75,000 | | | 74,063 |
| Marathon Oil Corp. | | | | | |
| 6.600%, due 10/01/37 | | 35,000 | | | 41,548 |
| Petrohawk Energy Corp. | | | | | |
| 7.250%, due 08/15/18 | | 240,000 | | | 260,880 |
| | | | | 599,090 |
| Energy-integrated—0.09% | | | | | |
| Cenovus Energy, Inc. | | | | | |
| 3.800%, due 09/15/23 | | 100,000 | | | 98,933 |
| ConocoPhillips | | | | | |
| 6.500%, due 02/01/39 | | 55,000 | | | 69,542 |
| Petro-Canada | | | | | |
| 6.800%, due 05/15/38 | | 50,000 | | | 59,984 |
| | | | | 228,459 |
| Energy-oilfield services—0.13% | | | | | |
| Expro Finance Luxembourg SCA | | | | | |
| 8.500%, due 12/15/162 | | 100,000 | | | 105,000 |
| Lightstream Resources Ltd. | | | | | |
| 8.625%, due 02/01/202 | | 100,000 | | | 95,000 |
| Transocean, Inc. | | | | | |
| 3.800%, due 10/15/22 | | 75,000 | | | 70,098 |
| 6.800%, due 03/15/38 | | 50,000 | | | 53,394 |
| | | | | 323,492 |
| Energy-refining & marketing—0.13% | | | | |
| Tesoro Corp. | | | | | |
| 4.250%, due 10/01/17 | | 200,000 | | | 202,500 |
| Valero Energy Corp. | | | | | |
| 6.625%, due 06/15/37 | | 115,000 | | | 125,806 |
| | | | | 328,306 |
| Finance-captive automotive—0.01% | | | | | |
| AmeriGas Finance LLC/AmeriGas | | | | | |
| Finance Corp. | | | | | |
| 6.750%, due 05/20/20 | | 35,000 | | | 37,100 |
| Finance-diversified—0.18% | | | | | |
| Merrill Lynch & Co., Inc. | | | | | |
| 5.000%, due 01/15/15 | | 175,000 | | | 183,965 |
| 6.110%, due 01/29/37 | | 100,000 | | | 101,810 |
| Merrill Lynch & Co., Inc. MTN | | | | | |
| 6.875%, due 04/25/18 | | 75,000 | | | 87,221 |
| Ventas Realty LP/Ventas Capital Corp. | | | | | |
| 2.700%, due 04/01/20 | | 100,000 | | | 93,989 |
| | | | | 466,985 |
| Finance-non-captive diversified—0.15% | | | |
| Ally Financial, Inc. | | | | | |
| 8.000%, due 03/15/20 | | 200,000 | | | 230,250 |
| General Electric Capital Corp. | | | | | |
| 6.750%, due 03/15/32 | | 120,000 | | | 143,792 |
| | | | | 374,042 |
| Finance-other—0.36% | | | | | |
| Caterpillar Financial Services Corp. | | | | | |
| 2.850%, due 06/01/22 | | 105,000 | | | 99,144 |
| FTI Consulting, Inc. | | | | | |
| 6.750%, due 10/01/20 | | 25,000 | | | 26,406 |
| General Electric Capital Corp. MTN | | | | | |
| 4.650%, due 10/17/21 | | 100,000 | | | 105,391 |
| Icahn Enterprises LP/Icahn | | | | | |
| Enterprises Finance Corp. | | | | | |
| 8.000%, due 01/15/18 | | 75,000 | | | 78,937 |
| International Lease Finance Corp. | | | | | |
| 3.875%, due 04/15/18 | | 250,000 | | | 238,750 |
| 5.875%, due 04/01/19 | | 75,000 | | | 75,984 |
| 7.125%, due 09/01/182 | | 100,000 | | | 111,000 |
| SLM Corp. MTN | | | | | |
| 8.450%, due 06/15/18 | | 100,000 | | | 114,000 |
| SquareTwo Financial Corp. | | | | | |
| 11.625%, due 04/01/171 | | 75,000 | | | 77,250 |
| | | | | 926,862 |
| Food—0.10% | | | | | |
| Kraft Foods Group, Inc. | | | | | |
| 5.000%, due 06/04/42 | | 100,000 | | | 98,123 |
| Michael Foods, Inc. | | | | | |
| 9.750%, due 07/15/18 | | 100,000 | | | 109,750 |
| Viskase Cos., Inc. | | | | | |
| 9.875%, due 01/15/182 | | 40,000 | | | 42,400 |
| | | | | 250,273 |
| Food/beverage—0.10% | | | | | |
| Anheuser-Busch InBev Worldwide, Inc. | | | | | |
| 2.500%, due 07/15/22 | | 65,000 | | | 59,759 |
| 8.200%, due 01/15/39 | | 60,000 | | | 88,738 |
| The Kroger Co. | | | | | |
| 3.850%, due 08/01/23 | | 110,000 | | | 107,783 |
| | | | | 256,280 |
UBS U.S. Allocation Fund
Portfolio of investments—August 31, 2013
| Security description | Face
amount | | Value |
| Corporate bonds—(continued) | | | | | |
| Gaming—0.23% | | | | | |
| Caesars Entertainment | | | | | |
| Operating Co., Inc. | | | | | |
| 11.250%, due 06/01/17 | $ | 55,000 | | $ | 56,650 |
| CityCenter Holdings LLC/CityCenter | | | | | |
| Finance Corp. | | | | | |
| 10.750%, due 01/15/171,7 | | 152,874 | | | 164,722 |
| MGM Resorts International | | | | | |
| 10.000%, due 11/01/16 | | 220,000 | | | 258,500 |
| Shingle Springs Tribal Gaming Authority | | | | | |
| 9.750%, due 09/01/212 | | 100,000 | | | 99,500 |
| Tunica-Biloxi Gaming Authority | | | | | |
| 9.000%, due 11/15/158 | | 15,000 | | | 13,575 |
| | | | | 592,947 |
| Gas distributors—0.07% | | | | | |
| Ferrellgas Partners LP | | | | | |
| 9.125%, due 10/01/17 | | 20,000 | | | 20,950 |
| Niska Gas Storage US LLC/Niska Gas | | | | | |
| Storage Canada ULC | | | | | |
| 8.875%, due 03/15/18 | | 45,000 | | | 46,912 |
| Sempra Energy | | | | | |
| 9.800%, due 02/15/19 | | 90,000 | | | 120,113 |
| | | | | 187,975 |
| Gas pipelines—0.63% | | | | | |
| Atlas Pipeline Partners LP/Atlas Pipeline | | | | | |
| Finance Corp. | | | | | |
| 4.750%, due 11/15/212 | | 50,000 | | | 44,500 |
| Crosstex Energy LP/Crosstex Energy | | | | | |
| Finance Corp. | | | | | |
| 8.875%, due 02/15/18 | | 80,000 | | | 85,000 |
| El Paso Pipeline Partners | | | | | |
| Operating Co. LLC | | | | | |
| 5.000%, due 10/01/21 | | 85,000 | | | 89,790 |
| Energy Transfer Partners LP | | | | | |
| 5.200%, due 02/01/22 | | 240,000 | | | 252,887 |
| 9.000%, due 04/15/19 | | 140,000 | | | 175,843 |
| Kinder Morgan Energy Partners LP | | | | | |
| 3.950%, due 09/01/22 | | 275,000 | | | 268,705 |
| 6.500%, due 09/01/39 | | 55,000 | | | 61,289 |
| MarkWest Energy Partners LP/MarkWest | | | | | |
| Energy Finance Corp. | | | | | |
| 6.750%, due 11/01/20 | | 55,000 | | | 58,712 |
| Sabine Pass Liquefaction LLC | | | | | |
| 5.625%, due 02/01/212 | | 200,000 | | | 191,000 |
| Sonat, Inc. | | | | | |
| 7.000%, due 02/01/18 | | 150,000 | | | 160,636 |
| Spectra Energy Capital LLC | | | | | |
| 3.300%, due 03/15/23 | | 120,000 | | | 106,795 |
| The Williams Cos., Inc. | | | | | |
| 3.700%, due 01/15/23 | | 120,000 | | | 107,869 |
| | | | | 1,603,026 |
| Health care—0.35% | | | | | |
| Biomet, Inc. | | | | | |
| 6.500%, due 08/01/20 | | 150,000 | | | 153,750 |
| Capella Healthcare, Inc. | | | | | |
| 9.250%, due 07/01/17 | | 50,000 | | | 53,313 |
| CVS Caremark Corp. | | | | | |
| 6.125%, due 09/15/39 | | 60,000 | | | 69,717 |
| ExamWorks Group, Inc. | | | | | |
| 9.000%, due 07/15/19 | | 70,000 | | | 75,425 |
| HCA, Inc. | | | | | |
| 7.500%, due 02/15/22 | | 145,000 | | | 157,687 |
| 8.500%, due 04/15/19 | | 120,000 | | | 129,600 |
| MPH Intermediate Holding Co. 2 | | | | | |
| 8.375%, due 08/01/182,7 | | 100,000 | | | 102,000 |
| Tenet Healthcare Corp. | | | | | |
| 4.375%, due 10/01/212 | | 50,000 | | | 45,375 |
| United Surgical Partners | | | | | |
| International, Inc. | | | | | |
| 9.000%, due 04/01/20 | | 100,000 | | | 110,250 |
| US Oncology, Inc., Escrow (related to | | | | | |
| 9.125% bond, due 08/15/17)9,10 | | 30,000 | | | 1,575 |
| | | | | 898,692 |
| Home construction—0.15% | | | | | |
| D.R. Horton, Inc. | | | | | |
| 4.375%, due 09/15/22 | | 100,000 | | | 89,000 |
| KB Home | | | | | |
| 7.250%, due 06/15/18 | | 100,000 | | | 106,000 |
| Standard Pacific Corp. | | | | | |
| 8.375%, due 01/15/21 | | 125,000 | | | 140,000 |
| 10.750%, due 09/15/16 | | 25,000 | | | 29,688 |
| Toll Brothers Finance Corp. | | | | | |
| 8.910%, due 10/15/17 | | 10,000 | | | 11,750 |
| | | | | 376,438 |
| Insurance-life—0.32% | | | | | |
| American International Group, Inc. | | | | | |
| 3.000%, due 03/20/15 | | 90,000 | | | 92,588 |
| 8.250%, due 08/15/18 | | 110,000 | | | 136,080 |
| AXA SA | | | | | |
| 6.379%, due 12/14/362,4,5 | | 100,000 | | | 97,500 |
| Hartford Financial Services Group, Inc. | | | | |
| 5.950%, due 10/15/36 | | 200,000 | | | 221,896 |
| Principal Financial Group, Inc. | | | | | |
| 8.875%, due 05/15/19 | | 110,000 | | | 142,004 |
| Prudential Financial, Inc. MTN | | | | | |
| 6.625%, due 12/01/37 | | 100,000 | | | 120,044 |
| | | | | 810,112 |
| Insurance-personal & casualty—0.07% | | | | |
| Berkshire Hathaway Finance Corp. | | | | | |
| 3.000%, due 05/15/22 | | 40,000 | | | 38,455 |
| Liberty Mutual Group, Inc. | | | | | |
| 7.800%, due 03/15/372,4 | | 25,000 | | | 28,125 |
| 10.750%, due 06/15/582,4 | | 70,000 | | | 103,600 |
| | | | | 170,180 |
UBS U.S. Allocation Fund
Portfolio of investments—August 31, 2013
| Security description | Face
amount | | Value |
| Corporate bonds—(continued) | | | | | |
| Leisure—0.13% | | | | | |
| Royal Caribbean Cruises Ltd. | | | | | |
| 7.250%, due 06/15/16 | $ | 300,000 | | $ | 336,000 |
| Lodging—0.07% | | | | | |
| Diamond Resorts Corp. | | | | | |
| 12.000%, due 08/15/18 | | 105,000 | | | 116,550 |
| Felcor Lodging LP | | | | | |
| 6.750%, due 06/01/19 | | 25,000 | | | 26,188 |
| Host Hotels & Resorts LP | | | | | |
| 4.750%, due 03/01/23 | | 25,000 | | | 24,869 |
| | | | | | 167,607 |
| Machinery-agriculture & construction—0.08% | | | |
| Case New Holland, Inc. | | | | | |
| 7.875%, due 12/01/17 | | 105,000 | | | 120,750 |
| The Manitowoc Co., Inc. | | | | | |
| 8.500%, due 11/01/20 | | 75,000 | | | 83,250 |
| | | | | | 204,000 |
| Media-broadcast/outdoor—0.05% | | | | | |
| Clear Channel Communications, Inc. | | | | | |
| 14.000%, due 02/01/212,7 | | 50,111 | | | 40,840 |
| News America, Inc. | | | | | |
| 6.200%, due 12/15/34 | | 45,000 | | | 48,299 |
| Nexstar Broadcasting, Inc./ | | | | | |
| Mission Broadcasting, Inc. | | | | | |
| 8.875%, due 04/15/17 | | 25,000 | | | 26,938 |
| | | | | | 116,077 |
| Media-cable—0.47% | | | | | |
| Cablevision Systems Corp. | | | | | |
| 8.625%, due 09/15/17 | | 100,000 | | | 113,750 |
| CCO Holdings LLC/CCO Holdings | | | | | |
| Capital Corp. | | | | | |
| 6.500%, due 04/30/21 | | 100,000 | | | 101,250 |
| 6.625%, due 01/31/22 | | 100,000 | | | 101,500 |
| Cequel Communications Holdings I | | | | | |
| LLC/Cequel Capital Corp. | | | | | |
| 5.125%, due 12/15/212 | | 100,000 | | | 92,000 |
| CSC Holdings LLC | | | | | |
| 8.625%, due 02/15/19 | | 25,000 | | | 28,750 |
| DIRECTV Holdings LLC/DIRECTV | | | | | |
| Financing Co., Inc. | | | | | |
| 6.000%, due 08/15/40 | | 100,000 | | | 95,445 |
| DISH DBS Corp. | | | | | |
| 7.875%, due 09/01/19 | | 220,000 | | | 248,050 |
| Time Warner Cable, Inc. | | | | | |
| 6.550%, due 05/01/37 | | 40,000 | | | 38,577 |
| Time Warner Entertainment Co. LP | | | | | |
| 8.375%, due 03/15/23 | | 155,000 | | | 178,386 |
| Time Warner, Inc. | | | | | |
| 6.100%, due 07/15/40 | | 45,000 | | | 48,530 |
| UPCB Finance V Ltd. | | | | | |
| 7.250%, due 11/15/212 | | 150,000 | | | 162,000 |
| | | | | | 1,208,238 |
| Media-non cable—0.13% | | | | | |
| Intelsat Jackson Holdings SA | | | | | |
| 5.500%, due 08/01/232 | | 100,000 | | | 92,750 |
| 7.250%, due 10/15/20 | | 75,000 | | | 80,063 |
| Intelsat Luxembourg SA | | | | | |
| 7.750%, due 06/01/212 | | 100,000 | | | 103,000 |
| Sinclair Television Group, Inc. | | | | | |
| 8.375%, due 10/15/18 | | 50,000 | | | 54,625 |
| | | | | 330,438 |
| Media-publishing—0.08% | | | | | |
| The McClatchy Co. | | | | | |
| 9.000%, due 12/15/22 | | 200,000 | | | 211,000 |
| Metals & mining—0.30% | | | | | |
| ArcelorMittal | | | | | |
| 6.750%, due 02/25/221,6 | | 100,000 | | | 101,750 |
| Barrick Gold Corp. | | | | | |
| 3.850%, due 04/01/22 | | 120,000 | | | 106,236 |
| CONSOL Energy, Inc. | | | | | |
| 8.250%, due 04/01/20 | | 50,000 | | | 53,000 |
| Glencore Funding LLC | | | | | |
| 2.500%, due 01/15/192 | | 160,000 | | | 145,420 |
| Goldcorp, Inc. | | | | | |
| 3.700%, due 03/15/23 | | 100,000 | | | 91,171 |
| Murray Energy Corp. | | | | | |
| 8.625%, due 06/15/212 | | 25,000 | | | 24,875 |
| Southern Copper Corp. | | | | | |
| 3.500%, due 11/08/221 | | 115,000 | | | 101,777 |
| Teck Resources Ltd. | | | | | |
| 6.250%, due 07/15/41 | | 25,000 | | | 23,782 |
| Vale Overseas Ltd. | | | | | |
| 4.375%, due 01/11/22 | | 95,000 | | | 88,652 |
| 6.875%, due 11/21/36 | | 35,000 | | | 33,893 |
| | | | | 770,556 |
| Metals/mining excluding steel—0.07% | | | | |
| FMG Resources (August 2006) Pty Ltd. | | | | |
| 8.250%, due 11/01/191,2 | | 50,000 | | | 53,375 |
| Inmet Mining Corp. | | | | | |
| 8.750%, due 06/01/202 | | 50,000 | | | 52,250 |
| Penn Virginia Resource Partners | | | | | |
| LP/Penn Virginia Resource | | | | | |
| Finance Corp. II | | | | | |
| 8.375%, due 06/01/20 | | 75,000 | | | 78,000 |
| | | | | | 183,625 |
| Oil & gas—0.17% | | | | | |
| BreitBurn Energy Partners | | | | | |
| LP/BreitBurn Finance Corp. | | | | | |
| 7.875%, due 04/15/22 | | 100,000 | | | 99,000 |
| Petrobras International Finance Co. | | | | | |
| 2.875%, due 02/06/15 | | 85,000 | | | 86,360 |
| 5.375%, due 01/27/21 | | 140,000 | | | 136,570 |
| Petroleos Mexicanos | | | | | |
| 3.500%, due 07/18/181 | | 100,000 | | | 100,500 |
| | | | | 422,430 |
UBS U.S. Allocation Fund
Portfolio of investments—August 31, 2013
| Security description | Face
amount | | Value |
| Corporate bonds—(continued) | | | | | |
| Oil field equipment & services—0.20% | | | | |
| Offshore Group Investment Ltd. | | | | | |
| 7.500%, due 11/01/191 | $ | 200,000 | | $ | 208,000 |
| Pacific Drilling SA | | | | | |
| 5.375%, due 06/01/202 | | 100,000 | | | 96,500 |
| SESI LLC | | | | | |
| 7.125%, due 12/15/21 | | 185,000 | | | 200,263 |
| | | | | | 504,763 |
| Oil refining & marketing—0.03% | | | | | |
| Phillips 66 | | | | | |
| 4.300%, due 04/01/22 | | 75,000 | | | 75,807 |
| Packaging & containers—0.08% | | | | | |
| Mustang Merger Corp. | | | | | |
| 8.500%, due 08/15/212 | | 100,000 | | | 98,500 |
| Sealed Air Corp. | | | | | |
| 8.375%, due 09/15/212 | | 100,000 | | | 113,125 |
| | | | | | 211,625 |
| Paper & forest products—0.03% | | | | | |
| Georgia-Pacific LLC | | | | | |
| 8.875%, due 05/15/31 | | 35,000 | | | 48,126 |
| Mercer International, Inc. | | | | | |
| 9.500%, due 12/01/17 | | 35,000 | | | 37,363 |
| | | | | | 85,489 |
| Pharmaceuticals—0.37% | | | | | |
| Celgene Corp. | | | | | |
| 4.000%, due 08/15/23 | | 140,000 | | | 138,308 |
| ConvaTec Healthcare SA | | | | | |
| 10.500%, due 12/15/182 | | 200,000 | | | 224,000 |
| Endo Health Solutions, Inc. | | | | | |
| 7.250%, due 01/15/22 | | 25,000 | | | 25,562 |
| Grifols, Inc. | | | | | |
| 8.250%, due 02/01/18 | | 70,000 | | | 75,775 |
| Mylan, Inc. | | | | | |
| 2.600%, due 06/24/182 | | 100,000 | | | 98,983 |
| Teva Pharmaceutical Finance Co. BV | | | | | |
| 2.400%, due 11/10/16 | | 125,000 | | | 128,258 |
| Teva Pharmaceutical Finance IV BV | | | | | |
| 3.650%, due 11/10/21 | | 90,000 | | | 88,803 |
| Valeant Pharmaceuticals International | | | | |
| 7.000%, due 10/01/202 | | 150,000 | | | 157,500 |
| | | | | | 937,189 |
| Railroads—0.03% | | | | | |
| Burlington Northern Santa Fe LLC | | | | | |
| 6.150%, due 05/01/37 | | 25,000 | | | 28,339 |
| Norfolk Southern Corp. | | | | | |
| 3.250%, due 12/01/21 | | 50,000 | | | 48,938 |
| | | | | | 77,277 |
| Real estate investment trusts—0.14% | | | | |
| Boston Properties LP | | | | | |
| 3.800%, due 02/01/24 | | 150,000 | | | 143,758 |
| CBRE Services, Inc. | | | | | |
| 5.000%, due 03/15/23 | | 100,000 | | | 92,750 |
| DuPont Fabros Technology LP | | | | | |
| 8.500%, due 12/15/17 | | 75,000 | | | 79,125 |
| ERP Operating LP | | | | | |
| 4.750%, due 07/15/20 | | 35,000 | | | 37,473 |
| | | | | | 353,106 |
| Retail-specialty—0.22% | | | | | |
| Burlington Coat Factory | | | | | |
| Warehouse Corp. | | | | | |
| 10.000%, due 02/15/19 | | 75,000 | | | 83,625 |
| Claire’s Stores, Inc. | | | | | |
| 8.875%, due 03/15/191 | | 100,000 | | | 107,500 |
| L Brands, Inc. | | | | | |
| 8.500%, due 06/15/19 | | 45,000 | | | 53,156 |
| Michaels FinCo Holdings | | | | | |
| LLC/Michaels FinCo, Inc. | | | | | |
| 7.500%, due 08/01/181,2,7 | | 25,000 | | | 25,000 |
| Michaels Stores, Inc. | | | | | |
| 11.375%, due 11/01/161 | | 50,000 | | | 51,688 |
| Petco Animal Supplies, Inc. | | | | | |
| 9.250%, due 12/01/181,2 | | 60,000 | | | 64,650 |
| Rite Aid Corp. | | | | | |
| 9.250%, due 03/15/201 | | 75,000 | | | 84,844 |
| YCC Holdings LLC/Yankee | | | | | |
| Finance, Inc. | | | | | |
| 10.250%, due 02/15/167 | | 75,000 | | | 77,063 |
| | | | | | 547,526 |
| Software/services—0.09% | | | | | |
| BMC Software Finance, Inc. | | | | | |
| 8.125%, due 07/15/212 | | 50,000 | | | 50,625 |
| Ceridian Corp. | | | | | |
| 11.250%, due 11/15/156 | | 50,000 | | | 50,625 |
| Flextronics International Ltd. | | | | | |
| 5.000%, due 02/15/23 | | 75,000 | | | 72,000 |
| MedAssets, Inc. | | | | | |
| 8.000%, due 11/15/18 | | 50,000 | | | 53,750 |
| | | | | | 227,000 |
| Steel producers/products—0.04% | | | | | |
| Severstal Columbus LLC | | | | | |
| 10.250%, due 02/15/18 | | 50,000 | | | 53,000 |
| US Steel Corp. | | | | | |
| 7.375%, due 04/01/201 | | 50,000 | | | 50,250 |
| | | | | | 103,250 |
| Technology-hardware—0.23% | | | | | |
| Apple, Inc. | | | | | |
| 2.400%, due 05/03/23 | | 145,000 | | | 131,025 |
| Equinix, Inc. | | | | | |
| 5.375%, due 04/01/231 | | 100,000 | | | 95,250 |
| 7.000%, due 07/15/21 | | 50,000 | | | 53,625 |
| International Business Machines Corp. | | | | | |
| 3.375%, due 08/01/23 | | 130,000 | | | 127,481 |
| Jabil Circuit, Inc. | | | | | |
| 8.250%, due 03/15/18 | | 25,000 | | | 29,437 |
| Seagate HDD Cayman | | | | | |
| 4.750%, due 06/01/232 | | 100,000 | | | 92,250 |
| 7.000%, due 11/01/21 | | 50,000 | | | 54,125 |
| | | | | 583,193 |
UBS U.S. Allocation Fund
Portfolio of investments—August 31, 2013
| Security description | Face
amount | | Value |
| Corporate bonds—(continued) | | | | | |
| Technology-software—0.16% | | | | | |
| Epicor Software Corp. | | | | | |
| 8.625%, due 05/01/19 | $ | 15,000 | | $ | 15,825 |
| First Data Corp. | | | | | |
| 10.625%, due 06/15/212 | | 150,000 | | | 149,062 |
| 11.250%, due 03/31/161 | | 79,000 | | | 78,803 |
| 12.625%, due 01/15/21 | | 100,000 | | | 108,125 |
| Oracle Corp. | | | | | |
| 3.625%, due 07/15/23 | | 60,000 | | | 59,535 |
| | | | | | 411,350 |
| Telecom-wireless—0.27% | | | | | |
| America Movil SAB de CV | | | | | |
| 3.125%, due 07/16/22 | | 40,000 | | | 36,099 |
| 5.000%, due 03/30/20 | | 135,000 | | | 143,215 |
| Clearwire Communications | | | | | |
| LLC/Clearwire Finance, Inc. | | | | | |
| 12.000%, due 12/01/152 | | 25,000 | | | 26,375 |
| Crown Castle International Corp. | | | | | |
| 5.250%, due 01/15/23 | | 100,000 | | | 94,500 |
| SBA Telecommunications, Inc. | | | | | |
| 8.250%, due 08/15/19 | | 49,000 | | | 53,165 |
| Sprint Capital Corp. | | | | | |
| 6.875%, due 11/15/28 | | 100,000 | | | 90,250 |
| 6.900%, due 05/01/19 | | 100,000 | | | 103,000 |
| Wind Acquisition Finance SA | | | | | |
| 11.750%, due 07/15/172 | | 140,000 | | | 146,300 |
| | | | | 692,904 |
| Telephone-integrated—0.58% | | | | | |
| AT&T, Inc. | | | | | |
| 6.500%, due 09/01/37 | | 40,000 | | | 45,497 |
| CenturyLink, Inc. | | | | | |
| 6.450%, due 06/15/21 | | 100,000 | | | 99,500 |
| Embarq Corp. | | | | | |
| 7.995%, due 06/01/36 | | 50,000 | | | 51,318 |
| Frontier Communications Corp. | | | | | |
| 8.500%, due 04/15/201 | | 275,000 | | | 300,437 |
| 9.000%, due 08/15/31 | | 45,000 | | | 43,650 |
| Level 3 Communications, Inc. | | | | | |
| 11.875%, due 02/01/19 | | 25,000 | | | 28,688 |
| Level 3 Financing, Inc. | | | | | |
| 8.625%, due 07/15/20 | | 25,000 | | | 26,750 |
| 10.000%, due 02/01/18 | | 125,000 | | | 134,375 |
| Motorola Solutions, Inc. | | | | | |
| 3.500%, due 03/01/23 | | 180,000 | | | 166,233 |
| PAETEC Holding Corp. | | | | | |
| 9.875%, due 12/01/18 | | 65,000 | | | 72,312 |
| Sprint Communications, Inc. | | | | | |
| 6.000%, due 12/01/16 | | 90,000 | | | 95,400 |
| 8.375%, due 08/15/17 | | 75,000 | | | 84,187 |
| 9.000%, due 11/15/182 | | 25,000 | | | 29,188 |
| 9.125%, due 03/01/17 | | 25,000 | | | 28,688 |
| Telefonica Emisiones SAU | | | | | |
| 3.192%, due 04/27/18 | | 150,000 | | | 146,349 |
| Videotron Ltee | | | | | |
| 5.000%, due 07/15/22 | | 35,000 | | | 32,550 |
| Windstream Corp. | | | | | |
| 7.750%, due 10/01/21 | | 100,000 | | | 102,250 |
| | | | | | 1,487,372 |
| Textiles & apparel—0.02% | | | | | |
| The William Carter Co. | | | | | |
| 5.250%, due 08/15/212 | | 50,000 | | | 50,250 |
| Theaters & entertainment—0.04% | | | | | |
| Cinemark USA, Inc. | | | | | |
| 4.875%, due 06/01/23 | | 100,000 | | | 92,000 |
| Tobacco—0.23% | | | | | |
| Altria Group, Inc. | | | | | |
| 9.950%, due 11/10/38 | | 65,000 | | | 96,133 |
| Imperial Tobacco Finance PLC | | | | | |
| 3.500%, due 02/11/232 | | 130,000 | | | 121,722 |
| Philip Morris International, Inc. | | | | | |
| 2.900%, due 11/15/21 | | 150,000 | | | 144,159 |
| Reynolds American, Inc. | | | | | |
| 3.250%, due 11/01/22 | | 120,000 | | | 109,780 |
| 7.750%, due 06/01/18 | | 90,000 | | | 109,069 |
| | | | | | 580,863 |
| Transportation services—0.13% | | | | | |
| ERAC USA Finance LLC | | | | | |
| 2.800%, due 11/01/182 | | 120,000 | | | 119,273 |
| Marquette Transportation | | | | | |
| Co./Marquette Transportation | | | | | |
| Finance Corp. | | | | | |
| 10.875%, due 01/15/17 | | 50,000 | | | 53,250 |
| Navios Maritime Acquisition | | | | | |
| Corp./Navios Acquisition | | | | | |
| Finance US, Inc. | | | | | |
| 8.625%, due 11/01/17 | | 75,000 | | | 78,000 |
| Ryder System, Inc. | | | | | |
| 2.350%, due 02/26/19 | | 95,000 | | | 91,775 |
| | | | | | 342,298 |
| Total corporate bonds | | | | | |
| (cost—$28,364,871) | | | | | 28,109,980 |
UBS U.S. Allocation Fund
Portfolio of investments—August 31, 2013
| Security description | Face
amount | | Value |
| Municipal bonds & notes—0.44% | | | | | | |
| California—0.16% | | | | | | |
| California (Build America Bonds) | | | | | | |
| 7.550%, due 04/01/39 | $ | 230,000 | | $ | 298,133 | |
| Los Angeles Unified School District | | | | | | |
| (Build America Bonds) | | | | | | |
| 6.758%, due 07/01/34 | | 100,000 | | | 122,036 | |
| | | | | 420,169 | |
| Illinois—0.16% | | | | | | |
| Chicago Transit Authority Sales & | | | | | | |
| Transfer Tax Receipts Revenue, | | | | | | |
| Taxable Pension Funding, Series A, | | | | | | |
| 6.899%, due 12/01/40 | | 55,000 | | | 62,345 | |
| Illinois Taxable Pension | | | | | | |
| 5.100%, due 06/01/33 | | 125,000 | | | 109,519 | |
| State of Illinois | | | | | | |
| 5.877%, due 03/01/19 | | 225,000 | | | 242,527 | |
| | | | | 414,391 | |
| Massachusetts—0.04% | | | | | | |
| Massachusetts State Water | | | | | | |
| Resources Authority Refunding | | | | | | |
| General, Series A, | | | | | | |
| 5.000%, due 08/01/32 | | 90,000 | | | 93,785 | |
| New York—0.04% | | | | | | |
| New York State Dorm Authority | | | | | | |
| State Personal Income Tax Revenue, | | | | | | |
| General Purpose, Series C, | | | | | | |
| 5.000%, due 03/15/34 | | 90,000 | | | 91,983 | |
| Washington—0.04% | | | | | | |
| Washington State, | | | | | | |
| Series A-Various Purpose, | | | | | | |
| 5.000%, due 08/01/33 | | 100,000 | | | 103,799 | |
| Total municipal bonds & notes | | | | | | |
| (cost—$1,170,961) | | | | | 1,124,127 | |
| Repurchase agreement—38.61% | | | | | | |
| Repurchase agreement dated | | | | | | |
| 08/30/13 with State Street | | | | | | |
| Bank and Trust Co., 0.010% | | | | | | |
| due 09/03/13, collateralized by | | | | | | |
| $87,011,956 Federal Home Loan | | | | | | |
| Mortgage Corp. obligations, | | | | | | |
| 1.960% to 2.100% due 10/17/22 to | | | | | | |
| 01/30/23 and $23,395,102 Federal | | | | | | |
| National Mortgage Association | | | | | | |
| obligations, 2.080% due 11/02/22; | | | | | | |
| (value—$100,341,065); | | | | | | |
| proceeds: $98,373,109 | | | | | | |
| (cost—$98,373,000) | | 98,373,000 | | | 98,373,000 | |
| | | | | | | |
| | Shares | | | | |
| Investment of cash collateral from securities loaned—1.93% | |
| Money market fund—1.93% | | | | | | |
| UBS Private Money Market Fund LLC11 | | | | | | |
| (cost – $4,915,379) | | 4,915,379 | | | 4,915,379 | |
| Total investments | | | | | | |
| (cost—$248,935,403)—103.83% | | | | | 264,571,754 | |
| Liabilities in excess of other | | | | | | |
| assets—(3.83)% | | | | | (9,751,872 | ) |
| Net assets—100.00% | | | | $ | 254,819,882 | |
UBS U.S. Allocation Fund
Portfolio of investments—August 31, 2013
For a listing of defined portfolio acronyms that are used throughout the Portfolio of investments as well as the tables that follow, please refer to page 25.
Aggregate cost for federal income tax purposes was $250,596,237; and net unrealized appreciation consisted of:
| Gross unrealized appreciation | $ | 18,400,279 | |
| Gross unrealized depreciation | | (4,424,762 | ) |
| Net unrealized appreciation | $ | 13,975,517 | |
Futures contracts
Number of
contracts | | | | Expiration
date | | Cost | | Current
value | | Unrealized
appreciation
(depreciation) |
| US Treasury futures buy contracts: | | | | | | | | | | | | | | |
| 178 | | US Treasury Note 10 Year Futures | | December 2013 | | $ | 22,102,818 | | | $ | 22,122,063 | | | $ | 19,245 | |
| Index futures buy contracts: | | | | | | | | | | | | | | |
| 920 | | S&P 500 E-Mini Index Futures | | September 2013 | | | 74,353,988 | | | | 75,039,800 | | | | 685,812 | |
| 111 | | Russell 2000 Mini Index Futures | | September 2013 | | | 10,836,134 | | | | 11,212,110 | | | | 375,976 | |
| | | | | | $ | 107,292,940 | | | $ | 108,373,973 | | | $ | 1,081,033 | |
| |
| | | | | | | Proceeds | | | | | | | | | |
| US Treasury futures sell contracts: | | | | | | | | | | | | | | |
| 217 | | US Treasury Note 5 Year Futures | | December 2013 | | $ | (25,960,253 | ) | | $ | (25,970,493 | ) | | $ | (10,240 | ) |
| Index futures sell contracts: | | | | | | | | | | | | | | |
| 176 | | NASDAQ 100 E-Mini Index Futures | | September 2013 | | | (10,337,466 | ) | | | (10,818,720 | ) | | | (481,254 | ) |
| | | | | | $ | (36,297,719 | ) | | $ | (36,789,213 | ) | | $ | (491,494 | ) |
| | | | | | | | | | | | | | $ | 589,539 | |
Fair valuation summary
The following is a summary of the fair valuations according to the inputs used as of August 31, 2013 in valuing the Fund’s investments:
| Unadjusted quoted prices
in active markets for
identical investments
(Level 1) | | Other significant
observable inputs
(Level 2) | | Unobservable
inputs
(Level 3) | | Total |
| Common stocks | | $ | 96,628,292 | | | | $ | — | | | | $ | — | | | $ | 96,628,292 |
| Preferred stock | | | — | | | | | 4,679 | | | | | — | | | | 4,679 |
| US government obligations | | | — | | | | | 12,446,601 | | | | | — | | | | 12,446,601 |
| Mortgage & agency debt securities | | | — | | | | | 18,881,836 | | | | | — | | | | 18,881,836 |
| Collateralized mortgage obligations | | | — | | | | | 829,836 | | | | | — | | | | 829,836 |
| Asset-backed security | | | — | | | | | 224,277 | | | | | — | | | | 224,277 |
| Commercial mortgage-backed securities | | | — | | | | | 3,033,747 | | | | | — | | | | 3,033,747 |
| Corporate bonds | | | — | | | | | 28,108,405 | | | | | 1,575 | | | | 28,109,980 |
| Municipal bonds & notes | | | — | | | | | 1,124,127 | | | | | — | | | | 1,124,127 |
| Repurchase agreement | | | — | | | | | 98,373,000 | | | | | — | | | | 98,373,000 |
| Investment of cash collateral from securities loaned | | | — | | | | | 4,915,379 | | | | | — | | | | 4,915,379 |
| Futures contracts, net | | | 589,539 | | | | | — | | | | | — | | | | 589,539 |
| Total | | $ | 97,217,831 | | | | $ | 167,941,887 | | | | $ | 1,575 | | | $ | 265,161,293 |
At August 31, 2013, there were no transfers between Level 1 and Level 2.
UBS U.S. Allocation Fund
Portfolio of investments—August 31, 2013
The following is a rollforward of the Fund’s investments that were valued using unobservable inputs (Level 3) for the year ended August 31, 2013:
| Corporate
bonds |
| Beginning balance | | $659 | |
| Purchases | | — | |
| Sales | | 0 | |
| Accrued discounts/(premiums) | | 62 | |
| Total realized gain/(loss) | | (585,000 | ) |
| Net change in unrealized appreciation/depreciation | | 585,854 | |
| Transfers into Level 3 | | — | |
| Transfers out of Level 3 | | — | |
| Ending balance | | $1,575 | |
The change in net unrealized appreciation/depreciation relating to the Level 3 investment held at August 31, 2013 was $975.
Issuer breakdown by country or territory of origin (unaudited)
| Percentage of
total investments |
| United States | 95.2 | % |
| Israel | 0.7 | |
| Canada | 0.5 | |
| Luxembourg | 0.4 | |
| United Kingdom | 0.4 | |
| Cayman Islands | 0.4 | |
| British Virgin Islands | 0.4 | |
| Switzerland | 0.3 | |
| Netherlands | 0.3 | |
| Panama | 0.3 | |
| Bermuda | 0.2 | |
| Curacao | 0.2 | |
| Singapore | 0.2 | |
| Liberia | 0.1 | |
| Mexico | 0.1 | |
| Spain | 0.1 | |
| France | 0.1 | |
| Brazil | 0.1 | |
| Marshall Islands | 0.0 | † |
| Australia | 0.0 | † |
| Total | 100.0 | % |
† Amount represents less than 0.05%.
UBS U.S. Allocation Fund
Portfolio of investments—August 31, 2013
Portfolio footnotes |
| * | Non-income producing security. |
| ** | On September 7, 2008, the Federal Housing Finance Agency placed the Federal National Mortgage Association and the Federal Home Loan Mortgage Corporation into conservatorship, and the US Treasury guaranteed the debt issued by those organizations. |
| 1 | Security, or portion thereof, was on loan at August 31, 2013. |
| 2 | Security exempt from registration pursuant to Rule 144A under the Securities Act of 1933. These securities, which represent 2.73% of net assets as of August 31, 2013, are considered liquid and may be resold in transactions exempt from registration, normally to qualified institutional buyers. |
| 3 | Cumulative preferred stock. The next call date is October 9, 2013. |
| 4 | Variable or floating rate security. The interest rate shown is the current rate as of August 31, 2013 and changes periodically. |
| 5 | Perpetual bond security. The maturity date reflects the next call date. |
| 6 | Step bond that converts to the noted fixed rate at a designated future date. |
| 7 | Payment-in-kind security. Income may be paid in cash or additional notes, at the discretion of the issuer. |
| 8 | Security exempt from registration pursuant to Rule 144A under the Security Act of 1933. This security, which represents 0.01% of net assets as of August 31, 2013, is considered illiquid and may not be sold in transactions exempt from registration, normally to qualified buyers. |
| 9 | Security called in full on February 16, 2011. Position represents remaining escrow balance expected to be received upon finalization of call premium. |
| 10 | Illiquid investment representing less than 0.005% of net assets as of August 31, 2013. |
| 11 | Investment in affiliated company. See notes to financial statements for additional information. |
Fund acronyms
|
| ADR | | American Depositary Receipt |
| FDIC | | Federal Deposit Insurance Corporation |
| MTN | | Medium Term Note |
| OEM | | Original Equipment Manufacturer |
| REMIC | | Real Estate Mortgage Investment Conduit |
| TBA | | (To Be Announced) Security is purchased on a forward commitment basis with an approximate principal amount (generally +/- 1.0%) and no definite maturity date. The actual principal amount and maturity date will be determined upon settlement when the specific mortgage pools are assigned. |
| See accompanying notes to financial statements | 25 |
UBS U.S. Allocation Fund
Statement of assets and liabilities
August 31, 2013
| Assets: | | | |
| Investments in unaffiliated securities, at value (cost—$145,647,024)1 | $ | 161,283,375 | |
| Investment in affiliated security, at value (cost—$4,915,379) | | 4,915,379 | |
| Repurchase agreement, at value (cost—$98,373,000) | | 98,373,000 | |
| Total investments in securities, at value (cost—$248,935,403) | $ | 264,571,754 | |
| Cash | | 138,561 | |
| Cash collateral on futures | | 3,294,623 | |
| Receivable for investments sold | | 10,604,895 | |
| Receivable for shares of beneficial interest sold | | 5,533 | |
| Receivable for dividends and interest | | 650,070 | |
| Receivable for variation margin on futures contracts | | 592,797 | |
| Receivable for foreign tax reclaims | | 242 | |
| Other assets | | 24,438 | |
| Total assets | | 279,882,913 | |
| Liabilities: | | | |
| Payable for investments purchased | | 19,412,646 | |
| Payable for cash collateral from securities loaned | | 4,915,379 | |
| Payable for shares of beneficial interest repurchased | | 374,460 | |
| Payable to affiliates | | 205,548 | |
| Payable for foreign withholding taxes | | 700 | |
| Accrued expenses and other liabilities | | 154,298 | |
| Total liabilities | | 25,063,031 | |
| Net assets: | | | |
| Beneficial interest shares of $0.001 par value (unlimited amount authorized) | | 317,448,690 | |
| Accumulated undistributed net investment income | | 975,414 | |
| Accumulated net realized loss | | (79,830,112 | ) |
| Net unrealized appreciation | | 16,225,890 | |
| Net assets | $ | 254,819,882 | |
| Class A | | | |
| Net assets | $ | 167,031,119 | |
| Shares outstanding | | 4,934,214 | |
| Net asset value per share | $ | 33.85 | |
| Maximum offering price per share (net asset value plus maximum sales charge of 5.50%) | $ | 35.82 | |
| Class C | | | |
| Net assets | $ | 68,734,872 | |
| Shares outstanding | | 2,071,910 | |
| Net asset value and offering price per share | $ | 33.17 | |
| Class Y | | | |
| Net assets | $ | 19,053,891 | |
| Shares outstanding | | 555,105 | |
| Net asset value and offering price per share | $ | 34.32 | |
1 Includes $6,224,158, of investments in securities on loan, at value plus accrued interest and dividends, if any.
| 26 | See accompanying notes to financial statements |
UBS U.S. Allocation Fund
Statement of operations
| For the year ended
August 31, 2013 |
| Investment income: | | | | | |
| Dividends (net of foreign withholding taxes of $2,542) | | $ | 1,652,870 | | |
| Interest (net of foreign withholding taxes of $9) | | | 2,275,960 | | |
| Securities lending income (includes $2,250 earned from an affiliated entity) | | | 33,852 | | |
| | | | 3,962,682 | | |
| Expenses: | | | | | |
| Investment management and administration fees | | | 1,288,607 | | |
| Service fees—Class A | | | 424,755 | | |
| Service and distribution fees—Class C | | | 697,337 | | |
| Transfer agency and related services fees—Class A | | | 172,512 | | |
| Transfer agency and related services fees—Class C | | | 76,875 | | |
| Transfer agency and related services fees—Class Y | | | 13,369 | | |
| Professional fees | | | 178,234 | | |
| Custody and accounting fees | | | 107,663 | | |
| Reports and notices to shareholders | | | 76,371 | | |
| State registration fees | | | 49,238 | | |
| Trustees’ fees | | | 16,185 | | |
| Insurance expense | | | 5,689 | | |
| Other expenses | | | 25,577 | | |
| Total expenses | | | 3,132,412 | | |
| Net investment income | | | 830,270 | | |
| Net realized and unrealized gains (losses) | | | | | |
| from investment activities: | | | | | |
| Net realized gains from: | | | | | |
| Investments in unaffiliated issuers | | | 21,191,476 | | |
| Investment in affiliated issuer | | | 1,793,352 | | |
| Futures | | | 6,874,951 | | |
| Swaps | | | 352,272 | | |
| Net realized gain | | | 30,212,051 | | |
| Net change in unrealized appreciation/depreciation of: | | | | | |
| Investments in unaffiliated issuers | | | 1,767,180 | | |
| Investment in affiliated issuer | | | (2,039,611 | ) | |
| Futures | | | 70,214 | | |
| Swaps | | | 31,867 | | |
| Net change in unrealized appreciation/depreciation | | | (170,350 | ) | |
| Net realized and unrealized gain from investment activities | | | 30,041,701 | | |
| Net increase in net assets resulting from operations | | $ | 30,871,971 | | |
| See accompanying notes to financial statements | 27 |
UBS U.S. Allocation Fund
Statement of changes in net assets
| For the years ended August 31, |
| 2013 | | 2012 |
| From operations: | | | | | | | |
| Net investment income | $ | 830,270 | | | $ | 920,589 | |
| Net realized gains | | 30,212,051 | | | | 13,731,479 | |
| Net change in unrealized appreciation/depreciation | | (170,350 | ) | | | 13,758,648 | |
| Net increase in net assets resulting from operations | | 30,871,971 | | | | 28,410,716 | |
| Dividends to shareholders from: | | | | | | | |
| Net investment income—Class A | | (857,187 | ) | | | (1,853,059 | ) |
| Net investment income—Class C | | — | | | | (166,185 | ) |
| Net investment income—Class Y | | (139,744 | ) | | | (259,667 | ) |
| Total dividends to shareholders | | (996,931 | ) | | | (2,278,911 | ) |
| From beneficial interest transactions: | | | | | | | |
| Net proceeds from shares sold | | 1,880,508 | | | | 4,392,621 | |
| Cost of shares repurchased | | (40,189,217 | ) | | | (44,535,126 | ) |
| Proceeds from dividends reinvested | | 906,535 | | | | 2,065,080 | |
| Net decrease in net assets from beneficial interest transactions | | (37,402,174 | ) | | | (38,077,425 | ) |
| Redemption fees | | 2,877 | | | | 511 | |
| Net decrease in net assets | | (7,524,257 | ) | | | (11,945,109 | ) |
| Net assets: | | | | | | | |
| Beginning of year | | 262,344,139 | | | | 274,289,248 | |
| End of year | $ | 254,819,882 | | | $ | 262,344,139 | |
| Accumulated undistributed net investment income | $ | 975,414 | | | $ | 1,009,006 | |
| 28 | See accompanying notes to financial statements |
UBS U.S. Allocation Fund
Financial highlights
Selected data for a share of beneficial interest outstanding throughout each year is presented below:
| | Class A |
| | Years ended August 31, |
| | 2013 | | 2012 | | 2011 | | 2010 | | 2009 |
| Net asset value, beginning of year | | $30.13 | | | $27.34 | | | $24.16 | | | $22.96 | | | $28.83 | |
| Net investment income1 | | 0.16 | | | 0.15 | | | 0.25 | | | 0.32 | | | 0.46 | |
| Net realized and unrealized gains (losses) | | 3.72 | | | 2.94 | | | 3.34 | | | 1.47 | | | (5.65 | ) |
| Net increase (decrease) from operations | | 3.88 | | | 3.09 | | | 3.59 | | | 1.79 | | | (5.19 | ) |
| Dividends from net investment income | | (0.16 | ) | | (0.30 | ) | | (0.41 | ) | | (0.59 | ) | | (0.68 | ) |
| Net asset value, end of year | | $33.85 | | | $30.13 | | | $27.34 | | | $24.16 | | | $22.96 | |
| Total investment return2 | | 12.92 | % | | 11.42 | % | | 14.85 | % | | 7.75 | % | | (17.49 | )% |
| Ratios to average net assets: | | | | | | | | | | | | | | | |
| Expenses before fee waivers | | 1.03 | % | | 1.03 | % | | 1.02 | % | | 1.03 | % | | 1.05 | % |
| Expenses after fee waivers | | 1.03 | % | | 1.03 | % | | 1.02 | % | | 1.03 | % | | 1.05 | % |
| Net investment income | | 0.51 | % | | 0.53 | % | | 0.92 | % | | 1.30 | % | | 2.26 | % |
| Supplemental data: | | | | | | | | | | | | | | | |
| Net assets, end of year (000’s) | | $167,031 | | | $173,218 | | | $178,780 | | | $190,007 | | | $221,983 | |
| Portfolio turnover | | 148 | % | | 150 | % | | 157 | % | | 138 | % | | 111 | % |
| 1 Calculated using the average shares method. |
| 2 Total investment return is calculated assuming a $10,000 investment on the first day of each year reported, reinvestment of all dividends and other distributions, if any, at net asset value on the ex-dividend dates, and a sale at net asset value on the last day of each year reported. The figures do not include any applicable sales charges or redemption fees; results would be lower if they were included. Returns do not reflect the deduction of taxes that a shareholder would pay on Fund distributions or the redemption of Fund shares. |
| See accompanying notes to financial statements | 29 |
UBS U.S. Allocation Fund
Financial highlights
Selected data for a share of beneficial interest outstanding throughout each year is presented below:
| | Class C |
| | Years ended August 31, |
| | 2013 | | 2012 | | 2011 | | 2010 | | 2009 |
| Net asset value, beginning of year | | $29.60 | | | $26.83 | | | $23.70 | | | $22.55 | | | $28.19 | |
| Net investment income (loss)1 | | (0.08 | ) | | (0.06 | ) | | 0.04 | | | 0.13 | | | 0.30 | |
| Net realized and unrealized gains (losses) | | 3.65 | | | 2.89 | | | 3.28 | | | 1.43 | | | (5.50 | ) |
| Net increase (decrease) from operations | | 3.57 | | | 2.83 | | | 3.32 | | | 1.56 | | | (5.20 | ) |
| Dividends from net investment income | | — | | | (0.06 | ) | | (0.19 | ) | | (0.41 | ) | | (0.44 | ) |
| Net asset value, end of year | | $33.17 | | | $29.60 | | | $26.83 | | | $23.70 | | | $22.55 | |
| Total investment return2 | | 12.06 | % | | 10.59 | % | | 14.00 | % | | 6.90 | % | | (18.10 | )% |
| Ratios to average net assets: | | | | | | | | | | | | | | | |
| Expenses before fee waivers | | 1.79 | % | | 1.79 | % | | 1.77 | % | | 1.78 | % | | 1.80 | % |
| Expenses after fee waivers | | 1.79 | % | | 1.79 | % | | 1.77 | % | | 1.78 | % | | 1.80 | % |
| Net investment income (loss) | | (0.25 | )% | | (0.23 | )% | | 0.16 | % | | 0.55 | % | | 1.51 | % |
| Supplemental data: | | | | | | | | | | | | | | | |
| Net assets, end of year (000’s) | | $68,735 | | | $70,215 | | | $74,702 | | | $79,561 | | | $94,818 | |
| Portfolio turnover | | 148 | % | | 150 | % | | 157 | % | | 138 | % | | 111 | % |
| 1 Calculated using the average shares method. |
| 2 Total investment return is calculated assuming a $10,000 investment on the first day of each year reported, reinvestment of all dividends and other distributions, if any, at net asset value on the ex-dividend dates, and a sale at net asset value on the last day of each year reported. The figures do not include any applicable sales charges or redemption fees; results would be lower if they were included. Returns do not reflect the deduction of taxes that a shareholder would pay on Fund distributions or the redemption of Fund shares. |
| 30 | See accompanying notes to financial statements |
UBS U.S. Allocation Fund
Financial highlights
Selected data for a share of beneficial interest outstanding throughout each year is presented below:
| | Class Y |
| | Years ended August 31, |
| | 2013 | | 2012 | | 2011 | | 2010 | | 2009 |
| Net asset value, beginning of year | | $30.54 | | | $27.72 | | | $24.51 | | | $23.29 | | | $29.27 | |
| Net investment income1 | | 0.26 | | | 0.24 | | | 0.34 | | | 0.41 | | | 0.55 | |
| Net realized and unrealized gains (losses) | | 3.76 | | | 2.97 | | | 3.37 | | | 1.49 | | | (5.75 | ) |
| Net increase (decrease) from operations | | 4.02 | | | 3.21 | | | 3.71 | | | 1.90 | | | (5.20 | ) |
| Dividends from net investment income | | (0.24 | ) | | (0.39 | ) | | (0.50 | ) | | (0.68 | ) | | (0.78 | ) |
| Net asset value, end of year | | $34.32 | | | $30.54 | | | $27.72 | | | $24.51 | | | $23.29 | |
| Total investment return2 | | 13.24 | % | | 11.74 | % | | 15.17 | % | | 8.13 | % | | (17.16 | )% |
| Ratios to average net assets: | | | | | | | | | | | | | | | |
| Expenses before fee waivers | | 0.75 | % | | 0.75 | % | | 0.73 | % | | 0.70 | % | | 0.65 | % |
| Expenses after fee waivers | | 0.75 | % | | 0.75 | % | | 0.73 | % | | 0.70 | % | | 0.65 | % |
| Net investment income | | 0.78 | % | | 0.81 | % | | 1.20 | % | | 1.63 | % | | 2.65 | % |
| Supplemental data: | | | | | | | | | | | | | | | |
| Net assets, end of year (000’s) | | $19,054 | | | $18,911 | | | $19,287 | | | $24,955 | | | $34,630 | |
| Portfolio turnover | | 148 | % | | 150 | % | | 157 | % | | 138 | % | | 111 | % |
| 1 Calculated using the average shares method. |
| 2 Total investment return is calculated assuming a $10,000 investment on the first day of each year reported, reinvestment of all dividends and other distributions, if any, at net asset value on the ex-dividend dates, and a sale at net asset value on the last day of each year reported. The figures do not include any applicable sales charges or redemption fees; results would be lower if they were included. Returns do not reflect the deduction of taxes that a shareholder would pay on Fund distributions or the redemption of Fund shares. |
| See accompanying notes to financial statements | 31 |
UBS U.S. Allocation Fund
Notes to financial statements
Organization and significant accounting policies
UBS U.S. Allocation Fund (the “Fund”) is a series of UBS Investment Trust (the “Trust”) and is registered with the US Securities and Exchange Commission (“SEC”) under the Investment Company Act of 1940 (the “1940 Act”), as amended, as an open-end, diversified management investment company. The Trust was organized on March 28, 1991, as a business trust under the laws of the Commonwealth of Massachusetts and currently has one operating series.
The Fund offers Class A, Class C and Class Y shares. Each class represents interests in the same assets of the Fund, and the classes are identical except for differences in their sales charge structures, ongoing service and distribution charges and certain transfer agency and related services expenses. All classes of shares have equal voting privileges except that Class A and Class C shares each have exclusive voting rights with respect to their respective service and/or distribution plans. Class Y shares have no service or distribution plan.
In the normal course of business the Fund may enter into contracts that contain a variety of representations or that provide indemnification for certain liabilities. The Fund’s maximum exposure under these arrangements is unknown, as this would involve future claims that may be made against the Fund that have not yet occurred. However, the Fund has not had such claims or losses through August 31, 2013 pursuant to these contracts and expects the risk of loss to be remote.
The Financial Accounting Standards Board (“FASB”) Accounting Standards Codification (“ASC”) is the exclusive reference of authoritative US generally accepted accounting principles (“US GAAP”) recognized by the FASB to be applied by nongovernmental entities. Rules and interpretive releases of the SEC under authority of federal laws are also sources of authoritative US GAAP for SEC registrants. The Fund’s financial statements are prepared in accordance with US GAAP, which may require the use of management estimates and assumptions. Actual results could differ from those estimates. The following is a summary of significant accounting policies:
Valuation of investments
The Fund calculates its net asset value on days that the New York Stock Exchange (“NYSE”) is open. The Fund calculates net asset value separately for each class as of the close of regular trading on the NYSE (generally, 4:00 p.m., Eastern time). If trading on the NYSE is halted for the day before 4:00 p.m., Eastern time, the Fund’s net asset value per share will be calculated as of the time trading was halted.
The Fund calculates its net asset value based on the current market value, where available, for its portfolio securities. The Fund normally obtains market values for its investments from independent pricing sources and broker-dealers. Independent pricing sources may use reported last sale prices, official market closing prices, current market quotations or valuations from computerized evaluation systems that derive values based on comparable investments. An evaluation system incorporates parameters such as security quality, maturity and coupon, and/or research and evaluation by its staff, including review of broker-dealer market price quotations, if available, in determining the valuation of the portfolio investments. Investments also may be valued based on appraisals derived from information concerning the investments or similar investments received from recognized dealers in those holdings.
Investments traded in the over-the-counter (“OTC”) market and listed on The NASDAQ Stock Market, Inc. (“NASDAQ”) normally are valued at the NASDAQ Official Closing Price. Other OTC securities are valued at the last bid price on the valuation date available prior to valuation. Investments which are listed on US and foreign stock exchanges normally are valued at the market closing price, the last sale price on the day the securities are valued or, lacking any sales on such day, at the last available bid price. In cases where investments are traded on more than one exchange, the investments are valued on the exchange designated as the primary market by UBS Global Asset Management (Americas) Inc. (“UBS Global AM” or the “Advisor”), the investment advisor of the Fund. UBS Global AM is an indirect wholly owned asset management subsidiary of UBS AG, an internationally diversified organization with headquarters in Zurich and Basel, Switzerland and operations in many areas of the financial services industry. If
UBS U.S. Allocation Fund
Notes to financial statements
a market value is not readily available from an independent pricing source for a particular security, that investment is valued at fair value as determined in good faith by or under the direction of the Board of Trustees (the “Board”). Various factors may be reviewed in order to make a good faith determination of an investment’s fair value. These factors include, but are not limited to, the type and cost of the security; contractual or legal restrictions on resale of the security; relevant financial or business developments of the issuer; actively traded similar or related securities; conversion or exchange rights on the security; related corporate actions; and changes in overall market conditions. If events occur that materially affect the value of securities (particularly non-US securities) between the close of trading in those securities and the close of regular trading on the New York Stock Exchange, these securities are fair valued.
The amortized cost method of valuation, which approximates market value, generally is used to value short-term debt-instruments with 60 days or less remaining to maturity, unless the Board determines that this does not represent fair value. Investments in open-end investment companies are valued at the daily closing net asset value of the respective investment company. Pursuant to the Fund’s use of the practical expedient within ASC Topic 820, investments in non-registered investment companies are also valued at the daily net asset value. Futures contracts are generally valued at the settlement price established each day on the exchange on which they are traded. Swaps are marked-to-market daily based upon values from third party vendors or quotations from market makers to the extent available. In the event that the market quotations are not readily available or deemed unreliable, the swap is valued at fair value as determined in good faith by or under the direction of the Board.
The Board has delegated to the UBS Global AM Global Valuation Committee (“GVC”) the responsibility for making fair value determinations with respect to the Fund’s holdings. The GVC is comprised of representatives of management, including members of the investment team. The GVC provides reports to the Board at each quarterly meeting regarding any investments that have been fair valued, valued pursuant to standing instructions approved by the GVC, or where non-vendor pricing sources had been used to make fair value determinations when sufficient information exists during the prior quarter. Fair valuation determinations are subject to review at least monthly by the GVC during scheduled meetings. Pricing decisions, processes, and controls over fair value determinations are subject to internal and external reviews, including annual internal compliance reviews and periodic internal audit reviews of securities valuations.
US GAAP requires disclosure surrounding the various inputs that are used in determining the value of the Fund’s investments. These inputs are summarized into the three broad levels listed below:
Level 1—Unadjusted quoted prices in active markets for identical investments.
Level 2—Other significant observable inputs, including but not limited to, quoted prices for similar investments, interest rates, prepayment speeds and credit risks.
Level 3—Unobservable inputs inclusive of the Fund’s own assumptions in determining the fair value of investments.
In accordance with the requirements of US GAAP, a fair value hierarchy has been included near the end of the Fund’s Portfolio of investments.
In January 2013, Accounting Standards Update 2013-01 (“ASU 2013-01”), “Clarifying the Scope of Disclosures about Offsetting Assets and Liabilities”, replaced Accounting Standards Update 2011-11 (“ASU 2011-11”), “Disclosures about Offsetting Assets and Liabilities”. ASU 2013-01 is effective for fiscal years beginning on or after January 1, 2013, and interim periods within those annual periods. ASU 2011-11 was intended to enhance disclosure requirements on the offsetting of financial assets and liabilities. ASU 2013-01 limits the scope of the new balance sheet offsetting disclosures to derivatives, repurchase agreements, and securities lending transactions to the extent that they are (1) offset in the financial statements or (2) subject to an enforceable master netting arrangement or similar agreement. Management is currently evaluating the application of ASU 2013-01 and its impact, if any, on the Fund’s financial statements.
UBS U.S. Allocation Fund
Notes to financial statements
The provisions of ASC Topic 815 “Derivatives and Hedging” (“ASC Topic 815”) require qualitative disclosures about objectives and strategies for using derivatives, quantitative disclosures about fair value amounts of gains and losses on derivative instruments and disclosures about credit-risk related contingent features in derivative agreements. Since investment companies value their derivatives at fair value and recognize changes in fair value through the Statement of operations, they do not qualify for hedge accounting under ASC Topic 815. Accordingly, even though a Fund’s investments in derivatives may represent economic hedges, they are considered to be non-hedge transactions for purposes of disclosure under ASC Topic 815. ASC Topic 815 requires (1) objectives for using derivative instruments be disclosed in terms of underlying risk and accounting designation, (2) the fair values of derivative instruments and their gains and losses be disclosed in a tabular format, and (3) information be disclosed about credit-risk contingent features of derivatives contracts. The Fund may enter into derivative contracts that may contain credit-risk related contingent features that could be triggered subject to certain circumstances. Such circumstances include agreed upon net asset value thresholds. If triggered, the derivative counterparty could request additional cash margin and/or terminate the derivative contract. Details of this disclosure can be found below as well as in the Portfolio of investments. The Advisor is not aware of any additional credit-risk contingent features on derivative contracts held by the Fund (other than those described earlier). The volume of derivatives that is presented in the Portfolio of investments of the Fund is consistent with the derivative activity during the year ended August 31, 2013.
At August 31, 2013, the Fund had the following derivatives categorized by underlying risk:
| Asset derivatives |
| Interest
rate risk | | Equity
risk | | Total |
| Futures contracts1 | | $19,245 | | | $ | 1,061,788 | | | $ | 1,081,033 | |
| Liability derivatives |
| Interest
rate risk | | Equity
risk | | Total |
| Futures contracts1 | $ | (10,240 | ) | | $ | (481,254 | ) | | $ | (491,494 | ) |
| 1 Futures contracts are reported in the table above using the cumulative appreciation (depreciation) as detailed in the futures contract table at the end of the Portfolio of investments, but only the variation margin to be received or paid, if any, is reported within the Statement of assets and liabilities. |
Net realized and unrealized gains (losses) from derivative instruments during the year ended August 31, 2013, were as follows:
| Interest
rate risk | | Equity
risk | | Total |
| Net realized gain (loss)2 | | | | | | | | | | | |
| Futures contracts | $ | (236,841 | ) | | $ | 7,111,792 | | | $ | 6,874,951 | |
| Swap agreements | | 352,272 | | | | — | | | | 352,272 | |
| Options purchased3 | | — | | | | (606,608 | ) | | | (606,608 | ) |
| Total net realized gain | $ | 115,431 | | | $ | 6,505,184 | | | $ | 6,620,615 | |
| Net change in unrealized appreciation/depreciation4 | | | | | | | | | | | |
| Futures contracts | $ | (65,847 | ) | | $ | 136,061 | | | $ | 70,214 | |
| Swap agreements | | 31,867 | | | | — | | | | 31,867 | |
| Total net change in unrealized appreciation/depreciation | $ | (33,980 | ) | | $ | 136,061 | | | $ | 102,081 | |
| 2 The net realized gains are shown in the Statement of operations in net realized gains from futures and swaps. |
| 3 Net realized loss is included in net realized gains from investments in unaffiliated issuers in the Statement of operations. |
| 4 The net change in unrealized appreciation/depreciation is shown in the Statement of operations in net change in unrealized appreciation/depreciation of futures and swaps. |
UBS U.S. Allocation Fund
Notes to financial statements
Repurchase agreements
The Fund may purchase securities or other obligations from a bank or securities dealer (or its affiliate), subject to the seller’s agreement to repurchase them at an agreed upon date (or upon demand) and price. The Fund maintains custody of the underlying obligations prior to their repurchase, either through its regular custodian or through a special “tri-party” custodian or sub-custodian that maintains a separate account for both the Fund and its counterparty. The underlying collateral is valued daily in an effort to ensure that the value, including accrued interest, is at least equal to the repurchase price. In the event of default of the obligation to repurchase, the Fund generally has the right to liquidate the collateral and apply the proceeds in satisfaction of the obligation. Repurchase agreements involving obligations other than US government securities (such as commercial paper, corporate bonds, equities and mortgage loans) may be subject to special risks and may not have the benefit of certain protections in the event of counterparty insolvency. If the seller (or seller’s guarantor, if any) becomes insolvent, the Fund may suffer delays, costs and possible losses in connection with the disposition or retention of the collateral. Under certain circumstances, in the event of default or bankruptcy by the other party to the agreement, realization and/or retention of the collateral may be subject to legal proceedings. The Fund may participate in joint repurchase agreement transactions with other funds managed or advised by UBS Global AM in accordance with an exemptive order granted by the SEC pursuant to Section 17(d) of the Act and Rule 17d-1 thereunder.
Under certain circumstances, the Fund may engage in a repurchase agreement transaction with a yield of zero in order to invest cash amounts remaining in its portfolio at the end of the day in order to avoid having the Fund assessed a fee for uninvested cash held in a business account at a bank.
Restricted securities
The Fund may invest in securities that are subject to legal or contractual restrictions on resale. These securities generally may be resold in transactions exempt from registration or to the public if the securities are registered. Disposal of these securities may involve time-consuming negotiations and expense, and prompt sale at an acceptable price may be difficult. Information regarding restricted securities, if any, is included at the end of the Fund’s Portfolio of investments.
Investment transactions, investment income and expenses
Investment transactions are recorded on the trade date. Realized gains and losses from investment transactions are calculated using the identified cost method. Dividend income is recorded net of withholding taxes on the ex-dividend date (“ex-date”). Interest income is recorded on an accrual basis. Discounts are accreted and premiums are amortized as adjustments to interest income and the identified cost of investments.
Income, expenses (excluding class-specific expenses) and realized/unrealized gains/losses are allocated proportionately to each class of shares based upon the relative net asset value of outstanding shares (or the value of dividend eligible shares, as appropriate) of each class at the beginning of the day (after adjusting for current capital share activity of the respective classes). Class-specific expenses are charged directly to the applicable class of shares.
Securities traded on to-be-announced basis
The Fund may from time to time purchase securities on a to-be-announced (“TBA”) basis. In a TBA transaction, the Fund commits to purchasing or selling securities for which all specific information is not yet known at the time of the trade, particularly the face amount and maturity date of the underlying security transactions. Securities purchased on a TBA basis are not settled until they are delivered to the Fund, normally 15 to 45 days later. Beginning on the date the Fund enters into a TBA transaction, cash, US government securities or other liquid securities are segregated in an amount equal in value to the purchase price of the TBA security. These transactions are subject to market fluctuations, and their current value is determined in the same manner as for other securities.
UBS U.S. Allocation Fund
Notes to financial statements
Purchased options
The Fund may purchase put and call options. Purchasing call options tends to increase exposure to the underlying instrument. Purchasing put options tends to decrease exposure to the underlying instrument. The Fund pays a premium which is included on the Statement of assets and liabilities as an investment and subsequently marked to market to reflect the current value of the option. Premiums paid for purchasing options which expire are treated as realized losses. The risk associated with purchasing put and call options is limited to the premium paid. Premiums paid for purchasing options which are exercised or closed are added to the amounts paid or offset against the proceeds on the underlying future, security or currency transaction to determine the realized gain or loss. Purchased options are shown as fund holdings within the Portfolio of investments and are included in the Statement of assets and liabilities in investments in unaffiliated securities, at value.
Futures contracts
The Fund may use futures contracts as part of its investment strategy, for hedging purposes to adjust exposure to US and foreign markets in connection with a reallocation of the Fund’s assets or to manage the average duration of the Fund. In addition, the Fund may purchase or sell futures contracts or purchase options thereon to increase or reduce its exposure to an asset class without purchasing or selling the underlying securities, either as a hedge or to enhance performance. Using futures contracts involves various market risks, including interest rate and equity risk. Risks of entering into futures contracts include the possibility that there may be an illiquid market or that a change in the value of the contract may not correlate with changes in the value of the underlying securities. To the extent that market prices move in an unexpected direction, there is a risk that the Fund will not achieve the anticipated benefits of the futures contract or may realize a loss.
Upon entering into a futures contract, the Fund is required to deliver to a broker an amount of cash and/or government securities equal to a certain percentage of the contract amount. This amount is known as the “initial margin.” Subsequent payments, known as “variation margin”, generally are made or received by the Fund each day, depending on the fluctuations in the value of the underlying futures contracts, except that in the case of certain futures contracts payments may be made or received at settlement. Such variation margin is recorded for financial statement purposes on a daily basis as an unrealized gain or loss on futures until the futures contract is closed, at which time the net gain or loss is reclassified to realized gain or loss on futures.
Swap agreements
The Fund may enter into interest rate swap agreements. This type of swap is an agreement that obligates two parties to exchange a series of cash flows at specified intervals based upon or calculated by reference to a specified interest rate(s) for a specified amount. The payment flows are usually netted against each other, with the difference being paid by one party to the other.
Risks may arise as a result of the failure of the counterparty to the swap agreement to comply with the terms of the agreement. The loss incurred by the failure of a counterparty is generally limited to the net interest payment to be received by the Fund. Therefore, the Fund considers the creditworthiness of the counterparty to a swap agreement in evaluating potential credit risk.
The Fund accrues for interim payments on swap agreements on a daily basis, with the net amount recorded within swap agreements on the Statement of assets and liabilities. Once interim payments are settled in cash, the net amount is recorded as realized gain/loss on swaps, in addition to realized gain/loss recorded upon the termination of swap contracts on the Statement of operations. Fluctuations in the value of interest rate swap agreements are recorded for financial statement purposes as unrealized appreciation or depreciation of swaps within the Statement of operations.
UBS U.S. Allocation Fund
Notes to financial statements
Inflation swap agreements are used to hedge inflation risk by transferring inflation risk from one party to another through an exchange of cash flows. In an inflation swap, one party pays a fixed rate on a notional principal amount while the other party pays a floating rate linked to an inflation index on that same notional amount. The party paying the floating rate pays the inflation adjusted rate multiplied by the notional principal amount. If the average inflation rate over the term of the swap is the same as the fixed rate of the swap, the two legs will have the same value and the swap will break even.
Dividends and distributions
Dividends and distributions to shareholders are recorded on the ex-dividend date. The amounts of dividends and distributions are determined in accordance with federal income tax regulations, which may differ from US GAAP. These “book/tax” differences are either considered temporary or permanent in nature. To the extent these differences are permanent in nature, such amounts are reclassified within the capital accounts based on their federal tax-basis treatment; temporary differences do not require reclassification.
Concentration of risk
Investing in securities of foreign issuers and currency transactions may involve certain considerations and risks not typically associated with investments in the United States. These risks include revaluation of currencies, adverse fluctuations in foreign currency values and possible adverse political, social and economic developments, including those particular to a specific industry, country or region, which could cause the securities and their markets to be less liquid and prices more volatile than those of comparable US companies and US government securities. These risks are greater with respect to securities of issuers located in emerging market countries. The ability of the issuers of the debt securities held by the Fund to meet their obligations may be affected by economic developments, including those particular to a specific industry, country, state or region.
Investment advisor and administrator fees and other transactions with affiliates
The Board has approved an Investment Advisory and Administration Contract (the “Advisory Contract”), under which UBS Global AM serves as investment advisor and administrator of the Fund. In accordance with the Advisory Contract, the Fund is to pay UBS Global AM an investment advisory and administration fee, which is to be accrued daily and paid monthly, at an annual rate of 0.50% of the Fund’s average daily net assets up to $250 million and 0.45% thereafter.
UBS Global AM has agreed to permanently reduce its advisory and administration fee based on the Fund’s average daily net assets so that it is assessed as follows: $0 to $250 million – 0.50%; in excess of $250 million up to $500 million – 0.45%; in excess of $500 million up to $2 billion – 0.40%; and over $2 billion – 0.35%. Accordingly, for the year ended August 31, 2013, UBS Global AM did not waive any investment advisory and administration fees. At August 31, 2013, the Fund owed UBS Global AM $109,883 for investment advisory and administration fees.
UBS Global AM has contractually undertaken to waive fees/reimburse a portion of the Fund’s expenses, when necessary, to maintain the total annual operating expenses (excluding (1) dividend expense, borrowing costs and interest expense relating to short sales, and (2) investments in other investment companies, interest, taxes, brokerage commissions and extraordinary expenses, if any) of Class A, Class C and Class Y shares at a level not to exceed 1.15%, 1.90% and 0.90%, respectively through December 31, 2013. The Fund will repay UBS Global AM for any previously waived fees/reimbursed expenses during the three-year period following August 31, 2013, to the extent that operating expenses (with certain exclusions such as dividend expense, borrowing costs, and interest expense relating to short sales, and interest, taxes, brokerage commissions and extraordinary expenses, if any) are otherwise below the expense caps in effect at the time the fees or expenses were waived/reimbursed. For the year ended August 31, 2013, the Fund had no fee waivers/expense reimbursements subject to repayment.
UBS U.S. Allocation Fund
Notes to financial statements
For the year ended August 31, 2013, the Fund paid $314 in brokerage commissions to UBS Securities LLC, an indirect wholly owned subsidiary of UBS AG, for transactions executed on behalf of the Fund.
The Fund may invest in certain affiliated investment companies also advised or managed by the Advisor. Investments in affiliated investment companies for the year ended August 31, 2013 were as follows:
Affiliated
investment
company | | Value at
08/31/12 | | Purchases
during the
year ended
08/31/13 | | Sales
during the
year ended
08/31/13 | | Net
realized
gain | | Change
in net
unrealized
appreciation | | Value at
08/31/13 |
| UBS Credit Bond | | | | | | | | | | | | |
| Relationship Fund | | $11,086,530 | | $— | | $10,840,271 | | $1,793,352 | | $(2,039,611) | | $— |
Under normal conditions, the Fund invests cash collateral from securities lending activities into an affiliated private money market fund, UBS Private Money Market Fund LLC (“Private Money Market”), which operates in compliance with most of the substantive provisions of Rule 2a-7 of the 1940 Act. Private Money Market is managed by UBS Global AM and is currently offered as a cash management option to mutual funds and certain other accounts managed by the Fund’s investment manager. UBS Global AM acts as managing member and receives a management fee from Private Money Market payable monthly in arrears at the annual rate of 0.10% of Private Money Market’s average daily members’ equity, minus the aggregate operating expenses of, and incurred by, Private Money Market during each such related month, not including investment expenses (including brokerage commissions, taxes, interest charges and other costs with respect to transactions in securities) and extraordinary expenses including litigation expenses, if any. UBS Global AM may, in its sole discretion, waive all or any portion of the management fee to which it may be entitled from time to time in order to maintain operating expenses or net yields at a certain level. Distributions received from Private Money Market, if any, net of fee rebates paid to borrowers, would be reflected as securities lending income in the Statement of operations.
Amounts relating to the investment for the year ended August 31, 2013, were as follows:
| | Value at
08/31/12 | | Purchases
during the
year ended
08/31/13 | |
Sales
during the
year ended
08/31/13 | | Value at
08/31/13 | | Net income
earned |
| UBS Private Money Market Fund LLC | | $5,655,123 | | $46,145,449 | | $46,885,193 | | $4,915,379 | | $2,250 |
Additional information regarding compensation to affiliate of a board member
Professor Meyer Feldberg serves as a senior advisor to Morgan Stanley, a financial services firm with which the Fund may conduct transactions, resulting in him being an interested trustee of the Fund. The Fund has been informed that Professor Feldberg’s role at Morgan Stanley does not involve matters directly affecting any UBS funds. Portfolio transactions are executed through Morgan Stanley based on that firm’s ability to provide best execution of the transactions. During the year ended August 31, 2013, the Fund paid brokerage commissions to Morgan Stanley in the amount of $11,473.
During the year ended August 31, 2013, the Fund purchased and sold certain securities (e.g., fixed income securities) in principal trades with Morgan Stanley, having an aggregate value of $38,619,172. Morgan Stanley received compensation in connection with these trades, which may have been in the form of a “mark-up” or “mark-down” of the price of the securities, a fee from the issuer for maintaining a commercial paper program, or some other form of compensation. Although the precise amount of this compensation is not generally known by the Fund’s investment manager, it is believed that under normal circumstances it represents a small portion of the total value of the transactions.
UBS U.S. Allocation Fund
Notes to financial statements
Service and distribution plans
UBS Global Asset Management (US) Inc. (“UBS Global AM (US)”) is the principal underwriter of the Fund’s shares. Under separate plans of service and/or distribution pertaining to Class A and Class C shares, the Fund pays UBS Global AM (US) monthly service fees at an annual rate of 0.25% of the average daily net assets of Class A and Class C shares and monthly distribution fees at the annual rate of 0.75% of the average daily net assets of Class C shares. At August 31, 2013, the Fund owed UBS Global AM (US) $95,665 for service and distribution fees.
UBS Global AM (US) also receives the proceeds of the initial sales charges paid by shareholders upon the purchase of Class A shares and the contingent deferred sales charges paid by shareholders upon certain redemptions of Class A and Class C shares. UBS Global AM (US) has informed the Fund that for the year ended August 31, 2013, it earned $8,052 in initial sales charges on Class A shares and $2,424 in deferred sales charges on Class A and Class C shares.
Transfer agency related services
UBS Financial Services Inc. provides certain services to the Fund pursuant to a delegation of authority from BNY Mellon Investment Servicing (US) Inc. (“BNY Mellon”), the Fund’s transfer agent, and is compensated for these services by BNY Mellon, not the Fund.
For the year ended August 31, 2013, UBS Financial Services Inc. received from BNY Mellon, not the Fund, $113,792 of the total transfer agency and related service fees paid by the Fund to BNY Mellon.
Securities lending
The Fund may lend securities up to 33¹/³% of its total assets to qualified broker-dealers or institutional investors. The loans are secured at all times by cash, US government securities or irrevocable letters of credit in an amount at least equal to the market value of the securities loaned, plus accrued interest and dividends, determined on a daily basis and adjusted accordingly. The Fund will regain ownership of loaned securities to exercise certain beneficial rights; however, the Fund may bear the risk of delay in recovery of, or even loss of rights in, the securities loaned should the borrower fail financially. The Fund receives compensation for lending its securities from interest or dividends earned on the cash, US government securities or irrevocable letters of credit held as collateral, net of fee rebates paid to the borrower plus reasonable administrative and custody fees. State Street Bank and Trust Company serves as the Fund’s lending agent.
At August 31, 2013, the Fund had securities on loan, cash collateral and non-cash collateral as follows:
Value of securities
on loan | | Cash collateral | | Non-cash collateral* | | Total collateral | | Security types held as non-cash collateral |
| $6,224,158 | | $4,915,379 | | $1,492,202 | | $6,407,581 | | US Treasury Notes and US Treasury Bills |
| * | These securities are held for the benefit of the Fund at the Fund’s custodian. The Fund cannot repledge or resell this collateral. As such, this collateral is excluded from the Statement of assets and liabilities. |
Bank line of credit
The Fund participates with other funds managed or advised by UBS Global AM in a $100 million committed credit facility with State Street Bank and Trust Company (“Committed Credit Facility”), to be utilized for temporary financing until the settlement of sales or purchases of portfolio securities, the repurchase or redemption of shares of the Fund at the request of shareholders and other temporary or emergency purposes. Under the Committed Credit Facility arrangement, the Fund has agreed to pay a commitment fee, pro rata, based on the relative asset size of the funds in the Committed Credit Facility. The Fund borrows at prevailing rates in effect at the time of borrowings. The Fund did not borrow under the Committed Credit Facility during the year ended August 31, 2013.
UBS U.S. Allocation Fund
Notes to financial statements
Purchases and sales of securities
For the year ended August 31, 2013, aggregate purchases and sales of portfolio securities, excluding short-term securities and US Government securities, were $86,555,776 and $172,645,890, respectively.
For the year ended August 31, 2013, aggregate purchases and sales of US Government securities, excluding short-term securities, were $203,079,321 and $200,349,853, respectively.
Shares of beneficial interest
There is an unlimited amount of $0.001 par value shares of beneficial interest authorized. Transactions in shares of beneficial interest were as follows:
| For the year ended | | Class A | | Class C | | Class Y |
| August 31, 2013 | | Shares | | Amount | | Shares | | Amount | | Shares | | Amount |
| Shares sold | | 32,066 | | | $ | 1,027,250 | | | 8,488 | | | $ | 268,477 | | | 18,505 | | | $ | 584,781 | |
| Shares repurchased | | (871,737 | ) | | | (27,701,138 | ) | | (308,557 | ) | | | (9,718,656 | ) | | (87,065 | ) | | | (2,769,423 | ) |
| Dividends reinvested | | 25,133 | | | | 767,553 | | | — | | | | — | | | 4,498 | | | | 138,982 | |
| Net decrease | | (814,538 | ) | | $ | (25,906,335 | ) | | (300,069 | ) | | $ | (9,450,179 | ) | | (64,062 | ) | | $ | (2,045,660 | ) |
| For the year ended | | Class A | | Class B1 |
| August 31, 2012 | | Shares | | Amount | | Shares | | Amount |
| Shares sold | | 71,125 | | | $ | 2,018,604 | | | — | | | $ | — | |
| Shares repurchased | | (976,736 | ) | | | (27,867,821 | ) | | (1,404 | ) | | | (39,442 | ) |
| Shares converted from Class B to Class A | | 54,541 | | | | 1,608,580 | | | (54,076 | ) | | | (1,608,580 | ) |
| Dividends reinvested | | 61,490 | | | | 1,655,927 | | | — | | | | — | |
| Net decrease | | (789,580 | ) | | $ | (22,584,710 | ) | | (55,480 | ) | | $ | (1,648,022 | ) |
| |
| | Class C | | Class Y |
| | Shares | | Amount | | Shares | | Amount |
| Shares sold | | 17,397 | | | $ | 482,487 | | | 9,380 | | | $ | 282,950 | |
| Shares repurchased | | (434,951 | ) | | | (12,250,080 | ) | | (95,338 | ) | | | (2,769,203 | ) |
| Dividends reinvested | | 5,681 | | | | 151,047 | | | 9,475 | | | | 258,106 | |
| Net decrease | | (411,873 | ) | | $ | (11,616,546 | ) | | (76,483 | ) | | $ | (2,228,147 | ) |
| 1 | Effective March 1, 2012 all outstanding Class B shares converted to Class A shares. |
Redemption fees
Each class of the Fund will impose a 1% redemption fee on shares sold or exchanged within 90 days of their purchase date, subject to limited exemptions as noted in the prospectus. This amount is paid to the Fund. The redemption fees, if any, earned by the Fund are disclosed in the Statement of changes in net assets. For the year ended August 31, 2013, redemption fees for each class of the Fund represent less than $0.005 per share.
Federal tax status
The Fund intends to distribute substantially all of its income and to comply with the other requirements of the Internal Revenue Code applicable to regulated investment companies. Accordingly, no provision for federal income taxes is required. In addition, by distributing during each calendar year substantially all of its net investment income, net realized capital gains and certain other amounts, if any, the Fund intends not to be subject to a federal excise tax.
UBS U.S. Allocation Fund
Notes to financial statements
The tax character of distributions paid during the fiscal years ended August 31, 2013 and August 31, 2012 were as follows:
| Distributions paid from: | | 2013 | | 2012 |
| Ordinary Income | | $996,931 | | $2,278,911 |
At August 31, 2013, the components of accumulated deficit on a tax basis were as follows:
| Undistributed ordinary income | | $ | 975,411 | |
| Accumulated realized capital and other losses | | | (77,579,739 | ) |
| Net unrealized appreciation of investments | | | 13,975,520 | |
| Total accumulated deficit | | $ | (62,628,808 | ) |
The differences between book-basis and tax-basis unrealized appreciation/depreciation is attributable primarily to the tax deferral of losses on wash sales and the tax treatment of certain derivative instruments.
To reflect reclassifications arising from permanent “book/tax” differences for the year ending August 31, 2013, accumulated undistributed net investment income was increased by $133,069, and accumulated net realized loss was increased by $133,069. These differences are primarily due to income reallocation from real estate investment trusts and paydown reclasses.
Under the Regulated Investment Company Modernization Act of 2010 (the “Act”), net capital losses recognized by the Fund after December 31, 2010, may be carried forward indefinitely, and retain their character as short-term and/or long-term losses. The Act requires that post-enactment net capital losses be used before pre-enactment net capital losses.
At August 31, 2013, the Fund had a pre-enactment net capital loss carryforward of $77,579,739. This pre-enactment capital loss carryforward is available as a reduction, to the extent provided in the regulations, of any future net realized capital gains and the full amount will expire in 2018. To the extent that such losses are used to offset future net realized capital gains, it is probable these gains will not be distributed. During the current fiscal year, the Fund utilized $30,841,793 of capital loss carryforwards to offset current year realized gains.
As of and during the year ended August 31, 2013, the Fund did not have any liabilities for any uncertain tax positions. The Funds recognize interest and penalties, if any, related to uncertain tax positions as income tax expense in the Statements of operations. During the year ended August 31, 2013, the Fund did not incur any interest or penalties.
Each of the tax years in the four year period ended August 31, 2013, remains subject to examination by the Internal Revenue Service and state taxing authorities.
UBS U.S. Allocation Fund
Report of Ernst & Young LLP, independent registered public
accounting firm
The Board of Trustees and Shareholders of
UBS U.S. Allocation Fund
We have audited the accompanying statement of assets and liabilities, including the portfolio of investments, of UBS U.S. Allocation Fund (the sole series comprising UBS Investment Trust) (the “Fund”) as of August 31, 2013, and the related statement of operations for the year then ended, the statement of changes in net assets for each of the two years in the period then ended, and the financial highlights for each of the five years in the period then ended. These financial statements and financial highlights are the responsibility of the Fund’s management. Our responsibility is to express an opinion on these financial statements and financial highlights based on our audits.
We conducted our audits in accordance with the standards of the Public Company Accounting Oversight Board (United States). Those standards require that we plan and perform the audit to obtain reasonable assurance about whether the financial statements and financial highlights are free of material misstatement. We were not engaged to perform an audit of the Fund’s internal control over financial reporting. Our audits included consideration of internal control over financial reporting as a basis for designing audit procedures that are appropriate in the circumstances, but not for the purpose of expressing an opinion on the effectiveness of the Fund’s internal control over financial reporting. Accordingly, we express no such opinion. An audit also includes examining, on a test basis, evidence supporting the amounts and disclosures in the financial statements and financial highlights, assessing the accounting principles used and significant estimates made by management and evaluating the overall financial statement presentation. Our procedures included confirmation of securities owned as of August 31, 2013, by correspondence with the custodian and others, or by other appropriate auditing procedures where replies from others were not received. We believe that our audits provide a reasonable basis for our opinion.
In our opinion, the financial statements and financial highlights referred to above present fairly, in all material respects, the financial position of UBS U.S. Allocation Fund at August 31, 2013, the results of its operations for the year then ended, the changes in its net assets for each of the two years in the period then ended, and the financial highlights for each of the five years in the period then ended, in conformity with U.S. generally accepted accounting principles.

New York, New York
October 29, 2013
UBS U.S. Allocation Fund
General information (unaudited)
Quarterly Form N-Q portfolio schedule
The Fund will file its complete schedule of portfolio holdings with the Securities and Exchange Commission (“SEC”) for the first and third quarters of each fiscal year on Form N-Q. The Fund’s Forms N-Q are available on the SEC’s Web site at http://www.sec.gov. The Fund’s Forms N-Q may be reviewed and copied at the SEC’s Public Reference Room in Washington, D.C. Information on the operation of the SEC’s Public Reference Room may be obtained by calling 1-800-SEC 0330. Additionally, you may obtain copies of Forms N-Q from the Fund upon request by calling 1-800-647 1568.
Proxy voting policies, procedures and record
You may obtain a description of the Fund’s (1) proxy voting policies, (2) proxy voting procedures and (3) information regarding how the Fund voted any proxies related to portfolio securities during the most recent 12-month period ended June 30 for which an SEC filing has been made, without charge, upon request by contacting the Fund directly at 1-800-647 1568, online on the Fund’s Web site: www.ubs.com/ubsglobalam-proxy, or on the EDGAR Database on the SEC’s Web site (http://www.sec.gov).
UBS U.S. Allocation Fund
Tax information (unaudited)
We are required by Subchapter M of the Internal Revenue Code of 1986, as amended, to advise you within 60 days of the Fund’s fiscal year end (August 31, 2013) as to the federal tax status of distributions received by shareholders during such fiscal year. The percentage of dividends paid that qualify for the dividends received deduction for corporate shareholders is 100%.
For the fiscal year ended August 31, 2013, certain dividends paid by UBS U.S. Allocation Fund may be subject to a maximum tax rate of 15%, as provided for by the Jobs and Growth Tax Relief Reconciliation Act of 2003. Of the distributions paid during the fiscal year, $996,931 represents the maximum amount that may be considered qualified dividend income.
Dividends received by tax-exempt recipients (e.g., IRAs and Keoghs) need not be reported as taxable income. Some retirement trusts (e.g., corporate, Keogh and 403(b)(7) plans) may need this information for their annual information reporting.
Since the Fund’s fiscal year is not the calendar year, another notification will be sent in respect of calendar year 2013. The second notification, which will reflect the amount to be used by calendar year taxpayers on their federal income tax returns, will be made in conjunction with Form 1099 DIV and will be mailed in January 2014. Shareholders are advised to consult their own tax advisers with respect to the tax consequences of their investment in the Fund.
UBS U.S. Allocation Fund
Board approval of investment advisory
and administration agreement (unaudited)
Background—At a meeting of the board of UBS Investment Trust (the “Trust”) on July 16-17, 2013, the members of the board, including the trustees who are not “interested persons” of the Trust (“Independent Trustees”), as defined in the Investment Company Act of 1940, as amended (the “1940 Act”), considered and approved the continuance of the investment advisory and administration agreement (the “Investment Advisory and Administration Agreement”) of the Trust with respect to its series, UBS U.S. Allocation Fund (the “Fund”), with UBS Global Asset Management (Americas) Inc. (“UBS Global AM”). In preparing for the meeting, the board members had requested and received extensive information from UBS Global AM to assist them. The board received and considered a variety of information about UBS Global AM as well as the advisory, administrative and distribution arrangements for the Fund. Independent Trustees discussed the materials initially provided by management among themselves on several occasions prior to the scheduled board meeting, and independent legal counsel participated in several such discussions. The Independent Trustees also met in executive session with their independent legal counsel to review the presentation that had been made to them at the meeting. The Independent Trustees also received a memorandum from their independent legal counsel discussing the duties of board members in considering approval of advisory, administration and distribution agreements.
In its consideration of the approval of the Investment Advisory and Administration Agreement, the board considered the following factors:
Nature, extent and quality of the services under the Investment Advisory and Administration Agreement—The board received and considered information regarding the nature, extent and quality of advisory services provided to the Fund by UBS Global AM under the Investment Advisory and Administration Agreement during the past year. The board also considered the nature, extent and quality of administrative, distribution, and shareholder services performed by UBS Global AM and its affiliates for the Fund and the resources devoted to, and the record of compliance with, the Fund’s compliance policies and procedures. The board noted that it received information at regular meetings throughout the year regarding the services rendered by UBS Global AM concerning the management of the Fund’s affairs and UBS Global AM’s role in coordinating providers of other services to the Fund, including custody, accounting and transfer agency services. The board’s evaluation of the services provided by UBS Global AM took into account the board’s knowledge and familiarity gained as board members of funds in the UBS New York fund complex, including the scope and quality of UBS Global AM’s investment advisory and other capabilities and the quality of its administrative and other services. The board observed that the scope of services provided by UBS Global AM had expanded over time as a result of regulatory and other developments, including maintaining and monitoring its own and the Fund’s expanded compliance programs.
The board had available to it the qualifications, backgrounds and responsibilities of the senior personnel at UBS Global AM responsible for the Fund and had previously met with and received information regarding the persons primarily responsible for the day-to-day portfolio management of the Fund and recognized that the Fund’s senior personnel at UBS Global AM report to the board regularly and that at each regular meeting the board receives a detailed report on the Fund’s performance. The board also considered, based on its knowledge of UBS Global AM and its affiliates, the financial resources available to UBS Global AM and its parent organization, UBS AG. In that regard, the board received extensive financial information regarding UBS Global AM and noted that it was a wholly owned, indirect subsidiary of one of the largest financial services firms in the world. It was also noted that UBS Global AM had approximately $159 billion in assets under management as of March 31, 2013 and was part of the UBS Global Asset Management Division, which had approximately $632 billion in assets under management worldwide as of March 31, 2013. The board was also cognizant of, and considered, the regulatory and litigation actions and investigations occurring in the past few years involving UBS AG, UBS Global AM and certain of their affiliates.
The board concluded that, overall, it was satisfied with the nature, extent and quality of services provided (and expected to be provided) to the Fund under the Investment Advisory and Administration Agreement.
UBS U.S. Allocation Fund
Board approval of investment advisory
and administration agreement (unaudited)
Advisory fees and expense ratios—The board reviewed and considered the contractual management fee (the “Contractual Management Fee”) payable by the Fund to UBS Global AM in light of the nature, extent and quality of the advisory and administrative services provided by UBS Global AM. The board also reviewed and considered the written agreement between UBS Global AM and the Fund, which is separate from UBS Global AM’s investment advisory agreement with the Fund, whereby UBS Global AM has agreed to permanently reduce its management fee based on the Fund’s average daily net assets, which is discussed in more detail in the “Economies of Scale” section, and considered the actual fee rate (after taking this agreement into account) (the “Actual Management Fee”). Additionally, the board received and considered information comparing the Fund’s Contractual Management Fee, Actual Management Fee and overall expenses with those of funds in a group of funds selected and provided by Lipper, Inc. (“Lipper”), an independent provider of investment company data (the “Expense Group”).
In addition, pursuant to a written fee waiver/expense reimbursement agreement, UBS Global AM is contractually obligated to waive its management fees and/or reimburse the Fund so that the Fund’s ordinary total annual operating expenses through December 31, 2013 (excluding dividend expense, borrowing costs, and interest expense relating to short sales, and investments in other investment companies, interest, taxes, brokerage commissions and extraordinary expenses) would not exceed 1.15% for Class A shares, 1.90% for Class C shares and 0.90% for Class Y shares. The board also considered that the Fund has agreed to repay UBS Global AM for those waived fees and/or reimbursed expenses if the Fund can do so over the following three fiscal years without causing its expenses in any of those years to exceed the expense caps.
In connection with its consideration of the Fund’s management fees, the board also received information on UBS Global AM’s standard institutional account fees for accounts of a similar investment type to the Fund. The board noted management’s explanation that comparisons with such accounts may be of limited relevance given the different structures and regulatory requirements of mutual funds versus such accounts and the differences in the levels of services required by mutual funds and such accounts. The board also received information on fees charged to other mutual funds managed by UBS Global AM.
The comparative Lipper information showed that the Fund’s Contractual Management Fee, Actual Management Fee and total expenses were in the first quintile in the Fund’s Expense Group for the comparison periods utilized in the Lipper report. (The first quintile represents that 20% of the funds in the Expense Group with the lowest fees or expenses, as applicable, and the fifth quintile represents that 20% of the funds in the Expense Group with the highest fees or expenses, as applicable.)
In light of the foregoing, the board determined that the management fee was reasonable in light of the nature, extent and quality of services provided to the Fund under the Investment Advisory and Administration Agreement.
Fund performance—The board received and considered (a) annualized total return information of the Fund compared to other funds (the “Performance Universe”) selected by Lipper over the one-, three-, five-, ten-year and since inception periods ended April 30, 2013 and (b) annualized performance information for each year in the ten-year period ended April 30, 2013. The board was provided with a description of the methodology Lipper used to determine the similarity of the Fund with the funds included in its Performance Universe. The board also noted that it had received information throughout the year at periodic intervals with respect to the Fund’s performance, including with respect to its benchmark index.
The comparative Lipper information showed that the Fund’s performance was in the second quintile for the one- and three-year periods, in the third quintile for the five-year period and since inception and in the fourth quintile for the ten-year period. (The first quintile represents that 20% of the funds in the Performance Universe with the best relative performance, and the fifth quintile represents that 20% of the funds in the Performance Universe
UBS U.S. Allocation Fund
Board approval of investment advisory
and administration agreement (unaudited)
with the worst relative performance.) Management noted the improved performance of the Fund over the recent periods. Based on its review of the Fund and management’s presentation, the board concluded that the Fund’s investment performance was acceptable.
Advisor profitability—The board received and considered a profitability analysis of UBS Global AM and its affiliates in providing services to the Fund. The board also received profitability information with respect to the UBS New York fund complex as a whole. UBS Global AM’s profitability was considered not excessive in light of the nature, extent and quality of the services provided to the Fund.
Economies of scale—The board received and considered information from management regarding whether UBS Global AM has achieved economies of scale with respect to the management of the Fund, whether the Fund has appropriately benefited from any economies of scale, and whether there is potential for realization of further economies of scale for the Fund. The board considered whether economies of scale in the provision of services to the Fund were being passed along to the shareholders. The board noted that the Fund’s Contractual Management Fee contained a single breakpoint and that the Fund’s assets exceeded the breakpoint as of April 30, 2013.
While the Fund’s Contractual Management Fee contained a single breakpoint, the board recognized that the Fund had entered into a separate agreement with UBS Global AM, whereby UBS Global AM agreed to permanently reduce its Contractual Management Fee by utilizing several additional breakpoints based on the Fund’s average daily net assets, thereby achieving the same effect as if the Contractual Management Fee contained multiple breakpoints.
Generally, in light of UBS Global AM’s profitability data and the Contractual Management Fee and Actual Management Fee currently in place, the board believed that UBS Global AM’s sharing of current economies of scale with the Fund was acceptable.
Other benefits to UBS Global AM—The board considered other benefits received by UBS Global AM and its affiliates as a result of its relationship with the Fund, including the opportunity to offer additional products and services to Fund shareholders.
In light of the costs of providing investment advisory, administrative and other services to the Fund and UBS Global AM’s ongoing commitment to the Fund, the profits and other ancillary benefits that UBS Global AM and its affiliates received were considered reasonable.
In light of all of the foregoing, the board approved the Investment Advisory and Administration Agreement. In making its decision, the board identified no single factor as being determinative in approving the Investment Advisory and Administration Agreement. The Independent Trustees were advised by separate independent legal counsel throughout the process. The board discussed the proposed continuance of the Investment Advisory and Administration Agreement in private sessions with their independent legal counsel at which no representatives of UBS Global AM were present.
UBS U.S. Allocation Fund
Supplemental information (unaudited)
Board of Trustees & Officers
The Trust is governed by a Board of Trustees which oversees the Fund’s operations. Each trustee serves an indefinite term of office. Officers are appointed by the trustees and serve at the pleasure of the Board. The table below shows, for each trustee and officer, his or her name, address and age, the position held with the Trust, the length of time served as a trustee or officer of the Trust, the trustee’s or officer’s principal occupations during the last five years, the number of portfolios in the UBS fund complex overseen by the trustee or for which a person served as an officer, and other directorships held by the trustee.
The Fund’s Statement of Additional Information contains additional information about the trustees and is available, without charge, upon request by calling 1-800-647 1568.
Interested Trustees
| Name, address, and age | | Position(s)
held with
Trust | | Term of
office† and
length of
time served | | Principal occupation(s)
during past 5 years |
Meyer Feldberg;†† 71
Morgan Stanley
1585 Broadway
33rd Floor
New York, NY 10036 | | Trustee | | Since 1996 | | Professor Feldberg is Dean Emeritus and Professor of Leadership and Ethics at Columbia Business School, although on an extended leave of absence. He is also a senior advisor to Morgan Stanley (financial services) (since 2005). Professor Feldberg also serves as president of New York Global Partners (an organization located in part of the Office of the Mayor of the City of New York that promotes interaction with other cities around the world) (since 2007). Prior to 2004, he was Dean and Professor of Management of the Graduate School of Business at Columbia University (since 1989). |
| |
| Barry Mandinach*†††; 57 | | Trustee | | Since 2010 | | Mr. Mandinach is a managing director of UBS Global Asset Management (US) Inc. and UBS Global AM (collectively, “UBS Global AM—Americas region”). He has been with UBS Global AM—Americas region or its predecessors since 2001. He is the Head of Institutional & Wholesale Business (US) (since 2009) as well as Chief Marketing Officer (US) (since 2006). |
| |
| Independent Trustees | | | | | | |
| |
Richard Q. Armstrong; 78
c/o Keith Weller, Assistant
Fund Secretary
UBS Global Asset
Management (Americas)
Inc., 1285 Avenue of the
Americas, New York,
NY 10019 | | Trustee and
Chairman
of the
Board of
Trustees | | Since 1995
(Trustee)
Since 2004
(Chairman of
the Board of
Trustees) | | Mr. Armstrong is chairman and principal of R.Q.A. Enterprises (management consulting firm) (since 1991 and principal occupation since March 1995). Mr. Armstrong was president or chairman of a number of packaged goods companies (such as Canada Dry, Dr. Pepper, Adirondack Beverages and Moët Hennessy) (from 1982 until 1995). |
UBS U.S. Allocation Fund
Supplemental information (unaudited)
Number of portfolios in fund complex
overseen by trustee | | Other directorships held by trustee |
Professor Feldberg is a director or trustee of 23 investment companies (consisting of 55 portfolios) for which UBS Global AM or one of its affiliates serves as investment advisor or manager. | | Professor Feldberg is also a director of Primedia Inc. (publishing), Macy’s, Inc. (operator of department stores), Revlon, Inc. (cosmetics), SAPPI, Ltd. (producer of paper) and the New York City Ballet. |
| | |
Mr. Mandinach is a director or trustee of 13 investment companies (consisting of 45 portfolios) for which UBS Global AM serves as investment advisor or manager. | | None |
| | |
Mr. Armstrong is a director or trustee of 13 investment companies (consisting of 45 portfolios) for which UBS Global AM serves as investment advisor or manager. | | None |
UBS U.S. Allocation Fund
Supplemental information (unaudited)
Independent Trustees (concluded)
| Name, address, and age | | Position(s)
held with
Trust | | Term of
office† and
length of
time served | | Principal occupation(s)
during past 5 years |
Alan S. Bernikow; 72
207 Benedict Ave.,
Staten Island, NY 10314 | | Trustee | | Since 2005 | | Mr. Bernikow is retired. He was a consultant on non-management matters for the firm of Deloitte & Touche (international accounting and consulting firm) (from 2003 until 2007). Previously, he was deputy chief executive officer at Deloitte & Touche. |
| | | | | | | |
Richard R. Burt; 66
McLarty Associates
900 19th Street, 8th Floor
Washington DC 20006 | | Trustee | | Since 1996 | | Mr. Burt is a managing director of McLarty Associates (a consulting firm) (since 2007). He was chairman of IEP Advisors (international investments and consulting firm) until 2009. Prior to 2007, he was chairman of Diligence Inc. (information and risk management firm). |
| | | | | | | |
Bernard H. Garil; 73
6754 Casa Grande Way
Delray Beach, FL 33446 | | Trustee | | Since 2005 | | Mr. Garil is retired (since 2001). He was a managing director at PIMCO Advisory Services (from 1999 to 2001) where he served as president of closed-end funds and vice-president of the variable insurance product funds advised by OpCap Advisors (until 2001). |
| | | | | | | |
Heather R. Higgins; 53
255 E. 49th St., Suite 23D
New York, NY 10017 | | Trustee | | Since 2005 | | Ms. Higgins is the president and director of The Randolph Foundation (charitable foundation) (since 1991). Ms. Higgins also serves (or had served) on the boards of several non-profit charitable groups, including the Independent Women’s Forum (chairman), and the Philanthropy Roundtable (vice chairman). She serves on the board of the Hoover Institution (from 2001 to 2007 and since 2009). |
UBS U.S. Allocation Fund
Supplemental information (unaudited)
Number of portfolios in fund complex
overseen by trustee | | Other directorships held by trustee |
Mr. Bernikow is a director or trustee of 13 investment companies (consisting of 45 portfolios) for which UBS Global AM serves as investment advisor or manager. | | Mr. Bernikow is also a director of Revlon, Inc. (cosmetics) (and serves as the chair of its audit committee and as the chair of its compensation committee), a director of Mack-Cali Realty Corporation (real estate investment trust) (and serves as the chair of its audit committee) and a director of the Casual Male Retail Group, Inc. (menswear) (and serves as a member of its audit committee and as a member of its nominating and corporate governance committee). He is also a director of Premier American Bank, N.A. |
| | | |
Mr. Burt is a director or trustee of 13 investment companies (consisting of 45 portfolios) for which UBS Global AM serves as investment advisor or manager. | | Mr. Burt is also a director of The Central Europe & Russia Fund, Inc., The European Equity Fund, Inc., and The New Germany Fund, Inc. |
| | |
Mr. Garil is a director or trustee of 13 investment companies (consisting of 45 portfolios) for which UBS Global AM serves as investment advisor or manager. | | Mr. Garil is also a director of OFI Trust Company (commercial trust company), the Leukemia & Lymphoma Society (voluntary health organization) and a trustee for the Brooklyn College Foundation, Inc. (charitable foundation). |
| | |
Ms. Higgins is a director or trustee of 13 investment companies (consisting of 45 portfolios) for which UBS Global AM serves as investment advisor or manager. | | None |
UBS U.S. Allocation Fund
Supplemental information (unaudited)
Officers
Name, address,
and age | | Position(s)
held with
the Trust | | Term of
office† and
length of
time served | | Principal occupation(s) during past 5 years;
number of portfolios in fund complex for which
person serves as officer |
Joseph Allessie*; 48 | | Vice President and Assistant Secretary | | Since 2005 | | Mr. Allessie is an executive director (since 2007) (prior to which he was a director) and deputy general counsel (since 2005) at UBS Global AM—Americas. Mr. Allessie is a vice president and assistant secretary of 17 investment companies (consisting of 77 portfolios) for which UBS Global AM serves as investment advisor or manager. |
| | | | | | |
Rose Ann Bubloski*; 45 | | Vice President and Assistant Treasurer | | Since 2011 | | Ms. Bubloski is a director (since 2012) (prior to which she was an associate director) and senior manager of the US mutual fund treasury administration department of UBS Global AM—Americas region. She was a vice president and assistant treasurer of certain UBS funds (from 2004 to 2007). She was vice president at Cohen & Steers Capital Management, Inc. (investment manager) (from 2007 to 2008). She is vice president and assistant treasurer of 17 investment companies (consisting of 77 portfolios) for which UBS Global AM serves as investment advisor or manager. |
| | | | | | |
Mark E. Carver*; 50 | | President | | Since 2010 | | Mr. Carver is a managing director and Head of Product Development and Management—Americas for UBS Global AM—Americas region (since 2008). In this role, he oversees product development and management for both wholesale and institutional businesses. He is a member of the Americas Management Committee (since 2008) and the Regional Operating Committee (since 2008). Prior to 2008, Mr. Carver held a number of product-related or sales responsibilities with respect to funds, advisory programs and separately managed accounts. Mr. Carver joined a predecessor of an affiliated firm in 1985 and has been with UBS Global AM—Americas region (or its affiliates) since 1996. Mr. Carver is president of 17 investment companies (consisting of 77 portfolios) for which UBS Global AM serves as investment advisor or manager. |
UBS U.S. Allocation Fund
Supplemental information (unaudited)
Officers (continued)
Name, address,
and age | | Position(s)
held with
the Trust | | Term of
office† and
length of
time served | | Principal occupation(s) during past 5 years;
number of portfolios in fund complex for which
person serves as officer |
Thomas Disbrow*; 47 | | Vice President and Treasurer | | Since 2000 (Vice President);
Since 2004 (Treasurer) | | Mr. Disbrow is a managing director (since 2011) (prior to which he was an executive director) (since 2007) and head of North America Fund Treasury (since 2011) of UBS Global AM—Americas region. Mr. Disbrow is a vice president and treasurer and/or principal accounting officer of 17 investment companies (consisting of 77 portfolios) for which UBS Global AM serves as investment advisor or manager. |
| | | | | | |
Michael J. Flook*; 48 | | Vice President and Assistant Treasurer | | Since 2006 | | Mr. Flook is a director (since 2010) (prior to which he was an associate director) (since 2006) and a senior manager of the US mutual fund treasury administration department of UBS Global AM—Americas region (since 2006). Mr. Flook is a vice president and assistant treasurer of 17 investment companies (consisting of 77 portfolios) for which UBS Global AM serves as investment advisor or manager. |
| | | | | | |
Christopher S. Ha*; 33 | | Vice President and Assistant Secretary | | Since 2012 | | Mr. Ha is a director and associate general counsel (since 2012) at UBS Global AM—Americas region. Prior to joining UBS Global AM—Americas region, Mr. Ha was of counsel at Buhler, Duggal & Henry LLP (law firm) (from March 2012 to July 2012) and an associate attorney at Dechert LLP (law firm) (from 2007 to 2009). Mr. Ha is a vice president and assistant secretary of 17 investment companies (consisting of 77 portfolios) for which UBS Global AM serves as investment advisor or manager. |
| | | | | | |
Mark F. Kemper**; 55 | | Vice President and Secretary | | Since 2004 | | Mr. Kemper is a managing director (since 2006) and head of the legal department of UBS Global AM—Americas region (since 2004). He has been secretary of UBS Global AM—Americas (since 2004), secretary of UBS Global Asset Management Trust Company (since 1993), and secretary of UBS AM Holdings (USA) Inc. (since 2001). Mr. Kemper is vice president and secretary of 17 investment companies (consisting of 77 portfolios) for which UBS Global AM serves as investment advisor or manager. |
UBS U.S. Allocation Fund
Supplemental information (unaudited)
Officers (continued)
Name, address,
and age | | Position(s)
held with
the Trust | | Term of
office† and
length of
time served | | Principal occupation(s) during past 5 years;
number of portfolios in fund complex for which
person serves as officer |
Joanne M. Kilkeary*; 45 | | Vice President and Assistant Treasurer | | Since 2004 | | Ms. Kilkeary is an executive director (since March 2013) (prior to which she was director) (since 2008) and a senior manager (since 2004) of the US mutual fund treasury administration department of UBS Global AM—Americas region. Ms. Kilkeary is a vice president and assistant treasurer of 17 investment companies (consisting of 77 portfolios) for which UBS Global AM serves as investment advisor or manager. |
| | | | | | |
Tammie Lee*; 42 | | Vice President and Assistant Secretary | | Since 2005 | | Ms. Lee is an executive director (since 2010) (prior to which she was a director) (since 2005) and associate general counsel of UBS Global AM—Americas region (since 2005). Ms. Lee is a vice president and assistant secretary of 17 investment companies (consisting of 77 portfolios) for which UBS Global AM serves as investment advisor or manager. |
| | | | | | |
Joseph McGill*; 51 | | Vice President and Chief Compliance Officer | | Since 2004 | | Mr. McGill is a managing director (since 2006) and chief compliance officer (since 2003) at UBS Global AM—Americas region. Mr. McGill is a vice president and chief compliance officer of 17 investment companies (consisting of 77 portfolios) for which UBS Global AM serves as investment advisor or manager. |
| | | | | | |
Nancy D. Osborn*; 47 | | Vice President and Assistant Treasurer | | Since 2007 | | Mrs. Osborn is a director (since 2010) (prior to which she was an associate director) and a senior manager of the US mutual fund treasury administration department of UBS Global AM—Americas region (since 2006). Mrs. Osborn is a vice president and assistant treasurer of 17 investment companies (consisting of 77 portfolios) for which UBS Global AM serves as investment advisor or manager. |
| | | | | | |
Eric Sanders*; 48 | | Vice President and Assistant Secretary | | Since 2005 | | Mr. Sanders is a director and associate general counsel of UBS Global AM—Americas region (since 2005). Mr. Sanders is a vice president and assistant secretary of 17 investment companies (consisting of 77 portfolios) for which UBS Global AM serves as investment advisor or manager. |
UBS U.S. Allocation Fund
Supplemental information (unaudited)
Officers (concluded)
Name, address,
and age | | Position(s)
held with
the Trust | | Term of
office† and
length of
time served | | Principal occupation(s) during past 5 years;
number of portfolios in fund complex for which
person serves as officer |
Andrew Shoup*; 57 | | Vice President and Chief Operating Officer | | Since 2006 | | Mr. Shoup is a managing director and global head of the fund treasury administration department of UBS Global AM—Americas region (since 2006). Mr. Shoup is also a director of UBS (IRL) Fund p.l.c. (since 2008), Mr. Shoup is a vice president and chief operating officer of 17 investment companies (consisting of 77 portfolios) for which UBS Global AM serves as investment advisor or manager. |
| | | | | | |
Keith A. Weller*; 52 | | Vice President and Assistant Secretary | | Since 1996 | | Mr. Weller is an executive director and senior associate general counsel of UBS Global AM—Americas region (since 2005) and has been an attorney with affiliated entities since 1995. Mr. Weller is a vice president and assistant secretary of 17 investment companies (consisting of 77 portfolios) for which UBS Global AM serves as investment advisor, sub-advisor or manager. |
| | | | | | |
Mandy Yu*; 29 | | Vice President | | Since February
2013 | | Ms. Yu is an authorized officer (since 2012) and tax compliance manager (since March 2013) of the US mutual fund treasury administration department of UBS Global AM — Americas region. She was a Fund Treasury Manager (from 2012 to March 2013 and a Mutual Fund Administrator (from 2007 to 2012) for UBS Global AM — Americas region. Ms. Yu is a vice president of 17 investment companies (consisting of 77 portfolios) for which UBS Global AM serves as investment advisor or manager. |
| * | This person’s business address is 1285 Avenue of the Americas, New York, New York 10019-6028. |
| ** | This person’s business address is One North Wacker Drive, Chicago, Illinois 60606. |
| † | Each trustee holds office for an indefinite term. |
| †† | Professor Feldberg is deemed an “interested person” of the Trust as defined in the Investment Company Act because he is a senior advisor to Morgan Stanley, a financial services firm with which the Fund may conduct transactions. |
| ††† | Mr. Mandinach is deemed an “interest person” of the Trust as defined in the Investment Company Act because of his employment by UBS Global AM—Americas region. |
This page intentionally left blank.
Trustees
Richard Q. Armstrong
Chairman
Alan S. Bernikow
Richard R. Burt
Principal Officers
Mark E. Carver
President
Mark F. Kemper
Vice President and Secretary
Investment Advisor and
Administrator
UBS Global Asset Management (Americas) Inc.
1285 Avenue of the Americas
New York, New York 10019-6028
Principal Underwriter
UBS Global Asset Management (US) Inc.
1285 Avenue of the Americas
New York, New York 10019-6028 |
Meyer Feldberg
Bernard H. Garil
Heather R. Higgins
Barry M. Mandinach
Thomas Disbrow
Vice President and Treasurer
|
This report is not to be used in connection with the offering of shares of the Fund unless accompanied or preceded by an effective prospectus.
© UBS 2013. All rights reserved.
 | PRESORTED
STANDARD
U.S. POSTAGE
PAID
COMPUTERSHARE |
UBS Global Asset Management (Americas) Inc.
1285 Avenue of the Americas
New York, New York 10019-6028
Item 2. Code of Ethics.
The registrant has adopted a code of ethics that applies to its principal executive officer, principal financial officer, principal accounting officer or controller, or persons performing similar functions pursuant to Section 406 of the Sarbanes-Oxley Act of 2002. (The registrant has designated the code of ethics adopted pursuant to Sarbanes-Oxley as a "Code of Conduct" to lessen the risk of confusion with its separate code of ethics adopted pursuant to Rule 17j-1 under the Investment Company Act of 1940, as amended.)
Item 3. Audit Committee Financial Expert.
The registrant's Board has determined that the following person serving on the registrant's Audit committee is an "audit committee financial expert" as defined in item 3 of Form N-CSR: Alan S. Bernikow. Mr. Bernikow is independent as defined in item 3 of Form N-CSR.
Item 4. Principal Accountant Fees and Services.
| | (a) | | Audit Fees: |
| | For the fiscal years ended August 31, 2013 and August 31, 2012, the aggregate Ernst & Young LLP (E&Y) audit fees for professional services rendered to the registrant were approximately $68,400 and $63,600, respectively. |
| |
| | | Fees included in the audit fees category are those associated with the annual audits of financial statements and services that are normally provided in connection with statutory and regulatory filings. |
| |
| (b) | | Audit-Related Fees: |
| | | In each of the fiscal years ended August 31, 2013 and August 31, 2012, the aggregate audit-related fees billed by E&Y for services rendered to the registrant that are reasonably related to the performance of the audits of the financial statements, but not reported as audit fees, were approximately $4,444 and $5,144, respectively. |
| |
| | | Fees included in the audit-related category are those associated with (1) the reading and providing of comments on the 2013 and 2012 semiannual financial statements and (2) review of the consolidated 2012 and 2011 reports on the profitability of the UBS Funds to UBS Global Asset Management (US) Inc. and its affiliates to assist the board members in their annual advisory/administration contract and service/distribution plan reviews. |
| |
| | | There were no audit-related fees required to be approved pursuant to paragraph (c)(7)(ii) of Rule 2-01 of Regulation S-X during the fiscal years indicated above. |
| | (c) | | Tax Fees: |
| | | In each of the fiscal years ended August 31, 2013 and August 31, 2012, the aggregate tax fees billed by E&Y for professional services rendered to the registrant were approximately $20,650 and $16,100, respectively. Fees included in the tax fees category comprise all services performed by professional staff in the independent accountant’s tax division except those services related to the audits. This category comprises fees for review of tax compliance, tax return preparation and excise tax calculations. There were no tax fees required to be approved pursuant to paragraph (c)(7)(ii) of Rule 2-01 of Regulation S-X during the fiscal years indicated above. |
| | | |
| | (d) | | All Other Fees: |
| | | In each of the fiscal years ended August 31, 2013 and August 31, 2012, there were no fees billed by E&Y for products and services, other than the services reported in Item 4(a)-(c) above, rendered to the registrant. |
| |
| | | Fees included in the all other fees category would consist of services related to internal control reviews, strategy and other consulting, financial information systems design and implementation, consulting on other information systems, and other tax services unrelated to the registrant. |
| |
| | | There were no “all other fees” required to be approved pursuant to paragraph (c)(7)(ii) of Rule 2-01 of Regulation S-X during the fiscal years indicated above. |
| |
| (e) | | (1) Audit Committee Pre-Approval Policies and Procedures: |
| | | The registrant’s Audit Committee (“audit committee”) has adopted an “Audit Committee Charter (Amended and Restated as of May 12, 2004 – with revisions through July 2013)” (the “charter”). The charter contains the audit committee’s pre-approval policies and procedures. Reproduced below is an excerpt from the charter regarding pre-approval policies and procedures: |
| The [audit] Committee shall: … |
| | |
|
| | 2. | | Pre-approve (a) all audit and permissible non-audit services1 to be provided to the Fund and (b) all permissible non-audit services to be provided by the Fund’s independent auditors to UBS Global [Asset Management (Americas) Inc. (“UBS Global AM”)] and any Covered Service Providers, if the engagement relates directly to the operations and financial reporting of the Fund. In carrying out this responsibility, the Committee shall seek periodically from UBS Global [AM] and from the independent auditors a list of such audit and permissible non-audit services that can be expected to be rendered to the Fund, UBS Global [AM] or any Covered Service Providers by the Fund’s independent auditors, and an estimate of the fees sought to be paid in connection with such services. The Committee may delegate its responsibility to pre-approve any such audit and permissible non-audit services to a sub-committee consisting of the Chairperson of the Committee and two other members of the Committee as the Chairperson, from time to time, may determine and appoint, and such sub-committee shall report to the Committee, at its next regularly scheduled meeting after the sub-committee’s meeting, its decision(s). From year to year, the Committee shall report to the Board whether this system of pre-approval has been effective and efficient or whether this Charter should be amended to allow for pre-approval pursuant to such policies and procedures as the Committee shall approve, including the delegation of some or all of the Committee’s pre-approval responsibilities to other persons (other than UBS Global [AM] or the Fund’s officers). |
| | | ____________________ |
1 The Committee will not approve non-audit services that the Committee believes may taint the independence of the auditors. Currently, permissible non-audit services include any professional services (including tax services) that are not prohibited services as described below, provided to the Fund by the independent auditors, other than those provided to the Fund in connection with an audit or a review of the financial statements of the Fund. Permissible non-audit services may not include: (i) bookkeeping or other services related to the accounting records or financial statements of the Fund; (ii) financial information systems design and implementation; (iii) appraisal or valuation services, fairness opinions or contribution-in-kind reports; (iv) actuarial services; (v) internal audit outsourcing services; (vi) management functions or human resources; (vii) broker or dealer, investment adviser or investment banking services; (viii) legal services and expert services unrelated to the audit; and (ix) any other service the Public Company Accounting Oversight Board determines, by regulation, is impermissible.
Pre-approval by the Committee of any permissible non-audit services is not required so long as: (i) the aggregate amount of all such permissible non-audit services provided to the Fund, UBS Global [AM] and any service providers controlling, controlled by or under common control with UBS Global [AM] that provide ongoing services to the Fund (“Covered Service Providers”) constitutes not more than 5% of the total amount of revenues paid to the independent auditors (during the fiscal year in which the permissible non-audit services are provided) by (a) the Fund, (b) its investment adviser and (c) any entity controlling, controlled by, or under common control with the investment adviser that provides ongoing services to the Fund during the fiscal year in which the services are provided that would have to be approved by the Committee; (ii) the permissible non-audit services were not recognized by the Fund at the time of the engagement to be non-audit services; and (iii) such services are promptly brought to the attention of the Committee and approved by the Committee (or its delegate(s)) prior to the completion of the audit.
| | (e) | | (2) Services approved pursuant to paragraph (c)(7)(i)(C) of Rule 2-01 of Regulation S-X: |
| | | |
| | | Audit-Related Fees: |
| | | There were no amounts that were approved by the audit committee pursuant to the de minimis exception for the fiscal years ended August 31, 2013 and August 31, 2012 on behalf of the registrant. There were no amounts that were required to be approved by the audit committee pursuant to the de minimis exception for the fiscal years ended August 31, 2013 and August 31, 2012 on behalf of the registrant’s service providers that relate directly to the operations and financial reporting of the registrant. Tax Fees:
There were no amounts that were approved by the audit committee pursuant to the de minimis exception for the fiscal years ended August 31, 2013 and August 31, 2012 on behalf of the registrant. There were no amounts that were required to be approved by the audit committee pursuant to the de minimis exception for the fiscal years ended August 31, 2013 and August 31, 2012 on behalf of the registrant’s service providers that relate directly to the operations and financial reporting of the registrant. All Other Fees:
There were no amounts that were approved by the audit committee pursuant to the de minimis exception for the fiscal years ended August 31, 2013 and August 31, 2012 on behalf of the registrant. There were no amounts that were required to be approved by the audit committee pursuant to the de minimis exception for the fiscal years ended August 31, 2013 and August 31, 2012 on behalf of the registrant’s service providers that relate directly to the operations and financial reporting of the registrant. |
| | (f) | | According to E&Y, for the fiscal year ended August 31, 2013, the percentage of hours spent on the audit of the registrant’s financial statements for the most recent fiscal year that were attributed to work performed by persons who are not full-time, permanent employees of E&Y was 0%. |
| | | | |
| (g) | | For the fiscal years ended August 31, 2013 and August 31, 2012, the aggregate fees billed by E&Y of $198,219 and $287,916, respectively, for non-audit services rendered on behalf of the registrant (“covered”), its investment adviser (not including any sub-adviser whose role is primarily portfolio management and is subcontracted with or overseen by another investment adviser) and any entity controlling, controlled by, or under common control with the adviser (“non-covered”) that provides (or provided during the relevant fiscal period) services to the registrant for each of the last two fiscal years of the registrant is shown in the table below: |
| | | | 2013 | | 2012 |
| | Covered Services | | $25,094 | | $21,244 |
| Non-Covered Services | | 173,125 | | 266,672 |
| | (h) | | The registrant’s audit committee was not required to consider whether the provision of non-audit services that were rendered to the registrant’s investment adviser (not including any sub-adviser whose role is primarily portfolio management and is subcontracted with or overseen by another investment adviser), and any entity controlling, controlled by, or under common control with the investment adviser that provides ongoing services to the registrant that were not pre-approved pursuant to paragraph (c)(7)(ii) of Rule 2-01 of Regulation S-X is compatible with maintaining the principal accountant’s independence. |
Item 5. Audit Committee of Listed Registrants.
Not applicable to the registrant.
Item 6. Schedule of Investments.
| | (a) | Included as part of the report to shareholders filed under Item 1 of this form. |
| | (b) | Not applicable. |
Item 7. Disclosure of Proxy Voting Policies and Procedures for Closed-End Management Investment Companies.
Not applicable to the registrant.
Item 8. Portfolio Managers of Closed-End Management Investment Companies.
Not applicable to the registrant.
Item 9. Purchases of Equity Securities by Closed-End Management Investment Company and Affiliated Purchasers.
Not applicable to the registrant.
Item 10. Submission of Matters to a Vote of Security Holders.
The registrant’s Board has established a Nominating and Corporate Governance Committee. The Nominating and Corporate Governance Committee will consider nominees recommended by shareholders if a vacancy occurs among those board members who are not “interested persons” as defined in Section 2(a)(19) of the Investment Company Act of 1940, as amended. In order to recommend a nominee, a shareholder should send a letter to the chairperson of the Nominating and Corporate Governance Committee, Richard R. Burt, care of the Secretary of the registrant at UBS Global Asset Management, UBS Building, One North Wacker Drive, Chicago, IL 60606, Attn: Mark Kemper, Secretary, and indicate on the envelope “Nominating and Corporate Governance Committee.” The shareholder’s letter should state the nominee’s name and should include the nominee’s resume or curriculum vitae, and must be accompanied by a written consent of the individual to stand for election if nominated for the Board and to serve if elected by shareholders.
Item 11. Controls and Procedures.
| | (a) | | The registrant’s principal executive officer and principal financial officer have concluded that the registrant’s disclosure controls and procedures (as defined in Rule 30a-3(c) under the Investment Company Act of 1940, as amended) are effective based on their evaluation of these controls and procedures as of a date within 90 days of the filing date of this document. |
| |
| (b) | | The registrant’s principal executive officer and principal financial officer are aware of no changes in the registrant’s internal control over financial reporting that occurred during the registrant’s most recent fiscal half-year that has materially affected, or is reasonably likely to materially affect, the registrant’s internal control over financial reporting. |
Item 12. Exhibits.
| | (a) | | (1) Code of Ethics as required pursuant to Section 406 of the Sarbanes-Oxley Act of 2002 (and designated by the registrant as a “Code of Conduct”)is filed herewith as Exhibit Ex-99.CODE ETH. |
| |
| (a) | | (2) Certifications of principal executive officer and principal financial officer pursuant to Section 302 of the Sarbanes-Oxley Act of 2002 are attached hereto as Exhibit EX-99.CERT. |
| |
| (a) | | (3) Written solicitation to purchase securities under Rule 23c-1 under the Investment Company Act of 1940 sent or given during the period covered by the report by or on behalf of the registrant to 10 or more persons – not applicable to the registrant. |
| |
| (b) | | Certifications of principal executive officer and principal financial officer pursuant to Section 906 of the Sarbanes-Oxley Act of 2002 are attached hereto as Exhibit EX-99.906CERT. |
| |
| (c) | | Disclosure pursuant to Section 13(r) of the Securities Exchange Act of 1934, as amended, is attached hereto as Exhibit EX-99.IRANNOTICE. |
SIGNATURES
Pursuant to the requirements of the Securities Exchange Act of 1934 and the Investment Company Act of 1940, the registrant has duly caused this report to be signed on its behalf by the undersigned, thereunto duly authorized.
| UBS Investment Trust |
| |
| By: | | /s/ Mark E. Carver |
| | Mark E. Carver
President |
| |
| Date: | | November 8, 2013 |
Pursuant to the requirements of the Securities Exchange Act of 1934 and the Investment Company Act of 1940, this report has been signed below by the following persons on behalf of the registrant and in the capacities and on the dates indicated.
| By: | | /s/ Mark E. Carver |
| | Mark E. Carver |
| | President |
| |
| Date: | | November 8, 2013 |
| |
| By: | | /s/ Thomas Disbrow |
| | Thomas Disbrow |
| | Vice President and Treasurer |
| |
| Date: | | November 8, 2013 |