UNITED STATES
SECURITIES AND EXCHANGE COMMISSION
Washington, D.C. 20549
FORM N-CSR
CERTIFIED SHAREHOLDER REPORT OF REGISTERED
MANAGEMENT INVESTMENT COMPANIES
Investment Company Act file number: 811-06292
______________________________________________
UBS Investment Trust
(Exact name of registrant as specified in charter)
1285 Avenue of the Americas, New York, New York 10019-6028
(Address of principal executive offices) (Zip code)
Keith A. Weller, Esq. UBS Asset Management One North Wacker Drive Chicago, IL 60606 |
| (Name and address of agent for service) |
| |
| Copy to: |
Stephen H. Bier, Esq. Dechert LLP 1095 Avenue of the Americas New York, NY 10036-6797 |
Registrant’s telephone number, including area code: 212-821 3000
Date of fiscal year end: August 31
Date of reporting period: August 31, 2021
Item 1. Reports to Stockholders.
| (a) | Copy of the report transmitted to shareholders: |

UBS U.S. Allocation Fund
Annual Report | August 31, 2021
October 6, 2021
Dear shareholder,
We present you with the annual report for UBS U.S. Allocation Fund (the "Fund") for the 12 months ended August 31, 2021.
Performance
Over the 12 months ended August 31, 2021, the Fund's Class A shares returned 22.37%% before deducting the maximum sales charge and returned 15.63% after deducting the maximum sales charge. During the same period, the Fund's primary benchmark, the S&P 500 Index,1 which tracks large cap US equities, returned 31.17%. Since the Fund invests in both stocks and bonds, we believe it is appropriate to also compare its performance to the UBS U.S. Allocation Fund Benchmark (the Fund's secondary benchmark),2 which returned 21.22% during the period. (Returns for all share classes over various time periods and descriptions of the indices are shown in "Performance at a glance" on page 6; please note that the returns shown do not reflect the deduction of taxes that a shareholder would pay on Fund distributions or on the redemption of Fund shares.)
Market commentary
The US economy rebounded sharply following the dramatic downturn due to the COVID-19 pandemic. Looking back, with large parts of the economy locked down, second quarter 2020 US annualized gross domestic product ("GDP") was -31.4% compared with the first quarter of 2020. This was the largest quarterly contraction on record. With the economy reopening, third quarter GDP growth was 33.4%, the largest quarterly increase ever. GDP growth in the US was then 4.3% and 6.3% during the fourth quarter of 2020 and the first quarter of 2021, respectively. Finally, second quarter 2021 annualized GDP growth was 6.7%.
The US Federal Reserve Board (the "Fed") maintained its highly accommodative monetary policy during the reporting period. Throughout the 12 months ended August 31, 2021, the Fed maintained the federal funds rate in a record-low range between 0.00% and 0.25%. The Fed also continued to purchase Treasury and mortgage securities, as well as individual corporate bonds. While inflation sharply increased, at its June 2021 meeting the Fed stated, "Progress on vaccinations has reduced the spread of COVID-19 in the United States... Inflation has risen, largely reflecting transitory factors." However, Fed officials pushed forward the time table for raising rates and now projects that it would institute two interest rate increases by the end of 2023, versus in 2024. Finally, in July 2021, Fed Chair Jerome Powell said the central bank may start tapering its monthly asset purchases in 2021.
The global equity market produced very strong results during the reporting period. Supporting the market were the continued COVID-19 vaccine rollout, aggressive monetary and fiscal policy and improving corporate profits. While there were periods of weakness, they were short lived, and investor demand for equities was robust overall. For the
UBS U.S. Allocation Fund
Investment Objective:
Total return, consisting of long-term capital appreciation and current income
Portfolio Managers:
Nicole Goldberger
Evan Brown
UBS Asset Management (Americas) Inc.
Commencement:
Class A—May 10, 1993
Class P (formerly Class Y)—May 10, 1993
Dividend payments:
Annually, if any
1 The S&P 500 Index is an unmanaged, weighted index composed of 500 widely held common stocks varying in composition and is not available for direct investment. Investors should note that indices do not reflect the deduction of fees and expenses.
2 The UBS U.S. Allocation Fund Benchmark is an unmanaged benchmark compiled by the Advisor, constructed as follows: from July 22, 1992 (the Fund's inception) until February 29, 2004: 100% S&P 500 Index; from March 1, 2004 until May 31, 2005: 65% Russell 3000 Index, 30% Blomberg Barclays US Aggregate Index and 5% BofA Merrill Lynch US High Yield Cash Pay Index; and from June 1, 2005 until present: 65% Russell 3000 Index, 30% Bloomberg Barclays US Aggregate Index and 5% BofA Merrill Lynch US High Yield Cash Pay Constrained Index. Investors should note that indices do not reflect the deduction of fees and expenses.
1
12-months ended August 31, 2021, the S&P 500 Index3 gained 31.17% and reached several new all-time highs. Outside the US, international developed equities, as measured by the MSCI EAFE Index (net),4 returned 26.12% during the reporting period, while emerging markets equities, as measured by the MSCI Emerging Markets Index (net),5 gained 21.12%.
The overall global fixed income market generated weak results over the reporting period. Developed market central banks maintained their highly accommodative monetary policies to support their economies. While inflation moved higher, the US Fed characterized the increase as being transitory. Regardless, with global growth improving and inflation rising, both short- and long-term US Treasury yields moved higher (bond yields and prices move in the opposite direction). For the 12 month reporting period as a whole, the yield on the US 10-year Treasury rose from 0.72% to 1.30%. The overall US bond market, as measured by the Bloomberg Barclays US Aggregate Index,6 returned -0.08% during the 12-months ended August 31, 2021. Returns of riskier fixed income securities were positive. High yield bonds, as measured by the ICE BofAML US High Yield Cash Pay Constrained Index,7 returned 10.12%. Elsewhere, emerging markets debt, as measured by the J.P. Morgan Emerging Markets Bond Index Global (EMBI Global),8 gained 4.20% during the reporting period.
Portfolio commentary
What worked
• Overall, security selection and asset allocation decisions contributed to performance during the reporting period. The US value equity core portion of the Fund was the most additive for returns.
• In the US value equity core portion of the Fund, performance was mainly driven by positive stock selection. The portfolio benefited from the market rotation in favor of value and small- cap stocks as a result of the expected post-pandemic economic normalization and rising bond yields. An overweight preference for the information technology and health care sectors were the most beneficial on a relative basis, followed by consumer staples and industrials. On an individual stock basis, the largest contributors included:
– AGCO's share price rose as the company posted strong second quarter 2021 results that beat expectations on both the top and bottom lines. In addition, strong end market demand more than offset supply chain and material cost challenges.
3 The S&P 500 Index is an unmanaged, weighted index composed of 500 widely held common stocks varying in composition and is not available for direct investment. Investors should note that indices do not reflect the deduction of fees and expenses.
4 The MSCI EAFE Index (net) is an index of stocks designed to measure the investment returns of developed economies outside of North America. Net total return indices reinvest dividends after the deduction of withholding taxes, using a tax rate applicable to non-resident institutional investors who do not benefit from double taxation treaties. The index is constructed and managed with a view to being fully investable from the perspective of international institutional investors. Investors should note that indices do not reflect the deduction of fees and expenses.
5 The MSCI Emerging Markets Index (net) is a market capitalization-weighted index composed of different emerging market countries in Europe, Latin America, and the Pacific Basin. Net total return indices reinvest dividends after the deduction of withholding taxes, using a tax rate applicable to non-resident institutional investors who do not benefit from double taxation treaties. The index is constructed and managed with a view to being fully investable from the perspective of international institutional investors. Investors should note that indices do not reflect the deduction of fees and expenses.
6 The Bloomberg Barclays US Aggregate Index is an unmanaged broad based index designed to measure the US dollar-denominated, investment-grade, taxable bond market. The index includes bonds from the Treasury, government-related, corporate, mortgage-backed, asset-backed and commercial mortgage-backed sectors. Investors should note that indices do not reflect the deduction of fees and expenses.
7 The ICE BofAML US High Yield Cash Pay Constrained Index is an unmanaged index of publicly placed, non-convertible, coupon-bearing US dollar denominated, below investment grade corporate debt with a term to maturity of at least one year. The index is market capitalization weighted, so that larger bond issuers have a greater effect on the index's return. However, the representation of any single bond issuer is restricted to a maximum of 2% of the total index. Investors should note that indices do not reflect the deduction of fees and expenses.
8 The J.P. Morgan Emerging Markets Bond Index Global (EMBI Global) is an unmanaged index which is designed to track total returns for US dollar denominated debt instruments issued by emerging market sovereign and quasi-sovereign entities: Brady bonds, loans and Eurobonds. Investors should note that indices do not reflect the deduction of fees and expenses.
2
– Wells Fargo's stock price fared well, and its shares were boosted by economic recovery.
– Bunge's shares performed well, benefiting from the agriculture boom. The company's first quarter 2021 adjusted earnings more than tripled from a year ago.
• In the US growth equity portion of the Fund, within sector allocation, an overweight to communication services and an underweight in consumer staples contributed the most to relative performance. Stock selection within health care and communication services were most positive. Several holdings were additive to performance on a relative basis including:
– HubSpot outperformed as the company experienced a large acceleration in new customer acquisitions as small- and mid-sized businesses have embraced digital transformation. The company also reported strong quarterly earnings results.
– Alphabet's shares outperformed amid robust results secured by strength in Cloud, advertising recovery, and YouTube viewership growth. We continue to favor its shares given improving cloud execution, secular YouTube tailwinds via connected TV penetration, and recovery in key advertising markets such as travel.
– United Rentals contributed to performance due to upward earnings revisions. We continue to see improving utilization rates, decent fleet absorption and signs of health in used equipment markets. We believe these factors should drive favorable pricing and incremental margins for the equipment rental industry.
• Overall, asset allocation was positive for relative performance during the reporting period.9
– We began the period slightly underweight equities and overweight fixed income versus the UBS U.S. Allocation Fund Benchmark.
– We ended the period slightly overweight equities and underweight fixed income versus the UBS U.S. Allocation Fund Benchmark. For comparison purposes, neutral Index weights for the Fund are 65.0% equities and 35.0% fixed income.
– We tactically adjusted the portfolio during the reporting period given the changing economic and market environment due to the COVID-19 pandemic. We moved to an overweight in equities by increasing exposure to US small-cap stocks over US large-cap stocks, as investors shifted focus away from large-cap stocks towards smaller-firms with improving profit margins. Furthermore, we increased our cyclical exposure and emphasized the reopening trend during the pandemic.
– Overall, asset allocation decisions were positive over the reporting period. Within equities, an overweight contributed to relative returns, as risk assets experienced a tremendous rebound, reversing much of the damage caused by the initial COVID-19 induced selloff in 2020. Within fixed income, an underweight to US government securities contributed to relative returns.
• Relative to the secondary benchmark, the use of fixed income and equity derivatives (futures, options, and swaps) contributed to the Fund's results. These derivative instruments, which were utilized to manage the Fund's fixed income and equity exposure, were contributors to performance.
9 Allocations include derivative expsoure.
3
What didn't work
• In the US value equity portion of the Fund, the largest detractors stemmed from energy and consumer discretionary sectors. On an individual stock basis, the largest detractors included:
– Dollar Tree cut its full-year profit forecast as the discount retailer joined rival Dollar General Corp in flagging that surging supply chain costs were squeezing its margins. We continue to hold this stock.
– Take-Two Interactive's shares lowered as delays in introductions pressured the outlook of the company. We continue to hold this stock.
– Mondelez, a multinational confectionery, food, holding and beverage and snack food company detracted from performance given headwinds in the snack producer business. We continue to hold this stock.
• In the US growth equity portion of the Fund, both sector allocation and stock selection detracted from performance. An overweight to consumer discretionary and small cash position were headwinds for relative results. Security selection within consumer discretionary and information technology sectors detracted from performance. On an individual stock basis, the largest detractors included:
– Splunk is an American software company. The company delivered modest upside to fourth quarter results and its cloud-based annual reoccurring revenue continues to grow very strongly as its business transitions. However, its guidance was subdued as Splunk continues to see headwinds from the macroeconomic conditions in its traditional on-premise business. We sold our position during the reporting period.
– Salesforce detracted from results. Although they are experiencing good sales momentum with strong customer interest in key digital transformation areas, its shares were weighed down by the announcement that the company would acquire Slack. This came as a surprise as Salesforce's Chief Executive Officer previously cited the rich valuation environment and organic growth priority. We continue to hold this stock.
– Coupa was a headwind for performance, as the company issued conservative guidance for the full year amid integration of Llamasoft, a direct purchasing software company. We sold our position during the reporting period.
4
We thank you for your continued support and welcome any comments or questions you may have. For additional information on the UBS family of funds,* please contact your financial advisor or visit us at www.ubs.com/am-us.
Sincerely,

| | 
| |
Igor Lasun
President
UBS U.S. Allocation Fund
Managing Director
UBS Asset Management
(Americas) Inc. | | Nicole Goldberger
Portfolio Manager
UBS U.S. Allocation Fund
Managing Director
UBS Asset Management
(Americas) Inc. | |
Evan Brown
Portfolio Manager
UBS U.S. Allocation Fund
Managing Director
UBS Asset Management
(Americas) Inc.
This letter is intended to assist shareholders in understanding how the Fund performed during the 12 months ended August 31, 2021. The views and opinions in the letter were current as of October 6, 2021. They are not guarantees of future performance or investment results and should not be taken as investment advice. Investment decisions reflect a variety of factors, and we reserve the right to change our views about individual securities, sectors and markets at any time. As a result, the views expressed should not be relied upon as a forecast of the Fund's future investment intent. We encourage you to consult your financial advisor regarding your personal investment program.
* Mutual funds are sold by prospectus only. You should read it carefully and consider a fund's investment objectives, risks, charges, expenses and other important information contained in the prospectus before investing. The prospectus contains this and other information about the fund. Prospectuses for most of our funds can be obtained from your Financial Advisor, by calling UBS Funds at 800-647 1568 or by visiting our website at www.ubs.com/am-us.
5
Performance at a glance (unaudited)
Average annual total returns for periods ended 08/31/2021 | | 1 year | | 5 years | | 10 years | |
Before deducting maximum sales charge | |
Class A1 | | | 22.37 | % | | | 11.99 | % | | | 11.00 | % | |
Class P2 | | | 22.69 | | | | 12.29 | | | | 11.31 | | |
After deducting maximum sales charge | |
Class A1 | | | 15.63 | | | | 10.73 | | | | 10.38 | | |
S&P 500 Index3 | | | 31.17 | | | | 18.02 | | | | 16.34 | | |
UBS U.S. Allocation Fund Benchmark4 | | | 21.22 | | | | 13.04 | | | | 11.92 | | |
Most recent calendar quarter-end returns (unaudited)
Average annual total returns for periods ended 09/30/2021 | | 1 year | | 5 years | | 10 years | |
Before deducting maximum sales charge | |
Class A1 | | | 21.90 | % | | | 11.30 | % | | | 11.33 | % | |
Class P2 | | | 22.22 | | | | 11.60 | | | | 11.64 | | |
After deducting maximum sales charge | |
Class A1 | | | 15.19 | | | | 10.04 | | | | 10.70 | | |
The annualized gross and net expense ratios, respectively, for each class of shares as in the December 29, 2020 prospectuses, were as follows: Class A—1.01% and 1.01%; and Class P—0.74% and 0.74%.
Net expenses reflect fee waivers and/or expense reimbursements, if any, pursuant to an agreement that is in effect to cap the expenses. The Fund and UBS Asset Management (Americas) Inc. have entered into a written agreement, separate from UBS AM's investment advisory agreement with the Fund, whereby UBS AM has agreed to permanently reduce its management fees based on the Fund's average daily net assets to the following rates: $0 to $250 million: 0.50%; in excess of $250 million up to $500 million: 0.45%; in excess of $500 million up to $2 billion: 0.40%; over $2 billion: 0.35%. Effective December 29, 2020, UBS AM has contractually undertaken to waive fees/reimburse a portion of the Fund's expenses, when necessary, so that the ordinary total annual operating expenses of each class through December 31, 2021 (excluding dividend expense, borrowing costs and interest expense relating to short sales, and expenses attributable to investments in other investment companies, interest, taxes, brokerage commissions and extraordinary expenses, if any) would not exceed 1.15% for Class A and 0.90% for Class P.
1 Maximum sales charge for Class A shares is 5.5%. Class A shares bear ongoing 12b-1 service fees.
2 Class P shares do not bear initial or contingent deferred sales charges or ongoing 12b-1 service and distribution fees, but Class P shares held through advisory programs may be subject to a program fee, which, if included, would have reduced performance.
3 The S&P 500 Index is an unmanaged, weighted index comprising 500 widely held common stocks varying in composition and is not available for direct investment. Investors should note that indices do not reflect the deduction of fees and expenses.
4 The UBS U.S. Allocation Fund Benchmark is an unmanaged benchmark compiled by the Advisor, constructed as follows: from June 1, 2005 until present: 65% Russell 3000 Index, 30% Bloomberg Barclays US Aggregate Bond Index, and 5% ICE BofAML US High Yield Cash Pay Constrained Index. Investors should note that indices do not reflect the deduction of fees and expenses.
Past performance does not predict future performance, and the performance information provided does not reflect the deduction of taxes that a shareholder would pay on Fund distributions or the redemption of Fund shares. The return and principal value of an investment will fluctuate, so that an investor's shares, when redeemed, may be worth more or less than their original cost. Performance results assume reinvestment of all dividends and capital gain distributions at net asset value on the ex-dividend dates. Current performance may be higher or lower than the performance data quoted. For month-end performance figures, please visit http://www.ubs.com/us-mutualfundperformance.
6
Illustration of an assumed investment of $10,000 in Class P shares of the Fund (unaudited)
The following graph depicts the performance of UBS U.S. Allocation Fund Class P shares versus the S&P 500 Index and the UBS U.S. Allocation Fund Benchmark over the 10 years ended August 31, 2021. The performance of the other class will vary based upon the different class specific expenses and sales charges. The performance provided does not reflect the deduction of taxes that a shareholder would pay on Fund distributions or the redemption of Fund shares. Past performance is no guarantee of future results. Share price and returns will vary with market conditions; investors may realize a gain or loss upon redemption. It is important to note that the Fund is a professionally managed portfolio while the Indices are not available for investment and are unmanaged. The comparison is shown for illustration purposes only.
UBS U.S. Allocation Fund Class P
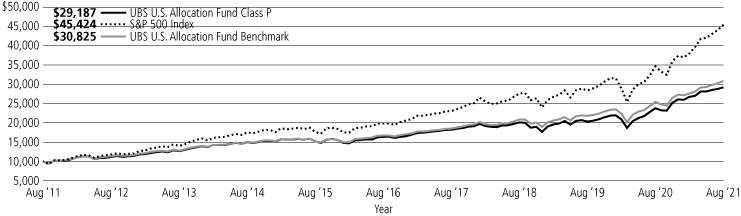
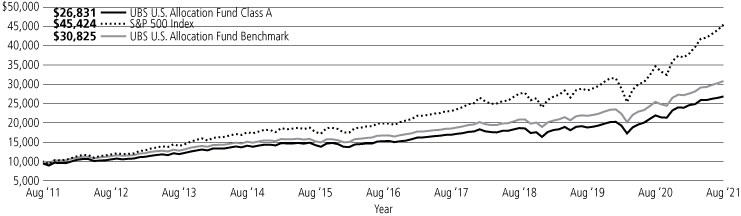
Illustration of an assumed investment of $10,000 in Class A shares of the Fund (unaudited)
The following graph depicts the performance of UBS U.S. Allocation Fund Class A shares versus the S&P 500 Index and the UBS U.S. Allocation Fund Benchmark over the 10 years ended August 31, 2021. The performance of the other class will vary based upon the different class specific expenses and sales charges. The performance provided does not reflect the deduction of taxes that a shareholder would pay on Fund distributions or the redemption of Fund shares. Past performance is no guarantee of future results. Share price and returns will vary with market conditions; investors may realize a gain or loss upon redemption. It is important to note that the Fund is a professionally managed portfolio while the Indices are not available for investment and are unmanaged. The comparison is shown for illustration purposes only.
UBS U.S. Allocation Fund Class A
7
Understanding your Fund's expenses (unaudited)
As a shareholder of the Fund, you incur two types of costs: (1) transactional costs (as applicable), including sales charges (loads); and (2) ongoing costs, including management fees; service and/or distribution (12b-1) fees (if applicable); and other Fund expenses. This example is intended to help you understand your ongoing costs (in dollars) of investing in the Fund and to compare these costs with the ongoing costs of investing in other mutual funds.
The example below is based on an investment of $1,000 invested at the beginning of the period and held for the entire period, March 1, 2021 to August 31, 2021.
Actual expenses (unaudited)
The first line for each class of shares in the table below provides information about actual account values and actual expenses. You may use the information in this line, together with the amount you invested, to estimate the expenses that you paid over a period. Simply divide your account value by $1,000 (for example, an $8,600 account value divided by $1,000 = 8.6), then multiply the result by the number in the first line for each class of shares under the heading entitled "Expenses paid during period" to estimate the expenses you paid on your account during this period.
Hypothetical example for comparison purposes (unaudited)
The second line for each class of shares in the table below provides information about hypothetical account values and hypothetical expenses based on the Fund's actual expense ratios for each class of shares and an assumed rate of return of 5% per year before expenses, which is not the Fund's actual return for each class of shares. The hypothetical account values and expenses may not be used to estimate the actual ending account balance or expenses you paid for the period. You may use this information to compare the ongoing costs of investing in the Fund and other funds. To do so, compare this 5% hypothetical example with the 5% hypothetical examples that appear in the shareholder reports of other funds.
Please note that the expenses shown in the table are meant to highlight your ongoing Fund costs only and do not reflect any transactional costs (as applicable), such as sales charges (loads). Therefore, the second line in the table for each class of shares is useful in comparing ongoing Fund costs only, and will not help you determine the relative total costs of owning different funds. In addition, if these transactional costs were included, your costs would have been higher.
| | | | | Beginning
account value
March 1, 2021 | | Ending
account value
August 31, 2021 | | Expenses paid
during period1
03/01/21 to 08/31/21 | | Expense
ratio during
the period | |
Class A | | Actual | | $ | 1,000.00 | | | $ | 1,090.40 | | | $ | 4.95 | | | | 0.94 | % | |
| | | Hypothetical (5% annual return before expenses) | | | 1,000.00 | | | | 1,020.47 | | | | 4.79 | | | | 0.94 | | |
Class P | | Actual | | | 1,000.00 | | | | 1,091.80 | | | | 3.48 | | | | 0.66 | | |
| | | Hypothetical (5% annual return before expenses) | | | 1,000.00 | | | | 1,021.88 | | | | 3.36 | | | | 0.66 | | |
1 Expenses are equal to the Fund's annualized net expense ratio, multiplied by the average account value over the period, multiplied by 184 divided by 365 (to reflect the one-half year period).
8
Portfolio statistics and industry diversification—(unaudited)1
As a percentage of net assets as of August 31, 2021
Top ten equity holdings | | | |
JPMorgan BetaBuilders MSCI US REIT ETF | | | 4.2 | % | |
Microsoft Corp. | | | 2.6 | | |
Apple, Inc. | | | 2.4 | | |
Alphabet, Inc., Class A | | | 2.3 | | |
Amazon.com, Inc. | | | 2.1 | | |
iShares Core S&P Mid-Cap ETF | | | 2.0 | | |
AbbVie, Inc. | | | 1.9 | | |
Health Care Select Sector SPDR Fund | | | 1.5 | | |
Salesforce.com, Inc. | | | 1.3 | | |
Energy Select Sector SPDR Fund | | | 1.2 | | |
Total | | | 21.5 | % | |
Top ten fixed income holdings | | | |
UMBS TBA, 3.000% | | | 0.9 | % | |
Federal National Mortgage Association, 2.000% due 03/01/51 | | | 0.7 | | |
U.S. Treasury Notes, 0.375% due 11/30/25 | | | 0.7 | | |
UMBS TBA, 2.000% | | | 0.7 | | |
U.S. Treasury Inflation Index Notes (TIPS), 0.125% due 07/15/30 | | | 0.5 | | |
U.S. Treasury Notes, 0.250% due 05/15/24 | | | 0.5 | | |
U.S. Treasury Notes, 1.500% due 03/31/23 | | | 0.5 | | |
Federal National Mortgage Association, 2.500% due 08/01/51 | | | 0.4 | | |
U.S. Treasury Bonds, 1.375% due 11/15/40 | | | 0.4 | | |
Santander Retail Auto Lease Trust, 1.100% due 06/20/25 | | | 0.4 | | |
Total | | | 5.7 | % | |
Top five issuer breakdown by country or territory of origin | | | |
United States | | | 98.8 | % | |
Canada | | | 0.4 | | |
United Kingdom | | | 0.4 | | |
Mexico | | | 0.2 | | |
Sweden | | | 0.2 | | |
Total | | | 100.0 | % | |
† Amount is less than 0.05% or (0.05%).
1 The portfolio is actively managed and its composition will vary over time.
9
Portfolio statistics and industry diversification—(unaudited)1 (concluded)
As a percentage of net assets as of August 31, 2021
Asset allocation | | | |
Common stocks | | | 49.7 | % | |
Corporate bonds | | | 12.9 | | |
Exchange traded funds | | | 8.9 | | |
U.S. Treasury obligations | | | 5.9 | | |
Mortgage-backed securities | | | 4.9 | | |
U.S. government agency obligations | | | 4.4 | | |
Asset-backed securities | | | 4.1 | | |
Municipal bonds | | | 0.8 | | |
Non-U.S. government agency obligations | | | 0.7 | | |
Options and swaptions purchased | | | 0.0 | † | |
Preferred stocks | | | 0.0 | † | |
Futures and swaps | | | 13.2 | | |
Cash equivalents and other assets less liabilities | | | (5.5 | ) | |
Total | | | 100.0 | % | |
† Amount is less than 0.05% or (0.05%).
1 The portfolio is actively managed and its composition will vary over time.
10
UBS U.S. Allocation Fund
Portfolio of investments—August 31, 2021
| | | Number of
shares | | Value | |
Common stocks—49.7% | |
Aerospace & defense—0.3% | |
TransDigm Group, Inc.* | | | 1,180 | | | $ | 716,815 | | |
Air freight & logistics—0.3% | |
FedEx Corp. | | | 2,971 | | | | 789,365 | | |
Airlines—0.7% | |
Southwest Airlines Co.* | | | 40,218 | | | | 2,002,052 | | |
Auto components—0.5% | |
Aptiv PLC* | | | 8,835 | | | | 1,344,599 | | |
Automobiles—0.9% | |
Ford Motor Co.* | | | 105,875 | | | | 1,379,551 | | |
Tesla, Inc.* | | | 1,692 | | | | 1,244,838 | | |
| | | | | | 2,624,389 | | |
Banks—1.4% | |
Bank OZK | | | 31,980 | | | | 1,356,911 | | |
Wells Fargo & Co. | | | 58,678 | | | | 2,681,585 | | |
| | | | | | 4,038,496 | | |
Biotechnology—2.3% | |
AbbVie, Inc. | | | 44,281 | | | | 5,348,259 | | |
BioMarin Pharmaceutical, Inc.* | | | 13,328 | | | | 1,122,351 | | |
| | | | | | 6,470,610 | | |
Capital markets—1.1% | |
Ameriprise Financial, Inc. | | | 8,365 | | | | 2,282,892 | | |
Charles Schwab Corp. | | | 11,908 | | | | 867,498 | | |
| | | | | | 3,150,390 | | |
Chemicals—1.1% | |
CF Industries Holdings, Inc. | | | 31,199 | | | | 1,417,058 | | |
Westlake Chemical Corp. | | | 20,525 | | | | 1,792,859 | | |
| | | | | | 3,209,917 | | |
Commercial services & supplies—0.5% | |
Stericycle, Inc.* | | | 20,067 | | | | 1,396,663 | | |
Communications equipment—0.5% | |
Ciena Corp.* | | | 22,231 | | | | 1,270,057 | | |
Consumer finance—0.5% | |
Synchrony Financial | | | 29,506 | | | | 1,467,923 | | |
Diversified financial services—0.5% | |
Voya Financial, Inc. | | | 22,679 | | | | 1,473,681 | | |
Electric utilities—0.9% | |
NextEra Energy, Inc. | | | 28,414 | | | | 2,386,492 | | |
Electrical equipment—0.2% | |
Shoals Technologies Group, Inc., Class A* | | | 15,313 | | | | 498,744 | | |
Entertainment—1.0% | |
Netflix, Inc.* | | | 2,411 | | | | 1,372,317 | | |
Take-Two Interactive Software, Inc.* | | | 9,505 | | | | 1,532,396 | | |
| | | | | | 2,904,713 | | |
Equity real estate investment trusts—0.8% | |
Prologis, Inc. | | | 17,100 | | | | 2,302,686 | | |
| | | Number of
shares | | Value | |
Common stocks—(continued) | |
Food products—1.9% | |
Bunge Ltd. | | | 31,582 | | | $ | 2,391,073 | | |
Mondelez International, Inc., Class A | | | 38,295 | | | | 2,376,971 | | |
Oatly Group AB, ADR* | | | 33,300 | | | | 606,726 | | |
| | | | | | 5,374,770 | | |
Health care equipment & supplies—1.3% | |
Cooper Cos., Inc. | | | 1,761 | | | | 793,701 | | |
DexCom, Inc.* | | | 2,634 | | | | 1,394,492 | | |
Edwards Lifesciences Corp.* | | | 12,818 | | | | 1,502,013 | | |
| | | | | | 3,690,206 | | |
Health care providers & services—1.1% | |
Laboratory Corp. of America Holdings* | | | 7,107 | | | | 2,156,122 | | |
UnitedHealth Group, Inc. | | | 2,537 | | | | 1,056,077 | | |
| | | | | | 3,212,199 | | |
Hotels, restaurants & leisure—1.7% | |
Airbnb, Inc., Class A* | | | 284 | | | | 44,017 | | |
Booking Holdings, Inc.* | | | 730 | | | | 1,678,759 | | |
McDonald's Corp. | | | 6,790 | | | | 1,612,354 | | |
Starbucks Corp. | | | 11,335 | | | | 1,331,749 | | |
| | | | | | 4,666,879 | | |
Insurance—1.0% | |
Allstate Corp. | | | 10,039 | | | | 1,358,076 | | |
Marsh & McLennan Cos., Inc. | | | 8,508 | | | | 1,337,458 | | |
| | | | | | 2,695,534 | | |
Interactive media & services—3.5% | |
Alphabet, Inc., Class A* | | | 2,233 | | | | 6,462,190 | | |
Facebook, Inc., Class A* | | | 4,184 | | | | 1,587,326 | | |
IAC/InterActiveCorp* | | | 3,850 | | | | 508,393 | | |
Match Group, Inc.* | | | 7,044 | | | | 968,127 | | |
Vimeo, Inc.* | | | 8,806 | | | | 335,685 | | |
| | | | | | 9,861,721 | | |
Internet & direct marketing retail—2.2% | |
Amazon.com, Inc.* | | | 1,676 | | | | 5,817,044 | | |
Coupang, Inc.* | | | 6,735 | | | | 201,781 | | |
| | | | | | 6,018,825 | | |
IT services—2.4% | |
Akamai Technologies, Inc.* | | | 22,149 | | | | 2,508,374 | | |
Fidelity National Information Services, Inc. | | | 7,283 | | | | 930,549 | | |
Visa, Inc., Class A | | | 13,832 | | | | 3,168,911 | | |
| | | | | | 6,607,834 | | |
Life sciences tools & services—1.5% | |
10X Genomics, Inc., Class A* | | | 2,497 | | | | 439,272 | | |
Bio-Rad Laboratories, Inc., Class A* | | | 3,317 | | | | 2,669,588 | | |
IQVIA Holdings, Inc.* | | | 4,576 | | | | 1,188,525 | | |
| | | | | | 4,297,385 | | |
Machinery—1.8% | |
AGCO Corp. | | | 15,992 | | | | 2,200,819 | | |
Ingersoll Rand, Inc.* | | | 51,324 | | | | 2,721,199 | | |
| | | | | | 4,922,018 | | |
11
UBS U.S. Allocation Fund
Portfolio of investments—August 31, 2021
| | | Number of
shares | | Value | |
Common stocks—(concluded) | |
Media—1.1% | |
Comcast Corp., Class A | | | 51,351 | | | $ | 3,115,979 | | |
Multiline retail—1.1% | |
Dollar General Corp. | | | 5,222 | | | | 1,164,036 | | |
Dollar Tree, Inc.* | | | 21,792 | | | | 1,973,048 | | |
| | | | | | 3,137,084 | | |
Oil, gas & consumable fuels—1.5% | |
APA Corp. | | | 54,271 | | | | 1,057,199 | | |
ConocoPhillips | | | 10,376 | | | | 576,179 | | |
Hess Corp. | | | 3,132 | | | | 215,325 | | |
Williams Cos., Inc. | | | 100,166 | | | | 2,473,099 | | |
| | | | | | 4,321,802 | | |
Pharmaceuticals—0.3% | |
Eli Lilly & Co. | | | 3,383 | | | | 873,795 | | |
Road & rail—0.3% | |
Union Pacific Corp. | | | 3,667 | | | | 795,152 | | |
Semiconductors & semiconductor equipment—2.7% | |
Advanced Micro Devices, Inc.* | | | 12,201 | | | | 1,350,895 | | |
Applied Materials, Inc. | | | 8,473 | | | | 1,144,956 | | |
Marvell Technology, Inc. | | | 15,683 | | | | 959,643 | | |
Micron Technology, Inc.* | | | 22,189 | | | | 1,635,329 | | |
NVIDIA Corp. | | | 4,532 | | | | 1,014,488 | | |
Qorvo, Inc.* | | | 4,523 | | | | 850,460 | | |
Universal Display Corp. | | | 2,656 | | | | 554,015 | | |
| | | | | | 7,509,786 | | |
Software—7.5% | |
Autodesk, Inc.* | | | 6,042 | | | | 1,873,564 | | |
HubSpot, Inc.* | | | 2,351 | | | | 1,609,189 | | |
Microsoft Corp. | | | 24,449 | | | | 7,380,664 | | |
Salesforce.com, Inc.* | | | 13,683 | | | | 3,629,689 | | |
ServiceNow, Inc.* | | | 3,290 | | | | 2,117,575 | | |
Trade Desk, Inc., Class A* | | | 11,652 | | | | 932,743 | | |
VMware, Inc., Class A* | | | 11,302 | | | | 1,682,529 | | |
Zscaler, Inc.* | | | 5,905 | | | | 1,643,598 | | |
| | | | | | 20,869,551 | | |
Technology hardware, storage & peripherals—2.9% | |
Apple, Inc. | | | 44,506 | | | | 6,757,346 | | |
Western Digital Corp.* | | | 20,422 | | | | 1,290,670 | | |
| | | | | | 8,048,016 | | |
Trading companies & distributors—0.4% | |
United Rentals, Inc.* | | | 2,957 | | | | 1,042,786 | | |
Total common stocks
(cost—$94,652,401) | | | 139,108,914 | | |
Preferred stocks—0.0%† | |
Financial services—0.0%† | |
Squaretwo Financial Corp.1,2
(cost—$0) | | | 35,000 | | | | 0 | | |
Exchange traded funds—8.9% | |
Energy Select Sector SPDR Fund3 | | | 66,441 | | | | 3,215,744 | | |
Health Care Select Sector SPDR Fund | | | 31,520 | | | | 4,261,819 | | |
iShares Core S&P Mid-Cap ETF | | | 20,491 | | | | 5,636,459 | | |
JPMorgan BetaBuilders MSCI US REIT ETF | | | 114,921 | | | | 11,767,911 | | |
Total exchange traded funds
(cost—$24,452,520) | | | 24,881,933 | | |
| | | Face
amount | | Value | |
Asset-backed securities—4.1% | |
AmeriCredit Automobile Receivables Trust,
Series 2020-2, Class B,
0.970%, due 02/18/26 | | $ | 350,000 | | | $ | 352,643 | | |
Capital One Multi-Asset Execution Trust,
Series 2005-B3, Class B3,
3 mo. USD LIBOR + 0.550%,
0.676%, due 05/15/284 | | | 350,000 | | | | 347,435 | | |
CCG Receivables Trust,
Series 2020-1, Class C,
1.840%, due 12/14/275 | | | 275,000 | | | | 279,029 | | |
Drive Auto Receivables Trust,
Series 2017-1, Class D,
3.840%, due 03/15/23 | | | 6,041 | | | | 6,053 | | |
Series 2018-4, Class D,
4.090%, due 01/15/26 | | | 224,878 | | | | 230,267 | | |
DT Auto Owner Trust,
Series 2021-1A, Class C,
0.840%, due 10/15/265 | | | 325,000 | | | | 325,426 | | |
Series 2021-1A, Class D,
1.160%, due 11/16/265 | | | 325,000 | | | | 324,925 | | |
Ford Credit Auto Owner Trust,
Series 2018-1, Class A,
3.190%, due 07/15/315 | | | 560,000 | | | | 603,524 | | |
Series 2020-1, Class A,
2.040%, due 08/15/315 | | | 450,000 | | | | 468,589 | | |
Golden Credit Card Trust,
Series 2021-1A, Class C,
1.740%, due 08/15/281,5 | | | 450,000 | | | | 449,900 | | |
HPEFS Equipment Trust,
Series 2021-1A, Class D,
1.030%, due 03/20/315 | | | 675,000 | | | | 674,660 | | |
Series 2021-2A, Class D,
1.290%, due 03/20/295 | | | 425,000 | | | | 424,865 | | |
Invitation Homes Trust,
Series 2018-SFR1, Class C,
1 mo. USD LIBOR + 1.250%,
1.343%, due 03/17/374,5 | | | 149,978 | | | | 150,178 | | |
New Residential Advance Receivables Trust
Advance Receivables Backed Notes,
Series 2020-APT1, Class AT1,
1.035%, due 12/16/525 | | | 175,000 | | | | 175,055 | | |
NRZ Advance Receivables Trust,
Series 2020-T3, Class AT3,
1.317%, due 10/15/525 | | | 90,000 | | | | 90,075 | | |
Ocwen Master Advance Receivables Trust,
Series 2020-T1, Class AT1,
1.278%, due 08/15/525 | | | 325,000 | | | | 324,697 | | |
OneMain Direct Auto Receivables Trust,
Series 2019-1A, Class A,
3.630%, due 09/14/275 | | | 550,000 | | | | 592,559 | | |
OneMain Financial Issuance Trust,
Series 2020-2A, Class A,
1.750%, due 09/14/355 | | | 150,000 | | | | 153,758 | | |
Series 2020-2A, Class B,
2.210%, due 09/14/355 | | | 300,000 | | | | 308,257 | | |
Series 2021-1A, Class A1,
1.550%, due 06/16/365 | | | 600,000 | | | | 604,949 | | |
12
UBS U.S. Allocation Fund
Portfolio of investments—August 31, 2021
| | | Face
amount | | Value | |
Asset-backed securities—(concluded) | |
Santander Consumer Auto Receivables Trust,
Series 2020-BA, Class B,
0.770%, due 12/15/255 | | $ | 475,000 | | | $ | 477,278 | | |
Santander Drive Auto Receivables Trust,
Series 2020-2, Class B,
0.960%, due 11/15/24 | | | 350,000 | | | | 351,269 | | |
Series 2021-1, Class D,
1.130%, due 11/16/26 | | | 750,000 | | | | 753,793 | | |
Santander Retail Auto Lease Trust,
Series 2021-B, Class C,
1.100%, due 06/20/255 | | | 1,150,000 | | | | 1,153,259 | | |
Sofi Consumer Loan Program Trust,
Series 2018-1, Class B,
3.650%, due 02/25/275 | | | 90,352 | | | | 91,364 | | |
Series 2018-2, Class B,
3.790%, due 04/26/275 | | | 70,696 | | | | 71,205 | | |
Series 2018-3, Class B,
4.020%, due 08/25/275 | | | 115,219 | | | | 116,422 | | |
Tesla Auto Lease Trust,
Series 2020-A, Class B,
1.180%, due 01/22/245 | | | 150,000 | | | | 151,523 | | |
Series 2020-A, Class D,
2.330%, due 02/20/245 | | | 150,000 | | | | 153,717 | | |
Series 2021-A, Class A4,
0.660%, due 03/20/255 | | | 700,000 | | | | 702,066 | | |
Series 2021-A, Class D,
1.340%, due 03/20/255 | | | 575,000 | | | | 577,790 | | |
Total asset-backed securities
(cost—$11,339,500) | | | 11,486,530 | | |
Corporate bonds—12.9% | |
Advertising—0.0%† | |
Lamar Media Corp.
4.875%, due 01/15/29 | | | 5,000 | | | | 5,319 | | |
Aerospace & defense—0.1% | |
Bombardier, Inc.
7.500%, due 12/01/245 | | | 29,000 | | | | 30,227 | | |
7.500%, due 03/15/255 | | | 25,000 | | | | 25,682 | | |
Raytheon Technologies Corp.
4.125%, due 11/16/28 | | | 150,000 | | | | 172,563 | | |
Spirit AeroSystems, Inc.
7.500%, due 04/15/255 | | | 20,000 | | | | 21,175 | | |
TransDigm, Inc.
4.625%, due 01/15/295 | | | 65,000 | | | | 64,187 | | |
6.375%, due 06/15/26 | | | 25,000 | | | | 25,958 | | |
| | | | | | 339,792 | | |
Agriculture—0.1% | |
Philip Morris International, Inc.
2.900%, due 11/15/21 | | | 180,000 | | | | 180,966 | | |
Reynolds American, Inc.
5.700%, due 08/15/35 | | | 70,000 | | | | 85,579 | | |
| | | | | | 266,545 | | |
| | | Face
amount | | Value | |
Corporate bonds—(continued) | |
Airlines—0.0%† | |
American Airlines Group, Inc.
5.000%, due 06/01/225 | | $ | 75,000 | | | $ | 75,656 | | |
American Airlines, Inc./AAdvantage Loyalty IP Ltd.
5.500%, due 04/20/265 | | | 30,000 | | | | 31,620 | | |
United Airlines, Inc.
4.375%, due 04/15/265 | | | 3,000 | | | | 3,112 | | |
4.625%, due 04/15/295 | | | 15,000 | | | | 15,563 | | |
| | | | | | 125,951 | | |
Apparel—0.0%† | |
Hanesbrands, Inc.
5.375%, due 05/15/255 | | | 25,000 | | | | 26,256 | | |
William Carter Co.
5.500%, due 05/15/255 | | | 30,000 | | | | 31,500 | | |
5.625%, due 03/15/275 | | | 10,000 | | | | 10,450 | | |
| | | | | | 68,206 | | |
Auto manufacturers—0.2% | |
Allison Transmission, Inc.
5.875%, due 06/01/295 | | | 50,000 | | | | 55,000 | | |
Ford Motor Co.
7.450%, due 07/16/31 | | | 40,000 | | | | 52,636 | | |
8.500%, due 04/21/23 | | | 30,000 | | | | 33,169 | | |
9.000%, due 04/22/25 | | | 100,000 | | | | 122,170 | | |
General Motors Co.
6.600%, due 04/01/36 | | | 200,000 | | | | 273,524 | | |
General Motors Financial Co., Inc.
5.200%, due 03/20/23 | | | 30,000 | | | | 32,036 | | |
PM General Purchaser LLC
9.500%, due 10/01/285 | | | 42,000 | | | | 45,671 | | |
| | | | | | 614,206 | | |
Auto parts & equipment—0.1% | |
Clarios Global LP
6.750%, due 05/15/255 | | | 4,000 | | | | 4,235 | | |
Clarios Global LP/Clarios U.S. Finance Co.
6.250%, due 05/15/265 | | | 4,000 | | | | 4,215 | | |
Dana Financing Luxembourg SARL
5.750%, due 04/15/255 | | | 30,000 | | | | 30,937 | | |
Dana, Inc.
4.250%, due 09/01/30 | | | 20,000 | | | | 20,796 | | |
5.625%, due 06/15/28 | | | 10,000 | | | | 10,749 | | |
Meritor, Inc.
4.500%, due 12/15/285 | | | 5,000 | | | | 5,100 | | |
6.250%, due 06/01/255 | | | 40,000 | | | | 42,547 | | |
Tenneco, Inc.
5.000%, due 07/15/26 | | | 35,000 | | | | 34,973 | | |
5.125%, due 04/15/295 | | | 30,000 | | | | 31,122 | | |
7.875%, due 01/15/295 | | | 5,000 | | | | 5,625 | | |
| | | | | | 190,299 | | |
13
UBS U.S. Allocation Fund
Portfolio of investments—August 31, 2021
| | | Face
amount | | Value | |
Corporate bonds—(continued) | |
Banks—2.3% | |
Bank of America Corp.
4.200%, due 08/26/24 | | $ | 120,000 | | | $ | 131,526 | | |
5.700%, due 01/24/22 | | | 550,000 | | | | 561,923 | | |
6.110%, due 01/29/37 | | | 350,000 | | | | 481,691 | | |
(Series Z),
(fixed, converts to FRN on 10/23/24),
6.500%, due 10/23/246 | | | 25,000 | | | | 28,188 | | |
Bank of New York Mellon Corp.
1.600%, due 04/24/25 | | | 150,000 | | | | 154,208 | | |
Barclays PLC
4.337%, due 01/10/28 | | | 305,000 | | | | 343,777 | | |
Citigroup, Inc.
(fixed, converts to FRN on 03/20/29),
3.980%, due 03/20/30 | | | 150,000 | | | | 170,332 | | |
5.500%, due 09/13/25 | | | 300,000 | | | | 348,615 | | |
(fixed, converts to FRN on 01/30/23),
5.950%, due 01/30/236 | | | 30,000 | | | | 31,583 | | |
6.675%, due 09/13/43 | | | 125,000 | | | | 194,753 | | |
Goldman Sachs Group, Inc.
3 mo. USD LIBOR + 1.600%,
1.735%, due 11/29/234 | | | 600,000 | | | | 617,468 | | |
5.150%, due 05/22/45 | | | 160,000 | | | | 214,666 | | |
5.750%, due 01/24/22 | | | 200,000 | | | | 204,362 | | |
HSBC Holdings PLC
6.500%, due 09/15/37 | | | 200,000 | | | | 279,933 | | |
JPMorgan Chase & Co.
3.875%, due 09/10/24 | | | 550,000 | | | | 598,701 | | |
(fixed, converts to FRN on 07/24/47),
4.032%, due 07/24/48 | | | 150,000 | | | | 179,156 | | |
(Series R),
(fixed, converts to FRN on 08/01/23),
6.000%, due 08/01/236 | | | 50,000 | | | | 53,063 | | |
Kreditanstalt fuer Wiederaufbau
1.928%, due 04/18/367 | | | 105,000 | | | | 81,882 | | |
Lloyds Banking Group PLC
4.582%, due 12/10/25 | | | 200,000 | | | | 225,292 | | |
Morgan Stanley
4.300%, due 01/27/45 | | | 150,000 | | | | 186,746 | | |
4.350%, due 09/08/26 | | | 365,000 | | | | 414,707 | | |
4.875%, due 11/01/22 | | | 720,000 | | | | 756,893 | | |
Wells Fargo & Co.
(fixed, converts to FRN on 06/17/26),
3.196%, due 06/17/27 | | | 95,000 | | | | 102,877 | | |
| | | | | | 6,362,342 | | |
Beverages—0.1% | |
Anheuser-Busch Cos. LLC/Anheuser-Busch
InBev Worldwide, Inc.
4.700%, due 02/01/36 | | | 75,000 | | | | 92,459 | | |
4.900%, due 02/01/46 | | | 30,000 | | | | 38,278 | | |
Primo Water Holdings, Inc.
4.375%, due 04/30/295 | | | 50,000 | | | | 50,476 | | |
| | | | | | 181,213 | | |
| | | Face
amount | | Value | |
Corporate bonds—(continued) | |
Biotechnology—0.1% | |
Biogen, Inc.
3.250%, due 02/15/515 | | $ | 56,000 | | | $ | 56,391 | | |
Gilead Sciences, Inc.
2.950%, due 03/01/27 | | | 200,000 | | | | 216,047 | | |
4.750%, due 03/01/46 | | | 50,000 | | | | 64,324 | | |
| | | | | | 336,762 | | |
Building materials—0.2% | |
Builders FirstSource, Inc.
4.250%, due 02/01/325 | | | 10,000 | | | | 10,272 | | |
5.000%, due 03/01/305 | | | 25,000 | | | | 26,750 | | |
6.750%, due 06/01/275 | | | 4,000 | | | | 4,270 | | |
Cornerstone Building Brands, Inc.
6.125%, due 01/15/295 | | | 42,000 | | | | 44,900 | | |
Griffon Corp.
5.750%, due 03/01/28 | | | 20,000 | | | | 21,224 | | |
Masco Corp.
4.500%, due 05/15/47 | | | 100,000 | | | | 122,040 | | |
Patrick Industries, Inc.
4.750%, due 05/01/295 | | | 25,000 | | | | 25,562 | | |
7.500%, due 10/15/275 | | | 35,000 | | | | 37,975 | | |
SRM Escrow Issuer LLC
6.000%, due 11/01/285 | | | 64,000 | | | | 67,840 | | |
Standard Industries, Inc.
4.375%, due 07/15/305 | | | 10,000 | | | | 10,273 | | |
Summit Materials LLC/Summit
Materials Finance Corp.
5.250%, due 01/15/295 | | | 2,000 | | | | 2,118 | | |
6.500%, due 03/15/275 | | | 25,000 | | | | 26,250 | | |
U.S. Concrete, Inc.
5.125%, due 03/01/295 | | | 30,000 | | | | 32,788 | | |
| | | | | | 432,262 | | |
Chemicals—0.3% | |
Ashland LLC
3.375%, due 09/01/315 | | | 30,000 | | | | 30,833 | | |
Chemours Co.
4.625%, due 11/15/295 | | | 40,000 | | | | 39,721 | | |
DuPont de Nemours, Inc.
4.725%, due 11/15/28 | | | 100,000 | | | | 119,139 | | |
LYB International Finance II BV
3.500%, due 03/02/27 | | | 150,000 | | | | 165,023 | | |
NOVA Chemicals Corp.
4.250%, due 05/15/295 | | | 20,000 | | | | 20,100 | | |
5.250%, due 06/01/275 | | | 75,000 | | | | 80,132 | | |
Nutrien Ltd.
4.200%, due 04/01/29 | | | 100,000 | | | | 115,261 | | |
Tronox, Inc.
4.625%, due 03/15/295 | | | 75,000 | | | | 76,046 | | |
WR Grace & Co-Conn
4.875%, due 06/15/275 | | | 25,000 | | | | 25,938 | | |
5.625%, due 10/01/245 | | | 50,000 | | | | 54,750 | | |
| | | | | | 726,943 | | |
14
UBS U.S. Allocation Fund
Portfolio of investments—August 31, 2021
| | | Face
amount | | Value | |
Corporate bonds—(continued) | |
Coal—0.0%† | |
SunCoke Energy, Inc.
4.875%, due 06/30/295 | | $ | 33,000 | | | $ | 33,424 | | |
Commercial services—0.3% | |
Allied Universal Holdco LLC/Allied
Universal Finance Corp.
9.750%, due 07/15/275 | | | 25,000 | | | | 27,344 | | |
ASGN, Inc.
4.625%, due 05/15/285 | | | 59,000 | | | | 61,597 | | |
Avis Budget Car Rental LLC/Avis
Budget Finance, Inc.
5.375%, due 03/01/295 | | | 10,000 | | | | 10,500 | | |
5.750%, due 07/15/275 | | | 77,000 | | | | 80,369 | | |
Carriage Services, Inc.
4.250%, due 05/15/295 | | | 35,000 | | | | 35,055 | | |
Garda World Security Corp.
6.000%, due 06/01/295 | | | 20,000 | | | | 19,322 | | |
9.500%, due 11/01/275 | | | 98,000 | | | | 106,721 | | |
Gartner, Inc.
3.625%, due 06/15/295 | | | 15,000 | | | | 15,439 | | |
4.500%, due 07/01/285 | | | 10,000 | | | | 10,587 | | |
Herc Holdings, Inc.
5.500%, due 07/15/275 | | | 68,000 | | | | 71,685 | | |
Legends Hospitality Holding Co. LLC/Legends
Hospitality Co-Issuer, Inc.
5.000%, due 02/01/265 | | | 25,000 | | | | 25,750 | | |
MoneyGram International, Inc.
5.375%, due 08/01/265 | | | 75,000 | | | | 76,500 | | |
NESCO Holdings II, Inc.
5.500%, due 04/15/295 | | | 40,000 | | | | 41,492 | | |
Nielsen Finance LLC/Nielsen Finance Co.
5.625%, due 10/01/285 | | | 30,000 | | | | 31,537 | | |
Prime Security Services Borrower LLC/Prime
Finance, Inc.
3.375%, due 08/31/275 | | | 5,000 | | | | 4,825 | | |
Rent-A-Center, Inc.
6.375%, due 02/15/295 | | | 30,000 | | | | 32,325 | | |
Service Corp. International
5.125%, due 06/01/29 | | | 35,000 | | | | 38,166 | | |
Square, Inc.
3.500%, due 06/01/315 | | | 35,000 | | | | 36,400 | | |
United Rentals North America, Inc.
4.875%, due 01/15/28 | | | 38,000 | | | | 40,280 | | |
WW International, Inc.
4.500%, due 04/15/295 | | | 55,000 | | | | 54,381 | | |
Yale University,
(Series 2020),
1.482%, due 04/15/30 | | | 100,000 | | | | 99,164 | | |
| | | | | | 919,439 | | |
Computers—0.2% | |
Ahead DB Holdings LLC
6.625%, due 05/01/285 | | | 25,000 | | | | 25,437 | | |
Apple, Inc.
3.850%, due 05/04/43 | | | 210,000 | | | | 250,475 | | |
| | | Face
amount | | Value | |
Corporate bonds—(continued) | |
Computers—(concluded) | |
Banff Merger Sub, Inc.
9.750%, due 09/01/265 | | $ | 25,000 | | | $ | 26,219 | | |
Booz Allen Hamilton, Inc.
3.875%, due 09/01/285 | | | 10,000 | | | | 10,308 | | |
4.000%, due 07/01/295 | | | 35,000 | | | | 36,269 | | |
International Business Machines Corp.
5.875%, due 11/29/32 | | | 175,000 | | | | 238,235 | | |
KBR, Inc.
4.750%, due 09/30/285 | | | 10,000 | | | | 10,150 | | |
Science Applications International Corp.
4.875%, due 04/01/285 | | | 10,000 | | | | 10,444 | | |
Western Digital Corp.
4.750%, due 02/15/26 | | | 50,000 | | | | 55,875 | | |
| | | | | | 663,412 | | |
Distribution & wholesale—0.0%† | |
American Builders & Contractors
Supply Co., Inc.
3.875%, due 11/15/295 | | | 20,000 | | | | 19,875 | | |
4.000%, due 01/15/285 | | | 10,000 | | | | 10,329 | | |
Avient Corp.
5.750%, due 05/15/255 | | | 20,000 | | | | 21,110 | | |
IAA, Inc.
5.500%, due 06/15/275 | | | 35,000 | | | | 36,531 | | |
| | | | | | 87,845 | | |
Diversified financial services—0.5% | |
Ally Financial, Inc.
4.125%, due 02/13/22 | | | 100,000 | | | | 101,663 | | |
Capital One Bank USA N.A.
3.375%, due 02/15/23 | | | 70,000 | | | | 72,958 | | |
Capital One Financial Corp.
3.750%, due 07/28/26 | | | 200,000 | | | | 221,291 | | |
Curo Group Holdings Corp.
7.500%, due 08/01/285 | | | 40,000 | | | | 39,897 | | |
GE Capital Funding LLC
3.450%, due 05/15/25 | | | 200,000 | | | | 216,827 | | |
GE Capital International Funding Co.
Unlimited Co.
4.418%, due 11/15/35 | | | 200,000 | | | | 242,762 | | |
Nationstar Mortgage Holdings, Inc.
5.125%, due 12/15/305 | | | 10,000 | | | | 10,251 | | |
6.000%, due 01/15/275 | | | 30,000 | | | | 31,612 | | |
OneMain Finance Corp.
3.875%, due 09/15/28 | | | 35,000 | | | | 35,131 | | |
5.375%, due 11/15/29 | | | 10,000 | | | | 10,925 | | |
5.625%, due 03/15/23 | | | 35,000 | | | | 36,969 | | |
6.125%, due 03/15/24 | | | 30,000 | | | | 32,250 | | |
7.125%, due 03/15/26 | | | 100,000 | | | | 116,875 | | |
8.875%, due 06/01/25 | | | 15,000 | | | | 16,451 | | |
Quicken Loans LLC/Quicken Loans
Co-Issuer, Inc.
3.625%, due 03/01/295 | | | 45,000 | | | | 45,956 | | |
Visa, Inc.
2.000%, due 08/15/50 | | | 50,000 | | | | 44,515 | | |
| | | | | | 1,276,333 | | |
15
UBS U.S. Allocation Fund
Portfolio of investments—August 31, 2021
| | | Face
amount | | Value | |
Corporate bonds—(continued) | |
Electric—0.9% | |
Alabama Power Co.
6.000%, due 03/01/39 | | $ | 30,000 | | | $ | 42,591 | | |
Berkshire Hathaway Energy Co.
3.750%, due 11/15/23 | | | 80,000 | | | | 85,285 | | |
4.450%, due 01/15/49 | | | 200,000 | | | | 252,066 | | |
Calpine Corp.
4.625%, due 02/01/295 | | | 25,000 | | | | 25,081 | | |
5.000%, due 02/01/315 | | | 30,000 | | | | 30,525 | | |
5.125%, due 03/15/285 | | | 30,000 | | | | 30,525 | | |
Clearway Energy Operating LLC
4.750%, due 03/15/285 | | | 25,000 | | | | 26,467 | | |
Dominion Energy, Inc.
3.900%, due 10/01/25 | | | 150,000 | | | | 165,111 | | |
DTE Electric Co.
3.950%, due 03/01/49 | | | 100,000 | | | | 121,309 | | |
Duke Energy Ohio, Inc.
4.300%, due 02/01/49 | | | 150,000 | | | | 188,895 | | |
Exelon Corp.
3.400%, due 04/15/26 | | | 170,000 | | | | 185,472 | | |
4.450%, due 04/15/46 | | | 200,000 | | | | 246,970 | | |
FirstEnergy Corp.,
(Series C),
5.350%, due 07/15/478 | | | 30,000 | | | | 37,548 | | |
Florida Power & Light Co.
5.950%, due 02/01/38 | | | 45,000 | | | | 65,207 | | |
Leeward Renewable Energy Operations LLC
4.250%, due 07/01/295 | | | 35,000 | | | | 35,716 | | |
National Rural Utilities Cooperative
Finance Corp.
3.900%, due 11/01/28 | | | 100,000 | | | | 114,162 | | |
Northern States Power Co.
2.600%, due 05/15/23 | | | 50,000 | | | | 51,358 | | |
NRG Energy, Inc.
3.625%, due 02/15/315 | | | 25,000 | | | | 25,437 | | |
5.250%, due 06/15/295 | | | 10,000 | | | | 10,857 | | |
Oncor Electric Delivery Co. LLC
3.750%, due 04/01/45 | | | 40,000 | | | | 46,613 | | |
Pike Corp.
5.500%, due 09/01/285 | | | 30,000 | | | | 30,487 | | |
Southern California Edison Co.
3.650%, due 02/01/50 | | | 175,000 | | | | 178,334 | | |
Southern Power Co.
5.250%, due 07/15/43 | | | 160,000 | | | | 203,031 | | |
Virginia Electric and Power Co.
4.600%, due 12/01/48 | | | 100,000 | | | | 132,173 | | |
Vistra Operations Co. LLC
5.000%, due 07/31/275 | | | 65,000 | | | | 67,444 | | |
| | | | | | 2,398,664 | | |
Electrical components & equipment—0.0%† | |
Energizer Holdings, Inc.
4.375%, due 03/31/295 | | | 20,000 | | | | 20,057 | | |
4.750%, due 06/15/285 | | | 25,000 | | | | 25,688 | | |
| | | | | | 45,745 | | |
| | | Face
amount | | Value | |
Corporate bonds—(continued) | |
Electronics—0.0%† | |
Sensata Technologies BV
4.000%, due 04/15/295 | | $ | 10,000 | | | $ | 10,351 | | |
Energy-Alternate Sources—0.0%† | |
Renewable Energy Group, Inc.
5.875%, due 06/01/285 | | | 32,000 | | | | 33,136 | | |
TerraForm Power Operating LLC
4.750%, due 01/15/305 | | | 35,000 | | | | 36,835 | | |
| | | | | | 69,971 | | |
Engineering & construction—0.1% | |
AECOM
5.125%, due 03/15/27 | | | 30,000 | | | | 33,509 | | |
Arcosa, Inc.
4.375%, due 04/15/295 | | | 30,000 | | | | 30,888 | | |
Dycom Industries, Inc.
4.500%, due 04/15/295 | | | 40,000 | | | | 41,100 | | |
Great Lakes Dredge & Dock Corp.
5.250%, due 06/01/295 | | | 40,000 | | | | 41,300 | | |
MasTec, Inc.
4.500%, due 08/15/285 | | | 10,000 | | | | 10,525 | | |
New Enterprise Stone & Lime Co., Inc.
6.250%, due 03/15/265 | | | 35,000 | | | | 35,962 | | |
9.750%, due 07/15/285 | | | 47,000 | | | | 52,052 | | |
Weekley Homes LLC/Weekley Finance Corp.
4.875%, due 09/15/285 | | | 30,000 | | | | 31,088 | | |
| | | | | | 276,424 | | |
Entertainment—0.2% | |
Affinity Gaming
6.875%, due 12/15/275 | | | 58,000 | | | | 61,613 | | |
Caesars Entertainment, Inc.
6.250%, due 07/01/255 | | | 65,000 | | | | 68,702 | | |
8.125%, due 07/01/275 | | | 118,000 | | | | 130,425 | | |
CCM Merger, Inc.
6.375%, due 05/01/265 | | | 29,000 | | | | 30,595 | | |
Cinemark USA, Inc.
5.250%, due 07/15/285 | | | 25,000 | | | | 23,750 | | |
5.875%, due 03/15/265 | | | 30,000 | | | | 29,850 | | |
Jacobs Entertainment, Inc.
7.875%, due 02/01/245 | | | 50,000 | | | | 52,250 | | |
Scientific Games International, Inc.
8.250%, due 03/15/265 | | | 25,000 | | | | 26,591 | | |
8.625%, due 07/01/255 | | | 30,000 | | | | 32,388 | | |
Speedway Motorsports LLC/Speedway
Funding II, Inc.
4.875%, due 11/01/275 | | | 35,000 | | | | 35,874 | | |
WMG Acquisition Corp.
3.000%, due 02/15/315 | | | 35,000 | | | | 34,475 | | |
| | | | | | 526,513 | | |
Environmental control—0.1% | |
Clean Harbors, Inc.
4.875%, due 07/15/275 | | | 15,000 | | | | 15,705 | | |
5.125%, due 07/15/295 | | | 25,000 | | | | 27,437 | | |
Covanta Holding Corp.
5.000%, due 09/01/30 | | | 20,000 | | | | 20,500 | | |
16
UBS U.S. Allocation Fund
Portfolio of investments—August 31, 2021
| | | Face
amount | | Value | |
Corporate bonds—(continued) | |
Environmental control—(concluded) | |
GFL Environmental, Inc.
4.000%, due 08/01/285 | | $ | 10,000 | | | $ | 9,925 | | |
4.375%, due 08/15/295 | | | 35,000 | | | | 35,175 | | |
4.750%, due 06/15/295 | | | 20,000 | | | | 20,550 | | |
Harsco Corp.
5.750%, due 07/31/275 | | | 15,000 | | | | 15,562 | | |
Madison IAQ LLC
5.875%, due 06/30/295 | | | 20,000 | | | | 20,475 | | |
Stericycle, Inc.
3.875%, due 01/15/295 | | | 15,000 | | | | 15,266 | | |
| | | | | | 180,595 | | |
Food—0.3% | |
Albertsons Cos., Inc./Safeway, Inc./New
Albertsons LP/Albertsons LLC
3.500%, due 03/15/295 | | | 5,000 | | | | 5,050 | | |
4.875%, due 02/15/305 | | | 30,000 | | | | 32,737 | | |
5.875%, due 02/15/285 | | | 15,000 | | | | 16,088 | | |
Chobani LLC/Chobani Finance Corp., Inc.
4.625%, due 11/15/285 | | | 10,000 | | | | 10,390 | | |
7.500%, due 04/15/255 | | | 55,000 | | | | 57,464 | | |
JBS USA LUX SA/JBS USA Food Co./JBS
USA Finance, Inc.
5.500%, due 01/15/305 | | | 25,000 | | | | 28,214 | | |
Kraft Heinz Foods Co.
4.250%, due 03/01/31 | | | 25,000 | | | | 28,858 | | |
5.000%, due 07/15/35 | | | 35,000 | | | | 43,398 | | |
5.200%, due 07/15/45 | | | 35,000 | | | | 44,913 | | |
6.875%, due 01/26/39 | | | 25,000 | | | | 37,353 | | |
Kroger Co.
2.800%, due 08/01/22 | | | 100,000 | | | | 102,084 | | |
3.850%, due 08/01/23 | | | 160,000 | | | | 169,145 | | |
3.875%, due 10/15/46 | | | 100,000 | | | | 112,236 | | |
Performance Food Group, Inc.
4.250%, due 08/01/295 | | | 30,000 | | | | 30,102 | | |
5.500%, due 10/15/275 | | | 10,000 | | | | 10,413 | | |
Post Holdings, Inc.
4.625%, due 04/15/305 | | | 50,000 | | | | 51,053 | | |
5.500%, due 12/15/295 | | | 5,000 | | | | 5,356 | | |
Simmons Foods, Inc./Simmons Prepared Foods,
Inc./Simmons Pet Food, Inc./Simmons Feed
4.625%, due 03/01/295 | | | 30,000 | | | | 30,529 | | |
United Natural Foods, Inc.
6.750%, due 10/15/285 | | | 30,000 | | | | 32,400 | | |
| | | | | | 847,783 | | |
Forest Products & Paper—0.0%† | |
Clearwater Paper Corp.
4.750%, due 08/15/285 | | | 30,000 | | | | 30,801 | | |
Healthcare-products—0.1% | |
Abbott Laboratories
3.750%, due 11/30/26 | | | 62,000 | | | | 70,126 | | |
4.900%, due 11/30/46 | | | 50,000 | | | | 69,491 | | |
Avantor Funding, Inc.
4.625%, due 07/15/285 | | | 60,000 | | | | 63,444 | | |
| | | Face
amount | | Value | |
Corporate bonds—(continued) | |
Healthcare-products—(concluded) | |
Medtronic, Inc.
4.375%, due 03/15/35 | | $ | 97,000 | | | $ | 121,766 | | |
Zimmer Biomet Holdings, Inc.
4.250%, due 08/15/35 | | | 50,000 | | | | 55,613 | | |
| | | | | | 380,440 | | |
Healthcare-services—0.4% | |
Acadia Healthcare Co., Inc.
5.000%, due 04/15/295 | | | 30,000 | | | | 31,350 | | |
Centene Corp.
2.500%, due 03/01/31 | | | 35,000 | | | | 34,910 | | |
3.000%, due 10/15/30 | | | 60,000 | | | | 62,188 | | |
4.625%, due 12/15/29 | | | 95,000 | | | | 104,205 | | |
Charles River Laboratories International, Inc.
4.250%, due 05/01/285 | | | 10,000 | | | | 10,474 | | |
CHS/Community Health Systems, Inc.
5.625%, due 03/15/275 | | | 45,000 | | | | 47,475 | | |
6.875%, due 04/15/295 | | | 60,000 | | | | 62,325 | | |
8.000%, due 03/15/265 | | | 40,000 | | | | 42,818 | | |
DaVita, Inc.
4.625%, due 06/01/305 | | | 25,000 | | | | 26,129 | | |
Encompass Health Corp.
4.500%, due 02/01/28 | | | 60,000 | | | | 62,850 | | |
HCA, Inc.
5.375%, due 02/01/25 | | | 120,000 | | | | 135,150 | | |
Legacy LifePoint Health LLC
4.375%, due 02/15/275 | | | 60,000 | | | | 59,850 | | |
MEDNAX, Inc.
6.250%, due 01/15/275 | | | 20,000 | | | | 21,075 | | |
Select Medical Corp.
6.250%, due 08/15/265 | | | 25,000 | | | | 26,438 | | |
Syneos Health, Inc.
3.625%, due 01/15/295 | | | 10,000 | | | | 9,947 | | |
Tenet Healthcare Corp.
4.625%, due 07/15/24 | | | 35,000 | | | | 35,481 | | |
4.625%, due 06/15/285 | | | 10,000 | | | | 10,350 | | |
4.875%, due 01/01/265 | | | 35,000 | | | | 36,306 | | |
5.125%, due 11/01/275 | | | 35,000 | | | | 36,837 | | |
6.125%, due 10/01/285 | | | 60,000 | | | | 63,339 | | |
UnitedHealth Group, Inc.
4.625%, due 07/15/35 | | | 40,000 | | | | 50,865 | | |
| | | | | | 970,362 | | |
Home builders—0.1% | |
Forestar Group, Inc.
3.850%, due 05/15/265 | | | 30,000 | | | | 30,263 | | |
Installed Building Products, Inc.
5.750%, due 02/01/285 | | | 10,000 | | | | 10,525 | | |
KB Home
6.875%, due 06/15/27 | | | 35,000 | | | | 41,825 | | |
Mattamy Group Corp.
5.250%, due 12/15/275 | | | 19,000 | | | | 19,808 | | |
Picasso Finance Sub, Inc.
6.125%, due 06/15/255 | | | 22,000 | | | | 23,265 | | |
Shea Homes LP/Shea Homes Funding Corp.
4.750%, due 02/15/285 | | | 13,000 | | | | 13,588 | | |
17
UBS U.S. Allocation Fund
Portfolio of investments—August 31, 2021
| | | Face
amount | | Value | |
Corporate bonds—(continued) | |
Home builders—(concluded) | |
Tri Pointe Homes, Inc.
5.700%, due 06/15/28 | | $ | 27,000 | | | $ | 30,079 | | |
Williams Scotsman International, Inc.
4.625%, due 08/15/285 | | | 50,000 | | | | 51,875 | | |
| | | | | | 221,228 | | |
Housewares—0.0%† | |
Newell Brands, Inc.
6.000%, due 04/01/468 | | | 25,000 | | | | 32,500 | | |
Insurance—0.5% | |
Allstate Corp.
3.280%, due 12/15/26 | | | 200,000 | | | | 221,112 | | |
3.850%, due 08/10/49 | | | 50,000 | | | | 60,501 | | |
American International Group, Inc.
2.500%, due 06/30/25 | | | 75,000 | | | | 78,865 | | |
Aon PLC
4.750%, due 05/15/45 | | | 50,000 | | | | 64,294 | | |
Berkshire Hathaway Finance Corp.
3.000%, due 05/15/22 | | | 150,000 | | | | 152,987 | | |
4.250%, due 01/15/49 | | | 100,000 | | | | 125,645 | | |
HUB International Ltd.
7.000%, due 05/01/265 | | | 50,000 | | | | 51,730 | | |
Lincoln National Corp.
4.000%, due 09/01/23 | | | 150,000 | | | | 160,402 | | |
MetLife, Inc.
4.125%, due 08/13/42 | | | 130,000 | | | | 157,345 | | |
Prudential Financial, Inc.
6.625%, due 06/21/40 | | | 110,000 | | | | 167,564 | | |
Teachers Insurance & Annuity
Association of America
4.270%, due 05/15/475 | | | 50,000 | | | | 61,621 | | |
| | | | | | 1,302,066 | | |
Internet—0.2% | |
Alibaba Group Holding Ltd.
2.125%, due 02/09/31 | | | 200,000 | | | | 196,768 | | |
Amazon.com, Inc.
2.500%, due 06/03/50 | | | 150,000 | | | | 143,998 | | |
Arches Buyer, Inc.
4.250%, due 06/01/285 | | | 20,000 | | | | 20,325 | | |
6.125%, due 12/01/285 | | | 25,000 | | | | 25,803 | | |
Netflix, Inc.
5.375%, due 11/15/295 | | | 50,000 | | | | 61,491 | | |
5.875%, due 02/15/25 | | | 15,000 | | | | 17,213 | | |
Northwest Fiber LLC/Northwest Fiber
Finance Sub, Inc.
6.000%, due 02/15/285 | | | 30,000 | | | | 29,850 | | |
Uber Technologies, Inc.
4.500%, due 08/15/295 | | | 20,000 | | | | 19,682 | | |
7.500%, due 09/15/275 | | | 20,000 | | | | 21,800 | | |
| | | | | | 536,930 | | |
Investment companies—0.0%† | |
Compass Group Diversified Holdings LLC
5.250%, due 04/15/295 | | | 25,000 | | | | 26,170 | | |
| | | Face
amount | | Value | |
Corporate bonds—(continued) | |
Iron & steel—0.0%† | |
Big River Steel LLC/BRS Finance Corp.
6.625%, due 01/31/295 | | $ | 4,000 | | | $ | 4,350 | | |
Cleveland-Cliffs, Inc.
4.625%, due 03/01/295 | | | 10,000 | | | | 10,525 | | |
4.875%, due 03/01/315 | | | 10,000 | | | | 10,750 | | |
Commercial Metals Co.
3.875%, due 02/15/31 | | | 20,000 | | | | 20,469 | | |
TMS International Corp.
6.250%, due 04/15/295 | | | 30,000 | | | | 31,446 | | |
| | | | | | 77,540 | | |
Leisure Time—0.1% | |
Carnival Corp.
4.000%, due 08/01/285 | | | 20,000 | | | | 20,104 | | |
5.750%, due 03/01/275 | | | 40,000 | | | | 40,893 | | |
7.625%, due 03/01/265 | | | 50,000 | | | | 53,130 | | |
11.500%, due 04/01/235 | | | 9,000 | | | | 10,105 | | |
NCL Corp. Ltd.
5.875%, due 03/15/265 | | | 25,000 | | | | 25,063 | | |
Pinnacle Bidco PLC
6.375%, due 02/15/259 | | GBP | 100,000 | | | | 140,413 | | |
Royal Caribbean Cruises Ltd.
5.500%, due 08/31/265 | | | 20,000 | | | | 20,275 | | |
7.500%, due 10/15/27 | | | 25,000 | | | | 29,026 | | |
9.125%, due 06/15/235 | | | 25,000 | | | | 27,250 | | |
VOC Escrow Ltd.
5.000%, due 02/15/285 | | | 20,000 | | | | 19,700 | | |
| | | | | | 385,959 | | |
Lodging—0.0%† | |
Boyd Gaming Corp.
4.750%, due 12/01/27 | | | 35,000 | | | | 36,094 | | |
Hilton Grand Vacations Borrower Escrow
LLC/Hilton Grand Vacations Borrower ESC
4.875%, due 07/01/315 | | | 10,000 | | | | 9,912 | | |
5.000%, due 06/01/295 | | | 20,000 | | | | 20,250 | | |
| | | | | | 66,256 | | |
Machinery-construction & mining—0.0%† | |
BWX Technologies, Inc.
4.125%, due 06/30/285 | | | 10,000 | | | | 10,275 | | |
Terex Corp.
5.000%, due 05/15/295 | | | 20,000 | | | | 21,025 | | |
| | | | | | 31,300 | | |
Machinery-diversified—0.0%† | |
GrafTech Finance, Inc.
4.625%, due 12/15/285 | | | 25,000 | | | | 25,500 | | |
Mueller Water Products, Inc.
4.000%, due 06/15/295 | | | 20,000 | | | | 20,811 | | |
| | | | | | 46,311 | | |
Media—0.7% | |
Audacy Capital Corp.
6.750%, due 03/31/295 | | | 35,000 | | | | 35,325 | | |
Cable One, Inc.
4.000%, due 11/15/305 | | | 30,000 | | | | 30,351 | | |
18
UBS U.S. Allocation Fund
Portfolio of investments—August 31, 2021
| | | Face
amount | | Value | |
Corporate bonds—(continued) | |
Media—(concluded) | |
CCO Holdings LLC/CCO Holdings Capital Corp.
4.250%, due 02/01/315 | | $ | 20,000 | | | $ | 20,525 | | |
4.250%, due 01/15/345 | | | 35,000 | | | | 35,315 | | |
4.500%, due 08/15/305 | | | 5,000 | | | | 5,224 | | |
4.750%, due 03/01/305 | | | 147,000 | | | | 155,538 | | |
5.375%, due 06/01/295 | | | 50,000 | | | | 54,625 | | |
Charter Communications Operating LLC/Charter
Communications Operating Capital
4.200%, due 03/15/28 | | | 150,000 | | | | 169,772 | | |
Comcast Corp.
2.887%, due 11/01/515 | | | 289,000 | | | | 287,632 | | |
3.969%, due 11/01/47 | | | 185,000 | | | | 217,466 | | |
CSC Holdings LLC
5.750%, due 01/15/305 | | | 50,000 | | | | 52,835 | | |
7.500%, due 04/01/285 | | | 25,000 | | | | 27,375 | | |
DIRECTV Holdings LLC/DIRECTV
Financing Co., Inc.
5.875%, due 08/15/275 | | | 2,000 | | | | 2,090 | | |
Fox Corp.
3.050%, due 04/07/25 | | | 25,000 | | | | 26,728 | | |
5.576%, due 01/25/49 | | | 50,000 | | | | 68,779 | | |
Liberty Interactive LLC
8.250%, due 02/01/30 | | | 30,000 | | | | 33,750 | | |
News Corp.
3.875%, due 05/15/295 | | | 30,000 | | | | 30,848 | | |
Nexstar Media, Inc.
4.750%, due 11/01/285 | | | 10,000 | | | | 10,398 | | |
5.625%, due 07/15/275 | | | 35,000 | | | | 37,160 | | |
Radiate Holdco LLC/Radiate Finance, Inc.
4.500%, due 09/15/265 | | | 10,000 | | | | 10,412 | | |
6.500%, due 09/15/285 | | | 50,000 | | | | 51,000 | | |
Scripps Escrow, Inc.
5.875%, due 07/15/275 | | | 30,000 | | | | 30,796 | | |
Sirius XM Radio, Inc.
3.875%, due 09/01/315 | | | 20,000 | | | | 19,914 | | |
4.000%, due 07/15/285 | | | 45,000 | | | | 45,951 | | |
4.125%, due 07/01/305 | | | 20,000 | | | | 20,474 | | |
5.375%, due 07/15/265 | | | 75,000 | | | | 77,016 | | |
5.500%, due 07/01/295 | | | 30,000 | | | | 32,850 | | |
TEGNA, Inc.
4.750%, due 03/15/265 | | | 5,000 | | | | 5,306 | | |
Time Warner Cable LLC
6.550%, due 05/01/37 | | | 25,000 | | | | 34,115 | | |
Time Warner Entertainment Co. LP
8.375%, due 03/15/23 | | | 35,000 | | | | 39,134 | | |
Univision Communications, Inc.
4.500%, due 05/01/295 | | | 35,000 | | | | 35,504 | | |
6.625%, due 06/01/275 | | | 20,000 | | | | 21,656 | | |
Videotron Ltd.
3.625%, due 06/15/295 | | | 20,000 | | | | 20,600 | | |
Walt Disney Co.
2.000%, due 09/01/29 | | | 100,000 | | | | 101,947 | | |
4.950%, due 10/15/45 | | | 70,000 | | | | 94,818 | | |
| | | | | | 1,943,229 | | |
| | | Face
amount | | Value | |
Corporate bonds—(continued) | |
Mining—0.1% | |
Arconic Corp.
6.125%, due 02/15/285 | | $ | 10,000 | | | $ | 10,689 | | |
Freeport-McMoRan, Inc.
4.250%, due 03/01/30 | | | 35,000 | | | | 37,800 | | |
5.400%, due 11/14/34 | | | 25,000 | | | | 31,349 | | |
Hudbay Minerals, Inc.
6.125%, due 04/01/295 | | | 20,000 | | | | 21,500 | | |
Kaiser Aluminum Corp.
4.625%, due 03/01/285 | | | 60,000 | | | | 62,250 | | |
Novelis Corp.
3.250%, due 11/15/265 | | | 10,000 | | | | 10,252 | | |
3.875%, due 08/15/315 | | | 10,000 | | | | 10,091 | | |
Southern Copper Corp.
6.750%, due 04/16/40 | | | 90,000 | | | | 127,800 | | |
| | | | | | 311,731 | | |
Miscellaneous manufacturers—0.1% | |
Amsted Industries, Inc.
4.625%, due 05/15/305 | | | 10,000 | | | | 10,400 | | |
5.625%, due 07/01/275 | | | 15,000 | | | | 15,713 | | |
Eaton Corp.
2.750%, due 11/02/22 | | | 70,000 | | | | 71,977 | | |
Illinois Tool Works, Inc.
2.650%, due 11/15/26 | | | 110,000 | | | | 118,233 | | |
| | | | | | 216,323 | | |
Oil & gas—0.8% | |
Aker BP ASA
3.750%, due 01/15/305 | | | 150,000 | | | | 162,183 | | |
Antero Resources Corp.
5.375%, due 03/01/305 | | | 10,000 | | | | 10,174 | | |
7.625%, due 02/01/295 | | | 50,000 | | | | 55,000 | | |
Apache Corp.
4.875%, due 11/15/27 | | | 25,000 | | | | 27,321 | | |
5.100%, due 09/01/40 | | | 30,000 | | | | 33,375 | | |
Ascent Resources Utica Holdings LLC/ARU
Finance Corp.
5.875%, due 06/30/295 | | | 30,000 | | | | 28,759 | | |
7.000%, due 11/01/265 | | | 30,000 | | | | 30,563 | | |
8.250%, due 12/31/285 | | | 10,000 | | | | 10,574 | | |
BP Capital Markets America, Inc.
3.017%, due 01/16/27 | | | 75,000 | | | | 81,152 | | |
Burlington Resources LLC
7.200%, due 08/15/31 | | | 150,000 | | | | 216,436 | | |
California Resources Corp.
7.125%, due 02/01/265 | | | 59,000 | | | | 61,893 | | |
Comstock Resources, Inc.
5.875%, due 01/15/305 | | | 20,000 | | | | 20,054 | | |
6.750%, due 03/01/295 | | | 30,000 | | | | 31,485 | | |
Ecopetrol SA
5.375%, due 06/26/26 | | | 325,000 | | | | 357,256 | | |
Endeavor Energy Resources LP/EER Finance, Inc.
6.625%, due 07/15/255 | | | 30,000 | | | | 31,814 | | |
EOG Resources, Inc.
3.900%, due 04/01/35 | | | 50,000 | | | | 57,575 | | |
19
UBS U.S. Allocation Fund
Portfolio of investments—August 31, 2021
| | | Face
amount | | Value | |
Corporate bonds—(continued) | |
Oil & gas—(concluded) | |
EQT Corp.
3.625%, due 05/15/315 | | $ | 60,000 | | | $ | 63,432 | | |
7.500%, due 02/01/308 | | | 35,000 | | | | 45,474 | | |
Equinor ASA
4.800%, due 11/08/43 | | | 50,000 | | | | 65,503 | | |
Exxon Mobil Corp.
4.114%, due 03/01/46 | | | 50,000 | | | | 59,802 | | |
Hilcorp Energy I LP/Hilcorp Finance Co.
5.750%, due 02/01/295 | | | 75,000 | | | | 76,125 | | |
Laredo Petroleum, Inc.
7.750%, due 07/31/295 | | | 30,000 | | | | 29,040 | | |
Marathon Petroleum Corp.
4.750%, due 09/15/44 | | | 110,000 | | | | 129,738 | | |
MEG Energy Corp.
5.875%, due 02/01/295 | | | 30,000 | | | | 30,897 | | |
7.125%, due 02/01/275 | | | 55,000 | | | | 57,874 | | |
Murphy Oil Corp.
6.375%, due 07/15/28 | | | 35,000 | | | | 36,838 | | |
6.875%, due 08/15/24 | | | 15,000 | | | | 15,300 | | |
Nabors Industries, Inc.
9.000%, due 02/01/255 | | | 14,000 | | | | 14,000 | | |
Occidental Petroleum Corp.
3.400%, due 04/15/26 | | | 20,000 | | | | 20,550 | | |
5.500%, due 12/01/25 | | | 3,000 | | | | 3,345 | | |
5.550%, due 03/15/26 | | | 37,000 | | | | 41,255 | | |
6.375%, due 09/01/28 | | | 50,000 | | | | 59,313 | | |
6.450%, due 09/15/36 | | | 60,000 | | | | 75,000 | | |
6.625%, due 09/01/30 | | | 15,000 | | | | 18,713 | | |
6.950%, due 07/01/24 | | | 30,000 | | | | 33,793 | | |
8.500%, due 07/15/27 | | | 50,000 | | | | 63,074 | | |
Shell International Finance BV
4.375%, due 05/11/45 | | | 100,000 | | | | 124,526 | | |
Southwestern Energy Co.
5.375%, due 03/15/30 | | | 30,000 | | | | 31,207 | | |
8.375%, due 09/15/28 | | | 10,000 | | | | 11,200 | | |
Sunoco LP/Sunoco Finance Corp.
5.875%, due 03/15/28 | | | 15,000 | | | | 15,844 | | |
| | | | | | 2,337,457 | | |
Oil & gas services—0.0%† | |
Archrock Partners LP/Archrock Partners
Finance Corp.
6.250%, due 04/01/285 | | | 10,000 | | | | 10,188 | | |
6.875%, due 04/01/275 | | | 30,000 | | | | 31,162 | | |
USA Compression Partners LP/USA
Compression Finance Corp.
6.875%, due 04/01/26 | | | 39,000 | | | | 40,523 | | |
6.875%, due 09/01/27 | | | 35,000 | | | | 36,658 | | |
| | | | | | 118,531 | | |
Packaging & containers—0.1% | |
Cascades, Inc./Cascades USA, Inc.
5.375%, due 01/15/285 | | | 10,000 | | | | 10,538 | | |
Graphic Packaging International LLC
3.500%, due 03/15/285 | | | 35,000 | | | | 35,730 | | |
4.750%, due 07/15/275 | | | 15,000 | | | | 16,226 | | |
| | | Face
amount | | Value | |
Corporate bonds—(continued) | |
Packaging & containers—(concluded) | |
OI European Group BV
4.000%, due 03/15/235 | | $ | 50,000 | | | $ | 51,740 | | |
Owens-Brockway Glass Container, Inc.
5.875%, due 08/15/235 | | | 30,000 | | | | 31,875 | | |
Silgan Holdings, Inc.
4.125%, due 02/01/28 | | | 10,000 | | | | 10,349 | | |
Trident TPI Holdings, Inc.
6.625%, due 11/01/255 | | | 25,000 | | | | 25,375 | | |
| | | | | | 181,833 | | |
Pharmaceuticals—0.5% | |
AbbVie, Inc.
3.200%, due 05/14/26 | | | 30,000 | | | | 32,571 | | |
3.800%, due 03/15/25 | | | 90,000 | | | | 98,142 | | |
4.450%, due 05/14/46 | | | 200,000 | | | | 244,900 | | |
Bausch Health Americas, Inc.
8.500%, due 01/31/275 | | | 65,000 | | | | 69,904 | | |
9.250%, due 04/01/265 | | | 20,000 | | | | 21,550 | | |
Bausch Health Cos., Inc.
5.000%, due 01/30/285 | | | 25,000 | | | | 23,844 | | |
Bristol-Myers Squibb Co.
4.125%, due 06/15/39 | | | 250,000 | | | | 304,259 | | |
CVS Health Corp.
3.500%, due 07/20/22 | | | 60,000 | | | | 61,363 | | |
Herbalife Nutrition Ltd./HLF Financing, Inc.
7.875%, due 09/01/255 | | | 30,000 | | | | 32,556 | | |
Pfizer, Inc.
7.200%, due 03/15/39 | | | 270,000 | | | | 442,360 | | |
| | | | | | 1,331,449 | | |
Pipelines—0.7% | |
Blue Racer Midstream LLC/Blue Racer
Finance Corp.
7.625%, due 12/15/255 | | | 60,000 | | | | 64,875 | | |
Buckeye Partners LP
5.600%, due 10/15/44 | | | 10,000 | | | | 9,850 | | |
5.850%, due 11/15/43 | | | 25,000 | | | | 25,053 | | |
Cheniere Energy Partners LP
4.000%, due 03/01/315 | | | 30,000 | | | | 31,575 | | |
Cheniere Energy, Inc.
4.625%, due 10/15/28 | | | 30,000 | | | | 31,650 | | |
Crestwood Midstream Partners LP/Crestwood
Midstream Finance Corp.
5.750%, due 04/01/25 | | | 35,000 | | | | 35,744 | | |
6.000%, due 02/01/295 | | | 5,000 | | | | 5,100 | | |
DCP Midstream Operating LP
5.375%, due 07/15/25 | | | 25,000 | | | | 27,531 | | |
5.625%, due 07/15/27 | | | 52,000 | | | | 59,089 | | |
Delek Logistics Partners LP/Delek Logistics
Finance Corp.
6.750%, due 05/15/25 | | | 50,000 | | | | 51,250 | | |
Energy Transfer LP
5.400%, due 10/01/47 | | | 100,000 | | | | 121,386 | | |
EnLink Midstream LLC
5.625%, due 01/15/285 | | | 30,000 | | | | 31,350 | | |
20
UBS U.S. Allocation Fund
Portfolio of investments—August 31, 2021
| | | Face
amount | | Value | |
Corporate bonds—(continued) | |
Pipelines—(concluded) | |
EQM Midstream Partners LP
4.500%, due 01/15/295 | | $ | 10,000 | | | $ | 10,150 | | |
4.750%, due 01/15/315 | | | 10,000 | | | | 10,175 | | |
5.500%, due 07/15/28 | | | 10,000 | | | | 10,912 | | |
6.500%, due 07/01/275 | | | 20,000 | | | | 22,300 | | |
Genesis Energy LP/Genesis Energy Finance Corp.
8.000%, due 01/15/27 | | | 63,000 | | | | 62,561 | | |
Hess Midstream Operations LP
4.250%, due 02/15/305 | | | 10,000 | | | | 10,125 | | |
5.125%, due 06/15/285 | | | 35,000 | | | | 36,662 | | |
5.625%, due 02/15/265 | | | 60,000 | | | | 62,302 | | |
Holly Energy Partners LP/Holly Energy Finance Corp.
5.000%, due 02/01/285 | | | 30,000 | | | | 30,609 | | |
Kinder Morgan, Inc.
4.300%, due 03/01/28 | | | 150,000 | | | | 171,320 | | |
5.550%, due 06/01/45 | | | 120,000 | | | | 155,711 | | |
MPLX LP
4.875%, due 06/01/25 | | | 120,000 | | | | 134,984 | | |
NuStar Logistics LP
5.625%, due 04/28/27 | | | 25,000 | | | | 26,588 | | |
Plains All American Pipeline LP/PAA Finance Corp.
3.800%, due 09/15/30 | | | 150,000 | | | | 161,561 | | |
Sabine Pass Liquefaction LLC
5.000%, due 03/15/27 | | | 80,000 | | | | 92,546 | | |
Tallgrass Energy Partners LP/
Tallgrass Energy Finance Corp.
6.000%, due 12/31/305 | | | 25,000 | | | | 25,428 | | |
Targa Resources Partners LP/
Targa Resources Partners Finance Corp.
5.000%, due 01/15/28 | | | 75,000 | | | | 78,750 | | |
5.500%, due 03/01/30 | | | 25,000 | | | | 27,563 | | |
Venture Global Calcasieu Pass LLC
3.875%, due 08/15/295 | | | 35,000 | | | | 36,071 | | |
Western Midstream Operating LP
4.350%, due 02/01/258 | | | 40,000 | | | | 42,033 | | |
4.650%, due 07/01/26 | | | 25,000 | | | | 26,950 | | |
5.450%, due 04/01/44 | | | 10,000 | | | | 11,373 | | |
Williams Cos., Inc.
4.300%, due 03/04/24 | | | 80,000 | | | | 86,287 | | |
| | | | | | 1,827,414 | | |
Real estate—0.0%† | |
Howard Hughes Corp.
5.375%, due 08/01/285 | | | 29,000 | | | | 30,740 | | |
Real estate investment trusts—0.2% | |
AvalonBay Communities, Inc.
3.450%, due 06/01/25 | | | 70,000 | | | | 76,265 | | |
Boston Properties LP, REIT
2.750%, due 10/01/26 | | | 40,000 | | | | 42,661 | | |
EPR Properties
4.500%, due 04/01/25 | | | 30,000 | | | | 31,919 | | |
4.500%, due 06/01/27 | | | 30,000 | | | | 31,770 | | |
Iron Mountain, Inc.
4.875%, due 09/15/275 | | | 40,000 | | | | 41,650 | | |
| | | Face
amount | | Value | |
Corporate bonds—(continued) | |
Real estate investment trusts—(concluded) | |
iStar, Inc.
4.750%, due 10/01/24 | | $ | 25,000 | | | $ | 26,533 | | |
5.500%, due 02/15/26 | | | 35,000 | | | | 36,662 | | |
Ladder Capital Finance Holdings LLLP/
Ladder Capital Finance Corp.
4.750%, due 06/15/295 | | | 25,000 | | | | 25,563 | | |
5.250%, due 03/15/225 | | | 15,000 | | | | 15,053 | | |
5.250%, due 10/01/255 | | | 15,000 | | | | 15,188 | | |
MGM Growth Properties Operating Partnership LP/
MGP Finance Co-Issuer, Inc.
4.500%, due 09/01/26 | | | 57,000 | | | | 62,090 | | |
5.750%, due 02/01/27 | | | 25,000 | | | | 28,778 | | |
Park Intermediate Holdings LLC/PK Domestic
Property LLC/PK Finance Co-Issuer
4.875%, due 05/15/295 | | | 27,000 | | | | 27,810 | | |
5.875%, due 10/01/285 | | | 10,000 | | | | 10,650 | | |
Service Properties Trust
7.500%, due 09/15/25 | | | 25,000 | | | | 28,233 | | |
Ventas Realty LP
3.500%, due 02/01/25 | | | 35,000 | | | | 37,680 | | |
VEREIT Operating Partnership LP
4.875%, due 06/01/26 | | | 15,000 | | | | 17,325 | | |
VICI Properties LP/VICI Note Co., Inc.
4.625%, due 12/01/295 | | | 45,000 | | | | 48,937 | | |
| | | | | | 604,767 | | |
Retail—0.3% | |
1011778 BC ULC/New Red Finance, Inc.
3.875%, due 01/15/285 | | | 5,000 | | | | 5,063 | | |
Academy Ltd.
6.000%, due 11/15/275 | | | 30,000 | | | | 32,138 | | |
Bath & Body Works, Inc.
6.625%, due 10/01/305 | | | 20,000 | | | | 23,050 | | |
6.875%, due 11/01/35 | | | 25,000 | | | | 32,093 | | |
Beacon Roofing Supply, Inc.
4.125%, due 05/15/295 | | | 25,000 | | | | 25,031 | | |
4.500%, due 11/15/265 | | | 5,000 | | | | 5,213 | | |
FirstCash, Inc.
4.625%, due 09/01/285 | | | 25,000 | | | | 25,998 | | |
Foundation Building Materials, Inc.
6.000%, due 03/01/295 | | | 50,000 | | | | 49,290 | | |
Group 1 Automotive, Inc.
4.000%, due 08/15/285 | | | 30,000 | | | | 30,525 | | |
GYP Holdings III Corp.
4.625%, due 05/01/295 | | | 35,000 | | | | 35,262 | | |
Home Depot, Inc.
2.125%, due 09/15/26 | | | 50,000 | | | | 52,644 | | |
3.350%, due 09/15/25 | | | 40,000 | | | | 43,818 | | |
LCM Investments Holdings II LLC
4.875%, due 05/01/295 | | | 25,000 | | | | 25,688 | | |
Lithia Motors, Inc.
3.875%, due 06/01/295 | | | 20,000 | | | | 20,971 | | |
4.625%, due 12/15/275 | | | 15,000 | | | | 15,900 | | |
McDonald's Corp.
3.800%, due 04/01/28 | | | 225,000 | | | | 254,534 | | |
21
UBS U.S. Allocation Fund
Portfolio of investments—August 31, 2021
| | | Face
amount | | Value | |
Corporate bonds—(continued) | |
Retail—(concluded) | |
4.875%, due 12/09/45 | | $ | 20,000 | | | $ | 26,312 | | |
QVC, Inc.
4.750%, due 02/15/27 | | | 10,000 | | | | 10,713 | | |
4.850%, due 04/01/24 | | | 25,000 | | | | 27,181 | | |
Rite Aid Corp.
7.500%, due 07/01/255 | | | 30,000 | | | | 30,854 | | |
8.000%, due 11/15/265 | | | 20,000 | | | | 20,623 | | |
SRS Distribution, Inc.
4.625%, due 07/01/285 | | | 20,000 | | | | 20,610 | | |
6.125%, due 07/01/295 | | | 20,000 | | | | 20,750 | | |
White Cap Buyer LLC
6.875%, due 10/15/285 | | | 67,000 | | | | 71,271 | | |
| | | | | | 905,532 | | |
Semiconductors—0.3% | |
Broadcom Corp./Broadcom Cayman Finance Ltd.
3.125%, due 01/15/25 | | | 40,000 | | | | 42,466 | | |
3.875%, due 01/15/27 | | | 150,000 | | | | 165,527 | | |
NVIDIA Corp.
2.850%, due 04/01/30 | | | 100,000 | | | | 108,287 | | |
NXP BV/NXP Funding LLC
5.550%, due 12/01/285 | | | 100,000 | | | | 122,574 | | |
NXP BV/NXP Funding LLC/NXP USA, Inc.
3.875%, due 06/18/265 | | | 95,000 | | | | 105,257 | | |
QUALCOMM, Inc.
3.250%, due 05/20/27 | | | 80,000 | | | | 88,356 | | |
Texas Instruments, Inc.
1.850%, due 05/15/22 | | | 90,000 | | | | 90,928 | | |
| | | | | | 723,395 | | |
Software—0.5% | |
Boxer Parent Co., Inc.
7.125%, due 10/02/255 | | | 27,000 | | | | 28,902 | | |
Change Healthcare Holdings LLC/Change
Healthcare Finance, Inc.
5.750%, due 03/01/255 | | | 40,000 | | | | 40,400 | | |
Elastic N.V.
4.125%, due 07/15/295 | | | 15,000 | | | | 15,232 | | |
Fiserv, Inc.
3.200%, due 07/01/26 | | | 90,000 | | | | 97,822 | | |
3.500%, due 07/01/29 | | | 200,000 | | | | 219,697 | | |
Microsoft Corp.
2.375%, due 02/12/22 | | | 180,000 | | | | 181,484 | | |
2.525%, due 06/01/50 | | | 120,000 | | | | 119,711 | | |
3.500%, due 02/12/35 | | | 250,000 | | | | 294,255 | | |
MSCI, Inc.
3.625%, due 09/01/305 | | | 5,000 | | | | 5,267 | | |
5.375%, due 05/15/275 | | | 15,000 | | | | 16,010 | | |
Oracle Corp.
2.500%, due 05/15/22 | | | 130,000 | | | | 131,555 | | |
2.800%, due 04/01/27 | | | 50,000 | | | | 53,343 | | |
5.375%, due 07/15/40 | | | 216,000 | | | | 279,575 | | |
| | | | | | 1,483,253 | | |
Telecommunications—0.8% | |
Altice France Holding SA
10.500%, due 05/15/275 | | | 200,000 | | | | 219,750 | | |
America Movil SAB de CV
3.125%, due 07/16/22 | | | 40,000 | | | | 40,835 | | |
| | | Face
amount | | Value | |
Corporate bonds—(continued) | |
Telecommunications—(concluded) | |
AT&T, Inc.
3.800%, due 12/01/575 | | $ | 117,000 | | | $ | 124,440 | | |
6.000%, due 08/15/40 | | | 330,000 | | | | 455,704 | | |
CommScope, Inc.
7.125%, due 07/01/285 | | | 25,000 | | | | 26,219 | | |
8.250%, due 03/01/275 | | | 25,000 | | | | 26,355 | | |
Consolidated Communications, Inc.
6.500%, due 10/01/285 | | | 77,000 | | | | 84,219 | | |
Deutsche Telekom International Finance BV
8.750%, due 06/15/308 | | | 150,000 | | | | 225,574 | | |
Frontier Communications Holdings LLC
5.875%, due 10/15/275 | | | 50,000 | | | | 53,449 | | |
6.750%, due 05/01/295 | | | 30,000 | | | | 32,106 | | |
Level 3 Financing, Inc.
4.250%, due 07/01/285 | | | 30,000 | | | | 30,359 | | |
LogMeIn, Inc.
5.500%, due 09/01/275 | | | 40,000 | | | | 41,500 | | |
Lumen Technologies, Inc.
5.625%, due 04/01/25 | | | 10,000 | | | | 10,822 | | |
(Series Y),
7.500%, due 04/01/24 | | | 25,000 | | | | 27,812 | | |
Rogers Communications, Inc.
5.000%, due 03/15/44 | | | 40,000 | | | | 49,998 | | |
Sprint Capital Corp.
6.875%, due 11/15/28 | | | 45,000 | | | | 58,657 | | |
Sprint Corp.
7.625%, due 03/01/26 | | | 35,000 | | | | 43,153 | | |
7.875%, due 09/15/23 | | | 75,000 | | | | 84,971 | | |
Switch Ltd.
4.125%, due 06/15/295 | | | 20,000 | | | | 20,625 | | |
Telecom Italia Capital SA
6.375%, due 11/15/33 | | | 10,000 | | | | 11,750 | | |
Verizon Communications, Inc.
2.987%, due 10/30/56 | | | 50,000 | | | | 48,236 | | |
3.376%, due 02/15/25 | | | 193,000 | | | | 208,967 | | |
4.016%, due 12/03/29 | | | 182,000 | | | | 209,353 | | |
4.862%, due 08/21/46 | | | 50,000 | | | | 65,092 | | |
ViaSat, Inc.
5.625%, due 09/15/255 | | | 50,000 | | | | 50,849 | | |
5.625%, due 04/15/275 | | | 15,000 | | | | 15,562 | | |
| | | | | | 2,266,357 | | |
Toys/Games/Hobbies—0.0%† | |
Mattel, Inc.
3.750%, due 04/01/295 | | | 10,000 | | | | 10,498 | | |
Transportation—0.3% | |
Burlington Northern Santa Fe LLC
3.050%, due 03/15/22 | | | 150,000 | | | | 151,221 | | |
5.150%, due 09/01/43 | | | 210,000 | | | | 288,732 | | |
First Student Bidco, Inc./First Transit Parent, Inc.
4.000%, due 07/31/295 | | | 20,000 | | | | 19,847 | | |
Norfolk Southern Corp.
3.250%, due 12/01/21 | | | 70,000 | | | | 70,000 | | |
3.400%, due 11/01/49 | | | 100,000 | | | | 107,264 | | |
22
UBS U.S. Allocation Fund
Portfolio of investments—August 31, 2021
| | | Face
amount | | Value | |
Corporate bonds—(concluded) | |
Transportation—(concluded) | |
Seaspan Corp.
5.500%, due 08/01/295 | | $ | 42,000 | | | $ | 42,945 | | |
United Parcel Service, Inc.
3.750%, due 11/15/47 | | | 50,000 | | | | 60,022 | | |
| | | | | | 740,031 | | |
Trucking & leasing—0.0%† | |
Fortress Transportation and Infrastructure
Investors LLC
5.500%, due 05/01/285 | | | 30,000 | | | | 30,465 | | |
Total corporate bonds
(cost—$34,529,794) | | | 36,157,207 | | |
Mortgage-backed securities—4.9% | |
Angel Oak Mortgage Trust,
Series 2019-5, Class A1,
2.593%, due 10/25/495,10 | | | 145,400 | | | | 145,661 | | |
Series 2020-4, Class A1,
1.469%, due 06/25/655,10 | | | 162,888 | | | | 163,659 | | |
Series 2020-R1, Class A1,
0.990%, due 04/25/535,10 | | | 242,642 | | | | 242,528 | | |
Series 2021-4, Class A1,
1.035%, due 01/20/655,10 | | | 250,000 | | | | 250,293 | | |
Series 2021-5, Class A1,
0.951%, due 07/25/661,5,10,11 | | | 350,000 | | | | 349,995 | | |
Angel Oak Mortgage Trust I LLC,
Series 2018-3, Class A1,
3.649%, due 09/25/485,10 | | | 55,362 | | | | 55,669 | | |
Series 2019-4, Class A1,
2.993%, due 07/26/495,10 | | | 124,580 | | | | 125,432 | | |
Angel Oak Mortgage Trust LLC,
Series 2020-5, Class A1,
1.373%, due 05/25/655,10 | | | 113,935 | | | | 114,475 | | |
BANK,
Series 2020-BN30, Class A4,
1.925%, due 12/15/53 | | | 350,000 | | | | 350,926 | | |
Benchmark Mortgage Trust,
Series 2019-B10, Class C,
3.750%, due 03/15/62 | | | 250,000 | | | | 267,116 | | |
BX Trust,
Series 2021-MFM1, Class D,
1 mo. USD LIBOR + 1.500%,
1.596%, due 01/15/344,5 | | | 175,000 | | | | 175,109 | | |
BX Commercial Mortgage Trust,
Series 2021-SOAR, Class D,
1 mo. USD LIBOR + 1.400%,
1.496%, due 06/15/384,5 | | | 350,000 | | | | 350,561 | | |
CHT Mortgage Trust,
Series 2017-CSMO, Class D,
1 mo. USD LIBOR + 2.250%,
2.346%, due 11/15/364,5 | | | 375,000 | | | | 375,603 | | |
Citigroup Commercial Mortgage Trust,
Series 2018-C5, Class A4,
4.228%, due 06/10/5110 | | | 350,000 | | | | 404,996 | | |
| | | Face
amount | | Value | |
Mortgage-backed securities—(continued) | |
COLT Funding LLC,
Series 2021-3R, Class A1,
1.051%, due 12/25/645,10 | | $ | 620,298 | | | $ | 620,821 | | |
COLT Mortgage Loan Trust,
Series 2020-2, Class A1,
1.853%, due 03/25/655,10 | | | 38,981 | | | | 39,153 | | |
Series 2020-3, Class A1,
1.506%, due 04/27/655,10 | | | 53,474 | | | | 53,577 | | |
Series 2021-2, Class A1,
0.924%, due 08/25/665,10 | | | 172,579 | | | | 172,350 | | |
COLT Mortgage Pass-Through Certificates,
Series 2021-1R, Class A1,
0.857%, due 05/25/655,10 | | | 84,777 | | | | 84,780 | | |
COMM Mortgage Trust,
Series 2021-LBA, Class C,
1 mo. USD LIBOR + 1.200%,
1.296%, due 03/15/384,5 | | | 1,000,000 | | | | 1,000,624 | | |
CSMC Trust,
Series 2020-NQM1, Class A1,
1.208%, due 05/25/655,8 | | | 192,604 | | | | 193,095 | | |
Deephaven Residential Mortgage Trust,
Series 2021-1, Class A1,
0.715%, due 05/25/655,10 | | | 205,131 | | | | 204,806 | | |
Extended Stay America Trust,
Series 2021-ESH, Class D,
1 mo. USD LIBOR + 2.250%,
2.346%, due 07/15/384,5 | | | 275,000 | | | | 277,056 | | |
FREMF Mortgage Trust,
Series 2017-K64, Class B,
4.129%, due 05/25/505,10 | | | 50,000 | | | | 55,615 | | |
GCAT Trust,
Series 2021-NQM4, Class A1,
1.093%, due 08/25/661,5,10 | | | 300,000 | | | | 299,998 | | |
GS Mortgage Securities Trust,
Series 2017-GS5, Class B,
4.047%, due 03/10/5010 | | | 325,000 | | | | 357,138 | | |
GS Mortgage-Backed Securities Corp. Trust,
Series 2021-NQM1, Class A1,
1.017%, due 07/25/615,10 | | | 467,925 | | | | 468,796 | | |
GS Mortgage-Backed Securities Trust,
Series 2020-NQM1, Class A1,
1.382%, due 09/27/605,10 | | | 99,010 | | | | 99,383 | | |
Hilton USA Trust,
Series 2016-SFP, Class B,
3.323%, due 11/05/355 | | | 425,000 | | | | 427,252 | | |
JPMBB Commercial Mortgage Securities Trust,
Series 2014-C26, Class AS,
3.800%, due 01/15/48 | | | 250,000 | | | | 268,791 | | |
MFRA Trust,
Series 2021-NQM2, Class A1,
1.029%, due 11/25/645,10 | | | 171,358 | | | | 171,173 | | |
MHC Commercial Mortgage Trust,
Series 2021-MHC, Class D,
1 mo. USD LIBOR + 1.601%,
1.697%, due 04/15/384,5 | | | 700,000 | | | | 702,163 | | |
23
UBS U.S. Allocation Fund
Portfolio of investments—August 31, 2021
| | | Face
amount | | Value | |
Mortgage-backed securities—(concluded) | |
Morgan Stanley Bank of America Merrill Lynch Trust,
Series 2016-C32, Class AS,
3.994%, due 12/15/4910 | | $ | 260,000 | | | $ | 286,366 | | |
Series 2017-C34, Class C,
4.318%, due 11/15/5210 | | | 150,000 | | | | 161,925 | | |
New Residential Mortgage Loan Trust,
Series 2020-NQM2, Class A1,
1.650%, due 05/24/605,10 | | | 66,434 | | | | 66,891 | | |
ONE Mortgage Trust,
Series 2021-PARK, Class C,
1 mo. USD LIBOR + 1.100%,
1.196%, due 03/15/364,5 | | | 850,000 | | | | 850,000 | | |
Residential Mortgage Loan Trust,
Series 2019-3, Class A1,
2.633%, due 09/25/595,10 | | | 132,076 | | | | 133,323 | | |
Series 2020-1, Class A1,
2.376%, due 02/25/245,10 | | | 62,866 | | | | 63,480 | | |
Series 2020-2, Class A1,
1.654%, due 05/25/605,10 | | | 115,837 | | | | 116,527 | | |
RETL,
Series 2019-RVP, Class C,
1 mo. USD LIBOR + 2.100%,
2.196%, due 03/15/364,5 | | | 137,196 | | | | 136,858 | | |
SLG Office Trust,
Series 2021-OVA, Class C,
2.851%, due 07/15/415 | | | 150,000 | | | | 156,948 | | |
Verus Securitization Trust,
Series 2019-3, Class A1,
2.784%, due 07/25/595,8 | | | 73,191 | | | | 73,660 | | |
Series 2019-4, Class A1,
2.642%, due 11/25/595,8 | | | 93,071 | | | | 94,474 | | |
Series 2020-4, Class A1,
1.502%, due 05/25/655,8 | | | 79,250 | | | | 79,721 | | |
Series 2020-5, Class A1,
1.218%, due 05/25/655,8 | | | 150,536 | | | | 150,997 | | |
Series 2021-1, Class A1,
0.815%, due 01/25/665,10 | | | 212,167 | | | | 211,988 | | |
Series 2021-3, Class A1,
1.046%, due 06/25/665,10 | | | 879,506 | | | | 880,551 | | |
Series 2021-4, Class A1,
0.938%, due 07/25/665,10 | | | 146,510 | | | | 146,339 | | |
Series 2021-R1, Class A1,
0.820%, due 10/25/635,10 | | | 308,331 | | | | 308,259 | | |
Series 2021-R3, Class A1,
1.020%, due 04/25/645,10 | | | 550,800 | | | | 548,754 | | |
Vista Point Securitization Trust,
Series 2020-1, Class A1,
1.763%, due 03/25/655,10 | | | 41,948 | | | | 42,131 | | |
Series 2020-2, Class A1,
1.475%, due 04/25/655,10 | | | 65,138 | | | | 65,539 | | |
Wells Fargo Commercial Mortgage Trust,
Series 2018-C44, Class C,
4.995%, due 05/15/5110 | | | 150,000 | | | | 168,665 | | |
Total mortgage-backed securities
(cost—$13,521,212) | | | 13,611,990 | | |
| | | Face
amount | | Value | |
Municipal bonds—0.8% | |
California—0.1% | |
State of California, GO Bonds
7.550%, due 04/01/39 | | $ | 205,000 | | | $ | 352,508 | | |
Georgia—0.1% | |
State of Georgia, GO Bonds,
Series B,
3.950%, due 07/01/37 | | | 250,000 | | | | 286,761 | | |
Hawaii—0.1% | |
State of Hawaii, GO Bonds,
Series FZ,
2.245%, due 08/01/38 | | | 125,000 | | | | 123,647 | | |
Illinois—0.1% | |
State of Illinois, GO Bonds
6.630%, due 02/01/35 | | | 150,000 | | | | 189,473 | | |
Massachusetts—0.0%† | |
Commonwealth of Massachusetts,
Taxable Refunding, GO Bonds,
Series D,
2.813%, due 09/01/43 | | | 40,000 | | | | 42,999 | | |
Michigan—0.0%† | |
Michigan Finance Authority Hospital, Trinity Health
Corp Obligated Group, Taxable Refunding,
Revenue Bonds
3.084%, due 12/01/34 | | | 100,000 | | | | 110,340 | | |
New York—0.2% | |
Metropolitan Transportation Authority,
Revenue Bonds
6.668%, due 11/15/39 | | | 40,000 | | | | 58,358 | | |
New York City Transitional Finance
Authority Future Tax Secured,
Revenue Bonds,
Series C-5,
3.800%, due 05/01/29 | | | 300,000 | | | | 343,256 | | |
New York State Dormitory Authority Unrefunded,
Taxable Refunding, Revenue Bonds,
Series F,
3.190%, due 02/15/43 | | | 100,000 | | | | 110,518 | | |
New York State Dormitory Authority, Taxable
Refunding, Revenue Bonds,
Series F,
2.657%, due 02/15/28 | | | 150,000 | | | | 160,130 | | |
| | | | | | 672,262 | | |
Tennessee—0.1% | |
Tennessee Valley Authority
2.875%, due 09/15/24 | | | 120,000 | | | | 128,853 | | |
Texas—0.1% | |
Texas Transportation Commission,
Taxable Refunding, GO Bonds
2.472%, due 10/01/44 | | | 150,000 | | | | 149,939 | | |
24
UBS U.S. Allocation Fund
Portfolio of investments—August 31, 2021
| | | Face
amount | | Value | |
Municipal bonds—(concluded) | |
Utah—0.0%† | |
Utah Transit Authority, Taxable Refunding,
Revenue Bonds,
Series B,
3.443%, due 12/15/42 | | $ | 100,000 | | | $ | 106,526 | | |
Total municipal bonds
(cost—$2,011,564) | | | 2,163,308 | | |
Non-U.S. government agency obligations—0.7% | |
Chile Government International Bond
3.125%, due 01/21/26 | | | 200,000 | | | | 216,287 | | |
Colombia Government International Bond
8.125%, due 05/21/24 | | | 135,000 | | | | 157,427 | | |
Indonesia Government International Bond
3.400%, due 09/18/29 | | | 200,000 | | | | 218,600 | | |
Israel Government AID Bond
5.500%, due 09/18/33 | | | 175,000 | | | | 248,820 | | |
Mexico Government International Bond
3.250%, due 04/16/30 | | | 400,000 | | | | 419,450 | | |
4.750%, due 04/27/32 | | | 200,000 | | | | 231,350 | | |
Panama Government International Bond
6.700%, due 01/26/36 | | | 265,000 | | | | 362,686 | | |
8.875%, due 09/30/27 | | | 60,000 | | | | 82,830 | | |
Republic of Poland Government International Bond
5.000%, due 03/23/22 | | | 35,000 | | | | 35,918 | | |
Uruguay Government International Bond
4.125%, due 11/20/45 | | | 80,000 | | | | 95,790 | | |
Total non-U.S. government agency obligations
(cost—$1,951,867) | | | 2,069,158 | | |
U.S. government agency obligations—4.4% | |
Federal Home Loan Mortgage Corporation
Certificates
3.000%, due 11/01/46 | | | 115,423 | | | | 122,005 | | |
3.000%, due 07/01/47 | | | 149,513 | | | | 157,861 | | |
3.000%, due 08/01/47 | | | 140,355 | | | | 148,192 | | |
4.000%, due 05/01/47 | | | 142,669 | | | | 153,397 | | |
5.000%, due 03/01/38 | | | 13,243 | | | | 15,088 | | |
5.500%, due 05/01/37 | | | 66,272 | | | | 76,082 | | |
5.500%, due 08/01/40 | | | 16,591 | | | | 19,304 | | |
6.500%, due 08/01/28 | | | 30,671 | | | | 34,791 | | |
Federal National Mortgage Association
1.875%, due 09/24/26 | | | 200,000 | | | | 210,613 | | |
2.000%, due 01/01/51 | | | 570,238 | | | | 578,361 | | |
2.000%, due 03/01/51 | | | 2,009,781 | | | | 2,038,482 | | |
2.500%, due 08/01/51 | | | 1,173,057 | | | | 1,224,323 | | |
4.000%, due 08/01/45 | | | 120,288 | | | | 133,240 | | |
Federal National Mortgage Association
Certificates
3.000%, due 11/01/48 | | | 233,432 | | | | 246,691 | | |
3.000%, due 02/01/50 | | | 277,124 | | | | 289,687 | | |
3.500%, due 12/01/47 | | | 105,812 | | | | 112,309 | | |
3.500%, due 02/01/48 | | | 733,555 | | | | 778,595 | | |
4.000%, due 12/01/39 | | | 40,209 | | | | 44,205 | | |
4.000%, due 02/01/41 | | | 18,899 | | | | 20,774 | | |
4.500%, due 09/01/37 | | | 129,239 | | | | 144,054 | | |
4.500%, due 07/01/47 | | | 73,316 | | | | 80,134 | | |
5.000%, due 10/01/39 | | | 5,610 | | | | 6,389 | | |
5.000%, due 05/01/40 | | | 5,791 | | | | 6,584 | | |
5.500%, due 08/01/39 | | | 18,418 | | | | 20,864 | | |
| | | Face
amount | | Value | |
U.S. government agency obligations—(concluded) | |
7.000%, due 08/01/32 | | $ | 90,231 | | | $ | 107,454 | | |
7.500%, due 02/01/33 | | | 1,431 | | | | 1,589 | | |
Government National Mortgage Association
Certificate I
4.000%, due 07/15/42 | | | 32,181 | | | | 35,600 | | |
Government National Mortgage Association
Certificates II
3.000%, due 01/20/47 | | | 61,773 | | | | 65,117 | | |
3.000%, due 07/20/47 | | | 173,819 | | | | 183,008 | | |
3.000%, due 08/20/47 | | | 130,291 | | | | 137,178 | | |
3.500%, due 04/20/47 | | | 163,053 | | | | 173,029 | | |
6.000%, due 11/20/28 | | | 319 | | | | 355 | | |
6.000%, due 02/20/29 | | | 660 | | | | 736 | | |
6.000%, due 02/20/34 | | | 216,804 | | | | 251,695 | | |
UMBS TBA
2.000% | | | 1,800,000 | | | | 1,824,570 | | |
| 2.500% | | | 400,000 | | | | 417,683 | | |
| 3.000% | | | 2,375,000 | | | | 2,483,989 | | |
Total U.S. government agency obligations
(cost—$12,177,195) | | | 12,344,028 | | |
U.S. Treasury obligations—5.9% | |
U.S. Treasury Bonds
1.250%, due 05/15/50 | | | 680,000 | | | | 576,459 | | |
1.375%, due 11/15/40 | | | 1,293,000 | | | | 1,196,833 | | |
1.375%, due 08/15/50 | | | 555,000 | | | | 485,452 | | |
2.000%, due 02/15/50 | | | 145,000 | | | | 147,334 | | |
2.250%, due 08/15/49 | | | 305,000 | | | | 326,553 | | |
2.375%, due 05/15/51 | | | 985,000 | | | | 1,087,809 | | |
2.875%, due 05/15/49 | | | 535,000 | | �� | | 646,075 | | |
3.125%, due 02/15/42 | | | 485,000 | | | | 594,409 | | |
3.375%, due 11/15/48 | | | 220,000 | | | | 289,240 | | |
3.750%, due 11/15/43 | | | 230,000 | | | | 309,521 | | |
U.S. Treasury Inflation Index Notes (TIPS)
0.125%, due 07/15/30 | | | 1,313,631 | | | | 1,472,225 | | |
0.250%, due 07/15/29 | | | 2,124 | | | | 2,397 | | |
U.S. Treasury Notes
0.250%, due 05/15/24 | | | 1,375,000 | | | | 1,371,294 | | |
0.250%, due 10/31/25 | | | 990,000 | | | | 973,487 | | |
0.375%, due 11/30/25 | | | 1,960,000 | | | | 1,935,959 | | |
0.500%, due 10/31/27 | | | 135,000 | | | | 131,203 | | |
0.625%, due 07/31/26 | | | 865,000 | | | | 859,053 | | |
1.000%, due 07/31/28 | | | 610,000 | | | | 606,950 | | |
1.125%, due 08/31/28 | | | 960,000 | | | | 962,550 | | |
1.125%, due 02/15/31 | | | 475,000 | | | | 468,617 | | |
1.500%, due 03/31/23 | | | 1,250,000 | | | | 1,276,660 | | |
1.625%, due 08/15/29 | | | 10,000 | | | | 10,354 | | |
1.625%, due 05/15/31 | | | 250,000 | | | | 257,773 | | |
2.000%, due 08/15/51 | | | 140,000 | | | | 142,494 | | |
2.250%, due 05/15/41 | | | 225,000 | | | | 240,750 | | |
Total U.S. Treasury obligations
(cost—$16,439,826) | | | 16,371,451 | | |
25
UBS U.S. Allocation Fund
Portfolio of investments—August 31, 2021
| | | Number of
shares | | Value | |
Short-term investments—9.0% | |
Investment companies—9.0% | |
State Street Institutional U.S. Government
Money Market Fund, 0.030%12
(cost—$25,114,986) | | | 25,114,986 | | | $ | 25,114,986 | | |
| | | Number of
contracts | | Notional
amount | | Value | |
Swaptions purchased—0.0%† | |
Put swaptions—0.0%† | |
CDX North American
High Yield Series 36 Index,
strike @ 108.000%,
expires 10/20/21
(Counterparty BB );
underlying swap
terminates 06/20/26
(cost—$5,350) | | | 500,000 | | | USD | 500,000 | | | $ | 1,921 | | |
Total investments
(cost—$236,196,215)—101.3% | | | | | | | 283,311,426 | | |
Liabilities in excess of other assets—(1.3)% | | | | | | | (3,681,587 | ) | |
Net assets—100.0% | | | | | | $ | 279,629,839 | | |
Swaptions written
Notional
amount
(000) | | Number of
contracts | | Put swaptions | | Counterparty | | Pay/
receive
floating
rate | | Expiration
date | | Premiums
received | | Current
value | | Unrealized
appreciation
(depreciation) | |
USD | 500 | | | | 500,000 | | | CDX North American High Yield Series
36 Index, strike @ 103.000%,
terminating 06/20/26 | | BB | | Receive | | 10/20/21 | | $ | 2,100 | | | $ | (481 | ) | | $ | 1,619 | | |
USD | 500 | | | | 500,000 | | | CDX North American High Yield Series
36 Index, strike @ 105.000%,
terminating 06/20/26 | | BB | | Receive | | 10/20/21 | | | 2,800 | | | | (832 | ) | | | 1,968 | | |
Total swaptions written | | | | | | | | | | | | $ | 4,900 | | | $ | (1,313 | ) | | $ | 3,587 | | |
Futures contracts
Number of
contracts | | Currency | | | | Expiration
date | | Current
notional
amount | | Value | | Unrealized
appreciation
(depreciation) | |
Index futures buy contracts: | |
| | 71 | | | USD | | | | Russell 1000 Value Index Futures | | September 2021 | | $ | 5,607,360 | | | $ | 5,684,260 | | | $ | 76,900 | | |
| | 107 | | | USD | | | | Russell 2000 E-Mini Index Futures | | September 2021 | | | 12,426,172 | | | | 12,150,920 | | | | (275,252 | ) | |
| | 28 | | | USD | | | | S&P 500 E-Mini Index Futures | | September 2021 | | | 6,107,168 | | | | 6,328,700 | | | | 221,532 | | |
U.S. Treasury futures buy contracts: | |
| | 19 | | | USD | | | | U.S. Treasury Note 5 Year Futures | | December 2021 | | $ | 2,348,457 | | | $ | 2,350,656 | | | $ | 2,199 | | |
Total | | | | | | | | | | | | | | $ | 26,489,157 | | | $ | 26,514,536 | | | $ | 25,379 | | |
U.S. Treasury futures sell contracts: | |
| | 77 | | | USD | | | | U.S. Treasury Note 10 Year Futures | | December 2021 | | $ | (10,245,699 | ) | | $ | (10,275,890 | ) | | $ | (30,191 | ) | |
| | 6 | | | USD | | | | U.S. Ultra Treasury Note 10 Year Futures | | December 2021 | | | (890,194 | ) | | | (888,094 | ) | | | 2,100 | | |
Total | | | | | | | | | | | | | | $ | (11,135,893 | ) | | $ | (11,163,984 | ) | | $ | (28,091 | ) | |
| Net unrealized appreciation (depreciation) | | | | | | | | | | | | | | | | | | | | | | $ | (2,712 | ) | |
26
UBS U.S. Allocation Fund
Portfolio of investments—August 31, 2021
Centrally cleared credit default swap agreements on credit indices—buy protection13
Referenced obligations | | Notional
amount
(000) | | Maturity
date | | Payment
frequency | | Payments
made by
the Portfolio14 | | Upfront
payments
received
(made) | | Value | | Unrealized
appreciation
(depreciation) | |
CDX North American Investment Grade 36 Index | | USD | 26,400 | | | 06/20/26 | | Quarterly | | | 1.000 | % | | $ | — | | | $ | (723,840 | ) | | $ | (723,840 | ) | |
OTC Total return swap agreements
Counterparty | | Notional
amount
(000) | | Maturity
date | | Payment
frequency | | Payments
made by the
Portfolio14 | | Payments
received by
the Portfolio14 | | Upfront
payments
received
(made) | | Value | | Unrealized
appreciation
(depreciation) | |
MSCI | | USD | 550 | | | 12/20/21 | | Quarterly | | iBoxx USD
Liquid High
Yield Index | | | 3 Month
USD LIBOR | | | $ | — | | | $ | 7,307 | | | $ | 7,307 | | |
Fair valuation summary
The following is a summary of the fair valuations according to the inputs used as of August 31, 2021 in valuing the Fund's investments. In the event a Fund holds investments for which fair value is measured using the NAV per share practical expedient (or its equivalent), a separate column will be added to the fair value hierarchy table; this is intended to permit reconciliation to the amounts presented in the Portfolio of investment:
Assets
Description | | Unadjusted
quoted prices in
active markets for
identical investments
(Level 1) | | Other significant
observable inputs
(Level 2) | | Unobservable
inputs
(Level 3) | | Total | |
Common stocks | | $ | 139,108,914 | | | $ | — | | | $ | — | | | $ | 139,108,914 | | |
Preferred stocks | | | — | | | | — | | | | 0 | | | | 0 | | |
Exchange traded funds | | | 24,881,933 | | | | — | | | | — | | | | 24,881,933 | | |
Asset-backed securities | | | — | | | | 11,486,530 | | | | — | | | | 11,486,530 | | |
Corporate bonds | | | — | | | | 36,157,207 | | | | — | | | | 36,157,207 | | |
Mortgage-backed securities | | | — | | | | 13,611,990 | | | | — | | | | 13,611,990 | | |
Municipal bonds | | | — | | | | 2,163,308 | | | | — | | | | 2,163,308 | | |
Non-U.S. government agency obligations | | | — | | | | 2,069,158 | | | | — | | | | 2,069,158 | | |
U.S. government agency obligations | | | — | | | | 12,344,028 | | | | — | | | | 12,344,028 | | |
U.S. Treasury obligations | | | — | | | | 16,371,451 | | | | — | | | | 16,371,451 | | |
Short-term investments | | | — | | | | 25,114,986 | | | | — | | | | 25,114,986 | | |
Swaptions purchased | | | — | | | | 1,921 | | | | — | | | | 1,921 | | |
Futures contracts | | | 302,731 | | | | — | | | | — | | | | 302,731 | | |
Swap agreements | | | — | | | | 7,307 | | | | — | | | | 7,307 | | |
Total | | $ | 164,293,578 | | | $ | 119,327,886 | | | $ | 0 | | | $ | 283,621,464 | | |
Liabilities | |
Swaptions written | | $ | — | | | $ | (1,313 | ) | | $ | — | | | $ | (1,313 | ) | |
Futures contracts | | | (305,443 | ) | | | — | | | | — | | | | (305,443 | ) | |
Swap agreements | | | — | | | | (723,840 | ) | | | — | | | | (723,840 | ) | |
Total | | $ | (305,443 | ) | | $ | (725,153 | ) | | $ | — | | | $ | (1,030,596 | ) | |
27
UBS U.S. Allocation Fund
Portfolio of investments—August 31, 2021
At August 31, 2021, there were no transfers in or out of Level 3.
Securities valued using unobservable inputs, i.e. Level 3, were not considered significant to the Fund.
Portfolio footnotes
† Amount represents less than 0.05% or (0.05)%.
* Non-income producing security.
1 Security fair valued by a Valuation Committee under the direction of the Board of Trustees.
2 Significant unobservable inputs were used in the valuation of this security; i.e. Level 3.
3 Security, or portion thereof, was on loan at the period end.
4 Variable or floating rate security. The interest rate shown is the rate in effect as of period end and changes periodically.
5 Security exempt from registration pursuant to Rule 144A under the Securities Act of 1933. These securities are considered liquid, unless noted otherwise, and may be resold in transactions exempt from registration, normally to qualified institutional buyers. Securities exempt from registration pursuant to Rule 144A, in the amount of $30,845,636, represented 11.0% of the Fund's net assets at period end.
6 Perpetual investment. Date shown reflects the next call date.
7 Rate shown reflects annualized yield at the period end on zero coupon bond.
8 Step bond—coupon rate increases in increments to maturity. The rate disclosed is the rate at the period end; the maturity date disclosed is the ultimate maturity date.
9 Security was purchased pursuant to Regulation S under the Securities Act of 1933, which exempts from registration securities offered and sold outside of the United States. Such a security cannot be sold in the United States without either an effective registration statement filed pursuant to the Securities Act of 1933, or pursuant to an exemption from registration.
10 Variable or floating rate security for which the interest rate adjusts periodically based on changes in current interest rates and prepayments on the underlying pool of assets. Rate shown is the rate in effect as of period end.
11 Security purchased on a when-issued basis. When-issued refers to a transaction made conditionally because a security, although authorized, has not yet been issued.
12 Rate shown reflects 7 day yield as of August 31, 2021.
13 If the Fund is a buyer of protection and a credit event occurs, as defined under the terms of that particular swap agreement, the Fund will either (i) receive from the seller of protection an amount equal to the notional amount of the swap and deliver the referenced obligation or underlying securities comprising the referenced obligation or (ii) receive a net settlement amount in the form of cash or securities equal to the notional amount of the swap less the recovery value of the referenced obligation or underlying securities comprising the referenced obligation.
14 Payments made or received are based on the notional amount.
Portfolio acronyms
ADR American Depositary Receipt
BB Barclays Bank PLC
ETF Exchange Traded Fund
FRN Floating Rate Note
GO General Obligation
LIBOR London Interbank Offered Rate
MSCI Morgan Stanley Capital International
OTC Over The Counter
REIT Real Estate Investment Trust
SPDR Standard & Poor's Depository Receipts
TBA To-Be-Announced Security
TIPS Treasury inflation protected securities
Currency type abbreviations
GBP British Pound
USD United States Dollar
See accompanying notes to financial statements
28
Statement of assets and liabilities
August 31, 2021
Assets: | |
Investments, at value (cost—$236,196,215)1 | | $ | 283,311,426 | | |
Cash collateral on futures | | | 1,423,289 | | |
Cash collateral on swap agreements | | | 323,840 | | |
Due from broker | | | 140,829 | | |
Receivable for investments sold | | | 4,066,520 | �� | |
Receivable for fund shares sold | | | 16,283 | | |
Receivable for interest and dividends | | | 642,481 | | |
Receivable for variation margin on centrally cleared swap agreements | | | 27,517 | | |
OTC swap agreements, at value | | | 7,307 | | |
Other assets | | | 20,287 | | |
Total assets | | | 289,979,779 | | |
Liabilities: | |
Options and swaptions written, at value (premiums received $4,900) | | | 1,313 | | |
Payable for investments purchased | | | 9,640,046 | | |
Payable for fund shares redeemed | | | 40,558 | | |
Payable to affiliate | | | 167,925 | | |
Payable to custodian | | | 302,415 | | |
Payable for foreign withholding taxes and foreign capital gains taxes | | | 6 | | |
Payable for variation margin on futures contracts | | | 2,106 | | |
Accrued expenses and other liabilities | | | 195,571 | | |
Total liabilities | | | 10,349,940 | | |
Net assets | | $ | 279,629,839 | | |
Net assets consist of: | |
Beneficial interest shares of $0.001 par value (unlimited amount authorized) | | $ | 192,005,475 | | |
Distributable earnings (accumulated losses) | | | 87,624,364 | | |
Net assets | | $ | 279,629,839 | | |
Class A | |
Net assets | | $ | 243,512,977 | | |
Shares outstanding | | | 4,029,601 | | |
Net asset value per share | | $ | 60.43 | | |
Maximum offering price per share (net asset value plus maximum sales charge of 5.50%) | | $ | 63.95 | | |
Class P | |
Net assets | | $ | 36,116,862 | | |
Shares outstanding | | | 583,797 | | |
Net asset value and offering price per share | | $ | 61.87 | | |
1 Includes $1,623,675 of investments in securities on loan, at value, plus accrued interest and dividends, if any.
See accompanying notes to financial statements
29
Statement of operations
For the year ended August 31, 2021
Investment income: | |
Dividends | | $ | 1,766,376 | | |
Interest | | | 2,115,246 | | |
Securities lending | | | 9,424 | | |
Foreign tax withheld | | | (49 | ) | |
Total income | | | 3,890,997 | | |
Expenses: | |
Investment management and administration fees | | | 1,312,141 | | |
Service fees–Class A | | | 576,452 | | |
Transfer agency and related services fees–Class A | | | 110,620 | | |
Transfer agency and related services fees–Class P | | | 9,431 | | |
Custody and fund accounting fees | | | 53,063 | | |
Trustees fees | | | 14,876 | | |
Professional services fees | | | 137,390 | | |
Printing and shareholder report fees | | | 69,101 | | |
Federal and state registration fees | | | 42,627 | | |
Insurance expense | | | 1,967 | | |
Other expenses | | | 58,034 | | |
Total expenses | | | 2,385,702 | | |
Net investment income (loss) | | | 1,505,295 | | |
Net realized and unrealized gains (loss) from investment activities: | |
Net realized gain (loss) on: | |
Investments | | | 35,551,099 | | |
Options and swaptions written | | | 7,852 | | |
Futures contracts | | | 9,476,153 | | |
Swap agreements | | | 972,506 | | |
Foreign currency transactions | | | 634 | | |
Net realized gain (loss) | | | 46,008,244 | | |
Change in net unrealized appreciation (depreciation) on: | |
Investments | | | 7,933,476 | | |
Options and swaptions written | | | 3,587 | | |
Futures contracts | | | (1,267,085 | ) | |
Swap agreements | | | (1,023,135 | ) | |
Translation of other assets and liabilities denominated in foreign currency | | | 3,608 | | |
Net change in unrealized appreciation (depreciation) | | | 5,650,451 | | |
Net realized and unrealized gain (loss) | | | 51,658,695 | | |
Net increase (decrease) in net assets resulting from operations | | $ | 53,163,990 | | |
See accompanying notes to financial statements
30
Statement of changes in net assets
| | | For the years ended August 31, | |
| | | 2021 | | 2020 | |
From operations: | |
Net investment income (loss) | | $ | 1,505,295 | | | $ | 2,380,567 | | |
Net realized gain (loss) | | | 46,008,244 | | | | 8,528,704 | | |
Net change in unrealized appreciation (depreciation) | | | 5,650,451 | | | | 25,046,814 | | |
Net increase (decrease) in net assets resulting from operations | | | 53,163,990 | | | | 35,956,085 | | |
Total distributions–Class A | | | (15,276,332 | ) | | | (4,153,451 | ) | |
Total distributions–Class P | | | (2,245,882 | ) | | | (637,135 | ) | |
Total distributions | | | (17,522,214 | ) | | | (4,790,586 | ) | |
From beneficial interest transactions: | |
Proceeds from shares sold | | | 3,253,591 | | | | 2,869,428 | | |
Cost of shares redeemed | | | (21,796,461 | ) | | | (22,898,564 | ) | |
Shares issued on reinvestment of dividends and distributions | | | 15,742,724 | | | | 4,300,293 | | |
Net increase (decrease) in net assets from beneficial interest transactions | | | (2,800,146 | ) | | | (15,728,843 | ) | |
Net increase (decrease) in net assets | | | 32,841,630 | | | | 15,436,656 | | |
Net assets: | |
Beginning of year | | | 246,788,209 | | | | 231,351,553 | | |
End of year | | $ | 279,629,839 | | | $ | 246,788,209 | | |
See accompanying notes to financial statements
31
UBS U.S. Allocation Fund
Financial highlights
Selected data for a share of beneficial interest outstanding throughout each year is presented below:
Class A
| | | Years ended August 31, | |
| | | 2021 | | 2020 | | 2019 | | 2018 | | 2017 | |
Net asset value, beginning of year | | $ | 52.91 | | | $ | 46.27 | | | $ | 51.30 | | | $ | 47.61 | | | $ | 43.06 | | |
Income (loss) from investment operations: | |
Net investment income (loss)1 | | | 0.30 | | | | 0.48 | | | | 0.61 | | | | 0.44 | | | | 0.28 | | |
Net realized and unrealized gain (loss) | | | 11.04 | | | | 7.13 | | | | (0.89 | ) | | | 4.37 | | | | 4.45 | | |
Net increase (decrease) from operations | | | 11.34 | | | | 7.61 | | | | (0.28 | ) | | | 4.81 | | | | 4.73 | | |
Dividends from net investment income | | | (0.64 | ) | | | (0.34 | ) | | | (0.51 | ) | | | (0.26 | ) | | | (0.18 | ) | |
Distributions from net realized gain | | | (3.18 | ) | | | (0.63 | ) | | | (4.24 | ) | | | (0.86 | ) | | | — | | |
Total dividends and distributions | | | (3.82 | ) | | | (0.97 | ) | | | (4.75 | ) | | | (1.12 | ) | | | (0.18 | ) | |
Net asset value, end of year | | $ | 60.43 | | | $ | 52.91 | | | $ | 46.27 | | | $ | 51.30 | | | $ | 47.61 | | |
Total investment return2 | | | 22.37 | % | | | 16.65 | % | | | 0.84 | % | | | 10.24 | % | | | 11.03 | % | |
Ratios to average net assets: | |
Expenses | | | 0.94 | % | | | 0.99 | % | | | 0.98 | % | | | 1.00 | %3 | | | 1.01 | % | |
Net investment income (loss) | | | 0.54 | % | | | 1.00 | % | | | 1.33 | % | | | 0.89 | % | | | 0.63 | % | |
Supplemental data: | |
Net assets, end of year (000's) | | $ | 243,513 | | | $ | 216,656 | | | $ | 203,857 | | | $ | 170,947 | | | $ | 166,224 | | |
Portfolio turnover | | | 69 | % | | | 129 | % | | | 86 | % | | | 132 | % | | | 253 | % | |
1 Calculated using the average shares method.
2 Total investment return is calculated assuming a $10,000 investment on the first day of each year reported, reinvestment of all dividends and other distributions, if any, at net asset value on the ex-dividend dates, and a sale at net asset value on the last day of each year reported. The figures do not include any applicable sales charges or redemption fees; results would be lower if they were included. Returns do not reflect the deduction of taxes that a shareholder would pay on Fund distributions or the redemption of Fund shares.
3 Includes interest expense representing less than 0.005%.
See accompanying notes to financial statements
32
UBS U.S. Allocation Fund
Financial highlights (concluded)
Selected data for a share of beneficial interest outstanding throughout each year is presented below:
Class P
| | | Years ended August 31, | |
| | | 2021 | | 2020 | | 2019 | | 2018 | | 2017 | |
Net asset value, beginning of year | | $ | 54.07 | | | $ | 47.25 | | | $ | 52.27 | | | $ | 48.49 | | | $ | 43.84 | | |
Income (loss) from investment operations: | |
Net investment income (loss)1 | | | 0.46 | | | | 0.62 | | | | 0.75 | | | | 0.58 | | | | 0.42 | | |
Net realized and unrealized gain (loss) | | | 11.30 | | | | 7.30 | | | | (0.92 | ) | | | 4.45 | | | | 4.53 | | |
Net increase (decrease) from operations | | | 11.76 | | | | 7.92 | | | | (0.17 | ) | | | 5.03 | | | | 4.95 | | |
Dividends from net investment income | | | (0.78 | ) | | | (0.47 | ) | | | (0.61 | ) | | | (0.39 | ) | | | (0.30 | ) | |
Distributions from net realized gain | | | (3.18 | ) | | | (0.63 | ) | | | (4.24 | ) | | | (0.86 | ) | | | — | | |
Total dividends and distributions | | | (3.96 | ) | | | (1.10 | ) | | | (4.85 | ) | | | (1.25 | ) | | | (0.30 | ) | |
Net asset value, end of year | | $ | 61.87 | | | $ | 54.07 | | | $ | 47.25 | | | $ | 52.27 | | | $ | 48.49 | | |
Total investment return2 | | | 22.69 | % | | | 16.98 | % | | | 1.08 | % | | | 10.52 | % | | | 11.36 | % | |
Ratios to average net assets: | |
Expenses | | | 0.67 | % | | | 0.72 | % | | | 0.71 | % | | | 0.74 | %3 | | | 0.73 | % | |
Net investment income (loss) | | | 0.81 | % | | | 1.28 | % | | | 1.60 | % | | | 1.16 | % | | | 0.91 | % | |
Supplemental data: | |
Net assets, end of year (000's) | | $ | 36,117 | | | $ | 30,132 | | | $ | 27,495 | | | $ | 29,196 | | | $ | 28,279 | | |
Portfolio turnover | | | 69 | % | | | 129 | % | | | 86 | % | | | 132 | % | | | 253 | % | |
1 Calculated using the average shares method.
2 Total investment return is calculated assuming a $10,000 investment on the first day of each year reported, reinvestment of all dividends and other distributions, if any, at net asset value on the ex-dividend dates, and a sale at net asset value on the last day of each year reported. The figures do not include any applicable sales charges or redemption fees; results would be lower if they were included. Returns do not reflect the deduction of taxes that a shareholder would pay on Fund distributions or the redemption of Fund shares.
3 Includes interest expense representing less than 0.005%.
See accompanying notes to financial statements
33
UBS U.S. Allocation Fund
Notes to financial statements
Organization and significant accounting policies
UBS U.S. Allocation Fund (the "Fund") is a series of UBS Investment Trust (the "Trust") and is registered with the US Securities and Exchange Commission ("SEC") under the Investment Company Act of 1940 (the "1940 Act"), as amended, as an open-end, diversified management investment company. The Trust was organized on March 28, 1991, as a business trust under the laws of the Commonwealth of Massachusetts and currently has one operating series.
UBS Asset Management (Americas) Inc. ("UBS AM" or the "Advisor") serves as the investment advisor and administrator for the Fund. UBS Asset Management (US) Inc. ("UBS AM (US)") serves as the principal underwriter for the Fund. UBS AM and UBS AM (US) are indirect wholly owned subsidiaries of UBS Group AG. UBS Group AG is an internationally diversified organization with headquarters in Zurich, Switzerland. UBS Group AG operates in many areas of the financial services industry.
The Fund currently offers Class A and Class P shares. Each class represents interests in the same assets of the Fund, and the classes are identical except for differences in their sales charge structures, ongoing service and distribution charges and certain transfer agency and related services expenses. All classes of shares have equal voting privileges except that each class has exclusive voting rights with respect to its service and/or distribution plan, if any. Class P shares have no service or distribution plan.
In the normal course of business the Fund may enter into contracts that contain a variety of representations that provide indemnification for certain liabilities. The Fund's maximum exposure under these arrangements is unknown, as this would involve future claims that may be made against the Fund that have not yet occurred. However, the Fund has not had any prior claims or losses pursuant to these contracts and expects the risk of loss to be remote.
The Financial Accounting Standards Board ("FASB") Accounting Standards Codification ("ASC") is the exclusive reference of authoritative US generally accepted accounting principles ("US GAAP") recognized by the FASB to be applied by nongovernmental entities. Rules and interpretive releases of the SEC under authority of federal laws are also sources of authoritative US GAAP for SEC registrants. The Fund's financial statements are prepared in accordance with US GAAP, which may require the use of management estimates and assumptions. Actual results could differ from those estimates.
In March 2020, the Financial Accounting Standards Board ("FASB") issued Accounting Standards Update No. 2020-04 ("ASU 2020-04"), "Reference Rate Reform (Topic 848)". In response to concerns about structural risks of interbank offered rates, and particularly the risk of cessation of LIBOR, regulators have undertaken reference rate reform initiatives to identify alternative reference rates that are more observable or transaction based and less susceptible to manipulation. ASU 2020-04 provides optional guidance for a limited period of time to ease the potential burden in accounting for (or recognizing the effects of) reference rate reform on financial reporting. ASU 2020-04 is elective and applies to all entities, subject to meeting certain criteria, that have contracts, hedging relationships, and other transactions that reference LIBOR or another reference rate expected to be discontinued because of reference rate reform. The amendments are effective as of March 12, 2020 through December 31, 2022. Management is currently evaluating the implications, if any, of the additional requirements and the impact on the Fund financial statements.
The following is a summary of significant accounting policies:
Investment transactions, investment income and expenses—Investment transactions are recorded on the trade date. Realized gains and losses from investment transactions and foreign exchange transactions are calculated using the identified cost method. Dividend income and expense are recorded on the ex-dividend date ("ex-date") except in the case of certain dividends from foreign securities which are recorded as soon after the ex-date as the Fund, using
34
UBS U.S. Allocation Fund
Notes to financial statements
reasonable diligence, becomes aware of such dividends. Interest income is recorded on an accrual basis. Discounts are accreted and premiums are amortized as adjustments to interest income and the identified cost of investments.
Income, expenses (excluding class-specific expenses) and realized/unrealized gains/losses are allocated proportionately to each class of shares based upon the relative net asset value of outstanding shares (or the value of dividend eligible shares, as appropriate) of each class at the beginning of the day after adjusting for current capital share activity of the respective classes. Class specific expenses are charged directly to the applicable class of shares.
Dividends and distributions—Dividends and distributions to shareholders are recorded on the ex-dividend date. The amount of dividends from investment income and distributions from realized capital gains and/or return of capital are determined in accordance with US federal income tax regulations, which may differ from US GAAP. These "book/tax" differences are either considered temporary or permanent in nature. To the extent these differences are permanent in nature, such amounts are reclassified within the capital accounts based on their federal tax-basis treatment; temporary differences do not require reclassification.
Foreign currency translation—The books and records of the Fund are maintained in US dollars. Foreign currency amounts are translated into US dollars as follows: (1) the foreign currency market value of investment securities and other assets and liabilities stated in foreign currencies are translated into US dollars based on the current exchange rates each business day; and (2) purchases and sales of investment securities and income and expenses are translated at the rate of exchange prevailing on the respective dates of such transactions. The resulting exchange gains and losses are included in the Statement of operations.
The Fund does not generally isolate the effect of fluctuations in foreign exchange rates from the effect of the changes in market prices of securities. However, the Fund does isolate the effect of fluctuations in foreign exchange rates when determining the realized gain or loss upon the sale or maturity of foreign currency-denominated securities pursuant to US federal income tax regulations. Net realized foreign currency transaction gain (loss) is treated as ordinary income (loss) for income tax reporting purposes.
Concentration of risk—Investing in securities of foreign issuers and currency transactions may involve certain considerations and risks not typically associated with investments in the United States. These risks include revaluation of currencies, adverse fluctuations in foreign currency values and possible adverse political, social and economic developments, including those particular to a specific industry, country or region, which could cause the securities and their markets to be less liquid and prices more volatile than those of comparable US companies and US government securities. These risks are greater with respect to securities of issuers located in emerging market countries in which the Fund invests.
The ability of the issuers of debt securities held by the Fund to meet their obligations may be affected by economic and political developments particular to a specific industry, country, state or region.
Investments in bonds with ratings of BB (Standard & Poor's Financial Services LLC or Fitch Ratings, Inc.) or Ba (Moody's Investors Service, Inc.) or below (commonly referred to as "high yield" bonds), or deemed of equivalent quality, have an increased risk of defaulting or otherwise being unable to honor a financial obligation. These securities are considered to be predominantly speculative with respect to an issuer's capacity to pay interest and repay principal in accordance with the terms of the obligations. Lower-quality bonds are more likely to be subject to an issuer's default or downgrade than investment grade (higher-quality) bonds.
Many financial instruments, financings or other transactions to which a Master Fund may be a party use or may use a floating rate based on the London Interbank Offered Rate ("LIBOR"). LIBOR is widely used in financial markets. In
35
UBS U.S. Allocation Fund
Notes to financial statements
July 2017, the United Kingdom's financial regulatory body announced that after 2021 it will cease its active encouragement of banks to provide the quotations needed to sustain LIBOR. That announcement suggests that LIBOR may cease to be published or utilized after that time. Various financial industry groups have begun planning for that transition, but the effect of the transition process and its ultimate success cannot yet be determined. The transition process may lead to increased volatility and illiquidity in markets for instruments the terms of which are based on LIBOR. It could also lead to a reduction in the value of some LIBOR-based investments and reduce the effectiveness of new hedges placed against existing LIBOR-based investments. Since the usefulness of LIBOR as a benchmark could deteriorate during the transition period, these effects could occur prior to the end of 2021. The willingness and ability of issuers to include enhanced provisions in new and existing contracts or instruments also remains uncertain. Any of these factors may adversely affect the Master Fund's performance or NAV.
Certain impacts to public health conditions particular to the coronavirus "COVID-19" outbreak that occurred may have a significant negative impact on the operations and profitability of the Fund's investments. The extent of the impact to the financial performance of a Fund will depend on future developments, including (i) the duration and spread of the outbreak, (ii) the restrictions and advisories, (iii) the effects on the financial markets, and (iv) the effects on the economy overall, all of which are highly uncertain and cannot be predicted.
Valuation of investments
The Fund generally calculates its net asset value on days that the New York Stock Exchange ("NYSE") is open. The Fund calculates net asset value separately for each class as of the close of regular trading on the NYSE (generally, 4:00 p.m., Eastern time). The NYSE normally is not open, and the Fund does not price its shares, on most national holidays and Good Friday. To the extent that the Fund's assets are traded in other markets on days when the NYSE is not open, the value of the Fund's assets may be affected on those days. If trading on the NYSE is halted for the day before 4:00 p.m., Eastern time, the Fund's net asset value per share generally will still be calculated as of the close of regular trading on the NYSE. The time at which the Fund calculates its net asset value and until which purchase, sale or exchange orders are accepted may be changed as permitted by the SEC.
The Fund calculates its net asset value based on the current market value, where available, for its portfolio investments. The Fund normally obtains market values for its investments from independent pricing sources and broker-dealers. Independent pricing sources may use reported last sale prices, official market closing prices, current market quotations or valuations from computerized "evaluation" systems that derive values based on comparable investments. An evaluation system incorporates parameters such as security quality, maturity and coupon, and/ or research and evaluations by its staff, including review of broker-dealer market price quotations, if available, in determining the valuation of the portfolio investments. Investments also may be valued based on appraisals derived from information concerning the investment or similar investments received from recognized dealers in those holdings.
Investments traded in the over-the-counter ("OTC") market and listed on The NASDAQ Stock Market, Inc. ("NASDAQ") normally are valued at the NASDAQ Official Closing Price. Other OTC securities are valued at the last bid price on the valuation date available prior to valuation. Investments which are listed on US and foreign stock exchanges normally are valued at the market closing price, the last sale price on the day the securities are valued or, lacking any sales on such day, at the last available bid price. Investments listed on foreign stock exchanges may be fair valued based on significant events that have occurred subsequent to the close of the foreign markets. In cases where investments are traded on more than one exchange, the investments are valued on the exchange designated as the primary market by UBS AM. If a market value is not readily available from an independent pricing source for a particular investment, that investment is valued at fair value as determined in good faith by or under the direction of the Fund's Board of Trustees (the "Board"). Foreign currency exchange rates are generally determined as of the close of the NYSE.
36
UBS U.S. Allocation Fund
Notes to financial statements
Certain investments in which the Fund invests may be traded in markets that close before 4:00 p.m., Eastern time. Normally, developments that occur between the close of the foreign markets and 4:00 p.m., Eastern time, will not be reflected in the Fund's net asset value. However, if the Fund determines that such developments are so significant that they will materially affect the value of the Fund's investments, the Fund may adjust the previous closing prices to reflect what is believed to be the fair value of these investments as of 4:00 p.m., Eastern time.
The Fund may use a systematic fair valuation model provided by an independent third party to value investments principally traded in foreign markets in order to adjust for possible stale pricing that may occur between the close of the foreign exchanges and the time for valuation. The systematic fair valuation model may use calculations based on indices of domestic securities and other appropriate indicators, such as prices of relevant ADRs and futures contracts. If an investment is valued at a "fair value," that value is likely to be different from the last quoted market price for the investment. The use of the fair valuation model may result in securities being transferred between Level 1 and Level 2 of the fair valuation hierarchy at the end of the reporting period.
The amortized cost method of valuation, which approximates market value, generally is used to value short-term debt instruments with 60 days or less remaining to maturity, unless the Board determines that this does not represent fair value.
Investments in open-end investment companies are valued at the daily closing net asset value of the respective investment company. Pursuant to the Fund's use of the practical expedient within ASC Topic 820, Fair Value Measurement, investments in investment companies without publicly published prices are also valued at the daily net asset value.
All investments quoted in foreign currencies are valued daily in US dollars on the basis of the foreign currency exchange rates prevailing at the time such valuation is determined by the Fund's custodian.
Futures contracts are generally valued at the settlement price established each day on the exchange on which they are traded. Forward foreign currency contracts, if any, are valued daily using forward exchange rates quoted by independent pricing services.
Swaps are marked-to-market daily based upon values from third party vendors or quotations from market makers to the extent available. In the event that market quotations are not readily available or deemed unreliable, the swap is valued at fair value as determined in good faith by or under the direction of the Board.
The Board has delegated to the Equities, Fixed Income and Multi-Asset Valuation Committee ("VC") the responsibility for making fair value determinations with respect to the Fund's portfolio holdings. The VC is comprised of representatives of management. The VC provides reports to the Board at each quarterly meeting regarding any investments that have been fair valued, valued pursuant to standing instructions approved by the VC, or where non-vendor pricing sources had been used to make fair value determinations when sufficient information exists during the prior quarter. Fair valuation determinations are subject to review at least monthly by the VC during scheduled meetings. Pricing decisions, processes, and controls over fair value determinations are subject to internal and external reviews, including annual internal compliance reviews and periodic internal audit reviews.
The types of investments for which such fair value pricing may be necessary include, but are not limited to: foreign investments under some circumstances; securities of an issuer that has entered into a restructuring; investments whose trading has been halted or suspended; fixed income securities that are in default and for which there is no current market value quotation; and investments that are restricted as to transfer or resale. The need to fair value a Fund's portfolio investments may also result from low trading volume in foreign markets or thinly traded domestic investments, and when a security that is subject to a trading limit or collar on the exchange or market on which it is
37
UBS U.S. Allocation Fund
Notes to financial statements
primarily traded reaches the "limit up" or "limit down" price and no trading has taken place at that price. Various factors may be reviewed in order to make a good faith determination of an investment's fair value. These factors include, but are not limited to, fundamental analytical data relating to the investment; the nature and duration of restrictions on disposition of the investment; and the evaluation of forces which influence the market in which the investment is purchased and sold. Valuing investments at fair value involves greater reliance on judgment than valuing investments that have readily available market quotations. Fair value determinations can also involve reliance on quantitative models employed by a fair value pricing service.
US GAAP requires disclosure regarding the various inputs that are used in determining the value of the Fund's investments. These inputs are summarized into the three broad levels listed below:
Level 1—Unadjusted quoted prices in active markets for identical investments.
Level 2—Other significant observable inputs, including but not limited to, quoted prices for similar investments, interest rates, prepayment speeds and credit risks.
Level 3—Unobservable inputs inclusive of the Fund's own assumptions in determining the fair value of investments.
A fair value hierarchy table has been included near the end of the Fund's Portfolio of investments.
Investments
Asset-backed securities—The Fund may invest in asset-backed securities ("ABS"), representing interests in pools of certain types of underlying installment loans, home equity loans, leases of various types of real and personal property and receivables from revolving lines of credit (credit cards). Such assets are securitized through the use of trusts or special purpose corporations. The yield characteristics of ABS differ from those of traditional debt securities. One such major difference is that principal may be prepaid at any time because the underlying obligations generally may be prepaid at any time. ABS may decrease in value as a result of increases in interest rates and may benefit less than other fixed-income securities from declining interest rates because of the risk of prepayment.
Mortgage-backed securities—The Fund may invest in mortgage-backed securities ("MBS"), representing direct or indirect interests in pools of underlying mortgage loans that are secured by real property. These securities provide investors with payments consisting of both principal and interest as the mortgages in the underlying mortgage pools are paid.
The timely payment of principal and interest (but not the market value) on MBS issued or guaranteed by Ginnie Mae (formally known as the Government National Mortgage Association or GNMA) is backed by Ginnie Mae and the full faith and credit of the US government. Obligations issued by Fannie Mae (formally known as the Federal National Mortgage Association or FNMA) and Freddie Mac (formally known as the Federal Home Loan Mortgage Company or FHLMC) are historically supported only by the credit of the issuer, but currently are guaranteed by the US government in connection with such agencies being placed temporarily into conservatorship by the US government.
Some MBS are sponsored or issued by private entities. Payments of principal and interest (but not the market value) of such private MBS may be supported by pools of mortgage loans or other MBS that are guaranteed, directly or indirectly, by the US government or one of its agencies or instrumentalities, or they may be issued without any government guarantee of the underlying mortgage assets but with some form of non-government credit enhancement.
Collateralized mortgage obligations ("CMO") are a type of MBS. A CMO is a debt security that may be collateralized by whole mortgage loans or mortgage pass-through securities. The mortgage loans or mortgage pass-through securities are divided into classes or tranches with each class having its own characteristics. Investors typically receive pay-
38
UBS U.S. Allocation Fund
Notes to financial statements
ments out of the interest and principal on the underlying mortgages. The portions of these payments that investors receive, as well as the priority of their rights to receive payments, are determined by the specific terms of the CMO class.
The yield characteristics of MBS differ from those of traditional debt securities. Among the major differences are that interest and principal payments are made more frequently, usually monthly, and that principal may be prepaid at any time because the underlying mortgage loans or other obligations generally may be prepaid at any time. Prepayments on a pool of mortgage loans are influenced by a variety of economic, geographic, social, and other factors. Generally, prepayments on fixed-rate mortgage loans will increase during a period of falling interest rates and decrease during a period of rising interest rates. Certain classes of CMOs and other MBS are structured in a manner that makes them extremely sensitive to changes in prepayment rates. Such classes include interest-only ("IO") and principal-only ("PO") classes. IOs are entitled to receive all or a portion of the interest, but none (or only a nominal amount) of the principal payments, from the underlying mortgage assets. If the mortgage assets underlying an IO experience greater than anticipated principal prepayments, then the total amount of interest payments allocable to the IO class, and therefore the yield to investors, generally will be reduced. Conversely, PO classes are entitled to receive all or a portion of the principal payments, but none of the interest, from the underlying mortgage assets. PO classes are purchased at substantial discounts from par and the yield to investors will be reduced if principal payments are slower than expected.
Real estate investment trusts—The Fund may invest in real estate investment trusts ("REITs"). Distributions from a REIT are initially recorded as dividend income and may subsequently be recharacterized by the REIT at the end of its tax year as a return of capital and/or capital gains. The Fund estimates the character of dividends received from REITs for financial reporting purposes based on the distribution history of each REIT. Once actual distribution characterizations are made available by the REITs, typically after calendar year end, the Fund updates its accounting and/or tax books and records.
Repurchase agreements—The Fund may purchase securities or other obligations from a bank or securities dealer (or its affiliate), subject to the seller's agreement to repurchase them at an agreed upon date (or upon demand) and price. The Fund maintains custody of the underlying obligations prior to their repurchase, either through its regular custodian or through a special "tri-party" custodian or sub-custodian that maintains a separate account for both the Fund and its counterparty. The underlying collateral is valued daily in an effort to ensure that the value, including accrued interest, is at least equal to the repurchase price.
Repurchase agreements carry certain risks not associated with direct investments in securities, including a possible decline in the market value of the underlying obligations. If their value becomes less than the repurchase price, plus any agreed-upon additional amount, the counterparty must provide additional collateral so that the collateral is at least equal to the repurchase price plus any agreed-upon additional amount. The difference between the total amount to be received upon repurchase of the obligations and the price that was paid by the Fund upon acquisition is accrued as interest and included in its net investment income. In the event of default of the obligation to repurchase, the Fund generally has the right to liquidate the collateral and apply the proceeds in satisfaction of the obligation. Repurchase agreements involving obligations other than U.S. government securities (such as commercial paper, corporate bonds, equities and mortgage loans) may be subject to special risks and may not have the benefit of certain protections in the event of counterparty insolvency. If the seller (or seller's guarantor, if any) becomes insolvent, the Fund may suffer delays, costs and possible losses in connection with the disposition or retention of the collateral. Under certain circumstances, in the event of default or bankruptcy by the other party to the agreement, realization and/or retention of the collateral may be subject to legal proceedings. The Fund intends to enter into repurchase agreements only in transactions with counterparties believed by UBS AM to present minimal credit risk.
The Fund may participate in joint repurchase agreement transactions with other funds managed or advised by UBS AM in accordance with an exemptive order granted by the SEC pursuant to Section 17(d) of the 1940 Act and
39
UBS U.S. Allocation Fund
Notes to financial statements
Rule 17d-1 thereunder. Under certain circumstances, the Fund may engage in a repurchase agreement transaction with a yield of zero in order to invest cash amounts remaining in its portfolio at the end of the day in order to avoid having the Fund potentially exposed to a fee for uninvested cash held in a business account at a bank.
Restricted securities—The Fund may invest in securities that are subject to legal or contractual restrictions on resale. These securities generally may be resold in transactions exempt from registration or to the public if the securities are registered. Disposal of these securities may involve time-consuming negotiations and expenses, and prompt sale at an acceptable price may be difficult. Information regarding restricted securities, if any, is included in the Fund's portfolio footnotes.
Securities traded on to-be-announced basis—The Fund may from time to time purchase, or short sell, securities on a to-be-announced ("TBA") basis. In a TBA transaction, the Fund commits to purchasing securities for which all specific information is not yet known at the time of the trade, particularly the face amount and maturity date of the underlying securities. Securities purchased on a TBA basis are not settled until they are delivered to the Fund, normally 15 to 45 days later. Beginning on the date the Fund enters into a TBA transaction, cash, US government securities or other liquid securities are segregated in an amount equal in value to the purchase price of the TBA security. These transactions are subject to market fluctuations and their current value is determined in the same manner as for other securities.
Treasury Inflation Protected Securities—The Fund may purchase Treasury inflation protected securities ("TIPS") which are debt securities issued by the US Treasury. TIPS adjust for inflation based on changes in the published Consumer Price Index ("CPI"). During periods of inflation when the CPI index increases, the principal amount of the debt to which the rate of interest is applied increases, which in turn increases the yield. During periods of deflation when the CPI index decreases, the principal amount of the debt to which the rate of interest is applied decreases, which in turn lowers the yield. At maturity, TIPS return the higher of the principal amount at maturity or the initial face amount of the debt.
Derivative instruments
Purchased options—The Fund may purchase put and call options in order to gain exposure to or protect against changes in the markets or in an attempt to enhance income or gains. Purchasing call options tends to increase exposure to the underlying instrument. Purchasing put options tends to decrease exposure to the underlying instrument.
The Fund pays a premium which is included in the Statement of assets and liabilities as an investment and subsequently marked-to-market to reflect the current value of the option. Premiums paid for purchasing options which expire are treated as realized losses. Purchased options are shown as portfolio holdings within the Portfolio of investments and are included in the Statement of assets and liabilities in investments, at value.
The risk associated with purchasing put and call options is limited to the premium paid. Premiums paid for purchasing options which are exercised or closed are added to the amounts paid or offset against the proceeds on the underlying future, security or currency transaction to determine the realized gain or loss.
Option writing—The Fund may write (sell) put and call options, including, but not limited to, options on foreign or US securities, indices, foreign currencies, options on futures contracts and options on swap agreements (commonly referred to as swaptions), in order to gain exposure to or protect against changes in the markets or in an attempt to enhance income or gains.
When a Fund writes a call or a put option, an amount equal to the premium received by the Fund is included on the Fund's Statement of assets and liabilities as a liability. The amount of the liability is subsequently marked-to-market to reflect the current market value of the option written. If an option which the Fund has written either expires on its
40
UBS U.S. Allocation Fund
Notes to financial statements
stipulated expiration date or the Fund enters into a closing purchase transaction, the Fund realizes a gain (or loss if the cost of a closing purchase transaction exceeds the premium received when the option was written) without regard to any unrealized gain or loss on the underlying security or derivative instrument, and the liability related to such option is extinguished. If a call option, which a Fund has written, is exercised, the Fund recognizes a realized gain or loss (long-term or short-term, depending on the holding period of the underlying security) from the sale of the underlying security or derivative instrument and the proceeds from the sale are increased by the premium originally received. If a put option, which a Fund has written, is exercised, the amount of the premium originally received reduces the cost of the security or derivative instrument which the Fund purchases upon exercise of the option.
In writing an option, a Fund bears the market risk of an unfavorable change in the price of the derivative instrument, security, or currency underlying the written option. Exercise of an option written by a Fund could result in the Fund selling or buying a derivative instrument, security or currency at a price different from current market value.
In the normal course of trading activities, the Fund trades and holds certain fair valued derivative contracts that constitute guarantees. Such contracts include written put options, where the Fund will be obligated to purchase securities at specified prices (i.e. the options are exercised by the counterparties). It also includes written swaptions, where the Fund will be obligated to enter into a swap agreement.
The maximum payout for written put options is limited to the number of put option contracts written and the related strike prices, respectively. Maximum payout amounts could be offset by the subsequent sale, if any, of assets obtained via the execution of a payout event. At August 31, 2021, UBS U.S. Allocation Fund had maximum payout amounts of approximately $1000 relating to written put option contracts.
Futures contracts—The Fund may purchase or sell futures contracts as part of its investment strategy, to increase or reduce its exposure to an asset class without purchasing or selling the underlying securities, either as a hedge or to enhance income or realized gains. Generally, a futures contract is a standard binding agreement to buy or sell a specified quantity of an underlying reference asset, such as a specific security or currency, at a specified price at a specified later date.
Upon entering into a futures contract, the Fund is required to deliver to a broker an amount of cash and/or US government securities equal to a certain percentage of the contract amount. This amount is known as the "initial margin." Subsequent payments, known as "variation margin", generally are made or received by the Fund, depending on the daily fluctuations in the value of the underlying futures contracts. Such variation margin is recorded for financial statement purposes on a daily basis as an unrealized appreciation or depreciation on futures until the futures contract is closed or expires, at which time the net gain or loss is reclassified to realized gain or loss on futures.
Using futures contracts involves various market risks, including interest rate and equity risk. Risks of entering into futures contracts include the possibility that there may be an illiquid market or that a change in the value of the contract may not correlate with changes in the value of the underlying securities. To the extent that market prices move in an unexpected direction, there is a risk that the Fund will not achieve the anticipated benefits of the futures contract or may realize a loss.
Futures contracts, if any, are shown as portfolio holdings within the Portfolio of investments. Variation margin, if applicable, is shown in Variation margin receivable or payable on futures contracts within the Statement of assets and liabilities.
Swap agreements—The Fund may engage in swap agreements, including, but not limited to, credit default and total return swap agreements. The Fund expects to enter into these transactions to preserve a return or spread on a particular investment or to hedge a portion of the portfolio's duration, to protect against any increase in the price of securities the Fund anticipates purchasing at a later date, to gain exposure to certain markets in the most economical way possible or in an attempt to enhance income or gains.
41
UBS U.S. Allocation Fund
Notes to financial statements
The Fund accrues for interim payments on swap agreements on a daily basis, with the net amount recorded within unrealized appreciation or depreciation of swap agreements. Once interim payments are settled in cash, the net amount is recorded as realized gain/loss on swap agreements, in addition to realized gain/loss recorded upon the termination of swap agreements on the Statement of operations. Fluctuations in the value of swap agreements are recorded for financial statement purposes as unrealized appreciation or depreciation on swap agreements.
The Fund may enter into interest rate swap agreements with another party to receive or pay interest (e.g., an exchange of fixed rate payments for floating rate payments) to protect themselves from interest rate fluctuations. This type of swap is an agreement that obligates two parties to exchange a series of cash flows at specified intervals based upon or calculated by reference to a specified interest rate(s) for a specified amount. The payment flows are usually netted against each other, with the difference being paid by one party to the other. Interest rate swap agreements are subject to general market risk, liquidity risk, counterparty risk and interest rate risk.
Credit default swap agreements involve commitments to make or receive payments in the event of a default of a security or other credit event of the referenced obligation. As a buyer, the Fund would make periodic payments to the counterparty, and the Fund would receive payments only upon the occurrence of a default or credit event. If no default or credit event occurs, the Fund will lose its periodic stream of payments over the term of the contract. However, if a default or a credit event does occur, the Fund typically would receive full notional value for the referenced obligation that may have little or no value. As a seller, the Fund would receive periodic payments from the counterparty, and the Fund would make payments only upon the occurrence of a default or a credit event. If no default or credit event occurs, the Fund will gain the periodic stream of payments it received over the term of the contract and the counterparty will lose its periodic stream of payments over the term of the contract. However, if a default or credit event occurs, the Fund typically would pay full notional value for the referenced obligation that may have little or no value. Credit default swap agreements may involve greater risks than if the Fund had invested in the referenced obligation directly and are subject to general market risk, liquidity risk and credit risk.
Credit default swap agreements on credit indices involve one party making a stream of payments to another party in exchange for the right to receive a specified return in the event of a write-down, principal shortfall, interest shortfall or default of all or part of the referenced entities comprising the credit index. A credit index is a list of a basket of credit instruments or exposures designed to be representative of some part of the credit market as a whole. These indices are made up of referenced credits that are judged by a poll of dealers to be the most liquid entities in the credit default swap market based on the sector of the index. Components of the indices may include, but are not limited to, investment grade securities, high yield securities, asset backed securities, emerging markets, and/or various credit ratings within each sector. Credit indices are traded using credit default swaps with standardized terms including a fixed spread and standard maturity dates. An index credit default swap references all the names in the index, and if there is a default, the credit event is settled based on that name's weight in the index. The composition of the indices changes periodically, usually every six months, and for most indices, each name has an equal weight in the index. The Fund may use credit default swap agreements on credit indices to hedge a portfolio of credit default swaps or bonds with a credit default swap on indices which is less expensive than it would be to buy many credit default swaps to achieve a similar effect. Credit default swap agreements on credit indices are benchmarks for protecting investors owning bonds against default, and traders use them to speculate on changes in credit quality.
Credit default swap agreements on corporate issues or sovereign issues of an emerging market country involve one party making a stream of payments to another party in exchange for the right to receive a specified return in the event of a default or other credit event. If a credit event occurs and cash settlement is not elected, a variety of other obligations may be delivered in lieu of the specific referenced obligation. The ability to deliver other obligations may result in a cheapest-to-deliver option (the buyer of protection's right to choose the deliverable obligation with the lowest value following a credit event). The Fund may use credit default swap agreements on corporate issues or sovereign issues of an emerging market country to provide a measure of protection against defaults of the issuers (i.e., to reduce risk where the Fund owns or has exposure to the referenced obligation) or to take an active long or short position with respect to the likelihood of a particular issuer's default.
42
UBS U.S. Allocation Fund
Notes to financial statements
The maximum potential amount of future payments (undiscounted) that a Fund as a seller of protection could be required to make under a credit default swap agreement would be an amount equal to the notional amount of the agreement, which may exceed the amount of the value reflected on the Statement of assets and liabilities. Notional amounts of all credit default swap agreements outstanding as of the period end for which a Fund is the seller of protection are disclosed under the section "Credit default swap agreements on corporate issues and credit indices—sell protection" in the Portfolio of investments. These potential amounts would be partially offset by any recovery values of the respective referenced obligations, upfront payments received upon entering into the agreement, or net amounts received from the settlement of buy protection credit default swap agreements entered into, if any, by a Fund for the same referenced entity or entities.
Total return swap agreements involve commitments to pay or receive interest in exchange for a market-linked return based on notional amounts. To the extent the total return of the security or index underlying the transactions exceeds or falls short of the offsetting interest rate obligation, the Fund will receive a payment from or make a payment to the counterparty, respectively. Total return swap agreements are marked-to-market daily, and the change, if any, is recorded as unrealized appreciation or depreciation. Total return swap agreements are subject to general market risk, liquidity risk, counterparty risk, interest rate risk, credit risk and the risk that there may be unfavorable changes in the underlying investments or instruments.
The use of swap agreements involves investment techniques, risks, and transaction costs different from those associated with ordinary portfolio security transactions, including assumptions about market conditions, interest rates, and other applicable factors. As a result, the performance of the Fund will be different than if it had used ordinary portfolio security transactions. OTC swap agreements do not involve the delivery of securities and are subject to counterparty risk. If the other party to a swap agreement defaults and fails to consummate the transaction, the Fund's risk of loss will consist of the net amount of interest or other payments that the Fund is contractually entitled to receive. Therefore, the Fund would consider the creditworthiness of the counterparty to a swap agreement in evaluating potential credit risk.
Certain clearinghouses offer clearing for limited types of derivatives transactions, such as interest rate and credit default swap agreements. Centrally cleared swap agreements must be transacted through a futures commission merchant ("FCM") and cleared through a clearinghouse that serves as a central counterparty. The performance of a centrally cleared swap transaction is effectively guaranteed by a central clearinghouse, thereby reducing the Fund's exposure to the credit risk of its original counterparty. The Fund will be required to post specified levels of margin with the clearinghouse or at the instruction of the clearinghouse; the margin required by a clearinghouse may be greater than the margin the Fund would be required to post in an uncleared transaction. Centrally cleared swap agreements, if any, are reported on the Statement of assets and liabilities based on variation margin received or paid, if any.
Swap agreements, if any, are shown as portfolio holdings within the Portfolio of investments.
Derivatives by underlying risk—Investment companies value their derivatives at fair value and recognize changes in fair value through the Statement of operations. Under US GAAP, investment companies do not qualify for hedge accounting. Accordingly, even though a Fund's investments in derivatives may represent economic hedges, they are considered to be non-hedge transactions for purposes of disclosure under US GAAP.
The volume of derivatives as disclosed in the Fund's Portfolio of investments is representative of the volume of derivatives outstanding during the period ended August 31, 2021.
Swap agreements and options written entered into by the Fund may contain credit-risk related contingent features that could be triggered subject to certain circumstances. Such circumstances include agreed upon net asset value thresholds. If triggered, the derivative counterparty could request additional cash margin and/or terminate the derivative contract. The aggregate fair value of the derivative contracts that are in a net liability position that contain these
43
UBS U.S. Allocation Fund
Notes to financial statements
triggers can be found in the Portfolio of investments. The aggregate fair value of assets that are already posted as collateral as of August 31, 2021, if any, is reflected in the Statement of assets and liabilities.
At August 31, 2021, the Fund had the following derivatives categorized by underlying risk:
Asset derivatives1
| | | Interest
rate risk | | Foreign
exchange
risk | | Credit
risk | | Equity
risk | | Total
value | |
Options and swaptions purchased | | $ | 1,921 | | | $ | — | | | $ | — | | | $ | — | | | $ | 1,921 | | |
Futures contracts | | | 4,299 | | | | — | | | | — | | | | 298,432 | | | | 302,731 | | |
Swap agreements | | | — | | | | — | | | | — | | | | 7,307 | | | | 7,307 | | |
Total value | | $ | 6,220 | | | $ | — | | | $ | — | | | $ | 305,739 | | | $ | 311,959 | | |
1 In the Statement of assets and liabilities, options and swaptions purchased are shown within investments, at value, swap agreements (except centrally cleared swap agreements) are shown within swap agreements, at value, while forward foreign currency contracts are shown using unrealized appreciation on forward foreign currency contracts. Futures contracts are reported in the table above using cumulative appreciation of futures contracts and centrally cleared swap agreements are reported at value, as reported in the futures contracts and centrally cleared swap agreements tables at the end of the Portfolio of investments, respectively, but only the variation margin to be received, if any, is reported within the Statement of assets and liabilities.
Liability derivatives1
| | | Interest
rate risk | | Foreign
exchange
risk | | Credit
risk | | Equity
risk | | Total
value | |
Options and swaptions written | | $ | (1,313 | ) | | $ | — | | | $ | — | | | $ | — | | | $ | (1,313 | ) | |
Futures contracts | | | (30,191 | ) | | | — | | | | — | | | | (275,252 | ) | | | (305,443 | ) | |
Swap agreements | | | — | | | | — | | | | (723,840 | ) | | | — | | | | (723,840 | ) | |
Total | | $ | (31,504 | ) | | $ | — | | | $ | (723,840 | ) | | $ | (275,252 | ) | | $ | (1,030,596 | ) | |
1 In the Statement of assets and liabilities, options and swaptions written are shown within options and swaptions written, at value, swap agreements (except centrally cleared swap agreements) are shown within swap agreements, at value, while forward foreign currency contracts are shown within unrealized depreciation on forward foreign currency contracts. Futures contracts are reported in the table above using cumulative depreciation of futures contracts and centrally cleared swap agreements are reported at value, as reported in the futures contracts and centrally cleared swap agreements are reported at value, as reported in the futures contracts and centrally cleared swap agreements tables at the end of the Portfolio of investments, respectively, but only the variation margin to be paid, if any, is reported within the Statement of assets and liabilities.
During the period ended August 31, 2021, net realized gain (loss) from derivatives were as follows:
Net realized gain (loss)1
| | | Interest
rate risk | | Foreign
exchange
risk | | Credit
risk | | Equity
risk | | Total
value | |
Options and swaptions written | | $ | 7,852 | | | $ | — | | | $ | — | | | $ | — | | | $ | 7,852 | | |
Futures contracts | | | 30,420 | | | | — | | | | — | | | | 9,445,733 | | | | 9,476,153 | | |
Swap agreements | | | 2,225 | | | | — | | | | 953,918 | | | | 16,363 | | | | 972,506 | | |
Total net realized gains (loss) | | $ | 40,497 | | | $ | — | | | $ | 953,918 | | | $ | 9,462,096 | | | $ | 10,456,511 | | |
1 The net realized gain (loss) is shown in the Statement of operations in net realized gain (loss) on futures contracts, options and swaptions written, swap agreements and forward foreign currency contracts, unless otherwise noted. The net realized gain (loss) on options and swaptions purchased is shown in the Statement of operations in net realized gain (loss) on investments.
44
UBS U.S. Allocation Fund
Notes to financial statements
During the period ended August 31, 2021, net unrealized appreciation (depreciation) from derivatives were as follows:
Net change in unrealized appreciation (depreciation)1
| | | Interest
rate risk | | Foreign
exchange
risk | | Credit
risk | | Equity
risk | | Total
value | |
Options and swaptions purchased | | $ | 1,921 | | | $ | — | | | $ | — | | | $ | — | | | $ | 1,921 | | |
Options and swaptions written | | | 3,587 | | | | — | | | | — | | | | — | | | | 3,587 | | |
Futures contracts | | | (28,697 | ) | | | — | | | | — | | | | (1,238,388 | ) | | | (1,267,085 | ) | |
Swap agreements | | | — | | | | — | | | | (1,030,442 | ) | | | 7,307 | | | | (1,023,135 | ) | |
Net change in appreciation (depreciation) | | $ | (23,189 | ) | | $ | — | | | $ | (1,030,442 | ) | | $ | (1,231,081 | ) | | $ | (2,284,712 | ) | |
1 The change in net unrealized appreciation (depreciation) is shown in the Statement of operations in change in net unrealized appreciation (depreciation) on futures contracts, options and swaptions written, swap agreements and forward foreign currency contracts, unless otherwise noted. The change in net unrealized appreciation (depreciation) of options and swaptions purchased is shown in the Statement of operations in change in net unrealized appreciation (depreciation) on investments.
Offsetting of certain derivatives—The Fund typically enter into International Swaps and Derivatives Association, Inc. Master Agreements ("ISDA Master Agreements") or similar master agreements with its OTC derivative contract counterparties in order to, among other things, reduce its credit risk to counterparties. ISDA Master Agreements include provisions for general obligations, representations, collateral and events of default or termination. Under an ISDA Master Agreement, the Fund typically may offset with the counterparty certain derivative financial instrument's payables and/or receivables with collateral held and/or posted and create one single net payment (close-out netting) in the event of default or termination. The Statement of assets and liabilities is presented gross of any netting.
At August 31, 2021, derivative assets and liabilities (by type) on a gross basis and derivatives subject to an enforceable master netting arrangement ("MNA") or similar were as follows:
UBS U.S. Allocation Fund
Derivative Financial Instruments: | | Assets | | Liabilities | |
Total gross amount of derivative assets and liabilities in the Statement of assets and liabilities1 | | $ | 311,959 | | | $ | (1,030,596 | ) | |
Derivatives not subject to a MNA or similar agreements | | | (302,731 | ) | | | 1,029,283 | | |
Total gross amount of assets and liabilities subject to MNA or similar agreements | | $ | 9,228 | | | $ | (1,313 | ) | |
The following tables present the Fund derivative assets and liabilities subject to MNA by counterparty net of amounts available for offset under a MNA and net of the related collateral received/pledged by the Fund as of the period end.
Counterparty | | Gross amount of
assets | | Financial
instruments
and derivatives
available for
offset | | Collateral
received2 | | Net amount
of assets | |
BB | | $ | 1,921 | | | $ | (1,313 | ) | | $ | — | | | $ | 608 | | |
MSCI | | | 7,307 | | | | — | | | | — | | | | 7,307 | | |
Total | | $ | 9,228 | | | $ | (1,313 | ) | | $ | — | | | $ | 7,915 | | |
45
UBS U.S. Allocation Fund
Notes to financial statements
Counterparty | | Gross amount of
liabilities | | Financial
instruments
and derivatives
available for
offset | | Collateral
pledged2 | | Net amount
of liabilities | |
BB | | $ | (1,313 | ) | | $ | 1,313 | | | $ | — | | | $ | — | | |
1 Includes cumulative appreciation/depreciation of futures contracts and centrally cleared swaps, at value as reported in the futures contracts and centrally cleared swaps tables in the Portfolio of investments, but only the unpaid variation margin is reported within the Statement of assets and liabilities within variation margin on futures contracts and centrally cleared swap agreements, respectively.
2 In some instances, the actual collateral received and/or pledged may be more than the amount shown and may be comprised of cash collateral, non-cash collateral or combination of both.
Investment advisor and administrator fees and other transactions with affiliates
The Board has approved an Investment Advisory and Administration Contract (the "Advisory Contract"), under which UBS AM serves as investment advisor and administrator of the Fund. In accordance with the Advisory Contract, the Fund is to pay UBS AM an investment advisory and administration fee, which is to be accrued daily and paid monthly, at an annual rate of 0.50% of the Fund's average daily net assets up to $250 million and 0.45% thereafter.
UBS AM has agreed to permanently reduce its advisory and administration fee based on the Fund's average daily net assets so that it is assessed as follows: $0 to $250 million—0.50%; in excess of $250 million up to $500 million—0.45%; in excess of $500 million up to $2 billion—0.40%; and over $2 billion—0.35%. At August 31, 2021, the Fund owed UBS AM $116,666 for investment advisory and administration fees.
UBS AM has contractually undertaken to waive fees/reimburse a portion of the Fund's expenses, when necessary, to maintain the total annual operating expenses (excluding (1) dividend expense, borrowing costs and interest expense relating to short sales, and (2) investments in other investment companies, interest, taxes, brokerage commissions and extraordinary expenses, if any) of Class A and Class P shares at a level not to exceed 1.15% and 0.90%, respectively through December 31, 2021. The Fund will repay UBS AM for any previously waived fees/reimbursed expenses during the three-year period following August 31, 2018, to the extent that operating expenses (with certain exclusions such as dividend expense, borrowing costs, and interest expense relating to short sales, and interest, taxes, brokerage commissions and extraordinary expenses, if any) are otherwise below the expense caps in effect at the time the fees or expenses were waived/reimbursed. For the period ended August 31, 2021, the Fund had no fee waivers/expense reimbursements subject to repayment. Accordingly, for the period ended August 31, 2021 UBS AM did not waive any investment advisory and administration fees.
During the period ended August 31, 2021, the Fund did not pay broker commissions to affiliates of the investment advisor.
During the period ended August 31, 2021, the Fund engaged in purchase and sale transactions with funds that have a common investment adviser, UBS AM. These interfund purchase and sale transactions were effected in compliance with Rule 17a-7 under the 1940 Act. There were no purchases for the period ended August 31, 2021, while the proceeds from such sales were $1,451,551 and net realized gain recognized was $55,797.
Service and distribution plans
UBS AM (US) is the principal underwriter of the Fund's shares. The Fund has adopted service and/or distribution plans (the "Plans") pursuant to Rule 12b-1 under the 1940 Act for Class A shares. The Plans govern payments made for the expenses incurred in the service and/or distribution of Class A shares. The Fund pays UBS AM (US) monthly service fees at an annual rate of 0.25% of the average daily net assets of Class A shares. At August 31, 2021, the Fund owed UBS AM (US) $51,259 for service and distribution fees.
46
UBS U.S. Allocation Fund
Notes to financial statements
UBS AM (US) also receives the proceeds of the initial sales charges paid upon the purchase of Class A shares and the contingent deferred sales charges paid by shareholders upon certain redemptions of Class A shares. UBS AM (US) has informed the Fund that for the period ended August 31, 2021, it earned $7,050 in initial sales charges on Class A shares.
Transfer agency and related services fees
UBS Financial Services Inc. provides certain services to the Fund pursuant to a delegation of authority from BNY Mellon Investment Servicing (US) Inc. ("BNY Mellon"), the Fund's transfer agent, and is compensated for these services by BNY Mellon, not the Fund. For the period ended August 31, 2021, UBS Financial Services Inc. received from BNY Mellon, not the Fund, $46,414 of the total transfer agency and related service fees paid by the Fund to BNY Mellon.
Securities lending
The Fund may lend securities up to 331/3% of its total assets to qualified broker-dealers or institutional investors. The loans are initially secured at all times by cash, US government securities and irrevocable letters of credit in an amount at least equal to 102% of the market value of the securities loaned with respect to domestic securities and 105% of the market value of the securities loaned with respect to foreign securities. In the event that the market value of the cash, US government securities, and irrevocable letters of credit securing the loan falls below 100% for domestic securities, and 103% for foreign securities, the borrower must provide additional cash, US government securities, and irrevocable letters of credit so that the total securing the loan is at least 102% of the market value for domestic securities and 105% of the market value for foreign securities.
The Fund will regain ownership of loaned securities to exercise certain beneficial rights; however, the Fund may bear the risk of delay in recovery of, or even loss of rights in, the securities loaned should the borrower fail financially. The Fund receives compensation for lending its securities from interest or dividends earned on the cash, US government securities and irrevocable letters of credit held as collateral, net of fee rebates paid to the borrower plus reasonable administrative and custody fees. Cash collateral received is invested in State Street Navigator Securities Lending Government Money Market Portfolio, which is included in the Fund's Portfolio of investments. State Street Bank and Trust Company serves as the Fund's lending agent.
At August 31, 2021, the Fund had securities on loan at value, cash collateral and non-cash collateral as follows:
Value of securities
on loan | | Cash collateral | | Non-cash
collateral* | | Total collateral | | Security types held
as non-cash
collateral | |
| $ | 1,623,675 | | | $ | — | | | $ | 1,682,875 | | | $ | 1,682,875 | | | U.S. Treasury Notes
and U.S. Treasury Bills | |
* These securities are held for the benefit of the Fund at the Fund's custodian. The Fund cannot repledge or resell this collateral. As such, collateral is excluded from the Statement of assets and liabilities.
Bank line of credit
The Fund participates with other funds managed by UBS AM in a $185 million committed credit facility (the "Committed Credit Facility") with State Street Bank and Trust Company. The Committed Credit Facility is to be utilized for temporary financing until the settlement of sales or purchases of portfolio securities, the repurchase or redemption of shares of a participating Fund at the request of shareholders and other temporary or emergency purposes.
Interest on amounts borrowed is calculated based on prevailing rates in effect at the time of borrowing. The Fund covered by the Committed Credit Facility has agreed to pay commitment fees on the average daily balance of the Committed Credit Facility not utilized. Commitment fees have been allocated among the funds in the Committed
47
UBS U.S. Allocation Fund
Notes to financial statements
Credit Facility as follows: 50% of the allocation is based on the relative asset size of funds and the other 50% of the Allocation is based on utilization. For the period ended August 31, 2021, the Fund did not borrow under the Committed Credit Facility.
Additional information regarding compensation to affiliate of a board member
Professor Meyer Feldberg serves as a senior advisor to Morgan Stanley, a financial services firm with which the Fund may conduct transactions, resulting in him being an interested trustee of the Fund . The Fund has been informed that Professor Feldberg's role at Morgan Stanley does not involve matters directly affecting any UBS funds. Portfolio transactions are executed through Morgan Stanley based on that firm's ability to provide best execution of the transactions.
During the period ended August 31, 2021, the Fund paid brokerage commissions to Morgan Stanley in the amount of $4,091.
During the period ended August 31, 2021, the Fund purchased and sold certain securities (e.g., fixed income securities) in principal trades with Morgan Stanley, having an aggregate value of $85,785,832. Morgan Stanley received compensation in connection with these trades, which may have been in the form of a "mark-up" or "mark-down" of the price of the securities, a fee from the issuer, or some other form of compensation. Although the precise amount of this compensation is not generally known by the Fund's investment advisor, it is believed that under normal circumstances it represents a small portion of the total value of the transactions.
Purchases and sales of securities
For the period ended August 31, 2021, aggregate purchases and sales of portfolio securities, excluding short-term securities, were $164,910,061 and $172,072,166, respectively.
Shares of beneficial interest
There is an unlimited amount of $0.001 par value shares of beneficial interest authorized. Transactions in shares of beneficial interest were as follows:
For the year ended August 31, 2021:
| | | Class A | | Class P | |
| | | Shares | | Amount | | Shares | | Amount | |
Shares sold | | | 13,469 | | | $ | 770,248 | | | | 44,024 | | | $ | 2,483,343 | | |
Shares repurchased | | | (331,190 | ) | | | (18,541,114 | ) | | | (57,027 | ) | | | (3,255,347 | ) | |
Dividends reinvested | | | 252,686 | | | | 13,571,750 | | | | 39,559 | | | | 2,170,974 | | |
Net increase (decrease) | | | (65,035 | ) | | $ | (4,199,116 | ) | | | 26,556 | | | $ | 1,398,970 | | |
For the year ended August 31, 2020:
| | | Class A | | Class P | |
| | | Shares | | Amount | | Shares | | Amount | |
Shares sold | | | 17,600 | | | $ | 828,962 | | | | 41,030 | | | $ | 2,040,466 | | |
Shares repurchased | | | (405,072 | ) | | | (19,237,046 | ) | | | (78,146 | ) | | | (3,661,518 | ) | |
Dividends reinvested | | | 75,951 | | | | 3,682,085 | | | | 12,502 | | | | 618,208 | | |
Net increase (decrease) | | | (311,521 | ) | | $ | (14,725,999 | ) | | | (24,614 | ) | | $ | (1,002,844 | ) | |
48
UBS U.S. Allocation Fund
Notes to financial statements
Federal tax status
The Fund intends to distribute substantially all of its income and to comply with the other requirements of the Internal Revenue Code applicable to regulated investment companies. Accordingly, no provision for federal income taxes is required. In addition, by distributing during each calendar year substantially all of its net investment income, net realized capital gains and certain other amounts, if any, the Fund intends not to be subject to a federal excise tax.
The tax character of distributions paid during the fiscal years ended August 31, 2021 and August 31,2020 were as follows:
Distributions paid from: | | 2021 | | 2020 | |
Ordinary Income | | $ | 6,343,701 | | | $ | 1,720,188 | | |
Long term realized capital gains | | | 11,178,513 | | | | 3,070,398 | | |
Aggregate cost for federal income tax purposes, including derivatives, was $236,947,368; and net unrealized appreciation (depreciation), including derivatives consisted of:
Gross unrealized appreciation | | $ | 48,055,148 | | |
Gross unrealized depreciation | | | (1,687,290 | ) | |
Net unrealized appreciation (depreciation) | | | 46,367,858 | | |
The differences between book-basis and tax-basis unrealized appreciation (depreciation) is attributable primarily to the tax deferral of losses on wash sales and tax treatment of certain derivative instruments.
At August 31, 2021, the components of accumulated earnings (deficit) on a tax basis were as follows:
Undistributed ordinary income | | $ | 16,723,377 | | |
Undistributed long-term capital gain | | | 24,536,710 | | |
Accumulated realized capital and other losses | | | (7,192 | ) | |
Net unrealized appreciation (depreciation) of investments | | | 46,371,469 | | |
Total accumulated earnings (deficit) | | | 87,624,364 | | |
There were no reclassifications arising from permanent "book/tax" differences for the period ended August 31, 2021.
Net capital losses recognized by the Fund may be carried forward indefinitely, and retain their character as short-term and/or long-term losses.
At August 31, 2021, the Fund had no net capital loss carryforward.
ASC 740-10 "Income Taxes-Overall" sets forth a minimum threshold for financial statement recognition of the benefit of a tax position taken or expected to be taken. The Fund has analyzed as of August 31, 2021 that there are no significant uncertain tax positions taken or expected to be taken that would require recognition in financial statements. The Fund recognizes interest and penalties, if any, related to uncertain tax positions as income tax expense in the Statement of operations. During the period ended August 31, 2021, the Fund did not incur any interest or penalties.
Under the applicable foreign tax laws, gains on certain securities held in certain foreign countries may be subject to taxes that will be paid by the Fund.
Each of the tax years in the four year period ended August 31, 2021, remains subject to examination by the Internal Revenue Service and state taxing authorities.
49
UBS U.S. Allocation Fund
Report of Independent Registered Public Accounting Firm
To the Shareholders and Board of Trustees of
UBS U.S. Allocation Fund
Opinion on the Financial Statements
We have audited the accompanying statement of assets and liabilities of UBS U.S. Allocation Fund (the "Fund") (the sole fund constituting UBS Investment Trust (the "Trust"), including the portfolio of investments, as of August 31, 2021, and the related statement of operations for the year then ended, the statements of changes in net assets for each of the two years in the period then ended, the financial highlights for each of the five years in the period then ended and the related notes (collectively referred to as the "financial statements"). In our opinion, the financial statements present fairly, in all material respects, the financial position of the Fund (the sole fund constituting UBS Investment Trust) at August 31, 2021, the results of its operations for the year then ended, the changes in its net assets for each of the two years in the period then ended and its financial highlights for each of the five years in the period then ended, in conformity with U.S. generally accepted accounting principles.
Basis for Opinion
These financial statements are the responsibility of the Trust's management. Our responsibility is to express an opinion on the Fund's financial statements based on our audits. We are a public accounting firm registered with the Public Company Accounting Oversight Board (United States) ("PCAOB") and are required to be independent with respect to the Trust in accordance with the U.S. federal securities laws and the applicable rules and regulations of the Securities and Exchange Commission and the PCAOB.
We conducted our audits in accordance with the standards of the PCAOB. Those standards require that we plan and perform the audit to obtain reasonable assurance about whether the financial statements are free of material misstatement, whether due to error or fraud. The Trust is not required to have, nor were we engaged to perform, an audit of the Trust's internal control over financial reporting. As part of our audits we are required to obtain an understanding of internal control over financial reporting but not for the purpose of expressing an opinion on the effectiveness of the Trust's internal control over financial reporting. Accordingly, we express no such opinion.
Our audits included performing procedures to assess the risks of material misstatement of the financial statements, whether due to error or fraud, and performing procedures that respond to those risks. Such procedures included examining, on a test basis, evidence regarding the amounts and disclosures in the financial statements. Our procedures included confirmation of securities owned as of August 31, 2021, by correspondence with the custodian and brokers or by other appropriate auditing procedures where replies from brokers were not received. Our audits also included evaluating the accounting principles used and significant estimates made by management, as well as evaluating the overall presentation of the financial statements. We believe that our audits provide a reasonable basis for our opinion.

We have served as the auditor of one or more UBS investment companies since 1978.
New York, New York
October 29, 2021
50
UBS U.S. Allocation Fund
Tax information (unaudited)
We are required by Subchapter M of the Internal Revenue Code of 1986, as amended, to advise you as to the federal tax status of distributions received by shareholders during the fiscal year. Accordingly, the amount of ordinary dividends paid that qualify for the dividends received deduction for corporate shareholders and long-term capital gains are $2,074,878 and $11,178,513, respectively.
For the taxable period ended August 31, 2021, the Fund designates $2,198,654 as the maximum amount that may be considered qualified dividend income for individual shareholders.
Dividends received by tax-exempt recipients (e.g., IRAs and Keoghs) need not be reported as taxable income. Some retirement trusts (e.g., corporate, Keogh and 403(b)(7) plans) may need this information for their annual information reporting.
Shareholders should not use the above information to prepare their tax returns. Since the Fund's fiscal year is not the calendar year, another notification will be sent with respect to calendar year 2021. Such notification, which will reflect the amount to be used by calendar year taxpayers on their federal income tax returns, will be made in conjunction with Form 1099 DIV and will be mailed in February 2022. Shareholders are advised to consult their own tax advisers with respect to the tax consequences of their investment in each of the Fund.
51
UBS U.S. Allocation Fund
General information (unaudited)
Monthly and quarterly portfolio holdings disclosure
The Fund filed its complete schedule of portfolio holdings with the Securities and Exchange Commission ("SEC") for the first and third quarters of each fiscal year as an exhibit to their reports on Form N-PORT. The fund's Form N-PORT reports are available on the SEC's Web site at http://www.sec.gov. (Please note that on the SEC's Web site, the "filing type" designation for this information may be "NPORT-EX.") Additionally, you may obtain copies of Form N-PORT for the first and third quarters of each fiscal year from the Funds upon request by calling 1-800-647 1568.
Proxy voting policies, procedures and record
You may obtain a description of the Fund's (1) proxy voting policies, (2) proxy voting procedures and (3) information regarding how the Fund voted any proxies related to portfolio securities during the most recent 12-month period ended June 30 for which an SEC filing has been made, without charge, upon request by contacting the Fund directly at 1-800-647 1568, online on the Fund's Web site: www.ubs.com/ubsam-proxy, or on the EDGAR Database on the SEC's Web site (http://www.sec.gov).
Liquidity Risk Management Program
Pursuant to Rule 22e-4 under the Investment Company Act of 1940, as amended (the "1940 Act"), UBS Investment Trust (the "Trust") has adopted a liquidity risk management program (the "program") with respect to its series, UBS U.S. Allocation Fund (the "Fund").
UBS Asset Management (Americas) Inc. ("UBS AM") has been designated by the Trust's Board to administer the program, and UBS AM has delegated the responsibility to carry out certain functions described in the program to an internal group which is comprised of representatives of various investment and non-investment areas of the firm. Liquidity risk is defined as the risk that the Fund could not meet redemption requests without significant dilution of remaining shareholders' interests. The program is intended to provide a framework for the assessment, management and periodic review of the Fund's liquidity risks, taking into consideration, as applicable, the Fund's investment strategy and liquidity of portfolio investments during both normal and reasonably foreseeable stressed conditions; short-term and long-term cash flow projections during both normal and reasonably foreseeable stressed conditions; and holdings of cash and cash equivalents, as well as borrowing arrangements and other funding sources. The provisions of the program shall be administered for the Fund in a manner that is appropriately tailored to reflect the Fund's particular liquidity risks. UBS AM's process of determining the degree of liquidity of a Fund's investments is supported by a third-party liquidity assessment vendor. In May 2021, UBS AM provided the Board with a report addressing the operation of the program and assessing its adequacy and effectiveness of implementation (the "report"). The report covered the period from May 2, 2020 through May 1, 2021.
UBS AM's report concluded that the program was reasonably designed to assess and manage the Fund's liquidity risk, including during periods of market volatility and net redemptions. UBS AM reported that the program operated adequately and has been implemented effectively to assess and manage the Fund's liquidity risk.
There can be no assurance that the program will achieve its objectives in the future. Please refer to the Fund's prospectus for more information regarding the Fund's exposure to liquidity risk and other risks to which an investment in the Fund may be subject.
52
UBS U.S. Allocation Fund
Board approval of investment advisory and administration
agreement (unaudited)
July 2021 Board Meeting
Background—At a meeting of the board of UBS Investment Trust (the "Trust") on July 20-21, 2021, the members of the board, including the trustees who are not "interested persons" of the Trust ("Independent Trustees"), as defined in the Investment Company Act of 1940, as amended, considered and approved the continuance of the investment advisory and administration contract (the "Investment Advisory and Administration Contract") of the Trust with respect to its series, UBS U.S. Allocation Fund (the "Fund"), with UBS Asset Management (Americas) Inc. ("UBS AM"). In preparing for the meeting, the Independent Trustees had requested and received extensive information from UBS AM to assist them, including information about UBS AM, as well as the advisory, administrative and distribution arrangements for the Fund. The board reviewed and discussed with management the materials initially provided by UBS AM prior to the scheduled board meeting. The Independent Trustees also met in executive session to review the disclosure that had been made to them. At these sessions the Independent Trustees were joined by their independent legal counsel. The Independent Trustees also received a memorandum from their independent legal counsel discussing the duties of board members in considering the approval of advisory, administration and distribution agreements.
In its consideration of the approval of the Investment Advisory and Administration Contract, the board reviewed the following factors:
Nature, extent and quality of the services under the Investment Advisory and Administration Contract—The board received and considered information regarding the nature, extent and quality of advisory services provided to the Fund by UBS AM under the Investment Advisory and Administration Contract during the past year. The board also considered the nature, extent and quality of administrative, distribution and shareholder services performed by UBS AM and its affiliates for the Fund and the resources devoted to, and the record of compliance with, the Fund's compliance policies and procedures. The board noted that it received information at regular meetings throughout the year regarding the services rendered by UBS AM concerning the management of the Fund's affairs and UBS AM's role in coordinating and overseeing providers of other services to the Fund. The board's evaluation of the services provided by UBS AM took into account the board's knowledge and familiarity gained as board members of funds in the UBS New York fund complex, including the scope and quality of UBS AM's investment advisory and other capabilities and the quality of its administrative and other services. The board observed that the scope of services provided by UBS AM had expanded over time as a result of regulatory and other developments, including maintaining and monitoring its own and the Fund's expanded compliance programs.
The board had available to it the qualifications, backgrounds and responsibilities of the senior personnel at UBS AM responsible for the Fund and had previously received information regarding the persons primarily responsible for the day-to-day management of the Fund. The board recognized that several senior personnel at UBS AM report to the board regularly and that at each regular meeting the board receives a detailed report from UBS AM on the Fund's performance. The board also considered, based on its knowledge of UBS AM and its affiliates, the financial resources available to UBS AM and its parent organization, UBS Group AG. In that regard, the board received extensive financial information regarding UBS AM and noted that it was a wholly owned, indirect subsidiary of one of the largest financial services firms in the world. It also was noted that UBS AM had approximately $277 billion in assets under management as of March 31, 2021 and was part of the UBS Asset Management Division, which had approximately $1.1 trillion in assets under management worldwide as of March 31, 2021. The board also was cognizant of, and considered, the regulatory and litigation actions and investigations occurring in the past few years involving UBS Group AG, UBS AM and certain of their affiliates.
The board concluded that, overall, it was satisfied with the nature, extent and quality of services provided (and expected to be provided) to the Fund under the Investment Advisory and Administration Contract.
53
UBS U.S. Allocation Fund
Board approval of investment advisory and administration
agreement (unaudited)
Advisory fees and expense ratios—The board reviewed and considered the contractual management fee (the "Contractual Management Fee") payable by the Fund to UBS AM in light of the nature, extent and quality of the advisory and administrative services provided by UBS AM. The board also reviewed and considered the written agreement between UBS AM and the Fund, which is separate from the Investment Advisory and Administration Contract, whereby UBS AM has agreed to permanently reduce its management fee based on the Fund's average daily net assets, which is discussed in more detail in the "Economies of scale" section, and considered the actual fee rate (after taking this agreement into account) (the "Actual Management Fee"). Additionally, the board received and considered information comparing the Fund's Contractual Management Fee, Actual Management Fee and total expenses with those of funds in a group of funds selected and provided by Broadridge, an independent provider of investment company data (the "Expense Group").
In addition, pursuant to a written fee waiver/expense reimbursement agreement, UBS AM is contractually obligated to waive its management fees and/or reimburse the Fund so that the Fund's ordinary total annual operating expenses through December 31, 2021 (excluding dividend expense, borrowing costs, interest expense relating to short sales, expenses attributable to investment in other investment companies, interest, taxes, brokerage commissions and extraordinary expenses) would not exceed 1.15% for Class A shares and 0.90% for Class P (formerly Class Y) shares. The board also considered that the Fund has agreed to repay UBS AM for those waived fees and/or reimbursed expenses if the Fund can do so over the following three fiscal years without causing its expenses in any of those years to exceed the expense caps.
In connection with its consideration of the Fund's management fees, the board also received information on UBS AM's standard institutional account fees for accounts of a similar investment type to the Fund. The board noted management's explanation that comparisons with such accounts may be of limited relevance given the different structures and regulatory requirements of mutual funds, such as the Fund, versus those accounts and the differences in the levels of services required by the Fund and those accounts. The board also received information on fees charged to other mutual funds managed by UBS AM.
The comparative Broadridge information showed that the Fund's Contractual Management Fee, Actual Management Fee and total expenses were below the respective medians in the Fund's Expense Group for the comparison periods utilized in the Broadridge report (lowest Contractual Management Fee and total expenses in the Expense Group). (Below median fees or expenses represent fees or expenses that are lower relative to the median, and above median fees or expenses represent fees or expenses that are higher relative to the median of the funds in the Expense Group.)
In light of the foregoing, the board determined that the management fee continued to be appropriate under the circumstances and in light of the nature, extent and quality of services provided to the Fund under the Investment Advisory and Administration Contract
Fund performance—The board received and considered (a) annualized total return information of the Fund compared to other funds (the "Performance Universe") selected by Broadridge over the one-, three-, five-, ten-year and since inception periods ended April 30, 2021 and (b) annualized performance information for each year in the ten-year period ended April 30, 2021. Although the board received information for the ten-year and since inception periods, in its analysis, it generally placed greater emphasis on the one-, three- and five-year periods. The board was provided with a description of the methodology Broadridge used to determine the similarity of the Fund with the funds included in its Performance Universe. The board also noted that it had received information throughout the year at periodic intervals with respect to the Fund's performance, including with respect to its benchmark index.
The comparative Broadridge information showed that the Fund's performance was above the median for all comparative periods. (Below median performance represents performance that is worse relative to the median, and
54
UBS U.S. Allocation Fund
Board approval of investment advisory and administration
agreement (unaudited)
above median performance represents performance that is better relative to the median.) Based on its review, the board concluded that the Fund's investment performance was acceptable.
Advisor profitability—The board received and considered a profitability analysis of UBS AM and its affiliates in providing services to the Fund and was provided information on UBS AM's expense allocation methodology. The board also received profitability information with respect to the UBS New York fund complex as a whole. The board observed that the profitability and expense analyses are substantially similar to those used by UBS AM for many internal purposes, and are subject to regular review with respect to how certain revenue and expenses should be allocated. UBS AM's profitability was considered not excessive in light of the nature, extent and quality of the services provided to the Fund.
Economies of scale—The board received and considered information from management regarding whether UBS AM realized economies of scale as the Fund's assets grew, whether the Fund has appropriately benefited from any economies of scale, and whether there is potential for realization of any further economies of scale for the Fund. The board considered whether economies of scale in the provision of services to the Fund were being passed along to the shareholders. The board noted that the Fund's Contractual Management Fee contained a single breakpoint and that the Fund's assets were above the breakpoint as of April 30, 2021.
While the Fund's Contractual Management Fee contained a single breakpoint, the board recognized that the Fund had entered into a separate agreement with UBS AM, whereby UBS AM agreed to permanently reduce its Contractual Management Fee at higher asset levels by utilizing several additional breakpoints based on the Fund's average daily net assets, thereby achieving the same effect as if the Contractual Management Fee contained multiple breakpoints.
Generally, in light of UBS AM's profitability data, the Actual Management Fee, Contractual Management Fee, the breakpoints currently in place for the Fund and the current assets of the Fund, the board believed that UBS AM's arrangement for sharing economies of scale with the Fund was acceptable.
Other benefits to UBS AM—The board considered other benefits received by UBS AM and its affiliates as a result of its relationship with the Fund, including the opportunity to offer additional products and services to Fund shareholders. In light of the costs of providing investment advisory, administrative and other services to the Fund and UBS AM's ongoing commitment to the Fund, the profits and other ancillary benefits that UBS AM and its affiliates received were considered reasonable.
In light of all of the foregoing, the board, including a majority of the Independent Trustees, approved the Investment Advisory and Administration Contract. No single factor reviewed by the board was identified by the board as the principal factor in determining whether to approve the Investment Advisory and Administration Contract. The Independent Trustees were advised by separate independent legal counsel throughout the process. The board discussed the proposed continuance of the Investment Advisory and Administration Contract in private sessions with its independent legal counsel at which no representatives of UBS AM were present.
55
UBS U.S. Allocation Fund
Supplemental information (unaudited)
Board of Trustees & Officers
The Trust is governed by a Board of Trustees which oversees the Fund's operations. Each Trustee serves an indefinite term of office. Officers are appointed by the trustees and serve at the pleasure of the Board. The table below shows, for each trustee and officer, his or her name, address and age, the position held with the Trust, the length of time served as a trustee or officer of the Trust, the trustee's or officer's principal occupations during the last five years, the number of portfolios in the UBS fund complex overseen by the trustee or for which a person served as an officer, and other directorships held by the trustee.
The Fund's Statement of Additional Information contains additional information about the trustees and is available, without charge, upon request by calling 1-800-647 1568.
Interested Trustee:
Name,
address,
and age | | Position(s)
held with
Trust | | Term of office1
and length of
time served | | Principal
occupation(s)
during past
5 years | | Number of
portfolios in fund
complex overseen
by Trustee | | Other
directorships
held by
Trustee | |
Meyer Feldberg2;
79
Morgan Stanley
1585 Broadway
36th Floor
New York, NY 10036 | | Trustee | | Since 2001 (Trustee); Since 2017 (Chairman of the Board of Trustees) | | Professor Feldberg is Dean Emeritus and Professor of Leadership and Ethics at Columbia Business School, although on an extended leave of absence. He is also a senior advisor to Morgan Stanley (financial services) (since 2005). Professor Feldberg also served as president of New York City Global Partners (an organization located in part of the Office of the Mayor of the City of New York that promoted interaction with other cities around the world) (2007-2014). Prior to 2004, he was Dean and Professor of Management and Ethics of the Graduate School of Business at Columbia University (since 1989). From 1992 to 2016, Professor Feldberg was a director of Macy's, Inc. (operator of department stores). From 1997 to 2017, Professor Feldberg was a director of Revlon, Inc. (cosmetics). | | Professor Feldberg is a director or trustee of 8 investment companies (consisting of 48 portfolios) for which UBS Asset Management (Americas) Inc. ("UBS AM") or one of its affiliates serves as investment advisor or manager. | | Professor Feldberg is also a director of the New York City Ballet. | |
56
UBS U.S. Allocation Fund
Supplemental information (unaudited)
Independent Trustees:
Name,
address,
and age | | Position(s)
held with
Trust | | Term of office1
and length of
time served | | Principal
occupation(s)
during past
5 years | | Number of
portfolios in fund
complex overseen
by Trustee | | Other
directorships
held by
Trustee | |
Alan S. Bernikow;
80
K2 Integrity
845 Third Avenue
New York, NY | | Trustee | | Since 2005 | | Mr. Bernikow is retired. Previously, he was deputy chief executive officer at Deloitte & Touche (international accounting and consulting firm). From 2003 to March 2017, Mr. Bernikow was also a director of Destination XL Group, Inc. (menswear) (and served as a member of its nominating and corporate governance committee). | | Mr. Bernikow is a director or trustee of 5 investment companies (consisting of 45 portfolios) for which UBS AM serves as investment advisor or manager. | | Mr. Bernikow is also a director of Revlon, Inc. (cosmetics) (and serves as the chair of its audit committee and as the chair of the compensation committee), the lead director of Mack-Cali Realty Corporation (real estate investment trust) (and serves as the chair of its audit committee). | |
Richard R. Burt;
74
McLarty Associates
900 17th Street 8th Floor
Washington, D.C. 20006 | | Trustee | | Since 2001 | | Mr. Burt is a managing partner to McLarty Associates (a consulting firm) (since 2007). He was chairman of IEP Advisors (international investments and consulting firm) until 2009. | | Mr. Burt is a director or trustee of 5 investment companies (consisting of 45 portfolios) for which UBS AM serves as investment advisor or manager. | | Mr. Burt is also a director of The Central Europe, Russia and Turkey Fund, Inc., The European Equity Fund, Inc. and The New Germany Fund, Inc. (and serves as a member of each such fund's audit, nominating and governance committee). | |
Bernard H. Garil;
81
6754 Casa Grande Way
Delray Beach, FL 33446 | | Trustee | | Since 2005 | | Mr. Garil is retired (since 2001). He was a managing director at PIMCO Advisory Services (from 1999 to 2001) where he served as president of closed-end funds and vice-president of the variable insurance product funds advised by OpCap Advisors (until 2001). | | Mr. Garil is a director or trustee of 5 investment companies (consisting of 45 portfolios) for which UBS AM serves as investment advisor or manager. | | Mr. Garil is a trustee for the Brooklyn College Foundation, Inc. (charitable foundation). | |
57
UBS U.S. Allocation Fund
Supplemental information (unaudited)
Independent Trustees (concluded):
Name,
address,
and age | | Position(s)
held with
Trust | | Term of office1
and length of
time served | | Principal
occupation(s)
during past
5 years | | Number of
portfolios in fund
complex overseen
by Trustee | | Other
directorships
held by
Trustee | |
Heather R. Higgins;
62
c/o Keith A. Weller
Fund Secretary
UBS Asset Management (Americas) Inc.
One North Wacker Drive
Chicago, IL 60606 | | Trustee | | Since 2005 | | Ms. Higgins is the president and director of The Randolph Foundation (charitable foundation) (since 1991). Ms. Higgins also serves (or has served) on the boards of several non-profit charitable groups, including the Independent Women's Forum (chairman) and the Philanthropy Roundtable (vice chairman). She also serves on the board of the Hoover Institution (from 2001 to 2007 and since 2009). | | Ms. Higgins is a director or trustee of 5 investment companies (consisting of 45 portfolios) for which UBS AM serves as investment advisor or manager. | | None | |
58
UBS U.S. Allocation Fund
Supplemental information (unaudited)
Officers:
Name,
address
and age | | Position(s)
held with
Trust | | Term of office1
and length of
time served | | Principal occupation(s) during past 5 years;
number of portfolios in fund complex
for which person serves as officer | |
Rose Ann Bubloski**;
53 | | Vice President and Assistant Treasurer | | Since 2011 | | Ms. Bubloski is a director (since 2012) (prior to which she was an associate director (from 2008 to 2012)) and a senior manager of fund accounting—US (previously named product control and investment support) of UBS AM—Americas region"). Ms. Bubloski is vice president and assistant treasurer of 8 investment companies (consisting of 58 portfolios) for which UBS AM serves as investment advisor or manager. | |
Franklin P. Dickson**;
43 | | Vice President | | Since 2017 | | Mr. Dickson is an associate director (since 2015) and tax compliance manager (since 2017) (prior to which he was a product controller (from 2015 to 2017) of fund accounting—US (previously named product control and investment support) of UBS AM—Americas region. Mr. Dickson is a vice president of 8 investment companies (consisting of 58 portfolios) for which UBS AM serves as investment advisor or manager. | |
Mark F. Kemper*;
63 | | Vice President and Assistant Secretary | | Since 2004 and March 2019, respectively | | Mr. Kemper is a managing director (since 2006) and general counsel (2004 through May 2019 and September 2021 to present) (prior to which he was senior legal counsel (October 2019-March 2020 and April 2021 to September 2021), Interim Head of Asia Pacific Legal (March 2020 through March 2021) and (Interim head of Compliance and Operational Risk Control (from June 2019 through September 2019) of UBS AM—Americas region. He has been secretary of UBS AM—Americas region (since 2004) and assistant secretary of UBS Asset Management Trust Company (since 1993). Mr. Kemper is vice president and assistant secretary of 8 investment companies (consisting of 58 portfolios) for which UBS AM serves as investment advisor or manager. Mr. Kemper is employed by UBS Business Solutions US LLC (since 2017). | |
Joanne M. Kilkeary**;
53 | | Vice President, Treasurer and Principal Accounting Officer | | Since 1999 (Vice President); since 2017 (Treasurer and Principal Accounting Officer) | | Ms. Kilkeary is an executive director (since 2013) (prior to which she was a director (from 2008 to 2013)) and head of regulatory, tax, audit and board governance for product control and investment support (from 2017 until October 2020) (prior to which she was a senior manager of registered fund product control of UBS AM—Americas region (from 2004 to 2017)). Ms. Kilkeary is a vice president and assistant treasurer of 8 investment companies (consisting of 58 portfolios) for which UBS AM serves as investment advisor or manager. | |
Igor Lasun**;
42 | | President | | Since September 2018 | | Mr. Lasun is an a managing director (since March 2021) (prior to which he was executive director (from 2018 until February 2021)) and head of fund development and management for UBS AM—Americas region (since 2018) (prior to which he was a senior fixed income product specialist from 2007 to 2018, and had joined the firm in 2005). In this role, he oversees development and management for both wholesale and institutional businesses. Mr. Lasun serves as president of 7 investment companies (consisting of 57 portfolios) for which UBS AM serves as investment advisor or manager. | |
59
UBS U.S. Allocation Fund
Supplemental information (unaudited)
Officers (concluded):
Name,
address
and age | | Position(s)
held with
Trust | | Term of office1
and length of
time served | | Principal occupation(s) during past 5 years;
number of portfolios in fund complex
for which person serves as officer | |
Frank S.
Pluchino***,
62 | | Chief Compliance Officer | | Since 2017 | | Mr. Pluchino is an executive director with UBS Business Solutions US LLC (Since 2017) and is also the chief compliance officer of UBS Hedge Fund Solutions LLC (since 2010). Mr. Pluchino serves as chief compliance officer of 11 investment companies (consisting of 61 portfolios) for which UBS AM or one of its affiliates serves as investment advisor or manager. | |
Eric Sanders*;
56 | | Vice President and Assistant Secretary | | Since 2005 | | Mr. Sanders is a director and associate general counsel with UBS Business Solutions US LLC (since 2017) and also with UBS AM—Americas region (since 2005). Mr. Sanders is a vice president and assistant secretary of 8 investment companies (consisting of 58 portfolios) for which UBS AM serves as investment advisor or manager. | |
Philip Stacey*;
36 | | Vice President and Assistant Secretary | | Since 2018 | | Mr. Stacey is an executive director and associate general counsel with UBS Business Solutions US LLC (since 2017) and also with UBS AM—Americas region since 2015. Mr. Stacey is a vice president and assistant secretary of 7 investment companies (consisting of 57 portfolios) for which UBS AM serves as investment advisor or manager. | |
Keith A. Weller*;
60 | | Vice President and Secretary | | Since 2000 and March 2019, respectively | | Mr. Weller is an executive director and deputy general counsel (since February 2019, prior to which he was senior associate general counsel) with UBS Business Solutions US LLC (since 2017) and also with UBS AM—Americas region (since 2005) and has been an attorney with affiliated entities since 1995. Mr. Weller is a vice president and secretary of 8 investment companies (consisting of 58 portfolios) for which UBS AM serves as investment advisor or manager, and is also involved with other funds for which UBS AM or an affiliate serves as investment advisor or administrator. | |
1 Each trustee holds office for an indefinite term. Officers are appointed by the trustees and serve at the pleasure of the Board.
2 Professor Feldberg is deemed an "interested person" of the Trust as defined in the Investment Company Act of 1940, as amended, because he is a senior advisor to Morgan Stanley, a financial services firm with which the Trust may conduct transactions.
* This person's business address is One North Wacker Drive, Chicago, Illinois 60606.
** This person's business address is 787 Seventh Avenue, New York, New York 10019.
*** This person's business address is 600 Washington Blvd, Stamford, CT 06901.
60
Trustees
Meyer Feldberg
Chairman
Alan S. Bernikow
Richard R. Burt
Bernard H. Garil
Heather R. Higgins
Investment Manager and
Administrator
UBS Asset Management (Americas) Inc.
787 Seventh Avenue
New York, New York 10019
Principal Underwriter
UBS Asset Management (US) Inc.
787 Seventh Avenue
New York, New York 10019
This report is not to be used in connection with the offering of shares of the Portfolios unless accompanied or preceded by an effective prospectus.
©UBS 2021. All rights reserved.
UBS Asset Management (Americas) Inc.
PRESORTED
STANDARD
U.S. POSTAGE
PAID
COMPUTERSHARE

UBS Asset Management (Americas) Inc.
1285 Avenue of the Americas
New York, NY 10019-6028
| (b) | Copy of each notice transmitted to shareholders in reliance on Rule 30e-3 under the Investment Company Act of 1940, as amended (the "1940 Act"), that contains disclosures specified by paragraph (c)(3) of that rule: Not applicable to the registrant. |
Item 2. Code of Ethics.
The registrant has adopted a code of ethics that applies to its principal executive officer, principal financial officer, principal accounting officer or controller, or persons performing similar functions pursuant to Section 406 of the Sarbanes-Oxley Act of 2002. (The registrant has designated the code of ethics adopted pursuant to Sarbanes-Oxley as a “Code of Conduct” to lessen the risk of confusion with its separate code of ethics adopted pursuant to Rule 17j-1 under the 1940 Act.).
Item 3. Audit Committee Financial Expert.
The registrant’s Board has determined that the following person serving on the registrant’s Audit Committee is an “audit committee financial expert” as defined in item 3 of Form N-CSR: Alan S. Bernikow. Mr. Bernikow is independent as defined in item 3 of Form N-CSR.
Item 4. Principal Accountant Fees and Services.
For the fiscal years ended August 31, 2021 and August 31, 2020, the aggregate Ernst & Young LLP (E&Y) audit fees for professional services rendered to the registrant were approximately $73,107 and $73,107, respectively.
Fees included in the audit fees category are those associated with the annual audits of financial statements and services that are normally provided in connection with statutory and regulatory filings.
In each of the fiscal years ended August 31, 2021 and August 31, 2020, the aggregate audit-related fees billed by EY for services rendered to the registrant that are reasonably related to the performance of the audits of the financial statements, but not reported as audit fees, were approximately $2,910 and $2,910, respectively.
Fees included in the audit-related fees category are those associated with the reading and providing of comments on the 2021 and 2020 semiannual financial statements.
There were no audit-related fees required to be approved pursuant to paragraph (c)(7)(ii) of Rule 2-01 of Regulation S-X during the fiscal years indicated above.
In each of the fiscal years ended August 31, 2021 and August 31, 2020, the aggregate tax fees billed by EY for professional services rendered to the registrant were approximately $12,964 and $13,337, respectively.
Fees included in the tax fees category comprise all services performed by professional staff in the independent accountant’s tax division except those services related to the audits. This category comprises fees for review of tax compliance, tax return preparation and excise tax calculations.
There were no tax fees required to be approved pursuant to paragraph (c)(7)(ii) of Rule 2-01 of Regulation S-X during the fiscal years indicated above.
In each of the fiscal years ended August 31, 2021 and August 31, 2020, there were no fees billed by EY for products and services, other than the services reported in Item 4(a)-(c) above, rendered to the registrant.
Fees included in the all other fees category would consist of services related to internal control reviews, strategy and other consulting, financial information systems design and implementation, consulting on other information systems, and other tax services unrelated to the registrant.
There were no “all other fees” required to be approved pursuant to paragraph (c)(7)(ii) of Rule 2-01 of Regulation S-X during the fiscal years indicated above.
| (e) | (1) Audit Committee Pre-Approval Policies and Procedures: |
The registrant’s Audit Committee (“audit committee”) has adopted an “Audit Committee Charter (Amended and Restated as of September 14, 2016)” (the “charter”). The charter contains the audit committee’s pre-approval policies and procedures. Reproduced below is an excerpt from the charter regarding pre-approval policies and procedures:
The [audit] Committee shall:
…
| 2. | Pre-approve (a) all audit and permissible non-audit services1 to be provided to the Fund and (b) all permissible non-audit services to be provided by the Fund’s independent auditors to UBS AM and any Covered Service Providers, if the engagement relates directly to the operations and financial reporting of the Fund. In carrying out this responsibility, the Committee shall seek periodically from UBS AM and from the independent auditors a list of such audit and permissible non-audit services that can be expected to be rendered to the Fund, UBS AM or any Covered Service Providers by the Fund’s independent auditors, and an estimate of the fees sought to be paid in connection with such services. The Committee has delegated its responsibility to pre-approve any such audit and permissible non-audit services not exceeding $100,000 (excluding reasonable out-of-pocket expenses) on an annual basis to the Chairperson. All such pre-approvals will be reported to the full Committee on a quarterly basis at the Committee’s next regularly scheduled meeting after the pre-approval. The Committee may not delegate to management its responsibility to pre-approve services to be performed by the independent auditor. Requests or applications to provide services that require specific pre-approval by the Committee or the Chairperson will be submitted by both the Fund’s independent auditors and the Fund’s Treasurer or other designated Fund officer and must include a joint statement as to whether, in their view, the request or application is consistent with SEC rules on auditor independence. From year to year, the Committee shall report to the Board whether this system of pre-approval has been effective and efficient or whether this Charter should be amended to allow for pre-approval pursuant to such policies and procedures as the Committee shall approve, including the delegation of some or all of the Committee’s pre-approval responsibilities to other persons (other than UBS AM or the Fund’s officers). |
1 The Committee will not approve non-audit services that the Committee believes may taint the independence of the auditors. Currently, permissible non-audit services include any professional services (including tax services) that are not prohibited services as described below, provided to the Fund by the independent auditors, other than those provided to the Fund in connection with an audit or a review of the financial statements of the Fund. Permissible non-audit services may not include: (i) bookkeeping or other services related to the accounting records or financial statements of the Fund; (ii) financial information systems design and implementation; (iii) appraisal or valuation services, fairness opinions or contribution-in-kind reports; (iv) actuarial services; (v) internal audit outsourcing services; (vi) management functions or human resources; (vii) broker or dealer, investment adviser or investment banking services; (viii) legal services and expert services unrelated to the audit; and (ix) any other service the Public Company Accounting Oversight Board determines, by regulation, is impermissible.
Pre-approval by the Committee of any permissible non-audit services is not required so long as: (i) the aggregate amount of all such permissible non-audit services provided to the Fund, UBS AM and any service providers controlling, controlled by or under common control with UBS AM that provide ongoing services to the Fund (“Covered Service Providers”) constitutes not more than 5% of the total amount of revenues paid to the independent auditors (during the fiscal year in which the permissible non-audit services are provided) by (a) the Fund, (b) its investment adviser and (c) any entity controlling, controlled by, or under common control with the investment adviser that provides ongoing services to the Fund during the fiscal year in which the services are provided that would have to be approved by the Committee; (ii) the permissible non-audit services were not recognized by the Fund at the time of the engagement to be non-audit services; and (iii) such services are promptly brought to the attention of the Committee and approved by the Committee (or its delegate(s)) prior to the completion of the audit.
| (e) (2) | Services approved pursuant to paragraph (c)(7)(i)(C) of Rule 2-01 of Regulation S-X: |
Audit-Related Fees:
There were no amounts that were approved by the audit committee pursuant to the de minimis exception for the fiscal years ended August 31, 2021 and August 31, 2020 on behalf of the registrant.
There were no amounts that were required to be approved by the audit committee pursuant to the de minimis exception for the fiscal years ended August 31, 2021 and August 31, 2020 on behalf of the registrant’s service providers that relate directly to the operations and financial reporting of the registrant.
Tax Fees:
There were no amounts that were approved by the audit committee pursuant to the de minimis exception for the fiscal years ended August 31, 2021 and August 31, 2020 on behalf of the registrant.
There were no amounts that were required to be approved by the audit committee pursuant to the de minimis exception for the fiscal years ended August 31, 2021 and August 31, 2020 on behalf of the registrant’s service providers that relate directly to the operations and financial reporting of the registrant.
All Other Fees:
There were no amounts that were approved by the audit committee pursuant to the de minimis exception for the fiscal years ended August 31, 2021 and August 31, 2020 on behalf of the registrant.
There were no amounts that were required to be approved by the audit committee pursuant to the de minimis exception for the fiscal years ended August 31, 2021 and August 31, 2020 on behalf of the registrant’s service providers that relate directly to the operations and financial reporting of the registrant.
| (f) | For the fiscal year ended August 31, 2021, if greater than 50%, specify the percentage of hours spent on the audit of the registrant’s financial statements for the most recent fiscal year that were attributed to work performed by persons who are not full-time, permanent employees of E&Y. According to E&Y, such amount was below 50%; therefore, disclosure item not applicable for this filing. |
| (g) | For the fiscal years ended August 31, 2021 and August 31, 2020, the aggregate fees billed by EY of $200,614 and $334,987, respectively, for non-audit services rendered on behalf of the registrant (“covered”), its investment adviser (not including any sub-adviser whose role is primarily portfolio management and is subcontracted with or overseen by another investment adviser) and any entity controlling, controlled by, or under common control with the adviser (“non-covered”) that provides ongoing services to the registrant for each of the last two fiscal years of the registrant is shown in the table below: |
| | | 2021 | | | 2020 | |
| Covered Services | | $ | 15,874 | | | $ | 16,247 | |
| Non-Covered Services | | $ | 184,740 | | | $ | 318,740 | |
| (h) | The registrant’s audit committee was not required to consider whether the provision of non-audit services that were rendered to the registrant’s investment adviser (not including any sub-adviser whose role is primarily portfolio management and is subcontracted with or overseen by another investment adviser), and any entity controlling, controlled by, or under common control with the investment adviser that provides ongoing services to the registrant that were not pre-approved pursuant to paragraph (c)(7)(ii) of Rule 2-01 of Regulation S-X is compatible with maintaining the principal accountant’s independence. |
Item 5. Audit Committee of Listed Registrants.
Not applicable to the registrant.
Item 6. Investments.
| (a) | Included as part of the report to shareholders filed under Item 1 of this form. |
Item 7. Disclosure of Proxy Voting Policies and Procedures for Closed-End Management Investment Companies.
Not applicable to the registrant.
Item 8. Portfolio Managers of Closed-End Management Investment Companies.
Not applicable to the registrant.
Item 9. Purchases of Equity Securities by Closed-End Management Investment Company and Affiliated Purchasers.
Not applicable to the registrant.
Item 10. Submission of Matters to a Vote of Security Holders.
The registrant’s Board has established a Nominating and Corporate Governance Committee. The Nominating and Corporate Governance Committee will consider nominees recommended by shareholders if a vacancy occurs among those board members who are not “interested persons” as defined in Section 2(a)(19) of the Investment Company Act of 1940, as amended. In order to recommend a nominee, a shareholder should send a letter to the chairperson of the Nominating and Corporate Governance Committee, Richard R. Burt, care of the Secretary of the registrant at UBS Asset Management, UBS Building, One North Wacker Drive, Chicago, IL 60606, Attn: Keith A. Weller, Secretary, and indicate on the envelope “Nominating and Corporate Governance Committee.” The shareholder’s letter should state the nominee’s name and should include the nominee’s resume or curriculum vitae, and must be accompanied by a written consent of the individual to stand for election if nominated for the Board and to serve if elected by shareholders.
Item 11. Controls and Procedures.
| (a) | The registrant’s principal executive officer and principal financial officer have concluded that the registrant’s disclosure controls and procedures (as defined in Rule 30a-3(c) under the Investment Company Act of 1940, as amended) are effective based on their evaluation of these controls and procedures as of a date within 90 days of the filing date of this document. |
| (b) | The registrant’s principal executive officer and principal financial officer are aware of no changes in the registrant’s internal control over financial reporting that occurred during the second fiscal quarter of the period covered by this report that has materially affected, or is reasonably likely to materially affect, the registrant’s internal control over financial reporting. |
Item 12. Disclosure of Securities Lending Activities for Closed-End Management Investment Companies.
Not applicable to the registrant
Item 13. Exhibits.
| (a) | (3) Written solicitation to purchase securities under Rule 23c-1 under the Investment Company Act of 1940 sent or given during the period covered by the report by or on behalf of the registrant to 10 or more persons – not applicable to the registrant. |
SIGNATURES
Pursuant to the requirements of the Securities Exchange Act of 1934 and the Investment Company Act of 1940, the registrant has duly caused this report to be signed on its behalf by the undersigned, thereunto duly authorized.
| UBS Investment Trust | |
| | |
| By: | /s/ Igor Lasun | |
| | Igor Lasun | |
| | President | |
| | | |
| Date: | November 8, 2021 | |
Pursuant to the requirements of the Securities Exchange Act of 1934 and the Investment Company Act of 1940, this report has been signed below by the following persons on behalf of the registrant and in the capacities and on the dates indicated.
| By: | /s/ Igor Lasun | |
| | Igor Lasun | |
| | President | |
| | |
| Date: | November 8, 2021 | |
| | |
| By: | /s/ Joanne M. Kilkeary | |
| | Joanne M. Kilkeary | |
| | Vice President, Treasurer and Principal Accounting Officer | |
| | |
| Date: | November 8, 2021 | |