UNITED STATES
SECURITIES AND EXCHANGE COMMISSION
Washington, D.C. 20549
FORM N-CSR
CERTIFIED SHAREHOLDER REPORT OF REGISTERED
MANAGEMENT INVESTMENT COMPANIES
Investment Company Act file number: 811-06292
UBS Investment Trust
______________________________________________________________________________
(Exact name of registrant as specified in charter)
787 Seventh Avenue, New York, New York 10019
______________________________________________________________________________
(Address of principal executive offices) (Zip code)
Keith A. Weller, Esq.
UBS Asset Management
One North Wacker Drive
Chicago, IL 60606
(Name and address of agent for service)
Copy to:
Stephen H. Bier, Esq.
Dechert LLP
1095 Avenue of the Americas
New York, NY 10036-6797
Registrant’s telephone number, including area code: 888-793-8637
Date of fiscal year end: August 31
Date of reporting period: August 31, 2024
Item 1. Reports to Stockholders.
(a) Copy of the report transmitted to shareholders:
TABLE OF CONTENTS
Annual Shareholder Report
August 31, 2024
This annual shareholder report contains important information about UBS U.S. Allocation Fund for the period of September 1, 2023 to August 31, 2024. You can find additional information about the Fund at http://www.ubs.com/port-info . You can also request this information by contacting us at 1-800-647-1568.
What were the Fund costs for the last year?
Annual Fund Operating Expenses
(based on a hypothetical $10,000 investment)
| Class Name | Cost of a $10,000 investment | Costs paid as a percentage of a $10,000 investment |
|---|
| Class A | $112 | 1.03% |
How did the Fund perform last year and what affected its performance?
Portfolio performance summary
What worked:
- Tactical asset allocation contributed positively to relative performance.
- Overweight stocks vs. bonds was a positive contributor to performance.
- An overweight to US large cap was the main contributor to performance. Within US large cap, an overweight to US Communication Services and an overweight to US Information Technology contributed the most.
- Within Fixed Income, overweights in securitized fixed income contributed to performance.
What didn’t work:
- Security selection detracted from relative performance. Negative impact from US Large Cap Value and the US Securitized Bond strategies outweighed positive contribution from the US High Yield Fixed Income, US Large Cap Growth, and the US Large Cap Sector Rotation Strategies.
- From a tactical allocation perspective, underweights to US 10 year treasuries and an overweight to US Health Care detracted the most from relative performance.
We used derivatives extensively for capital management, risk management, and expressing asset allocation views. We utilized various futures which include equity regional, equity style, fixed income regional in both government and corporate credit. Futures were sometimes used to manage overall regional exposure while increasing exposure to actively managed sleeves of the portfolio. We also utilized futures to gain exposure to asset classes when limited by our max allocation to external ETFs by SEC rules.
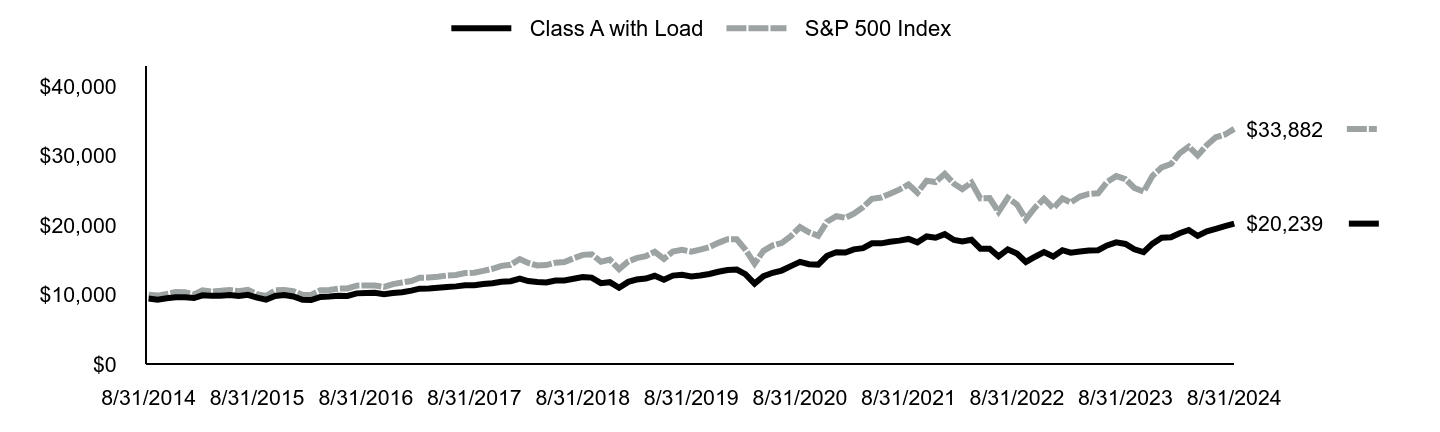
| Class A with Load | S&P 500 Index |
|---|
| 8/31/2014 | $9,450 | $10,000 |
| 9/30/2014 | $9,272 | $9,860 |
| 10/31/2014 | $9,464 | $10,101 |
| 11/30/2014 | $9,623 | $10,372 |
| 12/31/2014 | $9,630 | $10,346 |
| 1/31/2015 | $9,502 | $10,036 |
| 2/28/2015 | $9,899 | $10,612 |
| 3/31/2015 | $9,844 | $10,444 |
| 4/30/2015 | $9,837 | $10,545 |
| 5/31/2015 | $9,927 | $10,680 |
| 6/30/2015 | $9,804 | $10,474 |
| 7/31/2015 | $9,972 | $10,693 |
| 8/31/2015 | $9,557 | $10,048 |
| 9/30/2015 | $9,269 | $9,799 |
| 10/31/2015 | $9,816 | $10,626 |
| 11/30/2015 | $9,927 | $10,657 |
| 12/31/2015 | $9,725 | $10,489 |
| 1/31/2016 | $9,262 | $9,969 |
| 2/29/2016 | $9,219 | $9,955 |
| 3/31/2016 | $9,668 | $10,631 |
| 4/30/2016 | $9,730 | $10,672 |
| 5/31/2016 | $9,837 | $10,864 |
| 6/30/2016 | $9,818 | $10,892 |
| 7/31/2016 | $10,181 | $11,293 |
| 8/31/2016 | $10,229 | $11,309 |
| 9/30/2016 | $10,269 | $11,311 |
| 10/31/2016 | $10,070 | $11,105 |
| 11/30/2016 | $10,229 | $11,516 |
| 12/31/2016 | $10,332 | $11,744 |
| 1/31/2017 | $10,577 | $11,967 |
| 2/28/2017 | $10,861 | $12,442 |
| 3/31/2017 | $10,892 | $12,456 |
| 4/30/2017 | $10,997 | $12,584 |
| 5/31/2017 | $11,112 | $12,761 |
| 6/30/2017 | $11,188 | $12,841 |
| 7/31/2017 | $11,334 | $13,105 |
| 8/31/2017 | $11,357 | $13,145 |
| 9/30/2017 | $11,520 | $13,416 |
| 10/31/2017 | $11,632 | $13,729 |
| 11/30/2017 | $11,851 | $14,150 |
| 12/31/2017 | $11,927 | $14,308 |
| 1/31/2018 | $12,298 | $15,127 |
| 2/28/2018 | $11,956 | $14,569 |
| 3/31/2018 | $11,822 | $14,199 |
| 4/30/2018 | $11,763 | $14,254 |
| 5/31/2018 | $12,037 | $14,597 |
| 6/30/2018 | $12,049 | $14,687 |
| 7/31/2018 | $12,286 | $15,233 |
| 8/31/2018 | $12,520 | $15,730 |
| 9/30/2018 | $12,454 | $15,819 |
| 10/31/2018 | $11,658 | $14,738 |
| 11/30/2018 | $11,795 | $15,038 |
| 12/31/2018 | $10,985 | $13,680 |
| 1/31/2019 | $11,836 | $14,777 |
| 2/28/2019 | $12,180 | $15,251 |
| 3/31/2019 | $12,314 | $15,547 |
| 4/30/2019 | $12,715 | $16,177 |
| 5/31/2019 | $12,147 | $15,149 |
| 6/30/2019 | $12,737 | $16,217 |
| 7/31/2019 | $12,851 | $16,450 |
| 8/31/2019 | $12,625 | $16,189 |
| 9/30/2019 | $12,753 | $16,492 |
| 10/31/2019 | $12,971 | $16,849 |
| 11/30/2019 | $13,291 | $17,461 |
| 12/31/2019 | $13,558 | $17,988 |
| 1/31/2020 | $13,616 | $17,981 |
| 2/29/2020 | $12,954 | $16,501 |
| 3/31/2020 | $11,587 | $14,463 |
| 4/30/2020 | $12,659 | $16,317 |
| 5/31/2020 | $13,149 | $17,094 |
| 6/30/2020 | $13,469 | $17,434 |
| 7/31/2020 | $14,109 | $18,417 |
| 8/31/2020 | $14,727 | $19,740 |
| 9/30/2020 | $14,387 | $18,990 |
| 10/31/2020 | $14,329 | $18,485 |
| 11/30/2020 | $15,592 | $20,509 |
| 12/31/2020 | $16,121 | $21,297 |
| 1/31/2021 | $16,065 | $21,082 |
| 2/28/2021 | $16,527 | $21,664 |
| 3/31/2021 | $16,691 | $22,612 |
| 4/30/2021 | $17,389 | $23,819 |
| 5/31/2021 | $17,389 | $23,986 |
| 6/30/2021 | $17,621 | $24,546 |
| 7/31/2021 | $17,785 | $25,129 |
| 8/31/2021 | $18,021 | $25,893 |
| 9/30/2021 | $17,538 | $24,688 |
| 10/31/2021 | $18,390 | $26,418 |
| 11/30/2021 | $18,194 | $26,235 |
| 12/31/2021 | $18,712 | $27,411 |
| 1/31/2022 | $17,882 | $25,992 |
| 2/28/2022 | $17,668 | $25,214 |
| 3/31/2022 | $17,899 | $26,150 |
| 4/30/2022 | $16,613 | $23,870 |
| 5/31/2022 | $16,623 | $23,914 |
| 6/30/2022 | $15,522 | $21,940 |
| 7/31/2022 | $16,521 | $23,963 |
| 8/31/2022 | $15,915 | $22,986 |
| 9/30/2022 | $14,706 | $20,869 |
| 10/31/2022 | $15,463 | $22,558 |
| 11/30/2022 | $16,122 | $23,819 |
| 12/31/2022 | $15,496 | $22,446 |
| 1/31/2023 | $16,406 | $23,857 |
| 2/28/2023 | $16,039 | $23,275 |
| 3/31/2023 | $16,205 | $24,129 |
| 4/30/2023 | $16,352 | $24,506 |
| 5/31/2023 | $16,394 | $24,612 |
| 6/30/2023 | $17,084 | $26,239 |
| 7/31/2023 | $17,538 | $27,082 |
| 8/31/2023 | $17,303 | $26,650 |
| 9/30/2023 | $16,540 | $25,380 |
| 10/31/2023 | $16,113 | $24,846 |
| 11/30/2023 | $17,342 | $27,115 |
| 12/31/2023 | $18,192 | $28,347 |
| 1/31/2024 | $18,266 | $28,824 |
| 2/29/2024 | $18,848 | $30,363 |
| 3/31/2024 | $19,309 | $31,339 |
| 4/30/2024 | $18,465 | $30,059 |
| 5/31/2024 | $19,130 | $31,550 |
| 6/30/2024 | $19,481 | $32,682 |
| 7/31/2024 | $19,864 | $33,080 |
| 8/31/2024 | $20,239 | $33,882 |
Average Annual Total Returns (%)
| 1 Year | 5 Years | 10 Years |
|---|
| Class A | 16.97% | 9.90% | 7.91% |
| Class A with Load | 10.55% | 8.66% | 7.30% |
| S&P 500 Index | 27.14% | 15.92% | 12.98% |
Performance data represents past performance, which does not guarantee future results.
The graph and table do not reflect the deduction of taxes that a shareholder would pay on Fund distributions or a redemption of Fund shares.
| FUND STATISTICS | |
|---|
| Total Net Assets | $229,345,180 |
| # of Portfolio Holdings | 1,053 |
| Portfolio Turnover Rate | 58% |
| Total Advisory Fees Paid (includes Administration Fees) | $1,092,819 |
What is the Fund’s investment objective?
The Fund seeks total return, consisting of long-term capital appreciation and current income.
Top 5 Equity Holdings (%)
| Apple, Inc. | 4.2% |
| Microsoft Corp. | 4.0 |
| NVIDIA Corp. | 3.8 |
| Alphabet, Inc., Class A | 2.3 |
| Amazon.com, Inc. | 2.2 |
Top 5 Holdings (other than equities) (%)
| Invesco S&P 500 Equal Weight ETF | 2.0% |
| Uniform Mortgage-Backed Security, TBA , 2.000% | 1.7 |
| Uniform Mortgage-Backed Security, TBA , 4.500% | 1.3 |
| iShares Core S&P Mid-Cap ETF | 1.2 |
| Uniform Mortgage-Backed Security, TBA , 5.000% | 1.2 |
If you wish to view additional information about the Fund, including but not limited to financial statements or holdings, please visit http://www.ubs.com/port-info .
Annual Shareholder Report
August 31, 2024
This annual shareholder report contains important information about UBS U.S. Allocation Fund for the period of September 1, 2023 to August 31, 2024. You can find additional information about the Fund at http://www.ubs.com/port-info . You can also request this information by contacting us at 1-800-647-1568.
What were the Fund costs for the last year?
Annual Fund Operating Expenses
(based on a hypothetical $10,000 investment)
| Class Name | Cost of a $10,000 investment | Costs paid as a percentage of a $10,000 investment |
|---|
| Class P | $83 | 0.76% |
How did the Fund perform last year and what affected its performance?
Portfolio performance summary
What worked:
- Tactical asset allocation contributed positively to relative performance.
- Overweight stocks vs. bonds was a positive contributor to performance.
- An overweight to US large cap was the main contributor to performance. Within US large cap, an overweight to US Communication Services and an overweight to US Information Technology contributed the most.
- Within Fixed Income, overweights in securitized fixed income contributed to performance.
What didn’t work:
- Security selection detracted from relative performance. Negative impact from US Large Cap Value and the US Securitized Bond strategies outweighed positive contribution from the US High Yield Fixed Income, US Large Cap Growth, and the US Large Cap Sector Rotation Strategies.
- From a tactical allocation perspective, underweights to US 10 year treasuries and an overweight to US Health Care detracted the most from relative performance.
We used derivatives extensively for capital management, risk management, and expressing asset allocation views. We utilized various futures which include equity regional, equity style, fixed income regional in both government and corporate credit. Futures were sometimes used to manage overall regional exposure while increasing exposure to actively managed sleeves of the portfolio. We also utilized futures to gain exposure to asset classes when limited by our max allocation to external ETFs by SEC rules.
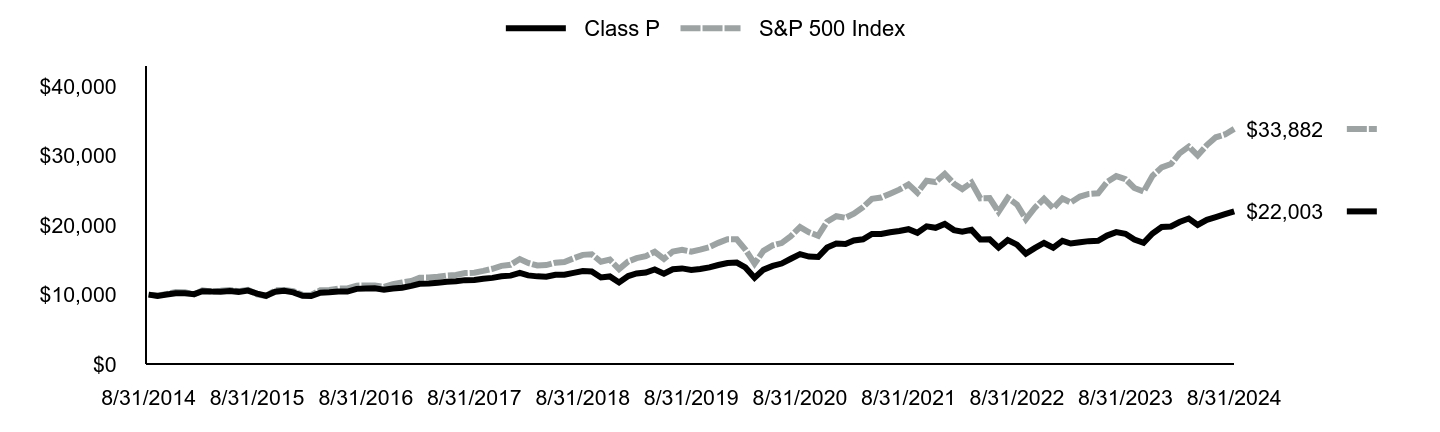
| Class P | S&P 500 Index |
|---|
| 8/31/2014 | $10,000 | $10,000 |
| 9/30/2014 | $9,815 | $9,860 |
| 10/31/2014 | $10,020 | $10,101 |
| 11/30/2014 | $10,190 | $10,372 |
| 12/31/2014 | $10,200 | $10,346 |
| 1/31/2015 | $10,066 | $10,036 |
| 2/28/2015 | $10,488 | $10,612 |
| 3/31/2015 | $10,433 | $10,444 |
| 4/30/2015 | $10,428 | $10,545 |
| 5/31/2015 | $10,527 | $10,680 |
| 6/30/2015 | $10,398 | $10,474 |
| 7/31/2015 | $10,580 | $10,693 |
| 8/31/2015 | $10,140 | $10,048 |
| 9/30/2015 | $9,835 | $9,799 |
| 10/31/2015 | $10,421 | $10,626 |
| 11/30/2015 | $10,540 | $10,657 |
| 12/31/2015 | $10,326 | $10,489 |
| 1/31/2016 | $9,837 | $9,969 |
| 2/29/2016 | $9,795 | $9,955 |
| 3/31/2016 | $10,277 | $10,631 |
| 4/30/2016 | $10,344 | $10,672 |
| 5/31/2016 | $10,458 | $10,864 |
| 6/30/2016 | $10,441 | $10,892 |
| 7/31/2016 | $10,830 | $11,293 |
| 8/31/2016 | $10,882 | $11,309 |
| 9/30/2016 | $10,927 | $11,311 |
| 10/31/2016 | $10,719 | $11,105 |
| 11/30/2016 | $10,890 | $11,516 |
| 12/31/2016 | $11,001 | $11,744 |
| 1/31/2017 | $11,266 | $11,967 |
| 2/28/2017 | $11,571 | $12,442 |
| 3/31/2017 | $11,606 | $12,456 |
| 4/30/2017 | $11,723 | $12,584 |
| 5/31/2017 | $11,846 | $12,761 |
| 6/30/2017 | $11,931 | $12,841 |
| 7/31/2017 | $12,088 | $13,105 |
| 8/31/2017 | $12,118 | $13,145 |
| 9/30/2017 | $12,293 | $13,416 |
| 10/31/2017 | $12,413 | $13,729 |
| 11/30/2017 | $12,653 | $14,150 |
| 12/31/2017 | $12,737 | $14,308 |
| 1/31/2018 | $13,135 | $15,127 |
| 2/28/2018 | $12,771 | $14,569 |
| 3/31/2018 | $12,632 | $14,199 |
| 4/30/2018 | $12,571 | $14,254 |
| 5/31/2018 | $12,866 | $14,597 |
| 6/30/2018 | $12,881 | $14,687 |
| 7/31/2018 | $13,137 | $15,233 |
| 8/31/2018 | $13,393 | $15,730 |
| 9/30/2018 | $13,324 | $15,819 |
| 10/31/2018 | $12,476 | $14,738 |
| 11/30/2018 | $12,625 | $15,038 |
| 12/31/2018 | $11,762 | $13,680 |
| 1/31/2019 | $12,676 | $14,777 |
| 2/28/2019 | $13,046 | $15,251 |
| 3/31/2019 | $13,192 | $15,547 |
| 4/30/2019 | $13,622 | $16,177 |
| 5/31/2019 | $13,020 | $15,149 |
| 6/30/2019 | $13,653 | $16,217 |
| 7/31/2019 | $13,779 | $16,450 |
| 8/31/2019 | $13,539 | $16,189 |
| 9/30/2019 | $13,682 | $16,492 |
| 10/31/2019 | $13,920 | $16,849 |
| 11/30/2019 | $14,264 | $17,461 |
| 12/31/2019 | $14,555 | $17,988 |
| 1/31/2020 | $14,619 | $17,981 |
| 2/29/2020 | $13,913 | $16,501 |
| 3/31/2020 | $12,446 | $14,463 |
| 4/30/2020 | $13,603 | $16,317 |
| 5/31/2020 | $14,133 | $17,094 |
| 6/30/2020 | $14,479 | $17,434 |
| 7/31/2020 | $15,170 | $18,417 |
| 8/31/2020 | $15,838 | $19,740 |
| 9/30/2020 | $15,478 | $18,990 |
| 10/31/2020 | $15,416 | $18,485 |
| 11/30/2020 | $16,778 | $20,509 |
| 12/31/2020 | $17,355 | $21,297 |
| 1/31/2021 | $17,299 | $21,082 |
| 2/28/2021 | $17,798 | $21,664 |
| 3/31/2021 | $17,977 | $22,612 |
| 4/30/2021 | $18,734 | $23,819 |
| 5/31/2021 | $18,740 | $23,986 |
| 6/30/2021 | $18,992 | $24,546 |
| 7/31/2021 | $19,174 | $25,129 |
| 8/31/2021 | $19,431 | $25,893 |
| 9/30/2021 | $18,916 | $24,688 |
| 10/31/2021 | $19,840 | $26,418 |
| 11/30/2021 | $19,632 | $26,235 |
| 12/31/2021 | $20,195 | $27,411 |
| 1/31/2022 | $19,303 | $25,992 |
| 2/28/2022 | $19,074 | $25,214 |
| 3/31/2022 | $19,332 | $26,150 |
| 4/30/2022 | $17,946 | $23,870 |
| 5/31/2022 | $17,961 | $23,914 |
| 6/30/2022 | $16,777 | $21,940 |
| 7/31/2022 | $17,857 | $23,963 |
| 8/31/2022 | $17,208 | $22,986 |
| 9/30/2022 | $15,903 | $20,869 |
| 10/31/2022 | $16,729 | $22,558 |
| 11/30/2022 | $17,441 | $23,819 |
| 12/31/2022 | $16,769 | $22,446 |
| 1/31/2023 | $17,758 | $23,857 |
| 2/28/2023 | $17,361 | $23,275 |
| 3/31/2023 | $17,547 | $24,129 |
| 4/30/2023 | $17,709 | $24,506 |
| 5/31/2023 | $17,762 | $24,612 |
| 6/30/2023 | $18,512 | $26,239 |
| 7/31/2023 | $19,007 | $27,082 |
| 8/31/2023 | $18,760 | $26,650 |
| 9/30/2023 | $17,937 | $25,380 |
| 10/31/2023 | $17,478 | $24,846 |
| 11/30/2023 | $18,808 | $27,115 |
| 12/31/2023 | $19,741 | $28,347 |
| 1/31/2024 | $19,823 | $28,824 |
| 2/29/2024 | $20,462 | $30,363 |
| 3/31/2024 | $20,964 | $31,339 |
| 4/30/2024 | $20,054 | $30,059 |
| 5/31/2024 | $20,779 | $31,550 |
| 6/30/2024 | $21,166 | $32,682 |
| 7/31/2024 | $21,587 | $33,080 |
| 8/31/2024 | $22,003 | $33,882 |
Average Annual Total Returns (%)
| 1 Year | 5 Years | 10 Years |
|---|
| Class P | 17.29% | 10.20% | 8.21% |
| S&P 500 Index | 27.14% | 15.92% | 12.98% |
Performance data represents past performance, which does not guarantee future results.
The graph and table do not reflect the deduction of taxes that a shareholder would pay on Fund distributions or a redemption of Fund shares.
| FUND STATISTICS | |
|---|
| Total Net Assets | $229,345,180 |
| # of Portfolio Holdings | 1,053 |
| Portfolio Turnover Rate | 58% |
| Total Advisory Fees Paid (includes Administration Fees) | $1,092,819 |
What is the Fund’s investment objective?
The Fund seeks total return, consisting of long-term capital appreciation and current income.
Top 5 Equity Holdings (%)
| Apple, Inc. | 4.2% |
| Microsoft Corp. | 4.0 |
| NVIDIA Corp. | 3.8 |
| Alphabet, Inc., Class A | 2.3 |
| Amazon.com, Inc. | 2.2 |
Top 5 Holdings (other than equities) (%)
| Invesco S&P 500 Equal Weight ETF | 2.0% |
| Uniform Mortgage-Backed Security, TBA , 2.000% | 1.7 |
| Uniform Mortgage-Backed Security, TBA , 4.500% | 1.3 |
| iShares Core S&P Mid-Cap ETF | 1.2 |
| Uniform Mortgage-Backed Security, TBA , 5.000% | 1.2 |
If you wish to view additional information about the Fund, including but not limited to financial statements or holdings, please visit http://www.ubs.com/port-info .
| (b) | Copy of each notice transmitted to shareholders in reliance on Rule 30e-3 under the Investment Company Act of 1940, as amended (the "1940 Act"), that contains disclosures specified by paragraph (c)(3) of that rule: Not applicable to the registrant. |
Item 2. Code of Ethics.
The registrant has adopted a code of ethics that applies to its principal executive officer, principal financial officer, principal accounting officer or controller, or persons performing similar functions pursuant to Section 406 of the Sarbanes-Oxley Act of 2002. (The registrant has designated the code of ethics adopted pursuant to Sarbanes-Oxley as a “Code of Conduct” to lessen the risk of confusion with its separate code of ethics adopted pursuant to Rule 17j-1 under the 1940 Act.).
Item 3. Audit Committee Financial Expert.
The registrant’s Board has determined that the following person serving on the registrant’s Audit Committee is an “audit committee financial expert” as defined in item 3 of Form N-CSR: Virginia G. Breen. Ms. Breen is independent as defined in item 3 of Form N-CSR.
Item 4. Principal Accountant Fees and Services.
For the fiscal years ended August 31, 2024 and August 31, 2023, the aggregate Ernst & Young LLP (E&Y) audit fees for professional services rendered to the registrant were approximately $73,107 and $73,107, respectively.
Fees included in the audit fees category are those associated with the annual audits of financial statements and services that are normally provided in connection with statutory and regulatory filings.
In each of the fiscal years ended August 31, 2024 and August 31, 2023, the aggregate audit-related fees billed by EY for services rendered to the registrant that are reasonably related to the performance of the audits of the financial statements, but not reported as audit fees, were approximately $3,056 and $2,910, respectively.
Fees included in the audit-related fees category are those associated with the reading and providing of comments on the 2024 and 2023 semiannual financial statements.
There were no audit-related fees required to be approved pursuant to paragraph (c)(7)(ii) of Rule 2-01 of Regulation S-X during the fiscal years indicated above.
In each of the fiscal years ended August 31, 2024 and August 31, 2023, the aggregate tax fees billed by EY for professional services rendered to the registrant were approximately $14,665 and $13,020, respectively.
Fees included in the tax fees category comprise all services performed by professional staff in the independent accountant’s tax division except those services related to the audits. This category comprises fees for review of tax compliance, tax return preparation and excise tax calculations and assistance with identification of passive foreign investment companies (PFICs).
There were no tax fees required to be approved pursuant to paragraph (c)(7)(ii) of Rule 2-01 of Regulation S-X during the fiscal years indicated above.
In each of the fiscal years ended August 31, 2024 and August 31, 2023, there were no fees billed by EY for products and services, other than the services reported in Item 4(a)-(c) above, rendered to the registrant.
Fees included in the all other fees category would consist of services related to internal control reviews, strategy and other consulting, financial information systems design and implementation, consulting on other information systems, and other tax services unrelated to the registrant.
There were no “all other fees” required to be approved pursuant to paragraph (c)(7)(ii) of Rule 2-01 of Regulation S-X during the fiscal years indicated above.
| (e) | (1) Audit Committee Pre-Approval Policies and Procedures: |
The registrant’s Audit Committee (“audit committee”) has adopted an “Audit Committee Charter (Amended and Restated as of September 14, 2016)” (the “charter”). The charter contains the audit committee’s pre-approval policies and procedures. Reproduced below is an excerpt from the charter regarding pre-approval policies and procedures:
The [audit] Committee shall:
…
| 2. | Pre-approve (a) all audit and permissible non-audit services1 to be provided to the Fund and (b) all permissible non-audit services to be provided by the Fund’s independent auditors to UBS AM and any Covered Service Providers, if the engagement relates directly to the operations and financial reporting of the Fund. In carrying out this responsibility, the Committee shall seek periodically from UBS AM and from the independent auditors a list of such audit and permissible non-audit services that can be expected to be rendered to the Fund, UBS AM or any Covered Service Providers by the Fund’s independent auditors, and an estimate of the fees sought to be paid in connection with such services. The Committee has delegated its responsibility to pre-approve any such audit and permissible non-audit services not exceeding $100,000 (excluding reasonable out-of-pocket expenses) on an annual basis to the Chairperson. All such pre-approvals will be reported to the full Committee on a quarterly basis at the Committee’s next regularly scheduled meeting after the pre-approval. The Committee may not delegate to management its responsibility to pre-approve services to be performed by the independent auditor. Requests or applications to provide services that require specific pre-approval by the Committee or the Chairperson will be submitted by both the Fund’s independent auditors and the Fund’s Treasurer or other designated Fund officer and must include a joint statement as to whether, in their view, the request or application is consistent with SEC rules on auditor independence. From year to year, the Committee shall report to the Board whether this system of pre-approval has been effective and efficient or whether this Charter should be amended to allow for pre-approval pursuant to such policies and procedures as the Committee shall approve, including the delegation of some or all of the Committee’s pre-approval responsibilities to other persons (other than UBS AM or the Fund’s officers). |
1 The Committee will not approve non-audit services that the Committee believes may taint the independence of the auditors. Currently, permissible non-audit services include any professional services (including tax services) that are not prohibited services as described below, provided to the Fund by the independent auditors, other than those provided to the Fund in connection with an audit or a review of the financial statements of the Fund. Permissible non-audit services may not include: (i) bookkeeping or other services related to the accounting records or financial statements of the Fund; (ii) financial information systems design and implementation; (iii) appraisal or valuation services, fairness opinions or contribution-in-kind reports; (iv) actuarial services; (v) internal audit outsourcing services; (vi) management functions or human resources; (vii) broker or dealer, investment adviser or investment banking services; (viii) legal services and expert services unrelated to the audit; and (ix) any other service the Public Company Accounting Oversight Board determines, by regulation, is impermissible.
Pre-approval by the Committee of any permissible non-audit services is not required so long as: (i) the aggregate amount of all such permissible non-audit services provided to the Fund, UBS AM and any service providers controlling, controlled by or under common control with UBS AM that provide ongoing services to the Fund (“Covered Service Providers”) constitutes not more than 5% of the total amount of revenues paid to the independent auditors (during the fiscal year in which the permissible non-audit services are provided) by (a) the Fund, (b) its investment adviser and (c) any entity controlling, controlled by, or under common control with the investment adviser that provides ongoing services to the Fund during the fiscal year in which the services are provided that would have to be approved by the Committee; (ii) the permissible non-audit services were not recognized by the Fund at the time of the engagement to be non-audit services; and (iii) such services are promptly brought to the attention of the Committee and approved by the Committee (or its delegate(s)) prior to the completion of the audit.
(e) (2) Services approved pursuant to paragraph (c)(7)(i)(C) of Rule 2-01 of Regulation S-X:
Audit-Related Fees:
There were no amounts that were approved by the audit committee pursuant to the de minimis exception for the fiscal years ended August 31, 2024 and August 31, 2023 on behalf of the registrant.
There were no amounts that were required to be approved by the audit committee pursuant to the de minimis exception for the fiscal years ended August 31, 2024 and August 31, 2023 on behalf of the registrant’s service providers that relate directly to the operations and financial reporting of the registrant.
Tax Fees:
There were no amounts that were approved by the audit committee pursuant to the de minimis exception for the fiscal years ended August 31, 2024 and August 31, 2023 on behalf of the registrant.
There were no amounts that were required to be approved by the audit committee pursuant to the de minimis exception for the fiscal years ended August 31, 2024 and August 31, 2023 on behalf of the registrant’s service providers that relate directly to the operations and financial reporting of the registrant.
All Other Fees:
There were no amounts that were approved by the audit committee pursuant to the de minimis exception for the fiscal years ended August 31, 2024 and August 31, 2023 on behalf of the registrant.
There were no amounts that were required to be approved by the audit committee pursuant to the de minimis exception for the fiscal years ended August 31, 2024 and August 31, 2023 on behalf of the registrant’s service providers that relate directly to the operations and financial reporting of the registrant.
| (f) | For the fiscal year ended August 31, 2023, if greater than 50%, specify the percentage of hours spent on the audit of the registrant’s financial statements for the most recent fiscal year that were attributed to work performed by persons who are not full-time, permanent employees of E&Y. According to E&Y, such amount was below 50%; therefore, disclosure item not applicable for this filing. |
| (g) | For the fiscal years ended August 31, 2024 and August 31, 2023, the aggregate fees billed by EY of $576,355 and $1,645,887, respectively, for non-audit services rendered on behalf of the registrant (“covered”), its investment adviser (not including any sub-adviser whose role is primarily portfolio management and is subcontracted with or overseen by another investment adviser) and any entity controlling, controlled by, or under common control with the adviser (“non-covered”) that provides ongoing services to the registrant for each of the last two fiscal years of the registrant is shown in the table below: |
| | | 2024 | | | 2023 | |
| | Covered Services | | $ | 17,721 | | | $ | 15,930 | |
| | Non-Covered Services | | $ | 558,634 | | | $ | 1,629,957 | |
| (h) | The registrant’s audit committee was not required to consider whether the provision of non-audit services that were rendered to the registrant’s investment adviser (not including any sub-adviser whose role is primarily portfolio management and is subcontracted with or overseen by another investment adviser), and any entity controlling, controlled by, or under common control with the investment adviser that provides ongoing services to the registrant that were not pre-approved pursuant to paragraph (c)(7)(ii) of Rule 2-01 of Regulation S-X is compatible with maintaining the principal accountant’s independence. |
| (i) | Not applicable to the registrant. |
| (j) | Not applicable to the registrant. |
Item 5. Audit Committee of Listed Registrants.
Not applicable to the registrant.
Item 6. Investments.
| (a) | Included as part of the report to shareholders filed under Item 1 of this form. |
Item 7. Financial Statements and Financial Highlights for Open-End Management Investment Companies.
(a) Copy of the most recent financial statements:

UBS U.S. Allocation Fund
Annual Financial Statements | August 31, 2024
UBS U.S. Allocation Fund
Portfolio of investments—August 31, 2024
| | | Number of
shares | | Value | |
Common stocks—62.3% | |
Aerospace & defense—1.4% | |
Axon Enterprise, Inc.* | | | 53 | | | $ | 19,343 | | |
Boeing Co.* | | | 411 | | | | 71,407 | | |
General Dynamics Corp. | | | 166 | | | | 49,694 | | |
General Electric Co. | | | 4,029 | | | | 703,544 | | |
Howmet Aerospace, Inc. | | | 283 | | | | 27,355 | | |
Huntington Ingalls Industries, Inc. | | | 41 | | | | 11,594 | | |
L3Harris Technologies, Inc. | | | 138 | | | | 32,661 | | |
Lockheed Martin Corp. | | | 152 | | | | 86,351 | | |
Northrop Grumman Corp. | | | 2,330 | | | | 1,219,079 | | |
RTX Corp. | | | 930 | | | | 114,706 | | |
Textron, Inc. | | | 118 | | | | 10,762 | | |
TransDigm Group, Inc. | | | 625 | | | | 858,256 | | |
| | | | | | 3,204,752 | | |
Air freight & logistics—0.1% | |
CH Robinson Worldwide, Inc. | | | 90 | | | | 9,316 | | |
Expeditors International of Washington, Inc. | | | 98 | | | | 12,094 | | |
FedEx Corp. | | | 166 | | | | 49,596 | | |
United Parcel Service, Inc., Class B | | | 519 | | | | 66,717 | | |
| | | | | | 137,723 | | |
Automobile components—0.3% | |
Aptiv PLC* | | | 8,606 | | | | 615,587 | | |
BorgWarner, Inc. | | | 246 | | | | 8,381 | | |
| | | | | | 623,968 | | |
Automobiles—0.5% | |
Ford Motor Co. | | | 3,299 | | | | 36,916 | | |
General Motors Co. | | | 966 | | | | 48,087 | | |
Tesla, Inc.* | | | 4,805 | | | | 1,028,799 | | |
| | | | | | 1,113,802 | | |
Banks—1.8% | |
Bank of America Corp. | | | 7,192 | | | | 293,074 | | |
Citigroup, Inc. | | | 2,006 | | | | 125,656 | | |
Citizens Financial Group, Inc. | | | 520 | | | | 22,386 | | |
Fifth Third Bancorp | | | 703 | | | | 30,011 | | |
Huntington Bancshares, Inc. | | | 1,533 | | | | 22,949 | | |
JPMorgan Chase & Co. | | | 3,028 | | | | 680,695 | | |
KeyCorp | | | 1,000 | | | | 17,060 | | |
M&T Bank Corp. | | | 184 | | | | 31,668 | | |
PNC Financial Services Group, Inc. | | | 433 | | | | 80,144 | | |
Regions Financial Corp. | | | 863 | | | | 20,212 | | |
Truist Financial Corp. | | | 1,409 | | | | 62,644 | | |
U.S. Bancorp | | | 1,658 | | | | 78,307 | | |
Wells Fargo & Co. | | | 44,071 | | | | 2,576,831 | | |
| | | | | | 4,041,637 | | |
Beverages—0.4% | |
Brown-Forman Corp., Class B | | | 92 | | | | 4,194 | | |
Coca-Cola Co. | | | 1,913 | | | | 138,635 | | |
Constellation Brands, Inc., Class A | | | 2,657 | | | | 639,567 | | |
Keurig Dr. Pepper, Inc. | | | 530 | | | | 19,403 | | |
Molson Coors Beverage Co., Class B | | | 42 | | | | 2,267 | | |
Monster Beverage Corp.* | | | 364 | | | | 17,155 | | |
| | | Number of
shares | | Value | |
Common stocks—(continued) | |
Beverages—(concluded) | |
PepsiCo, Inc. | | | 671 | | | $ | 116,003 | | |
| | | | | | 937,224 | | |
Biotechnology—0.4% | |
AbbVie, Inc. | | | 1,731 | | | | 339,813 | | |
ABIOMED, Inc.*,1 | | | 76 | | | | 133 | | |
Amgen, Inc. | | | 531 | | | | 177,264 | | |
Biogen, Inc.* | | | 140 | | | | 28,666 | | |
Gilead Sciences, Inc. | | | 1,199 | | | | 94,721 | | |
Incyte Corp.* | | | 172 | | | | 11,294 | | |
Moderna, Inc.* | | | 331 | | | | 25,619 | | |
Regeneron Pharmaceuticals, Inc.* | | | 103 | | | | 122,023 | | |
Vertex Pharmaceuticals, Inc.* | | | 254 | | | | 125,956 | | |
| | | | | | 925,489 | | |
Broadline retail—2.2% | |
Amazon.com, Inc.* | | | 28,595 | | | | 5,104,207 | | |
eBay, Inc. | | | 420 | | | | 24,822 | | |
Etsy, Inc.* | | | 117 | | | | 6,446 | | |
| | | | | | 5,135,475 | | |
Building products—0.4% | |
A.O. Smith Corp. | | | 72 | | | | 6,028 | | |
Allegion PLC | | | 75 | | | | 10,413 | | |
Builders FirstSource, Inc.* | | | 79 | | | | 13,746 | | |
Carrier Global Corp. | | | 572 | | | | 41,630 | | |
Hayward Holdings, Inc.* | | | 51,134 | | | | 758,829 | | |
Johnson Controls International PLC | | | 457 | | | | 33,292 | | |
Masco Corp. | | | 116 | | | | 9,229 | | |
Trane Technologies PLC | | | 162 | | | | 58,589 | | |
| | | | | | 931,756 | | |
Capital markets—2.2% | |
Ameriprise Financial, Inc. | | | 2,689 | | | | 1,208,544 | | |
Bank of New York Mellon Corp. | | | 779 | | | | 53,143 | | |
BlackRock, Inc. | | | 1,641 | | | | 1,479,870 | | |
Blackstone, Inc. | | | 772 | | | | 109,902 | | |
Cboe Global Markets, Inc. | | | 106 | | | | 21,772 | | |
Charles Schwab Corp. | | | 1,549 | | | | 100,840 | | |
CME Group, Inc. | | | 365 | | | | 78,745 | | |
FactSet Research Systems, Inc. | | | 47 | | | | 19,874 | | |
Franklin Resources, Inc. | | | 399 | | | | 8,076 | | |
Goldman Sachs Group, Inc. | | | 345 | | | | 176,036 | | |
Intercontinental Exchange, Inc. | | | 608 | | | | 98,222 | | |
Invesco Ltd. | | | 599 | | | | 10,237 | | |
KKR & Co., Inc. | | | 702 | | | | 86,887 | | |
MarketAxess Holdings, Inc. | | | 48 | | | | 11,635 | | |
Moody's Corp. | | | 167 | | | | 81,453 | | |
Morgan Stanley | | | 1,309 | | | | 135,626 | | |
MSCI, Inc. | | | 87 | | | | 50,511 | | |
Nasdaq, Inc. | | | 377 | | | | 27,174 | | |
Northern Trust Corp. | | | 221 | | | | 20,157 | | |
Raymond James Financial, Inc. | | | 191 | | | | 22,838 | | |
S&P Global, Inc. | | | 2,177 | | | | 1,117,324 | | |
State Street Corp. | | | 303 | | | | 26,391 | | |
1
UBS U.S. Allocation Fund
Portfolio of investments—August 31, 2024
| | | Number of
shares | | Value | |
Common stocks—(continued) | |
Capital markets—(concluded) | |
T. Rowe Price Group, Inc. | | | 271 | | | $ | 28,737 | | |
| | | | | | 4,973,994 | | |
Chemicals—0.3% | |
CF Industries Holdings, Inc. | | | 7,681 | | | | 638,214 | | |
Commercial services & supplies—0.1% | |
Cintas Corp. | | | 61 | | | | 49,112 | | |
Copart, Inc.* | | | 585 | | | | 30,982 | | |
Republic Services, Inc. | | | 146 | | | | 30,399 | | |
Rollins, Inc. | | | 196 | | | | 9,835 | | |
Veralto Corp. | | | 150 | | | | 16,865 | | |
Waste Management, Inc. | | | 259 | | | | 54,918 | | |
| | | | | | 192,111 | | |
Communications equipment—0.2% | |
Arista Networks, Inc.* | | | 255 | | | | 90,112 | | |
Cisco Systems, Inc. | | | 4,158 | | | | 210,145 | | |
F5, Inc.* | | | 57 | | | | 11,580 | | |
Juniper Networks, Inc. | | | 359 | | | | 13,958 | | |
Motorola Solutions, Inc. | | | 176 | | | | 77,799 | | |
| | | | | | 403,594 | | |
Construction & engineering—0.0%† | |
Quanta Services, Inc. | | | 115 | | | | 31,640 | | |
Construction materials—0.3% | |
Vulcan Materials Co. | | | 2,612 | | | | 640,489 | | |
Consumer finance—0.1% | |
American Express Co. | | | 600 | | | | 155,190 | | |
Capital One Financial Corp. | | | 406 | | | | 59,654 | | |
Discover Financial Services | | | 259 | | | | 35,926 | | |
Synchrony Financial | | | 452 | | | | 22,717 | | |
| | | | | | 273,487 | | |
Consumer staples distribution & retail—1.0% | |
Costco Wholesale Corp. | | | 213 | | | | 190,077 | | |
Dollar General Corp. | | | 112 | | | | 9,293 | | |
Dollar Tree, Inc.* | | | 109 | | | | 9,209 | | |
Kroger Co. | | | 339 | | | | 18,038 | | |
Sysco Corp. | | | 194 | | | | 15,126 | | |
Target Corp. | | | 228 | | | | 35,025 | | |
Walgreens Boots Alliance, Inc. | | | 254 | | | | 2,350 | | |
Walmart, Inc. | | | 26,957 | | | | 2,081,889 | | |
| | | | | | 2,361,007 | | |
Distributors—0.0%† | |
Genuine Parts Co. | | | 130 | | | | 18,624 | | |
LKQ Corp. | | | 176 | | | | 7,320 | | |
Pool Corp. | | | 45 | | | | 15,823 | | |
| | | | | | 41,767 | | |
Diversified telecommunication services—0.2% | |
AT&T, Inc. | | | 8,854 | | | | 176,195 | | |
Verizon Communications, Inc. | | | 5,152 | | | | 215,250 | | |
| | | | | | 391,445 | | |
| | | Number of
shares | | Value | |
Common stocks—(continued) | |
Electric utilities—1.5% | |
Alliant Energy Corp. | | | 468 | | | $ | 27,270 | | |
American Electric Power Co., Inc. | | | 951 | | | | 95,366 | | |
Constellation Energy Corp. | | | 581 | | | | 114,283 | | |
Duke Energy Corp. | | | 1,362 | | | | 155,200 | | |
Edison International | | | 674 | | | | 58,658 | | |
Entergy Corp. | | | 399 | | | | 48,155 | | |
Evergy, Inc. | | | 405 | | | | 23,952 | | |
Eversource Energy | | | 624 | | | | 42,139 | | |
Exelon Corp. | | | 1,804 | | | | 68,714 | | |
FirstEnergy Corp. | | | 910 | | | | 39,967 | | |
NextEra Energy, Inc. | | | 29,989 | | | | 2,414,415 | | |
NRG Energy, Inc. | | | 393 | | | | 33,409 | | |
PG&E Corp. | | | 3,910 | | | | 77,027 | | |
Pinnacle West Capital Corp. | | | 223 | | | | 19,517 | | |
PPL Corp. | | | 1,306 | | | | 41,675 | | |
Southern Co. | | | 1,930 | | | | 166,752 | | |
Xcel Energy, Inc. | | | 983 | | | | 60,189 | | |
| | | | | | 3,486,688 | | |
Electrical equipment—0.9% | |
AMETEK, Inc. | | | 163 | | | | 27,881 | | |
Eaton Corp. PLC | | | 283 | | | | 86,861 | | |
Emerson Electric Co. | | | 401 | | | | 42,261 | | |
GE Vernova, Inc.* | | | 3,448 | | | | 693,048 | | |
Generac Holdings, Inc.* | | | 32 | | | | 5,009 | | |
Hubbell, Inc. | | | 44 | | | | 17,597 | | |
Regal Rexnord Corp. | | | 7,023 | | | | 1,178,530 | | |
Rockwell Automation, Inc. | | | 91 | | | | 24,755 | | |
| | | | | | 2,075,942 | | |
Electronic equipment, instruments & components—0.7% | |
Amphenol Corp., Class A | | | 1,229 | | | | 82,896 | | |
CDW Corp. | | | 134 | | | | 30,236 | | |
Corning, Inc. | | | 790 | | | | 33,062 | | |
Jabil, Inc. | | | 100 | | | | 10,928 | | |
Keysight Technologies, Inc.* | | | 8,289 | | | | 1,277,501 | | |
TE Connectivity Ltd. | | | 304 | | | | 46,694 | | |
Teledyne Technologies, Inc.* | | | 53 | | | | 22,938 | | |
Trimble, Inc.* | | | 242 | | | | 13,719 | | |
Zebra Technologies Corp., Class A* | | | 56 | | | | 19,341 | | |
| | | | | | 1,537,315 | | |
Energy equipment & services—0.2% | |
Baker Hughes Co. | | | 969 | | | | 34,079 | | |
Halliburton Co. | | | 788 | | | | 24,499 | | |
Schlumberger NV | | | 8,323 | | | | 366,129 | | |
| | | | | | 424,707 | | |
Entertainment—2.0% | |
Electronic Arts, Inc. | | | 294 | | | | 44,635 | | |
Liberty Media Corp.-Liberty Formula One,
Class C* | | | 7,600 | | | | 593,180 | | |
Live Nation Entertainment, Inc.* | | | 6,609 | | | | 645,501 | | |
Netflix, Inc.* | | | 531 | | | | 372,417 | | |
Take-Two Interactive Software, Inc.* | | | 10,843 | | | | 1,753,421 | | |
Walt Disney Co. | | | 11,468 | | | | 1,036,478 | | |
2
UBS U.S. Allocation Fund
Portfolio of investments—August 31, 2024
| | | Number of
shares | | Value | |
Common stocks—(continued) | |
Entertainment—(concluded) | |
Warner Bros Discovery, Inc.* | | | 2,683 | | | $ | 21,035 | | |
| | | | | | 4,466,667 | | |
Financial services—4.1% | |
Apollo Global Management, Inc. | | | 7,880 | | | | 911,952 | | |
Berkshire Hathaway, Inc., Class B* | | | 7,617 | | | | 3,625,083 | | |
Corpay, Inc.* | | | 80 | | | | 25,244 | | |
Fidelity National Information Services, Inc. | | | 23,836 | | | | 1,965,278 | | |
Fiserv, Inc.* | | | 631 | | | | 110,173 | | |
Global Payments, Inc. | | | 259 | | | | 28,752 | | |
Jack Henry & Associates, Inc. | | | 99 | | | | 17,130 | | |
Mastercard, Inc., Class A | | | 4,631 | | | | 2,238,347 | | |
PayPal Holdings, Inc.* | | | 1,107 | | | | 80,180 | | |
Visa, Inc., Class A | | | 1,661 | | | | 459,050 | | |
| | | | | | 9,461,189 | | |
Food products—1.1% | |
Archer-Daniels-Midland Co. | | | 275 | | | | 16,772 | | |
Bunge Global SA | | | 9,423 | | | | 955,304 | | |
Campbell Soup Co. | | | 113 | | | | 5,618 | | |
Conagra Brands, Inc. | | | 190 | | | | 5,928 | | |
General Mills, Inc. | | | 296 | | | | 21,398 | | |
Hershey Co. | | | 52 | | | | 10,039 | | |
Hormel Foods Corp. | | | 210 | | | | 6,836 | | |
J.M. Smucker Co. | | | 65 | | | | 7,454 | | |
Kellanova | | | 109 | | | | 8,786 | | |
Kraft Heinz Co. | | | 426 | | | | 15,093 | | |
Lamb Weston Holdings, Inc. | | | 37 | | | | 2,291 | | |
McCormick & Co., Inc. | | | 118 | | | | 9,444 | | |
Mondelez International, Inc., Class A | | | 21,070 | | | | 1,513,037 | | |
Tyson Foods, Inc., Class A | | | 129 | | | | 8,296 | | |
| | | | | | 2,586,296 | | |
Gas utilities—0.0%† | |
Atmos Energy Corp. | | | 293 | | | | 38,307 | | |
Ground transportation—0.6% | |
CSX Corp. | | | 1,320 | | | | 45,236 | | |
JB Hunt Transport Services, Inc. | | | 63 | | | | 10,912 | | |
Lyft, Inc., Class A* | | | 50,257 | | | | 586,499 | | |
Norfolk Southern Corp. | | | 169 | | | | 43,291 | | |
Old Dominion Freight Line, Inc. | | | 132 | | | | 25,449 | | |
Uber Technologies, Inc.* | | | 7,975 | | | | 583,212 | | |
Union Pacific Corp. | | | 418 | | | | 107,046 | | |
| | | | | | 1,401,645 | | |
Health care equipment & supplies—0.8% | |
Abbott Laboratories | | | 1,738 | | | | 196,863 | | |
Align Technology, Inc.* | | | 65 | | | | 15,419 | | |
Baxter International, Inc. | | | 526 | | | | 19,957 | | |
Becton Dickinson & Co. | | | 283 | | | | 68,602 | | |
Boston Scientific Corp.* | | | 1,436 | | | | 117,451 | | |
Cooper Cos., Inc.* | | | 6,909 | | | | 730,489 | | |
Dexcom, Inc.* | | | 395 | | | | 27,389 | | |
Edwards Lifesciences Corp.* | | | 604 | | | | 42,256 | | |
GE HealthCare Technologies, Inc. | | | 417 | | | | 35,370 | | |
Hologic, Inc.* | | | 239 | | | | 19,416 | | |
| | | Number of
shares | | Value | |
Common stocks—(continued) | |
Health care equipment & supplies—(concluded) | |
IDEXX Laboratories, Inc.* | | | 76 | | | $ | 36,581 | | |
Insulet Corp.* | | | 63 | | | | 12,775 | | |
Intuitive Surgical, Inc.* | | | 348 | | | | 171,435 | | |
Medtronic PLC | | | 1,340 | | | | 118,697 | | |
ResMed, Inc. | | | 139 | | | | 34,058 | | |
Solventum Corp.* | | | 140 | | | | 8,975 | | |
STERIS PLC | | | 89 | | | | 21,458 | | |
Stryker Corp. | | | 333 | | | | 120,020 | | |
Teleflex, Inc. | | | 43 | | | | 10,542 | | |
Zimmer Biomet Holdings, Inc. | | | 193 | | | | 22,284 | | |
| | | | | | 1,830,037 | | |
Health care providers & services—1.7% | |
Cardinal Health, Inc. | | | 240 | | | | 27,053 | | |
Cencora, Inc. | | | 163 | | | | 39,050 | | |
Centene Corp.* | | | 520 | | | | 40,992 | | |
Cigna Group | | | 278 | | | | 100,583 | | |
CVS Health Corp. | | | 1,255 | | | | 71,836 | | |
DaVita, Inc.* | | | 40 | | | | 6,037 | | |
Elevance Health, Inc. | | | 225 | | | | 125,300 | | |
HCA Healthcare, Inc. | | | 190 | | | | 75,162 | | |
Henry Schein, Inc.* | | | 104 | | | | 7,337 | | |
Humana, Inc. | | | 117 | | | | 41,473 | | |
Labcorp Holdings, Inc. | | | 78 | | | | 17,931 | | |
McKesson Corp. | | | 125 | | | | 70,135 | | |
Molina Healthcare, Inc.* | | | 56 | | | | 19,588 | | |
Quest Diagnostics, Inc. | | | 120 | | | | 18,836 | | |
UnitedHealth Group, Inc. | | | 5,433 | | | | 3,206,557 | | |
Universal Health Services, Inc., Class B | | | 49 | | | | 11,661 | | |
| | | | | | 3,879,531 | | |
Health care REITs—0.1% | |
Alexandria Real Estate Equities, Inc. | | | 241 | | | | 28,816 | | |
Healthpeak Properties, Inc. | | | 1,202 | | | | 26,781 | | |
Ventas, Inc. | | | 669 | | | | 41,552 | | |
Welltower, Inc. | | | 977 | | | | 117,904 | | |
| | | | | | 215,053 | | |
Hotel & resort REITs—0.0%† | |
Host Hotels & Resorts, Inc. | | | 1,194 | | | | 21,134 | | |
Hotels, restaurants & leisure—1.6% | |
Airbnb, Inc., Class A* | | | 589 | | | | 69,096 | | |
Booking Holdings, Inc. | | | 30 | | | | 117,277 | | |
Caesars Entertainment, Inc.* | | | 217 | | | | 8,168 | | |
Carnival Corp.* | | | 885 | | | | 14,603 | | |
Chipotle Mexican Grill, Inc.* | | | 15,320 | | | | 859,146 | | |
Darden Restaurants, Inc. | | | 110 | | | | 17,396 | | |
Domino's Pizza, Inc. | | | 33 | | | | 13,669 | | |
Expedia Group, Inc.* | | | 105 | | | | 14,604 | | |
Hilton Worldwide Holdings, Inc. | | | 227 | | | | 49,858 | | |
Hyatt Hotels Corp., Class A3 | | | 3,218 | | | | 488,879 | | |
Las Vegas Sands Corp. | | | 15,092 | | | | 588,437 | | |
Marriott International, Inc., Class A | | | 217 | | | | 50,928 | | |
McDonald's Corp. | | | 631 | | | | 182,144 | | |
MGM Resorts International* | | | 273 | | | | 10,262 | | |
3
UBS U.S. Allocation Fund
Portfolio of investments—August 31, 2024
| | | Number of
shares | | Value | |
Common stocks—(continued) | |
Hotels, restaurants & leisure—(concluded) | |
Norwegian Cruise Line Holdings Ltd.* | | | 360 | | | $ | 6,440 | | |
Royal Caribbean Cruises Ltd.* | | | 212 | | | | 34,899 | | |
Starbucks Corp. | | | 11,321 | | | | 1,070,627 | | |
Wynn Resorts Ltd. | | | 75 | | | | 5,766 | | |
Yum! Brands, Inc. | | | 254 | | | | 34,270 | | |
| | | | | | 3,636,469 | | |
Household durables—0.1% | |
DR Horton, Inc. | | | 251 | | | | 47,379 | | |
Garmin Ltd. | | | 149 | | | | 27,310 | | |
Lennar Corp., Class A | | | 203 | | | | 36,958 | | |
Mohawk Industries, Inc.* | | | 38 | | | | 5,895 | | |
NVR, Inc.* | | | 3 | | | | 27,518 | | |
PulteGroup, Inc. | | | 182 | | | | 23,960 | | |
| | | | | | 169,020 | | |
Household products—0.1% | |
Church & Dwight Co., Inc. | | | 90 | | | | 9,169 | | |
Clorox Co. | | | 60 | | | | 9,499 | | |
Colgate-Palmolive Co. | | | 393 | | | | 41,854 | | |
Kimberly-Clark Corp. | | | 142 | | | | 20,542 | | |
Procter & Gamble Co. | | | 1,156 | | | | 198,300 | | |
| | | | | | 279,364 | | |
Independent power and renewable electricity producers—0.2% | |
AES Corp. | | | 22,111 | | | | 378,762 | | |
Vistra Corp. | | | 596 | | | | 50,916 | | |
| | | | | | 429,678 | | |
Industrial conglomerates—0.1% | |
3M Co. | | | 399 | | | | 53,741 | | |
Honeywell International, Inc. | | | 458 | | | | 95,223 | | |
| | | | | | 148,964 | | |
Industrial REITs—0.6% | |
Prologis, Inc. | | | 10,438 | | | | 1,334,185 | | |
Insurance—1.4% | |
Aflac, Inc. | | | 530 | | | | 58,491 | | |
Allstate Corp. | | | 5,988 | | | | 1,131,373 | | |
American International Group, Inc. | | | 689 | | | | 53,087 | | |
Aon PLC, Class A | | | 233 | | | | 80,087 | | |
Arch Capital Group Ltd.* | | | 415 | | | | 46,932 | | |
Arthur J Gallagher & Co. | | | 219 | | | | 64,073 | | |
Assurant, Inc. | | | 67 | | | | 13,155 | | |
Brown & Brown, Inc. | | | 236 | | | | 24,811 | | |
Chubb Ltd. | | | 431 | | | | 122,481 | | |
Cincinnati Financial Corp. | | | 164 | | | | 22,473 | | |
Everest Group Ltd. | | | 49 | | | | 19,220 | | |
Globe Life, Inc. | | | 121 | | | | 12,711 | | |
Hartford Financial Services Group, Inc. | | | 278 | | | | 32,276 | | |
Loews Corp. | | | 238 | | | | 19,502 | | |
Marsh & McLennan Cos., Inc. | | | 4,516 | | | | 1,027,435 | | |
MetLife, Inc. | | | 591 | | | | 45,791 | | |
Principal Financial Group, Inc. | | | 232 | | | | 18,889 | | |
Progressive Corp. | | | 622 | | | | 156,868 | | |
Prudential Financial, Inc. | | | 393 | | | | 47,616 | | |
| | | Number of
shares | | Value | |
Common stocks—(continued) | |
Insurance—(concluded) | |
Travelers Cos., Inc. | | | 241 | | | $ | 54,965 | | |
W.R. Berkley Corp. | | | 314 | | | | 18,746 | | |
Willis Towers Watson PLC | | | 117 | | | | 34,177 | | |
| | | | | | 3,105,159 | | |
Interactive media & services—4.6% | |
Alphabet, Inc., Class A | | | 32,913 | | | | 5,377,326 | | |
Alphabet, Inc., Class C | | | 6,011 | | | | 992,476 | | |
IAC, Inc.* | | | 15,875 | | | | 837,883 | | |
Match Group, Inc.* | | | 278 | | | | 10,344 | | |
Meta Platforms, Inc., Class A | | | 6,493 | | | | 3,384,866 | | |
| | | | | | 10,602,895 | | |
IT services—0.2% | |
Accenture PLC, Class A | | | 644 | | | | 220,216 | | |
Akamai Technologies, Inc.* | | | 149 | | | | 15,174 | | |
Cognizant Technology Solutions Corp., Class A | | | 543 | | | | 42,229 | | |
EPAM Systems, Inc.* | | | 72 | | | | 14,455 | | |
Gartner, Inc.* | | | 80 | | | | 39,357 | | |
GoDaddy, Inc., Class A* | | | 153 | | | | 25,614 | | |
International Business Machines Corp. | | | 940 | | | | 190,002 | | |
VeriSign, Inc.* | | | 78 | | | | 14,344 | | |
| | | | | | 561,391 | | |
Leisure products—0.3% | |
Brunswick Corp. | | | 9,163 | | | | 724,335 | | |
Hasbro, Inc. | | | 116 | | | | 7,907 | | |
| | | | | | 732,242 | | |
Life sciences tools & services—1.3% | |
Agilent Technologies, Inc. | | | 290 | | | | 41,447 | | |
Bio-Rad Laboratories, Inc., Class A* | | | 5,434 | | | | 1,832,997 | | |
Bio-Techne Corp. | | | 142 | | | | 10,507 | | |
Charles River Laboratories International, Inc.* | | | 41 | | | | 8,108 | | |
Danaher Corp. | | | 654 | | | | 176,129 | | |
IQVIA Holdings, Inc.* | | | 2,498 | | | | 628,372 | | |
Mettler-Toledo International, Inc.* | | | 18 | | | | 25,903 | | |
Revvity, Inc. | | | 114 | | | | 13,970 | | |
Thermo Fisher Scientific, Inc. | | | 377 | | | | 231,881 | | |
Waters Corp.* | | | 58 | | | | 20,088 | | |
West Pharmaceutical Services, Inc. | | | 67 | | | | 21,013 | | |
| | | | | | 3,010,415 | | |
Machinery—1.3% | |
Caterpillar, Inc. | | | 348 | | | | 123,923 | | |
Cummins, Inc. | | | 103 | | | | 32,224 | | |
Deere & Co. | | | 189 | | | | 72,905 | | |
Dover Corp. | | | 92 | | | | 17,115 | | |
Fortive Corp. | | | 256 | | | | 19,046 | | |
IDEX Corp. | | | 61 | | | | 12,595 | | |
Illinois Tool Works, Inc. | | | 195 | | | | 49,370 | | |
Ingersoll Rand, Inc. | | | 27,259 | | | | 2,492,836 | | |
Nordson Corp. | | | 42 | | | | 10,776 | | |
Otis Worldwide Corp. | | | 247 | | | | 23,388 | | |
PACCAR, Inc. | | | 367 | | | | 35,298 | | |
4
UBS U.S. Allocation Fund
Portfolio of investments—August 31, 2024
| | | Number of
shares | | Value | |
Common stocks—(continued) | |
Machinery—(concluded) | |
Parker-Hannifin Corp. | | | 97 | | | $ | 58,219 | | |
Pentair PLC | | | 77 | | | | 6,829 | | |
Snap-on, Inc. | | | 38 | | | | 10,782 | | |
Stanley Black & Decker, Inc. | | | 133 | | | | 13,614 | | |
Westinghouse Air Brake Technologies Corp. | | | 130 | | | | 22,044 | | |
Xylem, Inc. | | | 142 | | | | 19,529 | | |
| | | | | | 3,020,493 | | |
Media—0.1% | |
Charter Communications, Inc., Class A* | | | 115 | | | | 39,967 | | |
Comcast Corp., Class A | | | 4,829 | | | | 191,083 | | |
Fox Corp., Class A | | | 277 | | | | 11,459 | | |
Fox Corp., Class B | | | 189 | | | | 7,263 | | |
Interpublic Group of Cos., Inc. | | | 429 | | | | 13,990 | | |
News Corp., Class A | | | 398 | | | | 11,275 | | |
News Corp., Class B | | | 99 | | | | 2,914 | | |
Omnicom Group, Inc. | | | 248 | | | | 24,907 | | |
Paramount Global, Class B | | | 493 | | | | 5,162 | | |
| | | | | | 308,020 | | |
Multi-utilities—0.2% | |
Ameren Corp. | | | 498 | | | | 41,090 | | |
CenterPoint Energy, Inc. | | | 1,229 | | | | 33,552 | | |
CMS Energy Corp. | | | 534 | | | | 36,237 | | |
Consolidated Edison, Inc. | | | 592 | | | | 60,123 | | |
Dominion Energy, Inc. | | | 1,523 | | | | 85,136 | | |
DTE Energy Co. | | | 387 | | | | 48,383 | | |
NiSource, Inc. | | | 846 | | | | 27,969 | | |
Public Service Enterprise Group, Inc. | | | 844 | | | | 68,153 | | |
Sempra | | | 1,144 | | | | 94,014 | | |
WEC Energy Group, Inc. | | | 556 | | | | 51,724 | | |
| | | | | | 546,381 | | |
Office REITs—0.0%† | |
BXP, Inc. | | | 226 | | | | 17,000 | | |
Oil, gas & consumable fuels—2.7% | |
APA Corp. | | | 26,104 | | | | 743,703 | | |
Chevron Corp. | | | 1,677 | | | | 248,112 | | |
ConocoPhillips | | | 1,164 | | | | 132,452 | | |
Coterra Energy, Inc. | | | 648 | | | | 15,766 | | |
Devon Energy Corp. | | | 24,424 | | | | 1,093,707 | | |
Diamondback Energy, Inc. | | | 175 | | | | 34,144 | | |
EOG Resources, Inc. | | | 550 | | | | 70,851 | | |
EQT Corp. | | | 567 | | | | 19,000 | | |
Exxon Mobil Corp. | | | 7,772 | | | | 916,630 | | |
Hess Corp. | | | 273 | | | | 37,690 | | |
Kinder Morgan, Inc. | | | 1,832 | | | | 39,516 | | |
Marathon Oil Corp. | | | 603 | | | | 17,276 | | |
Marathon Petroleum Corp. | | | 356 | | | | 63,055 | | |
Occidental Petroleum Corp. | | | 628 | | | | 35,783 | | |
ONEOK, Inc. | | | 576 | | | | 53,199 | | |
Phillips 66 | | | 401 | | | | 56,264 | | |
Targa Resources Corp. | | | 212 | | | | 31,143 | | |
Valero Energy Corp. | | | 331 | | | | 48,568 | | |
| | | Number of
shares | | Value | |
Common stocks—(continued) | |
Oil, gas & consumable fuels—(concluded) | |
Williams Cos., Inc. | | | 54,467 | | | $ | 2,492,955 | | |
| | | | | | 6,149,814 | | |
Passenger airlines—0.0%† | |
American Airlines Group, Inc.* | | | 301 | | | | 3,197 | | |
Delta Air Lines, Inc. | | | 448 | | | | 19,035 | | |
Southwest Airlines Co.3 | | | 342 | | | | 9,891 | | |
United Airlines Holdings, Inc.* | | | 238 | | | | 10,481 | | |
| | | | | | 42,604 | | |
Personal care products—0.0%† | |
Estee Lauder Cos., Inc., Class A | | | 112 | | | | 10,266 | | |
Kenvue, Inc. | | | 939 | | | | 20,611 | | |
| | | | | | 30,877 | | |
Pharmaceuticals—2.4% | |
Bristol-Myers Squibb Co. | | | 38,120 | | | | 1,904,094 | | |
Catalent, Inc.* | | | 182 | | | | 11,095 | | |
Eli Lilly & Co. | | | 2,723 | | | | 2,614,134 | | |
Johnson & Johnson | | | 2,369 | | | | 392,922 | | |
Merck & Co., Inc. | | | 2,475 | | | | 293,164 | | |
Pfizer, Inc. | | | 5,483 | | | | 159,062 | | |
Viatris, Inc. | | | 1,179 | | | | 14,242 | | |
Zoetis, Inc. | | | 446 | | | | 81,837 | | |
| | | | | | 5,470,550 | | |
Professional services—0.1% | |
Automatic Data Processing, Inc. | | | 292 | | | | 80,566 | | |
Broadridge Financial Solutions, Inc. | | | 95 | | | | 20,222 | | |
Dayforce, Inc.*,3 | | | 93 | | | | 5,317 | | |
Equifax, Inc. | | | 94 | | | | 28,870 | | |
Jacobs Solutions, Inc. | | | 82 | | | | 12,372 | | |
Leidos Holdings, Inc. | | | 101 | | | | 16,009 | | |
Paychex, Inc. | | | 224 | | | | 29,389 | | |
Paycom Software, Inc. | | | 37 | | | | 6,023 | | |
Verisk Analytics, Inc. | | | 108 | | | | 29,464 | | |
| | | | | | 228,232 | | |
Real estate management & development—0.1% | |
CBRE Group, Inc., Class A* | | | 485 | | | | 55,843 | | |
CoStar Group, Inc.* | | | 645 | | | | 49,858 | | |
| | | | | | 105,701 | | |
Residential REITs—0.1% | |
AvalonBay Communities, Inc. | | | 211 | | | | 47,629 | | |
Camden Property Trust | | | 156 | | | | 19,531 | | |
Equity Residential | | | 572 | | | | 42,832 | | |
Essex Property Trust, Inc. | | | 89 | | | | 26,859 | | |
Invitation Homes, Inc. | | | 967 | | | | 35,624 | | |
Mid-America Apartment Communities, Inc. | | | 170 | | | | 27,603 | | |
UDR, Inc. | | | 512 | | | | 22,789 | | |
| | | | | | 222,867 | | |
5
UBS U.S. Allocation Fund
Portfolio of investments—August 31, 2024
| | | Number of
shares | | Value | |
Common stocks—(continued) | |
Retail REITs—0.1% | |
Federal Realty Investment Trust | | | 109 | | | $ | 12,535 | | |
Kimco Realty Corp. | | | 1,133 | | | | 26,354 | | |
Realty Income Corp. | | | 1,388 | | | | 86,209 | | |
Regency Centers Corp. | | | 260 | | | | 18,899 | | |
Simon Property Group, Inc. | | | 518 | | | | 86,687 | | |
| | | | | | 230,684 | | |
Semiconductors & semiconductor equipment—6.8% | |
Advanced Micro Devices, Inc.* | | | 5,324 | | | | 790,933 | | |
Analog Devices, Inc. | | | 503 | | | | 118,124 | | |
Applied Materials, Inc. | | | 860 | | | | 169,644 | | |
Broadcom, Inc. | | | 17,171 | | | | 2,795,782 | | |
Enphase Energy, Inc.* | | | 127 | | | | 15,372 | | |
First Solar, Inc.* | | | 107 | | | | 24,329 | | |
Intel Corp. | | | 27,922 | | | | 615,401 | | |
KLA Corp. | | | 141 | | | | 115,540 | | |
Lam Research Corp. | | | 137 | | | | 112,478 | | |
Marvell Technology, Inc. | | | 7,407 | | | | 564,710 | | |
Microchip Technology, Inc. | | | 592 | | | | 48,639 | | |
Micron Technology, Inc. | | | 10,062 | | | | 968,367 | | |
Monolithic Power Systems, Inc. | | | 48 | | | | 44,865 | | |
NVIDIA Corp. | | | 72,632 | | | | 8,670,082 | | |
NXP Semiconductors NV | | | 256 | | | | 65,628 | | |
ON Semiconductor Corp.* | | | 456 | | | | 35,509 | | |
Qorvo, Inc.* | | | 104 | | | | 12,052 | | |
QUALCOMM, Inc. | | | 1,171 | | | | 205,276 | | |
Skyworks Solutions, Inc. | | | 146 | | | | 16,000 | | |
Teradyne, Inc. | | | 162 | | | | 22,150 | | |
Texas Instruments, Inc. | | | 941 | | | | 201,694 | | |
| | | | | | 15,612,575 | | |
Software—6.4% | |
Adobe, Inc.* | | | 461 | | | | 264,803 | | |
ANSYS, Inc.* | | | 87 | | | | 27,964 | | |
Autodesk, Inc.* | | | 214 | | | | 55,298 | | |
Cadence Design Systems, Inc.* | | | 271 | | | | 72,880 | | |
Crowdstrike Holdings, Inc., Class A* | | | 2,236 | | | | 619,998 | | |
Dynatrace, Inc.* | | | 15,865 | | | | 803,086 | | |
Fair Isaac Corp.* | | | 24 | | | | 41,526 | | |
Fortinet, Inc.* | | | 652 | | | | 50,015 | | |
Gen Digital, Inc. | | | 625 | | | | 16,538 | | |
HubSpot, Inc.* | | | 1,439 | | | | 718,162 | | |
Intuit, Inc. | | | 285 | | | | 179,624 | | |
Microsoft Corp. | | | 22,146 | | | | 9,237,982 | | |
Oracle Corp. | | | 8,534 | | | | 1,205,769 | | |
Palo Alto Networks, Inc.* | | | 338 | | | | 122,599 | | |
PTC, Inc.* | | | 119 | | | | 21,312 | | |
Roper Technologies, Inc. | | | 109 | | | | 60,431 | | |
Salesforce, Inc. | | | 1,017 | | | | 257,199 | | |
ServiceNow, Inc.* | | | 209 | | | | 178,695 | | |
Synopsys, Inc.* | | | 159 | | | | 82,613 | | |
Tyler Technologies, Inc.* | | | 42 | | | | 24,691 | | |
Zoom Video Communications, Inc., Class A* | | | 9,454 | | | | 653,082 | | |
| | | | | | 14,694,267 | | |
| | | Number of
shares | | Value | |
Common stocks—(continued) | |
Specialized REITs—0.3% | |
American Tower Corp. | | | 765 | | | $ | 171,406 | | |
Crown Castle, Inc. | | | 717 | | | | 80,318 | | |
Digital Realty Trust, Inc. | | | 527 | | | | 79,899 | | |
Equinix, Inc. | | | 151 | | | | 125,988 | | |
Extra Space Storage, Inc. | | | 337 | | | | 59,649 | | |
Iron Mountain, Inc. | | | 473 | | | | 53,572 | | |
Public Storage | | | 253 | | | | 86,961 | | |
SBA Communications Corp. | | | 172 | | | | 38,986 | | |
VICI Properties, Inc. | | | 1,753 | | | | 58,690 | | |
Weyerhaeuser Co. | | | 1,231 | | | | 37,533 | | |
| | | | | | 793,002 | | |
Specialty retail—0.3% | |
AutoZone, Inc.* | | | 16 | | | | 50,904 | | |
Bath & Body Works, Inc. | | | 221 | | | | 6,798 | | |
Best Buy Co., Inc. | | | 177 | | | | 17,771 | | |
CarMax, Inc.* | | | 134 | | | | 11,330 | | |
Home Depot, Inc. | | | 868 | | | | 319,858 | | |
Lowe's Cos., Inc. | | | 494 | | | | 122,759 | | |
O'Reilly Automotive, Inc.* | | | 53 | | | | 59,888 | | |
Ross Stores, Inc. | | | 286 | | | | 43,074 | | |
TJX Cos., Inc. | | | 957 | | | | 112,227 | | |
Tractor Supply Co. | | | 105 | | | | 28,093 | | |
Ulta Beauty, Inc.* | | | 43 | | | | 15,172 | | |
| | | | | | 787,874 | | |
Technology hardware, storage & peripherals—4.3% | |
Apple, Inc. | | | 42,107 | | | | 9,642,503 | | |
Hewlett Packard Enterprise Co. | | | 1,291 | | | | 25,007 | | |
HP, Inc. | | | 828 | | | | 29,957 | | |
NetApp, Inc. | | | 222 | | | | 26,800 | | |
Seagate Technology Holdings PLC | | | 204 | | | | 20,308 | | |
Super Micro Computer, Inc.*,3 | | | 55 | | | | 24,073 | | |
Western Digital Corp.* | | | 320 | | | | 20,989 | | |
| | | | | | 9,789,637 | | |
Textiles, apparel & luxury goods—0.4% | |
Deckers Outdoor Corp.* | | | 25 | | | | 23,982 | | |
Lululemon Athletica, Inc.* | | | 94 | | | | 24,390 | | |
NIKE, Inc., Class B | | | 9,609 | | | | 800,622 | | |
Ralph Lauren Corp. | | | 50 | | | | 8,563 | | |
Tapestry, Inc. | | | 196 | | | | 8,030 | | |
| | | | | | 865,587 | | |
Tobacco—0.1% | |
Altria Group, Inc. | | | 831 | | | | 44,683 | | |
Philip Morris International, Inc. | | | 763 | | | | 94,070 | | |
| | | | | | 138,753 | | |
Trading companies & distributors—0.0%† | |
Fastenal Co. | | | 356 | | | | 24,308 | | |
United Rentals, Inc. | | | 51 | | | | 37,804 | | |
WW Grainger, Inc. | | | 35 | | | | 34,472 | | |
| | | | | | 96,584 | | |
6
UBS U.S. Allocation Fund
Portfolio of investments—August 31, 2024
| | | Number of
shares | | Value | |
Common stocks—(concluded) | |
Water utilities—0.0%† | |
American Water Works Co., Inc. | | | 362 | | | $ | 51,809 | | |
Wireless telecommunication services—0.5% | |
T-Mobile U.S., Inc. | | | 6,263 | | | | 1,244,583 | | |
Total common stocks
(cost—$111,722,905) | | | 142,881,761 | | |
Preferred stocks—0.0%† | |
Financial services—0.0%† | |
SquareTwo Financial Corp.*,1,2
(cost—$0) | | | 35,000 | | | | 0 | | |
Exchange traded funds—3.3% | |
Invesco S&P 500 Equal Weight ETF | | | 26,621 | | | | 4,681,835 | | |
iShares Core S&P Mid-Cap ETF | | | 46,294 | | | | 2,865,136 | | |
Total exchange traded funds
(cost—$6,897,090) | | | 7,546,971 | | |
| | | Face
amount | | | |
Asset-backed securities—6.4% | |
AmeriCredit Automobile Receivables Trust,
Series 2020-2, Class C,
1.480%, due 02/18/26 | | $ | 61,322 | | | | 61,119 | | |
Series 2022-1, Class A3,
2.450%, due 11/18/26 | | | 266,466 | | | | 263,857 | | |
ARES XLVIII CLO Ltd.,
Series 2018-48A, Class C,
3 mo. USD Term SOFR + 2.062%
7.344%, due 07/20/304,5 | | | 725,000 | | | | 726,541 | | |
BMW Vehicle Lease Trust,
Series 2024-1, Class A3,
4.980%, due 03/25/27 | | | 200,000 | | | | 201,087 | | |
Capital One Multi-Asset Execution Trust,
Series 2005-B3, Class B3,
3 mo. USD Term SOFR + 0.812%
6.113%, due 05/15/285 | | | 350,000 | | | | 349,585 | | |
CCG Receivables Trust,
Series 2024-1, Class A2,
4.990%, due 03/15/324 | | | 475,000 | | | | 475,550 | | |
Dell Equipment Finance Trust,
Series 2024-1, Class D,
6.120%, due 09/23/304 | | | 150,000 | | | | 153,378 | | |
Series 2023-3, Class D,
6.750%, due 10/22/294 | | | 650,000 | | | | 669,675 | | |
DLLMT LLC,
Series 2024-1A, Class A3,
4.840%, due 08/21/284 | | | 475,000 | | | | 476,207 | | |
Drive Auto Receivables Trust,
Series 2021-1, Class D,
1.450%, due 01/16/29 | | | 352,597 | | | | 345,490 | | |
Series 2024-1, Class A3,
5.350%, due 02/15/28 | | | 200,000 | | | | 200,758 | | |
DT Auto Owner Trust,
Series 2021-1A, Class D,
1.160%, due 11/16/264 | | | 295,731 | | | | 290,491 | | |
| | | Face
amount | | Value | |
Asset-backed securities—(continued) | |
Enterprise Fleet Financing LLC,
Series 2023-2, Class A2,
5.560%, due 04/22/304 | | $ | 544,191 | | | $ | 547,460 | | |
Series 2024-2, Class A2,
5.740%, due 12/20/264 | | | 150,000 | | | | 151,396 | | |
Exeter Automobile Receivables Trust,
Series 2024-4A, Class C,
5.480%, due 08/15/30 | | | 150,000 | | | | 151,522 | | |
Series 2024-3A, Class B,
5.570%, due 09/15/28 | | | 475,000 | | | | 481,042 | | |
Series 2023-4A, Class A2,
6.070%, due 12/15/25 | | | 35,917 | | | | 35,919 | | |
GM Financial Automobile Leasing Trust,
Series 2023-1, Class B,
5.510%, due 01/20/27 | | | 475,000 | | | | 477,423 | | |
HPEFS Equipment Trust,
Series 2022-1A, Class B,
1.790%, due 05/21/294 | | | 220,819 | | | | 220,357 | | |
Series 2024-1A, Class D,
5.820%, due 11/20/314 | | | 500,000 | | | | 509,123 | | |
Series 2024-2A, Class D,
5.820%, due 04/20/324 | | | 475,000 | | | | 484,996 | | |
Hyundai Auto Lease Securitization Trust,
Series 2024-B, Class B,
5.560%, due 08/15/284 | | | 475,000 | | | | 483,247 | | |
Hyundai Auto Receivables Trust,
Series 2024-A, Class C,
5.270%, due 07/15/31 | | | 475,000 | | | | 484,632 | | |
OneMain Financial Issuance Trust,
Series 2021-1A, Class A1,
1.550%, due 06/16/364 | | | 600,000 | | | | 558,252 | | |
Series 2020-2A, Class A,
1.750%, due 09/14/354 | | | 600,000 | | | | 570,912 | | |
Series 2020-2A, Class B,
2.210%, due 09/14/354 | | | 300,000 | | | | 278,766 | | |
Santander Drive Auto Receivables Trust,
Series 2020-4, Class D,
1.480%, due 01/15/27 | | | 82,999 | | | | 82,297 | | |
Series 2022-5, Class C,
4.740%, due 10/16/28 | | | 475,000 | | | | 473,125 | | |
Series 2024-4, Class C,
4.950%, due 04/15/30 | | | 300,000 | | | | 300,341 | | |
Series 2023-2, Class A3,
5.210%, due 07/15/27 | | | 437,251 | | | | 436,949 | | |
Series 2023-3, Class A3,
5.610%, due 10/15/27 | | | 600,000 | | | | 601,365 | | |
Series 2024-3, Class C,
5.640%, due 08/15/30 | | | 475,000 | | | | 485,451 | | |
Series 2023-3, Class A2,
6.080%, due 08/17/26 | | | 217,160 | | | | 217,286 | | |
Series 2023-6, Class A2,
6.080%, due 05/17/27 | | | 259,846 | | | | 260,404 | | |
Series 2023-4, Class A2,
6.180%, due 02/16/27 | | | 395,346 | | | | 396,040 | | |
SCF Equipment Leasing LLC,
Series 2022-2A, Class A3,
6.500%, due 10/21/304 | | | 500,000 | | | | 505,907 | | |
7
UBS U.S. Allocation Fund
Portfolio of investments—August 31, 2024
| | | Face
amount | | Value | |
Asset-backed securities—(concluded) | |
SFS Auto Receivables Securitization Trust,
Series 2024-1A, Class A2,
5.350%, due 06/21/274 | | $ | 402,414 | | | $ | 402,466 | | |
Synchrony Card Funding LLC,
Series 2024-A1, Class A,
5.040%, due 03/15/30 | | | 475,000 | | | | 481,776 | | |
Westlake Automobile Receivables Trust,
Series 2020-3A, Class D,
1.650%, due 02/17/264 | | | 100,537 | | | | 100,371 | | |
World Financial Network Credit Card
Master Note Trust,
Series 2024-B, Class A,
4.620%, due 05/15/31 | | | 250,000 | | | | 250,293 | | |
Total asset-backed securities
(cost—$14,631,726) | | | 14,642,856 | | |
Corporate bonds—13.5% | |
Advertising—0.0%† | |
Clear Channel Outdoor Holdings, Inc.
5.125%, due 08/15/274 | | | 35,000 | | | | 34,192 | | |
7.875%, due 04/01/304 | | | 20,000 | | | | 20,897 | | |
| | | | | | 55,089 | | |
Aerospace & defense—0.1% | |
AAR Escrow Issuer LLC,
6.750%, due 03/15/294 | | | 40,000 | | | | 41,406 | | |
Bombardier, Inc.
7.000%, due 06/01/324 | | | 40,000 | | | | 41,640 | | |
7.250%, due 07/01/314 | | | 10,000 | | | | 10,497 | | |
7.875%, due 04/15/274 | | | 30,000 | | | | 30,102 | | |
8.750%, due 11/15/304 | | | 40,000 | | | | 43,620 | | |
TransDigm, Inc.
6.375%, due 03/01/294 | | | 25,000 | | | | 25,764 | | |
6.625%, due 03/01/324 | | | 28,000 | | | | 29,119 | | |
7.125%, due 12/01/314 | | | 10,000 | | | | 10,560 | | |
| | | | | | 232,708 | | |
Agriculture—0.0%† | |
Reynolds American, Inc.,
5.700%, due 08/15/35 | | | 70,000 | | | | 71,673 | | |
Airlines—0.2% | |
Allegiant Travel Co.,
7.250%, due 08/15/274 | | | 15,000 | | | | 14,241 | | |
American Airlines, Inc.,
7.250%, due 02/15/284 | | | 25,000 | | | | 25,156 | | |
American Airlines, Inc./AAdvantage Loyalty IP Ltd.
5.500%, due 04/20/264 | | | 9,334 | | | | 9,285 | | |
5.750%, due 04/20/294 | | | 15,000 | | | | 14,703 | | |
Delta Air Lines Pass-Through Trust,
Series 2020-1,Class AA
2.000%, due 06/10/28 | | | 83,691 | | | | 77,805 | | |
JetBlue Airways Corp./JetBlue Loyalty LP,
9.875%, due 09/20/314 | | | 25,000 | | | | 24,709 | | |
Mileage Plus Holdings LLC/Mileage Plus
Intellectual Property Assets Ltd.,
6.500%, due 06/20/274 | | | 270,000 | | | | 272,506 | | |
| | | Face
amount | | Value | |
Corporate bonds—(continued) | |
Airlines—(concluded) | |
United Airlines, Inc.
4.375%, due 04/15/264 | | $ | 38,000 | | | $ | 37,083 | | |
4.625%, due 04/15/294 | | | 30,000 | | | | 28,557 | | |
VistaJet Malta Finance PLC/Vista
Management Holding, Inc.,
9.500%, due 06/01/284 | | | 40,000 | | | | 37,407 | | |
| | | | | | 541,452 | | |
Auto manufacturers—0.2% | |
Ford Motor Co.
7.450%, due 07/16/31 | | | 55,000 | | | | 60,526 | | |
9.625%, due 04/22/30 | | | 30,000 | | | | 35,608 | | |
Ford Motor Credit Co. LLC,
4.542%, due 08/01/26 | | | 200,000 | | | | 197,736 | | |
General Motors Co.,
6.600%, due 04/01/36 | | | 200,000 | | | | 216,526 | | |
| | | | | | 510,396 | | |
Auto parts & equipment—0.1% | |
American Axle & Manufacturing, Inc.,
6.500%, due 04/01/27 | | | 25,000 | | | | 25,129 | | |
Dana, Inc.
4.250%, due 09/01/30 | | | 20,000 | | | | 18,012 | | |
5.625%, due 06/15/28 | | | 20,000 | | | | 19,712 | | |
Goodyear Tire & Rubber Co.,
5.250%, due 07/15/31 | | | 86,000 | | | | 78,000 | | |
Phinia, Inc.,
6.750%, due 04/15/294 | | | 30,000 | | | | 30,785 | | |
| | | | | | 171,638 | | |
Banks—2.2% | |
Bank of America Corp.
(fixed, converts to FRN on 03/20/50)
4.083%, due 03/20/515 | | | 75,000 | | | | 63,121 | | |
6.110%, due 01/29/37 | | | 450,000 | | | | 488,796 | | |
Series X,
(fixed, converts to FRN on 09/05/24)
6.250%, due 09/05/245,6 | | | 60,000 | | | | 59,920 | | |
Series Z,
(fixed, converts to FRN on 10/23/24)
6.500%, due 10/23/245,6 | | | 30,000 | | | | 29,981 | | |
Bank of Nova Scotia,
(fixed, converts to FRN on 05/04/32)
4.588%, due 05/04/375 | | | 100,000 | | | | 93,776 | | |
Barclays Bank PLC,
3 mo. EURIBOR + 0.710%
4.429%, due 12/15/245,6,7 | | | 60,000 | | | | 63,339 | | |
Barclays PLC,
(fixed, converts to FRN on 08/09/32)
5.746%, due 08/09/335 | | | 400,000 | | | | 413,659 | | |
Citigroup, Inc.
(fixed, converts to FRN on 03/20/29)
3.980%, due 03/20/305 | | | 175,000 | | | | 169,904 | | |
5.500%, due 09/13/25 | | | 175,000 | | | | 175,893 | | |
6.675%, due 09/13/43 | | | 200,000 | | | | 228,750 | | |
8
UBS U.S. Allocation Fund
Portfolio of investments—August 31, 2024
| | | Face
amount | | Value | |
Corporate bonds—(continued) | |
Banks—(concluded) | |
Deutsche Bank AG,
(fixed, converts to FRN on 01/07/27)
2.552%, due 01/07/285 | | $ | 150,000 | | | $ | 141,845 | | |
Freedom Mortgage Corp.,
12.000%, due 10/01/284 | | | 55,000 | | | | 59,874 | | |
Goldman Sachs Group, Inc.
3.750%, due 02/25/26 | | | 150,000 | | | | 148,284 | | |
5.150%, due 05/22/45 | | | 110,000 | | | | 108,096 | | |
HSBC Holdings PLC,
6.500%, due 09/15/37 | | | 200,000 | | | | 216,382 | | |
JPMorgan Chase & Co.
3.875%, due 09/10/24 | | | 300,000 | | | | 299,887 | | |
(fixed, converts to FRN on 07/24/47)
4.032%, due 07/24/485 | | | 400,000 | | | | 339,515 | | |
Lloyds Banking Group PLC,
4.582%, due 12/10/25 | | | 400,000 | | | | 396,940 | | |
Mitsubishi UFJ Financial Group, Inc.,
3.677%, due 02/22/27 | | | 350,000 | | | | 343,855 | | |
Morgan Stanley
4.300%, due 01/27/45 | | | 200,000 | | | | 179,406 | | |
4.350%, due 09/08/26 | | | 590,000 | | | | 586,888 | | |
(fixed, converts to FRN on 02/07/34)
5.942%, due 02/07/395 | | | 100,000 | | | | 103,218 | | |
Royal Bank of Canada,
2.300%, due 11/03/31 | | | 100,000 | | | | 86,293 | | |
Societe Generale SA,
4.000%, due 01/12/274 | | | 200,000 | | | | 195,476 | | |
Sumitomo Mitsui Financial Group, Inc.,
3.544%, due 01/17/28 | | | 150,000 | | | | 145,290 | | |
| | | | | | 5,138,388 | | |
Beverages—0.1% | |
Anheuser-Busch Cos. LLC/Anheuser-Busch
InBev Worldwide, Inc.
4.700%, due 02/01/36 | | | 75,000 | | | | 74,077 | | |
4.900%, due 02/01/46 | | | 130,000 | | | | 124,811 | | |
| | | | | | 198,888 | | |
Biotechnology—0.2% | |
Amgen, Inc.,
5.250%, due 03/02/33 | | | 150,000 | | | | 154,151 | | |
Gilead Sciences, Inc.
2.950%, due 03/01/27 | | | 200,000 | | | | 193,661 | | |
4.750%, due 03/01/46 | | | 50,000 | | | | 46,323 | | |
| | | | | | 394,135 | | |
Building Materials—0.2% | |
Builders FirstSource, Inc.
4.250%, due 02/01/324 | | | 10,000 | | | | 9,137 | | |
5.000%, due 03/01/304 | | | 30,000 | | | | 29,163 | | |
6.375%, due 06/15/324 | | | 10,000 | | | | 10,299 | | |
Carrier Global Corp.,
6.200%, due 03/15/54 | | | 100,000 | | | | 113,384 | | |
Knife River Corp.,
7.750%, due 05/01/314 | | | 30,000 | | | | 31,761 | | |
Masco Corp.,
4.500%, due 05/15/47 | | | 100,000 | | | | 86,161 | | |
| | | Face
amount | | Value | |
Corporate bonds—(continued) | |
Building Materials—(concluded) | |
Smyrna Ready Mix Concrete LLC
6.000%, due 11/01/284 | | $ | 51,000 | | | $ | 50,897 | | |
8.875%, due 11/15/314 | | | 30,000 | | | | 32,202 | | |
Summit Materials LLC/Summit Materials
Finance Corp.,
5.250%, due 01/15/294 | | | 15,000 | | | | 14,848 | | |
| | | | | | 377,852 | | |
Chemicals—0.4% | |
Celanese U.S. Holdings LLC,
6.379%, due 07/15/32 | | | 150,000 | | | | 158,556 | | |
CF Industries, Inc.,
5.150%, due 03/15/34 | | | 100,000 | | | | 99,708 | | |
Chemours Co.,
4.625%, due 11/15/294 | | | 45,000 | | | | 39,587 | | |
LYB International Finance II BV,
3.500%, due 03/02/27 | | | 150,000 | | | | 146,295 | | |
LYB International Finance III LLC,
3.625%, due 04/01/51 | | | 100,000 | | | | 72,027 | | |
NOVA Chemicals Corp.
5.250%, due 06/01/274 | | | 39,000 | | | | 38,498 | | |
8.500%, due 11/15/284 | | | 11,000 | | | | 11,727 | | |
9.000%, due 02/15/304 | | | 20,000 | | | | 21,483 | | |
Olympus Water U.S. Holding Corp.,
9.625%, due 11/15/287 | | | 100,000 | | | | 118,486 | | |
Tronox, Inc.,
4.625%, due 03/15/294 | | | 40,000 | | | | 36,453 | | |
WR Grace Holdings LLC,
5.625%, due 08/15/294 | | | 50,000 | | | | 46,362 | | |
| | | | | | 789,182 | | |
Commercial services—0.3% | |
ADT Security Corp.,
4.875%, due 07/15/324 | | | 61,000 | | | | 57,986 | | |
Block, Inc.,
6.500%, due 05/15/324 | | | 22,000 | | | | 22,814 | | |
Brink's Co.,
6.500%, due 06/15/294 | | | 30,000 | | | | 31,042 | | |
Carriage Services, Inc.,
4.250%, due 05/15/294 | | | 30,000 | | | | 27,700 | | |
Garda World Security Corp.,
9.500%, due 11/01/274 | | | 53,000 | | | | 53,304 | | |
Herc Holdings, Inc.,
6.625%, due 06/15/294 | | | 22,000 | | | | 22,628 | | |
Neptune Bidco U.S., Inc.,
9.290%, due 04/15/294 | | | 85,000 | | | | 84,861 | | |
NESCO Holdings II, Inc.,
5.500%, due 04/15/294 | | | 68,000 | | | | 62,785 | | |
Prime Security Services Borrower LLC/Prime
Finance, Inc.
5.750%, due 04/15/264 | | | 20,000 | | | | 20,038 | | |
6.250%, due 01/15/284 | | | 30,000 | | | | 29,885 | | |
Quanta Services, Inc.,
2.350%, due 01/15/32 | | | 200,000 | | | | 168,489 | | |
Sabre GLBL, Inc.,
11.250%, due 12/15/274 | | | 45,000 | | | | 45,580 | | |
9
UBS U.S. Allocation Fund
Portfolio of investments—August 31, 2024
| | | Face
amount | | Value | |
Corporate bonds—(continued) | |
Commercial services—(concluded) | |
Shift4 Payments LLC/Shift4 Payments
Finance Sub, Inc.,
6.750%, due 08/15/324 | | $ | 25,000 | | | $ | 25,792 | | |
United Rentals North America, Inc.,
6.125%, due 03/15/344 | | | 40,000 | | | | 40,859 | | |
Wand NewCo 3, Inc.,
7.625%, due 01/30/324 | | | 30,000 | | | | 31,429 | | |
| | | | | | 725,192 | | |
Computers—0.4% | |
Ahead DB Holdings LLC,
6.625%, due 05/01/284 | | | 30,000 | | | | 28,783 | | |
Amentum Escrow Corp.,
7.250%, due 08/01/324 | | | 33,000 | | | | 34,505 | | |
Apple, Inc.
3.450%, due 02/09/45 | | | 100,000 | | | | 82,392 | | |
3.850%, due 05/04/43 | | | 160,000 | | | | 141,307 | | |
ASGN, Inc.,
4.625%, due 05/15/284 | | | 41,000 | | | | 39,613 | | |
International Business Machines Corp.,
5.875%, due 11/29/32 | | | 175,000 | | | | 190,052 | | |
KBR, Inc.,
4.750%, due 09/30/284 | | | 75,000 | | | | 71,862 | | |
Kyndryl Holdings, Inc.,
6.350%, due 02/20/34 | | | 200,000 | | | | 210,518 | | |
McAfee Corp.,
7.375%, due 02/15/304 | | | 50,000 | | | | 47,962 | | |
NCR Voyix Corp.,
5.125%, due 04/15/294 | | | 35,000 | | | | 34,323 | | |
Seagate HDD Cayman,
8.250%, due 12/15/29 | | | 25,000 | | | | 27,103 | | |
| | | | | | 908,420 | | |
Distribution & wholesale—0.0%† | |
Resideo Funding, Inc.,
6.500%, due 07/15/324 | | | 30,000 | | | | 30,542 | | |
Diversified financial services—0.8% | |
AerCap Ireland Capital DAC/AerCap Global
Aviation Trust
3.000%, due 10/29/28 | | | 200,000 | | | | 187,050 | | |
6.500%, due 07/15/25 | | | 29,000 | | | | 29,279 | | |
Bread Financial Holdings, Inc.,
9.750%, due 03/15/294 | | | 105,000 | | | | 113,266 | | |
Capital One Financial Corp.,
3.750%, due 07/28/26 | | | 200,000 | | | | 195,933 | | |
CME Group, Inc.,
3.750%, due 06/15/28 | | | 150,000 | | | | 148,069 | | |
Freedom Mortgage Holdings LLC,
9.250%, due 02/01/294 | | | 20,000 | | | | 20,487 | | |
GGAM Finance Ltd.,
6.875%, due 04/15/294 | | | 30,000 | | | | 30,958 | | |
Intercontinental Exchange, Inc.,
3.000%, due 06/15/50 | | | 100,000 | | | | 69,640 | | |
Jane Street Group/JSG Finance, Inc.,
7.125%, due 04/30/314 | | | 55,000 | | | | 57,763 | | |
| | | Face
amount | | Value | |
Corporate bonds—(continued) | |
Diversified financial services—(concluded) | |
Jerrold Finco PLC,
7.875%, due 04/15/307 | | $ | 100,000 | | | $ | 132,318 | | |
Macquarie Airfinance Holdings Ltd.
6.400%, due 03/26/294 | | | 34,000 | | | | 35,384 | | |
6.500%, due 03/26/314 | | | 33,000 | | | | 34,794 | | |
8.125%, due 03/30/294 | | | 40,000 | | | | 42,509 | | |
Nationstar Mortgage Holdings, Inc.
5.125%, due 12/15/304 | | | 29,000 | | | | 27,532 | | |
6.000%, due 01/15/274 | | | 35,000 | | | | 34,937 | | |
7.125%, due 02/01/324 | | | 10,000 | | | | 10,358 | | |
Navient Corp.
6.750%, due 06/15/26 | | | 255,000 | | | | 259,399 | | |
11.500%, due 03/15/31 | | | 25,000 | | | | 28,061 | | |
OneMain Finance Corp.
7.125%, due 03/15/26 | | | 65,000 | | | | 66,231 | | |
9.000%, due 01/15/29 | | | 40,000 | | | | 42,499 | | |
PennyMac Financial Services, Inc.,
7.875%, due 12/15/294 | | | 20,000 | | | | 21,223 | | |
PRA Group, Inc.
7.375%, due 09/01/254 | | | 35,000 | | | | 35,000 | | |
8.375%, due 02/01/284 | | | 35,000 | | | | 35,727 | | |
8.875%, due 01/31/304 | | | 20,000 | | | | 20,672 | | |
Rocket Mortgage LLC/Rocket Mortgage
Co-Issuer, Inc.,
2.875%, due 10/15/264 | | | 150,000 | | | | 142,682 | | |
Visa, Inc.,
2.000%, due 08/15/50 | | | 50,000 | | | | 29,880 | | |
| | | | | | 1,851,651 | | |
Electric—1.2% | |
Berkshire Hathaway Energy Co.,
4.450%, due 01/15/49 | | | 50,000 | | | | 43,036 | | |
Calpine Corp.
4.625%, due 02/01/294 | | | 30,000 | | | | 28,615 | | |
5.125%, due 03/15/284 | | | 35,000 | | | | 34,153 | | |
Clearway Energy Operating LLC,
4.750%, due 03/15/284 | | | 65,000 | | | | 63,148 | | |
Consolidated Edison Co. of New York, Inc.,
5.900%, due 11/15/53 | | | 100,000 | | | | 107,428 | | |
Dominion Energy, Inc.,
3.900%, due 10/01/25 | | | 150,000 | | | | 148,534 | | |
DTE Electric Co.,
Series A,
3.000%, due 03/01/32 | | | 200,000 | | | | 180,121 | | |
Duke Energy Ohio, Inc.,
4.300%, due 02/01/49 | | | 250,000 | | | | 210,756 | | |
Edison International
4.950%, due 04/15/25 | | | 188,000 | | | | 187,409 | | |
(fixed, converts to FRN on 06/15/29)
7.875%, due 06/15/545 | | | 25,000 | | | | 26,234 | | |
Exelon Corp.
3.400%, due 04/15/26 | | | 70,000 | | | | 68,708 | | |
4.450%, due 04/15/46 | | | 200,000 | | | | 172,439 | | |
FirstEnergy Corp.,
Series C,
4.850%, due 07/15/47 | | | 125,000 | | | | 111,582 | | |
10
UBS U.S. Allocation Fund
Portfolio of investments—August 31, 2024
| | | Face
amount | | Value | |
Corporate bonds—(continued) | |
Electric—(concluded) | |
Florida Power & Light Co.,
5.950%, due 02/01/38 | | $ | 45,000 | | | $ | 49,243 | | |
Georgia Power Co.,
Series B,
3.700%, due 01/30/50 | | | 200,000 | | | | 154,322 | | |
Leeward Renewable Energy Operations LLC,
4.250%, due 07/01/294 | | | 25,000 | | | | 23,490 | | |
Lightning Power LLC,
7.250%, due 08/15/324 | | | 35,000 | | | | 36,165 | | |
National Rural Utilities Cooperative Finance
Corp.,
3.900%, due 11/01/28 | | | 100,000 | | | | 97,912 | | |
NRG Energy, Inc.,
3.625%, due 02/15/314 | | | 66,000 | | | | 59,050 | | |
Oncor Electric Delivery Co. LLC,
3.750%, due 04/01/45 | | | 40,000 | | | | 31,969 | | |
PG&E Corp.,
5.000%, due 07/01/28 | | | 50,000 | | | | 48,972 | | |
Pike Corp.,
8.625%, due 01/31/314 | | | 40,000 | | | | 43,182 | | |
Public Service Electric & Gas Co.,
2.450%, due 01/15/30 | | | 250,000 | | | | 225,853 | | |
Sempra,
5.500%, due 08/01/33 | | | 150,000 | | | | 154,855 | | |
Southern California Edison Co.,
3.650%, due 02/01/50 | | | 175,000 | | | | 132,298 | | |
Southwestern Electric Power Co.,
3.250%, due 11/01/51 | | | 200,000 | | | | 133,012 | | |
Talen Energy Supply LLC,
8.625%, due 06/01/304 | | | 65,000 | | | | 70,382 | | |
Virginia Electric & Power Co.,
4.600%, due 12/01/48 | | | 100,000 | | | | 88,519 | | |
Vistra Corp.,
(fixed, converts to FRN on 12/15/26)
7.000%, due 12/15/264,5,6 | | | 69,000 | | | | 69,739 | | |
Vistra Operations Co. LLC,
5.625%, due 02/15/274 | | | 30,000 | | | | 29,955 | | |
| | | | | | 2,831,081 | | |
Electrical components & equipment—0.1% | |
Energizer Holdings, Inc.
4.375%, due 03/31/294 | | | 54,000 | | | | 50,766 | | |
4.750%, due 06/15/284 | | | 30,000 | | | | 28,914 | | |
WESCO Distribution, Inc.
6.375%, due 03/15/294 | | | 5,000 | | | | 5,131 | | |
6.625%, due 03/15/324 | | | 20,000 | | | | 20,604 | | |
7.250%, due 06/15/284 | | | 15,000 | | | | 15,388 | | |
| | | | | | 120,803 | | |
Electronics—0.0%† | |
Coherent Corp.,
5.000%, due 12/15/294 | | | 40,000 | | | | 38,679 | | |
Energy-Alternate Sources—0.0%† | |
TerraForm Power Operating LLC,
4.750%, due 01/15/304 | | | 97,000 | | | | 91,602 | | |
| | | Face
amount | | Value | |
Corporate bonds—(continued) | |
Engineering & construction—0.0%† | |
Arcosa, Inc.,
6.875%, due 08/15/324 | | $ | 25,000 | | | $ | 26,061 | | |
Artera Services LLC,
8.500%, due 02/15/314 | | | 60,000 | | | | 60,068 | | |
Weekley Homes LLC/Weekley Finance Corp.,
4.875%, due 09/15/284 | | | 15,000 | | | | 14,546 | | |
| | | | | | 100,675 | | |
Entertainment—0.2% | |
Caesars Entertainment, Inc.
6.500%, due 02/15/324 | | | 25,000 | | | | 25,691 | | |
8.125%, due 07/01/274 | | | 113,000 | | | | 115,400 | | |
Churchill Downs, Inc.,
5.750%, due 04/01/304 | | | 20,000 | | | | 19,880 | | |
Cinemark USA, Inc.,
5.250%, due 07/15/284 | | | 10,000 | | | | 9,823 | | |
Cirsa Finance International SARL,
10.375%, due 11/30/277 | | | 112,500 | | | | 131,897 | | |
International Game Technology PLC,
5.250%, due 01/15/294 | | | 20,000 | | | | 19,744 | | |
Jacobs Entertainment, Inc.,
6.750%, due 02/15/294 | | | 43,000 | | | | 41,022 | | |
Light & Wonder International, Inc.,
7.500%, due 09/01/314 | | | 45,000 | | | | 47,385 | | |
Ontario Gaming GTA LP/OTG Co-Issuer, Inc.,
8.000%, due 08/01/304 | | | 30,000 | | | | 30,921 | | |
Six Flags Entertainment Corp./Six Flags Theme
Parks, Inc.,
6.625%, due 05/01/324 | | | 22,000 | | | | 22,644 | | |
Warnermedia Holdings, Inc.,
5.050%, due 03/15/42 | | | 100,000 | | | | 80,134 | | |
| | | | | | 544,541 | | |
Food—0.1% | |
J.M. Smucker Co.,
6.200%, due 11/15/33 | | | 100,000 | | | | 108,933 | | |
Kroger Co.,
3.875%, due 10/15/46 | | | 150,000 | | | | 117,930 | | |
United Natural Foods, Inc.,
6.750%, due 10/15/284 | | | 35,000 | | | | 32,872 | | |
| | | | | | 259,735 | | |
Gas—0.0%† | |
AmeriGas Partners LP/AmeriGas Finance Corp.,
5.500%, due 05/20/25 | | | 14,000 | | | | 13,959 | | |
Healthcare-products—0.1% | |
Abbott Laboratories
3.750%, due 11/30/26 | | | 62,000 | | | | 61,456 | | |
4.900%, due 11/30/46 | | | 50,000 | | | | 49,497 | | |
Medline Borrower LP,
5.250%, due 10/01/294 | | | 62,000 | | | | 60,892 | | |
Medline Borrower LP/Medline Co-Issuer, Inc.,
6.250%, due 04/01/294 | | | 4,000 | | | | 4,123 | | |
| | | | | | 175,968 | | |
11
UBS U.S. Allocation Fund
Portfolio of investments—August 31, 2024
| | | Face
amount | | Value | |
Corporate bonds—(continued) | |
Healthcare-services—0.3% | |
CHS/Community Health Systems, Inc.
5.250%, due 05/15/304 | | $ | 29,000 | | | $ | 26,002 | | |
5.625%, due 03/15/274 | | | 28,000 | | | | 27,097 | | |
6.000%, due 01/15/294 | | | 25,000 | | | | 23,718 | | |
6.875%, due 04/15/294 | | | 43,000 | | | | 37,003 | | |
10.875%, due 01/15/324 | | | 45,000 | | | | 48,713 | | |
Concentra Escrow Issuer Corp.,
6.875%, due 07/15/324 | | | 35,000 | | | | 36,613 | | |
DaVita, Inc.
4.625%, due 06/01/304 | | | 48,000 | | | | 45,259 | | |
6.875%, due 09/01/324 | | | 25,000 | | | | 25,577 | | |
HCA, Inc.,
5.250%, due 06/15/49 | | | 150,000 | | | | 139,225 | | |
LifePoint Health, Inc.
9.875%, due 08/15/304 | | | 10,000 | | | | 10,967 | | |
10.000%, due 06/01/324 | | | 10,000 | | | | 10,853 | | |
11.000%, due 10/15/304 | | | 10,000 | | | | 11,270 | | |
Prime Healthcare Services, Inc.,
9.375%, due 09/01/294 | | | 23,000 | | | | 23,186 | | |
Star Parent, Inc.,
9.000%, due 10/01/304 | | | 30,000 | | | | 32,026 | | |
Tenet Healthcare Corp.
6.125%, due 06/15/30 | | | 65,000 | | | | 65,988 | | |
6.875%, due 11/15/31 | | | 43,000 | | | | 46,796 | | |
UnitedHealth Group, Inc.,
4.625%, due 07/15/35 | | | 40,000 | | | | 39,676 | | |
| | | | | | 649,969 | | |
Home builders—0.0%† | |
Ashton Woods USA LLC/Ashton Woods
Finance Co.
4.625%, due 08/01/294 | | | 15,000 | | | | 14,204 | | |
6.625%, due 01/15/284 | | | 10,000 | | | | 10,073 | | |
Installed Building Products, Inc.,
5.750%, due 02/01/284 | | | 40,000 | | | | 39,563 | | |
| | | | | | 63,840 | | |
Housewares—0.0%† | |
Newell Brands, Inc.
6.875%, due 04/01/365 | | | 15,000 | | | | 14,264 | | |
7.000%, due 04/01/465 | | | 5,000 | | | | 4,335 | | |
| | | | | | 18,599 | | |
Insurance—0.3% | |
Acrisure LLC/Acrisure Finance, Inc.,
8.250%, due 02/01/294 | | | 50,000 | | | | 51,462 | | |
Allstate Corp.,
3.850%, due 08/10/49 | | | 50,000 | | | | 40,019 | | |
Aon Global Ltd.,
4.750%, due 05/15/45 | | | 100,000 | | | | 91,194 | | |
Berkshire Hathaway Finance Corp.,
4.250%, due 01/15/49 | | | 100,000 | | | | 90,823 | | |
Hartford Financial Services Group, Inc.,
6.100%, due 10/01/41 | | | 150,000 | | | | 160,299 | | |
| | | Face
amount | | Value | |
Corporate bonds—(continued) | |
Insurance—(concluded) | |
MetLife, Inc.,
4.125%, due 08/13/42 | | $ | 130,000 | | | $ | 112,831 | | |
Prudential Financial, Inc.,
6.625%, due 06/21/40 | | | 60,000 | | | | 68,089 | | |
Teachers Insurance & Annuity Association of
America,
4.270%, due 05/15/474 | | | 50,000 | | | | 42,373 | | |
| | | | | | 657,090 | | |
Internet—0.1% | |
Amazon.com, Inc.,
2.500%, due 06/03/50 | | | 150,000 | | | | 96,137 | | |
Expedia Group, Inc.,
3.800%, due 02/15/28 | | | 100,000 | | | | 97,283 | | |
Match Group Holdings II LLC,
5.625%, due 02/15/294 | | | 30,000 | | | | 29,929 | | |
Netflix, Inc.,
4.875%, due 06/15/304 | | | 100,000 | | | | 102,255 | | |
| | | | | | 325,604 | | |
Investment companies—0.1% | |
Blue Owl Technology Finance Corp. II,
6.750%, due 04/04/294 | | | 125,000 | | | | 124,078 | | |
Icahn Enterprises LP/Icahn Enterprises
Finance Corp.
5.250%, due 05/15/27 | | | 35,000 | | | | 33,824 | | |
6.250%, due 05/15/26 | | | 85,000 | | | | 84,513 | | |
9.750%, due 01/15/294 | | | 30,000 | | | | 31,506 | | |
| | | | | | 273,921 | | |
Iron & steel—0.1% | |
Big River Steel LLC/BRS Finance Corp.,
6.625%, due 01/31/294 | | | 44,000 | | | | 44,490 | | |
Cleveland-Cliffs, Inc.,
7.000%, due 03/15/324 | | | 30,000 | | | | 30,128 | | |
Mineral Resources Ltd.,
8.500%, due 05/01/304 | | | 55,000 | | | | 57,195 | | |
| | | | | | 131,813 | | |
Leisure time—0.3% | |
Carnival Corp.
5.750%, due 03/01/274 | | | 70,000 | | | | 70,232 | | |
6.000%, due 05/01/294 | | | 30,000 | | | | 30,134 | | |
Carnival Holdings Bermuda Ltd.,
10.375%, due 05/01/284 | | | 84,000 | | | | 90,877 | | |
Harley-Davidson, Inc.,
3.500%, due 07/28/25 | | | 150,000 | | | | 147,713 | | |
NCL Corp. Ltd.
5.875%, due 03/15/264 | | | 50,000 | | | | 49,973 | | |
8.375%, due 02/01/284 | | | 35,000 | | | | 36,841 | | |
Pinnacle Bidco PLC,
8.250%, due 10/11/287 | | | 100,000 | | | | 118,325 | | |
Royal Caribbean Cruises Ltd.
5.500%, due 04/01/284 | | | 10,000 | | | | 10,077 | | |
6.000%, due 02/01/334 | | | 11,000 | | | | 11,268 | | |
12
UBS U.S. Allocation Fund
Portfolio of investments—August 31, 2024
| | | Face
amount | | Value | |
Corporate bonds—(continued) | |
Leisure time—(concluded) | |
6.250%, due 03/15/324 | | $ | 30,000 | | | $ | 30,982 | | |
7.500%, due 10/15/27 | | | 25,000 | | | | 26,720 | | |
| | | | | | 623,142 | | |
Lodging—0.1% | |
Hilton Grand Vacations Borrower Escrow LLC/
Hilton Grand Vacations Borrower Escrow, Inc.
4.875%, due 07/01/314 | | | 26,000 | | | | 23,311 | | |
5.000%, due 06/01/294 | | | 25,000 | | | | 23,637 | | |
6.625%, due 01/15/324 | | | 40,000 | | | | 40,482 | | |
Travel & Leisure Co.,
6.625%, due 07/31/264 | | | 15,000 | | | | 15,267 | | |
| | | | | | 102,697 | | |
Machinery-diversified—0.1% | |
Deere & Co.,
3.900%, due 06/09/42 | | | 100,000 | | | | 87,380 | | |
Esab Corp.,
6.250%, due 04/15/294 | | | 10,000 | | | | 10,273 | | |
Husky Injection Molding Systems Ltd./Titan
Co-Borrower LLC,
9.000%, due 02/15/294 | | | 55,000 | | | | 56,379 | | |
| | | | | | 154,032 | | |
Media—0.5% | |
CCO Holdings LLC/CCO Holdings Capital Corp.
4.250%, due 02/01/314 | | | 45,000 | | | | 39,047 | | |
4.250%, due 01/15/344 | | | 40,000 | | | | 32,256 | | |
4.750%, due 03/01/304 | | | 122,000 | | | | 111,206 | | |
5.375%, due 06/01/294 | | | 60,000 | | | | 56,914 | | |
Charter Communications Operating LLC/Charter
Communications Operating Capital,
4.200%, due 03/15/28 | | | 250,000 | | | | 241,943 | | |
Comcast Corp.
2.887%, due 11/01/51 | | | 239,000 | | | | 156,454 | | |
4.150%, due 10/15/28 | | | 50,000 | | | | 49,637 | | |
Directv Financing LLC,
8.875%, due 02/01/304 | | | 15,000 | | | | 15,218 | | |
Directv Financing LLC/Directv Financing
Co-Obligor, Inc.,
5.875%, due 08/15/274 | | | 15,000 | | | | 14,525 | | |
DISH DBS Corp.,
5.875%, due 11/15/24 | | | 30,000 | | | | 29,120 | | |
DISH Network Corp.,
11.750%, due 11/15/274 | | | 50,000 | | | | 50,838 | | |
Fox Corp.,
3.050%, due 04/07/25 | | | 25,000 | | | | 24,706 | | |
Gray Television, Inc.
5.375%, due 11/15/314 | | | 10,000 | | | | 5,728 | | |
10.500%, due 07/15/294 | | | 22,000 | | | | 22,580 | | |
Nexstar Media, Inc.,
4.750%, due 11/01/284 | | | 30,000 | | | | 28,030 | | |
Sirius XM Radio, Inc.
3.875%, due 09/01/314 | | | 25,000 | | | | 21,452 | | |
4.125%, due 07/01/304 | | | 20,000 | | | | 17,952 | | |
5.500%, due 07/01/294 | | | 35,000 | | | | 34,064 | | |
| | | Face
amount | | Value | |
Corporate bonds—(continued) | |
Media—(concluded) | |
Time Warner Cable LLC,
6.550%, due 05/01/37 | | $ | 25,000 | | | $ | 24,665 | | |
Univision Communications, Inc.
4.500%, due 05/01/294 | | | 40,000 | | | | 35,103 | | |
7.375%, due 06/30/304 | | | 25,000 | | | | 23,996 | | |
8.000%, due 08/15/284 | | | 5,000 | | | | 5,059 | | |
Walt Disney Co.,
4.950%, due 10/15/45 | | | 120,000 | | | | 115,243 | | |
| | | | | | 1,155,736 | | |
Mining—0.1% | |
Arsenal AIC Parent LLC,
8.000%, due 10/01/304 | | | 35,000 | | | | 37,630 | | |
FMG Resources August 2006 Pty. Ltd.
5.875%, due 04/15/304 | | | 15,000 | | | | 14,975 | | |
6.125%, due 04/15/324 | | | 40,000 | | | | 39,949 | | |
Hudbay Minerals, Inc.,
6.125%, due 04/01/294 | | | 40,000 | | | | 40,372 | | |
Novelis Corp.,
4.750%, due 01/30/304 | | | 30,000 | | | | 28,650 | | |
| | | | | | 161,576 | | |
Miscellaneous manufacturers—0.2% | |
Amsted Industries, Inc.
4.625%, due 05/15/304 | | | 35,000 | | | | 32,922 | | |
5.625%, due 07/01/274 | | | 20,000 | | | | 19,964 | | |
GE Capital Funding LLC,
3.450%, due 05/15/25 | | | 200,000 | | | | 197,379 | | |
GE Capital International Funding Co.
Unlimited Co.,
4.418%, due 11/15/35 | | | 200,000 | | | | 192,112 | | |
Hillenbrand, Inc.,
6.250%, due 02/15/29 | | | 30,000 | | | | 30,381 | | |
| | | | | | 472,758 | | |
Office & business equipment—0.1% | |
Xerox Holdings Corp.
5.000%, due 08/15/254 | | | 55,000 | | | | 54,133 | | |
8.875%, due 11/30/294 | | | 55,000 | | | | 51,607 | | |
Zebra Technologies Corp.,
6.500%, due 06/01/324 | | | 22,000 | | | | 22,730 | | |
| | | | | | 128,470 | | |
Oil & gas—0.8% | |
Aethon United BR LP/Aethon United
Finance Corp.,
8.250%, due 02/15/264 | | | 18,000 | | | | 18,249 | | |
Aker BP ASA,
3.750%, due 01/15/304 | | | 150,000 | | | | 141,977 | | |
Ascent Resources Utica Holdings LLC/ARU
Finance Corp.
5.875%, due 06/30/294 | | | 41,000 | | | | 40,900 | | |
7.000%, due 11/01/264 | | | 29,000 | | | | 29,092 | | |
8.250%, due 12/31/284 | | | 10,000 | | | | 10,275 | | |
BP Capital Markets America, Inc.,
3.017%, due 01/16/27 | | | 75,000 | | | | 72,830 | | |
13
UBS U.S. Allocation Fund
Portfolio of investments—August 31, 2024
| | | Face
amount | | Value | |
Corporate bonds—(continued) | |
Oil & gas—(concluded) | |
Civitas Resources, Inc.
8.375%, due 07/01/284 | | $ | 25,000 | | | $ | 26,357 | | |
8.750%, due 07/01/314 | | | 55,000 | | | | 59,355 | | |
CNX Resources Corp.,
7.250%, due 03/01/324 | | | 30,000 | | | | 31,412 | | |
ConocoPhillips Co.,
3.758%, due 03/15/42 | | | 250,000 | | | | 207,538 | | |
Diamond Foreign Asset Co./Diamond
Finance LLC,
8.500%, due 10/01/304 | | | 38,000 | | | | 40,086 | | |
Diamondback Energy, Inc.,
6.250%, due 03/15/33 | | | 100,000 | | | | 107,419 | | |
Ecopetrol SA,
5.375%, due 06/26/26 | | | 325,000 | | | | 324,087 | | |
Encino Acquisition Partners Holdings LLC,
8.750%, due 05/01/314 | | | 22,000 | | | | 23,369 | | |
EQT Corp.,
3.125%, due 05/15/264 | | | 150,000 | | | | 145,607 | | |
Equinor ASA,
4.800%, due 11/08/43 | | | 50,000 | | | | 48,202 | | |
Exxon Mobil Corp.,
4.114%, due 03/01/46 | | | 50,000 | | | | 43,541 | | |
Hilcorp Energy I LP/Hilcorp Finance Co.
5.750%, due 02/01/294 | | | 19,000 | | | | 18,855 | | |
6.000%, due 04/15/304 | | | 10,000 | | | | 9,949 | | |
Marathon Petroleum Corp.,
4.750%, due 09/15/44 | | | 110,000 | | | | 96,442 | | |
Nabors Industries, Inc.
8.875%, due 08/15/314 | | | 22,000 | | | | 22,044 | | |
9.125%, due 01/31/304 | | | 25,000 | | | | 26,790 | | |
Parkland Corp.,
6.625%, due 08/15/324 | | | 10,000 | | | | 10,105 | | |
Shell International Finance BV,
4.375%, due 05/11/45 | | | 100,000 | | | | 89,158 | | |
SM Energy Co.,
7.000%, due 08/01/324 | | | 22,000 | | | | 22,538 | | |
Talos Production, Inc.
9.000%, due 02/01/294 | | | 35,000 | | | | 37,182 | | |
9.375%, due 02/01/314 | | | 20,000 | | | | 21,359 | | |
Transocean Aquila Ltd.,
8.000%, due 09/30/284 | | | 20,000 | | | | 20,567 | | |
Transocean Titan Financing Ltd.,
8.375%, due 02/01/284 | | | 50,000 | | | | 51,848 | | |
Transocean, Inc.,
8.750%, due 02/15/304 | | | 4,250 | | | | 4,489 | | |
| | | | | | 1,801,622 | | |
Oil & gas services—0.1% | |
Archrock Partners LP/Archrock Partners
Finance Corp.
6.250%, due 04/01/284 | | | 11,000 | | | | 11,047 | | |
6.625%, due 09/01/324 | | | 25,000 | | | | 25,312 | | |
6.875%, due 04/01/274 | | | 29,000 | | | | 29,211 | | |
Bristow Group, Inc.,
6.875%, due 03/01/284 | | | 67,000 | | | | 67,071 | | |
| | | Face
amount | | Value | |
Corporate bonds—(continued) | |
Oil & gas services—(concluded) | |
Kodiak Gas Services LLC,
7.250%, due 02/15/294 | | $ | 30,000 | | | $ | 31,069 | | |
Oceaneering International, Inc.,
6.000%, due 02/01/28 | | | 23,000 | | | | 23,300 | | |
USA Compression Partners LP/USA Compression
Finance Corp.
6.875%, due 09/01/27 | | | 64,000 | | | | 64,498 | | |
7.125%, due 03/15/294 | | | 25,000 | | | | 25,679 | | |
Weatherford International Ltd.,
8.625%, due 04/30/304 | | | 27,000 | | | | 28,022 | | |
| | | | | | 305,209 | | |
Packaging & containers—0.0%† | |
Clearwater Paper Corp.,
4.750%, due 08/15/284 | | | 35,000 | | | | 32,668 | | |
Pharmaceuticals—0.4% | |
AbbVie, Inc.
3.200%, due 05/14/26 | | | 30,000 | | | | 29,417 | | |
3.800%, due 03/15/25 | | | 90,000 | | | | 89,388 | | |
4.450%, due 05/14/46 | | | 200,000 | | | | 181,186 | | |
Endo Finance Holdings, Inc.,
8.500%, due 04/15/314 | | | 10,000 | | | | 10,618 | | |
Nidda Healthcare Holding GmbH,
7.500%, due 08/21/267 | | | 100,000 | | | | 114,144 | | |
Pfizer, Inc.,
7.200%, due 03/15/39 | | | 270,000 | | | | 330,171 | | |
Teva Pharmaceutical Finance Netherlands II BV,
3.750%, due 05/09/27 | | | 100,000 | | | | 108,791 | | |
| | | | | | 863,715 | | |
Pipelines—0.7% | |
Antero Midstream Partners LP/Antero Midstream
Finance Corp.
5.375%, due 06/15/294 | | | 25,000 | | | | 24,701 | | |
6.625%, due 02/01/324 | | | 20,000 | | | | 20,608 | | |
Blue Racer Midstream LLC/Blue Racer Finance
Corp.,
7.250%, due 07/15/324 | | | 45,000 | | | | 47,182 | | |
Buckeye Partners LP
5.600%, due 10/15/44 | | | 16,000 | | | | 13,505 | | |
6.875%, due 07/01/294 | | | 22,000 | | | | 22,500 | | |
CNX Midstream Partners LP,
4.750%, due 04/15/304 | | | 71,000 | | | | 66,221 | | |
Enbridge Energy Partners LP,
7.375%, due 10/15/45 | | | 100,000 | | | | 118,436 | | |
Energy Transfer LP
5.400%, due 10/01/47 | | | 50,000 | | | | 46,750 | | |
8.527%, due 11/01/665
3 mo. USD Term SOFR + 3.279% | | | 75,000 | | | | 70,963 | | |
EQM Midstream Partners LP,
4.750%, due 01/15/314 | | | 13,000 | | | | 12,490 | | |
Genesis Energy LP/Genesis Energy Finance Corp.
8.000%, due 01/15/27 | | | 22,000 | | | | 22,526 | | |
8.875%, due 04/15/30 | | | 19,000 | | | | 20,167 | | |
14
UBS U.S. Allocation Fund
Portfolio of investments—August 31, 2024
| | | Face
amount | | Value | |
Corporate bonds—(continued) | |
Pipelines—(concluded) | |
Howard Midstream Energy Partners LLC
7.375%, due 07/15/324 | | $ | 51,000 | | | $ | 52,798 | | |
8.875%, due 07/15/284 | | | 55,000 | | | | 58,633 | | |
Kinder Morgan, Inc.
4.300%, due 03/01/28 | | | 150,000 | | | | 149,217 | | |
5.550%, due 06/01/45 | | | 70,000 | | | | 67,904 | | |
MPLX LP,
4.875%, due 06/01/25 | | | 120,000 | | | | 119,768 | | |
Northriver Midstream Finance LP,
6.750%, due 07/15/324 | | | 40,000 | | | | 41,300 | | |
Sabine Pass Liquefaction LLC,
5.000%, due 03/15/27 | | | 80,000 | | | | 80,550 | | |
Summit Midstream Holdings LLC,
8.625%, due 10/31/294 | | | 11,000 | | | | 11,417 | | |
Tallgrass Energy Partners LP/Tallgrass Energy
Finance Corp.,
7.375%, due 02/15/294 | | | 30,000 | | | | 30,660 | | |
Targa Resources Corp.,
4.200%, due 02/01/33 | | | 150,000 | | | | 139,509 | | |
Venture Global LNG, Inc.
7.000%, due 01/15/304 | | | 2,000 | | | | 2,045 | | |
8.125%, due 06/01/284 | | | 35,000 | | | | 36,654 | | |
8.375%, due 06/01/314 | | | 40,000 | | | | 42,460 | | |
9.500%, due 02/01/294 | | | 55,000 | | | | 61,982 | | |
9.875%, due 02/01/324 | | | 105,000 | | | | 116,655 | | |
Western Midstream Operating LP
4.650%, due 07/01/26 | | | 100,000 | | | | 99,486 | | |
6.150%, due 04/01/33 | | | 100,000 | | | | 105,091 | | |
| | | | | | 1,702,178 | | |
Real estate investment trusts—0.5% | |
AvalonBay Communities, Inc.,
3.450%, due 06/01/25 | | | 70,000 | | | | 69,203 | | |
Boston Properties LP,
2.750%, due 10/01/26 | | | 40,000 | | | | 38,110 | | |
Extra Space Storage LP,
5.400%, due 02/01/34 | | | 200,000 | | | | 203,594 | | |
Healthpeak OP LLC,
5.250%, due 12/15/32 | | | 150,000 | | | | 152,609 | | |
Iron Mountain, Inc.
4.875%, due 09/15/274 | | | 45,000 | | | | 44,184 | | |
5.250%, due 07/15/304 | | | 45,000 | | | | 43,864 | | |
Ladder Capital Finance Holdings
LLLP/Ladder Capital Finance Corp.
4.250%, due 02/01/274 | | | 30,000 | | | | 29,113 | | |
4.750%, due 06/15/294 | | | 30,000 | | | | 28,916 | | |
Public Storage Operating Co.,
2.250%, due 11/09/31 | | | 200,000 | | | | 171,036 | | |
Service Properties Trust
4.750%, due 10/01/26 | | | 33,000 | | | | 31,554 | | |
5.250%, due 02/15/26 | | | 65,000 | | | | 63,377 | | |
8.625%, due 11/15/314 | | | 30,000 | | | | 32,092 | | |
Starwood Property Trust, Inc.,
7.250%, due 04/01/294 | | | 20,000 | | | | 20,818 | | |
| | | Face
amount | | Value | |
Corporate bonds—(continued) | |
Real estate investment trusts—(concluded) | |
Uniti Group LP/Uniti Group Finance, Inc./CSL
Capital LLC,
10.500%, due 02/15/284 | | $ | 66,000 | | | $ | 67,720 | | |
VICI Properties LP/VICI Note Co., Inc.,
4.625%, due 12/01/294 | | | 25,000 | | | | 24,320 | | |
| | | | | | 1,020,510 | | |
Retail—0.6% | |
Academy Ltd.,
6.000%, due 11/15/274 | | | 35,000 | | | | 34,866 | | |
Asbury Automotive Group, Inc.,
4.625%, due 11/15/294 | | | 20,000 | | | | 19,041 | | |
Bath & Body Works, Inc.
6.625%, due 10/01/304 | | | 55,000 | | | | 55,687 | | |
6.875%, due 11/01/35 | | | 45,000 | | | | 46,478 | | |
Beacon Roofing Supply, Inc.
4.125%, due 05/15/294 | | | 28,000 | | | | 26,128 | | |
6.500%, due 08/01/304 | | | 30,000 | | | | 30,808 | | |
Cougar JV Subsidiary LLC,
8.000%, due 05/15/324 | | | 30,000 | | | | 31,642 | | |
Home Depot, Inc.
2.125%, due 09/15/26 | | | 150,000 | | | | 143,960 | | |
3.350%, due 09/15/25 | | | 40,000 | | | | 39,516 | | |
3.350%, due 04/15/50 | | | 100,000 | | | | 74,784 | | |
LCM Investments Holdings II LLC,
8.250%, due 08/01/314 | | | 25,000 | | | | 26,581 | | |
Lithia Motors, Inc.,
4.375%, due 01/15/314 | | | 51,000 | | | | 46,976 | | |
Macy's Retail Holdings LLC,
6.125%, due 03/15/324 | | | 11,000 | | | | 10,522 | | |
McDonald's Corp.
3.800%, due 04/01/28 | | | 250,000 | | | | 246,096 | | |
4.875%, due 12/09/45 | | | 20,000 | | | | 18,860 | | |
Nordstrom, Inc.
4.250%, due 08/01/31 | | | 13,000 | | | | 11,568 | | |
6.950%, due 03/15/28 | | | 11,000 | | | | 11,366 | | |
Patrick Industries, Inc.
4.750%, due 05/01/294 | | | 30,000 | | | | 28,160 | | |
7.500%, due 10/15/274 | | | 40,000 | | | | 40,143 | | |
QVC, Inc.
4.450%, due 02/15/25 | | | 60,000 | | | | 59,496 | | |
4.750%, due 02/15/27 | | | 20,000 | | | | 17,517 | | |
Raising Cane's Restaurants LLC,
9.375%, due 05/01/294 | | | 45,000 | | | | 48,570 | | |
Sally Holdings LLC/Sally Capital, Inc.,
6.750%, due 03/01/32 | | | 46,000 | | | | 46,923 | | |
Target Corp.,
1.950%, due 01/15/27 | | | 150,000 | | | | 143,231 | | |
Walgreens Boots Alliance, Inc.,
8.125%, due 08/15/29 | | | 10,000 | | | | 10,017 | | |
White Cap Buyer LLC,
6.875%, due 10/15/284 | | | 32,000 | | | | 31,691 | | |
| | | | | | 1,300,627 | | |
15
UBS U.S. Allocation Fund
Portfolio of investments—August 31, 2024
| | | Face
amount | | Value | |
Corporate bonds—(continued) | |
Semiconductors—0.2% | |
Broadcom, Inc.,
3.137%, due 11/15/354 | | $ | 140,000 | | | $ | 117,039 | | |
NVIDIA Corp.,
2.850%, due 04/01/30 | | | 100,000 | | | | 93,767 | | |
NXP BV/NXP Funding LLC,
5.550%, due 12/01/28 | | | 100,000 | | | | 103,117 | | |
NXP BV/NXP Funding LLC/NXP USA, Inc.,
3.875%, due 06/18/26 | | | 95,000 | | | | 93,683 | | |
QUALCOMM, Inc.,
4.800%, due 05/20/45 | | | 100,000 | | | | 96,627 | | |
| | | | | | 504,233 | | |
Software—0.3% | |
Central Parent LLC/CDK Global II LLC/CDK
Financing Co., Inc.,
8.000%, due 06/15/294 | | | 30,000 | | | | 30,975 | | |
Cloud Software Group, Inc.
6.500%, due 03/31/294 | | | 100,000 | | | | 98,574 | | |
9.000%, due 09/30/294 | | | 80,000 | | | | 80,517 | | |
Microsoft Corp.
2.525%, due 06/01/50 | | | 120,000 | | | | 79,925 | | |
3.500%, due 02/12/35 | | | 150,000 | | | | 141,367 | | |
Open Text Corp.,
3.875%, due 12/01/294 | | | 30,000 | | | | 27,657 | | |
Oracle Corp.,
5.375%, due 07/15/40 | | | 216,000 | | | | 213,584 | | |
Rocket Software, Inc.,
9.000%, due 11/28/284 | | | 10,000 | | | | 10,374 | | |
| | | | | | 682,973 | | |
Telecommunications—0.6% | |
AT&T, Inc.
3.800%, due 12/01/57 | | | 117,000 | | | | 85,756 | | |
6.000%, due 08/15/40 | | | 180,000 | | | | 188,979 | | |
Cisco Systems, Inc.,
5.300%, due 02/26/54 | | | 50,000 | | | | 51,620 | | |
Deutsche Telekom International Finance BV,
8.750%, due 06/15/307 | | | 75,000 | | | | 90,161 | | |
Frontier Communications Holdings LLC
5.875%, due 10/15/274 | | | 70,000 | | | | 69,725 | | |
6.750%, due 05/01/294 | | | 45,000 | | | | 43,407 | | |
8.750%, due 05/15/304 | | | 11,000 | | | | 11,585 | | |
Level 3 Financing, Inc.
4.000%, due 04/15/314 | | | 10,000 | | | | 6,700 | | |
4.875%, due 06/15/294 | | | 26,000 | | | | 20,216 | | |
10.500%, due 05/15/304 | | | 10,000 | | | | 10,715 | | |
10.750%, due 12/15/304 | | | 15,000 | | | | 16,155 | | |
Sprint LLC,
7.625%, due 03/01/26 | | | 150,000 | | | | 154,647 | | |
Telecom Italia Capital SA,
7.721%, due 06/04/38 | | | 40,000 | | | | 42,386 | | |
T-Mobile USA, Inc.,
5.150%, due 04/15/34 | | | 200,000 | | | | 203,610 | | |
Verizon Communications, Inc.
2.355%, due 03/15/32 | | | 209,000 | | | | 177,569 | | |
4.016%, due 12/03/29 | | | 282,000 | | | | 276,168 | | |
| | | Face
amount | | Value | |
Corporate bonds—(concluded) | |
Telecommunications—(concluded) | |
Zayo Group Holdings, Inc.
4.000%, due 03/01/274 | | $ | 10,000 | | | $ | 8,728 | | |
6.125%, due 03/01/284 | | | 15,000 | | | | 11,594 | | |
| | | | | | 1,469,721 | | |
Transportation—0.1% | |
Burlington Northern Santa Fe LLC,
5.150%, due 09/01/43 | | | 160,000 | | | | 160,980 | | |
Cargo Aircraft Management, Inc.,
4.750%, due 02/01/284 | | | 40,000 | | | | 38,314 | | |
Genesee & Wyoming, Inc.,
6.250%, due 04/15/324 | | | 29,000 | | | | 29,640 | | |
United Parcel Service, Inc.,
3.750%, due 11/15/47 | | | 50,000 | | | | 39,912 | | |
| | | | | | 268,846 | | |
Trucking & leasing—0.0%† | |
Fortress Transportation & Infrastructure
Investors LLC
5.500%, due 05/01/284 | | | 40,000 | | | | 39,738 | | |
7.875%, due 12/01/304 | | | 15,000 | | | | 16,098 | | |
| | | | | | 55,836 | | |
Total corporate bonds
(cost—$32,406,704) | | | 31,101,634 | | |
Mortgage-backed securities—1.5% | |
Bank,
Series 2020-BN30, Class A4,
1.925%, due 12/15/53 | | | 350,000 | | | | 291,045 | | |
BMO Mortgage Trust,
Series 2023-C4, Class A5,
5.117%, due 02/15/565 | | | 500,000 | | | | 508,791 | | |
BWAY Mortgage Trust,
Series 2013-1515, Class A2,
3.454%, due 03/10/334 | | | 450,000 | | | | 432,524 | | |
Citigroup Commercial Mortgage Trust,
Series 2018-C5, Class A4,
4.228%, due 06/10/515 | | | 350,000 | | | | 342,308 | | |
Extended Stay America Trust,
Series 2021-ESH, Class D,
7.702%, due 07/15/384,5 | | | 824,944 | | | | 820,823 | | |
Flagstar Mortgage Trust,
Series 2018-5, Class A2,
4.000%, due 09/25/484,5 | | | 150,752 | | | | 141,970 | | |
Hilton USA Trust,
Series 2016-SFP, Class B,
3.323%, due 11/05/354 | | | 425,000 | | | | 315,567 | | |
Hudson Yards Mortgage Trust,
Series 2016-10HY, Class A,
2.835%, due 08/10/384 | | | 400,000 | | | | 381,583 | | |
Residential Mortgage Loan Trust,
Series 2020-2, Class A1,
1.654%, due 05/25/604,5 | | | 3,325 | | | | 3,302 | | |
Series 2020-1, Class A1,
2.376%, due 01/26/604,5 | | | 9,163 | | | | 8,935 | | |
16
UBS U.S. Allocation Fund
Portfolio of investments—August 31, 2024
| | | Face
amount | | Value | |
Mortgage-backed securities—(concluded) | |
Series 2019-3, Class A1,
2.633%, due 09/25/594,5 | | $ | 7,460 | | | $ | 7,362 | | |
Verus Securitization Trust,
Series 2021-R1, Class A1,
0.820%, due 10/25/634,5 | | | 69,493 | | | | 65,106 | | |
Series 2021-R3, Class A1,
1.020%, due 04/25/644,5 | | | 162,136 | | | | 148,606 | | |
Series 2020-5, Class A1,
1.218%, due 05/25/654,5 | | | 50,197 | | | | 47,794 | | |
Series 2019-4, Class A1,
3.642%, due 11/25/594,5 | | | 16,217 | | | | 15,896 | | |
Total mortgage-backed securities
(cost—$3,788,430) | | | 3,531,612 | | |
Non-U.S. government agency obligations—0.2% | |
Mexico Government International Bonds
3.250%, due 04/16/30 | | | 200,000 | | | | 181,500 | | |
4.750%, due 04/27/32 | | | 200,000 | | | | 190,563 | | |
Total non-U.S. government agency
obligations
(cost—$411,986) | | | 372,063 | | |
U.S. government agency obligations—11.0% | |
Federal Home Loan Mortgage Corp.
3.000%, due 11/01/46 | | | 70,654 | | | | 64,022 | | |
3.000%, due 07/01/47 | | | 88,023 | | | | 79,759 | | |
3.000%, due 08/01/47 | | | 88,788 | | | | 80,452 | | |
4.000%, due 05/01/47 | | | 72,067 | | | | 69,409 | | |
5.000%, due 03/01/38 | | | 7,707 | | | | 7,872 | | |
5.500%, due 05/01/37 | | | 33,073 | | | | 34,467 | | |
5.500%, due 08/01/40 | | | 6,970 | | | | 7,270 | | |
6.500%, due 08/01/28 | | | 12,226 | | | | 12,558 | | |
Federal National Mortgage Association
2.000%, due 01/01/51 | | | 436,609 | | | | 358,803 | | |
2.000%, due 03/01/51 | | | 433,184 | | | | 356,259 | | |
2.500%, due 02/01/52 | | | 1,025,045 | | | | 891,190 | | |
3.000%, due 11/01/48 | | | 149,894 | | | | 135,672 | | |
3.000%, due 02/01/50 | | | 155,203 | | | | 139,448 | | |
3.500%, due 12/01/47 | | | 58,548 | | | | 54,682 | | |
3.500%, due 02/01/48 | | | 424,760 | | | | 396,693 | | |
4.000%, due 12/01/39 | | | 23,656 | | | | 23,062 | | |
4.000%, due 02/01/41 | | | 12,500 | | | | 12,187 | | |
4.500%, due 09/01/37 | | | 74,477 | | | | 74,426 | | |
4.500%, due 07/01/47 | | | 36,773 | | | | 36,426 | | |
5.000%, due 10/01/39 | | | 3,802 | | | | 3,891 | | |
5.000%, due 05/01/40 | | | 2,965 | | | | 3,032 | | |
5.500%, due 08/01/39 | | | 5,694 | | | | 5,939 | | |
7.000%, due 08/01/32 | | | 56,407 | | | | 59,879 | | |
7.500%, due 02/01/33 | | | 81 | | | | 81 | | |
Government National Mortgage Association
2.000%, due 03/20/51 | | | 1,164,504 | | | | 982,284 | | |
2.500%, due 03/20/51 | | | 1,216,813 | | | | 1,065,009 | | |
| | | Face
amount | | Value | |
U.S. government agency obligations—(concluded) | | | |
3.000%, due 01/20/47 | | $ | 34,537 | | | $ | 31,603 | | |
3.000%, due 07/20/47 | | | 94,210 | | | | 86,096 | | |
3.000%, due 08/20/47 | | | 71,203 | | | | 65,070 | | |
3.500%, due 04/20/47 | | | 87,251 | | | | 81,945 | | |
4.000%, due 07/15/42 | | | 21,459 | | | | 21,043 | | |
6.000%, due 11/20/28 | | | 124 | | | | 127 | | |
6.000%, due 02/20/29 | | | 270 | | | | 277 | | |
6.000%, due 02/20/34 | | | 170,601 | | | | 177,878 | | |
Government National Mortgage Association, TBA
3.000% | | | 250,000 | | | | 226,157 | | |
Uniform Mortgage-Backed Security, TBA
2.000% | | | 4,825,000 | | | | 3,948,505 | | |
| 2.500% | | | 2,900,000 | | | | 2,474,161 | | |
| 3.000% | | | 2,700,000 | | | | 2,395,181 | | |
| 3.500% | | | 2,700,000 | | | | 2,485,855 | | |
| 4.000% | | | 2,650,000 | | | | 2,514,466 | | |
| 4.500% | | | 2,950,000 | | | | 2,872,076 | | |
| 5.000% | | | 2,875,000 | | | | 2,854,602 | | |
Total U.S. government agency obligations
(cost—$25,413,388) | | | 25,189,814 | | |
U.S. treasury obligations—0.4% | | | |
U.S. Treasury Notes
4.250%, due 06/30/31 | | | 320,000 | | | | 328,400 | | |
4.375%, due 11/30/28 | | | 335,000 | | | | 343,074 | | |
4.500%, due 11/15/33 | | | 175,000 | | | | 182,950 | | |
Total U.S. treasury obligations
(cost—$845,337) | | | 854,424 | | |
Short term investments—9.5% | | | |
Investment companies—4.2% | | | |
State Street Institutional U.S. Government Money
Market Fund, 5.244%8 | | | 9,696,440 | | | | 9,696,440 | | |
U.S. treasury obligations—5.3% | | | |
U.S. Treasury Bills
4.954%, due 01/16/258 | | | 4,000,000 | | | | 3,927,215 | | |
5.325%, due 09/12/248 | | | 5,000,000 | | | | 4,992,145 | | |
5.367%, due 10/17/248 | | | 3,300,000 | | | | 3,278,173 | | |
| | | 12,197,533 | | |
Total short term investments
(cost—$21,893,973) | | | 21,893,973 | | |
Total investments
(cost—$218,011,539)—108.1% | | | | | 248,015,108 | | |
Liabilities in excess of other assets—(8.1)% | | | | | (18,669,928 | ) | |
Net assets—100.0% | | | | $ | 229,345,180 | | |
17
UBS U.S. Allocation Fund
Portfolio of investments—August 31, 2024
Futures contracts
Number of
contracts | | Currency | | | | Expiration
date | | Current
notional
amount | | Value | | Unrealized
appreciation
(depreciation) | |
Index futures buy contracts: | | | |
| | 66 | | | USD | | | | Russell 2000 Value Index Futures | | September 2024 | | $ | 6,754,605 | | | $ | 7,336,230 | | | $ | 581,625 | | |
U.S. Treasury futures buy contracts: | | | |
| | 187 | | | USD | | | | U.S. Treasury Note 10 Year Futures | | December 2024 | | $ | 21,304,517 | | | $ | 21,236,188 | | | $ | (68,329 | ) | |
| | 21 | | | USD | | | | U.S. Treasury Note 5 Year Futures | | December 2024 | | | 2,302,485 | | | | 2,297,367 | | | | (5,118 | ) | |
| | 2 | | | USD | | | | Ultra U.S. Treasury Note 10 Year Futures | | December 2024 | | | 236,019 | | | | 234,875 | | | | (1,144 | ) | |
Total | | | | | | | | | | | | | | $ | 30,597,626 | | | $ | 31,104,660 | | | $ | 507,034 | | |
Index futures sell contracts: | | | |
| | 27 | | | USD | | | | S&P 500 E-Mini Index Futures | | September 2024 | | $ | (7,460,506 | ) | | $ | (7,642,350 | ) | | $ | (181,844 | ) | |
U.S. Treasury futures sell contracts: | | | |
| | 12 | | | USD | | | | U.S. Long Bond Futures | | December 2024 | | $ | (1,492,946 | ) | | $ | (1,477,500 | ) | | $ | 15,446 | | |
| | 5 | | | USD | | | | U.S. Treasury Note 2 Year Futures | | December 2024 | | | (1,038,197 | ) | | | (1,037,735 | ) | | | 462 | | |
| | 6 | | | USD | | | | Ultra U.S. Treasury Bond Futures | | December 2024 | | | (804,778 | ) | | | (791,625 | ) | | | 13,153 | | |
Total | | | | | | | | | | | | | | $ | (10,796,427 | ) | | $ | (10,949,210 | ) | | $ | (152,783 | ) | |
| | Net unrealized appreciation (depreciation) | | | | | | | | | | | | | $ | 354,251 | | |
Centrally cleared credit default swap agreements on credit indices—buy protection9
Referenced obligations | | Implied credit
spread as of
August 31,
2024* | | Notional
amount
(000) | | Maturity
date | | Payment
frequency | | Payments
made by
the portfolio | | Upfront
payments
received
(made) | | Value | | Unrealized
appreciation
(depreciation) | |
CDX.NA.IG.S42 | | | N/A | | | USD | 4,300 | | | 06/20/29 | | Quarterly | | | 1.000 | % | | $ | (91,497 | ) | | $ | (104,141 | ) | | $ | (12,644 | ) | |
Centrally cleared credit default swap agreements on credit indices—sell protection10
Referenced obligations | | Implied credit
spread as of
August 31,
2024* | | Notional
amount
(000) | | Maturity
date | | Payment
frequency | | Payments
received by
the portfolio | | Upfront
payments
received
(made) | | Value | | Unrealized
appreciation
(depreciation) | |
CDX.NA.HY.S41 | | | N/A | | | USD | 1,163 | | | 12/20/28 | | Quarterly | | | 5.000 | % | | $ | (9,947 | ) | | $ | 94,885 | | | $ | 104,832 | | |
* Implied credit spreads, represented in absolute terms, used in determining the market value of credit default swap agreements on corporate issues or sovereign issues as of period end serve as an indicator of the current status of the payment/performance risk and represent the likelihood or risk of default for the credit derivative. The implied credit spread of a particular reference entity reflects the cost of buying/selling protection and may include upfront payments required to be made to enter into the agreement. Wider credit spreads represent a deterioration of the reference entity's credit soundness and greater likelihood or risk of default or other credit event occurring as defined under the terms of the agreement.
18
UBS U.S. Allocation Fund
Portfolio of investments—August 31, 2024
Forward foreign currency contracts
Counterparty | | Sell | | Purchase | | Settlement
date | | Unrealized
appreciation
(depreciation) | |
BOA | | EUR | 700,000 | | | USD | 772,678 | | | 09/19/24 | | $ | (1,635 | ) | |
SSB | | GBP | 105,000 | | | USD | 136,915 | | | 09/19/24 | | | (1,003 | ) | |
SSB | | USD | 93,815 | | | EUR | 85,000 | | | 09/19/24 | | | 209 | | |
Net unrealized appreciation (depreciation) | | | | | | | | $ | (2,429 | ) | |
Fair valuation summary
The following is a summary of the fair valuations according to the inputs used as of August 31, 2024 in valuing the Fund's investments. In the event a Fund holds investments for which fair value is measured using the NAV per share practical expedient (or its equivalent), a separate column will be added to the fair value hierarchy table; this is intended to permit reconciliation to the amounts presented in the Portfolio of investments:
Assets
Description | | Unadjusted
quoted prices in
active market for
identical investments
(Level 1) | | Other significant
observable inputs
(Level 2) | | Unobservable
inputs
(Level 3) | | Total | |
Common stocks | | $ | 142,881,628 | | | $ | 133 | | | $ | — | | | $ | 142,881,761 | | |
Preferred stocks | | | — | | | | — | | | | 0 | | | | 0 | | |
Exchange traded funds | | | 7,546,971 | | | | — | | | | — | | | | 7,546,971 | | |
Asset-backed securities | | | — | | | | 14,642,856 | | | | — | | | | 14,642,856 | | |
Corporate bonds | | | — | | | | 31,101,634 | | | | — | | | | 31,101,634 | | |
Mortgage-backed securities | | | — | | | | 3,531,612 | | | | — | | | | 3,531,612 | | |
Non-U.S. government agency obligations | | | — | | | | 372,063 | | | | — | | | | 372,063 | | |
U.S. government agency obligations | | | — | | | | 25,189,814 | | | | — | | | | 25,189,814 | | |
U.S. treasury obligations | | | — | | | | 854,424 | | | | — | | | | 854,424 | | |
Short term investments | | | — | | | | 9,696,440 | | | | — | | | | 9,696,440 | | |
Short-term U.S. treasury obligations | | | — | | | | 12,197,533 | | | | — | | | | 12,197,533 | | |
Futures contracts | | | 610,686 | | | | — | | | | — | | | | 610,686 | | |
Swap agreements | | | — | | | | 94,885 | | | | — | | | | 94,885 | | |
Forward foreign currency contracts | | | — | | | | 209 | | | | — | | | | 209 | | |
Total | | $ | 151,039,285 | | | $ | 97,681,603 | | | $ | 0 | | | $ | 248,720,888 | | |
Liabilities | |
Futures contracts | | $ | (256,435 | ) | | $ | — | | | $ | — | | | $ | (256,435 | ) | |
Swap agreements | | | — | | | | (104,141 | ) | | | — | | | | (104,141 | ) | |
Forward foreign currency contracts | | | — | | | | (2,638 | ) | | | — | | | | (2,638 | ) | |
Total | | $ | (256,435 | ) | | $ | (106,779 | ) | | $ | — | | | $ | (363,214 | ) | |
At August 31, 2024, there were no transfers in or out of Level 3.
Securities valued using unobservable inputs, i.e. Level 3, were not considered significant to the Fund.
Portfolio footnotes
† Amount represents less than 0.05% or (0.05)%.
* Non-income producing security.
1 Security fair valued by the Valuation Committee under the direction of the Board of Trustees.
2 Significant unobservable inputs were used in the valuation of this security; i.e. Level 3.
3 Security, or portion thereof, was on loan at the period end.
19
UBS U.S. Allocation Fund
Portfolio of investments—August 31, 2024
4 Security exempt from registration pursuant to Rule 144A under the Securities Act of 1933. These securities are considered liquid, unless noted otherwise, and may be resold in transactions exempt from registrations, normally to qualified institutional buyers. Securities exempt from registration pursuant to Rule 144A, in the amount of $19,575,353, represented 8.5% of the Fund's net assets at period end.
5 Floating or variable rate securities. The rates disclosed are as of August 31, 2024. For securities based on a published reference rate and spread, the reference rate and spread are indicated within the description. Variable rate securities with a floor or ceiling feature are disclosed at the inherent rate, where applicable. Certain variable rate securities are not based on a published reference rate and spread, but are determined by the issuer or agent and are based on current market conditions; these securities do not indicate a reference rate and spread in the description.
6 Perpetual investment. Date shown reflects the next call date.
7 Security was purchased pursuant to Regulation S under the Securities Act of 1933, which exempts from registration securities offered and sold outside of the United States. Such a security cannot be sold in the United States without either an effective registration statement filed pursuant to the Securities Act of 1933, or pursuant to an exemption from registration.
8 Rate shown reflects yield at August 31, 2024.
9 If the portfolio is a buyer of protection and a credit event occurs, as defined under the terms of that particular swap agreement, the portfolio will either (i) receive from the seller of protection an amount equal to the notional amount of the swap and deliver the referenced obligation or underlying securities comprising the referenced obligation or (ii) receive a net settlement amount in the form of cash or securities equal to the notional amount of the swap less the recovery value of the referenced obligation or underlying securities comprising the referenced obligation.
10 If the portfolio is a seller of protection and a credit event occurs, as defined under the terms of that particular swap agreement, the portfolio will either (i) pay to the buyer of protection an amount equal to the notional amount of the swap and take delivery of the referenced obligation or underlying securities comprising the referenced obligation or (ii) pay a net settlement amount in the form of cash or securities equal to the notional amount of the swap less the recovery value of the referenced obligation or underlying securities comprising the referenced obligation.
Portfolio acronyms:
BOA Bank of America
ETF Exchange Traded Fund
EURIBOR Euro Interbank Offered Rate
FRN Floating Rate Note
HSBC HSBC Bank PLC
MSCI Morgan Stanley Capital International
SOFR Secured Overnight Financing Rate
SSB State Street Bank and Trust Co.
TBA To-Be-Announced Security
Currency type abbreviations:
EUR Euro
GBP British Pound
USD United States Dollar
See accompanying notes to financial statements
20
Statement of assets and liabilities
August 31, 2024
Assets: | |
Investments, at value (cost—$218,011,539)1 | | $ | 248,015,108 | | |
Foreign currency (cost—$30,222) | | | 30,399 | | |
Cash | | | 16 | | |
Cash collateral on futures | | | 633,315 | | |
Cash collateral on swap agreements | | | 44,091 | | |
Receivable for investments sold | | | 334,404 | | |
Receivable for fund shares sold | | | 24,952 | | |
Receivable for interest and dividends | | | 703,081 | | |
Receivable for foreign tax reclaims | | | 1,737 | | |
Receivable for variation margin on futures contracts | | | 354,824 | | |
Receivable for variation margin on centrally cleared swap agreements | | | 29,208 | | |
Unrealized appreciation on forward foreign currency contracts | | | 209 | | |
Other assets | | | 23,304 | | |
Total assets | | | 250,194,648 | | |
Liabilities: | |
Due to broker | | | 342,516 | | |
Payable for investments purchased | | | 19,987,441 | | |
Payable for fund shares redeemed | | | 136,898 | | |
Payable to affiliate | | | 135,275 | | |
Payable to custodian | | | 33,666 | | |
Payable for foreign withholding taxes and foreign capital gains taxes | | | 961 | | |
Unrealized depreciation on forward foreign currency contracts | | | 2,638 | | |
Accrued expenses and other liabilities | | | 210,073 | | |
Total liabilities | | | 20,849,468 | | |
Net assets | | $ | 229,345,180 | | |
Net assets consist of: | |
Beneficial interest shares of $0.001 par value (unlimited amount authorized) | | $ | 183,677,986 | | |
Distributable earnings (accumulated losses) | | | 45,667,194 | | |
Net assets | | $ | 229,345,180 | | |
Class A | |
Net assets | | $ | 193,954,944 | | |
Shares outstanding | | | 3,744,285 | | |
Net asset value per share | | $ | 51.80 | | |
Maximum offering price per share (net asset value plus maximum sales charge of 5.50%) | | $ | 54.81 | | |
Class P | |
Net assets | | $ | 35,390,236 | | |
Shares outstanding | | | 662,924 | | |
Net asset value, offering price and redemption value per share | | $ | 53.39 | | |
1 Includes $522,536, of investments in securities on loan, at value, plus accrued interest and dividends, if any.
See accompanying notes to financial statements
21
Statement of operations
For the year ended August 31, 2024
Investment income: | |
Dividends | | $ | 1,810,146 | | |
Interest | | | 3,850,782 | | |
Securities lending | | | 2,555 | | |
Foreign tax withheld | | | (1,128 | ) | |
Total income | | | 5,662,355 | | |
Expenses: | |
Investment advisory and administration fees | | | 1,092,819 | | |
Service fees—Class A | | | 463,791 | | |
Transfer agency and related services fees—Class A | | | 99,442 | | |
Transfer agency and related services fees—Class P | | | 9,710 | | |
Custody and fund accounting fees | | | 84,490 | | |
Trustees fees | | | 23,006 | | |
Professional services fees | | | 190,786 | | |
Printing and shareholder report fees | | | 84,366 | | |
Federal and state registration fees | | | 42,530 | | |
Insurance expense | | | 1,465 | | |
Other expenses | | | 67,609 | | |
Total expenses | | | 2,160,014 | | |
Net investment income (loss) | | | 3,502,341 | | |
Net realized gain (loss) on: | |
Investments | | | 15,427,075 | | |
Options and swaptions written | | | 234 | | |
Futures contracts | | | (789,717 | ) | |
Swap agreements | | | 38,836 | | |
Forward foreign currency contracts | | | 3,112 | | |
Foreign currency transactions | | | 11,183 | | |
Net realized gain (loss) | | | 14,690,723 | | |
Change in net unrealized appreciation (depreciation) on: | |
Investments | | | 16,105,192 | | |
Options and swaptions written | | | (46 | ) | |
Futures contracts | | | 165,639 | | |
Swap agreements | | | 90,791 | | |
Forward foreign currency contracts | | | (11,083 | ) | |
Translation of other assets and liabilities denominated in foreign currency | | | 526 | | |
Net change in unrealized appreciation (depreciation) | | | 16,351,019 | | |
Net realized and unrealized gain (loss) from investment activities | | | 31,041,742 | | |
Net increase (decrease) in net assets resulting from operations | | $ | 34,544,083 | | |
See accompanying notes to financial statements
22
Statement of changes in net assets
| | | For the years ended August 31, | |
| | | 2024 | | 2023 | |
From operations: | |
Net investment income (loss) | | $ | 3,502,341 | | | $ | 3,311,887 | | |
Net realized gain (loss) | | | 14,690,723 | | | | (1,223,649 | ) | |
Net change in unrealized appreciation (depreciation) | | | 16,351,019 | | | | 15,696,856 | | |
Net increase (decrease) in net assets resulting from operations | | | 34,544,083 | | | | 17,785,094 | | |
Total distributions—Class A | | | (2,603,195 | ) | | | (16,408,010 | ) | |
Total distributions—Class P | | | (532,924 | ) | | | (2,827,745 | ) | |
Total distributions | | | (3,136,119 | ) | | | (19,235,755 | ) | |
From beneficial interest transactions: | |
Proceeds from shares sold | | | 1,783,454 | | | | 3,554,137 | | |
Cost of shares redeemed | | | (25,928,760 | ) | | | (27,932,398 | ) | |
Shares issued on reinvestment of dividends and distributions | | | 2,801,969 | | | | 17,206,072 | | |
Net increase (decrease) in net assets from beneficial interest transactions | | | (21,343,337 | ) | | | (7,172,189 | ) | |
Net increase (decrease) in net assets | | | 10,064,627 | | | | (8,622,850 | ) | |
Net assets: | |
Beginning of year | | | 219,280,553 | | | | 227,903,403 | | |
End of year | | $ | 229,345,180 | | | $ | 219,280,553 | | |
See accompanying notes to financial statements
23
UBS U.S. Allocation Fund
Financial highlights
Selected data for a share of beneficial interest outstanding throughout each year is presented below:
Class A
| | | Years ended August 31, | |
| | | 2024 | | 2023 | | 2022 | | 2021 | | 2020 | |
Net asset value, beginning of year | | $ | 44.91 | | | $ | 45.40 | | | $ | 60.43 | | | $ | 52.91 | | | $ | 46.27 | | |
Net investment income (loss)1 | | | 0.74 | | | | 0.64 | | | | 0.42 | | | | 0.30 | | | | 0.48 | | |
Net realized and unrealized gain (loss) | | | 6.80 | | | | 2.85 | | | | (6.37 | ) | | | 11.04 | | | | 7.13 | | |
Net increase (decrease) from operations | | | 7.54 | | | | 3.49 | | | | (5.95 | ) | | | 11.34 | | | | 7.61 | | |
Dividends from net investment income | | | (0.65 | ) | | | (0.38 | ) | | | (0.05 | ) | | | (0.64 | ) | | | (0.34 | ) | |
Distributions from net realized gains | | | — | | | | (3.60 | ) | | | (9.03 | ) | | | (3.18 | ) | | | (0.63 | ) | |
Total dividends and distributions | | | (0.65 | ) | | | (3.98 | ) | | | (9.08 | ) | | | (3.82 | ) | | | (0.97 | ) | |
Net asset value, end of year | | $ | 51.80 | | | $ | 44.91 | | | $ | 45.40 | | | $ | 60.43 | | | $ | 52.91 | | |
Total investment return2 | | | 16.97 | % | | | 8.72 | % | | | (11.69 | )% | | | 22.37 | % | | | 16.65 | % | |
Ratios to average net assets: | |
Expenses | | | 1.03 | % | | | 1.00 | % | | | 0.97 | % | | | 0.94 | % | | | 0.99 | % | |
Net investment income (loss) | | | 1.56 | % | | | 1.49 | % | | | 0.81 | % | | | 0.54 | % | | | 1.00 | % | |
Supplemental data: | |
Net assets, end of year (000's) | | $ | 193,955 | | | $ | 186,809 | | | $ | 195,884 | | | $ | 243,513 | | | $ | 216,656 | | |
Portfolio turnover | | | 58 | % | | | 65 | % | | | 96 | % | | | 69 | % | | | 129 | % | |
1 Calculated using the average shares method.
2 Total investment return is calculated assuming a $10,000 investment on the first day of each year reported, reinvestment of all dividends and other distributions, if any, at net asset value on the ex-dividend dates, and a sale at net asset value on the last day of each year reported. The figures do not include any applicable sales charges or redemption fees; results would be lower if they were included. Returns do not reflect the deduction of taxes that a shareholder would pay on Fund distributions or the redemption of Fund shares.
See accompanying notes to financial statements
24
UBS U.S. Allocation Fund
Financial highlights (Concluded)
Selected data for a share of beneficial interest outstanding throughout each year is presented below:
Class P
| | | Years ended August 31, | |
| | | 2024 | | 2023 | | 2022 | | 2021 | | 2020 | |
Net asset value, beginning of year | | $ | 46.26 | | | $ | 46.66 | | | $ | 61.87 | | | $ | 54.07 | | | $ | 47.25 | | |
Net investment income (loss)1 | | | 0.89 | | | | 0.78 | | | | 0.57 | | | | 0.46 | | | | 0.62 | | |
Net realized and unrealized gain (loss) | | | 7.01 | | | | 2.94 | | | | (6.55 | ) | | | 11.30 | | | | 7.30 | | |
Net increase (decrease) from operations | | | 7.90 | | | | 3.72 | | | | (5.98 | ) | | | 11.76 | | | | 7.92 | | |
Dividends from net investment income | | | (0.77 | ) | | | (0.52 | ) | | | (0.20 | ) | | | (0.78 | ) | | | (0.47 | ) | |
Distributions from net realized gains | | | — | | | | (3.60 | ) | | | (9.03 | ) | | | (3.18 | ) | | | (0.63 | ) | |
Total dividends and distributions | | | (0.77 | ) | | | (4.12 | ) | | | (9.23 | ) | | | (3.96 | ) | | | (1.10 | ) | |
Net asset value, end of year | | $ | 53.39 | | | $ | 46.26 | | | $ | 46.66 | | | $ | 61.87 | | | $ | 54.07 | | |
Total investment return2 | | | 17.29 | % | | | 9.02 | % | | | (11.44 | )% | | | 22.69 | % | | | 16.98 | % | |
Ratios to average net assets: | |
Expenses | | | 0.76 | % | | | 0.74 | % | | | 0.70 | % | | | 0.67 | % | | | 0.72 | % | |
Net investment income (loss) | | | 1.83 | % | | | 1.76 | % | | | 1.08 | % | | | 0.81 | % | | | 1.28 | % | |
Supplemental data: | |
Net assets, end of year (000's) | | $ | 35,390 | | | $ | 32,472 | | | $ | 32,019 | | | $ | 36,117 | | | $ | 30,132 | | |
Portfolio turnover | | | 58 | % | | | 65 | % | | | 96 | % | | | 69 | % | | | 129 | % | |
1 Calculated using the average shares method.
2 Total investment return is calculated assuming a $10,000 investment on the first day of each year reported, reinvestment of all dividends and other distributions, if any, at net asset value on the ex-dividend dates, and a sale at net asset value on the last day of each year reported. The figures do not include any applicable program fees; results would be lower if they were included. Returns do not reflect the deduction of taxes that a shareholder would pay on Fund distributions or the redemption of Fund shares.
See accompanying notes to financial statements
25
UBS U.S. Allocation Fund
Notes to financial statements
Organization and significant accounting policies
UBS U.S. Allocation Fund (the "Fund") is a series of UBS Investment Trust (the "Trust") and is registered with the US Securities and Exchange Commission ("SEC") under the Investment Company Act of 1940 (the "1940 Act"), as amended, as an open-end, diversified management investment company. The Trust was organized on March 28, 1991, as a business trust under the laws of the Commonwealth of Massachusetts and currently has one operating series.
UBS Asset Management (Americas) LLC ("UBS AM or the "Advisor"), formerly known as UBS Asset Management (Americas) Inc. ("UBS AM" or the "Advisor") serves as the investment advisor and administrator for the Fund. UBS Asset Management (US) Inc. ("UBS AM (US)") serves as the principal underwriter for the Fund. UBS AM and UBS AM (US) are indirect wholly owned subsidiaries of UBS Group AG. UBS Group AG is an internationally diversified organization with headquarters in Zurich, Switzerland. UBS Group AG operates in many areas of the financial services industry.
The Fund currently offers Class A and Class P shares. Each class represents interests in the same assets of the Fund, and the classes are identical except for differences in their sales charge structures, ongoing service and distribution charges and certain transfer agency and related services expenses. All classes of shares have equal voting privileges except that each class has exclusive voting rights with respect to its service and/or distribution plan, if any. Class P shares have no service or distribution plan.
In the normal course of business the Fund may enter into contracts that contain a variety of representations that provide indemnification for certain liabilities. The Fund's maximum exposure under these arrangements is unknown, as this would involve future claims that may be made against the Fund that have not yet occurred. However, the Fund has not had any prior claims or losses pursuant to these contracts and expects the risk of loss to be remote.
The Financial Accounting Standards Board ("FASB") Accounting Standards Codification ("ASC") is the exclusive reference of authoritative US generally accepted accounting principles ("US GAAP") recognized by the FASB to be applied by nongovernmental entities. Rules and interpretive releases of the SEC under authority of federal laws are also sources of authoritative US GAAP for SEC registrants. The Fund's financial statements are prepared in accordance with US GAAP, which may require the use of management estimates and assumptions. Actual results could differ from those estimates.
In October 2022, the SEC adopted the Tailored Shareholder Reports for Mutual Funds and Exchange-Traded Funds rule and reform amendments requiring open-end management investment companies, including mutual funds and exchange-traded funds, to transmit concise and visually engaging semi-annual and annual tailored shareholder reports that highlight key information, including fund expenses, performance, and holdings to shareholders. Certain information from the Fund's current shareholder reports, including the Fund's investment portfolio, financial statements and financial highlights, will not appear in the tailored shareholder report but will be filed on a semiannual basis on Form N-CSR. This information will be available online, mailed upon request and filed on a semiannual basis. The rule and form amendments have a compliance date of July 24, 2024.
The following is a summary of significant accounting policies:
Investment transactions, investment income and expenses—Investment transactions are recorded on the trade date. Realized gains and losses from investment transactions and foreign exchange transactions are calculated using the identified cost method. Dividend income and expense are recorded net of withholding taxes on the ex-dividend date ("ex-date") except in the case of certain dividends from foreign securities which are recorded as soon after the ex-date as the Fund, using reasonable diligence, becomes aware of such dividends. Interest income is recorded on an accrual basis. Discounts are accreted and premiums are amortized as adjustments to interest income and the identified cost of investments.
26
UBS U.S. Allocation Fund
Notes to financial statements
Income, expenses (excluding class-specific expenses) and realized/unrealized gains/losses are allocated proportionately to each class of shares based upon the relative net asset value of outstanding shares (or the value of dividend eligible shares, as appropriate) of each class at the beginning of the day after adjusting for current capital share activity of the respective classes. Class specific expenses are charged directly to the applicable class of shares.
Dividends and distributions—Dividends and distributions to shareholders are recorded on the ex-dividend date. The amount of dividends from net investment income and distributions from net realized capital gains and/or return of capital are determined in accordance with US federal income tax regulations, which may differ from US GAAP. These "book/tax" differences are either considered temporary or permanent in nature. To the extent these differences are permanent in nature, such amounts are reclassified within the capital accounts based on their federal tax-basis treatment; temporary differences do not require reclassification.
Foreign currency translation—The books and records of the Fund are maintained in US dollars. Foreign currency amounts are translated into US dollars as follows: (1) the foreign currency market value of investment securities and other assets and liabilities stated in foreign currencies are translated into US dollars based on the current exchange rates each business day; and (2) purchases and sales of investment securities and income and expenses are translated at the rate of exchange prevailing on the respective dates of such transactions. The resulting exchange gains and losses are included in the Statement of operations.
The Fund does not generally isolate the effect of fluctuations in foreign exchange rates from the effect of the changes in the market prices of securities. However, the Fund does isolate the effect of fluctuations in foreign exchange rates when determining the realized gain or loss upon the sale or maturity of foreign currency denominated securities pursuant to US federal income tax regulations. Net realized foreign currency transaction gain (loss) is treated as ordinary income (loss) for income tax reporting purposes.
Concentration of risk—Investing in securities of foreign issuers and currency transactions may involve certain considerations and risks not typically associated with investments in the United States. These risks include revaluation of currencies, adverse fluctuations in foreign currency values and possible adverse political, social and economic developments, including those particular to a specific industry, country or region, which could cause the securities and their markets to be less liquid and prices more volatile than those of comparable US companies and US government securities. These risks are greater with respect to securities of issuers located in emerging market countries in which the Fund invests.
The ability of the issuers of debt securities held by the Fund to meet their obligations may be affected by economic, political and other developments particular to a specific industry, country, state or region.
Investments in bonds with ratings of BB (Standard & Poor's Financial Services LLC or Fitch Ratings, Inc.) or Ba (Moody's Investors Service, Inc.) or below (commonly referred to as "high yield" bonds), or deemed of equivalent quality, have an increased risk of defaulting or otherwise being unable to honor a financial obligation. These securities are considered to be predominantly speculative with respect to an issuer's capacity to pay interest and repay principal in accordance with the terms of the obligations. Lower-quality bonds are more likely to be subject to an issuer's default or downgrade than investment grade (higher-quality) bonds.
Valuation of investments
The Fund generally calculates its net asset value on days that the New York Stock Exchange ("NYSE") is open. The Fund calculates net asset value as of the close of regular trading on the NYSE (generally, 4:00 p.m., Eastern Time). The NYSE normally is not open, and the Fund does not price its shares, on most national holidays and Good Friday. To the extent that the Fund's assets are traded in other markets on days when the NYSE is not open, the value of the Fund's assets may be affected on those days. If trading on the NYSE is halted for the day before 4:00 p.m., Eastern Time, the Fund's net asset value per share generally will still be calculated as of the close of regular trading
27
UBS U.S. Allocation Fund
Notes to financial statements
on the NYSE. The time at which the Fund calculates its net asset value and until which purchase, sale or exchange orders are accepted may be changed as permitted by the SEC.
The Fund calculates its net asset value based on the current market value, where available, for its portfolio investments. The Fund normally obtains market values for its investments from independent pricing sources and brokerdealers. Independent pricing sources may use reported last sale prices, official market closing prices, current market quotations or valuations from computerized "evaluation" systems that derive values based on comparable investments. An evaluation system incorporates parameters such as security quality, maturity and coupon, and/or research and evaluations by its staff, including review of broker-dealer market price quotations, if available, in determining the valuation of the portfolio investments. Investments also may be valued based on appraisals derived from information concerning the investment or similar investments received from recognized dealers in those holdings.
Investments traded in the over-the-counter ("OTC") market and listed on The NASDAQ Stock Market, Inc. ("NASDAQ") normally are valued at the NASDAQ Official Closing Price. Other OTC securities are valued at the last bid price on the valuation date available prior to valuation. Investments which are listed on US and foreign stock exchanges normally are valued at the market closing price, the last sale price on the day the securities are valued or, lacking any sales on such day, at the last available bid price. Investments listed on foreign stock exchanges may be fair valued based on significant events that have occurred subsequent to the close of the foreign markets. In cases where investments are traded on more than one exchange, the investments are valued on the exchange designated as the primary market by UBS AM. If a market value is not readily available from an independent pricing source for a particular investment, that investment is valued at fair value as determined in good faith by or under the direction of the Fund's Board of Trustees (the "Board"). Foreign currency exchange rates are generally determined as of the close of the NYSE.
Certain investments in which the Fund invests may be traded in markets that close before 4:00 p.m., Eastern Time. Normally, developments that occur between the close of the foreign markets and 4:00 p.m., Eastern Time, will not be reflected in the Fund's net asset value. However, if the Fund determines that such developments are so significant that they will materially affect the value of the Fund's investments, the Fund may adjust the previous closing prices to reflect what is believed to be the fair value of these investments as of 4:00 p.m., Eastern Time.
The Fund may use a systematic fair valuation model provided by an independent third party to value investments principally traded in foreign markets in order to adjust for possible stale pricing that may occur between the close of the foreign exchanges and the time for valuation. The systematic fair valuation model may use calculations based on indices of domestic securities and other appropriate indicators, such as prices of relevant ADRs and futures contracts. If an investment is valued at a "fair value," that value is likely to be different from the last quoted market price for the investment. The use of the fair valuation model may result in securities being transferred between Level 1 and Level 2 of the fair valuation hierarchy at the end of the reporting period.
The amortized cost method of valuation, which approximates market value, generally is used to value short-term debt instruments with 60 days or less remaining to maturity, unless the Board determines that this does not represent fair value.
Investments in open-end investment companies are valued at the daily closing net asset value of the respective investment company. Pursuant to the Fund's use of the practical expedient within ASC Topic 820, Fair Value Measurement, investments in investment companies without publicly published prices are also valued at the daily net asset value.
All investments quoted in foreign currencies are valued daily in US dollars on the basis of the foreign currency exchange rates prevailing at the time such valuation is determined by the Fund's custodian.
28
UBS U.S. Allocation Fund
Notes to financial statements
Futures contracts are generally valued at the settlement price established each day on the exchange on which they are traded. Forward foreign currency contracts, if any, are valued daily using forward exchange rates quoted by independent pricing services.
Swaps are marked-to-market daily based upon values from third-party vendors or quotations from market makers to the extent available. In the event that market quotations are not readily available or deemed unreliable, the swap is valued at fair value as determined in good faith by or under the direction of the Board.
The Board has designated UBS AM as the valuation designee pursuant to Rule 2a-5 under the 1940 Act, and delegated to UBS AM the responsibility for making fair value determinations with respect to portfolio holdings. UBS AM, as the valuation designee, is responsible for periodically assessing any material risks associated with the determination of the fair value of investments; establishing and applying fair value methodologies; testing the appropriateness of fair value methodologies; and overseeing and evaluating third-party pricing services. UBS AM has engaged the Equities, Fixed Income, and Multi-Asset Valuation Committee (the "VC") to assist with its designated responsibilities as valuation designee with respect to the Fund's portfolio holdings. The VC is comprised of representatives of management. The VC provides reports to the Board at each quarterly meeting regarding any investments that have been fair valued, valued pursuant to standing instructions approved by the VC, or where non-vendor pricing sources had been used to make fair value determinations when sufficient information exists during the prior quarter. Fair valuation determinations are subject to review at least monthly by the VC during scheduled meetings. Pricing decisions, processes, and controls over fair value determinations are subject to internal and external reviews, including annual internal compliance reviews and periodic internal audit reviews.
The types of investments for which such fair value pricing may be necessary include, but are not limited to: foreign investments under some circumstances; securities of an issuer that has entered into a restructuring; investments whose trading has been halted or suspended; fixed income securities that are in default and for which there is no current market value quotation; and investments that are restricted as to transfer or resale. The need to fair value the Fund's portfolio investments may also result from low trading volume in foreign markets or thinly traded domestic investments, and when a security that is subject to a trading limit or collar on the exchange or market on which it is primarily traded reaches the "limit up" or "limit down" price and no trading has taken place at that price. Various factors may be reviewed in order to make a good faith determination of an investment's fair value. These factors include, but are not limited to, fundamental analytical data relating to the investment; the nature and duration of restrictions on disposition of the investment; and the evaluation of forces which influence the market in which the investment is purchased and sold. Valuing investments at fair value involves greater reliance on judgment than valuing investments that have readily available market quotations. Fair value determinations can also involve reliance on quantitative models employed by a fair value pricing service.
US GAAP requires disclosure regarding the various inputs that are used in determining the value of the Fund's investments. These inputs are summarized into the three broad levels listed below:
Level 1—Unadjusted quoted prices in active markets for identical investments.
Level 2—Other significant observable inputs, including but not limited to, quoted prices for similar investments, interest rates, prepayment speeds and credit risks.
Level 3—Unobservable inputs inclusive of the Fund's own assumptions in determining the fair value of investments.
A fair value hierarchy table has been included near the end of the Fund's Portfolio of investments.
29
UBS U.S. Allocation Fund
Notes to financial statements
Investments
Asset-backed securities—The Fund may invest in asset-backed securities ("ABS"), representing interests in pools of certain types of underlying installment loans, home equity loans, leases of various types of real and personal property and receivables from revolving lines of credit (credit cards). Such assets are securitized through the use of trusts or special purpose corporations. The yield characteristics of ABS differ from those of traditional debt securities. One such major difference is that principal may be prepaid at any time because the underlying obligations generally may be prepaid at any time. ABS may decrease in value as a result of increases in interest rates and may benefit less than other fixed-income securities from declining interest rates because of the risk of prepayment.
Mortgage-backed securities—The Fund may invest in mortgage-backed securities ("MBS"), representing direct or indirect interests in pools of underlying mortgage loans that are secured by real property. These securities provide investors with payments consisting of both principal and interest as the mortgages in the underlying mortgage pools are paid.
The timely payment of principal and interest (but not the market value) on MBS issued or guaranteed by Ginnie Mae (formally known as the Government National Mortgage Association or GNMA) is backed by Ginnie Mae and the full faith and credit of the US government. Obligations issued by Fannie Mae (formally known as the Federal National Mortgage Association or FNMA) and Freddie Mac (formally known as the Federal Home Loan Mortgage Company or FHLMC) are historically supported only by the credit of the issuer, but currently are guaranteed by the US government in connection with such agencies being placed temporarily into conservatorship by the US government.
Some MBS are sponsored or issued by private entities. Payments of principal and interest (but not the market value) of such private MBS may be supported by pools of mortgage loans or other MBS that are guaranteed, directly or indirectly, by the US government or one of its agencies or instrumentalities, or they may be issued without any government guarantee of the underlying mortgage assets but with some form of non-government credit enhancement.
Collateralized mortgage obligations ("CMO") are a type of MBS. A CMO is a debt security that may be collateralized by whole mortgage loans or mortgage pass-through securities. The mortgage loans or mortgage pass-through securities are divided into classes or tranches with each class having its own characteristics. Investors typically receive payments out of the interest and principal on the underlying mortgages. The portions of these payments that investors receive, as well as the priority of their rights to receive payments, are determined by the specific terms of the CMO class.
The yield characteristics of MBS differ from those of traditional debt securities. Among the major differences are that interest and principal payments are made more frequently, usually monthly, and that principal may be prepaid at any time because the underlying mortgage loans or other obligations generally may be prepaid at any time. Prepayments on a pool of mortgage loans are influenced by a variety of economic, geographic, social and other factors. Generally, prepayments on fixed-rate mortgage loans will increase during a period of falling interest rates and decrease during a period of rising interest rates. Certain classes of CMOs and other MBS are structured in a manner that makes them extremely sensitive to changes in prepayment rates. Such classes include interest-only ("IO") and principal-only ("PO") classes. IOs are entitled to receive all or a portion of the interest, but none (or only a nominal amount) of the principal payments, from the underlying mortgage assets. If the mortgage assets underlying an IO experience greater than anticipated principal prepayments, then the total amount of interest payments allocable to the IO class, and therefore the yield to investors, generally will be reduced. Conversely, PO classes are entitled to receive all or a portion of the principal payments, but none of the interest, from the underlying mortgage assets. PO classes are purchased at substantial discounts from par, and the yield to investors will be reduced if principal payments are slower than expected.
30
UBS U.S. Allocation Fund
Notes to financial statements
Real estate investment trusts—The Fund may invest in real estate investment trusts ("REITs"). Distributions from a REIT are initially recorded as dividend income and may subsequently be recharacterized by the REIT at the end of its tax year as a return of capital and/or capital gains. The Fund estimates the character of dividends received from REITs for financial reporting purposes based on the distribution history of each REIT. Once actual distribution characterizations are made available by the REITs, typically after calendar year end, the Fund updates its accounting and/or tax books and records.
Repurchase agreements—The Fund may purchase securities or other obligations from a bank or securities dealer (or its affiliate), subject to the seller's agreement to repurchase them at an agreed upon date (or upon demand) and price. The Fund maintains custody of the underlying obligations prior to their repurchase, either through its regular custodian or through a special "tri-party" custodian or sub-custodian that maintains a separate account for both the Fund and its counterparty. The underlying collateral is valued daily in an effort to ensure that the value, including accrued interest, is at least equal to the repurchase price.
Repurchase agreements carry certain risks not associated with direct investments in securities, including a possible decline in the market value of the underlying obligations. If their value becomes less than the repurchase price, plus any agreed-upon additional amount, the counterparty must provide additional collateral so that the collateral is at least equal to the repurchase price plus any agreed-upon additional amount. The difference between the total amount to be received upon repurchase of the obligations and the price that was paid by the Fund upon acquisition is accrued as interest and included in its net investment income. In the event of default of the obligation to repurchase, the Fund generally has the right to liquidate the collateral and apply the proceeds in satisfaction of the obligation. Repurchase agreements involving obligations other than U.S. government securities (such as commercial paper, corporate bonds, equities and mortgage loans) may be subject to special risks and may not have the benefit of certain protections in the event of counterparty insolvency. If the seller (or seller's guarantor, if any) becomes insolvent, the Fund may suffer delays, costs and possible losses in connection with the disposition or retention of the collateral. Under certain circumstances, in the event of default or bankruptcy by the other party to the agreement, realization and/or retention of the collateral may be subject to legal proceedings. The Fund intends to enter into repurchase agreements only in transactions with counterparties believed by UBS AM to present minimal credit risk.
The Fund may participate in joint repurchase agreement transactions with other funds' managed or advised by UBS AM in accordance with an exemptive order granted by the SEC pursuant to Section 17(d) of the 1940 Act and Rule 17d-1 thereunder. Under certain circumstances, the Fund may engage in a repurchase agreement transaction with a yield of zero in order to invest cash amounts remaining in its portfolio at the end of the day in order to avoid having the Fund potentially exposed to a fee for uninvested cash held in a business account at a bank.
Restricted securities—The Fund may invest in securities that are subject to legal or contractual restrictions on resale. These securities generally may be resold in transactions exempt from registration or to the public if the securities are registered. Disposal of these securities may involve time-consuming negotiations and expense, and prompt sale at an acceptable price may be difficult. Information regarding restricted securities, if any, is included in Fund's portfolio footnotes.
Securities traded on to-be-announced basis—The Fund may from time to time purchase, or short sell, securities on a to-be-announced ("TBA") basis. In a TBA transaction, the Fund commits to purchasing securities for which all specific information is not yet known at the time of the trade, particularly the face amount and maturity date of the underlying securities. Securities purchased on a TBA basis are not settled until they are delivered to the Fund, normally 15 to 45 days later. Beginning on the date the Fund enters into a TBA transaction, cash, U.S. government securities or other liquid securities are segregated in an amount equal in value to the purchase price of the TBA security. These transactions are subject to market fluctuations and their current value is determined in the same manner as for other securities.
31
UBS U.S. Allocation Fund
Notes to financial statements
Treasury Inflation Protected Securities—The Fund may purchase Treasury inflation protected securities ("TIPS") which are debt securities issued by the US Treasury. TIPS adjust for inflation based on changes in the published Consumer Price Index ("CPI"). During periods of inflation when the CPI index increases, the principal amount of the debt to which the rate of interest is applied increases, which in turn increases the yield. During periods of deflation when the CPI index decreases, the principal amount of the debt to which the rate of interest is applied decreases, which in turn lowers the yield. At maturity, TIPS return the higher of the principal amount at maturity or the initial face amount of the debt.
Derivative instruments
Purchased options—The Fund may purchase put and call options, in order to gain exposure to or protect against changes in the markets or in an attempt to enhance income or gains. Purchasing call options tends to increase exposure to the underlying instrument. Purchasing put options tends to decrease exposure to the underlying instrument.
The Fund pays a premium which is included in the Statement of assets and liabilities as an investment and subsequently marked to market to reflect the current value of the option. Premiums paid for purchasing options which expire are treated as realized losses. Purchased options are shown as portfolio holdings within the portfolio of investments and are included in the Statement of assets and liabilities in investments, at value.
The risk associated with purchasing put and call options is limited to the premium paid. Premiums paid for purchasing options which are exercised or closed are added to the amounts paid or offset against the proceeds on the underlying future, security or currency transaction to determine the realized gain or loss.
Option writing—The Fund may write (sell) put and call options, including, but not limited to, options on foreign or US securities, indices, foreign currencies, options on futures contracts and options on swap agreements (commonly referred to as swaptions), in order to gain exposure to or protect against changes in the markets or in an attempt to enhance income or gains.
When the Fund writes a call or a put option, an amount equal to the premium received by the Fund is included on the Fund's Statement of assets and liabilities as a liability. The amount of the liability is subsequently marked-to-market to reflect the current market value of the option written. If an option which the Fund has written either expires on its stipulated expiration date or the Fund enters into a closing purchase transaction, the Fund realizes a gain (or loss if the cost of a closing purchase transaction exceeds the premium received when the option was written) without regard to any unrealized gain or loss on the underlying security or derivative instrument, and the liability related to such option is extinguished. If a call option, which the Fund has written, is exercised, the Fund recognizes a realized gain or loss (long-term or short-term, depending on the holding period of the underlying security) from the sale of the underlying security or derivative instrument and the proceeds from the sale are increased by the premium originally received. If a put option, which the Fund has written, is exercised, the amount of the premium originally received reduces the cost of the security or derivative instrument which the Fund purchases upon exercise of the option.
In writing an option, the Fund bears the market risk of an unfavorable change in the price of the derivative instrument, security, or currency underlying the written option. Exercise of an option written by the Fund could result in the Fund selling or buying a derivative instrument, security or currency at a price different from current market value.
In the normal course of trading activities, the Fund trades and holds certain fair valued derivative contracts that constitute guarantees. Such contracts include written put options, where the Fund will be obligated to purchase securities at specified prices (i.e. the options are exercised by the counterparties). It also includes written swaptions, where the Fund will be obligated to enter into a swap agreement.
32
UBS U.S. Allocation Fund
Notes to financial statements
The maximum payout for written put options is limited to the number of put option contracts written and the related strike prices, respectively. Maximum payout amounts could be offset by the subsequent sale, if any, of assets obtained via the execution of a payout event.
Futures contracts—The Fund may purchase or sell futures contracts as part of its investment strategy, to increase or reduce its exposure to an asset class without purchasing or selling the underlying securities, either as a hedge or to enhance income or realized gains. Generally, a futures contract is a standard binding agreement to buy or sell a specified quantity of an underlying reference asset, such as a specific security or currency, at a specified price at a specified later date.
Upon entering into a futures contract, the Fund is required to deliver to a broker an amount of cash and/or US government securities equal to a certain percentage of the contract amount. This amount is known as the "initial margin". Subsequent payments, known as "variation margin", generally are made or received by the Fund, depending on the daily fluctuations in the value of the underlying futures contracts. Such variation margin is recorded for financial statement purposes on a daily basis as an unrealized appreciation or depreciation on futures until the futures contract is closed or expires, at which time the net gain or loss is reclassified to realized gain or loss on futures.
Using futures contracts involves various market risks, including interest rate and equity risk. Risks of entering into futures contracts include the possibility that there may be an illiquid market or that a change in the value of the contract may not correlate with changes in the value of the underlying securities. To the extent that market prices move in an unexpected direction, there is a risk that the Fund will not achieve the anticipated benefits of the futures contract or may realize a loss.
Futures contracts, if any, are shown as portfolio holdings within the Portfolio of investments. Variation margin, if applicable, is shown in Variation margin receivable or payable on futures contracts within the Statement of assets and liabilities.
Swap agreements—The Fund may engage in swap agreements, including, but not limited to, credit default and total return swap agreements. The Fund expects to enter into these transactions to preserve a return or spread on a particular investment or to hedge a portion of the portfolio's duration, to protect against any increase in the price of securities the Fund anticipates purchasing at a later date, to gain exposure to certain markets in the most economical way possible or in an attempt to enhance income or gains.
The Fund accrues for interim payments on swap agreements on a daily basis, with the net amount recorded within unrealized appreciation or depreciation of swap agreements. Once interim payments are settled in cash, the net amount is recorded as realized gain/loss on swap agreements, in addition to realized gain/loss recorded upon the termination of swap agreements on the Statement of operations. Fluctuations in the value of swap agreements are recorded for financial statement purposes as unrealized appreciation or depreciation on swap agreements.
The Fund may enter into interest rate swap agreements with another party to receive or pay interest (e.g., an exchange of fixed rate payments for floating rate payments) to protect themselves from interest rate fluctuations. This type of swap is an agreement that obligates two parties to exchange a series of cash flows at specified intervals based upon or calculated by reference to a specified interest rate(s) for a specified amount. The payment flows are usually netted against each other, with the difference being paid by one party to the other. Interest rate swap agreements are subject to general market risk, liquidity risk, counterparty risk and interest rate risk.
Credit default swap agreements involve commitments to make or receive payments in the event of a default of a security or other credit event of the referenced obligation. As a buyer, the Fund would make periodic payments to the counterparty, and the Fund would receive payments only upon the occurrence of a default or credit event. If no default or credit event occurs, the Fund will lose its periodic stream of payments over the term of the contract.
33
UBS U.S. Allocation Fund
Notes to financial statements
However, if a default or a credit event does occur, the Fund typically would receive full notional value for the referenced obligation that may have little or no value. As a seller, the Fund would receive periodic payments from the counterparty, and the Fund would make payments only upon the occurrence of a default or a credit event. If no default or credit event occurs, the Fund will gain the periodic stream of payments it received over the term of the contract and the counterparty will lose its periodic stream of payments over the term of the contract. However, if a default or credit event occurs, the Fund typically would pay full notional value for the referenced obligation that may have little or no value. Credit default swap agreements may involve greater risks than if the Fund had invested in the referenced obligation directly and are subject to general market risk, liquidity risk and credit risk.
Credit default swap agreements on credit indices involve one party making a stream of payments to another party in exchange for the right to receive a specified return in the event of a write-down, principal shortfall, interest shortfall or default of all or part of the referenced entities comprising the credit index. A credit index is a list of a basket of credit instruments or exposures designed to be representative of some part of the credit market as a whole. These indices are made up of referenced credits that are judged by a poll of dealers to be the most liquid entities in the credit default swap market based on the sector of the index. Components of the indices may include, but are not limited to, investment grade securities, high yield securities, asset backed securities, emerging markets, and/or various credit ratings within each sector. Credit indices are traded using credit default swaps with standardized terms including a fixed spread and standard maturity dates. An index credit default swap references all the names in the index, and if there is a default, the credit event is settled based on that name's weight in the index. The composition of the indices changes periodically, usually every six months, and for most indices, each name has an equal weight in the index. The Fund may use credit default swap agreements on credit indices to hedge a portfolio of credit default swaps or bonds with a credit default swap on indices which is less expensive than it would be to buy many credit default swaps to achieve a similar effect. Credit default swap agreements on credit indices are benchmarks for protecting investors owning bonds against default, and traders use them to speculate on changes in credit quality.
Credit default swap agreements on corporate issues or sovereign issues of an emerging market country involve one party making a stream of payments to another party in exchange for the right to receive a specified return in the event of a default or other credit event. If a credit event occurs and cash settlement is not elected, a variety of other obligations may be delivered in lieu of the specific referenced obligation. The ability to deliver other obligations may result in a cheapest-to-deliver option (the buyer of protection's right to choose the deliverable obligation with the lowest value following a credit event). The Fund may use credit default swap agreements on corporate issues or sovereign issues of an emerging market country to provide a measure of protection against defaults of the issuers (i.e., to reduce risk where the Fund owns or has exposure to the referenced obligation) or to take an active long or short position with respect to the likelihood of a particular issuer's default.
The maximum potential amount of future payments (undiscounted) that the Fund as a seller of protection could be required to make under a credit default swap agreement would be an amount equal to the notional amount of the agreement, which may exceed the amount of the value reflected on the Statement of assets and liabilities. Notional amounts of all credit default swap agreements outstanding as of the period end for which the Fund is the seller of protection are disclosed under the section "Credit default swap agreements on corporate issues and credit indices—sell protection" in the Portfolio of investments. These potential amounts would be partially offset by any recovery values of the respective referenced obligations, upfront payments received upon entering into the agreement, or net amounts received from the settlement of buy protection credit default swap agreements entered into, if any, by the Fund for the same referenced entity or entities.
Total return swap agreements involve commitments to pay or receive interest in exchange for a market-linked return based on notional amounts. To the extent the total return of the security or index underlying the transactions exceeds or falls short of the offsetting interest rate obligation, the Fund will receive a payment from or make a payment to the counterparty, respectively. Total return swap agreements are marked-to-market daily, and the change, if any, is recorded as unrealized appreciation or depreciation. Total return swap agreements are subject to general
34
UBS U.S. Allocation Fund
Notes to financial statements
market risk, liquidity risk, counterparty risk, interest rate risk, credit risk and the risk that there may be unfavorable changes in the underlying investments or instruments.
The use of swap agreements involves investment techniques, risks, and transaction costs different from those associated with ordinary portfolio security transactions, including assumptions about market conditions, interest rates, and other applicable factors. As a result, the performance of the Fund will be different than if it had used ordinary portfolio security transactions. OTC swap agreements do not involve the delivery of securities and are subject to counterparty risk. If the other party to a swap agreement defaults and fails to consummate the transaction, the Fund's risk of loss will consist of the net amount of interest or other payments that the Fund is contractually entitled to receive. Therefore, the Fund would consider the creditworthiness of the counterparty to a swap agreement in evaluating potential credit risk.
Certain clearinghouses offer clearing for limited types of derivatives transactions, such as interest rate and credit default swap agreements. Centrally cleared swap agreements must be transacted through a futures commission merchant ("FCM") and cleared through a clearinghouse that serves as a central counterparty. The performance of a centrally cleared swap transaction is effectively guaranteed by a central clearinghouse, thereby reducing the Fund's exposure to the credit risk of its original counterparty. The Fund will be required to post specified levels of margin with the clearinghouse or at the instruction of the clearinghouse; the margin required by a clearinghouse may be greater than the margin the Fund would be required to post in an uncleared transaction. Centrally cleared swap agreements, if any, are reported on the Statement of assets and liabilities based on variation margin received or paid, if any.
Swap agreements, if any, are shown as portfolio holdings within the Portfolio of investments.
Derivatives by underlying risk—Investment companies value their derivatives at fair value and recognize changes in fair value through the Statement of operations. Although certain of a Fund's investments in derivatives may be intended to hedge risk from a portfolio implementation/economic perspective, derivatives are considered to be "non hedge transactions" for purposes of disclosure under US GAAP as reflected in the Fund's financial reports.
The volume of derivatives as disclosed in the Fund's Portfolio of investments is representative of the volume of derivatives outstanding during the period ended August 31, 2024.
Swap agreements, forward foreign currency contracts, swaptions and options written entered by the Fund may contain credit-risk related contingent features that could be triggered subject to certain circumstances. Such circumstances include agreed upon net asset value thresholds. If triggered, the derivative counterparty could request additional cash margin and/or terminate the derivative contract. The aggregate fair value of the derivative contracts that are in a net liability position that contain these triggers can be found in the Fund's Portfolio of investments. The aggregate fair value of assets that are already posted as collateral as of August 31, 2024 is reflected in the Statement of assets and liabilities.
At August 31, 2024, the Fund had the following derivatives categorized by underlying risk:
Asset derivatives1
| | | Interest
rate risk | | Foreign
exchange
risk | | Credit
risk | | Equity
risk | | Total
value | |
Futures contracts | | $ | 29,061 | | | $ | — | | | $ | — | | | $ | 581,625 | | | $ | 610,686 | | |
Swap agreements | | | — | | | | — | | | | 94,885 | | | | — | | | | 94,885 | | |
Forward foreign currency contracts | | | — | | | | 209 | | | | — | | | | — | | | | 209 | | |
Total | | $ | 29,061 | | | $ | 209 | | | $ | 94,885 | | | $ | 581,625 | | | $ | 705,780 | | |
35
UBS U.S. Allocation Fund
Notes to financial statements
1 In the Statement of assets and liabilities, options and swaptions purchased are shown within investments, at value, swap agreements (except centrally cleared swap agreements) are shown within swap agreements, at value, while forward foreign currency contracts are shown using unrealized appreciation on forward foreign currency contracts. Futures contracts are reported in the table above using cumulative appreciation of futures contracts and centrally cleared swap agreements are reported at value, as reported in the futures contracts and centrally cleared swap agreements tables at the end of the Portfolio of investments, respectively, but only the variation margin to be received, if any, is reported within the Statement of assets and liabilities.
Liability derivatives1
| | | Interest
rate risk | | Foreign
exchange
risk | | Credit
risk | | Equity
risk | | Total
value | |
Futures contracts | | $ | (74,591 | ) | | $ | — | | | $ | — | | | $ | (181,844 | ) | | $ | (256,435 | ) | |
Swap agreements | | | — | | | | — | | | | (104,141 | ) | | | — | | | | (104,141 | ) | |
Forward foreign currency contracts | | | — | | | | (2,638 | ) | | | — | | | | — | | | | (2,638 | ) | |
Total | | $ | (74,591 | ) | | $ | (2,638 | ) | | $ | (104,141 | ) | | $ | (181,844 | ) | | $ | (363,214 | ) | |
1 In the Statement of assets and liabilities, options and swaptions written are shown within options and swaptions written, at value, swap agreements (except centrally cleared swap agreements) are shown within swap agreements, at value, while forward foreign currency contracts are shown within unrealized depreciation on forward foreign currency contracts. Futures contracts are reported in the table above using cumulative depreciation of futures contracts and centrally cleared swap agreements are reported at value, at the end of the Portfolio of investments, respectively, but only the variation margin to be paid, if any, is reported within the Statement of assets and liabilities.
During the period ended August 31, 2024, net realized gain (loss) from derivatives were as follows:
Realized gain (loss)1
| | | Interest
rate risk | | Foreign
exchange
risk | | Credit
risk | | Equity
risk | | Total
value | |
Options and swaptions purchased | | $ | (1,078 | ) | | $ | — | | | $ | — | | | $ | — | | | $ | (1,078 | ) | |
Options and swaptions written | | | 234 | | | | — | | | | — | | | | — | | | | 234 | | |
Futures contracts | | | (341,575 | ) | | | — | | | | — | | | | (448,142 | ) | | | (789,717 | ) | |
Swap agreements | | | 104,483 | | | | — | | | | (65,647 | ) | | | — | | | | 38,836 | | |
Forward foreign currency contracts | | | — | | | | 3,112 | | | | — | | | | — | | | | 3,112 | | |
Total net realized gains (loss) | | $ | (237,936 | ) | | $ | 3,112 | | | $ | (65,647 | ) | | $ | (448,142 | ) | | $ | (748,613 | ) | |
1 The net realized gain (loss) is shown in the Statement of operations in net realized gain (loss) on futures contracts, options and swaptions written, swap agreements and forward foreign currency contracts, unless otherwise noted. The net realized gain (loss) on options and swaptions purchased is shown in the Statement of operations in net realized gain (loss) on investments.
During the period ended August 31, 2024, net unrealized appreciation (depreciation) from derivatives were as follows:
Net change in unrealized appreciation (depreciation)1
| | | Interest
rate risk | | Foreign
exchange
risk | | Credit
risk | | Equity
risk | | Total
value | |
Options and swaptions purchased | | $ | (516 | ) | | $ | — | | | $ | — | | | $ | — | | | $ | (516 | ) | |
Options and swaptions written | | | (46 | ) | | | — | | | | — | | | | — | | | | (46 | ) | |
Futures contracts | | | (212,549 | ) | | | — | | | | — | | | | 378,188 | | | | 165,639 | | |
Swap agreements | | | — | | | | — | | | | 92,188 | | | | (1,397 | ) | | | 90,791 | | |
Forward foreign currency contracts | | | — | | | | (11,083 | ) | | | — | | | | — | | | | (11,083 | ) | |
Total net change in unrealized appreciation (depreciation) | | $ | (213,111 | ) | | $ | (11,083 | ) | | $ | 92,188 | | | $ | 376,791 | | | $ | 244,785 | | |
36
UBS U.S. Allocation Fund
Notes to financial statements
1 The change in net unrealized appreciation (depreciation) is shown in the Statement of operations in change in net unrealized appreciation (depreciation) on futures contracts, options and swaptions written, swap agreements and forward foreign currency contracts, unless otherwise noted. The change in net unrealized appreciation (depreciation) of options and swaptions purchased is shown in the Statement of operations in change in net unrealized appreciation (depreciation) on investments.
Offsetting of certain derivatives—The Fund typically enters into International Swaps and Derivatives Association, Inc. Master Agreements ("ISDA Master Agreements") or similar master agreements with its OTC derivative contract counterparties in order to, among other things, reduce its credit risk to counterparties. ISDA Master Agreements include provisions for general obligations, representations, collateral and events of default or termination. Under an ISDA Master Agreement, the Fund typically may offset with the counterparty certain derivative financial instrument's payables and/or receivables with collateral held and/or posted and create one single net payment (close-out netting) in the event of default or termination. The Statement of assets and liabilities is presented gross of any netting.
At August 31, 2024, derivative assets and liabilities (by type) on a gross basis and derivatives subject to an enforceable master netting arrangement ("MNA") or similar were as follows:
UBS U.S. Allocation Fund
Derivative Financial Instruments: | | Assets | | Liabilities | |
Total gross amount of derivative assets and liabilities in the Statement of assets and liabilities1 | | $ | 705,780 | | | $ | (363,214 | ) | |
Derivatives not subject to a MNA or similar agreements | | | (705,571 | ) | | | 360,576 | | |
Total gross amount of assets and liabilities subject to MNA or similar agreements | | $ | 209 | | | $ | (2,638 | ) | |
The following tables present the Fund's derivative assets and liabilities by counterparty net of amounts available for offset under a MNA and net of the related collateral received/pledged by the Fund as of the period end.
Counterparty | | Gross amount of
assets | | Financial
instruments
and derivatives
available for
offset | | Collateral
received2 | | Net amount
of assets | |
SSB | | $ | 209 | | | $ | (209 | ) | | $ | — | | | $ | — | | |
Counterparty | | Gross amount of
liabilities | | Financial
instruments
and derivatives
available for
offset | | Collateral
pledged2 | | Net amount
of liabilities | |
BOA | | $ | (1,635 | ) | | $ | — | | | $ | — | | | $ | (1,635 | ) | |
SSB | | | (1,003 | ) | | | 209 | | | | — | | | | (794 | ) | |
Total | | $ | (2,638 | ) | | $ | 209 | | | $ | — | | | $ | (2,429 | ) | |
1 Includes cumulative appreciation/depreciation of futures contracts and centrally cleared swaps, at value as reported in the futures contracts and centrally cleared swaps tables in the Portfolio of investments, but only the unpaid variation margin is reported within the Statement of assets and liabilities within variation margin on futures contracts and centrally cleared swap agreements, respectively.
2 In some instances, the actual collateral received and/or pledged may be more than the amount shown and may be comprised of cash collateral, non-cash collateral or combination of both.
Investment advisor and administrator fees and other transactions with affiliates
The Board has approved an Investment Advisory and Administration Contract (the "Advisory Contract"), under which UBS AM serves as investment advisor and administrator of the Fund. In accordance with the Advisory Contract, the Fund is to pay UBS AM an investment advisory and administration fee, which is to be accrued daily
37
UBS U.S. Allocation Fund
Notes to financial statements
and paid monthly, at an annual rate of 0.50% of the Fund's average daily net assets up to $250 million and 0.45% thereafter.
UBS AM has agreed to permanently reduce its advisory and administration fee based on the Fund's average daily net assets so that it is assessed as follows: $0 to $250 million—0.50%; in excess of $250 million up to $500 million—0.45%; in excess of $500 million up to $2 billion—0.40%; and over $2 billion—0.35%. Accordingly, for the year ended August 31, 2024, UBS AM did not waive any investment advisory and administration fees. At August 31, 2024, the Fund owed UBS AM $95,171 for investment advisory and administration fees.
UBS AM has contractually undertaken to waive fees/reimburse a portion of the Fund's expenses, when necessary, to maintain the total annual operating expenses (excluding (1) dividend expense, borrowing costs and interest expense relating to short sales, and (2) investments in other investment companies, interest, taxes, brokerage commissions, trustee elections as well as other matters related to shareholder meetings (unless otherwise separately agreed by UBS AM), and extraordinary expenses, if any) of Class A and Class P shares at a level not to exceed 1.15% and 0.90%,respectively through December 31, 2024. The Fund will repay UBS AM for any previously waived fees/reimbursed expenses during the three-year period following August 31, 2021, to the extent that operating expenses (with certain exclusions such as dividend expense, borrowing costs, and interest expense relating to short sales, and interest, taxes, brokerage commissions, trustee elections as well as other matters related to shareholder meetings (unless otherwise separately agreed by UBS AM), and extraordinary expenses, if any) are otherwise below the expense caps in effect at the time the fees or expenses were waived/reimbursed. For the period ended August 31, 2024, the Fund had no fee waivers/expense reimbursements subject to repayment.
During the period ended August 31, 2024, the Fund engaged in purchase and sale transactions where an affiliate was underwriter. In such cases, the affiliate underwriter was not compensated and each trade was approved by the Board.
Service and distribution plans
UBS AM (US) is the principal underwriter of the Fund's shares. The Fund has adopted service and/or distribution plans (the "Plans") pursuant to Rule 12b-1 under the 1940 Act for Class A shares. The Plans govern payments made for the expenses incurred in the service and/or distribution of Class A shares. The Fund pays UBS AM (US) monthly service fees at an annual rate of 0.25% of the average daily net assets of Class A shares. At August 31, 2024, the Fund owed UBS AM (US) $40,104 for service and distribution fees.
UBS AM (US) also receives the proceeds of the initial sales charges paid upon the purchase of Class A shares and the contingent deferred sales charges paid by shareholders upon certain redemptions of Class A shares. UBS AM (US) has informed the Fund that for the period ended August 31, 2024, it earned $749 in initial sales charges on Class A shares.
Transfer agency and related services fees
UBS Financial Services Inc. provides certain services to the Fund pursuant to a delegation of authority from BNY Mellon Investment Servicing (US) Inc. ("BNY Mellon"), the Fund's transfer agent, and is compensated for these services by BNY Mellon, not the Fund. For the period ended August 31, 2024, UBS Financial Services Inc. received from BNY Mellon, not the Fund, $35,902 of the total transfer agency and related service fees paid by the Fund to BNY Mellon.
38
UBS U.S. Allocation Fund
Notes to financial statements
Securities lending
The Fund may lend securities up to 331/3% of its total assets to qualified broker-dealers or institutional investors. The loans are initially secured at all times by cash, US government securities and irrevocable letters of credit in an amount at least equal to 102% of the market value of the securities loaned with respect to domestic securities and 105% of the market value of the securities loaned with respect to foreign securities. In the event that the market value of the cash, US government securities, and irrevocable letters of credit securing the loan falls below 100% for domestic securities, and 103% for foreign securities, the borrower must provide additional cash, US government securities, and irrevocable letters of credit so that the total securing the loan is at least 102% of the market value for domestic securities and 105% of the market value for foreign securities.
The Fund will regain ownership of loaned securities to exercise certain beneficial rights; however, the Fund may bear the risk of delay in recovery of, or even loss of rights in, the securities loaned should the borrower fail financially. The Fund receives compensation for lending its securities from interest or dividends earned on the cash, US government securities and irrevocable letters of credit held as collateral, net of fee rebates paid to the borrower plus reasonable administrative and custody fees. Cash collateral received is invested in State Street Navigator Securities Lending Government Money Market Portfolio, which is included in the Fund's Portfolio of investments. State Street Bank and Trust Company serves as the Fund's lending agent.
At August 31, 2024, the Fund had securities on loan at value, cash collateral and non-cash collateral as follows:
Value of securities
on loan | | Cash collateral | | Non-cash
collateral* | | Total collateral | | Security types held
as non-cash
collateral | |
| $ | 522,536 | | | $ | — | | | $ | 534,798 | | | $ | 534,798 | | | U.S. Treasury Notes
and U.S. Treasury Bills | |
* These securities are held for the benefit of the Fund at the Fund's custodian. The Fund cannot repledge or resell this collateral. As such, collateral is excluded from the Statement of assets and liabilities.
Bank line of credit
The Fund participates with other funds managed by UBS AM in a $185 million committed credit facility (the "Committed Credit Facility") with State Street Bank and Trust Company. The Committed Credit Facility is to be utilized for temporary financing until the settlement of sales or purchases of portfolio securities, the repurchase or redemption of shares of the participating Fund at the request of shareholders and other temporary or emergency purposes. The expiration date of the line of credit agreement is March 31, 2025.
Interest on amounts borrowed is calculated based on the prevailing rates in effect at the time of borrowing. The funds covered by the Committed Credit Facility have agreed to pay an annual 25 basis point commitment fee on the average daily balance of the Committed Credit Facility not utilized. Commitment fees have been allocated among the funds in the Committed Credit Facility as follows: 50% of the allocation is based on the relative asset size of funds and the other 50% of the allocation is based on utilization.
For the period ended August 31, 2024, the Fund did not borrow under the Committed Credit Facility.
Purchases and sales of securities
For the period ended August 31, 2024, aggregate purchases and sales of portfolio securities, excluding short-term securities, were $116,322,327 and $153,618,992, respectively.
39
UBS U.S. Allocation Fund
Notes to financial statements
Shares of beneficial interest
There is an unlimited amount of $0.001 par value shares of beneficial interest authorized. Transactions in shares of beneficial interest, at $1.00 per share, were as follows:
For the year ended August 31, 2024:
| | | Class A | | Class P | |
| | | Shares | | Amount | | Shares | | Amount | |
Shares sold | | | 5,675 | | | $ | 265,937 | | | | 31,081 | | | $ | 1,517,517 | | |
Shares repurchased | | | (470,329 | ) | | | (22,025,208 | ) | | | (80,681 | ) | | | (3,903,552 | ) | |
Dividends reinvested | | | 49,754 | | | | 2,298,620 | | | | 10,592 | | | | 503,349 | | |
Net increase (decrease) | | | (414,900 | ) | | $ | (19,460,651 | ) | | | (39,008 | ) | | $ | (1,882,686 | ) | |
For the year ended August 31, 2023:
| | | Class A | | Class P | |
| | | Shares | | Amount | | Shares | | Amount | |
Shares sold | | | 11,175 | | | $ | 478,394 | | | | 69,348 | | | $ | 3,075,743 | | |
Shares repurchased | | | (528,936 | ) | | | (22,728,366 | ) | | | (117,242 | ) | | | (5,204,032 | ) | |
Dividends reinvested | | | 362,698 | | | | 14,576,844 | | | | 63,631 | | | | 2,629,228 | | |
Net increase (decrease) | | | (155,063 | ) | | $ | (7,673,128 | ) | | | 15,737 | | | $ | 500,939 | | |
Federal tax status
The Fund intends to distribute substantially all of its income and to comply with the other requirements of the Internal Revenue Code applicable to regulated investment companies. Accordingly, no provision for federal income taxes is required. In addition, by distributing during each calendar year substantially all of its net investment income, net realized capital gains and certain other amounts, if any, the Fund intends not to be subject to a federal excise tax.
The tax character of distributions paid during the fiscal year ended August 31, 2024 and August 31, 2023 were as follows:
Distribution paid from | | 2024 | | 2023 | |
Ordinary Income | | $ | 3,136,119 | | | $ | 1,926,417 | | |
Long term realized capital gains | | | — | | | | 17,309,338 | | |
Aggregate cost for federal income tax purposes, including derivatives, was $219,583,953; and net unrealized appreciation (depreciation), including derivatives consisted of:
Gross unrealized appreciation | | $ | 32,874,509 | | |
Gross unrealized depreciation | | | (4,443,354 | ) | |
Net unrealized appreciation (depreciation) | | $ | 28,431,155 | | |
The differences between book-basis and tax-basis unrealized appreciation/depreciation is attributable primarily to the tax deferral of losses on wash sales, REIT/ROC open basis adjustments, retained capital gains, premium amortization accruals, and the tax treatment of certain derivative instruments.
40
UBS U.S. Allocation Fund
Notes to financial statements
At August 31, 2024, the components of accumulated earnings (deficit) on a tax basis were as follows:
Undistributed ordinary income | | $ | 3,623,655 | | |
Undistributed long-term capital gain | | | 13,620,614 | | |
Accumulated realized capital and other losses | | | — | | |
Net unrealized appreciation of investments | | | 28,431,658 | | |
Other temporary differences | | | (8,733 | ) | |
Total accumulated earnings (deficit) | | | 45,667,194 | | |
There were no reclassifications arising from permanent "book/tax" differences for the period ended August 31, 2024.
Net capital losses recognized by the Fund may be carried forward indefinitely, and retain their character as short-term and/or long-term losses.
During the fiscal year ended, the Fund utilized $672,742 capital loss carryforwards to offset current year realized gains.
At August 31, 2024, the Fund had no net capital loss carryforward.
ASC 740-10 "Income Taxes-Overall" sets forth a minimum threshold for financial statement recognition of the benefit of a tax position taken or expected to be taken. The Fund has analyzed as of August 31, 2024 that there are no significant uncertain tax positions taken or expected to be taken that would require recognition in financial statements. The Fund recognizes interest and penalties, if any, related to uncertain tax positions as income tax expense in the Statement of operations. During the year ended August 31, 2024, the Fund did not incur any interest or penalties.
Under the applicable foreign tax laws, gains on certain securities held in certain foreign countries may be subject to taxes that will be paid by the Fund.
Each of the tax years in the four year period ended August 31, 2024, remains subject to examination by the Internal Revenue Service and state taxing authorities.
41
UBS U.S. Allocation Fund
Report of independent registered public accounting firm
To the Shareholders and Board of Trustees of
UBS U.S. Allocation Fund
Opinion on the Financial Statements
We have audited the accompanying statement of assets and liabilities of UBS U.S. Allocation Fund (the "Fund") (the sole fund constituting UBS Investment Trust (the "Trust")), including the portfolio of investments, as of August 31, 2024, and the related statement of operations for the year then ended, the statements of changes in net assets for each of the two years in the period then ended, the financial highlights for each of the five years in the period then ended and the related notes (collectively referred to as the "financial statements"). In our opinion, the financial statements present fairly, in all material respects, the financial position of the Fund (the sole fund constituting the Trust) at August 31, 2024, the results of its operations for the year then ended, the changes in its net assets for each of the two years in the period then ended and its financial highlights for each of the five years in the period then ended, in conformity with U.S. generally accepted accounting principles.
Basis for Opinion
These financial statements are the responsibility of the Trust's management. Our responsibility is to express an opinion on the Fund's financial statements based on our audits. We are a public accounting firm registered with the Public Company Accounting Oversight Board (United States) ("PCAOB") and are required to be independent with respect to the Trust in accordance with the U.S. federal securities laws and the applicable rules and regulations of the Securities and Exchange Commission and the PCAOB.
We conducted our audits in accordance with the standards of the PCAOB. Those standards require that we plan and perform the audit to obtain reasonable assurance about whether the financial statements are free of material misstatement, whether due to error or fraud. The Trust is not required to have, nor were we engaged to perform, an audit of the Trust's internal control over financial reporting. As part of our audits, we are required to obtain an understanding of internal control over financial reporting but not for the purpose of expressing an opinion on the effectiveness of the Trust's internal control over financial reporting. Accordingly, we express no such opinion.
Our audits included performing procedures to assess the risks of material misstatement of the financial statements, whether due to error or fraud, and performing procedures that respond to those risks. Such procedures included examining, on a test basis, evidence regarding the amounts and disclosures in the financial statements. Our procedures included confirmation of securities owned as of August 31, 2024, by correspondence with the custodian, brokers and others; when replies were not received from brokers, we performed other auditing procedures. Our audits also included evaluating the accounting principles used and significant estimates made by management, as well as evaluating the overall presentation of the financial statements. We believe that our audits provide a reasonable basis for our opinion.

We have served as the auditor of one or more UBS investment companies since 1978.
New York, New York
October 24, 2024
42
UBS U.S. Allocation Fund
Tax information (unaudited)
We are required by Subchapter M of the Internal Revenue Code of 1986, as amended, to advise you as to the federal tax status of distributions received by shareholders during the fiscal year. Accordingly, the amount of ordinary dividends paid that qualify for the dividends received deduction for corporate shareholders is $1,641,635
For the taxable period ended August 31, 2024, the Fund designates $1,711,684 as the maximum amount that may be considered qualified dividend income for individual shareholders.
Dividends received by tax-exempt recipients (e.g., IRAs and Keoghs) need not be reported as taxable income. Some retirement trusts (e.g., corporate, Keogh and 403(b)(7) plans) may need this information for their annual information reporting.
Shareholders should not use the above information to prepare their tax returns. Since the Fund's fiscal year is not the calendar year, another notification will be sent with respect to calendar year 2024. Such notification, which will reflect the amount to be used by calendar year taxpayers on their federal income tax returns, will be made in conjunction with Form 1099 DIV and will be mailed in February 2025. Shareholders are advised to consult their own tax advisers with respect to the tax consequences of their investment in the Fund.
43
Trustees
Virginia G. Breen
Richard R. Burt
Bernard H. Garil
Heather R. Higgins
Chair
David R. Malpass
Investment Manager and
Administrator
UBS Asset Management (Americas) LLC
787 Seventh Avenue
New York, New York 10019
Principal Underwriter
UBS Asset Management (US) Inc.
787 Seventh Avenue
New York, New York 10019
This report is not to be used in connection with the offering of shares of the Fund unless accompanied or preceded by an effective prospectus.
©UBS 2024. All rights reserved.
UBS Asset Management (Americas) LLC
PRESORTED
STANDARD
U.S. POSTAGE
PAID
COMPUTERSHARE

UBS Asset Management (Americas) LLC
787 Seventh Avenue
New York, NY 10019
(b) Included as part of the financial statements to shareholders filed under Item 7(a) of this form.
Item 8. Changes in and Disagreements with Accountants for Open-End Management Investment Companies.
Not applicable.
Item 9. Proxy Disclosures for Open-End Management Investment Companies.
Not applicable.
Item 10. Remuneration Paid to Directors, Officers, and Others of Open-End Management Investment Companies.
(1) All board members and all members of any advisory board for regular compensation: $23,006
(2) Each board member and each member of an advisory board for special compensation: Not applicable.
(3) All officers: Not applicable.
(4) Each person of whom any officer or director of the registrant is an affiliated person: Not applicable.
Item 11. Statement Regarding Basis for Approval of Investment Advisory Contract.
February 21, 2024 Meeting:
At a meeting of the board of UBS Investment Trust (the "Trust") on February 21, 2024, the members of the board, including the trustees who are not "interested persons" of the Trust (the "Independent Trustees") as defined in the Investment Company Act of 1940, as amended, considered the approval of an amendment to the Investment Advisory and Administration Contract (the "Contract") between UBS Asset Management (Americas) Inc. ("UBS AM") and the Trust.
Management discussed with the board its proposal to reorganize UBS AM from a Delaware corporation to a Delaware limited liability company and to change its name to UBS Asset Management (Americas) LLC. Management stated that UBS AM is proposing that the Contract be amended at the time of the closing of the reorganization to reflect UBS AM's new name and form of organization. UBS AM represented, and the board considered, that there was expected to be no change to: (i) the advisory fee or any other amounts to be paid by the Trust; (ii) the nature, extent, and quality of the services to be provided by UBS AM; (iii) fund performance; (iv) the costs of the services to be provided and profits to be realized by UBS AM and its affiliates from the relationship with the Trust; (v) the realization of economies of scale as the Trust grows; or (vi) any other benefits derived or to be derived by UBS AM from the relationship with the Trust.
The board, including a majority of the Independent Trustees, approved the amendment to the Contract. No single factor considered by the board was identified by the board the principal factor in determining whether to approve the amendment to the Contract. The Independent Trustees were advised by separate independent legal counsel throughout the process.
July 25-26 Meetings:
At a meeting of the board of UBS Investment Trust (the "Trust") on July 25-26, 2024, the members of the board, including the trustees who are not "interested persons," as defined in the Investment Company Act of 1940, as amended, of the Trust (the "Independent Trustees"), considered and approved the continuance of the investment advisory and administration contract (the "Investment Advisory and Administration Contract") of the Trust with respect to its series, UBS U.S. Allocation Fund (the "Fund"), with UBS Asset Management (Americas) LLC ("UBS AM"). In preparing for the meeting, the Independent Trustees had requested and received extensive information from UBS AM to assist them, including information about UBS AM, as well as the advisory, administrative and distribution arrangements for the Fund. The board reviewed and discussed with management the materials provided by UBS AM prior to the scheduled board meeting. The Independent Trustees also met in executive session to review the disclosure that had been made to them. At these sessions the Independent Trustees were joined by their independent legal counsel. The Independent Trustees also received a memorandum from their independent legal counsel discussing the duties of board members in considering the approval of advisory, administration and distribution agreements.
In its consideration of the approval of the Investment Advisory and Administration Contract, the board reviewed the following factors:
Nature, extent and quality of the services under the Investment Advisory and Administration Contract—The board received and considered information regarding the nature, extent and quality of advisory services provided to the Fund by UBS AM under the Investment Advisory and Administration Contract during the past year. The board also considered the nature, extent and quality of administrative, distribution and shareholder services performed by UBS AM and its affiliates for the Fund and the resources devoted to, and the record of compliance with, the Fund's compliance policies and procedures. The board noted that it received information at regular meetings throughout the year regarding the services rendered by UBS AM concerning the management of the Fund's affairs and UBS AM's role in coordinating and overseeing providers of other services to the Fund. The board's evaluation of the services provided by UBS AM took into account the board's knowledge and familiarity gained as board members of funds in the UBS New York fund complex, including the scope and quality of UBS AM's investment advisory and other capabilities and the quality of its administrative and other services. The board observed that the scope of services provided by UBS AM had expanded over time as a result of regulatory and other developments, including maintaining and monitoring its own and the Fund's expanded compliance programs.
In connection with its consideration of the Fund's management fees, the board also received information from UBS AM with respect to fees paid by institutional or separate accounts; however, in management's view, such fee information was not very relevant to the Fund given the different structures and regulatory requirements of mutual funds, such as the Fund, versus those accounts and the differences in the levels of services required by the Fund and those accounts. The board also received information on fees charged to other mutual funds managed by UBS AM.
The board had available to it the qualifications, backgrounds and responsibilities of the senior personnel at UBS AM responsible for the Fund and had previously met with and received information regarding the persons primarily responsible for the day-to-day management of the Fund. The board recognized that several senior personnel at UBS AM report to the board regularly and that at each regular meeting the board receives a detailed report from UBS AM on the Fund's performance. The board also considered, based on its knowledge of UBS AM and its affiliates, the financial resources available to UBS AM and its parent organization, UBS Group AG. In that regard, the board received extensive financial information regarding UBS AM and noted that it was a wholly owned, indirect subsidiary of one of the largest financial services firms in the world. It also was noted that UBS AM had approximately $395 billion in assets under management as of March 31, 2024 and was part of the UBS Asset Management Division, which had approximately $1.2 trillion in assets under management worldwide as of March 31, 2024. The board also was cognizant of, and considered, the financial combination transactions, regulatory and litigation actions and investigations occurring in the past few years involving UBS Group AG, UBS AM and certain of their affiliates.
The board concluded that, overall, it was satisfied with the nature, extent and quality of services provided (and expected to be provided) to the Fund under the Investment Advisory and Administration Contract.
Advisory fees and expense ratios—The board reviewed and considered the contractual management fee (the "Contractual Management Fee") payable by the Fund to UBS AM in light of the nature, extent and quality of the advisory and administrative services provided by UBS AM. The board also reviewed and considered the written agreement between UBS AM and the Fund, which is separate from the Investment Advisory and Administration Contract, whereby UBS AM has agreed to permanently reduce its management fee based on the Fund's average daily net assets, which is discussed in more detail in the "Economies of scale" section, and considered the actual fee rate (after taking this agreement into account) (the "Actual Management Fee"). Additionally, the board received and considered information comparing the Fund's Contractual Management Fee, Actual Management Fee and total expenses with those of funds in a group of funds selected and provided by Broadridge, an independent provider of investment company data (the "Expense Group").
The comparative Broadridge information showed that the Fund's Contractual Management Fee, Actual Management Fee and total expenses were below the respective medians in the Fund's Expense Group for the comparison periods utilized in the Broadridge report. (Below median fees or expenses represent fees or expenses that are lower relative to the median, and above median fees or expenses represent fees or expenses that are higher relative to the median of the funds in the Expense Group.)
In light of the foregoing, the board determined that the management fee continued to be appropriate under the circumstances and in light of the nature, extent and quality of services provided to the Fund under the Investment Advisory and Administration Contract.
Fund performance—The board received and considered (a) annualized total return information of the Fund compared to other funds (the "Performance Universe") selected by Broadridge over the one-, three-, five-, ten-year and since inception periods ended April 30, 2024 and (b) annualized performance information for each year in the ten-year period ended April 30, 2024. Although the board received information for the ten-year and since inception periods, in its analysis, it generally placed greater emphasis on the one-, three- and five-year periods. The board was provided with a description of the methodology Broadridge used to determine the similarity of the Fund with the funds included in its Performance Universe. The board also noted that it had received information throughout the year at periodic intervals with respect to the Fund's performance, including with respect to its benchmark index.
The comparative Broadridge information showed that the Fund's performance was above the Performance Universe median for all comparative periods, ranking in the first quintile for the one-, three-, five- and ten-year periods. (Below median performance represents performance that is worse relative to the median, and above median performance represents performance that is better relative to the median.) Based on its review, the board concluded that the Fund's investment performance was acceptable.
Advisor profitability—The board received and considered a profitability analysis of UBS AM and its affiliates in providing services to the Fund and was provided information on UBS AM's expense allocation methodology. The board also received profitability information with respect to the UBS New York fund complex as a whole. The board observed that the profitability and expense analyses are substantially similar to those used by UBS AM for many internal purposes, and are subject to regular review with respect to how certain revenues and expenses should be allocated. UBS AM's profitability was considered not excessive in light of the nature, extent and quality of the services provided to the Fund.
Economies of scale—The board received and considered information from management regarding whether UBS AM realized economies of scale as the Fund's assets grew, whether the Fund has appropriately benefited from any material unshared economies of scale over time, and whether there is potential for realization of any further economies of scale for the Fund. The board considered whether economies of scale in the provision of services to the Fund were being passed along to the shareholders. The board noted that the Fund's Contractual Management Fee contained a single breakpoint and that the Fund's assets were below the breakpoint as of April 30, 2024.
While the Fund's Contractual Management Fee contained a single breakpoint, the board recognized that the Fund had entered into a separate agreement with UBS AM, whereby UBS AM agreed to permanently reduce its Contractual Management Fee at higher asset levels by utilizing several additional breakpoints based on the Fund's average daily net assets, thereby achieving the same effect as if the Contractual Management Fee contained multiple breakpoints.
Generally, in light of UBS AM's profitability data, the Actual Management Fee, the Contractual Management Fee, the breakpoints currently in place for the Fund and the current assets of the Fund, the board believed that UBS AM's arrangement for sharing of potential and current economies of scale with the Fund was acceptable.
Other benefits to UBS AM—The board considered other benefits received by UBS AM and its affiliates as a result of its relationship with the Fund, including the opportunity to offer additional products and services to Fund shareholders. In light of the costs of providing investment advisory, administrative and other services to the Fund and UBS AM's ongoing commitment to the Fund, the profits and other ancillary benefits that UBS AM and its affiliates received were considered reasonable.
In light of all of the foregoing, the board, including a majority of the Independent Trustees, approved the Investment Advisory and Administration Contract. No single factor reviewed by the board was identified by the board as the principal factor in determining whether to approve the Investment Advisory and Administration Contract. The Independent Trustees were advised by separate independent legal counsel throughout the process. The board discussed the proposed continuance of the Investment Advisory and Administration Contract in private sessions with their independent legal counsel at which no representatives of UBS AM were present.
Item 12. Disclosure of Proxy Voting Policies and Procedures for Closed-End Management Investment Companies.
Not applicable to the registrant.
Item 13. Portfolio Managers of Closed-End Management Investment Companies.
Not applicable to the registrant.
Item 14. Purchases of Equity Securities by Closed-End Management Investment Company and Affiliated Purchasers.
Not applicable to the registrant.
Item 15. Submission of Matters to a Vote of Security Holders.
The registrant’s Board has established a Nominating and Corporate Governance Committee. The Nominating and Corporate Governance Committee will consider nominees recommended by shareholders if a vacancy occurs among those board members who are not “interested persons” as defined in Section 2(a)(19) of the Investment Company Act of 1940, as amended. In order to recommend a nominee, a shareholder should send a letter to the chairperson of the Nominating and Corporate Governance Committee, Richard R. Burt, care of the Secretary of the registrant at UBS Asset Management, UBS Building, One North Wacker Drive, Chicago, IL 60606, Attn: Keith A. Weller, Secretary, and indicate on the envelope “Nominating and Corporate Governance Committee.” The shareholder’s letter should state the nominee’s name and should include the nominee’s resume or curriculum vitae, and must be accompanied by a written consent of the individual to stand for election if nominated for the Board and to serve if elected by shareholders.
Item 16. Controls and Procedures.
| (a) | The registrant’s principal executive officer and principal financial officer have concluded that the registrant’s disclosure controls and procedures (as defined in Rule 30a-3(c) under the Investment Company Act of 1940, as amended) are effective based on their evaluation of these controls and procedures as of a date within 90 days of the filing date of this document. |
| (b) | The registrant’s principal executive officer and principal financial officer are aware of no changes in the registrant’s internal control over financial reporting that occurred during the period covered by this report that has materially affected, or is reasonably likely to materially affect, the registrant’s internal control over financial reporting. |
Item 17. Disclosure of Securities Lending Activities for Closed-End Management Investment Companies.
Not applicable to the registrant.
Item 18. Recovery of Erroneously Awarded Compensation.
Not applicable.
Item 19. Exhibits.
| (a) | (2) Any policy required by the listing standards adopted pursuant to Rule 10D-1 under the Exchange Act (17 CFR 240.10D-1) by the registered national securities exchange or registered national securities association upon which the registrant’s securities are listed. Not applicable to the registrant. |
| (a) | (4) Written solicitation to purchase securities under Rule 23c-1 under the Investment Company Act of 1940 sent or given during the period covered by the report by or on behalf of the registrant to 10 or more persons. Not applicable to the registrant. |
| (b) | (5) Change in the registrant’s independent public accountant. Provide the information called for by Item 4 of Form 8-K under the Exchange Act (17 CFR 249.308). Unless otherwise specified by Item 4, or related to and necessary for a complete understanding of information not previously disclosed, the information should relate to events occurring during the reporting period. Not applicable. |
SIGNATURES
Pursuant to the requirements of the Securities Exchange Act of 1934 and the Investment Company Act of 1940, the registrant has duly caused this report to be signed on its behalf by the undersigned, thereunto duly authorized.
| UBS Investment Trust | |
| | | |
| By: | /s/ Mark E. Carver | |
| | Mark E. Carver | |
| | President | |
| | | |
| Date: | November 12, 2024 | |
Pursuant to the requirements of the Securities Exchange Act of 1934 and the Investment Company Act of 1940, this report has been signed below by the following persons on behalf of the registrant and in the capacities and on the dates indicated.
| By: | /s/ Mark E. Carver | |
| | Mark E. Carver | |
| | President | |
| | | |
| Date: | November 12, 2024 | |
| | | |
| By: | /s/ Joanne M. Kilkeary | |
| | Joanne M. Kilkeary | |
| | Vice President, Treasurer and Principal Accounting Officer | |
| | | |
| Date: | November 12, 2024 | |