UNITED STATES
SECURITIES AND EXCHANGE COMMISSION
Washington, D.C. 20549
FORM N-CSR
CERTIFIED SHAREHOLDER REPORT OF REGISTERED
MANAGEMENT INVESTMENT COMPANIES
Investment Company Act file number: 811-06292
______________________________________________
UBS Investment Trust
______________________________________________________________________________
(Exact name of registrant as specified in charter)
51 West 52nd Street, New York, New York 10019-6114
______________________________________________________________________________
(Address of principal executive offices) (Zip code)
Mark F. Kemper, Esq.
UBS Global Asset Management
51 West 52nd Street
New York, NY 10019-6114 |
| (Name and address of agent for service) |
| |
| Copy to: |
Jack W. Murphy, Esq.
Dechert LLP
1775 I Street, N.W.
Washington, DC 20006-2401 |
Registrant’s telephone number, including area code: 212-882 5000
Date of fiscal year end: August 31
Date of reporting period: August 31, 2007
Item 1. Reports to Stockholders.
UBS U.S. Allocation Fund
Annual Report
August 31, 2007
UBS U.S. Allocation Fund
October 15, 2007
Dear shareholder,
We present you with the annual report for UBS U.S. Allocation Fund (the “Fund”) for the 12 months ended August 31, 2007.
PerformanceOver the 12 months ended August 31, 2007, the Fund’s Class A shares returned 11.04% before deducting the maximum sales charge; after deducting the maximum sales charge, the Fund’s Class A shares returned 4.95%. During the same period, the U.S. Allocation Fund Index* (the “Index”) returned 11.62%, and the S&P 500 Index returned 15.13%. (Returns for all share classes over various time periods are shown in “Performance at a glance” on page 9; please note that the returns shown do not reflect the deduction of taxes that a shareholder would pay on Fund distributions or the redemption of Fund shares.) | | |
UBS U.S. Allocation Fund | |
| | | | |
| | | Investment goal: | |
| | | Total return, consisting of long-term capital appreciation and current income | |
| | | | |
| | | Portfolio Managers: | |
| | | Portfolio Management Team,
including Brian D. Singer, CFA
UBS Global Asset
Management (Americas) Inc. | |
| | | | |
| | | Commencement: | |
| | | Class A—May 10, 1993 | |
| | | Class B—January 30, 1996 | |
| | | Class C—July 22, 1992 | |
| | | Class Y—May 10, 1993 | |
| | | | |
| | | Dividend payments: | |
| | | Annually, if any
| |
| | | | | |
| An interview with Lead Portfolio Manager Brian D. Singer |
| Q. | How would you describe the economic environment during the reporting period? |
| A. | US economic growth was mixed during the fiscal year. Gross domestic product—or “GDP,” which represents the market value of all final goods and services produced within a country in a given period of time—grew 1.1% and 2.1% in the third and fourth quarters of 2006, respectively. However, the economy weakened meaningfully during the first quarter of 2007, coming in at a modest 0.6%—the slowest rate of growth in |
| | |
| * | An unmanaged index compiled by the advisor, constructed as follows: from July 22, 1992 (the Fund’s inception) until February 29, 2004: 100% S&P 500 Index; from March 1, 2004 until May 31, 2005: 65% Russell 3000 Index, 30% Lehman Brothers US Aggregate Bond Index, 5% Merrill Lynch US High Yield Cash Pay Index; and from June 1, 2005 until present: 65% Russell 3000 Index, 30% Lehman Brothers US Aggregate Bond Index, 5% Merrill Lynch US High Yield Cash Pay Constrained Index. |
1
UBS U.S. Allocation Fund
| | the US since the fourth quarter of 2002. The slowdown was attributed to a variety of factors, including the cooling of the housing market and relatively tepid business spending.
As the fiscal year drew to a close, improving manufacturing activity and strong exports provided a boost to the economy, and the final number for second quarter GDP was 3.8%. Despite this uptick, the economic growth outlook for the remainder of 2007 is less robust, in our view. The combination of financial market volatility with tight credit conditions, ongoing housing market troubles, and concerns over subprime mortgage lending—the practice of making loans to borrowers who do not qualify for the best market interest rates because of their deficient credit history—is likely to impact both consumer and business spending. |
| | |
| Q. | How did the Federal Reserve Board (the “Fed”) react to the economic environment and the issues in the subprime mortgage market? |
| A. | Fed Chairman Ben Bernanke initially indicated that the issues related to the subprime mortgage market would probably not impact the overall economy. During Mr. Bernanke’s remarks to Congress in late March 2007, he stated that subprime defaults were “likely to be contained.” However, as the fallout from subprime mortgages escalated, the Fed became more concerned about these issues. On July 18, 2007, the Fed Chairman told Congress that “rising delinquencies and foreclosures are creating personal, economic and social distress for many homeowners and communities—problems that likely will get worse before they get better.”
As credit concerns mounted, the Fed provided greater amounts of liquidity to the market in order to facilitate normal market operations. In mid-August, the Fed lowered the discount rate—the rate the Fed uses for loans it makes directly to banks—from 6.25% to 5.75%. After the reporting period ended on August 31, 2007, the Fed continued to take action by reducing the federal funds rate from 5.25% to 4.75%. (The federal funds rate, or “fed funds” rate, is the rate that banks charge one another for funds they borrow on an overnight basis.) This was the first reduction in the federal funds rate since June 2003.
In its statement accompanying the September meeting, the Fed stated, “Economic growth was moderate during the first half of the year, but the tightening of credit conditions has the potential to intensify the housing correction and to restrain economic growth more generally. Today’s action is intended to help forestall some of the adverse effects on the broader economy that might otherwise arise from the disruptions in financial markets and to promote moderate growth over time.” |
2
UBS U.S. Allocation Fund
| Q. | How did the stock market perform during the reporting period? |
| A. | While the US stock market experienced periods of extreme volatility during the reporting period, it generated strong results overall, returning 15.13% as measured by the S&P 500 Index. With the exception of February 2007, the market generated positive results in each of the first eight months of the reporting period. Stocks then weakened significantly in June and July, due in part to the escalating negative news related to the US subprime mortgage market and fears that this would spill over into the broader corporate debt and loan markets.
In addition, investor concerns arose that the robust merger and acquisition environment, which had been supporting the market in recent years, would be impacted by the credit crunch. After falling from a peak in July, stock prices then rallied in August as the Fed lowered the discount rate and investors anticipated that the Fed’s next step would be to reduce the federal funds rate. |
| | |
| Q. | Did the bond market generate positive results as well during the reporting period? |
| A. | After advancing modestly during the first half of the reporting period, Treasury yields moved sharply higher during the second quarter of 2007. This was due, in part, to inflationary fears, a solid job market and expectations that the Fed would not be cutting short-term rates in the near future. Toward the end of the fiscal year, the turmoil in the subprime mortgage market triggered a massive flight to quality. This caused both short- and long-term Treasury yields to move sharply lower (which pushed fixed income prices higher) in July and August. In contrast, most other segments of the fixed income market experienced rapid spread widening and falling prices. (Spread represents the difference between the yield paid on US Treasury bonds and higher-risk securities.) During the reporting period, the overall US bond market, as measured by the Lehman Brothers US Aggregate Bond Index, returned 5.26%. |
| | |
| Q. | How was the Portfolio allocated at the end of the reporting period? |
| A. | As of August 31, 2007, the Fund’s net assets were allocated as follows: approximately 69% was invested in US equities; 23% was invested in investment grade US bonds; 5% was in high yield securities, and 3% was invested in cash equivalents. |
| | |
| | In comparison, at the time of the semiannual report, on February 28, 2007, the Fund’s net assets were allocated as follows: 66% was invested in US stocks; 30% was invested in investment grade US bonds; 2% was invested in high yield securities, and 2% was invested in cash equivalents. |
3
UBS U.S. Allocation Fund
| | We kept the allocation steady during the first part of the reporting period, but made several adjustments to the Fund’s allocation during the second half of the reporting period. In February 2007, we took advantage of the selloff in the bond market by increasing the Fund’s exposure to bonds while maintaining our allocation to high yield securities. This shift was done in concert with reducing our position in cash equivalents. We had been holding cash for some time (instead of holding the full benchmark exposure to US bonds), as we perceived bonds to be inferior to cash from a risk/return perspective. However, in our opinion, the selloff in bonds increased the attractiveness of the fixed income asset class relative to cash, warranting a change in strategy.
In July, following 2007’s second flight to quality in the bond market, high yield spreads widened sharply. As a result of this widening, high yield debt valuations moved from being overvalued to within our fair value range. In response, we increased the Fund’s high yield allocation to a position of 5%, in line with the Fund’s benchmark. To do so, we reduced the Fund’s allocation to investment grade bonds. |
| | |
| Q. | Which portions of the Fund performed well during the period and which areas produced disappointing results? |
| A. | During the fiscal year, we continued to rely on our bottom-up research process to guide sector allocation and stock selection for the Fund. For the period as a whole, our sector positioning enhanced relative results, while our security selection had a slight negative impact on performance.
In the equity component of the Fund, we held overweight positions in pharmaceuticals, banks and autos, and underweights in energy and materials. Later in the fiscal year, we also moved to an underweight position in capital goods stocks.
The Fund’s overweight to banks negatively impacted performance, as the financial sector, in general, underperformed during the period. Investors’ focus on subprime lending issues and levered debt weighed heavily on stock prices. An underweight to oil refining also detracted from performance, as that sector delivered strong returns during the reporting period. However, we continue to find this area unattractive, as we believe that current oil prices are not sustainable. |
| | |
| | In terms of the Fund’s fixed income exposure, we remained moderately defensive in terms of duration for most of the period. (Duration is a measure of a security’s sensitivity to changes in interest rates.) Specifically, our underweight duration exposure in the five- to 10-year part of the yield curve expressed our view that we expected yields in this area to rise |
4
UBS U.S. Allocation Fund
| | relative to the short end of the curve. Late in the period, we extended the Fund’s duration to assume a neutral position relative to the benchmark, the U.S. Allocation Fund Index. This reflected our belief that market sentiment and pricing had moved within our fair value estimates. (A yield curve illustrates the yields of all bonds of the same quality with maturities ranging from the shortest to the longest available.) Our defensive approach hindered returns at the beginning of the reporting period, though yields recovered in June and July of 2007. Overall, our duration strategy produced flat results during the reporting period.
In the Fund’s high yield component, we continued to take a conservative stance by underweighting it relative to the benchmark for the reporting period through June, as we felt the sector was overvalued. Overall, this stance had a negative impact on performance during the fiscal year. This is due to the fact that the high yield asset class outperformed as investors, seeking higher returns, flocked to relatively riskier asset classes at times during the reporting period. However, as discussed, we moved to a more neutral high yield position late in the period as the asset class became more fairly valued, according to our models. |
| | |
| Q. | Did the Fund have any exposure to subprime mortgages during the reporting period? |
| A. | While we avoided direct investments in subprime securities, the Fund’s performance was hurt by disappointing returns from its investment in the Alt-A market. Alt-A loans are designed for people with good credit, who want to borrow without verifying their income. In the wake of the deterioration of the subprime market, the Alt-A market came under scrutiny as concerns were raised about the creditworthiness of borrowers and the standards of the lenders of these securities.
Even higher-quality home equity asset-backed securities (bonds that are based on underlying pools of assets) were affected as investors—surprised by the number and magnitude of defaults in the subprime mortgage market—grew increasingly concerned. In many instances, we think that prices reflected unduly pessimistic default assumptions, investor uncertainty and poor liquidity. Given the divergence between fundamentals and market pricing, we anticipate significant investment opportunities in this sector as the year progresses. |
| | |
| Q. | What is your outlook for the economy and the Fund over the coming months? |
| A. | We believe that the problems in the US housing market are likely to have some impact on the future growth potential of the economy. That said, we believe the effects will take several quarters to filter through |
5
UBS U.S. Allocation Fund
| | to the global economy. In our view, they are not likely to be enough to end the current economic growth cycle on their own.
At the time of this writing, we believe the US equity market is priced slightly below fair value. This is largely in response to the decline in investor risk appetite, and is the result of turmoil in the credit markets spilling over into the equity markets.
In this environment, we see opportunities in areas where prices have fallen below our fundamental value estimates. We view the recent volatility and spread widening in the bond market as a return to normal pricing, as bond prices had reached very expensive levels. In fact, in our opinion, investment grade and high yield credit are fast approaching fair value. We believe our current asset allocation to be appropriate considering ongoing economic expansion in the US and the strength of realized earnings growth. |
| | | | |
| | Adding growth equity investments to UBS U.S. Allocation Fund | |
| | We regularly review our product offerings, in an effort to ensure they continue to meet our shareholders’ evolving needs. After careful analysis, this focus has led us to determine that investing a portion of UBS U.S. Allocation Fund’s assets to growth equities has the potential to provide our shareholders with returns at more attractive risk levels. | |
| | | | |
| | Managing risk and accessing an additional source of returns via a diverse strategy | |
| | By introducing US growth equities into the Fund, the portfolio management team seeks to provide shareholders with: | |
| | • | An investment that has the potential to reduce the risk of underperforming in markets that do not favor value stocks, by diversifying through a distinct growth equity investment process; and | |
| | • | Access to the security selection skill of an experienced growth equity investment team. | |
| | | | |
| | Investing in growth equities | |
| | The Fund will seek to invest directly in individual large capitalization US growth equities. This will be accomplished gradually, based on market conditions and the Fund’s allocation to value stocks. In general, we expect to have about 15% of the total US equity component of the Fund invested in growth equities. | |
| | | | |
| | For more information, please refer to the Funds’ prospectus, or contact your Financial Advisor. | |
| | | | |
6
UBS U.S. Allocation Fund
We thank you for your continued support and welcome any comments or questions you may have. For additional information on the UBS family of funds*, please contact your financial advisor, or visit us at www.ubs.com/globalam-us.
| Sincerely, |
 |
| Kai R. Sotorp |
| President |
| UBS U.S. Allocation Fund |
| Head of the Americas |
| UBS Global Asset Management (Americas) Inc. |
 |
| Brian D. Singer, CFA |
| Lead Portfolio Manager |
| UBS U.S. Allocation Fund |
| Americas Chief Investment Officer |
| UBS Global Asset Management (Americas) Inc. |
This letter is intended to assist shareholders in understanding how the Fund performed during the fiscal year ended August 31, 2007. The views and opinions in the letter were current as of October 15, 2007. They are not guarantees of performance or investment results and should not be taken as investment advice. Investment decisions reflect a variety of factors, and we reserve the right to change our views about individual securities, sectors and markets at any time. As a result, the views expressed should not be relied upon as a forecast of the Fund’s future investment intent. We encourage you to consult your financial advisor regarding your personal investment program.
| * | Mutual funds are sold by prospectus only. You should read it carefully and consider a fund’s investment objectives, risks, charges, expenses and other important information contained in the prospectus before investing. Prospectuses for most of our funds can be obtained from your Financial Advisor, by calling UBS Funds at 800-647 1568 or by visiting our Web site at www.ubs.com/globalam-us. |
7
UBS U.S. Allocation Fund
Comparison of change in value of a $10,000 investment in the Class C shares of the UBS U.S. Allocation Fund, the S&P 500 Index(1) and U.S. Allocation Fund Index(2) from August 31, 1997 through August 31, 2007 (unaudited)
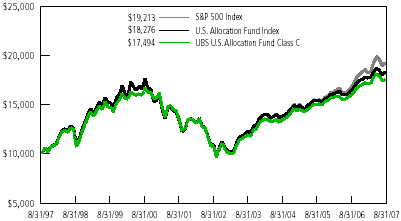
The graph depicts the performance of UBS U.S. Allocation Fund Class C shares versus the S&P 500 Index and UBS U.S. Allocation Fund Index over the 10 years ended August 31, 2007. The performance of the other share classes will vary from the performance of the class shown based on the difference in sales charges and fees paid by shareholders investing in different share classes. Past performance does not predict future performance and the performance provided does not reflect the deduction of taxes that a shareholder would pay on Fund distributions or the redemption of Fund shares. Performance results assume reinvestment of all dividend and capital gain distributions at net asset value on ex-dividend dates. It is important to note that the Fund is a professionally managed portfolio, while the Indexes are not available for investment and are unmanaged. The comparison is shown for illustrative purposes only.
| (1) | The S&P 500 Index is an unmanaged, weighted index comprising 500 widely held common stocks varying in composition and is not available for direct investment. |
| | |
| (2) | An unmanaged index compiled by the advisor, constructed as follows: from July 22, 1992 (the Fund’s inception) until February 29, 2004: 100% S&P 500 Index; from March 1, 2004 until May 31, 2005: 65% Russell 3000 Index, 30% Lehman Brothers US Aggregate Bond Index, and 5% Merrill Lynch US High Yield Cash Pay Index; and from June 1, 2005 until present: 65% Russell 3000 Index, 30% Lehman Brothers US Aggregate Bond Index, and 5% Merrill Lynch US High Yield Cash Pay Constrained Index. |
8
UBS U.S. Allocation Fund
Performance at a glance (unaudited)
Average annual total returns for periods ended 08/31/07
| | | | | | 1 year | | | 5 years | | | 10 years |
|
| | | Class A(1) | | | 11.04 | % | | | 10.96 | % | | | 6.55 | % |
| | |
|
| Before deducting maximum sales charge | | Class B(2) | | | 10.16 | | | | 10.10 | | | | 6.06 | |
| | |
|
| | | Class C(3) | | | 10.23 | | | | 10.14 | | | | 5.75 | |
| | |
|
| | | Class Y(4) | | | 11.42 | | | | 11.34 | | | | 6.89 | |
|
| | | Class A(1) | | | 4.95 | | | | 9.71 | | | | 5.95 | |
| | |
|
| After deducting maximum sales charge | | Class B(2) | | | 5.16 | | | | 9.83 | | | | 6.06 | |
| | |
|
| | | Class C(3) | | | 9.23 | | | | 10.14 | | | | 5.75 | |
|
| S&P 500 Index(5) | | | | | 15.13 | | | | 12.00 | | | | 6.75 | |
|
| U.S. Allocation Fund Index(6) | | | | | 11.62 | | | | 10.89 | | | | 6.22 | |
|
| Lipper Flexible Portfolio Funds median(7) | | | | | 12.14 | | | | 11.34 | | | | 6.80 | |
|
For most recent quarter-end performance, please refer to the “Average annual total return” table on page 10.
| (1) | | Maximum sales charge for Class A shares is 5.5%. Class A shares bear ongoing 12b-1 service fees. |
| |
| (2) | | Maximum contingent deferred sales charge for Class B shares is 5% imposed on redemptions and is reduced to 0% after a maximum of six years. Class B shares bear ongoing 12b-1 service and distribution fees. |
| |
| (3) | | Maximum contingent deferred sales charge for Class C shares is 1% imposed on redemptions and is reduced to 0% after one year. Class C shares bear ongoing 12b-1 service and distribution fees. |
| |
| (4) | | The Fund offers Class Y shares to a limited group of eligible investors, including certain qualifying retirement plans. Class Y shares do not bear initial or contingent deferred sales charges or ongoing 12b-1 service and distribution fees.
If an investor sells or exchanges shares less than 90 days after purchase, a redemption fee of 1.00% of the amount sold or exchanged will be deducted at the time of the transaction, except as noted otherwise in the prospectus. |
| |
| (5) | | The S&P 500 Index is an unmanaged, weighted index comprising 500 widely held common stocks varying in composition and is not available for direct investment. |
| |
| (6) | | An unmanaged index compiled by the advisor, constructed as follows: from July 22, 1992 (the Fund’s inception) until February 29, 2004: 100% S&P 500 Index; from March 1, 2004 until May 31, 2005: 65% Russell 3000 Index, 30% Lehman Brothers US Aggregate Bond Index, 5% Merrill Lynch US High Yield Cash Pay Index and from June 1, 2005 until present: 65% Russell 3000 Index, 30% Lehman Brothers US Aggregate Bond Index, 5% Merrill Lynch US High Yield Cash Pay Constrained Index. |
| |
| (7) | | Lipper peer group data calculated by Lipper Inc; used with permission. The Lipper median is the return of the fund that places in the middle of a Lipper peer group. |
Past performance does not predict future performance, and the performance information provided does not reflect the deduction of taxes that a shareholder would pay on Fund distributions or the redemption of Fund shares. The return and principal value of an investment will fluctuate, so that an investor’s shares, when redeemed, may be worth more or less than their original cost. Performance results assume reinvestment of all dividends and capital gain distributions at net asset value on the ex-dividend dates. Current performance may be higher or lower than the performance data quoted. For month-end performance figures, please visit http://www.ubs.com.
9
UBS U.S. Allocation Fund
Performance at a glance (unaudited) (concluded)
Average annual total returns for periods ended 09/30/07
| | | | | | 1 year | | | 5 years | | | 10 years |
|
| | | Class A(1) | | | 10.65 | % | | | 13.98 | % | | | 6.18 | % |
| | |
|
| Before deducting maximum sales charge | | Class B(2) | | | 9.87 | % | | | 13.10 | % | | | 5.69 | % |
| | |
|
| | | Class C(3) | | | 9.85 | % | | | 13.13 | % | | | 5.39 | % |
| | |
|
| | | Class Y(4) | | | 11.06 | % | | | 14.37 | % | | | 6.53 | % |
|
| | | Class A(1) | | | 4.57 | % | | | 12.69 | % | | | 5.58 | % |
| | |
|
| After deducting maximum sales charge | | Class B(2) | | | 4.87 | % | | | 12.85 | % | | | 5.69 | % |
| | |
|
| | | Class C(3) | | | 8.85 | % | | | 13.13 | % | | | 5.39 | % |
|
| (1) | | Maximum sales charge for Class A shares is 5.5%. Class A shares bear ongoing 12b-1 service fees. |
| | | |
| (2) | | Maximum contingent deferred sales charge for Class B shares is 5% imposed on redemptions and is reduced to 0% after a maximum of six years. Class B shares bear ongoing 12b-1 service and distribution fees. |
| | | |
| (3) | | Maximum contingent deferred sales charge for Class C shares is 1% imposed on redemptions and is reduced to 0% after one year. Class C shares bear ongoing 12b-1 service and distribution fees. |
| | | |
| (4) | | The Fund offers Class Y shares to a limited group of eligible investors, including certain qualifying retirement plans. Class Y shares do not bear initial or contingent deferred sales charges or ongoing 12b-1 service and distribution fees. |
| | | |
| | | If an investor sells or exchanges shares less than 90 days after purchase, a redemption fee of 1.00% of the amount sold or exchanged will be deducted at the time of the transaction, except as noted otherwise in the prospectus. |
Past performance does not predict future performance, and the performance information provided does not reflect the deduction of taxes that a shareholder would pay on Fund distributions or the redemption of Fund shares. The return and principal value of an investment will fluctuate, so that an investor’s shares, when redeemed, may be worth more or less than their original cost. Performance results assume reinvestment of all dividends and capital gain distributions at net asset value on the ex-dividend dates. Current performance may be higher or lower than the performance data quoted. For month-end performance figures, please visit http://www.ubs.com.
10
UBS U.S. Allocation Fund
Understanding your Fund’s expenses (unaudited)
As a shareholder of the Fund, you incur two types of costs: (1) transactional costs (as applicable), including sales charges (loads); and (2) ongoing costs, including management fees; service and/or distribution (12b-1) fees (if applicable); and other Fund expenses. This example is intended to help you understand your ongoing costs (in dollars) of investing in the Fund and to compare these costs with the ongoing costs of investing in other mutual funds.
The example below is based on an investment of $1,000 invested at the beginning of the period and held for the entire period, March 1, 2007 to August 31, 2007.
Actual expenses
The first line for each class of shares in the table below provides information about actual account values and actual expenses. You may use the information in this line, together with the amount you invested, to estimate the expenses that you paid over a period. Simply divide your account value by $1,000 (for example, an $8,600 account value divided by $1,000 = 8.6), then multiply the result by the number in the first line for each class of shares under the heading entitled “Expenses paid during period” to estimate the expenses you paid on your account during this period.
Hypothetical example for comparison purposes
The second line for each class of shares in the table below provides information about hypothetical account values and hypothetical expenses based on the Fund’s actual expense ratios for each class of shares and an assumed rate of return of 5% per year before expenses, which is not the Fund’s actual return for each class of shares. The hypothetical account values and expenses may not be used to estimate the actual ending account balance or expenses you paid for the period. You may use this information to compare the ongoing costs of investing in the Fund and other funds. To do so, compare this 5% hypothetical example with the 5% hypothetical examples that appear in the shareholder reports of other funds.
Please note that the expenses shown in the table are meant to highlight your ongoing Fund costs only and do not reflect any transactional costs (as applicable), such as sales charges (loads). Therefore, the second line in the table for each class of shares is useful in comparing ongoing Fund costs only, and will not help you determine the relative total costs of owning different funds. In addition, if these transactional costs were included, your costs would have been higher.
11
UBS U.S. Allocation Fund
Understanding your Fund’s expenses (unaudited) (concluded)
| | | | | Beginning | | Ending | | Expenses paid |
| | | | | account value | | account value | | during period(1) |
| | | | | March 1, 2007 | | August 31, 2007 | | 03/01/07 to 08/31/07 |
|
| Class A | | Actual | | $ | 1,000.00 | | | $ | 1,027.20 | | | $ | 4.65 | |
|
| | | Hypothetical (5% annual return before expenses) | | | 1,000.00 | | | | 1,020.62 | | | | 4.63 | |
|
| Class B | | Actual | | | 1,000.00 | | | | 1,023.40 | | | | 8.62 | |
|
| | | Hypothetical (5% annual return before expenses) | | | 1,000.00 | | | | 1,016.69 | | | | 8.59 | |
|
| Class C | | Actual | | | 1,000.00 | | | | 1,023.50 | | | | 8.42 | |
|
| | | Hypothetical (5% annual return before expenses) | | | 1,000.00 | | | | 1,016.89 | | | | 8.39 | |
|
| Class Y | | Actual | | | 1,000.00 | | | | 1,028.70 | | | | 2.86 | |
|
| | | Hypothetical (5% annual return before expenses) | | | 1,000.00 | | | | 1,022.38 | | | | 2.85 | |
|
| (1) | | Expenses are equal to the Fund’s annualized net expense ratios: Class A: 0.91%, Class B: 1.69%, Class C: 1.65% and Class Y: 0.56%, multiplied by the average account value over the period, multiplied by 184 divided by 365 (to reflect the one-half year period). |
12
UBS U.S. Allocation Fund
Portfolio statistics (unaudited)
| Characteristics | | 08/31/07 | | | | 02/28/07 | | | | 08/31/06 |
|
| Net assets (mm) | | $ | 745.0 | | | | | $ | 863.8 | | | | | $ | 892.6 | |
|
| Number of securities | | | 490 | | | | | | 491 | | | | | | 491 | |
|
| | | | | | | | | | | | | | | | | |
| Portfolio composition* | | 08/31/07 | | | | 02/28/07 | | | | 08/31/06 |
|
| Stocks | | | 69.4 | % | | | | | 65.6 | % | | | | | 66.1 | % |
|
| Bonds | | | 27.6 | | | | | | 31.8 | | | | | | 31.8 | |
|
| Swap contracts | | | 0.0 | ** | | | | | N/A | | | | | | N/A | |
|
| Cash equivalents and other | | | | | | | | | | | | | | | | |
| assets less liabilities | | | 3.0 | | | | | | 2.6 | | | | | | 2.1 | |
|
| | | | 100.0 | % | | | | | 100.0 | % | | | | | 100.0 | % |
|
| | | | | | | | | | | | | | | | | |
| Top five equity sectors* | | 08/31/07 | | | | 02/28/07 | | | | 08/31/06 |
|
| Financials | | | 14.8 | % | | Financials | | | 16.7 | % | | Financials | | | 17.2 | % |
|
| Consumer | | | | | | Consumer | | | | | | | | | | |
| discretionary | | | 11.7 | | | discretionary | | | 11.1 | | | Health care | | | 11.9 | |
|
| Information | | | | | | | | | | | | Information | | | | |
| technology | | | 11.3 | | | Health care | | | 9.6 | | | technology | | | 9.2 | |
|
| | | | | | | Information | | | | | | Consumer | | | | |
| Health care | | | 10.3 | | | technology | | | 8.7 | | | discretionary | | | 9.1 | |
|
| Industrials | | | 8.6 | | | Industrials | | | 7.2 | | | Industrials | | | 6.5 | |
|
| Total | | | 56.7 | % | | | | | 53.3 | % | | | | | 53.9 | % |
|
| | | | | | | | | | | | | | | | | |
| Top ten equity securities* | | 08/31/07 | | | | 02/28/07 | | | | 08/31/06 |
|
| Citigroup | | | 2.5 | % | | Citigroup | | | 2.6 | % | | Citigroup | | | 2.9 | % |
|
| Wells Fargo | | | 2.3 | | | Morgan Stanley | | | 2.4 | | | Microsoft | | | 2.4 | |
|
| Intel Corp. | | | 2.0 | | | Microsoft | | | 2.1 | | | Morgan Stanley | | | 2.3 | |
|
| Exelon | | | 1.9 | | | Wells Fargo | | | 2.1 | | | Wyeth | | | 2.1 | |
|
| Microsoft | | | 1.9 | | | Exelon | | | 1.8 | | | Wells Fargo | | | 2.1 | |
|
| Morgan Stanley | | | 1.8 | | | Mellon Financial Corp. | | | 1.4 | | | Exelon | | | 1.8 | |
|
| General Electric | | | 1.8 | | | Johnson Controls, Inc. | | | 1.4 | | | Allergan | | | 1.6 | |
|
| | | | | | | American | | | | | | UnitedHealth | | | | |
| Illinois Tool Works | | | 1.5 | | | International Group | | | 1.4 | | | Group | | | 1.6 | |
|
| | | | | | | | | | | | | American | | | | |
| Wyeth | | | 1.4 | | | Allergan | | | 1.4 | | | International Group | | | 1.5 | |
|
| Sprint Nextel Corp. | | | 1.4 | | | Wyeth | | | 1.4 | | | Johnson & Johnson | | | 1.5 | |
|
| Total | | | 18.5 | % | | | | | 18.0 | % | | | | | 19.8 | % |
|
| * | | Weightings represent percentages of net assets. | | |
| ** | | Amount represents less than 0.05%. | | |
13
UBS U.S. Allocation Fund
Portfolio statistics (unaudited) (continued)
| Fixed income sector allocation* | | | 08/31/07 | | | 02/28/07 | | | 08/31/06 |
|
| Mortgage & agency debt securities | | | 13.7 | % | | | 12.7 | % | | | 13.1 | % |
|
| Corporate bonds | | | 7.3 | | | | 7.8 | | | | 7.4 | |
|
| Commercial mortgage-backed securities | | | 3.0 | | | | 2.5 | | | | 3.3 | |
|
| US government obligations | | | 2.7 | | | | 7.1 | | | | 5.9 | |
|
| Asset-backed securities | | | 0.9 | | | | 1.5 | | | | 2.1 | |
|
| International government obligations | | | 0.0 | † | | | 0.2 | | | | 0.0 | † |
|
| Total | | | 27.6 | % | | | 31.8 | % | | | 31.8 | % |
|
| * | | Weightings represent percentages of net assets. |
| | | |
| † | | Weightings represent less than 0.05% of the Fund’s net assets as of the date indicated. |
14
UBS U.S. Allocation Fund
Portfolio statistics (unaudited) (concluded)
| Top ten fixed | | | | | | | | | | | | | | | | | |
| income securities* | | | 08/31/07 | | | | | 02/28/07 | | | | | 08/31/06 |
|
| US Treasury | | | | | | US Treasury | | | | | | US Treasury | | | | | |
| Bonds, 6.250% | | | | | | Notes, 3.500% | | | | | | Notes, 3.875% | | | | | |
| due 08/15/23 | | | 0.9 | % | | due 05/31/07 | | | 1.5 | % | | due 02/15/13 | | | | 0.9 | % |
|
| FHLMC | | | | | | US Treasury | | | | | | US Treasury | | | | | |
| Certificates, 5.500% | | | | | | Notes, 5.125% | | | | | | Bonds, 8.500% | | | | | |
| due 08/23/17 | | | 0.9 | | | due 05/15/16 | | | 1.2 | | | due 02/15/20 | | | | 0.9 | |
|
| FHLMC | | | | | | US Treasury | | | | | | US Treasury | | | | | |
| Certificates, 5.600% | | | | | | Notes, 4.875% | | | | | | Bonds, 8.875% | | | | | |
| due 10/17/13 | | | 0.8 | | | due 08/13/08 | | | 1.0 | | | due 05/15/17 | | | | 0.8 | |
|
| | | | | | | US Treasury | | | | | | | | | | | |
| US Treasury | | | | | | Inflation Index | | | | | | US Treasury | | | | | |
| Bonds, 4.750% | | | | | | Notes, 2.000% | | | | | | Bonds, 8.875% | | | | | |
| due 02/15/37 | | | 0.7 | | | due 01/15/16 | | | 0.8 | | | due 02/15/19 | | | | 0.8 | |
|
| FNMA | | | | | | FNMA | | | | | | FNMA | | | | | |
| Certificates, 6.500% | | | | | | Certificates, 5.500% | | | | | | Certificates, 5.500% | | | | | |
| due 01/01/36 | | | 0.7 | | | due 11/01/17 | | | 0.7 | | | due 11/01/17 | | | | 0.8 | |
|
| US Treasury | | | | | | FHLMC | | | | | | US Treasury | | | | | |
| Notes, 5.125% | | | | | | Certificates, 5.600% | | | | | | Notes, 4.875% | | | | | |
| due 05/15/16 | | | 0.6 | | | due 10/17/13 | | | 0.7 | | | due 05/31/08 | | | | 0.7 | |
|
| JP Morgan | | | | | | | | | | | | | | | | | |
| Chase Commercial | | | | | | | | | | | | | | | | | |
| Mortgage | | | | | | US Treasury | | | | | | FNMA | | | | | |
| Securities, 5.345% | | | | | | Bonds, 4.500% | | | | | | Certificates, 4.625% | | | | | |
| due 12/15/44 | | | 0.6 | | | due 02/15/36 | | | 0.6 | | | due 06/01/10 | | | | 0.7 | |
|
| FNMA | | | | | | FNMA | | | | | | FNMA | | | | | |
| Certificates, 5.200% | | | | | | Certificates, 5.500% | | | | | | REMIC, 6.000% | | | | | |
| due 11/08/10 | | | 0.5 | | | due 09/01/17 | | | 0.6 | | | due 01/25/32 | | | | 0.7 | |
|
| Greenwich | | | | | | Asset | | | | | | | | | | | |
| Capital Commercial | | | | | | Securitization | | | | | | Ford Motor | | | | | |
| Funding Corp., 5.962% | | | | | | Corp., 7.384% | | | | | | Credit Co., 5.800% | | | | | |
| due 03/18/49 | | | 0.4 | | | due 08/13/29 | | | 0.6 | | | due 01/12/09 | | | | 0.6 | |
|
| | | | | | | US Treasury | | | | | | | | | | | |
| FNMA | | | | | | Inflation Index | | | | | | FNMA | | | | | |
| Certificates, 5.000% | | | | | | Notes, 2.000% | | | | | | Certificates, 5.500% | | | | | |
| due 02/01/19 | | | 0.4 | | | due 07/15/14 | | | 0.5 | | | due 09/01/17 | | | | 0.6 | |
|
| Total | | | 6.5 | % | | | | | 8.2 | % | | | | | | 7.5 | % |
|
| * | | Weightings represent percentages of net assets. | | |
15
UBS U.S. Allocation Fund
Portfolio of investments—August 31, 2007
Common stocks—69.35%
| Security description | | | Shares | | | | Value |
|
| Aerospace & defense—0.11% |
| Hexcel Corp.(1),* | | | 21,000 | | | | $457,590 |
|
| LMI Aerospace, Inc.* | | | 15,700 | | | | 358,902 |
|
| | | | | | | | 816,492 |
|
| Air freight & couriers—1.20% |
| ABX Air, Inc.* | | | 33,000 | | | | 226,380 |
|
| Dynamex, Inc.(1),* | | | 8,200 | | | | 205,984 |
|
| FedEx Corp. | | | 77,800 | | | | 8,533,104 |
|
| | | | | | | | 8,965,468 |
|
| Auto components—2.21% |
| BorgWarner, Inc.(1) | | | 74,800 | | | | 6,320,600 |
|
| Johnson Controls, Inc. | | | 89,500 | | | | 10,122,450 |
|
| | | | | | | | 16,443,050 |
|
| Automobiles—0.35% |
| Harley-Davidson, Inc.(1) | | | 48,000 | | | | 2,581,920 |
|
| Banks—5.84% |
| Bank of New York Mellon Corp. | | | 253,400 | | | | 10,244,962 |
|
| Banner Corp. | | | 5,900 | | | | 190,098 |
|
| City National Corp. | | | 32,000 | | | | 2,284,480 |
|
| CoBiz Financial, Inc. | | | 9,499 | | | | 173,452 |
|
| Colonial BancGroup, Inc. | | | 14,700 | | | | 311,934 |
|
| Columbia Banking System, Inc. | | | 400 | | | | 12,204 |
|
| Cullen/Frost Bankers, Inc.(1) | | | 7,800 | | | | 402,324 |
|
| Fifth Third Bancorp(1) | | | 201,838 | | | | 7,203,598 |
|
| PNC Financial Services Group | | | 73,400 | | | | 5,165,158 |
|
| Preferred Bank | | | 3,900 | | | | 160,446 |
|
| PrivateBancorp, Inc.(1) | | | 9,342 | | | | 312,770 |
|
| Sterling Financial Corp. | | | 9,400 | | | | 239,418 |
|
| Wells Fargo & Co.(1) | | | 459,200 | | | | 16,779,168 |
|
| | | | | | | | 43,480,012 |
|
| Security description | | | Shares | | | | Value |
|
| Beverages—1.03% |
| Anheuser-Busch Cos., Inc. | | | 70,900 | | | | $3,502,460 |
|
| Constellation Brands, Inc., Class A(1),* | | | 171,700 | | | | 4,151,706 |
|
| | | | | | | | 7,654,166 |
|
| Biotechnology—1.64% |
| Amgen, Inc.* | | | 31,700 | | | | 1,588,487 |
|
| Genzyme Corp.* | | | 130,300 | | | | 8,132,023 |
|
| Millennium Pharmaceuticals, Inc.(1),* | | | 247,500 | | | | 2,512,125 |
|
| | | | | | | | 12,232,635 |
|
| Building products—1.28% |
| Masco Corp. | | | 327,400 | | | | 8,518,948 |
|
| NCI Building Systems, Inc.* | | | 9,100 | | | | 422,149 |
|
| Watsco, Inc.(1) | | | 11,700 | | | | 563,004 |
|
| | | | | | | | 9,504,101 |
|
| Chemicals—0.07% |
| Cytec Industries, Inc.(1) | | | 8,100 | | | | 537,840 |
|
| Commercial services & supplies—0.22% |
| Angelica Corp. | | | 5,800 | | | | 118,088 |
|
| Coinstar, Inc.(1),* | | | 8,400 | | | | 274,512 |
|
| Dice Holdings, Inc.* | | | 2,000 | | | | 19,360 |
|
| Dollar Financial Corp.* | | | 15,500 | | | | 371,690 |
|
| FTD Group, Inc. | | | 12,000 | | | | 213,240 |
|
| LECG Corp.* | | | 12,400 | | | | 190,216 |
|
| PeopleSupport, Inc.(1),* | | | 20,400 | | | | 256,632 |
|
| Valassis Communications, Inc.* | | | 19,200 | | | | 175,104 |
|
| | | | | | | | 1,618,842 |
|
| Communications equipment—0.14% |
| Black Box Corp. | | | 1,400 | | | | 57,330 |
|
| F5 Networks, Inc.* | | | 8,200 | | | | 286,754 |
|
| Harris Corp. | | | 5,700 | | | | 346,731 |
|
16
UBS U.S. Allocation Fund
Portfolio of investments—August 31, 2007
Common stocks—(continued)
| Security description | | | Shares | | | | Value |
|
| Communications equipment—(concluded) |
| OpNext, Inc.* | | | 11,100 | | | | $133,311 |
|
| Powerwave Technologies, Inc.* | | | 34,400 | | | | 235,640 |
|
| | | | | | | | 1,059,766 |
|
| Computers & peripherals—0.71% |
| Dell, Inc.(1),* | | | 186,100 | | | | 5,257,325 |
|
| Construction & engineering—0.02% |
| Sterling Construction Co., Inc.* | | | 7,600 | | | | 168,112 |
|
| Distributors—0.13% |
| Beacon Roofing Supply, Inc.(1),* | | | 38,200 | | | | 445,030 |
|
| WESCO International, Inc.* | | | 10,500 | | | | 499,695 |
|
| | | | | | | | 944,725 |
|
| Diversified financials—6.98% |
| Apollo Investment Corp. | | | 24,100 | | | | 526,344 |
|
| Asset Acceptance Capital Corp. | | | 6,989 | | | | 79,046 |
|
| Citigroup, Inc.(1) | | | 397,586 | | | | 18,638,832 |
|
| Discover Financial Services* | | | 126,925 | | | | 2,937,044 |
|
| Federal Home Loan Mortgage Corp.(1) | | | 85,100 | | | | 5,243,011 |
|
| J.P. Morgan Chase & Co. | | | 193,400 | | | | 8,610,168 |
|
| Lazard Ltd., Class A | | | 15,300 | | | | 613,377 |
|
| Morgan Stanley | | | 220,950 | | | | 13,780,651 |
|
| National Financial Partners Corp. | | | 6,100 | | | | 298,229 |
|
| optionsXpress Holdings, Inc. | | | 7,500 | | | | 176,400 |
|
| PennantPark Investment Corp.(1) | | | 37,800 | | | | 490,644 |
|
| Walter Industries, Inc. | | | 24,064 | | | | 608,338 |
|
| | | | | | | | 52,002,084 |
|
| Security description | | | | | Shares | | Value |
|
| Diversified telecommunication services—2.42% |
| AT&T, Inc. | | | | | 182,300 | | $7,268,301 |
|
| NeuStar, Inc., Class A* | | | | | 14,100 | | 445,842 |
|
| Sprint Nextel Corp.(1) | | | | | 545,094 | | 10,313,179 |
|
| | | | | | | | 18,027,322 |
|
| Electric utilities—2.91% |
| American Electric Power Co., Inc. | | | | | 101,100 | | 4,496,928 |
|
| Exelon Corp.(1) | | | | | 205,000 | | 14,487,350 |
|
| Northeast Utilities | | | | | 16,600 | | 458,990 |
|
| Pepco Holdings, Inc. | | | | | 79,000 | | 2,202,520 |
|
| | | | | | | | 21,645,788 |
|
| Electrical equipment—0.13% |
| A.O. Smith Corp. | | | | | 5,300 | | 255,460 |
|
| Airvana, Inc.(1),* | | | | | 17,700 | | 109,032 |
|
| Franklin Electric Co., Inc.(1) | | | | | 6,955 | | 287,102 |
|
| General Cable Corp.* | | | | | 5,800 | | 337,444 |
|
| | | | | | | | 989,038 |
|
| Electronic equipment & instruments—0.12% |
| Newport Corp.* | | | | | 24,200 | | 334,202 |
|
| Regal-Beloit Corp. | | | | | 11,600 | | 585,916 |
|
| | | | | | | | 920,118 |
|
| Energy equipment & services—2.02% |
| ENSCO International, Inc. | | | | | 66,400 | | 3,600,208 |
|
| GlobalSantaFe Corp. | | | | | 67,600 | | 4,771,884 |
|
| Halliburton Co. | | | | | 169,300 | | 5,856,087 |
|
| Oil States International, Inc.* | | | | | 9,000 | | 379,800 |
|
| TETRA Technologies, Inc.* | | | | | 20,600 | | 411,794 |
|
| | | | | | | | 15,019,773 |
|
| Food & drug retailing—0.84% |
| Sysco Corp. | | | | | 188,000 | | 6,275,440 |
|
17
UBS U.S. Allocation Fund
Portfolio of investments—August 31, 2007
Common stocks—(continued)
| Security description | | | Shares | | | | Value |
|
| Food products—0.01% |
| Maui Land & Pineapple Co., Inc.* | | | 2,377 | | | | $69,052 |
|
| Gas utilities—1.01% |
| NiSource, Inc.(1) | | | 120,600 | | | | 2,272,104 |
|
| Sempra Energy | | | 95,900 | | | | 5,277,377 |
|
| | | | | | | | 7,549,481 |
|
| Health care equipment & supplies—0.93% |
| Abaxis, Inc.* | | | 9,400 | | | | 182,736 |
|
| Advanced Medical Optics, Inc.(1),* | | | 10,700 | | | | 307,518 |
|
| ICU Medical, Inc.* | | | 9,678 | | | | 365,925 |
|
| Medical Action Industries, Inc.* | | | 8,600 | | | | 195,134 |
|
| Medtronic, Inc. | | | 97,200 | | | | 5,136,048 |
|
| Mentor Corp. | | | 3,400 | | | | 151,606 |
|
| Palomar Medical Technologies, Inc.(1),* | | | 8,847 | | | | 278,681 |
|
| Syneron Medical Ltd.(1),* | | | 12,400 | | | | 280,488 |
|
| | | | | | | | 6,898,136 |
|
| Health care providers & services—1.00% |
| LifePoint Hospitals, Inc.* | | | 8,500 | | | | 238,850 |
|
| Pharmaceutical Product Development, Inc. (PPD) | | | 47,400 | | | | 1,660,422 |
|
| United Health Group, Inc. | | | 110,600 | | | | 5,531,106 |
|
| | | | | | | | 7,430,378 |
|
| Hotels, restaurants & leisure—1.05% |
| Carnival Corp. | | | 165,300 | | | | 7,536,027 |
|
| Vail Resorts, Inc.* | | | 4,800 | | | | 274,464 |
|
| | | | | | | | 7,810,491 |
|
| Household durables—0.71% |
| Fortune Brands, Inc. | | | 56,900 | | | | 4,727,821 |
|
| Interface, Inc., Class A | | | 8,400 | | | | 151,536 |
|
| Syntax-Brillian Corp.(1),* | | | 43,900 | | | | 285,350 |
|
| Security description | | | Shares | | | | Value |
|
| Household durables—(concluded) |
| Tempur-Pedic International, Inc. | | | 5,600 | | | | $161,840 |
|
| | | | | | | | 5,326,547 |
|
| Industrial conglomerates—1.76% |
| General Electric Co. | | | 336,500 | | | | 13,079,755 |
|
| Insurance—1.83% |
| AFLAC, Inc.(1) | | | 61,200 | | | | 3,262,572 |
|
| Allstate Corp. | | | 79,200 | | | | 4,336,200 |
|
| CastlePoint Holdings Ltd. | | | 28,900 | | | | 327,148 |
|
| Hartford Financial Services Group, Inc. | | | 54,700 | | | | 4,863,377 |
|
| Primus Guaranty, Ltd.(1),* | | | 45,400 | | | | 431,754 |
|
| Tower Group, Inc.(1) | | | 15,200 | | | | 381,672 |
|
| | | | | | | | 13,602,723 |
|
| Internet & catalog retail—0.84% |
| Amazon.com, Inc.* | | | 78,800 | | | | 6,296,908 |
|
| Internet software & services—1.26% |
| Art Technology Group, Inc.* | | | 94,000 | | | | 292,340 |
|
| Google, Inc., Class A* | | | 6,100 | | | | 3,143,025 |
|
| Limelight Networks, Inc.(1),* | | | 5,300 | | | | 43,619 |
|
| Openwave Systems, Inc.(1) | | | 16,700 | | | | 75,484 |
|
| RightNow Technologies, Inc.* | | | 19,600 | | | | 287,140 |
|
| Sourcefire, Inc.(1),* | | | 600 | | | | 5,748 |
|
| TheStreet.com, Inc.(1) | | | 21,100 | | | | 215,642 |
|
| Tumbleweed Communications Corp.* | | | 64,000 | | | | 142,720 |
|
| ValueClick, Inc.* | | | 18,600 | | | | 372,744 |
|
| Websense, Inc.* | | | 21,000 | | | | 431,970 |
|
| Yahoo!, Inc.* | | | 193,900 | | | | 4,407,347 |
|
| | | | | | | | 9,417,779 |
|
| IT consulting & services—0.12% |
| CACI International, Inc., Class A* | | | 8,900 | | | | 454,078 |
|
| Glu Mobile, Inc.(1),* | | | 9,900 | | | | 82,566 |
|
18
UBS U.S. Allocation Fund
Portfolio of investments—August 31, 2007
Common stocks—(continued)
| Security description | | | Shares | | | | Value |
|
| IT consulting & services—(concluded) |
| SRA International, Inc., Class A* | | | 13,400 | | | | $378,014 |
|
| | | | | | | | 914,658 |
|
| Machinery—2.36% |
| Chart Industries, Inc.* | | | 8,900 | | | | 240,211 |
|
| Graco, Inc. | | | 8,700 | | | | 351,567 |
|
| Illinois Tool Works, Inc.(1) | | | 189,300 | | | | 11,011,581 |
|
| Insteel Industries, Inc.(1) | | | 15,300 | | | | 289,170 |
|
| Nordson Corp. | | | 9,600 | | | | 482,016 |
|
| PACCAR, Inc. | | | 61,200 | | | | 5,235,660 |
|
| | | | | | | | 17,610,205 |
|
| Media—2.85% |
| BigBand Networks(1),* | | | 6,200 | | | | 62,620 |
|
| Cinemark Holdings, Inc.* | | | 6,000 | | | | 107,880 |
|
| News Corp., Class A | | | 231,900 | | | | 4,691,337 |
|
| Omnicom Group, Inc. | | | 114,300 | | | | 5,821,299 |
|
| R.H. Donnelley Corp.* | | | 66,385 | | | | 3,905,430 |
|
| The McGraw-Hill Cos., Inc.(1) | | | 50,000 | | | | 2,523,000 |
|
| Viacom Inc., Class B* | | | 105,100 | | | | 4,147,246 |
|
| | | | | | | | 21,258,812 |
|
| Metals & mining—0.56% |
| Alpha Natural Resources, Inc.* | | | 16,000 | | | | 308,960 |
|
| Foundation Coal Holdings, Inc. | | | 12,400 | | | | 420,608 |
|
| Peabody Energy Corp.(1) | | | 69,500 | | | | 2,954,445 |
|
| Quanex Corp.(1) | | | 11,700 | | | | 506,727 |
|
| | | | | | | | 4,190,740 |
|
| Multi-line retail—1.61% |
| Costco Wholesale Corp. | | | 125,400 | | | | 7,743,450 |
|
| Target Corp. | | | 64,600 | | | | 4,259,078 |
|
| | | | | | | | 12,002,528 |
|
| Oil & gas—1.71% |
| Chevron Corp.(1) | | | 40,900 | | | | 3,589,384 |
|
| EOG Resources, Inc.(1) | | | 60,800 | | | | 4,095,488 |
|
| Security description | | | Shares | | | | Value |
|
| Oil & gas—(concluded) |
| Equitable Resources, Inc. | | | 8,300 | | | | $408,277 |
|
| Exxon Mobil Corp. | | | 54,400 | | | | 4,663,712 |
|
| | | | | | | | 12,756,861 |
|
| Pharmaceuticals—6.71% |
| Allergan, Inc. | | | 164,400 | | | | 9,865,644 |
|
| Animal Health International, Inc.* | | | 14,189 | | | | 161,045 |
|
| Bristol-Myers Squibb Co. | | | 140,800 | | | | 4,104,320 |
|
| Cephalon, Inc.* | | | 28,300 | | | | 2,123,915 |
|
| Johnson & Johnson | | | 100,664 | | | | 6,220,029 |
|
| Medco Health Solutions, Inc.* | | | 58,500 | | | | 4,998,825 |
|
| Merck & Co., Inc. | | | 178,500 | | | | 8,955,345 |
|
| Schering-Plough Corp. | | | 100,100 | | | | 3,005,002 |
|
| Wyeth | | | 228,100 | | | | 10,561,030 |
|
| | | | | | | | 49,995,155 |
|
| Real estate—0.11% |
| FelCor Lodging Trust, Inc. | | | 29,700 | | | | 651,618 |
|
| MFA Mortgage Investments, Inc. | | | 24,300 | | | | 188,325 |
|
| | | | | | | | 839,943 |
|
| Road & rail—1.44% |
| Burlington Northern Santa Fe Corp. | | | 118,900 | | | | 9,648,735 |
|
| Genesee & Wyoming, Inc., Class A* | | | 13,350 | | | | 365,523 |
|
| Kansas City Southern* | | | 15,600 | | | | 474,084 |
|
| Pacer International, Inc.(1) | | | 12,100 | | | | 261,602 |
|
| | | | | | | | 10,749,944 |
|
| Semiconductor equipment & products—4.43% |
| Analog Devices, Inc. | | | 244,300 | | | | 9,009,784 |
|
| AuthenTec, Inc.* | | | 8,800 | | | | 93,984 |
|
| Intel Corp.(1) | | | 565,500 | | | | 14,561,625 |
|
19
UBS U.S. Allocation Fund
Portfolio of investments—August 31, 2007
Common stocks—(concluded)
| Security description | | | Shares | | | | Value |
|
| Semiconductor equipment & products—(concluded) |
| Linear Technology Corp.(1) | | | 111,300 | | | | $3,783,087 |
|
| ON Semiconductor Corp.(1),* | | | 34,500 | | | | 404,340 |
|
| SiRF Technology Holdings, Inc.* | | | 10,500 | | | | 177,030 |
|
| Xilinx, Inc.(1) | | | 194,300 | | | | 4,968,251 |
|
| | | | | | | | 32,998,101 |
|
| Software—4.55% |
| BEA Systems, Inc.* | | | 247,300 | | | | 3,017,060 |
|
| Citrix Systems, Inc.(1),* | | | 116,500 | | | | 4,234,775 |
|
| Innerworkings, Inc.(1),* | | | 15,400 | | | | 217,294 |
|
| Intuit, Inc.* | | | 118,900 | | | | 3,247,159 |
|
| Microsoft Corp. | | | 484,200 | | | | 13,911,066 |
|
| Nuance Communications, Inc.* | | | 11,700 | | | | 219,960 |
|
| Quest Software, Inc.* | | | 9,900 | | | | 144,144 |
|
| Red Hat, Inc.(1),* | | | 71,000 | | | | 1,380,950 |
|
| Secure Computing Corp.* | | | 18,700 | | | | 167,926 |
|
| Smith Micro Software, Inc.(1),* | | | 20,600 | | | | 339,694 |
|
| Symantec Corp.* | | | 354,173 | | | | 6,661,994 |
|
| VASCO Data Security International, Inc.* | | | 10,400 | | | | 325,728 |
|
| | | | | | | | 33,867,750 |
|
| Security description | | | Shares | | | | Value |
|
| Specialty retail—1.55% |
| AnnTaylor Stores Corp.* | | | 6,800 | | | | $213,112 |
|
| Casual Male Retail Group, Inc.(1),* | | | 39,100 | | | | 394,910 |
|
| Chico’s FAS, Inc.* | | | 127,300 | | | | 2,034,254 |
|
| Conn’s, Inc.(1),* | | | 11,800 | | | | 259,600 |
|
| Home Depot, Inc. | | | 184,400 | | | | 7,064,364 |
|
| Interline Brands, Inc.(1),* | | | 22,000 | | | | 533,280 |
|
| Movado Group, Inc.(1) | | | 10,256 | | | | 302,552 |
|
| Regis Corp. | | | 12,600 | | | | 415,926 |
|
| Rush Enterprises, Inc., Class A* | | | 2,600 | | | | 65,936 |
|
| Susser Holdings Corp.* | | | 16,800 | | | | 281,736 |
|
| | | | | | | | 11,565,670 |
|
| Textiles & apparel—0.37% |
| Coach, Inc.(1),* | | | 55,900 | | | | 2,489,227 |
|
| True Religion Apparel, Inc.(1),* | | | 15,900 | | | | 266,802 |
|
| | | | | | | | 2,756,029 |
|
| Venture capital—0.16% |
| The Blackstone Group LP(1),* | | | 51,041 | | | | 1,180,578 |
|
| Water utilities—0.05% |
| Mueller Water Products, Inc., Class B | | | 32,073 | | | | 351,199 |
|
| Total common stocks | | | | | | | |
| (cost—$450,488,374) | | | | | | | 516,663,440 |
|
20
UBS U.S. Allocation Fund
Portfolio of investments—August 31, 2007
| | | | Face | | | | |
| | | | amount | | | | Value |
|
US government obligations—2.74% | | | | | | | |
| US Treasury Bonds, | | | | | | | |
4.750%, due 02/15/37(1) | | | $5,575,000 | | | | $5,499,214 |
|
6.250%, due 08/15/23 | | | 6,035,000 | | | | 6,955,808 |
|
6.250%, due 05/15/30 | | | 345,000 | | | | 410,577 |
|
6.625%, due 02/15/27 | | | 280,000 | | | | 340,878 |
|
| US Treasury Notes, | | | | | | | |
4.500%, due 03/31/09 | | | 1,545,000 | | | | 1,552,121 |
|
4.500%, due 03/31/12 | | | 980,000 | | | | 989,494 |
|
5.125%, due 05/15/16(1) | | | 4,500,000 | | | | 4,692,654 |
|
| Total US government obligations (cost—$19,913,554) | | | | | | | 20,440,746 |
|
Mortgage & agency debt securities—13.71% | | | | | | | |
| Adjustable Rate Mortgage Trust, Series 2006-1, Class 5A1, | | | | | | | |
6.090%, due 03/25/36 | | | 2,245,966 | | | | 2,258,829 |
|
| Banc of America Funding Corp., | | | | | | | |
Series 2006-H, Class B1, | | | | | | | |
6.101%, due 09/20/46(2) | | | 2,393,529 | | | | 2,403,095 |
|
Series 2007-C, Class XB1, | | | | | | | |
5.730%, due 05/20/36(2) | | | 2,398,741 | | | | 2,315,140 |
|
| Bear Stearns Adjustable Rate Mortgage Trust, | | | | | | | |
Series 2005-1, Class 4A1, | | | | | | | |
5.355%, due 03/25/35 | | | 1,028,836 | | | | 999,257 |
|
Series 2007-3, Class 2A1, | | | | | | | |
5.643%, due 05/25/47 | | | 2,759,905 | | | | 2,759,972 |
|
| Bear Stearns Alternative-A Trust, Series 2006-4, Class 3B2, | | | | | | | |
6.297%, due 07/25/36(2) | | | 998,480 | | | | 940,287 |
|
| Countrywide Alternative Loan Trust, Series 2005-J2, Class 2A1, | | | | | | | |
7.500%, due 12/15/34 | | | 917,729 | | | | 922,755 |
|
| Credit Suisse First Boston Mortgage Securities Corp., | | | | | | | |
Series 2005-10, Class 10A3, | | | | | | | |
6.000%, due 11/25/35 | | | 1,954,149 | | | | 1,963,818 |
|
Series 2005-11, Class 1A1, | | | | | | | |
6.500%, due 12/25/35 | | | 1,657,053 | | | | 1,670,000 |
|
| Federal Home Loan Bank Certificates, | | | | | | | |
5.375%, due 05/18/16 | | | 635,000 | | | | 648,315 |
|
5.500%, due 08/13/14 | | | 1,095,000 | | | | 1,130,139 |
|
| Federal Home Loan Mortgage Corporation Certificates, | | | | | | | |
4.500%, due 12/01/34 | | | 2,238,139 | | | | 2,074,470 |
|
4.625%, due 02/21/08 | | | 2,960,000 | | | | 2,950,928 |
|
| | | | | | | | |
|
| | | | | | | | 21 |
UBS U.S. Allocation Fund
Portfolio of investments—August 31, 2007
| | | | Face | | | | |
| | | | amount | | | | Value |
|
Mortgage & agency debt securities—(continued) | | | | | | | |
5.500%, due 08/23/17 | | | $6,155,000 | | | | $6,345,066 |
|
5.500%, due 01/01/18 | | | 29,938 | | | | 29,857 |
|
5.500%, due 04/01/18 | | | 26,199 | | | | 26,125 |
|
5.500%, due 04/01/37 | | | 1,451,797 | | | | 1,417,922 |
|
5.500%, due 05/01/37 | | | 3,234,324 | | | | 3,158,857 |
|
5.600%, due 10/17/13 | | | 6,080,000 | | | | 6,112,808 |
|
5.750%, due 06/27/16 | | | 1,750,000 | | | | 1,809,343 |
|
6.000%, due 12/01/17 | | | 24,519 | | | | 24,820 |
|
6.000%, due 03/01/32 | | | 5,669 | | | | 5,714 |
|
6.500%, due 08/01/28 | | | 1,316,503 | | | | 1,348,280 |
|
6.500%, due 02/01/29 | | | 21,153 | | | | 21,701 |
|
6.500%, due 04/01/29 | | | 18,323 | | | | 18,750 |
|
| Federal Home Loan Mortgage Corporation Certificates ARM, | | | | | | | |
5.229%, due 05/01/37 | | | 2,325,685 | | | | 2,306,358 |
|
5.388%, due 03/01/37 | | | 2,325,562 | | | | 2,315,564 |
|
| Federal National Mortgage Association Certificates, | | | | | | | |
4.250%, due 08/15/10 | | | 710,000 | | | | 700,710 |
|
5.000%, due 02/01/19 | | | 3,347,202 | | | | 3,280,844 |
|
5.200%, due 11/08/10 | | | 3,525,000 | | | | 3,526,956 |
|
5.500%, due 01/23/12 | | | 930,000 | | | | 932,506 |
|
5.500%, due 07/01/33 | | | 1,784,296 | | | | 1,747,673 |
|
5.500%, due 01/01/34 | | | 2,295,237 | | | | 2,248,127 |
|
6.000%, due 03/01/29 | | | 13,166 | | | | 13,254 |
|
6.000%, due 06/01/33 | | | 12,016 | | | | 12,081 |
|
6.070%, due 05/12/16 | | | 1,945,000 | | | | 1,958,969 |
|
6.250%, due 02/01/11 | | | 2,930,000 | | | | 3,068,525 |
|
6.500%, due 03/01/17 | | | 56,578 | | | | 57,745 |
|
6.500%, due 01/01/36 | | | 4,855,972 | | | | 4,972,973 |
|
7.000%, due 08/01/32 | | | 1,126,648 | | | | 1,167,826 |
|
7.500%, due 05/01/31 | | | 7,945 | | | | 8,324 |
|
7.500%, due 02/01/33 | | | 16,784 | | | | 17,576 |
|
| FHLMC REMIC, | | | | | | | |
Series 2148, Class ZA, | | | | | | | |
6.000%, due 04/15/29 | | | 46,776 | | | | 47,162 |
|
Series 2426, Class GH, | | | | | | | |
6.000%, due 08/15/30 | | | 10,435 | | | | 10,479 |
|
| | | | | | | | |
|
| 22 | | | | | | | |
UBS U.S. Allocation Fund
Portfolio of investments—August 31, 2007
| | | | Face | | | | |
| | | | amount | | | | Value |
|
Mortgage & agency debt securities—(continued) | | | | | | | |
Series 2430, Class UC, | | | | | | | |
6.000%, due 09/15/16 | | | $777,698 | | | | $786,507 |
|
Series T-42, Class A5, | | | | | | | |
7.500%, due 02/25/42 | | | 2,049,039 | | | | 2,134,017 |
|
| First Horizon Mortgage Pass-Through Trust, | | | | | | | |
Series 2004-FL1, Class 1A1, | | | | | | | |
5.775%, due 02/25/35(2) | | | 190,961 | | | | 184,951 |
|
Series 2007-AR2, Class 1A1, | | | | | | | |
5.863%, due 06/25/37(2) | | | 1,962,057 | | | | 1,930,174 |
|
| FNMA REMIC, Series 2004-W1, Class 3A, | | | | | | | |
6.414%, due 01/25/43(2) | | | 3,137,632 | | | | 3,143,354 |
|
| Government National Mortgage Association Certificates, | | | | | | | |
6.500%, due 10/15/24 | | | 1,840,516 | | | | 1,881,324 |
|
6.500%, due 10/15/28 | | | 12,895 | | | | 13,198 |
|
6.500%, due 04/15/31 | | | 824,275 | | | | 843,143 |
|
7.000%, due 04/15/26 | | | 7,314 | | | | 7,637 |
|
| Government National Mortgage Association Certificates II, | | | | | | | |
6.000%, due 11/20/28 | | | 5,577 | | | | 5,622 |
|
6.000%, due 02/20/29 | | | 12,332 | | | | 12,427 |
|
6.000%, due 02/20/34 | | | 2,783,529 | | | | 2,794,554 |
|
| JP Morgan Alternative Loan Trust, Series 2006-S1, Class 1A19, | | | | | | | |
6.500%, due 03/25/36 | | | 2,309,731 | | | | 2,337,033 |
|
| Lehman XS Trust, Series 2005-8, Class 2A3, | | | | | | | |
6.000%, due 12/25/35(3) | | | 3,250,000 | | | | 3,071,447 |
|
| MLCC Mortgage Investors, Inc., Series 2006-2, Class 4A, | | | | | | | |
5.807%, due 05/25/36(2) | | | 1,161,257 | | | | 1,158,547 |
|
| Residential Asset Securitization Trust, Series 2006-A2, Class A11, | | | | | | | |
6.000%, due 05/25/36 | | | 3,000,000 | | | | 2,929,066 |
|
| Washington Mutual Mortgage Pass-Through Certificates, | | | | | | | |
Series 2007-HY1, Class 1A1 | | | | | | | |
5.717%, due 02/25/37(2) | | | 1,267,081 | | | | 1,258,027 |
|
Series 2007-HY7, Class LB1, | | | | | | | |
5.878%, due 07/25/37(2) | | | 1,174,730 | | | | 1,164,865 |
|
Series 2002-AR17, Class 1A, | | | | | | | |
6.205%, due 11/25/42(2) | | | 1,287,038 | | | | 1,292,157 |
|
| Wells Fargo Mortgage Backed Securities Trust, | | | | | | | |
Series 2007-11, Class B1, | | | | | | | |
6.000%, due 08/25/37(4) | | | 2,398,864 | | | | 2,221,892 |
|
| | | | | | | | |
|
| | | | | | | | 23 |
UBS U.S. Allocation Fund
Portfolio of investments—August 31, 2007
| | | | Face | | | | |
| | | | amount | | | | Value |
|
Mortgage & agency debt securities—(concluded) | | | | | | | |
Series 2007-AR4, Class A1, | | | | | | | |
6.032%, due 08/25/37(2) | | | $1,250,000 | | | | $1,243,945 |
|
| Total mortgage & agency debt securities (cost—$102,854,943) | | | | | | | 102,163,787 |
|
Commercial mortgage-backed securities—2.97% | | | | | | | |
| Banc of America Commercial Mortgage, Inc., | | | | | | | |
Series 2006-2, Class B, | | | | | | | |
5.965%, due 05/10/45(2) | | | 250,000 | | | | 237,905 |
|
Series 2007-3, Class C, | | | | | | | |
5.838%, due 06/10/49(2) | | | 325,000 | | | | 302,674 |
|
| Bear Stearns Commercial Mortgage Securities, | | | | | | | |
Series 2007-PW16, Class C, | | | | | | | |
5.902%, due 06/11/40(2),(5) | | | 200,000 | | | | 188,359 |
|
| Citigroup Commercial Mortgage Trust, | | | | | | | |
Series 2006-C5, Class A4, | | | | | | | |
5.431%, due 10/15/49 | | | 1,050,000 | | | | 1,031,214 |
|
Series 2007-C6, Class A4, | | | | | | | |
5.889%, due 12/10/49(2) | | | 1,600,000 | | | | 1,604,627 |
|
| Citigroup/Deutsche Bank Commercial Mortgage Trust, | | | | | | | |
Series 2007-CD4, Class B, | | | | | | | |
5.447%, due 12/11/49(2) | | | 325,000 | | | | 299,424 |
|
| Credit Suisse Mortgage Capital Certificates, | | | | | | | |
Series 2007-C4, Class C, | | | | | | | |
5.811%, due 09/15/39 | | | 225,000 | | | | 213,867 |
|
| First Union Lehman-Brothers Commercial Mortgage, | | | | | | | |
Series 1997-C2, Class A3, | | | | | | | |
6.650%, due 11/18/29 | | | 139,632 | | | | 139,221 |
|
| GE Capital Commercial Mortgage Corp., | | | | | | | |
Series 2006-C1, Class A4, | | | | | | | |
5.518%, due 03/10/44(2) | | | 1,350,000 | | | | 1,331,544 |
|
| Greenwich Capital Commercial Funding Corp., | | | | | | | |
Series 2006-RR1, Class A1, | | | | | | | |
5.962%, due 03/18/49(2),(5) | | | 3,500,000 | | | | 3,350,156 |
|
| GS Mortgage Securities Corp. II, | | | | | | | |
Series 2006-CC1, Class A, | | | | | | | |
5.520%, due 03/21/46(2),(5) | | | 3,494,490 | | | | 3,268,920 |
|
Series 2006-RR2, Class A1, | | | | | | | |
5.811%, due 06/23/46(2),(5) | | | 3,125,000 | | | | 2,942,969 |
|
| | | | | | | | |
|
| 24 | | | | | | | |
UBS U.S. Allocation Fund
Portfolio of investments—August 31, 2007
| | | | Face | | | | |
| | | | amount | | | | Value |
|
Commercial mortgage-backed securities—(concluded) | | | | | | | |
| JP Morgan Chase Commercial Mortgage Securities Corp., | | | | | | | |
Series 2005-LDP5, Class A4, | | | | | | | |
5.345%, due 12/15/44(2) | | | $4,700,000 | | | | $4,607,589 |
|
Series 2006-LDP8, Class A4, | | | | | | | |
5.399%, due 05/15/45 | | | 1,350,000 | | | | 1,323,453 |
|
Series 2007-LDPX, Class B, | | | | | | | |
5.582%, due 01/15/49(2),(5) | | | 175,000 | | | | 161,719 |
|
| JP Morgan Commercial Mortgage Finance Corp., | | | | | | | |
Series 1998-C6, Class A3, | | | | | | | |
6.613%, due 01/15/30 | | | 181,645 | | | | 181,179 |
|
| Merrill Lynch Mortgage Trust, Series 2007-C1, Class B, | | | | | | | |
6.022%, due 06/12/50(2) | | | 325,000 | | | | 307,536 |
|
| Morgan Stanley Capital I, | | | | | | | |
Series 2007-IQ13, Class B, | | | | | | | |
5.517%, due 03/15/44(2),(5) | | | 375,000 | | | | 344,556 |
|
Series 2007-IQ15, Class B, | | | | | | | |
6.078%, due 06/11/49(2),(5) | | | 325,000 | | | | 309,169 |
|
| Total commercial mortgage-backed securities (cost—$22,453,555) | | | | | | | 22,146,081 |
|
Asset-backed securities—0.90% | | | | | | | |
| Conseco Finance Securitizations Corp., | | | | | | | |
Series 2000-5, Class A5, | | | | | | | |
7.700%, due 02/01/32 | | | 1,279,106 | | | | 1,280,144 |
|
| Countrywide Asset-Backed Certificates, | | | | | | | |
Series 2004-SD1, Class A1, | | | | | | | |
5.845%, due 06/25/33(2),(5) | | | 8,379 | | | | 8,207 |
|
| Fieldstone Mortgage Investment Corp., Series 2006-S1, Class A, | | | | | | | |
5.725%, due 01/25/37(2),(5) | | | 583,657 | | | | 559,764 |
|
| GSAMP Trust, Series 2006-S5, Class A2, | | | | | | | |
5.658%, due 12/12/36(3),(6) | | | 300,000 | | | | 129,000 |
|
| Home Equity Mortgage Trust, | | | | | | | |
Series 2006-4, Class A1, | | | | | | | |
5.671%, due 11/25/36(3) | | | 231,504 | | | | 211,793 |
|
Series 2006-4, Class A2, | | | | | | | |
5.730%, due 11/25/36(3) | | | 2,000,000 | | | | 1,567,579 |
|
Series 2006-5, Class A1, | | | | | | | |
5.500%, due 01/25/37(3) | | | 192,075 | | | | 184,695 |
|
Series 2006-6, Class 2A1, | | | | | | | |
5.605%, due 03/25/37(2) | | | 232,705 | | | | 212,588 |
|
| | | | | | | | |
|
| | | | | | | | 25 |
UBS U.S. Allocation Fund
Portfolio of investments—August 31, 2007
| | | | Face | | | | |
| | | | amount | | | | Value |
|
Asset-backed securities—(concluded) | | | | | | | |
| Long Beach Mortgage Loan Trust, Series 2006-A, Class A2, | | | | | | | |
5.548%, due 05/25/36(3) | | | $250,000 | | | | $153,535 |
|
| Merrill Lynch First Franklin Mortgage Loan, | | | | | | | |
Series 2007-A, Class A1, | | | | | | | |
6.919%, due 09/25/27(2) | | | 250,000 | | | | 249,705 |
|
| Merrill Lynch Mortgage Investors Trust, Series 2006-SL1, Class A, | | | | | | | |
5.685%, due 09/25/36(2) | | | 201,615 | | | | 199,926 |
|
| Morgan Stanley Mortgage Loan Trust, Series 2006-14SL, Class A1, | | | | | | | |
5.665%, due 11/25/36(2) | | | 447,041 | | | | 403,725 |
|
| Nomura Asset Acceptance Corp., Series 2006-S4, Class A1, | | | | | | | |
5.675%, due 08/25/36(2) | | | 451,552 | | | | 431,514 |
|
| Rutland Rated Investments, Series DRYD-1A, Class A6F, | | | | | | | |
6.957%, due 06/20/13(5) | | | 645,000 | | | | 561,553 |
|
| SACO I Trust, Series 2006-5, Class 2A1, | | | | | | | |
5.655%, due 05/25/36(2) | | | 616,683 | | | | 553,397 |
|
| Total asset-backed securities (cost—$7,516,220) | | | | | | | 6,707,125 |
|
Corporate bonds—7.27% | | | | | | | |
| | | | | | | | |
Aerospace & defense—0.07% | | | | | | | |
| Esterline Technologies Corp. | | | | | | | |
6.625%, due 03/01/17(5) | | | 155,000 | | | | 149,575 |
|
| Hawker Beechcraft Acquisition Co. | | | | | | | |
8.875%, due 04/01/15(5) | | | 250,000 | | | | 243,750 |
|
| Sequa Corp. | | | | | | | |
9.000%, due 08/01/09 | | | 125,000 | | | | 129,375 |
|
| | | | | | | | 522,700 |
|
Agriculture—0.02% | | | | | | | |
| American Rock Salt Co. LLC | | | | | | | |
9.500%, due 03/15/14 | | | 150,000 | | | | 152,625 |
|
Apparel/textiles—0.03% | | | | | | | |
| Levi Strauss & Co. | | | | | | | |
12.250%, due 12/15/12 | | | 225,000 | | | | 240,188 |
|
Automobile OEM—0.75% | | | | | | | |
| Ford Motor Credit Co. | | | | | | | |
5.800%, due 01/12/09 | | | 3,425,000 | | | | 3,227,282 |
|
7.375%, due 10/28/09 | | | 750,000 | | | | 709,699 |
|
| General Motors | | | | | | | |
7.200%, due 01/15/11(1) | | | 300,000 | | | | 265,500 |
|
| | | | | | | | |
|
| 26 | | | | | | | |
UBS U.S. Allocation Fund
Portfolio of investments—August 31, 2007
| | | | Face | | | | |
| | | | amount | | | | Value |
|
Corporate bonds—(continued) | | | | | | | |
| | | | | | | | |
Automobile OEM—(concluded) | | | | | | | |
| General Motors Acceptance Corp. | | | | | | | |
6.875%, due 09/15/11 | | | $1,055,000 | | | | $940,912 |
|
7.250%, due 03/02/11 | | | 500,000 | | | | 459,351 |
|
| | | | | | | | 5,602,744 |
|
Automotive parts—0.04% | | | | | | | |
| Arvinmeritor | | | | | | | |
8.125%, due 09/15/15(1) | | | 175,000 | | | | 163,625 |
|
| Stanadyne Corp. | | | | | | | |
10.000%, due 08/15/14 | | | 125,000 | | | | 124,375 |
|
| | | | | | | | 288,000 |
|
Banking-non-US—0.10% | | | | | | | |
| Abbey National PLC | | | | | | | |
7.950%, due 10/26/29 | | | 275,000 | | | | 333,677 |
|
| Royal Bank of Scotland Group PLC | | | | | | | |
9.118%, due 03/31/10(7) | | | 350,000 | | | | 382,452 |
|
| | | | | | | | 716,129 |
|
Banking-US—1.07% | | | | | | | |
| Bank of America Corp. | | | | | | | |
5.420%, due 03/15/17 | | | 1,000,000 | | | | 961,484 |
|
| Citigroup, Inc. | | | | | | | |
5.000%, due 09/15/14 | | | 880,000 | | | | 842,585 |
|
5.625%, due 08/27/12 | | | 600,000 | | | | 605,869 |
|
| HSBC Bank USA | | | | | | | |
5.625%, due 08/15/35 | | | 580,000 | | | | 526,700 |
|
| J.P. Morgan Chase & Co. | | | | | | | |
6.750%, due 02/01/11 | | | 1,000,000 | | | | 1,043,011 |
|
| Wachovia Bank N.A. | | | | | | | |
7.800%, due 08/18/10 | | | 775,000 | | | | 837,013 |
|
| Wachovia Corp. | | | | | | | |
5.300%, due 10/15/11 | | | 525,000 | | | | 522,843 |
|
| Washington Mutual, Inc. | | | | | | | |
5.500%, due 01/15/13 | | | 1,335,000 | | | | 1,288,631 |
|
| Wells Fargo Bank N.A. | | | | | | | |
5.950%, due 08/26/36 | | | 655,000 | | | | 640,852 |
|
6.450%, due 02/01/11 | | | 675,000 | | | | 699,914 |
|
| | | | | | | | 7,968,902 |
|
| | | | | | | | |
|
| | | | | | | | 27 |
UBS U.S. Allocation Fund
Portfolio of investments—August 31, 2007
| | | | Face | | | | |
| | | | amount | | | | Value |
|
Corporate bonds—(continued) | | | | | | | |
| | | | | | | | |
Broadcast—0.11% | | | | | | | |
| CMP Susquehanna | | | | | | | |
9.875%, due 05/15/14 | | | $125,000 | | | | $115,625 |
|
| Nexstar Finance Holdings LLC, Inc. | | | | | | | |
11.375%, due 04/01/13(3) | | | 325,000 | | | | 316,875 |
|
| Nexstar Finance, Inc. | | | | | | | |
7.000%, due 01/15/14 | | | 100,000 | | | | 94,500 |
|
| Univision Communications, Inc. | | | | | | | |
7.850%, due 07/15/11 | | | 75,000 | | | | 72,937 |
|
9.750%, due 03/15/15(1),(5) | | | 200,000 | | | | 190,500 |
|
| | | | | | | | 790,437 |
|
Brokerage—0.47% | | | | | | | |
| Bear Stearns Co., Inc. | | | | | | | |
5.350%, due 02/01/12 | | | 240,000 | | | | 230,353 |
|
5.550%, due 01/22/17 | | | 205,000 | | | | 188,740 |
|
| Lehman Brothers Holdings | | | | | | | |
5.250%, due 02/06/12 | | | 535,000 | | | | 519,075 |
|
5.500%, due 04/04/16 | | | 235,000 | | | | 219,759 |
|
6.500%, due 07/19/17 | | | 495,000 | | | | 487,346 |
|
| Merrill Lynch & Co. | | | | | | | |
5.700%, due 05/02/17 | | | 145,000 | | | | 139,608 |
|
6.050%, due 08/15/12 | | | 295,000 | | | | 300,041 |
|
| Morgan Stanley | | | | | | | |
6.750%, due 04/15/11 | | | 1,325,000 | | | | 1,380,920 |
|
| | | | | | | | 3,465,842 |
|
Building materials—0.09% | | | | | | | |
| Ahern Rentals, Inc. | | | | | | | |
9.250%, due 08/15/13 | | | 125,000 | | | | 123,125 |
|
| Ainsworth Lumber | | | | | | | |
7.250%, due 10/01/12 | | | 50,000 | | | | 35,750 |
|
| CRH America, Inc. | | | | | | | |
6.000%, due 09/30/16 | | | 260,000 | | | | 259,448 |
|
| Interface, Inc. | | | | | | | |
10.375%, due 02/01/10 | | | 100,000 | | | | 103,500 |
|
| US Concrete, Inc. | | | | | | | |
8.375%, due 04/01/14 | | | 200,000 | | | | 186,000 |
|
| | | | | | | | 707,823 |
|
| | | | | | | | |
|
| 28 | | | | | | | |
UBS U.S. Allocation Fund
Portfolio of investments—August 31, 2007
| | | | Face | | | | |
| | | | amount | | | | Value |
|
Corporate bonds—(continued) | | | | | | | |
| | | | | | | | |
Business services—0.02% | | | | | | | |
| Da-Lite Screen Co., Inc. | | | | | | | |
9.500%, due 05/15/11 | | | $125,000 | | | | $128,125 |
|
| Sensata Technologies BV | | | | | | | |
8.000%, due 05/01/14 | | | 50,000 | | | | 47,000 |
|
| | | | | | | | 175,125 |
|
Cable—0.19% | | | | | | | |
| Comcast Cable Communications, Inc. | | | | | | | |
6.750%, due 01/30/11 | | | 800,000 | | | | 830,846 |
|
| Comcast Corp. | | | | | | | |
6.300%, due 11/15/17 | | | 160,000 | | | | 161,623 |
|
| Insight Communications, Inc. | | | | | | | |
12.250%, due 02/15/11(3) | | | 150,000 | | | | 154,313 |
|
| Mediacom Broadband LLC | | | | | | | |
9.500%, due 01/15/13 | | | 150,000 | | | | 150,000 |
|
| Quebecor Media | | | | | | | |
7.750%, due 03/15/16 | | | 100,000 | | | | 95,125 |
|
| | | | | | | | 1,391,907 |
|
Chemicals—0.14% | | | | | | | |
| Hercules, Inc. | | | | | | | |
6.500%, due 06/30/29 | | | 100,000 | | | | 83,000 |
|
| ICI Wilmington, Inc. | | | | | | | |
4.375%, due 12/01/08 | | | 450,000 | | | | 443,513 |
|
| Ineos Group Holdings PLC | | | | | | | |
8.500%, due 02/15/16(1),(5) | | | 150,000 | | | | 138,000 |
|
| Lyondell Chemical Co. | | | | | | | |
6.875%, due 06/15/17 | | | 110,000 | | | | 119,075 |
|
| Momentive Performance | | | | | | | |
9.750%, due 12/01/14(5) | | | 50,000 | | | | 47,625 |
|
| Montell Finance Co. BV | | | | | | | |
8.100%, due 03/15/27(5) | | | 75,000 | | | | 65,250 |
|
| Terra Capital, Inc. | | | | | | | |
7.000%, due 02/01/17 | | | 75,000 | | | | 72,000 |
|
| Wimar Opco LLC/Finance Corp. | | | | | | | |
9.625%, due 12/15/14(5) | | | 150,000 | | | | 111,000 |
|
| | | | | | | | 1,079,463 |
|
| | | | | | | | |
|
| | | | | | | | 29 |
UBS U.S. Allocation Fund
Portfolio of investments—August 31, 2007
| | | | Face | | | | |
| | | | amount | | | | Value |
|
Corporate bonds—(continued) | | | | | | | |
| | | | | | | | |
Commercial services & supplies—0.12% | | | | | | | |
| United Rentals N.A., Inc. | | | | | | | |
6.500%, due 02/15/12 | | | $590,000 | | | | $592,950 |
|
| Xerox Capital Trust I | | | | | | | |
8.000%, due 02/01/27 | | | 300,000 | | | | 297,750 |
|
| | | | | | | | 890,700 |
|
Consumer products—0.10% | | | | | | | |
| Fortune Brands, Inc. | | | | | | | |
5.375%, due 01/15/16 | | | 600,000 | | | | 572,551 |
|
| Prestige Brands, Inc. | | | | | | | |
9.250%, due 04/15/12 | | | 150,000 | | | | 148,875 |
|
| | | | | | | | 721,426 |
|
Containers & packaging—0.10% | | | | | | | |
| Jefferson Smurfit Corp. | | | | | | | |
8.250%, due 10/01/12 | | | 125,000 | | | | 122,187 |
|
| Owens-Illinois, Inc. | | | | | | | |
7.500%, due 05/15/10 | | | 150,000 | | | | 149,250 |
|
| Stone Container Finance | | | | | | | |
7.375%, due 07/15/14(1) | | | 500,000 | | | | 470,000 |
|
| | | | | | | | 741,437 |
|
Diversified manufacturing—0.06% | | | | | | | |
| Harland Clarke Holdings | | | | | | | |
10.308%, due 05/15/15(2) | | | 500,000 | | | | 447,500 |
|
Electric utilities—0.50% | | | | | | | |
| Comstock Resources, Inc. | | | | | | | |
6.875%, due 03/01/12 | | | 125,000 | | | | 116,250 |
|
| Dominion Resources, Inc. | | | | | | | |
5.950%, due 06/15/35 | | | 280,000 | | | | 262,361 |
|
| DTE Energy Co. | | | | | | | |
6.350%, due 06/01/16 | | | 250,000 | | | | 257,686 |
|
| Dynegy Holdings, Inc. | | | | | | | |
8.375%, due 05/01/16 | | | 125,000 | | | | 122,812 |
|
| Exelon Generation Co. LLC | | | | | | | |
5.350%, due 01/15/14 | | | 395,000 | | | | 381,702 |
|
| MidAmerican Energy Holdings | | | | | | | |
5.950%, due 05/15/37 | | | 210,000 | | | | 196,984 |
|
| | | | | | | | |
|
| 30 | | | | | | | |
UBS U.S. Allocation Fund
Portfolio of investments—August 31, 2007
| | | | Face | | | | |
| | | | amount | | | | Value |
|
Corporate bonds—(continued) | | | | | | | |
| | | | | | | | |
Electric utilities—(concluded) | | | | | | | |
| Mirant Americas Generation LLC | | | | | | | |
8.300%, due 05/01/11 | | | $300,000 | | | | $296,250 |
|
9.125%, due 05/01/31 | | | 175,000 | | | | 169,312 |
|
| Mirant N.A. LLC | | | | | | | |
7.375%, due 12/31/13 | | | 100,000 | | | | 99,500 |
|
| NRG Energy, Inc. | | | | | | | |
7.375%, due 02/01/16 | | | 150,000 | | | | 148,125 |
|
7.375%, due 01/15/17 | | | 125,000 | | | | 122,813 |
|
| Pacific Gas & Electric Co. | | | | | | | |
6.050%, due 03/01/34 | | | 270,000 | | | | 264,451 |
|
| PSEG Power | | | | | | | |
6.950%, due 06/01/12 | | | 670,000 | | | | 709,691 |
|
| Reliant Energy, Inc. | | | | | | | |
6.750%, due 12/15/14 | | | 550,000 | | | | 544,500 |
|
| | | | | | | | 3,692,437 |
|
Electronics—0.07% | | | | | | | |
| NXP BV/NXP Funding LLC | | | | | | | |
7.875%, due 10/15/14 | | | 50,000 | | | | 45,125 |
|
9.500%, due 10/15/15 | | | 50,000 | | | | 43,250 |
|
| Sanmina-SCI Corp. | | | | | | | |
8.110%, due 06/15/14(1),(2),(5) | | | 295,000 | | | | 278,038 |
|
8.125%, due 03/01/16(1) | | | 150,000 | | | | 129,750 |
|
| | | | | | | | 496,163 |
|
Energy—0.13% | | | | | | | |
| Anadarko Finance Co., Series B | | | | | | | |
6.750%, due 05/01/11 | | | 225,000 | | | | 235,357 |
|
| Devon Financing Corp., U.L.C. | | | | | | | |
6.875%, due 09/30/11 | | | 350,000 | | | | 370,174 |
|
| Gulfmark Offshore, Inc. | | | | | | | |
7.750%, due 07/15/14 | | | 100,000 | | | | 98,500 |
|
| Transocean, Inc. | | | | | | | |
7.500%, due 04/15/31 | | | 85,000 | | | | 94,408 |
|
| Whiting Petroleum Corp. | | | | | | | |
7.250%, due 05/01/12 | | | 200,000 | | | | 192,500 |
|
| | | | | | | | 990,939 |
|
| | | | | | | | |
|
| | | | | | | | 31 |
UBS U.S. Allocation Fund
Portfolio of investments—August 31, 2007
| | | | Face | | | | |
| | | | amount | | | | Value |
|
Corporate bonds—(continued) | | | | | | | |
| | | | | | | | |
Energy-integrated—0.06% | | | | | | | |
| PPL Energy Supply LLC | | | | | | | |
6.000%, due 12/15/36 | | | $185,000 | | | | $167,170 |
|
Series A | | | | | | | |
6.400%, due 11/01/11 | | | 250,000 | | | | 257,213 |
|
| | | | | | | | 424,383 |
|
Environmental services—0.04% | | | | | | | |
| Waste Management, Inc. | | | | | | | |
7.375%, due 08/01/10 | | | 300,000 | | | | 316,595 |
|
Finance-noncaptive consumer—0.55% | | | | | | | |
| American General Finance | | | | | | | |
4.875%, due 07/15/12 | | | 360,000 | | | | 344,523 |
|
| Capital One Financial | | | | | | | |
5.500%, due 06/01/15 | | | 595,000 | | | | 561,270 |
|
| Countrywide Financial Corp. | | | | | | | |
5.440%, due 10/31/07(2) | | | 350,000 | | | | 344,925 |
|
| Countrywide Home Loan | | | | | | | |
4.250%, due 12/19/07 | | | 160,000 | | | | 158,078 |
|
| HSBC Finance Corp. | | | | | | | |
6.750%, due 05/15/11 | | | 700,000 | | | | 726,288 |
|
| Residential Capital LLC | | | | | | | |
5.860%, due 06/09/08(2) | | | 645,000 | | | | 548,250 |
|
6.125%, due 11/21/08 | | | 765,000 | | | | 638,775 |
|
6.375%, due 06/30/10 | | | 980,000 | | | | 754,600 |
|
| | | | | | | | 4,076,709 |
|
Finance-noncaptive diversified—0.17% | | | | | | | |
| General Electric Capital Corp. | | | | | | | |
6.750%, due 03/15/32 | | | 425,000 | | | | 466,814 |
|
| International Lease Finance Corp. | | | | | | | |
3.500%, due 04/01/09 | | | 850,000 | | | | 828,804 |
|
| | | | | | | | 1,295,618 |
|
Food—0.05% | | | | | | | |
| Ameriqual Group LLC | | | | | | | |
9.000%, due 04/01/12(5) | | | 200,000 | | | | 186,000 |
|
| Conagra Foods, Inc. | | | | | | | |
6.750%, due 09/15/11 | | | 1,000 | | | | 1,044 |
|
| | | | | | | | |
|
| 32 | | | | | | | |
UBS U.S. Allocation Fund
Portfolio of investments—August 31, 2007
| | | | Face | | | | |
| | | | amount | | | | Value |
|
Corporate bonds—(continued) | | | | | | | |
| | | | | | | | |
Food—(concluded) | | | | | | | |
| Dole Foods Co. | | | | | | | |
8.875%, due 03/15/11(1) | | | $175,000 | | | | $166,250 |
|
| | | | | | | | 353,294 |
|
Food processors/beverage/bottling—0.04% | | | | | | | |
| Coors Brewing Co. | | | | | | | |
6.375%, due 05/15/12 | | | 1,000 | | | | 1,047 |
|
| SABMiller PLC | | | | | | | |
6.500%, due 07/01/16(5) | | | 300,000 | | | | 313,676 |
|
| | | | | | | | 314,723 |
|
Gaming—0.18% | | | | | | | |
| Circus & Eldorado | | | | | | | |
10.125%, due 03/01/12 | | | 100,000 | | | | 104,500 |
|
| Great Canadian Gaming Co. | | | | | | | |
7.250%, due 02/15/15(5) | | | 25,000 | | | | 24,000 |
|
| Harrah’s Operating Co., Inc. | | | | | | | |
5.500%, due 07/01/10 | | | 400,000 | | | | 376,000 |
|
| Jacobs Entertainment, Inc. | | | | | | | |
9.750%, due 06/15/14 | | | 225,000 | | | | 224,437 |
|
| Pokagon Gaming Authority | | | | | | | |
10.375%, due 06/15/14(5) | | | 100,000 | | | | 107,000 |
|
| River Rock Entertainment | | | | | | | |
9.750%, due 11/01/11 | | | 150,000 | | | | 153,750 |
|
| San Pasqual Casino | | | | | | | |
8.000%, due 09/15/13(5) | | | 150,000 | | | | 150,188 |
|
| Wheeling Island Gaming, Inc. | | | | | | | |
10.125%, due 12/15/09 | | | 200,000 | | | | 198,000 |
|
| | | | | | | | 1,337,875 |
|
Health care—0.10% | | | | | | | |
| Community Health Systems | | | | | | | |
8.875%, due 07/15/15(5) | | | 500,000 | | | | 499,375 |
|
| HCA, Inc. | | | | | | | |
9.125%, due 11/15/14(5) | | | 50,000 | | | | 51,250 |
|
9.250%, due 11/15/16(5) | | | 50,000 | | | | 51,375 |
|
| Psychiatric Solutions | | | | | | | |
7.750%, due 07/15/15 | | | 100,000 | | | | 98,000 |
|
| | | | | | | | |
|
| | | | | | | | 33 |
UBS U.S. Allocation Fund
Portfolio of investments—August 31, 2007
| | | | Face | | | | |
| | | | amount | | | | Value |
|
Corporate bonds—(continued) | | | | | | | |
| | | | | | | | |
Health care—(concluded) | | | | | | | |
| Universal Hospital Services | | | | | | | |
8.500%, due 06/01/15(5) | | | $20,000 | | | | $19,000 |
|
8.759%, due 06/01/15(2),(5) | | | 20,000 | | | | 19,300 |
|
| | | | | | | | 738,300 |
|
Industrial-other—0.05% | | | | | | | |
| Aramark Services, Inc. | | | | | | | |
8.856%, due 02/01/15(2) | | | 250,000 | | | | 248,750 |
|
| Tube City IMS Corp. | | | | | | | |
9.750%, due 02/01/15 | | | 100,000 | | | | 98,000 |
|
| | | | | | | | 346,750 |
|
Machinery-agriculture & construction—0.04% | | | | | | | |
| Clondalkin Acquisition | | | | | | | |
7.359%, due 12/15/13(2),(5) | | | 330,000 | | | | 313,500 |
|
Media—0.11% | | | | | | | |
| Affinion Group, Inc. | | | | | | | |
10.125%, due 10/15/13 | | | 100,000 | | | | 100,000 |
|
| Baker & Taylor, Inc. | | | | | | | |
11.500%, due 07/01/13(5) | | | 75,000 | | | | 73,500 |
|
| LIN Television Corp. | | | | | | | |
6.500%, due 05/15/13 | | | 525,000 | | | | 493,500 |
|
| Sinclair Broadcast Group | | | | | | | |
8.000%, due 03/15/12 | | | 132,000 | | | | 133,320 |
|
| | | | | | | | 800,320 |
|
Metals & mining—0.03% | | | | | | | |
| Century Aluminum Co. | | | | | | | |
7.500%, due 08/15/14 | | | 100,000 | | | | 99,000 |
|
| Neenah Corp. | | | | | | | |
9.500%, due 01/01/17 | | | 125,000 | | | | 112,500 |
|
| | | | | | | | 211,500 |
|
Oil & gas—0.18% | | | | | | | |
| Inergy LP/Inergy Finance | | | | | | | |
8.250%, due 03/01/16 | | | 175,000 | | | | 177,187 |
|
| Kinder Morgan Energy Partners | | | | | | | |
5.125%, due 11/15/14 | | | 510,000 | | | | 481,822 |
|
5.800%, due 03/15/35 | | | 650,000 | | | | 571,024 |
|
7.400%, due 03/15/31 | | | 115,000 | | | | 121,364 |
|
| | | | | | | | 1,351,397 |
|
| | | | | | | | |
|
| 34 | | | | | | | |
UBS U.S. Allocation Fund
Portfolio of investments—August 31, 2007
| | | | Face | | | | |
| | | | amount | | | | Value |
|
Corporate bonds—(continued) | | | | | | | |
| | | | | | | | |
Paper & forest products—0.28% | | | | | | | |
| Abitibi-Consolidated, Inc. | | | | | | | |
6.950%, due 04/01/08 | | | $110,000 | | | | $106,700 |
|
8.550%, due 08/01/10 | | | 150,000 | | | | 134,250 |
|
| Boise Cascade LLC | | | | | | | |
7.125%, due 10/15/14 | | | 115,000 | | | | 105,800 |
|
| Bowater Canada Finance | | | | | | | |
7.950%, due 11/15/11 | | | 200,000 | | | | 170,000 |
|
| Bowater, Inc. | | | | | | | |
9.000%, due 08/01/09 | | | 250,000 | | | | 238,750 |
|
| Buckeye Technologies, Inc. | | | | | | | |
8.000%, due 10/15/10 | | | 150,000 | | | | 150,000 |
|
| Cellu Tissue Holdings, Inc. | | | | | | | |
9.750%, due 03/15/10 | | | 175,000 | | | | 167,125 |
|
| Millar Western Forest | | | | | | | |
7.750%, due 11/15/13 | | | 150,000 | | | | 117,375 |
|
| P.H. Glatfelter | | | | | | | |
7.125%, due 05/01/16 | | | 75,000 | | | | 73,875 |
|
| Stone Container | | | | | | | |
8.000%, due 03/15/17 | | | 35,000 | | | | 33,381 |
|
| Verso Paper Holdings LLC | | | | | | | |
9.125%, due 08/01/14 | | | 200,000 | | | | 200,000 |
|
| Weyerhaeuser Co. | | | | | | | |
6.750%, due 03/15/12 | | | 565,000 | | | | 582,550 |
|
| | | | | | | | 2,079,806 |
|
Pharmaceuticals—0.17% | | | | | | | |
| Allergan, Inc. | | | | | | | |
5.750%, due 04/01/16 | | | 770,000 | | | | 775,136 |
|
| Bristol-Myers Squibb | | | | | | | |
5.875%, due 11/15/36 | | | 265,000 | | | | 249,682 |
|
| Teva Pharmaceutical Finance LLC | | | | | | | |
5.550%, due 02/01/16 | | | 265,000 | | | | 258,002 |
|
| | | | | | | | 1,282,820 |
|
Publishing—0.13% | | | | | | | |
| Cenveo Corp. | | | | | | | |
7.875%, due 12/01/13 | | | 125,000 | | | | 114,375 |
|
| Deluxe Corp. | | | | | | | |
5.000%, due 12/15/12 | | | 300,000 | | | | 265,500 |
|
| | | | | | | | |
|
| | | | | | | | 35 |
UBS U.S. Allocation Fund
Portfolio of investments—August 31, 2007
| | | | | Face | | | | |
| | | | | amount | | | | Value |
|
| Corporate bonds—(continued) | | | | | | | | |
| | | | | | | | | |
| Publishing—(concluded) | | | | | | | | |
| Quebecor World Capital Corp. | | | | | | | | |
8.750%, due 03/15/16(5) | | | | $200,000 | | | | $180,000 |
|
| R.H. Donnelley Corp. | | | | | | | | |
8.875%, due 01/15/16 | | | | 175,000 | | | | 179,375 |
|
| Sheridan Acquisition Corp. | | | | | | | | |
10.250%, due 08/15/11 | | | | 200,000 | | | | 200,000 |
|
| | | | | | | | | 939,250 |
|
| Real estate investment trusts—0.09% | | | | | | | | |
| Avalonbay Communities | | | | | | | | |
7.500%, due 08/01/09 | | | | 325,000 | | | | 339,312 |
|
| Prologis | | | | | | | | |
5.625%, due 11/15/15 | | | | 280,000 | | | | 270,710 |
|
| Realogy Corp. | | | | | | | | |
12.375%, due 04/15/15(1),(5) | | | | 75,000 | | | | 55,219 |
|
| | | | | | | | | 665,241 |
|
| Restaurants—0.02% | | | | | | | | |
| Restaurant Co. | | | | | | | | |
10.000%, due 10/01/13 | | | | 150,000 | | | | 128,250 |
|
| Retail—0.13% | | | | | | | | |
| Brookstone Co., Inc. | | | | | | | | |
12.000%, due 10/15/12 | | | | 50,000 | | | | 48,125 |
|
| CVS Caremark Corp. | | | | | | | | |
5.750%, due 06/01/17 | | | | 335,000 | | | | 327,406 |
|
| GSC Holdings Corp. | | | | | | | | |
8.000%, due 10/01/12 | | | | 225,000 | | | | 231,750 |
|
| Ingles Markets, Inc. | | | | | | | | |
8.875%, due 12/01/11 | | | | 200,000 | | | | 203,000 |
|
| Pantry, Inc. | | | | | | | | |
7.750%, due 02/15/14 | | | | 175,000 | | | | 166,250 |
|
| | | | | | | | | 976,531 |
|
| Road & rail—0.04% | | | | | | | | |
| Burlington Northern Santa Fe Corp. | | | | | | | | |
7.082%, due 05/13/29 | | | | 275,000 | | | | 294,773 |
|
| Services—0.02% | | | | | | | | |
| Carriage Services, Inc. | | | | | | | | |
7.875%, due 01/15/15 | | | | 150,000 | | | | 147,750 |
|
36
UBS U.S. Allocation Fund
Portfolio of investments—August 31, 2007
| | | | | Face | | | | |
| | | | | amount | | | | Value |
|
| Corporate bonds—(continued) | | | | | | | | |
| | | | | | | | | |
| Specialty purpose entity—0.03% | | | | | | | | |
| AAC Group Holding Corp. | | | | | | | | |
10.250%, due 10/01/12(3) | | | | $150,000 | | | | $129,000 |
|
| Riddell Bell Holdings, Inc. | | | | | | | | |
8.375%, due 10/01/12 | | | | 125,000 | | | | 118,750 |
|
| | | | | | | | | 247,750 |
|
| Technology-hardware—0.03% | | | | | | | | |
| Freescale Semiconductor | | | | | | | | |
8.875%, due 12/15/14 | | | | 175,000 | | | | 161,438 |
|
10.125%, due 12/15/16 | | | | 50,000 | | | | 43,500 |
|
| | | | | | | | | 204,938 |
|
| Technology-software—0.06% | | | | | | | | |
| Computer Sciences Corp. | | | | | | | | |
3.500%, due 04/15/08 | | | | 350,000 | | | | 344,995 |
|
| Unisys Corp. | | | | | | | | |
8.000%, due 10/15/12 | | | | 125,000 | | | | 116,875 |
|
| | | | | | | | | 461,870 |
|
| Telecommunications—0.24% | | | | | | | | |
| Bellsouth Corp. | | | | | | | | |
6.550%, due 06/15/34 | | | | 325,000 | | | | 327,873 |
|
| Citizens Communications | | | | | | | | |
9.000%, due 08/15/31 | | | | 200,000 | | | | 196,500 |
|
| Dycom Industries, Inc. | | | | | | | | |
8.125%, due 10/15/15 | | | | 100,000 | | | | 100,000 |
|
| Intelsat Subsidiary Holding Co. Ltd. | | | | | | | | |
8.625%, due 01/15/15 | | | | 200,000 | | | | 201,250 |
|
| Qwest Communications International | | | | | | | | |
7.250%, due 02/15/11 | | | | 150,000 | | | | 148,500 |
|
| Telecom Italia Capital | | | | | | | | |
5.250%, due 11/15/13 | | | | 850,000 | | | | 818,926 |
|
| | | | | | | | | 1,793,049 |
|
| Tobacco—0.02% | | | | | | | | |
| Reynolds American, Inc. | | | | | | | | |
7.250%, due 06/01/13 | | | | 150,000 | | | | 155,345 |
|
| Transportation services—0.01% | | | | | | | | |
| ERAC USA Finance Co. | | | | | | | | |
8.000%, due 01/15/11(5) | | | | 100,000 | | | | 107,544 |
|
37
UBS U.S. Allocation Fund
Portfolio of investments—August 31, 2007
| | | | | Face | | | | |
| | | | | amount | | | | Value |
|
| Corporate bonds—(concluded) | | | | | | | | |
| | | | | | | | | |
| Utilities-other—0.03% | | | | | | | | |
| Duke Capital LLC | | | | | | | | |
5.668%, due 08/15/14 | | | | $250,000 | | | | $247,387 |
|
| Wireless telecommunication services—0.19% | | | | | | | | |
| American Cellular Corp., Series B | | | | | | | | |
10.000%, due 08/01/11 | | | | 41,000 | | | | 42,537 |
|
| AT&T Corp. | | | | | | | | |
8.000%, due 11/15/31 | | | | 300,000 | | | | 356,985 |
|
| AT&T Wireless Services, Inc. | | | | | | | | |
8.750%, due 03/01/31 | | | | 175,000 | | | | 218,150 |
|
| Cincinnati Bell, Inc. | | | | | | | | |
8.375%, due 01/15/14 | | | | 135,000 | | | | 133,650 |
|
| Sprint Capital Corp. | | | | | | | | |
8.750%, due 03/15/32 | | | | 400,000 | | | | 461,735 |
|
| Wind Acquisition Finance SA | | | | | | | | |
10.750%, due 12/01/15(5) | | | | 100,000 | | | | 103,000 |
|
| Windstream Corp. | | | | | | | | |
8.625%, due 08/01/16 | | | | 125,000 | | | | 130,625 |
|
| | | | | | | | | 1,446,682 |
|
| Total corporate bonds (cost—$55,571,415) | | | | | | | | 54,142,437 |
|
| International government obligation—0.05% | | | | | | | | |
| | | | | | | | | |
| Pemex Project Funding Master Trust | | | | | | | | |
8.000%, due 11/15/11 | | | | | | | | |
(cost—$359,777) | | | | 330,000 | | | | 359,040 |
|
| Commercial paper(8)—0.12% | | | | | | | | |
| | | | | | | | | |
| Finance-noncaptive consumer—0.12% | | | | | | | | |
| Countrywide Financial Corp. | | | | | | | | |
11.985%, due 09/14/07 | | | | 675,000 | | | | 672,079 |
|
57.736%, due 10/09/07 | | | | 200,000 | | | | 187,811 |
|
| Total commercial paper (cost—$859,890) | | | | | | | | 859,890 |
|
| Repurchase agreement—3.13% | | | | | | | | |
| | | | | | | | | |
Repurchase agreement dated 08/31/07 with State Street | | | | | | | | |
Bank & Trust Co., 4.720%, due 09/04/07, collateralized by | | | | �� | | | | |
$19,112,968 US Treasury Bonds, 7.500% to 8.750% | | | | | | | | |
due 11/15/16 to 08/15/19 (value—$23,814,976); | | | | | | | | |
proceeds: $23,360,245 (cost—$23,348,000) | | | | 23,348,000 | | | | 23,348,000 |
|
38
UBS U.S. Allocation Fund
Portfolio of investments—August 31, 2007
| | | | | Shares | | | Value | |
| |
| Investments of cash collateral from securities loaned—7.90% | | | | |
| | | | | |
| Money market funds(9)—7.90% | | | | | | | | |
| BlackRock Provident Institutional TempFund, 5.236% | | | | 6,474 | | | $6,474 | |
| |
| DWS Money Market Series, 5.305% | | | | 8,145,381 | | | 8,145,381 | |
| |
| UBS Private Money Market Fund LLC, 5.271%(10) | | | | 50,680,822 | | | 50,680,822 | |
| |
| Total money market funds and investments of cash | | | | | | | | |
collateral from securities loaned (cost—$58,832,677) | | | | | | | 58,832,677 | |
| |
| Total investments (cost—$742,198,405)—108.14% | | | | | | | 805,663,223 | |
| |
| Liabilities in excess of other assets—(8.14)% | | | | | | | (60,622,847 | ) |
| |
| Net assets—100.00% | | | | | | | $745,040,376 | |
| |
| * | | Non-income producing security. |
| (1) | | Security, or portion thereof, was on loan at August 31, 2007. |
| (2) | | Floating rate securities—The interest rate shown is the current rate as of August 31, 2007. |
| (3) | | Step bond—Coupon rate increases in increments to maturity. Rate disclosed is as of August 31, 2007. Maturity date disclosed is the ultimate maturity date. |
| (4) | | Security is being fair valued by a valuation committee under the direction of the Board of Trustees. At August 31, 2007, the value of these securities amounted to $2,221,892 or 0.30% of net assets. |
| (5) | | Security exempt from registration under Rule 144A of the Securities Act of 1933. These securities are considered liquid, unless otherwise noted, and may be resold in transactions exempt from registration, normally to qualified institutional buyers. At August 31, 2007, the value of these securities amounted to $15,173,037 or 2.04% of net assets. |
| (6) | | Security is illiquid. At August 31, 2007, the value of this security amounted to $129,000 or 0.02% of net assets. |
| (7) | | Perpetual bond security. The maturity date reflects the next call date. |
| (8) | | Interest rates shown are the discount rates at date of purchase. |
| (9) | | The rate shown reflects the yield at August 31, 2007. |
39
UBS U.S. Allocation Fund
Portfolio of investments—August 31, 2007
| (10) | | The table below details the Fund’s transaction activity in an affiliated issuer for the year ended August 31, 2007. |
| | | | | | | | | | | Net income |
| | | | | | | | | | | earned from |
| | | | | Purchases | | Sales | | | | affiliate for |
| | | | | during the | | during the | | | | the year |
| Security | | Value at | | year ended | | year ended | | Value at | | ended |
| description | | 08/31/06 | | 08/31/07 | | 08/31/07 | | 08/31/07 | | 08/31/07 |
|
| UBS Private | | | | | | | | | | |
| Money Market | | | | | | | | | | |
| Fund LLC | | $22,164,084 | | $1,047,310,474 | | $1,018,793,736 | | $50,680,822 | | $59,994 |
|
| ARM | | Adjustable Rate Mortgage. The interest rate shown is the current rateas of August 31, 2007. |
| FHLMC | | Federal Home Loan Mortgage Corporation |
| FNMA | | Federal National Mortgage Association |
| GSAMP | | Goldman Sachs Asset Mortgage Passthrough |
| OEM | | Original Equipment Manufacturer |
| REMIC | | Real Estate Mortgage Investment Conduit |
Issuer breakdown by country or territory of origin (unaudited) |
| | | Percentage of total investments |
|
| United States | | 97.7 | % |
|
| Panama | | 0.9 | |
|
| Cayman Islands | | 0.7 | |
|
| Bermuda | | 0.2 | |
|
| Canada | | 0.2 | |
|
| United Kingdom | | 0.1 | |
|
| Italy | | 0.1 | |
|
| Netherlands | | 0.1 | |
|
| Total | | 100.0 | % |
|
See accompanying notes to financial statements
40
UBS U.S. Allocation Fund
Statement of assets and liabilities—August 31, 2007
| Assets: | | | | |
| Investments in unaffiliated securities, at value (cost—$691,517,583)(1) | | | $754,982,401 | |
| |
| Investment in an affiliated security, at value (cost—$50,680,822) | | | 50,680,822 | |
| |
| Total investments in securities, at value (cost—$742,198,405) | | | 805,663,223 | |
| |
| Cash | | | 684 | |
| |
| Receivable for investments sold | | | 2,909,754 | |
| |
| Receivable for shares of beneficial interest sold | | | 71,551 | |
| |
| Receivable for dividends and interest | | | 2,986,063 | |
| |
| Swap contracts, at value | | | 6,043 | |
| |
| Other assets | | | 54,503 | |
| |
| Total assets | | | 811,691,821 | |
| |
| | | | | |
| Liabilities: | | | | |
| Payable for cash collateral from securities loaned | | | 58,832,677 | |
| |
| Payable for investments purchased | | | 3,421,204 | |
| |
| Payable for shares of beneficial interest repurchased | | | 2,682,095 | |
| |
| Swap contracts, at value(2) | | | 799,953 | |
| |
| Payable to affiliates | | | 587,589 | |
| |
| Payable for foreign withholding taxes | | | 1,286 | |
| |
| Accrued expenses and other liabilities | | | 326,641 | |
| |
| Total liabilities | | | 66,651,445 | |
| |
| | | | | |
| Net assets: | | | | |
| Beneficial interest—$0.001 par value per share (unlimited amount authorized) | | | 771,820,447 | |
| |
| Accumulated undistributed net investment income | | | 13,664,599 | |
| |
| Accumulated net realized loss from investments and swaps | | | (104,188,133 | ) |
| |
| Net unrealized appreciation of investments | | | 63,743,463 | |
| |
| Net assets | | | $745,040,376 | |
| |
| (1) | | Includes $100,641,339 of investments in securities on loan, at value. |
| (2) | | Upfront payments received totaled $1,072,555. |
See accompanying notes to financial statements
41
UBS U.S. Allocation Fund
Statement of assets and liabilities—August 31, 2007
| Class A: | | |
| Net assets | | $452,438,522 |
|
| Shares outstanding | | 13,909,001 |
|
| Net asset value per share | | $32.53 |
|
| Maximum offering price per share (net asset value plus maximum sales charge of 5.50%) | | $34.42 |
|
| | | |
| Class B: | | |
| Net assets | | $28,167,144 |
|
| Shares outstanding | | 883,884 |
|
| Net asset value and offering price per share | | $31.87 |
|
| | | |
| Class C: | | |
| Net assets | | $205,104,296 |
|
| Shares outstanding | | 6,450,643 |
|
| Net asset value and offering price per share | | $31.80 |
|
| | | |
| Class Y: | | |
| Net assets | | $59,330,414 |
|
| Shares outstanding | | 1,796,516 |
|
| Net asset value and offering price per share | | $33.03 |
|
See accompanying notes to financial statements
42
UBS U.S. Allocation Fund
Statement of operations
| | | For the
year ended
August 31, 2007 |
|
| Investment income: | | | |
| Dividends | | $9,858,410 | |
|
| Interest (net of foreign withholding taxes of $2,563) | | 15,476,570 | |
|
| Securities lending income (includes $59,994 earned from an affiliated entity) | | 188,124 | |
|
| | | 25,523,104 | |
|
| | | | |
| Expenses: | | | |
| Investment advisory and administration fees | | 3,922,681 | |
|
| Service fees—Class A | | 1,197,700 | |
|
| Service and distribution fees—Class B | | 522,121 | |
|
| Service and distribution fees—Class C | | 2,221,777 | |
|
| Transfer agency and related service fees—Class A | | 527,948 | |
|
| Transfer agency and related service fees—Class B | | 93,793 | |
|
| Transfer agency and related service fees—Class C | | 231,542 | |
|
| Transfer agency and related service fees—Class Y | | 13,531 | |
|
| Custody and accounting fees | | 337,558 | |
|
| Reports and notices to shareholders | | 159,385 | |
|
| Professional fees | | 125,691 | |
|
| State registration fees | | 81,633 | |
|
| Insurance expense | | 37,602 | |
|
| Trustees’ fees | | 22,995 | |
|
| Interest expense | | 15,212 | |
|
| Other expenses | | 28,243 | |
|
| | | 9,539,412 | |
|
| Less: Fee waivers by investment advisor and administrator | | (171,947 | ) |
|
| Net expenses | | 9,367,465 | |
|
| Net investment income | | 16,155,639 | |
|
| | | | |
| Realized and unrealized gains from investment activities | | | |
| Net realized gains from: | | | |
| Investments | | 71,818,286 | |
|
| Swaps | | 28,363 | |
|
| Net change in unrealized appreciation/depreciation of: | | | |
| Investments | | 2,231,476 | |
|
| Swaps | | 278,645 | |
|
| Net realized and unrealized gain from investment activities | | 74,356,770 | |
|
| Net increase in net assets resulting from operations | | $90,512,409 | |
|
See accompanying notes to financial statements
43
UBS U.S. Allocation Fund
Statement of changes in net assets
| | | | For the years ended August 31, |
| | | |
|
| | | | 2007 | | | | 2006 | |
|
| From operations: | | | | | | | | |
| Net investment income | | | $16,155,639 | | | | $16,370,720 | |
|
| Net realized gains from investments and swaps | | | 71,846,649 | | | | 49,492,775 | |
|
| Net change in unrealized appreciation/depreciation of investments and swaps | | | 2,510,121 | | | | (2,616,205 | ) |
|
| Net increase in net assets resulting from operations | | | 90,512,409 | | | | 63,247,290 | |
|
| | | | | | | | | |
| Dividends to shareholders from: | | | | | | | | |
| Net investment income—Class A | | | (10,456,632 | ) | | | (10,696,257 | ) |
|
| Net investment income—Class B | | | (690,100 | ) | | | (947,042 | ) |
|
| Net investment income—Class C | | | (3,289,920 | ) | | | (3,192,484 | ) |
|
| Net investment income—Class Y | | | (2,980,008 | ) | | | (2,885,670 | ) |
|
| | | | (17,416,660 | ) | | | (17,721,453 | ) |
|
| | | | | | | | | |
| From beneficial interest transactions: | | | | | | | | |
| Net proceeds from the sale of shares | | | 16,978,079 | | | | 19,991,380 | |
|
| Cost of shares repurchased | | | (254,156,118 | ) | | | (258,340,216 | ) |
|
| Proceeds from dividends reinvested | | | 16,501,783 | | | | 16,781,941 | |
|
| Redemption fees | | | 5,320 | | | | — | |
|
| Net decrease in net assets from beneficial interest transactions | | | (220,670,936 | ) | | | (221,566,895 | ) |
|
| Net decrease in net assets | | | (147,575,187 | ) | | | (176,041,058 | ) |
|
| | | | | | | | | |
| Net assets: | | | | | | | | |
| Beginning of year | | | 892,615,563 | | | | 1,068,656,621 | |
|
| End of year | | | $745,040,376 | | | | $892,615,563 | |
|
| Accumulated undistributed net investment income | | | $13,664,599 | | | | $14,556,482 | |
|
See accompanying notes to financial statements
44
(This page has been left blank intentionally)
45
UBS U.S. Allocation Fund
Financial highlights
Selected data for a share of beneficial interest outstanding throughout each year is presented below:
| | | | Class A |
| | | |
|
| | | | For the years ended August 31, |
| | | |
|
| | | | 2007 | | | | 2006 | | | | 2005 | | | | 2004 | | | | 2003 | |
|
| Net asset value, beginning of year | | | $29.94 | | | | $28.60 | | | | $25.81 | | | | $23.00 | | | | $20.80 | |
|
| Net investment income(1) | | | 0.68 | | | | 0.56 | | | | 0.51 | | | | 0.30 | | | | 0.18 | |
|
| Net realized and unrealized gains from investment activities | | | 2.60 | | | | 1.38 | | | | 2.79 | | | | 2.72 | | | | 2.10 | |
|
| Net increase from operations | | | 3.28 | | | | 1.94 | | | | 3.30 | | | | 3.02 | | | | 2.28 | |
|
| Dividends from net investment income | | | (0.69 | ) | | | (0.60 | ) | | | (0.51 | ) | | | (0.21 | ) | | | (0.08 | ) |
|
| Net asset value, end of year | | | $32.53 | | | | $29.94 | | | | $28.60 | | | | $25.81 | | | | $23.00 | |
|
| Total investment return(2) | | | 11.04 | % | | | 6.84 | % | | | 12.85 | % | | | 13.19 | % | | | 10.99 | % |
|
| Ratios/supplemental data: | | | | | | | | | | | | | | | | | | | | |
| Net assets, end of year (000’s) | | | $452,439 | | | | $472,213 | | | | $525,711 | | | | $552,195 | | | | $649,582 | |
|
| Expenses to average net assets, net of fee waivers by advisor | | | 0.90 | % | | | 0.91 | % | | | 0.90 | % | | | 0.93 | % | | | 0.98 | %(3) |
|
| Expenses to average net assets, before fee waivers by advisor | | | 0.92 | % | | | 0.94 | % | | | 0.93 | % | | | 0.95 | % | | | 0.98 | %(3) |
|
| Net investment income to average net assets | | | 2.12 | % | | | 1.91 | % | | | 1.87 | % | | | 1.18 | % | | | 0.84 | % |
|
| Portfolio turnover | | | 85 | % | | | 82 | % | | | 67 | % | | | 128 | % | | | 2 | % |
|
| (1) | | Calculated using the average month-end shares outstanding for the year. |
| (2) | | Total investment return is calculated assuming a $10,000 investment on the first day of each year reported, reinvestment of all dividends and other distributions, if any, at net asset value on the ex-dividend dates and a sale at net asset value on the last day of each year reported. The figures do not include any applicable sales charges or redemption fees; results would be lower if they were included. Returns do not reflect the deduction of taxes that a shareholder would pay on Fund distributions or the redemption of Fund shares. |
| (3) | | During the year ended August 31, 2003, UBS Global Asset Management (US) Inc. did not waive any advisory and administration fees. UBS Global Asset Management (US) Inc. served as advisor to the Fund until April 1, 2006. |
See accompanying notes to financial statements
46
| Class B |
|
| For the years ended August 31, |
|
| 2007 | | | | 2006 | | | | 2005 | | | | 2004 | | | | 2003 | |
|
| $29.24 | | | | $27.81 | | | | $25.04 | | | | $22.29 | | | | $20.23 | |
|
| 0.39 | | | | 0.30 | | | | 0.28 | | | | 0.09 | | | | 0.02 | |
|
| 2.57 | | | | 1.36 | | | | 2.70 | | | | 2.66 | | | | 2.04 | |
|
| 2.96 | | | | 1.66 | | | | 2.98 | | | | 2.75 | | | | 2.06 | |
|
| (0.33 | ) | | | (0.23 | ) | | | (0.21 | ) | | | — | | | | — | |
|
| $31.87 | | | | $29.24 | | | | $27.81 | | | | $25.04 | | | | $22.29 | |
|
| 10.16 | % | | | 5.99 | % | | | 11.95 | % | | | 12.34 | % | | | 10.18 | % |
|
| $28,167 | | | | $77,296 | | | | $148,208 | | | | $277,891 | | | | $461,273 | |
|
| 1.72 | % | | | 1.71 | % | | | 1.70 | % | | | 1.70 | % | | | 1.74 | %(3) |
|
| 1.74 | % | | | 1.74 | % | | | 1.73 | % | | | 1.72 | % | | | 1.74 | %(3) |
|
| 1.29 | % | | | 1.07 | % | | | 1.08 | % | | | 0.36 | % | | | 0.08 | % |
|
| 85 | % | | | 82 | % | | | 67 | % | | | 128 | % | | | 2 | % |
|
47
UBS U.S. Allocation Fund
Financial highlights
Selected data for a share of beneficial interest outstanding throughout each year is presented below:
| | | | Class C |
| | | |
|
| | | | For the years ended August 31, |
| | | |
|
| | | | 2007 | | | | 2006 | | | | 2005 | | | | 2004 | | | | 2003 | |
|
| Net asset value, beginning of year | | | $29.27 | | | | $27.95 | | | | $25.21 | | | | $22.46 | | | | $20.38 | |
|
| Net investment income(1) | | | 0.43 | | | | 0.33 | | | | 0.30 | | | | 0.10 | | | | 0.02 | |
|
| Net realized and unrealized gains from investment activities | | | 2.55 | | | | 1.35 | | | | 2.72 | | | | 2.67 | | | | 2.06 | |
|
| Net increase from operations | | | 2.98 | | | | 1.68 | | | | 3.02 | | | | 2.77 | | | | 2.08 | |
|
| Dividends from net investment income | | | (0.45 | ) | | | (0.36 | ) | | | (0.28 | ) | | | (0.02 | ) | | | — | |
|
| Net asset value, end of year | | | $31.80 | | | | $29.27 | | | | $27.95 | | | | $25.21 | | | | $22.46 | |
|
| Total investment return(2) | | | 10.23 | % | | | 6.02 | % | | | 12.02 | % | | | 12.35 | % | | | 10.21 | % |
|
| Ratios/supplemental data: | | | | | | | | | | | | | | | | | | | | |
| Net assets, end of year (000’s) | | | $205,104 | | | | $226,219 | | | | $271,996 | | | | $333,765 | | | | $458,117 | |
|
| Expenses to average net assets, net of fee waivers by advisor | | | 1.65 | % | | | 1.65 | % | | | 1.65 | % | | | 1.67 | % | | | 1.72 | %(3) |
|
| Expenses to average net assets, before fee waviers by advisor | | | 1.67 | % | | | 1.68 | % | | | 1.68 | % | | | 1.69 | % | | | 1.72 | %(3) |
|
| Net investment income to average net assets | | | 1.38 | % | | | 1.16 | % | | | 1.12 | % | | | 0.42 | % | | | 0.10 | % |
|
| Portfolio turnover | | | 85 | % | | | 82 | % | | | 67 | % | | | 128 | % | | | 2 | % |
|
| (1) | | Calculated using the average month-end shares outstanding for the year. |
| (2) | | Total investment return is calculated assuming a $10,000 investment on the first day of each year reported, reinvestment of all dividends and other distributions, if any, at net asset value on the ex-dividend dates and a sale at net asset value on the last day of each year reported. The figures do not include any applicable sales charges or redemption fees; results would be lower if they were included. Returns do not reflect the deduction of taxes that a shareholder would pay on Fund distributions or the redemption of Fund shares. |
| (3) | | During the year ended August 31, 2003, UBS Global Asset Management (US) Inc. did not waive any advisory and administration fees. UBS Global Asset Management (US) Inc. served as advisor to the Fund until April 1, 2006. |
See accompanying notes to financial statements
48
| Class Y |
|
| For the years ended August 31, |
|
| 2007 | | | | 2006 | | | | 2005 | | | | 2004 | | | | 2003 | |
|
| $30.39 | | | | $29.02 | | | | $26.19 | | | | $23.33 | | | | $21.07 | |
|
| 0.79 | | | | 0.67 | | | | 0.61 | | | | 0.39 | | | | 0.25 | |
|
| 2.66 | | | | 1.40 | | | | 2.83 | | | | 2.76 | | | | 2.13 | |
|
| 3.45 | | | | 2.07 | | | | 3.44 | | | | 3.15 | | | | 2.38 | |
|
| (0.81 | ) | | | (0.70 | ) | | | (0.61 | ) | | | (0.29 | ) | | | (0.12 | ) |
|
| $33.03 | | | | $30.39 | | | | $29.02 | | | | $26.19 | | | | $23.33 | |
|
| 11.42 | % | | | 7.22 | % | | | 13.22 | % | | | 13.58 | % | | | 11.39 | % |
|
| $59,330 | | | | $116,888 | | | | $122,743 | | | | $123,727 | | | | $137,401 | |
|
| 0.55 | % | | | 0.55 | % | | | 0.55 | % | | | 0.58 | % | | | 0.63 | %(3) |
|
| 0.57 | % | | | 0.57 | % | | | 0.58 | % | | | 0.60 | % | | | 0.63 | %(3) |
|
| 2.48 | % | | | 2.27 | % | | | 2.21 | % | | | 1.53 | % | | | 1.19 | % |
|
| 85 | % | | | 82 | % | | | 67 | % | | | 128 | % | | | 2 | % |
|
49
UBS U.S. Allocation Fund
Notes to financial statements
Organization and significant accounting policies
UBS U.S. Allocation Fund (the “Fund”) is a series of UBS Investment Trust (the “Trust”) and is registered with the Securities and Exchange Commission under the Investment Company Act of 1940, as amended, as an open-end, diversified management investment company. The Trust was organized on March 28, 1991, as a business trust under the laws of the Commonwealth of Massachusetts and currently has one operating series.
Currently, the Fund offers Class A, Class B, Class C and Class Y shares. Each class represents interests in the same assets of the Fund, and the classes are identical except for differences in their sales charge structures, ongoing service and distribution charges and certain transfer agency and related services expenses. In addition, Class B shares and all corresponding reinvested dividend shares automatically convert to Class A shares within a certain number of years after issuance which varies depending upon the amount invested. All classes of shares have equal voting privileges except that Class A, Class B and Class C shares each have exclusive voting rights with respect to their respective service and/or distribution plans. Class Y shares have no service or distribution plan.
In the normal course of business the Fund may enter into contracts that contain a variety of representations or that provide indemnification for certain liabilities. The Fund’s maximum exposure under these arrangements is unknown, as this would involve future claims that may be made against the Fund that have not yet occurred. However, the Fund has not had prior claims or losses pursuant to these contracts and expects the risk of loss to be remote.
The preparation of financial statements in accordance with US generally accepted accounting principles requires the Fund’s management to make estimates and assumptions that affect the reported amounts and disclosures in the financial statements. Actual results could differ from those estimates. The following is a summary of significant accounting policies:
Valuation of investments—The Fund calculates net asset values based on the current market value for its portfolio securities. The Fund normally obtains market values for its securities from independent pricing sources. Independent pricing sources may use last reported sale prices, current market quotations or valuations from computerized “matrix” systems that derive values based on comparable securities. Securities traded in the over-the-counter (“OTC”) market and listed on The Nasdaq Stock
50
UBS U.S. Allocation Fund
Notes to financial statements
Market, Inc. (“NASDAQ”) normally are valued at the NASDAQ Official Closing Price. Other OTC securities are valued at the last bid price available prior to valuation. Securities which are listed on US and foreign stock exchanges normally are valued at the last sale price on the day the securities are valued or, lacking any sales on such day, at the last available bid price. In cases where securities are traded on more than one exchange, the securities are valued on the exchange designated as the primary market by UBS Global Asset Management (Americas) Inc. (“UBS Global AM”). If a market value is not available from an independent pricing source for a particular security, that security is valued at fair value as determined in good faith by or under the direction of the Trust’s Board of Trustees (the “Board”). Various factors may be reviewed in order to make a good faith determination of a security’s fair value. These factors include, but are not limited to, the type and cost of the security; contractual or legal restrictions on resale of the security; relevant financial or business developments of the issuer; actively traded similar or related securities; conversion or exchange rights on the security; related corporate actions; and changes in overall market conditions. If events occur that materially affect the value of securities (particularly non-US securities) between the close of trading in those securities and the close of regular trading on the New York Stock Exchange, the securities are fair valued. The amortized cost method of valuation, which approximates market value, generally is used to value short-term debt-instruments with sixty days or less remaining to maturity, unless the Board determines that this does not represent fair value.
In September 2006, the Financial Accounting Standards Board (“FASB”) issued Statement on Financial Accounting Standards No. 157, “Fair Value Measurements” (“FAS 157”). This standard clarifies the definition of fair value for financial reporting, establishes a framework for measuring fair value and requires additional disclosures about the use of fair value measurements. FAS 157 is effective for financial statements issued for fiscal years beginning after November 15, 2007 and interim periods within those fiscal years. As of August 31, 2007, management does not believe the adoption of FAS 157 will impact the amounts reported in the financial statements, however, additional disclosures will be required about the inputs used to develop the measurements of fair value and the effect of certain measurements reported in the Statement of Operations for a fiscal period.
Repurchase agreements—The Fund may purchase securities or other obligations from a bank or securities dealer (or its affiliate), subject to the seller’s agreement to repurchase them at an agreed upon date
51
UBS U.S. Allocation Fund
Notes to financial statements
(or upon demand) and price. The Fund maintains custody of the underlying obligations prior to their repurchase, either through its regular custodian or through a special “tri-party” custodian or sub-custodian that maintains a separate account for both the Fund and its counterparty. The underlying collateral is valued daily to ensure that the value, including accrued interest, is at least equal to the repurchase price. In the event of default of the obligation to repurchase, the Fund generally has the right to liquidate the collateral and apply the proceeds in satisfaction of the obligation. Repurchase agreements involving obligations other than US government securities (such as commercial paper, corporate bonds and mortgage loans) may be subject to special risks and may not have the benefit of certain protections in the event of counterparty insolvency. If the seller (or seller’s guarantor, if any) becomes insolvent, the Fund may suffer delays, costs and possible losses in connection with the disposition or retention of the collateral. Under certain circumstances, in the event of default or bankruptcy by the other party to the agreement, realization and/or retention of the collateral may be subject to legal proceedings. The Fund may participate in joint repurchase agreement transactions with other funds managed, advised or sub-advised by UBS Global AM.
Investment transactions, investment income and expenses—Investment transactions are recorded on the trade date. Realized gains and losses from investment transactions are calculated using the identified cost method. Dividend income is recorded on the ex-dividend date (“ex-date”). Interest income is recorded on an accrual basis. Discounts are accreted and premiums are amortized as adjustments to interest income and the identified cost of investments.
Income, expenses (excluding class-specific expenses) and realized/unrealized gains/losses are allocated proportionately to each class of shares based upon the relative net asset value of outstanding shares (or the value of dividend-eligible shares, as appropriate) of each class at the beginning of the day (after adjusting for current capital share activity of the respective classes). Class-specific expenses are charged directly to the applicable class of shares.
Credit default swap agreements—Credit default swap agreements involve commitments to make or receive payments in the event of a default of a security or a credit event. As a buyer, the Fund would make periodic payments to the counterparty, and the Fund would receive
52
UBS U.S. Allocation Fund
Notes to financial statements
payments only upon the occurrence of a credit event. If no credit event occurs, the Fund will lose its periodic stream of payments over the term of the contract. However, if a credit event does occur, the Fund typically would receive full notional value for a reference obligation that may have little or no value. As a seller, the Fund would receive periodic payments from the counterparty, and the Fund would make payments only upon the occurrence of a credit event. If no default or credit event occurs, the Fund will gain the periodic stream of payments it received over the term of the contract and the counterparty will lose its periodic stream of payments over the term of the contract. However, if a default or credit event occurs, the Fund typically pays full notional value for a reference obligation that may have little or no value. Credit default swaps may involve greater risks than if the Fund had invested in the reference obligation directly and are subject to general market risk, liquidity risk and credit risk.
At August 31, 2007, the Fund had outstanding credit default swap contracts with the following terms:
Credit default swaps(1)
| | | | | | | Rate type | | | | |
| | | | | | |
| | | | |
| Notional | | | | | | Payments | | | Payments | | | | | |
| amount | | | | Termination | | made by | | | received by | | | | | |
| (000) | | | | dates | | the Fund | | | the Fund | | | | Value | |
|
| USD | | 450 | | 09/20/08 | | 0.000%(2) | | | 6.000% | | | | $6,043 | |
|
| USD | | 750 | | 09/20/08 | | 0.000(3) | | | 8.000 | | | | (50,975 | ) |
|
| USD | | 5,000 | | 06/20/12 | | 0.000(4) | | | 1.200 | | | | (250,164 | ) |
|
| USD | | 10,000 | | 06/20/12 | | 0.000(5) | | | 2.750 | | | | (498,814 | ) |
|
| | | | | | | | | | | | | | $(793,910 | ) |
|
| (1) | | Payments received are based on the notional amounts. |
| (2) | | Payment to the counterparty will be made upon the occurrence of bankruptcy and/or by a restructuring event with respect to the Countrywide Home Loans, Inc. bond, 6.00%, due 3/22/11. |
| (3) | | Payment to the counterparty will be made upon the occurrence of bankruptcy and/or by a restructuring event with respect to the Residential Capital LLC bond, 6.50%, due 4/17/13. |
| (4) | | Payment to the counterparty will be made upon the occurrence of bankruptcy and/or by a restructuring event with respect to the securities contained in the Loan CDX North America Index Series 8. |
| (5) | | Payment to the counterparty will be made upon the occurrence of bankruptcy and/or by a restructuring event with respect to the securities contained in the CDX North America High Yield Index. |
53
UBS U.S. Allocation Fund
Notes to financial statements
Dividends and distributions—Dividends and distributions to shareholders are recorded on the ex-dividend date. The amount of dividends and distributions is determined in accordance with federal income tax regulations, which may differ from US generally accepted accounting principles. These “book/tax” differences are either considered temporary or permanent in nature. To the extent these differences are permanent in nature, such amounts are reclassified within the capital accounts based on their federal tax-basis treatment; temporary differences do not require reclassification.
Concentration of risk
The ability of the issuers of the debt securities held by the Fund to meet their obligations may be affected by economic developments, including those particular to a specific industry, country or region.
Investment advisor and administrator
The Board has approved an Investment Advisory and Administration Contract (“Advisory Contract”), under which UBS Global AM serves as investment advisor and administrator of the Fund. In accordance with the Advisory Contract, the Fund is to pay UBS Global AM an investment advisory and administration fee, which is to be accrued daily and paid monthly, at an annual rate of 0.50% of the Fund’s average daily net assets up to $250 million and 0.45% thereafter.
UBS Global AM has agreed to permanently reduce its advisory and administration fee based on the Fund’s average daily net assets so that it is assessed as follows: $0 to $250 million – 0.50%; in excess of $250 million up to $500 million – 0.45%; in excess of $500 million up to $2 billion – 0.40%; and over $2 billion – 0.35%. Accordingly, for the year ended August 31, 2007, UBS Global AM waived $171,947 in investment advisory and administration fees. At August 31, 2007, the Fund owed UBS Global AM $296,602 in investment advisory and administration fees. At August 31, 2007, UBS Global AM owed the Fund $10,543 for fee waivers under the above agreement.
For the year ended August 31, 2007, the Fund paid $23,940 in brokerage commissions to UBS Securities LLC, an indirect wholly owned subsidiary of UBS AG, for transactions executed on behalf of the Fund.
54
UBS U.S. Allocation Fund
Notes to financial statements
Additional information regarding compensation to affiliate of a board member
Effective March 1, 2005, Professor Meyer Feldberg accepted the position of senior advisor to Morgan Stanley, resulting in him becoming an interested trustee of the Fund. The Fund has been informed that Professor Feldberg’s role at Morgan Stanley does not involve matters directly affecting any UBS funds. Fund transactions are executed through Morgan Stanley based on that firm’s ability to provide best execution of the transactions. During the year ended August 31, 2007, the Fund paid brokerage commissions to Morgan Stanley in the amount of $15,840. During the year ended August 31, 2007, the Fund purchased and sold certain securities (e.g., fixed income securities) in principal trades with Morgan Stanley having an aggregate value of $123,955,091. Morgan Stanley received compensation in connection with these trades, which may have been in the form of a “mark-up” or “mark-down” of the price of the securities, a fee from the issuer for maintaining a commercial paper program, or some other form of compensation. Although the precise amount of this compensation is not generally known by the advisor, it is believed that under normal circumstances it represents a small portion of the total value of the transactions.
Service and distribution plans
UBS Global Asset Management (US) Inc. (“UBS Global AM—US”) is the principal underwriter of the Fund’s shares. Under separate plans of service and/or distribution pertaining to Class A, Class B and Class C shares, the Fund pays UBS Global AM—US monthly service fees at an annual rate of 0.25% of the average daily net assets of Class A, Class B and Class C shares and monthly distribution fees at the annual rate of 0.75% of the average daily net assets of Class B and Class C shares. At August 31, 2007, the Fund owed UBS Global AM—US $295,761 for service and distribution fees.
UBS Global AM—US also receives the proceeds of the initial sales charges paid by shareholders upon the purchase of Class A shares and the contingent deferred sales charges paid by shareholders upon certain redemptions of Class A, Class B and Class C shares. UBS Global AM—US has informed the Fund that for the year ended August 31, 2007, it earned $149,225, $89,783, and $5,991 in initial sales and deferred sales charges on Class A, Class B and Class C shares, respectively.
55
UBS U.S. Allocation Fund
Notes to financial statements
Redemption fees
Effective March 1, 2007, there will be a redemption fee of 1.00% on any class of shares if an investor sells or exchanges shares less than 90 days after purchase, subject to certain exemptions as noted in the prospectus. For the period ended August 31, 2007, the Fund received $5,320 in redemption fees.
Transfer agency related services fees
UBS Financial Services Inc., an indirect wholly owned subsidiary of UBS AG, provides certain services to the Fund pursuant to a delegation of authority from PFPC, Inc. (“PFPC”), the Fund’s transfer agent, and is compensated for these services by PFPC, not the Fund.
For the year ended August 31, 2007, UBS Financial Services, Inc. received from PFPC, not the Fund, $432,966 of the total delegated services fees paid by the Fund to PFPC.
Securities lending
The Fund may lend securities up to 331/3% of its total assets to qualified broker-dealers or institutional investors. The loans are secured at all times by cash, US government securities or irrevocable letters of credit in an amount at least equal to the market value of the securities loaned, plus accrued interest and dividends, determined on a daily basis and adjusted accordingly. The Fund may regain ownership of loaned securities to exercise certain beneficial rights; however, the Fund may bear the risk of delay in recovery of, or even loss of rights in, the securities loaned should the borrower fail financially. The Fund receives compensation for lending its securities from interest or dividends earned on the cash, US government securities or irrevocable letters of credit held as collateral, net of fee rebates paid to the borrower plus reasonable administrative and custody fees. UBS Financial Services Inc. and other affiliated broker-dealers have been approved as borrowers under the Fund’s securities lending program. UBS Securities LLC is the Fund’s lending agent. For the year ended August 31, 2007, UBS Securities LLC earned $67,084 in compensation as the Fund’s lending agent. At August 31, 2007, the Fund owed UBS Securities LLC $5,769 in compensation as the Fund’s lending agent.
At August 31, 2007, the Fund had securities on loan having a market value of $100,641,339. The custodian for the Fund held cash and cash equivalents as collateral for securities loaned of $58,832,677. In addition,
56
UBS U.S. Allocation Fund
Notes to financial statements
the Fund held US government and agency securities having an aggregate value of $45,030,306 as collateral for portfolio securities loaned as follows:
| Principal | | | | | | | | | |
| amount | | | Maturity | | Interest | | | | |
| (000) | | | dates | | rates | | | | Value |
|
| $11,800 | | Federal National Mortgage Association | | 09/25/07 | | 0.000% | | | | $11,756,242 |
|
| 21,004 | | US Treasury Inflation Index Bonds | | 01/15/26 | | 2.000 | | | | 20,739,805 |
|
| 100 | | US Treasury Inflation Index Notes | | 04/15/10 | | 0.875 | | | | 105,559 |
|
| 820 | | US Treasury Inflation Index Notes | | 04/15/12 | | 2.000 | | | | 835,220 |
|
| 11,205 | | US Treasury Inflation Index Notes | | 07/15/15 | | 1.875 | | | | 11,593,480 |
|
| | | | | | | | | | | $45,030,306 |
|
Bank line of credit
The Fund participates with other funds managed, advised or sub-advised by UBS Global AM in a $100 million committed credit facility with State Street Bank and Trust Company (“Committed Credit Facility”), to be utilized for temporary financing until the settlement of sales or purchases of portfolio securities, the repurchase or redemption of shares of the Fund at the request of the shareholders and other temporary or emergency purposes. Under the Committed Credit Facility arrangement, the Fund has agreed to pay commitment fees, pro rata, based on the relative asset size of the funds in the Committed Credit Facility. Interest is charged to the Fund at the overnight federal funds rate in effect at the time of borrowings, plus 0.50%. For the year ended August 31, 2007 the Fund had an outstanding borrowing of $31,419,309 for three days at an annualized rate of 5.81%, which resulted in $15,212 of interest expense.
Purchases and sales of securities
For the year ended August 31, 2007, aggregate purchases and sales of portfolio securities, excluding short-term securities and US Government securities, were $327,128,825 and $513,213,019, respectively.
For the year ended August 31, 2007, aggregate purchases and sales of US Government securities, excluding short-term securities, were $370,190,105 and $404,700,385, respectively.
Federal tax status
The Fund intends to distribute substantially all of its income and to comply with the other requirements of the Internal Revenue Code applicable to regulated investment companies. Accordingly, no provision for federal income taxes is required. In addition, by distributing during each calendar
57
UBS U.S. Allocation Fund
Notes to financial statements
year substantially all of its net investment income, net realized capital gains and certain other amounts, if any, the Fund intends not to be subject to a federal excise tax.
The tax character of distributions paid during the fiscal years ended August 31, 2007 and August 31, 2006 were as follows:
| Distributions paid from: | | | 2007 | | | 2006 | |
| |
| Ordinary income | | | $17,416,660 | | | $17,721,453 | |
| |
At August 31, 2007, the components of accumulated deficit on a tax basis were as follows:
| Undistributed ordinary income | | | $13,938,343 | |
| |
| Accumulated realized capital and other losses | | | (100,452,966 | ) |
| |
| Net unrealized appreciation of investments | | | 59,734,552 | |
| |
| Total accumulated deficit | | | $(26,780,071 | ) |
| |
The differences between book-basis and tax-basis unrealized appreciation/depreciation is attributable primarily to the tax deferral of losses on wash sales, tax treatment of credit default swaps and return of capital adjustments from real estate investment trusts.
At August 31, 2007, the Fund had a net capital loss carryforward of $100,452,966. This loss carryforward is available as a reduction, to the extent provided in the regulations, of any future net realized capital gains and will expire August 31, 2011. To the extent that such losses are used to offset future net realized capital gains, it is probable these gains will not be distributed. For the period ended August 31, 2007, the Fund utilized $67,309,715 of capital loss carryforwards to offset current year realized gains.
For federal income tax purposes, the tax cost of investments and the components of net unrealized appreciation of investments at August 31, 2007 were as follows:
| Tax cost of investments | | $ | 745,928,671 | |
| |
| Gross appreciation (investments having an excess of value over cost) | | | 78,546,953 | |
| |
| Gross depreciation (investments having an excess of cost over value) | | | (18,812,401 | ) |
| |
| Net unrealized appreciation of investments | | | $59,734,552 | |
| |
To reflect reclassifications arising from permanent “book/tax” differences for the year ending August 31, 2007, undistributed net investment income
58
UBS U.S. Allocation Fund
Notes to financial statements
was increased by $369,138, and accumulated net realized losses from investment transactions were increased by $369,138. These differences are primarily due to return of capital adjustments from real estate investments trusts, reclassification of swap income and paydown reclasses.
On July 13, 2006, FASB released FASB Interpretation No. 48 “Accounting for Uncertainty in Income Taxes” (“FIN 48”). FIN 48 provides guidance for how uncertain tax positions should be recognized, measured, presented and disclosed in the financial statements. FIN 48 requires the evaluation of tax positions taken or expected to be taken in the course of preparing a Fund’s tax return to determine whether the tax positions are “more-likely-than-not” of being sustained by the applicable tax authority. Tax positions not deemed to meet a more-likely-than-not threshold would be recorded as a tax expense in the current year. Based on the Securities and Exchange Commission’s announcement on December 22, 2006, the implementation of FIN 48 must be incorporated into accounting practices no later than the last business day that occurs in the period covered by the Fund’s February 29, 2008 semiannual report. Management continues to evaluate the application of FIN 48 to the Fund, and is not in a position at this time to estimate the significance of its impact, if any, to the Fund’s financial statements.
Shares of beneficial interest
There is an unlimited amount of $0.001 par value shares of beneficial interest authorized. Transactions in shares of beneficial interest were as follows:
| | | Class A | | | Class B | |
| | |
| |
| For the year ended August 31, 2007: | | Shares | | | | Amount | | | Shares | | | | Amount | |
| |
| Shares sold | | 336,576 | | | | $10,727,532 | | | 15,262 | | | | $475,908 | |
| |
| Shares repurchased | | (3,875,111 | ) | | | (124,115,373 | ) | | (404,788 | ) | | | (12,574,484 | ) |
| |
| Shares converted from Class B to Class A | | 1,364,379 | | | | 43,544,750 | | | (1,391,160 | ) | | | (43,544,750 | ) |
| |
| Dividends reinvested | | 310,647 | | | | 9,791,587 | | | 20,755 | | | | 644,436 | |
| |
| Net decrease | | (1,863,509 | ) | | | $(60,051,504 | ) | | (1,759,931 | ) | | | $(54,998,890 | ) |
| |
| For the year ended August 31, 2006: | | | | | | | | | | | | | | |
| |
| Shares sold | | 452,746 | | | | $13,229,529 | | | 24,074 | | | | $687,476 | |
| |
| Shares repurchased | | (5,038,838 | ) | | | (147,389,209 | ) | | (1,064,911 | ) | | | (30,347,204 | ) |
| |
| Shares converted from Class B to Class A | | 1,633,859 | | | | 47,559,412 | | | (1,675,063 | ) | | | (47,559,412 | ) |
| |
| Dividends reinvested | | 344,764 | | | | 10,039,512 | | | 30,776 | | | | 879,895 | |
| |
| Net decrease | | (2,607,469 | ) | | | $(76,560,756 | ) | | (2,685,124 | ) | | | $(76,339,245 | ) |
| |
59
UBS U.S. Allocation Fund
Notes to financial statements
| | | Class C | | | Class Y | |
| | |
| |
| For the year ended August 31, 2007: | | Shares | | | | Amount | | | Shares | | | | Amount | |
| |
| Shares sold | | 83,181 | | | | $2,587,025 | | | 97,792 | | | | $3,187,614 | |
| |
| Shares repurchased | | (1,462,509 | ) | | | (45,791,461 | ) | | (2,238,875 | ) | | | (71,674,800 | ) |
| |
| Dividends reinvested | | 101,308 | | | | 3,137,517 | | | 91,737 | | | | 2,928,243 | |
| |
| Net decrease | | (1,278,020 | ) | | | $(40,066,919 | ) | | (2,049,346 | ) | | | $(65,558,943 | ) |
| |
| For the year ended August 31, 2006: | | | | | | | | | | | | | | |
| |
| Shares sold | | 95,556 | | | | $2,726,972 | | | 112,245 | | | | $3,347,403 | |
| |
| Shares repurchased | | (2,206,226 | ) | | | (63,042,153 | ) | | (590,909 | ) | | | (17,561,650 | ) |
| |
| Dividends reinvested | | 106,455 | | | | 3,045,661 | | | 95,552 | | | | 2,816,873 | |
| |
| Net decrease | | (2,004,215 | ) | | | $(57,269,520 | ) | | (383,112 | ) | | | $(11,397,374 | ) |
| |
Subsequent event
The UBS U.S. Allocation Fund will cease offering Class B shares (with exceptions for existing shareholders for exchanges or reinvesting dividends) effective on or about October 1, 2007. New or additional investments into Class B shares, including investments through an automatic investment plan, will not be permitted after September 28, 2007. Existing shareholders of Class B shares may: (i) continue as Class B shareholders; (ii) continue to reinvest dividends and distributions into Class B shares and (iii) exchange their Class B shares for Class B shares of other series of the UBS Family of Funds, as permitted by existing exchange privileges. For Class B shares outstanding on October 1, 2007 and Class B shares acquired upon reinvestment of dividends or distributions or through exchanges after September 28, 2007, Class B share attributes, including the associated Rule 12b-1 plan service and distribution fees, contingent deferred sales charges and conversion features, as applicable, will continue.
60
UBS U.S. Allocation Fund
Report of Ernst & Young LLP, independent registered public accounting firm
The Board of Trustees and Shareholders of
UBS U.S. Allocation Fund
We have audited the accompanying statement of assets and liabilities of the UBS U.S. Allocation Fund (the sole Fund comprising UBS Investment Trust) (the “Fund”), including the portfolio of investments, as of August 31, 2007, and the related statement of operations for the year then ended, the statement of changes in net assets for each of the two years in the period then ended and the financial highlights for each of the five years in the period then ended. These financial statements and financial highlights are the responsibility of the Fund’s management. Our responsibility is to express an opinion on these financial statements and financial highlights based on our audits.
We conducted our audits in accordance with the standards of the Public Company Accounting Oversight Board (United States). Those standards require that we plan and perform the audit to obtain reasonable assurance about whether the financial statements and financial highlights are free of material misstatement. We were not engaged to perform an audit of the Fund’s internal control over financial reporting. Our audits included consideration of internal control over financial reporting as a basis for designing audit procedures that are appropriate in the circumstances, but not for the purpose of expressing an opinion on the effectiveness of the Fund’s internal control over financial reporting. Accordingly, we express no such opinion. An audit also includes examining, on a test basis, evidence supporting the amounts and disclosures in the financial statements and financial highlights, assessing the accounting principles used and significant estimates made by management and evaluating the overall financial statement presentation. Our procedures included confirmation of securities owned as of August 31, 2007, by correspondence with the custodian and brokers. We believe that our audits provide a reasonable basis for our opinion.
In our opinion, the financial statements and financial highlights referred to above present fairly, in all material respects, the financial position of UBS U.S. Allocation Fund at August 31, 2007, the results of its operations for the year then ended, the changes in its net assets for each of the two years in the period then ended, and the financial highlights for each of the five years in the period then ended, in conformity with U.S. generally accepted accounting principles.

New York, New York
October 29, 2007
61
UBS U.S. Allocation Fund
General information (unaudited)
Tax information
We are required by Subchapter M of the Internal Revenue Code of 1986, as amended, to advise you within 60 days of the Fund’s fiscal year end (August 31, 2007) as to the federal tax status of distributions received by shareholders during such fiscal year. The percentage of dividends paid that qualify for the 70% dividends received deduction for corporate shareholders is 59.78%.
For the fiscal year ended August 31, 2007, certain dividends paid by UBS U.S. Allocation Fund may be subject to a maximum tax rate of 15%, as provided for by the Jobs and Growth Tax Relief Reconciliation Act of 2003. Of the distributions paid during the fiscal year, $17,416,660 represents the maximum amount that may be considered qualified dividend income.
Dividends received by tax-exempt recipients (e.g., IRAs and Keoghs) need not be reported as taxable income. Some retirement trusts (e.g., corporate, Keogh and 403(b)(7) plans) may need this information for their annual information reporting.
Since the Fund’s fiscal year is not the calendar year, another notification will be sent in respect of calendar year 2007. The second notification, which will reflect the amount to be used by calendar year taxpayers on their federal income tax returns, will be made in conjunction with Form 1099 DIV and will be mailed in January 2008. Shareholders are advised to consult their own tax advisers with respect to the tax consequences of their investment in the Fund.
Quarterly Form N-Q portfolio schedule
The Fund will file its complete schedule of portfolio holdings with the Securities and Exchange Commission (“SEC”) for the first and third quarters of each fiscal year on Form N-Q. The Fund’s Forms N-Q are available on the SEC’s Web site at http://www.sec.gov. The Fund’s Forms N-Q may be reviewed and copied at the SEC’s Public Reference Room in Washington, D.C. Information on the operation of the SEC’s Public Reference Room may be obtained by calling 1-800-SEC 0330. Additionally, you may obtain copies of Forms N-Q from the Fund upon request by calling 1-800-647 1568.
Proxy voting policies, procedures and record
You may obtain a description of the Fund’s (1) proxy voting policies, (2) proxy voting procedures and (3) information regarding how the Fund voted any
62
UBS U.S. Allocation Fund
General information (unaudited)
proxies related to portfolio securities during the most recent 12-month period ended June 30 for which an SEC filing has been made, without charge, upon request by contacting the Fund directly at 1-800-647 1568, online on the Fund’s Web site www.ubs.com/ubsglobalam-proxy, or on the EDGAR Database on the SEC’s Web site (http://www.sec.gov).
63
UBS U.S. Allocation Fund
Board approval of investment advisory and administration agreement (unaudited)
Background—At a meeting of the board of UBS Investment Trust (the “Trust”) on July 18, 2007, the members of the board, including the trustees who are not “interested persons” of the Trust (“Independent Trustees”), as defined in the Investment Company Act of 1940, as amended (the “1940 Act”), considered and approved the continuance of the Investment Advisory and Administration Agreement of the Trust with respect to its series, UBS U.S. Allocation Fund (the “Fund”), with UBS Global Asset Management (Americas) Inc. (“UBS Global AM”). In preparing for the meeting, the board members had requested and received extensive information from UBS Global AM to assist them, including performance and expense information for other investment companies with similar investment objectives. The board received and considered a variety of information about UBS Global AM, as well as the advisory, administrative and distribution arrangements for the Fund. In addition, one of the Independent Trustees and legal counsel to the Independent Trustees met several times with management and representatives of PricewaterhouseCoopers LLP (“PwC”) to discuss management’s proposed profitability methodology and made suggestions for changes to the methodology. As a result of management’s focus on the profitability methodology and this series of meetings, the Independent Trustees received extensive information on UBS Global AM’s profitability, a report from management on the methodology used and a report from PwC on industry practices with respect to profitability methodology. The board received materials detailing the administrative services provided to the Fund by UBS Global AM, which include providing accounting and financial analysis, ensuring that all financial and tax regulatory reporting requirements were met, certifying required Securities and Exchange Commission documentation and monitoring the performance of the Fund’s service providers.
The Independent Trustees also met for several hours the evening before the board meeting to discuss matters related to the Fund and other funds subject to their oversight and met again after management’s presentation was completed to review the disclosure that had been made to them at the meeting. At all of these sessions the Independent Trustees met in session with their independent legal counsel. The Independent Trustees also received a memorandum from their independent legal counsel discussing the duties of board members in considering approval of advisory and administration agreements.
64
UBS U.S. Allocation Fund
Board approval of investment advisory and administration agreement (unaudited)
In its consideration of the approval of the Investment Advisory and Administration Agreement, the board considered the following factors:
Nature, extent and quality of the services under the investment advisory and administration agreement—The board received and considered information regarding the nature, extent and quality of advisory services provided to the Fund by UBS Global AM under the Investment Advisory and Administration Agreement during the past year. The board considered the nature, extent and quality of administrative and shareholder services performed by UBS Global AM and its affiliates. The board also considered the resources devoted to, and the record of compliance with, the Fund’s compliance policies and procedures. The board noted that it received information at regular meetings throughout the year regarding the services rendered by UBS Global AM concerning the management of the Fund’s affairs and UBS Global AM’s role in coordinating providers of other services to the Fund, including custody, accounting and transfer agency services. The board’s evaluation of the services provided by UBS Global AM took into account the board’s knowledge and familiarity gained as board members of funds in the UBS New York fund complex, including the scope and quality of UBS Global AM’s investment advisory and other capabilities and the quality of its administrative and other services. The board observed that the scope of services provided by UBS Global AM had expanded over time as a result of regulatory and other developments, including maintaining and monitoring its own and the Fund’s expanded compliance programs.
The board had available to it the qualifications, backgrounds and responsibilities of the Fund’s senior personnel at UBS Global AM and had received information regarding the person primarily responsible for the day-to-day portfolio management of the Fund and recognized that the Fund’s senior personnel at UBS Global AM report to the board regularly, some at every board meeting, and that at each regular meeting the board receives a report on the Fund’s performance. The board also considered, based on its knowledge of UBS Global AM and its affiliates, the financial resources available to UBS Global AM and its parent organization, UBS AG. In that regard, the board received extensive financial information regarding UBS Global AM and noted that it was a wholly owned, indirect subsidiary of one of the largest financial services firms in the world. It was also noted that UBS Global AM had well over $100 billion in assets under
65
UBS U.S. Allocation Fund
Board approval of investment advisory and administration agreement (unaudited)
management and was part of the UBS Global Asset Management Division, which had over $700 billion of assets under management worldwide.
The board reviewed how transactions in Fund assets are effected. The board also reviewed the Fund’s brokerage policies and practices, the standards applied in seeking best execution, policies and practices regarding soft dollars, the use of a broker affiliated with UBS Global AM and the existence of quality controls applicable to brokerage allocation procedures. In addition, UBS Global AM also reported to the board on, among other things, its disaster recovery plans and portfolio manager compensation plan.
The board concluded that, overall, it was satisfied with the nature, extent and quality of services provided (and expected to be provided) to the Fund under the Investment Advisory and Administration Agreement.
Advisory fees and expense ratios—The board reviewed and considered the contractual management fee (“Contractual Management Fee”) payable by the Fund to UBS Global AM in light of the nature, extent and quality of the advisory and administrative services provided by UBS Global AM. The board also reviewed and considered the fee waiver arrangement in place for the Fund and considered the actual fee rate (after taking any waivers into account) (the “Actual Management Fee”). Additionally, the board received and considered information comparing the Fund’s Contractual Management Fee, Actual Management Fee and overall expenses with those of funds in a group of funds selected and provided by Lipper, Inc. (“Lipper”), an independent provider of investment company data (the “Expense Group”).
In connection with its consideration of the Fund’s advisory fees, the board also received information on UBS Global AM’s standard institutional account fees for accounts of a similar investment type to the Fund. The board noted that, in general, these fees were lower than the Contractual Management Fee and Actual Management Fee for the Fund, but also noted management’s explanation that comparisons with such accounts may be of limited relevance given the different structures and regulatory requirements of mutual funds versus such accounts and the differences in the levels of services required by mutual funds and such accounts. The board also received information on fees charged to other mutual funds managed by UBS Global AM.
66
UBS U.S. Allocation Fund
Board approval of investment advisory and administration agreement (unaudited)
In addition to the Contractual and Actual Management Fees, the board also reviewed and considered the total expenses for the Fund. The comparative Lipper information showed that the Fund’s Contractual Management Fee, Actual Management Fee and total expenses were in the first quintile in the Fund’s Expense Group for the comparison periods utilized in the Lipper report (with the first quintile representing that fifth of the funds in the Expense group with the lowest level of fees or expenses, as applicable, and the fifth quintile representing that fifth of the funds in the Expense Group with the highest level of fees or expenses, as applicable).
Taking all of the above into consideration, the board determined that the management fee was reasonable in light of the nature, extent and quality of the services provided to the Fund under the Investment Advisory and Administration Agreement.
Fund performance—The board received and considered (a) annualized total return information of the Fund compared to other funds (the “Performance Universe”) selected by Lipper over the one-, three-, five-, ten-year and since inception periods ended April 30, 2007 and (b) annualized performance information for each year in the ten-year period ended April 30, 2007. The board was provided with a description of the methodology Lipper used to determine the similarity of the Fund with the funds included in its Performance Universe. The board also noted that it had received information throughout the year at periodic intervals with respect to the Fund’s performance, including with respect to its benchmark index.
The comparative Lipper information showed that the Fund’s performance was in the first quintile for the one-year period, the third quintile for the three- and ten year periods, the fourth quintile for the five-year period, and the second quintile since inception (with the first quintile representing that fifth of the funds in the Performance Universe with the highest performance and the fifth quintile representing that fifth of the funds in the Performance Universe with the lowest performance). In its review the board particularly concentrated on the Fund’s performance for the one- and three-year periods as compared to the average return for the Fund’s Performance Universe and benchmark index, taking the volatility in returns for the Performance Universe and the index into account. Management explained that the below average five-year return was due almost entirely to the legacy Tactical Allocation investment model, and reminded the
67
UBS U.S. Allocation Fund
Board approval of investment advisory and administration agreement (unaudited)
board that the Fund had discontinued using that model and had changed its investment strategies in 2004. Based on its review, and management’s explanations, the board concluded that the Fund’s investment performance was satisfactory.
Adviser profitability—The board received and considered a profitability analysis of UBS Global AM and its affiliates in providing services to the Fund. The board also received profitability information with respect to the UBS New York fund complex as a whole. In addition, the board received information with respect to UBS Global AM’s allocation methodologies used in preparing this profitability data, as noted above. UBS Global AM’s profitability was considered not excessive in light of the nature, extent and quality of the services provided to the Fund.
Economies of scale—The board received and considered information from management regarding whether UBS Global AM has achieved economies of scale with respect to the management of the Fund, whether the Fund has appropriately benefited from any economies of scale, and whether there is potential for realization of further economies of scale for the Fund. The board considered whether economies of scale in the provision of services to the Fund were being passed along to shareholders. The board also considered whether alternative fee structures (such as breakpoints) would be more appropriate or reasonable taking into consideration economies of scale or other efficiencies.
Although the board noted that the Fund’s Contractual Management Fee did not contain breakpoints, it recognized that the Trust had entered into an agreement with UBS Global AM, whereby UBS Global AM agreed to permanently reduce its Contractual Management Fee by utilizing breakpoints based on the Fund’s average daily net assets, thereby achieving the same effect as if the Contractual Management Fee contained breakpoints. The board also noted that as the Fund’s assets have increased over time, it has realized other economies of scale as certain expenses, such as fees for Trustees, auditors and legal fees, become a smaller percentage of overall assets.
Generally, in light of UBS Global AM’s profitability data and the Contractual Management Fee and Actual Management Fee currently in place, the board believed that UBS Global AM’s sharing of current economies of scale with the Fund was acceptable.
68
UBS U.S. Allocation Fund
Board approval of investment advisory and administration agreement (unaudited)
Other benefits to UBS Global AM—The board considered other benefits received by UBS Global AM and its affiliates as a result of its relationship with the Fund, including the opportunity to offer additional products and services to Fund shareholders.
In light of the costs of providing investment advisory, administrative and other services to the Fund and UBS Global AM’s ongoing commitment to the Fund, the profits and other ancillary benefits that UBS Global AM and its affiliates received were considered reasonable.
In light of all of the foregoing, the board approved the Investment Advisory and Administration Agreement to continue for another year.
In making its decision, the board identified no single factor as being determinative in approving the Investment Advisory and Administration Agreement. The Independent Trustees were advised by separate independent legal counsel throughout the entire process. The board discussed the proposed continuance of the Investment Advisory and Administration Agreement in a private session with their independent legal counsel at which no representatives of UBS Global AM were present.
69
UBS U.S. Allocation Fund
Supplemental information (unaudited)
Board of Trustees & Officers
The Fund is governed by a Board of Trustees which oversees the Fund’s operations. Each trustee serves an indefinite term of office. Officers are appointed by the trustees and serve at the pleasure of the Board. The table below shows, for each trustee and officer, his or her name, address and age, the position held with the Trust, the length of time served as a trustee and officer of the Fund, the trustee’s or officer’s principal occupations during the last five years, the number of portfolios in the UBS fund complex overseen by the trustee or for which a person served as an officer, and other directorships held by the trustee.
The Fund’s Statement of Additional Information contains additional information about the trustees and is available, without charge, upon request by calling 1-800-647 1568.
Interested Trustee
| Name, address, and age | | Position(s)
held with
Trust | | Term of
office† and
length of
time served | | Principal occupation(s)
during past 5 years |
|
Meyer Feldberg;†† 65
Morgan Stanley
1585 Broadway
33rd Floor
New York, NY 10036 | | Trustee | | Since 1996 | | Professor Feldberg is Dean Emeritus and Sanford Bernstein Professor of Leadership and Ethics at Columbia Business School, although on a two year leave of absence. He is also a senior advisor to Morgan Stanley (financial services) (since March 2005). Professor Feldberg also serves as president of New York City Global Partners (an organization located in part of the Office of the Mayor of New York that promotes interaction with other cities around the world) (since May 2007). Prior to July 2004, he was Dean and Professor of Management of the Graduate School of Business at Columbia University (since 1989). |
70
UBS U.S. Allocation Fund
Supplemental information (unaudited)
Number of portfolios in fund complex
overseen by trustee | | Other directorships held by trustee |
|
| Professor Feldberg is a director or trustee of 30 investment companies (consisting of 59 portfolios) for which UBS Global AM or one of its affiliates serves as investment advisor, sub-advisor or manager. | | Professor Feldberg is also a director of Primedia Inc. (publishing), Macy’s Inc. (operator of department stores), Revlon, Inc. (cosmetics) and SAPPI, Ltd. (producer of paper). |
71
UBS U.S. Allocation Fund
Supplemental information (unaudited)
| Independent Trustees | | | | | | |
| Name, address, and age | | Position(s)
held with
Trust | | Term of
office† and
length of
time served | | Principal occupation(s)
during past 5 years |
|
Richard Q. Armstrong; 72
c/o Willkie Farr &
Gallagher LLP
787 Seventh Avenue
New York, NY 10019-6099 | | Trustee and
Chairman
of the
Board of
Trustees | | Since 1995
(Trustee)
Since 2004
(Chairman of
the Board
of Trustees) | | Mr. Armstrong is chairman and principal of R.Q.A. Enterprises (management consulting firm) (since April 1991 and principal occupation since March 1995). |
| | | | | | | |
Richard R. Burt; 60
Kissinger McLarty Associates
900 17th Street
8th Floor
Washington, DC 20006 | | Trustee | | Since 1996 | | Mr. Burt is a senior associate to Kissinger Mc Larty Associates (a consulting firm) and chairman of IEP Advisors (international investments and consulting firm). Prior to April 2007, he was chairman of Diligence Inc. (information and risk management firm.) |
| | | | | | | |
Alan S. Bernikow; 66
207 Benedict Ave.
Staten Island, NY 10314 | | Trustee | | Since 2005 | | Mr. Bernikow is retired. He was a consultant on non-management matters for the firm of Deloitte & Touche (international accounting and consulting firm) (since June 2003 until 2007). Previously, he was Deputy Chief Executive Officer at Deloitte & Touche. |
| | | | | | | |
Bernard H. Garil; 67
6754 Casa Grande Way
Delray Beach, FL 33446 | | Trustee | | Since 2005 | | Mr. Garil is retired (since 2001). He was a Managing Director at PIMCO Advisory Services (from 1999 to 2001) where he served as president of closed-end funds and vice-president of the variable insurance product funds advised by OpCap Advisors (until 2001). |
72
UBS U.S. Allocation Fund
Supplemental information (unaudited)
Number of portfolios in fund complex
overseen by trustee | | Other directorships held by trustee |
|
| Mr. Armstrong is a director or trustee of 17 investment companies (consisting of 46 portfolios) for which UBS Global AM or one of its affiliates serves as investment advisor, sub-advisor or manager. | | None |
| | | |
| Mr. Burt is a director or trustee of 17 investment companies (consisting of 46 portfolios) for which UBS Global AM or one of its affiliates serves as investment advisor, sub-advisor or manager. | | Mr. Burt is also a director of The Central European Fund, Inc., The Germany Fund, Inc., The New Germany Fund, Inc., IGT, Inc. (provides technology to gaming and wagering industry) and The Protective Group, Inc. (produces armor products). |
| | | |
| Mr. Bernikow is a director or trustee of 17 investment companies (consisting of 46 portfolios) for which UBS Global AM or one of its affiliates serves as investment advisor, sub-advisor or manager. | | Mr. Bernikow is also a director of Revlon, Inc. (cosmetics) (and serves as the chair of its audit committee and as a member of its nominating and corporate governance committee), a director of Mack-Cali Realty Corporation (real estate investment trust) (and serves as the chair of its audit committee) and a director of the Casual Male Retail Group, Inc. (menswear) (and serves as a member of its audit committee and as a member of its nominating and corporate governance committee). |
| | | |
| Mr. Garil is a director or trustee of 17 investment companies (consisting of 46 portfolios) for which UBS Global AM or one of its affiliates serves as investment advisor, sub-advisor or manager. | | Mr. Garil is also a director of OFI Trust Company (commercial trust company) and a trustee for the Brooklyn College Foundation, Inc. (charitable foundation). |
73
UBS U.S. Allocation Fund
Supplemental information (unaudited)
| Independent Trustees (concluded) | | | | |
| Name, address, and age | | Position(s)
held with
Trust | | Term of
office† and
length of
time served | | Principal occupation(s)
during past 5 years |
|
Heather R. Higgins; 48
255 E. 49th St., Suite 23D
New York, NY 10017 | | Trustee | | Since 2005 | | Ms. Higgins is the President and Director of The Randolph Foundation (charitable foundation) (since 1991). Ms. Higgins also serves on the boards of several non-profit charitable groups, including the Independent Women’s Forum (chairman), and the Philanthropy Roundtable (vice chairman). She had also served on the board of the Hoover Institution (executive committee) (2001-2007). |
74
UBS U.S. Allocation Fund
Supplemental information (unaudited)
Number of portfolios in fund complex
overseen by trustee | | Other directorships held by trustee |
|
| Ms. Higgins is a director or trustee of 17 investment companies (consisting of 46 portfolios) for which UBS Global AM or one of its affiliates serves as investment advisor, sub-advisor or manager. | | None |
75
UBS U.S. Allocation Fund
Supplemental information (unaudited)
| Officers | | | | | | |
Name, address,
and age | | Position(s)
held with
the Fund | | Term of
office† and
length of
time served | | Principal occupation(s) during
past 5 years; number of portfolios
in fund complex for which person
serves as officer |
|
| Joseph Allessie*; 42 | | Vice President
and Assistant
Secretary | | Since 2005 | | Mr. Allessie is an executive director (since 2007) and deputy general counsel (since 2005) at UBS Global Asset Management (US) Inc. and UBS Global AM (collectively, “UBS Global AM—Americas region”). Prior to joining UBS Global AM—Americas region, he was senior vice president and general counsel of Kenmar Advisory Corp. (from 2004 to 2005). Prior to that Mr. Allessie was general counsel and secretary of GAM USA Inc., GAM Investments, GAM Services, GAM Funds, Inc. and the GAM Avalon Funds (from 1999 to 2004). Mr. Allessie is a vice president and assistant secretary of 21 investment companies (consisting of 104 portfolios) for which UBS Global AM—Americas region or one of its affiliates serves as investment advisor, sub-advisor or manager. |
| | | | | | | |
| Thomas Disbrow*; 41 | | Vice President
and Treasurer | | Since 2000
(Vice
President);
Since 2004
(Treasurer) | | Mr. Disbrow is an executive director (since 2007), (prior to which he was a director) (since 2001) and head of the US mutual fund treasury administration department (since September 2006) of UBS Global AM—Americas region. Mr. Disbrow is a vice president and treasurer and/or principal accounting officer of 21 investment companies (consisting of 104 portfolios) for which UBS Global AM—Americas region or one of its affiliates serves as investment advisor, sub-advisor or manager. |
76
UBS U.S. Allocation Fund
Supplemental information (unaudited)
| Officers (continued) | | | | | | |
Name, address,
and age | | Position(s)
held with
the Fund | | Term of
office† and
length of
time served | | Principal occupation(s) during
past 5 years; number of portfolios
in fund complex for which person
serves as officer |
|
| Michael J. Flook*; 42 | | Vice President
and Assistant
Treasurer | | Since 2006 | | Mr. Flook is an associate director and a senior manager of the US mutual fund treasury administration department of UBS Global AM—Americas region (since 2006). Prior to joining UBS Global AM—Americas region, he was a senior manager with The Reserve (asset management firm) from May 2005 to May 2006. Prior to that he was a senior manager with PFPC Worldwide since October 2000. Mr. Flook is a vice president and assistant treasurer of 21 investment companies (consisting of 104 portfolios) for which UBS Global AM—Americas region or one of its affiliates serves as investment advisor, sub-advisor or manager. |
| | | | | | | |
| Mark F. Kemper**; 49 | | Vice President
and Secretary | | Since 2004 | | Mr. Kemper is general counsel of UBS Global AM—Americas region (since 2004). Mr. Kemper also is a managing director of UBS Global AM—Americas region (since 2006). He was deputy general counsel of UBS Global Asset Management (Americas) Inc. (“UBS Global AM—Americas”) from July 2001 to July 2004. He has been secretary of UBS Global AM—Americas since 1999 and assistant secretary of UBS Global Asset Management Trust Company since 1993. Mr. Kemper is secretary of UBS Global AM—Americas region (since 2004). Mr. Kemper is vice president and secretary of 21 investment companies (consisting of 104 portfolios) for which UBS Global AM—Americas region or one of its affiliates serves as investment advisor, sub-advisor or manager. |
77
UBS U.S. Allocation Fund
Supplemental information (unaudited)
| Officers (continued) | | | | | | |
Name, address,
and age | | Position(s)
held with
the Fund | | Term of
office† and
length of
time served | | Principal occupation(s) during
past 5 years; number of portfolios
in fund complex for which person
serves as officer |
|
| Joanne M. Kilkeary*; 39 | | Vice President
and Assistant
Treasurer | | Since 2004 | | Ms. Kilkeary is an associate director (since 2000) and a senior manager (since 2004) of the US mutual fund treasury administration department of UBS Global AM—Americas region. Ms. Kilkeary is a vice president and assistant treasurer of 21 investment companies (consisting of 104 portfolios) for which UBS Global AM—Americas region or one of its affiliates serves as investment advisor, sub-advisor or manager. |
| | | | | | | |
| Tammie Lee*; 36 | | Vice President
and Assistant
Secretary | | Since 2005 | | Ms. Lee is a director and associate general counsel of UBS Global AM—Americas region (since 2005). Prior to joining UBS Global AM-Americas region, she was vice president and counsel at Deutsche Asset Management/Scudder Investments from 2003 to 2005. Prior to that she was assistant vice president and counsel at Deutsche Asset Management/Scudder Investments from 2000 to 2003. Ms. Lee is a vice president and assistant secretary of 21 investment companies (consisting of 104 portfolios) for which UBS Global AM—Americas region or one of its affiliates serves as investment advisor, sub-advisor or manager. |
78
UBS U.S. Allocation Fund
Supplemental information (unaudited)
| Officers (continued) | | | | | | |
Name, address,
and age | | Position(s)
held with
the Fund | | Term of
office† and
length of
time served | | Principal occupation(s) during
past 5 years; number of portfolios
in fund complex for which person
serves as officer |
|
| Joseph McGill*; 45 | | Vice President
and Chief
Compliance
Officer | | Since 2004 | | Mr. McGill is a managing director (since 2006) and chief compliance officer (since 2003) at UBS Global AM—Americas region. Prior to joining UBS Global AM—Americas region, he was assistant general counsel at J.P. Morgan Investment Management (from 1999 to 2003). Mr. McGill is a vice president and chief compliance officer of 21 investment companies (consisting of 104 portfolios) for which UBS Global AM—Americas region or one of its affiliates serves as investment advisor, sub-advisor or manager. |
| | | | | | | |
| Eric Sanders*; 42 | | Vice President
and Assistant
Secretary | | Since 2005 | | Mr. Sanders is a director and associate general counsel of UBS Global AM—Americas region (since 2005). From 1996 until June 2005, he held various positions at Fred Alger & Company, Incorporated, the most recent being assistant vice president and associate general counsel. Mr. Sanders is a vice president and assistant secretary of 21 investment companies (consisting of 104 portfolios) for which UBS Global AM—Americas region or one of its affiliates serves as investment advisor, sub-advisor or manager. |
79
UBS U.S. Allocation Fund
Supplemental information (unaudited)
| Officers (continued) | | | | | | |
Name, address,
and age | | Position(s)
held with
the Fund | | Term of
office† and
length of
time served | | Principal occupation(s) during
past 5 years; number of portfolios
in fund complex for which person
serves as officer |
|
| Andrew Shoup*; 51 | | Vice President
and Chief
Operating
Officer | | Since 2006 | | Mr. Shoup is a managing director and senior member of the global treasury administration department of UBS Global AM—Americas region (since July 2006). Prior to joining UBS Global AM—Americas region, he was chief administrative officer for the Legg Mason Partner Funds (formerly Smith Barney, Salomon Brothers, and CitiFunds mutual funds) from November 2003 to July 2006. Prior to that, he held various positions with Citigroup Asset Management and related companies with their domestic and offshore mutual funds since 1993. Additionally, he has worked for another mutual fund complex as well as spending eleven years in public accounting. Mr. Shoup is a vice president and chief operating officer of 21 investment companies (consisting of 104 portfolios) for which UBS Global AM—Americas region or one of its affiliates serves as investment advisor, sub-advisor or manager. |
| | | | | | | |
| Brian D. Singer**; 47 | | Vice President | | Since 2004 | | Mr. Singer is chief investment officer—UBS Global AM—Americas region (since 2003). Prior to 2003, he was global head of asset allocation and risk management at UBS Global AM—Americas region. Mr. Singer is a vice president of two investment companies (consisting of two portfolios) for which UBS Global AM—Americas region or one of its affiliates serves as investment advisor, sub-advisor or manager. |
80
UBS U.S. Allocation Fund
Supplemental information (unaudited)
| Officers (continued) | | | | | | |
Name, address,
and age | | Position(s)
held with
the Fund | | Term of
office† and
length of
time served | | Principal occupation(s) during
past 5 years; number of portfolios
in fund complex for which person
serves as officer |
|
| Kai R. Sotorp**; 48 | | President | | Since 2006 | | Mr. Sotorp is the head of the Americas for UBS Global Asset Management (since 2004); a member of the UBS Group Managing Board (since 2003) and a member of the UBS Global Asset Management Executive Committee (since 2001). Prior to his current role, Mr. Sotorp was head of UBS Global Asset Management—Asia Pacific (2002-2004), covering Australia, Japan, Hong Kong, Singapore and Taiwan; head of UBS Global Asset Management (Japan) Ltd. (2001-2004); representative director and president of UBS Global Asset Management (Japan) Ltd. (2000-2004) and member of the board of Mitsubishi Corp.—UBS Realty Inc. (2000-2004) Mr. Sotorp is president of 21 investment companies (consisting of 104 portfolios) for which UBS Global Asset Management—Americas region or one of its affiliates serves as investment advisor, sub-advisor or manager. |
81
UBS U.S. Allocation Fund
Supplemental information (unaudited)
| Officers (concluded) | | | | | | |
Name, address,
and age | | Position(s)
held with
the Fund | | Term of
office† and
length of
time served | | Principal occupation(s) during
past 5 years; number of portfolios
in fund complex for which person
serves as officer |
|
| Keith A. Weller*; 46 | | Vice President and Assistant Secretary | | Since 1996 | | Mr. Weller is an executive director and senior associate general counsel of UBS Global AM—Americas region (since 2005) and has been an attorney with affiliated entities since 1995. Mr. Weller is a vice president and assistant secretary of 21 investment companies (consisting of 104 portfolios) for which UBS Global AM—Americas region or one of its affiliates serves as investment advisor, sub-advisor or manager. |
| * | | This person’s business address is 51 West 52nd Street, New York, New York 10019-6114. |
| | | |
| ** | | This person’s business address is One North Wacker Drive, Chicago, Illinois 60606. |
| | | |
| † | | Each trustee holds office for an indefinite term. Each trustee who has attained the age of seventy-two (72) years will be subject to retirement on the last day of the month in which he or she attains such age. Officers of the Fund are appointed by the trustees and serve at the pleasure of the Board. |
| | | |
| †† | | Professor Feldberg is deemed an “interested person” of the Fund as defined in the Investment Company Act because he is a senior advisor to Morgan Stanley, a financial services firm with which the Fund may conduct transactions. |
82
(This page has been left blank intentionally)
83
(This page has been left blank intentionally)
84
(This page has been left blank intentionally)
85
(This page has been left blank intentionally)
86
(This page has been left blank intentionally)
87
(This page has been left blank intentionally)
88
| Trustees | | |
| Richard Q. Armstrong | | Meyer Feldberg |
| Chairman | | |
| | | Bernard H. Garil |
| Alan S. Bernikow | | |
| | | Heather R. Higgins |
| Richard R. Burt | | |
| | | |
| Principal Officers | | |
| Kai R. Sotorp | | Thomas Disbrow |
| President | | Vice President and Treasurer |
| | | |
| Mark F. Kemper | | Brian D. Singer |
| Vice President and Secretary | | Vice President |
| | | |
Investment Advisor and Administrator
| | |
UBS Global Asset Management (Americas) Inc.
51 West 52nd Street
New York, New York 10019-6114 | | |
| | | |
| Principal Underwriter | | |
UBS Global Asset Management (US) Inc.
51 West 52nd Street
New York, New York 10019-6114 | | |
This report is not to be used in connection with the offering of shares of the Fund unless accompanied or preceded by an effective prospectus.
© 2007 UBS Global Asset Management (Americas) Inc. All rights reserved.
PRESORTED
STANDARD
U.S. POSTAGE
PAID
COMPUTERSHARE |
UBS Global Asset Management (Americas) Inc.
51 West 52nd Street
New York, New York 10019-6114
Item 2. Code of Ethics.
The registrant has adopted a code of ethics that applies to its principal executive officer, principal financial officer, principal accounting officer or controller, or persons performing similar functions pursuant to Section 406 of the Sarbanes-Oxley Act of 2002. (The registrant has designated the code of ethics adopted pursuant to Sarbanes-Oxley as a “Code of Conduct” to lessen the risk of confusion with its separate code of ethics adopted pursuant to Rule 17j-1 under the Investment Company Act of 1940, as amended.)
Item 3. Audit Committee Financial Expert.
The registrant’s Board has determined that the following person serving on the registrant’s Audit committee is an “audit committee financial expert” as defined in item 3 of Form N-CSR: Alan S. Bernikow. Mr. Bernikow is independent as defined in item 3 of Form N-CSR.
Item 4. Principal Accountant Fees and Services.
| (a) | | Audit Fees: |
| | | For the fiscal years ended August 31, 2007 and August 31, 2006, the aggregate Ernst & Young LLP (E&Y) audit fees for professional services rendered to the registrant were approximately $57,000 and $56,400, respectively. |
| | | |
| | | Fees included in the audit fees category are those associated with the annual audits of financial statements and services that are normally provided in connection with statutory and regulatory filings. |
| | | |
| (b) | | Audit-Related Fees: |
| | | In each of the fiscal years ended August 31, 2007 and August 31, 2006, the aggregate audit-related fees billed by E&Y for services rendered to the registrant that are reasonably related to the performance of the audits of the financial statements, but not reported as audit fees, were approximately $3,700 and $3,773, respectively. |
| | | |
| | | Fees included in the audit-related category are those associated with (1) the reading and providing of comments on the 2007 and 2006 semiannual financial statements and (2) review of the consolidated 2006 and 2005 reports on the profitability of the UBS Funds to UBS Global Asset Management (US) Inc. and its affiliates to assist the board members in their annual advisory/administration contract and service/distribution plan reviews. |
| | | |
| | | There were no audit-related fees required to be approved pursuant to paragraph (c)(7)(ii) of Rule 2-01 of Regulation S-X during the fiscal years indicated above. |
| | | |
| (c) | | Tax Fees: |
| | | In each of the fiscal years ended August 31, 2007 and August 31, 2006, the aggregate tax fees billed by E&Y for professional services rendered to the registrant were approximately $14,200 and $5,300, respectively, which includes amounts related to tax services prior to May 6, 2003 that would have been subject to pre-approval if the SEC rules relating to the pre-approval of non-audit services had been in effect at that time. |
| | | Fees included in the tax fees category comprise all services performed by professional staff in the independent accountant’s tax division except those services related to the audits. This category comprises fees for review of tax compliance, tax return preparation and excise tax calculations. |
| | | |
| | | There were no tax fees required to be approved pursuant to paragraph (c)(7)(ii) of Rule 2-01 of Regulation S-X during the fiscal years indicated above. |
| | | |
| (d) | | All Other Fees: |
| | | In each of the fiscal years ended August 31, 2007 and August 31, 2006, there were no fees billed by E&Y for products and services, other than the services reported in Item 4(a)-(c) above, rendered to the registrant. |
| | | |
| | | Fees included in the all other fees category would consist of services related to internal control reviews, strategy and other consulting, financial information systems design and implementation, consulting on other information systems, and other tax services unrelated to the registrant. |
| | | |
| | | There were no “all other fees” required to be approved pursuant to paragraph (c)(7)(ii) of Rule 2-01 of Regulation S-X during the fiscal years indicated above. |
| | | |
| (e) | | (1) | Audit Committee Pre-Approval Policies and Procedures: |
| | | | The registrant’s Audit Committee (“audit committee”) has adopted an “Audit Committee Charter (Amended and Restated as of May 12, 2004 – with revisions through May 2007)” (the “charter”). The charter contains the audit committee’s pre-approval policies and procedures. Reproduced below is an excerpt from the charter regarding pre-approval policies and procedures: |
| | | | The [audit] Committee shall: |
| | | | | |
| | | | ... |
| | | | | |
| | | | 2. | Pre-approve (a) all audit and permissible non-audit services1 to be provided to the Fund and (b) all permissible non-audit services to be provided by the Fund’s independent auditors to UBS Global [Asset Management (Americas) Inc. (“UBS Global AM”)] and any Covered Service Providers, if the engagement relates directly to the operations and financial reporting of the Fund. In carrying out this responsibility, the Committee shall seek periodically from UBS Global [AM] and from the independent auditors a list of such audit and permissible non-audit services that can be expected to be rendered to the Fund, UBS Global [AM] or any Covered Service Providers by the Fund’s independent auditors, and an estimate of the fees sought to be paid in connection with such services. The Committee may delegate its responsibility to pre-approve any such audit and permissible non-audit services to a sub-committee consisting o f the Chairperson of the Committee |
| | | | | and two other members of the Committee as the Chairperson, from time to time, may determine and appoint, and such sub-committee shall report to the Committee, at its next regularly scheduled meeting after the sub-committee’s meeting, its decision(s). From year to year, the Committee shall report to the Board whether this system of pre-approval has been effective and efficient or whether this Charter should be amended to allow for pre-approval pursuant to such policies and procedures as the Committee shall approve, including the delegation of some or all of the Committee’s pre-approval responsibilities to other persons (other than UBS Global [AM] or the Fund’s officers). |
| | | |
|
| | | | | 1 The Committee will not approve non-audit services that the Committee believes may taint the independence of the auditors. Currently, permissible non-audit services include any professional services (including tax services) that are not prohibited services as described below, provided to the Fund by the independent auditors, other than those provided to the Fund in connection with an audit or a review of the financial statements of the Fund. Permissible non-audit services may not include: (i) bookkeeping or other services related to the accounting records or financial statements of the Fund; (ii) financial information systems design and implementation; (iii) appraisal or valuation services, fairness opinions or contribution-in-kind reports; (iv) actuarial services; (v) internal audit outsourcing services; (vi) management functions or human resources; (vii) broker or dealer, investment adviser or investment banking services; (viii) legal services and expert services unrelated to the audit; and (ix) any other service the Public Company Accounting Oversight Board determines, by regulation, is impermissible. |
| |
| | | | | Pre-approval by the Committee of any permissible non-audit services is not required so long as: (i) the aggregate amount of all such permissible non-audit services provided to the Fund, UBS Global [AM] and any service providers controlling, controlled by or under common control with UBS Global [AM] that provide ongoing services to the Fund (“Covered Service Providers”) constitutes not more than 5% of the total amount of revenues paid to the independent auditors (during the fiscal year in which the permissible non-audit services are provided) by (a) the Fund, (b) its investment adviser and (c) any entity controlling, controlled by, or under common control with the investment adviser that provides ongoing services to the Fund during the fiscal year in which the services are provided that would have to be approved by the Committee; (ii) the permissible non-audit services were not recognized by the Fund at the time of the engag ement to be non-audit services; and (iii) such services are promptly brought to the attention of the Committee and approved by the Committee (or its delegate(s)) prior to the completion of the audit. |
| (e) | | (2) | Services approved pursuant to paragraph (c)(7)(i)(C) of Rule 2-01 of Regulation S-X: |
| | | | |
| | | | Audit-Related Fees: |
| | | | There were no amounts that were approved by the audit committee pursuant to the de minimis exception for the fiscal years ended August 31, 2007 and August 31, 2006 on behalf of the registrant. |
| | | | |
| | | | There were no amounts that were required to be approved by the audit committee pursuant to the de minimis exception for the fiscal years ended August 31, 2007 and August 31, 2006 on behalf of the registrant’s service providers that relate directly to the operations and financial reporting of the registrant. |
| | | | |
| | | | Tax Fees: |
| | | | There were no amounts that were approved by the audit committee pursuant to the de minimis exception for the fiscal years ended August 31, 2007 and August 31, 2007 on behalf of the registrant. |
| | | | |
| | | | There were no amounts that were required to be approved by the audit committee pursuant to the de minimis exception for the fiscal years ended August 31, 2007 and August 31, 2007 on behalf of the registrant’s service providers that relate directly to the operations and financial reporting of the registrant. |
| | | | |
| | | | All Other Fees: |
| | | | There were no amounts that were approved by the audit committee pursuant to the de minimis exception for the fiscal years ended August 31, 2004 and August 31, 2003 on behalf of the registrant. |
| | | | |
| | | | There were no amounts that were required to be approved by the audit committee pursuant to the de minimis exception for the fiscal years ended August 31, 2007 and August 31, 2007 on behalf of the registrant’s service providers that relate directly to the operations and financial reporting of the registrant. |
| (f) | | According to E&Y, for the fiscal year ended August 31, 2007, the percentage of hours spent on the audit of the registrant’s financial statements for the most recent fiscal year that were attributed to work performed by persons who are not full-time, permanent employees of E&Y was 0%. |
| | | |
| (g) | | For the fiscal years ended August 31, 2007 and August 31, 2006, the aggregate fees billed by E&Y of $1,863,815 and $1,888,547, respectively, for non-audit services rendered on behalf of the registrant (“covered”), its investment adviser (not including any sub-adviser whose role is primarily portfolio management and is subcontracted with or overseen by another investment adviser) and any entity controlling, controlled by, or under common control with the adviser (“non-covered”) that provides ongoing services to the registrant for each of the last two fiscal years of the registrant is shown in the table below: |
| | | |
| | | | | 2007 | | | | 2006 |
| | | Covered Services | | $17,900 | | | | $9,073 |
| | | Non-Covered Services | | 1,845,915 | | | | 1,879,474 |
| (h) | | The registrant’s audit committee was not required to consider whether the provision of non-audit services that were rendered to the registrant’s investment adviser (not including any sub-adviser whose role is primarily portfolio management and is subcontracted with or overseen by another investment adviser), and any entity controlling, controlled by, or under common control with the investment adviser that provides ongoing services to the registrant that were not pre-approved pursuant to paragraph (c)(7)(ii) of Rule 2-01 of Regulation S-X is compatible with maintaining the principal accountant’s independence. |
Item 5. Audit Committee of Listed Registrants.
Not applicable to the registrant.
Item 6. Schedule of Investments.
Included as part of the report to shareholders filed under Item 1 of this form.
Item 7. Disclosure of Proxy Voting Policies and Procedures for Closed-End Management Investment Companies.
Not applicable to the registrant.
Item 8. Portfolio Managers of Closed-End Management Investment Companies.
Not applicable to the registrant.
Item 9. Purchases of Equity Securities by Closed-End Management Investment Company and Affiliated Purchasers.
Not applicable to the registrant.
Item 10. Submission of Matters to a Vote of Security Holders.
The registrant’s Board has established a Nominating and Corporate Governance Committee. The Nominating and Corporate Governance Committee will consider nominees recommended by shareholders if a vacancy occurs among those board members who are not “interested persons” as defined in Section 2(a)(19) of the Investment Company Act of 1940, as amended. In order to recommend a nominee, a shareholder should send a letter to the chairperson of the Nominating and Corporate Governance Committee, Richard R. Burt, care of the Secretary of the registrant at UBS Global Asset Management (Americas) Inc., 51 West 52nd Street, New York, New York 10019-6114, and indicate on the envelope “Nominating and Corporate Governance Committee.” The shareholder’s letter should state the nominee’s name and should include the nominee’s resume or curriculum vitae, and must be accompanied by a written consent of the individual to stand for election if nominated for the Board and to serve if elected by shareholders.
Item 11. Controls and Procedures.
| (a) | | The registrant’s principal executive officer and principal financial officer have concluded that the registrant’s disclosure controls and procedures (as defined in Rule 30a-3(c) under the Investment Company Act of 1940, as amended) are effective based on their evaluation of these controls and procedures as of a date within 90 days of the filing date of this document. |
| | | |
| (b) | | The registrant’s principal executive officer and principal financial officer are aware of no changes in the registrant’s internal control over financial reporting that occurred during the registrant’s most recent fiscal half-year that has materially affected, or is reasonably likely to materially affect, the registrant’s internal control over financial reporting. |
Item 12. Exhibits.
| (a) | | (1) Code of Ethics as required pursuant to Section 406 of the Sarbanes-Oxley Act of 2002 (and designated by the registrant as a “Code of Conduct”) is incorporated by refernce herein from Exhibit Ex-99.CODE ETH to the registrant’s Report on Form N-CSR filed November 9, 2004 (Accession Number: 0000950136-04-003777) (SEC File No. 811-06292). |
| | | |
| (a) | | (2) Certifications of principal executive officer and principal financial officer pursuant to Section 302 of the Sarbanes-Oxley Act of 2002 is attached hereto as Exhibit EX-99.CERT. |
| | | |
| (a) | | (3) Written solicitation to purchase securities under Rule 23c-1 under the Investment Company Act of 1940 sent or given during the period covered by the report by or on behalf of the registrant to 10 or more persons – not applicable to the registrant. |
| | | |
| (b) | | Certifications of principal executive officer and principal financial officer pursuant to Section 906 of the Sarbanes-Oxley Act of 2002 is attached hereto as Exhibit EX-99.906CERT. |
SIGNATURES
Pursuant to the requirements of the Securities Exchange Act of 1934 and the Investment Company Act of 1940, the registrant has duly caused this report to be signed on its behalf by the undersigned, thereunto duly authorized.
UBS Investment Trust
| By: | | /s/ Kai R. Sotorp |
| | | Kai R. Sotorp |
| | | President |
Date: November 9, 2007
Pursuant to the requirements of the Securities Exchange Act of 1934 and the Investment Company Act of 1940, this report has been signed below by the following persons on behalf of the registrant and in the capacities and on the dates indicated.
| By: | | /s/ Kai R. Sotorp |
| | | Kai R. Sotorp |
| | | President |
Date: November 9, 2007
| By: | | /s/ Thomas Disbrow |
| | | Thomas Disbrow |
| | | Vice President and Treasurer |
Date: November 9, 2007