UNITED STATES
SECURITIES AND EXCHANGE COMMISSION
Washington, D.C. 20549
FORM N-CSR
CERTIFIED SHAREHOLDER REPORT OF REGISTERED
MANAGEMENT INVESTMENT COMPANIES
Investment Company Act file number: 811-06292
UBS Investment Trust
(Exact name of registrant as specified in charter)
51 West 52nd Street, New York, New York 10019-6114
(Address of principal executive offices) (Zip code)
Mark F. Kemper, Esq.
UBS Global Asset Management
51 West 52nd Street
New York, NY 10019-6114
(Name and address of agent for service)
Copy to:
Jack W. Murphy, Esq.
Dechert LLP
1775 I Street, N.W.
Washington, DC 20006-2401
Registrant’s telephone number, including area code: 212-882 5000
Date of fiscal year end: August 31
Date of reporting period: August 31, 2008
Item 1. Reports to Stockholders.
UBS U.S. Allocation Fund
Annual Report
August 31, 2008
UBS U.S. Allocation Fund
October 15, 2008
Dear shareholder,
We present you with the annual report for UBS U.S. Allocation Fund (the “Fund”) for the 12 months ended August 31, 2008.
Performance
Throughout the reporting period, both the US equity and fixed income markets experienced a high degree of volatility. Among numerous market challenges, fluctuating oil prices, inflationary pressures and falling corporate profits caused the equity markets to perform poorly during the reporting period, hurting the Fund’s returns. In fixed income, concerns over the US real estate market impacted mortgage- and asset-backed securities significantly, which weighed upon the Fund’s relative performance. | | | | UBS U.S. Allocation Fund
Investment goal:
Total return, consisting of
long-term capital appreciation
and current income
Portfolio Managers:
Portfolio Management
Team, including
Edwin M. Denson, PhD.
UBS Global Asset
Management (Americas) Inc.
Commencement:
Class A—May 10, 1993
Class B—January 30, 1996
Class C—July 22, 1992
Class Y—May 10, 1993
Dividend payments:
Annually, if any | | |
Against this backdrop, over the 12 months ended August 31, 2008, the Fund’s Class A shares declined 9.02% before deducting the maximum sales charge; after deducting the maximum sales charge, the Fund’s Class A shares declined 14.02%. During the same period, our proprietary index, the UBS U.S. Allocation Fund Index* declined 4.97%, and the Fund’s benchmark, the S&P 500 Index, fell 11.14%.
(Returns for all share classes over various time periods are shown in “Performance at a glance” on page 8; please note that the returns shown do not reflect the deduction of taxes that a shareholder would pay on Fund distributions or the redemption of Fund shares.)
| * | The UBS U.S. Allocation Fund Index is an unmanaged index compiled by the advisor, constructed as follows: from July 22, 1992 (the Fund’s inception) until February 29, 2004: 100% S&P 500 Index; from March 1, 2004 until May 31, 2005: 65% Russell 3000 Index, 30% Lehman Brothers US Aggregate Index, 5% Merrill Lynch US High Yield Cash Pay Index; and from June 1, 2005 until present: 65% Russell 3000 Index, 30% Lehman Brothers US Aggregate Index, 5% Merrill Lynch US High Yield Cash Pay Constrained Index. Investors should note that indices do not reflect fees and expenses. |
1
UBS U.S. Allocation Fund
| An interview with Lead Portfolio Manager Edwin M. Denson |
| Q. | | Can you describe the economic environment during the reporting period? |
| A. | | The US economy delivered mixed results during the 12-month reporting period. The US Department of Commerce reported that third quarter 2007 US gross domestic product (“GDP”) growth was a strong 4.8%. The economy then contracted during the last three months of the year, as fourth quarter 2007 GDP was – 0.2%. A variety of factors caused the economy to stumble, including the faltering housing market and tepid consumer and business spending. |
| | | |
| | | While there were fears that the US economy was headed for a recession—defined as two consecutive quarters of negative growth—GDP grew a surprising 0.9% during the first quarter of 2008. The Commerce Department’s estimate for second quarter GDP growth was 2.8%. This strong showing was, in part, due to rising exports, buoyed by the declining dollar, which made US goods more attractive overseas. In addition, consumer spending improved in recent months, helped by the government’s tax rebate program. |
| | | |
| Q. | | How did the Federal Reserve Board (the “Fed”) react in this economic environment? |
| A. | | The Fed has been extremely aggressive in attempting to stabilize the markets and keep the US economy from falling into a recession. As the problems and fallout from subprime mortgages escalated, the Fed moved into action by pumping substantial amounts of liquidity into the financial system in an effort to facilitate normal market operations. For example, in March 2008, the Fed established a new lending program allowing certain brokerage firms to take loans from its discount window. During the same month, it also helped orchestrate the purchase of Bear Stearns by JPMorgan Chase. |
| | | |
| | | Following the conclusion of the reporting period, the Fed made available billions of dollars to investment firms in an attempt to settle the markets following Lehman Brothers’ bankruptcy. It also announced an $85 billion loan to insurance giant AIG in exchange for an 80% ownership interest. The US Treasury Department was actively involved as well, taking control of mortgage finance companies Fannie Mae and Freddie Mac. |
| | | |
| | | During the reporting period, the Federal Reserve Board lowered the federal funds rate seven times between September 2007 and April 2008 in an attempt to stimulate the US economy and address other concerns. (The Federal Funds rate, or “fed funds” rate, is the rate that banks charge one another for funds they borrow on an overnight basis.) |
2
UBS U.S. Allocation Fund
| | | The final reduction brought the rate to 2.00%—its lowest level since 2004. Following the conclusion of the reporting period, the Fed again reduced the rate, citing a reduction of inflationary pressures and slowing economic activity. The most recent cut lowered the rate to 1.5%. |
| | | |
| Q. | | How did the equity and fixed income markets perform during the reporting period? |
| A. | | After initially rising in October 2007, the US stock market, as represented by the S&P 500 Index, declined during each of the next five months. The market then rallied briefly in April and May before plunging 8.43% in June 2008. This marked its worst monthly performance since September 2002 and its worst month of June since the Great Depression in 1930. The market ended the 12-month period largely treading water in July and August. All told, the S&P 500 Index fell 11.14% during the reporting period, and was down nearly 20% since its peak in October 2007. |
| | | |
| | | Turning to the US bond market, Treasury yields moved in response to mixed signals regarding the economy, rising inflation and expectations regarding future Fed monetary policy. Treasury yields ultimately moved lower, given the Fed’s numerous interest rate cuts and increased investor risk aversion triggered by the escalating troubles in the housing market. In the 12 months ended August 31, 2008, the overall US bond market, as measured by the Lehman Brothers US Aggregate Index, returned 5.86%.(1) |
| | | |
| Q. | | How was the Fund allocated at the end of the reporting period? |
| A. | | As of August 31, 2008, the Fund was overweight to equities and high yield debt, and underweight US bonds in relation to the target allocation of the UBS US Allocation Fund Index. This reflects a significant increase in the Fund’s allocation to equities and a decrease to bonds over the course of the 12-month period. |
| | | |
| | | During the reporting period, the sell-off in the equity markets caused the asset class to become undervalued, in our view. In response, we increased the Fund’s equity allocation. Given several flights to quality, high yield bond spreads widened over the period, making them more attractive, in our view. (Spread is the difference between the yield paid |
|
| (1) | The Lehman Brothers US Aggregate Index covers the USD-denominated, investment-grade, fixed-rate, taxable bond market of SEC-registered securities. The index includes bonds from the Treasury, Government-Related, Corporate, MBS (agency fixed-rate and hybrid ARM passthroughs), ABS and CMBS sectors. US Agency Hybrid Adjustable Rate Mortgage (ARM) securities were added to the US Aggregate Index on April 1, 2007. |
3
UBS U.S. Allocation Fund
| | | on US Treasury bonds and higher risk securities.) As such, we increased our exposure to these securities as well. |
| | | |
| | | While US investment grade bond prices fluctuated during the reporting period, we maintained our underweight to this area, as we found other areas of the market (such as equities and high yield bonds) to be more attractively valued based on our forward-looking risk and return expectations. Overall, our asset allocation strategies detracted from results during the reporting period, due to the weak performance of US equities and, to a lesser extent, high yield bonds. |
| | | |
| Q. | | Which equity strategies performed well during the reporting period, and which areas produced disappointing results? |
| A. | | Overall, the Fund’s equity holdings detracted from performance during the reporting period, with an underweight to energy stocks, a significant contributor to underperformance. The Fund’s underweight to the energy sector stems largely from an underweight to energy reserves and exploration/production companies. We believe many of these companies will see their margins reduced as crude oil prices fall and costs associated with new projects coming on line continue to rise. In our opinion, investors pricing these stocks based on recent margin levels are likely to be disappointed when these stock prices underperform. |
| | | |
| | | While the Fund maintained an underweight to the energy sector, it was overweight oil services companies, benefiting performance. We expect, over time, that their business models will be less dependent on crude oil prices than they had been in years past. Historically, lower crude oil prices dramatically reduced the number of profitable projects that oil services companies could provide infrastructure to globally. Today, we believe projects will continue to be profitable, resulting in continued demand for oil services, even if crude prices decline. Also benefiting Fund performance were electric utilities and railroads, in addition to liquid natural gas terminals and pipelines. |
| | | |
| | | The Fund’s overweight to banks detracted from performance. Given the price volatility seen in financial stocks during the reporting period, it is clear that investors, and in some cases the companies themselves, are having a difficult time evaluating the impact of the credit deterioration and subprime mortgage fallout on their respective businesses. We believe that while the environment for financials will continue to be challenging over the near term, conditions will improve over time, and that many of the companies within the sector are worth far more than the prices investors are paying today. |
4
UBS U.S. Allocation Fund
| Q. | | How did you manage the Fund’s fixed income exposure during the reporting period? |
| A. | | Early in the reporting period, we lengthened the Fund’s duration to a neutral position relative to the benchmark as we felt prices had moved to what we considered to be fair value. (Duration measures a portfolio’s sensitivity to changes in interest rates.) At the end of November 2007, we moved to a modest underweight duration relative to the benchmark as disarray in the credit markets caused longer-term interest rates to approach historically low levels. In our view, these events priced in an unduly dire economic outlook. As interest rates moved sharply higher in May and early June 2008, they moved closer to our estimate of fair value, and we added duration to the Fund, again moving to a neutral position. Overall, our duration positioning had a positive impact on performance. |
| | | |
| | | We viewed the periods of market volatility and their subsequent pricing dislocations as opportunities to adjust the Fund’s portfolio. During the reporting period, we increased the Fund’s exposure to certain Treasury Inflation-Protected Securities (TIPS) that offered what we believed to be relatively attractive yields, benefiting performance. |
| | | |
| | | However, this was not enough to offset the negative impact of the Fund’s holdings in mortgage- and asset-backed securities, which hurt the Fund’s performance significantly during the reporting period. In both cases, these securities were impacted by the fallout in the subprime mortgage market and heightened investor risk aversion. |
| | | |
| | | Finally, we maintained a relatively conservative stance in the Fund’s high yield component. However, the Fund’s exposure to the sector hurt performance on an absolute basis when high yield bonds underperformed during the reporting period. |
| | | |
| Q. | | What is your outlook for the economy? |
| A. | | While the extraordinary actions by the Fed and other government initiatives to add liquidity and restore confidence have provided some relief to the credit-related issues plaguing the markets, we expect volatility to remain high. As the credit crunch largely continues, and the effects of the still-slowing housing market are felt, the outlook for the US economy remains uncertain. We think it is likely, however, that the focus will shift from concerns over credit to a broader economic uneasiness. |
| | | |
| | | Looking ahead, we plan to monitor the state of the financial markets, inflation and the overall strength of the economy closely, as well as other factors that we believe are likely to influence the Fed’s future decisions on interest rates. |
5
UBS U.S. Allocation Fund
We thank you for your continued support and welcome any comments or questions you may have. For additional information on the UBS family of funds,** please contact your financial advisor or visit us at www.ubs.com/globalam-us.
Sincerely,
Kai R. Sotorp
President
UBS U.S. Allocation Fund
Head—Americas
UBS Global Asset Management (Americas) Inc.
Edwin M. Denson, PhD.
Lead Portfolio Manager
UBS U.S. Allocation Fund
Head of Asset Allocation
UBS Global Asset Management (Americas) Inc.
This letter is intended to assist shareholders in understanding how the Fund performed during the 12 months ended August 31, 2008. The views and opinions in the letter were current as of October 15, 2008. They are not guarantees of performance or investment results and should not be taken as investment advice. Investment decisions reflect a variety of factors, and we reserve the right to change our views about individual securities, sectors and markets at any time. As a result, the views expressed should not be relied upon as a forecast of the Fund’s future investment intent. We encourage you to consult your financial advisor regarding your personal investment program.
| ** | Mutual funds are sold by prospectus only. You should read it carefully and consider a fund’s investment objectives, risks, charges, expenses and other important information contained in the prospectus before investing. Prospectuses for most of our funds can be obtained from your Financial Advisor, by calling UBS Funds at 800-647 1568 or by visiting our Web site at www.ubs.com/globalam-us. |
6
UBS U.S. Allocation Fund
| Comparison of change in value of a $10,000 investment in the Class C shares of the UBS U.S. Allocation Fund, the S&P 500 Index(1) and the U.S. Allocation Fund Index(2) from August 31, 1998 through August 31, 2008 (unaudited) |
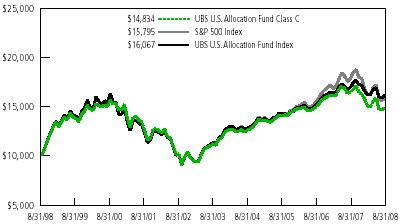
The graph depicts the performance of UBS U.S. Allocation Fund Class C shares versus the S&P 500 Index and the UBS U.S. Allocation Fund Index over the 10 years ended August 31, 2008. The performance of the other share classes will vary from the performance of the class shown based on the difference in sales charges and fees paid by shareholders investing in different share classes. Past performance does not predict future performance and the performance provided does not reflect the deduction of taxes that a shareholder would pay on Fund distributions or the redemption of Fund shares. Performance results assume reinvestment of all dividend and capital gain distributions at net asset value on the ex-dividend dates. It is important to note that the Fund is a professionally managed portfolio, while the Indices are not available for investment and are unmanaged. The comparison is shown for illustrative purposes only.
| (1) | The S&P 500 Index is an unmanaged, weighted index comprising 500 widely held common stocks varying in composition and is not available for direct investment. Investors should note that indices do not reflect fees and expenses. | | |
| | | | |
| (2) | The UBS U.S. Allocation Fund Index is an unmanaged index compiled by the advisor, constructed as follows: from July 22, 1992 (the Fund’s inception) until February 29, 2004: 100% S&P 500 Index; from March 1, 2004 until May 31, 2005: 65% Russell 3000 Index, 30% Lehman Brothers US Aggregate Index, 5% Merrill Lynch US High Yield Cash Pay Index; and from June 1, 2005 until present: 65% Russell 3000 Index, 30% Lehman Brothers US Aggregate Index, 5% Merrill Lynch US High Yield Cash Pay Constrained Index. Investors should note that indices do not reflect fees and expenses. | | |
7
UBS U.S. Allocation Fund
| Performance at a glance (unaudited) |
| |
| Average annual total returns for periods ended 08/31/08 |
| | | | | | 1 year | | | 5 years | | | 10 years |
|
| | | Class A(1) | | | –9.02 | % | | | 6.63 | % | | | 4.80 | % |
| | |
|
| Before deducting maximum sales charge | | Class B(2) | | | –9.96 | % | | | 5.74 | % | | | 4.33 | % |
| | |
|
| | | Class C(3) | | | –9.70 | % | | | 5.84 | % | | | 4.02 | % |
| | |
|
| | | Class Y(4) | | | –8.69 | % | | | 7.00 | % | | | 5.15 | % |
|
| | | Class A(1) | | | –14.02 | % | | | 5.43 | % | | | 4.21 | % |
| | |
|
| After deducting maximum sales charge | | Class B(2) | | | –14.41 | % | | | 5.42 | % | | | 4.33 | % |
| | |
|
| | | Class C(3) | | | –10.58 | % | | | 5.84 | % | | | 4.02 | % |
|
| S&P 500 Index(5) | | | | | –11.14 | % | | | 6.92 | % | | | 4.68 | % |
|
| UBS U.S. Allocation Fund Index(6) | | | | | –4.97 | % | | | 7.29 | % | | | 4.86 | % |
|
| Lipper Flexible Portfolio Funds median(7) | | | | | –4.27 | % | | | 7.19 | % | | | 6.34 | % |
|
| For most recent quarter-end performance, please refer to the “Average annual total return” table on page 9. |
| |
| (1) | | Maximum sales charge for Class A shares is 5.5%. Class A shares bear ongoing 12b-1 service fees. |
| |
| (2) | | Maximum contingent deferred sales charge for Class B shares is 5% imposed on redemptions and is reduced to 0% after a maximum of six years. Class B shares bear ongoing 12b-1 service and distribution fees. |
| |
| (3) | | Maximum contingent deferred sales charge for Class C shares is 1% imposed on redemptions and is reduced to 0% after one year. Class C shares bear ongoing 12b-1 service and distribution fees. |
| |
| (4) | | The Fund offers Class Y shares to a limited group of eligible investors, including certain qualifying retirement plans. Class Y shares do not bear initial or contingent deferred sales charges or ongoing 12b-1 service and distribution fees.
If an investor sells or exchanges shares less than 90 days after purchase, a redemption fee of 1.00% of the amount sold or exchanged will be deducted at the time of the transaction, except as noted otherwise in the prospectus. |
| |
| (5) | | The S&P 500 Index is an unmanaged, weighted index comprising 500 widely held common stocks varying in composition and is not available for direct investment. Investors should note that indices do not reflect fees and expenses. |
| |
| (6) | | The UBS U.S. Allocation Fund Index is an unmanaged index compiled by the advisor, constructed as follows: from July 22, 1992 (the Fund’s inception) until February 29, 2004: 100% S&P 500 Index; from March 1, 2004 until May 31, 2005: 65% Russell 3000 Index, 30% Lehman Brothers US Aggregate Index, 5% Merrill Lynch US High Yield Cash Pay Index; and from June 1, 2005 until present: 65% Russell 3000 Index, 30% Lehman Brothers US Aggregate Index, 5% Merrill Lynch US High Yield Cash Pay Constrained Index. Investors should note that indices do not reflect fees and expenses. |
| |
| (7) | | Lipper peer group data calculated by Lipper Inc; used with permission. The Lipper median is the return of the fund that places in the middle of a Lipper peer group. |
Past performance does not predict future performance, and the performance information provided does not reflect the deduction of taxes that a shareholder would pay on Fund distributions or the redemption of Fund shares. The return and principal value of an investment will fluctuate, so that an investor’s shares, when redeemed, may be worth more or less than their original cost. Performance results assume reinvestment of all dividends and capital gain distributions at net asset value on the ex-dividend dates. Current performance may be higher or lower than the performance data quoted. For month-end performance figures, please visit http://www.ubs.com.
8
UBS U.S. Allocation Fund
| Performance at a glance (unaudited) (concluded) |
| |
| Average annual total returns for periods ended 09/30/08 |
| | | | | | 1 year | | | 5 years | | | 10 years |
|
| | | Class A(1) | | | –18.80 | % | | | 4.85 | % | | | 3.17 | % |
| | |
|
| Before deducting maximum sales charge | | Class B(2) | | | –19.72 | % | | | 3.97 | % | | | 2.70 | % |
| | |
|
| | | Class C(3) | | | –19.45 | % | | | 4.06 | % | | | 2.40 | % |
| | |
|
| | | Class Y(4) | | | –18.55 | % | | | 5.21 | % | | | 3.51 | % |
|
| | | Class A(1) | | | –23.27 | % | | | 3.67 | % | | | 2.59 | % |
| | |
|
| After deducting maximum sales charge | | Class B(2) | | | –23.69 | % | | | 3.63 | % | | | 2.70 | % |
| | |
|
| | | Class C(3) | | | –20.24 | % | | | 4.06 | % | | | 2.40 | % |
|
| (1) | | Maximum sales charge for Class A shares is 5.5%. Class A shares bear ongoing 12b-1 service fees. |
| |
| (2) | | Maximum contingent deferred sales charge for Class B shares is 5% imposed on redemptions and is reduced to 0% after a maximum of six years. Class B shares bear ongoing 12b-1 service and distribution fees. |
| |
| (3) | | Maximum contingent deferred sales charge for Class C shares is 1% imposed on redemptions and is reduced to 0% after one year. Class C shares bear ongoing 12b-1 service and distribution fees. |
| |
| (4) | | The Fund offers Class Y shares to a limited group of eligible investors, including certain qualifying retirement plans. Class Y shares do not bear initial or contingent deferred sales charges or ongoing 12b-1 service and distribution fees. |
| |
| | | If an investor sells or exchanges shares less than 90 days after purchase, a redemption fee of 1.00% of the amount sold or exchanged will be deducted at the time of the transaction, except as noted otherwise in the prospectus. |
Past performance does not predict future performance, and the performance information provided does not reflect the deduction of taxes that a shareholder would pay on Fund distributions or the redemption of Fund shares. The return and principal value of an investment will fluctuate, so that an investor’s shares, when redeemed, may be worth more or less than their original cost. Performance results assume reinvestment of all dividends and capital gain distributions at net asset value on the ex-dividend dates. Current performance may be higher or lower than the performance data quoted. For month-end performance figures, please visit http://www.ubs.com.
9
UBS U.S. Allocation Fund
Understanding your Fund’s expenses (unaudited)
As a shareholder of the Fund, you incur two types of costs: (1) transactional costs (as applicable), including sales charges (loads); and (2) ongoing costs, including management fees; service and/or distribution (12b-1) fees (if applicable); and other Fund expenses. This example is intended to help you understand your ongoing costs (in dollars) of investing in the Fund and to compare these costs with the ongoing costs of investing in other mutual funds.
The example below is based on an investment of $1,000 invested at the beginning of the period and held for the entire period, March 1, 2008 to August 31, 2008.
Actual expenses
The first line for each class of shares in the table below provides information about actual account values and actual expenses. You may use the information in this line, together with the amount you invested, to estimate the expenses that you paid over a period. Simply divide your account value by $1,000 (for example, an $8,600 account value divided by $1,000 = 8.6), then multiply the result by the number in the first line for each class of shares under the heading entitled “Expenses paid during period” to estimate the expenses you paid on your account during this period.
Hypothetical example for comparison purposes
The second line for each class of shares in the table below provides information about hypothetical account values and hypothetical expenses based on the Fund’s actual expense ratios for each class of shares and an assumed rate of return of 5% per year before expenses, which is not the Fund’s actual return for each class of shares. The hypothetical account values and expenses may not be used to estimate the actual ending account balance or expenses you paid for the period. You may use this information to compare the ongoing costs of investing in the Fund and other funds. To do so, compare this 5% hypothetical example with the 5% hypothetical examples that appear in the shareholder reports of other funds.
Please note that the expenses shown in the table are meant to highlight your ongoing Fund costs only and do not reflect any transactional costs (as applicable), such as sales charges (loads). Therefore, the second line in the table for each class of shares is useful in comparing ongoing Fund costs only, and will not help you determine the relative total costs of owning different funds. In addition, if these transactional costs were included, your costs would have been higher.
10
UBS U.S. Allocation Fund
Understanding your Fund’s expenses (unaudited) (concluded)
| | | | | | | | | Expenses paid | | Expense |
| | | | | Beginning | | Ending | | during period(1) | | ratio |
| | | | | account value | | account value | | 03/01/08 to | | during the |
| | | | | March 1, 2008 | | August 31, 2008 | | 08/31/08 | | period |
|
| Class A | | Actual | | $1,000.00 | | | $990.10 | | | $4.65 | | | 0.93 | % |
|
| | | Hypothetical
(5% annual return
before expenses) | | 1,000.00 | | | 1,020.46 | | | 4.72 | | | 0.93 | % |
|
| Class B | | Actual | | 1,000.00 | | | 985.10 | | | 9.43 | | | 1.89 | % |
|
| | | Hypothetical
(5% annual return
before expenses) | | 1,000.00 | | | 1,015.63 | | | 9.58 | | | 1.89 | % |
|
| Class C | | Actual | | 1,000.00 | | | 986.00 | | | 8.59 | | | 1.72 | % |
|
| | | Hypothetical
(5% annual return
before expenses) | | 1,000.00 | | | 1,016.49 | | | 8.72 | | | 1.72 | % |
|
| Class Y | | Actual | | 1,000.00 | | | 991.50 | | | 3.00 | | | 0.60 | % |
|
| | | Hypothetical
(5% annual return
before expenses) | | 1,000.00 | | | 1,022.12 | | | 3.05 | | | 0.60 | % |
|
| (1) | | Expenses are equal to the Fund’s annualized net expense ratios, multiplied by the average account value over the period, multiplied by 184 divided by 366 (to reflect the one-half year period). |
11
UBS U.S. Allocation Fund
Portfolio statistics (unaudited)
| Characteristics | | 08/31/08 | | | | 02/29/08 | | | | 08/31/07 |
|
| Net assets (mm) | | $ | 546.7 | | | | $ | 621.9 | | | | | $ | 745.0 | |
|
| Number of securities | | | 483 | | | | | | 562 | | | | | | 490 | |
|
| | | | | | | | | | | | | | | | | |
| Portfolio composition(1) | | 08/31/08 | | | | 02/29/08 | | | | 08/31/07 |
|
| Stocks | | | 73.6% | | | | | | 65.3% | | | | | | 69.4% | |
|
| Bonds | | | 22.4 | | | | | | 30.6 | | | | | | 27.6 | |
|
| Futures, options and swap contracts | | | (0.3) | | | | | | (0.2) | | | | | | 0.0(2) | |
|
| Cash equivalents and other assets less liabilities | | | 4.3 | | | | | | 4.3 | | | | | | 3.0 | |
|
| Total | | 100.0% | | | | | 100.0% | | | | | 100.0% | |
|
| | | | | | | | | | | | | | | | | |
| Top five equity sectors(1) | | 08/31/08 | | | | 02/29/08 | | | | 08/31/07 |
|
| Health care | | 12.6% | | | | Health care | 12.1% | | | | Financials | 14.8% | |
|
| | | | | | | | | | | | | | Consumer | | | |
| Financials | | 12.2 | | | | Financials | 11.5 | | | | discretionary | 11.7 | |
|
| Information | | | | | | | | | | | | | Information | | | |
| technology | | 12.1 | | | | Industrials | 10.1 | | | | technology | 11.3 | |
|
| | | | | | | | Consumer | | | | | | | | | |
| Consumer discretionary | | 10.8 | | | | discretionary | 10.0 | | | | Health care | 10.3 | |
|
| | | | | | | | Information | | | | | | | | | |
| Industrials | | 10.7 | | | | technology | 8.5 | | | | Industrials | 8.6 | |
|
| Total | | 58.4% | | | | | 52.2% | | | | | 56.7% | |
|
| | | | | | | | | | | | | | | | | |
| Top ten equity securities(1) | | 08/31/08 | | | | 02/29/08 | | | | 08/31/07 |
|
| Intel Corp. | | 2.2% | | | | General Electric Co. | 1.8% | | | | Citigroup, Inc. | 2.5% | |
|
| Wyeth | | 1.8 | | | | Intel Corp. | 1.7 | | | | Wells Fargo & Co. | 2.3 | |
|
| Wells Fargo & Co. | | 1.8 | | | | Wyeth | 1.6 | | | | Intel Corp. | 2.0 | |
|
| General Electric Co. | | 1.7 | | | | Wells Fargo & Co. | 1.6 | | | | Exelon Corp. | 1.9 | |
|
| Halliburton Co. | | 1.5 | | | | Allergan, Inc. | 1.6 | | | | Microsoft Corp. | 1.9 | |
|
| Comcast Corp., Class A | | 1.5 | | | | Citigroup, Inc. | 1.5 | | | | Morgan Stanley | 1.8 | |
|
| Citigroup, Inc. | | 1.4 | | | | Exelon Corp. | 1.5 | | | | General Electric Co. | 1.8 | |
|
| | | | | | | | Burlington Northern | | | | | | Illinois Tool | | | |
| Baker Hughes, Inc. | | 1.4 | | | | Santa Fe Corp. | 1.4 | | | | Works, Inc. | 1.5 | |
|
| Microsoft Corp. | | 1.4 | | | | Morgan Stanley | 1.3 | | | | Wyeth | 1.4 | |
|
| Genzyme Corp. | | 1.4 | | | | Johnson & Johnson | 1.2 | | | | Sprint Nextel Corp. | 1.4 | |
|
| Total | | 16.1% | | | | 15.2% | | | | 18.5% |
|
| (1) | | Weightings represent percentages of the Fund’s net assets as of the dates indicated. |
| (2) | | Weighting represents less than 0.05% of the Fund’s net assets as of the dates indicated. |
12
UBS U.S. Allocation Fund
Portfolio statistics (unaudited) (continued)
| Long-term fixed income | | | | | | | | | | |
| sector allocation(1) | | | 08/31/08 | | 02/29/08 | | 08/31/07 |
|
| Mortgage & agency debt securities | | | 9.5 | % | | 12.7 | % | | 13.7 | % |
|
| Corporate bonds | | | 6.7 | | | 8.5 | | | 7.3 | |
|
| US government obligations | | | 4.2 | | | 4.8 | | | 2.7 | |
|
| Commercial mortgage-backed securities | | | 1.6 | | | 3.4 | | | 3.0 | |
|
| Asset-backed securities | | | 0.3 | | | 1.1 | | | 0.9 | |
|
| Collateralized debt obligation | | | 0.1 | | | 0.1 | | | — | |
|
| International government obligations | | | — | | | — | | | 0.0 | (2) |
|
| Total | | | 22.4 | % | | 30.6 | % | | 27.6 | % |
|
| (1) | | Weightings represent percentages of the Fund’s net assets as of the dates indicated. |
| (2) | | Weighting represents less than 0.05% of the Fund’s net assets as of the dates indicated. |
13
UBS U.S. Allocation Fund
Portfolio statistics (unaudited) (concluded)
| Top ten fixed | | | | | | | | | | | | | | | |
| income securities(1) | | | 08/31/08 | | | | | 02/29/08 | | | | 08/31/07 |
|
| | | | | | | US Treasury Notes, | | | | | | US Treasury Bonds, | | | |
| FNMA Certificates | | | | | | 4.250% | | | | | | 6.250% | | | |
| TBA, 5.500% TBA | | | 1.2 | % | | due 09/30/12 | | | 1.3 | % | | due 08/15/23 | | 0.9 | % |
|
| US Treasury Inflation | | | | | | US Treasury Notes, | | | | | | FHLMC Certificates, | | | |
| Index Notes, 2.000% | | | | | | 4.625% due | | | | | | 5.500% | | | |
| due 01/15/16 | | | 1.0 | | | 02/15/17 | | | 0.9 | | | due 08/23/17 | | 0.9 | |
|
| US Treasury | | | | | | US Treasury Bonds, | | | | | | FHLMC Certificates, | | | |
| Notes, 4.625% | | | | | | 6.250% due | | | | | | 5.600% | | | |
| due 02/15/17 | | | 0.9 | | | 08/15/23 | | | 0.9 | | | due 10/17/13 | | 0.8 | |
|
| FNMA Certificates | | | | | | FNMA Certificates, | | | | | | US Treasury Bonds, | | | |
| TBA, 6.000% | | | | | | 6.500% | | | | | | 4.750% | | | |
| TBA | | | 0.6 | | | due 01/01/36 | | | 0.8 | | | due 02/15/37 | | 0.7 | |
|
| US Treasury Inflation | | | | | | US Treasury Notes, | | | | | | FNMA Certificates, | | | |
| Index Notes, 2.375% | | | | | | 3.250% due | | | | | | 6.500% | | | |
| due 04/15/11 | | | 0.6 | | | 12/31/09 | | | 0.6 | | | due 01/01/36 | | 0.7 | |
|
| FHLMC Certificates, | | | | | | US Treasury Inflation | | | | | | US Treasury Notes, | | | |
| 5.500% | | | | | | Index Notes, 2.375% | | | | | | 5.125% | | | |
| due 05/01/37 | | | 0.6 | | | due 04/15/11 | | | 0.6 | | | due 05/15/16 | | 0.6 | |
|
| | | | | | | | | | | | | JP Morgan Chase | | | |
| US Treasury Bonds, | | | | | | FHLMC Certificates, | | | | | | Commercial Mortgage | | | |
| 5.375% | | | | | | 5.500% | | | | | | Securities, 5.345% | | | |
| due 02/15/31 | | | 0.5 | | | due 05/01/37 | | | 0.5 | | | due 12/15/44 | | 0.6 | |
|
| US Treasury Bonds, | | | | | | FNMA Certificates, | | | | | | FNMA Certificates, | | | |
| 4.750% | | | | | | 5.000% | | | | | | 5.200% | | | |
| due 02/15/37 | | | 0.5 | | | due 02/01/19 | | | 0.5 | | | due 11/08/10 | | 0.5 | |
|
| FNMA REMIC, | | | | | | | | | | | | Greenwich Capital | | | |
| Series 2004-W1, | | | | | | FHLMC Certificates, | | | | | | Commercial Funding | | | |
| Class 3A, 5.855% | | | | | | 5.600% | | | | | | Corp., 5.962% | | | |
| due 01/25/43 | | | 0.5 | | | due 10/17/13 | | | 0.5 | | | due 03/18/49 | | 0.4 | |
|
| GNMA Certificates II, | | | | | | Lehman XS Trust, | | | | | | FNMA Certificates, | | | |
| 6.000% | | | | | | 6.000% | | | | | | 5.500% | | | |
| due 02/20/34 | | | 0.4 | | | due 12/25/35 | | | 0.5 | | | due 02/01/19 | | 0.4 | |
|
| Total | | | 6.8 | % | | | | | 7.1 | % | | | | 6.5 | % |
|
| (1) | | Weightings represent percentages of the Fund’s net assets as of the dates indicated. |
14
UBS U.S. Allocation Fund
Portfolio of investments—August 31, 2008
Common stocks—73.59%
| Security description | | Shares | | | Value |
|
| Aerospace & defense—0.78% | | | | | |
| BE Aerospace, Inc.* | | 6,800 | | | $162,860 |
|
| General Dynamics Corp. | | 9,200 | | | 849,160 |
|
| Hexcel Corp.* | | 19,100 | | | 396,898 |
|
| LMI Aerospace, Inc.* | | 10,000 | | | 235,900 |
|
| Precision Castparts Corp. | | 10,700 | | | 1,104,882 |
|
| United Technologies Corp. | | 23,000 | | | 1,508,570 |
|
| | | | | | 4,258,270 |
|
| Air freight & couriers—1.69% | | | | | |
| Dynamex, Inc.* | | 10,500 | | | 309,540 |
|
| FedEx Corp. | | 79,900 | | | 6,617,318 |
|
| Ryder System, Inc. | | 35,600 | | | 2,296,912 |
|
| | | | | | 9,223,770 |
|
| Airlines—0.27% | | | | | |
| Southwest Airlines Co. | | 98,600 | | | 1,501,678 |
|
| Auto components—1.74% | | | | | |
| BorgWarner, Inc. | | 108,400 | | | 4,482,340 |
|
| Johnson Controls, Inc. | | 162,500 | | | 5,024,500 |
|
| | | | | | 9,506,840 |
|
| Banks—4.42% | | | | | |
| City National Corp. | | 30,600 | | | 1,514,394 |
|
| Cullen/Frost Bankers, Inc. | | 2,800 | | | 155,904 |
|
| East West Bancorp, Inc.(1) | | 15,200 | | | 189,544 |
|
| Fifth Third Bancorp | | 316,338 | | | 4,991,814 |
|
| South Financial Group, Inc. | | 33,700 | | | 229,160 |
|
| SunTrust Banks, Inc. | | 85,700 | | | 3,589,973 |
|
| SVB Financial Group* | | 6,700 | | | 375,535 |
|
| The Bank of New York Mellon Corp. | | 88,500 | | | 3,062,985 |
|
| United Bankshares, Inc.(1) | | 5,300 | | | 136,475 |
|
| Wells Fargo & Co. | | 323,300 | | | 9,786,291 |
|
| WSFS Financial Corp. | | 3,000 | | | 160,410 |
|
| | | | | | 24,192,485 |
|
| Security description | | Shares | | | Value |
|
| Beverages—0.65% | | | | | |
| Constellation Brands, Inc., Class A* | | 124,400 | | $ | 2,626,084 |
|
| PepsiCo, Inc. | | 13,900 | | | 951,872 |
|
| | | | | | 3,577,956 |
|
| Biotechnology—1.35% | | | | | |
| Genzyme Corp.* | | 94,400 | | | 7,391,520 |
|
| Building products—0.91% | | | | | |
| Masco Corp. | | 260,400 | | | 4,963,224 |
|
| Chemicals—0.66% | | | | | |
| Cytec Industries, Inc. | | 10,800 | | | 548,640 |
|
| Monsanto Co. | | 6,500 | | | 742,625 |
|
| Potash Corp. of Saskatchewan, Inc. | | 3,200 | | | 555,520 |
|
| Praxair, Inc. | | 17,900 | | | 1,608,136 |
|
| Spartech Corp. | | 16,100 | | | 169,533 |
|
| | | | | | 3,624,454 |
|
| Commercial services & supplies—0.91% | | | | | |
| Coinstar, Inc.* | | 20,800 | | | 684,736 |
|
| Dice Holdings, Inc.* | | 1,800 | | | 16,002 |
|
| Dollar Financial Corp.(1),* | | 20,400 | | | 372,912 |
|
| Factset Research Systems, Inc.(1) | | 4,600 | | | 288,466 |
|
| LECG Corp.* | | 14,100 | | | 114,915 |
|
| MasterCard, Inc., Class A | | 12,800 | | | 3,104,640 |
|
| Mobile Mini, Inc.(1),* | | 17,200 | | | 367,736 |
|
| | | | | | 4,949,407 |
|
| Communications equipment—1.33% | | | | | |
| Cisco Systems, Inc.* | | 76,000 | | | 1,827,800 |
|
| F5 Networks, Inc.(1),* | | 9,300 | | | 317,223 |
|
| Harris Corp. | | 6,500 | | | 340,340 |
|
| NICE Systems Ltd., ADR(1),* | | 6,800 | | | 208,284 |
|
| OpNext, Inc.* | | 12,600 | | | 79,884 |
|
| Powerwave Technologies, Inc.(1),* | | 83,400 | | | 421,170 |
|
| QUALCOMM, Inc. | | 52,300 | | | 2,753,595 |
|
15
UBS U.S. Allocation Fund
Portfolio of investments—August 31, 2008
Common stocks—(continued)
| Security description | | Shares | | | Value |
|
| Communications equipment—(concluded) | | | | | |
| Research In Motion Ltd. (RIM)* | | 10,900 | | | $1,325,440 |
|
| | | | | | 7,273,736 |
|
| Computers & peripherals—2.09% | | | | | |
| Apple, Inc.* | | 10,700 | | | 1,813,971 |
|
| Dell, Inc.* | | 135,200 | | | 2,937,896 |
|
| Hewlett-Packard Co. | | 51,800 | | | 2,430,456 |
|
| NetApp, Inc.* | | 156,600 | | | 3,990,168 |
|
| Stratasys, Inc.(1),* | | 16,600 | | | 276,556 |
|
| | | | | | 11,449,047 |
|
| Construction & engineering—0.04% | | | | | |
| Sterling Construction Co., Inc.* | | 12,445 | | | 229,610 |
|
| Distributors—0.09% | | | | | |
| Beacon Roofing Supply, Inc.(1),* | | 29,900 | | | 486,772 |
|
| Diversified financials—5.10% | | | | | |
| American Express Co. | | 20,500 | | | 813,440 |
|
| BlackRock, Inc. | | 1,600 | | | 347,600 |
|
| Citigroup, Inc. | | 413,786 | | | 7,857,796 |
|
| Discover Financial Services | | 204,525 | | | 3,364,436 |
|
| Goldman Sachs Group, Inc. | | 3,300 | | | 541,101 |
|
| Morgan Stanley | | 152,250 | | | 6,216,368 |
|
| National Financial | | | | | |
|
| Partners Corp. | | 18,200 | | | 367,094 |
|
| optionsXpress Holdings, Inc.(1) | | 5,800 | | | 133,806 |
|
| PennantPark Investment Corp.(1) | | 49,100 | | | 392,309 |
|
| Principal Financial Group, Inc. | | 93,200 | | | 4,267,628 |
|
| State Street Corp. | | 5,700 | | | 385,719 |
|
| T. Rowe Price Group, Inc. | | 11,500 | | | 682,640 |
|
| Visa, Inc., Class A | | 33,200 | | | 2,519,880 |
|
| | | | | | 27,889,817 |
|
| Security description | | Shares | | | Value |
|
| Diversified telecommunication services—2.16% | |
| AT&T, Inc. | | 151,600 | | | $4,849,684 |
|
| Cbeyond, Inc.(1),* | | 9,300 | | | 157,449 |
|
| NeuStar, Inc., Class A* | | 18,600 | | | 446,586 |
|
| Sprint Nextel Corp. | | 731,194 | | | 6,376,012 |
|
| | | | | | 11,829,731 |
|
| Electric utilities—1.58% | | | | | |
| American Electric Power Co., Inc. | | 73,200 | | | 2,857,728 |
|
| Exelon Corp. | | 56,800 | | | 4,314,528 |
|
| Pepco Holdings, Inc. | | 57,200 | | | 1,450,020 |
|
| | | | | | 8,622,276 |
|
| Electrical equipment—0.06% | | | | | |
| General Cable Corp.* | | 6,700 | | | 329,774 |
|
| Electronic equipment & instruments—0.14% | | | |
| Daktronics, Inc. | | 22,200 | | | 389,166 |
|
| Regal-Beloit Corp. | | 8,200 | | | 384,990 |
|
| | | | | | 774,156 |
|
| Energy equipment & services—3.77% | | | | | |
| Baker Hughes, Inc. | | 95,300 | | | 7,624,953 |
|
| Cameron International Corp.* | | 12,100 | | | 563,739 |
|
| GulfMark Offshore, Inc.* | | 4,700 | | | 235,470 |
|
| Halliburton Co. | | 192,800 | | | 8,471,632 |
|
| Oil States International, Inc.* | | 10,300 | | | 572,989 |
|
| Schlumberger Ltd. | | 15,100 | | | 1,422,722 |
|
| TETRA Technologies, Inc.* | | 31,700 | | | 701,838 |
|
| Weatherford International Ltd.* | | 26,200 | | | 1,010,796 |
|
| | | | | | 20,604,139 |
|
| Food & drug retailing—0.86% | | | | | |
| PetMed Express, Inc.(1),* | | 24,100 | | | 343,184 |
|
| Sysco Corp. | | 136,200 | | | 4,335,246 |
|
| | | | | | 4,678,430 |
|
16
UBS U.S. Allocation Fund
Portfolio of investments—August 31, 2008
Common stocks—(continued)
| Security description | | Shares | | | Value |
|
| Food products—0.14% | | | | | |
| Campbell Soup Co. | | 9,600 | | | $353,376 |
|
| Fresh Del Monte Produce, Inc.* | | 9,000 | | | 208,890 |
|
| Maui Land & Pineapple Co., Inc.* | | 3,977 | | | 106,703 |
|
| Reddy Ice Holdings, Inc.(1) | | 12,500 | | | 105,250 |
|
| | | | | | 774,219 |
|
| Gas utilities—1.12% | | | | | |
| NiSource, Inc. | | 87,400 | | | 1,440,352 |
|
| Sempra Energy | | 69,500 | | | 4,025,440 |
|
| Southwestern Energy Co.* | | 16,500 | | | 633,105 |
|
| | | | | | 6,098,897 |
|
| Health care equipment & supplies—3.68% | | | | | |
| Advanced Medical Optics, Inc.(1),* | | 18,600 | | | 402,318 |
|
| Align Technology, Inc.(1),* | | 23,600 | | | 307,744 |
|
| AngioDynamics, Inc.* | | 17,800 | | | 292,454 |
|
| Baxter International, Inc. | | 21,900 | | | 1,483,944 |
|
| Becton, Dickinson & Co. | | 6,200 | | | 541,756 |
|
| CONMED Corp.(1),* | | 15,600 | | | 498,576 |
|
| Covidien Ltd. | | 56,100 | | | 3,033,327 |
|
| Edwards Lifesciences Corp.* | | 3,700 | | | 219,077 |
|
| Medical Action Industries, Inc.* | | 20,800 | | | 273,936 |
|
| Medtronic, Inc. | | 87,600 | | | 4,782,960 |
|
| Mentor Corp.(1) | | 10,300 | | | 254,204 |
|
| Millipore Corp.* | | 33,400 | | | 2,505,334 |
|
| Orthofix International NV(1),* | | 16,200 | | | 392,688 |
|
| Stryker Corp. | | 20,100 | | | 1,350,519 |
|
| The Cooper Cos., Inc.(1) | | 6,600 | | | 243,078 |
|
| Zimmer Holdings, Inc.* | | 48,600 | | | 3,518,154 |
|
| | | | | | 20,100,069 |
|
| Security description | | Shares | | | Value |
|
| Health care providers & services—1.33% | | | | | |
| DaVita, Inc.* | | 28,900 | | | $1,658,571 |
|
| Express Scripts, Inc.* | | 10,200 | | | 748,782 |
|
| Laboratory Corp. of America Holdings* | | 22,800 | | | 1,667,820 |
|
| Pharmaceutical Product Development, Inc. (PPD) | | 29,358 | | | 1,197,806 |
|
| PSS World Medical, Inc.* | | 25,200 | | | 460,404 |
|
| UnitedHealth Group, Inc. | | 51,000 | | | 1,552,950 |
|
| | | | | | 7,286,333 |
|
| Hotels, restaurants & leisure—2.78% | | | | | |
| Carnival Corp. | | 119,800 | | | 4,439,788 |
|
| International Game Technology | | 38,100 | | | 816,483 |
|
| Life Time Fitness, Inc.(1),* | | 10,400 | | | 367,640 |
|
| Royal Caribbean Cruises Ltd.(1) | | 57,800 | | | 1,571,004 |
|
| Starbucks Corp.* | | 183,800 | | | 2,859,928 |
|
| Starwood Hotels & Resorts Worldwide, Inc. | | 78,100 | | | 2,831,125 |
|
| Wynn Resorts Ltd.(1) | | 24,000 | | | 2,290,080 |
|
| | | | | | 15,176,048 |
|
| Household durables—0.70% | | | | | |
| Fortune Brands, Inc. | | 53,900 | | | 3,170,398 |
|
| Interface, Inc., Class A | | 33,600 | | | 442,512 |
|
| Tempur-Pedic International, Inc.(1) | | 20,900 | | | 236,379 |
|
| | | | | | 3,849,289 |
|
| Household products—0.27% | | | | | |
| Colgate-Palmolive Co. | | 9,400 | | | 714,682 |
|
| Prestige Brands Holdings, Inc.* | | 31,900 | | | 303,050 |
|
| Procter & Gamble Co. | | 6,300 | | | 439,551 |
|
| | | | | | 1,457,283 |
|
| Industrial conglomerates—1.73% | | | | | |
| General Electric Co. | | 335,700 | | | 9,433,170 |
|
17
UBS U.S. Allocation Fund
Portfolio of investments—August 31, 2008
Common stocks—(continued)
| Security description | | Shares | | | Value |
|
| Insurance—2.42% | | | | | |
| ACE Ltd. | | 42,500 | | | $2,235,925 |
|
| AFLAC, Inc. | | 97,900 | | | 5,550,930 |
|
| Hartford Financial Services Group, Inc. | | 53,200 | | | 3,355,856 |
|
| Prudential Financial, Inc. | | 17,100 | | | 1,260,441 |
|
| Tower Group, Inc. | | 20,100 | | | 421,095 |
|
| Validus Holdings Ltd. | | 16,400 | | | 391,304 |
|
| | | | | | 13,215,551 |
|
| Internet & catalog retail—0.33% | | | | | |
| Amazon.com, Inc.* | | 20,200 | | | 1,632,362 |
|
| NutriSystem, Inc. | | 7,500 | | | 149,025 |
|
| | | | | | 1,781,387 |
|
| Internet software & services—0.82% | | | | | |
| Art Technology Group, Inc.* | | 104,100 | | | 426,810 |
|
| Google, Inc., Class A* | | 5,200 | | | 2,409,108 |
|
| Nortel Networks Corp.* | | 24,904 | | | 150,171 |
|
| RightNow Technologies, Inc.* | | 22,300 | | | 334,277 |
|
| TheStreet.com, Inc. | | 46,200 | | | 328,020 |
|
| ValueClick, Inc.* | | 23,800 | | | 306,782 |
|
| Websense, Inc.* | | 24,000 | | | 543,360 |
|
| | | | | | 4,498,528 |
|
| IT consulting & services—0.27% | | | | | |
| Automatic Data Processing, Inc. | | 22,100 | | | 980,798 |
|
| CACI International, Inc., Class A* | | 10,100 | | | 511,565 |
|
| | | | | | 1,492,363 |
|
| Machinery—2.62% | | | | | |
| Chart Industries, Inc.* | | 9,105 | | | 420,469 |
|
| Illinois Tool Works, Inc. | | 137,200 | | | 6,806,492 |
|
| PACCAR, Inc. | | 105,100 | | | 4,525,606 |
|
| Pall Corp. | | 62,700 | | | 2,546,247 |
|
| | | | | | 14,298,814 |
|
| Security description | | Shares | | | Value |
|
| Marine—0.04% | | | | | |
| Hornbeck Offshore Services, Inc.* | | 5,500 | | | $242,330 |
|
| Media—3.67% | | | | | |
| Cinemark Holdings, Inc.(1) | | 29,900 | | | 439,231 |
|
| Comcast Corp., Class A | | 382,500 | | | 8,101,350 |
|
| Interpublic Group of Cos., Inc.* | | 380,600 | | | 3,577,640 |
|
| News Corp., Class A | | 303,100 | | | 4,291,896 |
|
| Omnicom Group, Inc.(1) | | 86,300 | | | 3,658,257 |
|
| | | | | | 20,068,374 |
|
| Metals & mining—0.93% | | | | | |
| Brush Engineered Materials, Inc.* | | 9,300 | | | 272,490 |
|
| CONSOL Energy, Inc. | | 12,700 | | | 859,917 |
|
| Freeport-McMoRan Copper & Gold, Inc. | | 3,900 | | | 348,348 |
|
| Haynes International, Inc.(1),* | | 8,700 | | | 508,602 |
|
| Peabody Energy Corp. | | 49,500 | | | 3,116,025 |
|
| | | | | | 5,105,382 |
|
| Multi-line retail—0.27% | | | | | |
| Target Corp. | | 27,600 | | | 1,463,352 |
|
| Oil & gas—2.96% | | | | | |
| Chesapeake Energy Corp. | | 7,600 | | | 367,840 |
|
| Chevron Corp. | | 55,700 | | | 4,808,024 |
|
| EOG Resources, Inc. | | 24,000 | | | 2,506,080 |
|
| Equitable Resources, Inc. | | 6,700 | | | 334,397 |
|
| Marathon Oil Corp. | | 82,700 | | | 3,727,289 |
|
| Sunoco, Inc. | | 37,600 | | | 1,668,688 |
|
| Tesoro Corp.(1) | | 78,900 | | | 1,463,595 |
|
| Ultra Petroleum Corp.* | | 5,400 | | | 368,010 |
|
| XTO Energy, Inc. | | 18,550 | | | 935,105 |
|
| | | | | | 16,179,028 |
|
18
UBS U.S. Allocation Fund
Portfolio of investments—August 31, 2008
Common stocks—(continued)
| Security description | | Shares | | | Value |
|
| Pharmaceuticals—6.23% | | | | | |
| Abbott Laboratories | | 7,000 | | | $402,010 |
|
| Allergan, Inc. | | 112,800 | | | 6,302,136 |
|
| Cephalon, Inc.* | | 13,700 | | | 1,049,694 |
|
| Johnson & Johnson | | 98,664 | | | 6,948,905 |
|
| Medco Health Solutions, Inc.* | | 106,700 | | | 4,998,895 |
|
| Schering-Plough Corp. | | 231,200 | | | 4,485,280 |
|
| Wyeth | | 227,900 | | | 9,863,512 |
|
| | | | | | 34,050,432 |
|
| Real estate—0.27% | | | | | |
| American Campus Communities, Inc.(1) | | 8,700 | | | 263,784 |
|
| Capstead Mortgage Corp.(1) | | 13,300 | | | 156,142 |
|
| DiamondRock Hospitality Co. | | 24,800 | | | 228,408 |
|
| Digital Realty Trust, Inc. | | 4,600 | | | 211,002 |
|
| Entertainment Properties Trust | | 6,700 | | | 363,609 |
|
| Hatteras Financial Corp. | | 9,900 | | | 245,025 |
|
| | | | | | 1,467,970 |
|
| Road & rail—1.60% | | | | | |
| Burlington Northern Santa Fe Corp. | | 61,100 | | | 6,562,140 |
|
| Kansas City Southern* | | 13,800 | | | 709,734 |
|
| Knight Transportation, Inc.(1) | | 16,600 | | | 296,974 |
|
| Old Dominion Freight Line, Inc.* | | 8,500 | | | 282,795 |
|
| Union Pacific Corp. | | 11,000 | | | 922,900 |
|
| | | | | | 8,774,543 |
|
| Semiconductor equipment & products—4.27% | | | |
| Analog Devices, Inc. | | 177,000 | | | 4,948,920 |
|
| Broadcom Corp., Class A* | | 88,800 | | | 2,136,528 |
|
| Intel Corp. | | 528,200 | | | 12,079,934 |
|
| Security description | | Shares | | | Value |
|
| Semiconductor equipment & products—(concluded) | | |
| ON Semiconductor Corp.* | | 54,100 | | | $512,327 |
|
| Xilinx, Inc. | | 140,700 | | | 3,655,386 |
|
| | | | | | 23,333,095 |
|
| Software—3.23% | | | | | |
| Innerworkings, Inc.(1),* | | 32,800 | | | 389,008 |
|
| Intuit, Inc.* | | 119,900 | | | 3,605,393 |
|
| Microsoft Corp. | | 275,900 | | | 7,529,311 |
|
| Nuance Communications, Inc.(1),* | | 23,600 | | | 372,880 |
|
| Quest Software, Inc.* | | 14,400 | | | 212,976 |
|
| Secure Computing Corp.* | | 28,400 | | | 121,552 |
|
| Smith Micro Software, Inc.(1),* | | 23,300 | | | 176,381 |
|
| Symantec Corp.* | | 123,373 | | | 2,752,452 |
|
| Synchronoss Technologies, Inc.(1),* | | 10,900 | | | 137,994 |
|
| VASCO Data Security International, Inc.* | | 24,400 | | | 337,208 |
|
| VMware, Inc., Class A* | | 51,700 | | | 2,052,490 |
|
| | | | | | 17,687,645 |
|
| Specialty retail—0.84% | | | | | |
| Abercrombie & Fitch Co., Class A | | 12,800 | | | 671,360 |
|
| Casual Male Retail Group, Inc.(1),* | | 49,900 | | | 190,618 |
|
| Hibbett Sports, Inc.(1),* | | 22,800 | | | 544,920 |
|
| Interline Brands, Inc.* | | 30,100 | | | 483,105 |
|
| J. Crew Group, Inc.(1),* | | 29,700 | | | 784,377 |
|
| Movado Group, Inc. | | 18,756 | | | 434,952 |
|
| PetSmart, Inc. | | 11,500 | | | 310,155 |
|
| Rush Enterprises, Inc., Class A* | | 10,500 | | | 138,495 |
|
| Susser Holdings Corp.(1),* | | 9,500 | | | 177,745 |
|
19
UBS U.S. Allocation Fund
Portfolio of investments—August 31, 2008
Common stocks—(continued)
| Security description | | Shares | | | Value |
|
| Specialty retail—(concluded) | | | | | |
| The Sherwin-Williams Co. | | 12,700 | | | $743,585 |
|
| United Rentals, Inc.* | | 6,600 | | | 106,854 |
|
| | | | | | 4,586,166 |
|
| Textiles & apparel—0.39% | | | | | |
| Coach, Inc.* | | 59,400 | | | 1,722,006 |
|
| Steven Madden Ltd.* | | 15,400 | | | 387,310 |
|
| | | | | | 2,109,316 |
|
| Security description | | Shares | | | Value |
|
| Wireless telecommunication services—0.08% |
| American Tower Corp., Class A* | | 10,800 | | | $446,364 |
|
| Total common stocks | | | | | |
| (cost—$416,163,032) | | | | | 402,333,040 |
|
20
UBS U.S. Allocation Fund
Portfolio of investments—August 31, 2008
| | Face | | | |
| Security description | amount | | Value |
|
| US government obligations—4.18% | | | | | |
|
| US Treasury Bonds, | | | | | |
4.750%, due 02/15/37 | $ | 2,775,000 | | | $2,916,353 |
|
5.375%, due 02/15/31 | | 2,600,000 | | | 2,932,719 |
|
8.125%, due 08/15/19 | | 335,000 | | | 453,428 |
|
| US Treasury Inflation Index Notes (TIPS), | | | | | |
2.000%, due 01/15/16 | | 5,516,061 | | | 5,697,489 |
|
2.375%, due 04/15/11 | | 3,008,624 | | | 3,117,217 |
|
| US Treasury Notes, | | | | | |
1.750%, due 03/31/10 | | 2,105,000 | | | 2,089,869 |
|
3.500%, due 05/31/13 | | 690,000 | | | 703,639 |
|
3.875%, due 05/15/18 | | 150,000 | | | 150,879 |
|
4.625%, due 02/15/17(1) | | 4,500,000 | | | 4,809,375 |
|
| Total US government obligations (cost—$22,779,957) | | | | | 22,870,968 |
|
| Mortgage & agency debt securities—9.50% | | | | | |
|
| Banc of America Funding Corp., | | | | | |
Series 2006-H, Class B1, | | | | | |
6.079%, due 09/20/46(2) | | 2,379,118 | | | 401,357 |
|
| Bear Stearns Adjustable Rate Mortgage Trust, | | | | | |
Series 2005-1, Class 4A1, | | | | | |
5.345%, due 03/25/35 | | 958,404 | | | 843,191 |
|
Series 2007-3, Class 2A1, | | | | | |
5.632%, due 05/25/47 | | 2,554,093 | | | 2,160,105 |
|
| Countrywide Alternative Loan Trust, | | | | | |
Series 2005-J2, Class 2A1, | | | | | |
7.500%, due 12/25/34 | | 695,973 | | | 525,677 |
|
| Federal Home Loan Mortgage Corporation Certificates,** | | | | | |
5.500%, due 04/01/18 | | 21,663 | | | 22,040 |
|
5.500%, due 03/01/37 | | 1,934,599 | | | 1,909,270 |
|
5.500%, due 05/01/37 | | 3,051,913 | | | 3,011,956 |
|
6.000%, due 03/01/32 | | 5,080 | | | 5,171 |
|
6.500%, due 08/01/28 | | 1,096,716 | | | 1,137,997 |
|
6.500%, due 04/01/29 | | 15,034 | | | 15,591 |
|
| Federal Home Loan Mortgage Corporation Certificates ARM,** | | | | | |
5.140%, due 05/01/37 | | 2,138,243 | | | 2,141,826 |
|
5.361%, due 03/01/37 | | 1,961,114 | | | 1,979,412 |
|
| Federal Home Loan Mortgage Corporation Certificates TBA,** | | | | | |
5.000%, TBA | | 1,600,000 | | | 1,537,000 |
|
21
UBS U.S. Allocation Fund
Portfolio of investments—August 31, 2008
| | Face | | | |
| Security description | amount | | Value |
|
| Mortgage & agency debt securities—(continued) | | | | | |
|
| Federal National Mortgage Association Certificates,** | | | | | |
3.500%, due 04/28/11 | | $1,945,000 | | | $1,941,828 |
|
3.875%, due 07/12/13 | | 330,000 | | | 328,399 |
|
5.000%, due 10/15/10 | | 1,760,000 | | | 1,764,143 |
|
5.250%, due 08/01/12 | | 195,000 | | | 180,140 |
|
5.500%, due 07/01/33 | | 1,590,638 | | | 1,579,753 |
|
6.000%, due 06/01/33 | | 11,214 | | | 11,426 |
|
6.000%, due 04/01/38 | | 1,083,182 | | | 1,094,726 |
|
6.000%, due 06/01/38 | | 1,066,748 | | | 1,078,116 |
|
6.500%, due 03/01/17 | | 746,323 | | | 776,321 |
|
7.000%, due 08/01/32 | | 981,321 | | | 1,034,154 |
|
7.500%, due 05/01/31 | | 7,281 | | | 7,913 |
|
7.500%, due 02/01/33 | | 13,253 | | | 14,289 |
|
| Federal National Mortgage Association Certificates TBA,** | | | | | |
5.000%, TBA | | 2,225,000 | | | 2,138,781 |
|
5.500%, TBA | | 6,620,000 | | | 6,537,250 |
|
6.000%, TBA | | 3,310,000 | | | 3,342,067 |
|
| FHLMC REMIC, Series T-42, Class A5,** | | | | | |
7.500%, due 02/25/42 | | 1,724,671 | | | 1,859,570 |
|
| First Horizon Mortgage Pass-Through Trust, | | | | | |
Series 2004-FL1, Class 1A1, | | | | | |
2.742%, due 02/25/35(2) | | 151,140 | | | 134,190 |
|
Series 2007-AR2, Class 1A1, | | | | | |
5.850%, due 06/25/37(2) | | 1,678,032 | | | 1,574,791 |
|
| FNMA REMIC,** | | | | | |
Series 2004-W1, Class 3A, | | | | | |
5.855%, due 01/25/43(2) | | 2,554,242 | | | 2,531,864 |
|
| Government National Mortgage Association Certificates, | | | | | |
6.500%, due 10/15/24 | | 1,575,903 | | | 1,629,424 |
|
6.500%, due 10/15/28 | | 11,017 | | | 11,428 |
|
6.500%, due 04/15/31 | | 687,978 | | | 713,127 |
|
7.000%, due 04/15/26 | | 6,736 | | | 7,181 |
|
| Government National Mortgage Association Certificates II, | | | | | |
6.000%, due 11/20/28 | | 4,742 | | | 4,834 |
|
6.000%, due 02/20/29 | | 10,434 | | | 10,633 |
|
6.000%, due 02/20/34 | | 2,304,949 | | | 2,341,172 |
|
| Government National Mortgage Association Certificates TBA, | | | | | |
5.000%, TBA | | 1,100,000 | | | 1,073,532 |
|
22
UBS U.S. Allocation Fund
Portfolio of investments—August 31, 2008
| | Face | | | |
| Security description | amount | | Value |
|
| Mortgage & agency debt securities—(concluded) | | | | | |
|
| Washington Mutual Mortgage Pass-Through Certificates, | | | | | |
Series 2002-AR17, Class 1A, | | | | | |
4.279%, due 11/25/42(2) | | $797,560 | | | $612,377 |
|
Series 2007-HY7, Class LB1, | | | | | |
5.853%, due 07/25/37(2) | | 1,172,998 | | | 308,905 |
|
| Wells Fargo Mortgage Backed Securities Trust, | | | | | |
Series 2007-10, Class 1A1, | | | | | |
6.000%, due 07/25/37 | | 714,794 | | | 578,760 |
|
Series 2007-11, Class B1, | | | | | |
6.000%, due 08/25/37 | | 2,384,438 | | | 1,042,590 |
|
| Total mortgage & agency debt securities (cost—$56,932,339) | | | | | 51,954,277 |
|
| Commercial mortgage-backed securities—1.59% | | | | | |
|
| American Home Mortgage Investment Trust, | | | | | |
2.662%, due 11/25/35(2) | | 251,943 | | | 93,143 |
|
| Bear Stearns Commercial Mortgage Securities, | | | | | |
Series 2006-PW14, Class B, | | | | | |
5.333%, due 12/11/38(3) | | 375,000 | | | 246,097 |
|
| Citigroup Commercial Mortgage Trust, | | | | | |
Series 2006-C5, Class A4, | | | | | |
5.431%, due 10/15/49 | | 1,050,000 | | | 958,983 |
|
| Greenwich Capital Commercial Funding Corp., | | | | | |
Series 2006-RR1, Class A1, | | | | | |
5.961%, due 03/18/49(2),(3) | | 3,500,000 | | | 2,100,000 |
|
| GS Mortgage Securities Corp. II, | | | | | |
Series 2006-CC1, Class A, | | | | | |
5.504%, due 03/21/46(2),(3) | | 3,406,426 | | | 1,873,534 |
|
Series 2006-RR2, Class A1, | | | | | |
5.814%, due 06/23/46(2),(3) | | 3,119,994 | | | 1,871,996 |
|
| JP Morgan Chase Commercial Mortgage Securities Corp., | | | | | |
Series 2006-LDP8, Class A4, | | | | | |
5.399%, due 05/15/45 | | 1,350,000 | | | 1,231,848 |
|
Series 2007-LDPX, Class B, | | | | | |
5.582%, due 05/15/49(2),(3) | | 175,000 | | | 103,881 |
|
| Merrill Lynch/Countrywide Commercial Mortgage Trust, | | | | | |
Series 2006-3, Class B, | | | | | |
5.525%, due 07/12/46(2) | | 275,000 | | | 185,027 |
|
| Total commercial mortgage-backed securities (cost—$13,282,193) | | | | | 8,664,509 |
|
23
UBS U.S. Allocation Fund
Portfolio of investments—August 31, 2008
| | | Face | | | |
| Security description | | amount | | Value |
|
| Asset-backed securities—0.28% | | | | | |
|
| Countrywide Asset-Backed Certificates, | | | | | |
Series 2004-SD1, Class A1, | | | | | |
2.812%, due 06/25/33(2),(3) | | $8,379 | | | $7,293 |
|
| Fieldstone Mortgage Investment Corp., | | | | | |
Series 2006-S1, Class A, | | | | | |
2.692%, due 01/25/37(2),(3) | | 522,647 | | | 73,171 |
|
| GSAMP Trust, Series 2006-S5, Class A2, | | | | | |
5.658%, due 12/12/36(4),(5) | | 296,048 | | | 29,605 |
|
| Home Equity Mortgage Trust, | | | | | |
Series 2006-3, Class A1, | | | | | |
5.472%, due 09/25/36(4) | | 195,961 | | | 63,687 |
|
Series 2006-4, Class A2, | | | | | |
5.730%, due 11/25/36(4) | | 2,000,000 | | | 320,000 |
|
Series 2006-5, Class A1, | | | | | |
5.500%, due 01/25/37(4) | | 523,979 | | | 136,477 |
|
Series 2006-6, Class 2A1, | | | | | |
2.572%, due 03/25/37(2) | | 186,751 | | | 36,370 |
|
| Merrill Lynch First Franklin Mortgage Loan, | | | | | |
Series 2007-A, Class A1, | | | | | |
3.572%, due 09/25/27(2) | | 131,620 | | | 121,644 |
|
| Merrill Lynch Mortgage Investors Trust, | | | | | |
Series 2006-SL1, Class A, | | | | | |
2.652%, due 09/25/36(2) | | 120,474 | | | 48,340 |
|
| Morgan Stanley Mortgage Loan Trust, | | | | | |
Series 2006-14SL, Class A1, | | | | | |
2.632%, due 11/25/36(2) | | 353,430 | | | 106,029 |
|
| Nomura Asset Acceptance Corp., | | | | | |
Series 2006-S4, Class A1, | | | | | |
2.642%, due 08/25/36(2) | | 376,691 | | | 67,804 |
|
| SACO I Trust, | | | | | |
Series 2006-5, Class 2A1, | | | | | |
2.622%, due 05/25/36(2) | | 515,255 | | | 120,393 |
|
| Washington Mutual Master Note Trust, | | | | | |
Series 2007-A5A, Class A5, | | | | | |
3.217%, due 10/15/14(2),(3) | | 450,000 | | | 404,508 |
|
| Total asset-backed securities (cost—$5,515,135) | | | | | 1,535,321 |
|
| Collateralized debt obligation—0.05% | | | | | |
|
| Rutland Rated Investments, CDO, | | | | | |
Series DRYD-1A, Class A6, | | | | | |
6.957%, due 06/20/13(6) (cost—$645,000) | | 645,000 | | | 249,031 |
|
24
UBS U.S. Allocation Fund
Portfolio of investments—August 31, 2008
| | Face | | | |
| Security description | amount | | Value |
|
| Corporate bonds—6.73% | | | | | |
|
| Aerospace & defense—0.12% | | | | | |
| DAE Aviation Holdings | | | | | |
11.250%, due 08/01/15(3) | | $236,000 | | | $227,740 |
|
| Esterline Technologies Corp. | | | | | |
6.625%, due 03/01/17 | | 155,000 | | | 150,350 |
|
| Hawker Beechcraft Acquisition Co. | | | | | |
8.875%, due 04/01/15 | | 250,000 | | | 249,375 |
|
| | | | | | 627,465 |
|
| Agriculture—0.03% | | | | | |
| American Rock Salt Co. LLC | | | | | |
9.500%, due 03/15/14 | | 150,000 | | | 157,500 |
|
| Automobile OEM—0.65% | | | | | |
| Ford Capital BV | | | | | |
9.500%, due 06/01/10 | | 100,000 | | | 83,250 |
|
| Ford Motor Credit Co. | | | | | |
5.800%, due 01/12/09 | | 1,800,000 | | | 1,766,205 |
|
7.375%, due 10/28/09 | | 750,000 | | | 697,068 |
|
| General Motors | | | | | |
7.200%, due 01/15/11(1) | | 300,000 | | | 192,750 |
|
| General Motors Acceptance Corp. | | | | | |
6.875%, due 09/15/11 | | 800,000 | | | 496,432 |
|
7.250%, due 03/02/11 | | 500,000 | | | 333,616 |
|
| | | | | | 3,569,321 |
|
| Banking-non-US—0.12% | | | | | |
| Abbey National PLC | | | | | |
7.950%, due 10/26/29 | | 275,000 | | | 284,771 |
|
| Royal Bank of Scotland Group PLC | | | | | |
7.640%, due 09/29/17(7),(8) | | 200,000 | | | 168,951 |
|
9.118%, due 03/31/10(7) | | 200,000 | | | 200,567 |
|
| | | | | | 654,289 |
|
| Banking-US—0.54% | | | | | |
| Bank of America Corp. | | | | | |
5.420%, due 03/15/17 | | 700,000 | | | 622,224 |
|
| Citigroup, Inc. | | | | | |
6.125%, due 05/15/18 | | 550,000 | | | 514,224 |
|
6.875%, due 03/05/38 | | 265,000 | | | 255,461 |
|
| JP Morgan Chase & Co. | | | | | |
6.400%, due 05/15/38 | | 150,000 | | | 139,320 |
|
25
UBS U.S. Allocation Fund
Portfolio of investments—August 31, 2008
| | Face | | | |
| Security description | amount | | Value |
|
| Corporate bonds—(continued) | | | | | |
|
| Banking-US—(concluded) | | | | | |
| Wachovia Corp. | | | | | |
5.300%, due 10/15/11 | $ | 525,000 | | | $493,084 |
|
| Washington Mutual Bank NV | | | | | |
3.230%, due 05/20/13(2) | | 300,000 | | | 191,351 |
|
| Washington Mutual, Inc. | | | | | |
5.500%, due 01/15/13 | | 585,000 | | | 386,100 |
|
| Washington Mutual Preferred IV | | | | | |
9.750%, due 12/15/17(3),(7),(8) | | 200,000 | | | 90,000 |
|
| Wells Fargo Bank N.A. | | | | | |
5.950%, due 08/26/36 | | 310,000 | | | 278,280 |
|
| | | | | | 2,970,044 |
|
| Broadcast—0.08% | | | | | |
| CMP Susquehanna | | | | | |
9.875%, due 05/15/14 | | 125,000 | | | 78,125 |
|
| Nexstar Finance Holdings LLC, Inc. | | | | | |
11.375%, due 04/01/13(4) | | 207,734 | | | 186,960 |
|
| Nexstar Finance, Inc. | | | | | |
7.000%, due 01/15/14 | | 100,000 | | | 82,000 |
|
| Univision Communications, Inc. | | | | | |
9.750%, due 03/15/15(3) | | 100,000 | | | 71,500 |
|
| | | | | | 418,585 |
|
| Brokerage—0.31% | | | | | |
| Bear Stearns Co., Inc. | | | | | |
7.250%, due 02/01/18 | | 360,000 | | | 373,007 |
|
| Goldman Sachs Group, Inc. | | | | | |
6.150%, due 04/01/18 | | 205,000 | | | 196,096 |
|
6.750%, due 10/01/37 | | 100,000 | | | 87,986 |
|
| Lehman Brothers Holdings*** | | | | | |
7.000%, due 09/27/27 | | 180,000 | | | 160,504 |
|
| Lehman Brothers Holdings MTN*** | | | | | |
6.750%, due 12/28/17 | | 250,000 | | | 224,214 |
|
6.875%, due 05/02/18 | | 130,000 | | | 121,033 |
|
| Merrill Lynch & Co. | | | | | |
5.700%, due 05/02/17 | | 105,000 | | | 88,877 |
|
| Merrill Lynch & Co. MTN | | | | | |
6.875%, due 04/25/18 | | 135,000 | | | 124,336 |
|
26
UBS U.S. Allocation Fund
Portfolio of investments—August 31, 2008
| | Face | | | |
| Security description | amount | | Value |
|
| Corporate bonds—(continued) | | | | | |
|
| Brokerage—(concluded) | | | | | |
| Morgan Stanley MTN | | | | | |
6.625%, due 04/01/18 | $ | 350,000 | | | $325,193 |
|
| | | | | | 1,701,246 |
|
| Building materials—0.14% | | | | | |
| Ahern Rentals, Inc. | | | | | |
9.250%, due 08/15/13 | | 225,000 | | | 145,125 |
|
| Dayton Superior Corp. | | | | | |
13.000%, due 06/15/09 | | 135,000 | | | 110,700 |
|
| Interface, Inc. | | | | | |
10.375%, due 02/01/10 | | 100,000 | | | 105,000 |
|
| US Concrete, Inc. | | | | | |
8.375%, due 04/01/14 | | 450,000 | | | 373,500 |
|
| | | | | | 734,325 |
|
| Business services—0.02% | | | | | |
| Da-Lite Screen Co., Inc. | | | | | |
9.500%, due 05/15/11 | | 125,000 | | | 120,000 |
|
| Cable—0.15% | | | | | |
| Comcast Corp. | | | | | |
6.300%, due 11/15/17 | | 490,000 | | | 486,105 |
|
| Mediacom LLC/Mediacom Capital Corp. | | | | | |
9.500%, due 01/15/13 | | 150,000 | | | 145,125 |
|
| Time Warner Cable, Inc. | | | | | |
6.750%, due 07/01/18 | | 195,000 | | | 196,870 |
|
| | | | | | 828,100 |
|
| Chemicals—0.04% | | | | | |
| Airgas, Inc. | | | | | |
7.125%, due 10/01/18(3) | | 51,000 | | | 51,510 |
|
| Momentive Performance | | | | | |
9.750%, due 12/01/14 | | 50,000 | | | 45,125 |
|
10.125%, due 12/01/14 | | 100,000 | | | 87,500 |
|
| Montell Finance Co. BV | | | | | |
8.100%, due 03/15/27(3) | | 75,000 | | | 38,250 |
|
| | | | | | 222,385 |
|
| Commercial services & supplies—0.15% | | | | | |
| United Rentals N.A., Inc. | | | | | |
6.500%, due 02/15/12 | | 490,000 | | | 437,325 |
|
7.750%, due 11/15/13 | | 100,000 | | | 79,000 |
|
27
UBS U.S. Allocation Fund
Portfolio of investments—August 31, 2008
| | Face | | | |
| Security description | amount | | Value |
|
| Corporate bonds—(continued) | | | | | |
|
| Commercial services & supplies—(concluded) | | | | | |
| Xerox Capital Trust I | | | | | |
8.000%, due 02/01/27 | $ | 300,000 | | $ | 285,647 |
|
| | | | | | 801,972 |
|
| Consumer products—0.05% | | | | | |
| Fortune Brands, Inc. | | | | | |
5.375%, due 01/15/16 | | 305,000 | | | 278,338 |
|
| Containers & packaging—0.13% | | | | | |
| Exopack Holding Corp. | | | | | |
11.250%, due 02/01/14 | | 50,000 | | | 43,875 |
|
| Jefferson Smurfit Corp. | | | | | |
8.250%, due 10/01/12 | | 125,000 | | | 108,750 |
|
| Owens-Illinois, Inc. | | | | | |
7.500%, due 05/15/10 | | 150,000 | | | 153,375 |
|
| Stone Container Finance | | | | | |
7.375%, due 07/15/14 | | 500,000 | | | 402,500 |
|
| | | | | | 708,500 |
|
| Diversified manufacturing—0.09% | | | | | |
| Harland Clarke Holdings | | | | | |
7.554%, due 05/15/15(2) | | 500,000 | | | 352,500 |
|
| SPX Corp. | | | | | |
7.625%, due 12/15/14(3) | | 120,000 | | | 123,300 |
|
| | | | | | 475,800 |
|
| Electric utilities—0.71% | | | | | |
| AES Corp. | | | | | |
8.000%, due 06/01/20(3) | | 375,000 | | | 359,062 |
|
| Dominion Resources, Inc. | | | | | |
5.950%, due 06/15/35 | | 150,000 | | | 136,619 |
|
| DTE Energy Co. | | | | | |
6.350%, due 06/01/16 | | 250,000 | | | 249,004 |
|
| E. ON International Finance BV | | | | | |
5.800%, due 04/30/18(3) | | 175,000 | | | 172,271 |
|
| Edison Mission Energy | | | | | |
7.000%, due 05/15/17 | | 150,000 | | | 143,625 |
|
| Exelon Generation Co. LLC | | | | | |
5.350%, due 01/15/14 | | 395,000 | | | 381,343 |
|
| MidAmerican Energy Holdings | | | | | |
5.950%, due 05/15/37 | | 110,000 | | | 101,923 |
|
28
UBS U.S. Allocation Fund
Portfolio of investments—August 31, 2008
| | Face | | | |
| Security description | amount | | Value |
|
| Corporate bonds—(continued) | | | | | |
|
| Electric utilities—(concluded) | | | | | |
| Mirant Americas Generation LLC | | | | | |
8.300%, due 05/01/11 | $ | 300,000 | | | $306,000 |
|
9.125%, due 05/01/31 | | 175,000 | | | 152,031 |
|
| Mirant N.A. LLC | | | | | |
7.375%, due 12/31/13 | | 100,000 | | | 99,250 |
|
| NRG Energy, Inc. | | | | | |
7.375%, due 02/01/16 | | 150,000 | | | 148,125 |
|
7.375%, due 01/15/17 | | 125,000 | | | 122,188 |
|
| Pacific Gas & Electric Co. | | | | | |
6.050%, due 03/01/34 | | 170,000 | | | 163,227 |
|
| PSEG Power LLC | | | | | |
6.950%, due 06/01/12 | | 350,000 | | | 366,647 |
|
| Reliant Energy, Inc. | | | | | |
6.750%, due 12/15/14 | | 550,000 | | | 554,125 |
|
| Texas Competitive Electric Holdings LLC | | | | | |
10.250%, due 11/01/15(3) | | 450,000 | | | 448,875 |
|
| | | | | | 3,904,315 |
|
| Electronics—0.06% | | | | | |
| NXP BV/NXP Funding LLC | | | | | |
7.875%, due 10/15/14 | | 50,000 | | | 41,000 |
|
9.500%, due 10/15/15 | | 50,000 | | | 33,875 |
|
| Sanmina-SCI Corp. | | | | | |
5.526%, due 06/15/14(2),(3) | | 285,000 | | | 263,625 |
|
| | | | | | 338,500 |
|
| Energy—0.25% | | | | | |
| Anadarko Petroleum Corp. | | | | | |
5.950%, due 09/15/16 | | 100,000 | | | 97,450 |
|
| Atlas Pipeline Partners | | | | | |
8.750%, due 06/15/18(3) | | 50,000 | | | 48,750 |
|
| Canadian Natural Resources | | | | | |
6.750%, due 02/01/39 | | 240,000 | | | 236,084 |
|
| Gulfmark Offshore, Inc. | | | | | |
7.750%, due 07/15/14 | | 100,000 | | | 98,500 |
|
| Helix Energy Solutions | | | | | |
9.500%, due 01/15/16(3) | | 150,000 | | | 149,250 |
|
29
UBS U.S. Allocation Fund
Portfolio of investments—August 31, 2008
| | Face | | | |
| Security description | amount | | Value |
|
| Corporate bonds—(continued) | | | | | |
|
| Energy—(concluded) | | | | | |
| Key Energy Services, Inc. | | | | | |
8.375%, due 12/01/14(3) | | $70,000 | | | $70,525 |
|
| Newfield Exploration Co. | | | | | |
7.125%, due 05/15/18 | | 66,000 | | | 62,205 |
|
| Plains Exploration & Production | | | | | |
7.625%, due 06/01/18 | | 131,000 | | | 123,467 |
|
| Southwestern Energy Co. | | | | | |
7.500%, due 02/01/18(3) | | 50,000 | | | 51,125 |
|
| Transocean, Inc. | | | | | |
6.800%, due 03/15/38 | | 150,000 | | | 149,654 |
|
7.500%, due 04/15/31 | | 85,000 | | | 91,709 |
|
| Whiting Petroleum Corp. | | | | | |
7.250%, due 05/01/12 | | 200,000 | | | 193,000 |
|
| | | | | | 1,371,719 |
|
| Energy-integrated—0.07% | | | | | |
| PPL Energy Supply LLC | | | | | |
6.000%, due 12/15/36 | | 185,000 | | | 153,182 |
|
Series A | | | | | |
6.400%, due 11/01/11 | | 250,000 | | | 252,656 |
|
| | | | | | 405,838 |
|
| Energy-refining & marketing—0.07% | | | | | |
| Petroplus Finance Ltd. | | | | | |
7.000%, due 05/01/17(3) | | 100,000 | | | 88,750 |
|
| Valero Energy Corp. | | | | | |
6.625%, due 06/15/37 | | 175,000 | | | 154,411 |
|
7.500%, due 04/15/32 | | 140,000 | | | 135,189 |
|
| | | | | | 378,350 |
|
| Entertainment—0.09% | | | | | |
| Time Warner, Inc. | | | | | |
6.875%, due 05/01/12 | | 500,000 | | | 513,763 |
|
| Finance-noncaptive consumer—0.08% | | | | | |
| American General Finance | | | | | |
4.875%, due 07/15/12 | | 360,000 | | | 300,932 |
|
| Residential Capital LLC | | | | | |
8.125%, due 11/21/08(4) | | 105,000 | | | 93,975 |
|
9.625%, due 05/15/15(3) | | 49,000 | | | 16,170 |
|
| | | | | | 411,077 |
|
30
UBS U.S. Allocation Fund
Portfolio of investments—August 31, 2008
| | | Face | | | | | |
| Security description | | amount | | | Value | |
|
| Corporate bonds—(continued) | | | | | | | | |
|
| Food—0.02% | | | | | | | | |
| Ameriqual Group LLC | | | | | | | | |
9.000%, due 04/01/12(3) | | $ | 200,000 | | | | $130,000 | |
|
| Food processors/beverage/bottling—0.02% | | | | | | | | |
| SABMiller PLC | | | | | | | | |
6.500%, due 07/01/16(3) | | | 110,000 | | | | 111,709 | |
|
| Gaming—0.27% | | | | | | | | |
| Boyd Gaming Corp. | | | | | | | | |
7.750%, due 12/15/12 | | | 100,000 | | | | 90,250 | |
|
| Caesars Entertainment | | | | | | | | |
7.875%, due 03/15/10(1) | | | 300,000 | | | | 255,750 | |
|
| Circus & Eldorado | | | | | | | | |
10.125%, due 03/01/12 | | | 100,000 | | | | 91,500 | |
|
| FireKeepers Development Authority | | | | | | | | |
13.875%, due 05/01/15(3) | | | 56,000 | | | | 51,660 | |
|
| Harrah’s Operating Co., Inc. | | | | | | | | |
5.500%, due 07/01/10 | | | 400,000 | | | | 336,000 | |
|
| Jacobs Entertainment, Inc. | | | | | | | | |
9.750%, due 06/15/14 | | | 375,000 | | | | 266,250 | |
|
| Pokagon Gaming Authority | | | | | | | | |
10.375%, due 06/15/14(3) | | | 93,000 | | | | 96,952 | |
|
| River Rock Entertainment | | | | | | | | |
9.750%, due 11/01/11 | | | 150,000 | | | | 139,500 | |
|
| San Pasqual Casino | | | | | | | | |
8.000%, due 09/15/13(3) | | | 150,000 | | | | 136,500 | |
|
| Tropicana Entertainment LLC | | | | | | | | |
9.625%, due 12/15/14(9) | | | 50,000 | | | | 16,000 | |
|
| | | | | | | | 1,480,362 | |
|
| Health care—0.21% | | | | | | | | |
| Bausch & Lomb, Inc. | | | | | | | | |
9.875%, due 11/01/15(3) | | | 25,000 | | | | 25,688 | |
|
| CHS/Community Health Systems | | | | | | | | |
8.875%, due 07/15/15 | | | 500,000 | | | | 505,000 | |
|
| DaVita, Inc. | | | | | | | | |
7.250%, due 03/15/15 | | | 100,000 | | | | 98,375 | |
|
| HCA, Inc. | | | | | | | | |
9.125%, due 11/15/14 | | | 50,000 | | | | 51,375 | |
|
9.250%, due 11/15/16 | | | 50,000 | | | | 51,437 | |
|
| | | | | | | | | |
|
| | | | | | | | 31 |
UBS U.S. Allocation Fund
Portfolio of investments—August 31, 2008
| | | Face | | | | | |
| Security description | | amount | | | Value | |
|
| Corporate bonds—(continued) | | | | | | | | |
|
| Health care—(concluded) | | | | | | | | |
| Psychiatric Solutions | | | | | | | | |
7.750%, due 07/15/15 | | $ | 100,000 | | | | $97,000 | |
|
| UnitedHealth Group, Inc. | | | | | | | | |
6.000%, due 02/15/18 | | | 165,000 | | | | 158,003 | |
|
6.875%, due 02/15/38 | | | 175,000 | | | | 160,725 | |
|
| Universal Hospital Services | | | | | | | | |
8.500%, due 06/01/15 | | | 20,000 | | | | 19,900 | |
|
| | | | | | | | 1,167,503 | |
|
| Industrial-other—0.10% | | | | | | | | |
| Aramark Services, Inc. | | | | | | | | |
6.301%, due 02/01/15(2) | | | 500,000 | | | | 465,000 | |
|
| Tube City IMS Corp. | | | | | | | | |
9.750%, due 02/01/15 | | | 100,000 | | | | 93,500 | |
|
| | | | | | | | 558,500 | |
|
| Insurance-life—0.07% | | | | | | | | |
| Hartford Financial Services Group | | | | | | | | |
6.300%, due 03/15/18 | | | 195,000 | | | | 191,623 | |
|
| Hartford Financial Services Group MTN | | | | | | | | |
6.000%, due 01/15/19 | | | 205,000 | | | | 194,562 | |
|
| | | | | | | | 386,185 | |
|
| Machinery-agriculture & construction—0.05% | | | | | | | | |
| Clondalkin Acquisition | | | | | | | | |
4.776%, due 12/15/13(2),(3) | | | 330,000 | | | | 273,900 | |
|
| Media—0.11% | | | | | | | | |
| Affinion Group, Inc. | | | | | | | | |
10.125%, due 10/15/13 | | | 100,000 | | | | 98,500 | |
|
| Baker & Taylor, Inc. | | | | | | | | |
11.500%, due 07/01/13(3) | | | 75,000 | | | | 63,844 | |
|
| LIN Television Corp. | | | | | | | | |
6.500%, due 05/15/13 | | | 525,000 | | | | 430,500 | |
|
| | | | | | | | 592,844 | |
|
| Oil & gas—0.24% | | | | | | | | |
| Ferrellgas Partners LP | | | | | | | | |
6.750%, due 05/01/14(3) | | | 153,000 | | | | 133,110 | |
|
| Inergy LP/Inergy Finance | | | | | | | | |
8.250%, due 03/01/16 | | | 175,000 | | | | 164,500 | |
|
| | | | | | | | | |
|
| 32 | | | | | | | | |
UBS U.S. Allocation Fund
Portfolio of investments—August 31, 2008
| | | Face | | | | | |
| Security description | | amount | | | | Value | |
|
| Corporate bonds—(continued) | | | | | | | | |
|
| Oil & gas—(concluded) | | | | | | | | |
| Kinder Morgan Energy Partners | | | | | | | | |
5.800%, due 03/15/35 | | $ | 650,000 | | | | $553,755 | |
|
7.400%, due 03/15/31 | | | 115,000 | | | | 119,110 | |
|
| NGPL PipeCo LLC | | | | | | | | |
7.119%, due 12/15/17(3) | | | 75,000 | | | | 75,723 | |
|
| Nustar Logistics | | | | | | | | |
7.650%, due 04/15/18 | | | 240,000 | | | | 241,585 | |
|
| | | | | | | | 1,287,783 | |
|
| Paper & forest products—0.23% | | | | | | | | |
| Abitibi-Consolidated Co. of Canada | | | | | | | | |
15.500%, due 07/15/10(3) | | | 51,000 | | | | 38,505 | |
|
| Boise Cascade LLC | | | | | | | | |
7.125%, due 10/15/14 | | | 188,000 | | | | 121,260 | |
|
| Bowater Canada Finance | | | | | | | | |
7.950%, due 11/15/11 | | | 200,000 | | | | 125,000 | |
|
| Bowater, Inc. | | | | | | | | |
9.000%, due 08/01/09 | | | 100,000 | | | | 93,000 | |
|
| Buckeye Technologies, Inc. | | | | | | | | |
8.000%, due 10/15/10 | | | 115,000 | | | | 114,138 | |
|
| Cellu Tissue Holdings, Inc. | | | | | | | | |
9.750%, due 03/15/10 | | | 175,000 | | | | 162,312 | |
|
| Millar Western Forest | | | | | | | | |
7.750%, due 11/15/13 | | | 150,000 | | | | 91,500 | |
|
| Verso Paper Holdings LLC | | | | | | | | |
9.125%, due 08/01/14 | | | 200,000 | | | | 188,000 | |
|
| Weyerhaeuser Co. | | | | | | | | |
6.750%, due 03/15/12 | | | 300,000 | | | | 308,315 | |
|
| | | | | | | | 1,242,030 | |
|
| Pharmaceuticals—0.25% | | | | | | | | |
| Allergan, Inc. | | | | | | | | |
5.750%, due 04/01/16 | | | 585,000 | | | | 578,022 | |
|
| AstraZeneca PLC | | | | | | | | |
6.450%, due 09/15/37 | | | 150,000 | | | | 153,829 | |
|
| Axcan Intermediate Holdings | | | | | | | | |
9.250%, due 03/01/15(3) | | | 135,000 | | | | 135,000 | |
|
12.750%, due 03/01/16(3) | | | 243,000 | | | | 244,215 | |
|
| | | | | | | | | |
|
| | | | | | | | 33 |
UBS U.S. Allocation Fund
Portfolio of investments—August 31, 2008
| | | Face | | | | | |
| Security description | | amount | | | | Value | |
|
| Corporate bonds—(continued) | | | | | | | | |
|
| Pharmaceuticals—(concluded) | | | | | | | | |
| Bristol-Myers Squibb | | | | | | | | |
5.875%, due 11/15/36 | | $ | 115,000 | | | | $108,723 | |
|
| Teva Pharmaceutical Finance LLC | | | | | | | | |
5.550%, due 02/01/16 | | | 140,000 | | | | 135,991 | |
|
| | | | | | | | 1,355,780 | |
|
| Publishing—0.14% | | | | | | | | |
| Deluxe Corp. | | | | | | | | |
5.000%, due 12/15/12 | | | 300,000 | | | | 250,125 | |
|
| Quebecor World Capital Corp. | | | | | | | | |
4.875%, due 11/15/08(9) | | | 450,000 | | | | 159,750 | |
|
8.750%, due 03/15/16(3),(9) | | | 200,000 | | | | 88,500 | |
|
| R.H. Donnelley Corp. | | | | | | | | |
8.875%, due 01/15/16 | | | 175,000 | | | | 91,875 | |
|
| Sheridan Acquisition Corp. | | | | | | | | |
10.250%, due 08/15/11 | | | 200,000 | | | | 182,000 | |
|
| | | | | | | | 772,250 | |
|
| Real estate investment trusts—0.11% | | | | | | | | |
| Avalonbay Communities | | | | | | | | |
7.500%, due 08/01/09 | | | 325,000 | | | | 330,593 | |
|
| ProLogis | | | | | | | | |
5.625%, due 11/15/15 | | | 280,000 | | | | 250,898 | |
|
| Realogy Corp. | | | | | | | | |
12.375%, due 04/15/15 | | | 75,000 | | | | 34,500 | |
|
| | | | | | | | 615,991 | |
|
| Retail—0.08% | | | | | | | | |
| Gamestop Corp. & GS, Inc. | | | | | | | | |
8.000%, due 10/01/12 | | | 225,000 | | | | 235,687 | |
|
| Ingles Markets, Inc. | | | | | | | | |
8.875%, due 12/01/11 | | | 200,000 | | | | 203,000 | |
|
| | | | | | | | 438,687 | |
|
| Road & rail—0.05% | | | | | | | | |
| Burlington Northern Santa Fe Corp. | | | | | | | | |
7.082%, due 05/13/29 | | | 275,000 | | | | 285,376 | |
|
| Special purpose entity—0.03% | | | | | | | | |
| AAC Group Holding Corp. | | | | | | | | |
10.250%, due 10/01/12(3),(4) | | | 150,000 | | | | 142,688 | |
|
| | | | | | | | | |
|
| 34 | | | | | | | | |
UBS U.S. Allocation Fund
Portfolio of investments—August 31, 2008
| | | Face | | | | | |
| Security description | | amount | | | | Value | |
|
| Corporate bonds—(continued) | | | | | | | | |
|
| Technology-hardware—0.04% | | | | | | | | |
| Freescale Semiconductor | | | | | | | | |
8.875%, due 12/15/14 | | $ | 175,000 | | | | $141,750 | |
|
| Xerox Corp. | | | | | | | | |
6.350%, due 05/15/18 | | | 100,000 | | | | 96,734 | |
|
| | | | | | | | 238,484 | |
|
| Technology-software—0.07% | | | | | | | | |
| Oracle Corp. | | | | | | | | |
5.750%, due 04/15/18 | | | 275,000 | | | | 275,784 | |
|
| Unisys Corp. | | | | | | | | |
8.000%, due 10/15/12 | | | 125,000 | | | | 106,250 | |
|
| | | | | | | | 382,034 | |
|
| Telecommunications—0.32% | | | | | | | | |
| Bellsouth Corp. | | | | | | | | |
6.550%, due 06/15/34 | | | 325,000 | | | | 314,450 | |
|
| Citizens Communications Co. | | | | | | | | |
9.000%, due 08/15/31 | | | 200,000 | | | | 173,500 | |
|
| DirecTV Holdings/Financing | | | | | | | | |
7.625%, due 05/15/16(3) | | | 246,000 | | | | 245,385 | |
|
| Dycom Industries, Inc. | | | | | | | | |
8.125%, due 10/15/15 | | | 100,000 | | | | 93,500 | |
|
| Echostar DBS Corp. | | | | | | | | |
6.625%, due 10/01/14 | | | 250,000 | | | | 230,000 | |
|
| Qwest Communications International | | | | | | | | |
7.250%, due 02/15/11 | | | 150,000 | | | | 144,000 | |
|
| Telecom Italia Capital | | | | | | | | |
5.250%, due 11/15/13 | | | 575,000 | | | | 537,607 | |
|
| | | | | | | | 1,738,442 | |
|
| Tobacco—0.04% | | | | | | | | |
| Philip Morris International, Inc. | | | | | | | | |
5.650%, due 05/16/18 | | | 240,000 | | | | 236,113 | |
|
| Transportation services—0.04% | | | | | | | | |
| ERAC USA Finance Co. | | | | | | | | |
7.000%, due 10/15/37(3) | | | 115,000 | | | | 87,714 | |
|
8.000%, due 01/15/11(3) | | | 100,000 | | | | 101,995 | |
|
| | | | | | | | 189,709 | |
|
| | | | | | | | | |
|
| | | | | | | | 35 |
UBS U.S. Allocation Fund
Portfolio of investments—August 31, 2008
| | | Face | | | | | |
| Security description | | amount | | | | Value | |
|
| Corporate bonds—(concluded) | | | | | | | | |
|
| Utilities-other—0.05% | | | | | | | | |
| Duke Capital LLC | | | | | | | | |
5.668%, due 08/15/14 | | | $250,000 | | | | $245,079 | |
|
| Wireless telecommunication services—0.24% | | | | | | | | |
| AT&T, Inc. | | | | | | | | |
6.500%, due 09/01/37 | | | 50,000 | | | | 48,123 | |
|
| AT&T Wireless Services, Inc. | | | | | | | | |
8.750%, due 03/01/31 | | | 175,000 | | | | 209,033 | |
|
| Nextel Communications | | | | | | | | |
7.375%, due 08/01/15 | | | 300,000 | | | | 243,750 | |
|
| Sprint Capital Corp. | | | | | | | | |
6.875%, due 11/15/28 | | | 300,000 | | | | 255,000 | |
|
| Verizon Communications, Inc. | | | | | | | | |
6.100%, due 04/15/18 | | | 100,000 | | | | 99,748 | |
|
| Verizon New York, Inc.,Series B | | | | | | | | |
7.375%, due 04/01/32 | | | 225,000 | | | | 221,452 | |
|
| Wind Acquisition Finance SA | | | | | | | | |
10.750%, due 12/01/15(3) | | | 100,000 | | | | 102,500 | |
|
| Windstream Corp. | | | | | | | | |
8.625%, due 08/01/16 | | | 125,000 | | | | 123,750 | |
|
| | | | | | | | 1,303,356 | |
|
| Total corporate bonds (cost—$40,727,717) | | | | | | | 36,766,237 | |
|
| | | | | | | | | |
| | | | Number of | | | | | |
| | | | contracts | | | | | |
|
| Options*—0.00% | | | | | | | | |
|
| Call options purchased—0.00% | | | | | | | | |
| Federal Funds December 2008 Futures, strike @ 98.25, expires 12/31/08 | | | 83 | | | | 2,594 | |
|
| Put options purchased—0.00% | | | | | | | | |
| Federal Funds December 2008 Futures, strike @ 97.25, expires 12/31/08 | | | 83 | | | | 865 | |
|
| Total options (cost—$25,926) | | | | | | | 3,459 | |
|
| | | | | | | | | |
|
| 36 | | | | | | | | |
UBS U.S. Allocation Fund
Portfolio of investments—August 31, 2008
| | | Face | | | | | |
| Security description | | amount | | | | Value | |
|
| Repurchase agreement—5.99% | | | | | | | | |
|
Repurchase agreement dated 08/29/08 with State Street Bank & Trust Co., 1.430% due 09/02/08, collateralized by $23,714,854 US Treasury Bonds, 8.125% to 8.750% due 08/15/19 to 08/15/20;
(value—$33,420,601); proceeds: $32,770,206 (cost—$32,765,000) | | $ | 32,765,000 | | | | $32,765,000 | |
|
| | | | | | | | | |
| | | | Number of | | | | | |
| | | | shares | | | | | |
|
| Investments of cash collateral from securities loaned—3.76% | | | | | | | | |
|
| Money market funds(10)—3.76% | | | | | | | | |
BlackRock Liquidity Fund TempFund Portfolio Institutional Class, | | | | | | | | |
2.478% | | | 7,064,411 | | | | 7,064,411 | |
|
UBS Private Money Market Fund LLC(11) | | | | | | | | |
2.471% | | | 13,512,472 | | | | 13,512,472 | |
|
Total money market funds and investments of cash | | | | | | | | |
collateral from securities loaned (cost—$20,576,883) | | | | | | | 20,576,883 | |
|
Total investments (cost—$609,413,182)—105.67% | | | | | | | 577,718,725 | |
|
Liabilities in excess of other assets—(5.67)% | | | | | | | (31,004,799 | ) |
|
Net assets—100.00% | | | | | | $ | 546,713,926 | |
|
| * | | Non-income producing security. |
| ** | | On September 7, 2008, the Federal Housing Finance Agency placed the Federal National Mortgage Association and the Federal Home Loan Mortgage Corporation into conservatorship, and the U.S. Treasury guaranteed the debt issued by those organizations. |
| *** | | Issuer filed for bankruptcy subsequent to August 31, 2008. |
| (1) | | Security, or portion thereof, was on loan at August 31, 2008. |
| (2) | | Floating rate security. The interest rate shown is the current rate as of August 31, 2008. |
| (3) | | Security exempt from registration under Rule 144A of the Securities Act of 1933. These securities are considered liquid, unless otherwise noted, and may be resold in transactions exempt from registration, normally to qualified institutional buyers. At August 31, 2008, the value of these securities amounted to $11,236,771 or 2.06% of net assets. |
| (4) | | Step bond. Coupon rate increases in increments to maturity. Rate disclosed is as of August 31, 2008. Maturity date disclosed is the ultimate maturity date. |
| (5) | | Security is illiquid. At August 31, 2008, the value of this security amounted to $29,605 or 0.01% of net assets. |
37
UBS U.S. Allocation Fund
Portfolio of investments—August 31, 2008
| (6) | | The security detailed in the table below, which represents 0.05% of net assets, is considered illiquid and restricted as of August 31, 2008. |
| | | | | | | | Acquisition | | | | | Value at |
| Illiquid and | | | | | | | cost as a | | | | | 08/31/08 as |
| restricted | | Acquisition | | Acquisition | | percentage | | Value at | | a percentage |
| security | | date | | cost | | of net assets | | 08/31/08 | | of net assets |
|
| Rutland Rated Investments, CDO, Series DRYD-1A, Class A6F, 6.957%, due 06/20/13 | | 04/05/06 | | $ | 645,000 | | 0.12% | | $ | 249,031 | | 0.05% |
|
| (7) | | Perpetual bond security. The maturity date reflects the next call date. |
| (8) | | Variable rate security. The interest rate shown is the current rate as of August 31, 2008, and resets at the next call date. |
| (9) | | Bond interest in default. |
| (10) | | The rate shown reflects the yield at August 31, 2008. |
| (11) | | The table below details the Fund’s transaction activity in an affiliated issuer for the year ended August 31, 2008. |
| | | | | | | | | | | | | | | Net income |
| | | | | | Purchases | | Sales | | | | | earned from |
| | | | | | during the | | during the | | | | | affiliate for |
| Security | | Value at | | year ended | | year ended | | Value at | | year ended |
| description | | 08/31/07 | | 08/31/08 | | 08/31/08 | | 08/31/08 | | 08/31/08 |
|
| UBS Private Money Market Fund LLC | | $ | 50,680,822 | | $ | 514,671,279 | | $ | 551,839,629 | | $ | 13,512,472 | | $ | 125,555 |
|
| ADR | | American Depositary Receipt |
| ARM | | Adjustable Rate Mortgage. The interest rate shown is the current rate as of August 31, 2008. |
| CDO | | Collateralized Debt Obligation |
| FHLMC | | Federal Home Loan Mortgage Corporation |
| FNMA | | Federal National Mortgage Association |
| GS | | Goldman Sachs |
| GSAMP | | Goldman Sachs Asset Mortgage Passthrough |
| MTN | | Medium Term Note |
| OEM | | Original Equipment Manufacturer |
| REMIC | | Real Estate Mortgage Investment Conduit |
| TBA | | (To Be Announced) Securities are purchased on a forward commitment basis with an approximate principal amount (generally +/- 1.0%) and no definite maturity date. The actual principal amount and maturity date will be determined upon settlement when the specific mortgage pools are assigned. |
38
UBS U.S. Allocation Fund
Portfolio of investments—August 31, 2008
| TIPS | | Treasury inflation protected securities (“TIPS”) are debt securities issued by the US Treasury whose principal and/or interest payments are adjusted for inflation, unlike debt securities that make fixed principal and interest payments. The interest rate paid by the TIPS is fixed, while the principal value rises or falls based on changes in a published Consumer Price Index (“CPI”). Thus, if inflation occurs, the principal and interest payments on the TIPS are adjusted accordingly to protect investors from inflationary loss. During a deflationary period, the principal and interest payments decrease, although the TIPS principal amounts will not drop below their face amounts at maturity. In exchange for the inflation protection, the TIPS generally pay lower interest rates than typical US Treasury securities. Only if inflation occurs will TIPS offer a higher real yield than a conventional Treasury bond of the same maturity. |
Written options
| | | | | | | | | | | | | | Unrealized |
| Number of | | Call options | | Expiration | | Premiums | | Current | | | appreciation |
| contracts | | written | | dates | | received | | value | | | (depreciation) |
|
| 140 | | Euro Dollar June 2009 Futures, strike price @ 96.75 | | 06/15/09 | | $ | 140,635 | | $ | 168,875 | | | $(28,240 | ) |
|
| | | | | | | | | | | | | | | |
| | | Put options | | | | | | | | | | | | |
| | | written | | | | | | | | | | | | |
|
| 140 | | Euro Dollar June 2009 Futures, strike price @ 96.75 | | 06/15/09 | | | 197,069 | | | 112,000 | | | 85,069 | |
|
| | | | | | | | | | | | | | $56,829 | |
|
Futures contracts
|
| Number of | | | | Expiration | | | | | Current | | Unrealized |
| contracts | | Buy contracts | | dates | | Cost | | value | | depreciation |
|
| 67 | | S&P 500 Index Futures | | September 2008 | | $ | 22,775,310 | | $ | 21,483,550 | | $ | (1,291,760 | ) |
|
| | | | | | | | | | | | | | | |
| | | Sale contracts | | | | Proceeds | | | | | | | |
|
| 160 | | US Treasury Note 2 Year Futures | | December 2008 | | 33,924,747 | | | 33,965,000 | | | (40,253 | ) |
|
| 160 | | US Treasury Note 5 Year Futures | | December 2008 | | 17,892,151 | | | 17,910,000 | | | (17,849 | ) |
|
| | | | | | | 51,816,898 | | | 51,875,000 | | | (58,102 | ) |
|
| | | | | | | | | | | | | $ | (1,349,862 | ) |
|
39
UBS U.S. Allocation Fund
Portfolio of investments—August 31, 2008
Issuer breakdown by country or territory of origin (unaudited)
| Percentage of total investments |
|
| United States | | 96.4 | % |
|
| Bermuda | | 0.8 | |
|
| Panama | | 0.8 | |
|
| Canada | | 0.5 | |
|
| Switzerland | | 0.4 | |
|
| Netherlands Antilles | | 0.3 | |
|
| Liberia | | 0.3 | |
|
| United Kingdom | | 0.2 | |
|
| Netherlands | | 0.1 | |
|
| Cayman Islands | | 0.1 | |
|
| Italy | | 0.1 | |
|
| Total | | 100.0 | % |
|
See accompanying notes to financial statements
40
UBS U.S. Allocation Fund
Statement of assets and liabilities—August 31, 2008
| Assets: | | | | |
| Investments in unaffiliated securities, at value (cost—$595,900,710)(1) | | $ | 564,206,253 | |
|
| Investment in an affiliated security, at value (cost—$13,512,472) | | | 13,512,472 | |
|
| Total investments in securities, at value (cost—$609,413,182) | | | 577,718,725 | |
|
| Cash | | | 4,633,034 | (2) |
|
| Receivable for investments sold | | | 1,498,694 | |
|
| Receivable for shares of beneficial interest sold | | | 47,783 | |
|
| Receivable for dividends and interest | | | 2,147,920 | |
|
| Swap contracts, at value(3) | | | 354,978 | |
|
| Due from broker | | | 354,154 | |
|
| Receivable for variation margin | | | 21,747 | |
|
| Receivable for foreign tax reclaims | | | 3,594 | |
|
| Other assets | | | 45,883 | |
|
| Total assets | | | 586,826,512 | |
|
Liabilities: | | | | |
| Payable for cash collateral from securities loaned | | | 20,576,883 | |
|
| Payable for investments purchased | | | 15,103,205 | |
|
| Payable for shares of beneficial interest repurchased | | | 1,659,621 | |
|
| Swap contracts, at value(3) | | | 1,533,228 | |
|
| Payable to affiliates | | | 426,015 | |
|
| Payable for options written, at value (premiums received—$337,704) | | | 280,875 | |
|
| Due to broker | | | 155,030 | |
|
| Payable to custodian | | | 77,155 | |
|
| Accrued expenses and other liabilities | | | 300,574 | |
|
| Total liabilities | | | 40,112,586 | |
|
Net assets: | | | | |
| Beneficial interest—$0.001 par value per share (unlimited amount authorized) | | | 652,183,926 | |
|
| Accumulated undistributed net investment income | | | 11,181,529 | |
|
| Accumulated net realized loss from investments, futures and swaps | | | (83,329,170 | ) |
|
| Net unrealized depreciation of investments, futures, options written and swaps | | | (33,322,359 | ) |
|
| Net assets | | $ | 546,713,926 | |
|
| (1) | | Includes $19,573,767 of investments in securities on loan, at value. |
| (2) | | Represents restricted cash of $4,633,034 delivered to broker as initial margin for futures contracts. |
| (3) | | Net upfront payments received totaled $843,381. |
See accompanying notes to financial statements
41
UBS U.S. Allocation Fund
Statement of assets and liabilities—August 31, 2008
| Class A: | | | |
| Net assets | | | $344,910,469 |
|
| Shares outstanding | | | 11,963,139 |
|
| Net asset value per share | | | $28.83 |
|
| Maximum offering price per share (net asset value plus maximum sales charge of 5.50%) | | | $30.51 |
|
Class B: | | | |
| Net assets | | | $6,863,912 |
|
| Shares outstanding | | | 241,614 |
|
| Net asset value and offering price per share | | | $28.41 |
|
Class C: | | | |
| Net assets | | | $147,945,354 |
|
| Shares outstanding | | | 5,249,017 |
|
| Net asset value and offering price per share | | | $28.19 |
|
Class Y: | | | |
| Net assets | | | $46,994,191 |
|
| Shares outstanding | | | 1,605,461 |
|
| Net asset value and offering price per share | | | $29.27 |
|
See accompanying notes to financial statements
42
UBS U.S. Allocation Fund
Statement of operations
| | | | For the year ended |
| | | | August 31, 2008 |
|
| Investment income: | | | | |
| Dividends (net of foreign witholding taxes of $1,104) | | | $7,709,918 | |
|
| Interest | | | 12,764,438 | |
|
| Securities lending income (includes $125,555 earned from an affiliated entity) | | | 295,189 | |
|
| | | | 20,769,545 | |
|
Expenses: | | | | |
| Investment advisory and administration fees | | | 3,034,567 | |
|
| Service fees—Class A | | | 1,004,312 | |
|
| Service and distribution fees—Class B | | | 145,577 | |
|
| Service and distribution fees—Class C | | | 1,770,525 | |
|
| Transfer agency and related service fees—Class A | | | 456,599 | |
|
| Transfer agency and related service fees—Class B | | | 34,567 | |
|
| Transfer agency and related service fees—Class C | | | 198,665 | |
|
| Transfer agency and related service fees—Class Y | | | 10,718 | |
|
| Custody and accounting fees | | | 258,628 | |
|
| Reports and notices to shareholders | | | 206,456 | |
|
| Professional fees | | | 127,843 | |
|
| State registration fees | | | 68,713 | |
|
| Insurance expense | | | 23,667 | |
|
| Trustees’ fees | | | 16,698 | |
|
| Other expenses | | | 28,483 | |
|
| | | | 7,386,018 | |
|
| Less: Fee waivers by investment advisor and administrator | | | (73,285 | ) |
|
| Net expenses | | | 7,312,733 | |
|
| Net investment income | | | 13,456,812 | |
|
Realized and unrealized gains (losses) from investment activities: | | | | |
| Net realized gains from: | | | | |
| Investments | | | 19,594,351 | |
|
| Futures | | | 1,371,608 | |
|
| Swaps | | | 326,776 | |
|
| Net change in unrealized appreciation/depreciation of: | | | | |
| Investments | | | (95,159,275 | ) |
|
| Futures | | | (1,349,862 | ) |
|
| Options written | | | 56,829 | |
|
| Swaps | | | (613,514 | ) |
|
| Net realized and unrealized loss from investment activities | | | (75,773,087 | ) |
|
| Net decrease in net assets resulting from operations | | | $(62,316,275 | ) |
|
See accompanying notes to financial statements
43
UBS U.S. Allocation Fund
Statement of changes in net assets
| | | | For the years ended August 31, |
| | | |
|
| | | | 2008 | | | | 2007 | |
|
| From operations: | | | | | | | | |
| Net investment income | | | $13,456,812 | | | | $16,155,639 | |
|
| Net realized gains from investments, futures and swaps | | | 21,292,735 | | | | 71,846,649 | |
|
| Net change in unrealized appreciation/depreciation of investments, futures, options written and swaps | | | (97,065,822 | ) | | | 2,510,121 | |
|
| Net increase (decrease) in net assets resulting from operations | | | (62,316,275 | ) | | | 90,512,409 | |
|
Dividends to shareholders from: | | | | | | | | |
| Net investment income—Class A | | | (11,059,350 | ) | | | (10,456,632 | ) |
|
| Net investment income—Class B | | | (184,439 | ) | | | (690,100 | ) |
|
| Net investment income—Class C | | | (3,477,930 | ) | | | (3,289,920 | ) |
|
| Net investment income—Class Y | | | (1,651,935 | ) | | | (2,980,008 | ) |
|
| | | | (16,373,654 | ) | | | (17,416,660 | ) |
|
From beneficial interest transactions: | | | | | | | | |
| Net proceeds from shares sold | | | 11,595,739 | | | | 16,978,079 | |
|
| Cost of shares repurchased | | | (146,471,551 | ) | | | (254,156,118 | ) |
|
| Proceeds from dividends reinvested | | | 15,197,716 | | | | 16,501,783 | |
|
| Net decrease in net assets from beneficial transactions | | | (119,678,096 | ) | | | (220,676,256 | ) |
|
| Redemption fees | | | 12,286 | | | | 5,320 | |
|
| Contributions to capital from investment manager and custodian | | | 29,289 | | | | — | |
|
| Net decrease in net assets | | | (198,326,450 | ) | | | (147,575,187 | ) |
|
Net assets: | | | | | | | | |
| Beginning of year | | | 745,040,376 | | | | 892,615,563 | |
|
| End of year | | | $546,713,926 | | | | $745,040,376 | |
|
| Accumulated undistributed net investment income | | | $11,181,529 | | | | $13,664,599 | |
|
See accompanying notes to financial statements
44
(This page has been left blank intentionally)
45
UBS U.S. Allocation Fund
Financial highlights
Selected data for a share of beneficial interest outstanding throughout each year is presented below:
| | | Class A |
| | |
|
| | | For the years ended August 31, |
| | |
|
| | | 2008 | | | 2007 | | | 2006 | | | 2005 | | | 2004 | |
|
| Net asset value, beginning of year | | | $32.53 | | | | $29.94 | | | | $28.60 | | | | $25.81 | | | | $23.00 | |
|
| Net investment income(1) | | | 0.70 | | | | 0.68 | | | | 0.56 | | | | 0.51 | | | | 0.30 | |
|
| Net realized and unrealized gains (losses) from investment activities | | | (3.57 | ) | | | 2.60 | | | | 1.38 | | | | 2.79 | | | | 2.72 | |
|
| Net increase (decrease) from operations | | | (2.87 | ) | | | 3.28 | | | | 1.94 | | | | 3.30 | | | | 3.02 | |
|
| Dividends from net investment income | | | (0.83 | ) | | | (0.69 | ) | | | (0.60 | ) | | | (0.51 | ) | | | (0.21 | ) |
|
| Net asset value, end of year | | | $28.83 | | | | $32.53 | | | | $29.94 | | | | $28.60 | | | | $25.81 | |
|
| Total investment return(2) | | | (9.02 | )% | | | 11.04 | % | | | 6.84 | % | | | 12.85 | % | | | 13.19 | % |
|
| Ratios/supplemental data: | | | | | | | | | | | | | | | | | | | | |
| Net assets, end of year (000’s) | | $ | 344,910 | | | $ | 452,439 | | | $ | 472,213 | | | $ | 525,711 | | | $ | 552,195 | |
|
| Expenses to average net assets, net of fee waivers by advisor | | | 0.93 | % | | | 0.90 | % | | | 0.91 | % | | | 0.90 | % | | | 0.93 | % |
|
| Expenses to average net assets, before fee waivers by advisor | | | 0.95 | % | | | 0.92 | % | | | 0.94 | % | | | 0.93 | % | | | 0.95 | % |
|
| Net investment income to average net assets | | | 2.28 | % | | | 2.12 | % | | | 1.91 | % | | | 1.87 | % | | | 1.18 | % |
|
| Portfolio turnover | | | 98 | % | | | 85 | % | | | 82 | % | | | 67 | % | | | 128 | % |
|
| (1) | | Calculated using the average shares method. |
| (2) | | Total investment return is calculated assuming a $10,000 investment on the first day of each year reported, reinvestment of all dividends and other distributions, if any, at net asset value on the ex-dividend dates, and a sale at net asset value on the last day of each year reported. The figures do not include any applicable sales charges or redemption fees; results would be lower if they were included. Returns do not reflect the deduction of taxes that a shareholder would pay on Fund distributions or the redemption of Fund shares. |
See accompanying notes to financial statements
46
| Class B |
|
| For the years ended August 31, |
|
| 2008 | | | 2007 | | | 2006 | | | 2005 | | | 2004 | |
|
| $31.87 | | | | $29.24 | | | | $27.81 | | | | $25.04 | | | | $22.29 | |
|
| 0.41 | | | | 0.39 | | | | 0.30 | | | | 0.28 | | | | 0.09 | |
|
| | | | | | | | | | | | | | | | | | |
| (3.56 | ) | | | 2.57 | | | | 1.36 | | | | 2.70 | | | | 2.66 | |
|
| | | | | | | | | | | | | | | | | | |
| (3.15 | ) | | | 2.96 | | | | 1.66 | | | | 2.98 | | | | 2.75 | |
|
| | | | | | | | | | | | | | | | | | |
| (0.31 | ) | | | (0.33 | ) | | | (0.23 | ) | | | (0.21 | ) | | | — | |
|
| $28.41 | | | | $31.87 | | | | $29.24 | | | | $27.81 | | | | $25.04 | |
|
| (9.96 | )% | | | 10.16 | % | | | 5.99 | % | | | 11.95 | % | | | 12.34 | % |
|
| | | | | | | | | | | | | | | | | | |
| $6,864 | | | $ | 28,167 | | | $ | 77,296 | | | $ | 148,208 | | | $ | 277,891 | |
|
| | | | | | | | | | | | | | | | | | |
| 1.80 | % | | | 1.72 | % | | | 1.71 | % | | | 1.70 | % | | | 1.70 | % |
|
| | | | | | | | | | | | | | | | | | |
| 1.82 | % | | | 1.74 | % | | | 1.74 | % | | | 1.73 | % | | | 1.72 | % |
|
| | | | | | | | | | | | | | | | | | |
| 1.39 | % | | | 1.29 | % | | | 1.07 | % | | | 1.08 | % | | | 0.36 | % |
|
| 98 | % | | | 85 | % | | | 82 | % | | | 67 | % | | | 128 | % |
|
47
UBS U.S. Allocation Fund
Financial highlights
Selected data for a share of beneficial interest outstanding throughout each year is presented below:
| | | Class C |
| | |
|
| | | For the years ended August 31, |
| | |
|
| | | 2008 | | | 2007 | | | 2006 | | | 2005 | | | 2004 | |
|
| Net asset value, beginning of year | | | $31.80 | | | | $29.27 | | | | $27.95 | | | | $25.21 | | | | $22.46 | |
|
| Net investment income(1) | | | 0.46 | | | | 0.43 | | | | 0.33 | | | | 0.30 | | | | 0.10 | |
|
| Net realized and unrealized gains (losses) from investment activities | | | (3.50 | ) | | | 2.55 | | | | 1.35 | | | | 2.72 | | | | 2.67 | |
|
| Net increase (decrease) from operations | | | (3.04 | ) | | | 2.98 | | | | 1.68 | | | | 3.02 | | | | 2.77 | |
|
| Dividends from net investment income | | | (0.57 | ) | | | (0.45 | ) | | | (0.36 | ) | | | (0.28 | ) | | | (0.02 | ) |
|
| Net asset value, end of year | | | $28.19 | | | | $31.80 | | | | $29.27 | | | | $27.95 | | | | $25.21 | |
|
| Total investment return(2) | | | (9.70 | )% | | | 10.23 | % | | | 6.02 | % | | | 12.02 | % | | | 12.35 | % |
|
| Ratios/supplemental data: | | | | | | | | | | | | | | | | | | | | |
| Net assets, end of year (000’s) | | $ | 147,945 | | | $ | 205,104 | | | $ | 226,219 | | | $ | 271,996 | | | $ | 333,765 | |
|
| Expenses to average net assets, net of fee waivers by advisor | | | 1.68 | % | | | 1.65 | % | | | 1.65 | % | | | 1.65 | % | | | 1.67 | % |
|
| Expenses to average net assets, before fee waivers by advisor | | | 1.70 | % | | | 1.67 | % | | | 1.68 | % | | | 1.68 | % | | | 1.69 | % |
|
| Net investment income to average net assets | | | 1.53 | % | | | 1.38 | % | | | 1.16 | % | | | 1.12 | % | | | 0.42 | % |
|
| Portfolio turnover | | | 98 | % | | | 85 | % | | | 82 | % | | | 67 | % | | | 128 | % |
|
| (1) | | Calculated using the average shares method. |
| (2) | | Total investment return is calculated assuming a $10,000 investment on the first day of each year reported, reinvestment of all dividends and other distributions, if any, at net asset value on the ex-dividend dates, and a sale at net asset value on the last day of each year reported. The figures do not include any applicable sales charges or redemption fees; results would be lower if they were included. Returns do not reflect the deduction of taxes that a shareholder would pay on Fund distributions or the redemption of Fund shares. |
See accompanying notes to financial statements
48
| Class Y |
|
| For the years ended August 31, |
|
| 2008 | | | 2007 | | | 2006 | | | 2005 | | | 2004 | |
|
| | | | | | | | | | | | | | | | | | |
| $33.03 | | | | $30.39 | | | | $29.02 | | | | $26.19 | | | | $23.33 | |
|
| 0.81 | | | | 0.79 | | | | 0.67 | | | | 0.61 | | | | 0.39 | |
|
| | | | | | | | | | | | | | | | | | |
| (3.62 | ) | | | 2.66 | | | | 1.40 | | | | 2.83 | | | | 2.76 | |
|
| | | | | | | | | | | | | | | | | | |
| (2.81 | ) | | | 3.45 | | | | 2.07 | | | | 3.44 | | | | 3.15 | |
|
| | | | | | | | | | | | | | | | | | |
| (0.95 | ) | | | (0.81 | ) | | | (0.70 | ) | | | (0.61 | ) | | | (0.29 | ) |
|
| $29.27 | | | | $33.03 | | | | $30.39 | | | | $29.02 | | | | $26.19 | |
|
| (8.69 | )% | | | 11.42 | % | | | 7.22 | % | | | 13.22 | % | | | 13.58 | % |
|
| | | | | | | | | | | | | | | | | | |
| $46,994 | | | $ | 59,330 | | | $ | 116,888 | | | $ | 122,743 | | | $ | 123,727 | |
|
| | | | | | | | | | | | | | | | | | |
| 0.59 | % | | | 0.55 | % | | | 0.55 | % | | | 0.55 | % | | | 0.58 | % |
|
| | | | | | | | | | | | | | | | | | |
| 0.61 | % | | | 0.57 | % | | | 0.57 | % | | | 0.58 | % | | | 0.60 | % |
|
| | | | | | | | | | | | | | | | | | |
| 2.62 | % | | | 2.48 | % | | | 2.27 | % | | | 2.21 | % | | | 1.53 | % |
|
| 98 | % | | | 85 | % | | | 82 | % | | | 67 | % | | | 128 | % |
|
49
UBS U.S. Allocation Fund
Notes to financial statements
Organization and significant accounting policies
UBS U.S. Allocation Fund (the “Fund”) is a series of UBS Investment Trust (the “Trust”) and is registered with the Securities and Exchange Commission under the Investment Company Act of 1940, as amended, as an open-end, diversified management investment company. The Trust was organized on March 28, 1991, as a business trust under the laws of the Commonwealth of Massachusetts and currently has one operating series.
Currently, the Fund offers Class A, Class B, Class C and Class Y shares. Each class represents interests in the same assets of the Fund, and the classes are identical except for differences in their sales charge structures, ongoing service and distribution charges and certain transfer agency and related services expenses. In addition, Class B shares and all corresponding reinvested dividend shares automatically convert to Class A shares within a certain number of years after issuance which varies depending upon the amount invested. All classes of shares have equal voting privileges except that Class A, Class B and Class C shares each have exclusive voting rights with respect to their respective service and/or distribution plans. Class Y shares have no service or distribution plan.
As of October 1, 2007, new or additional investments into Class B shares, including investments through an automatic investment plan, are not permitted. Existing shareholders of Class B shares may: (i) continue as Class B shareholders; (ii) continue to reinvest dividends and distributions into Class B shares; and (iii) exchange their Class B shares for Class B shares of other series of the UBS Family of Funds, as permitted by existing exchange privileges. For Class B shares outstanding on October 1, 2007 and Class B shares acquired upon reinvestment of dividends or distributions or through exchanges, all Class B share attributes, including the associated Rule 12b-1 service plan and distribution fees, contingent deferred sales charges and conversion features will continue.
In the normal course of business the Fund may enter into contracts that contain a variety of representations or that provide indemnification for certain liabilities. The Fund’s maximum exposure under these arrangements is unknown, as this would involve future claims that may be made against the Fund that have not yet occurred. However, the Fund has not had prior claims or losses pursuant to these contracts and expects the risk of loss to be remote.
The preparation of financial statements in accordance with US generally accepted accounting principles requires the Fund’s management to make
50
UBS U.S. Allocation Fund
Notes to financial statements
estimates and assumptions that affect the reported amounts and disclosures in the financial statements. Actual results could differ from those estimates. The following is a summary of significant accounting policies:
Valuation of investments—The Fund calculates net asset values based on the current market value for its portfolio securities. The Fund normally obtains market values for its securities from independent pricing sources. Independent pricing sources may use last reported sale prices, current market quotations or valuations from computerized “matrix” systems that derive values based on comparable securities. Securities traded in the over-the-counter (“OTC”) market and listed on The Nasdaq Stock Market, Inc. (“NASDAQ”) normally are valued at the NASDAQ Official Closing Price. Other OTC securities are valued at the last bid price available prior to valuation. Securities which are listed on US and foreign stock exchanges normally are valued at the last sale price on the day the securities are valued or, lacking any sales on such day, at the last available bid price. In cases where securities are traded on more than one exchange, the securities are valued on the exchange designated as the primary market by UBS Global Asset Management (Americas) Inc. (“UBS Global AM”). If a market value is not available from an independent pricing source for a particular security, that security is valued at fair value as determined in good faith by or under the direction of the Trust’s Board of Trustees (the “Board”). Various factors may be reviewed in order to make a good faith determination of a security’s fair value. These factors may include, but are not limited to, the type and cost of the security; contractual or legal restrictions on resale of the security; relevant financial or business developments of the issuer; actively traded similar or related securities; conversion or exchange rights on the security; related corporate actions; and changes in overall market conditions. If events occur that materially affect the value of securities (particularly non-US securities) between the close of trading in those securities and the close of regular trading on the New York Stock Exchange, these securities would be fair valued. The amortized cost method of valuation, which approximates market value, generally is used to value short-term debt-instruments with sixty days or less remaining to maturity, unless the Board determines that this does not represent fair value.
In September 2006, the Financial Accounting Standards Board (“FASB”) issued Statement of Financial Accounting Standards No. 157, “Fair Value Measurements” (“FAS 157”). This standard clarifies the definition of fair value for financial reporting, establishes a framework for measuring fair value and requires additional disclosures about the use of fair value
51
UBS U.S. Allocation Fund
Notes to financial statements
measurements. FAS 157 is effective for financial statements issued for fiscal years beginning after November 15, 2007 and interim periods within those fiscal years. As of August 31, 2008, management does not believe the adoption of FAS 157 will impact the amounts reported in the financial statements, however, additional disclosures will be required about the inputs used to develop the measurements of fair value and the effect of certain measurements reported on the Statement of operations for a fiscal period.
In addition, in March 2008, the FASB issued Statement of Financial Accounting Standards No. 161, “Disclosures about Derivative Instruments and Hedging Activities” (“FAS 161”). The standard requires enhanced disclosures about the Fund’s derivative and hedging activities. FAS 161 is effective for financial statements issued for fiscal years and interim periods beginning after November 15, 2008. Management is currently evaluating the impact that the adoption of FAS 161 may have on the Fund’s financial statement disclosures.
Repurchase agreements—The Fund may purchase securities or other obligations from a bank or securities dealer (or its affiliate), subject to the seller’s agreement to repurchase them at an agreed upon date (or upon demand) and price. The Fund maintains custody of the underlying obligations prior to their repurchase, either through its regular custodian or through a special “tri-party” custodian or sub-custodian that maintains a separate account for both the Fund and its counterparty. The underlying collateral is valued daily to ensure that the value, including accrued interest, is at least equal to the repurchase price. In the event of default of the obligation to repurchase, the Fund generally has the right to liquidate the collateral and apply the proceeds in satisfaction of the obligation. Repurchase agreements involving obligations other than US government securities (such as commercial paper, corporate bonds and mortgage loans) may be subject to special risks and may not have the benefit of certain protections in the event of counterparty insolvency. If the seller (or seller’s guarantor, if any) becomes insolvent, the Fund may suffer delays, costs and possible losses in connection with the disposition or retention of the collateral. Under certain circumstances, in the event of default or bankruptcy by the other party to the agreement, realization and/or retention of the collateral may be subject to legal proceedings. The Fund may participate in joint repurchase agreement transactions with other funds managed, advised or sub-advised by UBS Global AM.
52
UBS U.S. Allocation Fund
Notes to financial statements
Investment transactions, investment income and expenses—Investment transactions are recorded on the trade date. Realized gains and losses from investment transactions are calculated using the identified cost method. Dividend income is recorded on the ex-dividend date (“ex-date”). Interest income is recorded on an accrual basis. Discounts are accreted and premiums are amortized as adjustments to interest income and the identified cost of investments.
Income, expenses (excluding class-specific expenses) and realized/unrealized gains/losses are allocated proportionately to each class of shares based upon the relative net asset value of outstanding shares (or the value of dividend-eligible shares, as appropriate) of each class at the beginning of the day (after adjusting for current capital share activity of the respective classes). Class-specific expenses are charged directly to the applicable class of shares.
Securities traded on to-be-announced basis—The Fund may from time to time purchase securities on a to-be-announced (“TBA”) basis. In a TBA transaction, the Fund commits to purchasing or selling securities for which all specific information is not yet known at the time of the trade, particularly the face amount and maturity date of the underlying security transactions. Securities purchased on a TBA basis are not settled until they are delivered to the Fund, normally 15 to 45 days later. Beginning on the date the Fund enters into a TBA transaction, cash, US government securities or other liquid securities are segregated in an amount equal in value to the purchase price of the TBA security. These transactions are subject to market fluctuations, and their current value is determined in the same manner as for other securities.
At August 31, 2008, the Fund held TBA securities with a total cost of $14,438,337.
Option writing—The Fund may write (sell) put and call options on securities or derivative instruments in order to gain exposure to or protect against changes in the markets. When the Fund writes a call or a put option, an amount equal to the premium received by the Fund is included on the Fund’s Statement of assets and liabilities as an asset and as an equivalent liability. The amount of the liability is subsequently marked-to-market to reflect the current market value of the option written. If an option which the Fund has written either expires on its stipulated expiration date or the Fund enters into a closing purchase transaction, the Fund realizes a gain (or loss if the cost of a closing purchase transaction exceeds the premium received
53
UBS U.S. Allocation Fund
Notes to financial statements
when the option was written) without regard to any unrealized gain or loss on the underlying security or derivative instrument, and the liability related to such option is extinguished. If a call option which the Fund has written is exercised, the Fund recognizes a realized gain or loss (long-term or short-term, depending on the holding period of the underlying security) from the sale of the underlying security or derivative instrument and the proceeds from the sale are increased by the premium originally received. If a put option which the Fund has written is exercised, the amount of the premium originally received reduces the cost of the security or derivative instrument which the Fund purchases upon exercise of the option.
In writing an option, the Fund bears the market risk of an unfavorable change in the price of the derivative instrument, security or currency underlying the written option. Exercise of an option written by the Fund could result in the Fund selling or buying a derivative instrument, security or currency at a price different from current market value.
Written option activity for the year ended August 31, 2008 was as follows:
| | | | | | Amount of |
| | | | Number of | | premiums |
| | | | contracts | | received |
|
| Options outstanding at August 31, 2007 | | | — | | $— | |
|
| Options written | | | 280 | | 337,704 | |
|
| Options outstanding at August 31, 2008(1) | | | 280 | | $337,704 | |
|
| (1) | For additional information regarding the written options outstanding at August 31, 2008, please refer to the footnotes in the Portfolio of investments. |
Purchased options—The Fund may also purchase put and call options. Purchasing call options tends to increase exposure to the underlying instrument. Purchasing put options tends to decrease exposure to the underlying instrument. The Fund pays a premium which is included on the Statement of assets and liabilities as an investment and subsequently marked to market to reflect the current value of the option. Premiums paid for purchasing options which expire are treated as realized losses. The risk associated with purchasing put and call options is limited to the premium paid. Premiums paid for purchasing options which are exercised or closed are added to the amounts paid or offset against the proceeds on the underlying future, security or currency transaction to determine the realized gain or loss.
54
UBS U.S. Allocation Fund
Notes to financial statements
Futures contracts—Upon entering into a financial futures contract, the Fund is required to deliver to a broker an amount of cash and/or securities equal to a certain percentage of the contract amount. This amount is known as the “initial margin.” Subsequent payments, known as “variation margin”, generally are made or received by the Fund each day, depending on the fluctuations in the value of the underlying financial futures contracts, except that in the case of certain futures contracts payments may be made or received at settlement. Such variation margin is recorded for financial statement purposes on a daily basis as unrealized gain or loss until the financial futures contract is closed, at which time the net gain or loss is reclassified to realized gain or loss on futures.
Using financial futures contracts involves various market risks. If the Fund was unable to liquidate a futures position due to the absence of a liquid secondary market or the imposition of price limits, it could incur substantial losses and would continue to be subject to market risk with respect to the position. In addition, the Fund would continue to be required to make variation margin payments and might be required to maintain the position being hedged or to maintain cash or securities in a separate account. Furthermore, certain characteristics of the futures market might increase the risk that movements in the prices of the financial futures contracts might not correlate perfectly with movements in the prices of the investments being hedged, including temporary price distortion. The separate account for margin will be maintained at the futures counterparty and may be subject to risks or delays if the counterparty becomes insolvent.
Interest rate swap agreements—The Fund may enter into interest rate swap agreements. This type of swap is an agreement that obligates two parties to exchange a series of cash flows at specified intervals based upon or calculated by reference to a specified interest rate(s) for a specified amount. The payment flows are usually netted against each other, with the difference being paid by one party to the other.
Risks may arise as a result of the failure of the counterparty to the swap contract to comply with the terms of the contract. The loss incurred by the failure of a counterparty is generally limited to the net interest payment to be received by the Fund. Therefore, the Fund considers the creditworthiness of the counterparty to a swap contract in evaluating potential credit risk.
55
UBS U.S. Allocation Fund
Notes to financial statements
The Fund accrues for interim payments on swap contracts on a daily basis, with the net amount recorded within unrealized appreciation/depreciation of swap contracts on the Statement of assets and liabilities. Once interim payments are settled in cash, the net amount is recorded as realized gain/loss on swaps, in addition to realized gain/loss recorded upon the termination of swap contracts on the Statement of operations. Fluctuations in the value of swap contracts are recorded for financial statement purposes as unrealized appreciation or depreciation of swaps.
At August 31, 2008, the Fund had outstanding interest rate swap contracts with the following terms:
| | | | | | | Rate type | | | | | | | | | | | | | | |
| | | | | | |
| | | | Upfront | | | | | | | | |
| Notional | | | | | | Payments | | | | Payments | | | | Payments | | | | | | | | Unrealized |
| amount | | | Termination | | | made by | | | | received by | | | | Received | | | | | | | | appreciation |
| (000) | | | dates | | | the Fund | | | | the Fund | | | | (made) | | | Value | | | (depreciation) |
|
| USD 9,400 | | | 09/15/10 | | | 2.811%(1) | | | | 3.600% | | | | $ | — | | | | $14,376 | | | | | $14,376 | |
|
| USD 9,400 | | | 09/15/10 | | | 2.811(1) | | | | 3.600 | | | | | — | | | | 14,376 | | | | | 14,376 | |
|
| USD 22,600 | | | 03/17/10 | | | 2.811(1) | | | | 2.621 | | | | | — | | | | (181,115 | ) | | | | (181,115 | ) |
|
| | | | | | | | | | | | | | | | — | | | $ | (152,363 | ) | | | $ | (152,363 | ) |
|
| (1) | | | Rate based on 3 Month LIBOR (London Interbank Offered Rate). |
| USD | | | United States Dollar |
Credit default swap agreements—Credit default swap agreements involve commitments to make or receive payments in the event of a default of a security or a credit event. As a buyer, the Fund would make periodic payments to the counterparty, and the Fund would receive payments only upon the occurrence of a credit event. If no credit event occurs, the Fund will lose its periodic stream of payments over the term of the contract. However, if a credit event does occur, the Fund typically would receive full notional value for a reference obligation that may have little or no value. As a seller, the Fund would receive periodic payments from the counterparty, and the Fund would make payments only upon the occurrence of a credit event. If no default or credit event occurs, the Fund will gain the periodic stream of payments it received over the term of the contract and the counterparty will lose its periodic stream of payments over the term of the contract. However, if a default or credit event occurs, the Fund typically pays full notional value for a reference obligation that may have little or no value. Credit default swaps may involve greater risks than if the Fund had invested in the reference obligation directly and are subject to general market risk, liquidity risk, and credit risk.
56
UBS U.S. Allocation Fund
Notes to financial statements
At August 31, 2008, the Fund had outstanding credit default swap contracts with the following terms:
Credit default swaps(1)
| | | | | | Rate type | | | | | | | | | | | | | | | |
| | | | | |
| | | Upfront | | | | | | | | | | | |
| Notional | | | | | Payments | | | | Payments | | | payments | | | | | | | | | Unrealized |
| amount | | | Termination | | made by | | | | received by | | | received | | | | | | | | | appreciation |
| (000) | | | dates | | the Fund | | | | the Fund | | | (made) | | | | Value | | | (depreciation) |
|
| USD 450 | | | 09/20/08 | | 0.000%(2) | | | | 6.000% | | | | $— | | | | | $622 | | | | | $622 | |
|
| USD 750 | | | 09/20/08 | | 0.000(3) | | | | 8.000 | | | | — | | | | | (31,066 | ) | | | | (31,066 | ) |
|
| USD 3,218 | | | 12/20/12 | | 3.750 | | | | 0.000(4) | | | | (138,277 | ) | | | | 325,604 | | | | | 187,327 | |
|
| USD 4,750 | | | 06/20/12 | | 0.000(5) | | | | 1.200 | | | | 285,633 | | | | | (332,898 | ) | | | | (47,265 | ) |
|
| USD 9,900 | | | 06/20/12 | | 0.000(5) | | | | 2.750 | | | | 696,025 | | | | | (988,149 | ) | | | | (292,124 | ) |
|
| | | | | | | | | | | | | $ | 843,381 | | | | $ | (1,025,887 | ) | | | $ | (182,506 | ) |
|
| (1) | | Payments made or received are based on the notional amounts. |
| (2) | | Payment to the counterparty will be made upon the occurrence of bankruptcy and/or by a restructuring event with respect to the Countrywide Home Loans, Inc. bond, 4.00%, due 03/22/11. |
| (3) | | Payment to the counterparty will be made upon the occurrence of bankruptcy and/or by a restructuring event with respect to the Residential Capital LLC bond, 6.50%, due 04/17/13. |
| (4) | | Payment from the counterparty will be received upon the occurrence of bankruptcy and/or by a restructuring event with respect to securities contained in the CDX North America High Yield Index. |
| (5) | | Payment to the counterparty will be made upon the occurrence of bankruptcy and/or by a restructuring event with respect to the securities contained in the CDX North America High Yield Index Series 8. |
| USD | | United States Dollar |
Dividends and distributions—Dividends and distributions to shareholders are recorded on the ex-dividend date. The amount of dividends and distributions is determined in accordance with federal income tax regulations, which may differ from US generally accepted accounting principles. These “book/tax” differences are either considered temporary or permanent in nature. To the extent these differences are permanent in nature, such amounts are reclassified within the capital accounts based on their federal tax-basis treatment; temporary differences do not require reclassification.
Concentration of risk
The ability of the issuers of the debt securities held by the Fund to meet their obligations may be affected by economic developments, including those particular to a specific industry, country or region.
57
UBS U.S. Allocation Fund
Notes to financial statements
Investment advisor and administrator
The Board has approved an Investment Advisory and Administration Contract (“Advisory Contract”), under which UBS Global AM serves as investment advisor and administrator of the Fund. In accordance with the Advisory Contract, the Fund is to pay UBS Global AM an investment advisory and administration fee, which is to be accrued daily and paid monthly, at an annual rate of 0.50% of the Fund’s average daily net assets up to $250 million and 0.45% thereafter.
UBS Global AM has agreed to permanently reduce its advisory and administration fee based on the Fund’s average daily net assets so that it is assessed as follows: $0 to $250 million – 0.50%; in excess of $250 million up to $500 million – 0.45%; in excess of $500 million up to $2 billion – 0.40%; and over $2 billion – 0.35%. Accordingly, for the year ended August 31, 2008, UBS Global AM waived $73,285 in investment advisory and administration fees. At August 31, 2008, the Fund owed UBS Global AM $220,417 in investment advisory and administration fees. At August 31, 2008, UBS Global AM owed the Fund $2,137 for fee waivers under the above agreement.
For the year ended August 31, 2008, the Fund paid $27,682 in brokerage commissions to UBS Securities LLC., an indirect wholly owned subsidiary of UBS AG, for transactions executed on behalf of the Fund.
Additional information regarding compensation to affiliate of a board member
Effective March 1, 2005, Professor Meyer Feldberg accepted the position of senior advisor to Morgan Stanley, resulting in him becoming an interested trustee of the Fund. The Fund has been informed that Professor Feldberg’s role at Morgan Stanley does not involve matters directly affecting any UBS funds. Fund transactions are executed through Morgan Stanley based on that firm’s ability to provide best execution of the transactions. During the year ended August 31, 2008, the Fund paid brokerage commissions to Morgan Stanley in the amount of $15,779. During the year ended August 31, 2008, the Fund purchased and sold certain securities (e.g., fixed income securities) in principal trades with Morgan Stanley having an aggregate value of $40,083,186. Morgan Stanley received compensation in connection with these trades, which may have been in the form of a “mark-up” or “mark-down” of the price of the securities, a fee from the issuer for maintaining a commercial paper program, or some other form of compensation. Although the precise amount of this compensation is not generally known by the
58
UBS U.S. Allocation Fund
Notes to financial statements
Fund’s investment advisor, it is believed that under normal circumstances it represents a small portion of the total value of the transactions.
Service and distribution plans
UBS Global Asset Management (US) Inc. (“UBS Global AM—US”) is the principal underwriter of the Fund’s shares. Under separate plans of service and/or distribution pertaining to Class A, Class B and Class C shares, the Fund pays UBS Global AM—US monthly service fees at an annual rate of 0.25% of the average daily net assets of Class A, Class B and Class C shares and monthly distribution fees at the annual rate of 0.75% of the average daily net assets of Class B and Class C shares. At August 31, 2008, the Fund owed UBS Global AM—US $206,044 for service and distribution fees.
UBS Global AM—US also receives the proceeds of the initial sales charges paid by shareholders upon the purchase of Class A shares and the contingent deferred sales charges paid by shareholders upon certain redemptions of Class A, Class B and Class C shares. UBS Global AM—US has informed the Fund that for the year ended August 31, 2008, it earned $62,031, $26,904, and $5,007 in initial sales and deferred sales charges on Class A, Class B and Class C shares, respectively.
Redemption fees
Effective March 1, 2007, there is a redemption fee of 1.00% on any class of shares if an investor sells or exchanges shares less than 90 days after purchase, subject to certain exemptions as noted in the prospectus. For the year ended August 31, 2008, the Fund received $12,286 in redemption fees.
Transfer agency related services fees
UBS Financial Services Inc., an indirect wholly owned subsidiary of UBS AG, provides certain services pursuant to a delegation of authority from PNC Global Investment Servicing (“PNC”), the Fund’s transfer agent, and is compensated for these services by PNC, not the Fund.
For the year ended August 31, 2008, UBS Financial Services, Inc. received from PNC, not the Fund, $321,064 of the total transfer agency and related services fees paid by the Fund to PNC.
Securities lending
The Fund may lend securities up to 331/3% of its total assets to qualified broker-dealers or institutional investors. The loans are secured at all times
59
UBS U.S. Allocation Fund
Notes to financial statements
by cash, US government securities or irrevocable letters of credit in an amount at least equal to the market value of the securities loaned, plus accrued interest and dividends, determined on a daily basis and adjusted accordingly. The Fund may regain ownership of loaned securities to exercise certain beneficial rights; however, the Fund may bear the risk of delay in recovery of, or even loss of rights in, the securities loaned should the borrower fail financially. The Fund receives compensation for lending its securities from interest or dividends earned on the cash, US government securities or irrevocable letters of credit held as collateral, net of fee rebates paid to the borrower plus reasonable administrative and custody fees. UBS Financial Services Inc. and other affiliated broker-dealers have been approved as borrowers under the Fund’s securities lending program. UBS Securities LLC is the Fund’s lending agent. For the year ended August 31, 2008, UBS Securities LLC earned $78,640 in compensation as the Fund’s lending agent. At August 31, 2008, the Fund owed UBS Securities LLC $1,691 in compensation as the Fund’s lending agent. At August 31, 2008, the Fund had securities on loan having a market value of $19,537,767.
Bank line of credit
The Fund participates with other funds managed, advised or sub-advised by UBS Global AM in a $100 million committed credit facility with State Street Bank and Trust Company (“Committed Credit Facility”), to be utilized for temporary financing until the settlement of sales or purchases of portfolio securities, the repurchase or redemption of shares of the Fund at the request of shareholders and other temporary or emergency purposes. Under the Committed Credit Facility arrangement, the Fund has agreed to pay a commitment fee, pro rata, based on the relative asset size of the funds in the Committed Credit Facility. Interest is charged to the Fund at the overnight federal funds rate in effect at the time of borrowings, plus 0.50%. The Fund did not borrow under the Committed Credit Facility during the year ended August 31, 2008.
Purchases and sales of securities
For the year ended August 31, 2008, aggregate purchases and sales of portfolio securities, excluding short-term securities and US Government securities, were $409,014,826 and $531,434,985, respectively.
For the year ended August 31, 2008, aggregate purchases and sales of US Government securities, excluding short-term securities, were $204,647,956 and $204,335,482, respectively.
60
UBS U.S. Allocation Fund
Notes to financial statements
Federal tax status
The Fund intends to distribute substantially all of its income and to comply with the other requirements of the Internal Revenue Code applicable to regulated investment companies. Accordingly, no provision for federal income taxes is required. In addition, by distributing during each calendar year substantially all of its net investment income, net realized capital gains and certain other amounts, if any, the Fund intends not to be subject to a federal excise tax.
The tax character of distributions paid during the fiscal years ended August 31, 2008 and August 31, 2007 were as follows:
| Distributions paid from: | | 2008 | | 2007 |
|
| Ordinary Income | | $ | 16,373,654 | | $ | 17,416,660 |
|
At August 31, 2008, the components of accumulated deficit on a tax basis were as follows:
| Undistributed ordinary income | | | $10,991,108 | |
| |
| Accumulated realized capital and other losses | | | (76,729,046 | ) |
| |
| Net unrealized depreciation | | | (39,732,062 | ) |
| |
| Total accumulated deficit | | $ | (105,470,000 | ) |
| |
The differences between book-basis and tax-basis unrealized appreciation/depreciation is attributable primarily to the tax deferral of losses on wash sales, tax treatment of credit default swaps and return of capital adjustments from real estate investment trusts.
At August 31, 2008, the Fund had a net capital loss carryforward of $76,729,046. This loss carryforward is available as a reduction, to the extent provided in the regulations, of any future net realized capital gains and will expire August 31, 2011. To the extent that such losses are used to offset future net realized capital gains, it is probable these gains will not be distributed. For the year ended August 31, 2008, the Fund utilized $23,723,920 of capital loss carryforwards to offset current year realized gains.
61
UBS U.S. Allocation Fund
Notes to financial statements
For federal income tax purposes, the tax cost of investments and the components of net unrealized depreciation of investments at August 31, 2008 were as follows:
| Tax cost of investments | | $ | 617,320,891 | |
| |
| Gross appreciation (investments having an excess of value over cost) | | | 31,428,714 | |
| |
| Gross depreciation (investments having an excess of cost over value) | | | (71,030,880 | ) |
| |
| Net unrealized depreciation of investments | | $ | (39,602,166 | ) |
| |
To reflect reclassifications arising from permanent “book/tax” differences for the year ending August 31, 2008, undistributed net investment income was increased by $433,772, and accumulated net realized losses from investment transactions were increased by $433,772. These differences are primarily due to return of capital adjustments from real estate investments trusts, reclassification of swap income and paydown reclasses.
The Fund adopted the provisions of Financial Accounting Standards Board Interpretation No. 48 (“FIN 48”), “Accounting for Uncertainty in Income Taxes.” The implementation of FIN 48 resulted in no material liabilities for unrecognized tax benefits and no material change to the beginning net asset value of the Fund.
As of and during the year ended August 31, 2008, the Fund did not have any liabilities for any unrecognized tax benefits. The Fund recognizes interest and penalties, if any, related to unrecognized tax benefits as income tax expense in the Statement of operations. During the year, the Fund did not incur any interest or penalties.
Each of the tax years in the four year period ended August 31, 2008, remains subject to examination by the Internal Revenue Service and state taxing authorities. The adoption of FIN 48 had no impact on the operations of the Fund for the year ended August 31, 2008.
Capital contributions from investment manager
On April 17, 2008, the Fund recorded a capital contribution from UBS Global AM in the amount of $3,728. This amount was paid by UBS Global AM in connection with losses incurred due to changes in the valuation of securities.
On April 18, 2008, the Fund recorded a capital contribution from State Street Bank and Trust Co. and UBS Global AM in the amount of $25,561. Of this amount, $15,337 was paid by State Street Bank and Trust Co.,
62
UBS U.S. Allocation Fund
Notes to financial statements
and $10,224 was paid by UBS Global AM, in connection with losses incurred due to incorrect transfer agent fee accruals on Class B shares during the period September 11, 2007 through March 31, 2008.
Shares of beneficial interest
There is an unlimited amount of $0.001 par value shares of beneficial interest authorized. Transactions in shares of beneficial interest were as follows:
| | | | Class A | | | Class B |
| | | |
| |
| For the year ended August 31, 2008: | | | Shares | | | | | Amount | | | | Shares | | | | | Amount | |
| |
| Shares sold | | | 235,427 | | | | | $7,251,582 | | | | 4,809 | | | | | $145,072 | |
| |
| Shares repurchased | | | (3,024,039 | ) | | | | (91,986,202 | ) | | | (130,762 | ) | | | | (3,934,198 | ) |
| |
| Shares converted from Class B to Class A | | | 515,420 | | | | | 16,215,706 | | | | (521,781 | ) | | | | (16,215,706 | ) |
| |
| Dividends reinvested | | | 327,330 | | | | | 10,202,854 | | | | 5,464 | | | | | 169,430 | |
| |
| Net decrease | | | (1,945,862 | ) | | | | $(58,316,060 | ) | | | (642,270 | ) | | | | $(19,835,402 | ) |
| |
| For the year ended August 31, 2007: | | | | | | | | | | | | | | | | | | |
| |
| Shares sold | | | 336,576 | | | | | $10,727,532 | | | | 15,262 | | | | | $475,908 | |
| |
| Shares repurchased | | | (3,875,111 | ) | | | | (124,115,373 | ) | | | (404,788 | ) | | | | (12,574,484 | ) |
| |
| Shares converted from Class B to Class A | | | 1,364,379 | | | | | 43,544,750 | | | | (1,391,160 | ) | | | | (43,544,750 | ) |
| |
| Dividends reinvested | | | 310,647 | | | | | 9,791,587 | | | | 20,755 | | | | | 644,436 | |
| |
| Net decrease | | | (1,863,509 | ) | | | | $(60,051,504 | ) | | | (1,759,931 | ) | | | | $(54,998,890 | ) |
| |
| | | | | | | | | | | | | | | | | | | |
| | | | Class C | | | Class Y |
| | | |
| |
| For the year ended August 31, 2008: | | | Shares | | | | | Amount | | | | Shares | | | | | Amount | |
| |
| Shares sold | | | 71,145 | | | | | $2,115,806 | | | | 68,086 | | | | | $2,083,279 | |
| |
| Shares repurchased | | | (1,379,873 | ) | | | | (41,111,148 | ) | | | (308,043 | ) | | | | (9,440,003 | ) |
| |
| Dividends reinvested | | | 107,102 | | | | | 3,281,599 | | | | 48,902 | | | | | 1,543,833 | |
| |
| Net decrease | | | (1,201,626 | ) | | | | $(35,713,743 | ) | | | (191,055 | ) | | | | $(5,812,891 | ) |
| |
| For the year ended August 31, 2007: | | | | | | | | | | | | | | | | | | |
| |
| Shares sold | | | 83,181 | | | | | $2,587,025 | | | | 97,792 | | | | | $3,187,614 | |
| |
| Shares repurchased | | | (1,462,509 | ) | | | | (45,791,461 | ) | | | (2,238,875 | ) | | | | (71,674,800 | ) |
| |
| Dividends reinvested | | | 101,308 | | | | | 3,137,517 | | | | 91,737 | | | | | 2,928,243 | |
| |
| Net decrease | | | (1,278,020 | ) | | | | $(40,066,919 | ) | | | (2,049,346 | ) | | | | $(65,558,943 | ) |
| |
63
UBS U.S. Allocation Fund
Report of Ernst & Young LLP, independent registered public accounting firm
The Board of Trustees and Shareholders of
UBS U.S. Allocation Fund
We have audited the accompanying statement of assets and liabilities of UBS U.S. Allocation Fund (the sole series comprising UBS Investment Trust) (the “Fund”), including the portfolio of investments, as of August 31, 2008, and the related statement of operations for the year then ended, the statement of changes in net assets for each of the two years in the period then ended and the financial highlights for each of the five years in the period then ended. These financial statements and financial highlights are the responsibility of the Fund’s management. Our responsibility is to express an opinion on these financial statements and financial highlights based on our audits.
We conducted our audits in accordance with the standards of the Public Company Accounting Oversight Board (United States). Those standards require that we plan and perform the audit to obtain reasonable assurance about whether the financial statements and financial highlights are free of material misstatement. We were not engaged to perform an audit of the Fund’s internal control over financial reporting. Our audits included consideration of internal control over financial reporting as a basis for designing audit procedures that are appropriate in the circumstances, but not for the purpose of expressing an opinion on the effectiveness of the Fund’s internal control over financial reporting. Accordingly, we express no such opinion. An audit also includes examining, on a test basis, evidence supporting the amounts and disclosures in the financial statements and financial highlights, assessing the accounting principles used and significant estimates made by management and evaluating the overall financial statement presentation. Our procedures included confirmation of securities owned as of August 31, 2008, by correspondence with the custodian and others, or by other appropriate auditing procedures where replies from others were not received. We believe that our audits provide a reasonable basis for our opinion.
In our opinion, the financial statements and financial highlights referred to above present fairly, in all material respects, the financial position of UBS U.S. Allocation Fund at August 31, 2008, the results of its operations for the year then ended, the changes in its net assets for each of the two years in the period then ended, and the financial highlights for each of the five years in the period then ended, in conformity with U.S. generally accepted accounting principles.

New York, New York
October 29, 2008
64
UBS U.S. Allocation Fund
General information (unaudited)
Quarterly Form N-Q portfolio schedule
The Fund will file its complete schedule of portfolio holdings with the Securities and Exchange Commission (“SEC”) for the first and third quarters of each fiscal year on Form N-Q. The Fund’s Forms N-Q are available on the SEC’s Web site at http://www.sec.gov. The Fund’s Forms N-Q may be reviewed and copied at the SEC’s Public Reference Room in Washington, D.C. Information on the operation of the SEC’s Public Reference Room may be obtained by calling 1-800-SEC 0330. Additionally, you may obtain copies of Forms N-Q from the Fund upon request by calling 1-800-647 1568.
Proxy voting policies, procedures and record
You may obtain a description of the Fund’s (1) proxy voting policies, (2) proxy voting procedures and (3) information regarding how the Fund voted any proxies related to portfolio securities during the most recent 12-month period ended June 30 for which an SEC filing has been made, without charge, upon request by contacting the Fund directly at 1-800-647 1568, online on the Fund’s Web site: www.ubs.com/ubsglobalam-proxy, or on the EDGAR Database on the SEC’s Web site (http://www.sec.gov).
65
UBS U.S. Allocation Fund
Tax information (unaudited)
We are required by Subchapter M of the Internal Revenue Code of 1986, as amended, to advise you within 60 days of the Fund’s fiscal year end (August 31, 2008) as to the federal tax status of distributions received by shareholders during such fiscal year. The percentage of dividends paid that qualify for the dividends received deduction for corporate shareholders is 55.22%.
For the fiscal year ended August 31, 2008, certain dividends paid by UBS U.S. Allocation Fund may be subject to a maximum tax rate of 15%, as provided for by the Jobs and Growth Tax Relief Reconciliation Act of 2003. Of the distributions paid during the fiscal year, $16,373,654 represents the maximum amount that may be considered qualified dividend income.
Dividends received by tax-exempt recipients (e.g., IRAs and Keoghs) need not be reported as taxable income. Some retirement trusts (e.g., corporate, Keogh and 403(b)(7) plans) may need this information for their annual information reporting.
Since the Fund’s fiscal year is not the calendar year, another notification will be sent in respect of calendar year 2008. The second notification, which will reflect the amount to be used by calendar year taxpayers on their federal income tax returns, will be made in conjunction with Form 1099 DIV and will be mailed in January 2009. Shareholders are advised to consult their own tax advisers with respect to the tax consequences of their investment in the Fund.
66
UBS U.S. Allocation Fund
Board approval of investment advisory and administration agreement (unaudited)
Background—At a meeting of the board of UBS Investment Trust (the “Trust”) on July 16, 2008, the members of the board, including the trustees who are not “interested persons” of the Trust (“Independent Trustees”), as defined in the Investment Company Act of 1940, as amended (the “1940 Act”), considered and approved the continuance of the Investment Advisory and Administration Agreement of the Trust with respect to its series, UBS U.S. Allocation Fund (the “Fund”), with UBS Global Asset Management (Americas) Inc. (“UBS Global AM”). In preparing for the meeting, the board members had requested and received extensive information from UBS Global AM to assist them, including performance and expense information for other investment companies with similar investment objectives. The board received and considered a variety of information about UBS Global AM, as well as the advisory, administrative and distribution arrangements for the Fund. The board received materials detailing the administrative services provided to the Fund by UBS Global AM, which include providing accounting and financial analysis, ensuring that all financial and tax regulatory reporting requirements were met, certifying required Securities and Exchange Commission documentation and monitoring the performance of the Fund’s service providers.
The Independent Trustees also met for several hours the evening before the board meeting to discuss matters related to the Fund and other funds subject to their oversight and met again after management’s presentation was completed to review the disclosure that had been made to them at the meeting. At all of these sessions the Independent Trustees met in session with their independent legal counsel. The Independent Trustees also received a memorandum from their independent legal counsel discussing the duties of board members in considering approval of advisory and administration agreements.
In its consideration of the approval of the Investment Advisory and Administration Agreement, the board considered the following factors:
Nature, extent and quality of the services under the investment advisory and administration agreement—The board received and considered information regarding the nature, extent and quality of advisory services provided to the Fund by UBS Global AM under the Investment Advisory and Administration Agreement during the past year. The board considered the nature, extent and quality of administrative and
67
UBS U.S. Allocation Fund
Board approval of investment advisory and administration agreement (unaudited)
shareholder services performed by UBS Global AM and its affiliates. The board also considered the resources devoted to, and the record of compliance with, the Fund’s compliance policies and procedures. The board noted that it received information at regular meetings throughout the year regarding the services rendered by UBS Global AM concerning the management of the Fund’s affairs and UBS Global AM’s role in coordinating providers of other services to the Fund, including custody, accounting and transfer agency services. The board’s evaluation of the services provided by UBS Global AM took into account the board’s knowledge and familiarity gained as board members of funds in the UBS New York fund complex, including the scope and quality of UBS Global AM’s investment advisory and other capabilities and the quality of its administrative and other services. The board observed that the scope of services provided by UBS Global AM had expanded over time as a result of regulatory and other developments, including maintaining and monitoring its own and the Fund’s expanded compliance programs.
The board had available to it the qualifications, backgrounds and responsibilities of the Fund’s senior personnel at UBS Global AM and had received information regarding the person primarily responsible for the day-to-day portfolio management of the Fund and recognized that the Fund’s senior personnel at UBS Global AM report to the board regularly, some at every board meeting, and that at each regular meeting the board receives a report on the Fund’s performance. The board also considered, based on its knowledge of UBS Global AM and its affiliates, the financial resources available to UBS Global AM and its parent organization, UBS AG. In that regard, the board received extensive financial information regarding UBS Global AM and noted that it was a wholly owned, indirect subsidiary of one of the largest financial services firms in the world. It was also noted that UBS Global AM had well over $100 billion in assets under management and was part of the UBS Global Asset Management Division, which had well over $700 billion of assets under management worldwide as of March 2008. The board was also cognizant of, and considered, the regulatory and litigation actions and investigations occurring in the past year involving UBS AG, UBS Global AM and certain of their affiliates.
The board reviewed how transactions in Fund assets are effected. The board also reviewed the Fund’s brokerage policies and practices, the standards applied in seeking best execution, policies and practices regarding soft dollars, the use of a broker affiliated with UBS Global AM and the existence
68
UBS U.S. Allocation Fund
Board approval of investment advisory and administration agreement (unaudited)
of quality controls applicable to brokerage allocation procedures. In addition, UBS Global AM also reported to the board on, among other things, its disaster recovery plans and portfolio manager compensation plan.
The board concluded that, overall, it was satisfied with the nature, extent and quality of services provided (and expected to be provided) to the Fund under the Investment Advisory and Administration Agreement.
Advisory fees and expense ratios—The board reviewed and considered the contractual management fee (“Contractual Management Fee”) payable by the Fund to UBS Global AM in light of the nature, extent and quality of the advisory and administrative services provided by UBS Global AM. The board also reviewed and considered the written agreement between UBS Global AM and the Fund, which is separate from UBS Global AM’s investment advisory agreement with the Fund, whereby UBS Global AM has agreed to permanently reduce its management fee based on the Fund’s average daily net assets, which is discussed in more detail in the “Economies of scale” section, and considered the actual fee rate (after taking this agreement into account) (the “Actual Management Fee”). Additionally, the board received and considered information comparing the Fund’s Contractual Management Fee, Actual Management Fee and overall expenses with those of funds in a group of funds selected and provided by Lipper, Inc. (“Lipper”), an independent provider of investment company data (the “Expense Group”).
In connection with its consideration of the Fund’s advisory fees, the board also received information on UBS Global AM’s standard institutional account fees for accounts of a similar investment type to the Fund. The board noted that, in general, these fees were lower than the Contractual Management Fee and Actual Management Fee for the Fund, but also noted management’s explanation that comparisons with such accounts may be of limited relevance given the different structures and regulatory requirements of mutual funds versus such accounts and the differences in the levels of services required by mutual funds and such accounts. The board also received information on fees charged to other mutual funds managed by UBS Global AM.
In addition to the Contractual and Actual Management Fees, the board also reviewed and considered the total expenses for the Fund. The comparative Lipper information showed that the Fund’s Contractual Management Fee,
69
UBS U.S. Allocation Fund
Board approval of investment advisory and administration agreement (unaudited)
Actual Management Fee and total expenses were in the first quintile in the Fund’s Expense Group for the comparison periods utilized in the Lipper report (with the first quintile representing that fifth of the funds in the Expense group with the lowest level of fees or expenses, as applicable, and the fifth quintile representing that fifth of the funds in the Expense Group with the highest level of fees or expenses, as applicable).
Taking all of the above into consideration, the board determined that the management fee was reasonable in light of the nature, extent and quality of the services provided to the Fund under the Investment Advisory and Administration Agreement.
Fund performance—The board received and considered (a) annualized total return information of the Fund compared to other funds (the “Performance Universe”) selected by Lipper over the one-, three-, five-, ten-year and since inception periods ended April 30, 2008 and (b) annualized performance information for each year in the ten-year period ended April 30, 2008. The board was provided with a description of the methodology Lipper used to determine the similarity of the Fund with the funds included in its Performance Universe. The board also noted that it had received information throughout the year at periodic intervals with respect to the Fund’s performance, including with respect to its benchmark index.
The comparative Lipper information showed that the Fund’s performance was in the fifth quintile for the one-, three- and ten-year periods, the third quintile for the five-year period and the second quintile since inception (with the first quintile representing that fifth of the funds in the Performance Universe with the highest performance and the fifth quintile representing that fifth of the funds in the Performance Universe with the lowest performance). Management explained that the Fund’s slight underweights and overweights in certain sectors added value to the Fund’s performance; however, this was significantly overshadowed by poor security selection within both US equities and fixed income and securitized instruments. After having extended discussions regarding the Fund’s performance with the board, management indicated it would return to the board at a later meeting to discuss the strategic positioning of the Fund. Based on its review and management’s explanation, the board concluded that the Fund’s investment performance was acceptable.
70
UBS U.S. Allocation Fund
Board approval of investment advisory and administration agreement (unaudited)
Adviser profitability—The board received and considered a profitability analysis of UBS Global AM and its affiliates in providing services to the Fund. The board also received profitability information with respect to the UBS New York fund complex as a whole. UBS Global AM’s profitability was considered not excessive in light of the nature, extent and quality of the services provided to the Fund.
Economies of scale—The board received and considered information from management regarding whether UBS Global AM has achieved economies of scale with respect to the management of the Fund, whether the Fund has appropriately benefited from any economies of scale, and whether there is potential for realization of further economies of scale for the Fund. The board considered whether economies of scale in the provision of services to the Fund were being passed along to shareholders. The board also considered whether alternative fee structures (such as breakpoints) would be more appropriate or reasonable taking into consideration economies of scale or other efficiencies.
Although the board noted that the Fund’s Contractual Management Fee did not contain breakpoints, it recognized that the Trust had entered into an agreement with UBS Global AM, whereby UBS Global AM agreed to permanently reduce its Contractual Management Fee by utilizing breakpoints based on the Fund’s average daily net assets, thereby achieving the same effect as if the Contractual Management Fee contained breakpoints. The board also noted that as the Fund’s assets have increased over time, it has realized other economies of scale as certain expenses, such as fees for Trustees, auditors and legal fees, become a smaller percentage of overall assets.
Generally, in light of UBS Global AM’s profitability data and the Contractual Management Fee and Actual Management Fee currently in place, the board believed that UBS Global AM’s sharing of current economies of scale with the Fund was acceptable.
Other benefits to UBS Global AM—The board considered other benefits received by UBS Global AM and its affiliates as a result of its relationship with the Fund, including the opportunity to offer additional products and services to Fund shareholders.
71
UBS U.S. Allocation Fund
Board approval of investment advisory and administration agreement (unaudited)
In light of the costs of providing investment advisory, administrative and other services to the Fund and UBS Global AM’s ongoing commitment to the Fund, the profits and other ancillary benefits that UBS Global AM and its affiliates received were considered reasonable.
In light of all of the foregoing, the board approved the Investment Advisory and Administration Agreement to continue for another year.
In making its decision, the board identified no single factor as being determinative in approving the Investment Advisory and Administration Agreement. The Independent Trustees were advised by separate independent legal counsel throughout the entire process. The board discussed the proposed continuance of the Investment Advisory and Administration Agreement in a private session with their independent legal counsel at which no representatives of UBS Global AM were present.
72
(This page has been left blank intentionally)
73
UBS U.S. Allocation Fund
Supplemental information (unaudited)
Board of Trustees & Officers
The Trust is governed by a Board of Trustees which oversees the Portfolio’s operations. Each trustee serves an indefinite term of office. Officers are appointed by the trustees and serve at the pleasure of the Board. The table below shows, for each trustee and officer, his or her name, address and age, the position held with the Trust, the length of time served as a trustee and officer of the Trust, the trustee’s or officer’s principal occupations during the last five years, the number of portfolios in the UBS fund complex overseen by the trustee or for which a person served as an officer, and other directorships held by the trustee.
The Portfolio’s Statement of Additional Information contains additional information about the trustees and is available, without charge, upon request by calling 1-800-647 1568.
Interested Trustee
| Name, address, and age | | Position(s)
held with
Trust | | Term of
office† and
length of
time served | | Principal occupation(s)
during past 5 years |
|
Meyer Feldberg;†† 66
Morgan Stanley
1585 Broadway
33rd Floor
New York, NY 10036 | | Trustee | | Since 1996 | | Professor Feldberg is Dean Emeritus and Professor of Leadership and Ethics at Columbia Business School, although on an extended leave of absence. He is also a senior advisor to Morgan Stanley (financial services) (since March 2005). Professor Feldberg also serves as president of New York Global Partners (an organization located in part of the Office of the Mayor of the City of New York that promotes interaction with other cities around the world) (since May 2007). Prior to July 2004, he was Dean and Professor of Management of the Graduate School of Business at Columbia University (since 1989). |
74
UBS U.S. Allocation Fund
Supplemental information (unaudited)
Number of portfolios in fund complex
overseen by trustee | | Other directorships held by trustee |
|
| Professor Feldberg is a director or trustee of 30 investment companies (consisting of 62 portfolios) for which UBS Global AM or one of its affiliates serves as investment advisor, sub-advisor or manager. | | Professor Feldberg is also a director of Primedia Inc. (publishing), Macy’s, Inc. (operator of department stores), Revlon, Inc. (cosmetics) and SAPPI, Ltd. (producer of paper) and the New York City Ballet. |
75
UBS U.S. Allocation Fund
Supplemental information (unaudited)
| Independent Trustees | | | | | | |
| Name, address, and age | | Position(s)
held with
Trust | | Term of
office† and
length of
time served | | Principal occupation(s)
during past 5 years |
|
Richard Q. Armstrong; 73
c/o Willkie Farr & Gallagher LLP
787 Seventh Avenue
New York, NY 10019-6099 | | Trustee and Chairman of the Board of Trustees | | Since 1996 (Trustee) Since 2004 (Chairman of the Board of Trustees) | | Mr. Armstrong is chairman and principal of R.Q.A. Enterprises (management consulting firm) (since April 1991 and principal occupation since March 1995). |
| | | | | | | |
Alan S. Bernikow; 67
207 Benedict Ave.,
Staten Island, NY 10314 | | Trustee | | Since 2005 | | Mr. Bernikow is retired. He was a consultant on non-management matters for the firm of Deloitte & Touche (international accounting and consulting firm) (from June 2003 until 2007). Previously, he was deputy chief executive officer at Deloitte & Touche. |
| | | | | | | |
Richard R. Burt; 61
McLarty Associates
900 19th Street, 8th Floor
Washington DC 20006 | | Trustee | | Since 1996 | | Mr. Burt is a senior advisor to McLarty Associates (a consulting firm) and chairman of IEP Advisors (international investments and consulting firm). Prior to April 2007, he was chairman of Diligence Inc. (information and risk management firm). |
| | | | | | | |
Bernard H. Garil; 68
6754 Casa Grande Way
Delray Beach, FL 33446 | | Trustee | | Since 2005 | | Mr. Garil is retired (since 2001). He was a managing director at PIMCO Advisory Services (from 1999 to 2001) where he served as president of closed-end funds and vice-president of the variable insurance product funds advised by OpCap Advisors (until 2001). |
76
UBS U.S. Allocation Fund
Supplemental information (unaudited)
Number of portfolios in fund complex
overseen by trustee | | Other directorships held by trustee |
|
| Mr. Armstrong is a director or trustee of 17 investment companies (consisting of 49 portfolios) for which UBS Global AM or one of its affiliates serves as investment advisor, sub-advisor or manager. | | None |
| | | |
| Mr. Bernikow is a director or trustee of 17 investment companies (consisting of 49 portfolios) for which UBS Global AM or one of its affiliates serves as investment advisor, sub-advisor or manager. | | Mr. Bernikow is also a director of Revlon, Inc. (cosmetics) (and serves as the chair of its audit committee and as a member of its nominating and corporate governance committee), a director of Mack-Cali Realty Corporation (real estate investment trust) (and serves as the chair of its audit committee) and a director of the Casual Male Retail Group, Inc. (menswear) (and serves as a member of its audit committee and as a member of its nominating and corporate governance committee). |
| | | |
| Mr. Burt is a director or trustee of 17 investment companies (consisting of 49 portfolios) for which UBS Global AM or one of its affiliates serves as investment advisor, sub-advisor or manager. | | Mr. Burt is also a director of The Central European Fund, Inc., The Germany Fund, Inc., The New Germany Fund, Inc., IGT, Inc. (provides technology to gaming and wagering industry) and The Protective Group, Inc. (produces armor products). |
| | | |
| Mr. Garil is a director or trustee of 17 investment companies (consisting of 49 portfolios) for which UBS Global AM or one of its affiliates serves as investment advisor, sub-advisor or manager. | | Mr. Garil is also a director of OFI Trust Company (commercial trust company) and a trustee for the Brooklyn College Foundation, Inc. (charitable foundation). |
77
UBS U.S. Allocation Fund
Supplemental information (unaudited)
| Independent Trustees (concluded) | | | | |
| Name, address, and age | | Position(s)
held with
Trust | | Term of
office† and
length of
time served | | Principal occupation(s)
during past 5 years |
|
Heather R. Higgins; 49
255 E. 49th St., Suite 23D
New York, NY 10017 | | Trustee | | Since 2005 | | Ms. Higgins is the President and Director of The Randolph Foundation (charitable foundation) (since 1991). Ms. Higgins also serves on the boards of several non-profit charitable groups, including the Independent Women’s Forum (chairman), and the Philanthropy Roundtable (vice chairman). She had also served on the board of the Hoover Institute (executive committee) (1995–2000 and
2001–2007). |
78
UBS U.S. Allocation Fund
Supplemental information (unaudited)
Number of portfolios in fund complex
overseen by trustee | | Other directorships held by trustee |
|
| Ms. Higgins is a director or trustee of 17 investment companies (consisting of 49 portfolios) for which UBS Global AM or one of its affiliates serves as investment advisor, sub-advisor or manager. | | None |
79
UBS U.S. Allocation Fund
Supplemental information (unaudited)
| Officers | | | | | | |
Name, address,
and age | | Position(s)
held with
the Trust | | Term of
office† and
length of
time served | | Principal occupation(s) during
past 5 years; number of portfolios
in fund complex for which person
serves as officer |
|
| Joseph Allessie*; 43 | | Vice President and Assistant Secretary | | Since 2005 | | Mr. Allessie is a director (since 2007) (prior to which he was a director) and deputy general counsel (since 2005) at UBS Global Asset Management (US) Inc. and UBS Global Asset Management (Americas) Inc. (“UBS Global AM—Americas”) (collectively, “UBS Global AM—Americas region”). Prior to joining UBS Global AM—Americas region, he was senior vice president and general counsel of Kenmar Advisory Corp. (from 2004 to 2005). Prior to that Mr. Allessie was general counsel and secretary of GAM USA Inc., GAM Investments, GAM Services, GAM Funds, Inc. and the GAM Avalon Funds (from 1999 to 2004). Mr. Allessie is a vice president and assistant secretary of 21 investment companies (consisting of 105 portfolios) for which UBS Global AM—Americas region or one of its affiliates serves as investment advisor, sub-advisor or manager. |
| | | | | | | |
| Thomas Disbrow*; 42 | | Vice President and Treasurer | | Since 2000 (Vice President); Since 2004 (Treasurer) | | Mr. Disbrow is an executive director (since 2007)(prior to which he was a director) (since 2001) and head of the US mutual fund treasury administration department (since September 2006) of UBS Global AM—Americas region. Mr. Disbrow is a vice president and treasurer and/or principal accounting officer of 21 investment companies (consisting of 105 portfolios) for which UBS Global AM—Americas region or one of its affiliates serves as investment advisor, sub-advisor or manager. |
80
UBS U.S. Allocation Fund
Supplemental information (unaudited)
| Officers (continued) | | | | | | |
Name, address,
and age | | Position(s)
held with
the Trust | | Term of
office† and
length of
time served | | Principal occupation(s) during
past 5 years; number of portfolios
in fund complex for which person
serves as officer |
|
| Michael J. Flook*; 43 | | Vice President and Assistant Treasurer | | Since 2006 | | Mr. Flook is an associate director and a senior manager of the US mutual fund treasury administration department of UBS Global AM—Americas region (since 2006). Prior to joining UBS Global AM—Americas region, he was a senior manager with The Reserve (asset management firm) from May 2005 to May 2006. Prior to that he was a senior manager with PFPC Worldwide since October 2000. Mr. Flook is a vice president and assistant treasurer of 21 investment companies (consisting of 105 portfolios) for which UBS Global AM—Americas region or one of its affiliates serves as investment advisor, sub-advisor or manager. |
| | | | | | | |
| Mark F. Kemper**; 50 | | Vice President and Secretary | | Since 2004 | | Mr. Kemper is general counsel of UBS Global AM—Americas region (since 2004). Mr. Kemper also is a managing director of UBS Global AM—Americas region (since 2006). He was deputy general counsel of UBS Global AM—Americas from July 2001 to July 2004. He has been secretary of UBS Global AM—Americas since 1999 and assistant secretary of UBS Global Asset Management Trust Company since 1993. Mr. Kemper is secretary of UBS Global AM—Americas region (since 2004). Mr. Kemper is vice president and secretary of 21 investment companies (consisting of 105 portfolios) for which UBS Global AM—Americas region or one of its affiliates serves as investment advisor, sub-advisor or manager. |
81
UBS U.S. Allocation Fund
Supplemental information (unaudited)
| Officers (continued) | | | | | | |
Name, address,
and age | | Position(s)
held with
the Trust | | Term of
office† and
length of
time served | | Principal occupation(s) during
past 5 years; number of portfolios
in fund complex for which person
serves as officer |
|
| Joanne M. Kilkeary*; 40 | | Vice President and Assistant Treasurer | | Since 2004 | | Ms. Kilkeary is an director (since March 2008) (prior to which she was an associate director) (since 2000) and a senior manager (since 2004) of the US mutual fund treasury administration department of UBS Global AM—Americas region. Ms. Kilkeary is a vice president and assistant treasurer of 21 investment companies (consisting of 105 portfolios) for which UBS Global AM—Americas region or one of its affiliates serves as investment advisor, sub-advisor or manager. |
| | | | | | | |
| Tammie Lee*; 37 | | Vice President and Assistant Secretary | | Since 2005 | | Ms. Lee is a director and associate general counsel of UBS Global AM—Americas region (since 2005). Prior to joining UBS Global AM—Americas region, she was vice president and counsel at Deutsche Asset Management/Scudder Investments from 2003 to 2005. Prior to that she was assistant vice president and counsel at Deutsche Asset Management/Scudder Investments from 2000 to 2003. Ms. Lee is a vice president and assistant secretary of 21 investment companies (consisting of 105 portfolios) for which UBS Global AM—Americas region or one of its affiliates serves as investment advisor, sub-advisor or manager. |
82
UBS U.S. Allocation Fund
Supplemental information (unaudited)
| Officers (continued) | | | | | | |
Name, address,
and age | | Position(s)
held with
the Trust | | Term of
office† and
length of
time served | | Principal occupation(s) during
past 5 years; number of portfolios
in fund complex for which person
serves as officer |
|
| Steven J. LeMire*; 39 | | Vice President and Assistant Treasurer | | Since 2007 | | Mr. LeMire is a director and senior manager of the US mutual fund treasury administration department of UBS Global AM—Americas region (since October 2007). Prior to joining UBS Global AM—Americas region, he was an independent consultant with Third River Capital, LLC (formerly Two Rivers Capital, LLC) (from 2005 to 2007). Prior to that, he was vice president of operations and fund administration with Oberweis Asset Management, Inc. (from 1997 to 2005). Mr. LeMire is a vice president and assistant treasurer of 21 investment companies (consisting of 105 portfolios) for which UBS Global AM—Americas region or one of its affiliates serves as investment advisor, sub-advisor or manager. |
| | | | | | | |
| Joseph McGill*; 46 | | Vice President and Chief Compliance Officer | | Since 2004 | | Mr. McGill is a managing director (since 2006) and chief compliance officer (since 2003) at UBS Global AM—Americas region. Prior to joining UBS Global AM—Americas region, he was assistant general counsel at J.P. Morgan Investment Management (from 1999 to 2003). Mr. McGill is a vice president and chief compliance officer of 21 investment companies (consisting of 105 portfolios) for which UBS Global AM—Americas region or one of its affiliates serves as investment advisor, sub-advisor or manager. |
83
UBS U.S. Allocation Fund
Supplemental information (unaudited)
| Officers (continued) | | | | | | |
Name, address,
and age | | Position(s)
held with
the Trust | | Term of
office† and
length of
time served | | Principal occupation(s) during
past 5 years; number of portfolios
in fund complex for which person
serves as officer |
|
| Nancy D. Osborn*; 42 | | Vice President and Assistant Treasurer | | Since 2006 | | Mrs. Osborn is an associate director and a senior manager of the US mutual fund treasury administration department of UBS Global AM—Americas region (since 2006). Prior to joining UBS Global AM—Americas region, she was an Assistant Vice President with Brown Brothers Harriman since April 1996. Mrs. Osborn is a vice president and assistant treasurer of 21 investment companies (consisting of 105 portfolios) for which UBS Global AM—Americas region or one of its affiliates serves as investment advisor, sub-advisor or manager. |
| | | | | | | |
| Eric Sanders*; 43 | | Vice President and Assistant Secretary | | Since 2005 | | Mr. Sanders is a director and associate general counsel of UBS Global AM—Americas region (since 2005). From 1996 until June 2005, he held various positions at Fred Alger & Company, Incorporated, the most recent being assistant vice president and associate general counsel. Mr. Sanders is a vice president and assistant secretary of 21 investment companies (consisting of 105 portfolios) for which UBS Global AM—Americas region or one of its affiliates serves as investment advisor, sub-advisor or manager. |
84
UBS U.S. Allocation Fund
Supplemental information (unaudited)
| Officers (continued) | | | | | | |
Name, address,
and age | | Position(s)
held with
the Trust | | Term of
office† and
length of
time served | | Principal occupation(s) during
past 5 years; number of portfolios
in fund complex for which person
serves as officer |
|
| Andrew Shoup*; 52 | | Vice President and Chief Operating Officer | | Since 2006 | | Mr. Shoup is a managing director and global head of the fund treasury administration department of UBS Global AM—Americas region (since July 2006). Prior to joining UBS Global AM—Americas region, he was chief administrative officer for the Legg Mason Partner Funds (formerly Smith Barney, Salomon Brothers, and CitiFunds mutual funds) from November 2003 to July 2006. Prior to that, he held various positions with Citigroup Asset Management and related companies with their domestic and offshore mutual funds since 1993. Additionally, he has worked for another mutual fund complex as well as spending eleven years in public accounting. Mr. Shoup is a vice president and chief operating officer of 21 investment companies (consisting of 105 portfolios) for which UBS Global AM—Americas region or one of its affiliates serves as investment advisor, sub-advisor or manager. |
85
UBS U.S. Allocation Fund
Supplemental information (unaudited)
| Officers (unaudited) | | | | | | |
Name, address,
and age | | Position(s)
held with
the Trust | | Term of
office† and
length of
time served | | Principal occupation(s) during
past 5 years; number of portfolios
in fund complex for which person
serves as officer |
|
| Kai R. Sotorp**; 49 | | President | | Since 2006 | | Mr. Sotorp is the Head-Americas for UBS Global Asset Management (since 2004); a member of the UBS Group Managing Board (since 2003) and a member of the UBS Global Asset Management Executive Committee (since 2001). Prior to his current role, Mr. Sotorp was head of UBS Global Asset Management—Asia Pacific (2002–2004), covering Australia, Japan, Hong Kong, Singapore and Taiwan; head of UBS Global Asset Management (Japan) Ltd. (2001–2004); representative director and president of UBS Global Asset Management (Japan) Ltd. (2000–2004); and member of the board of Mitsubishi Corp.—UBS Realty Inc. (2000–2004). Mr. Sotorp is president of 21 investment companies (consisting of 105 portfolios) for which UBS Global Asset Management—Americas region or one of its affiliates serves as investment advisor, sub-advisor or manager. |
86
UBS U.S. Allocation Fund
Supplemental information (unaudited)
| Officers (concluded) | | | | | | |
Name, address,
and age | | Position(s)
held with
the Trust | | Term of
office† and
length of
time served | | Principal occupation(s) during
past 5 years; number of portfolios
in fund complex for which person
serves as officer |
|
| Keith A. Weller*; 47 | | Vice President and Assistant Secretary | | Since 1996 | | Mr. Weller is an executive director and senior associate general counsel of UBS Global AM—Americas region (since 2005) and has been an attorney with affiliated entities since 1995. Mr. Weller is a vice president and assistant secretary of 21 investment companies (consisting of 105 portfolios) for which UBS Global AM—Americas region or one of its affiliates serves as investment advisor, sub-advisor or manager. |
| * | | This person’s business address is 51 West 52nd Street, New York, New York 10019-6114. |
| | | |
| ** | | This person’s business address is One North Wacker Drive, Chicago, Illinois 60606. |
| | | |
| † | | Each trustee holds office for an indefinite term. Each trustee who has attained the age of seventy-five (75) years will be subject to retirement on the last day of the month in which he or she attains such age. Officers of the Trust are appointed by the trustees and serve at the pleasure of the Board. |
| | | |
| †† | | Professor Feldberg is deemed an “interested person” of the Trust as defined in the Investment Company Act because he is a senior advisor to Morgan Stanley, a financial services firm with which the Portfolio may conduct transactions. |
87
(This page has been left blank intentionally)
88
| Trustees | | |
| Richard Q. Armstrong | | Meyer Feldberg |
| Chairman | | |
| | | Bernard H. Garil |
| Alan S. Bernikow | | |
| | | Heather R. Higgins |
| Richard R. Burt | | |
| | | |
| Principal Officers | | |
| Kai R. Sotorp | | Thomas Disbrow |
| President | | Vice President and Treasurer |
| | | |
| Mark F. Kemper | | |
| Vice President and Secretary | | |
| | | |
Investment Advisor and Administrator
| | |
UBS Global Asset Management (Americas) Inc.
51 West 52nd Street
New York, New York 10019-6114 | | |
| | | |
| Principal Underwriter | | |
UBS Global Asset Management (US) Inc.
51 West 52nd Street
New York, New York 10019-6114 | | |
This report is not to be used in connection with the offering of shares of the Fund unless accompanied or preceded by an effective prospectus.
© 2008 UBS Global Asset Management (Americas) Inc. All rights reserved.
PRESORTED
STANDARD
U.S. POSTAGE
PAID
COMPUTERSHARE |
UBS Global Asset Management (Americas) Inc.
51 West 52nd Street
New York, New York 10019-6114
Item 2. Code of Ethics.
The registrant has adopted a code of ethics that applies to its principal executive officer, principal financial officer, principal accounting officer or controller, or persons performing similar functions pursuant to Section 406 of the Sarbanes-Oxley Act of 2002. (The registrant has designated the code of ethics adopted pursuant to Sarbanes-Oxley as a “Code of Conduct” to lessen the risk of confusion with its separate code of ethics adopted pursuant to Rule 17j-1 under the Investment Company Act of 1940, as amended.)
Item 3. Audit Committee Financial Expert.
The registrant’s Board has determined that the following person serving on the registrant’s Audit committee is an “audit committee financial expert” as defined in item 3 of Form N-CSR: Alan S. Bernikow. Mr. Bernikow is independent as defined in item 3 of Form N-CSR.
Item 4. Principal Accountant Fees and Services.
| | (a) | Audit Fees: |
| | | For the fiscal years ended August 31, 2008 and August 31, 2007, the aggregate Ernst & Young LLP (E&Y) audit fees for professional services rendered to the registrant were approximately $57,000 and $57,000, respectively. |
| | | |
| | | Fees included in the audit fees category are those associated with the annual audits of financial statements and services that are normally provided in connection with statutory and regulatory filings. |
| | | |
| | (b) | Audit-Related Fees: |
| | | In each of the fiscal years ended August 31, 2008 and August 31, 2007, the aggregate audit- related fees billed by E&Y for services rendered to the registrant that are reasonably related to the performance of the audits of the financial statements, but not reported as audit fees, were approximately $2,500 and $3,700, respectively. |
| | | |
| | | Fees included in the audit-related category are those associated with (1) the reading and providing of comments on the 2008 and 2007 semiannual financial statements and (2) review of the consolidated 2006 reports on the profitability of the UBS Funds to UBS Global Asset Management (US) Inc. and its affiliates to assist the board members in their annual advisory/administration contract and service/distribution plan reviews. |
| | | |
| | | There were no audit-related fees required to be approved pursuant to paragraph (c)(7)(ii) of Rule 2-01 of Regulation S-X during the fiscal years indicated above. |
| | | |
| | (c) | Tax Fees: |
| | | In each of the fiscal years ended August 31, 2008 and August 31, 2007, the aggregate tax fees billed by E&Y for professional services rendered to the registrant were approximately $11,140 and $14,200, respectively. |
| | | |
| | | Fees included in the tax fees category comprise all services performed by professional staff in the independent accountant’s tax division except those services related to the audits. This category comprises fees for review of tax compliance, tax return preparation and excise tax calculations. |
| | | |
| | | There were no tax fees required to be approved pursuant to paragraph (c)(7)(ii) of Rule 2-01 of Regulation S-X during the fiscal years indicated above. |
| | | |
| | (d) | All Other Fees: |
| | | In each of the fiscal years ended August 31, 2008 and August 31, 2007, there were no fees billed by E&Y for products and services, other than the services reported in Item 4(a)-(c) above, rendered to the registrant. |
| | | |
| | | Fees included in the all other fees category would consist of services related to internal control reviews, strategy and other consulting, financial information systems design and implementation, consulting on other information systems, and other tax services unrelated to the registrant. |
| | | |
| | | There were no “all other fees” required to be approved pursuant to paragraph (c)(7)(ii) of Rule 2-01 of Regulation S-X during the fiscal years indicated above. |
| | | |
| | (e) | (1) | Audit Committee Pre-Approval Policies and Procedures: |
| | | | The registrant’s Audit Committee (“audit committee”) has adopted an “Audit Committee Charter (Amended and Restated as of May 12, 2004 – with revisions through June 2008)” (the “charter”). The charter contains the audit committee’s pre-approval policies and procedures. Reproduced below is an excerpt from the charter regarding pre-approval policies and procedures: |
| | The [audit] Committee shall: |
| |
| | ... |
| |
| | | | |
| | 2. | Pre-approve (a) all audit and permissible non-audit services1 to be provided to the Fund and (b) all permissible non-audit services to be provided by the Fund’s independent auditors to UBS Global [Asset Management (Americas) Inc. (“UBS Global AM”)] and any Covered Service Providers, if the engagement relates directly to the operations and financial reporting of the Fund. In carrying out this responsibility, the Committee shall seek periodically from UBS Global [AM] and from the independent auditors a list of such audit and permissible non-audit services that can be expected to be rendered to the Fund, UBS Global [AM] or any Covered Service Providers by the Fund’s independent auditors, and an estimate of the fees sought to be paid in connection with such services. The Committee may delegate its responsibility to pre-approve any such audit and permissible non-audit services to a sub-committee consisting of the Chairperson of the Committee and two other members of the Committee as the Chairperson, from time to time, may determine and appoint, and such sub-committee shall report to the Committee, at its next regularly scheduled meeting after the sub-committee’s meeting, its decision(s). From year to year, the Committee shall report to the Board whether this system of pre-approval has been effective and efficient or whether this Charter should be amended to allow for pre-approval pursuant to such policies and procedures as the Committee shall approve, including the delegation of some or all of the Committee’s pre-approval responsibilities to other persons (other than UBS Global [AM] or the Fund’s officers). |
| |
|
| | | 1 The Committee will not approve non-audit services that the Committee believes may taint the independence of the auditors. Currently, permissible non-audit services include any professional services (including tax services) that are not prohibited services as described below, provided to the Fund by the independent auditors, other than those provided to the Fund in connection with an audit or a review of the financial statements of the Fund. Permissible non-audit services may not include: (i) bookkeeping or other services related to the accounting records or financial statements of the Fund; (ii) financial information systems design and implementation; (iii) appraisal or valuation services, fairness opinions or contribution-in-kind reports; (iv) actuarial services; (v) internal audit outsourcing services; (vi) management functions or human resources; (vii) broker or dealer, investment adviser or investment banking services; (viii) legal services and expert services unrelated to the audit; and (ix) any other service the Public Company Accounting Oversight Board determines, by regulation, is impermissible. |
| | | |
| | | Pre-approval by the Committee of any permissible non-audit services is not required so long as: (i) the aggregate amount of all such permissible non-audit services provided to the Fund, UBS Global [AM] and any service providers controlling, controlled by or under common control with UBS Global [AM] that provide ongoing services to the Fund (“Covered Service Providers”) constitutes not more than 5% of the total amount of revenues paid to the independent auditors (during the fiscal year in which the permissible non-audit services are provided) by (a) the Fund, (b) its investment adviser and (c) any entity controlling, controlled by, or under common control with the investment adviser that provides ongoing services to the Fund during the fiscal year in which the services are provided that would have to be approved by the Committee; (ii) the permissible non-audit services were not recognized by the Fund at the time of the engagement to be non-audit services; and (iii) such services are promptly brought to the attention of the Committee and approved by the Committee (or its delegate(s)) prior to the completion of the audit. |
| | (e) | (2) | Services approved pursuant to paragraph (c)(7)(i)(C) of Rule 2-01 of Regulation S-X: |
| | | | |
| | | | Audit-Related Fees: |
| | | There were no amounts that were approved by the audit committee pursuant to the de minimis exception for the fiscal years ended August 31, 2008 and August 31, 2007 on behalf of the registrant. |
| | | |
| | | There were no amounts that were required to be approved by the audit committee pursuant to the de minimis exception for the fiscal years ended August 31, 2008 and August 31, 2007 on behalf of the registrant’s service providers that relate directly to the operations and financial reporting of the registrant. |
| | | |
| | | Tax Fees: |
| | | There were no amounts that were approved by the audit committee pursuant to the de minimis exception for the fiscal years ended August 31, 2008 and August 31, 2007 on behalf of the registrant. |
| | | |
| | | There were no amounts that were required to be approved by the audit committee pursuant to the de minimis exception for the fiscal years ended August 31, 2008 and August 31, 2007 on behalf of the registrant’s service providers that relate directly to the operations and financial reporting of the registrant. |
| | | |
| | | All Other Fees: |
| | | There were no amounts that were approved by the audit committee pursuant to the de minimis exception for the fiscal years ended August 31, 2004 and August 31, 2003 on behalf of the registrant. |
| | | |
| | | There were no amounts that were required to be approved by the audit committee pursuant to the de minimis exception for the fiscal years ended August 31, 2008 and August 31, 2007 on behalf of the registrant’s service providers that relate directly to the operations and financial reporting of the registrant. |
| | (f) | According to E&Y, for the fiscal year ended August 31, 2008, the percentage of hours spent on the audit of the registrant’s financial statements for the most recent fiscal year that were attributed to work performed by persons who are not full-time, permanent employees of E&Y was 0%. |
| | (g) | For the fiscal years ended August 31, 2008 and August 31, 2007, the aggregate fees billed by E&Y of $1,622,010 and $1,863,815, respectively, for non-audit services rendered on behalf of the registrant (“covered”), its investment adviser (not including any sub-adviser whose role is primarily portfolio management and is subcontracted with or overseen by another investment adviser) and any entity controlling, controlled by, or under common control with the adviser (“non-covered”) that provides ongoing services to the registrant for each of the last two fiscal years of the registrant is shown in the table below: |
| | | | | 2008 | | | 2007 |
| | | | |
| | |
|
| | | Covered Services | | $13,640 | | | $17,900 |
| | | Non-Covered Services | | 1,608,370 | | | 1,845,915 |
| | (h) | The registrant’s audit committee was not required to consider whether the provision of non-audit services that were rendered to the registrant’s investment adviser (not including any sub-adviser whose role is primarily portfolio management and is subcontracted with or overseen by another investment adviser), and any entity controlling, controlled by, or under common control with the investment adviser that provides ongoing services to the registrant that were not pre-approved pursuant to paragraph (c)(7)(ii) of Rule 2-01 of Regulation S-X is compatible with maintaining the principal accountant’s independence. |
Item 5. Audit Committee of Listed Registrants.
Not applicable to the registrant.
Item 6. Schedule of Investments.
| | (a) | Included as part of the report to shareholders filed under Item 1 of this form. |
| | (b) | Not applicable. |
Item 7. Disclosure of Proxy Voting Policies and Procedures for Closed-End Management Investment Companies.
Not applicable to the registrant.
Item 8. Portfolio Managers of Closed-End Management Investment Companies.
Not applicable to the registrant.
Item 9. Purchases of Equity Securities by Closed-End Management Investment Company and Affiliated Purchasers.
Not applicable to the registrant.
Item 10. Submission of Matters to a Vote of Security Holders.
The registrant’s Board has established a Nominating and Corporate Governance Committee. The Nominating and Corporate Governance Committee will consider nominees recommended by shareholders if a vacancy occurs among those board members who are not “interested persons” as defined in Section 2(a)(19) of the Investment Company Act of 1940, as amended. In order to recommend a nominee, a shareholder should send a letter to the chairperson of the Nominating and Corporate Governance Committee, Richard R. Burt, care of the Secretary of the registrant at UBS Global Asset Management (Americas) Inc., 51 West 52nd Street, New York, New York 10019-6114, and indicate on the envelope “Nominating and Corporate Governance Committee.” The shareholder’s letter should state the nominee’s name and should include the nominee’s resume or curriculum vitae, and must be accompanied by a written consent of the individual to stand for election if nominated for the Board and to serve if elected by shareholders.
Item 11. Controls and Procedures.
| | (a) | The registrant’s principal executive officer and principal financial officer have concluded that the registrant’s disclosure controls and procedures (as defined in Rule 30a-3(c) under the Investment Company Act of 1940, as amended) are effective based on their evaluation of these controls and procedures as of a date within 90 days of the filing date of this document. |
| | | |
| | (b) | The registrant’s principal executive officer and principal financial officer are aware of no changes in the registrant’s internal control over financial reporting that occurred during the registrant’s most recent fiscal half-year that has materially affected, or is reasonably likely to materially affect, the registrant’s internal control over financial reporting. |
| | | |
| Item 12. Exhibits. |
| | | |
| | (a) | (1) Code of Ethics as required pursuant to Section 406 of the Sarbanes-Oxley Act of 2002 (and designated by the registrant as a “Code of Conduct”) is incorporated by refernce herein from Exhibit Ex-99.CODE ETH to the registrant’s Report on Form N-CSR filed November 9, 2004 (Accession Number: 0000950136-04-003777) (SEC File No. 811-06292). |
| | | |
| | (a) | (2) Certifications of principal executive officer and principal financial officer pursuant to Section 302 of the Sarbanes-Oxley Act of 2002 is attached hereto as Exhibit EX-99.CERT. |
| | | |
| | (a) | (3) Written solicitation to purchase securities under Rule 23c-1 under the Investment Company Act of 1940 sent or given during the period covered by the report by or on behalf of the registrant to 10 or more persons – not applicable to the registrant. |
| | | |
| | (b) | Certifications of principal executive officer and principal financial officer pursuant to Section 906 of the Sarbanes-Oxley Act of 2002 is attached hereto as Exhibit EX-99.906CERT. |
SIGNATURES
Pursuant to the requirements of the Securities Exchange Act of 1934 and the Investment Company Act of 1940, the registrant has duly caused this report to be signed on its behalf by the undersigned, thereunto duly authorized.
UBS Investment Trust
| By: | | /s/ Kai R. Sotorp |
| | | Kai R. Sotorp |
| | | President |
| | | |
| Date: | | November 10, 2008 |
Pursuant to the requirements of the Securities Exchange Act of 1934 and the Investment Company Act of 1940, this report has been signed below by the following persons on behalf of the registrant and in the capacities and on the dates indicated.
| By: | | /s/ Kai R. Sotorp |
| | | Kai R. Sotorp |
| | | President |
| | | |
| Date: | | November 10, 2008 |
| | | |
| By: | | /s/ Thomas Disbrow |
| | | Thomas Disbrow |
| | | Vice President and Treasurer |
| | | |
| Date: | | November 10, 2008 |
