| Exhibit (a)(7) |

September 2, 2004
Fairness Opinion Presentation

I.
Background of Transaction Process
II.
Overview of Rag Shops
III.
Stock Performance and Trading Statistics
IV.
Valuation Analysis
Appendix
A.
Public Reference Company Analysis
B.
M&A Transaction Analysis
C.
Premiums Paid Analysis
Table of Contents
Outline
Background of Transaction Process
Transaction Timeline
February 24, 2004: Rag Shops engaged SunTrust Robinson Humphrey (“STRH”)
February 25, 2004: Issued a press release announcing STRH’s engagement to review possible
strategic alternatives
March 5, 2004: Initial due diligence meeting with Company
Week of April 19, 2004: Began contacting potential buyers, executing confidentiality
agreements (“CA’s”) and sending out confidential memorandums
May 26, 2004: Letters requesting indications of interest sent to potential buyers
June 3, 2004: Indications of interest received
Weeks of June 14, 21 and 28, 2004:Management meetings held
July 13, 2004: Letters requesting second round proposals sent and one additional management
meeting held
July 22-27, 2004:Four offers received
4

Overview of Contact History
Background of Transaction Process
5
Companies contacted:
115
Strategic buyers
29
Financial buyers
86
Companies signing CA and receiving confidential materials:
36
Strategic buyers
4
Financial buyers
32
Initial Indications of Interest Received
7
Offers Received
4
Recent Valuation Parameters
Background of Transaction Process
$ in thousands (except per share amounts)
Average Daily Volume & Price
Average Stock Price
1 Week
$3.65
1 Month
$3.42
3 Months
$3.33
6 Months
$3.57
Average Trading Volume
1 Week
1,585
1 Month
2,479
3 Months
2,006
6 Months
2,115
Capitalization
Stock Price as of 08/30/04
$3.61
Shares Outstanding (000's)
4,798
Market Capitalization
$17,321
Cash & Cash Equivalents [1]
$0
Debt [1]
$3,920
Firm Value
$21,241
Stockholders' Equity
$21,869
[1] As of July 31,2004.
[2] Projections provided by management.
Current Market Multiple Analysis
Firm Value to:
LTM Revenue ($117,695)
0.18
x
2004 Revenue ($118,248) [2]
0.18
2005 Revenue ($128,303) [2]
0.17
Firm Value to:
LTM EBITDA (-$152)
NM
x
2004 EBITDA (-$748) [2]
NM
2005 EBITDA ($1629) [2]
13.0
Price to:
LTM EPS (-$0.22)
NM
x
2004 EPS (-$0.29) [2]
NM
2005 EPS ($0.01) [2]
243.6
6

Sun Capital Offer
Background of Transaction Process
[1] As of July 31,2004.
Equity
Enterprise
Company
Offer
Value
Debt [1]
Cash [1]
Value
Sun Capital
$4.30
$20,844
$3,920
$0
$24,764
LTM Mutiples
2004 Multiples
Revenue
EBITDA
P/E
Revenue
EBITDA
P/E
0.21x
NM
NM
0.21x
NM
NM
Premium Analysis
30 Day
6 Month
February 24,
Company
Offer
Current Price
Average
Average
2004
$3.61
$3.37
$3.56
$3.65
Sun Capital
$4.30
19.1%
27.8%
20.8%
17.8%
7
Retailer of craft, floral, fabric, framing and home décor products used for creative
activities
68 stores in New Jersey (35), Florida (19), Pennsylvania (6), New York (5) and
Connecticut (3)
Founded in 1963 as retailer of fabrics
Modest growth through the ‘60s and ‘70s in New Jersey and New York
Added crafts in early 1980s
Expanded in new geographic markets during 1980s and early 1990s including Florida,
Pennsylvania, New York and Connecticut
IPO in 1991
Scaled back expansion in 1994
Store count today is same as in 1994
Company Summary
Overview of Rag Shops
8
Note: Gross profit for fiscal 2003, eleven months ended August 2, 2003, eleven months ended July 31, 2004 and the LTM period ended July 31, 2004 includes
$814,000, $638,000, $580,000 and $756,000 respectively in deferred income. This income arose from the transfer of ownership to the Company of certain inventories
(similar to consignment). All income realizable under these arrangements will be recognized by 2004.
[1] Operating profit for fiscal 2002 excludes $181,000 related to a gain from the demutualization of an insurance company with whom the Company maintained
certain life insurance policies. Operating profit for the LTM ended July 31, 2004 excludes $161,000 related to a gain from the sale of securities.
Historical Income Statements
Overview of Rag Shops
Fiscal Year Ended
LTM Ended
August 29,
August 28,
September 2,
September 1,
August 31,
August 30,
August 2,
July 31,
July 31,
1998
1999
2000
2001
2002
2003
2003
2004
2004
Total Revenue
$90,566
$94,781
$100,208
$100,888
$110,672
$115,547
$108,312
$110,459
$117,695
Growth Rate
0.0%
4.7%
5.7%
0.7%
9.7%
4.4%
NA
NA
3.9%
Cost of Goods Sold
57,794
60,866
63,665
66,881
73,067
76,932
59,921
60,671
77,682
Gross Profit
32,772
33,915
36,543
34,007
37,605
38,615
48,391
49,789
40,013
% of Total Revenue
36.2%
35.8%
36.5%
33.7%
34.0%
33.4%
44.7%
45.1%
34.0%
Selling, General & Administrative Expenses
31,167
33,163
34,582
33,992
37,117
39,643
49,538
51,504
41,609
Operating Profit [1]
1,605
752
1,960
15
488
(1,028)
(1,147)
(1,716)
(1,597)
% of Total Revenue
1.8%
0.8%
2.0%
0.0%
0.4%
NM
-1.1%
-1.6%
NM
Interest Income, (Expense)
(61)
(83)
31
128
37
(8)
0
0
(8)
Other Income
0
0
198
0
0
0
(39)
179
218
Pretax Income
1,544
668
2,189
143
525
(1,036)
(1,186)
(1,536)
(1,387)
Income Tax Expense
603
267
793
97
317
(331)
0
0
(331)
Net Income
$942
$402
$1,396
$46
$208
($705)
($1,186)
($1,536)
($1,056)
EBITDA
$2,972
$2,123
$3,375
$1,292
$1,712
$189
$101
($240)
($152)
% of Total Revenue
3.3%
2.2%
3.4%
1.3%
1.5%
0.2%
0.1%
-0.2%
NM
Depreciation & Amortization
$1,367
$1,371
$1,415
$1,276
$1,225
$1,217
$1,248
$1,476
$1,445
Capex
$1,579
$591
$1,890
$1,359
$1,581
$1,538
$1,347
$1,390
# of Stores
69
65
66
68
68
68
68
68
Eleven Months Ended
9
[1] Excludes extraordinary items.
Historical Income Statement Analysis
Overview of Rag Shops
Fiscal Year Ended
August 28,
September 2,
September 1,
August 31,
August 30,
1999
2000
2001
2002
2003
Year-over-year growth
Net sales
4.7%
5.7%
0.7%
9.7%
4.4%
EBITDA
-28.6%
59.0%
-61.7%
32.6%
-89.0%
Operating income
-53.2%
160.9%
-99.2%
3059.7%
-310.8%
Net income [1]
-57.3%
247.7%
-96.7%
351.4%
-438.8%
Diluted EPS [1]
-60.0%
262.5%
-96.7%
349.6%
-440.8%
Margin analysis
EBITDA
2.2%
3.4%
1.3%
1.5%
0.2%
Operating income
0.8%
2.0%
0.0%
0.4%
NM
Net income [1]
0.4%
1.4%
0.0%
0.2%
NM
2000 - 2003
1999 - 2003
CAGRs
Net sales
4.9%
5.1%
EBITDA
-61.8%
-45.4%
Operating income
NM
NM
Net income [1]
NM
NM
Diluted EPS [1]
NM
NM
10
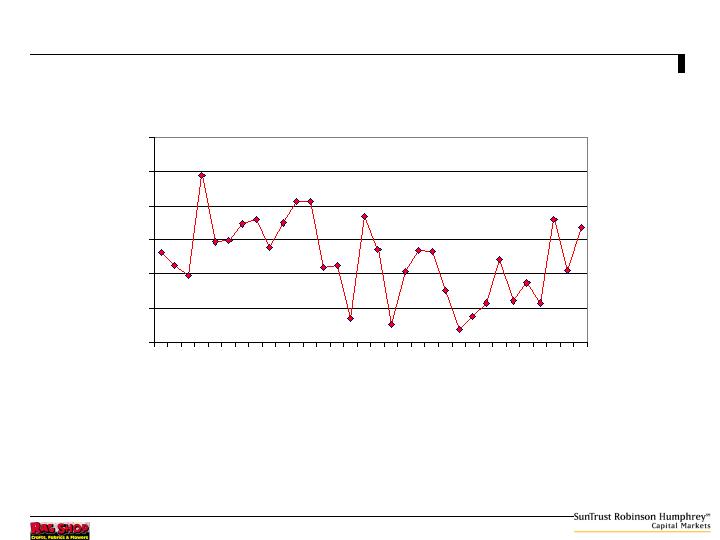
(8.0%)
(4.0%)
0.0%
4.0%
8.0%
12.0%
16.0%
Sept.
'01
Dec.
'01
Mar.
'02
June
'02
Sept.
'02
Dec.
'02
March
'03
June
'03
Sept.
'03
Dec.
'03
March
'04
Same Store Sales Growth
Overview of Rag Shops
11
Note: Gross profit beginning in the quarter ended May 31, 2003 includes deferred income. This income arose from the transfer of ownership to the Company of
certain inventories (similar to consignment). All income realizable under these arrangements will be recognized by 2004.
[1] Operating profit for the quarter ended February 28, 2004 excludes $161,000 related to a gain from the sale of securities.
[2] Operating profit for fiscal 2002 excludes $181,000 related to a gain from the demutualization of an insurance company with whom the Company maintained
certain life insurance policies.
Historical Quarterly Performance
3 Quarter ending May 29, 2004
rd
Sales down $675,000, or 2.4%, versus same period last year.
EBITDA was negative $478,000, down $363,000, or 316% versus same period last year.
Overview of Rag Shops
Quarter Ended
12/1/2001
3/2/2002
6/1/2002
8/31/2002
11/30/2002
3/1/2003
5/31/2003
8/30/2003
Total Revenue
$32,552
$28,931
$25,523
$23,666
$33,357
$30,672
$27,920
$23,598
Growth Rate
(11.1%)
(11.8%)
(7.3%)
40.9%
(8.0%)
(9.0%)
(15.5%)
Cost of Goods Sold
20,271
18,900
16,587
17,502
21,686
20,675
18,733
15,838
Gross Profit
12,281
10,031
8,936
6,164
11,671
9,997
9,187
7,760
% of Total Revenue
37.7%
34.7%
35.0%
26.0%
35.0%
32.6%
32.9%
32.9%
Selling, General & Administrative Expenses
10,008
9,839
8,802
8,275
10,737
9,837
9,646
9,422
Operating Profit [2]
2,273
192
134
(2,111)
934
160
(459)
(1,662)
% of Total Revenue
7.0%
0.7%
0.5%
NM
2.8%
0.5%
NM
NM
Interest Income, (Expense)
5
20
14
(2)
(5)
6
1
(10)
Other Income
0
0
0
0
0
0
0
0
Pretax Income
2,278
212
148
(2,113)
929
166
(458)
(1,672)
Income Tax Expense
888
83
58
(712)
418
75
(207)
(617)
Net Income
$1,390
$129
$90
($1,401)
$511
$91
($251)
($1,055)
EBITDA
$2,599
$521
$469
($1,877)
$1,265
$491
($115)
($1,452)
% of Total Revenue
8.0%
1.8%
1.8%
NM
3.8%
1.6%
NM
NM
11/29/2003
2/28/2004
5/29/2004
$33,814
$32,268
$27,245
43.3%
(4.6%)
(15.6%)
22,310
21,356
18,243
11,504
10,912
9,002
34.0%
33.8%
33.0%
11,080
10,524
9,935
424
388
[1]
(933)
1.3%
1.2%
NM
(25)
1
(9)
0
0
0
399
389
(942)
155
206
(342)
$244
$183
($600)
$783
$787
($478)
2.3%
2.4%
NM
12
Fiscal Year Ending August
2004
2005
2006
2007
Total Revenue
$118,248
$128,303
$139,068
$154,050
Growth Rate
2.3%
8.5%
8.4%
10.8%
Cost of Goods Sold [1]
64,331
69,213
74,520
82,415
% of Total Revenue
54.4%
53.9%
53.6%
53.5%
Gross Profit [1]
53,918
59,090
64,548
71,635
% of Total Revenue
45.6%
46.1%
46.4%
46.5%
Selling, General & Administrative Expenses
Store Expenses
41,391
44,301
47,249
52,303
General and Administrative Expenses
13,275
13,160
13,471
13,880
Depreciation & Amortization
1,562
1,500
1,545
1,545
Total S,G & A Expenses
56,228
58,961
62,265
67,728
Operating Profit (Loss)
(2,310)
129
2,283
3,907
% of Total Revenue
NM
0.1%
1.6%
2.5%
Other Income (Expense)
158
(12)
(12)
(12)
Pretax Income (Loss)
(2,152)
117
2,271
3,895
Income Tax Expense (Benefit)
(763)
45
886
1,519
Net Income (Loss)
($1,390)
$71
$1,385
$2,376
EBITDA
($748)
$1,629
$3,828
$5,452
% of Total Revenue
-0.6%
1.3%
2.8%
3.5%
Depreciation & Amortization
$1,562
$1,500
$1,545
$1,545
Capex
$250
$1,050
$1,550
$1,550
# of Stores
68
71
76
76
Projected Income Statements
Note: Projections provided by Company management.
[1] Projections prepared by management exclude co-op advertising, warehouse expense and volume rebates from cost of goods sold and are included in selling
general & administrative expenses.
$ in thousands
Overview of Rag Shops
13
Comparison of Historical and Projected Growth Rates and Margins
[1] Excluded extraordinary items.
Overview of Rag Shops
Historical Performance
2003 - 2004
2000 - 2003
1999 - 2003
CAGR
Net sales
4.9%
5.1%
EBITDA
-61.8%
-45.4%
Operating income
NM
NM
Net income [1]
NM
NM
Average margins
EBITDA
-0.6%
0.6%
1.3%
Operating income
NM
0.2%
0.8%
Net income [1]
NM
0.1%
0.5%
Projections
CAGR
2004
2005
2006
2007
2004 - 2007
Year-over-year growth
Net sales
0.0%
8.5%
8.4%
10.8%
9.2%
EBITDA
0.0%
NM
135.0%
42.4%
NM
Operating income
0.0%
NM
1675.4%
71.1%
NM
Net income [1]
0.0%
NM
1847.9%
71.5%
NM
Average
Margin analysis
2004 - 2007
EBITDA
0.0%
1.3%
2.8%
3.5%
1.9%
Operating income
0.0%
0.1%
1.6%
2.5%
1.1%
Net income [1]
0.0%
0.1%
1.0%
1.5%
0.6%
14
![]()
As of
Aug. 28,
Sept. 2,
Sept. 1,
Aug. 31,
Aug. 30,
July 31,
1999
2000
2001
2002
2003
2004 [1]
ASSETS
Current Assets:
Cash & Securities
$934
$1,311
$953
$959
$835
$0
Investment In Common Stock
0
0
0
286
307
0
Merchandise Inventories
30,563
27,805
27,807
30,327
31,995
29,404
Prepaid Expenses
537
483
1,194
1,249
1,490
1,158
Other Current Assets
225
99
154
454
431
1,678
Deferred Income Taxes
805
852
855
790
918
0
Total Current Assets
33,063
30,550
30,963
34,065
35,976
32,240
Net Property & Equipment
4,490
3,613
4,186
4,251
4,580
4,448
Deferred Income Taxes
210
350
436
368
324
0
Other Assets
106
67
49
44
29
491
TOTAL ASSETS
$37,869
$34,580
$35,634
$38,728
$40,909
$37,179
LIABILITIIES AND STOCKHOLDERS' EQUITY
Current Liabilities:
Short-Term Debt
$6,570
$0
$0
$0
$0
$3,920
Accounts Payable - Trade
5,929
7,763
8,349
10,308
11,432
7,915
Accrued Liabilities
2,505
2,012
2,680
2,953
4,315
3,904
Accrued Salaries and Wages
605
893
720
1,298
1,103
0
Income Taxes Payable
157
242
165
0
0
(430)
Deferred Income
0
0
0
0
582
0
Total Current Liabilities
15,765
10,910
11,914
14,559
17,432
15,309
STOCKHOLDERS' EQUITY
Common Stock
48
48
48
48
48
48
Additional Paid in Capital
6,268
6,242
6,238
6,235
6,235
6,235
Restricted Stock
(207)
(12)
(3)
0
0
0
Retained Earnings
16,059
17,456
17,502
17,891
17,185
15,650
Unrealized Gain on Investment
0
0
0
59
72
0
Treasury Stock
(64)
(64)
(64)
(64)
(64)
(64)
Total Stockholders' Equity
22,104
23,670
23,720
24,169
23,477
21,869
TOTAL LIABILITIES &
STOCKHOLDERS' EQUITY
$37,869
$34,580
$35,634
$38,728
$40,909
$37,179
$ in thousands
Historical Balance Sheet
Overview of Rag Shops
[1] Negative cash balance of $938,317 from internal financial statements reclassified as accounts payable.
15
Historical Balance Sheet Analysis
[1] Excludes cash and current maturities of debt
[2] Represents financial data as of the LTM period ending July 31, 2004.
Overview of Rag Shops
$ in thousands (except per share data)
As of
August 28,
September 2,
September 1,
August 31,
August 30,
July 31,
1999
2000
2001
2002
2003
2004 [2]
Liquidity ratios
Net working capital [1]
$22,934
$18,330
$18,096
$18,547
$17,710
$20,851
Current ratio
2.1
x
2.8
x
2.6
x
2.3
x
2.1
x
2.1
x
Quick ratio
0.1
0.1
0.1
0.1
0.1
NM
Asset and liability management ratios
Inventory turnover
2.1
2.2
2.4
2.5
2.5
2.7
Asset turnover
2.7
2.8
2.9
3.0
2.9
3.2
A/P turnover
9.8
9.3
8.3
7.8
7.1
9.9
Average days inventory
171.0
167.3
151.8
145.2
147.8
136.5
Average days payables
37.4
39.2
44.0
46.6
51.6
37.0
16
[1] Source: FactSet.
[2] Source: RAGS Proxy. Excludes options.
[3] Based on 4,797,983 shares outstanding.
Date
Institutional Ownership [1]
Number of
Shares
As % of
Total [3]
Date
Insider Ownership [2]
Number of
Shares
As % of
Total [3]
12/31/03
Peter S. Lynch
221,500
4.6%
12/10/03
Stanley And Doris Berenzweig
2,201,849
45.9%
06/30/04
Dimensional Fund Advisors, Inc.
214,390
4.5%
12/10/03
Judith Lombardo
181,125
3.8%
03/31/04
Northern Trust Global Investments
22,254
0.5%
12/10/03
Steven B. Barnett
181,125
3.8%
03/31/04
Mellon Bank Asset Mgmt. (Mellon Capital Mgmt.)
23,912
0.5%
12/10/03
Jeffrey C. Gerstel
13,700
0.3%
03/31/04
California Public Employees Retirement System
18,600
0.4%
12/10/03
Bruce J. Miller
3,000
0.1%
03/31/04
Barclays Global Investors, N.A.
587
0.0%
12/10/03
Alan C. Mintz
2,100
0.0%
12/10/03
Fred J. Damiano
1,050
0.0%
12/10/03
Mario Ciampi
1,000
0.0%
Total Institutional Ownership
501,243
10.4%
Total Insider and 5% Ownership
2,584,949
53.9%
Retail Ownership
1,711,791
35.7%
Current Ownership Structure
Overview of Rag Shops
17
Institutional Holders
09-30-02
12-31-02
03-31-03
06-30-03
09-30-03
12-31-03
03-31-04
06-30-04
Change
Dimensional Fund Advisors, Inc.
310,460
308,460
234,060
234,060
215,460
215,460
215,460
214,390
(96,070)
Mellon Bank Asset Mgmt. (Mellon Capital Mgmt.)
24,804
24,804
24,804
24,804
23,912
23,912
23,912
23,912
(892)
Northern Trust Global Investments
26,529
27,229
24,654
24,654
24,654
24,654
22,254
22,254
(4,275)
California Public Employees Retirement System
0
0
0
0
0
18,600
18,600
18,600
18,600
Barclays Global Investors, N.A.
0
0
0
0
0
0
587
587
587
Marketocracy Capital Management LLC
50
0
0
0
0
0
0
0
(50)
Royce & Associates LLC
0
3,600
0
0
0
0
0
0
0
Fidelity Management & Research Co.
0
0
5,100
0
0
0
0
0
0
Total Institutional Ownership
361,843
364,093
288,618
283,518
264,026
282,626
280,813
279,743
(82,100)
Source: FactSet Research Systems, Inc. as of July 23, 2004.
Change in Institutional Ownership
Overview of Rag Shops
18


Historical Price / Volume Performance – Five Years
Source: FactSet Research Systems, Inc.
Daily Price and Volume
August 30, 1999 to August 30, 2004
Stock Performance and Trading Statistics
19
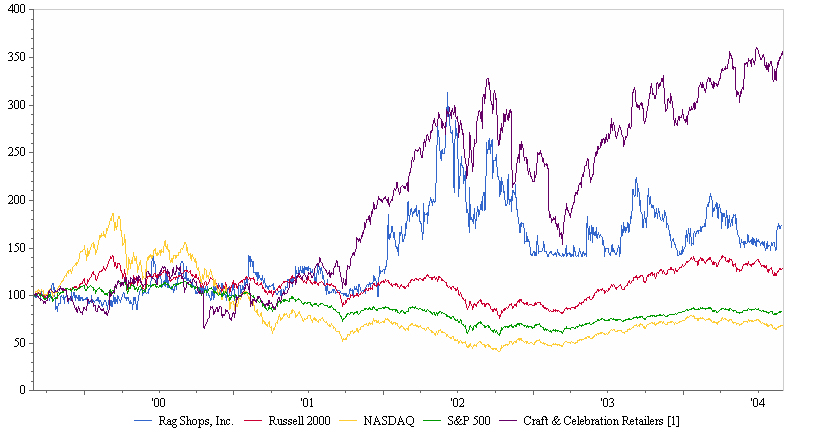
Source: FactSet Research Systems, Inc.
[1] Craft and Celebration retailers include ACMR, HKF, JAS, MIK and PCTY.
Indexed Price Performance vs. Broad Market – Five Years
Indexed Price Performance
August 30, 1999 to August 30, 2004
Stock Performance and Trading Statistics
20
Source: FactSet Research Systems, Inc.
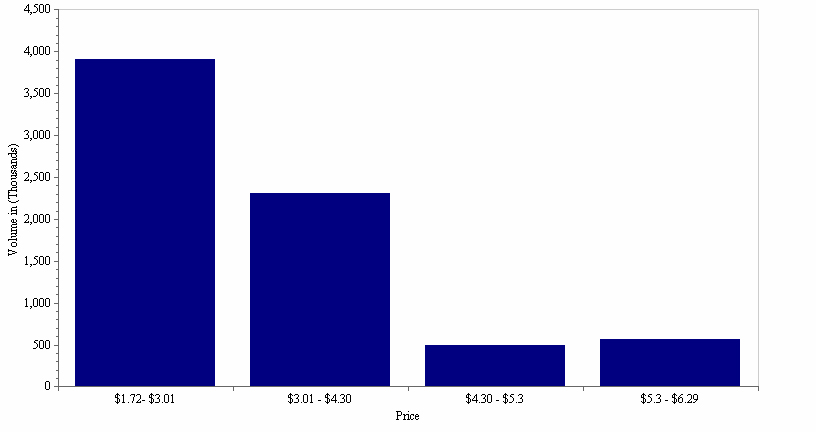
Five Year Histogram of Daily Trading Volume
Trading Volume Histogram
August 30, 1999 to August 30, 2004
Stock Performance and Trading Statistics
53.6%
31.7%
6.9%
7.8%
21

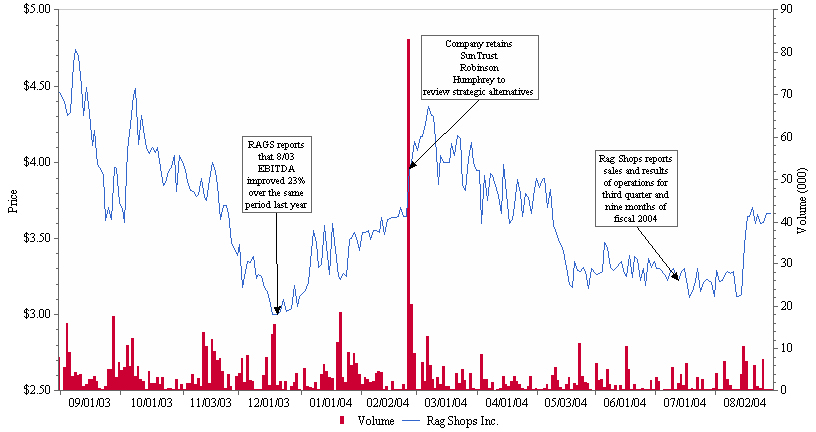
Source: FactSet Research Systems, Inc.
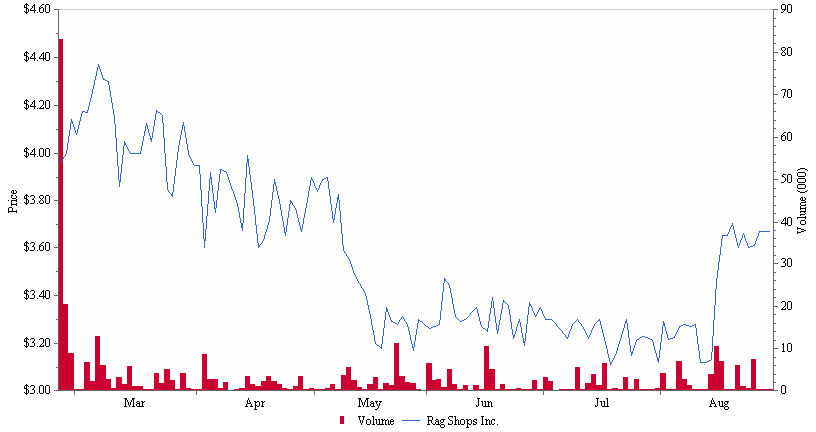
Price / Volume Performance – 1 Year
Daily Price and Volume
August 30, 2003 to August 30, 2004
Stock Performance and Trading Statistics
22

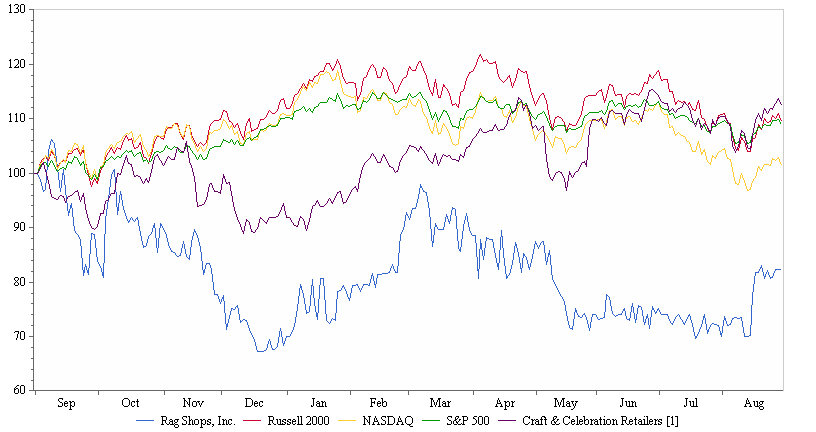
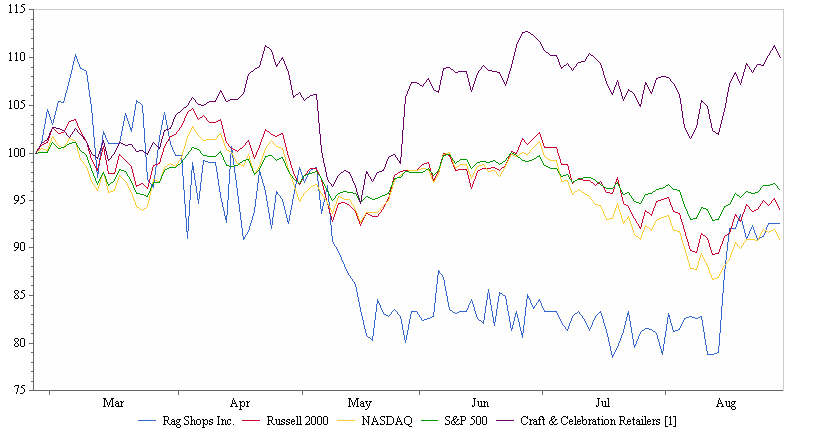
Source: FactSet Research Systems, Inc.
[1] Craft and Celebration retailers include ACMR, HKF, JAS, MIK and PCTY.
Indexed Price Performance vs. Broad Market – 1 Year
Indexed Price Performance
August 30, 2003 to August 30, 2004
Stock Performance and Trading Statistics
23

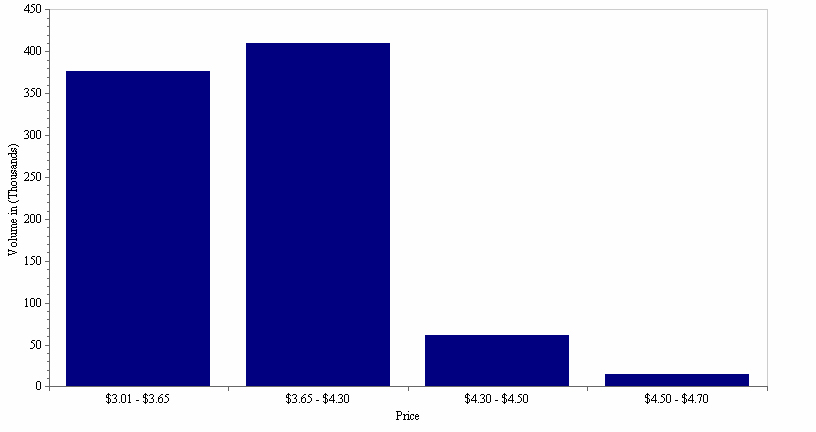
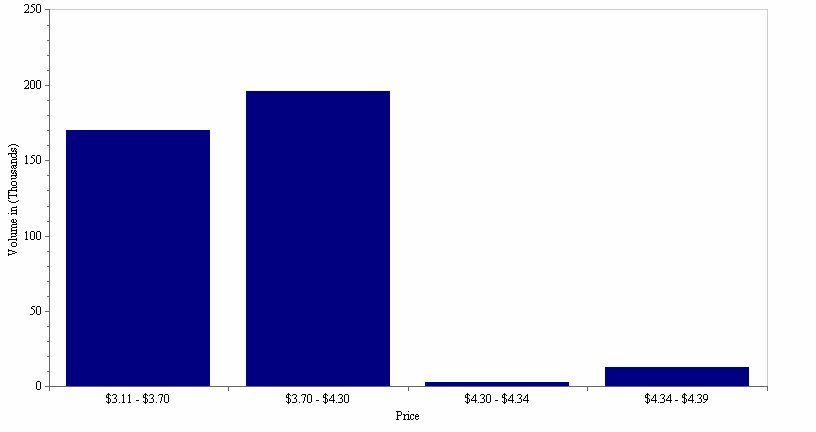
43.6%
47.5%
1.7%
1 Year Histogram of Daily Trading Volume
Trading Volume Histogram
August 30, 2003 to August 30, 2004
Stock Performance and Trading Statistics
Source: FactSet Research Systems, Inc.
7.2%
24

Historical Price / Volume Performance – Since STRH Engagement
Daily Price and Volume
February 25, 2004 to August 30, 2004
Stock Performance and Trading Statistics
Source: FactSet Research Systems, Inc.
25

Source: FactSet Research Systems, Inc.
[1] Craft and Celebration retailers include ACMR, HKF, JAS, MIK and PCTY.
Indexed Price Performance vs. Broad Market – Since STRH Engagement
Indexed Price Performance
February 25, 2004 to August 30, 2004
Stock Performance and Trading Statistics
26

44.5%
51.3%
0.8%
3.4%
Histogram of Daily Trading Volume – Since STRH Engagement
Trading Volume Histogram
February 25, 2004 to August 30, 2004
Stock Performance and Trading Statistics
Source: FactSet Research Systems, Inc.
27
Historical Trading Statistics – 1 Year Prior to STRH Engagement
Daily Trading Statistics
February 24, 2003 – February 24, 2004
Average Closing Price:
Average Daily Volume:
Average Volume Weighted Price:
12 Months
$3.47
12 Months
3,478
12 Months
$3.51
6 Months
3.71
6 Months
4,052
6 Months
3.72
3 Months
3.37
3 Months
3,574
3 Months
3.38
1 Month
3.55
1 Month
3,052
1 Month
3.53
High (09/28/03)
4.74
High (04/08/03)
56,200
Low (02/25/03)
2.98
Low (Several)
0
Date
High
Low
Close
Volume
Date
High
Low
Close
Volume
2/24/03
$3.06
$3.06
$3.06
100
2/25/03
3.00
2.98
2.98
900
2/26/03
3.13
2.99
3.13
3,901
2/27/03
3.24
3.10
3.11
1,700
2/28/03
3.05
3.05
3.05
100
3/3/03
3.03
2.98
3.02
4,701
3/4/03
3.08
3.00
3.04
0
3/5/03
2.99
2.99
2.99
300
3/6/03
3.00
2.98
3.00
2,800
3/7/03
2.99
2.98
2.98
1,300
3/10/03
3.00
2.96
2.98
5,600
3/11/03
3.00
2.98
2.99
0
3/12/03
3.04
2.97
3.04
43,900
3/13/03
2.98
2.98
2.98
500
3/14/03
3.08
2.98
3.03
0
3/17/03
$3.00
$3.00
$3.00
200
3/18/03
3.10
3.00
3.05
0
3/19/03
3.12
3.12
3.12
200
3/20/03
3.22
3.22
3.22
100
3/21/03
3.06
2.98
2.98
2,900
3/24/03
2.99
2.99
2.99
1,300
3/25/03
3.10
2.98
3.04
0
3/26/03
3.11
2.98
3.04
0
3/27/03
3.13
3.02
3.08
0
3/28/03
3.12
3.02
3.07
0
3/31/03
2.98
2.98
2.98
500
4/1/03
3.10
2.98
3.04
0
4/2/03
3.02
2.98
3.02
700
4/3/03
2.98
2.98
2.98
1,000
4/4/03
3.08
2.98
3.03
0
Stock Performance and Trading Statistics
Source: FactSet Research Systems, Inc.
28

Source: FactSet Research Systems, Inc.
Date
High
Low
Close
Volume
Date
High
Low
Close
Volume
4/7/03
$2.98
$2.98
$2.98
2,100
4/8/03
3.22
2.98
3.22
56,200
4/9/03
3.23
3.09
3.16
0
4/10/03
3.09
3.09
3.09
1,500
4/11/03
3.19
3.01
3.10
0
4/14/03
3.01
3.00
3.00
1,000
4/15/03
2.98
2.98
2.98
800
4/16/03
3.00
2.98
2.99
0
4/17/03
3.00
2.98
2.99
0
4/21/03
2.98
2.98
2.98
200
4/22/03
3.16
2.85
3.16
54,100
4/23/03
3.17
3.16
3.16
400
4/24/03
3.15
3.04
3.04
300
4/25/03
3.35
3.03
3.03
4,200
4/28/03
3.06
2.98
2.98
38,000
4/29/03
2.98
2.98
2.98
3,400
4/30/03
3.11
2.98
3.04
0
5/1/03
3.08
3.08
3.08
300
5/2/03
3.01
3.01
3.01
100
5/5/03
3.12
2.98
3.05
0
5/6/03
3.11
2.98
3.04
0
5/7/03
3.10
2.98
3.04
0
5/8/03
2.98
2.98
2.98
5,500
5/9/03
4.00
3.11
3.57
1,600
5/12/03
3.97
3.87
3.87
5,500
5/13/03
3.80
3.35
3.35
1,700
5/14/03
3.58
3.28
3.43
0
5/15/03
3.67
3.28
3.48
0
5/16/03
$3.98
$3.29
$3.63
0
5/19/03
3.33
3.33
3.33
200
5/20/03
3.52
3.36
3.36
2,200
5/21/03
3.99
3.35
3.67
0
5/22/03
3.35
3.28
3.28
2,800
5/23/03
3.99
3.25
3.62
0
5/27/03
3.53
3.40
3.47
0
5/28/03
3.51
3.51
3.51
300
5/29/03
3.50
3.40
3.45
0
5/30/03
3.44
3.40
3.44
600
6/2/03
3.70
3.31
3.62
2,800
6/3/03
3.41
3.41
3.41
300
6/4/03
3.38
3.38
3.38
200
6/5/03
3.50
3.38
3.44
0
6/6/03
3.50
3.39
3.48
1,300
6/9/03
3.52
3.47
3.52
500
6/10/03
3.40
3.32
3.40
700
6/11/03
3.52
3.39
3.46
0
6/12/03
3.52
3.41
3.47
500
6/13/03
3.47
3.39
3.43
0
6/16/03
3.47
3.39
3.43
0
6/17/03
3.39
3.32
3.39
1,000
6/18/03
3.41
3.20
3.25
5,100
6/19/03
3.47
3.20
3.34
0
6/20/03
3.15
2.98
3.10
7,600
6/23/03
3.06
2.98
2.98
300
6/24/03
3.19
3.11
3.15
0
6/25/03
3.15
3.15
3.15
200
Daily Trading Statistics
February 24, 2003 – February 24, 2004
Stock Performance and Trading Statistics
Historical Trading Statistics – 1 Year Prior to STRH Engagement
29
Source: FactSet Research Systems, Inc.
Daily Trading Statistics
February 24, 2003 – February 24, 2004
6/26/03
$3.30
$3.15
$3.15
1,700
6/27/03
3.24
3.15
3.15
2,000
6/30/03
3.16
3.15
3.15
600
7/1/03
3.24
3.05
3.15
0
7/2/03
3.06
3.05
3.06
700
7/3/03
3.18
3.05
3.05
2,200
7/7/03
3.05
2.98
2.99
5,400
7/8/03
3.22
3.09
3.15
0
7/9/03
3.22
3.09
3.22
2,300
7/10/03
3.25
3.07
3.25
500
7/11/03
3.09
2.98
3.09
2,700
7/14/03
3.10
3.10
3.10
1,000
7/15/03
3.16
3.16
3.16
1,000
7/16/03
3.10
2.98
3.10
5,100
7/17/03
3.03
3.03
3.03
500
7/18/03
3.03
3.03
3.03
5,700
7/21/03
3.02
3.00
3.02
3,100
7/22/03
3.05
3.05
3.05
3,300
7/23/03
3.11
3.05
3.11
2,000
7/24/03
3.10
3.06
3.10
1,600
7/25/03
3.22
3.22
3.22
1,000
7/28/03
3.22
3.15
3.15
2,700
7/29/03
3.05
2.98
2.98
900
7/30/03
3.30
3.00
3.10
6,631
7/31/03
3.13
3.12
3.13
1,800
8/1/03
3.66
3.29
3.66
10,000
8/4/03
3.86
3.66
3.66
3,300
8/5/03
3.45
3.45
3.45
1,000
8/6/03
$3.73
$3.73
$3.73
100
8/7/03
4.06
3.51
3.51
2,700
8/8/03
3.59
3.55
3.55
1,100
8/11/03
3.65
3.54
3.65
500
8/12/03
3.64
3.51
3.62
900
8/13/03
3.52
3.52
3.52
100
8/14/03
3.58
3.50
3.58
2,900
8/15/03
3.86
3.47
3.69
1,400
8/18/03
3.98
3.56
3.72
3,200
8/19/03
3.82
3.50
3.52
3,300
8/20/03
3.80
3.55
3.70
4,600
8/21/03
3.85
3.65
3.65
3,500
8/22/03
3.65
3.53
3.53
200
8/25/03
4.07
3.77
3.86
4,490
8/26/03
4.00
3.83
3.85
2,700
8/27/03
4.00
3.81
3.83
4,800
8/28/03
4.23
3.84
4.15
15,800
8/29/03
4.46
4.25
4.46
7,800
9/2/03
4.47
4.40
4.40
5,500
9/3/03
4.44
4.25
4.31
15,900
9/4/03
4.40
4.31
4.33
9,000
9/5/03
4.66
4.49
4.65
3,400
9/8/03
4.74
4.66
4.74
4,400
9/9/03
4.70
4.50
4.70
3,600
9/10/03
4.52
4.50
4.50
4,000
9/11/03
4.42
4.31
4.31
1,000
9/12/03
4.51
4.31
4.49
1,600
9/15/03
4.49
4.18
4.32
2,600
Date
High
Low
Close
Volume
Date
High
Low
Close
Volume
Stock Performance and Trading Statistics
Historical Trading Statistics – 1 Year Prior to STRH Engagement
30

Source: FactSet Research Systems, Inc.
Daily Trading Statistics
February 24, 2003 – February 24, 2004
9/16/03
$4.37
$4.11
$4.11
2,600
9/17/03
4.21
3.51
4.21
3,400
9/18/03
4.17
3.88
3.99
2,200
9/19/03
3.97
3.96
3.96
550
9/22/03
3.92
3.92
3.92
100
9/23/03
3.84
3.62
3.62
1,100
9/24/03
3.90
3.52
3.71
5,100
9/25/03
3.97
3.56
3.63
5,110
9/26/03
3.97
3.62
3.97
17,580
9/29/03
3.96
3.64
3.96
3,200
9/30/03
3.94
3.67
3.74
6,700
10/1/03
3.97
3.63
3.70
4,750
10/2/03
3.93
3.61
3.61
5,600
10/3/03
4.23
3.65
4.08
10,650
10/6/03
4.25
3.96
4.25
5,775
10/7/03
4.50
4.08
4.44
12,450
10/8/03
4.50
4.20
4.49
3,500
10/9/03
4.44
4.09
4.12
5,802
10/10/03
4.38
3.97
4.31
2,700
10/13/03
4.31
4.06
4.17
2,175
10/14/03
4.30
4.10
4.10
200
10/15/03
4.24
4.04
4.06
4,527
10/16/03
4.10
4.03
4.10
1,700
10/17/03
4.16
4.06
4.07
1,705
10/20/03
4.10
3.92
4.10
3,095
10/21/03
4.04
3.91
3.97
1,500
10/22/03
4.08
3.85
3.85
3,100
10/23/03
3.87
3.87
3.87
100
10/24/03
$3.94
$3.88
$3.94
700
10/27/03
3.97
3.87
3.97
500
10/28/03
4.09
4.00
4.04
0
10/29/03
4.08
3.80
3.81
2,600
10/30/03
4.05
4.05
4.05
200
10/31/03
4.10
3.94
4.01
1,450
11/3/03
4.00
3.90
3.95
0
11/4/03
3.94
3.86
3.88
1,800
11/5/03
3.94
3.81
3.82
1,700
11/6/03
3.92
3.80
3.81
4,000
11/7/03
3.91
3.70
3.78
1,597
11/10/03
3.94
3.79
3.79
2,840
11/11/03
3.93
3.81
3.90
1,000
11/12/03
3.86
3.66
3.78
13,900
11/13/03
3.94
3.75
3.75
10,400
11/14/03
3.89
3.66
3.89
1,800
11/17/03
4.00
3.66
4.00
12,096
11/18/03
3.94
3.75
3.94
9,200
11/19/03
4.00
3.74
3.85
7,284
11/20/03
4.00
3.63
3.63
7,700
11/21/03
3.95
3.69
3.72
4,600
11/24/03
3.72
3.72
3.72
500
11/25/03
3.82
3.66
3.67
3,950
11/26/03
3.63
3.47
3.47
1,150
11/28/03
3.48
3.39
3.39
3,400
12/1/03
3.99
3.46
3.46
4,100
12/2/03
3.74
3.00
3.18
7,650
12/3/03
3.61
3.27
3.28
1,900
Date
High
Low
Close
Volume
Date
High
Low
Close
Volume
Stock Performance and Trading Statistics
Historical Trading Statistics – 1 Year Prior to STRH Engagement
31

Source: FactSet Research Systems, Inc.
Daily Trading Statistics
February 24, 2003 – February 24, 2004
12/4/03
$3.63
$3.27
$3.35
8,425
12/5/03
3.45
3.06
3.34
2,400
12/8/03
3.38
3.20
3.38
2,211
12/9/03
3.30
3.17
3.24
0
12/10/03
3.35
3.17
3.26
0
12/11/03
3.32
3.18
3.25
0
12/12/03
3.18
3.16
3.18
3,700
12/15/03
3.25
3.15
3.15
7,976
12/16/03
3.10
3.10
3.10
1,200
12/17/03
3.07
3.00
3.00
13,198
12/18/03
3.10
2.99
3.00
15,629
12/19/03
3.03
2.99
3.00
1,300
12/22/03
3.02
3.01
3.02
2,300
12/23/03
3.10
3.10
3.10
350
12/24/03
3.08
3.02
3.02
2,300
12/26/03
3.04
3.04
3.04
1,100
12/29/03
3.19
3.00
3.19
2,100
12/30/03
3.06
3.05
3.05
4,100
12/31/03
3.18
3.06
3.12
0
1/2/04
3.25
3.16
3.16
5,197
1/5/04
3.21
3.21
3.21
1,000
1/6/04
3.35
3.11
3.35
800
1/7/04
3.55
3.34
3.55
600
1/8/04
3.49
3.33
3.47
1,900
1/9/04
3.31
3.31
3.31
250
1/12/04
3.69
3.33
3.33
3,900
1/13/04
3.70
3.30
3.59
6,150
1/14/04
3.60
3.34
3.39
4,500
1/15/04
$3.50
$3.26
$3.26
3,203
1/16/04
3.60
3.43
3.60
3,000
1/20/04
3.60
3.25
3.25
11,373
1/21/04
3.59
3.16
3.23
18,429
1/22/04
3.27
3.16
3.27
3,200
1/23/04
3.29
3.21
3.25
2,105
1/26/04
3.50
3.26
3.49
9,105
1/27/04
3.50
3.40
3.50
5,900
1/28/04
3.55
3.45
3.54
8,923
1/29/04
3.50
3.30
3.48
6,527
1/30/04
3.54
3.20
3.42
3,900
2/2/04
3.54
3.30
3.54
1,600
2/3/04
3.55
3.27
3.54
3,190
2/4/04
3.55
3.38
3.55
2,700
2/5/04
3.49
3.33
3.49
2,100
2/6/04
3.65
3.29
3.55
2,300
2/9/04
3.70
3.40
3.55
4,200
2/10/04
3.64
3.16
3.54
4,602
2/11/04
3.72
3.35
3.64
4,400
2/12/04
3.55
3.50
3.52
0
2/13/04
3.63
3.55
3.63
1,100
2/17/04
3.65
3.49
3.64
2,202
2/18/04
3.64
3.49
3.64
400
2/19/04
3.65
3.65
3.65
100
2/20/04
3.71
3.71
3.71
100
2/23/04
3.65
3.65
3.65
1,500
2/24/04
3.65
3.65
3.65
200
Date
High
Low
Close
Volume
Date
High
Low
Close
Volume
Stock Performance and Trading Statistics
Historical Trading Statistics – 1 Year Prior to STRH Engagement
32
Source: FactSet Research Systems, Inc.
Historical Trading Statistics – STRH Engagement to Present
Daily Trading Statistics
February 25, 2004 – August 30, 2004
Date
High
Low
Close
Volume
Date
High
Low
Close
Volume
2/25/04
$4.25
$3.65
$3.96
83,059
2/26/04
4.15
3.95
4.00
20,370
2/27/04
4.19
3.99
4.14
8,810
3/1/04
4.19
4.08
4.08
380
3/2/04
4.19
4.16
4.17
0
3/3/04
4.23
3.96
4.17
6,650
3/4/04
4.26
4.07
4.26
2,300
3/5/04
4.50
4.28
4.37
12,800
3/8/04
4.45
3.70
4.31
6,000
3/9/04
4.43
4.18
4.30
2,700
3/10/04
4.15
4.08
4.15
600
3/11/04
4.15
3.86
3.86
3,100
3/12/04
4.21
4.05
4.05
1,500
3/15/04
4.00
3.99
4.00
5,700
3/16/04
4.00
4.00
4.00
1,000
3/17/04
4.00
3.76
4.00
1,145
3/18/04
4.44
3.81
4.13
0
3/19/04
4.05
4.05
4.05
100
3/22/04
4.18
3.38
4.18
4,110
3/23/04
4.33
4.09
4.16
1,700
3/24/04
$4.32
$3.82
$3.85
5,135
3/25/04
4.37
3.74
3.82
2,500
3/26/04
4.24
3.81
4.03
0
3/29/04
4.13
3.83
4.13
4,200
3/30/04
4.00
4.00
4.00
700
3/31/04
4.00
3.90
3.95
0
4/1/04
4.00
3.90
3.95
0
4/2/04
4.00
3.57
3.60
8,700
4/5/04
4.13
3.62
3.92
2,650
4/6/04
3.81
3.63
3.75
2,600
4/7/04
3.93
3.51
3.93
600
4/8/04
3.92
3.56
3.92
2,000
4/12/04
3.93
3.64
3.79
0
4/13/04
3.67
3.67
3.67
600
4/14/04
4.00
3.82
3.99
3,319
4/15/04
4.00
3.51
3.80
1,606
4/16/04
3.61
3.60
3.60
1,000
4/19/04
3.72
3.41
3.63
2,300
4/20/04
3.90
3.55
3.72
3,450
4/21/04
3.89
3.67
3.89
2,200
Stock Performance and Trading Statistics
Average Closing Price:
Average Daily Volume:
Average Volume Weighted Price:
Since Engagement
$3.57
Since Engagement
2,842
Since Engagement
$3.57
High (03/05/04)
4.37
High (02/25/04)
83,059
Low (07/19/04)
3.11
Low (Several)
0
33

Source: FactSet Research Systems, Inc.
Daily Trading Statistics
February 25, 2004 – August 30, 2004
Date
High
Low
Close
Volume
Date
High
Low
Close
Volume
4/22/04
$3.82
$3.71
$3.80
1,500
4/23/04
3.65
3.64
3.65
600
4/26/04
3.80
3.80
3.80
200
4/27/04
3.83
3.68
3.77
1,000
4/28/04
3.84
3.67
3.67
3,400
4/29/04
3.91
3.65
3.78
0
4/30/04
3.90
3.90
3.90
500
5/3/04
3.91
3.77
3.84
0
5/4/04
3.90
3.89
3.89
400
5/5/04
3.90
3.90
3.90
700
5/6/04
3.78
3.66
3.71
1,450
5/7/04
3.83
3.83
3.83
300
5/10/04
3.71
3.55
3.59
3,600
5/11/04
3.55
3.31
3.55
5,590
5/12/04
3.52
3.40
3.49
2,450
5/13/04
3.45
3.31
3.45
850
5/14/04
3.41
3.41
3.41
145
5/17/04
3.40
3.31
3.31
1,550
5/18/04
3.25
3.15
3.20
3,150
5/19/04
3.20
3.16
3.18
0
5/20/04
3.35
3.11
3.35
1,821
5/21/04
3.29
3.28
3.29
1,300
5/24/04
3.32
3.28
3.28
11,200
5/25/04
3.35
3.31
3.31
3,350
5/26/04
3.28
3.28
3.28
2,000
5/27/04
3.30
3.13
3.17
1,800
5/28/04
3.44
3.16
3.30
0
6/1/04
3.49
3.21
3.26
6,435
6/2/04
$3.35
$3.24
$3.27
2,500
6/3/04
3.45
3.25
3.28
2,600
6/4/04
3.47
3.16
3.47
755
6/7/04
3.44
3.19
3.44
4,950
6/8/04
3.31
3.17
3.31
1,600
6/9/04
3.29
3.29
3.29
100
6/10/04
3.38
3.30
3.30
1,300
6/14/04
3.36
3.28
3.35
1,200
6/15/04
3.29
3.25
3.27
0
6/16/04
3.30
3.24
3.25
10,425
6/17/04
3.40
3.25
3.39
5,000
6/18/04
3.39
3.24
3.24
200
6/21/04
3.38
3.17
3.38
1,500
6/22/04
3.40
3.32
3.36
0
6/23/04
3.30
3.22
3.22
300
6/24/04
3.30
3.30
3.30
700
6/25/04
3.19
3.19
3.19
200
6/28/04
3.37
3.34
3.37
400
6/29/04
3.49
3.30
3.31
2,491
6/30/04
3.39
3.31
3.35
0
7/1/04
3.30
3.20
3.30
3,100
7/2/04
3.30
3.26
3.30
2,200
7/6/04
3.29
3.22
3.25
0
7/7/04
3.22
3.22
3.22
200
7/8/04
3.30
3.26
3.28
0
7/9/04
3.30
3.25
3.30
5,500
7/12/04
3.30
3.23
3.27
0
7/13/04
3.30
3.22
3.22
1,700
Stock Performance and Trading Statistics
Historical Trading Statistics – STRH Engagement to Present
34

Source: FactSet Research Systems, Inc.
Daily Trading Statistics
February 25, 2004 – August 30, 2004
Stock Performance and Trading Statistics
Historical Trading Statistics – STRH Engagement to Present
Date
High
Low
Close
Volume
Date
High
Low
Close
Volume
7/14/04
$3.28
$3.22
$3.28
4,000
7/15/04
3.30
3.22
3.30
1,300
7/16/04
3.22
3.11
3.22
6,400
7/19/04
3.11
3.11
3.11
100
7/20/04
3.15
3.14
3.15
500
7/21/04
3.28
3.15
3.22
0
7/22/04
3.49
3.29
3.30
3,235
7/23/04
3.15
3.15
3.15
210
7/26/04
3.21
3.20
3.21
2,616
7/27/04
3.30
3.16
3.23
0
7/28/04
3.29
3.16
3.23
0
7/29/04
3.30
3.12
3.21
0
7/30/04
3.12
3.12
3.12
600
8/2/04
3.30
3.13
3.29
4,223
8/3/04
3.30
3.13
3.22
0
8/4/04
3.30
3.15
3.23
0
8/5/04
3.27
3.10
3.27
7,000
8/6/04
$3.28
$3.11
$3.28
2600
8/9/04
3.27
3.20
3.27
1400
8/10/04
3.29
3.27
3.28
0
8/11/04
3.12
3.12
3.12
100
8/12/04
3.12
3.12
3.12
300
8/13/04
3.30
3.11
3.13
3900
8/16/04
3.46
3.11
3.46
10500
8/17/04
3.90
3.36
3.65
7014
8/18/04
3.69
3.61
3.65
0
8/19/04
3.79
3.62
3.71
0
8/20/04
3.75
3.60
3.60
6000
8/23/04
3.66
3.60
3.66
1100
8/24/04
3.63
3.60
3.60
525
8/25/04
3.62
3.43
3.61
7400
8/26/04
3.79
3.55
3.67
0
8/27/04
3.79
3.55
3.67
0
8/30/04
3.79
3.55
3.67
0
35
Valuation Analysis
Reviewed and analyzed a comparison of the present financial condition and projected
financial results of Rag Shops with those of certain publicly traded companies which we
deemed relevant. Following is a list of the companies included in the analysis:
A.C. Moore Arts & Crafts, Inc.
Hancock Fabrics, Inc.
Jo-Ann Stores, Inc.
Michaels Stores, Inc.
Reviewed the financial results for the LTM period ended July 31, 2004 and financial
projections provided by the management of Rag Shops.
Calculated the implied enterprise and equity valuation of Rag Shops based primarily on (i)
the Company’s operating metrics for the LTM period ended July 31, 2004 and projections
for the years ending August 2004 and 2005 and (ii) financial multiples of the relevant
reference companies.
Party City Corporation
99 Cents Only Stores
Big Lots, Inc.
Dollar General Corporation
Dollar Tree Stores, Inc.
Family Dollar Stores, Inc.
Fred’s, Inc.
Selected Public Reference Company Analysis
36
Note: Projections provided by management.
[1] Reflects results for the YTD period ended July 31, 2004.
[2] Net debt equals total debt of $3,920 less cash and cash equivalents of $0 as of July 31, 2004.
[3] Based on weighted average diluted shares outstanding of 4,847,792 which includes 4,797,983 basic shares from the 10-Q as of 5/29/04 and 146,700 in-the-money options at a weighted average
exercise price of $2.84 as of 5/29/04.
$ in thousands (except per share data)
Implied Valuation Based on Public Reference Company Analysis
Valuation Analysis
Mean Multiples - Craft and Celebration Retailers
Average Multiple
Valuation
RAGS
Weighted
Firm Value/
Firm Value/
Firm Value/
Parameter
Value
Average
Rev
EBITDA
EBIT
LTM Revenues [1]
$117,695
5.0%
0.67
x
2004 Revenues
$118,248
5.0%
0.64
LTM EBITDA [1]
($152)
6.7%
8.1
x
2004 EBITDA
($748)
6.7%
6.5
2005 EBITDA
$1,629
6.7%
6.3
LTM EBIT [1]
($1,597)
10.0%
11.0
x
2004 EBIT
($2,310)
10.0%
9.2
LTM Net Income [1]
($1,056)
13.3%
Net Income 2004
($1,390)
13.3%
Net Income 2005
$71
13.3%
Book Value
$21,869
10.0%
Mean Multiples - All Reference Companies
Average Multiple
Valuation
RAGS
Weighted
Firm Value/
Firm Value/
Firm Value/
Parameter
Value
Average
Rev
EBITDA
EBIT
LTM Revenues [1]
$117,695
5.0%
0.70
x
2004 Revenues
$118,248
5.0%
0.66
LTM EBITDA [1]
($152)
6.7%
8.1
x
2004 EBITDA
($748)
6.7%
7.1
2005 EBITDA
$1,629
6.7%
6.4
LTM EBIT [1]
($1,597)
10.0%
11.2
x
2004 EBIT
($2,310)
10.0%
10.5
LTM Net Income [1]
($1,056)
13.3%
Net Income 2004
($1,390)
13.3%
Net Income 2005
$71
13.3%
Book Value
$21,869
10.0%
Mean Multiples - Craft and Celebration Retailers
Average Multiple
Implied
Implied
Implied
Equity Value/
Equity Value/
Firm
Equity
Equity Value
NI
Book Value
Net Debt [2]
Value
Value
Per Share [3]
$3,920
$79,048
$75,128
$15.50
$3,920
$75,692
$71,772
$14.81
$3,920
$0
$0
$0.00
$3,920
$0
$0
$0.00
$3,920
$10,194
$6,274
$1.29
$3,920
$0
$0
$0.00
$3,920
$0
$0
$0.00
19.0
x
$3,920
$0
$0
$0.00
18.6
$3,920
$0
$0
$0.00
14.1
$3,920
$4,920
$1,000
$0.21
2.2
x
$3,920
$52,874
$48,954
$10.10
Average
$20,248
$18,466
$3.81
Weighted Average
$14,360
$12,792
$2.64
Median
$0
$0
$0.00
High
$79,048
$75,128
$15.50
Low
$0
$0
$0.00
Mean Multiples - All Reference Companies
Average Multiple
Implied
Implied
Implied
Equity Value/
Equity Value/
Firm
Equity
Equity Value
NI
Book Value
Net Debt [2]
Value
Value
Per Share [3]
$3,920
$82,426
$78,506
$16.19
$3,920
$77,554
$73,634
$15.19
$3,920
$0
$0
$0.00
$3,920
$0
$0
$0.00
$3,920
$10,377
$6,457
$1.33
$3,920
$0
$0
$0.00
$3,920
$0
$0
$0.00
18.7
x
$3,920
$0
$0
$0.00
18.2
$3,920
$0
$0
$0.00
14.6
$3,920
$4,959
$1,039
$0.21
2.4
x
$3,920
$56,072
$52,152
$10.76
Average
$21,035
$19,253
$3.97
Weighted Average
$14,959
$13,391
$2.76
Median
$0
$0
$0.00
High
$82,426
$78,506
$16.19
Low
$0
$0
$0.00
37
Implied Valuation Based on Public Reference Company Analysis
Valuation Analysis
$ in thousands (except per share data)
Note: Projections provided by management.
[1] Reflects results for the YTD period ended July 31, 2004.
[2] Net debt equals total debt of $3,920 less cash and cash equivalents of $0 as of July 31, 2004.
[3] Based on weighted average diluted shares outstanding of 4,847,792 which includes 4,797,983 basic shares from the 10-Q as of 5/29/04 and 146,700 in-the-money options at a weighted average
exercise price of $2.84 as of 5/29/04.
Median Multiples - Craft and Celebration Retailers
Median Multiple
Valuation
RAGS
Weighted
Firm Value/
Firm Value/
Firm Value/
Parameter
Value
Average
Rev
EBITDA
EBIT
LTM Revenues [1]
$117,695
5.0%
0.54
x
2004 Revenues
$118,248
5.0%
0.54
LTM EBITDA [1]
($152)
6.7%
9.3
x
2004 EBITDA
($748)
6.7%
5.9
2005 EBITDA
$1,629
6.7%
6.4
LTM EBIT [1]
($1,597)
10.0%
11.9
2004 EBIT
($2,310)
10.0%
9.9
LTM Net Income [1]
($1,056)
13.3%
Net Income 2004
($1,390)
13.3%
Net Income 2005
$71
13.3%
Book Value
$21,869
10.0%
Median Multiples - All Reference Companies
Median Multiple
Valuation
RAGS
Weighted
Firm Value/
Firm Value/
Firm Value/
Parameter
Value
Average
Rev
EBITDA
EBIT
LTM Revenues [1]
$117,695
5.0%
0.83
x
2004 Revenues
$118,248
5.0%
0.72
LTM EBITDA [1]
($152)
6.7%
8.3
x
2004 EBITDA
($748)
6.7%
7.0
2005 EBITDA
$1,629
6.7%
6.4
LTM EBIT [1]
($1,597)
10.0%
11.9
2004 EBIT
($2,310)
10.0%
10.4
LTM Net Income [1]
($1,056)
13.3%
Net Income 2004
($1,390)
13.3%
Net Income 2005
$71
13.3%
Book Value
$21,869
10.0%
Median Multiples - Craft and Celebration Retailers
Median Multiple
Implied
Implied
Implied
Equity Value/
Equity Value/
Firm
Equity
Equity Value
NI
Book Value
Net Debt [2]
Value
Value
Per Share [3]
$3,920
$63,789
$59,869
$12.35
$3,920
$64,252
$60,332
$12.45
$3,920
$0
$0
$0.00
$3,920
$0
$0
$0.00
$3,920
$10,351
$6,431
$1.33
x
$3,920
$0
$0
$0.00
$3,920
$0
$0
$0.00
20.7
x
$3,920
$0
$0
$0.00
19.2
$3,920
$0
$0
$0.00
14.4
$3,920
$4,946
$1,026
$0.21
2.4
x
$3,920
$55,574
$51,654
$10.66
Average
$18,083
$16,301
$3.36
Weighted Average
$13,309
$11,741
$2.42
Median
$0
$0
$0.00
High
$64,252
$60,332
$12.45
Low
$0
$0
$0.00
Median Multiples - All Reference Companies
Median Multiple
Implied
Implied
Implied
Equity Value/
Equity Value/
Firm
Equity
Equity Value
NI
Book Value
Net Debt [2]
Value
Value
Per Share [3]
$3,920
$97,350
$93,430
$19.27
$3,920
$85,288
$81,368
$16.78
$3,920
$0
$0
$0.00
$3,920
$0
$0
$0.00
$3,920
$10,346
$6,426
$1.33
x
$3,920
$0
$0
$0.00
$3,920
$0
$0
$0.00
18.8
x
$3,920
$0
$0
$0.00
18.1
$3,920
$0
$0
$0.00
14.6
$3,920
$4,957
$1,037
$0.21
2.4
x
$3,920
$55,574
$51,654
$10.66
Average
$23,047
$21,265
$4.39
Weighted Average
$16,040
$14,472
$2.99
Median
$0
$0
$0.00
High
$97,350
$93,430
$19.27
Low
$0
$0
$0.00
38

Selected Reference Transaction Analysis
Reviewed recently announced merger and acquisition transactions in the retail industry.
Reviewed the Company’s audited financial results as of and for the year ended August 30,
2003 and the unaudited financial results for the eleven months ended July 31, 2004.
Calculated the implied enterprise and equity valuation of Rag Shops based on (i) the
Company’s operating metrics as of and for the LTM period ended July 31, 2004 and July 31,
2004 and (ii) financial multiples of the relevant reference transactions.
Valuation Analysis
39
[1] Reflects results for the YTD period ended July 31, 2004.
[2] Net debt equals total debt of $3,920 less cash and cash equivalents of $0 as of July 31, 2004.
[3] Based on weighted average diluted shares outstanding of 4,847,792 which includes 4,797,983 basic shares from the 10-Q as of 5/29/04 and 146,700 in-the-money options at a weighted average
exercise price of $2.84 as of 5/29/04.
Implied Valuation Based on M&A Transaction Analysis
Valuation Analysis
$ in thousands (except per share data)
Average Multiple
Valuation
RAGS
Weighted
Firm Value/
Firm Value/
Parameter [1]
Value
Average
LTM Revenue
LTM EBITDA
LTM Revenues
$117,695
15.0%
0.60
x
LTM EBITDA
($152)
20.0%
8.9
x
LTM EBIT
($1,597)
20.0%
LTM Net Income
(1,056)
45.0%
Median Multiple
Valuation
RAGS
Weighted
Firm Value/
Firm Value/
Parameter [1]
Value
Average
LTM Revenue
LTM EBITDA
LTM Revenues
$117,695
15.0%
0.51
x
LTM EBITDA
($152)
20.0%
8.7
x
LTM EBIT
($1,597)
20.0%
LTM Net Income
(1,056)
45.0%
Average Multiple
Implied
Implied
Implied
Firm Value/
Equity Value/
Firm
Equity
Equity Value
LTM EBIT
Net Income
Net Debt [2]
Value
Value
Per Share [3]
$3,920
$70,647
$66,727
$13.76
$3,920
$0
$0
$0.00
13.2
x
$3,920
$0
$0
$0.00
20.3
x
$3,920
$0
$0
$0.00
Average
$17,662
$16,682
$3.44
Weighted Average
$10,597
$10,009
$2.06
Median
$0
$0
$0.00
High
$70,647
$66,727
$13.76
Low
$0
$0
$0.00
Median Multiple
Implied
Implied
Implied
Firm Value/
Equity Value/
Firm
Equity
Equity Value
LTM EBIT
Net Income
Net Debt [2]
Value
Value
Per Share [3]
$3,920
$59,788
$55,868
$11.52
$3,920
$0
$0
$0.00
12.0
x
$3,920
$0
$0
$0.00
22.5
x
$3,920
$0
$0
$0.00
Average
$14,947
$18,623
$3.84
Weighted Average
$8,968
$8,380
$1.73
Median
$0
$0
$0.00
High
$59,788
$55,868
$11.52
Low
$0
$0
$0.00
40

Premiums Paid Analysis
Reviewed premiums paid in certain recently announced merger and acquisition transactions
with the following criteria:
All M&A Transactions
Announcement date between January 1, 2004 and August 30, 2004
Transaction involved greater than 50% of a public company being sold
Target company enterprise value between $10 million and $100 million
Retail and Specialty Retail Transactions
Announcement date between January 1, 2002 and August 30, 2004
Transaction involved greater than 50% of a public company being sold
Calculated the implied per share price and equity valuation of Rag Shops based on the
average premium paid in relevant transactions (i) one day prior to announcement of
transaction, (ii) 5 days prior to announcement and (iii) 30 days prior to announcement
Calculated the implied per share price and equity valuation of Rag Shops based open the
most recent price of Rag Shops at August 30, 2004 and also based upon price of Rag Shops
one day prior to the announcement of STRH engagement.
Valuation Analysis
41

[1] Assumes weighted average diluted shares outstanding of 4,847,792 which includes 4,797,983 basic shares from the 10-Q as of 5/29/04 and 146,700 in-the-money options at a
weighted average exercise price of $2.84 as of 5/29/04.
Premium Paid Analysis – M&A Transactions between $10 and $100 MM
Valuation Analysis
$ in thousands (except per share data)
Mean Premium
Implied
Rag Shops
1 Day Prior to
5 Days Prior to
30 Days Prior to
Equity Value
Implied
Valuation Parameter
Value
Announcement
Announcement
Announcement
Per Share
Equity Value [1]
Stock Price as of August 30, 2004
$3.61
26.9%
$4.58
$22,209
Stock Price as of August 30, 2004
3.61
28.8%
4.65
22,534
Stock Price as of August 30, 2004
3.61
29.6%
4.68
22,680
High
$4.68
$22,680
Median
4.65
22,534
Average
4.64
22,474
Low
4.58
22,209
Median Premium
Implied
Rag Shops
1 Day Prior to
5 Days Prior to
30 Days Prior to
Equity Value
Implied
Valuation Parameter
Value
Announcement
Announcement
Announcement
Per Share
Equity Value [1]
Stock Price as of August 30, 2004
$3.61
13.5%
$4.10
$19,863
Stock Price as of August 30, 2004
3.61
16.0%
4.19
20,301
Stock Price as of August 30, 2004
3.61
17.5%
4.24
20,563
High
$4.24
$20,563
Median
4.19
20,301
Average
4.18
20,242
Low
4.10
19,863
42

Valuation Analysis
Premiums Paid Analysis – Retail Transactions from 2002 - Present
$ in thousands (except per share data)
[1] Assumes weighted average diluted shares outstanding of 4,847,792 which includes 4,797,983 basic shares from the 10-Q as of 5/29/04 and 146,700 in-the-money options at a
weighted average exercise price of $2.84 as of 5/29/04.
Mean Premium
Implied
Rag Shops
1 Day Prior to
5 Days Prior to
30 Days Prior to
Equity Value
Implied
Valuation Parameter
Value
Announcement
Announcement
Announcement
Per Share
Equity Value [1]
Stock Price as of August 30, 2004
$3.61
28.3%
$4.63
$22,450
Stock Price as of August 30, 2004
3.61
37.1%
4.95
23,992
Stock Price as of August 30, 2004
3.61
45.1%
5.24
25,386
High
$5.24
$25,386
Median
4.95
23,992
Average
4.94
23,942
Low
4.63
22,450
Median Premium
Implied
Rag Shops
1 Day Prior to
5 Days Prior to
30 Days Prior to
Equity Value
Implied
Valuation Parameter
Value
Announcement
Announcement
Announcement
Per Share
Equity Value [1]
Stock Price as of August 30, 2004
$3.61
21.0%
$4.37
$21,176
Stock Price as of August 30, 2004
3.61
29.0%
4.66
22,576
Stock Price as of August 30, 2004
3.61
36.0%
4.91
23,801
High
$4.91
$23,801
Median
4.66
22,576
Average
4.64
22,517
Low
4.37
21,176
43

Premiums Paid Analysis – Specialty Retail Transactions from 2002 - Present
Valuation Analysis
$ in thousands (except per share data)
[1] Assumes weighted average diluted shares outstanding of 4,847,792 which includes 4,797,983 basic shares from the 10-Q as of 5/29/04 and 146,700 in-the-money options at a
weighted average exercise price of $2.84 as of 5/29/04.
Mean Premium
Implied
Rag Shops
1 Day Prior to
5 Days Prior to
30 Days Prior to
Equity Value
Implied
Valuation Parameter
Value
Announcement
Announcement
Announcement
Per Share
Equity Value [1]
Stock Price as of August 30, 2004
$3.61
22.3%
$4.41
$21,397
Stock Price as of August 30, 2004
3.61
24.7%
4.50
21,823
Stock Price as of August 30, 2004
3.61
28.8%
4.65
22,535
High
$4.65
$22,535
Median
4.50
21,823
Average
4.52
21,918
Low
4.41
21,397
Median Premium
Implied
Rag Shops
1 Day Prior to
5 Days Prior to
30 Days Prior to
Equity Value
Implied
Valuation Parameter
Value
Announcement
Announcement
Announcement
Per Share
Equity Value [1]
Stock Price as of August 30, 2004
$3.61
21.0%
$4.37
$21,176
Stock Price as of August 30, 2004
3.61
22.5%
4.42
21,438
Stock Price as of August 30, 2004
3.61
26.0%
4.55
22,051
High
$4.55
$22,051
Median
4.42
21,438
Average
4.45
21,555
Low
4.37
21,176
44

[1] Assumes weighted average diluted shares outstanding of 4,847,792 which includes 4,797,983 basic shares from the 10-Q as of 5/29/04 and 146,700 in-the-money options at a
weighted average exercise price of $2.84 as of 5/29/04.
Premium Paid Analysis – M&A Transactions between $10 and $100 MM
Valuation Analysis
$ in thousands (except per share data)
Mean Premium
Implied
Rag Shops
1 Day Prior to
5 Days Prior to
30 Days Prior to
Equity Value
Implied
Valuation Parameter
Value
Announcement
Announcement
Announcement
Per Share
Equity Value [1]
Stock Price as of February 24, 2004
$3.65
26.9%
$4.63
$22,455
Stock Price as of February 24, 2004
3.65
28.8%
4.70
22,783
Stock Price as of February 24, 2004
3.65
29.6%
4.73
22,931
High
$4.73
$22,931
Median
4.70
22,783
Average
4.69
22,723
Low
4.63
22,455
Median Premium
Implied
Rag Shops
1 Day Prior to
5 Days Prior to
30 Days Prior to
Equity Value
Implied
Valuation Parameter
Value
Announcement
Announcement
Announcement
Per Share
Equity Value [1]
Stock Price as of February 24, 2004
$3.65
13.5%
$4.14
$20,083
Stock Price as of February 24, 2004
3.65
16.0%
4.23
20,526
Stock Price as of February 24, 2004
3.65
17.5%
4.29
20,791
High
$4.29
$20,791
Median
4.23
20,526
Average
4.22
20,467
Low
4.14
20,083
45
Valuation Analysis
Premiums Paid Analysis – Retail Transactions from 2002 - Present
$ in thousands (except per share data)
[1] Assumes weighted average diluted shares outstanding of 4,847,792 which includes 4,797,983 basic shares from the 10-Q as of 5/29/04 and 146,700 in-the-money options at a
weighted average exercise price of $2.84 as of 5/29/04.
Mean Premium
Implied
Rag Shops
1 Day Prior to
5 Days Prior to
30 Days Prior to
Equity Value
Implied
Valuation Parameter
Value
Announcement
Announcement
Announcement
Per Share
Equity Value [1]
Stock Price as of February 24, 2004
$3.65
28.3%
$4.68
$22,698
Stock Price as of February 24, 2004
3.65
37.1%
5.00
24,257
Stock Price as of February 24, 2004
3.65
45.1%
5.29
25,667
High
$5.29
$25,667
Median
5.00
24,257
Average
4.99
24,208
Low
4.68
22,698
Median Premium
Implied
Rag Shops
1 Day Prior to
5 Days Prior to
30 Days Prior to
Equity Value
Implied
Valuation Parameter
Value
Announcement
Announcement
Announcement
Per Share
Equity Value [1]
Stock Price as of February 24, 2004
$3.65
21.0%
$4.42
$21,410
Stock Price as of February 24, 2004
3.65
29.0%
4.71
22,826
Stock Price as of February 24, 2004
3.65
36.0%
4.96
24,064
High
$4.96
$24,064
Median
4.71
22,826
Average
4.70
22,767
Low
4.42
21,410
46

Premiums Paid Analysis – Specialty Retail Transactions from 2002 - Present
Valuation Analysis
$ in thousands (except per share data)
[1] Assumes weighted average diluted shares outstanding of 4,847,792 which includes 4,797,983 basic shares from the 10-Q as of 5/29/04 and 146,700 in-the-money options at a
weighted average exercise price of $2.84 as of 5/29/04.
Mean Premium
Implied
Rag Shops
1 Day Prior to
5 Days Prior to
30 Days Prior to
Equity Value
Implied
Valuation Parameter
Value
Announcement
Announcement
Announcement
Per Share
Equity Value [1]
Stock Price as of February 24, 2004
$3.65
22.3%
$4.46
$21,634
Stock Price as of February 24, 2004
3.65
24.7%
4.55
22,065
Stock Price as of February 24, 2004
3.65
28.8%
4.70
22,785
High
$4.70
$22,785
Median
4.55
22,065
Average
4.57
22,161
Low
4.46
21,634
Median Premium
Implied
Rag Shops
1 Day Prior to
5 Days Prior to
30 Days Prior to
Equity Value
Implied
Valuation Parameter
Value
Announcement
Announcement
Announcement
Per Share
Equity Value [1]
Stock Price as of February 24, 2004
$3.65
21.0%
$4.42
$21,410
Stock Price as of February 24, 2004
3.65
22.5%
4.47
21,676
Stock Price as of February 24, 2004
3.65
26.0%
4.60
22,295
High
$4.60
$22,295
Median
4.47
21,676
Average
4.50
21,794
Low
4.42
21,410
47

Discounted Cash Flow Analysis
Reviewed and analyzed historical financial performance.
Reviewed and analyzed financial projections provided by management for 2005 through
2009.
Performed sensitivity analysis on five-year projections by discounting the revenue growth
and EBIT margin projections.
Valuation Analysis
48
![]()
Discounted Cash Flow Analysis – Free Cash Flow
Valuation Analysis
[1] Based on Company estimates for 2005 through 2009.
Projected Year Ending August
PROJECTED CASH FLOWS [1]
2004
2005
2006
2007
2008
2009
Total Revenue
$118,248
$128,303
$139,068
$154,050
$170,647
$189,032
% Growth
2.3%
8.5%
8.4%
10.8%
10.8%
10.8%
Cost of Sales
64,331
69,213
74,520
82,415
91,294
101,130
Gross Margin
53,918
59,090
64,548
71,635
79,353
87,902
% of Total Revenue
45.6%
46.1%
46.4%
46.5%
46.5%
46.5%
Selling, General and Admin. Expenses (Excluding D&A)
54,666
57,461
60,720
66,183
73,314
81,212
EBITDA
(748)
1,629
3,828
5,452
6,039
6,690
% of Total Revenue
(0.6%)
1.3%
2.8%
3.5%
3.5%
3.5%
Depreciation and Amortization
1,562
1,500
1,545
1,545
1,387
1,542
% of Total Revenue
1.3%
1.2%
1.1%
1.0%
0.8%
0.8%
Operating Income
($2,310)
$129
$2,283
$3,907
$4,653
$5,148
Effective Tax Rate
39.0%
39.0%
39.0%
39.0%
39.0%
CASH SOURCES
Earnings Before Interest and After Tax
$78
$1,393
$2,383
$2,838
$3,141
Depreciation and Amortization Expense
1,500
1,545
1,545
1,387
1,542
TOTAL SOURCES
$1,578
$2,938
$3,928
$4,225
$4,682
CASH USES
Capital Expenditures
$1,050
$1,550
$1,550
$1,550
$1,550
Increase (Decrease) in Current Assets Except Cash
1,063
1,913
412
4,099
4,540
(Increase) Decrease in Current Liabilities Except Debt
(600)
(1,127)
(831)
(1,840)
(2,038)
Increase (Decrease) in Working Capital
463
786
(419)
2,259
2,503
TOTAL USES
$1,513
$2,336
$1,131
$3,809
$4,053
FREE CASH FLOW
$66
$602
$2,797
$416
$629
49
Discounted Cash Flow Analysis – EBITDA Multiple Methodology
Valuation Analysis
Discount Rate
15.00%
17.50%
20.00%
22.50%
25.00%
Present Value of Cash Flows:
$2,902
$2,715
$2,545
$2,389
$2,246
Present Value of Terminal Value:
5.5 x
$18,293
$16,428
$14,787
$13,338
$12,057
6.0 x
$19,956
$17,922
$16,131
$14,551
$13,153
Multiple
6.5 x
$21,620
$19,415
$17,475
$15,764
$14,249
7.0 x
$23,283
$20,909
$18,820
$16,976
$15,345
7.5 x
$24,946
$22,402
$20,164
$18,189
$16,441
Total Value:
5.5 x
$21,195
$19,143
$17,332
$15,727
$14,303
6.0 x
$22,858
$20,637
$18,676
$16,940
$15,399
Multiple
6.5 x
$24,521
$22,130
$20,020
$18,152
$16,495
7.0 x
$26,184
$23,624
$21,364
$19,365
$17,591
7.5 x
$27,847
$25,117
$22,709
$20,578
$18,687
Equity Value:
5.5 x
$18,018
$15,967
$14,155
$12,551
$11,126
6.0 x
$19,682
$17,460
$15,499
$13,763
$12,222
Multiple
6.5 x
$21,345
$18,954
$16,843
$14,976
$13,318
7.0 x
$23,008
$20,447
$18,188
$16,188
$14,415
7.5 x
$24,671
$21,941
$19,532
$17,401
$15,511
Equity Value Per Share:
5.5 x
$3.72
$3.29
$2.92
$2.59
$2.30
6.0 x
$4.06
$3.60
$3.20
$2.84
$2.52
Multiple
6.5 x
$4.40
$3.91
$3.47
$3.09
$2.75
7.0 x
$4.75
$4.22
$3.75
$3.34
$2.97
7.5 x
$5.09
$4.53
$4.03
$3.59
$3.20
50
Discounted Cash Flow Analysis – Weighted Average Cost of Capital
Valuation Analysis
[1] The risk free rate (Rf) is estimated to be the US treasury 10 year bond yield at 8/30/04.
[2] Moody’s corporate bond yield average.
[3] Ibbotson & Sinqufield data
[4] BARRA predicted beta if available. Latest 52 week beta relative to the NYSE otherwise.
[5] Per latest balance sheet.
WEIGHTED AVERAGE COST OF CAPITAL
WACC COMPONENTS
Cost of Debt:
Kd = Yield to Maturity on Long-Term Debt Obligations
Kd = Corporate Bond Yield Average
Kd = 6.0%
Cost of Equity:
Ke = Risk Free Rate + Company Risk Premium
Ke = Rf + [ Comparable Co. Beta x Equity Risk Premium]
Ke = 4.2% + [1.5 x 10.9% ]
Ke = 21.1%
Weighted Average Cost of Capital:
WACC = [ (D/C) (1-t) Kd] + [ (E/C) Ke]
WACC = [ 6.8% x 61.0 % x 6.0% ] + [93.2% x 21.1% ]
WACC = 19.9%
COMPARABLE COMPANY BETA & DEBT TO CAPITAL RATIO
Country
Unlevered
Relevered
Symbol
Company
of HeadQtrs
Beta [4]
Beta
Beta
ACMR
A.C. MOORE ARTS & CRAFTS INC
UNITED STATES
1.81
1.73
1.97
HKF
HANCOCK FABRICS INC
UNITED STATES
1.22
1.08
1.24
JAS
JO-ANN STORES INC
UNITED STATES
0.54
0.46
0.52
MIK
MICHAELS STORES INC
UNITED STATES
1.41
1.36
1.55
PCTY
PARTY CITY CORP
UNITED STATES
1.36
1.36
1.54
MEAN
1.27
1.20
1.37
MEDIAN
1.36
1.36
1.54
RAGS
RAG SHOPS INC
UNITED STATES
1.29
1.14
1.29
WACC COMPONENTS
Rf [1]
4.19%
Date of Rf
8/30/04
Kd [2]
6.04%
Ke
21.1%
Equity Risk Premium (Rm-Rf) [3]
10.9%
Tax Rate
39.0%
Tax Complement (1-t)
61.0%
Beta (Median)
1.54
Market
Price
Shares
Value of
Total
Total
Debt/
Equity/
Debt/
Tax
8/30/04
Out. [5]
Equity
Debt [5]
Capital
Capital
Capital
Equity
Rate
$21.02
19
410
30
440
6.8%
93.2%
7.3%
38.23%
$10.96
18
198
41
239
17.1%
82.9%
20.7%
36.30%
$26.32
22
578
162
740
21.8%
78.2%
28.0%
38.42%
$56.88
68
3,880
200
4,080
4.9%
95.1%
5.2%
37.34%
$13.55
17
229
0
229
0.0%
100.0%
0.0%
40.47%
1,059
87
1,146
10.1%
89.9%
12.2%
38.2%
410
41
440
6.8%
93.2%
7.3%
38.2%
$3.61
5
17
4
21
18.5%
81.5%
22.6%
39.00%
51
Summary of Valuation Analysis
Valuation Analysis
Implied Equity Value
Methodology
Total
Per Share
Total
Per Share
Total
Per Share
Total
Per Share
Selected Reference Company Analysis
Crafts and Celebration Retailers
Using Mean Multiples
$12,792
$2.64
$18,466
$3.81
$75,128
$15.50
$0
$0.00
Using Median Multiples
11,741
2.42
16,301
3.36
60,332
12.45
0
0.00
Crafts and Celebration and Discount Retailers
Using Mean Multiples
13,391
2.76
19,253
3.97
78,506
16.19
0
0.00
Using Median Multiples
14,472
2.99
21,265
4.39
93,430
19.27
0
0.00
Selected Reference Transaction Analysis
Using Mean Multiples
10,009
2.06
16,682
3.44
66,727
13.76
0
0.00
Using Median Multiples
8,380
1.73
18,623
3.84
55,868
11.52
0
0.00
Premiums Paid Analysis at August 30, 2004
All M&A Transactions between $10 and $100 Million
Using Mean Premiums
22,474
4.64
22,680
4.68
22,209
4.58
Using Median Premiums
20,242
4.18
20,563
4.24
19,863
4.10
Retail Transactions
Using Mean Premiums
23,942
4.94
25,386
5.24
22,450
4.63
Using Median Premiums
22,517
4.64
23,801
4.91
21,176
4.37
Specialty Retail Transactions
Using Mean Premiums
21,918
4.52
22,535
4.65
21,397
4.41
Using Median Premiums
21,555
4.45
22,051
4.55
21,176
4.37
Premiums Paid Analysis at February 24, 2004
All M&A Transactions between $10 and $100 Million
Using Mean Premiums
22,723
4.69
22,931
4.73
22,455
4.63
Using Median Premiums
20,467
4.22
20,791
4.29
20,083
4.14
Retail Transactions
Using Mean Premiums
24,208
4.99
25,667
5.29
22,698
4.68
Using Median Premiums
22,767
4.70
24,064
4.96
21,410
4.42
Specialty Retail Transactions
Using Mean Premiums
22,161
4.57
22,785
4.70
21,634
4.46
Using Median Premiums
21,794
4.50
22,295
4.60
21,410
4.42
Discounted Cash Flow Analysis
16,843
3.47
20,447
4.22
13,763
2.84
Mean
High
Low
Weighted Average
52
Comparable Public Company Analysis
* Excluded from average NA - Not available NM - Not meaningful F - Fiscal Year
[1] Estimates from First Call as of 08/30/04. STRH Equity Research estimates denoted in bold.
Public Reference Company Analysis
Market
Earnings Per Share [1]
5 Year
Price / Earnings Ratio
Price
% of
Calendar
Growth
Company Name
08/30/04
High
LTM
2004
2005
Rate
Craft & Celebration Retailers
A.C. Moore Arts & Crafts, Inc.
$21.02
71.2%
$0.87
$0.99
$1.30
21.0%
Hancock Fabrics, Inc.
10.96
61.4%
0.53
0.47
0.76
15.0%
Jo-Ann Stores, Inc.
26.32
86.3%
2.14
2.23
2.48
12.0%
Michaels Stores, Inc.
56.88
98.7%
2.74
2.96
F
3.35
F
15.0%
Party City Corporation
13.55
78.2%
0.79
0.78
1.12
15.0%
Average
79.2%
15.6%
Median
78.2%
15.0%
Discount Retailers
99 Cents Only Stores
$13.01
36.1%
$0.60
$0.51
$0.60
20.0%
Big Lots, Inc.
12.40
67.4%
0.66
0.68
F
0.85
F
15.0%
Dollar General Corporation
19.29
83.2%
0.95
1.03
F
1.19
F
15.0%
Dollar Tree Stores, Inc.
23.74
60.1%
1.57
1.79
F
2.11
F
20.0%
Family Dollar Stores, Inc.
26.56
60.2%
1.55
1.57
F
1.80
F
15.0%
Fred's, Inc.
14.26
36.8%
0.83
0.98
F
1.20
F
20.0%
Average
57.3%
17.5%
Median
60.1%
17.5%
Combined Average
67.2%
16.6%
Combined Median
67.4%
15.0%
Rag Shops, Inc.
$3.61
76.2%
($0.23)
($0.29)
F
$0.01
F
NA
Price / Earnings Ratio
2005
Calendar
PEG
Market
Market/
LTM
2004
2005
Ratio
Cap'n
Book
Net Debt
24.2
x
21.2
x
16.2
x
0.8
x
$409.8
2.4
x
($17.4)
20.7
23.3
14.4
1.0
198.4
1.6
37.2
12.3
11.8
10.6
0.9
578.4
1.6
144.0
20.8
19.2
17.0
1.1
3,880.1
3.3
(107.4)
17.2
17.4
12.1
0.8
228.7
2.4
(27.8)
19.0
x
18.6
x
14.1
x
0.9
x
2.2
x
$5.7
20.7
19.2
14.4
0.9
2.4
(17.4)
21.7
x
25.5
x
21.7
x
1.1
x
$904.4
1.9
x
($94.1)
18.8
18.1
14.6
1.0
1,438.2
1.4
182.0
20.3
18.7
16.2
1.1
6,334.8
4.1
173.5
15.1
13.3
11.3
0.6
2,698.5
2.5
87.2
17.1
16.9
14.8
1.0
4,469.5
3.3
(196.5)
17.2
14.6
11.9
0.6
557.4
1.9
32.2
18.4
x
17.8
x
15.1
x
0.9
x
2.5
x
$30.7
18.0
17.5
14.7
1.0
2.2
59.7
18.7
x
18.2
x
14.6
x
0.9
x
2.4
x
$19.3
18.8
18.1
14.6
1.0
2.4
32.2
NM
x
NM
x
243.6
x
NA
x
$17.3
0.8
x
$3.9
53
* Excluded from average NA - Not available NM - Not meaningful
[1] Excludes unusual items.
[2] 2004 values reflect Bloomberg consensus estimates.
[3] Excludes approximately $6.3 million of debt repurchases and share reclassification expense.
[4] Excludes $4.1 million of litigation charges.
[5] Excludes a $9.9 million partial charge-off of HCC note and $9.1 million for the CA wage and hour class action lawsuit.
[6] Excludes approximately $10.0 million for penalty and litigation settlement proceeds.
[7] Excludes approximately $0.161 million gain from sale of securities.
Comparable Public Company Analysis
Public Reference Company Analysis
Total Firm
Net Debt /
Latest Twelve Months
EBITDA [1]
EBIT [1]
Company Name
Value
EBITDA
Revenue
EBITDA [1]
EBIT [1]
Margin
Margin
Craft & Celebration Retailers
A.C. Moore Arts & Crafts, Inc.
$392.4
NM
x
$461.0
$35.1
$27.8
7.6%
6.0%
Hancock Fabrics, Inc.
235.6
1.6
434.7
22.9
16.1
5.3%
3.7%
Jo-Ann Stores, Inc.
722.4
1.0
1,776.0
137.6
[3]
98.2
[3]
7.7%
5.5%
Michaels Stores, Inc.
3,772.7
NM
3,227.1
404.3
317.3
12.5%
9.8%
Party City Corporation
200.9
NM
516.3
45.5
[4]
27.9
[4]
8.8%
5.4%
Average
1.3
x
8.4%
6.1%
Median
1.3
7.7%
5.5%
Discount Retailers
99 Cents Only Stores
$810.2
NM
x
$926.3
$87.8
$59.5
9.5%
6.4%
Big Lots, Inc.
1,620.1
0.8
4,290.9
237.6
[5]
144.3
[5]
5.5%
3.4%
Dollar General Corporation
6,508.3
0.2
7,236.0
697.4
[6]
539.1
[6]
9.6%
7.5%
Dollar Tree Stores, Inc.
2,785.7
0.2
2,972.8
411.8
299.2
13.9%
10.1%
Family Dollar Stores, Inc.
4,273.1
NM
5,166.1
517.0
421.1
10.0%
8.2%
Fred's, Inc.
589.5
0.4
1,372.0
74.9
48.4
5.5%
3.5%
Average
0.4
x
9.0%
6.5%
Median
0.3
9.6%
6.9%
Combined Average
0.7
x
8.7%
6.3%
Combined Median
0.6
8.8%
6.0%
Rag Shops, Inc.
$21.2
(25.7)
x
$117.7
($0.2)
[7]
($1.6)
[7]
(0.1%)
(1.4%)
FV to
Firm Value to LTM:
2004 [2]
2005
Firm Value to 2004:
2005
Revenue
EBITDA [1]
EBIT [1]
Revenue
EBITDA
EBIT
EBITDA
Revenue
EBITDA
EBIT
EBITDA
0.85
x
11.2
x
14.1
x
$508.5
F
$41.6
F
$31.9
F
$53.2
F
0.77
x
9.4
x
12.3
x
7.4
x
0.54
10.3
14.6
433.6
F
39.9
F
23.8
F
43.3
F
0.54
5.9
9.9
5.4
0.41
5.3
7.4
1,823.3
F
139.0
F
93.9
F
146.0
F
0.40
5.2
7.7
4.9
1.17
9.3
11.9
3,381.8
F
454.6
F
363.7
F
518.9
F
1.12
8.3
10.4
7.3
0.39
4.4
7.2
537.6
F
53.4
F
33.7
F
NA
0.37
3.8
6.0
NA
0.67
x
8.1
x
11.0
x
0.64
x
6.5
x
9.2
x
6.3
0.54
9.3
11.9
0.54
5.9
9.9
6.4
0.87
x
9.2
x
13.6
x
$1,004.4
F
$89.5
F
$48.0
F
$117.3
0.81
x
9.1
x
16.9
*
6.9
x
0.38
6.8
11.2
4,466.1
F
244.2
F
140.6
F
279.4
0.36
6.6
11.5
5.8
0.90
9.3
12.1
7,677.2
F
744.6
F
581.1
F
844.6
0.85
8.7
11.2
7.7
0.94
6.8
9.3
3,177.4
F
440.1
F
318.0
F
512.5
0.88
6.3
8.8
5.4
0.83
8.3
10.1
5,924.5
F
525.0
F
430.2
F
601.2
0.72
8.1
9.9
7.1
0.43
7.9
12.2
1,478.6
F
84.4
F
55.0
F
103.0
0.40
7.0
10.7
5.7
0.72
x
8.0
x
11.4
x
0.67
x
7.6
x
10.4
x
6.4
0.85
8.1
11.6
0.76
7.6
11.0
6.4
0.70
x
8.1
x
11.2
x
0.66
x
7.1
x
10.5
x
6.4
0.83
8.3
11.9
0.72
7.0
10.4
6.4
0.18
x
NM
x
NM
x
$118.2
F
($0.7)
F
($2.3)
F
$1.6
0.18
x
NM
x
NM
x
13.0
x
54

Recent Retail Merger and Acquisition Transactions
M&A Transaction Analysis
[1] Firm value less net debt equals equity value.
- Excluded from average NA - Not Available NM - Not Meaningful
Pending
Casual Male Retail Group, Inc.
Rochester Big & Tall Clothing
$24
$24
NA
x
0.46
x
NA
x
NA
x
Pending
Factory 2-U Acquisition LLC
Factory 2-U Stores, Inc.
26
28
NM
0.05
*
NM
NM
Pending
Private Equity Group Consortium
Mervyn's, Inc.
1,650
1,650
NA
0.50
NA
NA
Pending
Crescent Capital Investments
Loehmann's Holdings Inc.
170
178
22.5
0.47
7.1
12.0
Pending
Leonard Green & Partners LP
Hollywood Entertainment Corp.
1,182
901
10.5
0.69
5.0
6.7
08/25/04
Luxottica Group SpA
Cole National Corp.
727
496
NM
0.60
15.9
121.1
*
08/02/04
Oak Hill Capital Management, Inc.
Duane Reade, Inc.
673
402
79.2
*
0.49
11.9
30.4
07/30/04
Dicks Sporting Goods, Inc.
Galyans Trading Co., Inc.
355
298
176.4
*
0.49
10.5
48.8
*
07/06/04
Green Valley Acquisition Co. LLC
Uni-Marts, Inc.
90
17
68.4
*
0.29
10.9
23.7
06/09/04
MarineMax, Inc.
Imperial Marine
9
9
NA
0.78
NA
NA
05/12/04
Circuit City Stores, Inc.
InterTAN, Inc.
264
291
33.3
0.59
8.0
10.4
04/15/04
Compass Group USA Invest LLP
Creative Host Services, Inc.
40
31
49.8
*
1.00
7.9
16.0
04/01/04
Genesco, Inc.
Hat World, Inc.
NA
165
NA
NA
NA
NA
01/30/04
Blyth, Inc.
Walter Drake, Inc.
53
53
NA
0.66
NA
NA
12/20/03
CompUSA Inc.
Good Guys, Inc.
91
56
NM
0.13
11.8
NM
12/09/03
Boise Cascade Corp.
OfficeMax, Inc.
1,147
1,200
60.0
*
0.24
9.8
41.9
*
12/01/03
TBC Corp.
Sears Roebuck & Co. (National Tire
and Battery Business)
260
260
NA
NA
NA
NA
10/24/03
Bon-Ton Stores, Inc.
Elder-Beerman Stores Corp.
208
98
50.1
*
0.31
9.0
70.2
*
09/17/03
Alloy, Inc.
dELIA s Corp.
48
50
NM
0.35
NM
NM
09/05/03
Chico's FAS, Inc.
White House, Inc.
98
90
21.4
1.38
11.0
13.5
08/04/03
Gart Sports Co.
Sports Authority
581
464
24.3
0.41
9.3
24.6
07/17/03
Amazing Savings Holding LLC
Odd Job Stores, Inc.
22
27
NM
0.11
NM
NM
07/03/03
Ripplewood Corp.
Lillian Vernon Corp.
36
60
NM
0.15
NM
NM
06/30/03
Dollar Tree Stores, Inc.
Greenbacks, Inc.
100
100
NA
0.78
NA
NA
06/19/03
Bed Bath & Beyond, Inc.
Christmas Tree Shops, Inc.
200
200
20.0
0.54
NA
NA
06/16/03
Sun Capital Partners, Inc.
Musicland Group, Inc.
503
NA
NA
0.29
NM
NM
Firm
Equity
Equity Value/
Firm Value/
Date
Value
Value
LTM
LTM
LTM
LTM
Effective
Acquiror Name
Target Name
($MM)
($MM) [1]
Net Income
Revenue
EBITDA
EBIT
55

Recent Retail Merger and Acquisition Transactions
[1] Firm value less net debt equals equity value.
* - Excluded from average NA - Not Available NM - Not Meaningful
M&A Transaction Analysis
12/02/02
Bear, Stearns Cos.
Vitamin Shoppe Industries, Inc.
310
NA
NA
NA
NA
NA
10/28/02
Tiffany & Co.
Little Switzerland
53
43
NM
0.88
NM
NM
08/30/02
Aaron Rents, Inc.
Sight'n Sound
12
12
NA
0.20
NA
NA
05/15/02
Designs, Inc.
Casual Male Corp.
170
170
NM
0.36
4.5
6.5
03/04/02
Tweeter Home Entertainment
Hillcrest High Fidelity
5.7
NA
NA
0.41
NA
NA
11/05/01
Best Buy Co.
Future Shop Ltd.
402
377
18.0
0.31
7.1
11.8
10/18/01
Mothers Work, Inc.
iMaternity
26
20
NA
0.51
NA
NA
08/17/01
Charming Shoppes, Inc.
Lane Bryant (subsidiary LTD)
335
335
NA
0.36
NA
NA
08/01/01
Tweeter Home Entertainment
Sound Advice, Inc.
168
144
29.9
0.82
12.0
17.0
06/07/01
Gart Sports Co.
Oshman's Sporting Goods, Inc.
109
109
5.4
0.33
4.0
5.2
05/01/01
Tweeter Home Entertainment
Big Screen City
5
5
NA
0.33
NA
NA
04/25/01
Guitar Center, Inc.
American Music Group
34
17
NA
1.12
NA
NA
01/23/01
Best Buy Co. Inc.
Musicland Stores Corp.
639
419
7.2
0.33
4.4
6.2
12/18/00
Best Buy Co. Inc.
Magnolia Hi-Fi, Inc.
87
87
NA
0.88
NA
NA
10/02/00
Tweeter Home Entertainment
Douglas TV, Inc.
6
6
NA
0.21
NA
NA
10/02/00
Leonard Green & Partners LP
Petco Animal Supplies, Inc.
574
482
19.6
0.56
6.2
10.9
09/20/00
Zale Corp.
Piercing Pagoda, Inc.
218
206
14.9
0.77
6.2
8.3
09/11/00
Natural Wonders, Inc.
World of Science, Inc.
10
5
NM
0.18
NM
NM
08/11/00
May Department Stores Co.
David's Bridal, Inc.
414
413
31.2
1.99
16.0
19.5
07/31/00
Signet Group PLC
Marks & Morgan
160
115
NA
1.01
NA
10.6
06/14/00
Barnes & Noble, Inc.
Funco, Inc.
142
163
18.6
0.56
7.6
10.1
05/10/00
Investcorp International, Inc.
Jostens, Inc.
930
851
19.7
1.19
8.7
11.4
02/24/00
Claire's Stores, Inc.
Cleopatre
11
11
NA
1.10
NA
NA
01/11/00
Charming Shoppes, Inc.
Catherines Stores Corp.
156
155
14.0
0.51
5.6
8.1
12/31/99
May Department Stores Co.
Zion Cooperative Mercantile
115
50
NM
0.48
NM
NM
12/02/99
Claire's Stores, Inc.
Venator-Afterthought Chain
250
248
NA
1.28
22.9
*
67.2
*
Firm
Equity
Equity Value/
Firm Value/
Date
Value
Value
LTM
LTM
LTM
LTM
Effective
Acquiror Name
Target Name
($MM)
($MM) [1]
Net Income
Revenue
EBITDA
EBIT
56
Recent Retail Merger and Acquisition Transactions
[1] Firm value less net debt equals equity value.
- Excluded from average NA - Not Available NM - Not Meaningful
M&A Transaction Analysis
09/24/99
Buhrmann NV
Corporate Express, Inc.
2,342
1,062
NM
0.62
14.4
24.7
08/06/99
Koninklijke Numico NV
General Nutrition Companies
2,504
1,746
22.5
1.76
*
11.0
14.9
07/30/99
ShopKo Stores, Inc.
Pamida Holdings Corp.
236
68
23.3
0.35
5.2
7.7
06/15/99
Jones Apparel Group, Inc.
Nine West Group, Inc.
1,384
887
23.7
0.72
8.4
12.0
06/01/99
Men's Wearhouse, Inc.
K&G Men's Center, Inc.
94
112
17.9
0.68
9.1
9.9
03/22/99
Federated Department Stores
Fingerhut Cos, Inc.
1,605
1,344
28.6
0.90
7.8
10.5
Overall Average
$393.6
20.3
x
0.60
x
8.9
x
13.2
x
Overall Median
$169.1
22.5
0.51
8.7
12.0
Average Excluding Deals Over $1B
$205.0
20.1
x
0.60
x
8.8
x
13.0
x
Median Excluding Deals Over $1B
$128.5
21.9
0.49
8.7
11.8
Average of Deals Under $50MM
$21.0
NM
0.49
x
7.9
x
16.0
x
Median of Deals Under $50MM
$21.7
NM
0.35
7.9
16.0
Average of Deals with Negative EBITDA
$113.0
0.34
x
Median of Deals with Negative EBITDA
$48.3
0.29
Firm
Equity
Equity Value/
Firm Value/
Date
Value
Value
LTM
LTM
LTM
LTM
Effective
Acquiror Name
Target Name
($MM)
($MM) [1]
Net Income
Revenue
EBITDA
EBIT
57

All YTD M&A Transactions Between $10 and $100 Million
Premiums Paid Analysis
Premium
Date
Enterprise
1 Day Prior to
5 Days Prior to
30 Days Prior to
Announced
Acquiror Name
Target Name
Value ($MM)
Announcement
Announcement
Announcement
08/30/04
CIBER Inc.
Novasoft AG
$53.1
41.0%
38.0%
35.0%
08/27/04
Bravo Sports
Variflex, Inc.
35.0
-2.0%
3.0%
6.0%
08/27/04
Koerber AG
Winkler & Dunnebier AG
58.4
171.0%
160.0%
200.0%
08/26/04
First Federal Bank of The Southwest, Inc.
GFSB Bancorp, Inc.
22.9
-15.0%
-5.0%
-11.0%
08/25/04
WesBanco, Inc.
Winton Financial Corp.
98.9
60.0%
64.0%
66.0%
08/24/04
Sybron Dental Specialties, Inc.
Innova LifeSciences Corp.
43.0
33.0%
37.0%
36.0%
08/24/04
Cognos, Inc.
Frango AB
51.6
76.0%
74.0%
62.0%
08/23/04
C.I. Traders Ltd.
ComProp Ltd.
86.2
16.0%
16.0%
16.0%
08/17/04
Bytes Technology Grp (Usko) Ltd.
CS Computer Services Holding Ltd.
6.2
-4.0%
-29.0%
-22.0%
08/17/04
Lojack Corp.
Boomerang Tracking, Inc.
62.5
73.0%
81.0%
63.0%
08/12/04
ESB Financial Corp.
PHSB Financial Corp.
78.4
20.0%
30.0%
35.0%
08/10/04
Art Technology Group, Inc.
Primus Knowledge Solutions, Inc.
28.1
42.0%
42.0%
-16.0%
08/09/04
Intec Inc.
Intec Communications Inc.
41.9
19.0%
18.0%
13.0%
08/09/04
MIM Corp.
Chronimed, Inc.
95.4
-4.0%
-3.0%
-5.0%
08/06/04
Millfield Group PLC
Inter-Alliance Group PLC
20.6
109.0%
92.0%
77.0%
08/06/04
Toklon Ltd.
Gaming International PLC
22.8
10.0%
12.0%
5.0%
08/06/04
TEC Holdings
Estates & Agency Holdings PLC
46.3
-3.0%
-3.0%
-3.0%
08/06/04
Tokyo Dome Corp.
Matsudo Kousan Co., Ltd.
75.8
8.0%
5.0%
-3.0%
08/05/04
Gulfside Supply, Inc.
Eagle Supply Group, Inc.
22.6
11.0%
15.0%
1.0%
08/05/04
Enterra Energy Trust
Rocky Mountain Energy Corp.
41.2
52.0%
49.0%
41.0%
08/04/04
William Saurin
Paul Predault SA
18.4
121.0%
131.0%
134.0%
08/03/04
Park National Corp.
First Federal Bancorp Inc.
43.5
49.0%
57.0%
56.0%
07/29/04
Ennstone PLC
Johnston Group PLC
87.6
88.0%
80.0%
54.0%
07/28/04
Proventus AB
Brio AB
13.2
-12.0%
-15.0%
1.0%
07/28/04
Alvarion Ltd.
interWAVE Communications International Ltd.
51.9
9.0%
9.0%
15.0%
07/19/04
MCCC ICG Holdings LLC
ICG Communications, Inc.
5.9
47.0%
150.0%
0.0%
07/19/04
Webster Financial Corp.
First City Bank
29.6
21.0%
24.0%
16.0%
07/16/04
AmSouth Bancorporation
Frankfort First Bancorp, Inc.
29.8
1.0%
3.0%
14.0%
07/15/04
Peoples Holding Co.
Heritage Financial Holding Corp.
67.7
15.0%
12.0%
36.0%
07/14/04
United Heritage Corp.
Imperial Petroleum, Inc.
8.8
14.0%
14.0%
85.0%
07/14/04
SYNNEX Corp.
EMJ Data Systems Ltd.
40.8
6.0%
11.0%
13.0%
07/13/04
Morse PLC
Diagonal PLC
89.5
15.0%
17.0%
49.0%
07/07/04
Roly International Holdings Ltd.
Byford International Ltd.
6.5
8.0%
3.0%
94.0%
07/07/04
AA Scott Pty. Ltd.
Heggies Bulkhaul Ltd.
13.7
13.0%
13.0%
3.0%
07/07/04
Brookline Bancorp, Inc.
Mystic Financial, Inc.
61.5
20.0%
21.0%
40.0%
07/06/04
Energy World Corp. Ltd.
Pacific Energy Ltd.
2.3
10.0%
-4.0%
30.0%
07/06/04
Blue Mountain Energy Ltd.
Sentra Resources Corp.
27.8
21.0%
19.0%
16.0%
07/02/04
AIXTRON AG
Genus, Inc.
117.7
6.0%
20.0%
58.0%
07/01/04
Viacom, Inc.
SportsLine.com, Inc.
38.2
39.0%
40.0%
55.0%
Source: FactSet Research Systems, Inc.
58

Premiums Paid Analysis
All YTD M&A Transactions Between $10 and $100 Million
Premium
Date
Enterprise
1 Day Prior to
5 Days Prior to
30 Days Prior to
Announced
Acquiror Name
Target Name
Value ($MM)
Announcement
Announcement
Announcement
06/30/04
The First American Corp.
Basis100, Inc.
33.0
43.0%
69.0%
69.0%
06/30/04
Rio Narcea Gold Mines Ltd.
Defiance Mining Corp.
39.0
34.0%
50.0%
34.0%
06/30/04
Monmouth Community Bancorp.
Allaire Community Bank NJ
55.2
55.0%
60.0%
60.0%
06/29/04
Comvest Investment Partners LP
Catalyst International, Inc.
19.7
92.0%
92.0%
85.0%
06/28/04
Community Bancorp, Inc.
Cuyamaca Bank, N.A.
24.7
29.0%
35.0%
36.0%
06/28/04
Bangkok Dusit Medical Services Public Co. Ltd.
Samitivej Public Co., Ltd.
27.5
14.0%
18.0%
22.0%
06/28/04
Clear Energy, Inc.
Ranchgate Energy, Inc.
29.8
0.0%
-1.0%
23.0%
06/28/04
Sanmina-SCI Corp.
Pentex-Schweizer Circuits Ltd.
74.2
6.0%
6.0%
14.0%
06/25/04
Itoki Crebio Corp.
Itoki Co., Ltd.
48.8
16.0%
10.0%
5.0%
06/23/04
Sonic Healthcare Ltd.
Independent Practitioner Network Ltd.
23.8
14.0%
50.0%
119.0%
06/21/04
Paramount PLC
Paramount PLC
53.1
3.0%
13.0%
17.0%
06/17/04
Diverse Holdings Ltd.
Integrated Dental Holdings PLC
13.9
18.0%
18.0%
18.0%
06/17/04
The Carlyle Group
P&I Personal & Informatik AG
70.6
21.0%
19.0%
22.0%
06/17/04
JDA Software Group, Inc.
QRS Corp.
97.6
2.0%
14.0%
12.0%
06/15/04
Boston Private Financial Holdings, Inc.
Encino State Bank
33.1
140.0%
46.0%
45.0%
06/14/04
Sterling Financial Corp.
Pennsylvania State Banking Co.
44.0
68.0%
68.0%
-98.0%
06/14/04
Fulton Financial Corp
First Washington Financial Corp.
115.7
39.0%
36.0%
35.0%
06/11/04
Production Resource Group LLC
VLPS Lighting Services International, Inc.
62.0
96.0%
105.0%
54.0%
06/10/04
Major Automotive Cos., Inc.
Major Automotive Companies, Inc.
6.6
1.0%
13.0%
-9.0%
06/10/04
Major Cineplex Group Public Co. Ltd.
EGV Entertainment Public Co. Ltd.
47.3
-7.0%
6.0%
14.0%
06/04/04
Stephan Co. /Scott
Stephan Co.
19.9
8.0%
10.0%
12.0%
06/02/04
Cheminees Philippe
Chabert Duval SA
3.9
92.0%
91.0%
91.0%
06/01/04
ASM Ventures Ltd.
Transpac Industrial Holdings Ltd.
50.0
26.0%
24.0%
4.0%
05/26/04
CUNO Inc.
WTC Industries, Inc.
76.0
27.0%
42.0%
27.0%
05/25/04
Fairborne Energy Ltd.
Case Resources, Inc.
37.3
-2.0%
0.0%
-9.0%
05/24/04
Charterhouse Group International, Inc.
Lason, Inc.
3.7
-17.0%
-17.0%
-17.0%
05/24/04
Banco Bilbao Vizcaya Argentaria SA
Valley Bank
16.7
20.0%
9.0%
14.0%
05/21/04
Respironics, Inc.
Profile Therapeutics PLC
44.4
16.0%
16.0%
2.0%
05/20/04
Voestalpine AG
Nedcon Groep N.V.
36.9
24.0%
25.0%
20.0%
05/19/04
SteelCloud, Inc.
V-One Corp.
9.1
58.0%
43.0%
-3.0%
05/17/04
Quebecor, Inc.
Netgraphe, Inc.
17.9
34.0%
26.0%
17.0%
05/17/04
Suzuken Co., Ltd.
Astis (Eiwa) Co. Ltd.
37.0
53.0%
56.0%
35.0%
05/14/04
MidCountry Financial Corp.
FSF Financial Corp.
83.4
24.0%
23.0%
9.0%
05/13/04
Rita Medical Systems, Inc.
Horizon Medical Products, Inc.
62.9
-17.0%
-30.0%
-34.0%
05/11/04
Lyreco Sa
National 1 Ltd.
14.3
4.0%
0.0%
-6.0%
05/11/04
Burke Investments LLC
MC Shipping, Inc.
24.9
39.0%
30.0%
26.0%
05/10/04
Argo Energy Ltd.
Energy North, Inc.
27.7
2.0%
11.0%
0.0%
05/06/04
Teleca AB
RKS AB
12.4
21.0%
16.0%
11.0%
05/06/04
Sun Japan Corp.
TCC Corp.
33.1
12.0%
-1.0%
88.0%
Source: FactSet Research Systems, Inc.
59

All YTD M&A Transactions Between $10 and $100 Million
Premiums Paid Analysis
Premium
Date
Enterprise
1 Day Prior to
5 Days Prior to
30 Days Prior to
Announced
Acquiror Name
Target Name
Value ($MM)
Announcement
Announcement
Announcement
05/06/04
FNB Corp. (Florida)
Slippery Rock Financial Corp.
76.9
54.0%
51.0%
46.0%
05/03/04
Forte Resources, Inc.
Oiltec Resources Ltd.
32.4
4.0%
5.0%
12.0%
04/30/04
Wooster Inv Pty Ltd.
Hartstone Group
5.8
12.0%
12.0%
0.0%
04/30/04
Marubeni Infotec Corp.
Computer Wave, Inc.
28.1
6.0%
5.0%
10.0%
04/29/04
Telmex - Telefonos de Mexico SA de CV
Chilesat Corp.SA
2.1
-2.0%
-2.0%
-2.0%
04/29/04
infoUSA, Inc.
OneSource Information Services, Inc.
103.2
7.0%
8.0%
8.0%
04/28/04
Peptech (Peptide) Ltd.
Agenix Ltd.
76.6
0.0%
7.0%
24.0%
04/26/04
Bright Now Dental, Inc.
Castle Dental Centers, Inc.
34.4
-58.0%
-55.0%
-48.0%
04/22/04
Maywufa Corp.
Pro Healthcare International Co. Ltd.
16.3
-5.0%
-5.0%
-19.0%
04/22/04
Zhone Technologies, Inc.
Sorrento Networks Corp.
60.5
29.0%
17.0%
-6.0%
04/21/04
Cambior, Inc.
Sequoia Minerals, Inc.
21.5
25.0%
24.0%
34.0%
04/20/04
Sleeman Breweries Ltd.
Unibroue, Inc.
23.4
3.0%
28.0%
59.0%
04/16/04
Arrk Corp.
Avaplas Ltd.
41.3
10.0%
10.0%
19.0%
04/14/04
S Foods Inc.
Murachiku Co., Ltd.
80.0
5.0%
5.0%
25.0%
04/13/04
Synoptik AS
Aqua of Sweden
10.8
109.0%
109.0%
109.0%
04/13/04
First Community Corp.
DutchFork Bancshares, Inc.
48.2
10.0%
12.0%
13.0%
04/13/04
@road, Inc.
MDSI Mobile Data Solutions, Inc.
79.7
73.0%
93.0%
76.0%
04/12/04
Trinity Ventures LP
SciQuest, Inc.
24.0
6.0%
6.0%
6.0%
04/10/04
Northbrook Investments LLC
North Bancshares, Inc.
23.6
16.0%
17.0%
60.0%
04/08/04
Ulma Group
Bauma SA
11.1
-79.0%
-79.0%
-75.0%
04/08/04
Teledyne Technologies, Inc.
Isco, Inc.
91.8
32.0%
33.0%
47.0%
04/07/04
Ultra Source Technology Corp.
Princeton Technology Corp.
12.9
-36.0%
-34.0%
-41.0%
04/07/04
Pinetree Capital Ltd.
GeneVest, Inc.
20.7
-7.0%
-13.0%
-7.0%
04/06/04
Provident Energy Trust
Viracocha Energy, Inc.
95.6
2.0%
8.0%
6.0%
04/05/04
Lam Soon (Thailand) Public Co. Ltd.
Universal Food PCL
7.7
33.0%
45.0%
56.0%
04/02/04
ABN AMRO Rothschild Australia
UK Coal PLC
35.7
63.0%
63.0%
63.0%
04/02/04
PIPEX Communications PLC
Host Europe PLC
57.0
7.0%
12.0%
2.0%
04/01/04
WesBanco, Inc.
Western Ohio Financial Corp.
63.1
13.0%
10.0%
13.0%
03/31/04
GKN PLC
Tochigi Fuji Industrial Co. Ltd.
56.8
5.0%
8.0%
4.0%
03/30/04
Synergy Capital Co Ltd.
Kojitu Co Ltd.
6.8
-19.0%
-7.0%
-6.0%
03/29/04
Peri GmbH
Bauma SA
12.4
-74.0%
-72.0%
-61.0%
03/25/04
Sincere View International Ltd.
China Everbright Technology Ltd.
41.4
-12.0%
-12.0%
-30.0%
03/23/04
Anthem Acquisition Ltd.
Anthem Works Ltd.
19.9
16.0%
18.0%
24.0%
03/22/04
Sutter Capital Management LLC
Lancer Corp.
9.4
-87.0%
-87.0%
-87.0%
03/22/04
Showa Denko K.K.
Heisei Polymer Co. Ltd.
9.7
-2.0%
-2.0%
2.0%
03/22/04
SAFLINK Corp.
SSP Solutions, Inc.
78.6
31.0%
29.0%
18.0%
03/17/04
South Financial Group, Inc.
Florida Banks, Inc.
153.6
24.0%
36.0%
45.0%
03/16/04
Provident Bancorp, Inc.
Warwick Community Bancorp, Inc.
146.1
-3.0%
-5.0%
-4.0%
03/15/04
Carver Bancorp, Inc.
Independence Federal Savings Bank
32.6
-9.0%
-9.0%
-14.0%
Source: FactSet Research Systems, Inc.
60
Premiums Paid Analysis
All YTD M&A Transactions Between $10 and $100 Million
Premium
Date
Enterprise
1 Day Prior to
5 Days Prior to
30 Days Prior to
Announced
Acquiror Name
Target Name
Value ($MM)
Announcement
Announcement
Announcement
03/11/04
Lincoln Bancorp
First Shares Bancorp, Inc.
33.9
38.0%
38.0%
33.0%
03/11/04
Ecolab, Inc.
Alcide Corp.
56.3
24.0%
19.0%
18.0%
03/08/04
Durban Roodeport Deep Ltd.
Emperor Mines Ltd.
61.8
580.0%
623.0%
525.0%
03/02/04
Lastminute.com PLC
Online Travel Corp PLC
84.6
13.0%
12.0%
15.0%
03/01/04
SHPS Holdings, Inc.
LandaCorp, Inc.
50.0
3.0%
4.0%
2.0%
02/27/04
Dainippon Shigyo Co., Ltd.
Nippon Hi Pack Co. Ltd.
93.4
8.0%
8.0%
4.0%
02/24/04
Clinical Data, Inc.
Moore Medical Corp.
38.3
0.0%
0.0%
31.0%
02/23/04
Compton Petroleum Corp.
Redwood Energy Ltd.
4.7
33.0%
33.0%
8.0%
02/20/04
Tailwind Capital Partners
Trover Solutions, Inc.
59.2
0.0%
-3.0%
2.0%
02/18/04
Compass Group PLC
Creative Host Services, Inc.
29.0
22.0%
27.0%
41.0%
02/13/04
Attentus Healthcare
SunLink Health Systems, Inc.
31.4
81.0%
81.0%
87.0%
02/12/04
Walsin Technology Corp.Ltd.
Eden Technology Corp.
13.0
-1.0%
6.0%
8.0%
02/11/04
Allied Motion Technologies, Inc.
Owosso Corp.
4.0
398.0%
305.0%
224.0%
02/10/04
Nanogen, Inc.
Syn X Pharma, Inc.
10.1
9.0%
21.0%
45.0%
02/10/04
Meglan Ltd.
Barlo Group PLC
87.0
5.0%
8.0%
5.0%
02/06/04
SJ Strategic Investments LLC
Moore Medical Corp.
47.8
3.0%
3.0%
114.0%
02/04/04
TH Lee Putnam Ventures
SPI Technologies, Inc.
87.1
25.0%
30.0%
42.0%
02/04/04
Hewlett Packard Co.
Novadigm, Inc.
109.3
28.0%
39.0%
58.0%
02/02/04
Whiting Petroleum Corp.
Equity Oil Co.
58.0
7.0%
-4.0%
38.0%
01/29/04
Novena Holdings Ltd.
Green World Holdings, Ltd.
8.1
12.0%
24.0%
5.0%
01/28/04
Entertainment Rights PLC
Chorion PLC
76.6
13.0%
23.0%
21.0%
01/27/04
Green Valley Acquisition Co. LLC
Uni-Marts, Inc.
16.2
14.0%
37.0%
30.0%
01/27/04
Lawrence Weissberg Revocable Living Trust
Dover Investments Corp.
16.3
24.0%
24.0%
28.0%
01/23/04
Gates Group LLC
Imperial Parking Corp.
48.0
5.0%
3.0%
5.0%
01/22/04
HIG Capital Management, Inc.
T-Netix, Inc.
69.2
10.0%
16.0%
33.0%
01/20/04
McKesson Corp.
Moore Medical Corp.
38.4
15.0%
38.0%
74.0%
01/20/04
Stanley Works Ltd.
Frisco Bay Industries Ltd.
42.5
33.0%
33.0%
69.0%
01/19/04
Wireless Group PLC
Forever Broadcasting PLC
12.0
6.0%
57.0%
103.0%
01/16/04
Bank One Corp.
Ubizen NV
73.5
128.0%
126.0%
139.0%
01/14/04
Rock Bancshares, Inc.
HCB Bancshares, Inc.
27.0
4.0%
5.0%
-3.0%
01/12/04
Stellent Inc.
Optika, Inc.
43.5
-17.0%
-19.0%
-20.0%
01/09/04
Independent Bank Corp. /MA
Falmouth Bancorp, Inc.
36.3
-1.0%
4.0%
33.0%
01/05/04
Sava Kranj dd
Terme 3000 dd
36.7
0.0%
2.0%
12.0%
Average
26.9%
28.8%
29.6%
Median
13.5%
16.0%
17.5%
High
580.0%
623.0%
525.0%
Low
-87.0%
-87.0%
-98.0%
Source: FactSet Research Systems, Inc.
61

Retail Transactions from 2002 to Present
Premiums Paid Analysis
* - Excluded from average
Source: FactSet Research Systems, Inc.
08/09/04
MIM Corp.
Chronimed, Inc.
$95.4
-4.0%
-3.0%
-5.0%
07/07/04
Woolworths Ltd.
Australian Leisure & Hospitality Group Ltd.
566.4
-10.0%
11.0%
26.0%
06/21/04
Dicks Sporting Goods, Inc.
Galyans Trading Co., Inc.
292.0
53.0%
52.0%
76.0%
06/03/04
Revival Group
Marks & Spencer Group PLC
16,683.4
9.0%
16.0%
50.0%
05/24/04
Omnicare, Inc.
Neighborcare, Inc.
1,310.2
70.0%
68.0%
29.0%
05/17/04
Ellerine Holding Ltd.
Relyant Retail Ltd.
169.0
24489.0%
*
24489.0%
*
27382.0%
*
04/30/04
Grafton Group PLC
Heiton Group PLC
401.7
35.0%
39.0%
41.0%
04/23/04
First Islamic Investment Bank EC
Loehmanns Holdings, Inc.
154.8
6.0%
10.0%
25.0%
04/22/04
Maywufa Corp.
Pro Healthcare International Co. Ltd.
16.3
-5.0%
-5.0%
-19.0%
04/14/04
Gigas K's Denki Corp.
Yachiyo Musen Denk
81.3
16.0%
19.0%
25.0%
03/31/04
Koninklijke Vendex KBB NV /Private Group
Koninklijke Vendex KBB NV
1,809.9
10.0%
12.0%
13.0%
03/31/04
Circuit City Stores, Inc.
InterTAN, Inc.
283.0
14.0%
17.0%
21.0%
03/30/04
Synergy Capital Co. Ltd.
Kojitu Co. Ltd.
6.8
-19.0%
-7.0%
-6.0%
03/03/04
Serena Software, Inc.
Merant PLC
382.3
25.0%
23.0%
25.0%
02/12/04
Trinitybrook PLC
New Look Group PLC
1,272.6
4.0%
5.0%
12.0%
02/09/04
Ferrellgas Partners LP
Blue Rhino Corp.
303.5
22.0%
21.0%
26.0%
02/03/04
HAL Trust
GrandVision SA
499.1
9.0%
15.0%
22.0%
01/27/04
Green Valley Acquisition Co. LLC
Uni-Marts, Inc.
16.2
14.0%
37.0%
30.0%
01/26/04
BNP Paribas SA
Groupe Andre SA
858.9
0.0%
1.0%
8.0%
01/26/04
Luxottica Group SpA
Cole National Corp.
487.1
35.0%
34.0%
36.0%
01/23/04
Pendragon PLC
CD Bramall (Sanderson) PLC
403.8
-1.0%
2.0%
36.0%
12/23/03
Oak Hill Capital Management, Inc.
Duane Reade, Inc.
402.6
8.0%
25.0%
26.0%
12/23/03
MC298 Ltd.
Donatantonio PLC
20.9
10.0%
10.0%
1.0%
12/19/03
EW Scripps Co.
Summit America Television, Inc.
178.7
20.0%
13.0%
29.0%
12/08/03
Energy Producers, Inc.
World Wide Connect, Inc.
2.2
73.0%
73.0%
73.0%
11/21/03
Kona Acquisition Corp.
Integrity Media, Inc.
14.4
82.0%
72.0%
78.0%
11/21/03
Gigas K's Denki Corp.
Gigas Corp.
88.2
172.0%
*
170.0%
164.0%
11/19/03
2012413 Ontario, Inc.
Hy & Zels, Inc.
3.2
-1.0%
0.0%
14.0%
10/23/03
Castellina Investments Pty Ltd.
Pepkor Ltd.
384.7
41.0%
40.0%
46.0%
10/06/03
Leonard Green & Partners
FTD, Inc.
410.6
2.0%
12.0%
4.0%
09/29/03
CompUSA, Inc.
Good Guys, Inc.
55.3
37.0%
31.0%
65.0%
09/12/03
Baroness Retail Ltd.
Debenhams PLC
2,693.6
8.0%
8.0%
8.0%
09/08/03
Nutra Pharma Corp.
Infectech, Inc.
4.3
171.0%
*
77.0%
245.0%
*
09/01/03
New Look Group PLC
New Look Group PLC
795.4
12.0%
15.0%
19.0%
08/13/03
Ryland Group PLC /Management
Ryland Group PLC
73.9
3.0%
4.0%
12.0%
07/31/03
Alloy, Inc.
Delias, Inc.
50.0
17.0%
24.0%
12.0%
07/29/03
Bon Ton Stores, Inc.
Elder Beerman Stores Corp.
92.7
33.0%
33.0%
52.0%
Premium
Date
Enterprise
1 Day Prior to
5 Days Prior to
30 Days Prior to
Announced
Acquiror Name
Target Name
Value ($MM)
Announcement
Announcement
Announcement
62
Premiums Paid Analysis
Retail Transactions from 2002 to Present
Premium
Date
Enterprise
1 Day Prior to
5 Days Prior to
30 Days Prior to
Announced
Acquiror Name
Target Name
Value ($MM)
Announcement
Announcement
Announcement
07/23/03
BNP Paribas SA
GrandVision SA
566.5
17.0%
16.0%
22.0%
07/14/03
Boise Cascade Corp.
Officemax, Inc.
1,275.2
43.0%
49.0%
86.0%
06/26/03
Global Crossing Ltd.
Circuit City Stores, Inc.
1,508.6
0.0%
4.0%
22.0%
06/26/03
Wright Holdings, Inc.
Elder Beerman Stores Corp.
90.3
47.0%
43.0%
88.0%
06/23/03
Auchan SA
Brice SA
56.0
46.0%
90.0%
229.0%
06/17/03
Baugur Group hf
Hamleys PLC
85.6
17.0%
17.0%
46.0%
06/16/03
Maus Freres
Aigle SA
57.6
7.0%
10.0%
26.0%
06/11/03
Rewe Zentralfinanz Eg
Curti & Co. AG
121.3
50.0%
52.0%
73.0%
06/10/03
Tesco PLC
C Two-Network Co., Ltd .
274.6
27.0%
37.0%
33.0%
06/08/03
Aoki International Co., Ltd.
Torii Co., Ltd.
36.8
72.0%
69.0%
65.0%
06/03/03
HFL Corp.
Uni-Marts, Inc.
5.0
21.0%
48.0%
91.0%
06/03/03
Amazing Savings Holding LLC
Odd Job Stores, Inc.
24.5
29.0%
33.0%
-12.0%
05/30/03
Freeport PLC /Roberts, Howell & Wright
Freeport PLC
308.8
23.0%
27.0%
76.0%
05/21/03
Eb Acquisition LLC
Elder Beerman Stores Corp.
63.7
17.0%
65.0%
112.0%
05/20/03
Zones, Inc. /Lalji
Zones, Inc.
7.2
20.0%
23.0%
35.0%
05/12/03
Permira Advisers Ltd. / GS Group / Blackstone
Debenhams PLC
2,480.7
4.0%
29.0%
66.0%
05/12/03
Wittington Investments Ltd.
Selfridges PLC
977.2
9.0%
12.0%
66.0%
05/01/03
Nesbitt Acquisitions Ltd.
Arnotts PLC
240.0
12.0%
14.0%
14.0%
04/16/03
Ripplewood Holdings LLC
Lillian Vernon Corp.
60.6
73.0%
75.0%
88.0%
04/01/03
Reitangruppen AS
Sense Communications International
43.1
21.0%
70.0%
70.0%
04/01/03
Bradco Supply Corp.
Wickes, Inc.
7.9
107.0%
104.0%
173.0%
03/24/03
Cancom It Systeme AG
International Computer SA
3.1
275.0%
*
275.0%
*
305.0%
*
03/18/03
Enesco Group, Inc.
Bilston & Battersea Enamels PLC
3.9
40.0%
44.0%
44.0%
02/20/03
Gart Sports Co.
Sports Authority, Inc.
351.8
93.0%
105.0%
53.0%
02/17/03
Mars, Inc.
Nippon Conlux Co., Ltd.
221.4
42.0%
43.0%
45.0%
02/17/03
Wisdom Gateway Ltd.
Joyce Boutique Holdings Ltd.
20.0
24000.0%
*
24000.0%
*
21809.0%
*
02/14/03
SI Acquisition LLC
Successories, Inc.
2.2
88.0%
114.0%
84.0%
01/24/03
Krispy Kreme Doughnuts, Inc.
Montana Mills Bread Co, Inc.
41.1
2.0%
7.0%
13.0%
01/09/03
WM Morrison Supermarkets
Safeway PLC
5,215.9
45.0%
51.0%
38.0%
12/20/02
Concepts Direct, Inc.
Concepts Direct, Inc.
2.1
31.0%
58.0%
-18.0%
12/19/02
Scarlett Retail Group Limited
Allders PLC
199.5
-2.0%
5.0%
44.0%
12/17/02
1551053 Ontario, Inc.
Treats International Enterprises, Inc.
0.1
233.0%
*
233.0%
*
233.0%
*
12/06/02
West Coast Capital Ltd.
House of Fraser PLC
453.6
69.0%
73.0%
146.0%
10/30/02
Tesco PLC
T&S Stores PLC
572.0
98.0%
105.0%
117.0%
10/28/02
E Com Ventures, Inc.
E Com Ventures, Inc.
10.4
32.0%
31.0%
17.0%
09/27/02
Ackermans & Van Haaren NV
GIB Group International
1,033.7
1.0%
4.0%
10.0%
09/26/02
Hamsard 2353 Ltd.
QS Group PLC
24.4
36.0%
36.0%
40.0%
* - Excluded from average
Source: FactSet Research Systems, Inc.
63
Premiums Paid Analysis
Retail Transactions from 2002 to Present
Premium
Date
Enterprise
1 Day Prior to
5 Days Prior to
30 Days Prior to
Announced
Acquiror Name
Target Name
Value ($MM)
Announcement
Announcement
Announcement
09/20/02
Line Trust Corp Ltd.
Gameplay
1.4
88.0%
88.0%
114.0%
09/16/02
Ackermans & Van Haaren NV
GIB Group International
1,033.7
11.0%
9.0%
9.0%
08/19/02
Taveta Investments Ltd.
Arcadia Group PLC
1,206.9
36.0%
53.0%
26.0%
08/13/02
Forfinance
Pier Import Europe SA
10.3
67.0%
67.0%
29.0%
08/06/02
Hartford Group PLC
Jamies Bars PLC
3.8
17.0%
17.0%
-10.0%
08/05/02
Keiyo Co., Ltd.
Nikku Sangyo Co.
24.4
8.0%
8.0%
9.0%
07/30/02
Sutter Holding Co., Inc.
FFP Partners LP
4.5
135.0%
182.0%
174.0%
07/29/02
Omnicare, Inc.
NCS HealthCare, Inc.
130.4
643.0%
*
1122.0%
*
2192.0%
*
07/08/02
eBay, Inc.
PayPal, Inc.
1,264.1
4.0%
3.0%
-18.0%
06/21/02
Musgrave Group Ltd.
Budgens PLC
244.0
9.0%
8.0%
16.0%
06/20/02
Trefick Ltd.
Mallett PLC
36.7
0.0%
0.0%
21.0%
05/13/02
Sears Roebuck & Co.
Lands End, Inc.
1,860.8
22.0%
23.0%
40.0%
04/22/02
Royal Bank of Scotland PLC
Dixon Motors PLC
157.8
2.0%
17.0%
40.0%
04/10/02
Reitmans (Canada) Ltd.
Shirmax Fashions Ltd.
50.4
41.0%
49.0%
66.0%
03/25/02
Mobility Electronics, Inc.
iGo Corp.
7.9
15.0%
15.0%
35.0%
03/12/02
Caprabo SA
Enaco SA
136.4
51.0%
57.0%
80.0%
03/08/02
JJB Sports PLC
TJ Hughes PLC
60.0
4.0%
14.0%
0.0%
02/12/02
United Auto Group, Inc.
Sytner Group PLC
131.2
14.0%
17.0%
63.0%
01/07/02
Atlas International Group Ltd.
LoyaltyPoint, Inc.
10.1
43.0%
100.0%
50.0%
Average
28.3%
37.1%
45.1%
Median
21.0%
29.0%
36.0%
High
24489.0%
24489.0%
27382.0%
Low
-19.0%
-7.0%
-19.0%
* - Excluded from average
Source: FactSet Research Systems, Inc.
64
Specialty Retail Transactions from 2002 to Present
Premiums Paid Analysis
Premium
Date
Enterprise
1 Day Prior to
5 Days Prior to
30 Days Prior to
Announced
Acquiror Name
Target Name
Value ($MM)
Announcement
Announcement
Announcement
08/09/04
MIM Corp.
Chronimed, Inc.
$95.4
-4.0%
-3.0%
-5.0%
06/21/04
Dicks Sporting Goods, Inc.
Galyans Trading Co., Inc.
292.0
53.0%
52.0%
76.0%
06/10/04
Major Automotive Cos., Inc.
Major Automotive Companies, Inc.
6.6
1.0%
13.0%
-9.0%
05/17/04
Ellerine Holding Ltd.
Relyant Retail Ltd.
169.0
24489.0%
*
24489.0%
*
27382.0%
*
05/11/04
Lyreco Sa
National 1 Ltd.
14.3
4.0%
0.0%
-6.0%
05/05/04
Metro Cash & Carry Ltd.
Metro Cash & Carry Ltd.
180.8
-70.0%
-71.0%
-69.0%
03/30/04
Synergy Capital Co Ltd.
Kojitu Co., Ltd.
6.8
-19.0%
-7.0%
-6.0%
03/04/04
Full Circle Ltd.
DFS Furniture Co. Ltd. PLC
892.5
9.0%
9.0%
17.0%
02/09/04
Ferrellgas Partners LP
Blue Rhino Corp.
303.5
22.0%
21.0%
26.0%
02/04/04
Rent A Center, Inc.De
Rainbow Rentals, Inc.
94.9
96.0%
96.0%
118.0%
02/03/04
HAL Trust
GrandVision SA
499.1
9.0%
15.0%
22.0%
01/26/04
Luxottica Group SpA
Cole National Corp.
487.1
35.0%
34.0%
36.0%
01/23/04
Pendragon PLC
CD Bramall (Sanderson) PLC
403.8
-1.0%
2.0%
36.0%
12/22/03
IOT Ltd.
Eurocopy PLC
30.7
14.0%
14.0%
17.0%
12/19/03
EW Scripps Co.
Summit America Television, Inc.
178.7
20.0%
13.0%
29.0%
08/06/03
Ellerine Holding Ltd.
Wetherlys Investment Holdings Ltd.
68.3
3.0%
2.0%
28.0%
07/31/03
Alloy, Inc.
Delias, Inc.
50.0
17.0%
24.0%
12.0%
07/23/03
BNP Paribas SA
GrandVision SA
566.5
17.0%
16.0%
22.0%
07/14/03
Boise Cascade Corp.
Officemax, Inc.
1,275.2
43.0%
49.0%
86.0%
05/20/03
Zones, Inc.
Zones, Inc.
7.2
20.0%
23.0%
35.0%
05/12/03
Riverside Co.
Dwyer Group, Inc.
48.6
59.0%
57.0%
60.0%
04/29/03
Luxottica Group SpA
OPSM Group Ltd.
262.8
22.0%
22.0%
25.0%
04/16/03
Ripplewood Holdings LLC
Lillian Vernon Corp.
60.6
73.0%
75.0%
88.0%
02/20/03
Gart Sports Co.
Sports Authority, Inc.
351.8
93.0%
105.0%
53.0%
12/20/02
Concepts Direct, Inc.
Concepts Direct, Inc.
2.1
31.0%
58.0%
-18.0%
10/28/02
E Com Ventures, Inc.
E Com Ventures, Inc.
10.4
32.0%
31.0%
17.0%
06/20/02
Trefick Ltd.
Mallett PLC
36.7
0.0%
0.0%
21.0%
05/14/02
Kayak Acquisition Corp.
US Vision, Inc.
24.4
25.0%
25.0%
26.0%
05/13/02
Sears Roebuck & Co.
Lands End, Inc.
1,860.8
22.0%
23.0%
40.0%
03/14/02
Guinness Peat Group PLC
Nationwide Accident Repair Services PLC
20.9
12233.0%
*
11297.0%
*
11146.0%
*
02/12/02
United Auto Group, Inc.
Sytner Group PLC
131.2
14.0%
17.0%
63.0%
02/05/02
NeSBIC Groep BV
Beter Bed Holding NV
1.0
28.0%
26.0%
23.0%
Average
22.3%
24.7%
28.8%
Median
21.0%
22.5%
26.0%
High
24489.0%
24489.0%
27382.0%
Low
-70.0%
-71.0%
-69.0%
* - Excluded from average
Source: FactSet Research Systems, Inc.
65