UNITED STATES
SECURITIES AND EXCHANGE COMMISSION
Washington, D.C. 20549
FORMN-CSR
CERTIFIED SHAREHOLDER REPORT OF REGISTERED
MANAGEMENT INVESTMENT COMPANIES
Investment Company Act File Number: 811-06302
Cohen & Steers Realty Shares, Inc.
(Exact name of registrant as specified in charter)
280 Park Avenue, New York, NY 10017
(Address of principal executive offices) (Zip code)
Dana A. DeVivo
Cohen & Steers Capital Management, Inc.
280 Park Avenue
New York, New York 10017
(Name and address of agent for service)
Registrant’s telephone number, including area code: (212)832-3232
Date of fiscal year end: December 31
Date of reporting period: December 31, 2019
Item 1. Reports to Stockholders.
COHEN & STEERS REALTY SHARES, INC.
To Our Shareholders:
We would like to share with you our report for the year ended December 31, 2019. The total returns for Cohen & Steers Realty Shares, Inc. (the Fund) and its comparative benchmarks were:
| | | | | | | | |
| | | Six Months Ended
December 31, 2019 | | | Year Ended
December 31, 2019 | |
Cohen & Steers Realty Shares: | | | | | | | | |
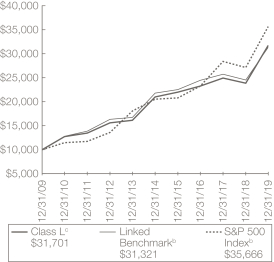
Class L | | | 9.63 | % | | | 32.90 | % |
Linked Benchmarka | | | 7.87 | % | | | 27.74 | % |
S&P 500 Indexa | | | 10.92 | % | | | 31.49 | % |
Effective July 1, 2019, Cohen & Steers Realty Shares, Inc. converted from a no-load fund to a multi-class fund with the addition of Class A, Class C, Class F, Class I, Class L, Class R and Class Z shares. Class F shares are currently not available for purchase. Existing shareholders were mapped to Class L shares.
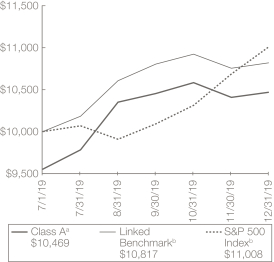
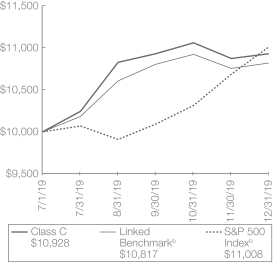
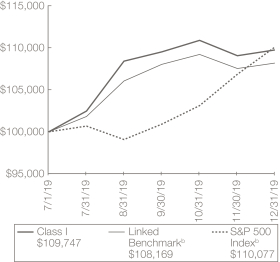
The inception date of Class A, Class C, Class I, Class R and Class Z shares was July 1, 2019. Total return for these classes was 9.63%, 9.28%, 9.75%, 9.55% and 9.80%, respectively, for the period July 1, 2019 through December 31, 2019. Total return for the Linked Benchmark and S&P 500 Index for the period July 1, 2019 through December 31, 2019 was 8.17% and 10.08%, respectively.
The performance data quoted represents past performance. Past performance is no guarantee of future results. The investment return and the principal value of an investment will flucuate and shares, if redeemed, may be worth more or less than their original cost. Current performance may be lower or higher than the performance data quoted. Current total returns of the Fund can be obtained by visiting our website at cohenandsteers.com. All share class returns assume the reinvestment of all dividends and distributions at net asset value (NAV). Fund performance figures reflect fee waivers and/or expense reimbursments, without which the performance would have been lower. Performance quoted does not reflect the deduction of the maximum 4.50% initial sales charge on Class A shares or the 1.00% maximum contingent deferred sales charge on Class C shares. The 1.00% maximum contingent deferred sales charge on Class C applies if redemption occurs on or before the one year anniversary date of their purchase. If such charges were included, returns would have been lower. Index performance does not reflect the deduction of any fees, taxes or expenses. An investor cannot invest directly in any index. Performance figures for periods shorter than one year are not annualized.
| a | The Linked Benchmark is represented by the performance of the FTSE Nareit Equity REITs Index through March 31, 2019 and the FTSE Nareit All Equity REITs Index thereafter. The FTSE Nareit Equity REITs Index contains all tax-qualified real estate investment trusts (REITs) except timber and infrastructure REITs with more than 50% of total assets in qualifying real estate assets other than mortgages secured by real property that also meet minimum size and liquidity criteria. The FTSE Nareit All Equity REITs Index contains all tax-qualified REITs with more than 50% of total assets in qualifying real estate assets other than mortgages secured by real property that also meet minimum size and liquidity criteria. The S&P 500 Index is an unmanaged index of 500 large-capitalization stocks that is frequently used as a general measure of U.S. stock market performance. |
1
COHEN & STEERS REALTY SHARES, INC.
Please note that distributions paid by the Fund to shareholders are subject to recharacterization for tax purposes and are taxable up to the amount of the Fund’s investment company taxable income and net realized gains. Distributions in excess of the Fund’s investment company taxable income and net realized gains are a return of capital distributed from the Fund’s assets.
Market Review
U.S. REITs enjoyed exceptional returns in 2019, supported by generally healthy property fundamentals and declining interest rates. Prospects of slowing economic growth prompted the U.S. Federal Reserve to respond forcefully with rate cuts and other easing measures, driving meaningful gains in the equity market. A resilient economy—marked by a 50-year low in unemployment and 111 consecutive months of job growth—resulted in healthy demand for most property types, coinciding with peaking supply in many sectors. Companies also benefited from easy access to capital at historically low rates, providing a healthy environment for cash flow growth.
Fund Performance
The Fund’s Class L shares had a positive total return for the year and outperformed its linked benchmark. The Fund’s remaining share classes were established on July 1, 2019, and outperformed the linked benchmark from their inception through December 31, 2019. The growing influence of e-commerce on real estate was a key driver of absolute and relative performance. Data centers and towers continued to benefit from rapid growth in data usage as well as increased capital spending on 5G infrastructure. The Fund’s stock selection and overweight allocations to these sectors contributed to relative performance during the year. Industrial landlords were another top-performing sector; supply struggled to keep pace with the demand for well-located distribution centers, as Amazon and other online retailers expanded supply-chain logistics capabilities. In our view, the earnings growth potential of industrial landlords did not warrant the sector’s high valuations. However, the market did not share our concerns, and our underweight allocation and stock selection in the sector detracted from relative performance.
Escalating online sales and retail store closures pointed to continued challenges for retail landlords. Against this backdrop, regional malls were the only real estate sector to experience a negative return in 2019. The Fund’s underweight allocation to regional malls contributed to relative performance, partially offset by stock selection in the sector. The Fund had a substantial underweight in the largest U.S. mall operator, which helped performance through most of the year, although its overweight in two other leading Class A mall companies detracted, as they experienced meaningful declines despite having what we believed were the capital and skills to renovate their properties to attract new tenants.
Residential housing continued to see favorable fundamentals due to a strong job market, a lack of new supply, worsening home affordability and positive demographic trends. Non-traditional segments manufactured homes and single family homes were among the best performers during the year. Our overweight allocations to the sectors (particularly investments centered in tech corridors of the West Coast) added to results. Returns for apartments were somewhat more modest, and our security selection in the sector—including an overweight position in UDR, Inc., which underperformed in part due to a subdued outlook from management—hindered relative performance.
2
COHEN & STEERS REALTY SHARES, INC.
Fundamentals for health care REITs generally improved during the year, particularly those with hospital and rehabilitation exposures. But despite a robust gain, health care REITs were relative laggards, impacted as interest rates moved higher in the fourth quarter. Our stock selection in the sector aided relative performance; one key contributor was a significant underweight in Ventas, which underperformed amid weak earnings (due mainly to pressure in its senior housing portfolio). An overweight position in Sabra Health Care REIT was also beneficial—the company has demonstrated improving fundamentals, and recent Medicare reimbursement trends for skilled nursing facilities have been favorable.
Self storage REITs faced challenging conditions, as increased supply prompted landlords to offer more aggressive discounts to attract new customers. Enhanced services from boutique self storage operators and new entries into the marketplace further strained profit margins. The timing of our allocations in the self storage sector was beneficial to the Fund’s performance.
Returns for office landlords were mixed, with companies in West Coast tech hubs benefiting from strong employment trends, while those centered on East Coast markets, particularly New York City, lagged amid tepid demand and rising supply. REITs have been adapting to the flexible office concept by adding co-working tenants or creating in-house flex-space brands. This generally requires higher capital outlays and results in increased density (fewer square feet per occupant), which was seen as a potential drag on office REIT profitability. The Fund’s stock selection in offices contributed to relative performance, as we favored West Coast property owners.
Impact of Derivatives on Fund Performance
The Fund engaged in the buying and selling of single stock options with the intention of enhancing total returns and reducing overall volatility. These contracts did not have a material effect on the Fund’s total return for the 12-month period ended December 31, 2019.
Sincerely,
| | |

| | 
|
| |
| THOMAS N. BOHJALIAN | | JON CHEIGH |
| Portfolio Manager | | Portfolio Manager |

JASON A. YABLON
Portfolio Manager
3
COHEN & STEERS REALTY SHARES, INC.
The views and opinions in the preceding commentary are subject to change without notice and are as of the date of the report. There is no guarantee that any market forecast set forth in the commentary will be realized. This material represents an assessment of the market environment at a specific point in time, should not be relied upon as investment advice and is not intended to predict or depict performance of any investment.
Visit Cohen & Steers online at cohenandsteers.com
For more information about the Cohen & Steers family of mutual funds, visit cohenandsteers.com. Here you will find fund net asset values, fund fact sheets and portfolio highlights, as well as educational resources and timely market updates.
Our website also provides comprehensive information about Cohen & Steers, including our most recent press releases, profiles of our senior investment professionals and their investment approach to each asset class. The Cohen & Steers family of mutual funds specializes in liquid real assets, including real estate securities, listed infrastructure and natural resource equities, as well as preferred securities and other income solutions.
4
COHEN & STEERS REALTY SHARES, INC.
Performance Review (Unaudited)
| | |
Class A—Growth of a $10,000 Investment | | Class C—Growth of a $10,000 Investment |
 | |  |
| | |
Class I—Growth of a $100,000 Investment | | Class L—Growth of a $10,000 Investment |
 | |  |
5
COHEN & STEERS REALTY SHARES, INC.
Performance Review (Unaudited)—(Continued)
| | |
Class R—Growth of a $10,000 Investment | | Class Z—Growth of a $10,000 Investment |
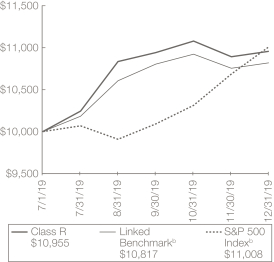 | | 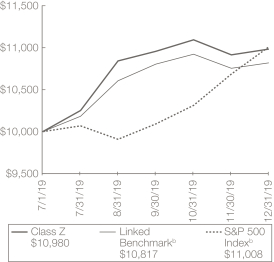 |
Average Annual Total Returns—For Periods Ended December 31, 2019c
| | | | | | | | | | | | | | | | | | | | | | | | |
| | | Class A
Shares | | | Class C
Shares | | | Class I
Shares | | | Class L
Shares | | | Class R
Shares | | | Class Z
Shares | |
1 Year (with sales charge) | | | — | | | | — | | | | — | | | | — | | | | — | | | | — | |
1 Year (without sales charge) | | | — | | | | — | | | | — | | | | 32.90 | % | | | — | | | | — | |
5 Years (with sales charge) | | | — | | | | — | | | | — | | | | — | | | | — | | | | — | |
5 Years (without sales charge) | | | — | | | | — | | | | — | | | | 8.62 | % | | | — | | | | — | |
10 Years (with sales charge) | | | — | | | | — | | | | — | | | | — | | | | — | | | | — | |
10 Years (without sales charge) | | | — | | | | — | | | | — | | | | 12.23 | % | | | — | | | | — | |
Since Inceptiond (with sales charge) | | | 4.69 | %a | | | 8.28 | %e | | | — | | | | — | | | | — | | | | — | |
Since Inceptiond (without sales charge) | | | 9.63 | % | | | 9.28 | % | | | 9.75 | % | | | 11.84 | % | | | 9.55 | % | | | 9.80 | % |
The performance data quoted represent past performance. Past performance is no guarantee of future results. The investment return and principal value of an investment will fluctuate and shares, if redeemed, may be worth more or less than their original cost. Current performance may be lower or higher than the performance data quoted. Performance information current to the most recent month end can be obtained by visiting our website at cohenandsteers.com. Total return assumes the reinvestment of all dividends and distributions at NAV. The performance graph and table do not reflect the deduction of taxes that a shareholder would pay on Fund distributions or the redemption of Fund shares. During certain periods presented above, the investment advisor waived fees and/or reimbursed expenses. Without this arrangement, performance would have been lower.
6
COHEN & STEERS REALTY SHARES, INC.
Performance Review (Unaudited)—(Continued)
On April 26, 2019, as disclosed in the Fund’s July 1, 2019 prospectus, the Fund’s Board of Directors approved converting the Fund from a no-load fund to a multi-class fund with the addition of Class A, Class C, Class F, Class I, Class L, Class R and Class Z shares. Class F shares are currently not available for purchase. Existing shareholders were mapped to Class L shares.
For the six months ended June 30, 2019, the annualized expense ratio as disclosed in the May 1, 2019 prospectus was 0.97%. Effective July 1, 2019, the annualized gross and net expense ratios, respectively, for each class of shares as disclosed in the July 1, 2019 prospectus as supplemented on December 20, 2019, were as follows: Class A—1.19% and 1.15%; Class C—1.84% and 1.80%; Class I—0.94% and 0.88%; Class L—0.94% and 0.88%; Class R—1.34% and 1.30%; and Class Z—0.84% and 0.80%.
On June 11, 2019, the Fund’s Board of Directors approved the adoption of a fee waiver/expense reimbursement agreement, effective July 1, 2019 through June 30, 2021, whereby the investment advisor has contractually agreed to waive its fee and/or reimburse expenses so that the Fund’s total annual operating expenses (excluding acquired fund fees and expenses, taxes and extraordinary expenses) do not exceed 1.15% for Class A shares, 1.80% for Class C shares, 0.88% for Class I shares, 0.88% for Class L shares, 1.30% for Class R shares and 0.80% for Class Z shares. This contractual agreement can only be amended or terminated by agreement of the Fund’s Board of Directors and the investment advisor and will terminate automatically in the event of termination of the investment advisory agreement between the investment advisor and the Fund. Prior to July 1, 2019, the Fund did not have a fee waiver/expense reimbursement agreement.
In addition, on June 11, 2019, the Fund’s Board of Directors approved an amendment to the Fund’s investment advisory agreement, effective July 1, 2019, reducing the Fund’s investment advisory fee so that the Fund pays the investment advisor a monthly investment advisory fee at the annual rate of 0.75% of the average daily net assets of the Fund up to $8.5 billion and 0.70% of such assets in excess of $8.5 billion. Prior to July 1, 2019, the Fund paid the investment advisor a monthly investment advisory fee at the annual rate of 0.85% of the average daily net assets of the Fund up to $1.5 billion, 0.75% of such assets between $1.5 billion and $7.5 billion and 0.70% of such assets in excess of $7.5 billion.
| a | Reflects a 4.50% front end sales charge. |
| b | The comparative indexes are not adjusted to reflect expenses or other fees that the U.S. Securities and Exchange Commission (SEC) requires to be reflected in the Fund’s performance. Index performance does not reflect the deduction of any fees, taxes or expenses. An investor cannot invest directly in an index. The Fund’s performance assumes the reinvestment of all dividends and distributions at NAV. For more information, including charges and expenses, please read the prospectus carefully before you invest. |
| c | Prior to July 1, 2019, Cohen & Steers Realty Shares, Inc. had one class of shares outstanding; these shares have been mapped to “Class L” shares. |
| d | Inception date of July 2, 1991 for Class L shares and July 1, 2019 for Class A, C, I, R and Class Z shares. |
| e | Reflects a contingent deferred sales charge of 1.00%. |
7
COHEN & STEERS REALTY SHARES, INC.
Expense Example (Unaudited)
As a shareholder of the Fund, you incur two types of costs: (1) transaction costs, including sales charges (loads) on purchases payments; and (2) ongoing costs including investment advisory fees; distributions and/or service (12b-1) fees; and other Fund expenses. This example is intended to help you understand your ongoing costs (in dollars) of investing in the Fund and to compare these costs with the ongoing costs of investing in other mutual funds.
The example is based on an investment of $1,000 invested at the beginning of the period and held for the entire period July 1, 2019—December 31, 2019.
Actual Expenses
The first line of the following table provides information about actual account values and expenses. You may use the information in this line, together with the amount you invested, to estimate the expenses that you paid over the period. Simply divide your account value by $1,000 (for example, an $8,600 account value divided by $1,000 = 8.6), then multiply the result by the number in the first line under the heading entitled “Expenses Paid During Period” to estimate the expenses you paid on your account during this period.
Hypothetical Example for Comparison Purposes
The second line of the following table provides information about hypothetical account values and hypothetical expenses based on the Fund’s actual expense ratio and an assumed rate of return of 5% per year before expenses, which is not the Fund’s actual return. The hypothetical account values and expenses may not be used to estimate the actual ending account balance or expenses you paid for the period. You may use this information to compare the ongoing cost of investing in the Fund and other funds. To do so, compare this 5% hypothetical example with the 5% hypothetical examples that appear in the shareholder reports of other funds.
Please note that the expenses shown in the table are meant to highlight your ongoing costs only and do not reflect any transaction costs, such as sales charges (loads). Therefore, the second line of the table is useful in comparing ongoing costs only, and will not help you determine the relative total costs of owning different funds. In addition, if these transactional costs were included, your costs would have been higher.
8
COHEN & STEERS REALTY SHARES, INC.
Expense Example (Unaudited)—(Continued)
| | | | | | | | | | | | |
| | | Beginning
Account Value
July 1, 2019 | | | Ending
Account Value
December 31, 2019 | | | Expenses Paid
During Perioda
July 1, 2019—
December 31, 2019 | |
Class A | |
Actual (9.63% return) | | $ | 1,000.00 | | | $ | 1,096.30 | | | $ | 6.08 | |
Hypothetical (5% annual return before expenses) | | $ | 1,000.00 | | | $ | 1,019.41 | | | $ | 5.85 | |
|
Class C | |
Actual (9.28% return) | | $ | 1,000.00 | | | $ | 1,092.80 | | | $ | 9.50 | |
Hypothetical (5% annual return before expenses) | | $ | 1,000.00 | | | $ | 1,016.13 | | | $ | 9.15 | |
|
Class I | |
Actual (9.75% return) | | $ | 1,000.00 | | | $ | 1,097.50 | | | $ | 4.65 | |
Hypothetical (5% annual return before expenses) | | $ | 1,000.00 | | | $ | 1,020.77 | | | $ | 4.48 | |
|
Class L | |
Actual (9.63% return) | | $ | 1,000.00 | | | $ | 1,096.30 | | | $ | 4.65 | |
Hypothetical (5% annual return before expenses) | | $ | 1,000.00 | | | $ | 1,020.77 | | | $ | 4.48 | |
|
Class R | |
Actual (9.55% return) | | $ | 1,000.00 | | | $ | 1,095.50 | | | $ | 6.87 | |
Hypothetical (5% annual return before expenses) | | $ | 1,000.00 | | | $ | 1,018.65 | | | $ | 6.61 | |
|
Class Z | |
Actual (9.80% return) | | $ | 1,000.00 | | | $ | 1,098.00 | | | $ | 4.23 | |
Hypothetical (5% annual return before expenses) | | $ | 1,000.00 | | | $ | 1,021.17 | | | $ | 4.08 | |
| a | Expenses are equal to the Fund’s Class A, Class C, Class I, Class L, Class R and Class Z annualized net expense ratios of 1.15%, 1.80%, 0.88%, 0.88%, 1.30% and 0.80%, respectively, multiplied by the average account value over the period, multiplied by 184/365 (to reflect theone-half year period). |
9
COHEN & STEERS REALTY SHARES, INC.
| | | | | | | | |
December 31, 2019 Top Ten Holdingsa (Unaudited) | |
Security | | Value | | | % of
Net
Assets | |
American Tower Corp. | | $ | 390,521,865 | | | | 9.0 | |
Equinix, Inc. | | | 292,766,409 | | | | 6.7 | |
UDR, Inc. | | | 246,155,887 | | | | 5.7 | |
Welltower, Inc. | | | 217,991,950 | | | | 5.0 | |
Essex Property Trust, Inc. | | | 186,777,197 | | | | 4.3 | |
SBA Communications Corp. | | | 162,194,222 | | | | 3.7 | |
Prologis, Inc. | | | 155,880,188 | | | | 3.6 | |
Public Storage | | | 151,644,344 | | | | 3.5 | |
Duke Realty Corp. | | | 148,905,916 | | | | 3.4 | |
VICI Properties, Inc. | | | 142,905,800 | | | | 3.3 | |
| a | Top ten holdings (excluding short-term investments) are determined on the basis of the value of individual securities held. |
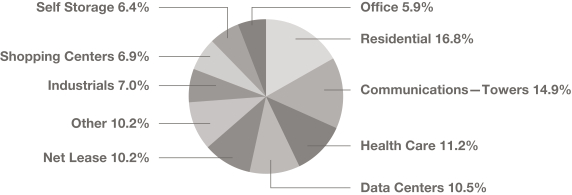
Sector Breakdown
(Based on Net Assets)
(Unaudited)
10
COHEN & STEERS REALTY SHARES, INC.
SCHEDULE OF INVESTMENTS
December 31, 2019
| | | | | | | | | | | | |
| | | | | | Shares | | | Value | |
COMMON STOCK | | | 99.2% | | | | | |
COMMUNICATIONS—TOWERS | | | 14.9% | | | | | |
American Tower Corp. | | | | 1,699,251 | | | $ | 390,521,865 | |
Crown Castle International Corp. | | | | 670,093 | | | | 95,253,720 | |
SBA Communications Corp. | | | | 673,033 | | | | 162,194,222 | |
| | | | | | | | | | | | |
| | | | | | | | | | | 647,969,807 | |
| | | | | | | | | | | | |
CONSUMER, CYCLICAL—HOTELS, RESTAURANTS & LEISURE | | | 0.6% | | | | | |
Boyd Gaming Corp. | | | | 788,081 | | | | 23,595,145 | |
| | | | | | | | | | | | |
REAL ESTATE | | | 83.7% | | | | | |
DATA CENTERS | | | 10.5% | | | | | |
CyrusOne, Inc. | | | | 994,914 | | | | 65,097,223 | |
Digital Realty Trust, Inc. | | | | 816,379 | | | | 97,753,222 | |
Equinix, Inc. | | | | 501,570 | | | | 292,766,409 | |
| | | | | | | | | | | | |
| | | | 455,616,854 | |
| | | | | | | | | | | | |
DIVERSIFIED | | | 1.7% | | | | | |
CBRE Group, Inc. Class Aa | | | | 787,633 | | | | 48,274,026 | |
Jones Lang LaSalle, Inc. | | | | 132,909 | | | | 23,138,128 | |
| | | | | | | | | | | | |
| | | | 71,412,154 | |
| | | | | | | | | | | | |
HEALTH CARE | | | 11.2% | | | | | |
Healthcare Trust of America, Inc., Class A | | | | 2,375,515 | | | | 71,930,594 | |
Healthpeak Properties, Inc. | | | | 1,304,543 | | | | 44,967,597 | |
Medical Properties Trust, Inc. | | | | 4,123,146 | | | | 87,039,612 | |
Sabra Health Care REIT, Inc. | | | | 2,907,172 | | | | 62,039,051 | |
Welltower, Inc. | | | | 2,665,590 | | | | 217,991,950 | |
| | | | | | | | | | | | |
| | | | 483,968,804 | |
| | | | | | | | | | | | |
HOTEL | | | 5.7% | | | | | |
Hilton Worldwide Holdings, Inc. | | | | 421,063 | | | | 46,700,097 | |
Host Hotels & Resorts, Inc. | | | | 3,503,627 | | | | 64,992,281 | |
Park Hotels & Resorts, Inc. | | | | 4,113,381 | | | | 106,413,167 | |
Red Rock Resorts, Inc. Class A | | | | 1,297,072 | | | | 31,064,874 | |
| | | | | | | | | | | | |
| | | | 249,170,419 | |
| | | | | | | | | | | | |
INDUSTRIALS | | | 7.0% | | | | | |
Duke Realty Corp. | | | | 4,294,950 | | | | 148,905,916 | |
Prologis, Inc. | | | | 1,748,712 | | | | 155,880,188 | |
| | | | | | | | | | | | |
| | | | 304,786,104 | |
| | | | | | | | | | | | |
See accompanying notes to financial statements.
11
COHEN & STEERS REALTY SHARES, INC.
SCHEDULE OF INVESTMENTS—(Continued)
December 31, 2019
| | | | | | | | | | | | |
| | | | | | Shares | | | Value | |
NET LEASE | | | 10.2% | | | | | |
Agree Realty Corp. | | | | 288,283 | | | $ | 20,228,818 | |
Realty Income Corp. | | | | 735,395 | | | | 54,147,134 | |
Spirit Realty Capital, Inc. | | | | 2,090,091 | | | | 102,790,675 | |
STORE Capital Corp. | | | | 1,069,597 | | | | 39,831,792 | |
VEREIT, Inc. | | | | 8,918,407 | | | | 82,406,081 | |
VICI Properties, Inc. | | | | 5,593,182 | | | | 142,905,800 | |
| | | | | | | | | | | | |
| | | | 442,310,300 | |
| | | | | | | | | | | | |
OFFICE | | | 5.9% | | | | | |
Boston Properties, Inc. | | | | 162,547 | | | | 22,408,729 | |
Empire State Realty Trust, Inc., Class A | | | | 2,243,985 | | | | 31,326,031 | |
Hudson Pacific Properties, Inc. | | | | 3,304,501 | | | | 124,414,463 | |
Kilroy Realty Corp. | | | | 930,321 | | | | 78,053,932 | |
| | | | | | | | | | | | |
| | | | 256,203,155 | |
| | | | | | | | | | | | |
RESIDENTIAL | | | 16.8% | | | | | |
APARTMENT | | | 13.7% | | | | | |
Apartment Investment & Management Co., Class A | | | | 820,175 | | | | 42,362,039 | |
AvalonBay Communities, Inc. | | | | 576,013 | | | | 120,789,926 | |
Essex Property Trust, Inc. | | | | 620,811 | | | | 186,777,197 | |
UDR, Inc. | | | | 5,271,004 | | | | 246,155,887 | |
| | | | | | | | | | | | |
| | | | 596,085,049 | |
| | | | | | | | | | | | |
SINGLE FAMILY | | | 3.1% | | | | | |
Invitation Homes, Inc. | | | | 4,448,318 | | | | 133,316,091 | |
| | | | | | | | | | | | |
TOTAL RESIDENTIAL | | | | | | | | 729,401,140 | |
| | | | | | | | | | | | |
SELF STORAGE | | | 6.4% | | | | | |
Extra Space Storage, Inc. | | | | 1,211,816 | | | | 127,992,006 | |
Public Storage | | | | 712,079 | | | | 151,644,344 | |
| | | | | | | | | | | | |
| | | | 279,636,350 | |
| | | | | | | | | | | | |
SHOPPING CENTERS | | | 6.9% | | | | | |
COMMUNITY CENTER | | | 3.7% | | | | | |
Regency Centers Corp. | | | | 662,652 | | | | 41,806,715 | |
SITE Centers Corp. | | | | 4,232,919 | | | | 59,345,524 | |
Urban Edge Properties | | | | 3,051,805 | | | | 58,533,620 | |
| | | | | | | | | | | | |
| | | | | | | | | | | 159,685,859 | |
| | | | | | | | | | | | |
See accompanying notes to financial statements.
12
COHEN & STEERS REALTY SHARES, INC.
SCHEDULE OF INVESTMENTS—(Continued)
December 31, 2019
| | | | | | | | | | | | |
| | | | | | Shares | | | Value | |
REGIONAL MALL | | | 3.2% | | | | | |
Macerich Co. (The) | | | | 2,357,666 | | | $ | 63,468,368 | |
Simon Property Group, Inc. | | | | 345,082 | | | | 51,403,415 | |
Taubman Centers, Inc. | | | | 831,356 | | | | 25,846,858 | |
| | | | | | | | | | | | |
| | | | | | | | | | | 140,718,641 | |
| | | | | | | | | | | | |
TOTAL SHOPPING CENTERS | | | | | | | | 300,404,500 | |
| | | | | | | | | | | | |
TIMBER | | | 1.4% | | | | | |
Weyerhaeuser Co. | | | | 2,073,553 | | | | 62,621,301 | |
| | | | | | | | | | | | |
TOTAL REAL ESTATE | | | | | | | | 3,635,531,081 | |
| | | | | | | | | | | | |
TOTAL COMMON STOCK
(Identified cost—$3,543,814,477) | | | | | | | | 4,307,096,033 | |
| | | | | | | | | | | | |
SHORT-TERM INVESTMENTS | | | 0.5% | | | | | |
MONEY MARKET FUNDS | | | | | | | | |
State Street Institutional Treasury Money Market Fund, Premier Class, 1.52%b | | | | 21,487,085 | | | | 21,487,085 | |
| | | | | | | | | | | | |
TOTAL SHORT-TERM INVESTMENTS
(Identified cost—$21,487,085) | | | | | | | | 21,487,085 | |
| | | | | | | | | | | | |
TOTAL INVESTMENTSIN SECURITIES
(Identified cost—$3,565,301,562) | | | 99.7% | | | | | | | | 4,328,583,118 | |
OTHER ASSETSIN EXCESSOF LIABILITIES | | | 0.3 | | | | | | | | 12,797,163 | |
| | | | | | | | | | | | |
NET ASSETS | | | 100.0% | | | | | | | $ | 4,341,380,281 | |
| | | | | | | | | | | | |
Glossary of Portfolio Abbreviations
| | |
REIT | | Real Estate Investment Trust |
Note: Percentages indicated are based on the net assets of the Fund.
| a | Non-income producing security. |
| b | Rate quoted represents the annualized seven-day yield. |
See accompanying notes to financial statements.
13
COHEN & STEERS REALTY SHARES, INC.
STATEMENT OF ASSETS AND LIABILITIES
December 31, 2019
| | | | |
ASSETS: | |
Investments in securities, at value (Identified cost—$3,565,301,562) | | $ | 4,328,583,118 | |
Receivable for: | | | | |
Dividends | | | 16,645,720 | |
Investment securities sold | | | 13,416,994 | |
Fund shares sold | | | 13,132,317 | |
Other assets | | | 35,591 | |
| | | | |
Total Assets | | | 4,371,813,740 | |
| | | | |
LIABILITIES: | |
Payable for: | | | | |
Investment securities purchased | | | 23,035,610 | |
Fund shares redeemed | | | 4,180,562 | |
Investment advisory fees | | | 2,457,383 | |
Administration fees | | | 144,467 | |
Shareholder servicing fees | | | 72,710 | |
Directors’ fees | | | 1,290 | |
Distribution fees | | | 184 | |
Other liabilities | | | 541,253 | |
| | | | |
Total Liabilities | | | 30,433,459 | |
| | | | |
NET ASSETS | | $ | 4,341,380,281 | |
| | | | |
NET ASSETS consist of: | |
Paid-in capital | | $ | 3,421,329,997 | |
Total distributable earnings/(accumulated loss) | | | 920,050,284 | |
| | | | |
| | $ | 4,341,380,281 | |
| | | | |
See accompanying notes to financial statements.
14
COHEN & STEERS REALTY SHARES, INC.
STATEMENT OF ASSETS AND LIABILITIES—(Continued)
December 31, 2019
| | | | |
CLASS A SHARES: | |
NET ASSETS | | $ | 5,769,300 | |
Shares issued and outstanding ($0.001 par value common stock outstanding) | | | 87,276 | |
| | | | |
Net asset value and redemption price per share | | $ | 66.10 | |
| | | | |
Maximum offering price per share ($66.10 ÷ 0.955)a | | $ | 69.21 | |
| | | | |
CLASS C SHARES: | |
NET ASSETS | | $ | 1,572,982 | |
Shares issued and outstanding ($0.001 par value common stock outstanding) | | | 23,840 | |
| | | | |
Net asset value and offering price per shareb | | $ | 65.98 | |
| | | | |
CLASS I SHARES: | |
NET ASSETS | | $ | 302,043,697 | |
Shares issued and outstanding ($0.001 par value common stock outstanding) | | | 4,565,810 | |
| | | | |
Net asset value, offering and redemption price per share | | $ | 66.15 | |
| | | | |
CLASS L SHARES: | |
NET ASSETS | | $ | 4,029,458,260 | |
Shares issued and outstanding ($0.001 par value common stock outstanding) | | | 60,900,589 | |
| | | | |
Net asset value, offering and redemption price per share | | $ | 66.16 | |
| | | | |
CLASS R SHARES: | |
NET ASSETS | | $ | 2,032,166 | |
Shares issued and outstanding ($0.001 par value common stock outstanding) | | | 30,731 | |
| | | | |
Net asset value, offering and redemption price per share | | $ | 66.13 | |
| | | | |
CLASS Z SHARES: | |
NET ASSETS | | $ | 503,876 | |
Shares issued and outstanding ($0.001 par value common stock outstanding) | | | 7,615 | |
| | | | |
Net asset value, offering and redemption price per share | | $ | 66.17 | |
| | | | |
| a | On investments of $100,000 or more, the offering price is reduced. |
| b | Redemption price per share is equal to the net asset value per share less any applicable contingent deferred sales charge of 1.00% on shares held for less than one year. |
See accompanying notes to financial statements.
15
COHEN & STEERS REALTY SHARES, INC.
STATEMENT OF OPERATIONS
For the Year Ended December 31, 2019
| | | | |
Investment Income: | | | | |
Dividend income | | $ | 108,114,653 | |
| | | | |
Expenses: | | | | |
Investment advisory fees | | | 32,733,850 | |
Shareholder servicing fees—Class A | | | 617 | |
Shareholder servicing fees—Class C | | | 427 | |
Shareholder servicing fees—Class I | | | 67,472 | |
Shareholder servicing fees—Class L | | | 4,036,521 | |
Administration fees | | | 1,884,852 | |
Transfer agent fees and expenses | | | 839,299 | |
Shareholder reporting expenses | | | 354,692 | |
Registration and filing fees | | | 207,664 | |
Directors’ fees and expenses | | | 192,391 | |
Professional fees | | | 132,526 | |
Custodian fees and expenses | | | 93,036 | |
Distribution fees—Class A | | | 1,542 | |
Distribution fees—Class C | | | 1,280 | |
Distribution fees—Class R | | | 1,079 | |
Miscellaneous | | | 171,992 | |
| | | | |
Total Expenses | | | 40,719,240 | |
Reduction of Expenses (See Note 2) | | | (1,345,734 | ) |
| | | | |
Net Expenses | | | 39,373,506 | |
| | | | |
Net Investment Income (Loss) | | | 68,741,147 | |
| | | | |
Net Realized and Unrealized Gain (Loss): | | | | |
Net realized gain (loss) on: | | | | |
Investments in securities | | | 646,793,788 | |
Written option contracts | | | 421,044 | |
| | | | |
Net realized gain (loss) | | | 647,214,832 | |
| | | | |
Net change in unrealized appreciation (depreciation)
on investments in securities | | | 460,340,750 | |
| | | | |
Net Realized and Unrealized Gain (Loss) | | | 1,107,555,582 | |
| | | | |
Net Increase (Decrease) in Net Assets Resulting from Operations | | $ | 1,176,296,729 | |
| | | | |
See accompanying notes to financial statements.
16
COHEN & STEERS REALTY SHARES, INC.
STATEMENT OF CHANGES IN NET ASSETS
| | | | | | | | |
| | | For the
Year Ended
December 31, 2019 | | | For the
Year Ended
December 31, 2018 | |
Change in Net Assets: | |
From Operations: | |
Net investment income (loss) | | $ | 68,741,147 | | | $ | 82,099,868 | |
Net realized gain (loss) | | | 647,214,832 | | | | 247,209,697 | |
Net change in unrealized appreciation (depreciation) | | | 460,340,750 | | | | (508,542,558 | ) |
| | | | | | | | |
Net increase (decrease) in net assets resulting from operations | | | 1,176,296,729 | | | | (179,232,993 | ) |
| | | | | | | | |
Distributions to Shareholders: | |
Class A | | | (132,606 | ) | | | — | |
Class C | | | (27,518 | ) | | | — | |
Class I | | | (18,905,023 | ) | | | — | |
Class L | | | (636,863,664 | ) | | | (247,497,742 | ) |
Class R | | | (19,825 | ) | | | — | |
Class Z | | | (4,610 | ) | | | — | |
| | | | | | | | |
Total distributions | | | (655,953,246 | ) | | | (247,497,742 | ) |
| | | | | | | | |
Capital Stock Transactions: | |
Increase (decrease) in net assets from Fund share transactions | | | 81,021,417 | | | | (371,967,474 | ) |
| | | | | | | | |
Total increase (decrease)
in net assets | | | 601,364,900 | | | | (798,698,209 | ) |
Net Assets: | |
Beginning of year | | | 3,740,015,381 | | | | 4,538,713,590 | |
| | | | | | | | |
End of year | | $ | 4,341,380,281 | | | $ | 3,740,015,381 | |
| | | | | | | | |
See accompanying notes to financial statements.
17
COHEN & STEERS REALTY SHARES, INC.
FINANCIAL HIGHLIGHTS
The following tables include selected data for a share outstanding throughout each period and other performance information derived from the financial statements. They should be read in conjunction with the financial statements and notes thereto.
| | | | |
| | | Class A | |
Per Share Operating Data: | | For the Period
July 1, 2019a
through
December 31, 2019 | |
Net asset value, beginning of period | | | $65.57 | |
| | | | |
Income (loss) from investment operations: | | | | |
| |
Net investment income (loss)b | | | 1.11 | |
Net realized and unrealized gain (loss) | | | 5.10 | |
| | | | |
Total from investment operations | | | 6.21 | |
| | | | |
Less dividends and distributions to shareholders from: | | | | |
| |
Net investment income | | | (0.81 | ) |
Net realized gain | | | (4.87 | ) |
| | | | |
Total dividends and distributions to shareholders | | | (5.68 | ) |
| | | | |
Net increase (decrease) in net asset value | | | 0.53 | |
| | | | |
Net asset value, end of period | | | $66.10 | |
| | | | |
| |
| | | | | |
Total returnc,d | | | 9.63 | %e |
| | | | |
| |
| | | | | |
Ratios/Supplemental Data: | | | | |
| |
Net assets, end of period (in millions) | | | $5.8 | |
| | | | |
Ratios to average daily net assets: | | | | |
| |
Expenses (before expense reduction) | | | 1.20 | %f |
| | | | |
Expenses (net of expense reduction) | | | 1.15 | %f |
| | | | |
Net investment income (loss) (before expense reduction) | | | 3.39 | %f,g |
| | | | |
Net investment income (loss) (net of expense reduction) | | | 3.44 | %f,g |
| | | | |
Portfolio turnover rate | | | 91 | %e |
| | | | |
| b | Calculation based on average shares outstanding. |
| c | Return assumes the reinvestment of all dividends and distributions at net asset value. |
| d | Does not reflect sales charges, which would reduce return. |
| g | The annualized ratios of net investment income to average daily net assets may not be indicative of operating results for a full year. |
See accompanying notes to financial statements.
18
COHEN & STEERS REALTY SHARES, INC.
FINANCIAL HIGHLIGHTS—(Continued)
| | | | |
| | | Class C | |
Per Share Operating Data: | | For the Period
July 1, 2019a
through
December 31, 2019 | |
Net asset value, beginning of period | | | $65.57 | |
| | | | |
Income (loss) from investment operations: | | | | |
| |
Net investment income (loss)b | | | 0.91 | |
Net realized and unrealized gain (loss) | | | 5.09 | |
| | | | |
Total from investment operations | | | 6.00 | |
| | | | |
Less dividends and distributions to shareholders from: | | | | |
| |
Net investment income | | | (0.72 | ) |
Net realized gain | | | (4.87 | ) |
| | | | |
Total dividends and distributions to shareholders | | | (5.59 | ) |
| | | | |
Net increase (decrease) in net asset value | | | 0.41 | |
| | | | |
Net asset value, end of period | | | $65.98 | |
| | | | |
| |
| | | | | |
Total returnc,d | | | 9.28 | %e |
| | | | |
| |
| | | | | |
Ratios/Supplemental Data: | | | | |
| |
Net assets, end of period (in millions) | | | $1.6 | |
| | | | |
Ratios to average daily net assets: | | | | |
| |
Expenses (before expense reduction) | | | 1.85 | %f |
| | | | |
Expenses (net of expense reduction) | | | 1.80 | %f |
| | | | |
Net investment income (loss) (before expense reduction) | | | 2.79 | %f,g |
| | | | |
Net investment income (loss) (net of expense reduction) | | | 2.84 | %f,g |
| | | | |
Portfolio turnover rate | | | 91 | %e |
| | | | |
| b | Calculation based on average shares outstanding. |
| c | Return assumes the reinvestment of all dividends and distributions at net asset value. |
| d | Does not reflect sales charges, which would reduce return. |
| g | The annualized ratios of net investment income to average daily net assets may not be indicative of operating results for a full year. |
See accompanying notes to financial statements.
19
COHEN & STEERS REALTY SHARES, INC.
FINANCIAL HIGHLIGHTS—(Continued)
| | | | |
| | | Class I | |
Per Share Operating Data: | | For the Period
July 1, 2019a
through
December 31, 2019 | |
Net asset value, beginning of period | | | $65.57 | |
| | | | |
Income (loss) from investment operations: | | | | |
| |
Net investment income (loss)b | | | 0.84 | |
Net realized and unrealized gain (loss) | | | 5.45 | |
| | | | |
Total from investment operations | | | 6.29 | |
| | | | |
Less dividends and distributions to shareholders from: | | | | |
| |
Net investment income | | | (0.84 | ) |
Net realized gain | | | (4.87 | ) |
| | | | |
Total dividends and distributions to shareholders | | | (5.71 | ) |
| | | | |
Net increase (decrease) in net asset value | | | 0.58 | |
| | | | |
Net asset value, end of period | | | $66.15 | |
| | | | |
| |
| | | | | |
Total returnc | | | 9.75 | %d |
| | | | |
| |
| | | | | |
Ratios/Supplemental Data: | | | | |
| |
Net assets, end of period (in millions) | | | $302.0 | |
| | | | |
Ratios to average daily net assets: | | | | |
| |
Expenses (before expense reduction) | | | 0.93 | %e |
| | | | |
Expenses (net of expense reduction) | | | 0.88 | %e |
| | | | |
Net investment income (loss) (before expense reduction) | | | 2.43 | %e,f |
| | | | |
Net investment income (loss) (net of expense reduction) | | | 2.48 | %e,f |
| | | | |
Portfolio turnover rate | | | 91 | %d |
| | | | |
| b | Calculation based on average shares outstanding. |
| c | Return assumes the reinvestment of all dividends and distributions at net asset value. |
| f | The annualized ratios of net investment income to average daily net assets may not be indicative of operating results for a full year. |
See accompanying notes to financial statements.
20
COHEN & STEERS REALTY SHARES, INC.
FINANCIAL HIGHLIGHTS—(Continued)
| | | | | | | | | | | | | | | | | | | | |
| | | Class L | |
| | | For the Year Ended December 31, | |
Per Share Operating Data: | | 2019 | | | 2018 | | | 2017 | | | 2016 | | | 2015 | |
Net asset value, beginning of year | | | $58.20 | | | | $64.45 | | | | $65.63 | | | | $70.52 | | | | $76.86 | |
| | | | | | | | | | | | | | | | | | | | |
Income (loss) from investment operations: | | | | | | | | | | | | | | | | | | | | |
| | | | | |
Net investment income (loss)a | | | 1.08 | | | | 1.23 | | | | 1.05 | | | | 1.11 | | | | 0.92 | b |
Net realized and unrealized gain (loss) | | | 17.48 | | | | (3.70 | )c | | | 3.49 | | | | 2.85 | | | | 2.17 | |
| | | | | | | | | | | | | | | | | | | | |
Total from investment operations | | | 18.56 | | | | (2.47 | ) | | | 4.54 | | | | 3.96 | | | | 3.09 | |
| | | | | | | | | | | | | | | | | | | | |
Less dividends and distributions to
shareholders from: | | | | | | | | | | | | | | | | | | | | |
| | | | | |
Net investment income | | | (0.83 | ) | | | (1.12 | ) | | | (1.16 | ) | | | (1.11 | ) | | | (0.87 | ) |
Net realized gain | | | (9.77 | ) | | | (2.66 | ) | | | (4.56 | ) | | | (7.74 | ) | | | (8.56 | ) |
| | | | | | | | | | | | | | | | | | | | |
Total dividends and distributions to shareholders | | | (10.60 | ) | | | (3.78 | ) | | | (5.72 | ) | | | (8.85 | ) | | | (9.43 | ) |
| | | | | | | | | | | | | | | | | | | | |
| | | | | |
Net increase (decrease) in net asset value | | | 7.96 | | | | (6.25 | ) | | | (1.18 | ) | | | (4.89 | ) | | | (6.34 | ) |
| | | | | | | | | | | | | | | | | | | | |
Net asset value, end of year | | | $66.16 | | | | $58.20 | | | | $64.45 | | | | $65.63 | | | | $70.52 | |
| | | | | | | | | | | | | | | | | | | | |
| | | | | |
| | | | | | | | | | | | | | | | | | | | | |
Total returnd | | | 32.90 | % | | | –4.20 | %c | | | 7.10 | % | | | 5.61 | % | | | 5.00 | % |
| | | | | | | | | | | | | | | | | | | | |
| | | | | |
| | | | | | | | | | | | | | | | | | | | | |
Ratios/Supplemental Data: | | | | | | | | | | | | | | | | | | | | |
| | | | | |
Net assets, end of year (in millions) | | | $4,029.5 | | | | $3,740.0 | | | | $4,538.7 | | | | $5,256.9 | | | | $5,743.3 | |
| | | | | | | | | | | | | | | | | | | | |
Ratios to average net assets: | | | | | | | | | | | | | | | | | | | | |
| | | | | |
Expenses (before expense reduction) | | | 0.95 | % | | | 1.00 | %c | | | 0.96 | % | | | 0.96 | % | | | 0.98 | % |
| | | | | | | | | | | | | | | | | | | | |
Expenses (net of expense reduction) | | | 0.92 | % | | | 1.00 | %c | | | 0.96 | % | | | 0.96 | % | | | 0.98 | % |
| | | | | | | | | | | | | | | | | | | | |
Net investment income (loss)
(before expense reduction) | | | 1.56 | % | | | 1.98 | % | | | 1.58 | % | | | 1.56 | % | | | 1.24 | % |
| | | | | | | | | | | | | | | | | | | | |
Net investment income (loss)
(net of expense reduction) | | | 1.59 | % | | | 1.98 | % | | | 1.58 | % | | | 1.56 | % | | | 1.24 | % |
| | | | | | | | | | | | | | | | | | | | |
Portfolio turnover rate | | | 91 | % | | | 63 | % | | | 75 | % | | | 78 | % | | | 58 | % |
| | | | | | | | | | | | | | | | | | | | |
| a | Calculation based on average shares outstanding. |
| b | 13.1% of gross income was attributable to dividends paid by Simon Property Group for the year ended December 31, 2015. |
| c | During the reporting period the Fund settled legal claims against two issuers of securities previously held by the Fund. As a result, the net realized and unrealized gain (loss) on investments per share includes proceeds received from the settlements. Without these proceeds the net realized and unrealized gain (loss) on investments per share would have been $(3.81). Additionally, the expense ratios include extraordinary expenses related to the direct action. Without these expenses, the ratios of expenses to average daily net assets would have been 0.97%. Excluding the proceeds from and expenses relating to the settlements, the total return would have been-4.35%. |
| d | Return assumes the reinvestment of all dividends and distributions at net asset value. |
See accompanying notes to financial statements.
21
COHEN & STEERS REALTY SHARES, INC.
FINANCIAL HIGHLIGHTS—(Continued)
| | | | |
| | | Class R | |
Per Share Operating Data: | | For the Period
July 1, 2019a
through
December 31, 2019 | |
Net asset value, beginning of period | | | $65.57 | |
| | | | |
Income (loss) from investment operations: | | | | |
| |
Net investment income (loss)b | | | 0.96 | |
Net realized and unrealized gain (loss) | | | 5.20 | |
| | | | |
Total from investment operations | | | 6.16 | |
| | | | |
Less dividends and distributions to shareholders from: | | | | |
| |
Net investment income | | | (0.73 | ) |
Net realized gain | | | (4.87 | ) |
| | | | |
Total dividends and distributions to shareholders | | | (5.60 | ) |
| | | | |
Net increase (decrease) in net asset value | | | 0.56 | |
| | | | |
Net asset value, end of period | | | $66.13 | |
| | | | |
| |
| | | | | |
Total returnc | | | 9.55 | %d |
| | | | |
| |
| | | | | |
Ratios/Supplemental Data: | | | | |
| |
Net assets, end of period (in millions) | | | $2.0 | |
| | | | |
Ratios to average daily net assets: | | | | |
| |
Expenses (before expense reduction) | | | 1.35 | %e |
| | | | |
Expenses (net of expense reduction) | | | 1.30 | %e |
| | | | |
Net investment income (loss) (before expense reduction) | | | 3.10 | %e,f |
| | | | |
Net investment income (loss) (net of expense reduction) | | | 3.15 | %e,f |
| | | | |
Portfolio turnover rate | | | 91 | %d |
| | | | |
| b | Calculation based on average shares outstanding. |
| c | Return assumes the reinvestment of all dividends and distributions at net asset value. |
| f | The annualized ratios of net investment income to average daily net assets may not be indicative of operating results for a full year. |
See accompanying notes to financial statements.
22
COHEN & STEERS REALTY SHARES, INC.
FINANCIAL HIGHLIGHTS—(Continued)
| | | | |
| | | Class Z | |
Per Share Operating Data: | | For the Period
July 1, 2019a
through
December 31, 2019 | |
Net asset value, beginning of period | | | $65.57 | |
| | | | |
Income (loss) from investment operations: | | | | |
| |
Net investment income (loss)b | | | 1.62 | |
Net realized and unrealized gain (loss) | | | 4.70 | |
| | | | |
Total from investment operations | | | 6.32 | |
| | | | |
Less dividends and distributions to shareholders from: | | | | |
| |
Net investment income | | | (0.85 | ) |
Net realized gain | | | (4.87 | ) |
| | | | |
Total dividends and distributions to shareholders | | | (5.72 | ) |
| | | | |
Net increase (decrease) in net asset value | | | 0.60 | |
| | | | |
Net asset value, end of period | | | $66.17 | |
| | | | |
| |
| | | | | |
Total returnc | | | 9.80 | %d |
| | | | |
| |
| | | | | |
Ratios/Supplemental Data: | | | | |
| |
Net assets, end of period (in 000s) | | | $503.9 | |
| | | | |
Ratios to average daily net assets: | | | | |
| |
Expenses (before expense reduction) | | | 0.85 | %e |
| | | | |
Expenses (net of expense reduction) | | | 0.80 | %e |
| | | | |
Net investment income (loss) (before expense reduction) | | | 5.09 | %e,f |
| | | | |
Net investment income (loss) (net of expense reduction) | | | 5.14 | %e,f |
| | | | |
Portfolio turnover rate | | | 91 | %d |
| | | | |
| b | Calculation based on average shares outstanding. |
| c | Return assumes the reinvestment of all dividends and distributions at net asset value. |
| f | The annualized ratios of net investment income to average daily net assets may not be indicative of operating results for a full year. |
See accompanying notes to financial statements.
23
COHEN & STEERS REALTY SHARES, INC.
NOTES TO FINANCIAL STATEMENTS
Note 1. Organization and Significant Accounting Policies
Cohen & Steers Realty Shares, Inc. (the Fund) was incorporated under the laws of the State of Maryland on April 26, 1991 and is registered under the Investment Company Act of 1940 (the 1940 Act) as anon-diversified,open-end management investment company. The Fund’s investment objective is total return through investment in real estate securities. On April 26, 2019, the Fund’s Board of Directors approved converting the Fund from ano-load fund to a multi-class fund with the addition of seven classes of shares, Class A, Class C, Class F, Class I, Class L, Class R and Class Z shares, effective July 1, 2019. Existing shareholders were mapped to Class L shares. Each of the Fund’s shares has equal dividend, liquidation and voting rights (except for matters relating to distribution and shareholder servicing of such shares). Class F shares are currently not available for purchase.
The following is a summary of significant accounting policies consistently followed by the Fund in the preparation of its financial statements. The Fund is an investment company and, accordingly, follows the investment company accounting and reporting guidance of the Financial Accounting Standards Board Accounting Standards Codification (ASC) Topic 946—Investment Companies. The accounting policies of the Fund are in conformity with accounting principles generally accepted in the United States of America (GAAP). The preparation of the financial statements in accordance with GAAP requires management to make estimates and assumptions that affect the reported amounts of assets and liabilities at the date of the financial statements and the reported amounts of income and expenses during the reporting period. Actual results could differ from those estimates.
Portfolio Valuation:Investments in securities that are listed on the New York Stock Exchange (NYSE) are valued, except as indicated below, at the last sale price reflected at the close of the NYSE on the business day as of which such value is being determined. If there has been no sale on such day, the securities are valued at the mean of the closing bid and ask prices on such day or, if no ask price is available, at the bid price. Exchange-traded options are valued at their last sale price as of the close of options trading on applicable exchanges on the valuation date. In the absence of a last sale price on such day, options are valued at the average of the quoted bid and ask prices as of the close of business.Over-the-counter (OTC) options are valued based upon prices provided by a third-party pricing service or counterparty.
Securities not listed on the NYSE but listed on other domestic or foreign securities exchanges (including NASDAQ) are valued in a similar manner. Securities traded on more than one securities exchange are valued at the last sale price reflected at the close of the exchange representing the principal market for such securities on the business day as of which such value is being determined.
Readily marketable securities traded in the OTC market, including listed securities whose primary market is believed by Cohen & Steers Capital Management, Inc. (the investment advisor) to be OTC, are valued on the basis of prices provided by a third-party pricing service or third-party broker-dealers when such prices are believed by the investment advisor, pursuant to delegation by the Board of Directors, to reflect the fair value of such securities.
24
COHEN & STEERS REALTY SHARES, INC.
NOTES TO FINANCIAL STATEMENTS—(Continued)
Short-term debt securities with a maturity date of 60 days or less are valued at amortized cost, which approximates fair value. Investments inopen-end mutual funds are valued at net asset value (NAV).
The policies and procedures approved by the Fund’s Board of Directors delegate authority to make fair value determinations to the investment advisor, subject to the oversight of the Board of Directors. The investment advisor has established a valuation committee (Valuation Committee) to administer, implement and oversee the fair valuation process according to the policies and procedures approved annually by the Board of Directors. Among other things, these procedures allow the Fund to utilize independent pricing services, quotations from securities and financial instrument dealers and other market sources to determine fair value.
Securities for which market prices are unavailable, or securities for which the investment advisor determines that the bid and/or ask price or a counterparty valuation does not reflect market value, will be valued at fair value, as determined in good faith by the Valuation Committee, pursuant to procedures approved by the Fund’s Board of Directors. Circumstances in which market prices may be unavailable include, but are not limited to, when trading in a security is suspended, the exchange on which the security is traded is subject to an unscheduled close or disruption or material events occur after the close of the exchange on which the security is principally traded. In these circumstances, the Fund determines fair value in a manner that fairly reflects the market value of the security on the valuation date based on consideration of any information or factors it deems appropriate. These may include, but are not limited to, recent transactions in comparable securities, information relating to the specific security and developments in the markets.
The Fund’s use of fair value pricing may cause the NAV of Fund shares to differ from the NAV that would be calculated using market quotations. Fair value pricing involves subjective judgments and it is possible that the fair value determined for a security may be materially different than the value that could be realized upon the sale of that security.
Fair value is defined as the price that the Fund would expect to receive upon the sale of an investment or expect to pay to transfer a liability in an orderly transaction with an independent buyer in the principal market or, in the absence of a principal market, the most advantageous market for the investment or liability. The hierarchy of inputs that are used in determining the fair value of the Fund’s investments is summarized below.
| | • | | Level 1—quoted prices in active markets for identical investments |
| | • | | Level 2—other significant observable inputs (including quoted prices for similar investments, interest rates, credit risk, etc.) |
| | • | | Level 3—significant unobservable inputs (including the Fund’s own assumptions in determining the fair value of investments) |
The inputs or methodology used for valuing investments may or may not be an indication of the risk associated with those investments. Changes in valuation techniques may result in transfers into or out of an assigned level within the disclosure hierarchy.
25
COHEN & STEERS REALTY SHARES, INC.
NOTES TO FINANCIAL STATEMENTS—(Continued)
The following is a summary of the inputs used as of December 31, 2019 in valuing the Fund’s investments carried at value:
| | | | | | | | | | | | | | | | |
| | | Total | | | Quoted Prices
in Active
Markets for
Identical
Investments
(Level 1) | | | Other
Significant
Observable
Inputs
(Level 2) | | | Significant
Unobservable
Inputs
(Level 3) | |
Common Stock | | $ | 4,307,096,033 | | | $ | 4,307,096,033 | | | $ | — | | | $ | — | |
Short-Term Investments | | | 21,487,085 | | | | — | | | | 21,487,085 | | | | — | |
| | | | | | | | | | | | | | | | |
Total Investments in Securitiesa | | $ | 4,328,583,118 | | | $ | 4,307,096,033 | | | $ | 21,487,085 | | | $ | — | |
| | | | | | | | | | | | | | | | |
| a | Portfolio holdings are disclosed individually on the Schedule of Investments. |
Security Transactions, Investment Income and Expense Allocations:Security transactions are recorded on trade date. Realized gains and losses on investments sold are recorded on the basis of identified cost. Interest income, which includes the amortization of premiums and accretion of discounts, is recorded on the accrual basis. Dividend income is recorded on theex-dividend date. Distributions from REITs are recorded as ordinary income, net realized capital gain or return of capital based on information reported by the REITs and management’s estimates of such amounts based on historical information. These estimates are adjusted when the actual source of distributions is disclosed by the REITs and actual amounts may differ from the estimated amounts. Income, expenses (other than expenses attributable to a specific class) and realized and unrealized gains or losses on investments are allocated to each class of shares based on its relative net assets.
Options:The Fund may purchase and write exchange-listed and OTC put or call options on securities, stock indices and other financial instruments for hedging purposes, to enhance portfolio returns and/or reduce overall volatility.
When the Fund writes (sells) an option, an amount equal to the premium received by the Fund is recorded on the Statement of Assets and Liabilities as a liability. The amount of the liability is subsequentlymarked-to-market to reflect the current market value of the option written. When an option expires, the Fund realizes a gain on the option to the extent of the premium received. Premiums received from writing options which are exercised or closed are added to or offset against the proceeds or amount paid on the transaction to determine the realized gain or loss. If a put option on a security is exercised, the premium reduces the cost basis of the security purchased by the Fund. If a call option is exercised, the premium is added to the proceeds of the security sold to determine the realized gain or loss. The Fund, as writer of an option, bears the market risk of an unfavorable change in the price of the underlying investment. Other risks include the possibility of an illiquid options market or the inability of the counterparties to fulfill their obligations under the contracts.
26
COHEN & STEERS REALTY SHARES, INC.
NOTES TO FINANCIAL STATEMENTS—(Continued)
Put and call options purchased are accounted for in the same manner as portfolio securities. Premiums paid for purchasing options which expire are treated as realized losses. Premiums paid for purchasing options which are exercised or closed are added to the amounts paid or offset against the proceeds on the underlying investment transaction to determine the realized gain or loss when the underlying transaction is executed. The risk associated with purchasing an option is that the Fund pays a premium whether or not the option is exercised. Additionally, the Fund bears the risk of loss of the premium and change in market value should the counterparty not perform under the contract.
At December 31, 2019, the Fund did not have any option contracts outstanding.
Dividends and Distributions to Shareholders:Dividends from net investment income and capital gain distributions are determined in accordance with U.S. federal income tax regulations, which may differ from GAAP. Dividends from net investment income, if any, are declared and paid quarterly. Net realized capital gains, unless offset by any available capital loss carryforward, are typically distributed to shareholders at least annually. Dividends and distributions to shareholders are recorded on theex-dividend date and are automatically reinvested in full and fractional shares of the Fund based on the NAV per share at the close of business on the payable date, unless the shareholder has elected to have them paid in cash.
Dividends from net investment income are subject to recharacterization for tax purposes. Based upon the results of operations for the year ended December 31, 2019, a portion of the dividends have been reclassified to distributions from net realized gain.
Income Taxes:It is the policy of the Fund to continue to qualify as a regulated investment company (RIC), if such qualification is in the best interest of the shareholders, by complying with the requirements of Subchapter M of the Internal Revenue Code applicable to RICs, and by distributing substantially all of its taxable earnings to its shareholders. Also, in order to avoid the payment of any federal excise taxes, the Fund will distribute substantially all of its net investment income and net realized gains on a calendar year basis. Accordingly, no provision for federal income or excise tax is necessary. Management has analyzed the Fund’s tax positions taken on federal and applicable state income tax returns as well as its tax positions innon-U.S. jurisdictions in which it trades for all open tax years and has concluded that as of December 31, 2019, no additional provisions for income tax are required in the Fund’s financial statements. The Fund’s tax positions for the tax years for which the applicable statutes of limitations have not expired are subject to examination by the Internal Revenue Service, state departments of revenue and by foreign tax authorities.
Note 2. Investment Advisory, Administration Fees and Other Transactions with Affiliates
Investment Advisory Fees: Cohen & Steers Capital Management, Inc. serves as the Fund’s investment advisor pursuant to an investment advisory agreement (the investment advisory agreement). Under the terms of the investment advisory agreement, the investment advisor provides the Fund withday-to-day investment decisions and generally manages the Fund’s investments in accordance with the stated policies of the Fund, subject to the supervision of the Board of Directors.
Prior to July 1, 2019, for the services provided to the Fund, the investment advisor received a fee, accrued daily and paid monthly, at the annual rate of 0.85% of the average daily net assets of the Fund up to $1.5 billion, 0.75% of such assets between $1.5 billion and $7.5 billion and 0.70% of such assets
27
COHEN & STEERS REALTY SHARES, INC.
NOTES TO FINANCIAL STATEMENTS—(Continued)
in excess of $7.5 billion. On June 11, 2019, the Fund’s Board of Directors approved an amendment to the Fund’s investment advisory agreement. Effective July 1, 2019, the Fund’s investment advisory fee was reduced so that the investment advisor receives a fee, accrued daily and paid monthly, at the annual rate of 0.75% of the average daily net assets of the Fund up to $8.5 billion and 0.70% of such assets in excess of $8.5 billion. Effective July 1, 2019, this fee is allocated among the separate classes based on the classes’ proportionate shares of such average daily net assets.
On June 11, 2019, the Fund’s Board of Directors approved a fee waiver/expense reimbursement agreement, effective July 1, 2019, whereby the investment advisor has contractually agreed to waive its fee and/or reimburse expenses through June 30, 2021 so that the Fund’s total operating expenses (excluding acquired fund fees and expenses, taxes and extraordinary expenses) do not exceed 1.15% for Class A shares, 1.80% for Class C shares, 0.88% for Class I shares, 0.88% for Class L shares, 1.30% for Class R shares and 0.80% for Class Z shares. This contractual agreement can only be amended or terminated by agreement of the Fund’s Board of Directors and the investment advisor and will terminate automatically in the event of termination of the investment advisory agreement between the investment advisor and the Fund. Existing shareholders were mapped to Class L shares. Prior to July 1, 2019, the Fund did not have a fee waiver/expense reimbursement agreement. For the year ended December 31, 2019, fees waived and/or expenses reimbursed totaled $1,345,734.
Administration Fees:The Fund has entered into an administration agreement with the investment advisor under which the investment advisor performs certain administrative functions for the Fund. Prior to July 1, 2019, under this administration agreement, the investment advisor received a fee, accrued daily and paid monthly, at the annual rate of 0.03% of the average daily net assets of the Fund. On June 11, 2019, the Fund’s Board of Directors approved an amendment to the Fund’s administration agreement, effective July 1, 2019, increasing the administration fee to an annual rate of 0.04% of the average daily net assets of the Fund. For the year ended December 31, 2019, the Fund incurred $1,494,935 in fees under this administration agreement. Additionally, the Fund pays State Street Bank and Trust Company asco-administrator under a fund accounting and administration agreement.
Distribution Fees:Shares of the Fund are distributed by Cohen & Steers Securities, LLC (the distributor), an affiliated entity of the investment advisor. On June 11, 2019, the Fund’s Board of Directors approved the adoption of a distribution and service plan (the plan) pursuant to Rule12b-1 under the 1940 Act, effective July 1, 2019, which allows the Fund to pay distribution fees for the sale and distribution of its shares. The plan provides that the Fund will pay the distributor a fee, accrued daily and paid monthly, at an annual rate of up to 0.25% of the average daily net assets attributable to Class A shares, up to 0.75% of the average daily net assets attributable to Class C shares and up to 0.50% of the average daily net assets attributable to Class R shares. In addition, with respect to Class R shares, such amounts may also be used to pay for services to Fund shareholders or services related to the maintenance of shareholder accounts.
Effective July 1, 2019, there is a maximum initial sales charge of 4.50% for Class A shares and a contingent deferred sales charge (CDSC) of 1.00% on purchases of $1 million or more of Class A shares, which applies if redemption occurs within one year from purchase. Also effective July 1, 2019, there is a CDSC of 1.00% on Class C shares, which applies if redemption occurs within one year from purchase. For the year ended December 31, 2019, the Fund has been advised that the distributor
28
COHEN & STEERS REALTY SHARES, INC.
NOTES TO FINANCIAL STATEMENTS—(Continued)
received $8,398, which represents a portion of the sales commissions paid by shareholders from the sale of Class A shares, and $0 and $0 of CDSC relating to redemptions of Class A and Class C shares, respectively. The distributor has advised the Fund that proceeds from the CDSC on these classes will be used by the distributor to defray its expenses related to providing distribution-related services to the Fund in connection with the sale of these classes, including payments to dealers and other financial intermediaries for selling these classes. The payment of a CDSC may result in the distributor receiving amounts greater or less than the upfront commission paid by the distributor to the financial intermediary.
Shareholder Servicing Fees:On June 11, 2019, the Fund’s Board of Directors adopted an amended shareholder services plan, effective July 1, 2019, pursuant to which the Fund pays the distributor a service fee at an annual rate of up to 0.10%, 0.25%, 0.10% and 0.10% of the average daily net assets attributable to the Fund’s Class A, Class C, Class I and Class L shares, respectively. Prior to July 1, 2019, for shareholder services, the Fund paid the distributor or its affiliates a fee, accrued daily, at an annual rate of up to 0.10% of the average daily net assets of the Fund. The distributor is responsible for paying qualified financial institutions for shareholder services.
Directors’ and Officers’ Fees:Certain directors and officers of the Fund are also directors, officers and/or employees of the investment advisor. The Fund does not pay compensation to directors and officers affiliated with the investment advisor except for the Chief Compliance Officer, who received compensation from the investment advisor, which was reimbursed by the Fund, in the amount of $40,507 for the year ended December 31, 2019.
Note 3. Purchases and Sales of Securities
Purchases and sales of securities, excluding short-term investments, for the year ended December 31, 2019, totaled $3,800,751,547 and $4,286,662,293, respectively.
Note 4. Derivative Investments
The following table presents the effect of derivatives held during the year ended December 31, 2019, along with the respective location in the financial statements.
Statement of Operations
| | | | | | | | | | |
Derivatives | | Location | | Realized
Gain (Loss) | | | Change in
Unrealized
Appreciation
(Depreciation) | |
Equity Risk: | | | | | | | | | | |
Purchased Option Contractsa | | Net Realized and Unrealized Gain (Loss) | | $ | (589,647 | ) | | $ | — | |
Written Option Contracts | | Net Realized and Unrealized Gain (Loss) | | | 421,044 | | | | — | |
| a | Purchased options are included in net realized gain (loss) and change in unrealized appreciation (depreciation) on investments in securities. |
29
COHEN & STEERS REALTY SHARES, INC.
NOTES TO FINANCIAL STATEMENTS—(Continued)
The following summarizes the volume of the Fund’s option contracts activity for the year ended December 31, 2019:
| | | | | | | | |
| | | Purchased Option
Contracts | | | Written Option
Contracts | |
Average Notional Amounta,b | | $ | 55,216,212 | | | $ | 59,570,619 | |
| a | Average notional amounts represent the average for all months in which the Fund had option contracts outstanding at month end. For the period, this represents one month for purchased option contracts and four months for written option contracts. |
| b | Notional amount is calculated using the number of contracts multiplied by notional contract size multiplied by the underlying price. |
Note 5. Income Tax Information
The tax character of dividends and distributions paid was as follows:
| | | | | | | | |
| | | For the Year Ended
December 31, | |
| | | 2019 | | | 2018 | |
Ordinary income | | $ | 244,177,433 | | | $ | 77,635,612 | |
Long-term capital gain | | | 411,775,813 | | | | 169,862,130 | |
| | | | | | | | |
Total dividends and distributions | | $ | 655,953,246 | | | $ | 247,497,742 | |
| | | | | | | | |
As of December 31, 2019, thetax-basis components of accumulated earnings, the federal tax cost and net unrealized appreciation (depreciation) in value of investments held were as follows:
| | | | |
Cost of investments in securities for federal income tax purposes | | $ | 3,573,841,599 | |
| | | | |
Gross unrealized appreciation on investments | | $ | 831,542,726 | |
Gross unrealized depreciation on investments | | | (76,801,207 | ) |
| | | | |
Net unrealized appreciation (depreciation) on investments | | $ | 754,741,519 | |
| | | | |
Undistributed ordinary income | | $ | 39,252,792 | |
| | | | |
Undistributed long-term capital gains | | $ | 117,275,881 | |
| | | | |
As of December 31, 2019, the Fund had temporary book/tax differences primarily attributable to wash sales on portfolio securities and certain REIT dividends, and permanent book/tax differences primarily attributable to Fund redemptions used as distributions and prior year REIT distribution adjustments. To reflect reclassifications arising from the permanent differences,paid-in capital was credited $17,966,062 and total distributable earnings/(accumulated loss) was charged $17,966,062. Net assets were not affected by this reclassification.
30
COHEN & STEERS REALTY SHARES, INC.
NOTES TO FINANCIAL STATEMENTS—(Continued)
Note 6. Capital Stock
On April 26, 2019, the Fund’s Board of Directors approved changing the name of the Fund’s sole outstanding share class to Class L common stock, adding Class A, C, F, I, R and Z shares of common stock and increasing the number of authorized shares of common stock. As of July 1, 2019, the Fund is authorized to issue 700 million shares of capital stock, at a par value of $0.001 per share, classified in seven classes as follows: 100 million of Class A capital stock, 50 million of Class C capital stock, 50 million of Class F capital stock, 200 million of Class I capital stock, 200 million of Class L capital stock, 50 million of Class R capital stock and 50 million of Class Z capital stock. Class F shares are currently not available for purchase. Prior to July 1, 2019, the Fund was authorized to issue 200 million shares of capital stock, at a par value of $0.001 per share. The Fund’s Board of Directors may increase or decrease the aggregate number of shares of common stock that the Fund has authority to issue. With the exception of Class C shares held through certain intermediaries, as noted in the Fund’s prospectus, effective July 1, 2019, Class C shares automatically convert to Class A shares on a monthly basis approximately ten years after the original date of purchase. Transactions in Fund shares were as follows:
| | | | | | | | | | | | | | | | |
| | | For the
Year Ended
December 31, 2019 | | | For the
Year Ended
December 31, 2018 | |
| | | Shares | | | Amount | | | Shares | | | Amount | |
Class Aa: | | | | | | | | | | | | | | | | |
Sold | | | 90,338 | | | $ | 6,049,797 | | | | — | | | $ | — | |
Issued as reinvestment of dividends and distributions | | | 1,846 | | | | 120,736 | | | | — | | | | — | |
Redeemed | | | (4,908 | ) | | | (323,323 | ) | | | — | | | | — | |
| | | | | | | | | | | | | | | | |
Net increase (decrease) | | | 87,276 | | | $ | 5,847,210 | | | | — | | | $ | — | |
| | | | | | | | | | | | | | | | |
| | | | |
Class Ca: | | | | | | | | | | | | | | | | |
Sold | | | 25,233 | | | $ | 1,666,216 | | | | — | | | $ | — | |
Issued as reinvestment of dividends and distributions | | | 167 | | | | 10,825 | | | | — | | | | — | |
Redeemed | | | (1,560 | ) | | | (102,546 | ) | | | — | | | | — | |
| | | | | | | | | | | | | | | | |
Net increase (decrease) | | | 23,840 | | | $ | 1,574,495 | | | | — | | | $ | — | |
| | | | | | | | | | | | | | | | |
31
COHEN & STEERS REALTY SHARES, INC.
NOTES TO FINANCIAL STATEMENTS—(Continued)
| | | | | | | | | | | | | | | | |
| | | For the
Year Ended
December 31, 2019 | | | For the
Year Ended
December 31, 2018 | |
| | | Shares | | | Amount | | | Shares | | | Amount | |
Class Ia: | | | | | | | | | | | | | | | | |
Sold | | | 4,807,319 | | | $ | 329,229,330 | | | | — | | | $ | — | |
Issued as reinvestment of dividends and distributions | | | 209,665 | | | | 13,743,698 | | | | — | | | | — | |
Redeemed | | | (451,174 | ) | | | (30,174,222 | ) | | | — | | | | — | |
| | | | | | | | | | | | | | | | |
Net increase (decrease) | | | 4,565,810 | | | $ | 312,798,806 | | | | — | | | $ | — | |
| | | | | | | | | | | | | | | | |
| | | | |
Class L: | | | | | | | | | | | | | | | | |
Sold | | | 11,846,876 | | | $ | 796,409,797 | | | | 10,495,965 | | | $ | 647,021,206 | |
Issued as reinvestment of dividends and distributions | | | 9,089,385 | | | | 597,955,759 | | | | 3,636,497 | | | | 230,478,885 | |
Redeemed | | | (24,300,699 | ) | | | (1,636,079,324 | ) | | | (20,289,689 | ) | | | (1,249,467,565 | ) |
| | | | | | | | | | | | | | | | |
Net increase (decrease) | | | (3,364,438 | ) | | $ | (241,713,768 | ) | | | (6,157,227 | ) | | $ | (371,967,474 | ) |
| | | | | | | | | | | | | | | | |
| | | | |
Class Ra: | | | | | | | | | | | | | | | | |
Sold | | | 30,495 | | | $ | 2,000,513 | | | | — | | | $ | — | |
Issued as reinvestment of dividends and distributions | | | 266 | | | | 17,240 | | | | — | | | | — | |
Redeemed | | | (30 | ) | | | (1,975 | ) | | | — | | | | — | |
| | | | | | | | | | | | | | | | |
Net increase (decrease) | | | 30,731 | | | $ | 2,015,778 | | | | — | | | $ | — | |
| | | | | | | | | | | | | | | | |
| | | | |
Class Za: | | | | | | | | | | | | | | | | |
Sold | | | 7,557 | | | $ | 495,159 | | | | — | | | $ | — | |
Issued as reinvestment of dividends and distributions | | | 58 | | | | 3,737 | | | | — | | | | — | |
Redeemed | | | — | | | | — | | | | — | | | | — | |
| | | | | | | | | | | | | | | | |
Net increase (decrease) | | | 7,615 | | | $ | 498,896 | | | | — | | | $ | — | |
| | | | | | | | | | | | | | | | |
| a | Inception date of July 1, 2019. |
32
COHEN & STEERS REALTY SHARES, INC.
NOTES TO FINANCIAL STATEMENTS—(Continued)
Note 7. Other Risks
Common Stock Risk:While common stocks have historically generated higher average returns than fixed-income securities over the long-term, common stocks have also experienced significantly more volatility in those returns, although under certain market conditions, fixed-income investments may have comparable or greater price volatility. The value of common stocks and other equity securities will fluctuate in response to developments concerning the company, political and regulatory circumstances, the stock market, and the economy. In the short term, stock prices can fluctuate dramatically in response to these developments. Different parts of the market and different types of equity securities can react differently to these developments. For example, stocks of large companies can react differently than stocks of smaller companies, and value stocks (stocks of companies that are undervalued by various measures and have potential for long-term capital appreciation), can react differently from growth stocks (stocks of companies with attractive cash flow returns on invested capital and earnings that are expected to grow). These developments can affect a single company, all companies within the same industry, economic sector or geographic region, or the stock market as a whole.
Real Estate Market Risk:Since the Fund concentrates its assets in companies engaged in the real estate industry, an investment in the Fund will be closely linked to the performance of the real estate markets. Risks of investing in real estate securities include falling property values due to increasing vacancies, declining rents resulting from economic, legal, tax, political or technological developments, lack of liquidity, limited diversification, and sensitivity to certain economic factors such as interest-rate changes and market recessions. Real estate company prices also may drop because of the failure of borrowers to pay their loans and poor management, and residential developers, in particular, could be negatively impacted by falling home prices, slower mortgage origination and rising construction costs. The risks of investing in REITs are similar to those associated with direct investments in real estate securities.
REIT Risk:In addition to the risks of securities linked to the real estate industry, REITs are subject to certain other risks related to their structure and focus. REITs are dependent upon management skills and generally may not be diversified. REITs are also subject to heavy cash flow dependency, defaults by borrowers and self-liquidation. In addition, REITs could possibly fail to (i) qualify for pass-through of income under applicable tax law, or (ii) maintain their exemptions from registration under the 1940 Act. The above factors may also adversely affect a borrower’s or a lessee’s ability to meet its obligations to the REIT. In the event of a default by a borrower or lessee, the REIT may experience delays in enforcing its rights as a mortgagee or lessor and may incur substantial costs associated with protecting its investments.
33
COHEN & STEERS REALTY SHARES, INC.
NOTES TO FINANCIAL STATEMENTS—(Continued)
Small- andMedium-Sized Companies Risk:Real estate companies in the industry tend to be small- tomedium-sized companies in relation to the equity markets as a whole. There may be less trading in a smaller company’s stock, which means that buy and sell transactions in that stock could have a larger impact on the stock’s price than is the case with larger company stocks. Smaller companies also may have fewer lines of business so that changes in any one line of business may have a greater impact on a smaller company’s stock price than is the case for a larger company. Further, smaller company stocks may perform differently in different cycles than larger company stocks. Accordingly, real estate company shares can, and at times will, perform differently than large company stocks.
Non-Diversification Risk:As a“non-diversified” investment company, the Fund can invest in fewer individual companies than a diversified investment company. As a result, the Fund is more susceptible to any single political, regulatory or economic occurrence and to the financial condition of individual issuers in which it invests. The Fund’s relative lack of diversity may subject investors to greater risk of loss than a fund that has a diversified portfolio.
Regulatory Risk:The U.S. government has proposed and adopted multiple regulations that could have a long-lasting impact on the Fund and on the mutual fund industry in general. The SEC’s final rules and amendments that modernize reporting and disclosure and require the implementation of a Liquidity Risk Management Program, along with other potential upcoming regulations, could, among other things, restrict the Fund’s ability to engage in transactions, impact flows into the Fund and/or increase overall expenses of the Fund. In addition, the SEC, Congress, various exchanges and regulatory and self-regulatory authorities, both domestic and foreign, have undertaken reviews of the use of derivatives by registered investment companies, which could affect the nature and extent of instruments used by the Fund. While the full extent of all of these regulations is still unclear, these regulations and actions may adversely affect both the Fund and the instruments in which the Fund invests and its ability to execute its investment strategy. Similarly, regulatory developments in other countries may have an unpredictable and adverse impact on the Fund.
This is not a complete list of the risks of investing in the Fund. For additional information concerning the risks of investing in the Fund, please consult the Fund’s prospectus.
Note 8. Other
In the normal course of business, the Fund enters into contracts that provide general indemnifications. The Fund’s maximum exposure under these arrangements is dependent on claims that may be made against the Fund in the future and, therefore, cannot be estimated; however, based on experience, the risk of material loss from such claims is considered remote.
Note 9. Subsequent Events
Management has evaluated events and transactions occurring after December 31, 2019 through the date that the financial statements were issued, and has determined that no additional disclosure in the financial statements is required.
34
COHEN & STEERS REALTY SHARES, INC.
REPORT OF INDEPENDENT REGISTERED PUBLIC ACCOUNTING FIRM
To the Board of Directors and Shareholders of
Cohen & Steers Realty Shares, Inc.
Opinion on the Financial Statements
We have audited the accompanying statement of assets and liabilities, including the schedule of investments, of Cohen & Steers Realty Shares, Inc. (the “Fund”) as of December 31, 2019, the related statement of operations for the year ended December 31, 2019, the statement of changes in net assets for each of the two years in the period ended December 31, 2019, including the related notes, and the financial highlights for each of the periods indicated therein (collectively referred to as the “financial statements”). In our opinion, the financial statements present fairly, in all material respects, the financial position of the Fund as of December 31, 2019, the results of its operations for the year then ended, the changes in its net assets for each of the two years in the period ended December 31, 2019 and the financial highlights for each of the periods indicated therein in conformity with accounting principles generally accepted in the United States of America.
Basis for Opinion
These financial statements are the responsibility of the Fund’s management. Our responsibility is to express an opinion on the Fund’s financial statements based on our audits. We are a public accounting firm registered with the Public Company Accounting Oversight Board (United States) (PCAOB) and are required to be independent with respect to the Fund in accordance with the U.S. federal securities laws and the applicable rules and regulations of the Securities and Exchange Commission and the PCAOB.
We conducted our audits of these financial statements in accordance with the standards of the PCAOB. Those standards require that we plan and perform the audit to obtain reasonable assurance about whether the financial statements are free of material misstatement, whether due to error or fraud.
Our audits included performing procedures to assess the risks of material misstatement of the financial statements, whether due to error or fraud, and performing procedures that respond to those risks. Such procedures included examining, on a test basis, evidence regarding the amounts and disclosures in the financial statements. Our audits also included evaluating the accounting principles used and significant estimates made by management, as well as evaluating the overall presentation of the financial statements. Our procedures included confirmation of securities owned as of December 31, 2019 by correspondence with the custodian, transfer agent and brokers; when replies were not received from brokers, we performed other auditing procedures. We believe that our audits provide a reasonable basis for our opinion.
/s/ PricewaterhouseCoopers LLP
New York, New York
February 21, 2020
We have served as the auditor of one or more investment companies in the Cohen & Steers family of mutual funds since 1991.
35
COHEN & STEERS REALTY SHARES, INC.
TAX INFORMATION—2019 (Unaudited)
For the calendar year ended December 31, 2019, for individual taxpayers, the Fund designates $3,060,672 as qualified dividend income eligible for reduced tax rates, long-term capital gain distributions of $427,257,307 taxable at the maximum 20% rate, long-term capital gain distributions of $879,219 taxable at 25% maximum rate, short-term capital gain distributions of $193,845,774 and $69,779,591 as qualified business income eligible for the 20% deduction. In addition, for corporate taxpayers, 0.27% of the ordinary dividends paid qualified for the dividends received deduction (DRD).
OTHER INFORMATION
A description of the policies and procedures that the Fund uses to determine how to vote proxies relating to portfolio securities is available (i) without charge, upon request, by calling 800-330-7348, (ii) on our website at cohenandsteers.com or (iii) on the SEC’s website at http://www.sec.gov. In addition, the Fund’s proxy voting record for the most recent 12-month period ended June 30 is available by August 31 of each year (i) without charge, upon request, by calling 800-330-7348 or (ii) on the SEC’s website at http://www.sec.gov.
Disclosures of the Fund’s complete holdings are required to be made monthly on Form N-PORT, with every third month made available to the public by the SEC 60 days after the end of the Fund’s fiscal quarter. Previously, the Fund filed its complete schedule of portfolio holdings with the SEC for the first and third quarters of each fiscal year on Form N-Q, which has now been rescinded. Both the Fund’s Form N-Q and Form N-PORT are available (i) without charge, upon request, by calling 800-330-7348 or (ii) on the SEC’s website at http://www.sec.gov.
Please note that distributions paid by the Fund to shareholders are subject to recharacterization for tax purposes and are taxable up to the amount of the Fund’s investment company taxable income and net realized gains. Distributions in excess of the Fund’s net investment company taxable income and realized gains are a return of capital distributed from the Fund’s assets. The final tax treatment of all distributions is reported to shareholders on their 1099-DIV forms, which are mailed after the close of each calendar year.
Benchmark Change
On December 4, 2018, the Fund’s Board of Directors approved a change to the Fund’s benchmark from the FTSE Nareit Equity REITs Index to the FTSE Nareit All Equity REITs Index, effective after the close of business on March 31, 2019.
Change from No-Load Fund to Multi-Class Fund
On April 26, 2019, the Fund’s Board of Directors approved converting the Fund from a no-load fund to a multi-class fund with the addition of seven classes of shares, Class A, Class C, Class F, Class I, Class L, Class R and Class Z shares, effective July 1, 2019. Class F shares are not available for purchase. In addition, on June 11, 2019, the Fund’s Board of Directors approved the following: an amendment to reduce the Fund’s investment advisory fee, an amendment to increase the Fund’s administration fee, the adoption of a distribution and service plan, an amendment to the Fund’s shareholder services plan and the adoption of a fee waiver/expense reimbursement agreement to reduce overall expenses, all effective July 1, 2019 (See Note 2).
36
COHEN & STEERS REALTY SHARES, INC.
Expansion of the Availability of Class I Shares
On December 10, 2019, the Fund’s Board of Directors approved expanding the availability of Class I shares to brokerage platforms of firms that have an agreement with the Fund’s distributor to offer Class I shares on a brokerage platform, effective January 1, 2020. In addition, the Fund’s Board of Directors approved expanding the investment minimum waivers on Class I shares to waive the investment minimum for financial intermediaries who have entered into an agreement with the distributor to offer Class I shares on a brokerage platform and allow financial intermediaries to charge commissions on Class I shares, also effective January 1, 2020. Class I shares are already available to advisory platforms that have an agreement with the Fund’s distributor also with the investment minimum waived. Please see the Fund’s prospectus for additional information.
37
COHEN & STEERS REALTY SHARES, INC.
MANAGEMENT OF THE FUND
The business and affairs of the Fund are managed under the direction of the Board of Directors. The Board of Directors approves all significant agreements between the Fund and persons or companies furnishing services to it, including the Fund’s agreements with its investment advisor, administrator,co-administrator, custodian and transfer agent. The management of the Fund’sday-to-day operations is delegated to its officers, the investment advisor, administrator andco-administrator, subject always to the investment objective and policies of the Fund and to the general supervision of the Board of Directors.
The Board of Directors and officers of the Fund and their principal occupations during at least the past five years are set forth below. The statement of additional information (SAI) includes additional information about fund directors and is available, without charge, upon request by calling800-330-7348.
| | | | | | | | | | | | |
Name, Address and Year of Birth1 | | Position(s) Held With Fund | | Term of Office2 | | Principal Occupation During At Least The Past 5 Years (Including Other Directorships Held) | | Number of Funds Within Fund Complex Overseen by Director (Including the Fund) | | | Length of Time Served3 |
| | | | | |
| Interested Directors4 | | | | | | | | | | | | |
| | | | | |
Robert H. Steers 1953 | | Director, Chairman | | Until Next Election of Directors | | Chief Executive Officer of Cohen & Steers Capital Management, Inc. (CSCM or the Advisor) and its parent, Cohen & Steers, Inc. (CNS) since 2014. Prior to that, Co- Chairman andCo-Chief Executive Officer of the Advisor since 2003 and CNS since 2004. Prior to that, Chairman of the Advisor; Vice President of Cohen & Steers Securities, LLC. | | | 20 | | | Since 1991 |
| | | | | |
Joseph M. Harvey 1963 | | Director | | Until Next Election of Directors | | President of the Advisor (since 2003) and President of CNS (since 2004). Chief Investment Officer of CSCM from 2003 to 2019. Prior to that, Senior Vice President and Director of Investment Research of CSCM. | | | 20 | | | Since 2014 |
(table continued on next page)
38
COHEN & STEERS REALTY SHARES, INC.
(table continued from previous page)
| | | | | | | | | | | | |
Name, Address and Year of Birth1 | | Position(s) Held With Fund | | Term of Office2 | | Principal Occupation During At Least The Past 5 Years (Including Other Directorships Held) | | Number of Funds Within Fund Complex Overseen by Director (Including the Fund) | | | Length of Time Served3 |
| | | | |
| Disinterested Directors | | | | | | | | | | |
| | | | | |
Michael G. Clark 1965 | | Director | | Until Next Election of Directors | | CPA and CFA; From 2006 to 2011, President and Chief Executive Officer of DWS Funds and Managing Director of Deutsche Asset Management. | | | 20 | | | Since 2011 |
| | | | | |
George Grossman 1953 | | Director | | Until Next Election of Directors | | Attorney-at-law. | | | 20 | | | Since 1993 |
| | | | | |
Dean A. Junkans 1959 | | Director | | Until Next Election of Directors | | CFA; Advisor to SigFig (a registered investment advisor) since July, 2018; Adjunct Professor and Executive–In–Residence, Bethel University Since 2015; Chief Investment Officer at Wells Fargo Private Bank from 2004 to 2014 and Chief Investment Officer of the Wealth, Brokerage and Retirement group at Wells Fargo & Company from 2011 to 2014; former Member and Chair, Claritas Advisory Committee at the CFA Institute from 2013 to 2015; Board Member and Investment Committee Member, Bethel University Foundation since 2010; formerly Corporate Executive Board Member of the National Chief Investment Officers Circle, 2010 to 2015; formerly, Member of the Board of Governors of the University of Wisconsin Foundation, River Falls, 1996 to 2004; U.S. Army Veteran, Gulf War. | | | 20 | | | Since 2015 |
(table continued on next page)
39
COHEN & STEERS REALTY SHARES, INC.
(table continued from previous page)
| | | | | | | | | | |
Name, Address and Year of Birth1 | | Position(s) Held With Fund | | Term of Office2 | | Principal Occupation During At Least The Past 5 Years (Including Other Directorships Held) | | Number of Funds Within Fund Complex Overseen by Director (Including the Fund) | | Length of Time Served3 |
| | | | | |
Gerald J. Maginnis 1955 | | Director | | Until Next Election of Directors | | Philadelphia Office Managing Partner, KPMG LLP from 2006 to 2015; Partner in Charge, KPMG Pennsylvania Audit Practice from 2002 to 2008; President, Pennsylvania Institute of Certified Public Accountants (PICPA) from 2014 to 2015; Member, PICPA Board of Directors from 2012 to 2016; Member, Council of the American Institute of Certified Public Accountants (AICPA) from 2013 to 2017; Member, Board of Trustees of AICPA Foundation since 2015. | | 20 | | Since 2015 |
| | | | | |
Jane F. Magpiong 1960 | | Director | | Until Next Election of Directors | | President, Untap Potential since 2013; Senior Managing Director, TIAA-CREF, from 2011 to 2013; National Head of Wealth Management, TIAA- CREF, from 2008 to 2011; and prior to that, President, Bank of America Private Bank from 2005 to 2008. | | 20 | | Since 2015 |
(table continued on next page)
40
COHEN & STEERS REALTY SHARES, INC.
(table continued from previous page)
| | | | | | | | | | |
Name, Address and Year of Birth1 | | Position(s) Held With Fund | | Term of Office2 | | Principal Occupation During At Least The Past 5 Years (Including Other Directorships Held) | | Number of Funds Within Fund Complex Overseen by Director (Including the Fund) | | Length of Time Served3 |
| | | | | |
Daphne L. Richards 1966 | | Director | | Until Next Election of Directors | | Independent Director of Cartica Management, LLC since 2015; Investment Committee Member of the Berkshire Taconic Community Foundation since 2015 and Member of the Advisory Board of Northeast Dutchess Fund since 2016; President and CIO of Ledge Harbor Management since 2016; formerly at Bessemer Trust Company from 1999 to 2014; prior thereto, held investment positions at Frank Russell Company from 1996 to 1999, Union Bank of Switzerland from 1993 to 1996; Credit Suisse from 1990 to 1993; and Hambros International Venture Capital Fund from 1988 to 1989. | | 20 | | Since 2017 |
| | | | | |
C. Edward Ward, Jr 1946 | | Director | | Until Next Election of Directors | | Member of The Board of Trustees of Manhattan College, Riverdale, New York from 2004 to 2014; formerly, Director ofclosed-end fund management for the NYSE where he worked from 1979 to 2004. | | 20 | | Since 2004 |
| 1 | The address for each director is 280 Park Avenue, New York, NY 10017. |
| 2 | On March 12, 2008, the Board of Directors adopted a mandatory retirement policy stating a Director must retire from the Board on December 31st of the year in which he or she turns 75 years of age. |
| 3 | The length of time served represents the year in which the Director was first elected or appointed to any fund in the Cohen & Steers fund complex. |
| 4 | “Interested person” as defined in the 1940 Act, of the Fund because of affiliation with CSCM (Interested Directors). |
41
COHEN & STEERS REALTY SHARES, INC.
The officers of the Fund (other than Messrs. Steers and Harvey, whose biographies are provided above), their address, their year of birth and their principal occupations for at least the past five years are set forth below.
| | | | | | |
Name, Address and
Year of Birth1 | | Position(s) Held
With Fund | | Principal Occupation During At
Least the Past 5 Years | | Length
of Time
Served2 |
| | | |
Adam M. Derechin 1964 | | President and Chief Executive Officer | | Chief Operating Officer of CSCM since 2003 and CNS since 2004. | | Since 2005 |
| | | |
James Giallanza 1966 | | Chief Financial Officer | | Executive Vice President of CSCM since 2014. Prior to that, Senior Vice President of CSCM since 2006. | | Since 2006 |
| | | |
Lisa D. Phelan 1968 | | Chief Compliance Officer | | Executive Vice President of CSCM since 2015. Prior to that, Senior Vice President of CSCM since 2008. Chief Compliance Officer of CSCM, the Cohen & Steers funds, Cohen & Steers Asia Limited and CSSL since 2007, 2006, 2005 and 2004, respectively. | | Since 2006 |
| | | |
Dana A. DeVivo 1981 | | Secretary and Chief Legal Officer | | Senior Vice President of CSCM since 2019. Prior to that, Vice President of CSCM since 2013. | | Since 2015 |
| | | |
Albert Laskaj 1977 | | Treasurer | | Senior Vice President of CSCM since 2019. Prior to that, Vice President of CSCM since 2015. Prior to that, Director of Legg Mason & Co. since 2013. | | Since 2015 |
| | | |
Stephen Murphy 1966 | | Vice President | | Senior Vice President of CSCM since 2019. Prior to that, Managing Director at Mirae Asset Securities (USA) Inc. since 2017. Prior to that, Vice President and Chief Compliance Officer of Weiss Multi-Strategy Advisers LLC since 2011. | | Since 2019 |
| | | |
Thomas N. Bohjalian 1965 | | Vice President | | Executive Vice President of CSCM since 2012. Prior to that, Senior Vice President of CSCM since 2006. | | Since 2006 |
| | | |
Jon Cheigh 1972 | | Vice President | | Chief Investment Officer of CSCM since October 2019 and Executive Vice President of CSCM since 2012. Prior to that, Senior Vice President of CSCM since 2007. | | Since 2007 |
| | | |
Jason A. Yablon 1979 | | Vice President | | Senior Vice President of CSCM since 2014. Prior to that, Vice President of CSCM since 2008. | | Since 2012 |
| 1 | The address of each officer is 280 Park Avenue, New York, NY 10017. |
| 2 | Officers serveone-year terms. The length of time served represents the year in which the officer was first elected as an officer of any fund in the Cohen & Steers fund complex. All of the officers listed above are officers of one or more of the other funds in the complex. |
42
COHEN & STEERS REALTY SHARES, INC.
Cohen & Steers Privacy Policy
| | |
| | |
| Facts | | What Does Cohen & Steers Do With Your Personal Information? |
| |
| Why? | | Financial companies choose how they share your personal information. Federal law gives consumers the right to limit some but not all sharing. Federal law also requires us to tell you how we collect, share, and protect your personal information. Please read this notice carefully to understand what we do. |
| |
| What? | | The types of personal information we collect and share depend on the product or service you have with us. This information can include: • Social Security number and account balances • Transaction history and account transactions • Purchase history and wire transfer instructions |
| |
| How? | | All financial companies need to share customers’ personal information to run their everyday business. In the section below, we list the reasons financial companies can share their customers’ personal information; the reasons Cohen & Steers chooses to share; and whether you can limit this sharing. |
| | | | |
| Reasons we can share your personal information | | Does Cohen & Steers share? | | Can you limit this sharing? |
| | |
For our everyday business purposes— such as to process your transactions, maintain your account(s), respond to court orders and legal investigations, or reports to credit bureaus | | Yes | | No |
| | |
For our marketing purposes— to offer our products and services to you | | Yes | | No |
| | |
| For joint marketing with other financial companies— | | No | | We don’t share |
| | |
For our affiliates’ everyday business purposes— information about your transactions and experiences | | No | | We don’t share |
| | |
For our affiliates’ everyday business purposes— information about your creditworthiness | | No | | We don’t share |
| | |
| For our affiliates to market to you— | | No | | We don’t share |
| | |
| For non-affiliates to market to you— | | No | | We don’t share |
| | |
| | | | |
| | |
| Questions? Call 800.330.7348 | | | | |
43
COHEN & STEERS REALTY SHARES, INC.
Cohen & Steers Privacy Policy—(Continued)
| | |
| | |
| Who we are | | |
| |
| Who is providing this notice? | | Cohen & Steers Capital Management, Inc., Cohen & Steers Asia Limited, Cohen & Steers Japan, LLC, Cohen & Steers UK Limited, Cohen & Steers Securities, LLC, Cohen & Steers Private Funds and Cohen & Steers Open and Closed-End Funds (collectively, Cohen & Steers). |
| |
| What we do | | |
| |
| How does Cohen & Steers protect my personal information? | | To protect your personal information from unauthorized access and use, we use security measures that comply with federal law. These measures include computer safeguards and secured files and buildings. We restrict access to your information to those employees who need it to perform their jobs, and also require companies that provide services on our behalf to protect your information. |
| |
| How does Cohen & Steers collect my personal information? | | We collect your personal information, for example, when you: • Open an account or buy securities from us • Provide account information or give us your contact information • Make deposits or withdrawals from your account We also collect your personal information from other companies. |
| |
| Why can’t I limit all sharing? | | Federal law gives you the right to limit only: • sharing for affiliates’ everyday business purposes—information about your creditworthiness • affiliates from using your information to market to you • sharing for non-affiliates to market to you State law and individual companies may give you additional rights to limit sharing. |
| |
| Definitions | | |
| |
| Affiliates | | Companies related by common ownership or control. They can be financial and nonfinancial companies. • Cohen & Steers does not share with affiliates. |
| |
| Non-affiliates | | Companies not related by common ownership or control. They can be financial and nonfinancial companies. • Cohen & Steers does not share with non-affiliates. |
| |
| Joint marketing | | A formal agreement between non-affiliated financial companies that together market financial products or services to you. • Cohen & Steers does not jointly market. |
44
COHEN & STEERS REALTY SHARES, INC.
Cohen & Steers Open-End Mutual Funds
COHEN & STEERS REALTY SHARES
| • | | Designed for investors seeking total return, investing primarily in U.S. real estate securities |
| • | | Symbols: CSJAX, CSJCX, CSJIX, CSRSX, CSJRX, CSJZX |
COHEN & STEERS REAL ESTATE SECURITIES FUND
| • | | Designed for investors seeking total return, investing primarily in U.S. real estate securities |
| • | | Symbols: CSEIX, CSCIX, CREFX, CSDIX, CIRRX, CSZIX |
COHEN & STEERS INSTITUTIONAL REALTY SHARES
| • | | Designed for institutional investors seeking total return, investing primarily in U.S. real estate securities |
COHEN & STEERS GLOBAL REALTY SHARES
| • | | Designed for investors seeking total return, investing primarily in global real estate equity securities |
| • | | Symbols: CSFAX, CSFCX, CSSPX, GRSRX, CSFZX |
COHEN & STEERS INTERNATIONAL REALTY FUND
| • | | Designed for investors seeking total return, investing primarily in international(non-U.S.) real estate securities |
| • | | Symbols: IRFAX, IRFCX, IRFIX, IRFRX, IRFZX |
COHEN & STEERS REAL ASSETS FUND
| • | | Designed for investors seeking total return and the maximization of real returns during inflationary environments by investing primarily in real assets |
| • | | Symbols: RAPAX, RAPCX, RAPIX, RAPRX, RAPZX |
COHEN & STEERS PREFERRED SECURITIES
AND INCOME FUND
| • | | Designed for investors seeking total return (high current income and capital appreciation), investing primarily in preferred and debt securities issued by U.S. andnon-U.S. companies |
| • | | Symbols: CPXAX, CPXCX, CPXFX, CPXIX, CPRRX, CPXZX |
COHEN & STEERS LOW DURATION PREFERRED
AND INCOME FUND
| • | | Designed for investors seeking high current income and capital preservation by investing inlow-duration preferred and other income securities issued by U.S. andnon-U.S. companies |
| • | | Symbols: LPXAX, LPXCX, LPXIX, LPXRX, LPXZX |
COHEN & STEERS MLP & ENERGY OPPORTUNITY FUND
| • | | Designed for investors seeking total return, investing primarily in midstream energy master limited partnership (MLP) units and related stocks |
| • | | Symbols: MLOAX, MLOCX, MLOIX, MLORX, MLOZX |
COHEN & STEERS GLOBAL INFRASTRUCTURE FUND
| • | | Designed for investors seeking total return, investing primarily in global infrastructure securities |
| • | | Symbols: CSUAX, CSUCX, CSUIX, CSURX, CSUZX |
COHEN & STEERS ALTERNATIVE INCOME FUND
(FORMERLY COHEN & STEERS DIVIDEND VALUE FUND)
| • | | Designed for investors seeking high current income and capital appreciation, investing in equity, preferred and debt securities, focused on real assets and alternative income strategies |
| • | | Symbols: DVFAX, DVFCX, DVFIX, DVFRX, DVFZX |
Distributed by Cohen & Steers Securities, LLC.
Please consider the investment objectives, risks, charges and expenses of any Cohen & Steers U.S. registeredopen-end fund carefully before investing. A summary prospectus and prospectus containing this and other information can be obtained by calling800-330-7348 or by visiting cohenandsteers.com. Please read the summary prospectus and prospectus carefully before investing.
45
COHEN & STEERS REALTY SHARES, INC.
OFFICERS AND DIRECTORS
Robert H. Steers
Director and Chairman
Joseph M. Harvey
Director and Vice President
Michael G. Clark
Director
George Grossman
Director
Dean A. Junkans
Director
Gerald J. Maginnis
Director
Jane F. Magpiong
Director
Daphne L. Richards
Director
C. Edward Ward, Jr.
Director
Adam M. Derechin
President and Chief Executive Officer
James Giallanza
Chief Financial Officer
Lisa D. Phelan
Chief Compliance Officer
Dana A. DeVivo
Secretary and Chief Legal Officer
Albert Laskaj
Treasurer
Stephen Murphy
Vice President
Thomas N. Bohjalian
Vice President
Jon Cheigh
Vice President
Jason A. Yablon
Vice President
KEY INFORMATION
Investment Advisor and Administrator
Cohen & Steers Capital Management, Inc.
280 Park Avenue
New York, NY 10017
(212) 832-3232
Co-administrator and Custodian
State Street Bank and Trust Company
One Lincoln Street
Boston, MA 02111
Transfer Agent
DST Asset Manager Solutions, Inc.
P.O. Box 219953
Kansas City, MO 64121-9953
(800) 437-9912
Legal Counsel
Ropes & Gray LLP
1211 Avenue of the Americas
New York, NY 10036
Distributor
Cohen & Steers Securities, LLC
280 Park Avenue
New York, NY 10017
| | |
| NASDAQ Symbol: | | Class A—CSJAX |
| | Class C—CSJCX |
| | Class F—CSJFX* |
| | Class I—CSJIX |
| | Class L—CSRSX |
| | Class R—CSJRX |
| | Class Z—CSJZX |
Website: cohenandsteers.com
This report is authorized for delivery only to shareholders of Cohen & Steers Realty Shares, Inc. unless accompanied or preceded by the delivery of a currently effective prospectus setting forth details of the Fund. Performance data quoted represent past performance. Past performance is no guarantee of future results and your investment may be worth more or less at the time you sell your shares.
| * | Class F shares are currently not available for purchase. |
46
eDelivery AVAILABLE
Stop traditional mail delivery;
receive your shareholder reports
and prospectus online.
Sign up at cohenandsteers.com

Cohen & Steers
Realty Shares
Annual Report December 31, 2019
Beginning on January 1, 2021, as permitted by regulations adopted by the U.S. Securities and Exchange Commission, paper copies of the Fund’s annual and semi-annual shareholder reports will no longer be sent by mail, unless you specifically request paper copies of the reports. Instead, the reports will be made available on the Fund’s website at www.cohenandsteers.com, and you will be notified by mail each time a report is posted and provided with a website link to access the report.
If you have already elected to receive shareholder reports electronically, you will not be affected by this change and you need not take any action. You may elect to receive shareholder reports and other communications from a Fund electronically anytime by contacting your financial intermediary or, if you are a direct investor, by signing up at www.cohenandsteers.com.
You may elect to receive all future reports in paper, free of charge, at any time. If you invest through a financial intermediary, you can contact your financial intermediary or, if you are a direct investor, you can call (800) 330-7348 to let the Fund know you wish to continue receiving paper copies of your shareholder reports. Your election to receive reports in paper will apply to all Funds held in your account if you invest through your financial intermediary or all Funds held within the fund complex if you invest directly with the Fund.
CSJAXAR
Item 2. Code of Ethics.
The registrant has adopted an Amended and Restated Code of Ethics that applies to its Principal Executive Officer and Principal Financial Officer. The Code of Ethics was in effect during the reporting period. The registrant has not amended the Code of Ethics as described in FormN-CSR during the reporting period. The registrant has not granted any waiver, including an implicit waiver, from a provision of the Code of Ethics as described in FormN-CSR during the reporting period. A current copy of the Code of Ethics is available on the registrant website athttps://www.cohenandsteers.com/assets/content/uploads/Code_of_Ethics_for_Principal_Executive_and_Principal_Financial_Officers_of_the_Funds.pdf. Upon request, a copy of the Code of Ethics can be obtained free of charge by calling800-330-7348 or writing to the Secretary of the Registrant, 280 Park Avenue, 10th floor, New York, NY 10017.
Item 3. Audit Committee Financial Expert.
The registrant’s board has determined that Gerald J. Maginnis qualifies as an audit committee financial expert based on his years of experience in the public accounting profession. The registrant’s board has determined that Michael G. Clark qualifies as an audit committee financial expert based on his years of experience in the public accounting profession and the investment management and financial services industry. Each of Messrs. Clark and Maginnis is a member of the board’s audit committee, and each is independent as such term is defined in FormN-CSR.
Item 4. Principal Accountant Fees and Services.
(a) – (d) Aggregate fees billed to the registrant for the last two fiscal years ended December 31, 2019 and December 31, 2018 for professional services rendered by the registrant’s principal accountant were as follows:
| | | | | | | | |
| | | 2019 | | | 2018 | |
Audit Fees | | $ | 46,490 | | | $ | 45,800 | |
Audit-Related Fees | | $ | 0 | | | $ | 0 | |
Tax Fees | | $ | 5,750 | | | $ | 5,660 | |
All Other Fees | | $ | 0 | | | $ | 0 | |
Tax fees were billed in connection with tax compliance services, including the preparation and review of federal and state tax returns.
(e)(1) The audit committee is required to pre-approve audit andnon-audit services performed for the registrant by the principal accountant. The audit committee also is required to pre-approvenon-audit services performed by the registrant’s principal accountant for the registrant’s investment advisor and anysub-advisor (not including anysub-advisor whose role is primarily portfolio management and is subcontracted with or overseen by another investment advisor) and/or to any entity controlling, controlled by or under common control with the registrant’s investment advisor that provides ongoing services to the registrant, if the engagement for services relates directly to the operations and financial reporting of the registrant.
The audit committee may delegate pre-approval authority to one or more of its members who are independent members of the board of directors of the registrant. The member or members to whom such authority is delegated shall report any pre-approval decisions to the audit committee at its next scheduled meeting. The audit committee may not delegate its responsibility topre-approve services to be performed by the registrant’s principal accountant to the investment advisor.
(e)(2) No services included in (b) – (d) above were approved by the audit committee pursuant to paragraphs (c)(7)(i)(C) of Rule2-01 of RegulationS-X.
(f) Not applicable.
(g) For the fiscal years ended December 31, 2019 and December 31, 2018, the aggregate fees billed by the registrant’s principal accountant fornon-audit services rendered to the registrant and fornon-audit services rendered to the registrant’s investment advisor (not including anysub-advisor whose role is primarily portfolio management and is subcontracted with or overseen by another investment advisor) and/or to any entity controlling, controlled by or under common control with the registrant’s investment advisor that provides ongoing services to the registrant were:
| | | | | | | | |
| | | 2019 | | | 2018 | |
Registrant | | $ | 5,750 | | | $ | 5,660 | |
Investment Advisor | | $ | 0 | | | $ | 0 | |
(h) The registrant’s audit committee considered whether the provision ofnon-audit services that were rendered to the registrant’s investment advisor (not including anysub-advisor whose role is primarily portfolio management and is subcontracted with or overseen by another investment advisor) and/or to any entity controlling, controlled by or under common control with the registrant’s investment advisor that provides ongoing services to the registrant that were not required to bepre-approved pursuant to paragraph (c)(7)(ii) of Rule2-01 of RegulationS-X was compatible with maintaining the principal accountant’s independence.
Item 5. Audit Committee of Listed Registrants.
Not applicable.
Item 6. Schedule of Investments.
Included in Item 1 above.
Item 7. Disclosure of Proxy Voting Policies and Procedures forClosed-End Management Investment Companies.
Not applicable.
Item 8. Portfolio Managers ofClosed-End Investment Companies.
Not applicable.
Item 9. Purchases of Equity Securities byClosed-End Management Investment Company and Affiliated Purchasers.
Not applicable.
Item 10. Submission of Matters to a Vote of Security Holders.
None.
Item 11. Controls and Procedures.
(a) The registrant’s principal executive officer and principal financial officer have concluded that the registrant’s disclosure controls and procedures are reasonably designed to ensure that information required to be disclosed by the registrant in this FormN-CSR was recorded, processed, summarized and reported within the time periods specified in the Securities and Exchange Commission’s rules and forms, based upon such officers’ evaluation of these controls and procedures as of a date within 90 days of the filing date of this report.
(b) There were no changes in the registrant’s internal control over financial reporting that occurred during the period covered by this report that have materially affected, or are reasonably likely to materially affect, the registrant’s internal control over financial reporting.
Item 12. Disclosure of Securities Lending Activities forClosed-End Management Investment Companies.
Not applicable.
Item 13. Exhibits.
(a)(1) Not applicable.
(a)(2) Certifications of principal executive officer and principal financial officer as required by Rule30a-2(a) under the Investment Company Act of 1940.
(a)(3) Not applicable.
(a)(4) Not applicable.
(b) Certifications of chief executive officer and chief financial officer as required by Rule30a-2(b) under the Investment Company Act of 1940.
SIGNATURES
Pursuant to the requirements of the Securities Exchange Act of 1934 and the Investment Company Act of 1940, the registrant has duly caused this report to be signed on its behalf by the undersigned, thereunto duly authorized.
COHEN & STEERS REALTY SHARES, INC.
| | | | |
| | |
| | By: | | /s/ Adam M. Derechin |
| | | | Name: Adam M. Derechin Title: Principal Executive Officer (President and Chief Executive Officer) |
| | |
| | Date: | | March 2, 2020 |
Pursuant to the requirements of the Securities Exchange Act of 1934 and the Investment Company Act of 1940, this report has been signed below by the following persons on behalf of the registrant and in the capacities and on the dates indicated.
| | | | |
| | |
| | By: | | /s/ Adam M. Derechin |
| | | | Name: Adam M. Derechin Title: Principal Executive Officer (President and Chief Executive Officer) |
| | |
| | By: | | /s/ James Giallanza |
| | | | Name: James Giallanza Title: Principal Financial Officer (Chief Financial Officer) |
| |
| | Date: March 2, 2020 |