Searchable text section of graphics shown above
AES Corporation
Second and Third Quarter 2005 Financial Review January 19, 2006
[LOGO]
[LOGO] | | Safe Harbor Disclosure |
Certain statements in the following presentation regarding AES’s business operations may constitute “forward looking statements.” Such forward-looking statements include, but are not limited to, those related to future earnings, growth and financial and operating performance. Forward-looking statements are not intended to be a guarantee of future results, but instead constitute AES’s current expectations based on reasonable assumptions. Forecasted financial information is based on certain material assumptions. These assumptions include, but are not limited to continued normal or better levels of operating performance and electricity demand at our distribution companies and operational performance at our contract generation businesses consistent with historical levels, as well as achievements of planned productivity improvements and incremental growth from investments at investment levels and rates of return consistent with prior experience. For additional assumptions see the Appendix to this presentation. Actual results could differ materially from those projected in our forward-looking statements due to risks, uncertainties and other factors. Important factors that could affect actual results are discussed in AES’s filings with the Securities and Exchange Commission, including, but not limited to the risks discussed under the caption “Cautionary Statements and Risk Factors” in the Company’s Annual Report on Form 10-K/A for the year ended December 31, 2004, as well as our other SEC filings. AES undertakes no obligation to update or revise any forward-looking statements, whether as a result of new information, future events or otherwise.
2Q05 and 3Q05 Financial Review | | www.aes.com |
2
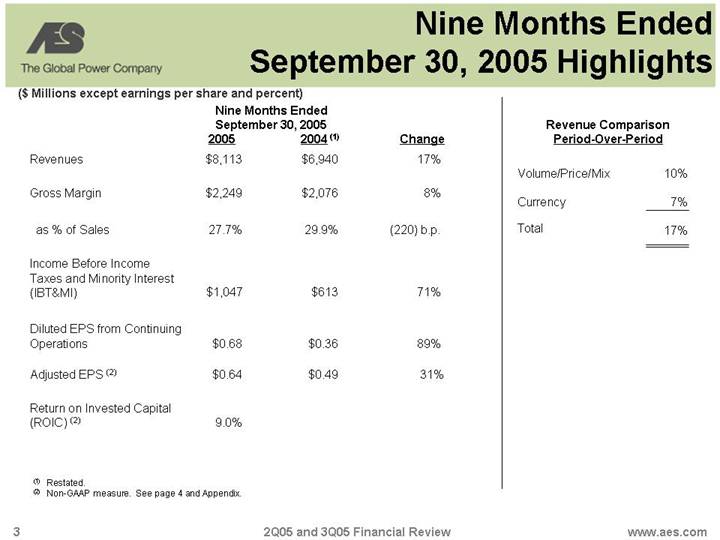
Nine Months Ended September 30, 2005 Highlights
($ Millions except earnings per share and percent)
| | Nine Months Ended
September 30, 2005 | | | |
| | 2005 | | 2004 (1) | | Change | |
Revenues | | $ | 8,113 | | $ | 6,940 | | 17 | % |
| | | | | | | |
Gross Margin | | $ | 2,249 | | $ | 2,076 | | 8 | % |
| | | | | | | |
as % of Sales | | 27.7 | % | 29.9 | % | (220 | ) b.p. |
| | | | | | | |
Income Before Income Taxes and Minority Interest (IBT&MI) | | $ | 1,047 | | $ | 613 | | 71 | % |
| | | | | | | |
Diluted EPS from Continuing Operations | | $ | 0.68 | | $ | 0.36 | | 89 | % |
| | | | | | | |
Adjusted EPS (2) | | $ | 0.64 | | $ | 0.49 | | 31 | % |
| | | | | | | |
Return on Invested Capital (ROIC) (2) | | 9.0 | % | | | | |
Revenue Comparison
Period-Over-Period
Volume/Price/Mix | | 10 | % |
| | | |
Currency | | 7 | % |
| | | |
Total | | 17 | % |
(1) Restated.
(2) Non-GAAP measure. See page 4 and Appendix.
3
Reconciliation of Adjusted Earnings Per Share
($ Per Share)
| | Third Quarter | | Second Quarter | | First Quarter | | Nine Months Ended
September 30, | |
| | 2005 (2) | | 2004(3) | | 2005 (4) | | 2004(3) | | 2005 (3) (5) | | 2004(3) (6) | | 2005(2) (4) (5) | | 2004(3) (6) | |
| | | | | | | | | | | | | | | | | |
Adjusted Earnings Per Share (1) | | $ | 0.35 | | $ | 0.14 | | $ | 0.11 | | $ | 0.20 | | $ | 0.18 | | $ | 0.15 | | $ | 0.64 | | $ | 0.49 | |
| | | | | | | | | | | | | | | | | |
FAS 133 Mark-to-Market Gains/(Losses) (6) | | 0.01 | | (0.01 | ) | (0.01 | ) | (0.01 | ) | — | | (0.05 | ) | (0.01 | ) | (0.07 | ) |
| | | | | | | | | | | | | | | | | |
Currency Transaction Gains/(Losses) | | 0.01 | | — | | 0.03 | | (0.03 | ) | 0.01 | | (0.02 | ) | 0.05 | | (0.05 | ) |
| | | | | | | | | | | | | | | | | |
Net Asset Gains/(Losses and Impairments) | | — | | — | | — | | — | | — | | — | | — | | — | |
| | | | | | | | | | | | | | | | | |
Debt Retirement Gains/(Losses) | | — | | — | | — | | — | | — | | (0.01 | ) | — | | (0.01 | ) |
| | | | | | | | | | | | | | | | | |
Diluted EPS from Continuing Operations | | $ | 0.37 | | $ | 0.13 | | $ | 0.13 | | $ | 0.16 | | $ | 0.19 | | $ | 0.07 | | $ | 0.68 | | $ | 0.36 | |
(1) Adjusted earnings per share (a non-GAAP financial measure), exclude from diluted earnings per share from continuing operations the effects of (i) gains or losses from mark-to-market accounting adjustments related to derivatives, (ii) certain foreign currency transaction gains and losses, (iii) significant impacts from net asset disposals or impairments, and (iv) early retirement of recourse debt.
(2) Includes $0.06 per share benefit related to an Argentina valuation allowance reversal.
(3) Restated.
(4) Includes ($0.06) per share related to Brazilian receivable reserve costs net of a reversal of a business tax reserve.
(5) Includes $0.01 increase in Q1 2005 diluted EPS from continuing operations as restated, due to a tariff increase at our Eletropaulo regulated utility in Brazil that was received in July 2005 and recorded retroactively in the first quarter of 2005 and is reflected in year to date results.
(6) Includes Gener debt restructuring cost of ($0.03) per share.
4
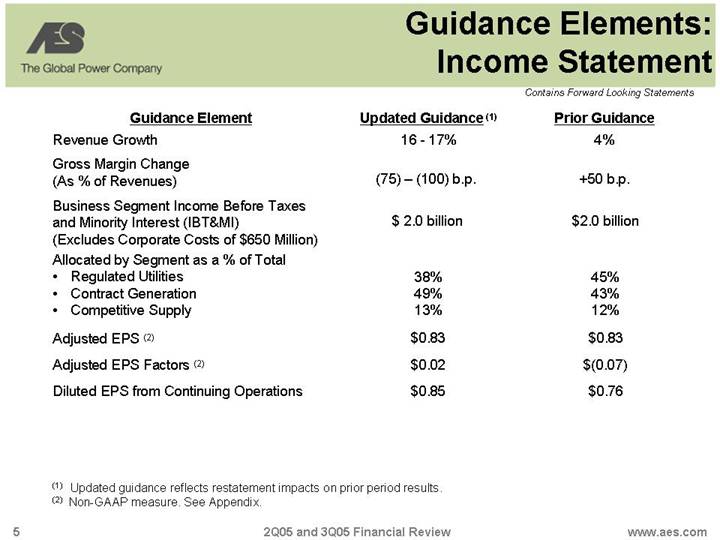
Guidance Elements: Income Statement
Contains Forward Looking Statements
Guidance Element | | Updated Guidance (1) | | Prior Guidance |
Revenue Growth | | 16 -17% | | 4% |
| | | | |
Gross Margin Change (As % of Revenues) | | (75) – (100) b.p. | | +50 b.p. |
| | | | |
Business Segment Income Before Taxes and Minority Interest (IBT&MI) | | $2.0 billion | | $2.0 billion |
(Excludes Corporate Costs of $650 Million) | | | | |
| | | | |
Allocated by Segment as a % of Total | | | | |
• Regulated Utilities | | 38% | | 45% |
• Contract Generation | | 49% | | 43% |
• Competitive Supply | | 13% | | 12% |
| | | | |
Adjusted EPS (2) | | $0.83 | | $0.83 |
| | | | |
Adjusted EPS Factors (2) | | $0.02 | | $(0.07) |
| | | | |
Diluted EPS from Continuing Operations | | $0.85 | | $0.76 |
(1) Updated guidance reflects restatement impacts on prior period results.
(2) Non-GAAP measure. See Appendix.
5
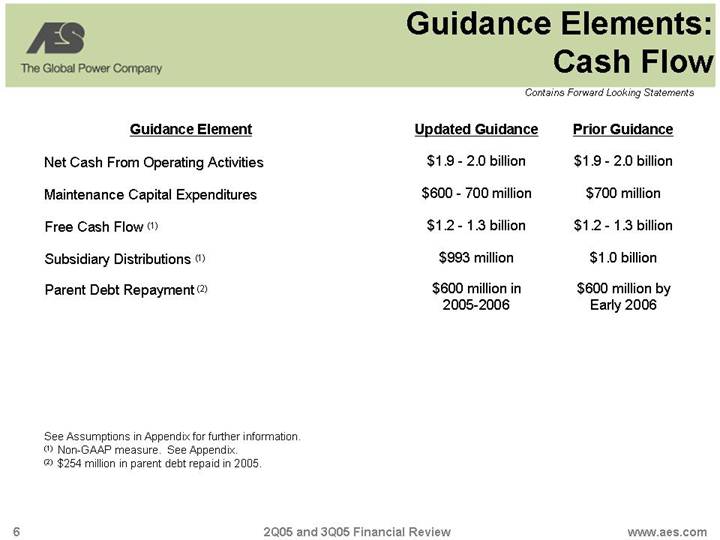
Guidance Elements: Cash Flow
Contains Forward Looking Statements
Guidance Element | | Updated Guidance | | Prior Guidance |
| | | | |
Net Cash From Operating Activities | | $1.9 - 2.0 billion | | $1.9 - 2.0 billion |
| | | | |
Maintenance Capital Expenditures | | $600 - 700 million | | $700 million |
| | | | |
Free Cash Flow (1) | | $1.2 - 1.3 billion | | $1.2 - 1.3 billion |
| | | | |
Subsidiary Distributions (1) | | $993 million | | $1.0 billion |
| | | | |
Parent Debt Repayment (2) | | $600 million in | | $600 million by |
| | 2005-2006 | | Early 2006 |
See Assumptions in Appendix for further information.
(1) Non-GAAP measure. See Appendix.
(2) $254 million in parent debt repaid in 2005.
6
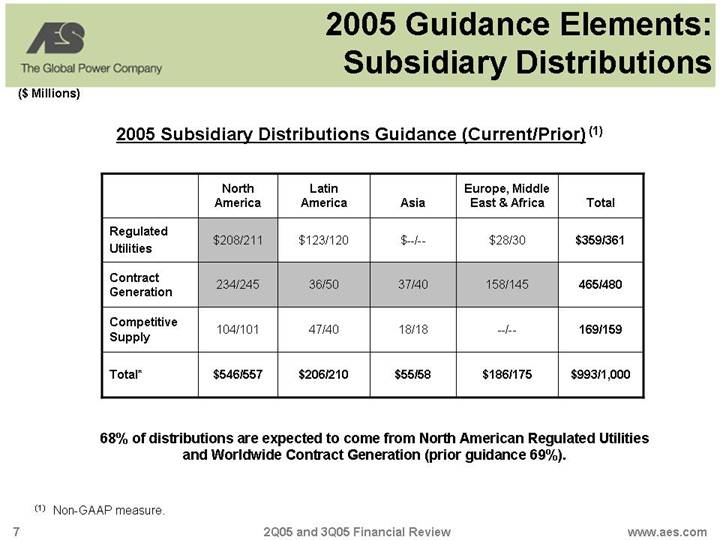
2005 Guidance Elements: Subsidiary Distributions
($ Millions)
2005 Subsidiary Distributions Guidance (Current/Prior) (1)
| | North
America | | Latin
America | | Asia | | Europe, Middle
East & Africa | | Total | |
| | | | | | | | | | | |
Regulated Utilities | | $208/211 | | $123/120 | | $—/— | | $28/30 | | $359/361 | |
| | | | | | | | | | | |
Contract Generation | | 234/245 | | 36/50 | | 37/40 | | 158/145 | | 465/480 | |
| | | | | | | | | | | |
Competitive Supply | | 104/101 | | 47/40 | | 18/18 | | —/— | | 169/159 | |
| | | | | | | | | | | |
Total* | | $546/557 | | $206/210 | | $55/58 | | $186/175 | | $993/1,000 | |
68% of distributions are expected to come from North American Regulated Utilities and Worldwide Contract Generation (prior guidance 69%).
(1) Non-GAAP measure.
7
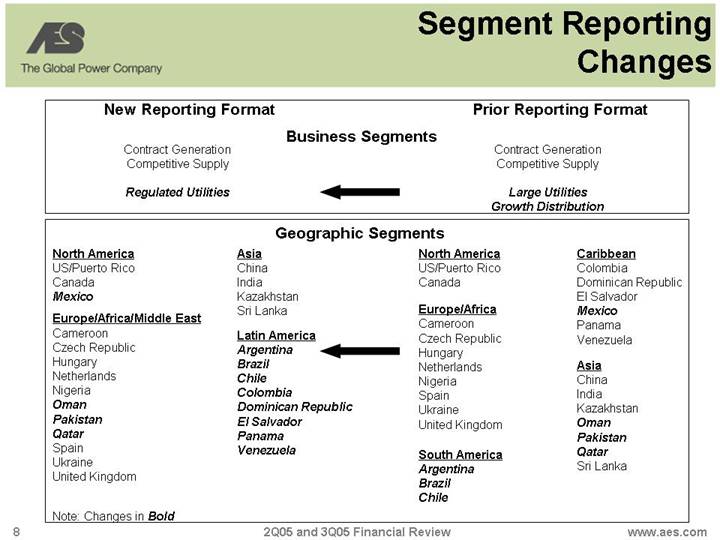
Segment Reporting Changes
New Reporting Format | | Prior Reporting Format |
| Business Segments | |
Contract Generation | | Contract Generation |
Competitive Supply | | Competitive Supply |
| | |
Regulated Utilities | | Large Utilities |
| | Growth Distribution |
Geographic Segments
North America | | Asia | | North America | | Caribbean |
US/Puerto Rico | | China | | US/Puerto Rico | | Colombia |
Canada | | India | | Canada | | Dominican Republic |
Mexico | | Kazakhstan | | | | El Salvador |
| | Sri Lanka | | Europe/Africa | | Mexico |
Europe/Africa/Middle East | | | | Cameroon | | Panama |
Cameroon | | Latin America | | Czech Republic | | Venezuela |
Czech Republic | | Argentina | | Hungary | | |
Hungary | | Brazil | | Netherlands | | |
Netherlands | | Chile | | Nigeria | | Asia |
Nigeria | | Colombia | | Spain | | China |
Oman | | Dominican Republic | | Ukraine | | India |
Pakistan | | El Salvador | | United Kingdom | | Kazakhstan |
Qatar | | Panama | | | | Oman |
Spain | | Venezuela | | | | Pakistan |
Ukraine | | | | South America | | Qatar |
United Kingdom | | | | Argentina | | Sri Lanka |
| | | | Brazil | | |
| | | | Chile | | |
Note: Changes in Bold
8
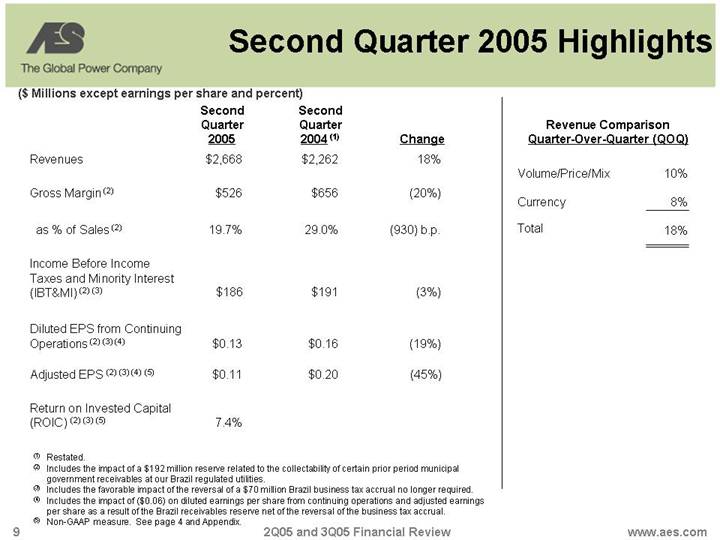
Second Quarter 2005 Highlights
($ Millions except earnings per share and percent)
| | Second
Quarter
2005 | | Second
Quarter
2004 (1) | | Change | |
Revenues | | $ | 2,668 | | $ | 2,262 | | 18 | % |
| | | | | | | |
Gross Margin (2) | | $ | 526 | | $ | 656 | | (20 | )% |
| | | | | | | |
as % of Sales (2) | | 19.7 | % | 29.0 | % | (930 | ) b.p. |
| | | | | | | |
Income Before Income Taxes and Minority Interest (IBT&MI) (2) (3) | | $ | 186 | | $ | 191 | | (3 | ) % |
| | | | | | | |
Diluted EPS from Continuing Operations (2) (3) (4) | | $ | 0.13 | | $ | 0.16 | | (19 | )% |
| | | | | | | |
Adjusted EPS (2) (3) (4) (5) | | $ | 0.11 | | $ | 0.20 | | (45 | )% |
| | | | | | | |
Return on Invested Capital (ROIC) (2) (3) (5) | | 7.4 | % | | | | |
(1) Restated.
(2) Includes the impact of a $192 million reserve related to the collectability of certain prior period municipal government receivables at our Brazilian regulated utilities.
(3) Includes the favorable impact of the reversal of a $70 million Brazilian business tax accrual no longer required.
(4) Includes the impact of ($0.06) on diluted earnings per share from continuing operations and adjusted earnings per share as a result of the Brazilian receivables reserve net of the reversal of the business tax accrual.
(5) Non-GAAP measure. See page 4 and Appendix.
Revenue Comparison
Quarter-Over-Quarter (QOQ)
Volume/Price/Mix | | 10 | % |
| | | |
Currency | | 8 | % |
| | | |
Total | | 18 | % |
9
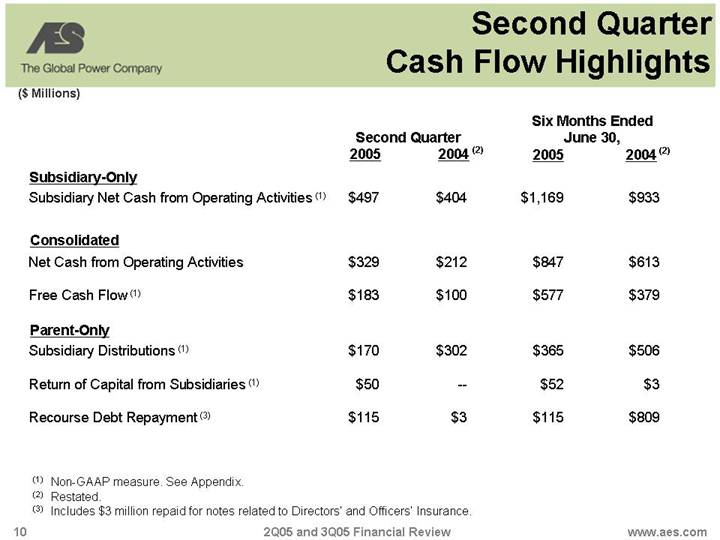
Second Quarter Cash Flow Highlights
($ Millions)
| | Second Quarter | | Six Months Ended
June 30, | |
| | 2005 | | 2004 (2) | | 2005 | | 2004 (2) | |
Subsidiary-Only | | | | | | | | | |
Subsidiary Net Cash from Operating Activities (1) | | $ | 497 | | $ | 404 | | $ | 1,169 | | $ | 933 | |
| | | | | | | | | |
Consolidated | | | | | | | | | |
Net Cash from Operating Activities | | $ | 329 | | $ | 212 | | $ | 847 | | $ | 613 | |
| | | | | | | | | |
Free Cash Flow (1) | | $ | 183 | | $ | 100 | | $ | 577 | | $ | 379 | |
| | | | | | | | | |
Parent-Only | | | | | | | | | |
Subsidiary Distributions (1) | | $ | 170 | | $ | 302 | | $ | 365 | | $ | 506 | |
| | | | | | | | | |
Return of Capital from Subsidiaries (1) | | $ | 50 | | — | | $ | 52 | | $ | 3 | |
| | | | | | | | | |
Recourse Debt Repayment (3) | | $ | 115 | | $ | 3 | | $ | 115 | | $ | 809 | |
(1) Non-GAAP measure. See Appendix.
(2) Restated.
(3) Includes $3 million repaid for notes related to Directors’ and Officers’ Insurance.
10
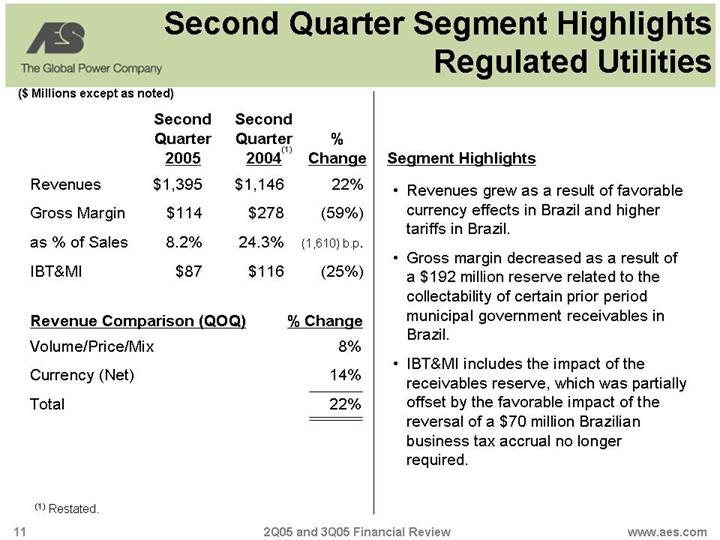
Second Quarter Segment Highlights Regulated Utilities
($ Millions except as noted)
| | Second | | Second | | | |
| | Quarter | | Quarter | | % | |
| | 2005 | | 2004(1) | | Change | |
Revenues | | $ | 1,395 | | $ | 1,146 | | 22 | % |
Gross Margin | | $ | 114 | | $ | 278 | | (59 | )% |
as % of Sales | | 8.2 | % | 24.3 | % | (1,610 | )b.p. |
IBT&MI | | $ | 87 | | $ | 116 | | (25 | )% |
Revenue Comparison (QOQ) | | % Change | |
Volume/Price/Mix | | 8 | % |
Currency (Net) | | 14 | % |
Total | | 22 | % |
(1) Restated.
Segment Highlights
• Revenues grew as a result of favorable currency effects in Brazil and higher tariffs in Brazil.
• Gross margin decreased as a result of a $192 million reserve related to the collectability of certain prior period municipal government receivables in Brazil.
• IBT&MI includes the impact of the receivables reserve, which was partially offset by the favorable impact of the reversal of a $70 million Brazilian business tax accrual no longer required.
11
Second Quarter Segment Highlights Contract Generation
($ Millions except as noted)
| | Second | | Second | | | |
| | Quarter | | Quarter | | % | |
| | 2005 | | 2004(1) | | Change | |
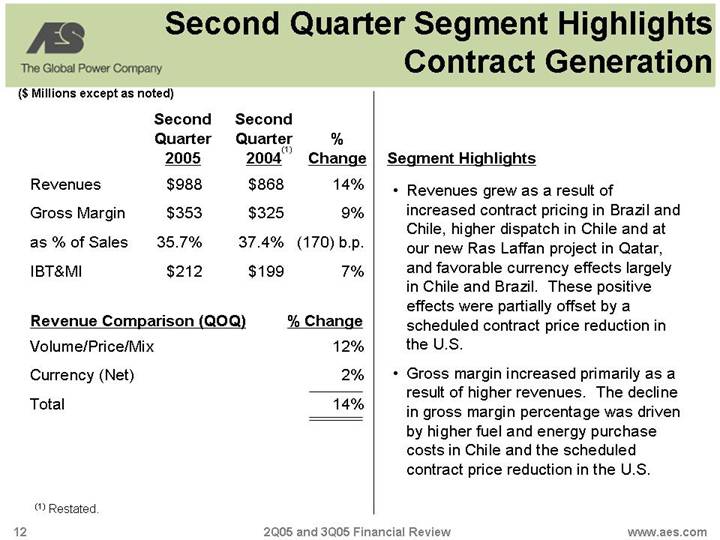
Revenues | | $ | 988 | | $ | 868 | | 14 | % |
Gross Margin | | $ | 353 | | $ | 325 | | 9 | % |
as % of Sales | | 35.7 | % | 37.4 | % | (170 | )b.p. |
IBT&MI | | $ | 212 | | $ | 199 | | 7 | % |
Revenue Comparison (QOQ) | | % Change | |
Volume/Price/Mix | | 12 | % |
Currency (Net) | | 2 | % |
Total | | 14 | % |
(1) Restated.
Segment Highlights
• Revenues grew as a result of increased contract pricing in Brazil and Chile, higher dispatch in Chile and at our new Ras Laffan project in Qatar, and favorable currency effects largely in Chile and Brazil. These positive effects were partially offset by a scheduled contract price reduction in the U.S.
• Gross margin increased primarily as a result of higher revenues. The decline in gross margin percentage was driven by higher fuel and energy purchase costs in Chile and the scheduled contract price reduction in the U.S.
12
Second Quarter Segment Highlights Competitive Supply
($ Millions except as noted)
| | Second | | Second | | | |
| | Quarter | | Quarter | | % | |
| | 2005 | | 2004(1) | | Change | |
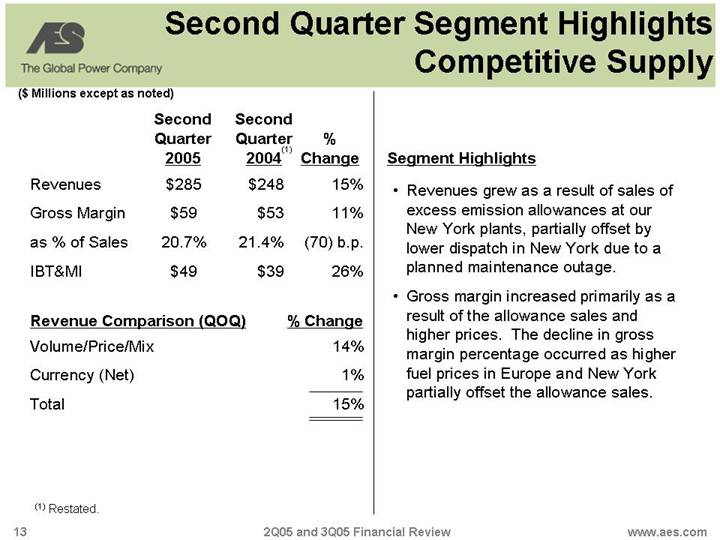
Revenues | | $ | 285 | | $ | 248 | | 15 | % |
Gross Margin | | $ | 59 | | $ | 53 | | 11 | % |
as % of Sales | | 20.7 | % | 21.4 | % | (70 | )b.p. |
IBT&MI | | $ | 49 | | $ | 39 | | 26 | % |
Revenue Comparison (QOQ) | | % Change | |
Volume/Price/Mix | | 14 | % |
Currency (Net) | | 1 | % |
Total | | 15 | % |
(1) Restated.
Segment Highlights
• Revenues grew as a result of sales of excess emission allowances at our New York plants, partially offset by lower dispatch in New York due to a planned maintenance outage.
• Gross margin increased primarily as a result of the allowance sales and higher prices. The decline in gross margin percentage occurred as higher fuel prices in Europe and New York partially offset the allowance sales.
13
Third Quarter 2005 Highlights
($ Millions except earnings per share and percent)
| | Third | | Third | | | |
| | Quarter | | Quarter | | | |
| | 2005 | | 2004 (1) | | Change | |
Revenues | | $ | 2,782 | | $ | 2,422 | | 15 | % |
| | | | | | | |
Gross Margin | | $ | 899 | | $ | 736 | | 22 | % |
| | | | | | | |
as % of Sales | | 32.3 | % | 30.4 | % | 190 | b.p. |
| | | | | | | |
Income Before Income Taxes and Minority Interest (IBT&MI) | | $ | 484 | | $ | 251 | | 93 | % |
| | | | | | | |
Diluted EPS from Continuing Operations (2) | | $ | 0.37 | | $ | 0.13 | | 185 | % |
| | | | | | | |
Adjusted EPS (2) (3) | | $ | 0.35 | | $ | 0.14 | | 150 | % |
| | | | | | | |
Return on Invested Capital (ROIC) (2) (3) | | 9.0 | % | | | | |
(1) Restated.
(2) Includes the favorable impact of the reversal of a $41 million tax reserve related to the recovery of net operating losses at two of our subsidiaries in Argentina, resulting in a positive impact of $0.06 on diluted earnings per share from continuing operations and adjusted earnings per share.
(3) Non-GAAP measure. See page 4 and Appendix.
Revenue Comparison
Quarter-Over-Quarter (QOQ)
Volume/Price/Mix | | 10 | % |
| | | |
Currency | | 5 | % |
| | | |
Total | | 15 | % |
14
Third Quarter Cash Flow Highlights
($ Millions)
| | Third Quarter | | Nine Months Ended
September 30, | |
| | 2005 | | 2004 (2) | | 2005 | | 2004 (2) | |
Subsidiary-Only | | | | | | | | | |
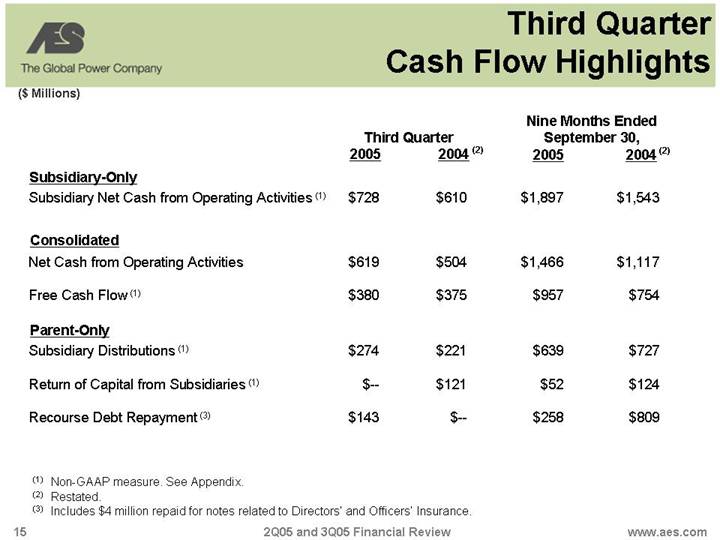
Subsidiary Net Cash from Operating Activities (1) | | $ | 728 | | $ | 610 | | $ | 1,897 | | $ | 1,543 | |
| | | | | | | | | |
Consolidated | | | | | | | | | |
Net Cash from Operating Activities | | $ | 619 | | $ | 504 | | $ | 1,466 | | $ | 1,117 | |
| | | | | | | | | |
Free Cash Flow (1) | | $ | 380 | | $ | 375 | | $ | 957 | | $ | 754 | |
| | | | | | | | | |
Parent-Only | | | | | | | | | |
Subsidiary Distributions (1) | | $ | 274 | | $ | 221 | | $ | 639 | | $ | 727 | |
| | | | | | | | | |
Return of Capital from Subsidiaries (1) | | $ | — | | $ | 121 | | $ | 52 | | $ | 124 | |
| | | | | | | | | |
Recourse Debt Repayment (3) | | $ | 143 | | $ | — | | $ | 258 | | $ | 809 | |
(1) Non-GAAP measure. See Appendix.
(2) Restated.
(3) Includes $4 million repaid for notes related to Directors’ and Officers’ Insurance.
15
Third Quarter/Nine Months Ended 9/30/05 Subsidiary Distributions
($ Millions)
Third Quarter/Nine Months Ended September 30, 2005
Subsidiary Distributions (1)
| | North | | Latin | | | | Europe, Middle | | | |
| | America | | America | | Asia | | East & Africa | | Total | |
| | | | | | | | | | | |
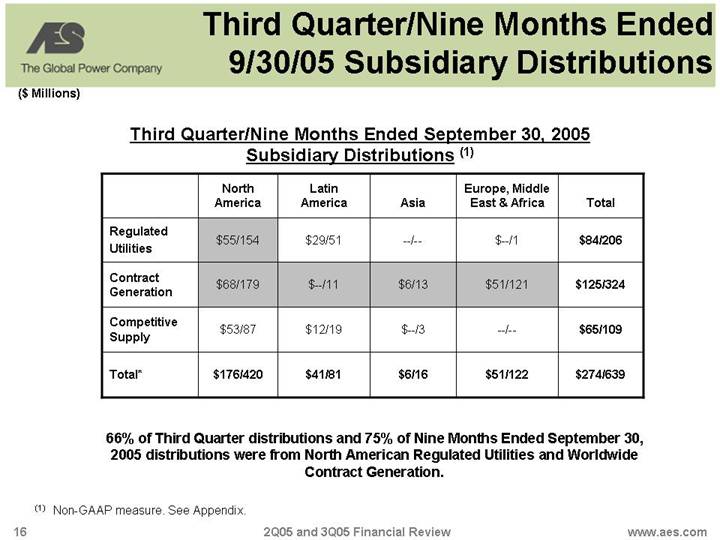
Regulated Utilities | | $55/154 | | $29/51 | | —/— | | $—/1 | | $84/206 | |
| | | | | | | | | | | |
Contract Generation | | $68/179 | | $—/11 | | $6/13 | | $51/121 | | $125/324 | |
| | | | | | | | | | | |
Competitive Supply | | $53/87 | | $12/19 | | $—/3 | | —/— | | $65/109 | |
| | | | | | | | | | | |
Total* | | $176/420 | | $41/81 | | $6/16 | | $51/122 | | $274/639 | |
66% of Third Quarter distributions and 75% of Nine Months Ended September 30, 2005 distributions were from North American Regulated Utilities and Worldwide Contract Generation.
(1) Non-GAAP measure. See Appendix.
16
Third Quarter Segment Highlights Regulated Utilities
($ Millions except as noted)
| | Third | | Third | | | |
| | Quarter | | Quarter | | % | |
| | 2005 | | 2004(1) | | Change | |
Revenues | | $ | 1,406 | | $ | 1,251 | | 12 | % |
Gross Margin | | $ | 340 | | $ | 301 | | 13 | % |
as % of Sales | | 24.2 | % | 24.1 | % | 10 | b.p. |
IBT&MI | | $ | 195 | | $ | 168 | | 16 | % |
Revenue Comparison (QOQ) | | % Change | |
Volume/Price/Mix | | (2 | )% |
Currency (Net) | | 14 | % |
Total | | 12 | % |
(1) Restated.
Segment Highlights
• Revenues grew as a result of favorable currency effects in Brazil more than offsetting unfavorable currency effects in Venezuela. Warm weather and recovery relating to environmental investments contributed to higher revenues in the U.S.
• Gross margin increased primarily as a result of higher revenues in Brazil and the U.S., as well as favorable purchased electricity cost comparisons in Brazil.
17
Third Quarter Segment Highlights Contract Generation
($ Millions except as noted)
| | Third | | Third | | | |
| | Quarter | | Quarter | | % | |
| | 2005 | | 2004(1) | | Change | |
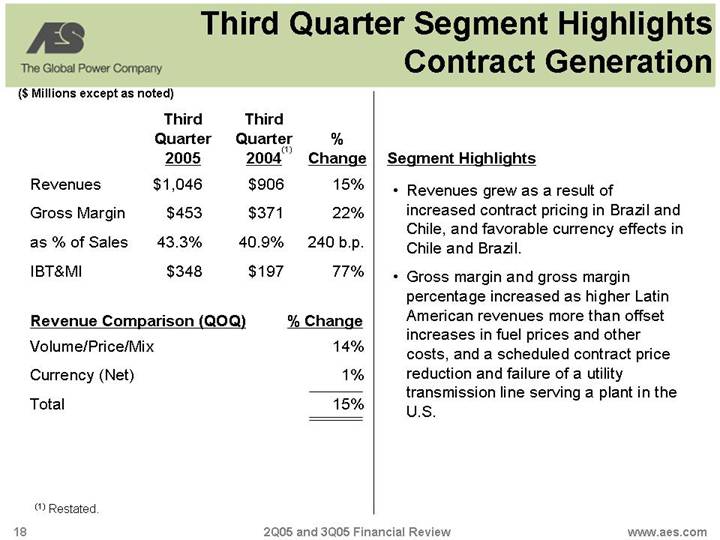
Revenues | | $ | 1,046 | | $ | 906 | | 15 | % |
Gross Margin | | $ | 453 | | $ | 371 | | 22 | % |
as % of Sales | | 43.3 | % | 40.9 | % | 240 | b.p. |
IBT&MI | | $ | 348 | | $ | 197 | | 77 | % |
Revenue Comparison (QOQ) | | % Change | |
Volume/Price/Mix | | 14 | % |
Currency (Net) | | 1 | % |
Total | | 15 | % |
(1) Restated.
Segment Highlights
• Revenues grew as a result of increased contract pricing in Brazil and Chile, and favorable currency effects in Chile and Brazil.
• Gross margin and gross margin percentage increased as higher Latin American revenues more than offset increases in fuel prices and other costs, and a scheduled contract price reduction and failure of a utility transmission line serving a plant in the U.S.
18
Third Quarter Segment Highlights Competitive Supply
($ Millions except as noted)
| | Third | | Third | | | |
| | Quarter | | Quarter | | % | |
| | 2005 | | 2004(1) | | Change | |
Revenues | | $ | 330 | | $ | 265 | | 25 | % |
Gross Margin | | $ | 106 | | $ | 64 | | 66 | % |
as % of Sales | | 32.1 | % | 24.2 | % | 790 | b.p. |
IBT&MI | | $ | 86 | | $ | 44 | | 95 | % |
Revenue Comparison (QOQ) | | % Change | |
Volume/Price/Mix | | 23 | % |
Currency (Net) | | 2 | % |
Total | | 25 | % |
(1) Restated.
Segment Highlights
• Revenues grew as a result of increased competitive market prices in Argentina, Panama and New York, as well as higher dispatch in Argentina.
• Gross margin and gross margin percentage increased as higher competitive market prices more than offset increases in fuel prices in New York and Argentina.
19
Restatement Summary Income Statement Effects 2002-2004
($ Millions)
| | Year Ended December 31, | |
| | 2004 | | 2003 | | 2002 | |
| | | | | | | |
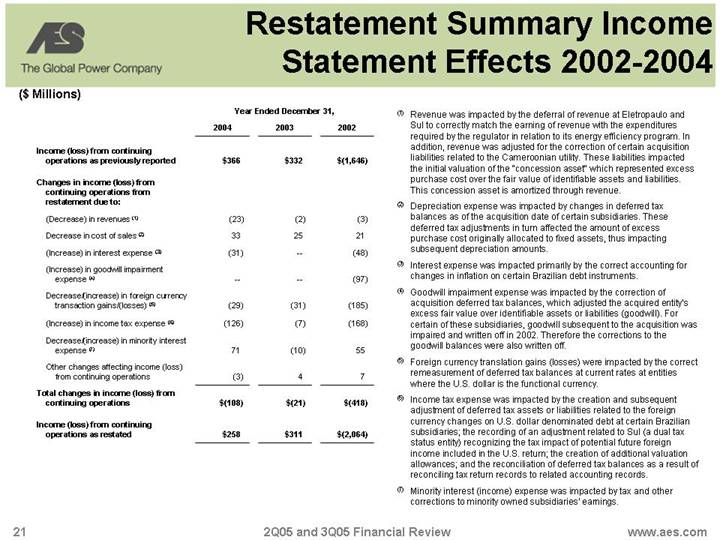
Income (loss) from continuing operations as previously reported | | $ | 366 | | $ | 332 | | $ | (1,646 | ) |
| | | | | | | |
Changes in income (loss) from continuing operations from restatement due to: | | | | | | | |
(Decrease) in revenues (1) | | (23 | ) | (2 | ) | (3 | ) |
Decrease in cost of sales (2) | | 33 | | 25 | | 21 | |
(Increase) in interest expense (3) | | (31 | ) | — | | (48 | ) |
(Increase) in goodwill impairment expense (4) | | — | | — | | (97 | ) |
Decrease/(increase) in foreign currency transaction gains/(losses) (5) | | (29 | ) | (31 | ) | (185 | ) |
| | | | | | | |
(Increase) in income tax expense (6) | | (126 | ) | (7 | ) | (168 | ) |
Decrease/(increase) in minority interest expense (7) | | 71 | | (10 | ) | 55 | |
Other changes affecting income (loss) from continuing operations | | (3 | ) | 4 | | 7 | |
Total changes in income (loss) from continuing operations | | $ | (108 | ) | $ | (21 | ) | $ | (418 | ) |
| | | | | | | |
Income (loss) from continuing operations as restated | | $ | 258 | | $ | 311 | | $ | (2,064 | ) |
(1) Revenue was impacted by the deferral of revenue at Eletropaulo and Sul to correctly match the earning of revenue with the expenditures required by the regulator in relation to its energy efficiency program. In addition, revenue was adjusted for the correction of certain acquisition liabilities related to the Cameroonian utility. These liabilities impacted the initial valuation of the “concession asset” which represented excess purchase cost over the fair value of identifiable assets and liabilities. This concession asset is amortized through revenue.
(2) Depreciation expense was impacted by changes in deferred tax balances as of the acquisition date of certain subsidiaries. These deferred tax adjustments in turn affected the amount of excess purchase cost originally allocated to fixed assets, thus impacting subsequent depreciation amounts.
(3) Interest expense was impacted primarily by the correct accounting for changes in inflation on certain Brazilian debt instruments.
(4) Goodwill impairment expense was impacted by the correction of acquisition deferred tax balances, which adjusted the acquired entity’s excess fair value over identifiable assets or liabilities (goodwill). For certain of these subsidiaries, goodwill subsequent to the acquisition was impaired and written off in 2002. Therefore the corrections to the goodwill balances were also written off.
(5) Foreign currency translation gains (losses) were impacted by the correct remeasurement of deferred tax balances at current rates at entities where the U.S. dollar is the functional currency.
(6) Income tax expense was impacted by the creation and subsequent adjustment of deferred tax assets or liabilities related to the foreign currency changes on U.S. dollar denominated debt at certain Brazilian subsidiaries; the recording of an adjustment related to Sul (a dual tax status entity) recognizing the tax impact of potential future foreign income included in the U.S. return; the creation of additional valuation allowances; and the reconciliation of deferred tax balances as a result of reconciling tax return records to related accounting records.
(7) Minority interest (income) expense was impacted by tax and other corrections to minority owned subsidiaries’ earnings.
21
Restatement Summary Income Statement Effects Quarters
($ Millions)
| | Quarter Ended | |
| | March 31, | | Dec. 31, | | Sept. 30, | | June 30, | | March 31, | |
| | 2005 | | 2004 | | 2004 | | 2004 | | 2004 | |
| | | | | | | | | | | |
Income from continuing operations as previously reported | | $ | 133 | | $ | 92 | | $ | 133 | | $ | 67 | | $ | 74 | |
| | | | | | | | | | | |
Change in income from continuing operations from restatement due to: | | | | | | | | | | | |
Increase/(decrease) in revenues | | 18 | | (20 | ) | (1 | ) | (1 | ) | (1 | ) |
Decrease in cost of sales | | 24 | | 13 | | 6 | | 9 | | 5 | |
(Increase) in interest expense | | — | | (5 | ) | (8 | ) | (10 | ) | (8 | ) |
Decrease/(increase) in foreign currency transaction gains/(losses) | | (19 | ) | (5 | ) | (6 | ) | 8 | | (26 | ) |
Decrease/(increase) in income tax expense | | (21 | ) | (107 | ) | (50 | ) | 42 | | (11 | ) |
Decrease/(increase) in minority interest expense | | (15 | ) | 59 | | 15 | | (12 | ) | 9 | |
Other changes affecting income from continuing operations | | 4 | | — | | (3 | ) | — | | — | |
Total changes in income from continuing operations | | $ | (9 | ) | $ | (65 | ) | $ | (47 | ) | $ | 36 | | $ | (32 | ) |
| | | | | | | | | | | |
Income from continuing operations as restated | | $ | 124 | | $ | 27 | | $ | 86 | | $ | 103 | | $ | 42 | |
22
Restatement Summary Earnings per Share Effects 2002-2005
| | Quarter Ended | | | | | | Year Ended | | | | | |
| | March 31, 2005 | | December 31, 2004 | | December 31, 2003 | | December 31, 2002 | |
| | As Previously | | | | As Previously | | | | As Previously | | | | As Previously | | | |
| | Reported | | As Restated | | Reported | | As Restated | | Reported | | As Restated | | Reported | | As Restated | |
| | | | | | | | | | | | | | | | | |
Adjusted earnings (loss) per share | | $ | 0.17 | | $ | 0.18 | | $ | 0.73 | | $ | 0.58 | | $ | 0.56 | | | | | | | |
FAS 133 mark-to-market gains/(losses) | | — | | — | | (0.06 | ) | (0.06 | ) | (0.07 | ) | | | | | | |
Currency transaction gains/(losses) | | 0.03 | | 0.01 | | (0.02 | ) | (0.06 | ) | 0.19 | | | | | | | |
Net asset gains/(losses and impairments) | | — | | — | | (0.05 | ) | (0.05 | ) | (0.24 | ) | | | | | | |
Debt retirement gains/(losses) | | — | | — | | (0.03 | ) | (0.01 | ) | 0.12 | | | | | | | |
Diluted earnings (loss) per share from continuing operations | | $ | 0.20 | | $ | 0.19 | | $ | 0.57 | | $ | 0.40 | | $ | 0.56 | | $ | 0.52 | | $ | (3.06 | ) | $ | (3.83 | ) |
| | | | | | | | | | | | | | | | | | | | | | | | | |
23
Restatement Summary Earnings per Share Effects 2004 Quarters
| | Quarter Ended | |
| | December 31, 2004 | | September 30, 2004 | | June 30, 2004 | | March 31, 2004 | |
| | As Previously | | | | As Previously | | | | As Previously | | | | As Previously | | | |
| | Reported | | As Restated | | Reported | | As Restated | | Reported | | As Restated | | Reported | | As Restated | |
| | | | | | | | | | | | | | | | | |
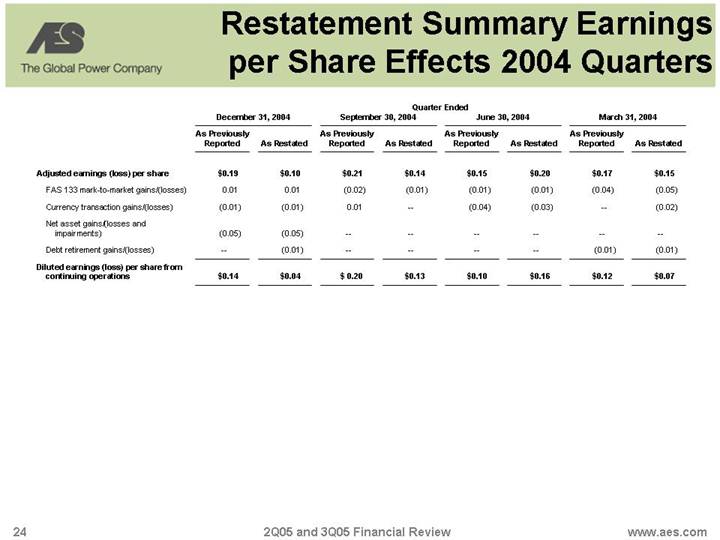
Adjusted earnings (loss) per share | | $ | 0.19 | | $ | 0.10 | | $ | 0.21 | | $ | 0.14 | | $ | 0.15 | | $ | 0.20 | | $ | 0.17 | | $ | 0.15 | |
FAS 133 mark-to-market gains/(losses) | | 0.01 | | 0.01 | | (0.02 | ) | (0.01 | ) | (0.01 | ) | (0.01 | ) | (0.04 | ) | (0.05 | ) |
Currency transaction gains/(losses) | | (0.01 | ) | (0.01 | ) | 0.01 | | — | | (0.04 | ) | (0.03 | ) | — | | (0.02 | ) |
Net asset gains/(losses and impairments) | | (0.05 | ) | (0.05 | ) | — | | — | | — | | — | | — | | — | |
Debt retirement gains/(losses) | | — | | (0.01 | ) | — | | — | | — | | — | | (0.01 | ) | (0.01 | ) |
Diluted earnings (loss) per share from continuing operations | | $ | 0.14 | | $ | 0.04 | | $ | 0.20 | | $ | 0.13 | | $ | 0.10 | | $ | 0.16 | | $ | 0.12 | | $ | 0.07 | |
24
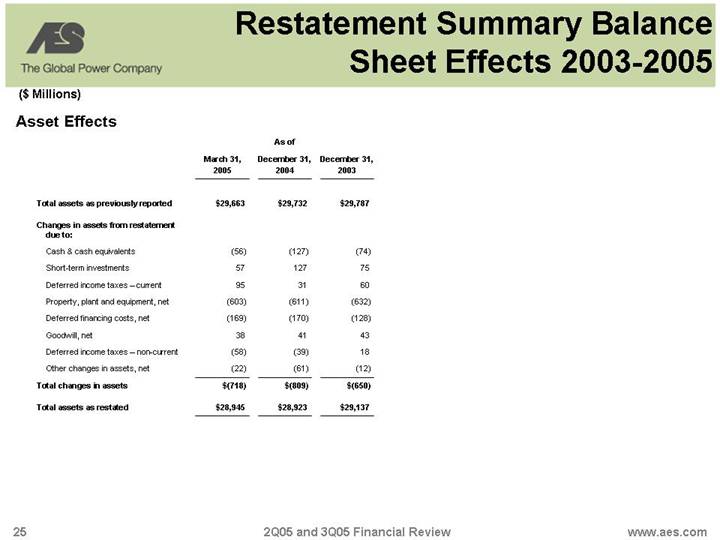
Restatement Summary Balance Sheet Effects 2003-2005
($ Millions)
Asset Effects
| | | | As of | | | |
| | March 31, | | December 31, | | December 31, | |
| | 2005 | | 2004 | | 2003 | |
| | | | | | | |
Total assets as previously reported | | $ | 29,663 | | $ | 29,732 | | $ | 29,787 | |
| | | | | | | |
Changes in assets from restatement due to: | | | | | | | |
Cash & cash equivalents | | (56 | ) | (127 | ) | (74 | ) |
Short-term investments | | 57 | | 127 | | 75 | |
Deferred income taxes – current | | 95 | | 31 | | 60 | |
Property, plant and equipment, net | | (603 | ) | (611 | ) | (632 | ) |
Deferred financing costs, net | | (169 | ) | (170 | ) | (128 | ) |
Goodwill, net | | 38 | | 41 | | 43 | |
Deferred income taxes – non-current | | (58 | ) | (39 | ) | 18 | |
Other changes in assets, net | | (22 | ) | (61 | ) | (12 | ) |
Total changes in assets | | $ | (718 | ) | $ | (809 | ) | $ | (650 | ) |
| | | | | | | |
Total assets as restated | | $ | 28,945 | | $ | 28,923 | | $ | 29,137 | |
25
($ Millions)
Liabilities and Stockholders’ Equity Effects
| | | | As of | | | |
| | March 31, | | December 31, | | December 31, | |
| | 2005 | | 2004 | | 2003 | |
| | | | | | | |
Total liabilities and minority interest as previously reported | | $ | 27,915 | | $ | 28,087 | | $ | 29,242 | |
| | | | | | | |
Changes in liabilities and minority interest from restatement due to: | | | | | | | |
Deferred income taxes | | 52 | | — | | (149 | ) |
Other long-term liabilities | | 109 | | 114 | | 119 | |
Minority interest | | (311 | ) | (326 | ) | (68 | ) |
Other changes in liabilities, net | | 87 | | 76 | | 61 | |
Total changes in liabilities and minority interest | | $ | (63 | ) | $ | (136 | ) | $ | (37 | ) |
| | | | | | | |
Total liabilities and minority interest as restated | | $ | 27,852 | | $ | 27,951 | | $ | 29,205 | |
| | | | | | | |
Total stockholders’ equity as previously reported | | $ | 1,748 | | $ | 1,645 | | $ | 545 | |
| | | | | | | |
Changes in stockholders’ equity from restatement due to: | | | | | | | |
Additional paid-in-capital | | 86 | | 82 | | 2 | |
Accumulated deficit | | (1,011 | ) | (1,002 | ) | (908 | ) |
Accumulated other comprehensive loss | | 270 | | 247 | | 293 | |
Total changes in stockholders’ equity | | $ | (655 | ) | $ | (673 | ) | $ | (613 | ) |
| | | | | | | |
Total stockholders’ equity as restated | | $ | 1,093 | | $ | 972 | | $ | (68 | ) |
26
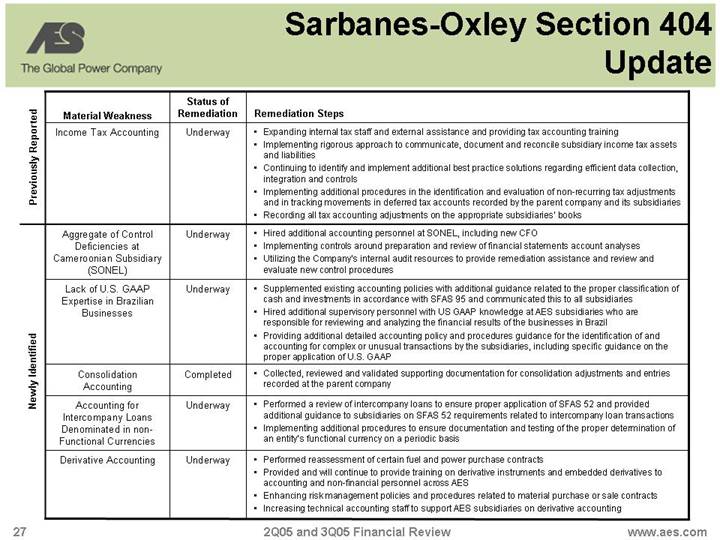
Sarbanes-Oxley Section 404 Update
| | Status of | | |
Material Weakness | | Remediation | | Remediation Steps |
Previously Reported | | | | |
| | | | |
Income Tax Accounting | | Underway | | • Expanding internal tax staff and external assistance and providing tax accounting training |
| | | | • Implementing rigorous approach to communicate, document and reconcile subsidiary income tax assets and liabilities |
| | | | • Continuing to identify and implement additional best practice solutions regarding efficient data collection, integration and controls |
| | | | • Implementing additional procedures in the identification and evaluation of non-recurring tax adjustments and in tracking movements in deferred tax accounts recorded by the parent company and its subsidiaries |
| | | | • Recording all tax accounting adjustments on the appropriate subsidiaries’ books |
| | | | |
Newly Identified | | | | |
| | | | |
Aggregate of Control
Deficiencies at
Cameroonian Subsidiary
(SONEL) | | Underway | | • Hired additional accounting personnel at SONEL, including new CFO |
| | | • Implementing controls around preparation and review of financial statements account analyses |
| | | • Utilizing the Company’s internal audit resources to provide remediation assistance and review and evaluate new control procedures |
| | | | |
Lack of U.S. GAAP
Expertise in Brazilian
Businesses | | Underway | | • Supplemented existing accounting policies with additional guidance related to the proper classification of cash and investments in accordance with SFAS 95 and communicated this to all subsidiaries |
| | | • Hired additional supervisory personnel with US GAAP knowledge at AES subsidiaries who are responsible for reviewing and analyzing the financial results of the businesses in Brazil |
| | | | • Providing additional detailed accounting policy and procedures guidance for the identification of and accounting for complex or unusual transactions by the subsidiaries, including specific guidance on the proper application of U.S. GAAP |
| | | | |
Consolidation
Accounting | | Completed | | • Collected, reviewed and validated supporting documentation for consolidation adjustments and entries recorded at the parent company |
| | | | |
Accounting for
Intercompany Loans
Denominated in non-
Functional Currencies | | Underway | | • Performed a review of intercompany loans to ensure proper application of SFAS 52 and provided additional guidance to subsidiaries on SFAS 52 requirements related to intercompany loan transactions |
| | |
| | | • Implementing additional procedures to ensure documentation and testing of the proper determination of an entity’s functional currency on a periodic basis |
| | | | |
Derivative Accounting | | Underway | | • Performed reassessment of certain fuel and power purchase contracts |
| | | | • Provided and will continue to provide training on derivative instruments and embedded derivatives to accounting and non-financial personnel across AES |
| | | | • Enhancing risk management policies and procedures related to material purchase or sale contracts |
| | | | • Increasing technical accounting staff to support AES subsidiaries on derivative accounting |
27
Second Quarter Subsidiary Distributions
($ Millions)
Second Quarter Subsidiary Distributions (1)
| | North | | Latin | | | | Europe, Middle | | | |
| | America | | America | | Asia | | East & Africa | | Total | |
| | | | | | | | | | | |
Regulated Utilities | | $ | 52 | | $ | — | | $ | — | | $ | 1 | | $ | 53 | |
| | | | | | | | | | | |
Contract Generation | | $ | 52 | | $ | 11 | | $ | — | | $ | 40 | | $ | 103 | |
| | | | | | | | | | | |
Competitive Supply | | $ | 6 | | $ | 5 | | $ | 3 | | $ | — | | $ | 14 | |
| | | | | | | | | | | |
Total* | | $ | 110 | | $ | 16 | | $ | 3 | | $ | 41 | | $ | 170 | |
91% of Second Quarter distributions were from North American Regulated Utilities and Worldwide Contract Generation.
(1) Non-GAAP measure. See Appendix.
28
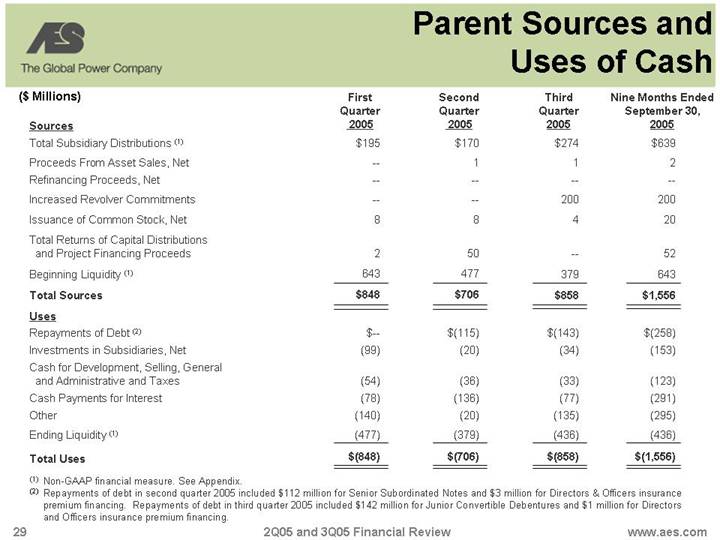
Parent Sources and Uses of Cash
($ Millions)
| | First | | Second | | Third | | Nine Months Ended | |
| | Quarter | | Quarter | | Quarter | | September 30, | |
| | 2005 | | 2005 | | 2005 | | 2005 | |
Sources | | | | | | | | | |
Total Subsidiary Distributions (1) | | $ | 195 | | $ | 170 | | $ | 274 | | $ | 639 | |
Proceeds From Asset Sales, Net | | — | | 1 | | 1 | | 2 | |
Refinancing Proceeds, Net | | — | | — | | — | | — | |
Increased Revolver Commitments | | — | | — | | 200 | | 200 | |
Issuance of Common Stock, Net | | 8 | | 8 | | 4 | | 20 | |
Total Returns of Capital Distributions and Project Financing Proceeds | | 2 | | 50 | | — | | 52 | |
Beginning Liquidity (1) | | 643 | | 477 | | 379 | | 643 | |
Total Sources | | $ | 848 | | $ | 706 | | $ | 858 | | $ | 1,556 | |
| | | | | | | | | |
Uses | | | | | | | | | |
Repayments of Debt (2) | | $ | — | | $ | (115 | ) | $ | (143 | ) | $ | (258 | ) |
Investments in Subsidiaries, Net | | (99 | ) | (20 | ) | (34 | ) | (153 | ) |
Cash for Development, Selling, General and Administrative and Taxes | | (54 | ) | (36 | ) | (33 | ) | (123 | ) |
Cash Payments for Interest | | (78 | ) | (136 | ) | (77 | ) | (291 | ) |
Other | | (140 | ) | (20 | ) | (135 | ) | (295 | ) |
Ending Liquidity (1) | | (477 | ) | (379 | ) | (436 | ) | (436 | ) |
Total Uses | | $ | (848 | ) | $ | (706 | ) | $ | (858 | ) | $ | (1,556 | ) |
(1) Non-GAAP financial measure. See Appendix.
(2) Repayments of debt in second quarter 2005 included $112 million for Senior Subordinated Notes and $3 million for Directors & Officers insurance premium financing. Repayments of debt in third quarter 2005 included $142 million for Junior Convertible Debentures and $1 million for Directors and Officers insurance premium financing.
29
Second Quarter Reconciliation of Changes to Debt Balances
($ Millions)
| | Debt | |
| | Reconciliation | |
Parent Debt (Including Letters of Credit) at 12/31/04 (1) | | $ | 5,250 | |
| | | |
Scheduled Debt Maturities | | — | |
Mandatory Debt Repayments | | — | |
Discretionary Debt Repayments: | | | |
Prepayment of Debt | | (112 | ) |
Other (2) | | 130 | |
Parent Debt (Including Letters of Credit) at 6/30/05 | | $ | 5,268 | |
Less: Letters of Credit Outstanding at 6/30/05 | | (235 | ) |
Parent Debt (Excluding Letters of Credit) at 6/30/05 | | $ | 5,033 | |
(1) Amounts reflect recourse debt of $5,152 million and $98 million of letters of credit under the parent revolver. Revolver availability at 6/30/05 was $215 million.
(2) Other includes $137 million increase in letters of credit and $10 million decrease due to foreign currency changes.
30
Third Quarter Reconciliation of Changes to Debt Balances
($ Millions)
| | Debt | |
| | Reconciliation | |
Parent Debt (Including Letters of Credit) at 12/31/04 (1) | | $ | 5,250 | |
| | | |
Scheduled Debt Maturities | | — | |
Mandatory Debt Repayments | | — | |
Discretionary Debt Repayments: | | | |
Prepayment of Debt | | (254 | ) |
Other (2) | | 259 | |
Parent Debt (Including Letters of Credit) at 9/30/05 | | $ | 5,255 | |
Less: Letters of Credit Outstanding at 9/30/05 | | (369 | ) |
Parent Debt (Excluding Letters of Credit) at 9/30/05 | | $ | 4,886 | |
(1) Amounts reflect recourse debt of $5,152 million and $98 million of letters of credit under the parent revolver. Revolver availability at 9/30/05 was $281 million.
(2) Other includes $271 million increase in letters of credit and $14 million decrease due to foreign currency changes.
31
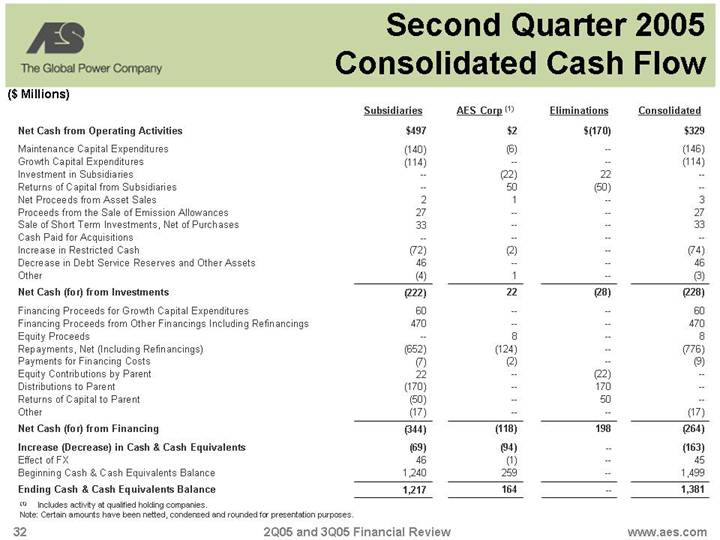
Second Quarter 2005 Consolidated Cash Flow
($ Millions)
| | Subsidiaries | | AES Corp (1) | | Eliminations | | Consolidated | |
| | | | | | | | | |
Net Cash from Operating Activities | | $ | 497 | | $ | 2 | | $ | (170 | ) | $ | 329 | |
| | | | | | | | | |
Maintenance Capital Expenditures | | (140 | ) | (6 | ) | — | | (146 | ) |
Growth Capital Expenditures | | (114 | ) | — | | — | | (114 | ) |
Investment in Subsidiaries | | — | | (22 | ) | 22 | | — | |
Returns of Capital from Subsidiaries | | — | | 50 | | (50 | ) | — | |
Net Proceeds from Asset Sales | | 2 | | 1 | | — | | 3 | |
Proceeds from the Sale of Emission Allowances | | 27 | | — | | — | | 27 | |
Sale of Short Term Investments, Net of Purchases | | 33 | | — | | — | | 33 | |
Cash Paid for Acquisitions | | — | | — | | — | | — | |
Increase in Restricted Cash | | (72 | ) | (2 | ) | — | | (74 | ) |
Decrease in Debt Service Reserves and Other Assets | | 46 | | — | | — | | 46 | |
Other | | (4 | ) | 1 | | — | | (3 | ) |
Net Cash (for) from Investments | | (222 | ) | 22 | | (28 | ) | (228 | ) |
| | | | | | | | | |
Financing Proceeds for Growth Capital Expenditures | | 60 | | — | | — | | 60 | |
Financing Proceeds from Other Financings Including Refinancings | | 470 | | — | | — | | 470 | |
Equity Proceeds | | — | | 8 | | — | | 8 | |
Repayments, Net (Including Refinancings) | | (652 | ) | (124 | ) | — | | (776 | ) |
Payments for Financing Costs | | (7 | ) | (2 | ) | — | | (9 | ) |
Equity Contributions by Parent | | 22 | | — | | (22 | ) | — | |
Distributions to Parent | | (170 | ) | — | | 170 | | — | |
Returns of Capital to Parent | | (50 | ) | — | | 50 | | — | |
Other | | (17 | ) | — | | — | | (17 | ) |
Net Cash (for) from Financing | | (344 | ) | (118 | ) | 198 | | (264 | ) |
| | | | | | | | | |
Increase (Decrease) in Cash & Cash Equivalents | | (69 | ) | (94 | ) | — | | (163 | ) |
Effect of FX | | 46 | | (1 | ) | — | | 45 | |
Beginning Cash & Cash Equivalents Balance | | 1,240 | | 259 | | — | | 1,499 | |
Ending Cash & Cash Equivalents Balance | | 1,217 | | 164 | | — | | 1,381 | |
| | | | | | | | | | | | | |
(1) Includes activity at qualified holding companies.
Note: Certain amounts have been netted, condensed and rounded for presentation purposes.
32
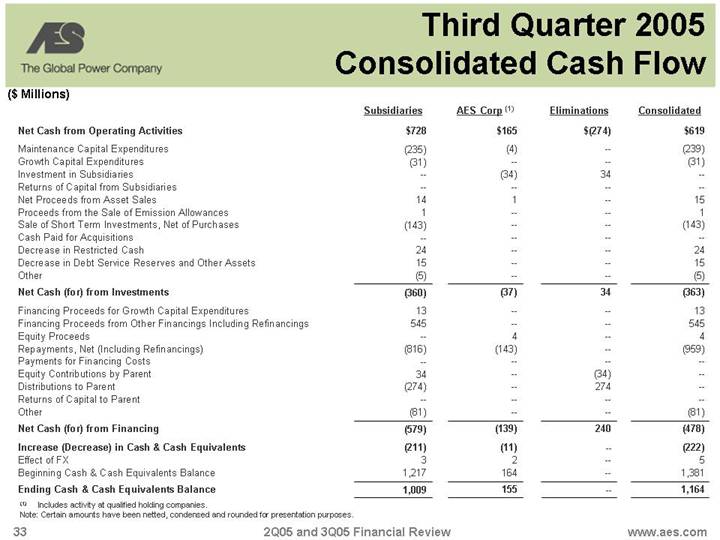
Third Quarter 2005 Consolidated Cash Flow
($ Millions)
| | Subsidiaries | | AES Corp (1) | | Eliminations | | Consolidated | |
| | | | | | | | | |
Net Cash from Operating Activities | | $ | 728 | | $ | 165 | | $ | (274 | ) | $ | 619 | |
| | | | | | | | | |
Maintenance Capital Expenditures | | (235 | ) | (4 | ) | — | | (239 | ) |
Growth Capital Expenditures | | (31 | ) | — | | — | | (31 | ) |
Investment in Subsidiaries | | — | | (34 | ) | 34 | | — | |
Returns of Capital from Subsidiaries | | — | | — | | — | | — | |
Net Proceeds from Asset Sales | | 14 | | 1 | | — | | 15 | |
Proceeds from the Sale of Emission Allowances | | 1 | | — | | — | | 1 | |
Sale of Short Term Investments, Net of Purchases | | (143 | ) | — | | — | | (143 | ) |
Cash Paid for Acquisitions | | — | | — | | — | | — | |
Decrease in Restricted Cash | | 24 | | — | | — | | 24 | |
Decrease in Debt Service Reserves and Other Assets | | 15 | | — | | — | | 15 | |
Other | | (5 | ) | — | | — | | (5 | ) |
Net Cash (for) from Investments | | (360 | ) | (37 | ) | 34 | | (363 | ) |
| | | | | | | | | |
Financing Proceeds for Growth Capital Expenditures | | 13 | | — | | — | | 13 | |
Financing Proceeds from Other Financings Including Refinancings | | 545 | | — | | — | | 545 | |
Equity Proceeds | | — | | 4 | | — | | 4 | |
Repayments, Net (Including Refinancings) | | (816 | ) | (143 | ) | — | | (959 | ) |
Payments for Financing Costs | | — | | — | | — | | — | |
Equity Contributions by Parent | | 34 | | — | | (34 | ) | — | |
Distributions to Parent | | (274 | ) | — | | 274 | | — | |
Returns of Capital to Parent | | — | | — | | — | | — | |
Other | | (81 | ) | — | | — | | (81 | ) |
Net Cash (for) from Financing | | (579 | ) | (139 | ) | 240 | | (478 | ) |
| | | | | | | | | |
Increase (Decrease) in Cash & Cash Equivalents | | (211 | ) | (11 | ) | — | | (222 | ) |
Effect of FX | | 3 | | 2 | | — | | 5 | |
Beginning Cash & Cash Equivalents Balance | | 1,217 | | 164 | | — | | 1,381 | |
Ending Cash & Cash Equivalents Balance | | 1,009 | | 155 | | — | | 1,164 | |
| | | | | | | | | | | | | |
(1) Includes activity at qualified holding companies.
Note: Certain amounts have been netted, condensed and rounded for presentation purposes.
33
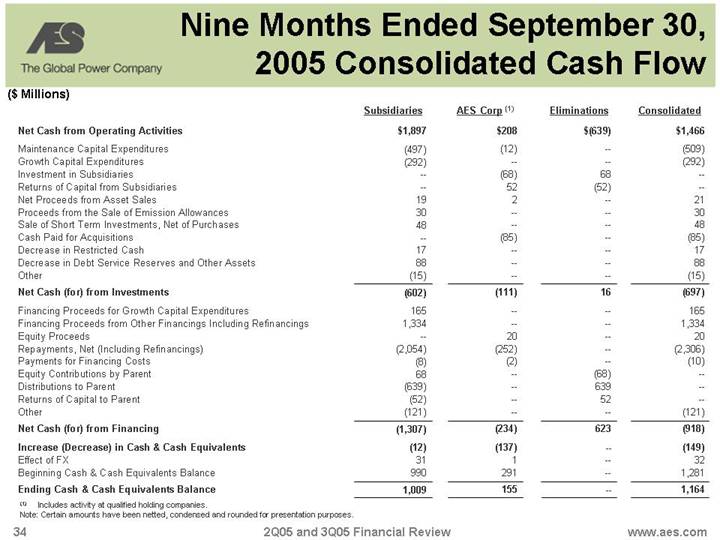
Nine Months Ended September 30, 2005 Consolidated Cash Flow
($ Millions)
| | Subsidiaries | | AES Corp (1) | | Eliminations | | Consolidated | |
| | | | | | | | | |
Net Cash from Operating Activities | | $ | 1,897 | | $ | 208 | | $ | (639 | ) | $ | 1,466 | |
| | | | | | | | | |
Maintenance Capital Expenditures | | (497 | ) | (12 | ) | — | | (509 | ) |
Growth Capital Expenditures | | (292 | ) | — | | — | | (292 | ) |
Investment in Subsidiaries | | — | | (68 | ) | 68 | | — | |
Returns of Capital from Subsidiaries | | — | | 52 | | (52 | ) | — | |
Net Proceeds from Asset Sales | | 19 | | 2 | | — | | 21 | |
Proceeds from the Sale of Emission Allowances | | 30 | | — | | — | | 30 | |
Sale of Short Term Investments, Net of Purchases | | 48 | | — | | — | | 48 | |
Cash Paid for Acquisitions | | — | | (85 | ) | — | | (85 | ) |
Decrease in Restricted Cash | | 17 | | — | | — | | 17 | |
Decrease in Debt Service Reserves and Other Assets | | 88 | | — | | — | | 88 | |
Other | | (15 | ) | — | | — | | (15 | ) |
Net Cash (for) from Investments | | (602 | ) | (111 | ) | 16 | | (697 | ) |
| | | | | | | | | |
Financing Proceeds for Growth Capital Expenditures | | 165 | | — | | — | | 165 | |
Financing Proceeds from Other Financings Including Refinancings | | 1,334 | | — | | — | | 1,334 | |
Equity Proceeds | | — | | 20 | | — | | 20 | |
Repayments, Net (Including Refinancings) | | (2,054 | ) | (252 | ) | — | | (2,306 | ) |
Payments for Financing Costs | | (8 | ) | (2 | ) | — | | (10 | ) |
Equity Contributions by Parent | | 68 | | — | | (68 | ) | — | |
Distributions to Parent | | (639 | ) | — | | 639 | | — | |
Returns of Capital to Parent | | (52 | ) | — | | 52 | | — | |
Other | | (121 | ) | — | | — | | (121 | ) |
Net Cash (for) from Financing | | (1,307 | ) | (234 | ) | 623 | | (918 | ) |
| | | | | | | | | |
Increase (Decrease) in Cash & Cash Equivalents | | (12 | ) | (137 | ) | — | | (149 | ) |
Effect of FX | | 31 | | 1 | | — | | 32 | |
Beginning Cash & Cash Equivalents Balance | | 990 | | 291 | | — | | 1,281 | |
Ending Cash & Cash Equivalents Balance | | 1,009 | | 155 | | — | | 1,164 | |
| | | | | | | | | | | | | |
(1) Includes activity at qualified holding companies.
Note: Certain amounts have been netted, condensed and rounded for presentation purposes.
34
Reconciliation of Subsidiary Distributions and Parent Liquidity
($ Millions)
Second and Third Quarter 2005 Reconciliation
| | Quarter Ended | | Six Months Ended | | Nine Months Ended | |
Total subsidiary distributions | | Sep. 30, | | June 30, | | March 31, | | Dec. 31, | | Sep. 30, | | June 30, | | Mar. 31, | | June 30, | | June 30, | | Sep. 30, | | Sep. 30, | |
& returns of capital to parent | | 2005 | | 2005 | | 2005 | | 2004 | | 2004 | | 2004 | | 2004 | | 2005 | | 2004 | | 2005 | | 2004 | |
| | | | | | | | | | | | | | | | | | | | | | | |
Subsidiary distributions to parent | | $ | 274 | | $ | 170 | | $ | 190 | | $ | 286 | | $ | 209 | | $ | 292 | | $ | 204 | | $ | 360 | | $ | 496 | | $ | 634 | | $ | 705 | |
Net distributions to/(from) QHCs | | — | | — | | 5 | | (9 | ) | 12 | | 10 | | — | | 5 | | 10 | | 5 | | 22 | |
Total subsidiary distributions | | 274 | | 170 | | 195 | | 277 | | 221 | | 302 | | 204 | | 365 | | 506 | | 639 | | 727 | |
| | | | | | | | | | | | | | | | | | | | | | | |
Returns of capital distributions to parent | | — | | 37 | | 2 | | 3 | | 110 | | — | | 3 | | 39 | | 3 | | 39 | | 113 | |
Net returns of capital distributions to/ (from) QHCs | | — | | 13 | | — | | — | | 11 | | — | | — | | 13 | | — | | 13 | | 11 | |
Total returns of capital distributions | | — | | 50 | | 2 | | 3 | | 121 | | — | | 3 | | 52 | | 3 | | 52 | | 124 | |
| | | | | | | | | | | | | | | | | | | | | | | |
Combined distributions & return of capital received | | 274 | | 220 | | 197 | | 280 | | 342 | | 302 | | 207 | | 417 | | 509 | | 691 | | 851 | |
Less: combined net distributions & returns of capital to/(from) QHCs | | — | | (13 | ) | (5 | ) | 9 | | (23 | ) | (10 | ) | — | | (18 | ) | (10 | ) | (18 | ) | (33 | ) |
Total subsidiary distributions & returns of capital to parent | | $ | 274 | | $ | 207 | | $ | 192 | | $ | 289 | | $ | 319 | | $ | 292 | | $ | 207 | | $ | 399 | | $ | 499 | | $ | 673 | | $ | 818 | |
| | Balance as of | | | | | | | | | | | | | | | |
| | Sep. 30, | | June 30, | | March 31, | | Dec. 31, | | | | | | | | | | | | | | | |
Liquidity | | 2005 | | 2005 | | 2005 | | 2004 | | | | | | | | | | | | | | | |
Cash at parent | | $ | 146 | | $ | 145 | | $ | 256 | | $ | 287 | | | | | | | | | | | | | | | |
Availability under revolver | | 281 | | 215 | | 218 | | 352 | | | | | | | | | | | | | | | |
Cash at QHCs | | 9 | | 19 | | 3 | | 4 | | | | | | | | | | | | | | | |
Ending liquidity | | 436 | | 379 | | 477 | | 643 | | | | | | | | | | | | | | | |
| | | | | | | | | | | | | | | | | | | | | | | | | | | |
See following page for further information.
35
Assumptions
Forecasted financial information is based on certain material assumptions. These assumptions include, but are not limited to continued normal levels of operating performance and electricity demand at our distribution companies and operational performance at our contract generation businesses consistent with historical levels.
The cash held at qualifying holding companies (QHCs) represents cash sent to subsidiaries of the company domiciled outside of the U.S. Such subsidiaries had no contractual restrictions on their ability to send cash to AES, the parent company. Cash at those subsidiaries was used for investment and related activities outside of the U.S. These investments included equity investments and loans to other foreign subsidiaries as well as development and general costs and expenses incurred outside the U.S. Since the cash held by these qualifying holding companies is available to the parent, AES uses the combined measure of subsidiary distributions to parent and qualified holding companies as a useful measure of cash available to the parent to meet its international liquidity needs.
AES believes that unconsolidated parent company liquidity is important to the liquidity position of AES as a parent company because of the non-recourse nature of most of AES’s indebtedness.
36
Definitions of Non-GAAP Measures
• Adjusted earnings per share (a non-GAAP financial measure), exclude from diluted earnings per share from continuing operations the effects of (i) gains or losses from mark-to-market accounting adjustments related to derivatives, (ii) certain foreign currency transaction gains and losses, (iii) significant impacts from net asset disposals or impairments, and(iv) early retirement of recourse debt. AES believes that adjusted earnings per share better reflects the underlying business performance of the Company, and are considered in the Company’s internal evaluation of financial performance. Factors in this determination include the variability associated with mark-to-market gains or losses related to certain derivative transactions, and periodic strategic decisions to dispose of certain assets which may influence results in a given period.
• Free cash flow – Net cash flow from operating activities less maintenance capital expenditures.
• Liquidity – Cash at the parent company plus availability under corporate revolver plus cash at qualifying holding companies (QHCs).
• Maintenance capital expenditures – reflect property additions less growth capital expenditures.
• Return on invested capital (ROIC) – Net operating profit after tax (NOPAT) divided by average capital. NOPAT is defined as income before tax and minority expense plus interest expense less income taxes less tax benefit on interest expense at effective tax rate. Average capital is defined as the average of beginning and ending total debt plus minority interest plus shareholders equity less debt service reserves.
• Subsidiary Distributions – Cash distributions (primarily dividends and interest income) from subsidiary companies to the parent company and qualified holding companies. These cash flows are the source of cash flow to the parent to meet corporate interest, overhead, cash taxes, and discretionary uses such as recourse debt reductions and corporate investments.
37
Reconciliation of Cash Flow Items
Reconciliation of Net Cash from Operating Activities ($ Millions)
| | | | AES Corp & | | | | | |
| | Subsidiaries | | QHCs (1) | | Eliminations | | Consolidated | |
| | | | | | | | | |
Second Quarter 2005 | | $ | 497 | | $ | 2 | | $ | (170 | ) | $ | 329 | |
| | | | | | | | | |
Six Months Ended June 30, 2005 | | $ | 1,169 | | $ | 43 | | $ | (365 | ) | $ | 847 | |
| | | | | | | | | |
Third Quarter 2005 | | $ | 728 | | $ | 165 | | $ | (274 | ) | $ | 619 | |
| | | | | | | | | |
Nine Months Ended September 30, 2005 | | $ | 1,897 | | $ | 208 | | $ | (639 | ) | $ | 1,466 | |
(1) Includes qualified holding companies.
Reconciliation of Free Cash Flow ($Millions)
| | | | Nine Months Ended | | | | | | Six Months Ended | | | | | |
| | 2005 | | September 30, | | Third Quarter | | June 30, | | Second Quarter | |
| | Guidance | | 2005 | | 2004 | | 2005 | | 2004 | | 2005 | | 2004 | | 2005 | | 2004 | |
| | | | | | | | | | | | | | | | | | | |
Free Cash Flow | | $1,200 to 1,300 | | $ | 957 | | $ | 754 | | $ | 380 | | $ | 375 | | $ | 577 | | $ | 379 | | $ | 183 | | $ | 100 | |
| | | | | | | | | | | | | | | | | | | | | | | | | | | |
Maintenance Capital Expenditures | | $600 to 700 | | $ | 509 | | $ | 363 | | $ | 239 | | $ | 129 | | $ | 270 | | $ | 234 | | $ | 146 | | $ | 112 | |
| | | | | | | | | | | | | | | | | | | |
Net Cash Provided by Operating Activities | | $1,900 to 2,000 | | $ | 1,466 | | $ | 1,117 | | $ | 619 | | $ | 504 | | $ | 847 | | $ | 613 | | $ | 329 | | $ | 212 | |
38
Second Quarter Calculation of Return on Invested Capital
($ Millions except percent)
Net Operating Profit After Tax (1) | | Third
Quarter
2004 | | Fourth
Quarter
2004 | | First
Quarter
2005 | | Second
Quarter
2005 | | Rolling Twelve
Months
Second Quarter
2005 | |
| | | | | | | | | | | |
IBT&MI | | $ | 251 | | $ | 218 | | $ | 377 | | $ | 186 | | $ | 1,032 | |
| | | | | | | | | | | | | | | | |
Reported Interest Expense | | 478 | | 492 | | 467 | | 475 | | 1,912 | |
| | | | | | | | | | | |
Income Tax Expense (2) | | 372 | | 505 | | 329 | | 291 | | 1,461 | |
| | | | | | | | | | | |
Net Operating Profit After Tax | | 357 | | 205 | | 515 | | 370 | | 1,483 | |
| | | | | | | | | | | |
Effective Tax Rate (3) | | 51 | % | 71 | % | 39 | % | 44 | % | 50 | % |
| | | | | | | | | | | |
ROIC (4) | | | | | | | | | | 7.4 | % |
| | Second | | Second | |
| | Quarter | | Quarter | |
Total Capital (5) | | 2004 | | 2005 | |
| | | | | |
Total Debt | | $ | 18,343 | | $ | 18,245 | |
| | | | | |
Minority Interest | | 960 | | 1,430 | |
| | | | | |
Stockholders’ Equity | | 1,402 | | 1,228 | |
| | | | | |
Debt Service Reserves and Other Deposits | | 615 | | 634 | |
| | | | | |
Total Capital | | $ | 20,090 | | $ | 20,269 | |
| | | | | |
Average Capital (6) | | | | | $ | 20,180 | |
(1) Net operating profit after tax, a non-GAAP financial measure, is defined as income before tax and minority interest expense (IBT&MI) plus interest expense less income taxes less tax benefit on interest expense at the effective tax rate.
(2) Income tax expense calculated by multiplying the sum of IBT&MI and reported interest expense for the period by the effective tax rate for the period.
(3) Effective tax rate calculated by dividing reported income tax expense for the period by IBT&MI for the period.
(4) Return on invested capital (ROIC), a non-GAAP financial measure, is defined as net operating profit after tax divided by average capital calculated over rolling 12 month basis.
(5) Total capital, a non-GAAP financial measure, is defined as total debt plus minority interest plus stockholders’ equity less debt service reserves.
(6) Average capital is defined as the average of beginning and ending total capital over the last twelve months.
39
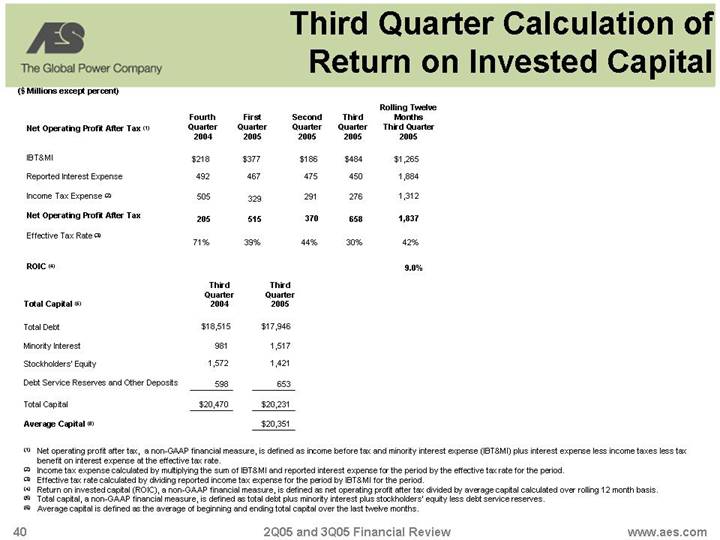
Third Quarter Calculation of Return on Invested Capital
($ Millions except percent)
Net Operating Profit After Tax (1) | | Fourth
Quarter
2004 | | First
Quarter
2005 | | Second
Quarter
2005 | | Third
Quarter
2005 | | Rolling Twelve
Months
Third Quarter
2005 | |
| | | | | | | | | | | |
IBT&MI | | $ | 218 | | $ | 377 | | $ | 186 | | $ | 484 | | $ | 1,265 | |
| | | | | | | | | | | |
Reported Interest Expense | | 492 | | 467 | | 475 | | 450 | | 1,884 | |
| | | | | | | | | | | |
Income Tax Expense (2) | | 505 | | 329 | | 291 | | 276 | | 1,312 | |
| | | | | | | | | | | |
Net Operating Profit After Tax | | 205 | | 515 | | 370 | | 658 | | 1,837 | |
| | | | | | | | | | | |
Effective Tax Rate (3) | | 71 | % | 39 | % | 44 | % | 30 | % | 42 | % |
| | | | | | | | | | | |
ROIC (4) | | | | | | | | | | 9.0 | % |
| | | | | | | | | | | | | | | | |
| | Third | | Third | |
| | Quarter | | Quarter | |
Total Capital (5) | | 2004 | | 2005 | |
| | | | | |
Total Debt | | $ | 18,515 | | $ | 17,946 | |
| | | | | |
Minority Interest | | 981 | | 1,517 | |
| | | | | |
Stockholders’ Equity | | 1,572 | | 1,421 | |
| | | | | |
Debt Service Reserves and Other Deposits | | 598 | | 653 | |
| | | | | |
Total Capital | | $ | 20,470 | | $ | 20,231 | |
| | | | | |
Average Capital (6) | | | | | $ | 20,351 | |
(1) Net operating profit after tax, a non-GAAP financial measure, is defined as income before tax and minority interest expense (IBT&MI) plus interest expense less income taxes less tax benefit on interest expense at the effective tax rate.
(2) Income tax expense calculated by multiplying the sum of IBT&MI and reported interest expense for the period by the effective tax rate for the period.
(3) Effective tax rate calculated by dividing reported income tax expense for the period by IBT&MI for the period.
(4) Return on invested capital (ROIC), a non-GAAP financial measure, is defined as net operating profit after tax divided by average capital calculated over rolling 12 month basis.
(5) Total capital, a non-GAAP financial measure, is defined as total debt plus minority interest plus stockholders’ equity less debt service reserves.
(6) Average capital is defined as the average of beginning and ending total capital over the last twelve months.
40