Exhibit 99.3

Link to searchable text of slide shown above
Link to searchable text of slide shown above
Link to searchable text of slide shown above
Link to searchable text of slide shown above
Link to searchable text of slide shown above
Link to searchable text of slide shown above
Link to searchable text of slide shown above

Link to searchable text of slide shown above

Link to searchable text of slide shown above

Link to searchable text of slide shown above
Link to searchable text of slide shown above
Link to searchable text of slide shown above
Link to searchable text of slide shown above

Link to searchable text of slide shown above
Link to searchable text of slide shown above
Link to searchable text of slide shown above
Link to searchable text of slide shown above

Link to searchable text of slide shown above
Link to searchable text of slide shown above
Link to searchable text of slide shown above
Link to searchable text of slide shown above
Link to searchable text of slide shown above

Link to searchable text of slide shown above

Link to searchable text of slide shown above

Link to searchable text of slide shown above
Link to searchable text of slide shown above
Link to searchable text of slide shown above
Link to searchable text of slide shown above
Link to searchable text of slide shown above
Searchable text section of graphics shown above
AES Investor Presentation
AES CORPORATION
[GRAPHIC]
January 19, 2006
Safe Harbor Disclosure
Certain statements in the following presentation regarding AES’s business operations may constitute “forward looking statements.” Such forward-looking statements include, but are not limited to, those related to future earnings, growth and financial and operating performance. Forward-looking statements are not intended to be a guarantee of future results, but instead constitute AES’s current expectations based on reasonable assumptions. Forecasted financial information is based on certain material assumptions. These assumptions include, but are not limited to continued normal or better levels of operating performance and electricity demand at our distribution companies and operational performance at our contract generation businesses consistent with historical levels, as well as achievements of planned productivity improvements and incremental growth from investments at investment levels and rates of return consistent with prior experience. For additional assumptions see the Appendix to this presentation. Actual results could differ materially from those projected in our forward-looking statements due to risks, uncertainties and other factors. Important factors that could affect actual results are discussed in AES’s filings with the Securities and Exchange Commission, including, but not limited to the risks discussed under the caption “Cautionary Statements and Risk Factors” in the Company’s 2004 Annual Report on Form 10-K/A, as well as our other SEC filings. AES undertakes no obligation to update or revise any forward-looking statements, whether as a result of new information, future events or otherwise.
www.aes.com
2
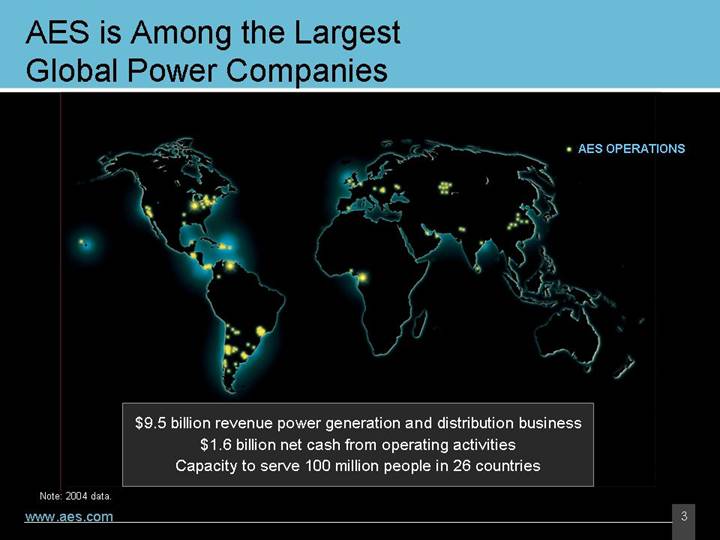
AES is Among the Largest Global Power Companies
[GRAPHIC]
$9.5 billion revenue power generation and distribution business
$1.6 billion net cash from operating activities
Capacity to serve 100 million people in 26 countries
Note: 2004 data.
3
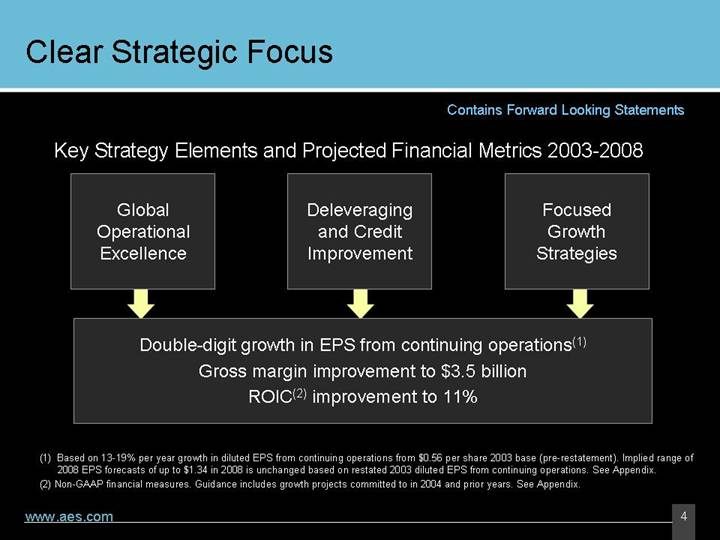
Clear Strategic Focus
Contains Forward Looking Statements
Key Strategy Elements and Projected Financial Metrics 2003-2008
Global
Operational
Excellence | | Deleveraging
and Credit
Improvement | | Focused
Growth
Strategies | |
Double-digit growth in EPS from continuing operations(1)
Gross margin improvement to $3.5 billion
ROIC(2) improvement to 11%
(1) Based on 13-19% per year growth in diluted EPS from continuing operations from $0.56 per share 2003 base (pre-restatement). Implied range of 2008 EPS forecasts of up to $1.34 in 2008 is unchanged based on restated 2003 diluted EPS from continuing operations. See Appendix.
(2) Non-GAAP financial measures. Guidance includes growth projects committed to in 2004 and prior years. See Appendix.
4
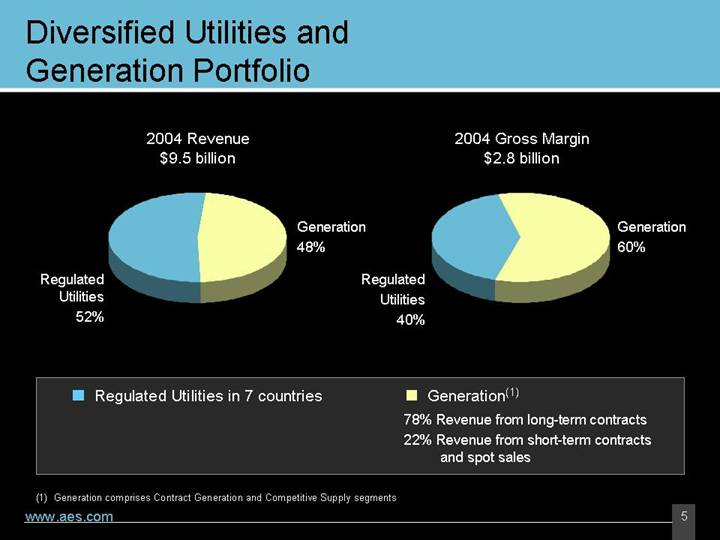
Diversified Utilities and Generation Portfolio
2004 Revenue
$9.5 billion | | 2004 Gross Margin
$2.8 billion |
| | |
[CHART] | | [CHART] |
• Regulated Utilities in 7 countries | | • Generation(1) | |
| | 78% Revenue from long-term contracts | |
| | 22% Revenue from short-term contracts and spot sales | |
| | | |
(1) Generation comprises Contract Generation and Competitive Supply segments
5
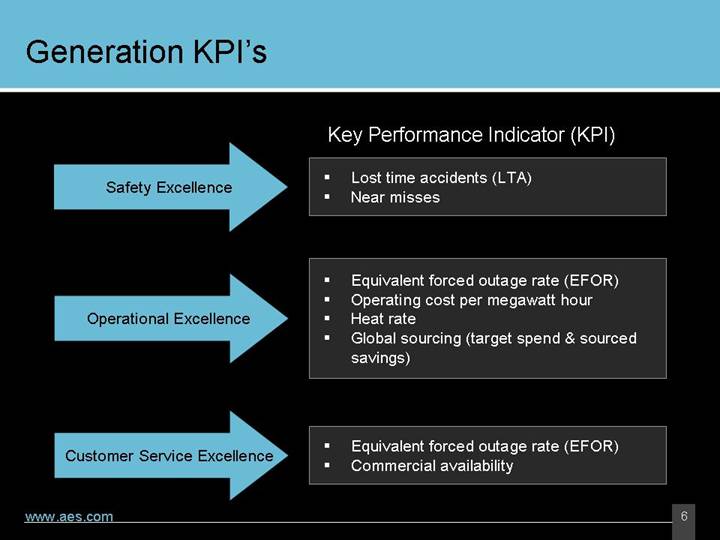
Generation KPI’s
| | Key Peformance Indicator (KPI) |
| | |
| | • Lost time accidents (LTA) |
Safety Excellence | | • Near misses |
| | |
Operational Excellence | | • Equivalent forced outage rate (EFOR) • Operating cost per megawatt hour • Heat rate • Global sourcing (target spend & sourced savings) |
| | |
Customer Service Excellence | | • Equivalent forced outage rate (EFOR) • Commercial availability |
6
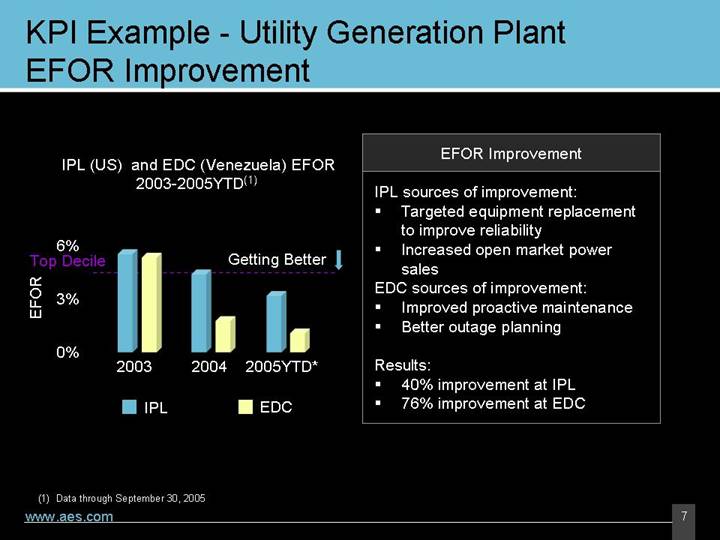
KPI Example - Utility Generation Plant EFOR Improvement
IPL (US) and EDC (Venezuela) EFOR
2003-2005YTD(1) |
[CHART]
EFOR Improvement |
|
IPL sources of improvement: |
• Targeted equipment replacement to improve reliability |
• Increased open market power sales |
|
EDC sources of improvement: |
• Improved proactive maintenance |
• Better outage planning |
|
Results: |
• 40% improvement at IPL |
• 76% improvement at EDC |
(1) Data through September 30, 2005
7
Utility KPI’s
| Key Performance Indicator (KPI) |
| | |
| • | Lost time accidents (LTA) |
Safety Excellence | • | Near misses |
| • | Public safety |
| | |
| • | Losses rate |
Operational Excellence | • | Collections rate |
| • | O&M per customer |
| • | Overhead per customer |
| | |
| • | System interruption frequency (SAIFI) |
Customer Service Excellence | • | System interruption duration (SAIDI) |
| • | Customer satisfaction surveys |
8
Utility KPI Example - El Salvador O&M per Customer
El Salvador O&M per Customer
2003-2005YTD(1)
[CHART]
El Salvador O&M Cost Reduction
• Four distribution companies serving almost 1 million customers
Sources of improvement:
• Integrating four distribution companies to gain synergies
• Implemented rigorous work management process to streamline maintenance and improve workforce efficiency
• Feeder level analysis to optimize investments and asset importance
Results: 21% unit O&M cost reduction
(1) Data through September 30, 2005
9
Utility KPI Examples - Argentina Losses
Eden Total Loss Rate
2003-2005YTD(1)
[CHART]
Eden Total Loss Rate Reduction
• Distribution company serving almost 300,000 customers
Sources of improvement:
• Increased proactive contact with customers possibly committing fraud
• 100% increase in letters sent to bad debtors
• �� More aggressive and targeted disconnection effort and use of collection agents
Results: 27% total loss rate reduction
(1) Data through September 30, 2005
10
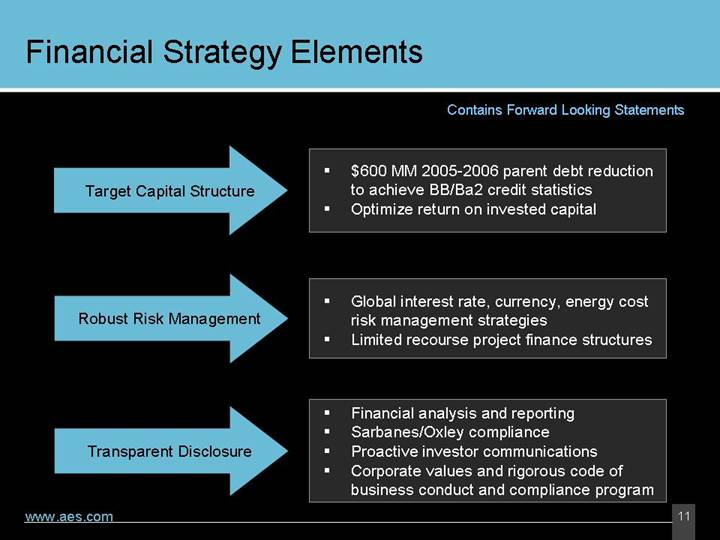
Financial Strategy Elements
Contains Forward Looking Statements
Target Capital Structure | • | $600 MM 2005-2006 parent debt reduction to achieve BB credit statistics |
• | Optimize return on invested capital |
| | |
| | |
Robust Risk Management | • | Global interest rate, currency, energy cost risk management strategies |
• | Limited recourse project finance structures |
| | |
Transparent Disclosure | • | Financial analysis and reporting |
• | Sarbanes/Oxley compliance |
• | Proactive investor communications |
• | Corporate values and rigorous code of business conduct and compliance program |
11
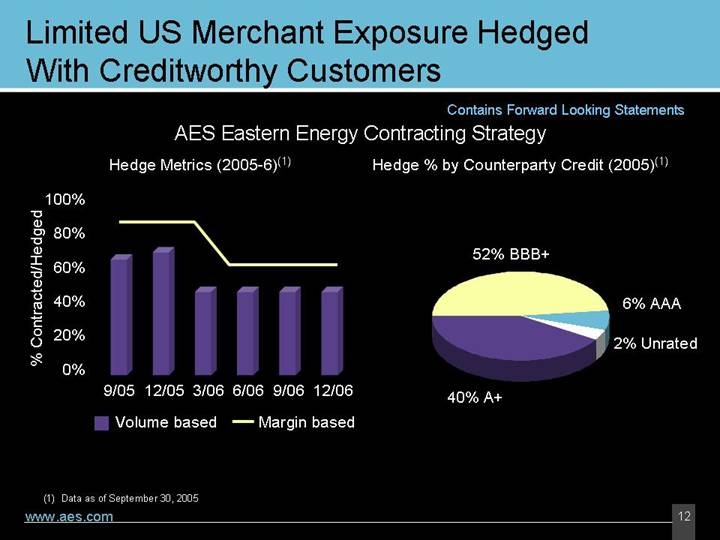
Limited US Merchant Exposure Hedged With Creditworthy Customers
Contains Forward Looking Statements
AES Eastern Energy Contracting Strategy
Hedge Metrics (2005-6)(1) | | Hedge % by Counterparty Credit (2005)(1) |
| | |
[CHART] | | [CHART] |
(1) Data as of September 30, 2005
12
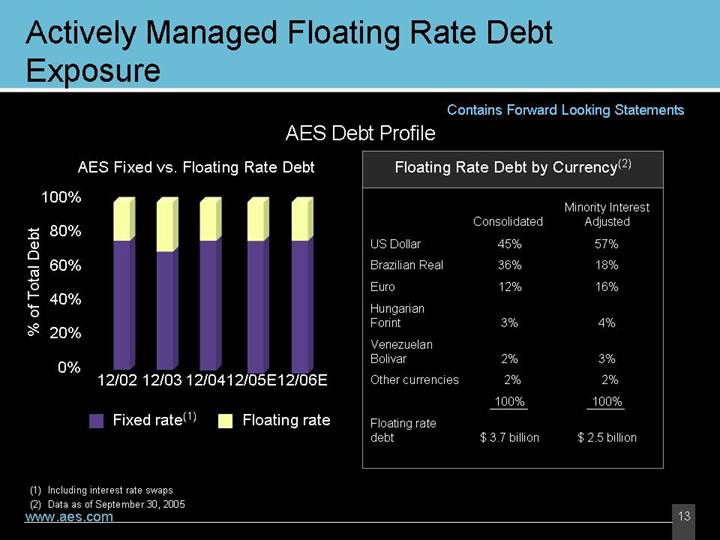
Actively Managed Floating Rate Debt Exposure
Contains Forward Looking Statements
AES Debt Profile
AES Fixed vs. Floating Rate Debt
[CHART]
Floating Rate Debt by Currency(2)
| | | | Minority Interest | |
| | Consolidated | | Adjusted | |
US Dollar | | 45 | % | 57 | % |
Brazilian Real | | 36 | % | 18 | % |
Euro | | 12 | % | 16 | % |
Hungarian Forint | | 3 | % | 4 | % |
Venezuelan Bolivar | | 2 | % | 3 | % |
Other currencies | | 2 | % | 2 | % |
| | 100 | % | 100 | % |
Floating rate debt | | $ | 3.7 billion | | $ | 2.5 billion | |
| | | | | | | |
(1) Including interest rate swaps
(2) Data as of September 30, 2005
13
Measuring Improvement through Gross Margin and Return on Invested Capital
Performance Drivers | | |
| | |
Generation | | Utilities | | |
| | | | |
New Contracted Capacity | | Tariff Process Management | | |
| | | | |
Competitive Supply Dispatch | | Demand Growth (non-US) | Revenues | |
| | | | |
Reduce EFOR | | Reduce Commercial Losses | Gross | |
| | | Margin | |
Optimize Operating & Sourcing Costs
Fuel Purchase Risk Management | Operating
Costs | |
| | |
| | |
Overhead Cost Management
Currency and Other Risk Management | Below Gross
Margin | ROIC |
| | |
| | |
Working Capital and Debt Reduction
Asset Utilization | Asset
Management | |
14
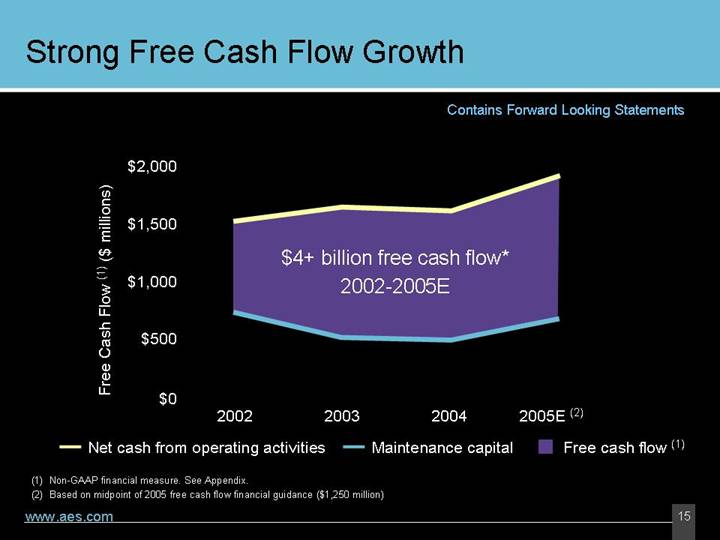
Strong Free Cash Flow Growth
Contains Forward Looking Statements
[CHART]
(1) Non-GAAP financial measure. See Appendix.
(2) Based on midpoint of 2005 free cash flow financial guidance ($1,250 million)
15
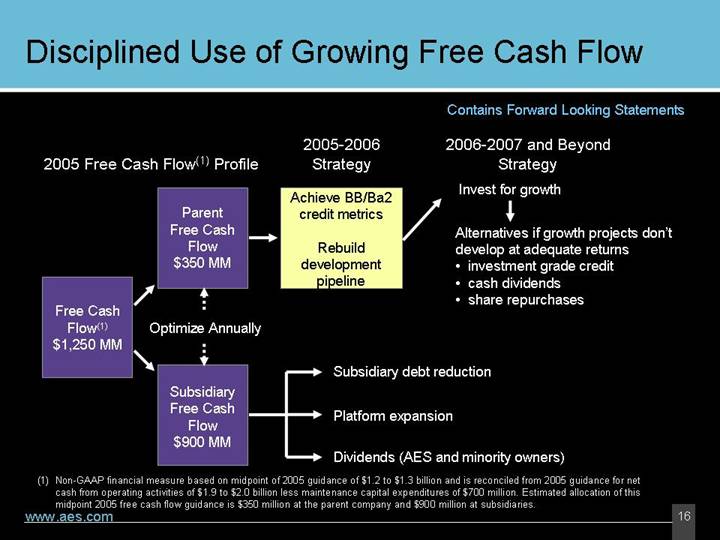
Disciplined Use of Growing Free Cash Flow
| | | Contains Forward Looking Statements |
| | | |
| | 2005-2006 | 2006-2007 and Beyond | |
2005 Free Cash Flow(1) Profile | Strategy | Strategy | |
| | | | |
| | Achieve BB/Ba2 | Invest for growth | |
| Parent | credit metrics | |
| Free Cash
Flow
$350 MM |
Rebuild
development
pipeline
| Alternatives if growth projects don’t develop at adequate returns
• investment grade credit
• cash dividends
• share repurchases |
Free Cash | | | |
Flow(1) | Optimize Annually | | |
$1,250 MM | | | |
| | Subsidiary debt reduction | |
| Subsidiary | | |
| Free Cash | Platform expansion | |
| Flow | | |
| $900 MM | Dividends (AES and minority owners) | |
| | | | | |
(1) Non-GAAP financial measure based on midpoint of 2005 guidance of $1.2 to $1.3 billion and is reconciled from 2005 guidance for net cash from operating activities of $1.9 to $2.0 billion less maintenance capital expenditures of $700 million. Estimated allocation of this midpoint 2005 free cash flow guidance is $350 million at the parent company and $900 million at subsidiaries.
16
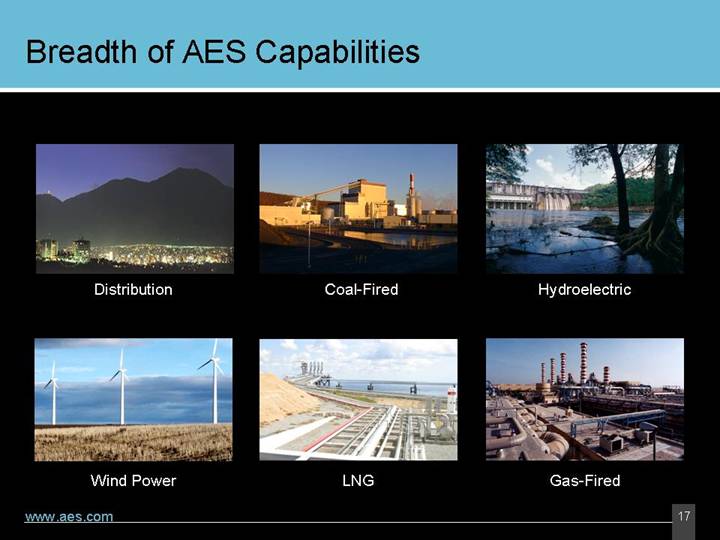
Breadth of AES Capabilities
[GRAPHIC] | | [GRAPHIC] | | [GRAPHIC] |
| | | | |
Distribution | | Coal-Fired | | Hydroelectric |
| | | | |
| | | | |
[GRAPHIC] | | [GRAPHIC] | | [GRAPHIC] |
| | | | |
Wind Power | | LNG | | Gas-Fired |
17
Rebuilding Development Pipeline
Contains Forward Looking Statements
Deep Development Pipeline Supports Sustained Growth
4-6 Years for Greenfield Projects
3-4 Years for Wind Projects
Development
Milestones | | Market
Assessment/
Feasibility Study | | Negotiations/
Permits/
RFP | | Purchase
Agreement | | Project
Financing | | Construction |
| | | | | | | | | | |
Current Activity | | 38 Countries | | 6 Countries | | 1 Country | | 2 Countries | | 3 Countries |
| | | | | | | | | | |
| | Central America | | Bahamas | | Chile | | Bulgaria | | Chile |
Examples of | | China | | Romania | | | | Panama | | Spain |
Current | | Eastern Europe | | El Salvador | | | | | | US |
Portfolio | | India | | Middle East | | | | | | |
Development | | Pakistan | | US | | | | | | |
Activity | | South Africa | | Vietnam | | | | | | |
| | US | | | | | | | | |
18
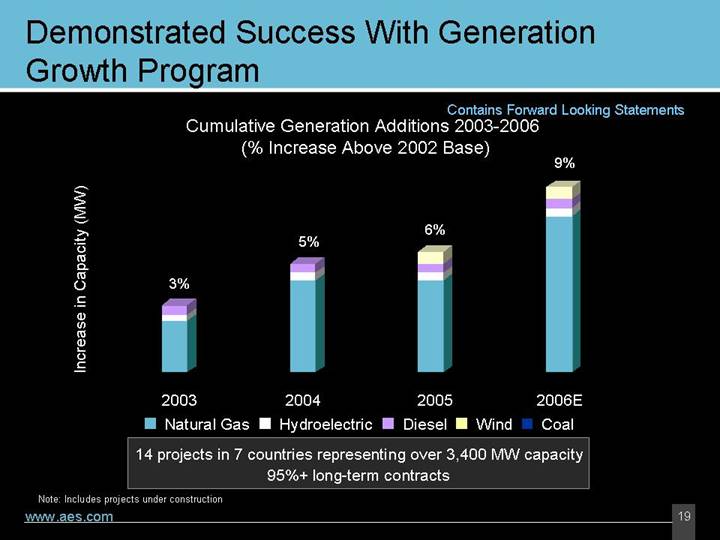
Demonstrated Success With Generation Growth Program
Contains Forward Looking Statements
Cumulative Generation Additions 2003-2006
(% Increase Above 2002 Base)
[CHART]
14 projects in 7 countries representing over 3,400 MW capacity
95%+ long-term contracts
Note: Includes projects under construction
19
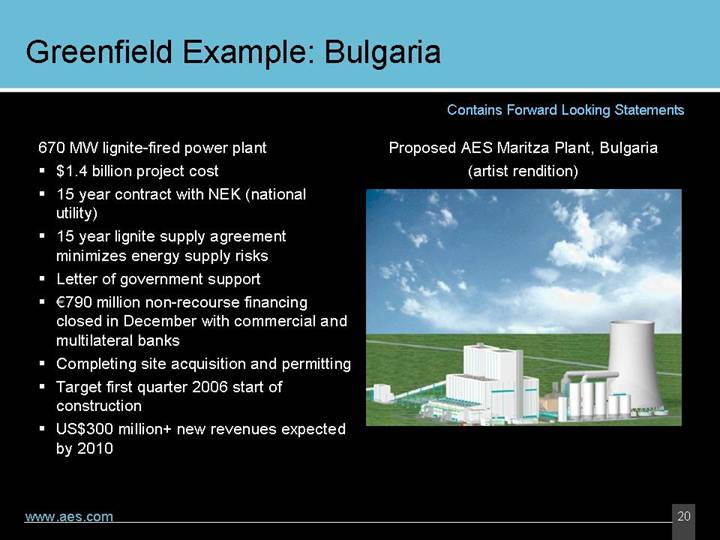
Greenfield Example: Bulgaria
Contains Forward Looking Statements
670 MW lignite-fired power plant
• $1.4 billion project cost
• 15 year contract with NEK (national utility)
• 15 year lignite supply agreement minimizes energy supply risks
• Letter of government support
• €790 million non-recourse financing closed in December with commercial and multilateral banks
• Completing site acquisition and permitting
• Target first quarter 2006 start of construction
• US$300 million+ new revenues expected by 2010
Proposed AES Maritza Plant, Bulgaria
(artist rendition)
[CHART]
20
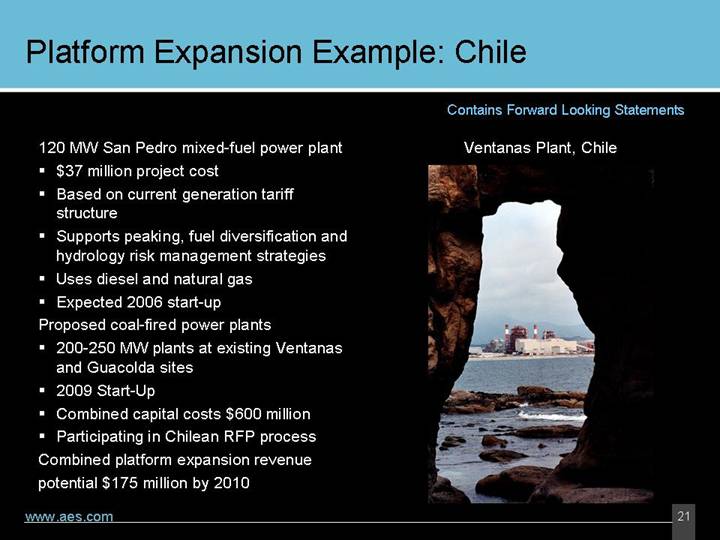
Platform Expansion Example: Chile
Contains Forward Looking Statements
120 MW San Pedro mixed-fuel power plant • $37 million project cost |
• Based on current generation tariff structure |
• Supports peaking, fuel diversification and hydrology risk management strategies |
• Uses diesel and natural gas |
• Expected 2006 start-up |
Proposed coal-fired power plants |
• 200-250 MW plants at existing Ventanas and Guacolda sites |
• 2009 Start-Up |
• Combined capital costs $600 million |
• Participating in Chilean RFP process |
Combined platform expansion revenue potential $175 million by 2010 |
Ventanas Plant, Chile
[GRAPHIC]
21
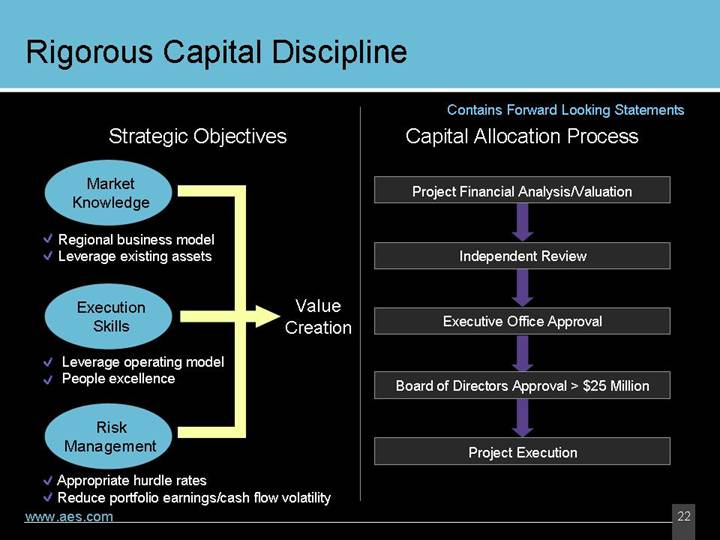
Rigorous Capital Discipline
| | Contains Forward Looking Statements |
| | |
Strategic Objectives | | Capital Allocation Process |
| | |
Market Knowledge | | Project Financial Analysis/Valuation |
| | |
• Regional business model • Leverage existing assets | | Independent Review |
| | |
Execution Skills | Value
Creation | Executive Office Approval |
| | |
• Leverage operating model • People excellence | | Board of Directors Approval > $25 Million |
| | |
Risk Management | | Project Execution |
| | |
• Appropriate hurdle rates | | |
• Reduce portfolio earnings/cash flow volatility | |
22
Key Takeaways
| | Contains Forward Looking Statements |
| | |
[GRAPHIC] | • | Global power market offers sizeable growth opportunities |
| | • AES well positioned to capitalize on these opportunities |
| | • Investment discipline firmly established |
[GRAPHIC] | • | Strong AES financial metrics |
| | • Margin expansion |
| | • ROIC improvement |
| | • Growing free cash flow |
[GRAPHIC] | | • Improving credit quality |
| | • Double digit EPS growth |
| • | Incentives aligned with investors |
| | • Stock performance (options) |
| | • Free cash flow growth (performance units) |
| | • Other performance metrics (restricted stock) |
23
AES: The power of being global.
[GRAPHIC]
Thank you.
Appendix - Assumptions
Forecasted financial information is based on certain material assumptions. Such assumptions include, but are not limited to: 1) no unforeseen external events such as wars, depressions, or economic or political disruptions occur; 2) businesses continue to operate in a manner consistent with or better than prior operating performance, including achievement of planned productivity improvements including benefits of global sourcing, and in accordance with the provisions of their relevant contracts or concessions; 3) new business opportunities are available to AES in sufficient quantity so that AES can capture its historical market share; 4) no major disruptions or discontinuities occur in GDP, foreign exchange rates, inflation or interest rates during the forecast period; 5) negative factors do not combine to create highly negative low-probability business situations; 6) business-specific risks as described in the Company’s SEC filings do not occur.
In addition, benefits from global sourcing include avoided costs, reduction in capital project costs versus budgetary estimates, and projected savings based on assumed spend volume which may or may not actually be achieved. These benefits will not be fully reflected in the Company’s consolidated financial results.
25
Appendix - Definitions
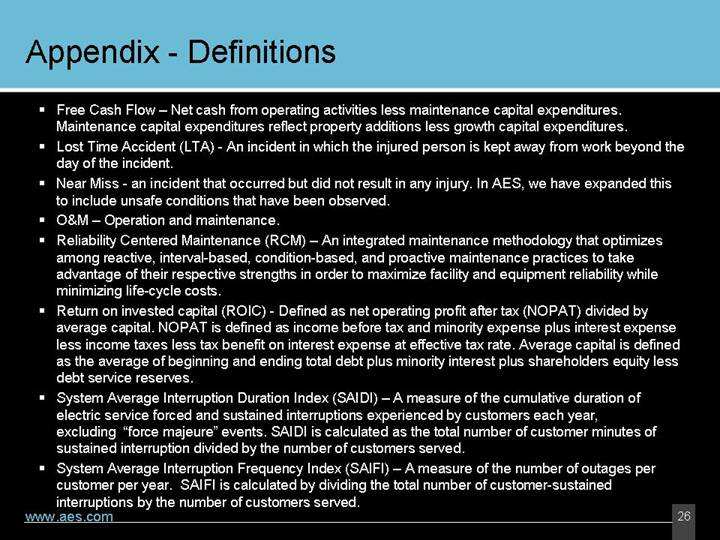
• Free cash flow – Net cash from operating activities less maintenance capital expenditures. Maintenance capital expenditures reflect property additions less growth capital expenditures.
• Lost Time Accident (LTA) - An incident in which the injured person is kept away from work beyond the day of the incident.
• Near Miss - an incident that occurred but did not result in any injury. In AES, we have expanded this to include unsafe conditions that have been observed.
• O&M – Operation and maintenance.
• Reliability Centered Maintenance (RCM) – An integrated maintenance methodology that optimizes among reactive, interval-based, condition-based, and proactive maintenance practices to take advantage of their respective strengths in order to maximize facility and equipment reliability while minimizing life-cycle costs.
• Return on invested capital (ROIC) - Defined as net operating profit after tax (NOPAT) divided by average capital. NOPAT is defined as income before tax and minority expense plus interest expense less income taxes less tax benefit on interest expense at effective tax rate. Average capital is defined as the average of beginning and ending total debt plus minority interest plus shareholders equity less debt service reserves.
• System Average Interruption Duration Index (SAIDI) – A measure of the cumulative duration of electric service forced and sustained interruptions experienced by customers each year, excluding “force majeure” events. SAIDI is calculated as the total number of customer minutes of sustained interruption divided by the number of customers served.
• System Average Interruption Frequency Index (SAIFI) – A measure of the number of outages per customer per year. SAIFI is calculated by dividing the total number of customer-sustained interruptions by the number of customers served.
26
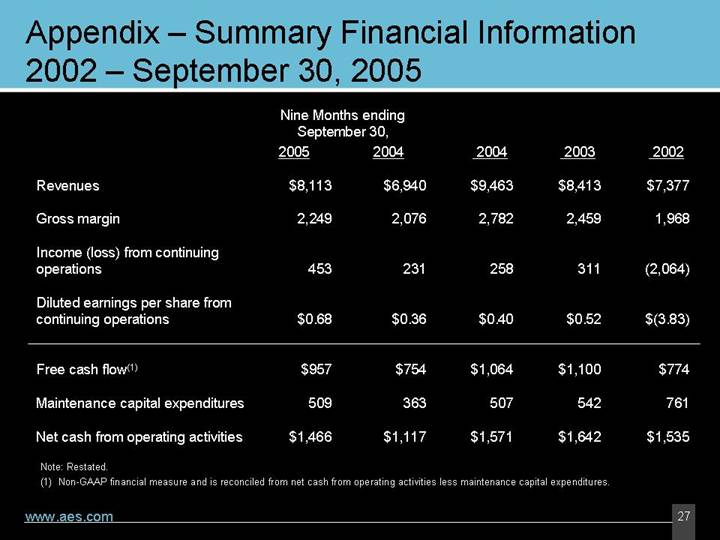
Appendix – Summary Financial Information 2002 – September 30, 2005
| | Nine Months ending
September 30, | | | | | | | |
| | 2005 | | 2004 | | 2004 | | 2003 | | 2002 | |
| | | | | | | | | | | |
Revenues | | $ | 8,113 | | $ | 6,940 | | $ | 9,463 | | $ | 8,413 | | $ | 7,377 | |
Gross margin | | 2,249 | | 2,076 | | 2,782 | | 2,459 | | 1,968 | |
Income (loss) from continuing operations | | 453 | | 231 | | 258 | | 311 | | (2,064 | ) |
Diluted earnings per share from continuing operations | | $ | 0.68 | | $ | 0.36 | | $ | 0.40 | | $ | 0.52 | | $ | (3.83 | ) |
| | | | | | | | | | | |
Free cash flow(1) | | $ | 957 | | $ | 754 | | $ | 1,064 | | $ | 1,100 | | $ | 774 | |
Maintenance capital expenditures | | 509 | | 363 | | 507 | | 542 | | 761 | |
Net cash from operating activities | | $ | 1,466 | | $ | 1,117 | | $ | 1,571 | | $ | 1,642 | | $ | 1,535 | |
Note: Restated.
(1) Non-GAAP financial measure and is reconciled from net cash from operating activities less maintenance capital expenditures.
27
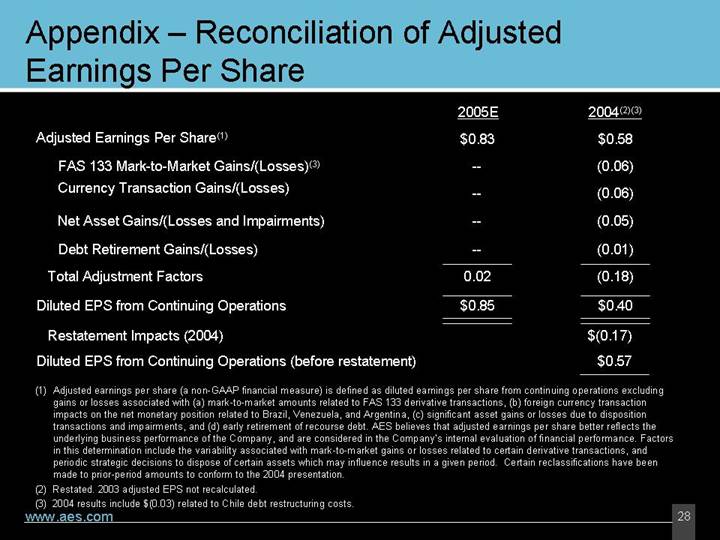
Appendix – Reconciliation of Adjusted Earnings Per Share
| | 2005E | | 2004(2)(3) | |
| | | | | |
Adjusted Earnings Per Share(1) | | $ | 0.83 | | $ | 0.58 | |
FAS 133 Mark-to-Market Gains/(Losses)(3) | | — | | (0.06 | ) |
Currency Transaction Gains/(Losses) | | — | | (0.06 | ) |
Net Asset Gains/(Losses and Impairments) | | — | | (0.05 | ) |
Debt Retirement Gains/(Losses) | | — | | (0.01 | ) |
Total Adjustment Factors | | 0.02 | | (0.18 | ) |
Diluted EPS from Continuing Operations | | $ | 0.85 | | $ | 0.40 | |
Restatement Impacts (2004) | | | | $ | (0.17 | ) |
Diluted EPS from Continuing Operations (before restatement) | | | | $ | 0.57 | |
(1) Adjusted earnings per share (a non-GAAP financial measure) is defined as diluted earnings per share from continuing operations excluding gains or losses associated with (a) mark-to-market amounts related to FAS 133 derivative transactions, (b) foreign currency transaction impacts on the net monetary position related to Brazil, Venezuela, and Argentina, (c) significant asset gains or losses due to disposition transactions and impairments, and (d) early retirement of recourse debt. AES believes that adjusted earnings per share better reflects the underlying business performance of the Company, and are considered in the Company’s internal evaluation of financial performance. Factors in this determination include the variability associated with mark-to-market gains or losses related to certain derivative transactions, and periodic strategic decisions to dispose of certain assets which may influence results in a given period. Certain reclassifications have been made to prior-period amounts to conform to the 2004 presentation.
(2) Restated. 2003 adjusted EPS not recalculated.
(3) 2004 results include $(0.03) related to Chile debt restructuring costs.
28
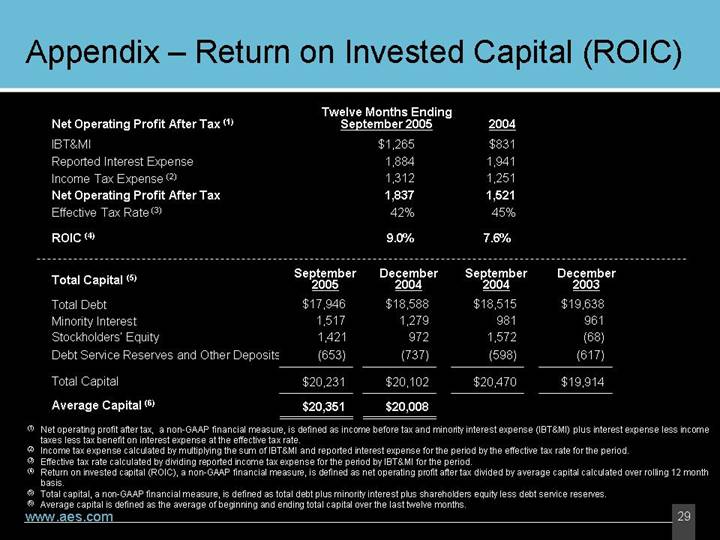
Appendix – Return on Invested Capital (ROIC)
| | Twelve Months Ending | | | |
Net Operating Profit After Tax (1) | | September 2005 | | 2004 | |
IBT&MI | | $ | 1,265 | | $ | 831 | |
Reported Interest Expense | | 1,884 | | 1,941 | |
Income Tax Expense (2) | | 1,312 | | 1,251 | |
Net Operating Profit After Tax | | 1,837 | | 1,521 | |
Effective Tax Rate (3) | | 42 | % | 45 | % |
| | | | | |
ROIC (4) | | 9.0 | % | 7.6 | % |
| | | | | | | |
| | September | | December | | September | | December | |
Total Capital (5) | | 2005 | | 2004 | | 2004 | | 2003 | |
Total Debt | | $ | 17,946 | | $ | 18,588 | | $ | 18,515 | | $ | 19,638 | |
Minority Interest | | 1,517 | | 1,279 | | 981 | | 961 | |
Stockholders’Equity | | 1,421 | | 972 | | 1,572 | | (68 | ) |
Debt Service Reserves and Other Deposits | | (653 | ) | (737 | ) | (598 | ) | (617 | ) |
| | | | | | | | | |
Total Capital | | $ | 20,231 | | $ | 20,102 | | $ | 20,470 | | $ | 19,914 | |
| | | | | | | | | |
Average Capital (6) | | $ | 20,351 | | $ | 20,008 | | | | | |
(1) Net operating profit after tax, a non-GAAP financial measure, is defined as income before tax and minority interest expense (IBT&MI) plus interest expense less income taxes less tax benefit on interest expense at the effective tax rate.
(2) Income tax expense calculated by multiplying the sum of IBT&MI and reported interest expense for the period by the effective tax rate for the period.
(3) Effective tax rate calculated by dividing reported income tax expense for the period by IBT&MI for the period.
(4) Return on invested capital (ROIC), a non-GAAP financial measure, is defined as net operating profit after tax divided by average capital calculated over rolling 12 month basis.
(5) Total capital, a non-GAAP financial measure, is defined as total debt plus minority interest plus shareholders equity less debt service reserves.
(6) Average capital is defined as the average of beginning and ending total capital over the last twelve months.
29