UNITED STATES
SECURITIES AND EXCHANGE COMMISSION
Washington, D.C. 20549
FORM N-CSR
CERTIFIED SHAREHOLDER REPORT OF REGISTERED
MANAGEMENT INVESTMENT COMPANIES
Investment Company Act file number 811-06310
Legg Mason Partners Variable Income Trust
(Exact name of registrant as specified in charter)
55 Water Street, New York, NY 10041
(Address of principal executive offices) (Zip code)
Robert I. Frenkel, Esq.
Legg Mason & Co., LLC
100 First Stamford Place
Stamford, CT 06902
(Name and address of agent for service)
Registrant’s telephone number, including area code:
Funds Investor Services 1-800-822-5544
or
Institutional Shareholder Services 1-888-425-6432
Date of fiscal year end: December 31
Date of reporting period: June 30, 2010
| ITEM 1. | REPORT TO STOCKHOLDERS. |
The Semi-Annual Report to Stockholders is filed herewith.
June 30, 2010

Semi-Annual Repor t
Legg Mason
Western Asset
Variable Diversified
Strategic Income
Portfolio
INVESTMENT PRODUCTS: NOT FDIC INSURED • NO BANK GUARANTEE • MAY LOSE VALUE
| | |
| II | | Legg Mason Western Asset Variable Diversified Strategic Income Portfolio |
Portfolio objective
The Portfolio seeks high current income.
Portfolio name change
Prior to November 2, 2009, the Portfolio was known as Legg Mason Partners Variable Diversified Strategic Income Portfolio. There was no change in the Portfolio’s investment objective or investment policies as a result of the name change.
| | |
| Letter from the chairman | |  |
Dear Shareholder,
We are pleased to provide the semi-annual report of Legg Mason Western Asset Variable Diversified Strategic Income Portfolio for the six-month reporting period ended June 30, 2010.
Please read on for Portfolio performance information and a detailed look at prevailing economic and market conditions during the Portfolio’s reporting period. Important information with regard to recent regulatory developments that may affect the Portfolio is contained in the Notes to Financial Statements included in this report.
As always, we remain committed to providing you with excellent service and a full spectrum of investment choices. We also remain committed to supplementing the support you receive from your financial advisor. One way we accomplish this is through our website, www.leggmason.com/individualinvestors. Here you can gain immediate access to market and investment information, including:
| Ÿ | | Market insights and commentaries from our portfolio managers and |
| Ÿ | | A host of educational resources. |
We look forward to helping you meet your financial goals.
Sincerely,

R. Jay Gerken, CFA
Chairman, President and Chief Executive Officer
July 30, 2010
| | |
| Legg Mason Western Asset Variable Diversified Strategic Income Portfolio | | III |
Investment commentary
Economic review
While the overall U.S. economy continued to expand over the six months ended June 30, 2010, several economic data points weakened toward the end of the reporting period. This, in combination with sovereign debt woes in Europe, caused investor sentiment to turn negative and had significant implications for the financial markets.
Looking back, the U.S. Department of Commerce reported that U.S. gross domestic product (“GDP”)i contracted four consecutive quarters, beginning in the third quarter of 2008 through the second quarter of 2009. Economic conditions then began to improve in the third quarter of 2009, as GDP growth was 1.6%. A variety of factors helped the economy to regain its footing, including the government’s $787 billion stimulus program. Economic growth then accelerated during the fourth quarter of 2009, as GDP growth was 5.0%. A slower drawdown in business inventories and renewed consumer spending were contributing factors spurring the economy’s higher growth rate. While the recovery continued during the first half of 2010, it did so at a more modest pace, as GDP growth was 3.7% during the first quarter of 2010 and an estimated 2.4% during the second quarter. The slower pace of growth in the second quarter was due, in part, to slower consumer spending, which rose an annualized 1.6% during the quarter, versus a 1.9% gain over the first three months of the year.
Even before GDP growth turned positive, there were signs that the economy was on the mend. The manufacturing sector, as measured by the Institute for Supply Management’s PMIii, rose to 52.8 in August 2009, the first time it surpassed 50 since January 2008 (a reading below 50 indicates a contraction, whereas a reading above 50 indicates an expansion). While June 2010’s PMI reading of 56.2 was lower than May’s reading of 59.7, manufacturing has now expanded eleven consecutive months according to PMI data. The manufacturing sector’s growth remained fairly broad-based with thirteen of the eighteen industries tracked by the Institute for Supply Management expanding during June.
After experiencing sharp job losses in 2009, the U.S. Department of Labor reported that over one million new positions were added during the first five months of 2010. Included in that total, however, were 700,000 temporary government jobs tied to the 2010 Census. In June, 225,000 of these temporary positions were eliminated, offsetting private sector growth and resulting in a net loss of 125,000 jobs for the month. However, the unemployment rate fell to 9.5% in June, versus 9.7% and 9.9% in May and April, respectively.
There was mixed news in the housing market during the period. According to the National Association of Realtors, existing home sales increased 7.0% and 8.0% in March and April, respectively, after sales had fallen for the period from December 2009 through February 2010. The rebound was largely attributed to people rushing to take advantage of the government’s $8,000 tax credit for first-time home buyers that expired at the end of April. However, with the end of the tax credit, existing home sales then declined 2.2% and 5.1% in May and June, respectively. In addition, the inventory of unsold homes increased 2.5% to 3.99 million in June. Looking at home prices, the S&P/Case-Shiller Home Price Indexiii indicated that month-to-month U.S. home prices rose 1.3% in May. This marked the second straight monthly increase following six consecutive months of declining prices.
Financial market overview
During the first half of the reporting period, the financial markets were largely characterized by healthy investor risk appetite and solid results by lower-quality bonds. However, the market experienced a sharp sell-off during the second half of the reporting period, during which risk aversion returned and investors flocked to the relative safety of U.S. Treasury securities.
Given certain pockets of weakness in the economy, including elevated unemployment in the U.S., the Federal Reserve Board (“Fed”)iv remained cautious. At its meeting in June 2010, the Fed said it “will maintain the target range for the federal funds ratev at 0 to 1/4 percent and continues to anticipate that economic conditions, including low rates of resource utilization, subdued inflation trends, and stable inflation expectations, are likely to warrant exceptionally low levels of the federal funds rate for an extended period.”
However, the Fed took several steps in reversing its accommodative monetary stance. On February 18, 2010, the Fed raised the discount rate, the interest rate it charges banks for temporary loans, from 1/2 to 3/4 percent. The Fed also concluded its $1.25 trillion mortgage securities purchase program at the end of the first quarter of 2010. However, the Fed left the door open for future stimulus measures if needed. In the minutes of its June meeting that were released on July 14th (after the reporting period ended), the Fed said, “In addition to continuing to develop and test instruments to exit from the period of unusually accommodative monetary policy, the Committee would need to consider whether further policy stimulus might become appropriate if the outlook were to worsen appreciably.”
| | |
| IV | | Legg Mason Western Asset Variable Diversified Strategic Income Portfolio |
Investment commentary (cont’d)
Fixed-income market review
Continuing the trend that began in the second quarter of 2009, nearly every spread sector (non-Treasury) outperformed equal-durationvi Treasuries during the first half of the reporting period. Over that time, investor confidence was high given encouraging economic data, continued low interest rates, benign inflation and rebounding corporate profits. However, robust investor appetite was replaced with heightened risk aversion toward the end of April and during the month of May. This was due to the escalating sovereign debt crisis in Europe, uncertainties regarding new financial reforms in the U.S. and some worse-than-expected economic data. Most spread sectors then produced positive absolute returns in June, as investor demand for these securities began to again increase.
Both short- and long-term Treasury yields fluctuated during the period but generally moved lower. When the period began, two- and ten-year Treasury yields were 1.14% and 3.85%, respectively. Two- and ten-year Treasury yields initially rose, reaching as high as 1.18% and 4.01%, respectively, in early April. Yields then largely declined amid the investor “flight to quality.” On June 30, 2010, two- and ten-year Treasury yields reached their lows for the reporting period: 0.61% and 2.97%, respectively. Over the six-month reporting period, the yield curvevii flattened, with longer-term Treasury yields declining more than their shorter-term counterparts. For the six months ended June 30, 2010, the Barclays Capital U.S. Aggregate Indexviii returned 5.33%.
While the high-yield bond market could not escape the negative impact of the investor flight to quality, it still was able to produce strong results during the reporting period. The asset class posted positive returns during each month except for May 2010 when risk aversion reached extremely elevated levels. The high-yield market was supported by better-than-expected corporate profits and overall strong investor demand. All told, the Barclays Capital U.S. High Yield – 2% Issuer Cap Indexix returned 4.45% for the six months ended June 30, 2010.
Emerging market debt prices rallied over the reporting period, also posting positive returns each month during the period except for May 2010. This impressive performance was triggered by strong economic growth in many emerging market countries, solid domestic demand and generally robust investor demand for the asset class. The JPMorgan Emerging Markets Bond Index Global (“EMBI Global”)x returned 5.37% over the six months ended June 30, 2010.
Performance review
For the six months ended June 30, 2010, Legg Mason Western Asset Variable Diversified Strategic Income Portfolio1 returned 7.23%. The Portfolio’s unmanaged benchmark, the Barclays Capital U.S. Aggregate Index, returned 5.33% over the same time frame. The Lipper Variable General Bond Funds Category Average2 returned 4.77% for the same period.
| | | |
| Performance Snapshot as of June 30, 2010 (unaudited) | |
| | | 6 months | |
| Legg Mason Western Asset Variable Diversified Strategic Income Portfolio1 | | 7.23 | % |
| Barclays Capital U.S. Aggregate Index | | 5.33 | % |
| Lipper Variable General Bond Funds Category Average | | 4.77 | % |
The performance shown represents past performance. Past performance is no guarantee of future results and current performance may be higher or lower than the performance shown above. Principal value, investment returns and yields will fluctuate and investors’ shares, when redeemed, may be worth more or less than their original cost.
Portfolio returns assume the reinvestment of all distributions, including returns of capital, if any, at net asset value and the deduction of all Portfolio expenses. Performance figures for periods shorter than one year represent cumulative figures and are not annualized.
The 30-Day SEC Yield for the period ended June 30, 2010 was 3.53%. The 30-Day SEC Yield is the average annualized net investment income per share for the 30-day period indicated and is subject to change.
| 1 | The Portfolio is an underlying investment option of various variable annuity and variable life insurance products. The Portfolio’s performance returns do not reflect the deduction of expenses imposed in connection with investing in variable annuity or variable life insurance contracts, such as administrative fees, account charges and surrender charges, which, if reflected, would reduce the performance of the Portfolio. Past performance is no guarantee of future results. |
| 2 | Lipper, Inc., a wholly-owned subsidiary of Reuters, provides independent insight on global collective investments. Returns are based on the six-month period ended June 30, 2010, including the reinvestment of all distributions, including returns of capital, if any, calculated among the 71 funds in the Portfolio’s Lipper category. |
| | |
| Legg Mason Western Asset Variable Diversified Strategic Income Portfolio | | V |
|
| Total Annual Operating Expenses (unaudited) |
As of the Portfolio’s most current prospectus dated April 30, 2010, the gross total operating expense ratio for the Portfolio was 0.95%.
Actual expenses may be higher. For example, expenses may be higher than those shown if average net assets decrease. Net assets are more likely to decrease and Portfolio expense ratios are more likely to increase when markets are volatile.
As always, thank you for your confidence in our stewardship of your assets.
Sincerely,
R. Jay Gerken, CFA
Chairman, President and Chief Executive Officer
July 30, 2010
RISKS: As interest rates rise, bond prices fall, reducing the value of the Portfolio’s share price. High-yield bonds involve greater credit and liquidity risks than investment grade bonds. Investing in foreign securities is subject to certain risks not associated with domestic investing, such as currency fluctuations, and changes in political and economic conditions. These risks are magnified in emerging or developing markets. The Portfolio may use derivatives, such as options and futures, which can be illiquid, may disproportionately increase losses, and have a potentially large impact on Portfolio performance. Please see the Portfolio’s prospectus for more information on these and other risks.
All investments are subject to risk including the possible loss of principal. All index performance reflects no deduction for fees, expenses or taxes. Please note that an investor cannot invest directly in an index.
The information provided is not intended to be a forecast of future events, a guarantee of future results or investment advice. Views expressed may differ from those of the firm as a whole.
| i | Gross domestic product (“GDP”) is the market value of all final goods and services produced within a country in a given period of time. |
| ii | The Institute for Supply Management’s PMI is based on a survey of purchasing executives who buy the raw materials for manufacturing at more than 350 companies. It offers an early reading on the health of the manufacturing sector. |
| iii | The S&P/Case-Shiller Home Price Index measures the residential housing market, tracking changes in the value of the residential real estate market in twenty metropolitan regions across the United States. |
| iv | The Federal Reserve Board (“Fed”) is responsible for the formulation of policies designed to promote economic growth, full employment, stable prices and a sustainable pattern of international trade and payments. |
| v | The federal funds rate is the rate charged by one depository institution on an overnight sale of immediately available funds (balances at the Federal Reserve) to another depository institution; the rate may vary from depository institution to depository institution and from day to day. |
| vi | Duration is the measure of the price sensitivity of a fixed-income security to an interest rate change of 100 basis points. Calculation is based on the weighted average of the present values for all cash flows. |
| vii | The yield curve is the graphical depiction of the relationship between the yield on bonds of the same credit quality but different maturities. |
| viii | The Barclays Capital U.S. Aggregate Index is a broad-based bond index comprised of government, corporate, mortgage- and asset-backed issues, rated investment grade or higher, and having at least one year to maturity. |
| ix | The Barclays Capital U.S. High Yield – 2% Issuer Cap Index is an index of the 2% Issuer Cap component of the Barclays Capital U.S. Corporate High Yield Index, which covers the U.S. dollar-denominated, non-investment grade, fixed-rate, taxable corporate bond market. |
| x | The JPMorgan Emerging Markets Bond Index Global (“EMBI Global”) tracks total returns for U.S. dollar-denominated debt instruments issued by emerging market sovereign and quasi-sovereign entities: Brady bonds, loans, Eurobonds and local market instruments. |
| | |
| Legg Mason Western Asset Variable Diversified Strategic Income Portfolio 2010 Semi-Annual Report | | 1 |
Portfolio at a glance† (unaudited)
Investment breakdown (%) as a percent of total investments
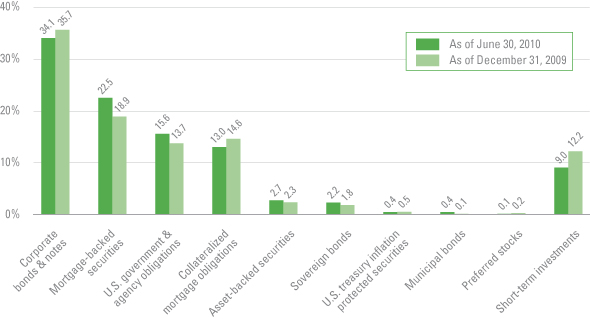
| † | The bar graph above represents the composition of the Portfolio’s investments as of June 30, 2010 and December 31, 2009 and does not include derivatives. The Portfolio is actively managed. As a result, the composition of the Portfolio’s investments is subject to change at any time. |
| | |
| 2 | | Legg Mason Western Asset Variable Diversified Strategic Income Portfolio 2010 Semi-Annual Report |
Portfolio expenses (unaudited)
Example
As a shareholder of the Portfolio, you may incur two types of costs: (1) transaction costs and (2) ongoing costs, including management fees; and other Portfolio expenses. This example is intended to help you understand your ongoing costs (in dollars) of investing in the Portfolio and to compare these costs with the ongoing costs of investing in other mutual funds.
This example is based on an investment of $1,000 invested on January 1, 2010 and held for the six months ended June 30, 2010.
Actual expenses
The table below titled “Based on Actual Total Return” provides information about actual account values and actual expenses. You may use the information provided in this table, together with the amount you invested, to estimate the expenses that you paid over the period. To estimate the expenses you paid on your account, divide your ending account value by $1,000 (for example, an $8,600 ending account value divided by $1,000 = 8.6), then multiply the result by the number under the heading entitled “Expenses Paid During the Period”.
Hypothetical example for comparison purposes
The table below titled “Based on Hypothetical Total Return” provides information about hypothetical account values and hypothetical expenses based on the actual expense ratio and an assumed rate of return of 5.00% per year before expenses, which is not the Portfolio’s actual return. The hypothetical account values and expenses may not be used to estimate the actual ending account balance or expenses you paid for the period. You may use the information provided in this table to compare the ongoing costs of investing in the Portfolio and other funds. To do so, compare the 5.00% hypothetical example relating to the Portfolio with the 5.00% hypothetical examples that appear in the shareholder reports of the other funds.
Please note that the expenses shown in the table below are meant to highlight your ongoing costs only and do not reflect any transactional costs. Therefore, the table is useful in comparing ongoing costs only, and will not help you determine the relative total costs of owning different funds. In addition, if these transaction costs were included, your costs would have been higher.
| | | | | | | | | | | | | | | | | | | | | | | | | | | | | |
| Based on actual total return1 | | | | Based on hypothetical total return1 |
Actual Total
Return2 | | Beginning
Account
Value | | Ending
Account
Value | | Annualized
Expense
Ratio | | | Expenses
Paid During
the Period3 | | | | Hypothetical
Annualized
Total Return | | | Beginning
Account
Value | | Ending
Account
Value | | Annualized
Expense
Ratio | | | Expenses
Paid During
the Period3 |
| 7.23% | | $ | 1,000.00 | | $ | 1,072.30 | | 0.96 | % | | $ | 4.93 | | | | 5.00 | % | | $ | 1,000.00 | | $ | 1,020.03 | | 0.96 | % | | $ | 4.81 |
| 1 | For the six months ended June 30, 2010. |
| 2 | Assumes the reinvestment of all distributions, including returns of capital, if any, at net asset value. Total return is not annualized, as it may not be representative of the total return for the year. Total return does not reflect expenses associated with the separate account such as administrative fees, account charges and surrender charges, which, if reflected, would reduce the total return. Performance figures may reflect fee waivers and/or expense reimbursements. In the absence of fee waivers and/or expense reimbursements, the total return would have been lower. Past performance is no guarantee of future results. |
| 3 | Expenses are equal to the Portfolio’s annualized expense ratio multiplied by the average account value over the period, multiplied by the number of days in the most recent fiscal half-year (181), then divided by 365. |
| | |
| Legg Mason Western Asset Variable Diversified Strategic Income Portfolio 2010 Semi-Annual Report | | 3 |
Schedule of investments (unaudited)
June 30, 2010
Legg Mason Western Asset Variable Diversified Strategic Income Portfolio
| | | | | | | | | | | | |
| Security | | Rate | | | Maturity
Date | | Face
Amount | | Value | |
| Corporate Bonds & Notes — 37.5% | | | | | | | | | | | | |
| Consumer Discretionary — 2.4% | | | | | | | | | | | | |
Automobiles — 0.1% | | | | | | | | | | | | |
Motors Liquidation Co., Senior Debentures | | 8.250 | % | | 7/15/23 | | $ | 155,000 | | $ | 47,662 | (a) |
Hotels, Restaurants & Leisure — 0.2% | | | | | | | | | | | | |
Boyd Gaming Corp., Senior Subordinated Notes | | 6.750 | % | | 4/15/14 | | | 10,000 | | | 8,800 | |
MGM MIRAGE Inc., Notes | | 6.750 | % | | 9/1/12 | | | 65,000 | | | 60,775 | |
Station Casinos Inc., Senior Notes | | 7.750 | % | | 8/15/16 | | | 50,000 | | | 3,406 | (a)(b) |
Total Hotels, Restaurants & Leisure | | | | | | | | | | | 72,981 | |
Media — 2.0% | | | | | | | | | | | | |
Cengage Learning Acquisitions Inc., Senior Notes | | 10.500 | % | | 1/15/15 | | | 10,000 | | | 9,350 | (c) |
Comcast Cable Communications LLC, Notes | | 8.875 | % | | 5/1/17 | | | 80,000 | | | 100,467 | |
Comcast Corp., Notes | | 6.500 | % | | 1/15/15 | | | 120,000 | | | 137,866 | |
Comcast Corp., Notes | | 5.875 | % | | 2/15/18 | | | 10,000 | | | 11,144 | |
CSC Holdings Inc., Senior Notes | | 6.750 | % | | 4/15/12 | | | 50,000 | | | 52,000 | |
DISH DBS Corp., Senior Notes | | 6.625 | % | | 10/1/14 | | | 10,000 | | | 10,025 | |
DISH DBS Corp., Senior Notes | | 7.750 | % | | 5/31/15 | | | 40,000 | | | 41,400 | |
News America Inc., Senior Notes | | 6.200 | % | | 12/15/34 | | | 20,000 | | | 21,132 | |
News America Inc., Senior Notes | | 6.650 | % | | 11/15/37 | | | 10,000 | | | 11,260 | |
Reed Elsevier Capital Inc., Notes | | 8.625 | % | | 1/15/19 | | | 50,000 | | | 63,755 | |
Time Warner Cable Inc., Senior Notes | | 8.750 | % | | 2/14/19 | | | 20,000 | | | 25,275 | |
Time Warner Cable Inc., Senior Notes | | 8.250 | % | | 4/1/19 | | | 170,000 | | | 209,406 | |
Time Warner Cable Inc., Senior Notes | | 6.750 | % | | 6/15/39 | | | 40,000 | | | 44,337 | |
Time Warner Inc., Senior Notes | | 7.625 | % | | 4/15/31 | | | 50,000 | | | 60,319 | |
Total Media | | | | | | | | | | | 797,736 | |
Multiline Retail — 0.1% | | | | | | | | | | | | |
Neiman Marcus Group Inc., Senior Notes | | 9.000 | % | | 10/15/15 | | | 21,750 | | | 21,913 | (d) |
Total Consumer Discretionary | | | | | | | | | | | 940,292 | |
| Consumer Staples — 1.5% | | | | | | | | | | | | |
Beverages — 0.4% | | | | | | | | | | | | |
Anheuser-Busch InBev Worldwide Inc., Senior Notes | | 5.375 | % | | 1/15/20 | | | 80,000 | | | 86,369 | |
Anheuser-Busch InBev Worldwide Inc., Senior Notes | | 5.000 | % | | 4/15/20 | | | 10,000 | | | 10,475 | (c) |
Diageo Finance BV | | 3.250 | % | | 1/15/15 | | | 50,000 | | | 51,482 | |
Total Beverages | | | | | | | | | | | 148,326 | |
Food & Staples Retailing — 0.5% | | | | | | | | | | | | |
CVS Caremark Corp., Senior Notes | | 6.600 | % | | 3/15/19 | | | 70,000 | | | 81,596 | |
CVS Pass-Through Trust, Secured Notes | | 6.943 | % | | 1/10/30 | | | 123,442 | | | 136,515 | |
Total Food & Staples Retailing | | | | | | | | | | | 218,111 | |
Food Products — 0.3% | | | | | | | | | | | | |
Kraft Foods Inc., Senior Notes | | 5.625 | % | | 11/1/11 | | | 5,000 | | | 5,263 | |
Kraft Foods Inc., Senior Notes | | 5.375 | % | | 2/10/20 | | | 100,000 | | | 107,357 | |
Total Food Products | | | | | | | | | | | 112,620 | |
Tobacco — 0.3% | | | | | | | | | | | | |
Altria Group Inc., Senior Notes | | 8.500 | % | | 11/10/13 | | | 40,000 | | | 46,729 | |
Reynolds American Inc., Senior Notes | | 7.250 | % | | 6/1/12 | | | 50,000 | | | 53,781 | |
Total Tobacco | | | | | | | | | | | 100,510 | |
Total Consumer Staples | | | | | | | | | | | 579,567 | |
See Notes to Financial Statements.
| | |
| 4 | | Legg Mason Western Asset Variable Diversified Strategic Income Portfolio 2010 Semi-Annual Report |
Schedule of investments (unaudited) (cont’d)
June 30, 2010
Legg Mason Western Asset Variable Diversified Strategic Income Portfolio
| | | | | | | | | | | | |
| Security | | Rate | | | Maturity
Date | | Face
Amount | | Value | |
| Energy — 4.3% | | | | | | | | | | | | |
Energy Equipment & Services — 0.1% | | | | | | | | | | | | |
Complete Production Services Inc., Senior Notes | | 8.000 | % | | 12/15/16 | | $ | 40,000 | | $ | 39,300 | |
Oil, Gas & Consumable Fuels — 4.2% | | | | | | | | | | | | |
Anadarko Petroleum Corp., Senior Notes | | 8.700 | % | | 3/15/19 | | | 40,000 | | | 37,822 | |
BP Capital Markets PLC, Guaranteed Notes | | 5.250 | % | | 11/7/13 | | | 80,000 | | | 73,595 | |
BP Capital Markets PLC, Senior Notes | | 3.125 | % | | 3/10/12 | | | 20,000 | | | 18,498 | |
Chesapeake Energy Corp., Senior Notes | | 6.625 | % | | 1/15/16 | | | 100,000 | | | 102,125 | |
Chesapeake Energy Corp., Senior Notes | | 6.250 | % | | 1/15/18 | | | 50,000 | | | 50,750 | |
Compagnie Generale de Geophysique SA, Senior Notes | | 7.500 | % | | 5/15/15 | | | 10,000 | | | 9,575 | |
Compagnie Generale de Geophysique SA, Senior Notes | | 7.750 | % | | 5/15/17 | | | 45,000 | | | 42,862 | |
ConocoPhillips Holding Co., Senior Notes | | 6.950 | % | | 4/15/29 | | | 105,000 | | | 129,224 | |
CONSOL Energy Inc., Senior Notes | | 8.250 | % | | 4/1/20 | | | 30,000 | | | 31,425 | (c) |
El Paso Corp., Medium-Term Notes | | 7.375 | % | | 12/15/12 | | | 50,000 | | | 52,609 | |
El Paso Corp., Medium-Term Notes | | 7.800 | % | | 8/1/31 | | | 22,000 | | | 21,853 | |
Hess Corp., Notes | | 8.125 | % | | 2/15/19 | | | 160,000 | | | 199,772 | |
Kerr-McGee Corp., Notes | | 7.875 | % | | 9/15/31 | | | 95,000 | | | 87,241 | |
Kinder Morgan Energy Partners LP, Notes | | 6.750 | % | | 3/15/11 | | | 100,000 | | | 103,533 | |
Kinder Morgan Energy Partners LP, Senior Notes | | 5.850 | % | | 9/15/12 | | | 20,000 | | | 21,454 | |
Noble Energy Inc., Senior Notes | | 8.250 | % | | 3/1/19 | | | 60,000 | | | 72,732 | |
Pemex Project Funding Master Trust, Senior Bonds | | 6.625 | % | | 6/15/35 | | | 15,000 | | | 15,503 | |
Petrobras International Finance Co., Senior Notes | | 6.125 | % | | 10/6/16 | | | 26,000 | | | 27,731 | |
Petrobras International Finance Co., Senior Notes | | 5.750 | % | | 1/20/20 | | | 32,000 | | | 32,386 | |
SandRidge Energy Inc., Senior Notes | | 9.875 | % | | 5/15/16 | | | 35,000 | | | 35,700 | (c) |
Shell International Finance BV, Senior Notes | | 4.375 | % | | 3/25/20 | | | 90,000 | | | 93,220 | |
Stone Energy Corp., Senior Subordinated Notes | | 6.750 | % | | 12/15/14 | | | 55,000 | | | 47,025 | |
Tennessee Gas Pipeline Co., Debentures | | 7.625 | % | | 4/1/37 | | | 50,000 | | | 55,532 | |
Whiting Petroleum Corp., Senior Subordinated Notes | | 7.000 | % | | 2/1/14 | | | 25,000 | | | 25,625 | |
Williams Cos. Inc., Debentures | | 7.500 | % | | 1/15/31 | | | 22,000 | | | 23,465 | |
Williams Cos. Inc., Notes | | 7.875 | % | | 9/1/21 | | | 44,000 | | | 50,525 | |
Williams Cos. Inc., Senior Notes | | 7.750 | % | | 6/15/31 | | | 52,000 | | | 56,015 | |
Williams Cos. Inc., Senior Notes | | 8.750 | % | | 3/15/32 | | | 8,000 | | | 9,360 | |
XTO Energy Inc., Senior Notes | | 7.500 | % | | 4/15/12 | | | 30,000 | | | 33,418 | |
XTO Energy Inc., Senior Notes | | 5.500 | % | | 6/15/18 | | | 30,000 | | | 34,361 | |
XTO Energy Inc., Senior Notes | | 6.500 | % | | 12/15/18 | | | 50,000 | | | 60,778 | |
Total Oil, Gas & Consumable Fuels | | | | | | | | | | | 1,655,714 | |
Total Energy | | | | | | | | | | | 1,695,014 | |
| Financials — 17.2% | | | | | | | | | | | | |
Capital Markets — 1.7% | | | | | | | | | | | | |
Credit Suisse Guernsey Ltd., Junior Subordinated Notes | | 5.860 | % | | 5/15/17 | | | 80,000 | | | 71,000 | (e)(f) |
Goldman Sachs Group Inc., Notes | | 6.600 | % | | 1/15/12 | | | 10,000 | | | 10,580 | |
Goldman Sachs Group Inc., Notes | | 5.450 | % | | 11/1/12 | | | 20,000 | | | 21,080 | |
Goldman Sachs Group Inc., Notes | | 4.750 | % | | 7/15/13 | | | 10,000 | | | 10,448 | |
Goldman Sachs Group Inc., Notes | | 5.250 | % | | 10/15/13 | | | 20,000 | | | 21,098 | |
Goldman Sachs Group Inc., Senior Notes | | 3.625 | % | | 8/1/12 | | | 10,000 | | | 10,192 | |
Goldman Sachs Group Inc., Senior Notes | | 5.375 | % | | 3/15/20 | | | 260,000 | | | 257,390 | |
Kaupthing Bank HF, Senior Notes | | 7.625 | % | | 2/28/15 | | | 370,000 | | | 90,650 | (a)(b)(c) |
See Notes to Financial Statements.
| | |
| Legg Mason Western Asset Variable Diversified Strategic Income Portfolio 2010 Semi-Annual Report | | 5 |
Legg Mason Western Asset Variable Diversified Strategic Income Portfolio
| | | | | | | | | | | | |
| Security | | Rate | | | Maturity
Date | | Face
Amount | | Value | |
Capital Markets — continued | | | | | | | | | | | | |
Lehman Brothers Holdings Capital Trust VII, Medium-Term Notes | | 5.857 | % | | 5/31/12 | | $ | 90,000 | | $ | 234 | (a)(e)(f) |
Lehman Brothers Holdings E-Capital Trust I, Notes | | 6.155 | % | | 8/19/65 | | | 60,000 | | | 156 | (a)(e) |
Lehman Brothers Holdings Inc., Medium-Term Notes, Senior Notes | | 5.250 | % | | 2/6/12 | | | 50,000 | | | 10,125 | (a) |
Merrill Lynch & Co. Inc., Notes | | 6.875 | % | | 4/25/18 | | | 20,000 | | | 21,368 | |
Morgan Stanley, Medium-Term Notes | | 5.625 | % | | 1/9/12 | | | 100,000 | | | 104,093 | |
Morgan Stanley, Medium-Term Notes | | 0.754 | % | | 10/18/16 | | | 50,000 | | | 43,557 | (e) |
Total Capital Markets | | | | | | | | | | | 671,971 | |
Commercial Banks — 5.0% | | | | | | | | | | | | |
Barclays Bank PLC, Senior Notes | | 5.200 | % | | 7/10/14 | | | 100,000 | | | 105,631 | |
Commonwealth Bank of Australia, Senior Notes | | 3.750 | % | | 10/15/14 | | | 50,000 | | | 51,452 | (c) |
Commonwealth Bank of Australia, Senior Notes | | 5.000 | % | | 10/15/19 | | | 20,000 | | | 20,799 | (c) |
Credit Agricole SA, Subordinated Notes | | 8.375 | % | | 10/13/19 | | | 120,000 | | | 114,000 | (c)(e)(f) |
Glitnir Banki HF, Notes | | 6.330 | % | | 7/28/11 | | | 150,000 | | | 39,750 | (a)(b)(c) |
Glitnir Banki HF, Subordinated Notes | | 6.693 | % | | 6/15/16 | | | 130,000 | | | 488 | (a)(b)(c) |
ICICI Bank Ltd., Subordinated Bonds | | 6.375 | % | | 4/30/22 | | | 100,000 | | | 92,125 | (c)(e) |
Landsbanki Islands HF, Senior Notes | | 6.100 | % | | 8/25/11 | | | 260,000 | | | 30,550 | (a)(b)(c) |
Lloyds TSB Bank PLC, Bonds | | 4.375 | % | | 1/12/15 | | | 100,000 | | | 96,443 | (c) |
Lloyds TSB Bank PLC, Notes | | 5.800 | % | | 1/13/20 | | | 100,000 | | | 94,558 | (c) |
Nordea Bank AB, Senior Notes | | 3.700 | % | | 11/13/14 | | | 100,000 | | | 101,973 | (c) |
Nordea Bank AB, Senior Notes | | 4.875 | % | | 1/27/20 | | | 100,000 | | | 102,900 | (c) |
Resona Preferred Global Securities Cayman Ltd., Junior Subordinated Bonds | | 7.191 | % | | 7/30/15 | | | 120,000 | | | 110,537 | (c)(e)(f) |
Royal Bank of Scotland Group PLC, Senior Notes | | 6.400 | % | | 10/21/19 | | | 100,000 | | | 101,540 | |
Royal Bank of Scotland Group PLC, Subordinated Notes | | 5.000 | % | | 11/12/13 | | | 20,000 | | | 19,421 | |
Royal Bank of Scotland Group PLC, Subordinated Notes | | 5.000 | % | | 10/1/14 | | | 50,000 | | | 46,957 | |
Royal Bank of Scotland Group PLC, Subordinated Notes | | 5.050 | % | | 1/8/15 | | | 40,000 | | | 37,395 | |
Santander Issuances SA Unipersonal, Subordinated Notes | | 5.805 | % | | 6/20/16 | | | 120,000 | | | 116,225 | (c)(e) |
Shinsei Finance Cayman Ltd., Junior Subordinated Bonds | | 6.418 | % | | 7/20/16 | | | 130,000 | | | 83,663 | (c)(e)(f) |
SunTrust Capital, Trust Preferred Securities | | 6.100 | % | | 12/15/36 | | | 60,000 | | | 45,803 | (e) |
Wachovia Corp., Subordinated Notes | | 5.250 | % | | 8/1/14 | | | 420,000 | | | 445,182 | |
Wells Fargo Capital X, Capital Securities | | 5.950 | % | | 12/15/36 | | | 100,000 | | | 89,191 | |
Total Commercial Banks | | | | | | | | | | | 1,946,583 | |
Consumer Finance — 2.6% | | | | | | | | | | | | |
American Express Co., Subordinated Debentures | | 6.800 | % | | 9/1/66 | | | 100,000 | | | 96,000 | (e) |
American Express Credit Corp., Senior Notes | | 5.125 | % | | 8/25/14 | | | 60,000 | | | 64,613 | |
Ford Motor Credit Co., LLC, Senior Notes | | 5.787 | % | | 6/15/11 | | | 131,000 | | | 132,801 | (e) |
GMAC Inc., Notes | | 1.750 | % | | 10/30/12 | | | 100,000 | | | 101,793 | |
GMAC Inc., Senior Notes | | 6.625 | % | | 5/15/12 | | | 62,000 | | | 62,620 | |
GMAC Inc., Senior Notes | | 7.500 | % | | 12/31/13 | | | 51,000 | | | 51,382 | |
GMAC Inc., Senior Notes | | 6.750 | % | | 12/1/14 | | | 92,000 | | | 89,930 | |
SLM Corp., Medium-Term Notes | | 5.000 | % | | 10/1/13 | | | 105,000 | | | 100,450 | |
SLM Corp., Medium-Term Notes | | 5.375 | % | | 5/15/14 | | | 225,000 | | | 205,904 | |
SLM Corp., Medium-Term Notes | | 5.050 | % | | 11/14/14 | | | 30,000 | | | 26,856 | |
SLM Corp., Medium-Term Notes, Senior Notes | | 5.625 | % | | 8/1/33 | | | 25,000 | | | 18,400 | |
SLM Corp., Senior Notes | | 3.934 | % | | 4/1/14 | | | 30,000 | | | 25,714 | (e) |
SLM Corp., Senior Notes | | 8.000 | % | | 3/25/20 | | | 30,000 | | | 26,388 | |
Total Consumer Finance | | | | | | | | | | | 1,002,851 | |
See Notes to Financial Statements.
| | |
| 6 | | Legg Mason Western Asset Variable Diversified Strategic Income Portfolio 2010 Semi-Annual Report |
Schedule of investments (unaudited) (cont’d)
June 30, 2010
Legg Mason Western Asset Variable Diversified Strategic Income Portfolio
| | | | | | | | | | | | |
| Security | | Rate | | | Maturity
Date | | Face
Amount | | Value | |
Diversified Financial Services — 6.3% | | | | | | | | | | | | |
Bank of America Corp., Senior Notes | | 4.500 | % | | 4/1/15 | | $ | 210,000 | | $ | 212,476 | |
Bank of America Corp., Senior Notes | | 5.625 | % | | 7/1/20 | | | 20,000 | | | 20,197 | |
Bank of America Corp., Subordinated Notes | | 7.400 | % | | 1/15/11 | | | 60,000 | | | 61,787 | |
Bank of America Corp., Subordinated Notes | | 5.420 | % | | 3/15/17 | | | 90,000 | | | 89,791 | |
Boeing Capital Corp., Senior Notes | | 4.700 | % | | 10/27/19 | | | 30,000 | | | 32,315 | |
Citigroup Inc., Notes | | 6.500 | % | | 8/19/13 | | | 160,000 | | | 170,549 | |
Citigroup Inc., Notes | | 6.000 | % | | 12/13/13 | | | 110,000 | | | 115,492 | |
Citigroup Inc., Senior Notes | | 6.010 | % | | 1/15/15 | | | 50,000 | | | 52,496 | |
Citigroup Inc., Senior Notes | | 6.875 | % | | 3/5/38 | | | 150,000 | | | 157,858 | |
Citigroup Inc., Subordinated Notes | | 5.000 | % | | 9/15/14 | | | 180,000 | | | 180,205 | |
El Paso Performance-Linked Trust Certificates, Senior Notes | | 7.750 | % | | 7/15/11 | | | 220,000 | | | 227,872 | (c) |
General Electric Capital Corp., Senior Notes | | 6.875 | % | | 1/10/39 | | | 260,000 | | | 288,020 | |
General Electric Capital Corp., Subordinated Debentures | | 6.375 | % | | 11/15/67 | | | 220,000 | | | 205,975 | (e) |
JPMorgan Chase & Co., Subordinated Notes | | 5.125 | % | | 9/15/14 | | | 400,000 | | | 427,255 | |
JPMorgan Chase & Co., Subordinated Notes | | 6.125 | % | | 6/27/17 | | | 110,000 | | | 120,515 | |
MUFG Capital Finance 1 Ltd., Preferred Securities | | 6.346 | % | | 7/25/16 | | | 100,000 | | | 96,868 | (e)(f) |
Total Diversified Financial Services | | | | | | | | | | | 2,459,671 | |
Insurance — 1.4% | | | | | | | | | | | | |
American International Group Inc., Junior Subordinated Debentures | | 6.250 | % | | 3/15/37 | | | 110,000 | | | 75,350 | |
American International Group Inc., Medium-Term Notes, Senior Notes | | 5.850 | % | | 1/16/18 | | | 20,000 | | | 17,975 | |
Berkshire Hathaway Inc., Senior Notes | | 3.200 | % | | 2/11/15 | | | 70,000 | | | 72,164 | |
MetLife Inc., Junior Subordinated Debentures | | 6.400 | % | | 12/15/36 | | | 190,000 | | | 168,150 | |
MetLife Inc., Senior Notes | | 6.750 | % | | 6/1/16 | | | 60,000 | | | 67,965 | |
Teachers Insurance & Annuity Association of America — College Retirement Equity Fund, Notes | | 6.850 | % | | 12/16/39 | | | 60,000 | | | 70,125 | (c) |
Travelers Cos. Inc., Junior Subordinated Debentures | | 6.250 | % | | 3/15/37 | | | 100,000 | | | 93,962 | (e) |
Total Insurance | | | | | | | | | | | 565,691 | |
Real Estate Management & Development — 0.2% | | | | | | | | | | | | |
Realogy Corp., Senior Notes | | 10.500 | % | | 4/15/14 | | | 110,000 | | | 93,775 | |
Total Financials | | | | | | | | | | | 6,740,542 | |
| Health Care — 2.4% | | | | | | | | | | | | |
Health Care Equipment & Supplies — 0.1% | | | | | | | | | | | | |
Medtronic Inc., Senior Notes | | 4.450 | % | | 3/15/20 | | | 30,000 | | | 32,031 | |
Health Care Providers & Services — 1.5% | | | | | | | | | | | | |
Community Health Systems Inc., Senior Notes | | 8.875 | % | | 7/15/15 | | | 30,000 | | | 31,012 | |
DaVita Inc., Senior Notes | | 6.625 | % | | 3/15/13 | | | 39,000 | | | 39,244 | |
HCA Inc., Senior Notes | | 6.300 | % | | 10/1/12 | | | 10,000 | | | 10,000 | |
HCA Inc., Senior Notes | | 6.250 | % | | 2/15/13 | | | 58,000 | | | 57,275 | |
HCA Inc., Senior Secured Notes | | 9.625 | % | | 11/15/16 | | | 1,000 | | | 1,073 | (d) |
Tenet Healthcare Corp., Senior Notes | | 7.375 | % | | 2/1/13 | | | 75,000 | | | 75,375 | |
UnitedHealth Group Inc., Senior Notes | | 6.000 | % | | 2/15/18 | | | 30,000 | | | 33,502 | |
WellPoint Health Networks Inc., Notes | | 6.375 | % | | 1/15/12 | | | 300,000 | | | 320,941 | |
WellPoint Inc., Notes | | 5.875 | % | | 6/15/17 | | | 10,000 | | | 11,157 | |
Total Health Care Providers & Services | | | | | | | | | | | 579,579 | |
See Notes to Financial Statements.
| | |
| Legg Mason Western Asset Variable Diversified Strategic Income Portfolio 2010 Semi-Annual Report | | 7 |
Legg Mason Western Asset Variable Diversified Strategic Income Portfolio
| | | | | | | | | | | | |
| Security | | Rate | | | Maturity
Date | | Face
Amount | | Value | |
Pharmaceuticals — 0.8% | | | | | | | | | | | | |
Abbott Laboratories, Senior Notes | | 5.125 | % | | 4/1/19 | | $ | 140,000 | | $ | 156,486 | |
Pfizer Inc., Senior Notes | | 6.200 | % | | 3/15/19 | | | 90,000 | | | 107,141 | |
Wyeth, Notes | | 5.950 | % | | 4/1/37 | | | 70,000 | | | 79,573 | |
Total Pharmaceuticals | | | | | | | | | | | 343,200 | |
Total Health Care | | | | | | | | | | | 954,810 | |
| Industrials — 2.4% | | | | | | | | | | | | |
Aerospace & Defense — 0.5% | | | | | | | | | | | | |
Boeing Co., Senior Notes | | 6.000 | % | | 3/15/19 | | | 40,000 | | | 47,190 | |
Boeing Co., Senior Notes | | 4.875 | % | | 2/15/20 | | | 20,000 | | | 22,064 | |
L-3 Communications Corp., Senior Subordinated Notes | | 5.875 | % | | 1/15/15 | | | 125,000 | | | 124,062 | |
Total Aerospace & Defense | | | | | | | | | | | 193,316 | |
Airlines — 0.6% | | | | | | | | | | | | |
Delta Air Lines Inc., Pass-Through Certificates | | 6.821 | % | | 8/10/22 | | | 168,540 | | | 166,433 | |
Northwest Airlines Corp., Pass-Through Certificates | | 7.575 | % | | 3/1/19 | | | 31,575 | | | 31,890 | |
United Airlines, Pass-Through Trust, Secured Notes | | 9.750 | % | | 1/15/17 | | | 30,000 | | | 32,025 | |
Total Airlines | | | | | | | | | | | 230,348 | |
Industrial Conglomerates — 1.2% | | | | | | | | | | | | |
Tyco International Group SA, Notes | | 6.000 | % | | 11/15/13 | | | 420,000 | | | 470,469 | |
Road & Rail — 0.1% | | | | | | | | | | | | |
Kansas City Southern de Mexico, Senior Notes | | 12.500 | % | | 4/1/16 | | | 20,000 | | | 24,000 | |
RailAmerica Inc., Senior Secured Notes | | 9.250 | % | | 7/1/17 | | | 40,000 | | | 42,100 | |
Total Road & Rail | | | | | | | | | | | 66,100 | |
Total Industrials | | | | | | | | | | | 960,233 | |
| Information Technology — 0.0% | | | | | | | | | | | | |
Semiconductors & Semiconductor Equipment — 0.0% | | | | | | | | | | | | |
National Semiconductor Corp., Senior Notes | | 6.600 | % | | 6/15/17 | | | 10,000 | | | 11,219 | |
| Materials — 0.9% | | | | | | | | | | | | |
Chemicals — 0.2% | | | | | | | | | | | | |
FMC Finance III SA, Senior Notes | | 6.875 | % | | 7/15/17 | | | 60,000 | | | 60,900 | |
Containers & Packaging — 0.1% | | | | | | | | | | | | |
Ball Corp., Senior Notes | | 6.750 | % | | 9/15/20 | | | 40,000 | | | 40,600 | |
Radnor Holdings Inc., Senior Notes | | 11.000 | % | | 3/15/11 | | | 25,000 | | | 0 | (a)(b)(g) |
Total Containers & Packaging | | | | | | | | | | | 40,600 | |
Metals & Mining — 0.6% | | | | | | | | | | | | |
Freeport-McMoRan Copper & Gold Inc., Senior Notes | | 8.375 | % | | 4/1/17 | | | 60,000 | | | 66,086 | |
Rio Tinto Finance USA Ltd., Notes | | 6.500 | % | | 7/15/18 | | | 30,000 | | | 34,246 | |
Rio Tinto Finance USA Ltd., Senior Notes | | 5.875 | % | | 7/15/13 | | | 10,000 | | | 10,964 | |
Steel Dynamics Inc., Senior Notes | | 6.750 | % | | 4/1/15 | | | 35,000 | | | 35,306 | |
Teck Resources Ltd., Senior Secured Notes | | 9.750 | % | | 5/15/14 | | | 5,000 | | | 5,914 | |
Teck Resources Ltd., Senior Secured Notes | | 10.250 | % | | 5/15/16 | | | 5,000 | | | 5,907 | |
Teck Resources Ltd., Senior Secured Notes | | 10.750 | % | | 5/15/19 | | | 5,000 | | | 6,136 | |
Vale Overseas Ltd., Notes | | 6.875 | % | | 11/21/36 | | | 70,000 | | | 73,151 | |
Total Metals & Mining | | | | | | | | | | | 237,710 | |
Total Materials | | | | | | | | | | | 339,210 | |
See Notes to Financial Statements.
| | |
| 8 | | Legg Mason Western Asset Variable Diversified Strategic Income Portfolio 2010 Semi-Annual Report |
Schedule of investments (unaudited) (cont’d)
June 30, 2010
Legg Mason Western Asset Variable Diversified Strategic Income Portfolio
| | | | | | | | | | | | |
| Security | | Rate | | | Maturity
Date | | Face
Amount | | Value | |
| Telecommunication Services — 3.5% | | | | | | | | | | | | |
Diversified Telecommunication Services — 2.8% | | | | | | | | | | | | |
AT&T Inc., Global Notes | | 5.500 | % | | 2/1/18 | | $ | 100,000 | | $ | 110,756 | |
AT&T Inc., Global Notes | | 6.550 | % | | 2/15/39 | | | 50,000 | | | 56,196 | |
Deutsche Telekom International Finance BV, Senior Notes | | 5.750 | % | | 3/23/16 | | | 155,000 | | | 169,800 | |
Intelsat Corp., Senior Notes | | 9.250 | % | | 8/15/14 | | | 20,000 | | | 20,550 | |
Intelsat Jackson Holdings Ltd., Senior Notes | | 9.500 | % | | 6/15/16 | | | 5,000 | | | 5,275 | |
Intelsat Jackson Holdings Ltd., Senior Notes | | 8.500 | % | | 11/1/19 | | | 10,000 | | | 10,150 | (c) |
Koninklijke KPN NV, Senior Notes | | 8.000 | % | | 10/1/10 | | | 160,000 | | | 162,559 | |
Qwest Communications International Inc., Senior Notes | | 7.500 | % | | 2/15/14 | | | 50,000 | | | 50,375 | |
Telecom Italia Capital S.p.A., Senior Notes | | 5.250 | % | | 10/1/15 | | | 140,000 | | | 141,455 | |
Telefonica Emisiones SAU, Senior Notes | | 5.134 | % | | 4/27/20 | | | 80,000 | | | 80,337 | |
Verizon Communications Inc., Senior Notes | | 8.950 | % | | 3/1/39 | | | 20,000 | | | 28,422 | |
Verizon Global Funding Corp., Notes | | 7.375 | % | | 9/1/12 | | | 80,000 | | | 89,925 | |
Verizon New York Inc., Senior Debentures | | 6.875 | % | | 4/1/12 | | | 120,000 | | | 129,722 | |
Windstream Corp., Senior Notes | | 8.625 | % | | 8/1/16 | | | 40,000 | | | 40,500 | |
Total Diversified Telecommunication Services | | | | | | | | | | | 1,096,022 | |
Wireless Telecommunication Services — 0.7% | | | | | | | | | | | | |
America Movil SAB de CV, Senior Notes | | 5.625 | % | | 11/15/17 | | | 30,000 | | | 32,944 | |
Rogers Communications Inc., Senior Notes | | 6.800 | % | | 8/15/18 | | | 30,000 | | | 35,520 | |
Sprint Capital Corp., Senior Notes | | 8.375 | % | | 3/15/12 | | | 200,000 | | | 210,750 | |
Total Wireless Telecommunication Services | | | | | | | | | | | 279,214 | |
Total Telecommunication Services | | | | | | | | | | | 1,375,236 | |
| Utilities — 2.9% | | | | | | | | | | | | |
Electric Utilities — 1.4% | | | | | | | | | | | | |
Duke Energy Corp., Senior Notes | | 5.625 | % | | 11/30/12 | | | 70,000 | | | 76,614 | |
Exelon Corp., Bonds | | 5.625 | % | | 6/15/35 | | | 165,000 | | | 160,385 | |
FirstEnergy Corp., Notes | | 7.375 | % | | 11/15/31 | | | 205,000 | | | 216,744 | |
Pacific Gas & Electric Co., First Mortgage Bonds | | 6.050 | % | | 3/1/34 | | | 70,000 | | | 78,357 | |
Total Electric Utilities | | | | | | | | | | | 532,100 | |
Gas Utilities — 0.1% | | | | | | | | | | | | |
Southern Natural Gas Co., Notes | | 5.900 | % | | 4/1/17 | | | 20,000 | | | 21,289 | (c) |
Southern Natural Gas Co., Senior Notes | | 8.000 | % | | 3/1/32 | | | 25,000 | | | 28,453 | |
Total Gas Utilities | | | | | | | | | | | 49,742 | |
Independent Power Producers & Energy Traders — 1.1% | | | | | | | | | | | | |
AES Corp., Senior Notes | | 7.750 | % | | 10/15/15 | | | 40,000 | | | 40,700 | |
Calpine Construction Finance Co. LP and CCFC Finance Corp., Senior Secured Notes | | 8.000 | % | | 6/1/16 | | | 35,000 | | | 35,962 | (c) |
Edison Mission Energy, Senior Notes | | 7.625 | % | | 5/15/27 | | | 20,000 | | | 11,450 | |
Energy Future Holdings Corp., Senior Notes | | 11.250 | % | | 11/1/17 | | | 440,901 | | | 288,790 | (d) |
NRG Energy Inc., Senior Notes | | 7.250 | % | | 2/1/14 | | | 25,000 | | | 25,406 | |
NRG Energy Inc., Senior Notes | | 7.375 | % | | 2/1/16 | | | 35,000 | | | 34,913 | |
Total Independent Power Producers & Energy Traders | | | | | | | | | | | 437,221 | |
Multi-Utilities — 0.3% | | | | | | | | | | | | |
Dominion Resources Inc., Senior Notes | | 8.875 | % | | 1/15/19 | | | 90,000 | | | 119,066 | |
Total Utilities | | | | | | | | | | | 1,138,129 | |
Total Corporate Bonds & Notes (Cost — $15,337,243) | | | | | | | | | | | 14,734,252 | |
See Notes to Financial Statements.
| | |
| Legg Mason Western Asset Variable Diversified Strategic Income Portfolio 2010 Semi-Annual Report | | 9 |
Legg Mason Western Asset Variable Diversified Strategic Income Portfolio
| | | | | | | | | | | | |
| Security | | Rate | | | Maturity
Date | | Face
Amount | | Value | |
| Asset-Backed Securities — 3.0% | | | | | | | | | | | | |
| Financials — 3.0% | | | | | | | | | | | | |
Automobiles — 0.5% | | | | | | | | | | | | |
AESOP Funding II LLC, 2010-3A A | | 4.640 | % | | 5/20/16 | | $ | 100,000 | | $ | 103,735 | (c) |
Hertz Vehicle Financing LLC, 2009-2A A2 | | 5.290 | % | | 3/25/16 | | | 80,000 | | | 86,660 | (c) |
Total Automobiles | | | | | | | | | | | 190,395 | |
Home Equity — 2.3% | | | | | | | | | | | | |
Accredited Mortgage Loan Trust, 2005-3 A1 | | 0.587 | % | | 9/25/35 | | | 76,021 | | | 69,232 | (e) |
ACE Securities Corp., 2006-SL2 A | | 0.517 | % | | 1/25/36 | | | 382,985 | | | 23,320 | (e) |
Bear Stearns Asset-Backed Securities Trust, 2004-BO1 1A2 | | 0.697 | % | | 9/25/34 | | | 71,023 | | | 70,369 | (e) |
Countrywide Asset-Backed Certificates, 2004-5 M4 | | 1.597 | % | | 6/25/34 | | | 83,405 | | | 20,872 | (e) |
Countrywide Home Equity Loan Trust, 2006-RES 4Q1B | | 0.650 | % | | 12/15/33 | | | 301,675 | | | 64,196 | (c)(e) |
First Horizon ABS Trust, 2006-HE1 A | | 0.507 | % | | 10/25/34 | | | 264,851 | | | 135,114 | (e) |
GSRPM Mortgage Loan Trust, 2006-1 A1 | | 0.647 | % | | 3/25/35 | | | 281,971 | | | 226,031 | (c)(e) |
Indymac Home Equity Loan Asset-Backed Trust, 2006-H1 A | | 0.517 | % | | 4/25/36 | | | 219,872 | | | 58,064 | (e) |
Lehman XS Trust, 2006-14N 1A1B | | 0.557 | % | | 9/25/46 | | | 418,874 | | | 181,581 | (e) |
SACO I Trust, 2006-4 A1 | | 0.517 | % | | 2/25/34 | | | 233,874 | | | 47,472 | (e) |
Sail Net Interest Margin Notes, 2003-3 A | | 7.750 | % | | 4/27/33 | | | 7,825 | | | 0 | (b)(c) |
Total Home Equity | | | | | | | | | | | 896,251 | |
Student Loan — 0.2% | | | | | | | | | | | | |
Education Funding Capital Trust, 2003-3 A6 | | 1.520 | % | | 12/15/42 | | | 50,000 | | | 47,500 | (e) |
Education Funding Capital Trust, 2003-3 A7 | | 2.430 | % | | 12/15/42 | | | 50,000 | | | 46,813 | (e) |
Total Student Loan | | | | | | | | | | | 94,313 | |
Total Asset-Backed Securities (Cost — $2,618,397) | | | | | | | | | | | 1,180,959 | |
| Collateralized Mortgage Obligations — 14.3% | | | | | | | | | | | | |
American Home Mortgage Investment Trust, 2005-1 6A | | 2.749 | % | | 6/25/45 | | | 364,801 | | | 297,214 | (e) |
Banc of America Mortgage Securities, 2005-H 2A1 | | 4.787 | % | | 9/25/35 | | | 266,590 | | | 225,882 | (e) |
Commercial Mortgage Pass-Through Certificates, 2001-J2A A1 | | 5.447 | % | | 7/16/34 | | | 218,802 | | | 222,844 | (c) |
Countrywide Alternative Loan Trust, 2003-20CB 1A1 | | 5.500 | % | | 10/25/33 | | | 31,450 | | | 32,392 | |
Countrywide Alternative Loan Trust, 2005-72 A1 | | 0.617 | % | | 1/25/36 | | | 364,385 | | | 221,183 | (e) |
Countrywide Alternative Loan Trust, 2006-OA6 1A1A | | 0.557 | % | | 7/25/46 | | | 415,290 | | | 215,477 | (e) |
Countrywide Home Loan Mortgage Pass-Through Trust, 2004-23 A | | 2.454 | % | | 11/25/34 | | | 257,630 | | | 153,202 | (e) |
Countrywide Home Loan Mortgage Pass-Through Trust, 2005-9 1A1 | | 0.647 | % | | 5/25/35 | | | 265,504 | | | 153,245 | (e) |
CS First Boston Mortgage Securities Corp., 2005-C6 A4 | | 5.230 | % | | 12/15/40 | | | 500,000 | | | 530,085 | (e) |
Deutsche ALT-A Securities Inc. Mortgage Loan Trust, 2005-AR1 2A1 | | 4.844 | % | | 8/25/35 | | | 134,091 | | | 102,579 | (e) |
Downey Savings & Loan Association Mortgage Loan Trust, 2005-AR2 2A1A | | 0.558 | % | | 3/19/45 | | | 232,181 | | | 132,277 | (e) |
Downey Savings & Loan Association Mortgage Loan Trust, 2006-AR1 1A1A | | 1.333 | % | | 3/19/46 | | | 326,721 | | | 156,083 | (e) |
GS Mortgage Securities Corp. II, 2001-1285 C | | 6.712 | % | | 8/15/18 | | | 40,000 | | | 41,308 | (c) |
GSR Mortgage Loan Trust, 2005-AR5 1A1 | | 3.464 | % | | 10/25/35 | | | 366,324 | | | 268,956 | (e) |
Harborview Mortgage Loan Trust, 2004-11 3A1A | | 0.698 | % | | 1/19/35 | | | 273,797 | | | 145,435 | (e) |
Harborview Mortgage Loan Trust, 2004-8 2A4A | | 0.748 | % | | 11/19/34 | | | 242,966 | | | 147,570 | (e) |
Harborview Mortgage Loan Trust, 2004-8 3A2 | | 0.748 | % | | 11/19/34 | | | 101,421 | | | 55,148 | (e) |
Indymac Index Mortgage Loan Trust, 2005-AR1 1A1 | | 3.247 | % | | 3/25/35 | | | 149,587 | | | 107,990 | (e) |
Indymac Index Mortgage Loan Trust, 2006-AR4 A1A | | 0.557 | % | | 5/25/46 | | | 494,097 | | | 258,007 | (e) |
Indymac Index Mortgage Loan Trust, 2007-AR15 2A1 | | 5.534 | % | | 8/25/37 | | | 248,829 | | | 131,848 | (e) |
JPMorgan Chase Commercial Mortgage Securities Corp., 2007-LD11 A3 | | 5.983 | % | | 6/15/49 | | | 200,000 | | | 205,241 | (e) |
JPMorgan Mortgage Trust, 2005-S3 1A1 | | 6.500 | % | | 1/25/36 | | | 128,909 | | | 85,279 | |
See Notes to Financial Statements.
| | |
| 10 | | Legg Mason Western Asset Variable Diversified Strategic Income Portfolio 2010 Semi-Annual Report |
Schedule of investments (unaudited) (cont’d)
June 30, 2010
Legg Mason Western Asset Variable Diversified Strategic Income Portfolio
| | | | | | | | | | | | |
| Security | | Rate | | | Maturity Date | | Face
Amount | | Value | |
| Collateralized Mortgage Obligations — continued | | | | | | | | | | | | |
MASTR Adjustable Rate Mortgages Trust, 2007-R5 A1 | | 5.571 | % | | 11/25/35 | | $ | 130,403 | | $ | 74,729 | (c)(e) |
Merrill Lynch Mortgage Investors Trust, 2004-A3 4A3 | | 5.055 | % | | 5/25/34 | | | 112,726 | | | 114,223 | (e) |
Morgan Stanley Mortgage Loan Trust, 2006-3AR 2A3 | | 4.962 | % | | 3/25/36 | | | 454,373 | | | 275,112 | (e) |
RBSGC Mortgage Pass-Through Certificates, 2007-B 1A4 | | 0.797 | % | | 1/25/37 | | | 140,036 | | | 77,786 | (e) |
Structured Adjustable Rate Mortgage Loan Trust, 2005-21 1A | | 5.615 | % | | 11/25/35 | | | 142,155 | | | 76,493 | (e) |
Structured Asset Mortgage Investments Inc., 2006-AR5 2A1 | | 0.557 | % | | 5/25/46 | | | 236,419 | | | 128,043 | (e) |
Voyager Dwnys Delaware Trust, 2009-1 UGL2 | | 1.361 | % | | 3/20/47 | | | 329,500 | | | 28,008 | (b)(c)(e)(g) |
Washington Mutual Inc. Mortgage Pass-Through Certificates,
2005-AR17 A1A1 | | 0.617 | % | | 12/25/45 | | | 387,253 | | | 291,790 | (e) |
Washington Mutual Inc. Mortgage Pass-Through Certificates,
2005-AR19 A1A2 | | 0.637 | % | | 12/25/45 | | | 220,154 | | | 147,327 | (e) |
Washington Mutual Inc. Mortgage Pass-Through Certificates,
2006-AR10 1A1 | | 5.890 | % | | 9/25/36 | | | 184,817 | | | 144,737 | (e) |
Wells Fargo Mortgage Backed Securities Trust, 2005-AR16 6A3 | | 3.981 | % | | 10/25/35 | | | 311,239 | | | 278,394 | (e) |
Wells Fargo Mortgage Backed Securities Trust, 2006-AR8 2A3 | | 4.759 | % | | 4/25/36 | | | 88,952 | | | 81,952 | (e) |
Total Collateralized Mortgage Obligations (Cost — $7,923,492) | | | | | | | | | | | 5,607,839 | |
| Mortgage-Backed Securities — 24.8% | | | | | | | | | | | | |
FHLMC — 9.9% | | | | | | | | | | | | |
Federal Home Loan Mortgage Corp. (FHLMC) | | 5.383 | % | | 2/1/36 | | | 169,902 | | | 178,390 | (e) |
Federal Home Loan Mortgage Corp. (FHLMC) | | 5.799 | % | | 2/1/37 | | | 36,244 | | | 38,680 | (e) |
Federal Home Loan Mortgage Corp. (FHLMC) | | 6.062 | % | | 3/1/37 | | | 216,158 | | | 231,049 | (e) |
Federal Home Loan Mortgage Corp. (FHLMC) | | 5.751 | % | | 5/1/37 | | | 86,671 | | | 92,558 | (e) |
Federal Home Loan Mortgage Corp. (FHLMC) | | 5.805 | % | | 5/1/37 | | | 105,988 | | | 112,968 | (e) |
Federal Home Loan Mortgage Corp. (FHLMC) | | 4.500 | % | | 8/12/40 | | | 300,000 | | | 309,750 | (h) |
Federal Home Loan Mortgage Corp. (FHLMC), Gold | | 7.000 | % | | 2/1/15-5/1/16 | | | 42,385 | | | 46,022 | |
Federal Home Loan Mortgage Corp. (FHLMC), Gold | | 6.500 | % | | 9/1/31 | | | 140,109 | | | 155,967 | |
Federal Home Loan Mortgage Corp. (FHLMC), Gold | | 5.500 | % | | 11/1/35-4/1/38 | | | 349,315 | | | 375,488 | |
Federal Home Loan Mortgage Corp. (FHLMC), Gold | | 5.000 | % | | 11/1/36 | | | 710,054 | | | 753,131 | |
Federal Home Loan Mortgage Corp. (FHLMC), Gold | | 6.000 | % | | 12/1/36-2/1/37 | | | 455,562 | | | 495,648 | |
Federal Home Loan Mortgage Corp. (FHLMC), Gold | | 6.000 | % | | 8/12/40 | | | 1,000,000 | | | 1,082,344 | (h) |
Total FHLMC | | | | | | | | | | | 3,871,995 | |
FNMA — 7.6% | | | | | | | | | | | | |
Federal National Mortgage Association (FNMA) | | 6.500 | % | | 3/1/16-11/1/36 | | | 844,033 | | | 928,552 | |
Federal National Mortgage Association (FNMA) | | 5.500 | % | | 12/1/16-11/1/36 | | | 109,917 | | | 118,610 | |
Federal National Mortgage Association (FNMA) | | 4.500 | % | | 8/17/25-8/12/40 | | | 700,000 | | | 726,953 | (h) |
Federal National Mortgage Association (FNMA) | | 7.500 | % | | 2/1/30-7/1/31 | | | 36,876 | | | 42,088 | |
Federal National Mortgage Association (FNMA) | | 7.000 | % | | 7/1/30-4/1/32 | | | 274,513 | | | 310,904 | |
Federal National Mortgage Association (FNMA) | | 6.000 | % | | 3/1/32-4/1/32 | | | 398,603 | | | 439,767 | |
Federal National Mortgage Association (FNMA) | | 5.000 | % | | 6/1/35 | | | 205,014 | | | 217,900 | |
Federal National Mortgage Association (FNMA) | | 4.000 | % | | 8/12/40 | | | 200,000 | | | 201,969 | (h) |
Total FNMA | | | | | | | | | | | 2,986,743 | |
GNMA — 7.3% | | | | | | | | | | | | |
Government National Mortgage Association (GNMA) | | 7.000 | % | | 6/15/28-7/15/29 | | | 33,400 | | | 37,972 | |
Government National Mortgage Association (GNMA) | | 6.500 | % | | 9/15/28-2/15/31 | | | 146,753 | | | 164,590 | |
Government National Mortgage Association (GNMA) | | 5.000 | % | | 1/15/40 | | | 595,977 | | | 636,597 | |
Government National Mortgage Association (GNMA) | | 4.500 | % | | 7/21/40 | | | 400,000 | | | 416,750 | (h) |
Government National Mortgage Association (GNMA) | | 5.000 | % | | 7/21/40-9/21/40 | | | 700,000 | | | 742,972 | (h) |
See Notes to Financial Statements.
| | |
| Legg Mason Western Asset Variable Diversified Strategic Income Portfolio 2010 Semi-Annual Report | | 11 |
Legg Mason Western Asset Variable Diversified Strategic Income Portfolio
| | | | | | | | | | | | |
| Security | | Rate | | | Maturity
Date | | Face
Amount | | Value | |
GNMA — continued | | | | | | | | | | | | |
Government National Mortgage Association (GNMA) | | 5.500 | % | | 7/21/40 | | $ | 400,000 | | $ | 431,502 | (h) |
Government National Mortgage Association (GNMA) | | 6.000 | % | | 7/21/40 | | | 400,000 | | | 436,061 | (h) |
Total GNMA | | | | | | | | | | | 2,866,444 | |
Total Mortgage-Backed Securities (Cost — $9,300,044) | | | | | | | | | | | 9,725,182 | |
| Municipal Bonds — 0.4% | | | | | | | | | | | | |
California — 0.1% | | | | | | | | | | | | |
California State, GO, Build America Bonds | | 7.300 | % | | 10/1/39 | | | 40,000 | | | 41,684 | |
Georgia — 0.1% | | | | | | | | | | | | |
Municipal Electric Authority, GA, Build America Bonds, Plant Vogtle Units 3&4 Project J | | 6.637 | % | | 4/1/57 | | | 30,000 | | | 29,083 | |
Municipal Electric Authority, GA, Build America Bonds, Plant Vogtle Units 3&4 Project M | | 6.655 | % | | 4/1/57 | | | 10,000 | | | 9,656 | |
Total Georgia | | | | | | | | | | | 38,739 | |
Texas — 0.2% | | | | | | | | | | | | |
North Texas Higher Education Authority Inc., Student Loan Revenue | | 1.460 | % | | 7/1/30 | | | 80,000 | | | 79,626 | (e) |
Total Municipal Bonds (Cost — $160,327) | | | | | | | | | | | 160,049 | |
| Sovereign Bonds — 2.4% | | | | | | | | | | | | |
Italy — 0.9% | | | | | | | | | | | | |
Region of Lombardy | | 5.804 | % | | 10/25/32 | | | 350,000 | | | 350,619 | |
Japan — 0.5% | | | | | | | | | | | | |
Japan Finance Corp., Guaranteed Bonds | | 2.875 | % | | 2/2/15 | | | 190,000 | | | 195,506 | |
Mexico — 0.4% | | | | | | | | | | | | |
United Mexican States, Medium-Term Notes | | 5.875 | % | | 1/15/14 | | | 140,000 | | | 159,250 | |
Russia — 0.6% | | | | | | | | | | | | |
Russian Foreign Bond-Eurobond | | 11.000 | % | | 7/24/18 | | | 175,000 | | | 242,156 | (c) |
Total Sovereign Bonds (Cost — $916,917) | | | | | | | | | | | 947,531 | |
| U.S. Government & Agency Obligations — 17.2% | | | | | | | | | | | | |
U.S. Government Agencies — 1.9% | | | | | | | | | | | | |
Farmer Mac, Guaranteed Trust | | 5.125 | % | | 4/19/17 | | | 300,000 | | | 328,365 | (c) |
Federal Home Loan Bank (FHLB), Bonds | | 1.500 | % | | 1/16/13 | | | 50,000 | | | 50,664 | |
Federal National Mortgage Association (FNMA) | | 0.000 | % | | 10/9/19 | | | 100,000 | | | 61,962 | |
Federal National Mortgage Association (FNMA) | | 6.250 | % | | 5/15/29 | | | 100,000 | | | 124,099 | |
Federal National Mortgage Association (FNMA), Senior Notes | | 7.125 | % | | 1/15/30 | | | 90,000 | | | 122,864 | |
Tennessee Valley Authority, Notes | | 5.250 | % | | 9/15/39 | | | 40,000 | | | 44,392 | |
Total U.S. Government Agencies | | | | | | | | | | | 732,346 | |
U.S. Government Obligations — 15.3% | | | | | | | | | | | | |
U.S. Treasury Bonds | | 8.000 | % | | 11/15/21 | | | 80,000 | | | 116,362 | |
U.S. Treasury Bonds | | 3.500 | % | | 2/15/39 | | | 919,000 | | | 853,809 | |
U.S. Treasury Bonds | | 4.250 | % | | 5/15/39 | | | 600,000 | | | 634,500 | |
U.S. Treasury Bonds | | 4.500 | % | | 8/15/39 | | | 440,000 | | | 484,688 | |
U.S. Treasury Bonds | | 4.375 | % | | 11/15/39 | | | 960,000 | | | 1,036,501 | |
U.S. Treasury Notes | | 0.625 | % | | 6/30/12 | | | 230,000 | | | 230,054 | |
U.S. Treasury Notes | | 2.125 | % | | 5/31/15 | | | 30,000 | | | 30,520 | |
U.S. Treasury Notes | | 2.750 | % | | 11/30/16 | | | 480,000 | | | 492,188 | |
U.S. Treasury Notes | | 3.125 | % | | 1/31/17 | | | 210,000 | | | 219,663 | |
U.S. Treasury Notes | | 2.750 | % | | 5/31/17 | | | 230,000 | | | 234,888 | |
U.S. Treasury Notes | | 2.500 | % | | 6/30/17 | | | 600,000 | | | 602,719 | |
See Notes to Financial Statements.
| | |
| 12 | | Legg Mason Western Asset Variable Diversified Strategic Income Portfolio 2010 Semi-Annual Report |
Schedule of investments (unaudited) (cont’d)
June 30, 2010
Legg Mason Western Asset Variable Diversified Strategic Income Portfolio
| | | | | | | | | | | | |
| Security | | Rate | | | Maturity
Date | | Face
Amount | | Value | |
U.S. Government Obligations — continued | | | | | | | | | | | | |
U.S. Treasury Notes | | 3.375 | % | | 11/15/19 | | $ | 790,000 | | $ | 818,329 | |
U.S. Treasury Notes | | 3.500 | % | | 5/15/20 | | | 240,000 | | | 251,212 | |
Total U.S. Government Obligations | | | | | | | | | | | 6,005,433 | |
Total U.S. Government & Agency Obligations (Cost — $6,361,955) | | | | | | | | | | | 6,737,779 | |
| U.S. Treasury Inflation Protected Security — 0.5% | | | | | | | | | | | | |
U.S. Treasury Bonds, Inflation Indexed (Cost — $162,454) | | 2.500 | % | | 1/15/29 | | | 162,456 | | | 184,121 | |
| | | | |
| | | | | | | | Shares | | | |
| Common Stock — 0.0% | | | | | | | | | | | | |
| Energy — 0.0% | | | | | | | | | | | | |
Oil, Gas & Consumable Fuels — 0.0% | | | | | | | | | | | | |
SemGroup Corp., Class A Shares (Cost — $773) | | | | | | | | 25 | | | 656 | *(g) |
| Preferred Stocks — 0.2% | | | | | | | | | | | | |
| Financials — 0.2% | | | | | | | | | | | | |
Diversified Financial Services — 0.2% | | | | | | | | | | | | |
Citigroup Capital XII | | 8.500 | % | | | | | 2,450 | | | 61,403 | |
Thrifts & Mortgage Finance — 0.0% | | | | | | | | | | | | |
Federal Home Loan Mortgage Corp. (FHLMC) | | 8.375 | % | | | | | 7,000 | | | 2,380 | *(e) |
Federal National Mortgage Association (FNMA) | | 7.000 | % | | | | | 300 | | | 180 | *(e) |
Federal National Mortgage Association (FNMA) | | 8.250 | % | | | | | 5,300 | | | 1,802 | *(e) |
Total Thrifts & Mortgage Finance | | | | | | | | | | | 4,362 | |
Total Preferred Stocks (Cost — $384,722) | | | | | | | | | | | 65,765 | |
| | | | |
| | | | | | Expiration
Date | | Warrants | | | |
| Warrants — 0.0% | | | | | | | | | | | | |
SemGroup Corp. (Cost — $0) | | | | | 11/30/14 | | | 27 | | | 148 | * |
| | | | |
| | | | | | | | Contracts | | | |
| Purchased Options — 0.0% | | | | | | | | | | | | |
U.S. Treasury 10-Year Notes Futures, Call @ $119.50 | | | | | 8/27/10 | | | 2 | | | 6,875 | |
U.S. Treasury 10-Year Notes Futures, Call @ $121.50 | | | | | 8/27/10 | | | 4 | | | 7,813 | |
Total Purchased Options (Cost — $7,754) | | | | | | | | | | | 14,688 | |
Total Investments Before Short-Term Investments (Cost — $43,174,078) | | | | | | | | | | | 39,358,969 | |
| | | | |
| | | | | | Maturity
Date | | Face
Amount | | | |
| Short-Term Investments — 9.9% | | | | | | | | | | | | |
U.S. Government Agency — 0.2% | | | | | | | | | | | | |
Federal National Mortgage Association (FNMA), Discount Notes (Cost — $91,976) | | 0.180 | % | | 8/23/10 | | $ | 92,000 | | | 91,976 | (i)(j) |
U.S. Treasury Bills — 3.8% | | | | | | | | | | | | |
U.S. Treasury Bills (Cost — $1,488,974) | | 0.177 | % | | 11/18/10 | | | 1,490,000 | | | 1,488,985 | (j) |
See Notes to Financial Statements.
| | |
| Legg Mason Western Asset Variable Diversified Strategic Income Portfolio 2010 Semi-Annual Report | | 13 |
Legg Mason Western Asset Variable Diversified Strategic Income Portfolio
| | | | | | | | | | | | |
| Security | | Rate | | | Maturity
Date | | Face
Amount | | Value | |
Repurchase Agreement — 5.9% | | | | | | | | | | | | |
Morgan Stanley tri-party repurchase agreement dated 6/30/10; Proceeds at maturity — $2,300,001; (Fully collateralized by U.S. government agency obligations, 3.000% due 5/26/15; Market value — $2,354,680) (Cost — $2,300,000) | | 0.020 | % | | 7/1/10 | | $ | 2,300,000 | | $ | 2,300,000 | |
Total Short-Term Investments (Cost — $3,880,950) | | | | | | | | | | | 3,880,961 | |
Total Investments — 110.2% (Cost — $47,055,028#) | | | | | | | | | | | 43,239,930 | |
Liabilities in Excess of Other Assets — (10.2)% | | | | | | | | | | | (4,016,304 | ) |
Total Net Assets — 100.0% | | | | | | | | | | $ | 39,223,626 | |
| * | Non-income producing security. |
| (a) | The coupon payment on these securities is currently in default as of June 30, 2010. |
| (c) | Security is exempt from registration under Rule 144A of the Securities Act of 1933. This security may be resold in transactions that are exempt from registration, normally to qualified institutional buyers. This security has been deemed liquid pursuant to guidelines approved by the Board of Trustees, unless otherwise noted. |
| (d) | Payment-in-kind security for which part of the income earned may be paid as additional principal. |
| (e) | Variable rate security. Interest rate disclosed is that which is in effect at June 30, 2010. |
| (f) | Security has no maturity date. The date shown represents the next call date. |
| (g) | Security is valued in good faith at fair value in accordance with procedures approved by the Board of Trustees (See Note 1). |
| (h) | This security is traded on a to-be-announced (“TBA”) basis (See Note 1). |
| (i) | All or a portion of this security is held at the broker as collateral for open futures contracts. |
| (j) | Rate shown represents yield-to-maturity. |
| # | Aggregate cost for federal income tax purposes is substantially the same. |
| | |
Abbreviation used in this schedule: |
| GO | | — General Obligation |
| | | | | | | | | | |
| Schedule of Written Options | | | | | | | | |
| Security | | Expiration
Date | | Strike
Price | | Contracts | | Value |
| Eurodollar Futures, Call | | 9/13/10 | | $ | 99.25 | | 9 | | $ | 3,769 |
| U.S. Treasury 10-Year Notes Futures, Call | | 8/27/10 | | | 121.00 | | 4 | | | 9,125 |
| U.S. Treasury 10-Year Notes Futures, Call | | 8/27/10 | | | 123.50 | | 2 | | | 1,875 |
| U.S. Treasury 10-Year Notes Futures, Put | | 8/27/10 | | | 115.00 | | 4 | | | 250 |
| Total Written Options (Premiums received — $10,876) | | | | | | | | | $ | 15,019 |
See Notes to Financial Statements.
| | |
| 14 | | Legg Mason Western Asset Variable Diversified Strategic Income Portfolio 2010 Semi-Annual Report |
Statement of assets and liabilities (unaudited)
June 30, 2010
| | | |
| |
| Assets: | | | |
Investments, at value (Cost — $47,055,028) | | $ | 43,239,930 |
Foreign currency, at value (Cost — $33,541) | | | 32,592 |
Cash | | | 604 |
Receivable for securities sold | | | 9,832,891 |
Interest receivable | | | 369,714 |
Unrealized appreciation on forward currency contracts | | | 53,133 |
Principal paydown receivable | | | 25,553 |
Total Assets | | | 53,554,417 |
| |
| Liabilities: | | | |
Payable for securities purchased | | | 14,150,027 |
Payable for Portfolio shares repurchased | | | 72,450 |
Unrealized depreciation on forward currency contracts | | | 30,430 |
Investment management fee payable | | | 20,921 |
Written options, at value (premiums received $10,876) | | | 15,019 |
Payable to broker — variation margin on open futures contracts | | | 4,989 |
Trustees’ fees payable | | | 2,851 |
Accrued expenses | | | 34,104 |
Total Liabilities | | | 14,330,791 |
| Total Net Assets | | $ | 39,223,626 |
| |
| Net Assets: | | | |
Par value (Note 5) | | $ | 47 |
Paid-in capital in excess of par value | | | 46,680,108 |
Undistributed net investment income | | | 707,428 |
Accumulated net realized loss on investments, futures contracts, written options and foreign currency transactions | | | (4,343,666) |
Net unrealized depreciation on investments, futures contracts, written options and foreign currencies | | | (3,820,291) |
| Total Net Assets | | $ | 39,223,626 |
| Shares Outstanding | | | 4,679,422 |
| Net Asset Value | | | $8.38 |
See Notes to Financial Statements.
| | |
| Legg Mason Western Asset Variable Diversified Strategic Income Portfolio 2010 Semi-Annual Report | | 15 |
Statement of operations (unaudited)
For the Six Months Ended June 30, 2010
| | | |
| |
| Investment Income: | | | |
Interest | | $ | 984,606 |
Dividends | | | 2,978 |
Total Investment Income | | | 987,584 |
| |
| Expenses: | | | |
Investment management fee (Note 2) | | | 129,826 |
Shareholder reports | | | 38,920 |
Audit and tax | | | 12,392 |
Transfer agent fees | | | 3,402 |
Legal fees | | | 3,115 |
Custody fees | | | 1,942 |
Insurance | | | 932 |
Trustees’ fees | | | 243 |
Miscellaneous expenses | | | 1,410 |
Total Expenses | | | 192,182 |
Less: Compensating balance arrangements (Note 1) | | | (159) |
Net Expenses | | | 192,023 |
| Net Investment Income | | | 795,561 |
| |
Realized and Unrealized Gain (Loss) on Investments, Futures Contracts, Written Options
and Foreign Currency Transactions (Notes 1, 3 and 4): | | | |
Net Realized Gain (Loss) From: | | | |
Investment transactions | | | (57,576) |
Futures contracts | | | 110,896 |
Written options | | | 16,542 |
Foreign currency transactions | | | 62,673 |
Net Realized Gain | | | 132,535 |
Change in Net Unrealized Appreciation/Depreciation From: | | | |
Investments | | | 1,890,399 |
Futures contracts | | | 5,279 |
Written options | | | (7,697) |
Foreign currencies | | | 21,616 |
Change in Net Unrealized Appreciation/Depreciation | | | 1,909,597 |
| Net Gain on Investments, Futures Contracts, Written Options and Foreign Currency Transactions | | | 2,042,132 |
| Proceeds from Settlement of a Regulatory Matter (Note 7) | | | 8,502 |
| Increase in Net Assets from Operations | | $ | 2,846,195 |
See Notes to Financial Statements.
| | |
| 16 | | Legg Mason Western Asset Variable Diversified Strategic Income Portfolio 2010 Semi-Annual Report |
Statements of changes in net assets
| | | | | | |
For the Six Months Ended June 30, 2010 (unaudited)
and the Year Ended December 31, 2009 | | 2010 | | 2009 |
| | |
| Operations: | | | | | | |
Net investment income | | $ | 795,561 | | $ | 2,162,550 |
Net realized gain (loss) | | | 132,535 | | | (752,371) |
Change in net unrealized appreciation/depreciation | | | 1,909,597 | | | 5,927,730 |
Proceeds from settlement of a regulatory matter (Note 7) | | | 8,502 | | | — |
Increase in Net Assets From Operations | | | 2,846,195 | | | 7,337,909 |
| | |
| Distributions to Shareholders From (Note 1): | | | | | | |
Net investment income | | | (75,002) | | | (2,050,000) |
Decrease in Net Assets From Distributions to Shareholders | | | (75,002) | | | (2,050,000) |
| | |
| Portfolio Share Transactions (Note 5): | | | | | | |
Net proceeds from sale of shares | | | 293,994 | | | 664,343 |
Reinvestment of distributions | | | 75,002 | | | 2,050,000 |
Cost of shares repurchased | | | (4,397,710) | | | (8,106,122) |
Decrease in Net Assets From Portfolio Share Transactions | | | (4,028,714) | | | (5,391,779) |
Decrease in Net Assets | | | (1,257,521) | | | (103,870) |
| | |
| Net Assets: | | | | | | |
Beginning of period | | | 40,481,147 | | | 40,585,017 |
End of period* | | $ | 39,223,626 | | $ | 40,481,147 |
* Includes undistributed and (overdistributed) net investment income, respectively, of: | | | $707,428 | | | $(21,633) |
See Notes to Financial Statements.
| | |
| Legg Mason Western Asset Variable Diversified Strategic Income Portfolio 2010 Semi-Annual Report | | 17 |
Financial highlights
| | | | | | | | | | | | | | | | | | |
| For a share of beneficial interest outstanding throughout each year ended December 31, unless otherwise noted: | |
| | | 20101,2 | | | 20092 | | | 20082 | | | 20072 | | | 20062 | | | 20052 | |
| | | | | | |
| Net asset value, beginning of period | | $ 7.83 | | | $ 6.88 | | | $ 8.62 | | | $ 8.93 | | | $ 9.01 | | | $ 9.30 | |
| | | | | | |
| Income (loss) from operations: | | | | | | | | | | | | | | | | | | |
Net investment income | | 0.16 | | | 0.40 | | | 0.44 | | | 0.47 | | | 0.48 | | | 0.46 | |
Net realized and unrealized gain (loss) | | 0.41 | | | 0.96 | | | (1.65) | | | (0.30) | | | 0.01 | | | (0.22) | |
Total income (loss) from operations | | 0.57 | | | 1.36 | | | (1.21) | | | 0.17 | | | 0.49 | | | 0.24 | |
| | | | | | |
| Less distributions from: | | | | | | | | | | | | | | | | | | |
Net investment income | | (0.02) | | | (0.41) | | | (0.53) | | | (0.48) | | | (0.54) | | | (0.53) | |
Net realized gains | | — | | | — | | | — | | | — | | | (0.03) | | | — | |
Total distributions | | (0.02) | | | (0.41) | | | (0.53) | | | (0.48) | | | (0.57) | | | (0.53) | |
| | | | | | |
| Net asset value, end of period | | $8.38 | | | $7.83 | | | $6.88 | | | $8.62 | | | $8.93 | | | $9.01 | |
Total return3 | | 7.23 | % | | 19.84 | % | | (13.98) | % | | 1.98 | % | | 5.39 | % | | 2.56 | % |
| | | | | | |
| Net assets, end of period (000s) | | $39,224 | | | $40,481 | | | $40,585 | | | $62,667 | | | $76,178 | | | $89,522 | |
| | | | | | |
| Ratios to average net assets: | | | | | | | | | | | | | | | | | | |
Gross expenses | | 0.96 | %4 | | 0.95 | % | | 1.07 | % | | 0.85 | % | | 0.75 | %5 | | 0.77 | % |
Net expenses6 | | 0.96 | 4 | | 0.95 | | | 1.07 | | | 0.85 | | | 0.74 | 5,7 | | 0.77 | |
Net investment income | | 3.98 | 4 | | 5.33 | | | 5.43 | | | 5.23 | | | 5.24 | | | 4.87 | |
| | | | | | |
| Portfolio turnover rate8 | | 70 | % | | 53 | % | | 29 | % | | 67 | % | | 224 | % | | 83 | % |
| 1 | For the six months ended June 30, 2010 (unaudited). |
| 2 | Per share amounts have been calculated using the average shares method. |
| 3 | Performance figures may reflect fee waivers and/or expense reimbursements. In the absence of fee waivers and/or expense reimbursements, the total return would have been lower. Total returns do not reflect expenses associated with the separate accounts such as administrative fees, account charges and surrender charges which, if reflected, would reduce the total return for all periods shown. Past performance is no guarantee of future results. Total returns for periods of less than one year are not annualized. |
| 5 | Included in the expense ratios are certain non-recurring restructuring (and reorganization, if applicable) fees that were incurred by the Portfolio during the period. Without these fees, the gross and net expense ratios would have been 0.73% and 0.72%, respectively. |
| 6 | The impact of compensating balance arrangements, if any, was less than 0.01%. |
| 7 | Reflects fee waivers and/or expense reimbursements. |
| 8 | Excluding mortgage dollar roll transactions. If mortgage dollar roll transactions had been included, the portfolio turnover rate would have been 203%, 151%, 261%, 416%, 632%, and 538% for the six months ended June 30, 2010 and the years ended December 31, 2009, 2008, 2007, 2006 and 2005, respectively. |
See Notes to Financial Statements.
| | |
| 18 | | Legg Mason Western Asset Variable Diversified Strategic Income Portfolio 2010 Semi-Annual Report |
Notes to financial statements (unaudited)
1. Organization and significant accounting policies
Legg Mason Western Asset Variable Diversified Strategic Income Portfolio (the “Portfolio”) is a separate diversified investment series of Legg Mason Partners Variable Income Trust (the “Trust”). The Trust, a Maryland statutory trust, is registered under the Investment Company Act of 1940, as amended (the “1940 Act”), as an open-end management investment company.
Shares of the Portfolio may only be purchased or redeemed through variable annuity contracts and variable life insurance policies offered by the separate accounts of participating insurance companies or through eligible pension or other qualified plans.
The following are significant accounting policies consistently followed by the Portfolio and are in conformity with U.S. generally accepted accounting principles (“GAAP”). Estimates and assumptions are required to be made regarding assets, liabilities and changes in net assets resulting from operations when financial statements are prepared. Changes in the economic environment, financial markets and any other parameters used in determining these estimates could cause actual results to differ. Subsequent events have been evaluated through the date the financial statements were issued.
(a) Investment valuation. Debt securities are valued at the mean between the last quoted bid and asked prices provided by an independent pricing service which are based on transactions in debt obligations, quotations from bond dealers, market transactions in comparable securities and various other relationships between securities. Publicly traded foreign government debt securities are typically traded internationally in the over-the-counter market, and are valued at the mean between the last quoted bid and asked prices as of the close of business of that market. Futures contracts are valued daily at the settlement price established by the board of trade or exchange on which they are traded. Equity securities for which market quotations are available are valued at the last reported sale price or official closing price on the primary market or exchange on which they trade. When prices are not readily available, or are determined not to reflect fair value, such as when the value of a security has been significantly affected by events after the close of the exchange or market on which the security is principally traded, but before the Portfolio calculates its net asset value, the Portfolio values these investments at fair value as determined in accordance with the procedures approved by the Portfolio’s Board of Trustees. Short-term obligations with maturities of 60 days or less are valued at amortized cost, which approximates fair value.
The Portfolio has adopted Financial Accounting Standards Board Codification Topic 820 (“ASC Topic 820”). ASC Topic 820 establishes a single definition of fair value, creates a three-tier hierarchy as a framework for measuring fair value based on inputs used to value the Portfolio’s investments, and requires additional disclosure about fair value. The hierarchy of inputs is summarized below.
| Ÿ | | Level 1 — quoted prices in active markets for identical investments |
| Ÿ | | Level 2 — other significant observable inputs (including quoted prices for similar investments, interest rates, prepayment speeds, credit risk, etc.) |
| Ÿ | | Level 3 — significant unobservable inputs (including the Portfolio’s own assumptions in determining the fair value of investments) |
The inputs or methodology used for valuing securities are not necessarily an indication of the risk associated with investing in those securities.
The Portfolio uses valuation techniques to measure fair value that are consistent with the market approach and/or income approach, depending on the type of the security and the particular circumstance. The market approach uses prices and other relevant information generated by market transactions involving identical or comparable securities. The income approach uses valuation techniques to convert future amounts of cash flow to a single present amount.
| | |
| Legg Mason Western Asset Variable Diversified Strategic Income Portfolio 2010 Semi-Annual Report | | 19 |
The following is a summary of the inputs used in valuing the Portfolio’s assets carried at fair value:
| | | | | | | | | | | | | |
| Description | | Quoted Prices
(Level 1) | | Other Significant
Observable Inputs
(Level 2) | | Significant
Unobservable
Inputs
(Level 3) | | | Total |
| Long-term investments†: | | | | | | | | | | | | | |
Corporate bonds & notes | | | — | | $ | 14,734,252 | | $ | 0 | * | | $ | 14,734,252 |
Asset-backed securities | | | — | | | 1,180,959 | | | — | | | | 1,180,959 |
Collateralized mortgage obligations | | | — | | | 5,579,831 | | | 28,008 | | | | 5,607,839 |
Mortgage-backed securities | | | — | | | 9,725,182 | | | — | | | | 9,725,182 |
Municipal bonds | | | — | | | 160,049 | | | — | | | | 160,049 |
Sovereign bonds | | | — | | | 947,531 | | | — | | | | 947,531 |
U.S. government & agency obligations | | | — | | | 6,737,779 | | | — | | | | 6,737,779 |
U.S. treasury inflation protected security | | | — | | | 184,121 | | | — | | | | 184,121 |
Common stock | | | — | | | — | | | 656 | | | | 656 |
Preferred stocks | | $ | 4,362 | | | 61,403 | | | — | | | | 65,765 |
Warrants | | | — | | | 148 | | | — | | | | 148 |
Purchased options | | | 14,688 | | | — | | | — | | | | 14,688 |
| Total long-term investments | | $ | 19,050 | | $ | 39,311,255 | | $ | 28,664 | | | $ | 39,358,969 |
| Short-term investments† | | | — | | | 3,880,961 | | | — | | | | 3,880,961 |
| Total investments | | $ | 19,050 | | $ | 43,192,216 | | $ | 28,664 | | | $ | 43,239,930 |
| Other financial instruments: | | | | | | | | | | | | | |
Futures contracts | | | (22,804) | | | — | | | — | | | | (22,804) |
Forward foreign currency contracts | | | — | | | 22,703 | | | — | | | | 22,703 |
Written options | | | (15,019) | | | — | | | — | | | | (15,019) |
| Total other financial instruments | | $ | (37,823) | | $ | 22,703 | | | — | | | $ | (15,120) |
| Total | | $ | (18,773) | | $ | 43,214,919 | | $ | 28,664 | | | $ | 43,224,810 |
| † | See Schedule of Investments for additional detailed categorizations. |
Following is a reconciliation of investments in which significant unobservable inputs (Level 3) were used in determining fair value:
| | | | | | | | | | | | | | | | | |
| Investments in Securities | | Corporate
Bonds & Notes | | | Collateralized
Mortgage
Obligations | | Common
Stock | | Warrants | | | Total |
| Balance as of December 31, 2009 | | $ | 0 | * | | | — | | $ | 621 | | $ | 0 | * | | $ | 621 |
| Accrued premiums/discounts | | | 42 | | | | — | | | — | | | — | | | | 42 |
| Realized gain/(loss)1 | | | (49,980) | | | | — | | | (27) | | | (3,947) | | | | (53,954) |
| Change in unrealized appreciation (depreciation)2 | | | 49,938 | | | | — | | | 62 | | | 4,095 | | | | 54,095 |
| Net purchases (sales) | | | — | | | | — | | | — | | | — | | | | — |
| Transfers in to Level 3 | | | — | | | $ | 28,008 | | | — | | | — | | | | 28,008 |
| Transfers out of Level 3 | | | — | | | | — | | | — | | | (148) | | | | (148) |
| Balance as of June 30, 2010 | | $ | 0 | * | | $ | 28,008 | | $ | 656 | | | — | | | $ | 28,664 |
| Net change in unrealized appreciation (depreciation) for investments in securities still held at June 30, 20102 | | $ | 0 | * | | $ | 0 | | $ | 62 | | | — | | | $ | 62 |
| 1 | This amount is included in net realized gain (loss) from investment transactions in the accompanying Statement of Operations. |
| 2 | This amount is included in the change in net unrealized appreciation (depreciation) in the accompanying Statement of Operations. Change in unrealized appreciation (depreciation) includes net unrealized appreciation (depreciation) resulting from changes in investment values during the reporting period and the reversal of previously recorded unrealized appreciation (depreciation) when gains or losses are realized. |
(b) Repurchase agreements. The Portfolio may enter into repurchase agreements with institutions that its investment adviser has determined are creditworthy. Each repurchase agreement is recorded at cost. Under the terms of a typical repurchase agreement, a portfolio takes possession of an underlying debt obligation subject to an obligation of the seller to repurchase, and of the portfolio to resell, the obligation at an agreed-upon price and time, thereby determining the yield during a portfolio’s holding period. When entering into repurchase agreements, it is the Portfolio’s policy that its custodian or a third party custodian, acting on the Portfolio’s behalf, take possession of the underlying collateral securities, the market value of which, at all
| | |
| 20 | | Legg Mason Western Asset Variable Diversified Strategic Income Portfolio 2010 Semi-Annual Report |
Notes to financial statements (unaudited) (cont’d)
times, at least equals the principal amount of the repurchase transaction, including accrued interest. To the extent that any repurchase transaction maturity exceeds one business day, the value of the collateral is marked to market and measured against the value of the agreement in an effort to ensure the adequacy of the collateral. If the counterparty defaults, the Portfolio generally has the right to use the collateral to satisfy the terms of the repurchase transaction. However, if the market value of the collateral declines during the period in which the Portfolio seeks to assert its rights or if bankruptcy proceedings are commenced with respect to the seller of the security, realization of the collateral by the Portfolio may be delayed or limited.
(c) Futures contracts. The Portfolio may use futures contracts to gain exposure to, or hedge against, changes in the value of interest rates or foreign currencies. A futures contract represents a commitment for the future purchase or sale of an asset at a specified price on a specified date.
Upon entering into a futures contract, the Portfolio is required to deposit cash or cash equivalents with a broker in an amount equal to a certain percentage of the contract amount. This is known as the “initial margin” and subsequent payments (“variation margin”) are made or received by the Portfolio each day, depending on the daily fluctuation in the value of the contract. For certain futures, including foreign denominated futures, variation margin is not settled daily, but is recorded as a net variation margin payable or receivable. Futures contracts are valued daily at the settlement price established by the board of trade or exchange on which they are traded. The daily changes in contract value are recorded as unrealized gains or losses in the Statement of Operations and the Portfolio recognizes a realized gain or loss when the contract is closed.
Futures contracts involve, to varying degrees, risk of loss in excess of the amounts reflected in the financial statements. In addition, there is the risk that the Portfolio may not be able to enter into a closing transaction because of an illiquid secondary market.
(d) Written options. When the Portfolio writes an option, an amount equal to the premium received by the Portfolio is recorded as a liability, the value of which is marked to market daily to reflect the current market value of the option written. If the option expires, the premium received is recorded as a realized gain. When a written call option is exercised, the difference between the premium received plus the option exercise price and the Portfolio’s basis in the underlying security (in the case of a covered written call option), or the cost to purchase the underlying security (in the case of an uncovered written call option), including brokerage commission, is recognized as a realized gain or loss. When a written put option is exercised, the amount of the premium received is subtracted from the cost of the security purchased by the Portfolio from the exercise of the written put option to form the Portfolio’s basis in the underlying security purchased. The writer or buyer of an option traded on an exchange can liquidate the position before the exercise of the option by entering into a closing transaction. The cost of a closing transaction is deducted from the original premium received resulting in a realized gain or loss to the Portfolio.
The risk in writing a covered call option is that the Portfolio may forego the opportunity of profit if the market price of the underlying security increases and the option is exercised. The risk in writing a put option is that the Portfolio may incur a loss if the market price of the underlying security decreases and the option is exercised. The risk in writing a call option is that the Portfolio is exposed to the risk of loss if the market price of the underlying security increases. In addition, there is the risk that the Portfolio may not be able to enter into a closing transaction because of an illiquid secondary market.
(e) Inflation-Indexed bonds. Inflation-indexed bonds are fixed-income securities whose principal value or interest rate is periodically adjusted according to the rate of inflation. As the index measuring inflation changes, the principal value or interest rate of inflation-indexed bonds will be adjusted accordingly. Inflation adjustments to the principal amount of inflation-indexed bonds are reflected as an increase or decrease to investment income on the Statement of Operations. Repayment of the original bond principal upon maturity (as adjusted for inflation) is guaranteed in the case of U.S. Treasury inflation-indexed bonds. For bonds that do not provide a similar guarantee, the adjusted principal value of the bond repaid at maturity may be less than the original principal.
(f) Securities traded on a to-be-announced basis. The Portfolio may trade securities on a to-be-announced (“TBA”) basis. In a TBA transaction, the Portfolio commits to purchasing or selling securities which have not yet been issued by the issuer and for which specific information, such as the face amount, maturity date
| | |
| Legg Mason Western Asset Variable Diversified Strategic Income Portfolio 2010 Semi-Annual Report | | 21 |
and underlying pool of investments in U.S. government agency mortgage pass-through securities, is not announced. Securities purchased on a TBA basis are not settled until they are delivered to the Portfolio. Beginning on the date the Portfolio enters into a TBA transaction, cash, U.S. government securities or other liquid high-grade debt obligations are segregated in an amount equal in value to the purchase price of the TBA security. These securities are subject to market fluctuations and their current value is determined in the same manner as for other securities.
(g) Mortgage dollar rolls. The Portfolio may enter into mortgage dollar rolls in which the Portfolio sells mortgage-backed securities for delivery in the current month, realizing a gain or loss, and simultaneously contracts to repurchase substantially similar (same type, coupon and maturity) securities to settle on a specified future date.
The Portfolio executes its mortgage dollar rolls entirely in the TBA market, whereby the Portfolio makes a forward commitment to purchase a security and, instead of accepting delivery, the position is offset by a sale of the security with a simultaneous agreement to repurchase at a future date. The Portfolio accounts for mortgage dollar rolls as purchases and sales.
The risk of entering into mortgage dollar rolls is that the market value of the securities the Portfolio is obligated to repurchase under the agreement may decline below the repurchase price. In the event the buyer of securities under a mortgage dollar roll files for bankruptcy or becomes insolvent, the Portfolio’s use of the proceeds of the mortgage dollar roll may be restricted pending a determination by the counterparty, or its trustee or receiver, whether to enforce the Portfolio’s obligation to repurchase the securities.
(h) Foreign currency translation. Investment securities and other assets and liabilities denominated in foreign currencies are translated into U.S. dollar amounts based upon prevailing exchange rates on the date of valuation. Purchases and sales of investment securities and income and expense items denominated in foreign currencies are translated into U.S. dollar amounts based upon prevailing exchange rates on the respective dates of such transactions.
The Portfolio does not isolate that portion of the results of operations resulting from fluctuations in foreign exchange rates on investments from the fluctuations arising from changes in market prices of securities held. Such fluctuations are included with the net realized and unrealized gain or loss on investments.
Net realized foreign exchange gains or losses arise from sales of foreign currencies, including gains and losses on forward foreign currency contracts, currency gains or losses realized between the trade and settlement dates on securities transactions, and the difference between the amounts of dividends, interest, and foreign withholding taxes recorded on the Portfolio’s books and the U.S. dollar equivalent of the amounts actually received or paid. Net unrealized foreign exchange gains and losses arise from changes in the values of assets and liabilities, other than investments in securities, on the date of valuation, resulting from changes in exchange rates.
Foreign security and currency transactions may involve certain considerations and risks not typically associated with those of U.S. dollar denominated transactions as a result of, among other factors, the possibility of lower levels of governmental supervision and regulation of foreign securities markets and the possibility of political or economic instability.
(i) Forward foreign currency contracts. The Portfolio may enter into a forward foreign currency contract to hedge against foreign currency exchange rate risk on its non-U.S. dollar denominated securities or to facilitate settlement of a foreign currency denominated portfolio transaction. A forward foreign currency contract is an agreement between two parties to buy and sell a currency at a set price with delivery and settlement at a future date. The contract is marked-to-market daily and the change in value is recorded by the Portfolio as an unrealized gain or loss. When a forward foreign currency contract is closed, through either delivery or offset by entering into another forward foreign currency contract, the Portfolio recognizes a realized gain or loss equal to the difference between the value of the contract at the time it was opened and the value of the contract at the time it is closed.
Forward foreign currency contracts involve elements of market risk in excess of the amounts reflected on the Statement of Assets and Liabilities. The Portfolio bears the risk of an unfavorable change in the foreign exchange rate underlying the forward foreign currency contract. Risks may also arise upon entering into these contracts from the potential inability of the counterparties to meet the terms of their contracts.
| | |
| 22 | | Legg Mason Western Asset Variable Diversified Strategic Income Portfolio 2010 Semi-Annual Report |
Notes to financial statements (unaudited) (cont’d)
(j) Credit and market risk. The Portfolio invests in high-yield and emerging market instruments that are subject to certain credit and market risks. The yields of high-yield and emerging market debt obligations reflect, among other things, perceived credit and market risks. The Portfolio’s investment in securities rated below investment grade typically involve risks not associated with higher rated securities including, among others, greater risk related to timely and ultimate payment of interest and principal, greater market price volatility and less liquid secondary market trading. The consequences of political, social, economic or diplomatic changes may have disruptive effects on the market prices of investments held by the Portfolio. The Portfolio’s investment in non-U.S. dollar denominated securities may also result in foreign currency losses caused by devaluations and exchange rate fluctuations.
Investments in securities that are collateralized by residential real estate mortgages are subject to certain credit and liquidity risks. When market conditions result in an increase in default rates of the underlying mortgages and foreclosure values of underlying real estate properties are materially below the outstanding amount of these underlying mortgages, collection of the full amount of accrued interest and principal on these investments may be doubtful. Such market conditions may significantly impair the value and liquidity of these investments and may result in a lack of correlation between their credit ratings and values.
(k) Other risks. Consistent with its objective to seek high current income, the Portfolio may invest in instruments whose values and interest rates are linked to foreign currencies, interest rates, indices or some other financial indicator. The value at maturity or interest rates for these instruments will increase or decrease according to the change in the indicator to which they are indexed, amongst other factors. These securities are generally more volatile in nature, and the risk of loss of principal may be greater.
(l) Security transactions and investment income. Security transactions are accounted for on a trade date basis. Interest income, adjusted for amortization of premium and accretion of discount, is recorded on the accrual basis. Dividend income is recorded on the ex-dividend date. The cost of investments sold is determined by use of the specific identification method. To the extent any issuer defaults or a credit event occurs that impacts the issuer, the Portfolio may halt any additional interest income accruals and consider the realizability of interest accrued up to the date of default or credit event.
(m) Distributions to shareholders. Distributions from net investment income and distributions of net realized gains, if any, are declared at least annually. Distributions to shareholders of the Portfolio are recorded on the ex-dividend date and are determined in accordance with income tax regulations, which may differ from GAAP.
(n) Compensating balance arrangements. The Portfolio has an arrangement with its custodian bank whereby a portion of the custodian’s fees is paid indirectly by credits earned on the Portfolio’s cash on deposit with the bank. The amount is shown as a reduction of expenses in the Statement of Operations.
(o) Federal and other taxes. It is the Portfolio’s policy to comply with the federal income and excise tax requirements of the Internal Revenue Code of 1986 (the “Code”), as amended, applicable to regulated investment companies. Accordingly, the Portfolio intends to distribute its taxable income and net realized gains, if any, to shareholders in accordance with timing requirements imposed by the Code. Therefore, no federal income tax provision is required in the Portfolio’s financial statements.
Management has analyzed the Portfolio’s tax positions taken on federal income tax returns for all open tax years and has concluded that as of June 30, 2010, no provision for income tax is required in the Portfolio’s financial statements. The Portfolio’s federal and state income and federal excise tax returns for tax years for which the applicable statutes of limitations have not expired are subject to examination by Internal Revenue Service and state departments of revenue.
(p) Reclassification. GAAP requires that certain components of net assets be reclassified to reflect permanent differences between financial and tax reporting. These reclassifications have no effect on net assets or net asset value per share.
| | |
| Legg Mason Western Asset Variable Diversified Strategic Income Portfolio 2010 Semi-Annual Report | | 23 |
2. Investment management agreement and other transactions with affiliates
Legg Mason Partners Fund Advisor, LLC (“LMPFA”) is the Portfolio’s investment manager. Western Asset Management Company (“Western Asset”), Western Asset Management Company Limited (“Western Asset Limited”), Western Asset Management Company Pte. Ltd. (“Western Singapore”) and Western Asset Management Company Ltd (“Western Japan”) are the Portfolio’s subadvisers. LMPFA, Western Asset, Western Asset Limited, Western Singapore and Western Japan are wholly-owned subsidiaries of Legg Mason, Inc. (“Legg Mason”).
Under the investment management agreement, the Portfolio pays an investment management fee, calculated daily and paid monthly, in accordance with the following breakpoint schedule:
| | | |
| Average Daily Net Assets | | Annual Rate | |
| First $1 billion | | 0.650 | % |
| Next $1 billion | | 0.625 | |
| Next $3 billion | | 0.600 | |
| Next $5 billion | | 0.575 | |
| Over $10 billion | | 0.550 | |
LMPFA provides administrative and certain oversight services to the Portfolio. LMPFA delegates to the subadvisers the day-to-day portfolio management of the Portfolio. For its services, LMPFA pays Western Asset 70% of the net management fee it receives from the Portfolio. In turn, Western Asset pays Western Asset Limited, Western Singapore and Western Japan a sub-advisory fee of 0.30% on the assets managed by Western Asset Limited, Western Singapore and Western Japan.
Legg Mason Investor Services, LLC, a wholly-owned broker-dealer subsidiary of Legg Mason, serves as the Portfolio’s sole and exclusive distributor.
The Portfolio had adopted an unfunded, non-qualified deferred compensation plan (the “Plan”) which allowed non-interested trustees (“Independent Trustees”) to defer the receipt of all or a portion of their fees earned until a later date specified by the Independent Trustees. The deferred balances are reported in the Statement of Assets and Liabilities under Trustees’ fees payable and are considered a general obligation of the Portfolio and any payments made pursuant to the Plan will be made from the Portfolio’s general assets. The Plan was terminated effective January 1, 2007. This change had no effect on fees previously deferred. As of June 30, 2010, the Portfolio had accrued $1,030 as deferred compensation payable.
All officers and one Trustee of the Trust are employees of Legg Mason or its affiliates and do not receive compensation from the Trust.
3. Investments
During the six months ended June 30, 2010, the aggregate cost of purchases and proceeds from sales of investments (excluding short-term investments) and U.S Government & Agency Obligations were as follows:
| | | | | | |
| | | Investments | | U.S. Government & Agency Obligations |
| Purchases | | $ | 2,847,715 | | $ | 76,472,469 |
| Sales | | | 3,838,777 | | | 74,381,282 |
At June 30, 2010, the aggregate gross unrealized appreciation and depreciation of investments for federal income tax purposes were substantially as follows:
| | | |
| Gross unrealized appreciation | | $ | 1,880,549 |
| Gross unrealized depreciation | | | (5,695,647) |
| Net unrealized depreciation | | $ | (3,815,098) |
| | |
| 24 | | Legg Mason Western Asset Variable Diversified Strategic Income Portfolio 2010 Semi-Annual Report |
Notes to financial statements (unaudited) (cont’d)
At June 30, 2010, the Portfolio had the following open futures contracts:
| | | | | | | | | | | | | |
| | | Number of
Contracts | | Expiration
Date | | Basis Value | | Market Value | | Unrealized Gain/(Loss) |
| Contracts to Buy: | | | | | | | | | | | | | |
| 90-Day Eurodollar | | 10 | | 9/10 | | $ | 2,479,832 | | $ | 2,483,625 | | $ | 3,793 |
| U.S. Treasury 5-Year Notes | | 17 | | 9/10 | | | 1,984,758 | | | 2,011,976 | | | 27,218 |
| | | | | | | | | | | | | | 31,011 |
| | | | | |
| Contracts to Sell: | | | | | | | | | | | | | |
| U.S. Treasury 10-Year Notes | | 6 | | 9/10 | | $ | 730,105 | | $ | 735,281 | | $ | (5,176) |
| U.S. Treasury 30-Year Bonds | | 8 | | 9/10 | | | 975,177 | | | 1,020,000 | | | (44,823) |
| Ultra Long U.S. Treasury Bonds | | 1 | | 9/10 | | | 131,997 | | | 135,813 | | | (3,816) |
| | | | | | | | | | | | | | (53,815) |
| Net unrealized loss on open futures contracts | | | | | | | | | | | | $ | (22,804) |
During the six months ended June 30, 2010, written option transactions for the Portfolio were as follows:
| | | | | |
| | | Number of Contracts | | Premiums |
| Written options, outstanding December 31, 2009 | | 47 | | $ | 20,635 |
| Options written | | 56 | | | 24,118 |
| Options closed | | (54) | | | (24,053) |
| Options exercised | | (8) | | | (2,161) |
| Options expired | | (22) | | | (7,663) |
| Written options, outstanding June 30, 2010 | | 19 | | $ | 10,876 |
At June 30, 2010, the Portfolio had the following open forward foreign currency contracts:
| | | | | | | | | | | | |
| Foreign Currency | | Counterparty | | Local Currency | | Market Value | | Settlement
Date | | Unrealized Gain/(Loss) |
| Contracts to Buy: | | | | | | | | | | | | |
| Euro | | Citibank N.A. | | 150,000 | | $ | 183,470 | | 8/17/10 | | $ | (7,114) |
| Euro | | Citibank N.A. | | 320,000 | | | 391,402 | | 8/17/10 | | | (3,152) |
| | | | | | | | | | | | | (10,266) |
| | | | | |
| Contracts to Sell: | | | | | | | | | | | | |
| Euro | | Citibank N.A. | | 780,000 | | $ | 954,042 | | 8/17/10 | | $ | 37,088 |
| Euro | | Citibank N.A. | | 310,000 | | | 379,171 | | 8/17/10 | | | 16,045 |
| Japanese Yen | | Citibank N.A. | | 17,070,000 | | | 193,208 | | 8/17/10 | | | (6,099) |
| Japanese Yen | | Goldman Sachs | | 18,846,400 | | | 213,315 | | 8/17/10 | | | (14,065) |
| | | | | | | | | | | | | 32,969 |
| Net unrealized gain on open forward foreign currency contracts | | $ | 22,703 |
At June 30, 2010, the Portfolio held TBA securities with a total cost of $4,332,461.
4. Derivative instruments and hedging activities
Financial Accounting Standards Board Codification Topic 815 requires enhanced disclosure about an entity’s derivative and hedging activities.
Below is a table, grouped by derivative type that provides information about the fair value and the location of derivatives within the Statement of Assets and Liabilities at June 30, 2010.
| | | | | | | | | |
| ASSET DERIVATIVES1 |
| | | Interest Rate
Contracts Risk | | Foreign Exchange
Contracts Risk | | Total |
| Purchased options2 | | $ | 14,688 | | | — | | $ | 14,688 |
| Futures contracts3 | | | 31,011 | | | — | | | 31,011 |
| Forward foreign currency contracts | | | — | | $ | 53,133 | | | 53,133 |
| Total | | $ | 45,699 | | $ | 53,133 | | $ | 98,832 |
| | |
| Legg Mason Western Asset Variable Diversified Strategic Income Portfolio 2010 Semi-Annual Report | | 25 |
| | | | | | | | | |
|
| LIABILITY DERIVATIVES1 |
| | | Interest Rate
Contracts Risk | | Foreign Exchange
Contracts Risk | | Total |
| Written options | | $ | 15,019 | | | — | | $ | 15,019 |
| Futures contracts3 | | | 53,815 | | | — | | | 53,815 |
| Forward foreign currency contracts | | | — | | $ | 30,430 | | | 30,430 |
| Total | | $ | 68,834 | | $ | 30,430 | | $ | 99,264 |
| 1 | Generally, the balance sheet location for asset derivatives is receivables/net unrealized appreciation(depreciation) and for liability derivatives is payables/net unrealized appreciation(depreciation). |
| 2 | Market value of purchased options is reported in Investments at value in the Statement of Assets and Liabilities. |
| 3 | Includes cumulative appreciation/depreciation of futures contracts as reported in the footnotes. Only variation margin is reported within the receivables and/or payables of the Statement of Assets and Liabilities. |
The following tables provide information about the effect of derivatives and hedging activities on the Portfolio’s Statement of Operations for the six months ended June 30, 2010. The first table provides additional detail about the amounts and sources of gains/(losses) realized on derivatives during the period. The second table provides additional information about the changes in unrealized appreciation/(depreciation) resulting from the Portfolio’s derivatives and hedging activities during the period.
| | | | | | | | | |
| AMOUNT OF REALIZED GAIN OR (LOSS) ON DERIVATIVES RECOGNIZED |
| | | Interest Rate
Contracts Risk | | Foreign Exchange
Contracts Risk | | Total |
| Purchased options | | $ | (12,324) | | | — | | $ | (12,324) |
| Written options | | | 16,542 | | | — | | | 16,542 |
| Futures contracts | | | 110,896 | | | — | | | 110,896 |
| Forward foreign currency contracts | | | — | | $ | 69,064 | | | 69,064 |
| Total | | $ | 115,114 | | $ | 69,064 | | $ | 184,178 |
| | | | | | | | | |
| CHANGE IN UNREALIZED APPRECIATION/DEPRECIATION ON DERIVATIVES RECOGNIZED |
| | | Interest Rate
Contracts Risk | | Foreign Exchange
Contracts Risk | | Total |
| Purchased options | | $ | 9,254 | | | — | | $ | 9,254 |
| Written options | | | (7,697) | | | — | | | (7,697) |
| Futures contracts | | | 5,279 | | | — | | | 5,279 |
| Forward foreign currency contracts | | | — | | $ | 22,703 | | | 22,703 |
| Total | | $ | 6,836 | | $ | 22,703 | | $ | 29,539 |
During the six months ended June 30, 2010, the volume of derivative activity for the Portfolio was as follows:
| | | |
| | | Average market
value |
| Purchased options | | $ | 5,795 |
| Written options | | | 11,700 |
| Futures contracts (to buy) | | | 5,408,129 |
| Futures contracts (to sell) | | | 1,574,931 |
| Forward foreign currency contracts (to buy) | | | 164,589 |
| Forward foreign currency contracts (to sell) | | | 733,565 |
The Portfolio has several credit related contingent features that if triggered would allow its derivatives counterparties to close out and demand payment or additional collateral to cover their exposure from the Portfolio. Credit related contingent features are established between the Portfolio and its derivatives counterparties to reduce the risk that the Portfolio will not fulfill its payment obligations to its counterparties. These triggering features include, but are not limited to, a percentage decrease in the Portfolio’s net assets and/or a percentage decrease in the Portfolio’s Net Asset Value or NAV. The contingent features are established within the Portfolio’s International Swap and Derivatives Association, Inc. master agreements which govern positions in swaps, over-the-counter options, and forward currency exchange contracts for each individual counterparty.
| | |
| 26 | | Legg Mason Western Asset Variable Diversified Strategic Income Portfolio 2010 Semi-Annual Report |
Notes to financial statements (unaudited) (cont’d)
5. Shares of beneficial interest
At June 30, 2010, the Trust had an unlimited number of shares of beneficial interest authorized with a par value of $0.00001 per share.
Transactions in shares of the Portfolio were as follows:
| | | | |
| | | Six Months Ended
June 30, 2010 | | Year Ended December 31, 2009 |
| Shares sold | | 36,462 | | 89,404 |
| Shares issued on reinvestment | | 9,036 | | 262,484 |
| Shares repurchased | | (538,919) | | (1,075,913) |
| Net decrease | | (493,421) | | (724,025) |
6. Capital loss carryforward
As of December 31, 2009, the Portfolio had a net capital loss carryforward of approximately $4,414,159, of which $2,118,955 expires in 2010, $1,079,367 expires in 2014 and $1,215,837 expires in 2017. These amounts will be available to offset any future taxable capital gains.
7. Regulatory matters
On May 31, 2005, the U.S. Securities and Exchange Commission (“SEC”) issued an order in connection with the settlement of an administrative proceeding against Smith Barney Fund Management LLC (“SBFM”), a wholly-owned subsidiary of Legg Mason and the then investment adviser or manager to the Portfolio, and Citigroup Global Markets Inc. (“CGM”), a former distributor of the Portfolio, relating to the appointment of an affiliated transfer agent for the Smith Barney family of mutual funds, including the Portfolio (the “Affected Funds”).
The SEC order found that SBFM and CGM willfully violated Section 206(1) of the Investment Advisers Act of 1940, as amended, and the rules promulgated there under (the “Advisers Act”). Specifically, the order found that SBFM and CGM knowingly or recklessly failed to disclose to the boards of the Affected Funds in 1999 when proposing a new transfer agent arrangement with an affiliated transfer agent that: First Data Investors Services Group (“First Data”), the Affected Funds’ then-existing transfer agent, had offered to continue as transfer agent and do the same work for substantially less money than before; and that Citigroup Asset Management (“CAM”), the Citigroup business unit that, at the time, included the Affected Funds’ investment manager and other investment advisory companies, had entered into a side letter with First Data under which CAM agreed to recommend the appointment of First Data as sub-transfer agent to the affiliated transfer agent in exchange for, among other things, a guarantee by First Data of specified amounts of asset management and investment banking fees to CAM and CGM. The order also found that SBFM and CGM willfully violated Section 206(2) of the Advisers Act by virtue of the omissions discussed above and other misrepresentations and omissions in the materials provided to the Affected Funds’ boards, including the failure to make clear that the affiliated transfer agent would earn a high profit for performing limited functions while First Data continued to perform almost all of the transfer agent functions, and the suggestion that the proposed arrangement was in the Affected Funds’ best interests and that no viable alternatives existed.
SBFM and CGM do not admit or deny any wrongdoing or liability. The settlement does not establish wrongdoing or liability for purposes of any other proceeding. The SEC censured SBFM and CGM and ordered them to cease and desist from violations of Sections 206(1) and 206(2) of the Advisers Act. The order required Citigroup to pay $208.1 million, including $109 million in disgorgement of profits, $19.1 million in interest, and a civil money penalty of $80 million. Approximately $24.4 million has already been paid to the Affected Funds, primarily through fee waivers. The remaining $183.7 million, including the penalty, has been paid to the U.S. Treasury and will be distributed pursuant to a plan submitted for the approval of the SEC. The order also required that transfer agency fees received from the Affected Funds since December 1, 2004, less certain expenses, be placed in escrow and provided that a portion of such fees might be subsequently distributed in accordance with the terms of the order. On April 3, 2006, an aggregate amount of approximately $9 million held in escrow was distributed to the Affected Funds.
| | |
| Legg Mason Western Asset Variable Diversified Strategic Income Portfolio 2010 Semi-Annual Report | | 27 |
The order required SBFM to recommend a new transfer agent contract to the Affected Funds’ boards within 180 days of the entry of the order; if a Citigroup affiliate submitted a proposal to serve as transfer agent or sub-transfer agent, SBFM and CGM would have been required, at their expense, to engage an independent monitor to oversee a competitive bidding process. On November 21, 2005, and within the specified timeframe, the Affected Funds’ boards selected a new transfer agent for the Affected Funds. No Citigroup affiliate submitted a proposal to serve as transfer agent. Under the order, SBFM also must comply with an amended version of a vendor policy that Citigroup instituted in August 2004.
Although there can be no assurance, LMPFA does not believe that this matter will have a material adverse effect on the Affected Funds.
On December 1, 2005, Citigroup completed the sale of substantially all of its global asset management business, including SBFM, to Legg Mason.
On May 12, 2010, the SEC approved the disbursement of approximately $108.6 million previously paid to the U.S. Treasury, reflecting the disgorgement of Citigroup’s profits, plus interest. On May 26, 2010, these amounts were disbursed to the Affected Funds pursuant to a Plan of Distribution approved by the SEC. The Portfolio has received $8,502 related to this distribution. All other amounts not previously distributed were retained by the U.S. Treasury.
8. Legal matters
Beginning in May 2004, class action lawsuits alleging violations of the federal securities laws were filed against CGM, a former distributor of the Portfolio, and other affiliated funds (collectively, the “Funds”) and a number of its then affiliates, including SBFM and Salomon Brothers Asset Management Inc. (“SBAM”), which were then investment adviser or manager to certain of the Funds (the “Managers”), substantially all of the mutual funds then managed by the Managers (the “Defendant Funds”), and Board members of the Defendant Funds (collectively, the “Defendants”). The complaints alleged, among other things, that CGM created various undisclosed incentives for its brokers to sell Smith Barney and Salomon Brothers funds. In addition, according to the complaints, the Managers caused the Defendant Funds to pay excessive brokerage commissions to CGM for steering clients towards proprietary funds. The complaints also alleged that the Defendants breached their fiduciary duty to the Defendant Funds by improperly charging Rule 12b-1 fees and by drawing on fund assets to make undisclosed payments of soft dollars and excessive brokerage commissions. The complaints also alleged that the Defendant Funds failed to adequately disclose certain of the allegedly wrongful conduct. The complaints sought injunctive relief and compensatory and punitive damages, rescission of the Defendant Funds’ contracts with the Managers, recovery of all fees paid to the Managers pursuant to such contracts and an award of attorneys’ fees and litigation expenses.
On December 15, 2004, a consolidated amended complaint (the “Complaint”) was filed alleging substantially similar causes of action. On May 27, 2005, all of the Defendants filed motions to dismiss the Complaint. On July 26, 2006, the court issued a decision and order (1) finding that plaintiffs lacked standing to sue on behalf of the shareholders of the Funds in which none of the plaintiffs had invested and dismissing those Funds from the case (although stating that they could be brought back into the case if standing as to them could be established), and (2) other than one stayed claim, dismissing all of the causes of action against the remaining Defendants, with prejudice, except for the cause of action under Section 36(b) of the 1940 Act, which the court granted plaintiffs leave to replead as a derivative claim.
On October 16, 2006, plaintiffs filed their Second Consolidated Amended Complaint (“Second Amended Complaint”) which alleges derivative claims on behalf of nine funds identified in the Second Amended Complaint, under Section 36(b) of the 1940 Act, against CAM, SBAM and SBFM as investment advisers to the identified funds, as well as CGM as a distributor for the identified funds (collectively, the “Second Amended Complaint Defendants”). The Portfolio was not identified in the Second Amended Complaint. The Second Amended Complaint alleges no claims against any of the funds or any of their Board Members. Under Section 36(b), the Second Amended Complaint alleges similar facts and seeks similar relief against the Second Amended Complaint Defendants as the Complaint.
On December 3, 2007, the court granted the Defendants’ motion to dismiss, with prejudice. On January 2, 2008, the plaintiffs filed a notice of appeal to the Second Circuit Court of Appeals. The appeal was fully
| | |
| 28 | | Legg Mason Western Asset Variable Diversified Strategic Income Portfolio 2010 Semi-Annual Report |
Notes to financial statements (unaudited) (cont’d)
briefed and oral argument before the U.S. Court of Appeals for the Second Circuit took place on March 5, 2009. The parties currently are awaiting a decision from the U.S. Court of Appeals for the Second Circuit.
Additional lawsuits arising out of these circumstances and presenting similar allegations and requests for relief may be filed in the future.
9. Other matters
On or about May 30, 2006, John Halebian, a purported shareholder of Western Asset New York Tax Free Money Market Fund (prior to May 31, 2010, the Fund was known as Western Asset / CitiSM New York Tax Free Reserves, and prior to June 1, 2009, as CitiSM New York Tax Free Reserves), a series of Legg Mason Partners Money Market Trust, formerly a series of CitiFunds Trust III (the “Subject Trust”), filed a complaint in the United States District Court for the Southern District of New York against the independent trustees of the Subject Trust (Elliott J. Berv, Donald M. Carlton, A. Benton Cocanougher, Mark T. Finn, Stephen Randolph Gross, Diana R. Harrington, Susan B. Kerley, Alan G. Merten and R. Richardson Pettit).
The Subject Trust is also named in the complaint as a nominal defendant. The complaint alleges both derivative claims on behalf of the Subject Trust and class claims on behalf of a putative class of shareholders of the Subject Trust in connection with the 2005 sale of Citigroup’s asset management business to Legg Mason and the related approval of new investment advisory agreements by the trustees and shareholders. In the derivative claim, the plaintiff alleges, among other things, that the independent trustees breached their fiduciary duty to the Subject Trust and its shareholders by failing to negotiate lower fees or seek competing bids from other qualified investment advisers in connection with Citigroup’s sale to Legg Mason. In the claims brought on behalf of the putative class of shareholders, the plaintiff alleges that the independent trustees violated the proxy solicitation requirements of the 1940 Act, and breached their fiduciary duty to shareholders, by virtue of the voting procedures, including “echo voting,” used to obtain approval of the new investment advisory agreements and statements made in a proxy statement regarding those voting procedures. The plaintiff alleges that the proxy statement was misleading because it failed to disclose that the voting procedures violated the 1940 Act. The relief sought includes an award of damages, rescission of the advisory agreement, and an award of costs and attorney fees.
In advance of filing the complaint, Mr. Halebian’s lawyers made written demand for relief on the Board of the Subject Trust, and the Board’s independent trustees formed a demand review committee to investigate the matters raised in the demand, and subsequently in the complaint, and recommend a course of action to the Board. The committee, after a thorough review, determined that the independent trustees did not breach their fiduciary duties as alleged by Mr. Halebian, and that the action demanded by Mr. Halebian would not be in the best interests of the Subject Trust. The Board of the Subject Trust (the trustee who is an “interested person” of the Subject Trust, within the meaning of the 1940 Act, having recused himself from the matter), after receiving and considering the committee’s report and based upon the findings of the committee, subsequently also determined and, adopting the recommendation of the committee, directed counsel to move to dismiss Mr. Halebian’s complaint. A motion to dismiss was filed on October 23, 2006. Opposition papers were filed on or about December 7, 2006. The complaint was dismissed on July 31, 2007. Mr. Halebian filed an appeal in the U.S. Court of Appeals for the Second Circuit. On December 29, 2009, the U.S. Court of Appeals for the Second Circuit ruled that the propriety of the district court’s dismissal depended upon an unsettled question of Massachusetts state law better addressed by a Massachusetts court and certified the question to the Massachusetts Supreme Judicial Court. After full briefing, oral argument took place on May 4, 2010. The parties are awaiting a decision.
Legg Mason Western Asset
Variable Diversified Strategic Income Portfolio
Trustees
Elliott J. Berv
A. Benton Cocanougher
Jane F. Dasher
Mark T. Finn
R. Jay Gerken, CFA
Chairman
Rainer Greeven
Stephen R. Gross
Richard E. Hanson, Jr.
Diana R. Harrington
Susan M. Heilbron
Susan B. Kerley
Alan G. Merten
R. Richardson Pettit
Investment manager
Legg Mason Partners Fund Advisor, LLC
Subadvisers
Western Asset Management Company
Western Asset Management Company Limited
Western Asset Management Company Pte. Ltd.
Western Asset Management Company Ltd
Distributor
Legg Mason Investor Services, LLC
Custodian
State Street Bank and Trust Company
Transfer agent
Boston Financial Data Services, Inc.
2000 Crown Colony Drive
Quincy, MA 02169
Independent registered public accounting firm
KPMG LLP
345 Park Avenue
New York, NY 10154
Legg Mason Western Asset Variable Diversified Strategic Income Portfolio
The Portfolio is a separate investment series of Legg Mason Partners Variable Income Trust, a Maryland statutory trust.
Legg Mason Western Asset Variable Diversified Strategic Income Portfolio
Legg Mason Funds
55 Water Street
New York, NY 10041
The Portfolio files its complete schedule of portfolio holdings with the Securities and Exchange Commission (“SEC”) for the first and third quarters of each fiscal year on Form N-Q. The Portfolio’s Forms N-Q are available on the SEC’s website at www.sec.gov. The Portfolio’s Forms N-Q may be reviewed and copied at the SEC’s Public Reference Room in Washington, D.C., and information on the operation of the Public Reference Room may be obtained by calling 1-800-SEC-0330. To obtain information on Form N-Q from the Portfolio, shareholders can call Funds Investor Services at 1-800-822-5544 or Institutional Shareholder Services at 1-888-425-6432.
Information on how the Portfolio voted proxies relating to portfolio securities during the prior 12-month period ended June 30th of each year and a description of the policies and procedures that the Portfolio uses to determine how to vote proxies related to portfolio transactions are available (1) without charge, upon request, by calling Funds Investor Services at 1-800-822-5544 or Institutional Shareholder Services at 1-888-425-6432, (2) on the Portfolio’s website at www.leggmason.com/individualinvestors and (3) on the SEC’s website at www.sec.gov.
This report is submitted for the general information of the shareholders of Legg Mason Western Asset Variable Diversified Strategic Income Portfolio. This report is not authorized for distribution to prospective investors in the Portfolio unless proceeded or accompanied by a current prospectus.
Investors should consider the Portfolio’s investment objectives, risks, charges and expenses carefully before investing. The prospectus contains this and other important information about the Portfolio. Please read the prospectus carefully before investing.
www.leggmason.com/individualinvestors
© 2010 Legg Mason Investor Services, LLC
Member FINRA, SIPC
Privacy policy
We are committed to keeping nonpublic personal information about you secure and confidential. This notice is intended to help you understand how we fulfill this commitment. From time to time, we may collect a variety of personal information about you, including:
| Ÿ | | Information we receive from you on applications and forms, via the telephone, and through our websites; |
| Ÿ | | Information about your transactions with us, our affiliates, or others (such as your purchases, sales, or account balances); and |
| Ÿ | | Information we receive from consumer reporting agencies. |
We do not disclose nonpublic personal information about our customers or former customers, except to our affiliates (such as broker-dealers or investment advisers within the Legg Mason family of companies) or as is otherwise permitted by applicable law or regulation. For example, we may share this information with others in order to process your transactions or service an account. We may also provide this information to companies that perform marketing services on our behalf, such as printing and mailing, or to other financial institutions with whom we have joint marketing agreements. When we enter into such agreements, we will require these companies to protect the confidentiality of this information and to use it only to perform the services for which we hired them.
With respect to our internal security procedures, we maintain physical, electronic, and procedural safeguards to protect your nonpublic personal information, and we restrict access to this information.
If you decide at some point either to close your account(s) or become an inactive customer, we will continue to adhere to our privacy policies and practices with respect to your nonpublic personal information.
NOT PART OF THE SEMI-ANNUAL REPORT
At Legg Mason, we’ve assembled a collection of experienced investment management firms and empowered each of them with the tools, the resources and, most importantly, the independence to pursue the strategies they know best.
| Ÿ | | Each was purposefully chosen for their commitment to investment excellence. |
| Ÿ | | Each is focused on specific investment styles and asset classes. |
| Ÿ | | Each exhibits thought leadership in their chosen area of focus. |
Together, we’ve built a powerful portfolio of solutions for financial advisors and their clients. And it has made us a world leader in money management.*
| * | Ranked eighth-largest money manager in the world, according to Pensions & Investments, May 31, 2010, based on 12/31/09 worldwide institutional assets under management. |
www.leggmason.com/individualinvestors
©2010 Legg Mason Investor Services, LLC Member FINRA, SIPC
FDXX010085 8/10 SR10-1157
NOT PART OF THE SEMI-ANNUAL REPORT
Not applicable.
| ITEM 3. | AUDIT COMMITTEE FINANCIAL EXPERT. |
Not applicable.
| ITEM 4. | PRINCIPAL ACCOUNTANT FEES AND SERVICES. |
Not applicable.
| ITEM 5. | AUDIT COMMITTEE OF LISTED REGISTRANTS. |
Not applicable.
| ITEM 6. | SCHEDULE OF INVESTMENTS. |
Included herein under Item 1.
| ITEM 7. | DISCLOSURE OF PROXY VOTING POLICIES AND PROCEDURES FOR CLOSED-END MANAGEMENT INVESTMENT COMPANIES. |
Not applicable.
| ITEM 8. | PORTFOLIO MANAGERS OF CLOSED-END MANAGEMENT INVESTMENT COMPANIES. |
Not applicable.
| ITEM 9. | PURCHASES OF EQUITY SECURITIES BY CLOSED-END MANAGEMENT INVESTMENT COMPANY AND AFFILIATED PURCHASERS. |
Not applicable.
| ITEM 10. | SUBMISSION OF MATTERS TO A VOTE OF SECURITY HOLDERS. |
Not applicable.
| ITEM 11. | CONTROLS AND PROCEDURES. |
| | (a) | The registrant’s principal executive officer and principal financial officer have concluded that the registrant’s disclosure controls and procedures (as defined in Rule 30a- 3(c) under the Investment Company Act of 1940, as amended (the “1940 Act”)) are effective as of a date within 90 days of the filing date of this report that includes the disclosure required by this paragraph, based on their evaluation of the disclosure controls and procedures required by Rule 30a-3(b) under the 1940 Act and 15d-15(b) under the Securities Exchange Act of 1934. |
| | (b) | There were no changes in the registrant’s internal control over financial reporting (as defined in Rule 30a-3(d) under the 1940 Act) that occurred during the registrant’s last fiscal half-year (the registrant’s second fiscal half-year in the case of an annual report) that have materially affected, or are likely to materially affect the registrant’s internal control over financial reporting. |
(a) (1) Not applicable.
Exhibit 99.CODE ETH
(a) (2) Certifications pursuant to section 302 of the Sarbanes-Oxley Act of 2002 attached hereto.
Exhibit 99.CERT
(b) Certifications pursuant to Section 906 of the Sarbanes-Oxley Act of 2002 attached hereto.
Exhibit 99.906CERT
SIGNATURES
Pursuant to the requirements of the Securities Exchange Act of 1934 and the Investment Company Act of 1940, the registrant has duly caused this Report to be signed on its behalf by the undersigned, there unto duly authorized.
| | |
| Legg Mason Partners Variable Income Trust |
| |
| By: | | /S/ R. JAY GERKEN |
| | (R. Jay Gerken) |
| | Chief Executive Officer of |
| | Legg Mason Partners Variable Income Trust |
| |
| Date: | | August 26, 2010 |
Pursuant to the requirements of the Securities Exchange Act of 1934 and the Investment Company Act of 1940, this report has been signed below by the following persons on behalf of the registrant and in the capacities and on the dates indicated.
| | |
| By: | | /S/ R. JAY GERKEN |
| | (R. Jay Gerken) |
| | Chief Executive Officer of |
| | Legg Mason Partners Variable Income Trust |
| |
| Date: | | August 26, 2010 |
| |
| By: | | /S/ KAPREL OZSOLAK |
| | (Kaprel Ozsolak) |
| | Chief Financial Officer of |
| | Legg Mason Partners Variable Income Trust |
| |
| Date: | | August 26, 2010 |