UNITED STATES
SECURITIES AND EXCHANGE COMMISSION
Washington, D.C. 20549
FORM N-CSR
CERTIFIED SHAREHOLDER REPORT OF REGISTERED
MANAGEMENT INVESTMENT COMPANIES
Investment Company Act file number 811-06310
Legg Mason Partners Variable Income Trust
(Exact name of registrant as specified in charter)
620 Eighth Avenue, 49th Floor, New York, NY 10018
(Address of principal executive offices) (Zip code)
Robert I. Frenkel, Esq.
Legg Mason & Co., LLC
100 First Stamford Place
Stamford, CT 06902
(Name and address of agent for service)
Registrant’s telephone number, including area code: 1-877-721-1926
Date of fiscal year end: December 31
Date of reporting period: December 31, 2013
| ITEM 1. | REPORT TO STOCKHOLDERS. |
The Annual Report to Stockholders is filed herewith.

| | |
| Annual Report | | December 31, 2013 |
WESTERN ASSET
VARIABLE GLOBAL
HIGH YIELD BOND
PORTFOLIO

|
| INVESTMENT PRODUCTS: NOT FDIC INSURED • NO BANK GUARANTEE • MAY LOSE VALUE |
Portfolio objective
The Portfolio seeks to maximize total return.*
* Prior to May 1, 2014, the Portfolio seeks to maximize total return consistent with the preservation of capital.
Letter from the president

Dear Shareholder,
We are pleased to provide the annual report of Western Asset Variable Global High Yield Bond Portfolio for the twelve-month reporting period ended December 31, 2013. Please read on for a detailed look at prevailing economic and market conditions during the Portfolio’s reporting period and to learn how those conditions have affected Portfolio performance.
As always, we remain committed to providing you with excellent service and a full spectrum of investment choices. We also remain committed to supplementing the support you receive from your financial advisor. One way we accomplish this is through our website, www.leggmason.com/individualinvestors. Here you can gain immediate access to market and investment information, including:
| Ÿ | | Market insights and commentaries from our portfolio managers and |
| Ÿ | | A host of educational resources. |
We look forward to helping you meet your financial goals.
Sincerely,

Kenneth D. Fuller
President and Chief Executive Officer
January 31, 2014
| | |
| II | | Western Asset Variable Global High Yield Bond Portfolio |
Investment commentary
Economic review
The U.S. economy continued to grow over the twelve months ended December 31, 2013 (the “reporting period”). Looking back, U.S. gross domestic product (“GDP”)i growth, as reported by the U.S. Department of Commerce, was 1.1% during the first quarter of 2013. The economic expansion then accelerated, as GDP growth was 2.5% during the second quarter. This was partially due to increases in exports and non-residential fixed investments, along with a smaller decline in federal government spending versus the previous quarter. The economy gained further momentum during the third quarter, with GDP growth of 4.1%, its best reading since the fourth quarter of 2011. Stronger growth was driven, in part, by an increase in private inventory investment, a deceleration in imports and accelerating state and local government spending. The U.S. Department of Commerce’s initial reading for fourth quarter 2013 GDP growth, released after the reporting period ended, was 3.2%. Slower growth was due to several factors, including a deceleration in private inventory investment, declining federal government spending and less residential fixed investments.
The U.S. job market improved during the reporting period, although unemployment remained elevated from a historical perspective. When the period began, unemployment, as reported by the U.S. Department of Labor, was 7.9%. Unemployment fell to 7.7% in February 2013 and generally edged lower over the remainder of the period, falling to 6.7% in December. This represented the lowest level since October 2008. However, falling unemployment during the period was partially due to a decline in the workforce participation rate, which was 62.8% in December, its lowest level since 1978. In addition, the number of longer-term unemployed continues to be high, as roughly 37.7% of the 10.4 million Americans looking for work in December 2013 had been out of work for more than six months.
While sales of existing-homes declined at times throughout the reporting period given rising mortgage rates, they moved higher at the end of the year. According to the National Association of Realtors (“NAR”), existing-home sales rose 1.0% on a seasonally adjusted basis in December 2013 versus the previous month, although they were 0.6% lower than in December 2012. However, existing homes sales in 2013 were 9.1% higher than the previous year and 2013’s sales were the strongest since 2006. In addition, the NAR reported that the median existing-home price for all housing types was $198,100 in December 2013, up 9.9% from December 2012. The inventory of homes available for sale in December 2013 was 11% lower than the previous month at a 4.6 month supply at the current sales pace but 1.6% higher than in December 2012.
The manufacturing sector expanded during the majority of the reporting period, although it experienced a temporary soft patch. Based on the Institute for Supply Management’s Purchasing Managers’ Index (“PMI”)ii, manufacturing expanded during the first four months of the reporting period. It then contracted in May 2013, with a PMI of 49.0 (a reading below 50 indicates a contraction, whereas a reading above 50 indicates an expansion). This represented the PMI’s lowest reading since June 2009. However, the contraction was a short-term setback, as the PMI rose over the next seven months and peaked at 57.3 in November,
| | |
| Western Asset Variable Global High Yield Bond Portfolio | | III |
Investment commentary (cont’d)
the best reading since April 2011. The PMI then moderated somewhat in December 2013, edging back to a still strong 57.0.
Growth outside the U.S. generally improved in developed countries. In its January 2014 World Economic Outlook Update, released after the reporting period ended, the International Monetary Fund (“IMF”) stated that “Global activity strengthened during the second half of 2013… activity is expected to improve further in 2014-15, largely on account of recovery in the advanced economies.” From a regional perspective, the IMF anticipates 2014 growth will be 1.0% in the Eurozone, versus -0.4% in 2013. After moderating somewhat in 2013, the IMF projects that overall growth in emerging market countries will improve in 2014, with growth of 5.1% versus 4.7% in 2013. For example, GDP growth in India is projected to move from 4.4% in 2013 to 5.4% in 2014. However, the IMF now projects that growth in China will dip from 7.7% in 2013 to 7.5% in 2014.
The Federal Reserve Board (“Fed”)iii took a number of actions as it sought to meet its dual mandate of fostering maximum employment and price stability. As has been the case since December 2008, the Fed kept the federal funds rateiv at a historically low range between zero and 0.25%. At its meeting in December 2012, the Fed announced that it would continue purchasing $40 billion per month of agency mortgage-backed securities (“MBS”), as well as initially purchasing $45 billion per month of longer-term Treasuries. At its meeting that ended on June 19, 2013, the Fed did not make any material changes to its official policy statement. However, in a press conference following the meeting, Fed Chairman Bernanke said “…the Committee currently anticipates that it would be appropriate to moderate the monthly pace of purchases later this year.” In a surprise to many investors, at its meeting that ended on September 18, 2013, the Fed did not taper its asset purchase program and said that it “…decided to await more evidence that progress will be sustained before adjusting the pace of its purchases.” At its meeting that concluded on December 18, 2013, the Fed announced that it would begin reducing its monthly asset purchases, saying “Beginning in January 2014, the Committee will add to its holdings of agency mortgage-backed securities at a pace of $35 billion per month rather than $40 billion per month, and will add to its holdings of longer-term Treasury securities at a pace of $40 billion per month rather than $45 billion per month.” At the Fed’s meeting that concluded on January 29, 2014, after the reporting period ended, it announced that in February 2014 it would further taper its asset purchases, to a total of $65 billion a month ($30 billion per month of agency mortgage-backed securities and $35 billion per month of longer-term Treasury securities).
Given the economic challenges in the Eurozone, the European Central Bank (“ECB”)v took a number of actions to stimulate growth. In May 2013, the ECB cut rates from 0.75% to 0.50%. The ECB then lowered the rates to a new record low of 0.25% in November 2013. In other developed countries, the Bank of England kept rates on hold at 0.50% during the reporting period, as did Japan at a range of zero to 0.10%, its lowest level since 2006. In January 2013, the Bank of Japan announced that it would raise its target for annual inflation from 1% to 2%, and the Japanese government introduced a ¥10.3 trillion ($116 billion)
| | |
| IV | | Western Asset Variable Global High Yield Bond Portfolio |
stimulus package to support its economy. Elsewhere, the People’s Bank of China kept rates on hold at 6.0%.
As always, thank you for your confidence in our stewardship of your assets.
Sincerely,
Kenneth D. Fuller
President and Chief Executive Officer
January 31, 2014
All investments are subject to risk including the possible loss of principal. Past performance is no guarantee of future results. Forecasts and predictions are inherently limited and should not be relied upon as an indication of actual or future performance.
| i | Gross domestic product (“GDP”) is the market value of all final goods and services produced within a country in a given period of time. |
| ii | The Institute for Supply Management’s PMI is based on a survey of purchasing executives who buy the raw materials for manufacturing at more than 350 companies. It offers an early reading on the health of the manufacturing sector. |
| iii | The Federal Reserve Board (“Fed”) is responsible for the formulation of policies designed to promote economic growth, full employment, stable prices and a sustainable pattern of international trade and payments. |
| iv | The federal funds rate is the rate charged by one depository institution on an overnight sale of immediately available funds (balances at the Federal Reserve) to another depository institution; the rate may vary from depository institution to depository institution and from day to day. |
| v | The European Central Bank (“ECB”) is responsible for the monetary system of the European Union and the euro currency. |
| | |
| Western Asset Variable Global High Yield Bond Portfolio | | V |
Portfolio overview
Q. What is the Portfolio’s investment strategy?
A. The Portfolio invests primarily in high-yield fixed-income securities issued by U.S. and foreign companies and foreign governments and their agencies and instrumentalities. Under normal conditions, the Portfolio invests at least 80% of its assets in high-yield bonds. High-yield bonds are rated below investment grade (that is, rated below the Baa/BBB categories) or if unrated, securities we determine to be of comparable credit quality. Under normal circumstances, the Portfolio will be invested in at least three countries (one of which may be the U.S.). The Portfolio may invest without limit in foreign securities denominated either in U.S. dollars or foreign currencies and may invest up to 35% of its assets in sovereign debt issued by emerging market governmental issuers. The Portfolio may invest in securities of any maturity or durationi.
Instead of, and/or in addition to, investing directly in particular securities, the Portfolio may gain exposure to a security, an issuer, an index or a basket of securities, or a market, by investing through the use of instruments such as derivatives. The Portfolio may also engage in a variety of transactions using derivatives in order to change the investment characteristics of its portfolio (such as shortening or lengthening duration) and for other purposes.
At Western Asset Management Company (“Western Asset”), the Portfolio’s subadviser, we utilize a fixed-income team approach, with decisions derived from interaction among various investment management sector specialists. The sector teams are comprised of Western Asset’s senior portfolio management personnel, research analysts and an in-house economist. Under this team approach, management of client fixed-income portfolios will reflect a consensus of interdisciplinary views within the Western Asset organization.
Q. What were the overall market conditions during the Portfolio’s reporting period?
A. The spread sectors (non-Treasuries) experienced several periods of heightened risk aversion but largely outperformed equal-duration Treasuries over the twelve months ended December 31, 2013. However, most spread sectors posted negative absolute returns during the reporting period. Risk aversion was prevalent at times given mixed economic data, geopolitical issues, signs of shifting monetary policy by the Federal Reserve Board (“Fed”)ii and the U.S. government’s sixteen-day partial shutdown which ended on October 16, 2013.
Both short- and long-term Treasury yields moved higher during the twelve months ended December 31, 2013. Two-year Treasury yields rose from 0.25% at the beginning of the period to 0.38% at the end of the period. Their peak of 0.52% occurred on September 5, 2013 and they were as low as 0.20% in late April and early May 2013. Ten-year Treasury yields were 1.78% at the beginning of the period and reached a low of 1.66% in early May 2013. Their peak of 3.04% occurred on December 31, 2013, as fixed-income investors reacted negatively to the Fed’s announcement that it would start tapering its asset purchase program. This was the highest level for the ten-year Treasury since July 2011.
All told, the Barclays U.S. Aggregate Indexiii returned -2.02% for the twelve months ended December 31, 2013. Comparatively, riskier
| | |
| Western Asset Variable Global High Yield Bond Portfolio 2013 Annual Report | | 1 |
Portfolio overview (cont’d)
fixed-income securities, including global high-yield bonds and emerging market debt, produced mixed results. Over the fiscal year, the Barclays Global High Yield Index (Hedged) (the “Index”)iv gained 6.47%. Broken down regionally, European issuers outperformed, as the Barclays Pan-European High Yield Index (USD-hedged)v gained 10.49%. Elsewhere, emerging market high-yield bonds, as measured by the Barclays Emerging Market High Yield Index,vi returned -1.33% and U.S. high-yield, as measured by the Barclays U.S. Corporate High Yield — 2% Issuer Cap Index,vii rose 7.44%.
Q. How did we respond to these changing market conditions?
A. A number of adjustments were made to the Portfolio during the reporting period. We increased our emerging market high-yield exposure to bring its allocation in line with that of the Index. In contrast, we reduced our exposures to U.S. and European high-yield bonds, though we remained overweight to the U.S. From a credit quality perspective, we pared its overweight exposure to CCC-rated securities to capture profits given their strong results during the period. However, we remained overweight versus the Index. Elsewhere, we added to the Portfolio’s allocation to the Transportation sector. In contrast, we reduced its weightings in the Basic Industry1, Energy and emerging market Non-Corporate sectors. Finally, we actively participated in the
| 1 | Basic Industry consists of the following industries: Chemicals, Metals & Mining and Paper. |
| 2 | The Portfolio is an underlying investment option of various variable annuity and variable life insurance products. The Portfolio’s performance returns do not reflect the deduction of expenses imposed in connection with investing in variable annuity or variable life insurance contracts, such as administrative fees, account charges and surrender charges, which, if reflected, would reduce the performance of the Portfolio. Past performance is no guarantee of future results. |
| 3 | Lipper, Inc., a wholly-owned subsidiary of Reuters, provides independent insight on global collective investments. Returns are based on the twelve-month period ended December 31, 2013, including the reinvestment of all distributions, including returns of capital, if any, calculated among the 110 funds in the Portfolio’s Lipper category. |
new issue market and purchased securities that we felt were attractively valued.
Treasury futures, which were used to help manage the Portfolio’s duration and yield curveviii positioning, modestly contributed to performance. High-yield index swaps (CDX) and high-yield index swaptions, which were used to manage our high-yield exposure, detracted from performance. Finally, the use of currency forwards to hedge its currency exposure were negative for results. However, these losses from currency hedges were essentially offset by the increase in the value of our non-U.S. dollar denominated bonds when translated back to U.S. dollars.
Performance review
For the twelve months ended December 31, 2013, Class I shares of Western Asset Variable Global High Yield Bond Portfolio2 returned 6.27%. The Portfolio’s unmanaged benchmark, the Barclays Global High Yield Index (Hedged), returned 6.47% for the same period. The Lipper Variable High Yield Funds Category Average3 returned 6.51% over the same time frame.
| | |
| 2 | | Western Asset Variable Global High Yield Bond Portfolio 2013 Annual Report |
| | | | | | | | |
Performance Snapshot as of December 31, 2013
(unaudited) | |
| | | 6 months | | | 12 months | |
Western Asset Variable Global High Yield Bond Portfolio1: | | | | | | | | |
Class I | | | 5.50 | % | | | 6.27 | % |
Class II | | | 5.31 | % | | | 6.06 | % |
| Barclays Global High Yield Index (Hedged) | | | 6.04 | % | | | 6.47 | % |
| Lipper Variable High Yield Funds Category Average2 | | | 5.16 | % | | | 6.51 | % |
The performance shown represents past performance. Past performance is no guarantee of future results and current performance may be higher or lower than the performance shown above. Principal value, investment returns and yields will fluctuate and investors’ shares, when redeemed, may be worth more or less than their original cost.
All share class returns assume the reinvestment of all distributions, at net asset value and the deduction of all Portfolio expenses. Performance figures for periods shorter than one year represent cumulative figures and are not annualized.
The 30-Day SEC Yields for the period ended December 31, 2013 for Class I and Class II shares were 6.44% and 6.15%, respectively. The 30-Day SEC Yield is subject to change and is based on the yield to maturity of the Portfolio’s investments over a 30-day period and not on the dividends paid by the Portfolio, which may differ.
| | |
| Total Annual Operating Expenses (unaudited) |
As of the Portfolio’s current prospectus dated May 1, 2013, the gross total annual operating expense ratios for Class I and Class II shares were 0.82% and 1.10%, respectively.
Actual expenses may be higher. For example, expenses may be higher than those shown if average net assets decrease. Net assets are more likely to decrease and Portfolio expense ratios are more likely to increase when markets are volatile.
Q. What were the leading contributions to performance?
A. The largest contributor to the Portfolio’s relative performance during the reporting period was our ratings biases. In particular, an overweight to lower-rated CCC bonds was a positive, as they significantly outperformed the Index. In addition, we underweighted bonds rated BB, which was beneficial given their underperformance versus the Index.
A number of individual holdings benefited performance, including our overweight positions in Wind Acquisition Finance, Realogy Holdings Corp. and CMA/CGM. Wind Acquisition Finance is the third largest wireless provider and the second largest wireline provider in Italy. Its bonds had also generated poor results prior to the beginning of the reporting period. We maintained our
| 1 | The Portfolio is an underlying investment option of various variable annuity and variable life insurance products. The Portfolio’s performance returns do not reflect the deduction of expenses imposed in connection with investing in variable annuity or variable life insurance contracts, such as administrative fees, account charges and surrender charges, which, if reflected, would reduce the performance of the Portfolio. Past performance is no guarantee of future results. |
| 2 | Lipper, Inc., a wholly-owned subsidiary of Reuters, provides independent insight on global collective investments. Returns are based on the period ended December 31, 2013, including the reinvestment of all distributions, including returns of capital, if any, calculated among the 113 funds for the six-month period and among the 110 funds for the twelve-month period in the Portfolio’s Lipper category. |
| | |
| Western Asset Variable Global High Yield Bond Portfolio 2013 Annual Report | | 3 |
Portfolio overview (cont’d)
position, as we felt the weakness was primarily due to the fact that the company is located in Italy, a southern European country that was a key concern in the European sovereign debt crisis. As the period progressed, Wind Acquisition Finance’s bonds rebounded sharply, as its fundamentals remained intact and the weak supply/demand technicals surrounding Italy dissipated. Realogy Holdings Corp. has a diversified business model that includes real estate franchising, brokerage, relocation and title services. Its business units include Better Homes and Gardens Real Estate, CENTURY 21, Coldwell Banker, Sotheby’s International Realty and Title Resource Group. Investor sentiment for Realogy Holdings Corp. improved as the U.S. housing market continued to recover. In addition, in October 2012 the company went public and raised more than $1 billion in additional capital, which will help support its debt obligations. CMA/CGM is a global shipping company headquartered in France. Its bonds had performed poorly prior to the reporting period due to a variety of factors, including fears of declining global economic growth, higher oil prices and issues related to the European sovereign debt crisis. We maintained our exposure and CMA/CGM’s bonds rallied significantly from distressed levels during the reporting period as the company’s fundamentals improved and European macro concerns lessened.
From a sector perspective, the Portfolio’s underweight to emerging market Non-Corporates was beneficial as it was the worst performing sector in the Index. An overweight to Transportation was rewarded given its outperformance versus the Index. Elsewhere, the Portfolio’s overweight to U.S. high-yield bonds was additive to results as they outperformed the Index.
Q. What were the leading detractors from performance?
A. The largest detractor from the Portfolio’s relative performance during the reporting period was our regional positioning. Although the Portfolio benefited from its overweight to U.S. high-yield, the U.S. region lagged European high-yield bonds, where the Portfolio had an underweight position.
Certain sector allocations were also negative for performance, including an underweight to Technology, the best performing sector in the Index. Our overweight to Energy was also a drag on results, as it was the worst performing sector in the Index.
Overweight positions in a number of areas also detracted from results, including our allocations to Venezuelan and Turkish sovereign debt, and an overweight in Physiotherapy Associates Holdings. An overweight to Venezuela was negative for the Portfolio’s performance. The death of Venezuelan President Chavez in March 2013 created a number of uncertainties in the country and the political climate remained highly unsettled during the reporting period. The country’s economy continued to be weak and inflation soared, causing its bond yields to move sharply higher. We believe valuations in Venezuela are still very attractive and our belief is that there are both ability and willingness for the country to meet its debt obligations. Our overweight to Turkish sovereign debt hurt the Portfolio’s performance as it was negatively impacted by an increasing current account deficit and political issues. Physiotherapy Associates
| | |
| 4 | | Western Asset Variable Global High Yield Bond Portfolio 2013 Annual Report |
Holdings is a national provider of outpatient rehabilitation and orthotics and prosthetics services. The company experienced headwinds due to both billing and accounting issues and, in May 2013, it defaulted on a bond payment. We remain positive regarding the prospects for recovery as we like the company’s market position, which include more than 500 outpatient rehabilitation and orthotic and prosthetic clinics in 34 states.
Thank you for your investment in Western Asset Variable Global High Yield Bond Portfolio. As always, we appreciate that you have chosen us to manage your assets and we remain focused on achieving the Portfolio’s investment goals.
Sincerely,
Western Asset Management Company
January 24, 2014
RISKS: Investments in bonds are subject to interest rate and credit risks. As interest rates rise, bond prices fall, reducing the value of the Portfolio’s share price. High-yield bonds involve greater credit and liquidity risks than investment grade bonds. Investing in foreign securities is subject to certain risks not associated with domestic investing, such as currency fluctuations, and changes in political and economic conditions. These risks are magnified in emerging or developing markets. The Portfolio may use derivatives, such as options and futures, which can be illiquid, may disproportionately increase losses, and have a potentially large impact on Portfolio performance. Please see the Portfolio’s prospectus for a more complete discussion of these and other risks, and the Portfolio’s investment strategies.
Portfolio holdings and breakdowns are as of December 31, 2013 and are subject to change and may not be representative of the portfolio managers’ current or future investments. Please refer to pages 13 through 31 for a list and percentage breakdown of the Portfolio’s holdings.
The mention of sector breakdowns is for informational purposes only and should not be construed as a recommendation to purchase or sell any securities. The information provided regarding such sectors is not a sufficient basis upon which to make an investment decision. Investors seeking financial advice regarding the appropriateness of investing in any securities or investment strategies discussed should consult their financial professional. Portfolio holdings are subject to change at any time and may not be representative of the portfolio managers’ current or future investments. The Portfolio’s top five sector holdings (as a percentage of net assets) as of December 31, 2013 were: Consumer Discretionary (17.5%), Energy (13.9%), Industrials (12.3%), Materials (12.3%) and Sovereign Bonds (8.7%). The Portfolio’s composition is subject to change at any time.
All investments are subject to risk including the possible loss of principal. Past performance is no guarantee of future results. All index performance reflects no deduction for fees, expenses or taxes. Please note that an investor cannot invest directly in an index.
The information provided is not intended to be a forecast of future events, a guarantee of future results or investment advice. Views expressed may differ from those of the firm as a whole.
| | |
| Western Asset Variable Global High Yield Bond Portfolio 2013 Annual Report | | 5 |
Portfolio overview (cont’d)
| i | Duration is the measure of the price sensitivity of a fixed-income security to an interest rate change of 100 basis points. Calculation is based on the weighted average of the present values for all cash flows. |
| ii | The Federal Reserve Board (“Fed”) is responsible for the formulation of policies designed to promote economic growth, full employment, stable prices, and a sustainable pattern of international trade and payments. |
| iii | The Barclays U.S. Aggregate Index is a broad-based bond index comprised of government, corporate, mortgage- and asset-backed issues, rated investment grade or higher, and having at least one year to maturity. |
| iv | The Barclays Global High Yield Index (Hedged) provides a broad-based measure of the global high-yield fixed-income markets, representing the union of the U.S. High-Yield, Pan-European High-Yield, U.S. Emerging Markets High-Yield, CMBS High-Yield and Pan European Emerging Markets High-Yield Indices. |
| v | The Barclays Pan-European High Yield Index covers the universe of fixed-rate, sub-investment-grade debt denominated in euros or other European currencies (except Swiss francs). |
| vi | The Barclays Emerging Market High Yield Index is the emerging market high yield component of the Barclays Emerging Markets (U.S. Dollar) Index. The Barclays Emerging Markets Index includes U.S. dollar-denominated debt from emerging markets in the following regions: Americas, Europe, Middle East, Africa, and Asia. |
| vii | The Barclays U.S. Corporate High Yield — 2% Issuer Cap Index is an index of the 2% Issuer Cap component of the Barclays U.S. Corporate High Yield Index, which covers the U.S. dollar-denominated, non-investment grade, fixed-rate, taxable corporate bond market. |
| viii | The yield curve is the graphical depiction of the relationship between the yield on bonds of the same credit quality but different maturities. |
| | |
| 6 | | Western Asset Variable Global High Yield Bond Portfolio 2013 Annual Report |
Portfolio at a glance† (unaudited)
Investment breakdown (%) as a percent of total investments
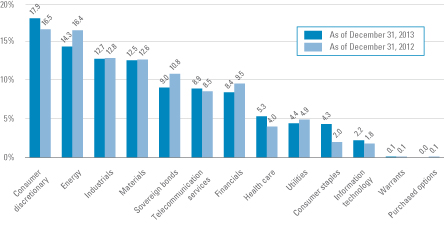
| † | The bar graph above represents the composition of the Portfolio’s investments as of December 31, 2013 and December 31, 2012 and does not include derivatives, such as futures contracts, written options, swaps contracts and forward foreign currency contracts. The Portfolio is actively managed. As a result, the composition of the Portfolio’s investments is subject to change at any time. |
| | |
| Western Asset Variable Global High Yield Bond Portfolio 2013 Annual Report | | 7 |
Portfolio expenses (unaudited)
Example
As a shareholder of the Portfolio, you may incur two types of costs: (1) transaction costs and (2) ongoing costs, including management fees; distribution and/or service (12b-1) fees; and other Portfolio expenses. This example is intended to help you understand your ongoing costs (in dollars) of investing in the Portfolio and to compare these costs with the ongoing costs of investing in other mutual funds.
This example is based on an investment of $1,000 invested on July 1, 2013 and held for the six months ended December 31, 2013.
Actual expenses
The table below titled “Based on Actual Total Return” provides information about actual account values and actual expenses. You may use the information provided in this table, together with the amount you invested, to estimate the expenses that you paid over the period. To estimate the expenses you paid on your account, divide your ending account value by $1,000 (for example, an $8,600 ending account value divided by $1,000 = 8.6), then multiply the result by the number under the heading entitled “Expenses Paid During the Period”.
Hypothetical example for comparison purposes
The table below titled “Based on Hypothetical Total Return” provides information about hypothetical account values and hypothetical expenses based on the actual expense ratio and an assumed rate of return of 5.00% per year before expenses, which is not the Portfolio’s actual return. The hypothetical account values and expenses may not be used to estimate the actual ending account balance or expenses you paid for the period. You may use the information provided in this table to compare the ongoing costs of investing in the Portfolio and other funds. To do so, compare the 5.00% hypothetical example relating to the Portfolio with the 5.00% hypothetical examples that appear in the shareholder reports of the other funds.
Please note that the expenses shown in the table below are meant to highlight your ongoing costs only and do not reflect any transactional costs. Therefore, the table is useful in comparing ongoing costs only, and will not help you determine the relative total costs of owning different funds. In addition, if these transaction costs were included, your costs would have been higher.
| | | | | | | | | | | | | | | | | | | | | | | | | | | | | | | | | | | | | | | | | | | | |
| Based on actual total return1 | | | | | Based on hypothetical total return1 | |
| | | Actual
Total
Return2 | | | Beginning
Account
Value | | | Ending
Account
Value | | | Annualized
Expense
Ratio | | | Expenses
Paid During
the Period3 | | | | | | | Hypothetical
Annualized
Total Return | | | Beginning
Account
Value | | | Ending
Account
Value | | | Annualized
Expense
Ratio | | | Expenses
Paid During
the Period3 | |
| Class I | | | 5.50 | % | | $ | 1,000.00 | | | $ | 1,055.00 | | | | 0.82 | % | | $ | 4.25 | | | | | Class I | | | 5.00 | % | | $ | 1,000.00 | | | $ | 1,021.07 | | | | 0.82 | % | | $ | 4.18 | |
| Class II | | | 5.31 | | | | 1,000.00 | | | | 1,053.10 | | | | 1.08 | | | | 5.59 | | | | | Class II | | | 5.00 | | | | 1,000.00 | | | | 1,019.76 | | | | 1.08 | | | | 5.50 | |
| 1 | For the six months ended December 31, 2013. |
| 2 | Assumes the reinvestment of all distributions, including returns of capital, if any, at net asset value. Total return is not annualized, as it may not be representative of the total return for the year. Total returns do not reflect expenses associated with separate accounts such as administrative fees, account charges and surrender charges, which, if neglected, would reduce the total returns. Performance figures may reflect compensating balance arrangements, fee waivers and/or expense reimbursements. In the absence of compensating balance arrangements, fee waivers and/or expense reimbursements, the total return would have been lower. Past performance is no guarantee of future results. |
| 3 | Expenses (net of compensating balance arrangements, fee waivers and/or expense reimbursements) are equal to each class’ respective annualized expense ratio multiplied by the average account value over the period, multiplied by the number of days in the most recent fiscal half-year (184), then divided by 365. |
| | |
| 8 | | Western Asset Variable Global High Yield Bond Portfolio 2013 Annual Report |
Portfolio performance (unaudited)
| | | | | | | | |
| Average annual total returns1 | |
| | | Class I | | | Class II | |
| Twelve Months Ended 12/31/13 | | | 6.27 | % | | | 6.06 | % |
| Five Years Ended 12/31/13 | | | 17.99 | | | | 17.68 | |
| Ten Years Ended 12/31/13 | | | 7.27 | | | | N/A | |
| Inception* through 12/31/13 | | | 7.23 | | | | 7.05 | |
| | | | |
| Cumulative total returns1 | | | |
| Class I (12/31/03 through 12/31/13) | | | 101.68 | % |
| Class II (Inception date of 2/26/04 through 12/31/13) | | | 95.53 | |
All figures represent past performance and are not a guarantee of future results. Investment return and principal value of an investment will fluctuate so that an investor’s shares, when redeemed, may be worth more or less than their original cost. The returns shown do not reflect expenses associated with separate accounts such as administrative fees, account charges and surrender charges, which, if reflected, would reduce the total returns. Performance figures may reflect compensating balance arrangements, fee waivers and/or expense reimbursements. In the absence of compensating balance arrangements, fee waivers and/or expense reimbursements, the total return would have been lower.
| 1 | Assumes the reinvestment of all distributions, including returns of capital, if any, at net asset value. |
| * | Inception dates for Class I and II shares are May 1, 1998 and February 26, 2004, respectively. |
| | |
| Western Asset Variable Global High Yield Bond Portfolio 2013 Annual Report | | 9 |
Portfolio performance (unaudited) (cont’d)
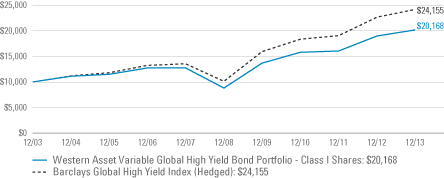
Historical performance
Value of $10,000 invested in
Class I Shares of Western Asset Variable Global High Yield Bond Portfolio vs. Barclays Global High Yield Index (Hedged)† — December 2003 - December 2013
All figures represent past performance and are not a guarantee of future results. Investment return and principal value of an investment will fluctuate so that an investor’s shares, when redeemed, may be worth more or less than their original cost. The returns shown do not reflect expenses associated with separate accounts such as administrative fees, account charges and surrender charges, which, if reflected, would reduce the total returns. Performance figures may reflect compensating balance arrangements, fee waivers and/or expense reimbursements. In the absence of compensating balance arrangements, fee waivers and/or expense reimbursements, the total return would have been lower.
| † | Hypothetical illustration of $10,000 invested in Class I shares of Western Asset Variable Global High Yield Bond Portfolio on December 31, 2003, assuming the reinvestment of all distributions, including returns of capital, if any, at net asset value through December 31, 2013. The hypothetical illustration also assumes a $10,000 investment in the Barclays Global High Yield Index (Hedged). The Barclays Global High Yield Index (Hedged) provides a broad-based measure of the global high-yield fixed-income markets, representing the union of the U.S. High-Yield, Pan-European High-Yield, U.S. Emerging Markets High-Yield, CMBS High-Yield and Pan European Emerging Markets High-Yield Indices. The Index is unmanaged and not subject to the same management and trading expenses as a mutual fund. Please note that an investor cannot invest directly in an index. The performance of the Portfolio’s other class may be greater or less than the Class I shares’ performance indicated on this chart, depending on whether greater or lesser fees were incurred by shareholders investing in the other class. |
| | |
| 10 | | Western Asset Variable Global High Yield Bond Portfolio 2013 Annual Report |
Spread duration (unaudited)
Economic exposure — December 31, 2013
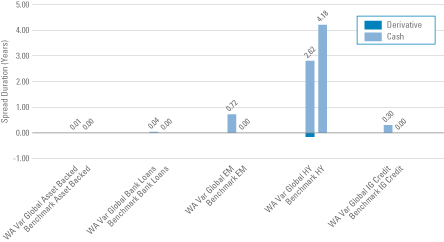
Spread duration measures the sensitivity to changes in spreads. The spread over Treasuries is the annual risk-premium demanded by investors to hold non-Treasury securities. Spread duration is quantified as the % change in price resulting from a 100 basis points change in spreads. For a security with positive spread duration, an increase in spreads would result in a price decline and a decline in spreads would result in a price increase. This chart highlights the market sector exposure of the Portfolio’s sectors relative to the selected benchmark sectors as of the end of the reporting period.
| | |
| Benchmark | | — Barclays Global High Yield Index (Hedged) |
| EM | | — Emerging Markets |
| HY | | — High Yield |
| IG Credit | | — Investment Grade Credit |
| WA Var Global | | — Western Asset Variable Global High Yield Bond Portfolio |
| | |
| Western Asset Variable Global High Yield Bond Portfolio 2013 Annual Report | | 11 |
Effective duration (unaudited)
Interest rate exposure — December 31, 2013
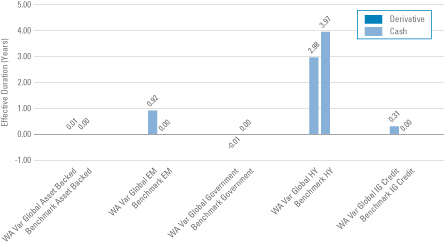
Effective duration measures the sensitivity to changes in relevant interest rates. Effective duration is quantified as the % change in price resulting from a 100 basis points change in interest rates. For a security with positive effective duration, an increase in interest rates would result in a price decline and a decline in interest rates would result in a price increase. This chart highlights the interest rate exposure of the Portfolio’s sectors relative to the selected benchmark sectors as of the end of the reporting period.
| | |
Benchmark | | — Barclays Global High Yield Index (Hedged) |
| EM | | — Emerging Markets |
| HY | | — High Yield |
| IG Credit | | — Investment Grade Credit |
| WA Var Global | | — Western Asset Variable Global High Yield Bond Portfolio |
| | |
| 12 | | Western Asset Variable Global High Yield Bond Portfolio 2013 Annual Report |
Schedule of investments
December 31, 2013
Western Asset Variable Global High Yield Bond Portfolio
| | | | | | | | | | | | | | | | |
| Security | | Rate | | | Maturity
Date | | | Face
Amount† | | | Value | |
| Corporate Bonds & Notes — 83.7% | | | | | | | | | | | | | | | | |
| Consumer Discretionary — 16.4% | | | | | | | | | | | | | | | | |
Auto Components — 1.1% | | | | | | | | | | | | | | | | |
American Axle & Manufacturing Inc., Senior Notes | | | 6.250 | % | | | 3/15/21 | | | | 110,000 | | | $ | 117,425 | |
American Axle & Manufacturing Inc., Senior Notes | | | 6.625 | % | | | 10/15/22 | | | | 320,000 | | | | 338,400 | |
Cooper-Standard Holding Inc., Senior Notes | | | 7.375 | % | | | 4/1/18 | | | | 260,000 | | | | 262,600 | (a)(b) |
Dana Holding Corp., Senior Notes | | | 5.375 | % | | | 9/15/21 | | | | 430,000 | | | | 433,763 | |
Dana Holding Corp., Senior Notes | | | 6.000 | % | | | 9/15/23 | | | | 430,000 | | | | 433,225 | |
Europcar Groupe SA, Senior Notes | | | 11.500 | % | | | 5/15/17 | | | | 100,000 | EUR | | | 160,812 | (a) |
Europcar Groupe SA, Senior Notes | | | 9.375 | % | | | 4/15/18 | | | | 395,000 | EUR | | | 583,004 | (a) |
Total Auto Components | | | | | | | | | | | | | | | 2,329,229 | |
Automobiles — 0.1% | | | | | | | | | | | | | | | | |
Jaguar Holding Co. II/Jaguar Merger Sub Inc., Senior Notes | | | 9.500 | % | | | 12/1/19 | | | | 160,000 | | | | 180,800 | (a) |
Distributors — 0.2% | | | | | | | | | | | | | | | | |
LKQ Corp., Senior Notes | | | 4.750 | % | | | 5/15/23 | | | | 380,000 | | | | 354,350 | (a) |
Diversified Consumer Services — 1.2% | | | | | | | | | | | | | | | | |
Co-operative Group Holdings 2011 Ltd., Senior Notes | | | 7.500 | % | | | 7/8/26 | | | | 160,000 | GBP | | | 272,238 | |
Laureate Education Inc., Senior Notes | | | 9.250 | % | | | 9/1/19 | | | | 350,000 | | | | 382,375 | (a) |
Odeon & UCI Finco PLC, Senior Secured Notes | | | 9.000 | % | | | 8/1/18 | | | | 400,000 | GBP | | | 672,316 | (a) |
Service Corp. International, Senior Notes | | | 7.500 | % | | | 4/1/27 | | | | 290,000 | | | | 307,400 | |
Sotheby’s, Senior Notes | | | 5.250 | % | | | 10/1/22 | | | | 540,000 | | | | 508,950 | (a) |
StoneMor Partners LP/Cornerstone Family Services of WV, Senior Notes | | | 7.875 | % | | | 6/1/21 | | | | 330,000 | | | | 344,850 | (a) |
Total Diversified Consumer Services | | | | | | | | | | | | | | | 2,488,129 | |
Hotels, Restaurants & Leisure — 5.2% | | | | | | | | | | | | | | | | |
Arcos Dorados Holdings Inc., Senior Notes | | | 6.625 | % | | | 9/27/23 | | | | 390,000 | | | | 397,020 | (a) |
Bossier Casino Venture Holdco Inc., Senior Secured Bonds | | | 14.000 | % | | | 2/9/18 | | | | 446,589 | | | | 432,220 | (a)(b)(c)(d) |
Burger King Capital Holdings LLC/Burger King Capital Finance Inc., Senior Notes, Step bond | | | 0.000 | % | | | 4/15/19 | | | | 160,000 | | | | 144,800 | (a) |
Caesars Entertainment Operating Co. Inc., Senior Secured Notes | | | 11.250 | % | | | 6/1/17 | | | | 550,000 | | | | 561,000 | |
Caesars Entertainment Operating Co. Inc., Senior Secured Notes | | | 9.000 | % | | | 2/15/20 | | | | 500,000 | | | | 488,750 | |
Caesars Entertainment Operating Co. Inc., Senior Secured Notes | | | 9.000 | % | | | 2/15/20 | | | | 240,000 | | | | 234,600 | |
Carrols Restaurant Group Inc., Senior Secured Notes | | | 11.250 | % | | | 5/15/18 | | | | 450,000 | | | | 513,000 | |
CCM Merger Inc., Senior Notes | | | 9.125 | % | | | 5/1/19 | | | | 190,000 | | | | 199,500 | (a) |
Choctaw Resort Development Enterprise, Senior Notes | | | 7.250 | % | | | 11/15/19 | | | | 235,000 | | | | 230,888 | (a) |
Downstream Development Quapaw, Senior Secured Notes | | | 10.500 | % | | | 7/1/19 | | | | 390,000 | | | | 395,850 | (a) |
Enterprise Inns PLC, Senior Secured Bonds | | | 6.500 | % | | | 12/6/18 | | | | 416,000 | GBP | | | 718,152 | |
See Notes to Financial Statements.
| | |
| Western Asset Variable Global High Yield Bond Portfolio 2013 Annual Report | | 13 |
Schedule of investments (cont’d)
December 31, 2013
Western Asset Variable Global High Yield Bond Portfolio
| | | | | | | | | | | | | | | | |
| Security | | Rate | | | Maturity
Date | | | Face
Amount† | | | Value | |
Hotels, Restaurants & Leisure — continued | | | | | | | | | | | | | | | | |
Fontainebleau Las Vegas Holdings LLC/Fontainebleau Las Vegas Capital Corp., Senior Secured Notes | | | 10.250 | % | | | 6/15/15 | | | | 265,000 | | | $ | 298 | (a)(e) |
Hilton Worldwide Finance LLC/Hilton Worldwide Finance Corp., Senior Notes | | | 5.625 | % | | | 10/15/21 | | | | 730,000 | | | | 758,744 | (a) |
Hoa Restaurant Group LLC/Hoa Finance Corp., Senior Secured Notes | | | 11.250 | % | | | 4/1/17 | | | | 590,000 | | | | 625,400 | (a) |
Landry’s Holdings II Inc., Senior Notes | | | 10.250 | % | | | 1/1/18 | | | | 510,000 | | | | 543,787 | (a) |
Landry’s Inc., Senior Notes | | | 9.375 | % | | | 5/1/20 | | | | 610,000 | | | | 667,950 | (a) |
Marstons Issuer PLC, Secured Bonds | | | 5.641 | % | | | 7/15/35 | | | | 223,000 | GBP | | | 331,426 | (f) |
MCE Finance Ltd., Senior Notes | | | 5.000 | % | | | 2/15/21 | | | | 1,050,000 | | | | 1,026,375 | (a) |
Mohegan Tribal Gaming Authority, Senior Notes | | | 9.750 | % | | | 9/1/21 | | | | 190,000 | | | | 205,675 | (a) |
NCL Corp. Ltd., Senior Notes | | | 5.000 | % | | | 2/15/18 | | | | 250,000 | | | | 258,750 | |
Paris Las Vegas Holding LLC/Harrah’s Las Vegas LLC/Flamingo Las Vegas Holding LLC, Senior Secured Notes | | | 8.000 | % | | | 10/1/20 | | | | 620,000 | | | | 647,900 | (a) |
Seven Seas Cruises S de RL LLC, Senior Secured Notes | | | 9.125 | % | | | 5/15/19 | | | | 630,000 | | | | 696,937 | |
Snoqualmie Entertainment Authority, Senior Secured Notes | | | 4.147 | % | | | 2/1/14 | | | | 235,000 | | | | 233,825 | (a)(f) |
Wynn Las Vegas LLC/Wynn Las Vegas Capital Corp., Senior Notes | | | 5.375 | % | | | 3/15/22 | | | | 490,000 | | | | 497,350 | |
Total Hotels, Restaurants & Leisure | | | | | | | | | | | | | | | 10,810,197 | |
Household Durables — 1.1% | | | | | | | | | | | | | | | | |
Shea Homes LP/Shea Homes Funding Corp., Senior Secured Notes | | | 8.625 | % | | | 5/15/19 | | | | 490,000 | | | | 545,125 | |
Standard Pacific Corp., Senior Notes | | | 6.250 | % | | | 12/15/21 | | | | 490,000 | | | | 511,438 | |
Weekley Homes LLC/Weekley Finance Corp., Senior Notes | | | 6.000 | % | | | 2/1/23 | | | | 190,000 | | | | 184,300 | (a) |
William Lyon Homes Inc., Senior Notes | | | 8.500 | % | | | 11/15/20 | | | | 490,000 | | | | 532,875 | |
Woodside Homes Co. LLC/Woodside Homes Finance Inc., Senior Notes | | | 6.750 | % | | | 12/15/21 | | | | 410,000 | | | | 413,075 | (a) |
Total Household Durables | | | | | | | | | | | | | | | 2,186,813 | |
Media — 5.0% | | | | | | | | | | | | | | | | |
Carmike Cinemas Inc., Secured Notes | | | 7.375 | % | | | 5/15/19 | | | | 170,000 | | | | 186,150 | |
CCO Holdings LLC/CCO Holdings Capital Corp., Senior Notes | | | 8.125 | % | | | 4/30/20 | | | | 380,000 | | | | 414,200 | |
CCO Holdings LLC/CCO Holdings Capital Corp., Senior Notes | | | 6.625 | % | | | 1/31/22 | | | | 250,000 | | | | 258,750 | |
Cerved Group SpA, Senior Subordinated Notes | | | 8.000 | % | | | 1/15/21 | | | | 110,000 | EUR | | | 160,785 | (a) |
Cerved Group SpA, Senior Subordinated Notes | | | 8.000 | % | | | 1/15/21 | | | | 100,000 | EUR | | | 146,168 | (a) |
Clear Channel Worldwide Holdings Inc., Senior Notes | | | 6.500 | % | | | 11/15/22 | | | | 390,000 | | | | 400,238 | |
Clear Channel Worldwide Holdings Inc., Senior Notes | | | 6.500 | % | | | 11/15/22 | | | | 150,000 | | | | 152,813 | |
Clear Channel Worldwide Holdings Inc., Senior Subordinated Notes | | | 7.625 | % | | | 3/15/20 | | | | 120,000 | | | | 125,400 | |
CSC Holdings LLC, Senior Notes | | | 6.750 | % | | | 11/15/21 | | | | 890,000 | | | | 963,425 | |
DISH DBS Corp., Senior Notes | | | 6.625 | % | | | 10/1/14 | | | | 30,000 | | | | 31,275 | |
See Notes to Financial Statements.
| | |
| 14 | | Western Asset Variable Global High Yield Bond Portfolio 2013 Annual Report |
Western Asset Variable Global High Yield Bond Portfolio
| | | | | | | | | | | | | | | | |
| Security | | Rate | | | Maturity
Date | | | Face
Amount† | | | Value | |
Media — continued | | | | | | | | | | | | | | | | |
DISH DBS Corp., Senior Notes | | | 6.750 | % | | | 6/1/21 | | | | 1,090,000 | | | $ | 1,160,850 | |
DISH DBS Corp., Senior Notes | | | 5.000 | % | | | 3/15/23 | | | | 400,000 | | | | 375,000 | |
Gannett Co. Inc., Senior Notes | | | 6.375 | % | | | 10/15/23 | | | | 360,000 | | | | 373,500 | (a) |
Gibson Brands Inc., Senior Secured Notes | | | 8.875 | % | | | 8/1/18 | | | | 140,000 | | | | 148,400 | (a) |
Kabel Deutschland Holding AG, Senior Subordinated Secured Notes | | | 6.500 | % | | | 7/31/17 | | | | 400,000 | EUR | | | 592,981 | (a) |
Lynx II Corp., Senior Notes | | | 7.000 | % | | | 4/15/23 | | | | 210,000 | GBP | | | 363,398 | (a) |
MDC Partners Inc., Senior Notes | | | 6.750 | % | | | 4/1/20 | | | | 400,000 | | | | 420,500 | (a) |
MediaNews Group Inc. | | | 12.000 | % | | | 12/31/18 | | | | 200,000 | | | | 200,000 | (c) |
Nara Cable Funding Ltd., Senior Secured Notes | | | 8.875 | % | | | 12/1/18 | | | | 500,000 | | | | 540,000 | (a) |
New Cotai LLC/New Cotai Capital Corp., Senior Secured Notes | | | 10.625 | % | | | 5/1/19 | | | | 528,333 | | | | 546,825 | (a)(b) |
Ono Finance II PLC, Senior Bonds | | | 10.875 | % | | | 7/15/19 | | | | 210,000 | | | | 231,000 | (a) |
Polish Television Holding BV, Senior Secured Bonds | | | 11.000 | % | | | 1/15/21 | | | | 100,000 | EUR | | | 148,328 | (a)(b) |
Sinclair Television Group Inc., Senior Notes | | | 5.375 | % | | | 4/1/21 | | | | 260,000 | | | | 257,400 | |
Time Warner Cable Inc., Senior Notes | | | 8.750 | % | | | 2/14/19 | | | | 177,000 | | | | 211,356 | |
Time Warner Cable Inc., Senior Notes | | | 8.250 | % | | | 4/1/19 | | | | 183,000 | | | | 214,618 | |
TVN Finance Corp. III AB, Senior Bonds | | | 7.375 | % | | | 12/15/20 | | | | 151,000 | EUR | | | 224,868 | (a) |
TVN Finance Corp. III AB, Senior Notes | | | 7.875 | % | | | 11/15/18 | | | | 75,000 | EUR | | | 109,509 | (a) |
Univision Communications Inc., Senior Notes | | | 8.500 | % | | | 5/15/21 | | | | 760,000 | | | | 839,800 | (a) |
Univision Communications Inc., Senior Secured Notes | | | 6.875 | % | | | 5/15/19 | | | | 300,000 | | | | 322,125 | (a) |
Vougeot Bidco PLC, Senior Secured Notes | | | 7.875 | % | | | 7/15/20 | | | | 100,000 | GBP | | | 178,346 | (a) |
Total Media | | | | | | | | | | | | | | | 10,298,008 | |
Multiline Retail — 0.7% | | | | | | | | | | | | | | | | |
Bon-Ton Department Stores Inc., Secured Notes | | | 8.000 | % | | | 6/15/21 | | | | 400,000 | | | | 405,000 | |
Neiman Marcus Group Ltd. Inc., Senior Notes | | | 8.000 | % | | | 10/15/21 | | | | 80,000 | | | | 84,000 | (a) |
Neiman Marcus Group Ltd. Inc., Senior Notes | | | 8.750 | % | | | 10/15/21 | | | | 870,000 | | | | 915,675 | (a)(b) |
Total Multiline Retail | | | | | | | | | | | | | | | 1,404,675 | |
Specialty Retail — 1.2% | | | | | | | | | | | | | | | | |
AA Bond Co., Ltd., Secured Notes | | | 9.500 | % | | | 7/31/19 | | | | 120,000 | GBP | | | 219,082 | (a) |
CST Brands Inc., Senior Notes | | | 5.000 | % | | | 5/1/23 | | | | 210,000 | | | | 203,700 | |
Dufry Finance SCA, Senior Notes | | | 5.500 | % | | | 10/15/20 | | | | 520,000 | | | | 534,300 | (a) |
Edcon Pty Ltd., Senior Secured Notes | | | 9.500 | % | | | 3/1/18 | | | | 431,000 | EUR | | | 612,197 | (a) |
Gymboree Corp., Senior Notes | | | 9.125 | % | | | 12/1/18 | | | | 390,000 | | | | 361,238 | |
Michaels Stores Inc., Senior Subordinated Notes | | | 5.875 | % | | | 12/15/20 | | | | 450,000 | | | | 453,375 | (a) |
New Academy Finance Co. LLC/New Academy Finance Corp., Senior Notes | | | 8.000 | % | | | 6/15/18 | | | | 40,000 | | | | 41,200 | (a)(b) |
Spencer Spirit Holdings Inc., Senior Notes | | | 9.000 | % | | | 5/1/18 | | | | 170,000 | | | | 173,825 | (a)(b) |
Total Specialty Retail | | | | | | | | | | | | | | | 2,598,917 | |
See Notes to Financial Statements.
| | |
| Western Asset Variable Global High Yield Bond Portfolio 2013 Annual Report | | 15 |
Schedule of investments (cont’d)
December 31, 2013
Western Asset Variable Global High Yield Bond Portfolio
| | | | | | | | | | | | | | | | |
| Security | | Rate | | | Maturity
Date | | | Face
Amount† | | | Value | |
Textiles, Apparel & Luxury Goods — 0.6% | | | | | | | | | | | | | | | | |
Boardriders SA, Senior Notes | | | 8.875 | % | | | 12/15/17 | | | | 550,000 | EUR | | $ | 817,165 | (a) |
Empire Today LLC/Empire Today Finance Corp., Senior Secured Notes | | | 11.375 | % | | | 2/1/17 | | | | 200,000 | | | | 201,000 | (a) |
William Carter Co., Senior Notes | | | 5.250 | % | | | 8/15/21 | | | | 200,000 | | | | 204,000 | (a) |
Total Textiles, Apparel & Luxury Goods | | | | | | | | | | | | | | | 1,222,165 | |
Total Consumer Discretionary | | | | | | | | | | | | | | | 33,873,283 | |
| Consumer Staples — 4.1% | | | | | | | | | | | | | | | | |
Beverages — 0.8% | | | | | | | | | | | | | | | | |
Carolina Beverage Group LLC/Carolina Beverage Group Finance Inc., Secured Notes | | | 10.625 | % | | | 8/1/18 | | | | 250,000 | | | | 263,750 | (a) |
Constellation Brands Inc., Senior Notes | | | 4.250 | % | | | 5/1/23 | | | | 360,000 | | | | 336,600 | |
Crestview DS Merger Subordinated II Inc., Senior Secured Notes | | | 10.000 | % | | | 9/1/21 | | | | 450,000 | | | | 484,875 | (a) |
Darling Escrow Corp., Senior Notes | | | 5.375 | % | | | 1/15/22 | | | | 250,000 | | | | 252,187 | (a) |
Hawk Acquisition Subordinated Inc., Senior Secured Notes | | | 4.250 | % | | | 10/15/20 | | | | 360,000 | | | | 349,200 | (a) |
Total Beverages | | | | | | | | | | | | | | | 1,686,612 | |
Food & Staples Retailing — 0.2% | | | | | | | | | | | | | | | | |
Beverages & More Inc., Senior Secured Notes | | | 10.000 | % | | | 11/15/18 | | | | 440,000 | | | | 444,950 | (a) |
Food Products — 2.4% | | | | | | | | | | | | | | | | |
Boparan Holdings Ltd., Senior Notes | | | 9.875 | % | | | 4/30/18 | | | | 300,000 | GBP | | | 545,271 | (a) |
Chiquita Brands International Inc./Chiquita Brands LLC, Senior Secured Notes | | | 7.875 | % | | | 2/1/21 | | | | 500,000 | | | | 542,500 | (a) |
Dole Food Co. Inc., Senior Secured Notes | | | 7.250 | % | | | 5/1/19 | | | | 500,000 | | | | 499,375 | (a) |
Marfrig Holding Europe BV, Senior Notes | | | 11.250 | % | | | 9/20/21 | | | | 460,000 | | | | 443,900 | (a) |
Post Holdings Inc., Senior Notes | | | 7.375 | % | | | 2/15/22 | | | | 560,000 | | | | 602,000 | (a) |
R&R Ice Cream PLC, Senior Secured Notes | | | 8.375 | % | | | 11/15/17 | | | | 231,000 | EUR | | | 339,360 | (a) |
Simmons Foods Inc., Senior Secured Notes | | | 10.500 | % | | | 11/1/17 | | | | 820,000 | | | | 875,350 | (a) |
Sun Merger Sub Inc., Senior Notes | | | 5.875 | % | | | 8/1/21 | | | | 890,000 | | | | 914,475 | (a) |
Wells Enterprises Inc., Senior Secured Notes | | | 6.750 | % | | | 2/1/20 | | | | 180,000 | | | | 183,150 | (a) |
Total Food Products | | | | | | | | | | | | | | | 4,945,381 | |
Household Products — 0.2% | | | | | | | | | | | | | | | | |
Spectrum Brands Escrow Corp., Senior Notes | | | 6.375 | % | | | 11/15/20 | | | | 140,000 | | | | 149,800 | (a) |
Spectrum Brands Escrow Corp., Senior Notes | | | 6.625 | % | | | 11/15/22 | | | | 180,000 | | | | 191,925 | (a) |
Total Household Products | | | | | | | | | | | | | | | 341,725 | |
Personal Products — 0.2% | | | | | | | | | | | | | | | | |
Hypermarcas SA, Notes | | | 6.500 | % | | | 4/20/21 | | | | 380,000 | | | | 402,800 | (a) |
Tobacco — 0.3% | | | | | | | | | | | | | | | | |
Alliance One International Inc., Secured Notes | | | 9.875 | % | | | 7/15/21 | | | | 700,000 | | | | 659,750 | |
Total Consumer Staples | | | | 8,481,218 | |
See Notes to Financial Statements.
| | |
| 16 | | Western Asset Variable Global High Yield Bond Portfolio 2013 Annual Report |
Western Asset Variable Global High Yield Bond Portfolio
| | | | | | | | | | | | | | | | |
| Security | | Rate | | | Maturity
Date | | | Face
Amount† | | | Value | |
| Energy — 13.4% | | | | | | | | | | | | | | | | |
Energy Equipment & Services — 1.9% | | | | | | | | | | | | | | | | |
Atwood Oceanics Inc., Senior Notes | | | 6.500 | % | | | 2/1/20 | | | | 210,000 | | | $ | 225,225 | |
CGG, Senior Notes | | | 6.500 | % | | | 6/1/21 | | | | 230,000 | | | | 236,900 | |
Gulfmark Offshore Inc., Senior Notes | | | 6.375 | % | | | 3/15/22 | | | | 300,000 | | | | 303,750 | |
Hercules Offshore Inc., Senior Notes | | | 10.250 | % | | | 4/1/19 | | | | 450,000 | | | | 511,875 | (a) |
Hercules Offshore Inc., Senior Notes | | | 8.750 | % | | | 7/15/21 | | | | 420,000 | | | | 470,400 | (a) |
Hercules Offshore Inc., Senior Notes | | | 7.500 | % | | | 10/1/21 | | | | 160,000 | | | | 170,400 | (a) |
Key Energy Services Inc., Senior Notes | | | 6.750 | % | | | 3/1/21 | | | | 560,000 | | | | 576,800 | |
Offshore Drilling Holding SA, Senior Secured Notes | | | 8.375 | % | | | 9/20/20 | | | | 510,000 | | | | 545,700 | (a) |
Pacific Drilling SA, Senior Secured Notes | | | 5.375 | % | | | 6/1/20 | | | | 330,000 | | | | 333,300 | (a) |
SESI LLC, Senior Notes | | | 7.125 | % | | | 12/15/21 | | | | 440,000 | | | | 492,800 | |
Total Energy Equipment & Services | | | | 3,867,150 | |
Oil, Gas & Consumable Fuels — 11.5% | | | | | | | | | | | | | | | | |
Access Midstream Partners LP/ACMP Finance Corp., Senior Notes | | | 5.875 | % | | | 4/15/21 | | | | 380,000 | | | | 406,600 | |
Access Midstream Partners LP/ACMP Finance Corp., Senior Notes | | | 4.875 | % | | | 5/15/23 | | | | 490,000 | | | | 475,300 | |
Antero Resources Finance Corp., Senior Notes | | | 5.375 | % | | | 11/1/21 | | | | 280,000 | | | | 282,975 | (a) |
Arch Coal Inc., Senior Notes | | | 7.000 | % | | | 6/15/19 | | | | 250,000 | | | | 200,000 | |
Arch Coal Inc., Senior Notes | | | 9.875 | % | | | 6/15/19 | | | | 690,000 | | | | 617,550 | |
Atlas Pipeline Partners LP/Atlas Pipeline Finance Corp., Senior Notes | | | 6.625 | % | | | 10/1/20 | | | | 160,000 | | | | 168,000 | |
Atlas Pipeline Partners LP/Atlas Pipeline Finance Corp., Senior Notes | | | 4.750 | % | | | 11/15/21 | | | | 120,000 | | | | 110,400 | (a) |
Atlas Pipeline Partners LP/Atlas Pipeline Finance Corp., Senior Notes | | | 5.875 | % | | | 8/1/23 | | | | 430,000 | | | | 411,725 | (a) |
Calumet Specialty Products Partners LP/Calumet Finance Corp., Senior Notes | | | 9.375 | % | | | 5/1/19 | | | | 330,000 | | | | 367,950 | |
Calumet Specialty Products Partners LP/Calumet Finance Corp., Senior Notes | | | 9.625 | % | | | 8/1/20 | | | | 560,000 | | | | 631,400 | |
Calumet Specialty Products Partners LP/Calumet Finance Corp., Senior Notes | | | 7.625 | % | | | 1/15/22 | | | | 40,000 | | | | 40,500 | (a) |
Carrizo Oil & Gas Inc., Senior Notes | | | 7.500 | % | | | 9/15/20 | | | | 160,000 | | | | 176,000 | |
Chesapeake Energy Corp., Senior Notes | | | 6.875 | % | | | 11/15/20 | | | | 430,000 | | | | 488,050 | |
Concho Resources Inc., Senior Notes | | | 5.500 | % | | | 10/1/22 | | | | 50,000 | | | | 51,875 | |
Concho Resources Inc., Senior Notes | | | 5.500 | % | | | 4/1/23 | | | | 120,000 | | | | 124,200 | |
Corral Petroleum Holdings AB, Senior Notes | | | 15.000 | % | | | 12/31/17 | | | | 886,255 | | | | 879,608 | (a)(b)(c) |
Crestwood Midstream Partners LP, Senior Notes | | | 6.125 | % | | | 3/1/22 | | | | 430,000 | | | | 442,900 | (a) |
CVR Refining LLC/Coffeyville Finance Inc., Secured Notes | | | 6.500 | % | | | 11/1/22 | | | | 350,000 | | | | 345,625 | |
Ecopetrol SA, Senior Notes | | | 5.875 | % | | | 9/18/23 | | | | 435,000 | | | | 460,013 | |
See Notes to Financial Statements.
| | |
| Western Asset Variable Global High Yield Bond Portfolio 2013 Annual Report | | 17 |
Schedule of investments (cont’d)
December 31, 2013
Western Asset Variable Global High Yield Bond Portfolio
| | | | | | | | | | | | | | | | |
| Security | | Rate | | | Maturity
Date | | | Face
Amount† | | | Value | |
Oil, Gas & Consumable Fuels — continued | | | | | | | | | | | | | | | | |
EDC Finance Ltd., Senior Notes | | | 4.875 | % | | | 4/17/20 | | | | 500,000 | | | $ | 486,875 | (a) |
EPE Holdings LLC/EP Energy Bond Co. Inc., Senior Notes | | | 8.875 | % | | | 12/15/17 | | | | 17,919 | | | | 18,501 | (a)(b) |
Globe Luxembourg SCA, Senior Secured Notes | | | 9.625 | % | | | 5/1/18 | | | | 680,000 | | | | 707,948 | (a) |
Halcon Resources Corp., Senior Notes | | | 9.750 | % | | | 7/15/20 | | | | 520,000 | | | | 544,700 | |
Halcon Resources Corp., Senior Notes | | | 9.750 | % | | | 7/15/20 | | | | 220,000 | | | | 230,175 | (a) |
Halcon Resources Corp., Senior Notes | | | 8.875 | % | | | 5/15/21 | | | | 200,000 | | | | 203,000 | |
Hiland Partners LP/Hiland Partners Finance Corp., Senior Notes | | | 7.250 | % | | | 10/1/20 | | | | 230,000 | | | | 247,825 | (a) |
Kinder Morgan Inc., Senior Secured Notes | | | 5.000 | % | | | 2/15/21 | | | | 370,000 | | | | 366,295 | (a) |
Kodiak Oil & Gas Corp., Senior Notes | | | 8.125 | % | | | 12/1/19 | | | | 300,000 | | | | 334,500 | |
LUKOIL International Finance BV, Bonds | | | 6.356 | % | | | 6/7/17 | | | | 250,000 | | | | 280,625 | (a) |
LUKOIL International Finance BV, Bonds | | | 6.656 | % | | | 6/7/22 | | | | 530,000 | | | | 582,337 | (a) |
Magnum Hunter Resources Corp., Senior Notes | | | 9.750 | % | | | 5/15/20 | | | | 580,000 | | | | 629,300 | |
MarkWest Energy Partners LP/MarkWest Energy Finance Corp., Senior Notes | | | 6.250 | % | | | 6/15/22 | | | | 84,000 | | | | 89,250 | |
MarkWest Energy Partners LP/MarkWest Energy Finance Corp., Senior Notes | | | 4.500 | % | | | 7/15/23 | | | | 220,000 | | | | 207,350 | |
MEG Energy Corp., Senior Notes | | | 7.000 | % | | | 3/31/24 | | | | 820,000 | | | | 832,300 | (a) |
Milagro Oil & Gas Inc., Secured Notes | | | 10.500 | % | | | 5/15/16 | | | | 650,000 | | | | 490,750 | |
Murphy Oil USA Inc., Senior Notes | | | 6.000 | % | | | 8/15/23 | | | | 380,000 | | | | 383,800 | (a) |
Natural Resource Partners LP, Senior Notes | | | 9.125 | % | | | 10/1/18 | | | | 330,000 | | | | 339,075 | (a) |
Novatek Finance Ltd., Notes | | | 6.604 | % | | | 2/3/21 | | | | 400,000 | | | | 440,000 | (a) |
Pacific Drilling V Ltd., Senior Secured Notes | | | 7.250 | % | | | 12/1/17 | | | | 200,000 | | | | 217,000 | (a) |
Pacific Rubiales Energy Corp., Senior Notes | | | 5.375 | % | | | 1/26/19 | | | | 340,000 | | | | 343,400 | (a) |
Pacific Rubiales Energy Corp., Senior Notes | | | 7.250 | % | | | 12/12/21 | | | | 390,000 | | | | 415,350 | (a) |
Pan American Energy LLC, Senior Notes | | | 7.875 | % | | | 5/7/21 | | | | 68,000 | | | | 70,720 | (a) |
Pan American Energy LLC, Senior Notes | | | 7.875 | % | | | 5/7/21 | | | | 29,000 | | | | 30,160 | (a) |
Peabody Energy Corp., Senior Notes | | | 7.875 | % | | | 11/1/26 | | | | 1,120,000 | | | | 1,142,400 | |
Petrobras Global Finance BV, Senior Notes | | | 4.375 | % | | | 5/20/23 | | | | 630,000 | | | | 567,562 | |
Petroleum Co. of Trinidad & Tobago Ltd., Senior Notes | | | 9.750 | % | | | 8/14/19 | | | | 320,000 | | | | 403,200 | (a) |
QEP Resources Inc., Senior Notes | | | 5.375 | % | | | 10/1/22 | | | | 450,000 | | | | 435,375 | |
QEP Resources Inc., Senior Notes | | | 5.250 | % | | | 5/1/23 | | | | 160,000 | | | | 150,800 | |
Quicksilver Resources Inc., Senior Notes | | | 11.000 | % | | | 7/1/21 | | | | 600,000 | | | | 654,000 | (a) |
Range Resources Corp., Senior Notes | | | 5.000 | % | | | 8/15/22 | | | | 90,000 | | | | 88,875 | |
Range Resources Corp., Senior Subordinated Notes | | | 8.000 | % | | | 5/15/19 | | | | 150,000 | | | | 160,688 | |
Regency Energy Partners LP/Regency Energy Finance Corp., Senior Notes | | | 6.500 | % | | | 7/15/21 | | | | 100,000 | | | | 106,500 | |
Regency Energy Partners LP/Regency Energy Finance Corp., Senior Notes | | | 5.500 | % | | | 4/15/23 | | | | 30,000 | | | | 29,400 | |
See Notes to Financial Statements.
| | |
| 18 | | Western Asset Variable Global High Yield Bond Portfolio 2013 Annual Report |
Western Asset Variable Global High Yield Bond Portfolio
| | | | | | | | | | | | | | | | |
| Security | | Rate | | | Maturity
Date | | | Face
Amount† | | | Value | |
Oil, Gas & Consumable Fuels — continued | | | | | | | | | | | | | | | | |
Regency Energy Partners LP/Regency Energy Finance Corp., Senior Notes | | | 4.500 | % | | | 11/1/23 | | | | 460,000 | | | $ | 420,900 | |
Rosneft Finance SA, Senior Notes | | | 7.500 | % | | | 7/18/16 | | | | 220,000 | | | | 248,050 | (a) |
Rosneft Finance SA, Senior Notes | | | 7.875 | % | | | 3/13/18 | | | | 490,000 | | | | 568,400 | (a) |
Rosneft Finance SA, Senior Notes | | | 7.875 | % | | | 3/13/18 | | | | 150,000 | | | | 174,000 | (a) |
Samson Investment Co., Senior Notes | | | 10.500 | % | | | 2/15/20 | | | | 1,000,000 | | | | 1,095,000 | (a) |
Sanchez Energy Corp., Senior Notes | | | 7.750 | % | | | 6/15/21 | | | | 830,000 | | | | 852,825 | (a) |
Shelf Drilling Holdings Ltd., Senior Secured Notes | | | 8.625 | % | | | 11/1/18 | | | | 320,000 | | | | 347,200 | (a) |
Sidewinder Drilling Inc., Senior Notes | | | 9.750 | % | | | 11/15/19 | | | | 190,000 | | | | 169,100 | (a) |
Summit Midstream Holdings LLC/Summit Mindstream Finance Corp., Senior Notes | | | 7.500 | % | | | 7/1/21 | | | | 240,000 | | | | 252,000 | (a) |
Targa Resources Partners LP/Targa Resources Partners Finance Corp., Senior Bonds | | | 5.250 | % | | | 5/1/23 | | | | 80,000 | | | | 77,900 | |
Targa Resources Partners LP/Targa Resources Partners Finance Corp., Senior Notes | | | 6.375 | % | | | 8/1/22 | | | | 188,000 | | | | 199,750 | |
Xinergy Ltd., Senior Secured Notes | | | 9.250 | % | | | 5/15/19 | | | | 780,000 | | | | 549,900 | (a) |
Total Oil, Gas & Consumable Fuels | | | | 23,865,732 | |
Total Energy | | | | 27,732,882 | |
| Financials — 6.1% | | | | | | | | | | | | | | | | |
Commercial Banks — 2.9% | | | | | | | | | | | | | | | | |
Barclays Bank PLC, Subordinated Notes | | | 10.179 | % | | | 6/12/21 | | | | 250,000 | | | | 331,814 | (a) |
Barclays Bank PLC, Subordinated Notes | | | 7.625 | % | | | 11/21/22 | | | | 220,000 | | | | 234,850 | |
CIT Group Inc., Senior Notes | | | 5.000 | % | | | 8/1/23 | | | | 1,330,000 | | | | 1,286,775 | |
Cooperatieve Centrale Raiffeisen-Boerenleenbank BA, Junior Subordinated Notes | | | 11.000 | % | | | 6/30/19 | | | | 90,000 | | | | 119,362 | (a)(f)(g) |
Credit Agricole SA, Subordinated Notes | | | 8.375 | % | | | 10/13/19 | | | | 300,000 | | | | 342,000 | (a)(f)(g) |
Deutsche Postbank Funding Trust IV, Subordinated Notes | | | 5.983 | % | | | 6/29/17 | | | | 650,000 | EUR | | | 917,901 | (a)(f)(g) |
M&T Bank Corp., Junior Subordinated Notes | | | 6.875 | % | | | 6/15/16 | | | | 530,000 | | | | 511,719 | (a)(g) |
Royal Bank of Scotland Group PLC, Junior Subordinated Bonds | | | 7.648 | % | | | 9/30/31 | | | | 670,000 | | | | 706,850 | (f)(g) |
Royal Bank of Scotland Group PLC, Subordinated Notes | | | 6.000 | % | | | 12/19/23 | | | | 320,000 | | | | 322,678 | |
Royal Bank of Scotland NV, Subordinated Notes | | | 7.750 | % | | | 5/15/23 | | | | 160,000 | | | | 176,292 | |
Royal Bank of Scotland PLC, Subordinated Notes | | | 13.125 | % | | | 3/19/22 | | | | 940,000 | AUD | | | 989,991 | (a)(f) |
Total Commercial Banks | | | | | | | | | | | | | | | 5,940,232 | |
Consumer Finance — 0.4% | | | | | | | | | | | | | | | | |
SLM Corp., Medium-Term Notes, Senior Notes | | | 8.450 | % | | | 6/15/18 | | | | 340,000 | | | | 397,375 | |
Stearns Holdings Inc., Senior Secured Notes | | | 9.375 | % | | | 8/15/20 | | | | 230,000 | | | | 235,750 | (a) |
TMX Finance LLC/TitleMax Finance Corp., Senior Secured Notes | | | 8.500 | % | | | 9/15/18 | | | | 190,000 | | | | 203,300 | (a) |
Total Consumer Finance | | | | | | | | | | | | | | | 836,425 | |
See Notes to Financial Statements.
| | |
| Western Asset Variable Global High Yield Bond Portfolio 2013 Annual Report | | 19 |
Schedule of investments (cont’d)
December 31, 2013
Western Asset Variable Global High Yield Bond Portfolio
| | | | | | | | | | | | | | | | |
| Security | | Rate | | | Maturity
Date | | | Face
Amount† | | | Value | |
Diversified Financial Services — 2.1% | | | | | | | | | | | | | | | | |
ING Group NV, Subordinated Bonds | | | 5.140 | % | | | 3/17/16 | | | | 550,000 | GBP | | $ | 901,557 | (f)(g) |
International Lease Finance Corp., Senior Notes | | | 8.625 | % | | | 1/15/22 | | | | 1,280,000 | | | | 1,519,043 | |
JPMorgan Chase & Co., Junior Subordinated Bonds | | | 5.150 | % | | | 5/1/23 | | | | 250,000 | | | | 225,625 | (f)(g) |
Nationstar Mortgage LLC/Nationstar Capital Corp., Senior Notes | | | 6.500 | % | | | 8/1/18 | | | | 530,000 | | | | 541,925 | |
Nationstar Mortgage LLC/Nationstar Capital Corp., Senior Notes | | | 7.875 | % | | | 10/1/20 | | | | 210,000 | | | | 218,925 | |
TransUnion Holding Co. Inc., Senior Notes | | | 9.625 | % | | | 6/15/18 | | | | 380,000 | | | | 410,400 | |
ZFS Finance USA Trust II, Bonds | | | 6.450 | % | | | 12/15/65 | | | | 500,000 | | | | 537,500 | (a)(f) |
Total Diversified Financial Services | | | | | | | | | | | | | | | 4,354,975 | |
Insurance — 0.4% | | | | | | | | | | | | | | | | |
ELM BV, Subordinated Notes | | | 5.252 | % | | | 5/25/16 | | | | 500,000 | EUR | | | 722,135 | (a)(f)(g) |
Fidelity & Guaranty Life Holdings Inc., Senior Notes | | | 6.375 | % | | | 4/1/21 | | | | 190,000 | | | | 200,450 | (a) |
Total Insurance | | | | | | | | | | | | | | | 922,585 | |
Real Estate Management & Development — 0.3% | | | | | | | | | | | | | | | | |
Howard Hughes Corp., Senior Notes | | | 6.875 | % | | | 10/1/21 | | | | 540,000 | | | | 564,300 | (a) |
Total Financials | | | | | | | | | | | | | | | 12,618,517 | |
| Health Care — 4.9% | | | | | | | | | | | | | | | | |
Health Care Equipment & Supplies — 0.8% | | | | | | | | | | | | | | | | |
Alere Inc., Senior Subordinated Notes | | | 6.500 | % | | | 6/15/20 | | | | 430,000 | | | | 441,825 | |
ConvaTec Finance International SA, Senior Notes | | | 8.250 | % | | | 1/15/19 | | | | 380,000 | | | | 389,975 | (a)(b) |
Lantheus Medical Imaging Inc., Senior Notes | | | 9.750 | % | | | 5/15/17 | | | | 810,000 | | | | 729,000 | |
Ontex IV SA, Senior Notes | | | 9.000 | % | | | 4/15/19 | | | | 120,000 | EUR | | | 179,941 | (a) |
Total Health Care Equipment & Supplies | | | | | | | | | | | | | | | 1,740,741 | |
Health Care Providers & Services — 3.2% | | | | | | | | | | | | | | | | |
Acadia Healthcare Co. Inc., Senior Notes | | | 12.875 | % | | | 11/1/18 | | | | 247,000 | | | | 300,105 | |
Acadia Healthcare Co. Inc., Senior Notes | | | 6.125 | % | | | 3/15/21 | | | | 330,000 | | | | 339,900 | (a) |
DJO Finance LLC/DJO Finance Corp., Senior Notes | | | 9.875 | % | | | 4/15/18 | | | | 510,000 | | | | 550,800 | |
ExamWorks Group Inc., Senior Notes | | | 9.000 | % | | | 7/15/19 | | | | 480,000 | | | | 522,000 | |
Fresenius Medical Care U.S. Finance II Inc., Senior Notes | | | 5.875 | % | | | 1/31/22 | | | | 710,000 | | | | 752,600 | (a) |
HCA Holdings Inc., Senior Notes | | | 6.250 | % | | | 2/15/21 | | | | 660,000 | | | | 692,175 | |
IASIS Healthcare LLC/IASIS Capital Corp., Senior Notes | | | 8.375 | % | | | 5/15/19 | | | | 730,000 | | | | 777,450 | |
Physiotherapy Associates Holdings Inc., Senior Notes | | | 11.875 | % | | | 5/1/19 | | | | 550,000 | | | | 217,250 | (a)(e) |
Radnet Management Inc., Senior Notes | | | 10.375 | % | | | 4/1/18 | | | | 560,000 | | | | 561,400 | |
Tenet Healthcare Corp., Senior Notes | | | 8.125 | % | | | 4/1/22 | | | | 170,000 | | | | 183,600 | |
Tenet Healthcare Corp., Senior Secured Notes | | | 6.000 | % | | | 10/1/20 | | | | 510,000 | | | | 533,269 | (a) |
Unilabs Subholding AB, Senior Secured Notes | | | 8.500 | % | | | 7/15/18 | | | | 460,000 | EUR | | | 664,463 | (a) |
WellCare Health Plans Inc., Senior Notes | | | 5.750 | % | | | 11/15/20 | | | | 550,000 | | | | 565,125 | |
Total Health Care Providers & Services | | | | | | | | | | | | | | | 6,660,137 | |
See Notes to Financial Statements.
| | |
| 20 | | Western Asset Variable Global High Yield Bond Portfolio 2013 Annual Report |
Western Asset Variable Global High Yield Bond Portfolio
| | | | | | | | | | | | | | | | |
| Security | | Rate | | | Maturity
Date | | | Face
Amount† | | | Value | |
Pharmaceuticals — 0.9% | | | | | | | | | | | | | | | | |
ConvaTec Healthcare E SA, Senior Notes | | | 10.875 | % | | | 12/15/18 | | | | 307,000 | EUR | | $ | 477,244 | (a) |
Forest Laboratories Inc., Senior Notes | | | 5.000 | % | | | 12/15/21 | | | | 580,000 | | | | 583,625 | (a) |
Salix Pharmaceuticals Ltd., Senior Notes | | | 6.000 | % | | | 1/15/21 | | | | 220,000 | | | | 226,050 | (a) |
UCB SA, Subordinated Notes | | | 7.750 | % | | | 3/18/16 | | | | 100,000 | EUR | | | 149,676 | (a)(f)(g) |
Valeant Pharmaceuticals International Inc., Senior Notes | | | 5.625 | % | | | 12/1/21 | | | | 400,000 | | | | 403,000 | (a) |
Total Pharmaceuticals | | | | | | | | | | | | | | | 1,839,595 | |
Total Health Care | | | | | | | | | | | | | | | 10,240,473 | |
| Industrials — 11.9% | | | | | | | | | | | | | | | | |
Aerospace & Defense — 1.4% | | | | | | | | | | | | | | | | |
Alliant Techsystems Inc., Senior Notes | | | 5.250 | % | | | 10/1/21 | | | | 470,000 | | | | 473,525 | (a) |
CBC Ammo LLC/CBC FinCo Inc., Senior Notes | | | 7.250 | % | | | 11/15/21 | | | | 580,000 | | | | 574,200 | (a) |
Ducommun Inc., Senior Notes | | | 9.750 | % | | | 7/15/18 | | | | 710,000 | | | | 793,425 | |
Erickson Air-Crane Inc., Senior Secured Notes | | | 8.250 | % | | | 5/1/20 | | | | 719,000 | | | | 747,760 | (a) |
GenCorp Inc., Secured Notes | | | 7.125 | % | | | 3/15/21 | | | | 270,000 | | | | 290,250 | |
Total Aerospace & Defense | | | | | | | | | | | | | | | 2,879,160 | |
Airlines — 2.1% | | | | | | | | | | | | | | | | |
Air Canada, Pass-Through Trust, Secured Notes | | | 6.625 | % | | | 5/15/18 | | | | 430,000 | | | | 430,258 | (a) |
Air Canada, Senior Secured Notes | | | 8.750 | % | | | 4/1/20 | | | | 290,000 | | | | 309,575 | (a) |
American Airlines, Pass-Through Trust, Secured Notes | | | 7.000 | % | | | 1/31/18 | | | | 196,059 | | | | 207,333 | (a) |
American Airlines, Pass-Through Trust, Secured Notes | | | 5.625 | % | | | 1/15/21 | | | | 260,000 | | | | 260,650 | (a) |
American Airlines, Pass-Through Trust, Senior Secured Notes | | | 5.600 | % | | | 7/15/20 | | | | 540,000 | | | | 545,400 | (a) |
Delta Air Lines Inc., Pass-Through Certificates, Subordinated Secured Notes | | | 9.750 | % | | | 12/17/16 | | | | 76,132 | | | | 86,029 | |
Hawaiian Airlines, Pass-Through Certificates, Senior Secured Bonds | | | 4.950 | % | | | 1/15/22 | | | | 480,000 | | | | 440,400 | |
Heathrow Finance PLC, Senior Secured Notes | | | 7.125 | % | | | 3/1/17 | | | | 500,000 | GBP | | | 913,871 | (a) |
United Airlines Inc., Pass-Through Certificates | | | 7.373 | % | | | 12/15/15 | | | | 502,597 | | | | 536,523 | |
United Airlines Inc., Pass-Through Certificates | | | 8.388 | % | | | 11/1/20 | | | | 104,976 | | | | 111,799 | |
United Airlines Inc., Pass-Through Certificates, Secured Notes | | | 6.250 | % | | | 4/11/20 | | | | 227,838 | | | | 238,090 | |
US Airways, Pass-Through Trust, Secured Bonds | | | 6.750 | % | | | 6/3/21 | | | | 59,766 | | | | 63,501 | |
US Airways, Pass-Through Trust, Senior Secured Bonds | | | 5.375 | % | | | 11/15/21 | | | | 220,000 | | | | 216,700 | |
Total Airlines | | | | | | | | | | | | | | | 4,360,129 | |
Building Products — 0.8% | | | | | | | | | | | | | | | | |
Andrade Gutierrez International SA, Senior Notes | | | 4.000 | % | | | 4/30/18 | | | | 570,000 | | | | 540,075 | (a) |
Ashton Woods USA LLC/Ashton Woods Finance Co., Senior Notes | | | 6.875 | % | | | 2/15/21 | | | | 470,000 | | | | 465,300 | (a) |
Rearden G Holdings EINS GmbH, Senior Notes | | | 7.875 | % | | | 3/30/20 | | | | 160,000 | | | | 167,200 | (a) |
Reliance Intermediate Holdings LP, Senior Secured Notes | | | 9.500 | % | | | 12/15/19 | | | | 100,000 | | | | 110,000 | (a) |
See Notes to Financial Statements.
| | |
| Western Asset Variable Global High Yield Bond Portfolio 2013 Annual Report | | 21 |
Schedule of investments (cont’d)
December 31, 2013
Western Asset Variable Global High Yield Bond Portfolio
| | | | | | | | | | | | | | | | |
| Security | | Rate | | | Maturity
Date | | | Face
Amount† | | | Value | |
Building Products — continued | | | | | | | | | | | | | | | | |
Spie BondCo 3 SCA, Secured Notes | | | 11.000 | % | | | 8/15/19 | | | | 243,000 | EUR | | $ | 382,447 | (a) |
Total Building Products | | | | | | | | | | | | | | | 1,665,022 | |
Commercial Services & Supplies — 1.2% | | | | | | | | | | | | | | | | |
Empark Funding SA, Senior Secured Bonds | | | 6.750 | % | | | 12/15/19 | | | | 190,000 | EUR | | | 268,898 | (a) |
Garda World Security Corp., Senior Notes | | | 7.250 | % | | | 11/15/21 | | | | 140,000 | | | | 141,750 | (a) |
JM Huber Corp., Senior Notes | | | 9.875 | % | | | 11/1/19 | | | | 250,000 | | | | 288,437 | (a) |
Monitronics International Inc., Senior Notes | | | 9.125 | % | | | 4/1/20 | | | | 570,000 | | | | 607,050 | |
Taylor Morrison Communities Inc./Monarch Communities Inc., Senior Notes | | | 7.750 | % | | | 4/15/20 | | | | 563,000 | | | | 622,115 | (a) |
Taylor Morrison Communities Inc./Monarch Communities Inc., Senior Notes | | | 7.750 | % | | | 4/15/20 | | | | 252,000 | | | | 278,460 | (a) |
Taylor Morrison Communities Inc./Monarch Communities Inc., Senior Notes | | | 5.250 | % | | | 4/15/21 | | | | 30,000 | | | | 29,250 | (a) |
TMS International Corp., Senior Notes | | | 7.625 | % | | | 10/15/21 | | | | 170,000 | | | | 181,900 | (a) |
Total Commercial Services & Supplies | | | | | | | | | | | | | | | 2,417,860 | |
Construction & Engineering — 1.1% | | | | | | | | | | | | | | | | |
Astaldi SpA, Senior Bonds | | | 7.125 | % | | | 12/1/20 | | | | 280,000 | EUR | | | 411,678 | (a) |
Ausdrill Finance Pty Ltd., Senior Notes | | | 6.875 | % | | | 11/1/19 | | | | 530,000 | | | | 486,275 | (a) |
Michael Baker International LLC/CDL Acquisition Co. Inc., Senior Secured Notes | | | 8.250 | % | | | 10/15/18 | | | | 510,000 | | | | 525,300 | (a) |
Odebrecht Finance Ltd., Senior Notes | | | 4.375 | % | | | 4/25/25 | | | | 1,020,000 | | | | 892,500 | (a) |
Total Construction & Engineering | | | | | | | | | | | | | | | 2,315,753 | |
Electrical Equipment — 0.5% | | | | | | | | | | | | | | | | |
International Wire Group Holdings Inc., Senior Secured Notes | | | 8.500 | % | | | 10/15/17 | | | | 340,000 | | | | 361,250 | (a) |
NES Rentals Holdings Inc., Senior Secured Notes | | | 7.875 | % | | | 5/1/18 | | | | 340,000 | | | | 361,250 | (a) |
Trionista TopCo GmbH, Senior Subordinated Notes | | | 6.875 | % | | | 4/30/21 | | | | 100,000 | EUR | | | 145,859 | (a) |
Wesco Distribution Inc., Senior Notes | | | 5.375 | % | | | 12/15/21 | | | | 250,000 | | | | 250,625 | (a) |
Total Electrical Equipment | | | | | | | | | | | | | | | 1,118,984 | |
Machinery — 1.0% | | | | | | | | | | | | | | | | |
CTP Transportation Products LLC/CTP Finance Inc., Senior Secured Notes | | | 8.250 | % | | | 12/15/19 | | | | 170,000 | | | | 178,075 | (a) |
Dematic SA/DH Services Luxembourg Sarl, Senior Notes | | | 7.750 | % | | | 12/15/20 | | | | 950,000 | | | | 1,014,125 | (a) |
Global Brass and Copper Inc., Senior Secured Notes | | | 9.500 | % | | | 6/1/19 | | | | 390,000 | | | | 446,550 | |
KraussMaffei Group GmbH, Senior Secured Notes | | | 8.750 | % | | | 12/15/20 | | | | 170,000 | EUR | | | 261,933 | (a) |
KraussMaffei Group GmbH, Senior Secured Notes | | | 8.750 | % | | | 12/15/20 | | | | 160,000 | EUR | | | 246,525 | (a) |
Total Machinery | | | | | | | | | | | | | | | 2,147,208 | |
Marine — 0.8% | | | | | | | | | | | | | | | | |
Horizon Lines LLC, Secured Notes | | | 13.000 | % | | | 10/15/16 | | | | 482,630 | | | | 448,846 | (b) |
Horizon Lines LLC, Senior Secured Notes | | | 11.000 | % | | | 10/15/16 | | | | 433,000 | | | | 434,082 | |
See Notes to Financial Statements.
| | |
| 22 | | Western Asset Variable Global High Yield Bond Portfolio 2013 Annual Report |
Western Asset Variable Global High Yield Bond Portfolio
| | | | | | | | | | | | | | | | |
| Security | | Rate | | | Maturity
Date | | | Face
Amount† | | | Value | |
Marine — continued | | | | | | | | | | | | | | | | |
Navios Maritime Acquisition Corp./Navios Acquisition Finance U.S. Inc., Senior Secured Notes | | | 8.125 | % | | | 11/15/21 | | | | 380,000 | | | $ | 389,500 | (a) |
Ultrapetrol Bahamas Ltd., Senior Secured Mortgage Notes | | | 8.875 | % | | | 6/15/21 | | | | 50,000 | | | | 54,063 | (a) |
Ultrapetrol Bahamas Ltd., Senior Secured Notes | | | 8.875 | % | | | 6/15/21 | | | | 310,000 | | | | 334,025 | (c) |
Total Marine | | | | | | | | | | | | | | | 1,660,516 | |
Road & Rail — 0.7% | | | | | | | | | | | | | | | | |
Flexi-Van Leasing Inc., Senior Notes | | | 7.875 | % | | | 8/15/18 | | | | 470,000 | | | | 500,550 | (a) |
Gategroup Finance Luxembourg SA, Senior Notes | | | 6.750 | % | | | 3/1/19 | | | | 100,000 | EUR | | | 146,443 | (a) |
Jack Cooper Finance Co., Senior Secured Notes | | | 9.250 | % | | | 6/1/20 | | | | 270,000 | | | | 291,938 | (a) |
Jack Cooper Holdings Corp., Senior Secured Notes | | | 9.250 | % | | | 6/1/20 | | | | 520,000 | | | | 562,250 | (a) |
Total Road & Rail | | | | | | | | | | | | | | | 1,501,181 | |
Trading Companies & Distributors — 0.5% | | | | | | | | | | | | | | | | |
Ashtead Capital Inc., Senior Secured Notes | | | 6.500 | % | | | 7/15/22 | | | | 630,000 | | | | 674,887 | (a) |
H&E Equipment Services Inc., Senior Notes | | | 7.000 | % | | | 9/1/22 | | | | 350,000 | | | | 383,250 | |
Total Trading Companies & Distributors | | | | | | | | | | | | | | | 1,058,137 | |
Transportation — 1.5% | | | | | | | | | | | | | | | | |
CMA CGM, Senior Notes | | | 8.500 | % | | | 4/15/17 | | | | 150,000 | | | | 147,750 | (a) |
CMA CGM, Senior Notes | | | 8.875 | % | | | 4/15/19 | | | | 600,000 | EUR | | | 818,437 | (a) |
Hapag-Lloyd AG, Senior Notes | | | 9.750 | % | | | 10/15/17 | | | | 190,000 | | | | 201,875 | (a) |
Neovia Logistics Intermediate Holdings LLC/Logistics Intermediate Finance Corp., Senior Notes | | | 10.000 | % | | | 2/15/18 | | | | 700,000 | | | | 710,500 | (a)(b) |
Syncreon Group BV/Syncreon Global Finance US Inc., Senior Notes | | | 8.625 | % | | | 11/1/21 | | | | 780,000 | | | | 811,200 | (a) |
Watco Cos., LLC/Watco Finance Corp., Senior Notes | | | 6.375 | % | | | 4/1/23 | | | | 300,000 | | | | 298,500 | (a) |
Total Transportation | | | | | | | | | | | | | | | 2,988,262 | |
Transportation Infrastructure — 0.3% | | | | | | | | | | | | | | | | |
Aguila 3 SA, Senior Secured Notes | | | 7.875 | % | | | 1/31/18 | | | | 480,000 | | | | 511,200 | (a) |
Total Industrials | | | | | | | | | | | | | | | 24,623,412 | |
| Information Technology — 2.2% | | | | | | | | | | | | | | | | |
Electronic Equipment, Instruments & Components — 0.1% | | | | | | | | | |
Techem GmbH, Senior Secured Notes | | | 6.125 | % | | | 10/1/19 | | | | 150,000 | EUR | | | 225,856 | (a) |
Internet Software & Services — 0.6% | | | | | | | | | | | | | | | | |
Ancestry.com Inc., Senior Notes | | | 11.000 | % | | | 12/15/20 | | | | 240,000 | | | | 279,600 | |
Bankrate Inc., Senior Notes | | | 6.125 | % | | | 8/15/18 | | | | 150,000 | | | | 156,750 | (a) |
VeriSign Inc., Senior Notes | | | 4.625 | % | | | 5/1/23 | | | | 560,000 | | | | 537,600 | |
Zayo Group LLC/Zayo Capital Inc., Senior Secured Notes | | | 8.125 | % | | | 1/1/20 | | | | 300,000 | | | | 330,000 | |
Total Internet Software & Services | | | | | | | | | | | | | | | 1,303,950 | |
See Notes to Financial Statements.
| | |
| Western Asset Variable Global High Yield Bond Portfolio 2013 Annual Report | | 23 |
Schedule of investments (cont’d)
December 31, 2013
Western Asset Variable Global High Yield Bond Portfolio
| | | | | | | | | | | | | | | | |
| Security | | Rate | | | Maturity
Date | | | Face
Amount† | | | Value | |
IT Services — 0.6% | | | | | | | | | | | | | | | | |
Compiler Finance Subordinated Inc., Senior Notes | | | 7.000 | % | | | 5/1/21 | | | | 120,000 | | | $ | 119,700 | (a) |
First Data Corp., Senior Notes | | | 12.625 | % | | | 1/15/21 | | | | 420,000 | | | | 495,075 | |
First Data Corp., Senior Secured Notes | | | 6.750 | % | | | 11/1/20 | | | | 250,000 | | | | 261,250 | (a) |
First Data Corp., Senior Subordinated Notes | | | 11.750 | % | | | 8/15/21 | | | | 320,000 | | | | 339,200 | (a) |
Total IT Services | | | | | | | | | | | | | | | 1,215,225 | |
Software — 0.9% | | | | | | | | | | | | | | | | |
ACI Worldwide Inc., Senior Notes | | | 6.375 | % | | | 8/15/20 | | | | 390,000 | | | | 408,525 | (a) |
Activision Blizzard Inc., Senior Notes | | | 5.625 | % | | | 9/15/21 | | | | 390,000 | | | | 404,625 | (a) |
Activision Blizzard Inc., Senior Notes | | | 6.125 | % | | | 9/15/23 | | | | 320,000 | | | | 334,400 | (a) |
Audatex North America Inc., Senior Notes | | | 6.125 | % | | | 11/1/23 | | | | 150,000 | | | | 155,250 | (a) |
Interface Security Systems Holdings Inc./Interface Security Systems LLC, Senior Secured Notes | | | 9.250 | % | | | 1/15/18 | | | | 450,000 | | | | 468,000 | (a) |
Total Software | | | | | | | | | | | | | | | 1,770,800 | |
Total Information Technology | | | | | | | | | | | | | | | 4,515,831 | |
| Materials — 11.8% | | | | | | | | | | | | | | | | |
Chemicals — 0.7% | | | | | | | | | | | | | | | | |
Axiall Corp., Senior Notes | | | 4.875 | % | | | 5/15/23 | | | | 500,000 | | | | 474,375 | (a) |
INEOS Group Holdings SA, Senior Notes | | | 7.875 | % | | | 2/15/16 | | | | 202,771 | EUR | | | 281,741 | (a) |
KP Germany Erste GmbH, Senior Secured Notes | | | 11.625 | % | | | 7/15/17 | | | | 150,000 | EUR | | | 238,959 | (a) |
KP Germany Erste GmbH, Senior Secured Notes | | | 11.625 | % | | | 7/15/17 | | | | 130,000 | EUR | | | 207,098 | (a) |
Styrolution GmbH, Senior Secured Notes | | | 7.625 | % | | | 5/15/16 | | | | 240,000 | EUR | | | 347,304 | (a) |
Total Chemicals | | | | | | | | | | | | | | | 1,549,477 | |
Construction Materials — 1.4% | | | | | | | | | | | | | | | | |
American Builders & Contractors Supply Co. Inc., Senior Notes | | | 5.625 | % | | | 4/15/21 | | | | 390,000 | | | | 392,925 | (a) |
Cemex Finance LLC, Senior Secured Notes | | | 9.375 | % | | | 10/12/22 | | | | 400,000 | | | | 453,000 | (a) |
Cemex Finance LLC, Senior Secured Notes | | | 9.375 | % | | | 10/12/22 | | | | 260,000 | | | | 294,450 | (a) |
Cemex SAB de CV, Senior Secured Notes | | | 9.000 | % | | | 1/11/18 | | | | 1,550,000 | | | | 1,708,875 | (a) |
Total Construction Materials | | | | | | | | | | | | | | | 2,849,250 | |
Containers & Packaging — 2.8% | | | | | | | | | | | | | | | | |
Ardagh Packaging Finance PLC, Senior Notes | | | 9.250 | % | | | 10/15/20 | | | | 375,000 | EUR | | | 562,962 | (a) |
Ardagh Packaging Finance PLC/Ardagh MP Holdings USA Inc., Senior Notes | | | 9.125 | % | | | 10/15/20 | | | | 250,000 | | | | 273,750 | (a) |
Ardagh Packaging Finance PLC/Ardagh MP Holdings USA Inc., Senior Notes | | | 7.000 | % | | | 11/15/20 | | | | 790,000 | | | | 801,850 | (a) |
Ardagh Packaging Finance PLC/Ardagh MP Holdings USA Inc., Senior Secured Notes | | | 7.375 | % | | | 10/15/17 | | | | 390,000 | EUR | | | 576,118 | (a) |
BOE Intermediate Holding Corp., Senior Notes | | | 9.000 | % | | | 11/1/17 | | | | 62,730 | | | | 65,710 | (a)(b) |
Exopack Holdings SA, Senior Notes | | | 7.875 | % | | | 11/1/19 | | | | 450,000 | | | | 461,250 | (a) |
Graphic Packaging International Inc., Senior Notes | | | 4.750 | % | | | 4/15/21 | | | | 140,000 | | | | 138,950 | |
See Notes to Financial Statements.
| | |
| 24 | | Western Asset Variable Global High Yield Bond Portfolio 2013 Annual Report |
Western Asset Variable Global High Yield Bond Portfolio
| | | | | | | | | | | | | | | | |
| Security | | Rate | | | Maturity
Date | | | Face
Amount† | | | Value | |
Containers & Packaging — continued | | | | | | | | | | | | | | | | |
Pactiv LLC, Senior Notes | | | 7.950 | % | | | 12/15/25 | | | | 1,720,000 | | | $ | 1,621,100 | |
Reynolds Group Issuer Inc./Reynolds Group Issuer LLC/Reynolds Group Issuer (Luxembourg) SA, Senior Secured Notes | | | 5.750 | % | | | 10/15/20 | | | | 550,000 | | | | 563,750 | |
Viskase Cos. Inc., Senior Secured Notes | | | 9.875 | % | | | 1/15/18 | | | | 720,000 | | | | 757,764 | (a) |
Total Containers & Packaging | | | | | | | | | | | | | | | 5,823,204 | |
Metals & Mining — 5.5% | | | | | | | | | | | | | | | | |
AngloGold Ashanti Holdings PLC, Senior Notes | | | 8.500 | % | | | 7/30/20 | | | | 400,000 | | | | 415,040 | |
ArcelorMittal, Senior Notes | | | 6.750 | % | | | 2/25/22 | | | | 400,000 | | | | 437,000 | |
Barminco Finance Pty Ltd., Senior Notes | | | 9.000 | % | | | 6/1/18 | | | | 350,000 | | | | 323,750 | (a) |
Barrick Gold Corp., Senior Notes | | | 4.100 | % | | | 5/1/23 | | | | 110,000 | | | | 99,616 | |
Coeur Mining Inc., Senior Notes | | | 7.875 | % | | | 2/1/21 | | | | 660,000 | | | | 673,200 | |
CSN Resources SA, Senior Bonds | | | 6.500 | % | | | 7/21/20 | | | | 190,000 | | | | 193,088 | (a) |
CSN Resources SA, Senior Bonds | | | 6.500 | % | | | 7/21/20 | | | | 186,000 | | | | 189,023 | (a) |
Evraz Group SA, Notes | | | 6.750 | % | | | 4/27/18 | | | | 1,170,000 | | | | 1,167,660 | (a) |
Evraz Group SA, Senior Notes | | | 9.500 | % | | | 4/24/18 | | | | 370,000 | | | | 405,612 | (a) |
FMG Resources (August 2006) Pty Ltd., Senior Notes | | | 8.250 | % | | | 11/1/19 | | | | 220,000 | | | | 247,775 | (a) |
FMG Resources (August 2006) Pty Ltd., Senior Notes | | | 6.875 | % | | | 4/1/22 | | | | 240,000 | | | | 262,800 | (a) |
Gerdau Holdings Inc., Senior Notes | | | 7.000 | % | | | 1/20/20 | | | | 354,000 | | | | 387,630 | (a) |
Midwest Vanadium Pty Ltd., Senior Secured Notes | | | 11.500 | % | | | 2/15/18 | | | | 420,000 | | | | 352,800 | (a)(d) |
Mirabela Nickel Ltd., Notes | | | 3.500 | % | | | 3/28/14 | | | | 119,000 | | | | 80,000 | (a)(b)(c)(k) |
Mirabela Nickel Ltd., Senior Notes | | | 8.750 | % | | | 4/15/18 | | | | 330,000 | | | | 90,750 | (a)(e) |
Molycorp Inc., Senior Secured Notes | | | 10.000 | % | | | 6/1/20 | | | | 390,000 | | | | 389,025 | |
New World Resources NV, Senior Notes | | | 7.875 | % | | | 1/15/21 | | | | 350,000 | EUR | | | 192,598 | (a) |
Noranda Aluminum Acquisition Corp., Senior Notes | | | 11.000 | % | | | 6/1/19 | | | | 120,000 | | | | 102,600 | (a) |
Rio Tinto Finance USA Ltd., Senior Notes | | | 9.000 | % | | | 5/1/19 | | | | 120,000 | | | | 156,848 | |
Ryerson Inc./Joseph T. Ryerson & Son Inc., Senior Secured Notes | | | 9.000 | % | | | 10/15/17 | | | | 650,000 | | | | 689,812 | |
Schaeffler Holding Finance BV, Senior Secured Bonds | | | 6.875 | % | | | 8/15/18 | | | | 280,000 | | | | 298,200 | (a)(b) |
Schaeffler Holding Finance BV, Senior Secured Notes | | | 6.875 | % | | | 8/15/18 | | | | 620,000 | EUR | | | 915,837 | (a)(b) |
Southern Copper Corp., Senior Notes | | | 6.750 | % | | | 4/16/40 | | | | 60,000 | | | | 58,696 | |
St. Barbara Ltd., Senior Secured Notes | | | 8.875 | % | | | 4/15/18 | | | | 760,000 | | | | 636,500 | (a) |
Steel Dynamics Inc., Senior Notes | | | 6.125 | % | | | 8/15/19 | | | | 230,000 | | | | 250,125 | |
Thompson Creek Metals Co. Inc., Senior Notes | | | 12.500 | % | | | 5/1/19 | | | | 330,000 | | | | 323,400 | |
Thompson Creek Metals Co. Inc., Senior Secured Notes | | | 9.750 | % | | | 12/1/17 | | | | 170,000 | | | | 187,850 | |
Vedanta Resources PLC, Senior Notes | | | 8.750 | % | | | 1/15/14 | | | | 670,000 | | | | 673,350 | (a) |
Vedanta Resources PLC, Senior Notes | | | 6.750 | % | | | 6/7/16 | | | | 860,000 | | | | 895,475 | (a) |
Vedanta Resources PLC, Senior Notes | | | 6.000 | % | | | 1/31/19 | | | | 230,000 | | | | 223,675 | (a) |
Total Metals & Mining | | | | | | | | | | | | | | | 11,319,735 | |
See Notes to Financial Statements.
| | |
| Western Asset Variable Global High Yield Bond Portfolio 2013 Annual Report | | 25 |
Schedule of investments (cont’d)
December 31, 2013
Western Asset Variable Global High Yield Bond Portfolio
| | | | | | | | | | | | | | | | |
| Security | | Rate | | | Maturity
Date | | | Face
Amount† | | | Value | |
Paper & Forest Products — 1.4% | | | | | | | | | | | | | | | | |
Appvion Inc., Secured Notes | | | 9.000 | % | | | 6/1/20 | | | | 860,000 | | | $ | 871,825 | (a) |
Celulosa Arauco y Constitucion SA, Senior Notes | | | 4.750 | % | | | 1/11/22 | | | | 430,000 | | | | 421,074 | |
Fibria Overseas Finance Ltd., Senior Notes | | | 7.500 | % | | | 5/4/20 | | | | 143,000 | | | | 157,121 | (a) |
Fibria Overseas Finance Ltd., Senior Notes | | | 6.750 | % | | | 3/3/21 | | | | 390,000 | | | | 429,000 | (a) |
Resolute Forest Products Inc., Senior Notes | | | 5.875 | % | | | 5/15/23 | | | | 600,000 | | | | 558,000 | (a) |
Verso Paper Holdings LLC/Verso Paper Inc., Senior Secured Notes | | | 11.750 | % | | | 1/15/19 | | | | 260,000 | | | | 276,900 | |
Verso Paper Holdings LLC/Verso Paper Inc., Senior Secured Notes | | | 11.750 | % | | | 1/15/19 | | | | 146,000 | | | | 112,420 | |
Total Paper & Forest Products | | | | | | | | | | | | | | | 2,826,340 | |
Total Materials | | | | | | | | | | | | | | | 24,368,006 | |
| Telecommunication Services — 8.7% | | | | | | | | | | | | | | | | |
Diversified Telecommunication Services — 5.0% | | | | | | | | | | | | | | | | |
Axtel SAB de CV, Senior Secured Notes, Step Bond | | | 7.000 | % | | | 1/31/20 | | | | 437,000 | | | | 409,687 | (a) |
CenturyLink Inc., Senior Notes | | | 6.450 | % | | | 6/15/21 | | | | 240,000 | | | | 250,800 | |
CenturyLink Inc., Senior Notes | | | 6.750 | % | | | 12/1/23 | | | | 130,000 | | | | 132,275 | |
Cogent Communications Group Inc., Senior Secured Notes | | | 8.375 | % | | | 2/15/18 | | | | 680,000 | | | | 741,200 | (a) |
Digicel Group Ltd., Senior Notes | | | 8.250 | % | | | 9/30/20 | | | | 400,000 | | | | 416,500 | (a) |
Intelsat Jackson Holdings SA, Senior Notes | | | 7.250 | % | | | 10/15/20 | | | | 150,000 | | | | 164,813 | |
Intelsat Jackson Holdings SA, Senior Notes | | | 7.500 | % | | | 4/1/21 | | | | 160,000 | | | | 177,200 | |
Intelsat Jackson Holdings SA, Senior Notes | | | 5.500 | % | | | 8/1/23 | | | | 900,000 | | | | 859,500 | (a) |
Level 3 Financing Inc., Senior Notes | | | 7.000 | % | | | 6/1/20 | | | | 120,000 | | | | 127,800 | |
Level 3 Financing Inc., Senior Notes | | | 8.625 | % | | | 7/15/20 | | | | 610,000 | | | | 686,250 | |
Telecom Italia Capital SA, Senior Notes | | | 7.175 | % | | | 6/18/19 | | | | 560,000 | | | | 631,400 | |
Telefonica Emisiones SAU, Senior Notes | | | 5.462 | % | | | 2/16/21 | | | | 840,000 | | | | 888,420 | |
TW Telecom Holdings Inc., Senior Notes | | | 5.375 | % | | | 10/1/22 | | | | 380,000 | | | | 374,300 | (a) |
TW Telecom Holdings Inc., Senior Notes | | | 6.375 | % | | | 9/1/23 | | | | 460,000 | | | | 479,550 | (a) |
UBS Luxembourg SA for OJSC Vimpel Communications, Loan Participation Notes | | | 8.250 | % | | | 5/23/16 | | | | 100,000 | | | | 111,000 | (a) |
Unitymedia Hessen GmbH & Co. KG/Unitymedia NRW GmbH, Senior Secured Notes | | | 5.500 | % | | | 1/15/23 | | | | 200,000 | | | | 195,000 | (a) |
UPCB Finance V Ltd., Senior Secured Notes | | | 7.250 | % | | | 11/15/21 | | | | 530,000 | | | | 577,700 | (a) |
Verizon Communications Inc., Senior Notes | | | 5.150 | % | | | 9/15/23 | | | | 650,000 | | | | 699,240 | |
Vimpel Communications, Notes | | | 6.493 | % | | | 2/2/16 | | | | 200,000 | | | | 214,500 | (a) |
Wind Acquisition Finance SA, Senior Notes | | | 11.750 | % | | | 7/15/17 | | | | 210,000 | | | | 223,650 | (a) |
Wind Acquisition Holdings Finance SpA, Senior Notes | | | 12.250 | % | | | 7/15/17 | | | | 1,254,953 | | | | 1,327,113 | (a)(b) |
Windstream Corp., Senior Notes | | | 7.500 | % | | | 4/1/23 | | | | 600,000 | | | | 606,000 | |
Total Diversified Telecommunication Services | | | | | | | | | | | | | | | 10,293,898 | |
See Notes to Financial Statements.
| | |
| 26 | | Western Asset Variable Global High Yield Bond Portfolio 2013 Annual Report |
Western Asset Variable Global High Yield Bond Portfolio
| | | | | | | | | | | | | | | | |
| Security | | Rate | | | Maturity
Date | | | Face
Amount† | | | Value | |
Wireless Telecommunication Services — 3.7% | | | | | | | | | | | | | | | | |
Matterhorn Midco & Cy SCA, Senior Notes | | | 7.750 | % | | | 2/15/20 | | | | 330,000 | EUR | | $ | 470,787 | (a) |
Phones4u Finance PLC, Senior Secured Notes | | | 9.500 | % | | | 4/1/18 | | | | 200,000 | GBP | | | 351,889 | (a) |
Phones4u Finance PLC, Senior Secured Notes | | | 9.500 | % | | | 4/1/18 | | | | 100,000 | GBP | | | 175,945 | (a) |
SoftBank Corp., Senior Notes | | | 4.500 | % | | | 4/15/20 | | | | 410,000 | | | | 401,800 | (a) |
Sprint Capital Corp., Senior Notes | | | 6.875 | % | | | 11/15/28 | | | | 1,370,000 | | | | 1,298,075 | |
Sprint Capital Corp., Senior Notes | | | 8.750 | % | | | 3/15/32 | | | | 860,000 | | | | 926,650 | |
Sprint Communications Inc., Senior Notes | | | 9.000 | % | | | 11/15/18 | | | | 670,000 | | | | 809,025 | (a) |
Sprint Corp., Senior Notes | | | 7.875 | % | | | 9/15/23 | | | | 1,190,000 | | | | 1,282,225 | (a) |
T-Mobile USA Inc., Senior Notes | | | 6.542 | % | | | 4/28/20 | | | | 150,000 | | | | 159,937 | |
T-Mobile USA Inc., Senior Notes | | | 6.125 | % | | | 1/15/22 | | | | 130,000 | | | | 132,600 | |
T-Mobile USA Inc., Senior Notes | | | 6.731 | % | | | 4/28/22 | | | | 100,000 | | | | 104,625 | |
VimpelCom Holdings BV, Senior Notes | | | 7.504 | % | | | 3/1/22 | | | | 1,130,000 | | | | 1,183,246 | (a) |
VimpelCom Holdings BV, Senior Notes | | | 7.504 | % | | | 3/1/22 | | | | 290,000 | | | | 303,665 | (a) |
Total Wireless Telecommunication Services | | | | | | | | | | | | | | | 7,600,469 | |
Total Telecommunication Services | | | | | | | | | | | | | | | 17,894,367 | |
| Utilities — 4.2% | | | | | | | | | | | | | | | | |
Electric Utilities — 1.4% | | | | | | | | | | | | | | | | |
AES Red Oak LLC, Secured Notes | | | 9.200 | % | | | 11/30/29 | | | | 120,000 | | | | 132,600 | |
GenOn REMA LLC, Pass-Through Certificates | | | 9.237 | % | | | 7/2/17 | | | | 965,896 | | | | 994,873 | |
GenOn REMA LLC, Pass-Through Certificates | | | 9.681 | % | | | 7/2/26 | | | | 1,080,000 | | | | 1,112,400 | |
Midwest Generation LLC, Pass-Through Certificates | | | 8.560 | % | | | 1/2/16 | | | | 560,079 | | | | 641,291 | (e) |
Total Electric Utilities | | | | | | | | | | | | | | | 2,881,164 | |
Gas Utilities — 0.1% | | | | | | | | | | | | | | | | |
Southern Natural Gas Co., Senior Notes | | | 8.000 | % | | | 3/1/32 | | | | 60,000 | | | | 77,020 | |
Suburban Propane Partners LP/Suburban Energy Finance Corp., Senior Notes | | | 7.375 | % | | | 3/15/20 | | | | 250,000 | | | | 268,750 | |
Total Gas Utilities | | | | | | | | | | | | | | | 345,770 | |
Independent Power Producers & Energy Traders — 2.6% | | | | | | | | | | | | | | | | |
AES Corp., Senior Notes | | | 7.375 | % | | | 7/1/21 | | | | 100,000 | | | | 113,250 | |
AES Corp., Senior Notes | | | 4.875 | % | | | 5/15/23 | | | | 600,000 | | | | 564,000 | |
Atlantic Power Corp., Senior Notes | | | 9.000 | % | | | 11/15/18 | | | | 1,340,000 | | | | 1,403,650 | |
Calpine Corp., Senior Secured Notes | | | 5.875 | % | | | 1/15/24 | | | | 650,000 | | | | 638,625 | (a) |
Colbun SA, Senior Notes | | | 6.000 | % | | | 1/21/20 | | | | 240,000 | | | | 258,687 | (a) |
Energy Future Intermediate Holding Co. LLC/EFIH Finance Inc., Senior Secured Notes | | | 10.000 | % | | | 12/1/20 | | | | 1,130,000 | | | | 1,206,275 | |
First Wind Holdings Inc., Senior Secured Notes | | | 10.250 | % | | | 6/1/18 | | | | 470,000 | | | | 517,000 | (a) |
Foresight Energy LLC/Foresight Energy Corp., Senior Notes | | | 7.875 | % | | | 8/15/21 | | | | 620,000 | | | | 640,150 | (a) |
Total Independent Power Producers & Energy Traders | | | | | | | | | | | | | | | 5,341,637 | |
See Notes to Financial Statements.
| | |
| Western Asset Variable Global High Yield Bond Portfolio 2013 Annual Report | | 27 |
Schedule of investments (cont’d)
December 31, 2013
Western Asset Variable Global High Yield Bond Portfolio
| | | | | | | | | | | | | | | | |
| Security | | Rate | | | Maturity
Date | | | Face
Amount† | | | Value | |
Multi-Utilities — 0.1% | | | | | | | | | | | | | | | | |
Empresas Publicas de Medellin ESP, Senior Notes | | | 7.625 | % | | | 7/29/19 | | | | 150,000 | | | $ | 177,750 | (a) |
Total Utilities | | | | | | | | | | | | | | | 8,746,321 | |
Total Corporate Bonds & Notes (Cost — $167,234,457) | | | | | | | | | | | | | | | 173,094,310 | |
| Convertible Bonds & Notes — 0.0% | | | | | | | | | | | | | | | | |
| Telecommunication Services — 0.0% | | | | | | | | | | | | | | | | |
Diversified Telecommunication Services — 0.0% | | | | | | | | | | | | | | | | |
Axtel SAB de CV, Senior Secured Notes, Step Bond
(Cost — $73,952) | | | 7.000 | % | | | 1/31/20 | | | | 498,100 | MXN | | | 53,982 | (a) |
| Senior Loans — 1.9% | | | | | | | | | | | | | | | | |
| Consumer Discretionary — 1.0% | | | | | | | | | | | | | | | | |
Hotels, Restaurants & Leisure — 0.6% | | | | | | | | | | | | | | | | |
Equinox Holdings Inc., Second Lien Term Loan | | | 9.750 | % | | | 7/31/20 | | | | 450,000 | | | | 457,875 | (h) |
Stockbridge SBE Holdings LLC, Term Loan B | | | 13.000 | % | | | 5/2/17 | | | | 716,667 | | | | 791,916 | (h) |
Total Hotels, Restaurants & Leisure | | | | | | | | | | | | | | | 1,249,791 | |
Specialty Retail — 0.4% | | | | | | | | | | | | | | | | |
Camping World Inc., Term Loan | | | 5.750 | % | | | 2/20/20 | | | | 640,000 | | | | 644,800 | (h) |
Gymboree Corp., Initial Term Loan | | | 5.000 | % | | | 2/23/18 | | | | 220,000 | | | | 206,195 | (h) |
Total Specialty Retail | | | | | | | | | | | | | | | 850,995 | |
Total Consumer Discretionary | | | | | | | | | | | | | | | 2,100,786 | |
| Consumer Staples — 0.1% | | | | | | | | | | | | | | | | |
Food Products — 0.1% | | | | | | | | | | | | | | | | |
AdvancePierre Foods Inc., Second Lien Term Loan | | | 9.500 | % | | | 10/10/17 | | | | 170,000 | | | | 164,900 | (h) |
| Energy — 0.2% | | | | | | | | | �� | | | | | | | |
Energy Equipment & Services — 0.2% | | | | | | | | | | | | | | | | |
Frac Tech International LLC, Term Loan B | | | 8.500 | % | | | 5/6/16 | | | | 450,000 | | | | 453,094 | (h) |
| Health Care — 0.2% | | | | | | | | | | | | | | | | |
Health Care Providers & Services — 0.2% | | | | | | | | | | | | | | | | |
Physiotherapy Associates Holdings Inc., Exit Term Loan | | | — | | | | 10/10/16 | | | | 430,000 | | | | 427,850 | (i) |
| Materials — 0.4% | | | | | | | | | | | | | | | | |
Chemicals — 0.4% | | | | | | | | | | | | | | | | |
Kerling PLC, EUR Term Loan | | | 10.000 | % | | | 6/30/16 | | | | 300,000 | EUR | | | 432,572 | (h) |
Kronos Inc., Second Lien Term Loan | | | 9.750 | % | | | 4/30/20 | | | | 340,000 | | | | 353,033 | (h) |
Total Materials | | | | | | | | | | | | | | | 785,605 | |
Total Senior Loans (Cost — $3,733,820) | | | | | | | | | | | | | | | 3,932,235 | |
| Sovereign Bonds — 8.7% | | | | | | | | | | | | | | | | |
Argentina — 0.5% | | | | | | | | | | | | | | | | |
Republic of Argentina, Senior Bonds | | | 7.000 | % | | | 10/3/15 | | | | 1,083,000 | | | | 1,064,246 | |
See Notes to Financial Statements.
| | |
| 28 | | Western Asset Variable Global High Yield Bond Portfolio 2013 Annual Report |
Western Asset Variable Global High Yield Bond Portfolio
| | | | | | | | | | | | | | | | |
| Security | | Rate | | | Maturity
Date | | | Face
Amount† | | | Value | |
Brazil — 0.6% | | | | | | | | | | | | | | | | |
Banco Nacional de Desenvolvimento Economico e Social, Senior Notes | | | 3.375 | % | | | 9/26/16 | | | | 280,000 | | | $ | 283,500 | (a) |
Federative Republic of Brazil, Notes | | | 10.000 | % | | | 1/1/14 | | | | 159,000 | BRL | | | 67,394 | |
Federative Republic of Brazil, Notes | | | 10.000 | % | | | 1/1/17 | | | | 2,075,000 | BRL | | | 833,623 | |
Federative Republic of Brazil, Notes | | | 10.000 | % | | | 1/1/21 | | | | 182,000 | BRL | | | 67,247 | |
Total Brazil | | | | | | | | | | | | | | | 1,251,764 | |
Hungary — 0.6% | | | | | | | | | | | | | | | | |
Hungary Government Bond, Senior Notes | | | 5.750 | % | | | 11/22/23 | | | | 1,104,000 | | | | 1,115,040 | |
Mexico — 2.1% | | | | | | | | | | | | | | | | |
United Mexican States, Bonds | | | 6.500 | % | | | 6/9/22 | | | | 56,816,000 | MXN | | | 4,409,925 | |
Russia — 0.4% | | | | | | | | | | | | | | | | |
Russian Federal Bond, Bonds | | | 7.400 | % | | | 6/14/17 | | | | 22,520,000 | RUB | | | 699,064 | |
Russian Federal Bond, Bonds | | | 7.500 | % | | | 3/15/18 | | | | 5,000,000 | RUB | | | 156,031 | |
Total Russia | | | | | | | | | | | | | | | 855,095 | |
Turkey — 1.9% | | | | | | | | | | | | | | | | |
Republic of Turkey, Notes | | | 6.750 | % | | | 5/30/40 | | | | 1,270,000 | | | | 1,232,852 | |
Republic of Turkey, Senior Notes | | | 6.250 | % | | | 9/26/22 | | | | 2,640,000 | | | | 2,748,240 | |
Total Turkey | | | | | | | | | | | | | | | 3,981,092 | |
Venezuela — 2.6% | | | | | | | | | | | | | | | | |
Bolivarian Republic of Venezuela, Senior Bonds | | | 5.750 | % | | | 2/26/16 | | | | 4,200,000 | | | | 3,578,400 | (a) |
Bolivarian Republic of Venezuela, Senior Notes | | | 7.750 | % | | | 10/13/19 | | | | 2,430,000 | | | | 1,822,500 | (a) |
Total Venezuela | | | | | | | | | | | | | | | 5,400,900 | |
Total Sovereign Bonds (Cost — $19,050,041) | | | | | | | | | | | | | | | 18,078,062 | |
| | | | |
| | | | | | | | | Shares | | | | |
| Common Stocks — 0.9% | | | | | | | | | | | | | | | | |
| Consumer Discretionary — 0.1% | | | | | | | | | | | | | | | | |
Hotels, Restaurants & Leisure — 0.1% | | | | | | | | | | | | | | | | |
Bossier Casino Venture Holdco Inc. | | | | | | | | | | | 26,303 | | | | 52,606 | *(c)(d) |
Household Durables — 0.0% | | | | | | | | | | | | | | | | |
William Lyon Homes, Class A Shares | | | | | | | | | | | 1,301 | | | | 28,804 | * |
Media — 0.0% | | | | | | | | | | | | | | | | |
New Cotai LLC/New Cotai Capital Corp., Class B Shares | | | | | | | | | | | 2 | | | | 0 | *(c)(d)(j) |
Total Consumer Discretionary | | | | | | | | | | | | | | | 81,410 | |
| Energy — 0.3% | | | | | | | | | | | | | | | | |
Energy Equipment & Services — 0.3% | | | | | | | | | | | | | | | | |
KCAD Holdings I Ltd. | | | | | | | | | | | 75,024,286 | | | | 639,657 | *(c)(d) |
See Notes to Financial Statements.
| | |
| Western Asset Variable Global High Yield Bond Portfolio 2013 Annual Report | | 29 |
Schedule of investments (cont’d)
December 31, 2013
Western Asset Variable Global High Yield Bond Portfolio
| | | | | | | | | | | | | | | | |
| Security | | | | | | | | Shares | | | Value | |
| Financials — 0.1% | | | | | | | | | | | | | | | | |
Diversified Financial Services — 0.1% | | | | | | | | | | | | | | | | |
Citigroup Inc. | | | | | | | | | | | 3,909 | | | $ | 203,698 | |
| Industrials — 0.4% | | | | | | | | | | | | | | | | |
Building Products — 0.0% | | | | | | | | | | | | | | | | |
Nortek Inc. | | | | | | | | | | | 437 | | | | 32,600 | * |
Marine — 0.4% | | | | | | | | | | | | | | | | |
DeepOcean Group Holding AS | | | | | | | | | | | 19,935 | | | | 656,968 | *(c)(d) |
Horizon Lines Inc., Class A Shares | | | | | | | | | | | 212,508 | | | | 178,507 | * |
Total Marine | | | | | | | | | | | | | | | 835,475 | |
Total Industrials | | | | | | | | | | | | | | | 868,075 | |
Total Common Stocks (Cost — $2,138,381) | | | | | | | | | | | | | | | 1,792,840 | |
| | | | |
| | | Rate | | | | | | | | | | |
| Convertible Preferred Stocks — 0.1% | | | | | | | | | | | | | | | | |
| Materials — 0.1% | | | | | | | | | | | | | | | | |
Metals & Mining — 0.1% | | | | | | | | | | | | | | | | |
ArcelorMittal (Cost — $92,500) | | | 6.000 | % | | | | | | | 3,700 | | | | 96,200 | |
| Preferred Stocks — 2.0% | | | | | | | | | | | | | | | | |
| Financials — 2.0% | | | | | | | | | | | | | | | | |
Commercial Banks — 0.1% | | | | | | | | | | | | | | | | |
Santander Finance Preferred SA Unipersonal | | | 10.500 | % | | | | | | | 190 | | | | 198,253 | (f) |
Consumer Finance — 1.4% | | | | | | | | | | | | | | | | |
GMAC Capital Trust I | | | 8.125 | % | | | | | | | 110,217 | | | | 2,947,202 | (f) |
Diversified Financial Services — 0.5% | | | | | | | | | | | | | | | | |
Citigroup Capital XIII | | | 7.875 | % | | | | | | | 36,975 | | | | 1,007,569 | (f) |
Total Preferred Stocks (Cost — $4,003,150) | | | | | | | | | | | | | | | 4,153,024 | |
| | | | |
| | | | | | Expiration
Date | | | Warrants | | | | |
| Warrants — 0.1% | | | | | | | | | | | | | | | | |
Jack Cooper Holdings Corp. | | | | | | | 12/15/17 | | | | 627 | | | | 79,942 | * |
Jack Cooper Holdings Corp. | | | | | | | 5/6/18 | | | | 309 | | | | 39,398 | * |
Total Warrants (Cost — $16,894) | | | | | | | | | | | | | | | 119,340 | |
Total Investments — 97.4% (Cost — $196,343,195#) | | | | | | | | | | | | | | | 201,319,993 | |
Other Assets in Excess of Liabilities — 2.6% | | | | | | | | | | | | | | | 5,435,231 | |
Total Net Assets — 100.0% | | | | | | | | | | | | | | $ | 206,755,224 | |
| † | Face amount denominated in U.S. dollars, unless otherwise noted. |
| * | Non-income producing security. |
See Notes to Financial Statements.
| | |
| 30 | | Western Asset Variable Global High Yield Bond Portfolio 2013 Annual Report |
Western Asset Variable Global High Yield Bond Portfolio
| (a) | Security is exempt from registration under Rule 144A of the Securities Act of 1933. This security may be resold in transactions that are exempt from registration, normally to qualified institutional buyers. This security has been deemed liquid pursuant to guidelines approved by the Board of Trustees, unless otherwise noted. |
| (b) | Payment-in-kind security for which the issuer has the option at each interest payment date of making interest payments in cash or additional debt securities. |
| (c) | Security is valued in good faith in accordance with procedures approved by the Board of Trustees (See Note 1). |
| (d) | Illiquid security (unaudited). |
| (e) | The coupon payment on these securities is currently in default as of December 31, 2013. |
| (f) | Variable rate security. Interest rate disclosed is as of the most recent information available. |
| (g) | Security has no maturity date. The date shown represents the next call date. |
| (h) | Interest rates disclosed represent the effective rates on senior loans. Ranges in interest rates are attributable to multiple contracts under the same loan. |
| (i) | All or a portion of this loan is unfunded as of December 31, 2013. The interest rate for fully unfunded term loans is to be determined. |
| (j) | Value is less than $1. |
| (k) | All or a portion of this loan is unfunded as of December 31, 2013 |
| # | Aggregate cost for federal income tax purposes is $196,353,697. |
| | |
Abbreviations used in this schedule: |
| AUD | | — Australian Dollar |
| BRL | | — Brazilian Real |
| EUR | | — Euro |
| GBP | | — British Pound |
| MXN | | — Mexican Peso |
| OJSC | | — Open Joint Stock Company |
| RUB | | — Russian Ruble |
See Notes to Financial Statements.
| | |
| Western Asset Variable Global High Yield Bond Portfolio 2013 Annual Report | | 31 |
Statement of assets and liabilities
December 31, 2013
| | | | |
| |
| Assets: | | | | |
Investments, at value (Cost — $196,343,195) | | $ | 201,319,993 | |
Foreign currency, at value (Cost — $823,174) | | | 818,834 | |
Cash | | | 2,470,923 | |
Interest and dividends receivable | | | 3,690,214 | |
Deposits with brokers for centrally cleared swap contracts | | | 405,035 | |
Unrealized appreciation on forward foreign currency contracts | | | 43,935 | |
Receivable for Portfolio shares sold | | | 34,392 | |
Deposits with brokers for open futures contracts | | | 16,012 | |
Receivable from broker — variation margin on open futures contracts | | | 938 | |
Prepaid expenses | | | 3,005 | |
Total Assets | | | 208,803,281 | |
| |
| Liabilities: | | | | |
Payable for securities purchased | | | 1,097,264 | |
Unrealized depreciation on forward foreign currency contracts | | | 414,645 | |
Payable for Portfolio shares repurchased | | | 295,399 | |
Investment management fee payable | | | 122,526 | |
Payable to broker — variation margin on centrally cleared swaps | | | 21,048 | |
Service and/or distribution fees payable | | | 9,308 | |
Accrued expenses | | | 87,867 | |
Total Liabilities | | | 2,048,057 | |
| Total Net Assets | | $ | 206,755,224 | |
| |
| Net Assets: | | | | |
Par value (Note 7) | | $ | 253 | |
Paid-in capital in excess of par value | | | 217,064,320 | |
Undistributed net investment income | | | 170,631 | |
Accumulated net realized loss on investments, futures contracts, written options,
swap contracts and foreign currency transactions | | | (14,929,517) | |
Net unrealized appreciation on investments, futures contracts, swap contracts and foreign currencies | | | 4,449,537 | |
| Total Net Assets | | $ | 206,755,224 | |
| |
| Shares Outstanding: | | | | |
Class I | | | 20,046,098 | |
Class II | | | 5,293,297 | |
| |
| Net Asset Value: | | | | |
Class I | | | $8.12 | |
Class II | | | $8.30 | |
See Notes to Financial Statements.
| | |
| 32 | | Western Asset Variable Global High Yield Bond Portfolio 2013 Annual Report |
Statement of operations
For the Year Ended December 31, 2013
| | | | |
| |
| Investment Income: | | | | |
Interest | | $ | 14,597,898 | |
Dividends | | | 315,186 | |
Total Investment Income | | | 14,913,084 | |
| |
| Expenses: | | | | |
Investment management fee (Note 2) | | | 1,376,685 | |
Service and/or distribution fees (Notes 2 and 5) | | | 83,025 | |
Shareholder reports | | | 78,731 | |
Audit and tax | | | 43,619 | |
Legal fees | | | 42,848 | |
Fund accounting fees | | | 19,600 | |
Custody fees | | | 15,548 | |
Transfer agent fees (Note 5) | | | 13,825 | |
Insurance | | | 4,538 | |
Trustees’ fees | | | 3,101 | |
Miscellaneous expenses | | | 6,323 | |
Total Expenses | | | 1,687,843 | |
| Net Investment Income | | | 13,225,241 | |
| |
Realized and Unrealized Gain (Loss) on Investments, Futures Contracts, Written Options,
Swap Contracts and Foreign Currency Transactions (Notes 1, 3 and 4): | | | | |
Net Realized Gain (Loss) From: | | | | |
Investment transactions | | | 3,822,406 | |
Futures contracts | | | 20,537 | |
Written options | | | 129,204 | |
Swap contracts | | | (1,244,668) | |
Foreign currency transactions | | | (534,231) | |
Net Realized Gain | | | 2,193,248 | |
Change in Net Unrealized Appreciation (Depreciation) From: | | | | |
Investments | | | (3,647,035) | |
Futures contracts | | | 5,861 | |
Written options | | | 53,596 | |
Swap contracts | | | 86,065 | |
Foreign currencies | | | 21,614 | |
Change in Net Unrealized Appreciation (Depreciation) | | | (3,479,899) | |
Net Loss on Investments, Futures Contracts, Written Options, Swap Contracts
and Foreign Currency Transactions | | | (1,286,651) | |
| Increase in Net Assets from Operations | | $ | 11,938,590 | |
See Notes to Financial Statements.
| | |
| Western Asset Variable Global High Yield Bond Portfolio 2013 Annual Report | | 33 |
Statements of changes in net assets
| | | | | | | | |
| For the Years Ended December 31, | | 2013 | | | 2012 | |
| | |
| Operations: | | | | | | | | |
Net investment income | | $ | 13,225,241 | | | $ | 12,519,148 | |
Net realized gain | | | 2,193,248 | | | | 2,225,173 | |
Change in net unrealized appreciation (depreciation) | | | (3,479,899) | | | | 13,185,684 | |
Increase in Net Assets From Operations | | | 11,938,590 | | | | 27,930,005 | |
| | |
| Distributions to Shareholders From (Notes 1 and 6): | | | | | | | | |
Net investment income | | | (12,100,047) | | | | (13,027,132) | |
Decrease in Net Assets From Distributions to Shareholders | | | (12,100,047) | | | | (13,027,132) | |
| | |
| Portfolio Share Transactions (Note 7): | | | | | | | | |
Net proceeds from sale of shares | | | 75,717,139 | | | | 56,666,823 | |
Reinvestment of distributions | | | 12,100,047 | | | | 13,027,132 | |
Cost of shares repurchased | | | (70,579,199) | | | | (41,624,318) | |
Increase in Net Assets From Portfolio Share Transactions | | | 17,237,987 | | | | 28,069,637 | |
Increase in Net Assets | | | 17,076,530 | | | | 42,972,510 | |
| | |
| Net Assets: | | | | | | | | |
Beginning of year | | | 189,678,694 | | | | 146,706,184 | |
End of year* | | $ | 206,755,224 | | | $ | 189,678,694 | |
* Includes undistributed (overdistributed) net investment income, respectively, of: | | | $170,631 | | | | $(62,817) | |
See Notes to Financial Statements.
| | |
| 34 | | Western Asset Variable Global High Yield Bond Portfolio 2013 Annual Report |
Financial highlights
| | | | | | | | | | | | | | | | | | | | |
| For a share of each class of beneficial interest outstanding throughout each year ended December 31: | |
| Class I Shares1 | | 2013 | | | 2012 | | | 2011 | | | 2010 | | | 2009 | |
| | | | | |
| Net asset value, beginning of year | | | $8.12 | | | | $7.38 | | | | $7.90 | | | | $7.50 | | | | $5.30 | |
| | | | | |
| Income (loss) from operations: | | | | | | | | | | | | | | | | | | | | |
Net investment income | | | 0.57 | | | | 0.60 | | | | 0.62 | | | | 0.68 | | | | 0.80 | |
Net realized and unrealized gain (loss) | | | (0.06) | | | | 0.74 | | | | (0.50) | | | | 0.44 | | | | 2.13 | |
Total income from operations | | | 0.51 | | | | 1.34 | | | | 0.12 | | | | 1.12 | | | | 2.93 | |
| | | | | |
| Less distributions from: | | | | | | | | | | | | | | | | | | | | |
Net investment income | | | (0.51) | | | | (0.60) | | | | (0.64) | | | | (0.72) | | | | (0.73) | |
Total distributions | | | (0.51) | | | | (0.60) | | | | (0.64) | | | | (0.72) | | | | (0.73) | |
| | | | | |
| Net asset value, end of year | | | $8.12 | | | | $8.12 | | | | $7.38 | | | | $7.90 | | | | $7.50 | |
Total return2 | | | 6.27 | % | | | 18.33 | % | | | 1.58 | % | | | 15.07 | % | | | 55.55 | % |
| | | | | |
| Net assets, end of year (000s) | | | $162,826 | | | | $164,191 | | | | $118,714 | | | | $121,188 | | | | $123,458 | |
| | | | | |
| Ratios to average net assets: | | | | | | | | | | | | | | | | | | | | |
Gross expenses | | | 0.81 | % | | | 0.87 | % | | | 0.94 | % | | | 0.91 | % | | | 0.91 | % |
Net expenses3,4 | | | 0.81 | | | | 0.87 | | | | 0.94 | 5 | | | 0.91 | | | | 0.91 | |
Net investment income | | | 6.77 | | | | 7.48 | | | | 7.70 | | | | 8.49 | | | | 11.79 | |
| | | | | |
| Portfolio turnover rate | | | 74 | % | | | 73 | % | | | 77 | % | | | 108 | % | | | 80 | % |
| 1 | Per share amounts have been calculated using the average shares method. |
| 2 | Performance figures may reflect compensating balance arrangements, fee waivers and/or expense reimbursements. In the absence of compensating balance arrangements, fee waivers and/or expense reimbursements, the total return would have been lower. Total returns do not reflect expenses associated with separate accounts such as administrative fees, account charges and surrender charges which, if reflected, would reduce the total return for all periods shown. Past performance is no guarantee of future results. |
| 3 | As a result of an expense limitation arrangement, the ratio of expenses, other than brokerage, interest, taxes, extraordinary expenses and acquired fund fees and expenses, to average net assets of Class I shares did not exceed 0.90%. This expense limitation arrangement cannot be terminated prior to December 31, 2015 without the Board of Trustees’ consent. Prior to August 1, 2012 the expense limitation was 1.00%. |
| 4 | The impact of compensating balance arrangements, if any, was less than 0.01%. |
| 5 | Reflects fee waivers and/or expense reimbursements. |
See Notes to Financial Statements.
| | |
| Western Asset Variable Global High Yield Bond Portfolio 2013 Annual Report | | 35 |
Financial highlights (cont’d)
| | | | | | | | | | | | | | | | | | | | |
| For a share of each class of beneficial interest outstanding throughout each year ended December 31: | |
| Class II Shares1 | | 2013 | | | 2012 | | | 2011 | | | 2010 | | | 2009 | |
| | | | | |
| Net asset value, beginning of year | | | $8.29 | | | | $7.50 | | | | $8.01 | | | | $7.58 | | | | $5.33 | |
| | | | | |
| Income (loss) from operations: | | | | | | | | | | | | | | | | | | | | |
Net investment income | | | 0.55 | | | | 0.59 | | | | 0.61 | | | | 0.66 | | | | 0.78 | |
Net realized and unrealized gain (loss) | | | (0.05) | | | | 0.76 | | | | (0.51) | | | | 0.45 | | | | 2.15 | |
Total income from operations | | | 0.50 | | | | 1.35 | | | | 0.10 | | | | 1.11 | | | | 2.93 | |
| | | | | |
| Less distributions from: | | | | | | | | | | | | | | | | | | | | |
Net investment income | | | (0.49) | | | | (0.56) | | | | (0.61) | | | | (0.68) | | | | (0.68) | |
Total distributions | | | (0.49) | | | | (0.56) | | | | (0.61) | | | | (0.68) | | | | (0.68) | |
| | | | | |
| Net asset value, end of year | | | $8.30 | | | | $8.29 | | | | $7.50 | | | | $8.01 | | | | $7.58 | |
Total return2 | | | 6.06 | % | | | 18.08 | % | | | 1.27 | % | | | 14.70 | % | | | 55.14 | % |
| | | | | |
| Net assets, end of year (000s) | | | $43,929 | | | | $25,488 | | | | $27,992 | | | | $28,596 | | | | $29,569 | |
| | | | | |
| Ratios to average net assets: | | | | | | | | | | | | | | | | | | | | |
Gross expenses | | | 1.08 | % | | | 1.15 | % | | | 1.20 | % | | | 1.17 | % | | | 1.24 | % |
Net expenses3,4 | | | 1.08 | | | | 1.15 | 5 | | | 1.20 | 5 | | | 1.17 | | | | 1.24 | |
Net investment income | | | 6.49 | | | | 7.23 | | | | 7.43 | | | | 8.22 | | | | 11.67 | |
| | | | | |
| Portfolio turnover rate | | | 74 | % | | | 73 | % | | | 77 | % | | | 108 | % | | | 80 | % |
| 1 | Per share amounts have been calculated using the average shares method. |
| 2 | Performance figures may reflect compensating balance arrangements, fee waivers and/or expense reimbursements. In the absence of compensating balance arrangements, fee waivers and/or expense reimbursements, the total return would have been lower. Total returns do not reflect expenses associated with separate accounts such as administrative fees, account charges and surrender charges which, if reflected, would reduce the total return for all periods shown. Past performance is no guarantee of future results. |
| 3 | As a result of an expense limitation arrangement, the ratio of expenses, other than brokerage, interest, taxes, extraordinary expenses and acquired fund fees and expenses, to average net assets of Class II shares did not exceed 1.15%. This expense limitation arrangement cannot be terminated prior to December 31, 2015 without the Board of Trustees’ consent. Prior to August 1, 2012 the expense limitation was 1.25%. |
| 4 | The impact of compensating balance arrangements, if any, was less than 0.01%. |
| 5 | Reflects fee waivers and/or expense reimbursements. |
See Notes to Financial Statements.
| | |
| 36 | | Western Asset Variable Global High Yield Bond Portfolio 2013 Annual Report |
Notes to financial statements
1. Organization and significant accounting policies
Western Asset Variable Global High Yield Bond Portfolio (the “Portfolio”) is a separate diversified investment series of Legg Mason Partners Variable Income Trust (the “Trust”). The Trust, a Maryland statutory trust, is registered under the Investment Company Act of 1940, as amended (the “1940 Act”), as an open-end management investment company.
Shares of the Portfolio may only be purchased or redeemed through variable annuity contracts and variable life insurance policies offered by the separate accounts of participating insurance companies or through eligible pension or other qualified plans.
The following are significant accounting policies consistently followed by the Portfolio and are in conformity with U.S. generally accepted accounting principles (“GAAP”). Estimates and assumptions are required to be made regarding assets, liabilities and changes in net assets resulting from operations when financial statements are prepared. Changes in the economic environment, financial markets and any other parameters used in determining these estimates could cause actual results to differ. Subsequent events have been evaluated through the date the financial statements were issued.
(a) Investment valuation. The valuations for fixed income securities (which may include, but are not limited to, corporate, government, municipal, mortgage-backed, collateralized mortgage obligations and asset-backed securities) and certain derivative instruments are typically the prices supplied by independent third party pricing services, which may use market prices or broker/dealer quotations or a variety of valuation techniques and methodologies. The independent third party pricing services use inputs that are observable such as issuer details, interest rates, yield curves, prepayment speeds, credit risks/spreads, default rates and quoted prices for similar securities. Short-term fixed income securities that will mature in 60 days or less are valued at amortized cost, unless it is determined that using this method would not reflect an investment’s fair value. Futures contracts are valued daily at the settlement price established by the board of trade or exchange on which they are traded. Equity securities for which market quotations are available are valued at the last reported sales price or official closing price on the primary market or exchange on which they trade. When the Portfolio holds securities or other assets that are denominated in a foreign currency, the Portfolio will normally use the currency exchange rates as of 4:00 p.m. (Eastern Time). If independent third party pricing services are unable to supply prices for a portfolio investment, or if the prices supplied are deemed by the manager to be unreliable, the market price may be determined by the manager using quotations from one or more broker/dealers or at the transaction price if the security has recently been purchased and no value has yet been obtained from a pricing service or pricing broker. When reliable prices are not readily available, such as when the value of a security has been significantly affected by events after the close of the exchange or market on which the security is principally traded, but before the Portfolio calculates its net asset value, the Portfolio values these securities as determined in accordance with procedures approved by the Portfolio’s Board of Trustees.
| | |
| Western Asset Variable Global High Yield Bond Portfolio 2013 Annual Report | | 37 |
Notes to financial statements (cont’d)
The Board of Trustees is responsible for the valuation process and has delegated the supervision of the daily valuation process to the Legg Mason North American Fund Valuation Committee (the “Valuation Committee”). The Valuation Committee, pursuant to the policies adopted by the Board of Trustees, is responsible for making fair value determinations, evaluating the effectiveness of the Portfolio’s pricing policies, and reporting to the Board of Trustees. When determining the reliability of third party pricing information for investments owned by the Portfolio, the Valuation Committee, among other things, conducts due diligence reviews of pricing vendors, monitors the daily change in prices and reviews transactions among market participants.
The Valuation Committee will consider pricing methodologies it deems relevant and appropriate when making fair value determinations. Examples of possible methodologies include, but are not limited to, multiple of earnings; discount from market of a similar freely traded security; discounted cash-flow analysis; book value or a multiple thereof; risk premium/yield analysis; yield to maturity; and/or fundamental investment analysis. The Valuation Committee will also consider factors it deems relevant and appropriate in light of the facts and circumstances. Examples of possible factors include, but are not limited to, the type of security; the issuer’s financial statements; the purchase price of the security; the discount from market value of unrestricted securities of the same class at the time of purchase; analysts’ research and observations from financial institutions; information regarding any transactions or offers with respect to the security; the existence of merger proposals or tender offers affecting the security; the price and extent of public trading in similar securities of the issuer or comparable companies; and the existence of a shelf registration for restricted securities.
For each portfolio security that has been fair valued pursuant to the policies adopted by the Board of Trustees, the fair value price is compared against the last available and next available market quotations. The Valuation Committee reviews the results of such back testing monthly and fair valuation occurrences are reported to the Board of Trustees quarterly.
The Portfolio uses valuation techniques to measure fair value that are consistent with the market approach and/or income approach, depending on the type of security and the particular circumstance. The market approach uses prices and other relevant information generated by market transactions involving identical or comparable securities. The income approach uses valuation techniques to discount estimated future cash flows to present value.
GAAP establishes a disclosure hierarchy that categorizes the inputs to valuation techniques used to value assets and liabilities at measurement date. These inputs are summarized in the three broad levels listed below:
| Ÿ | | Level 1 — quoted prices in active markets for identical investments |
| Ÿ | | Level 2 — other significant observable inputs (including quoted prices for similar investments, interest rates, prepayment speeds, credit risk, etc.) |
| | |
| 38 | | Western Asset Variable Global High Yield Bond Portfolio 2013 Annual Report |
| Ÿ | | Level 3 — significant unobservable inputs (including the Portfolio’s own assumptions in determining the fair value of investments) |
The inputs or methodologies used to value securities are not necessarily an indication of the risk associated with investing in those securities.
The following is a summary of the inputs used in valuing the Portfolio’s assets and liabilities carried at fair value:
| | | | | | | | | | | | | | | | |
| ASSETS | |
| Description | | Quoted Prices
(Level 1) | | | Other Significant
Observable Inputs
(Level 2) | | | Significant
Unobservable
Inputs
(Level 3) | | | Total | |
| Long-term investments†: | | | | | | | | | | | | | | | | |
Corporate bonds & notes | | | — | | | $ | 171,502,482 | | | $ | 1,591,828 | | | $ | 173,094,310 | |
Convertible bonds & notes | | | — | | | | 53,982 | | | | — | | | | 53,982 | |
Senior loans | | | — | | | | 3,932,235 | | | | — | | | | 3,932,235 | |
Sovereign bonds | | | — | | | | 18,078,062 | | | | — | | | | 18,078,062 | |
Common stocks | | $ | 443,609 | | | | — | | | | 1,349,231 | | | | 1,792,840 | |
Convertible preferred stocks | | | 96,200 | | | | — | | | | — | | | | 96,200 | |
Preferred stocks | | | 4,153,024 | | | | — | | | | — | | | | 4,153,024 | |
Warrants | | | — | | | | 119,340 | | | | — | | | | 119,340 | |
| Total investments | | $ | 4,692,833 | | | $ | 193,686,101 | | | $ | 2,941,059 | | | $ | 201,319,993 | |
| Other financial instruments: | | | | | | | | | | | | | | | | |
Futures contracts | | $ | 5,861 | | | | — | | | | — | | | $ | 5,861 | |
Forward foreign currency contracts | | | — | | | $ | 43,935 | | | | — | | | | 43,935 | |
| Total other financial instruments | | $ | 5,861 | | | $ | 43,935 | | | | — | | | $ | 49,796 | |
| Total | | $ | 4,698,694 | | | $ | 193,730,036 | | | $ | 2,941,059 | | | $ | 201,369,789 | |
|
| LIABILITIES | |
| Description | | Quoted Prices
(Level 1) | | | Other Significant
Observable Inputs
(Level 2) | | | Significant
Unobservable
Inputs
(Level 3) | | | Total | |
| Other financial instruments: | | | | | | | | | | | | | | | | |
Forward foreign currency contracts | | | — | | | $ | 414,645 | | | | — | | | $ | 414,645 | |
Centrally cleared credit default swaps on credit indices — buy protection | | | — | | | | 164,421 | | | | — | | | | 164,421 | |
| Total | | | — | | | $ | 579,066 | | | | — | | | $ | 579,066 | |
| † | See Schedule of Investments for additional detailed categorizations. |
| | |
| Western Asset Variable Global High Yield Bond Portfolio 2013 Annual Report | | 39 |
Notes to financial statements (cont’d)
The following is a reconciliation of investments in which significant unobservable inputs (Level 3) were used in determining fair value:
| | | | | | | | | | | | |
| Investments in Securities | | Corporate
Bonds & Notes | | | Common
Stocks | | | Total | |
| Balance as of December 31, 2012 | | $ | 1,302,616 | | | $ | 1,355,382 | | | $ | 2,657,998 | |
| Accrued premiums/discounts | | | 10,603 | | | | — | | | | 10,603 | |
| Realized gain (loss)1 | | | 25,462 | | | | — | | | | 25,462 | |
| Change in unrealized appreciation (depreciation)2 | | | 183,361 | | | | (6,151) | | | | 177,210 | |
| Purchases | | | 429,336 | | | | — | | | | 429,336 | |
| Sales | | | (359,550) | | | | — | | | | (359,550) | |
| Transfers into Level 3 | | | — | | | | — | | | | — | |
| Transfers out of Level 3 | | | — | | | | — | | | | — | |
| Balance as of December 31, 2013 | | $ | 1,591,828 | | | $ | 1,349,231 | | | $ | 2,941,059 | |
| Net change in unrealized appreciation (depreciation) for investments in securities still held at December 31, 20132 | | $ | 185,279 | | | $ | (6,151) | | | $ | 179,128 | |
The Fund’s policy is to recognize transfers between levels as of the end of the reporting period.
| 1 | This amount is included in net realized gain (loss) from investment transactions in the accompanying Statement of Operations. |
| 2 | This amount is included in the change in net unrealized appreciation (depreciation) in the accompanying Statement of Operations. Change in unrealized appreciation (depreciation) includes net unrealized appreciation (depreciation) resulting from changes in investment values during the reporting period and the reversal of previously recorded unrealized appreciation (depreciation) when gains or losses are realized. |
(b) Repurchase agreements. The Portfolio may enter into repurchase agreements with institutions that its investment adviser has determined are creditworthy. Each repurchase agreement is recorded at cost. Under the terms of a typical repurchase agreement, the Portfolio acquires a debt security subject to an obligation of the seller to repurchase, and of the Portfolio to resell, the security at an agreed-upon price and time, thereby determining the yield during the Portfolio’s holding period. When entering into repurchase agreements, it is the Portfolio’s policy that its custodian or a third party custodian, acting on the Portfolio’s behalf, take possession of the underlying collateral securities, the market value of which, at all times, at least equals the principal amount of the repurchase transaction, including accrued interest. To the extent that any repurchase transaction maturity exceeds one business day, the value of the collateral is marked-to-market and measured against the value of the agreement in an effort to ensure the adequacy of the collateral. If the counterparty defaults, the Portfolio generally has the right to use the collateral to satisfy the terms of the repurchase transaction. However, if the market value of the collateral declines during the period in which the Portfolio seeks to assert its rights or if bankruptcy proceedings are commenced with respect to the seller of the security, realization of the collateral by the Portfolio may be delayed or limited.
(c) Futures contracts. The Portfolio uses futures contracts generally to gain exposure to, or hedge against, changes in interest rates or gain exposure to, or hedge against, changes in certain asset classes. A futures contract represents a commitment for the future purchase or sale of an asset at a specified price on a specified date.
Upon entering into a futures contract, the Portfolio is required to deposit cash or cash equivalents with a broker in an amount equal to a certain percentage of the contract amount.
| | |
| 40 | | Western Asset Variable Global High Yield Bond Portfolio 2013 Annual Report |
This is known as the ‘‘initial margin’’ and subsequent payments (‘‘variation margin’’) are made or received by the Portfolio each day, depending on the daily fluctuation in the value of the contract. For certain futures, including foreign denominated futures, variation margin is not settled daily, but is recorded as a net variation margin payable or receivable. Futures contracts are valued daily at the settlement price established by the board of trade or exchange on which they are traded. The daily changes in contract value are recorded as unrealized gains or losses in the Statement of Operations and the Portfolio recognizes a realized gain or loss when the contract is closed.
Futures contracts involve, to varying degrees, risk of loss in excess of the amounts reflected in the financial statements. In addition, there is the risk that the Portfolio may not be able to enter into a closing transaction because of an illiquid secondary market.
(d) Written options. When the Portfolio writes an option, an amount equal to the premium received by the Portfolio is recorded as a liability, the value of which is marked-to-market daily to reflect the current market value of the option written. If the option expires, the premium received is recorded as a realized gain. When a written call option is exercised, the difference between the premium received plus the option exercise price and the Portfolio’s basis in the underlying security (in the case of a covered written call option), or the cost to purchase the underlying security (in the case of an uncovered written call option), including brokerage commission, is recognized as a realized gain or loss. When a written put option is exercised, the amount of the premium received is subtracted from the cost of the security purchased by the Portfolio from the exercise of the written put option to form the Portfolio’s basis in the underlying security purchased. The writer or buyer of an option traded on an exchange can liquidate the position before the exercise of the option by entering into a closing transaction. The cost of a closing transaction is deducted from the original premium received resulting in a realized gain or loss to the Portfolio.
The risk in writing a covered call option is that the Portfolio may forego the opportunity of profit if the market price of the underlying security increases and the option is exercised. The risk in writing a put option is that the Portfolio may incur a loss if the market price of the underlying security decreases and the option is exercised. The risk in writing an uncovered call option is that the Portfolio is exposed to the risk of loss if the market price of the underlying security increases. In addition, there is the risk that the Portfolio may not be able to enter into a closing transaction because of an illiquid secondary market.
(e) Forward foreign currency contracts. The Portfolio enters into a forward foreign currency contract to hedge against foreign currency exchange rate risk on its non-U.S. dollar denominated securities or to facilitate settlement of a foreign currency denominated portfolio transaction. A forward foreign currency contract is an agreement between two parties to buy and sell a currency at a set price with delivery and settlement at a future date. The contract is marked-to-market daily and the change in value is recorded by the Portfolio as an unrealized gain or loss. When a forward foreign currency contract is closed, through either delivery or offset by entering into another forward foreign currency contract, the Portfolio recognizes a realized gain or loss equal to the difference between the value of the contract at the time it was opened and the value of the contract at the time it is closed.
| | |
| Western Asset Variable Global High Yield Bond Portfolio 2013 Annual Report | | 41 |
Notes to financial statements (cont’d)
Forward foreign currency contracts involve elements of market risk in excess of the amounts reflected on the Statement of Assets and Liabilities. The Portfolio bears the risk of an unfavorable change in the foreign exchange rate underlying the forward foreign currency contract. Risks may also arise upon entering into these contracts from the potential inability of the counterparties to meet the terms of their contracts.
(f) Swap agreements. The Portfolio invests in swaps for the purpose of managing its exposure to interest rate, credit or market risk, or for other purposes. The use of swaps involves risks that are different from those associated with other portfolio transactions. Swap agreements are privately negotiated in the over-the-counter market (“OTC Swaps”) or may be executed on a registered exchange (“Centrally Cleared Swaps”). Unlike Centrally Cleared Swaps, the Portfolio has credit exposure to the counterparties of OTC Swaps.
Swap contracts are marked-to-market daily and changes in value are recorded as unrealized appreciation (depreciation). The daily change in valuation of Centrally Cleared Swaps, if any, is recorded as a receivable or payable for variation margin on the Statement of Assets and Liabilities. Gains or losses are realized upon termination of the swap agreement. Collateral, in the form of restricted cash or securities, may be required to be held in segregated accounts with the Portfolio’s custodian in compliance with the terms of the swap contracts. Securities posted as collateral for swap contracts are identified in the Schedule of Investments and restricted cash, if any, is identified on the Statement of Assets and Liabilities. Risks may exceed amounts recorded in the Statement of Assets and Liabilities. These risks include changes in the returns of the underlying instruments, failure of the counterparties to perform under the contracts’ terms, and the possible lack of liquidity with respect to the swap agreements.
OTC swap payments received or made at the beginning of the measurement period are reflected as a premium or deposit, respectively, on the Statement of Assets and Liabilities. These upfront payments are amortized over the life of the swap and are recognized as realized gain or loss in the Statement of Operations. Net periodic payments received or paid by the Portfolio are recognized as a realized gain or loss in the Statement of Operations.
The Portfolio’s maximum exposure in the event of a defined credit event on a credit default swap to sell protection is the notional amount. As of December 31, 2013, the Portfolio did not hold any credit default swaps to sell protection.
For average notional amounts of swaps held during the year ended December 31, 2013, see Note 4.
Credit default swaps
The Portfolio enters into credit default swap (“CDS”) contracts for investment purposes, to manage its credit risk or to add leverage. CDS agreements involve one party making a stream of payments to another party in exchange for the right to receive a specified return in the event of a default by a third party, typically corporate or sovereign issuers, on a specified obligation, or in the event of a write-down, principal shortfall, interest shortfall or default of all or part of the referenced entities comprising a credit index. The Portfolio may
| | |
| 42 | | Western Asset Variable Global High Yield Bond Portfolio 2013 Annual Report |
use a CDS to provide protection against defaults of the issuers (i.e., to reduce risk where the Portfolio has exposure to an issuer) or to take an active long or short position with respect to the likelihood of a particular issuer’s default. As a seller of protection, the Portfolio generally receives an upfront payment or a stream of payments throughout the term of the swap provided that there is no credit event. If the Portfolio is a seller of protection and a credit event occurs, as defined under the terms of that particular swap agreement, the maximum potential amount of future payments (undiscounted) that the Portfolio could be required to make under a credit default swap agreement would be an amount equal to the notional amount of the agreement. These amounts of potential payments will be partially offset by any recovery of values from the respective referenced obligations. As a seller of protection, the Portfolio effectively adds leverage to its portfolio because, in addition to its total net assets, the Portfolio is subject to investment exposure on the notional amount of the swap. As a buyer of protection, the Portfolio generally receives an amount up to the notional value of the swap if a credit event occurs.
Implied spreads are the theoretical prices a lender receives for credit default protection. When spreads rise, market perceived credit risk rises and when spreads fall, market perceived credit risk falls. The implied credit spread of a particular referenced entity reflects the cost of buying/selling protection and may include upfront payments required to enter into the agreement. Wider credit spreads and decreasing market values, when compared to the notional amount of the swap, represent a deterioration of the referenced entity’s credit soundness and a greater likelihood or risk of default or other credit event occurring as defined under the terms of the agreement. Credit spreads utilized in determining the period end market value of credit default swap agreements on corporate or sovereign issues are disclosed in the Notes to Financial Statements and serve as an indicator of the current status of the payment/performance risk and represent the likelihood or risk of default for credit derivatives. For credit default swap agreements on asset-backed securities and credit indices, the quoted market prices and resulting values, particularly in relation to the notional amount of the contract as well as the annual payment rate, serve as an indication of the current status of the payment/performance risk.
The Portfolio’s maximum risk of loss from counterparty risk, as the protection buyer, is the fair value of the contract (this risk is mitigated by the posting of collateral by the counterparty to the Portfolio to cover the Portfolio’s exposure to the counterparty). As the protection seller, the Portfolio’s maximum risk is the notional amount of the contract. Credit default swaps are considered to have credit risk-related contingent features since they require payment by the protection seller to the protection buyer upon the occurrence of a defined credit event.
Entering into a CDS agreement involves, to varying degrees, elements of credit, market and documentation risk in excess of the related amounts recognized on the Statement of Assets and Liabilities. Such risks involve the possibility that there will be no liquid market for these agreements, that the counterparty to the agreement may default on its obligation to perform or disagree as to the meaning of the contractual terms in the agreement, and that there will be unfavorable changes in net interest rates.
| | |
| Western Asset Variable Global High Yield Bond Portfolio 2013 Annual Report | | 43 |
Notes to financial statements (cont’d)
(g) Swaptions. The Portfolio purchases and writes swaption contracts to manage exposure to an underlying instrument. The Portfolio may also purchase or write swaptions to manage exposure to fluctuations in interest rates or to enhance yield. Swaption contracts written by the Portfolio represent an option that gives the purchaser the right, but not the obligation, to enter into a previously agreed upon swap contract at a future date. Swaption contracts purchased by the Portfolio represent an option that gives the Portfolio the right, but not the obligation, to enter into a previously agreed upon swap contract at a future date.
When the Portfolio writes a swaption, an amount equal to the premium received by the Portfolio is recorded as a liability, the value of which is marked-to-market daily to reflect the current market value of the swaption written. If the swaption expires, the Portfolio realizes a gain equal to the amount of the premium received.
When the Portfolio purchases a swaption, an amount equal to the premium paid by the Portfolio is recorded as an investment on the Statement of Assets and Liabilities, the value of which is marked-to-market daily to reflect the current market value of the swaption purchased. If the swaption expires, the Portfolio realizes a loss equal to the amount of the premium paid.
Swaptions are marked-to-market daily based upon quotations from market makers. Changes in the value of the swaption are reported as unrealized gains or losses in the Statement of Operations.
(h) Foreign currency translation. Investment securities and other assets and liabilities denominated in foreign currencies are translated into U.S. dollar amounts based upon prevailing exchange rates on the date of valuation. Purchases and sales of investment securities and income and expense items denominated in foreign currencies are translated into U.S. dollar amounts based upon prevailing exchange rates on the respective dates of such transactions.
The Portfolio does not isolate that portion of the results of operations resulting from fluctuations in foreign exchange rates on investments from the fluctuations arising from changes in market prices of securities held. Such fluctuations are included with the net realized and unrealized gain or loss on investments.
Net realized foreign exchange gains or losses arise from sales of foreign currencies, including gains and losses on forward foreign currency contracts, currency gains or losses realized between the trade and settlement dates on securities transactions, and the difference between the amounts of dividends, interest, and foreign withholding taxes recorded on the Portfolio’s books and the U.S. dollar equivalent of the amounts actually received or paid. Net unrealized foreign exchange gains and losses arise from changes in the values of assets and liabilities, other than investments in securities, on the date of valuation, resulting from changes in exchange rates.
Foreign security and currency transactions may involve certain considerations and risks not typically associated with those of U.S. dollar denominated transactions as a result of,
| | |
| 44 | | Western Asset Variable Global High Yield Bond Portfolio 2013 Annual Report |
among other factors, the possibility of lower levels of governmental supervision and regulation of foreign securities markets and the possibility of political or economic instability.
(i) Loan participations. The Portfolio may invest in loans arranged through private negotiation between one or more financial institutions. The Portfolio’s investment in any such loan may be in the form of a participation in or an assignment of the loan. In connection with purchasing participations, the Portfolio generally will have no right to enforce compliance by the borrower with the terms of the loan agreement related to the loan, or any rights of off-set against the borrower and the Portfolio may not benefit directly from any collateral supporting the loan in which it has purchased the participation.
The Portfolio assumes the credit risk of the borrower, the lender that is selling the participation and any other persons interpositioned between the Portfolio and the borrower. In the event of the insolvency of the lender selling the participation, the Portfolio may be treated as a general creditor of the lender and may not benefit from any off-set between the lender and the borrower.
(j) Unfunded loan commitments. The Portfolio may enter into certain credit agreements where all or a portion of which may be unfunded. The Portfolio is obligated to fund these commitments at the borrower’s discretion. The commitments are disclosed in the accompanying Schedule of Investments. At December 31, 2013, the Portfolio had sufficient cash and/or securities to cover these commitments.
(k) Credit and market risk. The Portfolio invests in high-yield and emerging market instruments that are subject to certain credit and market risks. The yields of high-yield and emerging market debt obligations reflect, among other things, perceived credit and market risks. The Portfolio’s investments in securities rated below investment grade typically involve risks not associated with higher rated securities including, among others, greater risk related to timely and ultimate payment of interest and principal, greater market price volatility and less liquid secondary market trading. The consequences of political, social, economic or diplomatic changes may have disruptive effects on the market prices of investments held by the Portfolio. The Portfolio’s investments in non-U.S. dollar denominated securities may also result in foreign currency losses caused by devaluations and exchange rate fluctuations.
(l) Foreign investment risks. The Portfolio’s investments in foreign securities may involve risks not present in domestic investments. Since securities may be denominated in foreign currencies, may require settlement in foreign currencies or pay interest or dividends in foreign currencies, changes in the relationship of these foreign currencies to the U.S. dollar can significantly affect the value of the investments and earnings of the Portfolio. Foreign investments may also subject the Portfolio to foreign government exchange restrictions, expropriation, taxation or other political, social or economic developments, all of which affect the market and/or credit risk of the investments.
(m) Counterparty risk and credit-risk-related contingent features of derivative instruments. The Portfolio may invest in certain securities or engage in other transactions,
| | |
| Western Asset Variable Global High Yield Bond Portfolio 2013 Annual Report | | 45 |
Notes to financial statements (cont’d)
where the Portfolio is exposed to counterparty credit risk in addition to broader market risks. The Portfolio may invest in securities of issuers, which may also be considered counterparties as trading partners in other transactions. This may increase the risk of loss in the event of default or bankruptcy by the counterparty or if the counterparty otherwise fails to meet its contractual obligations. The Portfolio’s investment manager attempts to mitigate counterparty risk by (i) periodically assessing the creditworthiness of its trading partners, (ii) monitoring and/or limiting the amount of its net exposure to each individual counterparty based on its assessment and (iii) requiring collateral from the counterparty for certain transactions. Market events and changes in overall economic conditions may impact the assessment of such counterparty risk by the investment manager. In addition, declines in the values of underlying collateral received may expose the Portfolio to increased risk of loss.
The Portfolio has entered into master agreements with certain of its derivative counterparties that provide for general obligations, representations, agreements, collateral, events of default or termination and credit related contingent features. The credit related contingent features include, but are not limited to, a percentage decrease in the Portfolio’s net assets or NAV over a specified period of time. If these credit related contingent features were triggered, the derivatives counterparty could terminate the positions and demand payment or require additional collateral.
Collateral requirements differ by type of derivative. Collateral or margin requirements are set by the broker or exchange clearing house for exchange traded derivatives while collateral terms are contract specific for over-the-counter traded derivatives. Cash collateral that has been pledged to cover obligations of the Portfolio under derivative contracts, if any, will be reported separately in the Statement of Assets and Liabilities. Securities pledged as collateral, if any, for the same purpose are noted in the Schedule of Investments.
Absent an event of default by the counterparty or a termination of the agreement, the terms of the master agreements do not result in an offset of reported amounts of financial assets and financial liabilities in the Statement of Assets and Liabilities across transactions between the Portfolio and the applicable counterparty. The enforceability of the right to offset may vary by jurisdiction.
As of December 31, 2013, the Portfolio held forward foreign currency contracts with credit related contingent features which had a liability position of $414,645. If a contingent feature in the master agreements would have been triggered, the Portfolio would have been required to pay this amount to its derivatives counterparties
(n) Security transactions and investment income. Security transactions are accounted for on a trade date basis. Interest income, adjusted for amortization of premium and accretion of discount, is recorded on the accrual basis. Dividend income is recorded on the ex-dividend date. Foreign dividend income is recorded on the ex-dividend date or as soon as practicable after the Portfolio determines the existence of a dividend declaration after exercising reasonable due diligence. The cost of investments sold is determined by
| | |
| 46 | | Western Asset Variable Global High Yield Bond Portfolio 2013 Annual Report |
use of the specific identification method. To the extent any issuer defaults or a credit event occurs that impacts the issuer, the Portfolio may halt any additional interest income accruals and consider the realizability of interest accrued up to the date of default or credit event.
(o) Distributions to shareholders. Distributions from net investment income and distributions of net realized gains, if any, are declared at least annually. Distributions to shareholders of the Portfolio are recorded on the ex-dividend date and are determined in accordance with income tax regulations, which may differ from GAAP.
(p) Share class accounting. Investment income, common expenses and realized/unrealized gains (losses) on investments are allocated to the various classes of the Portfolio on the basis of daily net assets of each class. Fees relating to a specific class are charged directly to that share class.
(q) Compensating balance arrangements. The Portfolio has an arrangement with its custodian bank whereby a portion of the custodian’s fees is paid indirectly by credits earned on the Portfolio’s cash on deposit with the bank.
(r) Federal and other taxes. It is the Portfolio’s policy to comply with the federal income and excise tax requirements of the Internal Revenue Code of 1986 (the “Code”), as amended, applicable to regulated investment companies. Accordingly, the Portfolio intends to distribute its taxable income and net realized gains, if any, to shareholders in accordance with timing requirements imposed by the Code. Therefore, no federal or state income tax provision is required in the Portfolio’s financial statements.
Management has analyzed the Portfolio’s tax positions taken on income tax returns for all open tax years and has concluded that as of December 31, 2013, no provision for income tax is required in the Portfolio’s financial statements. The Portfolio’s federal and state income and federal excise tax returns for tax years for which the applicable statutes of limitations have not expired are subject to examination by the Internal Revenue Service and state departments of revenue.
Under the applicable foreign tax laws, a withholding tax may be imposed on interest, dividends and capital gains at various rates.
(s) Reclassification. GAAP requires that certain components of net assets be reclassified to reflect permanent differences between financial and tax reporting. These reclassifications have no effect on net assets or net asset values per share. During the current year, the following reclassifications have been made:
| | | | | | | | |
| | | Undistributed Net
Investment Income | | | Accumulated Net
Realized Loss | |
| (a) | | $ | (891,746) | | | $ | 891,746 | |
| (a) | Reclassifications are primarily due to foreign currency transactions treated as ordinary income for tax purposes and book/tax differences in the treatment of swaps. |
| | |
| Western Asset Variable Global High Yield Bond Portfolio 2013 Annual Report | | 47 |
Notes to financial statements (cont’d)
2. Investment management agreement and other transactions with affiliates
Legg Mason Partners Fund Advisor, LLC (“LMPFA”) is the Portfolio’s investment manager. Western Asset Management Company (“Western Asset”), Western Asset Management Company Limited (“Western Asset Limited”) and Western Asset Management Company Pte. Ltd. (“Western Singapore”) are the Portfolio’s subadvisers. LMPFA, Western Asset, Western Asset Limited and Western Singapore are wholly-owned subsidiaries of Legg Mason, Inc. (“Legg Mason”).
Under the investment management agreement, the Portfolio pays an investment management fee, calculated daily and paid monthly at an annual rate of 0.70% of the Portfolio’s average daily net assets.
LMPFA provides administrative and certain oversight services to the Portfolio. LMPFA delegates to the subadviser the day-to-day portfolio management of the Portfolio. Western Asset Limited and Western Singapore provide certain advisory services to the Portfolio relating to currency transactions and investment in non-U.S. dollar denominated securities and related foreign currency instruments. For its services, LMPFA pays Western Asset 70% of the net investment management fee it receives from the Portfolio. In turn, Western Asset pays Western Asset Limited and Western Singapore a subadvisory fee of 0.30% on the assets managed by Western Asset Limited and Western Singapore.
As a result of expense limitation arrangements between the Portfolio and LMPFA, the ratio of expenses other than brokerage, interest, taxes, extraordinary expenses and acquired fund fees and expenses, to average net assets of Class I and Class II shares did not exceed 0.90% and 1.15%, respectively. These expense limitation arrangements cannot be terminated prior to December 31, 2015 without the Board of Trustees’ consent.
The investment manager is permitted to recapture amounts waived or reimbursed to a class during the same fiscal year if the class’ total annual operating expenses have fallen to a level below the expense limitation (“expense cap”) in effect at the time the fees were earned or the expenses incurred. In no case will the investment manager recapture any amount that would result, on any particular business day of the Portfolio, in the class’ total annual operating expenses exceeding the expense cap or any other lower limit then in effect.
Legg Mason Investor Services, LLC a wholly-owned broker-dealer subsidiary of Legg Mason, serves as the Portfolio’s sole and exclusive distributor.
All officers and one Trustee of the Trust are employees of Legg Mason or its affiliates and do not receive compensation from the Trust.
3. Investments
During the year ended December 31, 2013, the aggregate cost of purchases and proceeds from sales of investments (excluding short-term investments) were as follows:
| | | | |
| Purchases | | $ | 156,227,690 | |
| Sales | | | 144,078,700 | |
| | |
| 48 | | Western Asset Variable Global High Yield Bond Portfolio 2013 Annual Report |
At December 31, 2013, the aggregate gross unrealized appreciation and depreciation of investments for federal income tax purposes were as follows:
| | | | |
| Gross unrealized appreciation | | $ | 9,836,790 | |
| Gross unrealized depreciation | | | (4,870,494) | |
| Net unrealized appreciation | | $ | 4,966,296 | |
At December 31, 2013, the Portfolio had the following open futures contracts:
| | | | | | | | | | | | | | | | | | | | |
| | | Number of
Contracts | | | Expiration
Date | | | Basis
Value | | | Market
Value | | | Unrealized
Gain | |
| Contracts to Sell: | | | | | | | | | | | | | | | | | | | | |
| U.S. Treasury Ultra Long-Term Bonds | | | 2 | | | | 3/14 | | | $ | 262,486 | | | $ | 256,625 | | | $ | 5,861 | |
During the year ended December 31, 2013, written option transactions for the Portfolio were as follows:
| | | | | | | | |
| | | Notional Amount | | | Premiums | |
| Written options, outstanding as of December 31, 2012 | | $ | 20,120,000 | | | $ | 104,984 | |
| Options written | | | 15,850,000 | | | | 104,045 | |
| Options closed | | | — | | | | — | |
| Options exercised | | | (12,350,000) | | | | (79,825) | |
| Options expired | | | (23,620,000) | | | | (129,204) | |
| Written options, outstanding as of December 31, 2013 | | | — | | | | — | |
At December 31, 2013, the Portfolio had the following open forward foreign currency contracts:
| | | | | | | | | | | | | | | | | | |
| Foreign Currency | | Counterparty | | Local
Currency | | | Market
Value | | | Settlement
Date | | | Unrealized
Gain (Loss) | |
| Contracts to Buy: | | | | | | | | | | | | | | | | | | |
| Brazilian Real | | Citibank N.A. | | | 71,840 | | | $ | 30,358 | | | | 1/15/14 | | | $ | (89) | |
| Euro | | UBS AG | | | 600,000 | | | | 825,404 | | | | 2/18/14 | | | | 14,762 | |
| | | | | | | | | | | | | | | | | | 14,673 | |
| Contracts to Sell: | | | | | | | | | | | | | | | | | | |
| Brazilian Real | | Citibank N.A. | | | 1,480,500 | | | | 625,626 | | | | 1/15/14 | | | | 29,173 | |
| British Pound | | Citibank N.A. | | | 596,335 | | | | 987,190 | | | | 2/18/14 | | | | (31,528) | |
| British Pound | | Credit Suisse | | | 221,262 | | | | 366,284 | | | | 2/18/14 | | | | (11,678) | |
| British Pound | | UBS AG | | | 1,876,488 | | | | 3,106,390 | | | | 2/18/14 | | | | (97,629) | |
| Euro | | Citibank N.A. | | | 100,000 | | | | 137,567 | | | | 2/18/14 | | | | (1,595) | |
| Euro | | Citibank N.A. | | | 100,000 | | | | 137,567 | | | | 2/18/14 | | | | (66) | |
| Euro | | Citibank N.A. | | | 300,000 | | | | 412,702 | | | | 2/18/14 | | | | (2,858) | |
| Euro | | Citibank N.A. | | | 674,009 | | | | 927,216 | | | | 2/18/14 | | | | (26,090) | |
| Euro | | JPMorgan Chase & Co. | | | 330,810 | | | | 455,087 | | | | 2/18/14 | | | | (13,624) | |
| Euro | | UBS AG | | | 8,194,805 | | | | 11,273,381 | | | | 2/18/14 | | | | (229,488) | |
| | | | | | | | | | | | | | | | | | (385,383) | |
| Net unrealized loss on open forward foreign currency contracts | | | $ | (370,710) | |
| | |
| Western Asset Variable Global High Yield Bond Portfolio 2013 Annual Report | | 49 |
Notes to financial statements (cont’d)
At December 31, 2013, the Portfolio held the following open swap contracts:
| | | | | | | | | | | | | | | | | | | | | | |
| CENTRALLY CLEARED CREDIT DEFAULT SWAPS ON CREDIT INDICES — BUY PROTECTION1 | |
Swap Counterparty
(Reference Entity) | | Notional
Amount 2 | | | Termination
Date | | | Periodic
Payments
Made By
The Portfolio† | | Market
Value3 | | | Upfront
Premiums
Paid
(Received) | | | Unrealized
Depreciation | |
| Barclays Capital Inc. (Markit CDX.NA.HY.21 Index) | | $ | 7,230,000 | | | | 12/20/18 | | | 5.000% quarterly | | $ | (616,356) | | | $ | (451,935) | | | $ | (164,421) | |
| 1 | If the Portfolio is a buyer of protection and a credit event occurs, as defined under the terms of that particular swap agreement, the Portfolio will either (i) receive from the seller of protection an amount equal to the notional amount of the swap and deliver the referenced obligation or the underlying securities comprising the referenced index or (ii) receive a net settlement amount in the form of cash or securities equal to the notional amount of the swap less the recovery value of the referenced obligation or the underlying securities comprising the referenced index. |
| 2 | The maximum potential amount the Portfolio could be required to pay as a seller of credit protection or receive as a buyer of credit protection if a credit event occurs as defined under the terms of that particular swap agreement. |
| 3 | The quoted market prices and resulting values for credit default swap agreements on asset-backed securities and credit indices serve as an indicator of the current status of the payment/performance risk and represent the likelihood of an expected liability (or profit) for the credit derivative should the notional amount of the swap agreement been closed/sold as of the period end. Decreasing market values (sell protection) or increasing market values (buy protection) when compared to the notional amount of the swap, represent a deterioration of the referenced entity’s credit soundness and a greater likelihood or risk of default or other credit event occurring as defined under the terms of the agreement. |
| † | Percentage shown is an annual percentage rate. |
4. Derivative instruments and hedging activities
GAAP requires enhanced disclosure about an entity’s derivative and hedging activities.
Below is a table, grouped by derivative type, that provides information about the fair value and the location of derivatives within the Statement of Assets and Liabilities at December 31, 2013.
| | | | | | | | | | | | |
| ASSET DERIVATIVES1 | |
| | | Interest
Rate Risk | | | Foreign
Exchange Risk | | | Total | |
| Futures contracts2 | | $ | 5,861 | | | | — | | | $ | 5,861 | |
| Forward foreign currency contracts | | | — | | | $ | 43,935 | | | | 43,935 | |
| Total | | $ | 5,861 | | | $ | 43,935 | | | $ | 49,796 | |
| | | | | | | | | | | | |
| LIABILITY DERIVATIVES1 | |
| | | Foreign
Exchange Risk | | | Credit Risk | | | Total | |
| Centrally cleared swap contracts3 | | | — | | | $ | 164,421 | | | $ | 164,421 | |
| Forward foreign currency contracts | | $ | 414,645 | | | | — | | | | 414,645 | |
| Total | | $ | 414,645 | | | $ | 164,421 | | | $ | 579,066 | |
| 1 | Generally, the balance sheet location for asset derivatives is receivables/net unrealized appreciation (depreciation) and for liability derivatives is payables/net unrealized appreciation (depreciation). |
| 2 | Includes cumulative appreciation (depreciation) of futures contracts as reported in the footnotes. Only variation margin is reported within the receivables and/or payables on the Statement of Assets and Liabilities. |
| 3 | Includes cumulative appreciation (depreciation) of centrally cleared swap contracts as reported in the footnotes. Only variation margin is reported within the receivables and/or payables on the Statement of Assets and Liabilities. |
| | |
| 50 | | Western Asset Variable Global High Yield Bond Portfolio 2013 Annual Report |
The following tables provide information about the effect of derivatives and hedging activities on the Portfolio’s Statement of Operations for the year ended December 31, 2013. The first table provides additional detail about the amounts and sources of gains (losses) realized on derivatives during the period. The second table provides additional information about the change in unrealized appreciation (depreciation) resulting from the Portfolio’s derivatives and hedging activities during the period.
| | | | | | | | | | | | | | | | |
| AMOUNT OF REALIZED GAIN (LOSS) ON DERIVATIVES RECOGNIZED | |
| | | Interest
Rate Risk | | | Foreign
Exchange Risk | | | Credit Risk | | | Total | |
| Purchased options1 | | | — | | | | — | | | $ | (232,434) | | | $ | (232,434) | |
| Written options | | | — | | | | — | | | | 129,204 | | | | 129,204 | |
| Futures contracts | | $ | 20,537 | | | | — | | | | — | | | | 20,537 | |
| Swap contracts | | | — | | | | — | | | | (1,244,668) | | | | (1,244,668) | |
| Forward foreign currency contracts | | | — | | | $ | (557,505) | | | | | | | | (557,505) | |
| Total | | $ | 20,537 | | | $ | (557,505) | | | $ | (1,347,898) | | | $ | (1,884,866) | |
| 1 | Net realized gain (loss) from purchased options is reported in net realized gain (loss) from investment transactions in the Statement of Operations. |
| | | | | | | | | | | | | | | | |
| CHANGE IN UNREALIZED APPRECIATION (DEPRECIATION) ON DERIVATIVES RECOGNIZED | |
| | | Interest
Rate Risk | | | Foreign
Exchange Risk | | | Credit Risk | | | Total | |
| Purchased options1 | | | — | | | | — | | | $ | (67,642) | | | $ | (67,642) | |
| Written options | | | — | | | | — | | | | 53,596 | | | | 53,596 | |
| Futures contracts | | $ | 5,861 | | | | — | | | | — | | | | 5,861 | |
| Swap contracts | | | — | | | | — | | | | 86,065 | | | | 86,065 | |
| Forward foreign currency contracts | | | — | | | $ | 26,071 | | | | — | | | | 26,071 | |
| Total | | $ | 5,861 | | | $ | 26,071 | | | $ | 72,019 | | | $ | 103,951 | |
| 1 | The change in unrealized appreciation (depreciation) from purchased options is reported in the change in net unrealized appreciation (depreciation) from investments in the Statement of Operations. |
During the year ended December 31, 2013, the volume of derivative activity for the Portfolio was as follows:
| | | | |
| | | Average Market
Value | |
| Purchased options† | | $ | 25,531 | |
| Written options† | | | 45,500 | |
| Futures contracts (to buy)† | | | 631,031 | |
| Futures contracts (to sell) | | | 253,721 | |
| Forward foreign currency contracts (to buy) | | | 784,481 | |
| Forward foreign currency contracts (to sell) | | | 17,960,126 | |
| |
| | | Average Notional
Balance | |
| Credit default swap contracts (to buy protection) | | $ | 5,591,200 | |
| † | At December 31, 2013, there were no open positions held in this derivative. |
| | |
| Western Asset Variable Global High Yield Bond Portfolio 2013 Annual Report | | 51 |
Notes to financial statements (cont’d)
The following table presents by financial instrument, the Portfolio’s derivative assets net of the related collateral held by the Portfolio at December 31, 2013:
| | | | | | | | | | | | |
| | | Gross Amount of Derivative
Assets in the Statement of
Assets and Liabilities1 | | | Collateral Received2,3 | | | Net Amount | |
| Futures contracts4 | | $ | 938 | | | $ | (938) | | | | — | |
| Forward foreign currency contracts | | | 43,935 | | | | — | | | $ | 43,935 | |
| Total | | $ | 44,873 | | | $ | (938) | | | $ | 43,935 | |
The following table presents by financial instrument, the Portfolio’s derivative liabilities net of the related collateral pledged by the Portfolio at December 31, 2013:
| | | | | | | | | | | | |
| | | Gross Amount of Derivative
Liabilities in the Statement of Assets and Liabilities1 | | | Collateral Pledged2,3 | | | Net Amount | |
| Centrally cleared swap contracts4 | | $ | 21,048 | | | $ | (21,048) | | | | — | |
| Forward foreign currency contracts | | | 414,645 | | | | — | | | $ | 414,645 | |
| Total | | $ | 435,693 | | | $ | (21,048) | | | $ | 414,645 | |
| 1 | Absent an event of default or early termination, derivative assets and liabilities are presented gross and not offset in the Statement of Assets and Liabilities. |
| 2 | Gross amounts not offset in the Statement of Assets and Liabilities. |
| 3 | In some instances, the actual collateral received and/or pledged may be more than the amount shown here due to overcollateralization. |
| 4 | Amount represents the current day’s variation margin as reported in the Statement of Assets and Liabilities. It differs from the cumulative appreciation (depreciation) presented in the previous table. |
5. Class specific expenses, waivers and/or expense reimbursements
The Portfolio has adopted a Rule 12b-1 distribution plan and under that plan the Portfolio pays a service and/or distribution fee with respect to its Class II shares calculated at the annual rate of 0.25% of the average daily net assets of the class.
For the year ended December 31, 2013, class specific expenses were as follows:
| | | | | | | | |
| | | Service and/or
Distribution Fees | | | Transfer Agent
Fees | |
| Class I | | | — | | | $ | 7,165 | |
| Class II | | $ | 83,025 | | | | 6,660 | |
| Total | | $ | 83,025 | | | $ | 13,825 | |
6. Distributions to shareholders by class
| | | | | | | | |
| | | Year Ended
December 31, 2013 | | | Year Ended
December 31, 2012 | |
| Net Investment Income: | | | | | | | | |
| Class I | | $ | 9,656,236 | | | $ | 11,345,901 | |
| Class II | | | 2,443,811 | | | | 1,681,231 | |
| Total | | $ | 12,100,047 | | | $ | 13,027,132 | |
| | |
| 52 | | Western Asset Variable Global High Yield Bond Portfolio 2013 Annual Report |
7. Shares of beneficial interest
At December 31, 2013, the Trust had an unlimited number of shares of beneficial interest authorized with a par value of $0.00001 per share. The Portfolio has the ability to issue multiple classes of shares. Each class of shares represents an identical interest and has the same rights, except that each class bears certain direct expenses, including those specifically related to the distribution of its shares.
Transactions in shares of each class were as follows:
| | | | | | | | | | | | | | | | |
| | | Year Ended
December 31, 2013 | | | Year Ended
December 31, 2012 | |
| | | Shares | | | Amount | | | Shares | | | Amount | |
| Class I | | | | | | | | | | | | | | | | |
| Shares sold | | | 4,927,498 | | | $ | 41,273,871 | | | | 6,341,490 | | | $ | 51,134,531 | |
| Shares issued on reinvestment | | | 1,190,108 | | | | 9,656,236 | | | | 1,405,312 | | | | 11,345,901 | |
| Shares repurchased | | | (6,303,082) | | | | (52,651,687) | | | | (3,605,568) | | | | (29,059,525) | |
| Net increase (decrease) | | | (185,476) | | | $ | (1,721,580) | | | | 4,141,234 | | | $ | 33,420,907 | |
| | | | |
| Class II | | | | | | | | | | | | | | | | |
| Shares sold | | | 4,032,734 | | | $ | 34,443,268 | | | | 666,407 | | | $ | 5,532,292 | |
| Shares issued on reinvestment | | | 295,049 | | | | 2,443,811 | | | | 203,931 | | | | 1,681,231 | |
| Shares repurchased | | | (2,109,864) | | | | (17,927,512) | | | | (1,525,284) | | | | (12,564,793) | |
| Net increase (decrease) | | | 2,217,919 | | | $ | 18,959,567 | | | | (654,946) | | | $ | (5,351,270) | |
8. Income tax information and distributions to shareholders
The tax character of distributions paid during the fiscal years ended December 31, was as follows:
| | | | | | | | |
| | | 2013 | | | 2012 | |
| Distributions Paid From: | | | | | | | | |
| Ordinary income | | $ | 12,100,047 | | | $ | 13,027,132 | |
As of December 31, 2013, the components of accumulated earnings on a tax basis were as follows:
| | | | |
| Capital loss carryforward* | | $ | (14,913,154) | |
| Other book/tax temporary differences(a) | | | 164,770 | |
| Unrealized appreciation (depreciation)(b) | | | 4,439,035 | |
| Total accumulated earnings (losses) — net | | $ | (10,309,349) | |
| * | During the taxable year ended December 31, 2013, the Fund utilized $3,090,834 of its capital loss carryforward available from prior years. As of December 31, 2013, the Fund had the following net capital loss carryforward remaining: |
| | | | |
| Year of Expiration | | Amount | |
| 12/31/2017 | | $ | (14,913,154 | ) |
This amount will be available to offset any future taxable capital gains.
| (a) | Other book/tax temporary differences are attributable primarily to the realization for tax purposes of unrealized gains/losses on certain futures and foreign currency contracts, the deferral of certain late year losses for tax purposes, book/tax |
| | |
| Western Asset Variable Global High Yield Bond Portfolio 2013 Annual Report | | 53 |
Notes to financial statements (cont’d)
| | difference in the accrual of interest income on securities in default and book/tax differences in the timing of the deductibility of various expenses. |
| (b) | The difference between book-basis and tax-basis unrealized appreciation/(depreciation) is attributable primarily to the tax deferral of losses on wash sales. |
9. Legal matters
On or about May 30, 2006, John Halebian, a purported shareholder of Western Asset New York Tax Free Money Market Fund (formerly known as CitiSM New York Tax Free Reserves), a series of Legg Mason Partners Money Market Trust, formerly a series of CitiFunds Trust III (the “Subject Trust”), filed a complaint in the United States District Court for the Southern District of New York against the persons who were then the independent trustees of the Subject Trust. The Subject Trust was also named in the complaint as a nominal defendant.
The complaint raised derivative claims on behalf of the Subject Trust and putative class claims against the then independent trustees in connection with the 2005 sale of Citigroup’s asset management business to Legg Mason and the related approval of new investment advisory agreements by the trustees and shareholders. In the derivative claim, the plaintiff alleged that the independent trustees had breached their fiduciary duty to the Subject Trust and its shareholders by failing to negotiate lower fees or to seek competing bids from other qualified investment advisers in connection with Citigroup’s sale to Legg Mason. In the claims brought on behalf of a putative class of shareholders, the plaintiff alleged that the echo voting provisions applicable to the proxy solicitation process violated the 1940 Act and constituted a breach of fiduciary duty. The relief sought included rescission of the advisory agreement and an award of costs and attorney fees.
In advance of filing the complaint, Plaintiff’s lawyers had made written demand for relief on the Board of the Subject Trust, and the Board’s independent trustees formed a demand review committee to investigate the matters raised in the demand and the expanded set of matters subsequently raised in the complaint. The demand review committee recommended that the action demanded by Plaintiff would not be in the best interests of the Subject Trust. The independent trustees of the Subject Trust considered the committee’s report, adopted the recommendation of the committee, and directed counsel to move to dismiss the complaint.
The Federal district court dismissed the complaint in its entirety in July 2007. In May 2011, the U.S. Court of Appeals for the Second Circuit affirmed the district court’s dismissal as to the class claims, and remanded the remaining claim relating to the demand review committee that had examined the derivative claim to the district court with instructions to convert the motion to dismiss into a motion for summary judgment. In July 2012, the district court granted summary judgment in favor of the defendants. In August 2012, Plaintiff filed an appeal. In November 2013, the U.S. Court of Appeals for the Second Circuit issued a summary order affirming the dismissal of the case in its entirety. On November 26, 2013, Plaintiff filed a petition for panel rehearing and for rehearing en banc with the U.S. Court of Appeals for the Second Circuit. On January 13, 2014, the Appeals Court denied Plaintiff’s petition.
| | |
| 54 | | Western Asset Variable Global High Yield Bond Portfolio 2013 Annual Report |
10. Recent accounting pronouncement
The Portfolio has adopted the disclosure provisions of Financial Accounting Standards Board (“FASB”) Accounting Standards Update 2011-11 (“ASU 2011-11”), Balance Sheet (Topic 210) — Disclosures about Offsetting Assets and Liabilities along with the related scope clarification provisions of FASB Accounting Standards Update 2013-01 (“ASU 2013-01”) entitled Balance Sheet (Topic 210) — Clarifying the Scope of Disclosures about Offsetting Assets and Liabilities. ASU 2011-11 is intended to enhance disclosures on the offsetting of financial assets and liabilities by requiring entities to disclose both gross and net information about financial instruments and transactions that are either offset in the statement of assets and liabilities or subject to a master netting agreement or similar arrangement. ASU 2013-01 limits the scope of ASU 2011-11’s disclosure requirements on offsetting to financial assets and financial liabilities related to derivatives, repurchase and reverse repurchase agreements, and securities lending and securities borrowing transactions.
| | |
| Western Asset Variable Global High Yield Bond Portfolio 2013 Annual Report | | 55 |
Report of independent registered public
accounting firm
The Board of Trustees and Shareholders
Legg Mason Partners Variable Income Trust:
We have audited the accompanying statement of assets and liabilities of Western Asset Variable Global High Yield Bond Portfolio (the “Portfolio”), a series of Legg Mason Partners Variable Income Trust, including the schedule of investments, as of December 31, 2013, and the related statement of operations for the year then ended, the statements of changes in net assets for each of the years in the two-year period then ended, and the financial highlights for each of the years in the five-year period then ended. These financial statements and financial highlights are the responsibility of the Portfolio’s management. Our responsibility is to express an opinion on these financial statements and financial highlights based on our audits.
We conducted our audits in accordance with the standards of the Public Company Accounting Oversight Board (United States). Those standards require that we plan and perform the audit to obtain reasonable assurance about whether the financial statements and financial highlights are free of material misstatement. An audit includes examining, on a test basis, evidence supporting the amounts and disclosures in the financial statements. Our procedures included confirmation of securities owned as of December 31, 2013, by correspondence with the custodian and brokers or by other appropriate auditing procedures. An audit also includes assessing the accounting principles used and significant estimates made by management, as well as evaluating the overall financial statement presentation. We believe that our audits provide a reasonable basis for our opinion.
In our opinion, the financial statements and financial highlights referred to above present fairly, in all material respects, the financial position of Western Asset Variable Global High Yield Bond Portfolio as of December 31, 2013, the results of its operations for the year then ended, the changes in its net assets for each of the years in the two-year period then ended, and the financial highlights for each of the years in the five-year period then ended, in conformity with U.S. generally accepted accounting principles.

New York, New York
February 21, 2014
| | |
| 56 | | Western Asset Variable Global High Yield Bond Portfolio 2013 Annual Report |
Board approval of management and subadvisory agreements (unaudited)
At an in-person meeting of the Board of Trustees of Legg Mason Partners Variable Income Trust (the “Trust”) held on November 11-12, 2013, the Board, including the Trustees who are not considered to be “interested persons” of the Trust (the “Independent Trustees”) under the Investment Company Act of 1940, as amended (the “1940 Act”), approved for an annual period the continuation of the management agreement (the “Management Agreement”) between the Trust and Legg Mason Partners Fund Advisor, LLC (the “Manager”) with respect to the Western Asset Variable Global High Yield Bond Portfolio, a series of the Trust (the “Fund”), and the sub-advisory agreement (the “Sub-Advisory Agreement”) between the Manager and Western Asset Management Company (the “Subadviser”), an affiliate of the Manager, with respect to the Fund. At that meeting, the Board, including the Independent Trustees, also approved for an annual period the continuation of a sub-advisory agreement (together with the Sub-Advisory Agreement, the “Sub-Advisory Agreements”) between the Subadviser and Western Asset Management Company Limited and Western Asset Management Company Pte. Ltd. (together with the Subadviser, the “Subadvisers”), an affiliate of the Manager and the Subadviser, with respect to the Fund.
Background
The Board received information in advance of the meeting from the Manager to assist it in its consideration of the Management Agreement and the Sub-Advisory Agreements and was given the opportunity to ask questions and request additional information from management. In addition, the Independent Trustees submitted questions to management before the meeting and considered the responses provided. The Board received and considered a variety of information about the Manager and the Subadvisers, as well as the management and sub-advisory arrangements for the Fund and other funds overseen by the Board, certain portions of which are discussed below. The information provided and presentations made to the Board encompassed the Fund and all funds for which the Board has responsibility. The discussion below covers both the advisory and the administrative functions being rendered by the Manager, both of which functions are encompassed by the Management Agreement, as well as the advisory functions rendered by the Subadvisers pursuant to the Sub-Advisory Agreements.
Board approval of management agreement and sub-advisory agreements
The Independent Trustees were advised by separate independent legal counsel throughout the process. Prior to voting, the Independent Trustees received a memorandum from their independent legal counsel discussing the legal standards for their consideration of the proposed continuation of the Management Agreement and the Sub-Advisory Agreements. The Independent Trustees also reviewed the proposed continuation of the Management Agreement and the Sub-Advisory Agreements in private sessions with their independent legal counsel at which no representatives of the Manager or Subadvisers were present. The Independent Trustees considered the Management Agreement and each Sub-Advisory Agreement separately in the course of their review. In doing so, they noted the respective roles of the Manager and the Subadvisers in providing services to the Fund.
| | |
| Western Asset Variable Global High Yield Bond Portfolio | | 57 |
Board approval of management and subadvisory agreements (unaudited) (cont’d)
In approving the Management Agreement and Sub-Advisory Agreements, the Board, including the Independent Trustees, considered a variety of factors, including those factors discussed below. No single factor reviewed by the Board was identified by the Board as the principal factor in determining whether to approve the Management Agreement and the Sub-Advisory Agreements. Each Trustee may have attributed different weight to the various factors in evaluating the Management Agreement and each Sub-Advisory Agreement.
Nature, extent and quality of the services under the management agreement and sub-advisory agreements
The Board received and considered information regarding the nature, extent and quality of services provided to the Fund by the Manager and the Subadvisers under the Management Agreement and the Sub-Advisory Agreements, respectively, during the past year. The Board noted information received at regular meetings throughout the year related to the services rendered by the Manager in its management of the Fund’s affairs and the Manager’s role in coordinating the activities of the Fund’s other service providers. The Board’s evaluation of the services provided by the Manager and the Subadvisers took into account the Board’s knowledge gained as Trustees of funds in the Legg Mason fund complex, including the scope and quality of the investment management and other capabilities of the Manager and the Subadvisers, and the quality of the Manager’s administrative and other services. The Board observed that the scope of services provided by the Manager and the Subadvisers had expanded over time as a result of regulatory, market and other developments, including maintaining and monitoring their own and the Fund’s compliance programs. The Board also noted that on a regular basis it received and reviewed information from the Manager and the Subadvisers regarding the Fund’s compliance policies and procedures established pursuant to Rule 38a-1 under the 1940 Act. The Board also considered the Manager’s and each Subadviser’s risk management processes.
The Board reviewed the qualifications, backgrounds and responsibilities of the Manager’s and each Subadviser’s senior personnel and the team of investment professionals primarily responsible for the day-to-day portfolio management of the Fund. The Board also considered, based on its knowledge of the Manager and its affiliates, the financial resources of Legg Mason, Inc., the parent organization of the Manager and the Subadvisers.
The Board considered the division of responsibilities between the Manager and the Subadvisers and the oversight provided by the Manager. The Board also considered the Manager’s and the Subadvisers’ policies and practices regarding the selection of brokers and dealers and the execution of portfolio transactions. In addition, management also reported to the Board on, among other things, its business plans and organizational changes.
The Board received and considered performance information for the Fund as well as for a group of funds (the “Performance Universe”) selected by Lipper, Inc. (“Lipper”), an independent provider of investment company data. The Board was provided with a description of the methodology Lipper used to determine the similarity of the Fund with the funds
| | |
| 58 | | Western Asset Variable Global High Yield Bond Portfolio |
included in the Performance Universe. The Board also noted that it had received and discussed with management information throughout the year at periodic intervals comparing the Fund’s performance against its benchmark and against the Fund’s peers. In addition, the Board considered the Fund’s performance in light of overall financial market conditions.
The information comparing the Fund’s performance to that of its Performance Universe, consisting of all funds classified by Lipper as high yield funds underlying variable insurance products, showed, among other data, that the Fund’s performance was above the median for the 1-, 3- and 5-year periods ended June 30, 2013 and that its performance was below the median for the 10-year period ended June 30, 2013. The Board noted the explanations from the Manager and the Subadvisers concerning the Fund’s relative performance versus the peer group for the various periods.
The Board concluded that, overall, the nature, extent and quality of services provided (and expected to be provided), including performance, under the Management Agreement and the Sub-Advisory Agreements were sufficient for renewal.
Management fees and expense ratios
The Board reviewed and considered the contractual management fee (the “Contractual Management Fee”) and the actual management fees paid by the Fund to the Manager (the “Actual Management Fee”) in light of the nature, extent and quality of the management and sub-advisory services provided by the Manager and the Subadvisers. The Board also noted that the compensation paid to the Subadvisers is paid by the Manager, not the Fund.
In addition, the Board received and considered information comparing the Contractual Management Fee and the Actual Management Fee and the Fund’s total actual expenses with those of funds in both the relevant expense group and a broader group of funds, each selected and provided by Lipper. The Board also reviewed information regarding fees charged by the Manager to other U.S. clients investing primarily in an asset class similar to that of the Fund, including, where applicable, separate accounts.
The Manager reviewed with the Board the differences in the services provided to these different types of accounts, noting that the Fund is provided with certain administrative services, office facilities, and Fund officers (including the Fund’s chief executive, chief financial and chief compliance officers), and that the Manager coordinates and oversees the provision of services to the Fund by other Fund service providers. The Board considered the fee comparisons in light of the differences in management of these different types of accounts.
The Board considered the overall management fee, Subadvisers’ fees and the amount of the management fee retained by the Manager after payment of the subadvisory fees in each case in light of the services rendered for those amounts. The Board also received an analysis of complex-wide management fees provided by the Manager, which, among other things, set out a framework of fees based on asset classes.
The information comparing the Fund’s Contractual and Actual Management Fees as well as its actual total expense ratio to its expense group, consisting of a group of funds (including
| | |
| Western Asset Variable Global High Yield Bond Portfolio | | 59 |
Board approval of management and subadvisory agreements (unaudited) (cont’d)
the Fund) classified as high yield funds underlying variable insurance products and chosen by Lipper to be comparable to the Fund, showed that the Fund’s Contractual Management Fee and Actual Management Fee were above the median. The Board noted that the Fund’s actual total expense ratio was above the median. The Board took into account management’s discussion of the Fund’s expenses. The Board considered that the Fund’s Contractual Management Fee was reduced in August 2012 and noted that this lower fee was not fully reflected in the Lipper comparisons. The Board also considered that the current limitation on the Fund’s expenses is expected to continue through December 2015.
Taking all of the above into consideration, as well as the factors identified below, the Board determined that the management fee and the subadvisory fees for the Fund were reasonable in light of the nature, extent and quality of the services provided to the Fund under the Management Agreement and the Sub-Advisory Agreements.
Manager profitability
The Board received and considered an analysis of the profitability of the Manager and its affiliates in providing services to the Fund. The Board also received profitability information with respect to the Legg Mason fund complex as a whole. In addition, the Board received information with respect to the Manager’s allocation methodologies used in preparing this profitability data. It was noted that the allocation methodologies had been reviewed previously by an outside consultant. The profitability of the Manager and its affiliates was considered by the Board not excessive in light of the nature, extent and quality of the services provided to the Fund and the type of fund it represented.
Economies of scale
The Board received and discussed information concerning whether the Manager realizes economies of scale as the Fund’s assets grow. The Board noted that the Fund’s Contractual Management Fee, which was reduced in August 2012, does not currently have breakpoints in place.
The Board determined that the management fee structure for the Fund was reasonable.
Other benefits to the manager and the subadvisers
The Board considered other benefits received by the Manager, the Subadvisers and their affiliates as a result of their relationship with the Fund, including the opportunity to offer additional products and services to Fund shareholders.
In light of the costs of providing investment management and other services to the Fund and the ongoing commitment of the Manager and the Subadvisers to the Fund, the Board considered that the ancillary benefits that the Manager and its affiliates received were reasonable.
* * *
In light of all of the foregoing, the Board determined that the continuation of each of the Management Agreement and Sub-Advisory Agreements would be in the best interests of the Fund’s shareholders and approved the continuation of such agreements for another year.
| | |
| 60 | | Western Asset Variable Global High Yield Bond Portfolio |
Additional information (unaudited)
Information about Trustees and Officers
The business and affairs of Western Asset Variable Global High Yield Bond Portfolio (the “Portfolio”) are conducted by management under the supervision and subject to the direction of its Board of Trustees. The business address of each Trustee is c/o Kenneth D. Fuller, Legg Mason, 100 International Drive, 11th Floor, Baltimore, Maryland 21202. Information pertaining to the Trustees and officers of the Portfolio is set forth below.
The Statement of Additional Information includes additional information about Trustees and is available, without charge, upon request by calling the Portfolio at 1-877-721-1926.
| | |
| Independent Trustees†: | | |
| Elliott J. Berv | | |
| Year of birth | | 1943 |
| Position(s) with Trust | | Trustee |
| Term of office1 and length of time served2 | | Since 1989 |
| Principal occupation(s) during past five years | | President and Chief Executive Officer, Catalyst (consulting) (since 1984); formerly, Chief Executive Officer, Rocket City Enterprises (media) (2000 to 2005) |
| Number of funds in fund complex overseen by Trustee | | 54 |
| Other board memberships held by Trustee during past 5 years | | World Affairs Council (since 2009); Board Member, American Identity Corp. (doing business as Morpheus Technologies) (biometric information management) (since 2001); formerly, Director, Lapoint Industries (industrial filter company) (2002 to 2007); formerly, Director, Alzheimer’s Association (New England Chapter) (1998 to 2008) |
| |
| Jane F. Dasher | | |
| Year of birth | | 1949 |
| Position(s) with Trust | | Trustee |
| Term of office1 and length of time served2 | | Since 1999 |
| Principal occupation(s) during past five years | | Chief Financial Officer, Long Light Capital, LLC, formerly known as Korsant Partners, LLC (a family investment company) (since 1997) |
| Number of funds in fund complex overseen by Trustee | | 54 |
| Other board memberships held by Trustee during past five years | | None |
| |
| Mark T. Finn | | |
| Year of birth | | 1943 |
| Position(s) with Trust | | Trustee |
| Term of office1 and length of time served2 | | Since 1989 |
| Principal occupation(s) during past five years | | Adjunct Professor, College of William & Mary (since 2002); Chairman, Chief Executive Officer and Owner, Vantage Consulting Group, Inc. (investment management) (since 1988); Principal/Member, Balvan Partners (investment management) (2002 to 2009) |
| Number of funds in fund complex overseen by Trustee | | 54 |
| Other board memberships held by Trustee during past five years | | None |
| | |
| Western Asset Variable Global High Yield Bond Portfolio | | 61 |
Additional information (unaudited) (cont’d)
Information about Trustees and Officers
| | |
| Independent Trustees cont’d | | |
| Stephen R. Gross | | |
| Year of birth | | 1947 |
| Position(s) with Trust | | Trustee |
| Term of office1 and length of time served2 | | Since 1986 |
| Principal occupation(s) during past five years | | Chairman Emeritus (since 2011) and formerly Chairman, HLB Gross Collins, P.C. (accounting and consulting firm) (1974 to 2011); Executive Director of Business Builders Team, LLC (since 2005); Principal, Gross Consulting Group, LLC (since 2011); CEO, Gross Capital Advisors, LLC (since 2011); CEO, Trusted CFO Solutions, LLC (since 2011) |
| Number of funds in fund complex overseen by Trustee | | 54 |
| Other board memberships held by Trustee during past five years | | None |
| |
| Richard E. Hanson, Jr. | | |
| Year of birth | | 1941 |
| Position(s) with Trust | | Trustee |
| Term of office1 and length of time served2 | | Since 1985 |
| Principal occupation(s) during past five years | | Retired; formerly Headmaster, The New Atlanta Jewish Community High School, Atlanta, Georgia (1996 to 2000) |
| Number of funds in fund complex overseen by Trustee | | 54 |
| Other board memberships held by Trustee during past five years | | None |
| |
| Diana R. Harrington | | |
| Year of birth | | 1940 |
| Position(s) with Trust | | Trustee and Chair |
| Term of office1 and length of time served2 | | Since 1992 and since 2013 |
| Principal occupation(s) during past five years | | Babson Distinguished Professor of Finance, Babson College (since 1992) |
| Number of funds in fund complex overseen by Trustee | | 54 |
| Other board memberships held by Trustee during past five years | | None |
| |
| Susan M. Heilbron | | |
| Year of birth | | 1945 |
| Position(s) with Trust | | Trustee |
| Term of office1 and length of time served2 | | Since 1994 |
| Principal occupation(s) during past five years | | Retired; formerly, President, Lacey & Heilbron (communications consulting) (1990 to 2002); formerly, General Counsel and Executive Vice President, The Trump Organization (1986 to 1990); formerly, Senior Vice President, New York State Urban Development Corporation (1984 to 1986); formerly, Associate, Cravath, Swaine & Moore (1980 to 1984) and (1977 to 1979) |
| Number of funds in fund complex overseen by Trustee | | 54 |
| Other board memberships held by Trustee during past five years | | Formerly, Director, Lincoln Savings Bank, FSB (1991 to 1994); formerly, Director, Trump Shuttle, Inc. (air transportation) (1989 to 1990); formerly, Director, Alexander’s Inc. (department store) (1987 to 1990) |
| | |
| 62 | | Western Asset Variable Global High Yield Bond Portfolio |
| | |
| Independent Trustees cont’d | | |
| Susan B. Kerley | | |
| Year of birth | | 1951 |
| Position(s) with Trust | | Trustee |
| Term of office1 and length of time served2 | | Since 1992 |
| Principal occupation(s) during past five years | | Investment Consulting Partner, Strategic Management Advisors, LLC (investment consulting) (since 1990) |
| Number of funds in fund complex overseen by Trustee | | 54 |
| Other board memberships held by Trustee during past five years | | Director and Trustee (since 1990) and formerly, Chairman (2005 to 2012) of various series of MainStay Family of Funds (66 funds); Investment Company Institute (ICI) Board of Governors (since 2006); ICI Executive Committee (since 2011); Chairman of the Independent Directors Council (since 2012) |
| |
| Alan G. Merten | | |
| Year of birth | | 1941 |
| Position(s) with Trust | | Trustee |
| Term of office1 and length of time served2 | | Since 1990 |
| Principal occupation(s) during past five years | | President Emeritus (since 2012) and formerly, President, George Mason University (1996 to 2012) |
| Number of funds in fund complex overseen by Trustee | | 54 |
| Other board memberships held by Trustee during past five years | | Director Emeritus, Cardinal Financial Corporation (since 2006); Trustee, First Potomac Realty Trust (since 2005); Director, DeVry Inc. (educational services) (since 2012); formerly, Director, Xybernaut Corporation (information technology) (2004 to 2006); formerly, Director, Digital Net Holdings, Inc. (2003 to 2004); formerly, Director, Comshare, Inc. (information technology) (1985 to 2003) |
| |
| R. Richardson Pettit | | |
| Year of birth | | 1942 |
| Position(s) with Trust | | Trustee |
| Term of office1 and length of time served2 | | Since 1990 |
| Principal occupation(s) during past five years | | Retired; formerly, Duncan Professor of Finance, University of Houston (1977 to 2006); previous academic or management positions include: University of Washington, University of Pennsylvania and Purdue University |
| Number of funds in fund complex overseen by Trustee | | 54 |
| Other board memberships held by Trustee during past five years | | None |
| | |
| | |
| Western Asset Variable Global High Yield Bond Portfolio | | 63 |
Additional information (unaudited) (cont’d)
Information about Trustees and Officers
| | |
| Interested Trustee and Officer: |
| Kenneth D. Fuller3 | | |
| Year of birth | | 1958 |
| Position(s) with Trust | | Trustee, President, and Chief Executive Officer |
| Term of office1 and length of time served2 | | Since 2013 |
| Principal occupation(s) during past five years | | Managing Director of Legg Mason & Co., LLC (“Legg Mason & Co.”) (since 2013); Officer and/or Trustee/Director of 167 funds associated with Legg Mason Fund Advisor, LLC (“LMPFA”) or its affiliates (since 2013); President and Chief Executive Officer of LMPFA (since 2013); President and Chief Executive Officer of LM Asset Services, LLC (“LMAS”) and Legg Mason Fund Asset Management Inc. (“LMFAM”) (formerly registered investment advisers) (since 2013); formerly, Senior Vice President of LMPFA (2012 to 2013); formerly, Director of Legg Mason & Co. (2012 to 2013); formerly, Vice President of Legg Mason & Co. (2009 to 2012); formerly, Vice President — Equity Division of T. Rowe Price Associates (1993 to 2009), as well as Investment Analyst and Portfolio Manager for certain asset allocation accounts (2004 to 2009). |
| Number of funds in fund complex overseen by Trustee | | 155 |
| Other board memberships held by Trustee during past five years | | None |
| | |
| Additional Officers: |
Ted P. Becker Legg Mason 620 Eighth Avenue, 49th Floor, New York, NY 10018 | | |
| Year of birth | | 1951 |
| Position(s) with Trust | | Chief Compliance Officer |
| Term of office1 and length of time served2 | | Since 2007 |
| Principal occupation(s) during past five years | | Director of Global Compliance at Legg Mason (since 2006); Chief Compliance Officer of LMPFA (since 2006); Managing Director of Compliance of Legg Mason & Co. (since 2005); Chief Compliance Officer of certain mutual funds associated with Legg Mason & Co. or its affiliates (since 2006) |
| | |
| 64 | | Western Asset Variable Global High Yield Bond Portfolio |
| | |
| Additional Officers cont’d |
Susan Kerr Legg Mason 620 Eighth Avenue, 49th Floor, New York, NY 10018 | | |
| Year of birth | | 1949 |
| Position(s) with Trust | | Chief Anti-Money Laundering Compliance Officer |
| Term of office1 and length of time served2 | | Since 2013 |
| Principal occupation(s) during past five years | | Assistant Vice President of Legg Mason & Co. and Legg Mason Investor Services, LLC (“LMIS”) (since 2010); Chief Anti-Money Laundering Compliance Officer of certain mutual funds associated with Legg Mason & Co. or its affiliates (since 2013) and Anti-Money Laundering Compliance Officer of LMIS (since 2012); Senior Compliance Officer of LMIS (since 2011); formerly, AML Consultant, DTCC (2010); formerly, AML Consultant, Rabobank Netherlands, (2009); formerly, First Vice President, Director of Marketing & Advertising Compliance and Manager of Communications Review Group at Citigroup Inc. (1996 to 2008) |
| |
Vanessa A. Williams Legg Mason 100 First Stamford Place, 6th Floor, Stamford, CT 06902 | | |
| Year of birth | | 1979 |
| Position(s) with Trust | | Identity Theft Prevention Officer |
| Term of office1 and length of time served2 | | Since 2011 |
| Principal occupation(s) during past five years | | Vice President of Legg Mason & Co. (since 2012); Identity Theft Prevention Officer of certain mutual funds associated with Legg Mason & Co. or its affiliates (since 2011); formerly, Chief Anti-Money Laundering Compliance Officer of certain mutual funds associated with Legg Mason & Co. or its affiliates (2011 to 2013); formerly, Senior Compliance Officer of Legg Mason & Co. (2008 to 2011); formerly, Compliance Analyst of Legg Mason & Co. (2006 to 2008) and Legg Mason & Co. predecessors (prior to 2006) |
| |
Robert I. Frenkel Legg Mason 100 First Stamford Place, 6th Floor, Stamford, CT 06902 | | |
| Year of birth | | 1954 |
| Position(s) with Trust | | Secretary and Chief Legal Officer |
| Term of office1 and length of time served2 | | Since 2007 |
| Principal occupation(s) during past five years | | Vice President and Deputy General Counsel of Legg Mason (since 2006); Managing Director and General Counsel of Global Mutual Funds for Legg Mason & Co. (since 2006) and Legg Mason & Co. predecessors (since 1994); Secretary and Chief Legal Officer of certain mutual funds associated with Legg Mason & Co. or its affiliates (since 2006) and Legg Mason & Co. predecessors (prior to 2006) |
| | |
| Western Asset Variable Global High Yield Bond Portfolio | | 65 |
Additional information (unaudited) (cont’d)
Information about Trustees and Officers
| | |
| Additional Officers cont’d |
Thomas C. Mandia Legg Mason 100 First Stamford Place, 6th Floor, Stamford, CT 06902 | | |
| Year of birth | | 1962 |
| Position(s) with Trust | | Assistant Secretary |
| Term of office1 and length of time served2 | | Since 2007 |
| Principal occupation(s) during past five years | | Managing Director and Deputy General Counsel of Legg Mason & Co. (since 2005) and Legg Mason & Co. predecessors (prior to 2005); Secretary of LMPFA (since 2006); Assistant Secretary of certain mutual funds associated with Legg Mason & Co. or its affiliates (since 2006) and Legg Mason & Co. predecessors (prior to 2006); Secretary to LMAS (since 2002) and LMFAM (since 2013) |
| |
Richard F. Sennett Legg Mason 100 International Drive, 7th Floor, Baltimore, MD 21202 | | |
| Year of birth | | 1970 |
| Position(s) with Trust | | Principal Financial Officer |
| Term of office1 and length of time served2 | | Since 2011 |
| Principal occupation(s) during past five years | | Principal Financial Officer and Treasurer of certain mutual funds associated with Legg Mason & Co. or its affiliates (since 2011 and since 2013); Managing Director of Legg Mason & Co. and Senior Manager of the Treasury Policy group for Legg Mason & Co.’s Global Fiduciary Platform (since 2011); formerly, Chief Accountant within the SEC’s Division of Investment Management (2007 to 2011); formerly, Assistant Chief Accountant within the SEC’s Division of Investment Management (2002 to 2007) |
| |
James Crowley
Legg Mason 620 Eighth Avenue, 49th Floor, New York, NY 10018 | | |
| Year of birth | | 1966 |
| Position(s) with Trust | | Treasurer |
| Term of office1 and length of time served2 | | Since 2011 |
| Principal occupation(s) during past five years | | Vice President of Legg Mason & Co. (since 2010); Treasurer of certain mutual funds associated with Legg Mason & Co. or its affiliates (since 2011); formerly, Controller of certain mutual funds associated with Legg Mason & Co. or its affiliates (prior to 2011); formerly, Controller of Security Fair Valuation and Project Management for Legg Mason & Co. or its affiliates (prior to 2010) |
| | |
| 66 | | Western Asset Variable Global High Yield Bond Portfolio |
| | |
| Additional Officers cont’d |
Jeanne M. Kelly Legg Mason 620 Eighth Avenue, 49th Floor, New York, NY 10018 | | |
| Year of birth | | 1951 |
| Position(s) with Trust | | Senior Vice President |
| Term of office1 and length of time served2 | | Since 2007 |
| Principal occupation(s) during past five years | | Senior Vice President of certain mutual funds associated with Legg Mason & Co. or its affiliates (since 2007); Senior Vice President of LMPFA (since 2006) and LMFAM (since 2013); Managing Director of Legg Mason & Co. (since 2005) and Legg Mason & Co. predecessors (prior to 2005) |
| † | Trustees who are not “interested persons” of the Fund within the meaning of section 2(a)(19) of the 1940 Act. |
| 1 | Each Trustee and officer serves until his or her respective successor has been duly elected and qualified or until his or her earlier death, resignation, retirement or removal. |
| 2 | Indicates the earliest year in which the Trustee became a board member for a fund in the Legg Mason fund complex or the officer took such office. |
| 3 | Effective June 1, 2013, Mr. Fuller was appointed to the position of President and Chief Executive Officer. Prior to this date, R. Jay Gerken served as Chairman, President and Chief Executive Officer. Mr. Gerken retired effective May 31, 2013. Mr. Fuller is an “interested person” of the Fund, as defined in the 1940 Act, because of his position with LMPFA and/or certain of its affiliates. |
| | |
| Western Asset Variable Global High Yield Bond Portfolio | | 67 |
Western Asset
Variable Global High Yield Bond Portfolio
Trustees
Elliott J. Berv
Jane F. Dasher
Mark T. Finn
Kenneth D. Fuller*
President
Stephen R. Gross
Richard E. Hanson, Jr.
Diana R. Harrington*
Chair
Susan M. Heilbron
Susan B. Kerley
Alan G. Merten
R. Richardson Pettit
Investment manager
Legg Mason Partners Fund Advisor, LLC
Subadvisers
Western Asset Management Company
Western Asset Management Company Limited
Western Asset Management Company Pte. Ltd.
Distributor
Legg Mason Investor Services, LLC
Custodian
State Street Bank and Trust Company
Transfer agent
Boston Financial Data Services, Inc.
2000 Crown Colony Drive
Quincy, MA 02169
Independent registered public accounting firm
KPMG LLP
345 Park Avenue
New York, NY 10154
| * | Effective June 1, 2013, Dr. Harrington became Chair and Mr. Fuller became a Trustee, President and Chief Executive Officer. |
Western Asset Variable Global High Yield Bond Portfolio
The Portfolio is a separate investment series of Legg Mason Partners Variable Income Trust, a Maryland statutory trust.
Western Asset Variable Global High Yield Bond Portfolio
Legg Mason Funds
620 Eighth Avenue, 49th Floor
New York, NY 10018
The Portfolio files its complete schedule of portfolio holdings with the Securities and Exchange Commission (“SEC”) for the first and third quarters of each fiscal year on Form N-Q. The Portfolio’s Forms N-Q are available on the SEC’s website at www.sec.gov. The Portfolio’s Forms N-Q may be reviewed and copied at the SEC’s Public Reference Room in Washington, D.C., and information on the operation of the Public Reference Room may be obtained by calling 1-800-SEC-0330. To obtain information on Form N-Q, shareholders can call the Portfolio at 1-877-721-1926.
Information on how the Portfolio voted proxies relating to portfolio securities during the prior 12-month period ended June 30th of each year and a description of the policies and procedures that the Portfolio uses to determine how to vote proxies related to portfolio transactions are available (1) without charge, upon request, by calling the Portfolio at 1-877-721-1926, (2) on the Portfolio’s website at www.leggmason.com/
individualinvestors and (3) on the SEC’s website at www.sec.gov.
This report is submitted for the general information of the shareholders of Western Asset Variable Global High Yield Bond Portfolio. This report is not authorized for distribution to prospective investors in the Portfolio unless preceded or accompanied by a current prospectus.
Investors should consider the Portfolio’s investment objectives, risks, charges and expenses carefully before investing. The prospectus contains this and other important information about the Portfolio. Please read the prospectus carefully before investing.
www.leggmason.com/individualinvestors
© 2014 Legg Mason Investor Services, LLC
Member FINRA, SIPC
Legg Mason Funds Privacy and Security Notice
Your Privacy and the Security of Your Personal Information is Very Important to the Legg Mason Funds
This Privacy and Security Notice (the “Privacy Notice”) addresses the Legg Mason Funds’ privacy and data protection practices with respect to nonpublic personal information the Funds receive. The Legg Mason Funds include any funds sold by the Funds’ distributor, Legg Mason Investor Services, LLC, as well as Legg Mason-sponsored closed-end funds and certain closed-end funds managed or sub-advised by Legg Mason or its affiliates. The provisions of this Privacy Notice apply to your information both while you are a shareholder and after you are no longer invested with the Funds.
The Type of Nonpublic Personal Information the Funds Collect About You
The Funds collect and maintain nonpublic personal information about you in connection with your shareholder account. Such information may include, but is not limited to:
| Ÿ | | Personal information included on applications or other forms; |
| Ÿ | | Account balances, transactions, and mutual fund holdings and positions; |
| Ÿ | | Online account access user IDs, passwords, security challenge question responses; and |
| Ÿ | | Information received from consumer reporting agencies regarding credit history and creditworthiness (such as the amount of an individual’s total debt, payment history, etc.). |
How the Funds Use Nonpublic Personal Information About You
The Funds do not sell or share your nonpublic personal information with third parties or with affiliates for their marketing purposes, or with other financial institutions or affiliates for joint marketing purposes, unless you have authorized the Funds to do so. The Funds do not disclose any nonpublic personal information about you except as may be required to perform transactions or services you have authorized or as permitted or required by law. The Funds may disclose information about you to:
| Ÿ | | Employees, agents, and affiliates on a “need to know” basis to enable the Funds to conduct ordinary business or comply with obligations to government regulators; |
| Ÿ | | Service providers, including the Funds’ affiliates, who assist the Funds as part of the ordinary course of business (such as printing, mailing services, or processing or servicing your account with us) or otherwise perform services on the Funds’ behalf, including companies that may perform marketing services solely for the Funds; |
| Ÿ | | The Funds’ representatives such as legal counsel, accountants and auditors; and |
| Ÿ | | Fiduciaries or representatives acting on your behalf, such as an IRA custodian or trustee of a grantor trust. |
|
| NOT PART OF THE ANNUAL REPORT |
Legg Mason Funds Privacy and Security Notice (cont’d)
Except as otherwise permitted by applicable law, companies acting on the Funds’ behalf are contractually obligated to keep nonpublic personal information the Funds provide to them confidential and to use the information the Funds share only to provide the services the Funds ask them to perform.
The Funds may disclose nonpublic personal information about you when necessary to enforce their rights or protect against fraud, or as permitted or required by applicable law, such as in connection with a law enforcement or regulatory request, subpoena, or similar legal process. In the event of a corporate action or in the event a Fund service provider changes, the Funds may be required to disclose your nonpublic personal information to third parties. While it is the Funds’ practice to obtain protections for disclosed information in these types of transactions, the Funds cannot guarantee their privacy policy will remain unchanged.
Keeping You Informed of the Funds’ Privacy and Security Practices
The Funds will notify you annually of their privacy policy as required by federal law. While the Funds reserve the right to modify this policy at any time they will notify you promptly if this privacy policy changes.
The Funds’ Security Practices
The Funds maintain appropriate physical, electronic and procedural safeguards designed to guard your nonpublic personal information. The Funds’ internal data security policies restrict access to your nonpublic personal information to authorized employees, who may use your nonpublic personal information for Fund business purposes only.
Although the Funds strive to protect your nonpublic personal information, they cannot ensure or warrant the security of any information you provide or transmit to them, and you do so at your own risk. In the event of a breach of the confidentiality or security of your nonpublic personal information, the Funds will attempt to notify you as necessary so you can take appropriate protective steps. If you have consented to the Funds using electronic communications or electronic delivery of statements, they may notify you under such circumstances using the most current email address you have on record with them.
In order for the Funds to provide effective service to you, keeping your account information accurate is very important. If you believe that your account information is incomplete, not accurate or not current, or if you have questions about the Funds’ privacy practices, write the Funds using the contact information on your account statements, email the Funds by clicking on the Contact Us section of the Funds’ website at www.leggmason.com, or contact the Fund at 1-877-721-1926.
Revised April 2011
|
| NOT PART OF THE ANNUAL REPORT |
www.leggmason.com/individualinvestors
©2014 Legg Mason Investor Services, LLC
FD04117 2/14 SR14-2124
The registrant has adopted a code of ethics that applies to the registrant’s principal executive officer, principal financial officer, principal accounting officer or controller.
| ITEM 3. | AUDIT COMMITTEE FINANCIAL EXPERT. |
The Board of Trustees of the registrant has determined that Stephen R. Gross and Jane F. Dasher possess the technical attributes identified in Instruction 2(b) of Item 3 to Form N-CSR to qualify as “audit committee financial experts,” and have designated Mr. Gross and Ms. Dasher as the Audit Committee’s financial experts. Mr. Gross and Ms. Dasher are “independent” Trustees pursuant to paragraph (a) (2) of Item 3 to Form N-CSR.
| ITEM 4. | PRINCIPAL ACCOUNTANT FEES AND SERVICES. |
| | a) | Audit Fees. The aggregate fees billed in the last two fiscal years ending December 31, 2012 and December 31, 2013 (the “Reporting Periods”) for professional services rendered by the Registrant’s principal accountant (the “Auditor”) for the audit of the Registrant’s annual financial statements, or services that are normally provided by the Auditor in connection with the statutory and regulatory filings or engagements for the Reporting Periods, were $99,000 in December 31, 2012 and $111,486 in December 31, 2013. |
| | b) | Audit-Related Fees. The aggregate fees billed in the Reporting Period for assurance and related services by the Auditor that are reasonably related to the performance of the Registrant’s financial statements were $0 in December 31, 2012 and $0 in December 31, 2013. |
In addition, there were no Audit-Related Fees billed in the Reporting Period for assurance and related services by the Auditor to the Registrant’s investment adviser (not including any sub-adviser whose role is primarily portfolio management and is subcontracted with or overseen by another investment adviser), and any entity controlling, controlled by or under common control with the investment adviser that provides ongoing services to the Legg Mason Partners Variable Income Trust (“service affiliates”), that were reasonably related to the performance of the annual audit of the service affiliates. Accordingly, there were no such fees that required pre-approval by the Audit Committee for the Reporting Periods.
| | (c) | Tax Fees. The aggregate fees billed in the Reporting Periods for professional services rendered by the Auditor for tax compliance, tax advice and tax planning (“Tax Services”) were $10,600, in December 31, 2012 and $12,100 in December 31, 2013. These services consisted of (i) review or preparation of U.S. federal, state, local and excise tax returns; (ii) U.S. federal, state and local tax planning, advice and assistance regarding statutory, regulatory or administrative developments, and (iii) tax advice regarding tax qualification matters and/or treatment of various financial instruments held or proposed to be acquired or held. |
There were no fees billed for tax services by the Auditors to service affiliates during the Reporting Periods that required pre-approval by the Audit Committee.
| | d) | All Other Fees. There were no other fees billed in the Reporting Periods for products and services provided by the Auditor, other than the services reported in paragraphs (a) through (c) of this Item for the Legg Mason Partners Variable Income Trust. |
All Other Fees. There were no other non-audit services rendered by the Auditor to Legg Mason Partners Fund Advisors, LLC (“LMPFA”), and any entity controlling, controlled by or under common control with LMPFA that provided ongoing services to Legg Mason Partners Variable Income Trust requiring pre-approval by the Audit Committee in the Reporting Period.
| | (e) | Audit Committee’s pre–approval policies and procedures described in paragraph (c) (7) of Rule 2-01 of Regulation S-X. |
| | (1) | The Charter for the Audit Committee (the “Committee”) of the Board of each registered investment company (the “Fund”) advised by LMPFA or one of their affiliates (each, an “Adviser”) requires that the Committee shall approve (a) all audit and permissible non-audit services to be provided to the Fund and (b) all permissible non-audit services to be provided by the Fund’s independent auditors to the Adviser and any Covered Service Providers if the engagement relates directly to the operations and financial reporting of the Fund. The Committee may implement policies and procedures by which such services are approved other than by the full Committee. |
The Committee shall not approve non-audit services that the Committee believes may impair the independence of the auditors. As of the date of the approval of this Audit Committee Charter, permissible non-audit services include any professional services (including tax services), that are not prohibited services as described below, provided to the Fund by the independent auditors, other than those provided to the Fund in connection with an audit or a review of the financial statements of the Fund. Permissible non-audit services may not include: (i) bookkeeping or other services related to the accounting records or financial statements of the Fund; (ii) financial information systems design and implementation; (iii) appraisal or valuation services, fairness opinions or contribution-in-kind reports; (iv) actuarial services; (v) internal audit outsourcing services; (vi) management functions or human resources; (vii) broker or dealer, investment adviser or investment banking services; (viii) legal services and expert services unrelated to the audit; and (ix) any other service the Public Company Accounting Oversight Board determines, by regulation, is impermissible.
Pre-approval by the Committee of any permissible non-audit services is not required so long as: (i) the aggregate amount of all such permissible non-audit services provided to the Fund, the Adviser and any service providers controlling, controlled by or under common control with the Adviser that provide ongoing services to the Fund (“Covered Service Providers”) constitutes not more than 5% of the total amount of revenues paid to the independent auditors during the fiscal year in which the permissible non-audit services are provided to (a) the Fund, (b) the Adviser and (c) any entity controlling, controlled by or under common control with the Adviser that provides ongoing services to the Fund during the fiscal year in which the services are provided that would have to be approved by the Committee; (ii) the permissible non-audit services were not recognized by the Fund at the time of the engagement to be non-audit services; and (iii) such services are promptly brought to the attention of the Committee and approved by the Committee (or its delegate(s)) prior to the completion of the audit.
| | (2) | For the Legg Mason Partners Variable Income Trust, the percentage of fees that were approved by the audit committee, with respect to: Audit-Related Fees were 100% and 100% for December 31, 2012 and December 31, 2013; Tax Fees were 100% and 100% for December 31, 2012 and December 31, 2013; and Other Fees were 100% and 100% for December 31, 2012 and $0 for December 31, 2013. |
| | (g) | Non-audit fees billed by the Auditor for services rendered to Legg Mason Partners Variable Income Trust, LMPFA and any entity controlling, controlled by, or under common control with LMPFA that provides ongoing services to Legg Mason Partners Variable Income Trust during the reporting period were $0 in December 31, 2013. |
| | (h) | Yes. Legg Mason Partners Variable Income Trust’s Audit Committee has considered whether the provision of non-audit services that were rendered to Service Affiliates, which were not pre-approved (not requiring pre-approval), is compatible with maintaining the Accountant’s independence. All services provided by the Auditor to the Legg Mason Partners Variable Income Trust or to Service Affiliates, which were required to be pre-approved, were pre-approved as required. |
| ITEM 5. | AUDIT COMMITTEE OF LISTED REGISTRANTS. |
| | a) | The independent board members are acting as the registrant’s audit committee as specified in Section 3(a)(58)(B) of the Exchange Act. The Audit Committee consists of the following Board members: |
Elliott J. Berv
Jane F. Dasher
Mark T. Finn
Stephen R. Gross
Richard E. Hanson, Jr.
Diana R. Harrington
Susan M. Heilbron
Susan B. Kerley
Alan G. Merten
R. Richardson Pettit
| ITEM 6. | SCHEDULE OF INVESTMENTS. |
Included herein under Item 1.
| ITEM 7. | DISCLOSURE OF PROXY VOTING POLICIES AND PROCEDURES FOR CLOSED-END MANAGEMENT INVESTMENT COMPANIES. |
Not applicable.
| ITEM 8. | PORTFOLIO MANAGERS OF CLOSED-END MANAGEMENT INVESTMENT COMPANIES. |
Not applicable.
| ITEM 9. | PURCHASES OF EQUITY SECURITIES BY CLOSED-END MANAGEMENT INVESTMENT COMPANY AND AFFILIATED PURCHASERS. |
Not applicable.
| ITEM 10. | SUBMISSION OF MATTERS TO A VOTE OF SECURITY HOLDERS. |
Not applicable.
| ITEM 11. | CONTROLS AND PROCEDURES. |
| | (a) | The registrant’s principal executive officer and principal financial officer have concluded that the registrant’s disclosure controls and procedures (as defined in Rule 30a- 3(c) under the Investment Company Act of 1940, as amended (the “1940 Act”)) are effective as of a date within 90 days of the filing date of this report that includes the disclosure required by this paragraph, based on their evaluation of the disclosure controls and procedures required by Rule 30a-3(b) under the 1940 Act and 15d-15(b) under the Securities Exchange Act of 1934. |
| | (b) | There were no changes in the registrant’s internal control over financial reporting (as defined in Rule 30a-3(d) under the 1940 Act) that occurred during the second fiscal quarter of the period covered by this report that have materially affected, or are likely to materially affect the registrant’s internal control over financial reporting. |
(a) (1) Code of Ethics attached hereto.
Exhibit 99.CODE ETH
(a) (2) Certifications pursuant to section 302 of the Sarbanes-Oxley Act of 2002 attached hereto.
Exhibit 99.CERT
(b) Certifications pursuant to Section 906 of the Sarbanes-Oxley Act of 2002 attached hereto.
Exhibit 99.906CERT
SIGNATURES
Pursuant to the requirements of the Securities Exchange Act of 1934 and the Investment Company Act of 1940, the registrant has duly caused this Report to be signed on its behalf by the undersigned, there unto duly authorized.
| | |
| Legg Mason Partners Variable Income Trust |
| |
| By: | | /S/ KENNETH D. FULLER |
| | Kenneth D. Fuller |
| | Chief Executive Officer |
| |
Date: | | February 25, 2014 |
Pursuant to the requirements of the Securities Exchange Act of 1934 and the Investment Company Act of 1940, this report has been signed below by the following persons on behalf of the registrant and in the capacities and on the dates indicated.
| | |
| |
| By: | | /S/ KENNETH D. FULLER |
| | Kenneth D. Fuller |
| | Chief Executive Officer |
| |
Date: | | February 25, 2014 |
| |
| By: | | /S/ RICHARD F. SENNETT |
| | Richard F. Sennett |
| | Principal Financial Officer |
| |
Date: | | February 25, 2014 |