UNITED STATES
SECURITIES AND EXCHANGE COMMISSION
Washington, D.C. 20549
FORM N-CSR
CERTIFIED SHAREHOLDER REPORT OF REGISTERED
MANAGEMENT INVESTMENT COMPANIES
Investment Company Act file number 811-06310
Legg Mason Partners Variable Income Trust
(Exact name of registrant as specified in charter)
620 Eighth Avenue, 49th Floor, New York, NY 10018
(Address of principal executive offices) (Zip code)
Robert I. Frenkel, Esq.
Legg Mason & Co., LLC
100 First Stamford Place
Stamford, CT 06902
(Name and address of agent for service)
Registrant’s telephone number, including area code: 1-877-721-1926
Date of fiscal year end: December 31
Date of reporting period: December 31, 2014
| ITEM 1. | REPORT TO STOCKHOLDERS. |
The Annual Report to Stockholders is filed herewith.

| | |
| Annual Report | | December 31, 2014 |
WESTERN ASSET
VARIABLE HIGH INCOME PORTFOLIO

|
| INVESTMENT PRODUCTS: NOT FDIC INSURED • NO BANK GUARANTEE • MAY LOSE VALUE |
Portfolio objectives
The Portfolio seeks to provide high current income as its primary objective. Its secondary objective is capital appreciation.
Letter from the president

Dear Shareholder,
We are pleased to provide the annual report of Western Asset Variable High Income Portfolio for the twelve-month reporting period ended December 31, 2014. Please read on for a detailed look at prevailing economic and market conditions during the Portfolio’s reporting period and to learn how those conditions have affected Portfolio performance.
As always, we remain committed to providing you with excellent service and a full spectrum of investment choices. We also remain committed to supplementing the support you receive from your financial advisor. One way we accomplish this is through our website, www.leggmason.com/individualinvestors. Here you can gain immediate access to market and investment information, including:
| Ÿ | | Market insights and commentaries from our portfolio managers and |
| Ÿ | | A host of educational resources. |
We look forward to helping you meet your financial goals.
Sincerely,

Kenneth D. Fuller
President and Chief Executive Officer
January 30, 2015
| | |
| II | | Western Asset Variable High Income Portfolio |
Investment commentary
Economic review
Despite weakness in early 2014, the U.S. economy expanded at a solid pace during the twelve months ended December 31, 2014 (the “reporting period”). The U.S. Department of Commerce reported that in the first quarter of 2014, U.S. gross domestic product (“GDP”)i contracted 2.1%. This was the first negative GDP report in three years and partially attributed to severe winter weather. Thankfully, this setback was very brief, as second quarter GDP growth was 4.6%. The rebound in GDP growth was driven by several factors, including an acceleration in personal consumption expenditures (“PCE”), increased private inventory investment and exports, as well as an upturn in state and local government spending. The economy then gained further momentum as third quarter GDP growth was 5.0%, its strongest reading since the third quarter of 2003. This was driven by contributions from PCE, exports, nonresidential fixed investment and government spending. After the reporting period ended, the U.S. Department of Commerce’s initial estimate showed that fourth quarter 2014 GDP growth was 2.6%. Moderating growth was due to several factors, including an upturn in imports, a downturn in federal government spending and decelerations in nonresidential fixed investment and in exports.
The U.S. manufacturing sector was another tailwind for the economy. Based on figures for the Institute for Supply Management’s Purchasing Managers’ Index (“PMI”)ii, U.S. manufacturing expanded during all twelve months of the reporting period (a reading below 50 indicates a contraction, whereas a reading above 50 indicates an expansion). After a reading of 56.5 in December 2013, the PMI fell to 51.3 in January 2014, but generally rose over the next several months, reaching a high of 59.0 in August, its best reading since March 2011. While the PMI dipped to 56.6 in September, it rose back to 59.0 in October. Manufacturing activity then moderated over the last two months of the year and the PMI was 55.5 in December. However, for 2014 as a whole the PMI averaged 55.8, the best annual reading since 2010.
The improving U.S. job market was another factor supporting the overall economy during the reporting period. When the period began, unemployment, as reported by the U.S. Department of Labor, was 6.6%. Unemployment generally declined throughout the reporting period and reached a low of 5.6% in December 2014, the lowest level since June 2008.
The Federal Reserve Board (“Fed”)iii took a number of actions as it sought to meet its dual mandate of fostering maximum employment and price stability. As it has since December 2008, the Fed kept the federal funds rateiv at a historically low range between zero and 0.25%. The Fed also ended its asset purchase program that was announced in December 2012. At that time, the Fed said it would continue purchasing $40 billion per month of agency mortgage-backed securities (“MBS”), as well as $45 billion per month of longer-term Treasuries. Following the meeting that concluded on December 18, 2013, the Fed announced that it would begin reducing its monthly asset purchases, saying “Beginning in January 2014, the Committee will add to its holdings of agency MBS at a pace of $35 billion per month rather than $40 billion per month, and will add to its holdings of longer-term Treasury securities at a pace of $40 billion per month rather than $45 billion
| | |
| Western Asset Variable High Income Portfolio | | III |
Investment commentary (cont’d)
per month.” At each of the Fed’s next six meetings (January, March, April, June, July and September 2014), it announced further $10 billion tapering of its asset purchases. At its meeting that ended on October 29, 2014, the Fed announced that its asset purchase program had concluded. During its last meeting of the year that concluded on December 17, 2014, the Fed said that “Based on its current assessment, the Committee judges that it can be patient … to maintain the 0 to 1/4 percent target range for the federal funds rate for a considerable time….” Finally, at its meeting that ended on January 28, 2015, after the reporting period ended, the Fed said “Based on its current assessment, the Committee judges that it can be patient in beginning to normalize the stance of monetary policy.”
As always, thank you for your confidence in our stewardship of your assets.
Sincerely,
Kenneth D. Fuller
President and Chief Executive Officer
January 30, 2015
All investments are subject to risk including the possible loss of principal. Past performance is no guarantee of future results.
| i | Gross domestic product (“GDP”) is the market value of all final goods and services produced within a country in a given period of time. |
| ii | The Institute for Supply Management’s PMI is based on a survey of purchasing executives who buy the raw materials for manufacturing at more than 350 companies. It offers an early reading on the health of the U.S. manufacturing sector. |
| iii | The Federal Reserve Board (“Fed”) is responsible for the formulation of policies designed to promote economic growth, full employment, stable prices and a sustainable pattern of international trade and payments. |
| iv | The federal funds rate is the rate charged by one depository institution on an overnight sale of immediately available funds (balances at the Federal Reserve) to another depository institution; the rate may vary from depository institution to depository institution and from day to day. |
| | |
| IV | | Western Asset Variable High Income Portfolio |
Portfolio overview
Q. What is the Portfolio’s investment strategy?
A. The Portfolio seeks to provide high current income as its primary objective and capital appreciation as its secondary objective. The Portfolio invests, under normal circumstances, at least 80% of its assets in high-yield corporate debt obligations and preferred stock of U.S. and foreign issuers. High-yield securities, commonly known as “junk bonds,” are those rated below investment grade (that is, securities rated below the Baa/BBB categories) or, if unrated, securities that we determined to be of comparable quality. The Portfolio may invest up to 50% of its assets in foreign currency denominated securities and without limit in U.S. dollar denominated securities of foreign issuers, including those in emerging market countries. The Portfolio’s investments may be of any maturity or durationi. Instead of, and/or in addition to, investing directly in particular securities, the Portfolio may gain exposure to a security, an issuer, an index or basket of securities, or a market, by investing through the use of instruments such as derivatives. The Portfolio may also engage in a variety of transactions using derivatives in order to change the investment characteristics of its portfolio (such as shortening or lengthening duration) and for other purposes. The Portfolio may use one or more types of these instruments without limit.
We attempt to minimize the risk of any individual security by diversifying the Portfolio’s investments across a range of issues, industries and maturity dates. In selecting high-yield corporate fixed-income securities, we consider and compare the relative yields of various types of obligations and employ a forward-looking strategy seeking to identify companies that exhibit favorable earnings prospects or demonstrate a potential for higher ratings over time.
At Western Asset Management Company (“Western Asset”), the Portfolio’s subadviser, we utilize a fixed-income team approach, with decisions derived from interaction among various investment management sector specialists. The sector teams are comprised of Western Asset’s senior portfolio management personnel, research analysts and an in-house economist. Under this team approach, management of client fixed-income portfolios will reflect a consensus of interdisciplinary views within the Western Asset organization.
Q. What were the overall market conditions during the Portfolio’s reporting period?
A. The U.S. spread sectors (non-Treasuries) generated positive results and largely outperformed equal-duration Treasuries over the twelve months ended December 31, 2014. Risk aversion was prevalent at times given mixed economic data, questions surrounding the outlook for global growth, changing monetary policy by the Federal Reserve Board (“Fed”)ii, and numerous geopolitical issues. However, these factors were largely overshadowed by solid demand from investors looking to generate incremental yield in the low interest rate environment.
Short-term Treasury yields moved higher, whereas longer-term Treasury yields declined during the twelve months ended December 31, 2014. Two-year Treasury yields rose from 0.38% at the beginning of the period to 0.67% at the end of the period. Their peak of 0.73% occurred on December 23, December 24 and December 26, 2014, and they were as low as
| | |
| Western Asset Variable High Income Portfolio 2014 Annual Report | | 1 |
Portfolio overview (cont’d)
0.30% in early February 2014. Ten-year Treasury yields were at a peak of 3.04% when the reporting period began and reached a low of 2.07% on December 16, 2014. They ended the reporting period at 2.17%.
All told, the Barclays U.S. Aggregate Indexiii returned 5.97% for the twelve months ended December 31, 2014. Comparatively, riskier fixed-income securities, including high-yield bonds and emerging market debt, produced weaker results. Over the fiscal year, the Barclays U.S. Corporate High Yield — 2% Issuer Cap Index (the “Index”)iv gained 2.46%. During this period, as measured by the Index, lower-quality CCC-rated bonds underperformed higher-quality BB-rated securities, as they returned -1.11% and 5.37%, respectively. In contrast, the emerging market debt asset class, as measured by the JPMorgan Emerging Markets Bond Index Global (“EMBI Global”)v, returned 5.53% over the same period.
Q. How did we respond to these changing market conditions?
A. A number of adjustments were made to the Portfolio during the reporting period. We increased the Portfolio’s allocation to cash and added to its Capital Goods1 exposure. In contrast, we reduced our weightings in the Basic Industry2, Communications3, Transportation4 and Financials sectors. From a credit quality perspective, we pared the Portfolio’s overweight exposure to CCC-rated securities and increased its allocation to BB-rated securities. These ratings adjustments were made to reduce the Portfolio’s overall risk exposure. Finally, we actively participated in the new issue market and purchased securities that we felt were attractively valued.
High-yield index swaps (CDX), which were used to manage our high-yield exposure, modestly detracted from performance during the reporting period. Currency forwards were used to hedge the Portfolio’s non-U.S. dollar currency exposure. They were a positive for results.
| 1 | Capital Goods consists of the following industries: Aerospace & Defense, Building Materials, Diversified Manufacturing, Construction Machines, Packaging and Environmental. |
| 2 | Basic Industry consists of the following industries: Chemicals, Metals & Mining and Paper. |
| 3 | Communications consists of the following industries: Media — Cable, Media — Non-Cable and Telecommunications. |
| 4 | Transportation consists of the following industries: Airlines, Railroads and other transportation-related services. |
| | |
| 2 | | Western Asset Variable High Income Portfolio 2014 Annual Report |
Performance review
For the twelve months ended December 31, 2014, Western Asset Variable High Income Portfolio1 returned -0.33%. The Portfolio’s unmanaged benchmark, the Barclays U.S. Corporate High Yield — 2% Issuer Cap Index, returned 2.46% for the same period. The Lipper Variable High Yield Funds Category Average1 returned 1.59% over the same time frame.
| | | | | | | | |
Performance Snapshot as of December 31, 2014
(unaudited) | |
| | | 6 months | | | 12 months | |
Western Asset Variable High
Income Portfolio2 | | | -5.44 | % | | | -0.33 | % |
| Barclays U.S. Corporate High Yield — 2% Issuer Cap Index | | | -2.84 | % | | | 2.46 | % |
| Lipper Variable High Yield Funds Category Average1 | | | -2.92 | % | | | 1.59 | % |
The performance shown represents past performance. Past performance is no guarantee of future results and current performance may be higher or lower than the performance shown above. Principal value, investment returns and yields will fluctuate and investors’ shares, when redeemed, may be worth more or less than their original cost.
Portfolio return assumes the reinvestment of all distributions at net asset value and the deduction of all Portfolio expenses. Performance figures for periods shorter than one year represent cumulative figures and are not annualized.
The 30-Day SEC Yield for the period ended December 31, 2014 was 7.38%. The 30-Day SEC Yield is subject to change and is based on the yield to maturity of the Portfolio’s investments over a 30-day period and not on the dividends paid by the Portfolio, which may differ.
|
| Total Annual Operating Expenses (unaudited) |
As of the Portfolio’s current prospectus dated May 1, 2014, the gross total annual operating expense ratio for the Portfolio was 0.74%.
Actual expenses may be higher. For example, expenses may be higher than those shown if average net assets decrease. Net assets are more likely to decrease and Portfolio expense ratios are more likely to increase when markets are volatile.
Q. What were the leading contributors to performance?
A. Despite underperforming the Index, the Portfolio’s concentrations in select outperforming sectors added to relative results during the reporting period. In particular, the Fund’s overweight to the Transportation sector was beneficial for performance.
A number of individual holdings contributed to performance, including our overweight positions in Physiotherapy and Royal Bank of Scotland. Physiotherapy Associates Holdings is a national provider of outpatient rehabilitation and orthotics and prosthetics services. The company experienced headwinds due to both billing and accounting issues, and in May 2013, restructured its balance sheet as bondholders led the reorganization of the credit. In doing so,
| 1 | Lipper, Inc., a wholly-owned subsidiary of Reuters, provides independent insight on global collective investments. Returns are based on the period ended December 31, 2014, including the reinvestment of all distributions, including returns of capital, if any, calculated among the 116 funds for the six-month period and among the 112 funds for the twelve-month period in the Portfolio’s Lipper category. |
| 2 | The Portfolio is an underlying investment option of various variable annuity and variable life insurance products. The Portfolio’s performance returns do not reflect the deduction of expenses imposed in connection with investing in variable annuity or variable life insurance contracts, such as administrative fees, account charges and surrender charges, which, if reflected, would reduce the performance of the Portfolio. Past performance is no guarantee of future results. |
| | |
| Western Asset Variable High Income Portfolio 2014 Annual Report | | 3 |
Portfolio overview (cont’d)
Western received equity in exchange for our original bond position and participated in the new financing of a secured loan. The valuation of the company has improved meaningfully since the workout took place due to successful management initiatives. We remain positive regarding the prospects for further recovery as we remain bullish on the company’s market position which includes more than 500 outpatient rehabilitation clinics in 34 states. Royal Bank of Scotland performed well as investor sentiment, overall, improved due to continued balance sheet and capital ratio improvement, as well as strengthening fundamental prospects.
Q. What were the leading detractors from performance?
A. The largest detractor from the Portfolio’s relative performance during the reporting period was security selection. In particular, overweight positions in select energy issuers including KCA Deutag, Hercules Offshore and Samson Investment Co. were negative for performance. These three energy-related companies were hurt by sharply declining oil prices, as they fell 46% in 2014.
Our ratings biases were negative for performance. In particular, an overweight to lower-rated CCC bonds detracted from results, as they significantly underperformed the Index. In addition, we underweighted bonds rated BB, which was not rewarded given their outperformance versus the Index.
From a sector positioning perspective, the Portfolio’s overweight in Energy (the worst performing sector in the Index) and an underweight in Information Technology (the second best performing sector in the Index) negatively impacted results.
Thank you for your investment in Western Asset Variable High Income Portfolio. As always, we appreciate that you have chosen us to manage your assets and we remain focused on achieving the Fund’s investment goals.
Sincerely,
Western Asset Management Company
January 20, 2015
RISKS: As interest rates rise, bond prices fall, reducing the value of the Portfolio’s share price. High-yield bonds, commonly known as “junk bonds,” are rated below investment grade and carry more risk than higher-rated securities. Also, the Portfolio is subject to fluctuations in share price as interest rates rise and fall and is subject to certain risks of overseas investing, including currency fluctuations, differing securities regulations and periods of illiquidity, which could result in significant market fluctuations. These risks are magnified in emerging markets. The Portfolio may use derivatives, such as options and futures, which can be illiquid, may disproportionately increase losses, and have a potentially large impact on Portfolio performance. Please see the Portfolio’s prospectus for a more complete discussion of these and other risks, and the Portfolio’s investment strategies.
Portfolio holdings and breakdowns are as of December 31, 2014 and are subject to change and may not be representative of the portfolio managers’ current or future investments. Please refer to pages 12 through 27 for a list and percentage breakdown of the Portfolio’s holdings.
The mention of sector breakdowns is for informational purposes only and should not be construed as a recommendation to purchase or sell any securities. The information provided regarding such sectors is not a sufficient basis
| | |
| 4 | | Western Asset Variable High Income Portfolio 2014 Annual Report |
upon which to make an investment decision. Investors seeking financial advice regarding the appropriateness of investing in any securities or investment strategies discussed should consult their financial professional. Portfolio holdings are subject to change at any time and may not be representative of the portfolio managers’ current or future investments. The Portfolio’s top five sector holdings (as a percentage of net assets) as of December 31, 2014 were: Industrials (18.6%), Energy (18.5%), Consumer Discretionary (16.9%), Financials (11.5%) and Materials (9.1%). The Portfolio’s composition is subject to change at any time.
All investments are subject to risk including the possible loss of principal. Past performance is no guarantee of future results. All index performance reflects no deduction for fees, expenses or taxes. Please note that an investor cannot invest directly in an index.
The information provided is not intended to be a forecast of future events, a guarantee of future results or investment advice. Views expressed may differ from those of the firm as a whole.
| i | Duration is the measure of the price sensitivity of a fixed-income security to an interest rate change of 100 basis points. Calculation is based on the weighted average of the present values for all cash flows. |
| ii | The Federal Reserve Board (“Fed”) is responsible for the formulation of policies designed to promote economic growth, full employment, stable prices, and a sustainable pattern of international trade and payments. |
| iii | The Barclays U.S. Aggregate Index is a broad-based bond index comprised of government, corporate, mortgage- and asset-backed issues, rated investment grade or higher, and having at least one year to maturity. |
| iv | The Barclays U.S. Corporate High Yield — 2% Issuer Cap Index is an index of the 2% Issuer Cap component of the Barclays U.S. Corporate High Yield Index, which covers the U.S. dollar-denominated, non-investment grade, fixed-rate, taxable corporate bond market. |
| v | The JPMorgan Emerging Markets Bond Index Global (“EMBI Global”) tracks total returns for U.S. dollar-denominated debt instruments issued by emerging market sovereign and quasi-sovereign entities: Brady bonds, loans, Eurobonds and local market instruments. |
| | |
| Western Asset Variable High Income Portfolio 2014 Annual Report | | 5 |
Portfolio at a glance† (unaudited)
Investment breakdown (%) as a percent of total investments
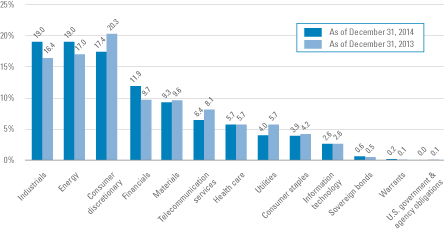
| † | The bar graph above represents the composition of the Portfolio’s investments as of December 31, 2014 and December 31, 2013 and does not include derivatives such as swap contracts and forward foreign currency contracts. The Portfolio is actively managed. As a result, the composition of the Portfolio’s investments is subject to change at any time. |
| | |
| 6 | | Western Asset Variable High Income Portfolio 2014 Annual Report |
Portfolio expenses (unaudited)
Example
As a shareholder of the Portfolio, you may incur two types of costs: (1) transaction costs and (2) ongoing costs, including management fees and other Portfolio expenses. This example is intended to help you understand your ongoing costs (in dollars) of investing in the Portfolio and to compare these costs with the ongoing costs of investing in other mutual funds.
This example is based on an investment of $1,000 invested on July 1, 2014 and held for the six months ended December 31, 2014.
Actual expenses
The table below titled “Based on Actual Total Return” provides information about actual account values and actual expenses. You may use the information provided in this table, together with the amount you invested, to estimate the expenses that you paid over the period. To estimate the expenses you paid on your account, divide your ending account value by $1,000 (for example, an $8,600 ending account value divided by $1,000 = 8.6), then multiply the result by the number under the heading entitled “Expenses Paid During the Period”.
Hypothetical example for comparison purposes
The table below titled “Based on Hypothetical Total Return” provides information about hypothetical account values and hypothetical expenses based on the actual expense ratio and an assumed rate of return of 5.00% per year before expenses, which is not the Portfolio’s actual return. The hypothetical account values and expenses may not be used to estimate the actual ending account balance or expenses you paid for the period. You may use the information provided in this table to compare the ongoing costs of investing in the Portfolio and other funds. To do so, compare the 5.00% hypothetical example relating to the Portfolio with the 5.00% hypothetical examples that appear in the shareholder reports of the other funds.
Please note that the expenses shown in the table below are meant to highlight your ongoing costs only and do not reflect any transactional costs. Therefore, the table is useful in comparing ongoing costs only, and will not help you determine the relative total costs of owning different funds. In addition, if these transaction costs were included, your costs would have been higher.
| | | | | | | | | | | | | | | | | | | | | | | | | | | | | | | | | | | | | | | | | | | | | | | | | | |
| Based on actual total return1 | | | | Based on hypothetical total return1 |
Actual
Total
Return2 | | Beginning
Account
Value | | Ending
Account
Value | | Annualized
Expense
Ratio | | Expenses
Paid During
the Period3 | | | | Hypothetical
Annualized
Total Return | | Beginning
Account
Value | | Ending
Account
Value | | Annualized
Expense
Ratio | | Expenses
Paid During
the Period3 |
| | | -5.44% | | | | $ | 1,000.00 | | | | $ | 945.60 | | | | | 0.75 | % | | | $ | 3.68 | | | | | | | 5.00 | % | | | | $1,000.00 | | | | $ | 1,021.42 | | | | | 0.75 | % | | | $ | 3.82 | |
| 1 | For the six months ended December 31, 2014. |
| 2 | Assumes the reinvestment of all distributions, including returns of capital, if any, at net asset value. Total return is not annualized, as it may not be representative of the total return for the year. Total return does not reflect expenses associated with separate accounts such as administrative fees, account charges and surrender charges, which, if reflected would reduce the total return. Performance figures may reflect compensating balance arrangements, fee waivers and/or expense reimbursements. In the absence of compensating balance arrangements, fee waivers and/or expense reimbursements, the total return would have been lower. Past performance is no guarantee of future results. |
| 3 | Expenses (net of compensating balance arrangements, fee waivers and/or expense reimbursements) are equal to each class’ annualized expense ratio multiplied by the average account value over the period, multiplied by the number of days in the most recent fiscal half-year (184), then divided by 365. |
| | |
| Western Asset Variable High Income Portfolio 2014 Annual Report | | 7 |
Portfolio performance (unaudited)
| | | | |
| Average annual total returns1 | | | |
| Twelve Months Ended 12/31/14 | | | -0.33 | % |
| Five Years Ended 12/31/14 | | | 8.91 | |
| Ten Years Ended 12/31/14 | | | 6.96 | |
| | | | |
| Cumulative total returns1 | | | |
| 12/31/04 through 12/31/14 | | | 95.98 | % |
All figures represent past performance and are not a guarantee of future results. Investment return and principal value of an investment will fluctuate so that an investor’s shares, when redeemed, may be worth more or less than their original cost. The returns shown do not reflect expenses associated with separate accounts such as administrative fees, account charges and surrender charges, which, if reflected, would reduce the total returns. Performance figures may reflect compensating balance arrangements, fee waivers and/or expense reimbursements. In the absence of compensating balance arrangements, fee waivers and/or expense reimbursements, the total return would have been lower.
| 1 | Assumes the reinvestment of all distributions, including returns of capital, if any, at net asset value. |
| | |
| 8 | | Western Asset Variable High Income Portfolio 2014 Annual Report |
Historical performance
Value of $10,000 invested in
Western Asset Variable High Income Portfolio vs. Barclays U.S. Corporate High Yield – 2% Issuer Cap Index† — December 2004 - December 2014
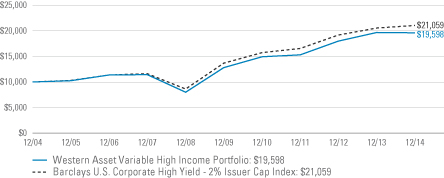
All figures represent past performance and are not a guarantee of future results. Investment return and principal value of an investment will fluctuate so that an investor’s shares, when redeemed, may be worth more or less than their original cost. The returns shown do not reflect expenses associated with separate accounts such as administrative fees, account charges and surrender charges, which, if reflected, would reduce the total returns. Performance figures may reflect compensating balance arrangements, fee waivers and/or expense reimbursements. In the absence of compensating balance arrangements, fee waivers and/or expense reimbursements, the total return would have been lower.
| † | Hypothetical illustration of $10,000 invested in Western Asset Variable High Income Portfolio on December 31, 2004, assuming the reinvestment of all distributions, including returns of capital, if any, at net asset value through December 31, 2014. The hypothetical illustration also assumes a $10,000 investment in the Barclays U.S. Corporate High Yield — 2% Issuer Cap Index. The Barclays U.S. Corporate High Yield — 2% Issuer Cap Index is an index of the 2% Issuer Cap component of the Barclays U.S. Corporate High Yield Index, which covers the U.S. dollar-denominated, non-investment grade, fixed-rate, taxable corporate bond market. The Index is unmanaged and is not subject to the same management and trading expenses as a mutual fund. Please note that an investor cannot invest directly in an index. |
| | |
| Western Asset Variable High Income Portfolio 2014 Annual Report | | 9 |
Spread duration (unaudited)
Economic exposure — December 31, 2014
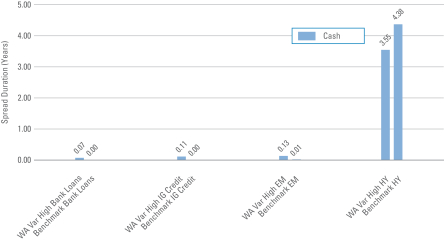
Spread duration measures the sensitivity to changes in spreads. The spread over Treasuries is the annual risk-premium demanded by investors to hold non-Treasury securities. Spread duration is quantified as the % change in price resulting from a 100 basis points change in spreads. For a security with positive spread duration, an increase in spreads would result in a price decline and a decline in spreads would result in a price increase. This chart highlights the market sector exposure of the Portfolio’s sectors relative to the selected benchmark sectors as of the end of the reporting period.
| | |
| Benchmark | | — Barclays U.S. Corporate High Yield — 2% Issuer Cap Index |
| EM | | — Emerging Markets |
| HY | | — High Yield |
| IG Credit | | — Investment Grade Credit |
| WA Var High | | — Western Asset Variable High Income Portfolio |
| | |
| 10 | | Western Asset Variable High Income Portfolio 2014 Annual Report |
Effective duration (unaudited)
Interest rate exposure — December 31, 2014
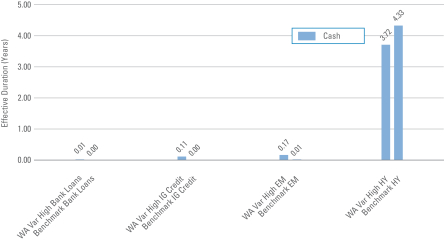
Effective duration measures the sensitivity to changes in relevant interest rates. Effective duration is quantified as the % change in price resulting from a 100 basis points change in interest rates. For a security with positive effective duration, an increase in interest rates would result in a price decline and a decline in interest rates would result in a price increase. This chart highlights the interest rate exposure of the Portfolio’s sectors relative to the selected benchmark sectors as of the end of the reporting period.
| | |
| Benchmark | | — Barclays U.S. Corporate High Yield — 2% Issuer Cap Index |
| EM | | — Emerging Markets |
| HY | | — High Yield |
| IG Credit | | — Investment Grade Credit |
| WA Var High | | — Western Asset Variable High Income Portfolio |
| | |
| Western Asset Variable High Income Portfolio 2014 Annual Report | | 11 |
Schedule of investments
December 31, 2014
Western Asset Variable High Income Portfolio
| | | | | | | | | | | | | | | | |
| Security | | Rate | | | Maturity
Date | | | Face
Amount† | | | Value | |
| Corporate Bonds & Notes — 88.2% | | | | | | | | | | | | | | | | |
| Consumer Discretionary — 15.4% | | | | | | | | | | | | | | | | |
Automobiles — 0.5% | | | | | | | | | | | | | | | | |
General Motors Co., Senior Notes | | | 5.200 | % | | | 4/1/45 | | | | 60,000 | | | $ | 63,450 | |
General Motors Financial Co. Inc., Senior Notes | | | 4.375 | % | | | 9/25/21 | | | | 390,000 | | | | 407,550 | |
Total Automobiles | | | | | | | | | | | | | | | 471,000 | |
Distributors — 0.3% | | | | | | | | | | | | | | | | |
LKQ Corp., Senior Notes | | | 4.750 | % | | | 5/15/23 | | | | 240,000 | | | | 231,600 | |
Diversified Consumer Services — 0.5% | | | | | | | | | | | | | | | | |
Service Corp. International, Senior Notes | | | 7.500 | % | | | 4/1/27 | | | | 210,000 | | | | 237,300 | |
StoneMor Partners LP/Cornerstone Family Services of WV, Senior Bonds | | | 7.875 | % | | | 6/1/21 | | | | 200,000 | | | | 205,000 | (a) |
Total Diversified Consumer Services | | | | | | | | | | | | | | | 442,300 | |
Hotels, Restaurants & Leisure — 4.5% | | | | | | | | | | | | | | | | |
1011778 BC ULC/New Red Finance Inc., Secured Notes | | | 6.000 | % | | | 4/1/22 | | | | 300,000 | | | | 309,000 | (a) |
24 Hour Holdings III LLC, Senior Notes | | | 8.000 | % | | | 6/1/22 | | | | 160,000 | | | | 128,800 | (a) |
Bossier Casino Venture Holdco Inc. | | | 11.000 | % | | | 2/9/18 | | | | 52,264 | | | | 50,984 | (a)(b)(c) |
Bossier Casino Venture Holdco Inc., Senior Secured Bonds | | | 14.000 | % | | | 2/9/18 | | | | 430,171 | | | | 366,032 | (a)(b)(c)(d) |
Caesars Entertainment Operating Co. Inc., Senior Secured Notes | | | 11.250 | % | | | 6/1/17 | | | | 160,000 | | | | 118,080 | |
Caesars Entertainment Resort Properties LLC, Secured Notes | | | 11.000 | % | | | 10/1/21 | | | | 370,000 | | | | 338,550 | (a) |
Carrols Restaurant Group Inc., Senior Secured Notes | | | 11.250 | % | | | 5/15/18 | | | | 200,000 | | | | 216,000 | |
CEC Entertainment Inc., Senior Notes | | | 8.000 | % | | | 2/15/22 | | | | 140,000 | | | | 136,500 | (a) |
Downstream Development Quapaw, Senior Secured Notes | | | 10.500 | % | | | 7/1/19 | | | | 220,000 | | | | 205,700 | (a) |
Greektown Holdings LLC/Greektown Mothership Corp., Senior Secured Notes | | | 8.875 | % | | | 3/15/19 | | | | 160,000 | | | | 160,400 | (a) |
Hilton Worldwide Finance LLC/Hilton Worldwide Finance Corp., Senior Notes | | | 5.625 | % | | | 10/15/21 | | | | 370,000 | | | | 388,500 | |
Landry’s Holdings II Inc., Senior Notes | | | 10.250 | % | | | 1/1/18 | | | | 360,000 | | | | 372,600 | (a) |
Landry’s Inc., Senior Notes | | | 9.375 | % | | | 5/1/20 | | | | 313,000 | | | | 333,345 | (a) |
MCE Finance Ltd., Senior Notes | | | 5.000 | % | | | 2/15/21 | | | | 270,000 | | | | 253,800 | (a) |
MGM Resorts International, Senior Notes | | | 6.625 | % | | | 12/15/21 | | | | 140,000 | | | | 147,700 | |
NCL Corp. Ltd., Senior Notes | | | 5.250 | % | | | 11/15/19 | | | | 570,000 | | | | 577,125 | (a) |
Total Hotels, Restaurants & Leisure | | | | | | | | | | | | | | | 4,103,116 | |
Household Durables — 1.6% | | | | | | | | | | | | | | | | |
Century Intermediate Holding Co. 2, Senior Notes | | | 9.750 | % | | | 2/15/19 | | | | 340,000 | | | | 358,700 | (a)(d) |
Standard Pacific Corp., Senior Notes | | | 5.875 | % | | | 11/15/24 | | | | 190,000 | | | | 190,950 | |
Toll Brothers Finance Corp., Senior Notes | | | 6.750 | % | | | 11/1/19 | | | | 50,000 | | | | 56,250 | |
William Lyon Homes Inc., Senior Notes | | | 8.500 | % | | | 11/15/20 | | | | 260,000 | | | | 281,450 | |
William Lyon Homes PNW Finance Corp., Senior Notes | | | 7.000 | % | | | 8/15/22 | | | | 220,000 | | | | 222,200 | (a) |
See Notes to Financial Statements.
| | |
| 12 | | Western Asset Variable High Income Portfolio 2014 Annual Report |
Western Asset Variable High Income Portfolio
| | | | | | | | | | | | | | | | |
| Security | | Rate | | | Maturity
Date | | | Face
Amount† | | | Value | |
Household Durables — continued | | | | | | | | | | | | | | | | |
Woodside Homes Co., LLC/Woodside Homes Finance Inc., Senior Notes | | | 6.750 | % | | | 12/15/21 | | | | 380,000 | | | $ | 380,000 | (a) |
Total Household Durables | | | | | | | | | | | | | | | 1,489,550 | |
Media — 5.7% | | | | | | | | | | | | | | | | |
Carmike Cinemas Inc., Secured Notes | | | 7.375 | % | | | 5/15/19 | | | | 120,000 | | | | 128,100 | |
CCO Holdings LLC/CCO Holdings Capital Corp., Senior Notes | | | 8.125 | % | | | 4/30/20 | | | | 200,000 | | | | 211,000 | |
Clear Channel Worldwide Holdings Inc., Senior Notes | | | 6.500 | % | | | 11/15/22 | | | | 100,000 | | | | 102,250 | |
Clear Channel Worldwide Holdings Inc., Senior Subordinated Notes | | | 7.625 | % | | | 3/15/20 | | | | 80,000 | | | | 83,400 | |
DISH DBS Corp., Senior Notes | | | 5.875 | % | | | 7/15/22 | | | | 450,000 | | | | 462,375 | |
DISH DBS Corp., Senior Notes | | | 5.875 | % | | | 11/15/24 | | | | 240,000 | | | | 241,800 | (a) |
Gibson Brands Inc., Senior Secured Notes | | | 8.875 | % | | | 8/1/18 | | | | 270,000 | | | | 260,550 | (a) |
iHeartCommunications Inc., Senior Notes | | | 10.000 | % | | | 1/15/18 | | | | 210,000 | | | | 180,863 | |
MDC Partners Inc., Senior Notes | | | 6.750 | % | | | 4/1/20 | | | | 280,000 | | | | 289,450 | (a) |
MediaNews Group Inc. | | | 12.000 | % | | | 12/31/18 | | | | 200,000 | | | | 200,000 | (b) |
New Cotai LLC/New Cotai Capital Corp., Senior Secured Notes | | | 10.625 | % | | | 5/1/19 | | | | 556,259 | | | | 592,416 | (a)(d) |
Numericable-SFR, Senior Secured Bonds | | | 6.000 | % | | | 5/15/22 | | | | 650,000 | | | | 654,387 | (a) |
Sinclair Television Group Inc., Senior Notes | | | 5.375 | % | | | 4/1/21 | | | | 150,000 | | | | 149,625 | |
Univision Communications Inc., Senior Secured Notes | | | 7.875 | % | | | 11/1/20 | | | | 330,000 | | | | 353,100 | (a) |
Univision Communications Inc., Senior Secured Notes | | | 6.750 | % | | | 9/15/22 | | | | 145,000 | | | | 155,875 | (a) |
Virgin Media Finance PLC, Senior Notes | | | 6.375 | % | | | 4/15/23 | | | | 360,000 | | | | 378,900 | (a) |
Virgin Media Finance PLC, Senior Notes | | | 6.000 | % | | | 10/15/24 | | | | 200,000 | | | | 210,000 | (a) |
Virgin Media Secured Finance PLC, Senior Secured Bonds | | | 5.500 | % | | | 1/15/25 | | | | 200,000 | | | | 207,000 | (a) |
WMG Acquisition Corp., Senior Notes | | | 6.750 | % | | | 4/15/22 | | | | 310,000 | | | | 283,650 | (a) |
Total Media | | | | | | | | | | | | | | | 5,144,741 | |
Multiline Retail — 0.3% | | | | | | | | | | | | | | | | |
Neiman Marcus Group Ltd. LLC, Senior Notes | | | 8.750 | % | | | 10/15/21 | | | | 270,000 | | | | 287,550 | (a)(d) |
Specialty Retail — 1.6% | | | | | | | | | | | | | | | | |
CST Brands Inc., Senior Notes | | | 5.000 | % | | | 5/1/23 | | | | 200,000 | | | | 203,000 | |
Edcon Pty Ltd., Senior Secured Notes | | | 9.500 | % | | | 3/1/18 | | | | 400,000 | | | | 314,000 | (a) |
GameStop Corp., Senior Notes | | | 5.500 | % | | | 10/1/19 | | | | 210,000 | | | | 211,575 | (a) |
Guitar Center Inc., Senior Bonds | | | 9.625 | % | | | 4/15/20 | | | | 560,000 | | | | 369,600 | (a) |
Spencer Spirit Holdings Inc., Senior Notes | | | 9.000 | % | | | 5/1/18 | | | | 352,000 | | | | 356,400 | (a)(d) |
Total Specialty Retail | | | | | | | | | | | | | | | 1,454,575 | |
Textiles, Apparel & Luxury Goods — 0.4% | | | | | | | | | | | | | | | | |
Empire Today LLC/Empire Today Finance Corp.,
Senior Secured Notes | | | 11.375 | % | | | 2/1/17 | | | | 210,000 | | | | 157,500 | (a) |
William Carter Co., Senior Notes | | | 5.250 | % | | | 8/15/21 | | | | 160,000 | | | | 165,600 | |
Total Textiles, Apparel & Luxury Goods | | | | | | | | | | | | | | | 323,100 | |
Total Consumer Discretionary | | | | | | | | | | | | | | | 13,947,532 | |
See Notes to Financial Statements.
| | |
| Western Asset Variable High Income Portfolio 2014 Annual Report | | 13 |
Schedule of investments (cont’d)
December 31, 2014
Western Asset Variable High Income Portfolio
| | | | | | | | | | | | | | | | |
| Security | | Rate | | | Maturity
Date | | | Face
Amount† | | | Value | |
| Consumer Staples — 3.6% | | | | | | | | | | | | | | | | |
Beverages — 1.3% | | | | | | | | | | | | | | | | |
Carolina Beverage Group LLC/Carolina Beverage Group Finance Inc., Secured Notes | | | 10.625 | % | | | 8/1/18 | | | | 200,000 | | | $ | 199,000 | (a) |
Constellation Brands Inc., Senior Notes | | | 4.750 | % | | | 11/15/24 | | | | 520,000 | | | | 527,800 | |
Cott Beverages Inc., Senior Notes | | | 6.750 | % | | | 1/1/20 | | | | 200,000 | | | | 200,500 | (a) |
DS Services of America Inc., Secured Notes | | | 10.000 | % | | | 9/1/21 | | | | 250,000 | | | | 290,000 | (a) |
Total Beverages | | | | | | | | | | | | | | | 1,217,300 | |
Food & Staples Retailing — 0.3% | | | | | | | | | | | | | | | | |
Beverages & More Inc., Senior Secured Notes | | | 10.000 | % | | | 11/15/18 | | | | 330,000 | | | | 308,138 | (a) |
Food Products — 1.5% | | | | | | | | | | | | | | | | |
Dole Food Co. Inc., Senior Secured Notes | | | 7.250 | % | | | 5/1/19 | | | | 270,000 | | | | 269,662 | (a) |
H.J. Heinz Co., Secured Notes | | | 4.250 | % | | | 10/15/20 | | | | 120,000 | | | | 121,500 | |
Hearthside Group Holdings LLC/Hearthside Finance Co.,
Senior Notes | | | 6.500 | % | | | 5/1/22 | | | | 280,000 | | | | 274,400 | (a) |
Simmons Foods Inc., Secured Notes | | | 7.875 | % | | | 10/1/21 | | | | 350,000 | | | | 344,750 | (a) |
Wells Enterprises Inc., Senior Secured Notes | | | 6.750 | % | | | 2/1/20 | | | | 172,000 | | | | 176,730 | (a) |
WhiteWave Foods Co., Senior Notes | | | 5.375 | % | | | 10/1/22 | | | | 180,000 | | | | 185,850 | |
Total Food Products | | | | | | | | | | | | | | | 1,372,892 | |
Household Products — 0.2% | | | | | | | | | | | | | | | | |
Spectrum Brands Inc., Senior Notes | | | 6.125 | % | | | 12/15/24 | | | | 150,000 | | | | 153,000 | (a) |
Tobacco — 0.3% | | | | | | | | | | | | | | | | |
Alliance One International Inc., Secured Notes | | | 9.875 | % | | | 7/15/21 | | | | 280,000 | | | | 251,300 | |
Total Consumer Staples | | | | | | | | | | | | | | | 3,302,630 | |
| Energy — 18.0% | | | | | | | | | | | | | | | | |
Energy Equipment & Services — 1.9% | | | | | | | | | | | | | | | | |
Atwood Oceanics Inc., Senior Notes | | | 6.500 | % | | | 2/1/20 | | | | 300,000 | | | | 276,000 | |
CGG, Senior Notes | | | 6.500 | % | | | 6/1/21 | | | | 280,000 | | | | 214,200 | |
Exterran Partners LP/EXLP Finance Corp., Senior Notes | | | 6.000 | % | | | 10/1/22 | | | | 90,000 | | | | 77,400 | (a) |
FTS International Inc., Senior Secured Notes | | | 6.250 | % | | | 5/1/22 | | | | 270,000 | | | | 201,150 | (a) |
Hercules Offshore Inc., Senior Notes | | | 10.250 | % | | | 4/1/19 | | | | 20,000 | | | | 10,700 | (a) |
Hercules Offshore Inc., Senior Notes | | | 7.500 | % | | | 10/1/21 | | | | 730,000 | | | | 324,850 | (a) |
Hercules Offshore Inc., Senior Notes | | | 6.750 | % | | | 4/1/22 | | | | 210,000 | | | | 91,350 | (a) |
Key Energy Services Inc., Senior Notes | | | 6.750 | % | | | 3/1/21 | | | | 220,000 | | | | 138,600 | |
Pacific Drilling SA, Senior Secured Notes | | | 5.375 | % | | | 6/1/20 | | | | 260,000 | | | | 214,500 | (a) |
Parker Drilling Co., Senior Notes | | | 6.750 | % | | | 7/15/22 | | | | 230,000 | | | | 174,800 | |
Total Energy Equipment & Services | | | | | | | | | | | | | | | 1,723,550 | |
Oil, Gas & Consumable Fuels — 16.1% | | | | | | | | | | | | | | | | |
Access Midstream Partners LP/ACMP Finance Corp., Senior Notes | | | 5.875 | % | | | 4/15/21 | | | | 420,000 | | | | 439,950 | |
See Notes to Financial Statements.
| | |
| 14 | | Western Asset Variable High Income Portfolio 2014 Annual Report |
Western Asset Variable High Income Portfolio
| | | | | | | | | | | | | | | | |
| Security | | Rate | | | Maturity
Date | | | Face
Amount† | | | Value | |
Oil, Gas & Consumable Fuels — continued | | | | | | | | | | | | | | | | |
Access Midstream Partners LP/ACMP Finance Corp., Senior Notes | | | 6.125 | % | | | 7/15/22 | | | | 180,000 | | | $ | 192,150 | |
Antero Resources Corp., Senior Notes | | | 5.125 | % | | | 12/1/22 | | | | 230,000 | | | | 217,925 | (a) |
Antero Resources Finance Corp., Senior Notes | | | 5.375 | % | | | 11/1/21 | | | | 100,000 | | | | 97,125 | |
Arch Coal Inc., Senior Notes | | | 7.000 | % | | | 6/15/19 | | | | 340,000 | | | | 103,700 | |
Arch Coal Inc., Senior Notes | | | 9.875 | % | | | 6/15/19 | | | | 270,000 | | | | 93,150 | |
Atlas Pipeline Partners LP/Atlas Pipeline Finance Corp.,
Senior Notes | | | 4.750 | % | | | 11/15/21 | | | | 60,000 | | | | 57,300 | |
Atlas Pipeline Partners LP/Atlas Pipeline Finance Corp.,
Senior Notes | | | 5.875 | % | | | 8/1/23 | | | | 250,000 | | | | 248,750 | |
Berry Petroleum Co., Senior Notes | | | 6.375 | % | | | 9/15/22 | | | | 190,000 | | | | 145,350 | |
Blue Racer Midstream LLC/Blue Racer Finance Corp., Senior Notes | | | 6.125 | % | | | 11/15/22 | | | | 160,000 | | | | 154,800 | (a) |
California Resources Corp., Senior Notes | | | 6.000 | % | | | 11/15/24 | | | | 330,000 | | | | 280,500 | (a) |
Calumet Specialty Products Partners LP/Calumet Finance Corp., Senior Notes | | | 6.500 | % | | | 4/15/21 | | | | 190,000 | | | | 170,525 | (a) |
Calumet Specialty Products Partners LP/Calumet Finance Corp., Senior Notes | | | 7.625 | % | | | 1/15/22 | | | | 200,000 | | | | 186,000 | |
Carrizo Oil & Gas Inc., Senior Notes | | | 7.500 | % | | | 9/15/20 | | | | 90,000 | | | | 86,850 | |
Carrizo Oil & Gas Inc., Senior Notes | | | 7.500 | % | | | 9/15/20 | | | | 80,000 | | | | 77,200 | (a) |
Chesapeake Energy Corp., Senior Notes | | | 6.875 | % | | | 11/15/20 | | | | 80,000 | | | | 86,400 | |
Chesapeake Energy Corp., Senior Notes | | | 6.125 | % | | | 2/15/21 | | | | 280,000 | | | | 295,400 | |
Chesapeake Energy Corp., Senior Notes | | | 4.875 | % | | | 4/15/22 | | | | 360,000 | | | | 351,900 | |
Cloud Peak Energy Resources LLC/Cloud Peak Energy Finance Corp., Senior Notes | | | 6.375 | % | | | 3/15/24 | | | | 210,000 | | | | 196,350 | |
Comstock Resources Inc., Senior Notes | | | 9.500 | % | | | 6/15/20 | | | | 280,000 | | | | 191,800 | |
CONSOL Energy Inc., Senior Notes | | | 5.875 | % | | | 4/15/22 | | | | 200,000 | | | | 187,000 | (a) |
Corral Petroleum Holdings AB, Senior Notes | | | 15.000 | % | | | 12/31/17 | | | | 450,761 | | | | 400,614 | (a)(d) |
Crestwood Midstream Partners LP, Senior Notes | | | 6.000 | % | | | 12/15/20 | | | | 40,000 | | | | 38,500 | |
Crestwood Midstream Partners LP, Senior Notes | | | 6.125 | % | | | 3/1/22 | | | | 270,000 | | | | 259,200 | |
CVR Refining LLC/Coffeyville Finance Inc., Secured Notes | | | 6.500 | % | | | 11/1/22 | | | | 240,000 | | | | 229,200 | |
Ecopetrol SA, Senior Notes | | | 5.875 | % | | | 9/18/23 | | | | 50,000 | | | | 53,063 | |
El Paso Corp., Medium-Term Notes | | | 7.750 | % | | | 1/15/32 | | | | 150,000 | | | | 185,250 | |
EXCO Resources Inc., Senior Notes | | | 7.500 | % | | | 9/15/18 | | | | 220,000 | | | | 169,262 | |
Globe Luxembourg SCA, Senior Secured Notes | | | 9.625 | % | | | 5/1/18 | | | | 390,000 | | | | 306,150 | (a) |
Gulfport Energy Corp., Senior Notes | | | 7.750 | % | | | 11/1/20 | | | | 80,000 | | | | 78,600 | (a) |
Halcon Resources Corp., Senior Notes | | | 9.750 | % | | | 7/15/20 | | | | 250,000 | | | | 188,750 | |
Halcon Resources Corp., Senior Notes | | | 8.875 | % | | | 5/15/21 | | | | 550,000 | | | | 416,625 | |
Hiland Partners LP/Hiland Partners Finance Corp., Senior Notes | | | 7.250 | % | | | 10/1/20 | | | | 350,000 | | | | 334,250 | (a) |
Hiland Partners LP/Hiland Partners Finance Corp., Senior Notes | | | 5.500 | % | | | 5/15/22 | | | | 180,000 | | | | 158,850 | (a) |
Kinder Morgan Inc., Senior Secured Notes | | | 5.625 | % | | | 11/15/23 | | | | 120,000 | | | | 128,671 | (a) |
See Notes to Financial Statements.
| | |
| Western Asset Variable High Income Portfolio 2014 Annual Report | | 15 |
Schedule of investments (cont’d)
December 31, 2014
Western Asset Variable High Income Portfolio
| | | | | | | | | | | | | | | | |
| Security | | Rate | | | Maturity
Date | | | Face
Amount† | | | Value | |
Oil, Gas & Consumable Fuels — continued | | | | | | | | | | | | | | | | |
Magnum Hunter Resources Corp., Senior Notes | | | 9.750 | % | | | 5/15/20 | | | | 470,000 | | | $ | 373,650 | |
MarkWest Energy Partners LP/MarkWest Energy Finance Corp., Senior Notes | | | 6.500 | % | | | 8/15/21 | | | | 254,000 | | | | 262,890 | |
MarkWest Energy Partners LP/MarkWest Energy Finance Corp., Senior Notes | | | 4.875 | % | | | 12/1/24 | | | | 180,000 | | | | 176,850 | |
MEG Energy Corp., Senior Notes | | | 6.500 | % | | | 3/15/21 | | | | 200,000 | | | | 183,500 | (a) |
MEG Energy Corp., Senior Notes | | | 6.375 | % | | | 1/30/23 | | | | 80,000 | | | | 71,800 | (a) |
MEG Energy Corp., Senior Notes | | | 7.000 | % | | | 3/31/24 | | | | 180,000 | | | | 163,800 | (a) |
Milagro Oil & Gas Inc., Secured Notes | | | 10.500 | % | | | 5/15/16 | | | | 450,000 | | | | 335,250 | (e) |
Murphy Oil USA Inc., Senior Notes | | | 6.000 | % | | | 8/15/23 | | | | 230,000 | | | | 240,350 | |
Murray Energy Corp., Senior Secured Notes | | | 9.500 | % | | | 12/5/20 | | | | 280,000 | | | | 281,400 | (a) |
Natural Resource Partners LP/Natural Resource Partners Finance Corp., Senior Notes | | | 9.125 | % | | | 10/1/18 | | | | 140,000 | | | | 136,500 | |
New Gulf Resources LLC/NGR Finance Corp., Senior Secured Notes | | | 11.750 | % | | | 5/15/19 | | | | 280,000 | | | | 205,800 | |
NGL Energy Partners LP/NGL Energy Finance Corp., Senior Notes | | | 5.125 | % | | | 7/15/19 | | | | 170,000 | | | | 163,413 | (a) |
NGL Energy Partners LP/NGL Energy Finance Corp., Senior Notes | | | 6.875 | % | | | 10/15/21 | | | | 210,000 | | | | 207,900 | (a) |
Parsley Energy LLC/Parsley Finance Corp., Senior Notes | | | 7.500 | % | | | 2/15/22 | | | | 310,000 | | | | 295,275 | (a) |
Petrobras Global Finance BV, Senior Notes | | | 4.375 | % | | | 5/20/23 | | | | 300,000 | | | | 258,774 | |
Puma International Financing SA, Senior Bonds | | | 6.750 | % | | | 2/1/21 | | | | 230,000 | | | | 224,020 | (a) |
PVR Partners LP/Penn Virginia Resource Finance Corp. II, Senior Notes | | | 6.500 | % | | | 5/15/21 | | | | 90,000 | | | | 91,350 | |
QEP Resources Inc., Senior Notes | | | 6.875 | % | | | 3/1/21 | | | | 40,000 | | | | 41,200 | |
QEP Resources Inc., Senior Notes | | | 5.375 | % | | | 10/1/22 | | | | 260,000 | | | | 247,000 | |
QEP Resources Inc., Senior Notes | | | 5.250 | % | | | 5/1/23 | | | | 150,000 | | | | 141,000 | |
Quicksilver Resources Inc., Senior Notes | | | 11.000 | % | | | 7/1/21 | | | | 40,000 | | | | 10,200 | |
Range Resources Corp., Senior Subordinated Notes | | | 5.750 | % | | | 6/1/21 | | | | 200,000 | | | | 207,500 | |
Regency Energy Partners LP/Regency Energy Finance Corp., Senior Notes | | | 5.000 | % | | | 10/1/22 | | | | 190,000 | | | | 180,500 | |
Regency Energy Partners LP/Regency Energy Finance Corp., Senior Notes | | | 4.500 | % | | | 11/1/23 | | | | 220,000 | | | | 202,950 | |
Rice Energy Inc., Senior Notes | | | 6.250 | % | | | 5/1/22 | | | | 390,000 | | | | 364,650 | (a) |
Rockies Express Pipeline LLC, Senior Notes | | | 5.625 | % | | | 4/15/20 | | | | 270,000 | | | | 266,625 | (a) |
Rockies Express Pipeline LLC, Senior Notes | | | 6.875 | % | | | 4/15/40 | | | | 130,000 | | | | 139,425 | (a) |
Samson Investment Co., Senior Notes | | | 9.750 | % | | | 2/15/20 | | | | 600,000 | | | | 251,625 | |
Sanchez Energy Corp., Senior Notes | | | 7.750 | % | | | 6/15/21 | | | | 550,000 | | | | 514,250 | |
Sanchez Energy Corp., Senior Notes | | | 6.125 | % | | | 1/15/23 | | | | 80,000 | | | | 67,400 | (a) |
Shelf Drilling Holdings Ltd., Senior Secured Notes | | | 8.625 | % | | | 11/1/18 | | | | 220,000 | | | | 182,600 | (a) |
Sidewinder Drilling Inc., Senior Notes | | | 9.750 | % | | | 11/15/19 | | | | 210,000 | | | | 119,175 | (a) |
Summit Midstream Holdings LLC/Summit Midstream Finance Corp., Senior Notes | | | 7.500 | % | | | 7/1/21 | | | | 150,000 | | | | 158,250 | |
See Notes to Financial Statements.
| | |
| 16 | | Western Asset Variable High Income Portfolio 2014 Annual Report |
Western Asset Variable High Income Portfolio
| | | | | | | | | | | | | | | | |
| Security | | Rate | | | Maturity
Date | | | Face
Amount† | | | Value | |
Oil, Gas & Consumable Fuels — continued | | | | | | | | | | | | | | | | |
Summit Midstream Holdings LLC/Summit Midstream Finance Corp., Senior Notes | | | 5.500 | % | | | 8/15/22 | | | | 330,000 | | | $ | 315,150 | |
Targa Resources Partners LP/Targa Resources Partners Finance Corp., Senior Bonds | | | 5.250 | % | | | 5/1/23 | | | | 70,000 | | | | 67,900 | |
Targa Resources Partners LP/Targa Resources Partners Finance Corp., Senior Notes | | | 6.375 | % | | | 8/1/22 | | | | 233,000 | | | | 237,077 | |
Teine Energy Ltd., Senior Notes | | | 6.875 | % | | | 9/30/22 | | | | 120,000 | | | | 93,600 | (a) |
Ultra Petroieum Corp., Senior Notes | | | 5.750 | % | | | 12/15/18 | | | | 300,000 | | | | 278,250 | (a) |
Total Oil, Gas & Consumable Fuels | | | | | | | | | | | | | | | 14,565,959 | |
Total Energy | | | | | | | | | | | | | | | 16,289,509 | |
| Financials — 9.0% | | | | | | | | | | | | | | | | |
Banks — 4.8% | | | | | | | | | | | | | | | | |
Bank of America Corp., Junior Subordinated Notes | | | 5.200 | % | | | 6/1/23 | | | | 260,000 | | | | 240,825 | (g)(h) |
Barclays Bank PLC, Subordinated Notes | | | 7.625 | % | | | 11/21/22 | | | | 200,000 | | | | 219,060 | |
Barclays PLC, Junior Subordinated Bonds | | | 8.250 | % | | | 12/15/18 | | | | 200,000 | | | | 205,384 | (g)(h) |
CIT Group Inc., Senior Notes | | | 5.500 | % | | | 2/15/19 | | | | 270,000 | | | | 285,694 | (a) |
CIT Group Inc., Senior Notes | | | 5.000 | % | | | 8/1/23 | | | | 340,000 | | | | 350,200 | |
Citigroup Inc., Junior Subordinated Bonds | | | 6.300 | % | | | 5/15/24 | | | | 150,000 | | | | 148,125 | (g)(h) |
Cooperatieve Centrale Raiffeisen-Boerenleenbank BA, Junior Subordinated Notes | | | 11.000 | % | | | 6/30/19 | | | | 155,000 | | | | 199,872 | (a)(g)(h) |
Credit Agricole SA, Subordinated Notes | | | 8.375 | % | | | 10/13/19 | | | | 300,000 | | | | 347,250 | (a)(g)(h) |
HSBC Holdings PLC, Junior Subordinated Bonds | | | 6.375 | % | | | 9/17/24 | | | | 230,000 | | | | 232,587 | (g)(h) |
JPMorgan Chase & Co., Junior Subordinated Bonds | | | 5.150 | % | | | 5/1/23 | | | | 130,000 | | | | 122,785 | (g)(h) |
M&T Bank Corp., Junior Subordinated Bonds | | | 6.875 | % | | | 6/15/16 | | | | 300,000 | | | | 308,250 | (h) |
Novo Banco SA, Senior Notes | | | 5.875 | % | | | 11/9/15 | | | | 100,000 | EUR | | | 122,366 | (f) |
Royal Bank of Scotland Group PLC, Junior Subordinated Bonds | | | 7.648 | % | | | 9/30/31 | | | | 450,000 | | | | 526,500 | (g)(h) |
Royal Bank of Scotland Group PLC, Subordinated Notes | | | 6.000 | % | | | 12/19/23 | | | | 100,000 | | | | 108,429 | |
Royal Bank of Scotland NV, Subordinated Notes | | | 7.750 | % | | | 5/15/23 | | | | 100,000 | | | | 117,489 | |
Royal Bank of Scotland PLC, Subordinated Notes | | | 13.125 | % | | | 3/19/22 | | | | 500,000 | AUD | | | 478,743 | (f)(g) |
Wells Fargo & Co., Junior Subordinated Bonds | | | 5.900 | % | | | 6/15/24 | | | | 350,000 | | | | 355,250 | (g)(h) |
Total Banks | | | | | | | | | | | | | | | 4,368,809 | |
Consumer Finance — 1.6% | | | | | | | | | | | | | | | | |
Ally Financial Inc., Senior Notes | | | 8.000 | % | | | 11/1/31 | | | | 100,000 | | | | 127,750 | |
First Cash Financial Services Inc., Senior Notes | | | 6.750 | % | | | 4/1/21 | | | | 160,000 | | | | 167,200 | |
GMAC International Finance BV, Senior Bonds | | | 7.500 | % | | | 4/21/15 | | | | 270,000 | EUR | | | 332,027 | (f) |
Navient Corp., Senior Notes | | | 5.875 | % | | | 10/25/24 | | | | 530,000 | | | | 506,150 | |
SLM Corp., Medium-Term Notes, Senior Notes | | | 8.000 | % | | | 3/25/20 | | | | 140,000 | | | | 155,400 | |
TMX Finance LLC/TitleMax Finance Corp., Senior Secured Notes | | | 8.500 | % | | | 9/15/18 | | | | 180,000 | | | | 152,100 | (a) |
Total Consumer Finance | | | | | | | | | | | | | | | 1,440,627 | |
See Notes to Financial Statements.
| | |
| Western Asset Variable High Income Portfolio 2014 Annual Report | | 17 |
Schedule of investments (cont’d)
December 31, 2014
Western Asset Variable High Income Portfolio
| | | | | | | | | | | | | | | | |
| Security | | Rate | | | Maturity
Date | | | Face
Amount† | | | Value | |
Diversified Financial Services — 0.3% | | | | | | | | | | | | | | | | |
AerCap Ireland Capital Ltd./AerCap Global Aviation Trust, Senior Notes | | | 4.500 | % | | | 5/15/21 | | | | 250,000 | | | $ | 253,437 | (a) |
Insurance — 0.3% | | | | | | | | | | | | | | | | |
Liberty Mutual Group Inc., Junior Subordinated Bonds | | | 7.800 | % | | | 3/15/37 | | | | 210,000 | | | | 246,750 | (a) |
Real Estate Investment Trusts (REITs) — 1.2% | | | | | | | | | | | | | | | | |
CB Richard Ellis Services Inc., Senior Notes | | | 5.250 | % | | | 3/15/25 | | | | 420,000 | | | | 429,450 | |
CTR Partnership LP/CareTrust Capital Corp., Senior Notes | | | 5.875 | % | | | 6/1/21 | | | | 430,000 | | | | 437,525 | |
Geo Group Inc., Senior Notes | | | 5.875 | % | | | 10/15/24 | | | | 230,000 | | | | 234,025 | |
Total Real Estate Investment Trusts (REITs) | | | | | | | | | | | | | | | 1,101,000 | |
Real Estate Management & Development — 0.8% | | | | | | | | | | | | | | | | |
Greystar Real Estate Partners LLC, Senior Secured Notes | | | 8.250 | % | | | 12/1/22 | | | | 290,000 | | | | 296,525 | (a) |
Howard Hughes Corp., Senior Notes | | | 6.875 | % | | | 10/1/21 | | | | 420,000 | | | | 436,800 | (a) |
Total Real Estate Management & Development | | | | | | | | | | | | | | | 733,325 | |
Total Financials | | | | | | | | | | | | | | | 8,143,948 | |
| Health Care — 4.3% | | | | | | | | | | | | | | | | |
Biotechnology — 0.2% | | | | | | | | | | | | | | | | |
Grifols Worldwide Operations Ltd., Senior Notes | | | 5.250 | % | | | 4/1/22 | | | | 200,000 | | | | 205,040 | (a) |
Health Care Equipment & Supplies — 0.8% | | | | | | | | | | | | | | | | |
Lantheus Medical Imaging Inc., Senior Notes | | | 9.750 | % | | | 5/15/17 | | | | 700,000 | | | | 674,625 | |
Health Care Providers & Services — 2.7% | | | | | | | | | | | | | | | | |
Acadia Healthcare Co. Inc., Senior Notes | | | 12.875 | % | | | 11/1/18 | | | | 208,000 | | | | 235,040 | |
DJO Finance LLC/DJO Finance Corp., Senior Notes | | | 9.875 | % | | | 4/15/18 | | | | 240,000 | | | | 244,800 | |
DJO Finance LLC/DJO Finance Corp., Senior Subordinated Notes | | | 9.750 | % | | | 10/15/17 | | | | 80,000 | | | | 80,400 | |
ExamWorks Group Inc., Senior Notes | | | 9.000 | % | | | 7/15/19 | | | | 400,000 | | | | 428,000 | |
Fresenius Medical Care U.S. Finance II Inc., Senior Notes | | | 5.875 | % | | | 1/31/22 | | | | 240,000 | | | | 261,600 | (a) |
Fresenius Medical Care U.S. Finance II Inc., Senior Notes | | | 4.750 | % | | | 10/15/24 | | | | 320,000 | | | | 324,800 | (a) |
HCA Inc., Senior Notes | | | 7.500 | % | | | 2/15/22 | | | | 90,000 | | | | 103,050 | |
IASIS Healthcare LLC/IASIS Capital Corp., Senior Notes | | | 8.375 | % | | | 5/15/19 | | | | 530,000 | | | | 557,825 | |
Universal Hospital Services Inc., Secured Notes | | | 7.625 | % | | | 8/15/20 | | | | 220,000 | | | | 190,300 | |
Total Health Care Providers & Services | | | | | | | | | | | | | | | 2,425,815 | |
Pharmaceuticals — 0.6% | | | | | | | | | | | | | | | | |
JLL/Delta Dutch Newco BV, Senior Notes | | | 7.500 | % | | | 2/1/22 | | | | 290,000 | | | | 295,438 | (a) |
Salix Pharmaceuticals Ltd., Senior Notes | | | 6.000 | % | | | 1/15/21 | | | | 270,000 | | | | 276,075 | (a) |
Total Pharmaceuticals | | | | | | | | | | | | | | | 571,513 | |
Total Health Care | | | | | | | | | | | | | | | 3,876,993 | |
| Industrials — 17.3% | | | | | | | | | | | | | | | | |
Aerospace & Defense — 2.3% | | | | | | | | | | | | | | | | |
Alliant Techsystems Inc., Senior Notes | | | 5.250 | % | | | 10/1/21 | | | | 250,000 | | | | 253,125 | (a) |
See Notes to Financial Statements.
| | |
| 18 | | Western Asset Variable High Income Portfolio 2014 Annual Report |
Western Asset Variable High Income Portfolio
| | | | | | | | | | | | | | | | |
| Security | | Rate | | | Maturity
Date | | | Face
Amount† | | | Value | |
Aerospace & Defense — continued | | | | | | | | | | | | | | | | |
CBC Ammo LLC/CBC FinCo Inc., Senior Notes | | | 7.250 | % | | | 11/15/21 | | | | 460,000 | | | $ | 435,275 | (a) |
Ducommun Inc., Senior Notes | | | 9.750 | % | | | 7/15/18 | | | | 380,000 | | | | 408,500 | |
Erickson Inc., Secured Notes | | | 8.250 | % | | | 5/1/20 | | | | 444,000 | | | | 392,940 | |
Huntington Ingalls Industries Inc., Senior Notes | | | 5.000 | % | | | 12/15/21 | | | | 310,000 | | | | 315,812 | (a) |
LMI Aerospace Inc., Secured Notes | | | 7.375 | % | | | 7/15/19 | | | | 160,000 | | | | 156,800 | (a) |
Triumph Group Inc., Senior Notes | | | 5.250 | % | | | 6/1/22 | | | | 130,000 | | | | 130,325 | |
Total Aerospace & Defense | | | | | | | | | | | | | | | 2,092,777 | |
Air Freight & Logistics — 0.2% | | | | | | | | | | | | | | | | |
XPO Logistics Inc., Senior Notes | | | 7.875 | % | | | 9/1/19 | | | | 190,000 | | | | 199,500 | (a) |
Airlines — 2.8% | | | | | | | | | | | | | | | | |
Air Canada, Pass-Through Trust, Secured Notes | | | 6.625 | % | | | 5/15/18 | | | | 120,000 | | | | 123,168 | (a) |
America West Airlines, Pass-Through Certificates, Secured Notes | | | 7.100 | % | | | 4/2/21 | | | | 98,263 | | | | 108,335 | |
American Airlines, Pass Through Trust, Secured Bonds | | | 6.125 | % | | | 7/15/18 | | | | 220,000 | | | | 228,800 | (a) |
American Airlines, Pass-Through Trust, Secured Bonds | | | 5.625 | % | | | 1/15/21 | | | | 188,451 | | | | 193,162 | (a) |
American Airlines, Pass-Through Trust, Secured Notes | | | 7.000 | % | | | 1/31/18 | | | | 193,079 | | | | 206,595 | (a) |
American Airlines, Pass-Through Trust, Senior Secured Bonds | | | 5.600 | % | | | 7/15/20 | | | | 272,103 | | | | 277,545 | (a) |
Delta Air Lines Inc., Pass-Through Certificates, Subordinated Secured Notes | | | 9.750 | % | | | 12/17/16 | | | | 100,766 | | | | 113,865 | |
Delta Air Lines Inc., Pass-Through Trust, Secured Notes | | | 6.875 | % | | | 5/7/19 | | | | 171,510 | | | | 189,518 | (a) |
Delta Air Lines Inc., Secured Notes | | | 6.375 | % | | | 1/2/16 | | | | 190,000 | | | | 197,600 | (a) |
United Airlines Inc., Pass-Through Certificates, Secured Bond | | | 5.375 | % | | | 8/15/21 | | | | 160,000 | | | | 161,200 | |
United Airlines Inc., Pass-Through Certificates, Secured Notes | | | 4.750 | % | | | 4/11/22 | | | | 350,000 | | | | 347,375 | |
United Airlines Inc., Pass-Through Certificates, Secured Notes | | | 4.625 | % | | | 9/3/22 | | | | 180,000 | | | | 176,400 | |
US Airways, Pass-Through Trust, Secured Bonds | | | 6.750 | % | | | 6/3/21 | | | | 101,497 | | | | 108,094 | |
US Airways, Pass-Through Trust, Senior Secured Bonds | | | 5.375 | % | | | 11/15/21 | | | | 118,698 | | | | 120,776 | |
Total Airlines | | | | | | | | | | | | | | | 2,552,433 | |
Building Products — 0.7% | | | | | | | | | | | | | | | | |
Ashton Woods USA LLC/Ashton Woods Finance Co.,
Senior Notes | | | 6.875 | % | | | 2/15/21 | | | | 290,000 | | | | 276,950 | (a) |
Griffon Corp., Senior Notes | | | 5.250 | % | | | 3/1/22 | | | | 400,000 | | | | 376,000 | |
Total Building Products | | | | | | | | | | | | | | | 652,950 | |
Commercial Services & Supplies — 2.2% | | | | | | | | | | | | | | | | |
Garda World Security Corp., Senior Notes | | | 7.250 | % | | | 11/15/21 | | | | 80,000 | | | | 79,600 | (a) |
JM Huber Corp., Senior Notes | | | 9.875 | % | | | 11/1/19 | | | | 230,000 | | | | 254,150 | (a) |
Monitronics International Inc., Senior Notes | | | 9.125 | % | | | 4/1/20 | | | | 380,000 | | | | 360,763 | |
Taylor Morrison Communities Inc./Monarch Communities Inc., Senior Notes | | | 7.750 | % | | | 4/15/20 | | | | 346,000 | | | | 368,490 | (a) |
Taylor Morrison Communities Inc./Monarch Communities Inc., Senior Notes | | | 7.750 | % | | | 4/15/20 | | | | 65,000 | | | | 69,225 | (a) |
See Notes to Financial Statements.
| | |
| Western Asset Variable High Income Portfolio 2014 Annual Report | | 19 |
Schedule of investments (cont’d)
December 31, 2014
Western Asset Variable High Income Portfolio
| | | | | | | | | | | | | | | | |
| Security | | Rate | | | Maturity
Date | | | Face
Amount† | | | Value | |
Commercial Services & Supplies — continued | | | | | | | | | | | | | | | | |
United Rentals North America Inc., Senior Notes | | | 5.750 | % | | | 11/15/24 | | | | 300,000 | | | $ | 309,750 | |
West Corp., Senior Notes | | | 5.375 | % | | | 7/15/22 | | | | 550,000 | | | | 528,000 | (a) |
Total Commercial Services & Supplies | | | | | | | | | | | | | | | 1,969,978 | |
Construction & Engineering — 1.7% | | | | | | | | | | | | | | | | |
Aecom Technology Corp., Senior Notes | | | 5.875 | % | | | 10/15/24 | | | | 200,000 | | | | 205,000 | (a) |
Ausdrill Finance Pty Ltd., Senior Notes | | | 6.875 | % | | | 11/1/19 | | | | 350,000 | | | | 288,750 | (a) |
Michael Baker Holdings LLC/Michael Baker Finance Corp., Senior Notes | | | 8.875 | % | | | 4/15/19 | | | | 420,000 | | | | 407,400 | (a)(d) |
Michael Baker International LLC/CDL Acquisition Co. Inc., Senior Secured Notes | | | 8.250 | % | | | 10/15/18 | | | | 370,000 | | | | 370,000 | (a) |
Modular Space Corp., Secured Notes | | | 10.250 | % | | | 1/31/19 | | | | 270,000 | | | | 234,225 | (a) |
Total Construction & Engineering | | | | | | | | | | | | | | | 1,505,375 | |
Electrical Equipment — 0.7% | | | | | | | | | | | | | | | | |
International Wire Group Holdings Inc., Senior Secured Notes | | | 8.500 | % | | | 10/15/17 | | | | 240,000 | | | | 252,600 | (a) |
NES Rentals Holdings Inc., Senior Secured Notes | | | 7.875 | % | | | 5/1/18 | | | | 210,000 | | | | 214,200 | (a) |
WESCO Distribution Inc., Senior Notes | | | 5.375 | % | | | 12/15/21 | | | | 190,000 | | | | 192,613 | |
Total Electrical Equipment | | | | | | | | | | | | | | | 659,413 | |
Machinery — 1.1% | | | | | | | | | | | | | | | | |
CTP Transportation Products LLC/CTP Finance Inc.,
Senior Secured Notes | | | 8.250 | % | | | 12/15/19 | | | | 170,000 | | | | 180,200 | (a) |
Dematic SA/DH Services Luxembourg Sarl, Senior Notes | | | 7.750 | % | | | 12/15/20 | | | | 340,000 | | | | 357,850 | (a) |
Global Brass and Copper Inc., Senior Secured Notes | | | 9.500 | % | | | 6/1/19 | | | | 300,000 | | | | 325,500 | |
SPL Logistics Escrow LLC/SPL Logistics Finance Corp.,
Senior Secured Notes | | | 8.875 | % | | | 8/1/20 | | | | 130,000 | | | | 138,450 | (a) |
Total Machinery | | | | | | | | | | | | | | | 1,002,000 | |
Marine — 1.0% | | | | | | | | | | | | | | | | |
Horizon Lines LLC, Secured Notes | | | 15.000 | % | | | 10/15/16 | | | | 46,831 | | | | 45,423 | (c)(d) |
Horizon Lines LLC, Senior Secured Notes | | | 11.000 | % | | | 10/15/16 | | | | 284,000 | | | | 286,130 | (c) |
Navios Maritime Acquisition Corp./Navios Acquisition Finance U.S. Inc., Senior Secured Notes | | | 8.125 | % | | | 11/15/21 | | | | 300,000 | | | | 294,000 | (a) |
Ultrapetrol Bahamas Ltd., Senior Secured Notes | | | 8.875 | % | | | 6/15/21 | | | | 290,000 | | | | 307,400 | |
Total Marine | | | | | | | | | | | | | | | 932,953 | |
Professional Services — 0.2% | | | | | | | | | | | | | | | | |
IHS Inc., Senior Notes | | | 5.000 | % | | | 11/1/22 | | | | 120,000 | | | | 119,400 | (a) |
Road & Rail — 1.2% | | | | | | | | | | | | | | | | |
Flexi-Van Leasing Inc., Senior Notes | | | 7.875 | % | | | 8/15/18 | | | | 270,000 | | | | 268,650 | (a) |
Florida East Coast Holdings Corp., Senior Secured Notes | | | 6.750 | % | | | 5/1/19 | | | | 160,000 | | | | 158,800 | (a) |
Jack Cooper Holdings Corp., Senior Secured Notes | | | 9.250 | % | | | 6/1/20 | | | | 450,000 | | | | 470,250 | (a) |
Jurassic Holdings III Inc., Secured Notes | | | 6.875 | % | | | 2/15/21 | | | | 170,000 | | | | 158,950 | (a) |
Total Road & Rail | | | | | | | | | | | | | | | 1,056,650 | |
See Notes to Financial Statements.
| | |
| 20 | | Western Asset Variable High Income Portfolio 2014 Annual Report |
Western Asset Variable High Income Portfolio
| | | | | | | | | | | | | | | | |
| Security | | Rate | | | Maturity
Date | | | Face
Amount† | | | Value | |
Trading Companies & Distributors — 1.7% | | | | | | | | | | | | | | | | |
Ashtead Capital Inc., Secured Notes | | | 5.625 | % | | | 10/1/24 | | | | 340,000 | | | $ | 349,350 | (a) |
Ashtead Capital Inc., Senior Secured Notes | | | 6.500 | % | | | 7/15/22 | | | | 290,000 | | | | 309,575 | (a) |
H&E Equipment Services Inc., Senior Notes | | | 7.000 | % | | | 9/1/22 | | | | 300,000 | | | | 310,125 | |
KLX Inc., Senior Notes | | | 5.875 | % | | | 12/1/22 | | | | 200,000 | | | | 202,500 | (a) |
United Rentals North America Inc., Senior Notes | | | 6.125 | % | | | 6/15/23 | | | | 350,000 | | | | 369,250 | |
Total Trading Companies & Distributors | | | | | | | | | | | | | | | 1,540,800 | |
Transportation — 1.5% | | | | | | | | | | | | | | | | |
Hapag-Lloyd AG, Senior Notes | | | 9.750 | % | | | 10/15/17 | | | | 290,000 | | | | 297,250 | (a) |
Neovia Logistics Intermediate Holdings LLC/Logistics Intermediate Finance Corp., Senior Notes | | | 10.000 | % | | | 2/15/18 | | | | 390,000 | | | | 397,800 | (a)(d) |
Syncreon Group BV/Syncreon Global Finance US Inc., Senior Notes | | | 8.625 | % | | | 11/1/21 | | | | 360,000 | | | | 340,200 | (a) |
Watco Cos., LLC/Watco Finance Corp., Senior Notes | | | 6.375 | % | | | 4/1/23 | | | | 280,000 | | | | 278,600 | (a) |
Total Transportation | | | | | | | | | | | | | | | 1,313,850 | |
Total Industrials | | | | | | | | | | | | | | | 15,598,079 | |
| Information Technology — 2.6% | | | | | | | | | | | | | | | | |
Electronic Equipment, Instruments & Components — 0.3% | | | | | | | | | | | | | | | | |
Interface Security Systems Holdings Inc./Interface Security Systems LLC, Senior Secured Notes | | | 9.250 | % | | | 1/15/18 | | | | 230,000 | | | | 233,450 | |
KEMET Corp., Senior Secured Notes | | | 10.500 | % | | | 5/1/18 | | | | 50,000 | | | | 51,500 | |
Total Electronic Equipment, Instruments & Components | | | | | | | | | | | | | | | 284,950 | |
Internet Software & Services — 0.8% | | | | | | | | | | | | | | | | |
Ancestry.com Inc., Senior Notes | | | 9.625 | % | | | 10/15/18 | | | | 200,000 | | | | 197,000 | (a)(d) |
Ancestry.com Inc., Senior Notes | | | 11.000 | % | | | 12/15/20 | | | | 150,000 | | | | 169,688 | |
Equinix Inc., Senior Notes | | | 5.375 | % | | | 1/1/22 | | | | 180,000 | | | | 182,592 | |
Equinix Inc., Senior Notes | | | 5.750 | % | | | 1/1/25 | | | | 190,000 | | | | 192,612 | |
Total Internet Software & Services | | | | | | | | | | | | | | | 741,892 | |
IT Services — 1.2% | | | | | | | | | | | | | | | | |
Compiler Finance Subordinated Inc., Senior Notes | | | 7.000 | % | | | 5/1/21 | | | | 250,000 | | | | 216,250 | (a) |
First Data Corp., Secured Notes | | | 8.750 | % | | | 1/15/22 | | | | 180,000 | | | | 194,400 | (a)(d) |
First Data Corp., Senior Notes | | | 12.625 | % | | | 1/15/21 | | | | 200,000 | | | | 238,000 | |
First Data Corp., Senior Subordinated Notes | | | 11.750 | % | | | 8/15/21 | | | | 202,000 | | | | 232,805 | |
Interactive Data Corp., Senior Notes | | | 5.875 | % | | | 4/15/19 | | | | 160,000 | | | | 159,600 | (a) |
Total IT Services | | | | | | | | | | | | | | | 1,041,055 | |
Software — 0.3% | | | | | | | | | | | | | | | | |
Activision Blizzard Inc., Senior Notes | | | 5.625 | % | | | 9/15/21 | | | | 160,000 | | | | 168,400 | (a) |
Audatex North America Inc., Senior Notes | | | 6.125 | % | | | 11/1/23 | | | | 90,000 | | | | 93,375 | (a) |
Total Software | | | | | | | | | | | | | | | 261,775 | |
Total Information Technology | | | | | | | | | | | | | | | 2,329,672 | |
See Notes to Financial Statements.
| | |
| Western Asset Variable High Income Portfolio 2014 Annual Report | | 21 |
Schedule of investments (cont’d)
December 31, 2014
Western Asset Variable High Income Portfolio
| | | | | | | | | | | | | | | | |
| Security | | Rate | | | Maturity
Date | | | Face
Amount† | | | Value | |
| Materials — 8.4% | | | | | | | | | | | | | | | | |
Chemicals — 1.4% | | | | | | | | | | | | | | | | |
Axiall Corp., Senior Notes | | | 4.875 | % | | | 5/15/23 | | | | 180,000 | | | $ | 170,550 | |
Eagle Spinco Inc., Senior Subordinated Notes | | | 4.625 | % | | | 2/15/21 | | | | 130,000 | | | | 123,662 | |
Eco Services Operations LLC/Eco Finance Corp., Senior Notes | | | 8.500 | % | | | 11/1/22 | | | | 130,000 | | | | 132,600 | (a) |
Hexion U.S. Finance Corp./Hexion Nova Scotia Finance ULC, Senior Secured Notes | | | 8.875 | % | | | 2/1/18 | | | | 210,000 | | | | 187,425 | |
HIG BBC Intermediate Holdings LLC/HIG BBC Holdings Corp., Senior Notes | | | 10.500 | % | | | 9/15/18 | | | | 150,000 | | | | 146,250 | (a)(d) |
Kerling PLC, Senior Secured Notes | | | 10.625 | % | | | 2/1/17 | | | | 189,000 | EUR | | | 231,650 | (a) |
KP Germany Erste GmbH, Senior Secured Notes | | | 11.625 | % | | | 7/15/17 | | | | 110,000 | EUR | | | 143,229 | (a) |
KP Germany Erste GmbH, Senior Secured Notes | | | 11.625 | % | | | 7/15/17 | | | | 100,000 | EUR | | | 130,209 | (f) |
Total Chemicals | | | | | | | | | | | | | | | 1,265,575 | |
Construction Materials — 0.7% | | | | | | | | | | | | | | | | |
American Builders & Contractors Supply Co. Inc., Senior Notes | | | 5.625 | % | | | 4/15/21 | | | | 380,000 | | | | 382,850 | (a) |
Hardwoods Acquisition Inc., Senior Secured Notes | | | 7.500 | % | | | 8/1/21 | | | | 240,000 | | | | 237,600 | (a) |
Total Construction Materials | | | | | | | | | | | | | | | 620,450 | |
Containers & Packaging — 2.9% | | | | | | �� | | | | | | | | | | |
Ardagh Finance Holdings SA, Senior Notes | | | 8.625 | % | | | 6/15/19 | | | | 240,084 | | | | 237,683 | (a)(d) |
Ardagh Packaging Finance PLC/Ardagh MP Holdings USA Inc., Senior Notes | | | 9.125 | % | | | 10/15/20 | | | | 460,000 | | | | 489,900 | (a) |
Ardagh Packaging Finance PLC/Ardagh MP Holdings USA Inc., Senior Notes | | | 7.000 | % | | | 11/15/20 | | | | 49,412 | | | | 50,153 | (a) |
Ardagh Packaging Finance PLC/Ardagh MP Holdings USA Inc., Senior Secured Notes | | | 3.241 | % | | | 12/15/19 | | | | 310,000 | | | | 300,313 | (a)(g) |
BWAY Holding Co., Senior Notes | | | 9.125 | % | | | 8/15/21 | | | | 300,000 | | | | 301,500 | (a) |
Coveris Holdings SA, Senior Notes | | | 7.875 | % | | | 11/1/19 | | | | 200,000 | | | | 207,000 | (a) |
Pactiv LLC, Senior Bonds | | | 8.375 | % | | | 4/15/27 | | | | 570,000 | | | | 578,550 | |
Pactiv LLC, Senior Notes | | | 7.950 | % | | | 12/15/25 | | | | 10,000 | | | | 10,100 | |
Reynolds Group Issuer Inc./Reynolds Group Issuer LLC/Reynolds Group Issuer (Luxembourg) SA, Senior Secured Notes | | | 5.750 | % | | | 10/15/20 | | | | 410,000 | | | | 422,300 | |
Total Containers & Packaging | | | | | | | | | | | | | | | 2,597,499 | |
Metals & Mining — 2.7% | | | | | | | | | | | | | | | | |
Barminco Finance Pty Ltd., Senior Notes | | | 9.000 | % | | | 6/1/18 | | | | 250,000 | | | | 228,750 | (a) |
Coeur Mining Inc., Senior Notes | | | 7.875 | % | | | 2/1/21 | | | | 310,000 | | | | 245,675 | |
FMG Resources (August 2006) Pty Ltd., Senior Notes | | | 6.875 | % | | | 2/1/18 | | | | 80,000 | | | | 72,800 | (a) |
FMG Resources (August 2006) Pty Ltd., Senior Notes | | | 8.250 | % | | | 11/1/19 | | | | 80,000 | | | | 73,100 | (a) |
FMG Resources (August 2006) Pty Ltd., Senior Notes | | | 6.875 | % | | | 4/1/22 | | | | 390,000 | | | | 326,138 | (a) |
Midwest Vanadium Pty Ltd., Senior Secured Notes | | | 11.500 | % | | | 2/15/18 | | | | 320,000 | | | | 51,200 | (a)(c)(e) |
Mirabela Nickel Ltd., Subordinated Notes | | | 1.000 | % | | | 9/10/44 | | | | 2,911 | | | | 0 | (a)(b)(c)(i) |
Prince Mineral Holding Corp., Senior Secured Notes | | | 12.500 | % | | | 12/15/19 | | | | 140,000 | | | | 143,500 | (a) |
See Notes to Financial Statements.
| | |
| 22 | | Western Asset Variable High Income Portfolio 2014 Annual Report |
Western Asset Variable High Income Portfolio
| | | | | | | | | | | | | | | | |
| Security | | Rate | | | Maturity
Date | | | Face
Amount† | | | Value | |
Metals & Mining — continued | | | | | | | | | | | | | | | | |
Ryerson Inc./Joseph T. Ryerson & Son Inc., Senior Secured Notes | | | 9.000 | % | | | 10/15/17 | | | | 260,000 | | | $ | 267,800 | |
Schaeffler Holding Finance BV, Senior Secured Notes | | | 6.875 | % | | | 8/15/18 | | | | 290,000 | EUR | | | 365,828 | (a)(d) |
Schaeffler Holding Finance BV, Senior Secured Notes | | | 6.750 | % | | | 11/15/22 | | | | 310,000 | | | | 325,500 | (a)(d) |
Thompson Creek Metals Co. Inc., Senior Notes | | | 12.500 | % | | | 5/1/19 | | | | 350,000 | | | | 349,125 | |
Total Metals & Mining | | | | | | | | | | | | | | | 2,449,416 | |
Paper & Forest Products — 0.7% | | | | | | | | | | | | | | | | |
Appvion Inc., Secured Notes | | | 9.000 | % | | | 6/1/20 | | | | 320,000 | | | | 220,800 | (a) |
Resolute Forest Products Inc., Senior Notes | | | 5.875 | % | | | 5/15/23 | | | | 170,000 | | | | 162,350 | |
Verso Paper Holdings LLC/Verso Paper Inc., Senior Secured Notes | | | 11.750 | % | | | 1/15/19 | | | | 260,000 | | | | 261,300 | |
Total Paper & Forest Products | | | | | | | | | | | | | | | 644,450 | |
Total Materials | | | | | | | | | | | | | | | 7,577,390 | |
| Telecommunication Services — 6.3% | | | | | | | | | | | | | | | | |
Diversified Telecommunication Services — 3.3% | | | | | | | | | | | | | | | | |
CCOH Safari LLC, Senior Bonds | | | 5.500 | % | | | 12/1/22 | | | | 140,000 | | | | 142,450 | |
CCOH Safari LLC, Senior Bonds | | | 5.750 | % | | | 12/1/24 | | | | 230,000 | | | | 233,162 | |
CenturyLink Inc., Senior Notes | | | 6.450 | % | | | 6/15/21 | | | | 250,000 | | | | 269,375 | |
CenturyLink Inc., Senior Notes | | | 5.800 | % | | | 3/15/22 | | | | 130,000 | | | | 135,525 | |
CenturyLink Inc., Senior Notes | | | 6.750 | % | | | 12/1/23 | | | | 60,000 | | | | 65,925 | |
Cincinnati Bell Telephone Co., Senior Debentures | | | 6.300 | % | | | 12/1/28 | | | | 70,000 | | | | 66,325 | |
Cogent Communications Holdings Inc., Senior Secured Notes | | | 8.375 | % | | | 2/15/18 | | | | 520,000 | | | | 546,000 | (a) |
Intelsat Jackson Holdings SA, Senior Bonds | | | 5.500 | % | | | 8/1/23 | | | | 260,000 | | | | 259,389 | |
Intelsat Jackson Holdings SA, Senior Notes | | | 7.500 | % | | | 4/1/21 | | | | 120,000 | | | | 128,850 | |
Level 3 Financing Inc., Senior Notes | | | 8.625 | % | | | 7/15/20 | | | | 520,000 | | | | 563,550 | |
Windstream Corp., Senior Notes | | | 7.750 | % | | | 10/1/21 | | | | 110,000 | | | | 112,750 | |
Windstream Corp., Senior Notes | | | 7.500 | % | | | 4/1/23 | | | | 460,000 | | | | 460,000 | |
Total Diversified Telecommunication Services | | | | | | | | | | | | | | | 2,983,301 | |
Wireless Telecommunication Services — 3.0% | | | | | | | | | | | | | | | | |
Sprint Capital Corp., Senior Notes | | | 6.875 | % | | | 11/15/28 | | | | 40,000 | | | | 35,400 | |
Sprint Capital Corp., Senior Notes | | | 8.750 | % | | | 3/15/32 | | | | 1,560,000 | | | | 1,517,100 | |
Sprint Corp., Senior Notes | | | 7.875 | % | | | 9/15/23 | | | | 800,000 | | | | 793,760 | |
Sprint Corp., Senior Notes | | | 7.125 | % | | | 6/15/24 | | | | 30,000 | | | | 28,050 | |
VimpelCom Holdings BV, Senior Notes | | | 5.950 | % | | | 2/13/23 | | | | 410,000 | | | | 315,495 | (a) |
Total Wireless Telecommunication Services | | | | | | | | | | | | | | | 2,689,805 | |
Total Telecommunication Services | | | | | | | | | | | | | | | 5,673,106 | |
| Utilities — 3.3% | | | | | | | | | | | | | | | | |
Electric Utilities — 1.7% | | | | | | | | | | | | | | | | |
AES Red Oak LLC, Secured Notes | | | 9.200 | % | | | 11/30/29 | | | | 530,000 | | | | 583,000 | |
GenOn REMA LLC, Pass-Through Certificates | | | 9.237 | % | | | 7/2/17 | | | | 422,539 | | | | 451,060 | |
See Notes to Financial Statements.
| | |
| Western Asset Variable High Income Portfolio 2014 Annual Report | | 23 |
Schedule of investments (cont’d)
December 31, 2014
Western Asset Variable High Income Portfolio
| | | | | | | | | | | | | | | | |
| Security | | Rate | | | Maturity
Date | | | Face
Amount† | | | Value | |
Electric Utilities — continued | | | | | | | | | | | | | | | | |
GenOn REMA LLC, Pass-Through Certificates | | | 9.681 | % | | | 7/2/26 | | | | 350,000 | | | $ | 372,750 | |
Midwest Generation LLC, Pass-Through Certificates | | | 8.560 | % | | | 1/2/16 | | | | 92,532 | | | | 93,458 | |
Total Electric Utilities | | | | | | | | | | | | | | | 1,500,268 | |
Gas Utilities — 0.5% | | | | | | | | | | | | | | | | |
Southern Natural Gas Co., Senior Notes | | | 8.000 | % | | | 3/1/32 | | | | 130,000 | | | | 168,855 | |
Suburban Propane Partners LP/Suburban Energy Finance Corp., Senior Notes | | | 5.500 | % | | | 6/1/24 | | | | 260,000 | | | | 251,550 | |
Total Gas Utilities | | | | | | | | | | | | | | | 420,405 | |
Independent Power and Renewable Electricity Producers — 1.1% | | | | | | | | | | | | | |
AES Corp., Senior Notes | | | 4.875 | % | | | 5/15/23 | | | | 300,000 | | | | 299,250 | |
AES Corp., Senior Notes | | | 5.500 | % | | | 3/15/24 | | | | 60,000 | | | | 61,188 | |
Atlantic Power Corp., Senior Notes | | | 9.000 | % | | | 11/15/18 | | | | 30,000 | | | | 29,850 | |
Calpine Corp., Senior Secured Notes | | | 6.000 | % | | | 1/15/22 | | | | 420,000 | | | | 449,400 | (a) |
Dynegy Roseton LLC/Dynegy Danskammer LLC Pass-Through Trust, Escrow Receipt | | | — | | | | — | | | | 140,000 | | | | 0 | (b)(c)(e)(i) |
Foresight Energy LLC/Foresight Energy Corp., Senior Notes | | | 7.875 | % | | | 8/15/21 | | | | 200,000 | | | | 198,500 | (a) |
Total Independent Power and Renewable Electricity Producers | | | | | | | | 1,038,188 | |
Total Utilities | | | | | | | | | | | | | | | 2,958,861 | |
Total Corporate Bonds & Notes (Cost — $83,041,638) | | | | | | | | | | | | 79,697,720 | |
| Convertible Bonds & Notes — 0.3% | | | | | | | | | | | | | | | | |
| Materials — 0.3% | | | | | | | | | | | | | | | | |
Chemicals — 0.1% | | | | | | | | | | | | | | | | |
Hercules Inc., Junior Subordinated Bonds | | | 6.500 | % | | | 6/30/29 | | | | 80,000 | | | | 74,504 | |
Metals & Mining — 0.2% | | | | | | | | | | | | | | | | |
Mirabela Nickel Ltd., Senior Secured Bonds | | | 9.500 | % | | | 6/24/19 | | | | 272,350 | | | | 224,689 | (a)(c)(d) |
Total Convertible Bonds & Notes (Cost — $345,858) | | | | 299,193 | |
| Senior Loans — 3.8% | | | | | | | | | | | | | | | | |
| Consumer Discretionary — 1.2% | | | | | | | | | | | | | | | | |
Hotels, Restaurants & Leisure — 0.3% | | | | | | | | | | | | | | | | |
Equinox Holdings Inc., Second Lien Term Loan | | | 9.750 | % | | | 7/31/20 | | | | 290,000 | | | | 295,800 | (j)(k) |
Media — 0.3% | | | | | | | | | | | | | | | | |
AP NMT Acquisition BV, USD Second Lien Term Loan | | | 10.000 | % | | | 8/13/22 | | | | 290,000 | | | | 279,850 | (j)(k) |
Specialty Retail — 0.5% | | | | | | | | | | | | | | | | |
Camping World Inc., Term Loan | | | 5.750 | % | | | 2/20/20 | | | | 333,625 | | | | 332,374 | (j)(k) |
Gymboree Corp., Initial Term Loan | | | 5.000 | % | | | 2/23/18 | | | | 140,000 | | | | 92,400 | (j)(k) |
Total Specialty Retail | | | | | | | | | | | | | | | 424,774 | |
Textiles, Apparel & Luxury Goods — 0.1% | | | | | | | | | | | | | | | | |
TOMS Shoes LLC, Term Loan B | | | 6.500 | % | | | 10/28/20 | | | | 150,000 | | | | 138,500 | (j)(k) |
Total Consumer Discretionary | | | | | | | | | | | | | | | 1,138,924 | |
See Notes to Financial Statements.
| | |
| 24 | | Western Asset Variable High Income Portfolio 2014 Annual Report |
Western Asset Variable High Income Portfolio
| | | | | | | | | | | | | | | | |
| Security | | Rate | | | Maturity
Date | | | Face
Amount† | | | Value | |
| Consumer Staples — 0.1% | | | | | | | | | | | | | | | | |
Food Products — 0.1% | | | | | | | | | | | | | | | | |
AdvancePierre Foods Inc., Second Lien Term Loan | | | 9.500 | % | | | 10/10/17 | | | | 120,000 | | | $ | 118,800 | (j)(k) |
| Energy — 0.1% | | | | | | | | | | | | | | | | |
Oil, Gas & Consumable Fuels — 0.1% | | | | | | | | | | | | | | | | |
Westmoreland Coal Co., Term Loan B | | | 7.500 | % | | | 10/16/20 | | | | 140,000 | | | | 137,550 | (j)(k) |
| Health Care — 1.0% | | | | | | | | | | | | | | | | |
Health Care Equipment & Supplies — 0.2% | | | | | | | | | | | | | | | | |
Immucor Inc., REFI Term Loan B2 | | | 5.000 | % | | | 8/17/18 | | | | 174,202 | | | | 172,677 | (j)(k) |
Health Care Providers & Services — 0.8% | | | | | | | | | | | | | | | | |
CRC Health Corp., Second Lien Term Loan | | | 9.000 | % | | | 9/28/21 | | | | 200,000 | | | | 204,875 | (j)(k) |
Physiotherapy Associates Holdings Inc., Exit Term Loan | | | 11.000 | % | | | 1/2/17 | | | | 240,000 | | | | 239,700 | (c)(j)(k) |
Radnet Management Inc., Second Lien Term Loan | | | 8.000 | % | | | 3/25/21 | | | | 260,000 | | | | 258,700 | (j)(k) |
Total Health Care Providers & Services | | | | | | | | | | | | | | | 703,275 | |
Total Health Care | | | | | | | | | | | | | | | 875,952 | |
| Industrials — 0.3% | | | | | | | | | | | | | | | | |
Machinery — 0.3% | | | | | | | | | | | | | | | | |
Intelligrated Inc., First Lien Term Loan | | | 4.500-5.750 | % | | | 7/30/18 | | | | 268,633 | | | | 262,588 | (j)(k) |
| Materials — 0.4% | | | | | | | | | | | | | | | | |
Chemicals — 0.3% | | | | | | | | | | | | | | | | |
Kronos Inc., Second Lien Term Loan | | | 9.750 | % | | | 4/30/20 | | | | 229,820 | | | | 234,847 | (j)(k) |
Metals & Mining — 0.1% | | | | | | | | | | | | | | | | |
Essar Steel Algoma Inc., Term Loan | | | 7.500 | % | | | 8/9/19 | | | | 99,750 | | | | 99,376 | (j)(k) |
Total Materials | | | | | | | | | | | | | | | 334,223 | |
| Utilities — 0.7% | | | | | | | | | | | | | | | | |
Independent Power and Renewable Electricity Producers — 0.7% | | | | | | | | | | | | | |
Energy Future Intermediate Holding Co., LLC, DIP Term Loan | | | 4.250 | % | | | 6/19/16 | | | | 426,974 | | | | 427,642 | (j)(k) |
TPF II Power LLC, Term Loan B | | | 5.500 | % | | | 10/2/21 | | | | 170,000 | | | | 169,504 | (j)(k) |
Total Utilities | | | | | | | | | | | | | | | 597,146 | |
Total Senior Loans (Cost — $3,455,255) | | | | | | | | | | | | | | | 3,465,183 | |
| Sovereign Bonds — 0.6% | | | | | | | | | | | | | | | | |
Mexico — 0.6% | | | | | | | | | | | | | | | | |
United Mexican States, Bonds (Cost — $592,605) | | | 6.500 | % | | | 6/9/22 | | | | 7,188,000 | MXN | | | 512,034 | |
| | | | |
| | | | | | | | | Shares | | | | |
| Common Stocks — 2.6% | | | | | | | | | | | | | | | | |
| Consumer Discretionary — 0.3% | | | | | | | | | | | | | | | | |
Automobiles — 0.3% | | | | | | | | | | | | | | | | |
Ford Motor Co. | | | | | | | | | | | 16,174 | | | | 250,697 | |
Hotels, Restaurants & Leisure — 0.0% | | | | | | | | | | | | | | | | |
Bossier Casino Venture Holdco Inc. | | | | | | | | | | | 22,038 | | | | 0 | *(b)(c)(i) |
See Notes to Financial Statements.
| | |
| Western Asset Variable High Income Portfolio 2014 Annual Report | | 25 |
Schedule of investments (cont’d)
December 31, 2014
Western Asset Variable High Income Portfolio
| | | | | | | | | | | | | | |
| Security | | Rate | | | | | Shares | | | Value | |
Media — 0.0% | | | | | | | | | | | | | | |
New Cotai LLC/New Cotai Capital Corp., Class B Shares | | | | | | | | | 1 | | | $ | 27,838 | *(c) |
Total Consumer Discretionary | | | | | | | | | | | | | 278,535 | |
| Energy — 0.3% | | | | | | | | | | | | | | |
Energy Equipment & Services — 0.3% | | | | | | | | | | | | | | |
KCAD Holdings I Ltd. | | | | | | | | | 108,106,087 | | | | 222,807 | *(b)(c) |
| Financials — 0.7% | | | | | | | | | | | | | | |
Banks — 0.7% | | | | | | | | | | | | | | |
Citigroup Inc. | | | | | | | | | 6,981 | | | | 377,742 | |
JPMorgan Chase & Co. | | | | | | | | | 4,380 | | | | 274,100 | |
Total Financials | | | | | | | | | | | | | 651,842 | |
| Health Care — 0.3% | | | | | | | | | | | | | | |
Health Care Providers & Services — 0.3% | | | | | | | | | | | | | | |
Physiotherapy Associates Holdings Inc. | | | | | | | | | 3,500 | | | | 290,500 | *(b)(c) |
| Industrials — 1.0% | | | | | | | | | | | | | | |
Marine — 1.0% | | | | | | | | | | | | | | |
DeepOcean Group Holding AS | | | | | | | | | 33,669 | | | | 824,507 | *(b)(c) |
Horizon Lines Inc., Class A Shares | | | | | | | | | 123,758 | | | | 78,104 | *(c) |
Total Industrials | | | | | | | | | | | | | 902,611 | |
| Materials — 0.0% | | | | | | | | | | | | | | |
Metals & Mining — 0.0% | | | | | | | | | | | | | | |
Mirabela Nickel Ltd. | | | | | | | | | 638,674 | | | | 15,025 | *(b) |
Total Common Stocks (Cost — $3,150,788) | | | | | | | | | | 2,361,320 | |
| Preferred Stocks — 1.9% | | | | | | | | | | | | | | |
| Energy — 0.1% | | | | | | | | | | | | | | |
Oil, Gas & Consumable Fuels — 0.1% | | | | | | | | | | | | | | |
Rex Energy Corp. | | | 6.000 | % | | | | | 1,700 | | | | 90,797 | |
| Financials — 1.8% | | | | | | | | | | | | | | |
Consumer Finance — 1.1% | | | | | | | | | | | | | | |
GMAC Capital Trust I | | | 8.125 | % | | | | | 36,969 | | | | 975,242 | (g) |
Diversified Financial Services — 0.7% | | | | | | | | | | | | | | |
Citigroup Capital XIII | | | 7.875 | % | | | | | 25,825 | | | | 686,429 | (g) |
Total Financials | | | | | | | | | | | | | 1,661,671 | |
Total Preferred Stocks (Cost — $1,699,157) | | | | | | | | | | 1,752,468 | |
See Notes to Financial Statements.
| | |
| 26 | | Western Asset Variable High Income Portfolio 2014 Annual Report |
Western Asset Variable High Income Portfolio
| | | | | | | | | | | | | | |
| | | | | Expiration
Date | | | Warrants | | | Value | |
| Warrants — 0.2% | | | | | | | | | | | | | | |
Jack Cooper Holdings Corp. | | | | | 12/15/17 | | | | 668 | | | $ | 106,880 | *(a) |
Jack Cooper Holdings Corp. | | | | | 5/6/18 | | | | 297 | | | | 47,520 | *(a) |
Total Warrants (Cost — $16,238) | | | | | | | | | | | | | 154,400 | |
Total Investments — 97.6% (Cost — $92,301,539#) | | | | | | | | | | | | | 88,242,318 | |
Other Assets in Excess of Liabilities — 2.4% | | | | | | | | | | | | | 2,161,026 | |
Total Net Assets — 100.0% | | | | | | | | | | | | $ | 90,403,344 | |
| † | Face amount denominated in U.S. dollars, unless otherwise noted. |
| * | Non-income producing security. |
| (a) | Security is exempt from registration under Rule 144A of the Securities Act of 1933. This security may be resold in transactions that are exempt from registration, normally to qualified institutional buyers. This security has been deemed liquid pursuant to guidelines approved by the Board of Trustees, unless otherwise noted. |
| (b) | Security is valued in good faith in accordance with procedures approved by the Board of Trustees (See Note 1). |
| (c) | Illiquid security (unaudited). |
| (d) | Payment-in-kind security for which the issuer has the option at each interest payment date of making interest payments in cash or additional debt securities. |
| (e) | The coupon payment on these securities is currently in default as of December 31, 2014. |
| (f) | Security is exempt from registration under Regulation S of the Securities Act of 1933. Regulation S applies to securities offerings that are made outside of the United States and do not involve direct selling efforts in the United States. This security has been deemed liquid pursuant to guidelines approved by the Board of Trustees, unless otherwise noted. |
| (g) | Variable rate security. Interest rate disclosed is as of the most recent information available. |
| (h) | Security has no maturity date. The date shown represents the next call date. |
| (i) | Value is less than $1. |
| (j) | Interest rates disclosed represent the effective rates on senior loans. Ranges in interest rates are attributable to multiple contracts under the same loan. |
| (k) | Senior loans may be considered restricted in that the Portfolio ordinarily is contractually obligated to receive approval from the agent bank and/or borrower prior to the disposition of a senior loan. |
| # | Aggregate cost for federal income tax purposes is $92,483,699. |
| | |
Abbreviations used in this schedule: |
| AUD | | — Australian Dollar |
| EUR | | — Euro |
| MXN | | — Mexican Peso |
See Notes to Financial Statements.
| | |
| Western Asset Variable High Income Portfolio 2014 Annual Report | | 27 |
Statement of assets and liabilities
December 31, 2014
| | | | |
|
| Assets: | |
Investments, at value (Cost — $92,301,539) | | $ | 88,242,318 | |
Foreign currency, at value (Cost — $131,578) | | | 125,208 | |
Cash | | | 369,857 | |
Interest receivable | | | 1,629,124 | |
Receivable for securities sold | | | 484,700 | |
Unrealized appreciation on forward foreign currency contracts | | | 52,017 | |
Receivable for Portfolio shares sold | | | 1,977 | |
Prepaid expenses | | | 1,726 | |
Total Assets | | | 90,906,927 | |
| |
| Liabilities: | | | | |
Payable for securities purchased | | | 356,753 | |
Investment management fee payable | | | 45,966 | |
Payable for Portfolio shares repurchased | | | 18,842 | |
Unrealized depreciation on forward foreign currency contracts | | | 4,499 | |
Trustees’ fees payable | | | 228 | |
Accrued expenses | | | 77,295 | |
Total Liabilities | | | 503,583 | |
| Total Net Assets | | $ | 90,403,344 | |
| |
| Net Assets: | | | | |
Par value (Note 5) | | $ | 162 | |
Paid-in capital in excess of par value | | | 126,232,172 | |
Overdistributed net investment income | | | (71,477) | |
Accumulated net realized loss on investments, swap contracts and foreign currency transactions | | | (31,735,393) | |
Net unrealized depreciation on investments and foreign currencies | | | (4,022,120) | |
| Total Net Assets | | $ | 90,403,344 | |
| |
| Shares Outstanding | | | 16,157,335 | |
| |
| Net Asset Value | | | $5.60 | |
See Notes to Financial Statements.
| | |
| 28 | | Western Asset Variable High Income Portfolio 2014 Annual Report |
Statement of operations
For the Year Ended December 31, 2014
| | | | |
|
| Investment Income: | |
Interest | | $ | 7,206,961 | |
Dividends | | | 165,184 | |
Total Investment Income | | | 7,372,145 | |
| |
| Expenses: | | | | |
Investment management fee (Note 2) | | | 607,349 | |
Shareholder reports | | | 50,425 | |
Audit and tax fees | | | 42,729 | |
Legal fees | | | 25,918 | |
Fund accounting fees | | | 10,393 | |
Transfer agent fees | | | 6,322 | |
Custody fees | | | 4,881 | |
Insurance | | | 2,984 | |
Trustees’ fees | | | 1,831 | |
Miscellaneous expenses | | | 2,900 | |
Total Expenses | | | 755,732 | |
| Net Investment Income | | | 6,616,413 | |
| |
Realized and Unrealized Gain (Loss) on Investments, Swap Contracts
and Foreign Currency Transactions (Notes 1, 3 and 4): | | | | |
Net Realized Gain (Loss) From: | | | | |
Investment transactions | | | 1,158,546 | |
Swap contracts | | | (147,658) | |
Foreign currency transactions | | | 120,704 | |
Net Realized Gain | | | 1,131,592 | |
Change in Net Unrealized Appreciation (Depreciation) From: | | | | |
Investments | | | (7,747,466) | |
Swap contracts | | | 93,150 | |
Foreign currencies | | | 73,075 | |
Change in Net Unrealized Appreciation (Depreciation) | | | (7,581,241) | |
| Net Loss on Investments, Swap Contracts and Foreign Currency Transactions | | | (6,449,649) | |
| Increase in Net Assets from Operations | | $ | 166,764 | |
See Notes to Financial Statements.
| | |
| Western Asset Variable High Income Portfolio 2014 Annual Report | | 29 |
Statements of changes in net assets
| | | | | | | | |
| For the Years Ended December 31, | | 2014 | | | 2013 | |
| | |
| Operations: | | | | | | | | |
Net investment income | | $ | 6,616,413 | | | $ | 7,998,148 | |
Net realized gain | | | 1,131,592 | | | | 2,859,564 | |
Change in net unrealized appreciation (depreciation) | | | (7,581,241) | | | | (742,594) | |
Increase in Net Assets from Operations | | | 166,764 | | | | 10,115,118 | |
| | |
| Distributions to Shareholders From (Note 1): | | | | | | | | |
Net investment income | | | (6,890,013) | | | | (7,850,013) | |
Decrease in Net Assets from Distributions to Shareholders | | | (6,890,013) | | | | (7,850,013) | |
| | |
| Portfolio Share Transactions (Note 5): | | | | | | | | |
Net proceeds from sale of shares | | | 1,366,469 | | | | 1,767,220 | |
Reinvestment of distributions | | | 6,890,013 | | | | 7,850,013 | |
Cost of shares repurchased | | | (19,375,346) | | | | (23,743,448) | |
Decrease in Net Assets from Portfolio Share Transactions | | | (11,118,864) | | | | (14,126,215) | |
Decrease in Net Assets | | | (17,842,113) | | | | (11,861,110) | |
| | |
| Net Assets: | | | | | | | | |
Beginning of year | | | 108,245,457 | | | | 120,106,567 | |
End of year* | | $ | 90,403,344 | | | $ | 108,245,457 | |
*Includes(overdistributed) undistributed net investment income, respectively, of: | | | $(71,477) | | | | $11,171 | |
See Notes to Financial Statements.
| | |
| 30 | | Western Asset Variable High Income Portfolio 2014 Annual Report |
Financial highlights
| | | | | | | | | | | | | | | | | | | | |
| For a share of beneficial interest outstanding throughout each year ended December 31: | |
| | | 20141 | | | 20131 | | | 20121 | | | 2011 | | | 2010 | |
| | | | | |
| Net asset value, beginning of year | | | $6.08 | | | | $6.00 | | | | $5.54 | | | | $5.95 | | | | $5.63 | |
| | | | | |
| Income (loss) from operations: | | | | | | | | | | | | | | | | | | | | |
Net investment income | | | 0.41 | | | | 0.44 | | | | 0.47 | | | | 0.55 | | | | 0.61 | |
Net realized and unrealized gain (loss) | | | (0.43) | | | | 0.11 | | | | 0.52 | | | | (0.41) | | | | 0.32 | |
Total income (loss) from operations | | | (0.02) | | | | 0.55 | | | | 0.99 | | | | 0.14 | | | | 0.93 | |
| | | | | |
| Less distributions from: | | | | | | | | | | | | | | | | | | | | |
Net investment income | | | (0.46) | | | | (0.47) | | | | (0.53) | | | | (0.55) | | | | (0.61) | |
Total distributions | | | (0.46) | | | | (0.47) | | | | (0.53) | | | | (0.55) | | | | (0.61) | |
| | | | | |
| Net asset value, end of year | | | $5.60 | | | | $6.08 | | | | $6.00 | | | | $5.54 | | | | $5.95 | |
Total return2 | | | (0.33) | % | | | 9.21 | % | | | 17.88 | % | | | 2.40 | % | | | 16.63 | % |
| | | | | |
| Net assets, end of year (millions) | | | $90 | | | | $108 | | | | $120 | | | | $126 | | | | $158 | |
| | | | | |
| Ratios to average net assets: | | | | | | | | | | | | | | | | | | | | |
Gross expenses | | | 0.75 | % | | | 0.74 | % | | | 0.72 | % | | | 0.68 | % | | | 0.68 | % |
Net expenses3,4 | | | 0.75 | | | | 0.74 | | | | 0.72 | | | | 0.68 | | | | 0.68 | |
Net investment income | | | 6.54 | | | | 6.97 | | | | 7.86 | | | | 8.01 | | | | 9.15 | |
| | | | | |
| Portfolio turnover rate | | | 68 | % | | | 75 | % | | | 76 | % | | | 68 | % | | | 97 | % |
| 1 | Per share amounts have been calculated using the average shares method. |
| 2 | Performance figures may reflect compensating balance arrangements, fee waivers and/or expense reimbursements. In the absence of compensating balance arrangements, fee waivers and/or expense reimbursements, the total return would have been lower. Total returns do not reflect expenses associated with separate accounts such as administrative fees, account charges and surrender charges which, if reflected, would reduce the total return for all periods shown. Past performance is no guarantee of future results. |
| 3 | The impact of compensating balance arrangements, if any, was less than 0.01%. |
| 4 | As a result of an expense limitation arrangement, the ratio of expenses, other than interest, brokerage, taxes, extraordinary expenses and acquired fund fees and expenses, to average net assets of shares did not exceed 1.00%. This expense limitation arrangement cannot be terminated prior to December 31, 2016 without the Board of Trustees’ consent. |
See Notes to Financial Statements.
| | |
| Western Asset Variable High Income Portfolio 2014 Annual Report | | 31 |
Notes to financial statements
1. Organization and significant accounting policies
Western Asset Variable High Income Portfolio (the “Portfolio”) is a separate diversified investment series of Legg Mason Partners Variable Income Trust (the “Trust”). The Trust, a Maryland statutory trust, is registered under the Investment Company Act of 1940, as amended (the “1940 Act”), as an open-end management investment company.
Shares of the Portfolio may only be purchased or redeemed through variable annuity contracts and variable life insurance policies offered by the separate accounts of participating insurance companies or through eligible pension or other qualified plans.
The following are significant accounting policies consistently followed by the Portfolio and are in conformity with U.S. generally accepted accounting principles (“GAAP”). Estimates and assumptions are required to be made regarding assets, liabilities and changes in net assets resulting from operations when financial statements are prepared. Changes in the economic environment, financial markets and any other parameters used in determining these estimates could cause actual results to differ. Subsequent events have been evaluated through the date the financial statements were issued.
(a) Investment valuation. The valuations for fixed income securities (which may include, but are not limited to, corporate, government, municipal, mortgage-backed, collateralized mortgage obligations and asset-backed securities) and certain derivative instruments are typically the prices supplied by independent third party pricing services, which may use market prices or broker/dealer quotations or a variety of valuation techniques and methodologies. The independent third party pricing services use inputs that are observable such as issuer details, interest rates, yield curves, prepayment speeds, credit risks/spreads, default rates and quoted prices for similar securities. Short-term fixed income securities that will mature in 60 days or less are valued at amortized cost, unless it is determined that using this method would not reflect an investment’s fair value. Investment in open-end funds are valued at the closing net asset value per share of each fund on the day of valuation. Equity securities for which market quotations are available are valued at the last reported sales price or official closing price on the primary market or exchange on which they trade. When the Portfolio holds securities or other assets that are denominated in a foreign currency, the Portfolio will normally use the currency exchange rates as of 4:00 p.m. (Eastern Time). If independent third party pricing services are unable to supply prices for a portfolio investment, or if the prices supplied are deemed by the manager to be unreliable, the market price may be determined by the manager using quotations from one or more broker/dealers or at the transaction price if the security has recently been purchased and no value has yet been obtained from a pricing service or pricing broker. When reliable prices are not readily available, such as when the value of a security has been significantly affected by events after the close of the exchange or market on which the security is principally traded, but before the Portfolio calculates its net asset value, the Portfolio values these securities as determined in accordance with procedures approved by the Portfolio’s Board of Trustees.
The Board of Trustees is responsible for the valuation process and has delegated the supervision of the daily valuation process to the Legg Mason North American Fund Valuation
| | |
| 32 | | Western Asset Variable High Income Portfolio 2014 Annual Report |
Committee (the “Valuation Committee”). The Valuation Committee, pursuant to the policies adopted by the Board of Trustees, is responsible for making fair value determinations, evaluating the effectiveness of the Portfolio’s pricing policies, and reporting to the Board of Trustees. When determining the reliability of third party pricing information for investments owned by the Portfolio, the Valuation Committee, among other things, conducts due diligence reviews of pricing vendors, monitors the daily change in prices and reviews transactions among market participants.
The Valuation Committee will consider pricing methodologies it deems relevant and appropriate when making fair value determinations. Examples of possible methodologies include, but are not limited to, multiple of earnings; discount from market of a similar freely traded security; discounted cash-flow analysis; book value or a multiple thereof; risk premium/yield analysis; yield to maturity; and/or fundamental investment analysis. The Valuation Committee will also consider factors it deems relevant and appropriate in light of the facts and circumstances. Examples of possible factors include, but are not limited to, the type of security; the issuer’s financial statements; the purchase price of the security; the discount from market value of unrestricted securities of the same class at the time of purchase; analysts’ research and observations from financial institutions; information regarding any transactions or offers with respect to the security; the existence of merger proposals or tender offers affecting the security; the price and extent of public trading in similar securities of the issuer or comparable companies; and the existence of a shelf registration for restricted securities.
For each portfolio security that has been fair valued pursuant to the policies adopted by the Board of Trustees, the fair value price is compared against the last available and next available market quotations. The Valuation Committee reviews the results of such back testing monthly and fair valuation occurrences are reported to the Board of Trustees quarterly.
The Portfolio uses valuation techniques to measure fair value that are consistent with the market approach and/or income approach, depending on the type of security and the particular circumstance. The market approach uses prices and other relevant information generated by market transactions involving identical or comparable securities. The income approach uses valuation techniques to discount estimated future cash flows to present value.
GAAP establishes a disclosure hierarchy that categorizes the inputs to valuation techniques used to value assets and liabilities at measurement date. These inputs are summarized in the three broad levels listed below:
| Ÿ | | Level 1 — quoted prices in active markets for identical investments |
| Ÿ | | Level 2 — other significant observable inputs (including quoted prices for similar investments, interest rates, prepayment speeds, credit risk, etc.) |
| Ÿ | | Level 3 — significant unobservable inputs (including the Portfolio’s own assumptions in determining the fair value of investments) |
The inputs or methodologies used to value securities are not necessarily an indication of the risk associated with investing in those securities.
| | |
| Western Asset Variable High Income Portfolio 2014 Annual Report | | 33 |
Notes to financial statements (cont’d)
The following is a summary of the inputs used in valuing the Portfolio’s assets and liabilities carried at fair value:
| | | | | | | | | | | | | | | | |
| ASSETS | |
| Description | | Quoted Prices
(Level 1) | | | Other Significant
Observable Inputs
(Level 2) | | | Significant
Unobservable
Inputs (Level 3) | | | Total | |
| Long-term investments†: | | | | | | | | | | | | | | | | |
Corporate bonds & notes: | | | | | | | | | | | | | | | | |
Consumer discretionary | | | — | | | $ | 13,330,516 | | | $ | 617,016 | | | $ | 13,947,532 | |
Materials | | | — | | | | 7,577,390 | | | | 0 | * | | | 7,577,390 | |
Utilities | | | — | | | | 2,958,861 | | | | 0 | * | | | 2,958,861 | |
Other corporate bonds & notes | | | — | | | | 55,213,937 | | | | — | | | | 55,213,937 | |
Convertible bonds & notes | | | — | | | | 299,193 | | | | — | | | | 299,193 | |
Senior loans | | | — | | | | 3,465,183 | | | | — | | | | 3,465,183 | |
Sovereign bonds | | | — | | | | 512,034 | | | | — | | | | 512,034 | |
Common stocks: | | | | | | | | | | | | | | | | |
Consumer discretionary | | $ | 250,697 | | | | 27,838 | | | | 0 | * | | | 278,535 | |
Energy | | | — | | | | — | | | | 222,807 | | | | 222,807 | |
Financials | | | 651,842 | | | | — | | | | — | | | | 651,842 | |
Health care | | | — | | | | — | | | | 290,500 | | | | 290,500 | |
Industrials | | | 78,104 | | | | — | | | | 824,507 | | | | 902,611 | |
Materials | | | — | | | | — | | | | 15,025 | | | | 15,025 | |
Preferred stocks: | | | | | | | | | | | | | | | | |
Energy | | | — | | | | 90,797 | | | | — | | | | 90,797 | |
Financials | | | 1,661,671 | | | | — | | | | — | | | | 1,661,671 | |
Warrants | | | — | | | | 154,400 | | | | — | | | | 154,400 | |
| Total investments | | $ | 2,642,314 | | | $ | 83,630,149 | | | $ | 1,969,855 | | | $ | 88,242,318 | |
| Other financial instruments: | | | | | | | | | | | | | | | | |
Forward foreign currency contracts | | | — | | | $ | 52,017 | | | | — | | | $ | 52,017 | |
| Total | | $ | 2,642,314 | | | $ | 83,682,166 | | | $ | 1,969,855 | | | $ | 88,294,335 | |
|
| LIABILITIES | |
| Description | | Quoted Prices
(Level 1) | | | Other Significant
Observable Inputs
(Level 2) | | | Significant
Unobservable
Inputs
(Level 3) | | | Total | |
| Other financial instruments: | | | | | | | | | | | | | | | | |
Forward foreign currency contracts | | | — | | | $ | 4,499 | | | | — | | | $ | 4,499 | |
| † | See Schedule of Investments for additional detailed categorizations. |
| * | Amount represents less than $1. |
| | |
| 34 | | Western Asset Variable High Income Portfolio 2014 Annual Report |
The following is a reconciliation of investments in which significant unobservable inputs (Level 3) were used in determining fair value:
| | | | | | | | | | | | | | | | | | | | |
| | | Corporate Bonds & Notes | | | | |
| Investments in Securities | | Consumer
Discretionary | | | Energy | | | Materials | | | Utilities | | | Total | |
| Balance as of December 31, 2013 | | $ | 562,130 | | | $ | 581,017 | | | $ | 40,000 | | | $ | 0 | * | | $ | 1,183,147 | |
| Accrued premiums/discounts | | | 6,345 | | | | 2,680 | | | | — | | | | — | | | | 9,025 | |
| Realized gain (loss)1 | | | — | | | | (31,419) | | | | 19,499 | | | | — | | | | (11,920) | |
| Change in unrealized appreciation (depreciation)2 | | | (59,725) | | | | (49,984) | | | | — | | | | — | | | | (109,709) | |
| Purchases | | | 108,266 | | | | 75,353 | | | | 20,001 | | | | — | | | | 203,620 | |
| Sales | | | — | | | | (177,033) | | | | (79,500) | | | | — | | | | (256,533) | |
| Transfers into Level 3 | | | — | | | | — | | | | — | | | | — | | | | — | |
| Transfers out of Level 33 | | | — | | | | (400,614) | | | | — | | | | — | | | | (400,614) | |
| Balance as of December 31, 2014 | | $ | 617,016 | | | | — | | | $ | 0 | * | | $ | 0 | * | | $ | 617,016 | |
| Net change in unrealized appreciation (depreciation) for investments in securities still held at December 31, 20142 | | $ | (59,725) | | | | — | | | | — | | | | — | | | $ | (59,725) | |
| | | | | | | | | | | | | | | | | | | | | | | | |
| | | Common Stocks | | | | |
| Investments in Securities | | Consumer
Discretionary | | | Energy | | | Healthcare | | | Industrials | | | Materials | | | Total | |
| Balance as of December 31, 2013 | | $ | 44,076 | | | $ | 921,712 | | | | — | | | $ | 1,109,579 | | | | — | | | $ | 2,075,367 | |
| Accrued premiums/discounts | | | — | | | | — | | | | — | | | | — | | | | — | | | | — | |
| Realized gain (loss) | | | — | | | | — | | | | — | | | | — | | | | — | | | | — | |
| Change in unrealized appreciation (depreciation)2 | | | (16,238) | | | | (698,905) | | | $ | 11,479 | | | | (285,072) | | | $ | (33,973) | | | | (1,022,709) | |
| Purchases | | | — | | | | — | | | | 279,021 | | | | — | | | | 48,998 | | | | 328,019 | |
| Sales | | | — | | | | — | | | | — | | | | — | | | | — | | | | — | |
| Transfers into Level 3 | | | — | | | | — | | | | — | | | | — | | | | — | | | | — | |
| Transfers out of Level 33 | | | (27,838) | | | | — | | | | — | | | | — | | | | — | | | | (27,838) | |
| Balance as of December 31, 2014 | | $ | 0 | * | | $ | 222,807 | | | $ | 290,500 | | | $ | 824,507 | | | $ | 15,025 | �� | | $ | 1,352,839 | |
| Net change in unrealized appreciation (depreciation) for investments in securities still held at December 31, 20142 | | $ | (16,238) | | | $ | (698,905) | | | $ | 11,479 | | | $ | (285,072) | | | $ | (33,973) | | | $ | (1,022,709) | |
The Portfolio’s policy is to recognize transfers between levels as of the end of the reporting period.
| * | Amount represents less than $1. |
| 1 | This amount is included in net realized gain (loss) from investment transactions in the accompanying Statement of Operations. |
| 2 | This amount is included in the change in net unrealized appreciation (depreciation) in the accompanying Statement of Operations. Change in unrealized appreciation (depreciation) includes net unrealized appreciation (depreciation) resulting from changes in investment values during the reporting period and the reversal of previously recorded unrealized appreciation (depreciation) when gains or losses are realized. |
| 3 | Transferred out of Level 3 as a result of the availability of a quoted price in an active market for an identical investment or the availability of other significant observable inputs. |
| | |
| Western Asset Variable High Income Portfolio 2014 Annual Report | | 35 |
Notes to financial statements (cont’d)
(b) Repurchase agreements. The Portfolio may enter into repurchase agreements with institutions that its investment adviser has determined are creditworthy. Each repurchase agreement is recorded at cost. Under the terms of a typical repurchase agreement, the Portfolio acquires a debt security subject to an obligation of the seller to repurchase, and of the Portfolio to resell, the security at an agreed-upon price and time, thereby determining the yield during the Portfolio’s holding period. When entering into repurchase agreements, it is the Portfolio’s policy that its custodian or a third party custodian, acting on the Portfolio’s behalf, take possession of the underlying collateral securities, the market value of which, at all times, at least equals the principal amount of the repurchase transaction, including accrued interest. To the extent that any repurchase transaction maturity exceeds one business day, the value of the collateral is marked-to-market and measured against the value of the agreement in an effort to ensure the adequacy of the collateral. If the counterparty defaults, the Portfolio generally has the right to use the collateral to satisfy the terms of the repurchase transaction. However, if the market value of the collateral declines during the period in which the Portfolio seeks to assert its rights or if bankruptcy proceedings are commenced with respect to the seller of the security, realization of the collateral by the Portfolio may be delayed or limited.
(c) Foreign currency translation. Investment securities and other assets and liabilities denominated in foreign currencies are translated into U.S. dollar amounts based upon prevailing exchange rates on the date of valuation. Purchases and sales of investment securities and income and expense items denominated in foreign currencies are translated into U.S. dollar amounts based upon prevailing exchange rates on the respective dates of such transactions.
The Portfolio does not isolate that portion of the results of operations resulting from fluctuations in foreign exchange rates on investments from the fluctuations arising from changes in market prices of securities held. Such fluctuations are included with the net realized and unrealized gain or loss on investments.
Net realized foreign exchange gains or losses arise from sales of foreign currencies, including gains and losses on forward foreign currency contracts, currency gains or losses realized between the trade and settlement dates on securities transactions, and the difference between the amounts of dividends, interest, and foreign withholding taxes recorded on the Portfolio’s books and the U.S. dollar equivalent of the amounts actually received or paid. Net unrealized foreign exchange gains and losses arise from changes in the values of assets and liabilities, other than investments in securities, on the date of valuation, resulting from changes in exchange rates.
Foreign security and currency transactions may involve certain considerations and risks not typically associated with those of U.S. dollar denominated transactions as a result of, among other factors, the possibility of lower levels of governmental supervision and regulation of foreign securities markets and the possibility of political or economic instability.
| | |
| 36 | | Western Asset Variable High Income Portfolio 2014 Annual Report |
(d) Forward foreign currency contracts. The Portfolio enters into a forward foreign currency contract to hedge against foreign currency exchange rate risk on its non-U.S. dollar denominated securities or to facilitate settlement of a foreign currency denominated portfolio transaction. A forward foreign currency contract is an agreement between two parties to buy and sell a currency at a set price with delivery and settlement at a future date. The contract is marked-to-market daily and the change in value is recorded by the Portfolio as an unrealized gain or loss. When a forward foreign currency contract is closed, through either delivery or offset by entering into another forward foreign currency contract, the Portfolio recognizes a realized gain or loss equal to the difference between the value of the contract at the time it was opened and the value of the contract at the time it is closed.
Forward foreign currency contracts involve elements of market risk in excess of the amounts reflected on the Statement of Assets and Liabilities. The Portfolio bears the risk of an unfavorable change in the foreign exchange rate underlying the forward foreign currency contract. Risks may also arise upon entering into these contracts from the potential inability of the counterparties to meet the terms of their contracts.
(e) Swap agreements. The Portfolio may invest in swaps for the purpose of managing its exposure to interest rate, credit or market risk, or for other purposes. The use of swaps involves risks that are different from those associated with other portfolio transactions. Swap agreements are privately negotiated in the over-the-counter market (“OTC Swaps”) or may be executed on a registered exchange (“Centrally Cleared Swaps”). Unlike Centrally Cleared Swaps, the Portfolio has credit exposure to the counterparties of OTC Swaps.
Swap contracts are marked-to-market daily and changes in value are recorded as unrealized appreciation (depreciation). The daily change in valuation of Centrally Cleared Swaps, if any, is recorded as a receivable or payable for variation margin on the Statement of Assets and Liabilities. Gains or losses are realized upon termination of the swap agreement. Collateral, in the form of restricted cash or securities, may be required to be held in segregated accounts with the Portfolio’s custodian in compliance with the terms of the swap contracts. Securities posted as collateral for swap contracts are identified in the Schedule of Investments and restricted cash, if any, is identified on the Statement of Assets and Liabilities. Risks may exceed amounts recorded in the Statement of Assets and Liabilities. These risks include changes in the returns of the underlying instruments, failure of the counterparties to perform under the contracts’ terms, and the possible lack of liquidity with respect to the swap agreements.
OTC swap payments received or made at the beginning of the measurement period are reflected as a premium or deposit, respectively, on the Statement of Assets and Liabilities. These upfront payments are amortized over the life of the swap and are recognized as realized gain or loss in the Statement of Operations. Net periodic payments received or paid by the Portfolio are recognized as a realized gain or loss in the Statement of Operations.
The Portfolio’s maximum exposure in the event of a defined credit event on a credit default swap to sell protection is the notional amount. As of December 31, 2014, the Portfolio did not hold any credit default swaps to sell protection.
| | |
| Western Asset Variable High Income Portfolio 2014 Annual Report | | 37 |
Notes to financial statements (cont’d)
For average notional amounts of swaps held during the year ended December 31, 2014, see Note 4.
Credit default swaps
The Portfolio enters into credit default swap (“CDS”) contracts for investment purposes, to manage its credit risk or to add leverage. CDS agreements involve one party making a stream of payments to another party in exchange for the right to receive a specified return in the event of a default by a third party, typically corporate or sovereign issuers, on a specified obligation, or in the event of a write-down, principal shortfall, interest shortfall or default of all or part of the referenced entities comprising a credit index. The Portfolio may use a CDS to provide protection against defaults of the issuers (i.e., to reduce risk where the Portfolio has exposure to an issuer) or to take an active long or short position with respect to the likelihood of a particular issuer’s default. As a seller of protection, the Portfolio generally receives an upfront payment or a stream of payments throughout the term of the swap provided that there is no credit event. If the Portfolio is a seller of protection and a credit event occurs, as defined under the terms of that particular swap agreement, the maximum potential amount of future payments (undiscounted) that the Portfolio could be required to make under a credit default swap agreement would be an amount equal to the notional amount of the agreement. These amounts of potential payments will be partially offset by any recovery of values from the respective referenced obligations. As a seller of protection, the Portfolio effectively adds leverage to its portfolio because, in addition to its total net assets, the Portfolio is subject to investment exposure on the notional amount of the swap. As a buyer of protection, the Portfolio generally receives an amount up to the notional value of the swap if a credit event occurs.
Implied spreads are the theoretical prices a lender receives for credit default protection. When spreads rise, market perceived credit risk rises and when spreads fall, market perceived credit risk falls. The implied credit spread of a particular referenced entity reflects the cost of buying/selling protection and may include upfront payments required to enter into the agreement. Wider credit spreads and decreasing market values, when compared to the notional amount of the swap, represent a deterioration of the referenced entity’s credit soundness and a greater likelihood or risk of default or other credit event occurring as defined under the terms of the agreement. Credit spreads utilized in determining the period end market value of credit default swap agreements on corporate or sovereign issues are disclosed in the Notes to Financial Statements and serve as an indicator of the current status of the payment/performance risk and represent the likelihood or risk of default for credit derivatives. For credit default swap agreements on asset-backed securities and credit indices, the quoted market prices and resulting values, particularly in relation to the notional amount of the contract as well as the annual payment rate, serve as an indication of the current status of the payment/performance risk.
The Portfolio’s maximum risk of loss from counterparty risk, as the protection buyer, is the fair value of the contract (this risk is mitigated by the posting of collateral by the counterparty to the Portfolio to cover the Portfolio’s exposure to the counterparty). As the protection seller, the
| | |
| 38 | | Western Asset Variable High Income Portfolio 2014 Annual Report |
Portfolio’s maximum risk is the notional amount of the contract. Credit default swaps are considered to have credit risk-related contingent features since they require payment by the protection seller to the protection buyer upon the occurrence of a defined credit event.
Entering into a CDS agreement involves, to varying degrees, elements of credit, market and documentation risk in excess of the related amounts recognized on the Statement of Assets and Liabilities. Such risks involve the possibility that there will be no liquid market for these agreements, that the counterparty to the agreement may default on its obligation to perform or disagree as to the meaning of the contractual terms in the agreement, and that there will be unfavorable changes in net interest rates.
(f) Loan participations. The Portfolio may invest in loans arranged through private negotiation between one or more financial institutions. The Portfolio’s investment in any such loan may be in the form of a participation in or an assignment of the loan. In connection with purchasing participations, the Portfolio generally will have no right to enforce compliance by the borrower with the terms of the loan agreement related to the loan, or any rights of off-set against the borrower and the Portfolio may not benefit directly from any collateral supporting the loan in which it has purchased the participation.
The Portfolio assumes the credit risk of the borrower, the lender that is selling the participation and any other persons interpositioned between the Portfolio and the borrower. In the event of the insolvency of the lender selling the participation, the Portfolio may be treated as a general creditor of the lender and may not benefit from any off-set between the lender and the borrower.
(g) Credit and market risk. The Portfolio invests in high-yield and emerging market instruments that are subject to certain credit and market risks. The yields of high-yield and emerging market debt obligations reflect, among other things, perceived credit and market risks. The Portfolio’s investments in securities rated below investment grade typically involve risks not associated with higher rated securities including, among others, greater risk related to timely and ultimate payment of interest and principal, greater market price volatility and less liquid secondary market trading. The consequences of political, social, economic or diplomatic changes may have disruptive effects on the market prices of investments held by the Portfolio. The Portfolio’s investments in non-U.S. dollar denominated securities may also result in foreign currency losses caused by devaluations and exchange rate fluctuations.
(h) Foreign investment risks. The Portfolio’s investments in foreign securities may involve risks not present in domestic investments. Since securities may be denominated in foreign currencies, may require settlement in foreign currencies or pay interest or dividends in foreign currencies, changes in the relationship of these foreign currencies to the U.S. dollar can significantly affect the value of the investments and earnings of the Portfolio. Foreign investments may also subject the Portfolio to foreign government exchange restrictions, expropriation, taxation or other political, social or economic developments, all of which affect the market and/or credit risk of the investments.
| | |
| Western Asset Variable High Income Portfolio 2014 Annual Report | | 39 |
Notes to financial statements (cont’d)
(i) Counterparty risk and credit-risk-related contingent features of derivative instruments. The Portfolio may invest in certain securities or engage in other transactions, where the Portfolio is exposed to counterparty credit risk in addition to broader market risks. The Portfolio may invest in securities of issuers, which may also be considered counterparties as trading partners in other transactions. This may increase the risk of loss in the event of default or bankruptcy by the counterparty or if the counterparty otherwise fails to meet its contractual obligations. The Portfolio’s investment manager attempts to mitigate counterparty risk by (i) periodically assessing the creditworthiness of its trading partners, (ii) monitoring and/or limiting the amount of its net exposure to each individual counterparty based on its assessment and (iii) requiring collateral from the counterparty for certain transactions. Market events and changes in overall economic conditions may impact the assessment of such counterparty risk by the investment manager. In addition, declines in the values of underlying collateral received may expose the Portfolio to increased risk of loss.
The Portfolio has entered into master agreements with certain of its derivative counterparties that provide for general obligations, representations, agreements, collateral, events of default or termination and credit related contingent features. The credit related contingent features include, but are not limited to, a percentage decrease in the Portfolio’s net assets or NAV over a specified period of time. If these credit related contingent features were triggered, the derivatives counterparty could terminate the positions and demand payment or require additional collateral.
Collateral requirements differ by type of derivative. Collateral or margin requirements are set by the broker or exchange clearing house for exchange traded derivatives while collateral terms are contract specific for over-the-counter traded derivatives. Cash collateral that has been pledged to cover obligations of the Portfolio under derivative contracts, if any, will be reported separately in the Statement of Assets and Liabilities. Securities pledged as collateral, if any, for the same purpose are noted in the Schedule of Investments.
Absent an event of default by the counterparty or a termination of the agreement, the terms of the master agreements do not result in an offset of reported amounts of financial assets and financial liabilities in the Statement of Assets and Liabilities across transactions between the Portfolio and the applicable counterparty. The enforceability of the right to offset may vary by jurisdiction.
As of December 31, 2014, the Portfolio held forward foreign currency contracts with credit related contingent features which had a liability position of $4,499. If a contingent feature in the master agreements would have been triggered, the Portfolio would have been required to pay this amount to its derivatives counterparties.
(j) Security transactions and investment income. Security transactions are accounted for on a trade date basis. Interest income, adjusted for amortization of premium and accretion of discount, is recorded on the accrual basis. Dividend income is recorded on the ex-dividend date. Foreign dividend income is recorded on the ex-dividend date or as soon as practicable after the Portfolio determines the existence of a dividend declaration after
| | |
| 40 | | Western Asset Variable High Income Portfolio 2014 Annual Report |
exercising reasonable due diligence. The cost of investments sold is determined by use of the specific identification method. To the extent any issuer defaults or a credit event occurs that impacts the issuer, the Portfolio may halt any additional interest income accruals and consider the realizability of interest accrued up to the date of default or credit event.
(k) Distributions to shareholders. Distributions from net investment income and distributions of net realized gains, if any, are declared at least annually. Distributions to shareholders of the Portfolio are recorded on the ex-dividend date and are determined in accordance with income tax regulations, which may differ from GAAP.
(l) Compensating balance arrangements. The Portfolio has an arrangement with its custodian bank whereby a portion of the custodian’s fees is paid indirectly by credits earned on the Portfolio’s cash on deposit with the bank.
(m) Federal and other taxes. It is the Portfolio’s policy to comply with the federal income and excise tax requirements of the Internal Revenue Code of 1986 (the “Code”), as amended, applicable to regulated investment companies. Accordingly, the Portfolio intends to distribute its taxable income and net realized gains, if any, to shareholders in accordance with timing requirements imposed by the Code. Therefore, no federal or state income tax provision is required in the Portfolio’s financial statements.
Management has analyzed the Portfolio’s tax positions taken on income tax returns for all open tax years and has concluded that as of December 31, 2014, no provision for income tax is required in the Portfolio’s financial statements. The Portfolio’s federal and state income and federal excise tax returns for tax years for which the applicable statutes of limitations have not expired are subject to examination by the Internal Revenue Service and state departments of revenue.
Under the applicable foreign tax laws, a withholding tax may be imposed on interest, dividends and capital gains at various rates.
(n) Reclassification. GAAP requires that certain components of net assets be reclassified to reflect permanent differences between financial and tax reporting. These reclassifications have no effect on net assets or net asset value per share. During the current year, the following reclassifications have been made:
| | | | | | | | |
| | | Overdistributed Net
Investment Income | | | Accumulated Net
Realized Loss | |
| (a) | | $ | 190,952 | | | $ | (190,952) | |
| (a) | Reclassifications are due to foreign currency transactions treated as ordinary income for tax purposes, differences between book and tax amortization of premium on fixed income securities and book/tax differences in the treatment of swap contracts. |
2. Investment management agreement and other transactions with affiliates
Legg Mason Partners Fund Advisor, LLC (“LMPFA”) is the Portfolio’s investment manager. Western Asset Management Company (“Western Asset”) and Western Asset Management Company Limited (“Western Asset Limited”) are the Portfolio’s subadvisers. LMPFA,
| | |
| Western Asset Variable High Income Portfolio 2014 Annual Report | | 41 |
Notes to financial statements (cont’d)
Western Asset and Western Asset Limited are wholly-owned subsidiaries of Legg Mason, Inc. (“Legg Mason”).
Under the investment management agreement, the Portfolio pays an investment management fee, calculated daily and paid monthly, at an annual rate of 0.60% of the Portfolio’s average daily net assets.
LMPFA provides administrative and certain oversight services to the Portfolio. LMPFA delegates to the subadviser the day-to day portfolio management of the Portfolio. Western Asset Limited provides certain subadvisory services related to currency transactions and investments in non-U.S. dollar-denominated securities and related foreign currency instruments. For its services, LMPFA pays Western Asset 70% of the net management fee it receives from the Portfolio. In turn, Western Asset pays Western Asset Limited a subadvisory fee of 0.30% on the assets managed by Western Asset Limited.
As a result of an expense limitation arrangement between the Portfolio and LMPFA, the ratio of expenses other than interest, brokerage, taxes, extraordinary expenses and acquired fund fees and expenses, to average net assets of the Portfolio did not exceed 1.00%. This expense limitation arrangement cannot be terminated prior to December 31, 2016 without the Board of Trustees’ consent.
The investment manager is permitted to recapture amounts waived and/or reimbursed to a class during the same fiscal year if the class’ total annual operating expenses have fallen to a level below the expense limitation (“expense cap”) in effect at the time the fees were earned or the expenses incurred. In no case will the investment manager recapture any amount that would result, on any particular business day of the Portfolio, in the class’ total annual operating expenses exceeding the expense cap or any other lower limit then in effect.
Legg Mason Investor Services, LLC, a wholly-owned broker-dealer subsidiary of Legg Mason, serves as the Portfolio’s sole and exclusive distributor.
All officers and one Trustee of the Trust are employees of Legg Mason or its affiliates and do not receive compensation from the Trust.
3. Investments
During the year ended December 31, 2014, the aggregate cost of purchases and proceeds from sales of investments (excluding short-term investments) and U.S Government & Agency Obligations were as follows:
| | | | | | | | |
| | | Investments | | | U.S. Government &
Agency Obligations | |
| Purchases | | $ | 67,289,936 | | | | — | |
| Sales | | | 78,413,226 | | | $ | 68,750 | |
| | |
| 42 | | Western Asset Variable High Income Portfolio 2014 Annual Report |
At December 31, 2014, the aggregate gross unrealized appreciation and depreciation of investments for federal income tax purposes were as follows:
| | | | |
| Gross unrealized appreciation | | $ | 2,253,563 | |
| Gross unrealized depreciation | | | (6,494,944) | |
| Net unrealized depreciation | | $ | (4,241,381) | |
At December 31, 2014, the Portfolio had the following open forward foreign currency contracts:
| | | | | | | | | | | | | | | | | | | | |
Currency Purchased | | | Currency Sold | | | Counterparty | | Settlement
Date | | | Unrealized
Appreciation
(Depreciation) | |
| EUR | | | 120,000 | | | USD | | | 149,762 | | | Citibank N.A. | | | 2/13/15 | | | $ | (4,499) | |
| USD | | | 173,410 | | | EUR | | | 138,551 | | | Citibank N.A. | | | 2/13/15 | | | | 5,690 | |
| USD | | | 1,377,041 | | | EUR | | | 1,099,285 | | | Royal Bank of Scotland PLC | | | 2/13/15 | | | | 46,327 | |
| Total | | | $ | 47,518 | |
| | |
Abbreviations used in this schedule: |
| EUR | | — Euro |
| USD | | — United States Dollar |
4. Derivative instruments and hedging activities
Below is a table, grouped by derivative type, that provides information about the fair value and the location of derivatives within the Statement of Assets and Liabilities at December 31, 2014.
| | | | |
| ASSET DERIVATIVES1 | |
| | | Foreign
Exchange Risk | |
| Forward foreign currency contracts | | $ | 52,017 | |
| | | | |
| LIABILITY DERIVATIVES1 | |
| | | Foreign
Exchange Risk | |
| Forward foreign currency contracts | | $ | 4,499 | |
| 1 | Generally, the balance sheet location for asset derivatives is receivables/net unrealized appreciation (depreciation) and for liability derivatives is payables/net unrealized appreciation (depreciation). |
The following tables provide information about the effect of derivatives and hedging activities on the Portfolio’s Statement of Operations for the year ended December 31, 2014. The first table provides additional detail about the amounts and sources of gains (losses) realized on derivatives during the period. The second table provides additional information about the change in unrealized appreciation (depreciation) resulting from the Portfolio’s derivatives and hedging activities during the period.
| | |
| Western Asset Variable High Income Portfolio 2014 Annual Report | | 43 |
Notes to financial statements (cont’d)
| | | | | | | | | | | | |
| AMOUNT OF REALIZED GAIN (LOSS) ON DERIVATIVES RECOGNIZED | |
| | | Foreign
Exchange Risk | | | Credit
Risk | | | Total | |
| Swap contracts | | | — | | | $ | (147,658) | | | $ | (147,658) | |
| Forward foreign currency contracts1 | | $ | 121,786 | | | | — | | | | 121,786 | |
| Total | | $ | 121,786 | | | $ | (147,658) | | | $ | (25,872) | |
| 1 | Net realized gain (loss) from forward foreign currency contracts is reported in net realized gain (loss) from foreign currency transactions in the Statement of Operations. |
| | | | | | | | | | | | |
| CHANGE IN UNREALIZED APPRECIATION (DEPRECIATION) ON DERIVATIVES RECOGNIZED | |
| | | Foreign
Exchange Risk | | | Credit
Risk | | | Total | |
| Swap contracts | | | — | | | $ | 93,150 | | | $ | 93,150 | |
| Forward foreign currency contracts1 | | $ | 84,673 | | | | — | | | | 84,673 | |
| Total | | $ | 84,673 | | | $ | 93,150 | | | $ | 177,823 | |
| 1 | The change in unrealized appreciation (depreciation) from forward foreign currency contracts is reported in the change in net unrealized appreciation (depreciation) from foreign currencies in the Statement of Operations. |
During the year ended December 31, 2014, the volume of derivative activity for the Portfolio was as follows:
| | | | |
| | | Average Market
Value | |
| Forward foreign currency contracts (to buy) | | $ | 99,731 | |
| Forward foreign currency contracts (to sell) | | | 1,787,907 | |
| |
| | | Average Notional
Balance | |
| Credit default swap contracts (to buy protection)† | | $ | 2,885,094 | |
| † | At December 31, 2014, there were no open positions held in this derivative. |
The following table presents by financial instrument, the Portfolio’s derivative assets net of the related collateral received by the Portfolio at December 31, 2014:
| | | | | | | | | | | | |
| | | Gross Amount of Derivative
Assets in the Statement of
Assets and Liabilities1 | | | Collateral
Received | | | Net
Amount | |
| Forward foreign currency contracts | | $ | 52,017 | | | | — | | | $ | 52,017 | |
The following table presents by financial instrument, the Portfolio’s derivative liabilities net of the related collateral pledged by the Portfolio at December 31, 2014:
| | | | | | | | | | | | |
| | | Gross Amount of Derivative
Liabilities in the Statement of
Assets and Liabilities1 | | | Collateral
Pledged | | | Net
Amount | |
| Forward foreign currency contracts | | $ | 4,499 | | | | — | | | $ | 4,499 | |
| 1 | Absent an event of default or early termination, derivative assets and liabilities are presented gross and not offset in the Statement of Assets and Liabilities. |
| | |
| 44 | | Western Asset Variable High Income Portfolio 2014 Annual Report |
5. Shares of beneficial interest
At December 31, 2014, the Trust had an unlimited number of shares of beneficial interest authorized with a par value of $0.00001 per share.
Transactions in shares of the Portfolio were as follows:
| | | | | | | | |
| | | Year Ended
December 31, 2014 | | | Year Ended
December 31, 2013 | |
| Shares sold | | | 223,153 | | | | 277,241 | |
| Shares issued on reinvestment | | | 1,232,498 | | | | 1,294,276 | |
| Shares repurchased | | | (3,105,610) | | | | (3,772,828) | |
| Net decrease | | | (1,649,959) | | | | (2,201,311) | |
6. Income tax information and distributions to shareholders
The tax character of distributions paid during the fiscal years ended December 31, was as follows:
| | | | | | | | |
| | | 2014 | | | 2013 | |
| Distributions paid from: | | | | | | | | |
| Ordinary income | | $ | 6,890,013 | | | $ | 7,850,013 | |
As of December 31, 2014, the components of accumulated earnings on a tax basis were as follows:
| | | | |
| Undistributed ordinary income — net | | $ | 60,547 | |
| Deferred capital losses* | | | (85,229) | |
| Capital loss carryforward** | | | (31,468,004) | |
| Other book/tax temporary differences(a) | | | (132,024) | |
| Unrealized appreciation (depreciation)(b) | | | (4,204,280) | |
| Total accumulated earnings (losses) — net | | $ | (35,828,990) | |
| * | These capital losses have been deferred in the current year as either short-term or long-term losses. The losses will be deemed to occur on the first day of the next taxable year in the same character as they were originally deferred and will be available to offset future taxable capital gains. These losses must be utilized before any of the Portfolio's capital loss carryforward may be utilized. |
| ** | During the taxable year ended December 31, 2014, the Portfolio utilized $ 1,057,841 of its capital loss carryforward available from prior years. As of December 31, 2014, the Portfolio had the following net capital loss carryforwards remaining: |
| | | | |
| Year of Expiration | | Amount | |
| 12/31/2015 | | $ | (7,903,237 | ) |
| 12/31/2016 | | | (20,466,624 | ) |
| 12/31/2018 | | | (3,098,143 | ) |
| | | $ | (31,468,004 | ) |
These amounts will be available to offset any future taxable capital gains.
| (a) | Other book/tax temporary differences are attributable to the realization for tax purposes of unrealized gains (losses) on certain foreign currency contracts, book/tax difference in the accrual of interest income on securities in default and book/tax differences in the timing of the deductibility of various expenses. |
| (b) | The difference between book-basis and tax-basis unrealized appreciation (depreciation) is attributable to the tax deferral of losses on wash sales and the difference between book and tax amortization methods for premiums on fixed income securities. |
| | |
| Western Asset Variable High Income Portfolio 2014 Annual Report | | 45 |
Notes to financial statements (cont’d)
7. Subsequent event note
At its February 2015 meeting, the Board of Trustees approved a proposal by LMPFA, in conjunction with Western Asset, the subadviser to the Portfolio, to change the name of the Portfolio, to revise its investment objective and strategies consistent with Western Asset’s flagship “core plus” strategy, and to make other related changes. The proposed changes do not require a shareholder vote, but at least 60 days’ prior written notice will be provided to shareholders. It is expected that the changes to the Portfolio will become effective by April 15, 2015.
| | |
| 46 | | Western Asset Variable High Income Portfolio 2014 Annual Report |
Report of independent registered public accounting firm
The Board of Trustees and Shareholders
Legg Mason Partners Variable Income Trust:
We have audited the accompanying statement of assets and liabilities of Western Asset Variable High Income Portfolio (the “Portfolio”), a series of Legg Mason Partners Variable Income Trust, including the schedule of investments, as of December 31, 2014, and the related statement of operations for the year then ended, the statements of changes in net assets for each of the years in the two-year period then ended, and the financial highlights for each of the years in the five-year period then ended. These financial statements and financial highlights are the responsibility of the Portfolio’s management. Our responsibility is to express an opinion on these financial statements and financial highlights based on our audits.
We conducted our audits in accordance with the standards of the Public Company Accounting Oversight Board (United States). Those standards require that we plan and perform the audit to obtain reasonable assurance about whether the financial statements and financial highlights are free of material misstatement. An audit includes examining, on a test basis, evidence supporting the amounts and disclosures in the financial statements. Our procedures included confirmation of securities owned as of December 31, 2014, by correspondence with the custodian and brokers or by other appropriate auditing procedures. An audit also includes assessing the accounting principles used and significant estimates made by management, as well as evaluating the overall financial statement presentation. We believe that our audits provide a reasonable basis for our opinion.
In our opinion, the financial statements and financial highlights referred to above present fairly, in all material respects, the financial position of Western Asset Variable High Income Portfolio as of December 31, 2014, the results of its operations for the year then ended, the changes in its net assets for each of the years in the two-year period then ended, and the financial highlights for each of the years in the five-year period then ended, in conformity with U.S. generally accepted accounting principles.

New York, New York
February 19, 2015
| | |
| Western Asset Variable High Income Portfolio 2014 Annual Report | | 47 |
Board approval of management and
subadvisory agreements (unaudited)
At an in-person meeting of the Board of Trustees of Legg Mason Partners Variable Income Trust (the “Trust”) held on November 10-11, 2014, the Board, including the Trustees who are not considered to be “interested persons” of the Trust (the “Independent Trustees”) under the Investment Company Act of 1940, as amended (the “1940 Act”), approved for an annual period the continuation of the management agreement (the “Management Agreement”) between the Trust and Legg Mason Partners Fund Advisor, LLC (the “Manager”) with respect to the Western Asset Variable High Income Portfolio, a series of the Trust (the “Fund”), and the sub-advisory agreement (the “Sub-Advisory Agreement”) between the Manager and Western Asset Management Company (the “Subadviser”), an affiliate of the Manager, with respect to the Fund. At that meeting, the Board, including the Independent Trustees, also approved for an annual period the continuation of a sub-advisory agreement (together with the Sub-Advisory Agreement, the “Sub-Advisory Agreements”) between the Subadviser and Western Asset Management Company Limited (together with the Subadviser, the “Subadvisers”), an affiliate of the Manager and the Subadviser, with respect to the Fund.
Background
The Board received information in advance of the meeting from the Manager to assist it in its consideration of the Management Agreement and the Sub-Advisory Agreements and was given the opportunity to ask questions and request additional information from management. In addition, prior to the meeting the Independent Trustees met with their independent legal counsel to discuss and consider the information provided by management and submitted questions to management, and they considered the responses provided. The Board received and considered a variety of information about the Manager and the Subadvisers, as well as the management and sub-advisory arrangements for the Fund and other funds overseen by the Board, certain portions of which are discussed below.
The information provided and presentations made to the Board encompassed the Fund and all funds for which the Board has responsibility. The discussion below covers both the advisory and the administrative functions being rendered by the Manager, both of which functions are encompassed by the Management Agreement, as well as the advisory functions rendered by the Subadvisers pursuant to the Sub-Advisory Agreements.
Board approval of management agreement and sub-advisory agreements
The Independent Trustees were advised by separate independent legal counsel throughout the process. Prior to voting, the Independent Trustees received a memorandum from their independent legal counsel discussing the legal standards for their consideration of the proposed continuation of the Management Agreement and the Sub-Advisory Agreements. The Independent Trustees also reviewed the proposed continuation of the Management Agreement and the Sub-Advisory Agreements in private sessions with their independent legal counsel at which no representatives of the Manager or Subadvisers were present. The Independent Trustees considered the Management Agreement and each Sub-Advisory Agreement separately in the course of their review. In doing so, they noted the respective roles of the Manager and the Subadvisers in providing services to the Fund.
| | |
| 48 | | Western Asset Variable High Income Portfolio |
In approving the Management Agreement and Sub-Advisory Agreements, the Board, including the Independent Trustees, considered a variety of factors, including those factors discussed below. No single factor reviewed by the Board was identified by the Board as the principal factor in determining whether to approve the Management Agreement and the Sub-Advisory Agreements. Each Trustee may have attributed different weight to the various factors in evaluating the Management Agreement and each Sub-Advisory Agreement.
Nature, extent and quality of the services under the management agreement and sub-advisory agreements
The Board received and considered information regarding the nature, extent and quality of services provided to the Fund by the Manager and the Subadvisers under the Management Agreement and the Sub-Advisory Agreements, respectively, during the past year. The Board noted information received at regular meetings throughout the year related to the services rendered by the Manager in its management of the Fund’s affairs and the Manager’s role in coordinating the activities of the Fund’s other service providers. The Board’s evaluation of the services provided by the Manager and the Subadvisers took into account the Board’s knowledge gained as Trustees of funds in the Legg Mason fund complex, including knowledge gaining regarding the scope and quality of the investment management and other capabilities of the Manager and the Subadvisers, and the quality of the Manager’s administrative and other services. The Board observed that the scope of services provided by the Manager and the Subadvisers, and of the undertakings required of the Manager and Subadvisers in connection with those services, including maintaining and monitoring their own and the Fund’s compliance programs, had expanded over time as a result of regulatory, market and other developments. The Board also noted that on a regular basis it received and reviewed information from the Manager and the Subadvisers regarding the Fund’s compliance policies and procedures established pursuant to Rule 38a-1 under the 1940 Act. The Board also considered the Manager’s and each Subadviser’s risk management processes.
The Board reviewed the qualifications, backgrounds and responsibilities of the Manager’s and each Subadviser’s senior personnel and the team of investment professionals primarily responsible for the day-to-day portfolio management of the Fund. The Board also considered, based on its knowledge of the Manager and its affiliates, the financial resources of Legg Mason, Inc., the parent organization of the Manager and the Subadvisers.
The Board considered the division of responsibilities between the Manager and the Subadvisers and the oversight provided by the Manager. The Board also considered the Manager’s and the Subadvisers’ policies and practices regarding the selection of brokers and dealers and the execution of portfolio transactions. In addition, management also reported to the Board on, among other things, its business plans and organizational changes.
The Board received and considered performance information for the Fund as well as for a group of funds (the “Performance Universe”) selected by Lipper, Inc. (“Lipper”), an independent provider of investment company data. The Board was provided with a description of the methodology Lipper used to determine the similarity of the Fund with the funds
| | |
| Western Asset Variable High Income Portfolio | | 49 |
Board approval of management and
subadvisory agreements (unaudited) (cont’d)
included in the Performance Universe. The Board also noted that it had received and discussed with management information throughout the year at periodic intervals comparing the Fund’s performance against its benchmark and against the Fund’s peers. In addition, the Board considered the Fund’s performance in light of overall financial market conditions.
The information comparing the Fund’s performance to that of its Performance Universe, consisting of all funds classified by Lipper as high yield funds underlying variable insurance products, showed, among other data, that the Fund’s performance for the 1-, 3-, 5- and 10-year periods ended June 30, 2014 was above the median.
The Board concluded that, overall, the nature, extent and quality of services provided (and expected to be provided), including performance, under the Management Agreement and the Sub-Advisory Agreements were sufficient for renewal.
Management fees and expense ratios
The Board reviewed and considered the contractual management fee (the “Contractual Management Fee”) and the actual management fees paid by the Fund to the Manager (the “Actual Management Fee”) in light of the nature, extent and quality of the management and sub-advisory services provided by the Manager and the Subadvisers. The Board also noted that the compensation paid to the Subadvisers is paid by the Manager, not the Fund.
In addition, the Board received and considered information provided by Lipper comparing the Contractual Management Fee and the Actual Management Fee and the Fund’s total actual expenses with those of funds in both the relevant expense group and a broader group of funds, each selected by Lipper. The Board also reviewed information regarding fees charged by the Manager to other U.S. clients investing primarily in an asset class similar to that of the Fund, including, where applicable, separate accounts.
The Manager reviewed with the Board the differences in services provided to these different types of accounts, noting that the Fund is provided with certain administrative services, office facilities, and Fund officers (including the Fund’s chief executive, chief financial and chief compliance officers), and that the Manager coordinates and oversees the provision of services to the Fund by other Fund service providers. The Board considered the fee comparisons in light of the differences in management of these different types of accounts.
The Board considered the overall management fee, Subadvisers’ fees and the amount of the management fee retained by the Manager after payment of the subadvisory fees in each case in light of the services rendered for those amounts. The Board also received an analysis of complex-wide management fees provided by the Manager, which, among other things, set out a framework of fees based on asset classes.
The information comparing the Fund’s Contractual and Actual Management Fees as well as its actual total expense ratio to its expense group, consisting of a group of funds (including the Fund) classified as high yield funds underlying variable insurance products and chosen by Lipper to be comparable to the Fund, showed that the Fund’s Contractual Management
| | |
| 50 | | Western Asset Variable High Income Portfolio |
Fee and Actual Management Fee were below the median. The Board noted that the Fund’s actual total expense ratio was below the median. The Board also considered that the current limitation on the Fund’s expenses is expected to continue through December 2016.
Taking all of the above into consideration, as well as the factors identified below, the Board determined that the management fee and the subadvisory fees for the Fund were reasonable in light of the nature, extent and quality of the services provided to the Fund under the Management Agreement and the Sub-Advisory Agreements.
Manager profitability
The Board received and considered an analysis of the profitability of the Manager and its affiliates in providing services to the Fund. The Board also received profitability information with respect to the Legg Mason fund complex as a whole. In addition, the Board received information with respect to the Manager’s allocation methodologies used in preparing this profitability data. It was noted that the allocation methodologies had been reviewed previously by an outside consultant. The profitability of the Manager and its affiliates was considered by the Board not excessive in light of the nature, extent and quality of the services provided to the Fund and the type of fund it represented.
Economies of scale
The Board received and discussed information concerning whether the Manager realizes economies of scale as the Fund’s assets grow. The Board noted that the Fund’s Contractual Management Fee is approximately equivalent to the asset-weighted average of management fees paid by other funds with the same Lipper investment classification/objective at all asset levels. The Board also noted that the Fund’s Contractual Management Fee is below the median of the expense group.
The Board determined that the management fee structure for the Fund was reasonable.
Other benefits to the manager and the subadvisers
The Board considered other benefits received by the Manager, the Subadvisers and their affiliates as a result of their relationship with the Fund, including the opportunity to offer additional products and services to Fund shareholders.
In light of the costs of providing investment management and other services to the Fund and the ongoing commitment of the Manager and the Subadvisers to the Fund, the Board considered that the ancillary benefits that the Manager and its affiliates received were reasonable.
* * *
In light of all of the foregoing, the Board determined that the continuation of each of the Management Agreement and Sub-Advisory Agreements would be in the best interests of the Fund’s shareholders and approved the continuation of such agreements for another year.
| | |
| Western Asset Variable High Income Portfolio | | 51 |
Additional information (unaudited)
Information about Trustees and Officers
The business and affairs of Western Asset Variable High Income Portfolio (the “Portfolio”) are conducted by management under the supervision and subject to the direction of its Board of Trustees. The business address of each Trustee is c/o Kenneth D. Fuller, Legg Mason, 100 International Drive, 11th Floor, Baltimore, Maryland 21202. Information pertaining to the Trustees and officers of the Portfolio is set forth below.
The Statement of Additional Information includes additional information about Trustees and is available, without charge, upon request by calling the Portfolio at 1-877-721-1926.
| | |
| Independent Trustees†: | | |
| Elliott J. Berv | | |
| Year of birth | | 1943 |
| Position(s) with Trust | | Trustee |
| Term of office1 and length of time served2 | | Since 1989 |
| Principal occupation(s) during past five years | | President and Chief Executive Officer, Catalyst (consulting) (since 1984); formerly, Chief Executive Officer, Rocket City Enterprises (media) (2000 to 2005) |
| Number of funds in fund complex overseen by Trustee | | 55 |
| Other board memberships held by Trustee during past five years | | None |
| |
| Jane F. Dasher | | |
| Year of birth | | 1949 |
| Position(s) with Trust | | Trustee |
| Term of office1 and length of time served2 | | Since 1999 |
| Principal occupation(s) during past five years | | Chief Financial Officer, Long Light Capital, LLC, formerly known as Korsant Partners, LLC (a family investment company) (since 1997) |
| Number of funds in fund complex overseen by Trustee | | 55 |
| Other board memberships held by Trustee during past five years | | None |
| |
| Mark T. Finn | | |
| Year of birth | | 1943 |
| Position(s) with Trust | | Trustee |
| Term of office1 and length of time served2 | | Since 1989 |
| Principal occupation(s) during past five years | | Adjunct Professor, College of William & Mary (since 2002); Chairman, Chief Executive Officer and Owner, Vantage Consulting Group, Inc. (investment management) (since 1988); Principal/Member, Balvan Partners (investment management) (2002 to 2009) |
| Number of funds in fund complex overseen by Trustee | | 55 |
| Other board memberships held by Trustee during past five years | | None |
| | |
| 52 | | Western Asset Variable High Income Portfolio |
| | |
| Independent Trustees cont’d | | |
| Stephen R. Gross | | |
| Year of birth | | 1947 |
| Position(s) with Trust | | Trustee |
| Term of office1 and length of time served2 | | Since 1986 |
| Principal occupation(s) during past five years | | Chairman Emeritus (since 2011) and formerly Chairman, HLB Gross Collins, P.C. (accounting and consulting firm) (1974 to 2011); Executive Director of Business Builders Team, LLC (since 2005); Principal, Gross Consulting Group, LLC (since 2011); CEO, Gross Capital Advisors, LLC (since 2011); CEO, Trusted CFO Solutions, LLC (since 2011) |
| Number of funds in fund complex overseen by Trustee | | 55 |
| Other board memberships held by Trustee during past five years | | None |
| |
| Richard E. Hanson, Jr. | | |
| Year of birth | | 1941 |
| Position(s) with Trust | | Trustee |
| Term of office1 and length of time served2 | | Since 1985 |
| Principal occupation(s) during past five years | | Retired; formerly Headmaster, The New Atlanta Jewish Community High School, Atlanta, Georgia (1996 to 2000) |
| Number of funds in fund complex overseen by Trustee | | 55 |
| Other board memberships held by Trustee during past five years | | None |
| |
| Diana R. Harrington | | |
| Year of birth | | 1940 |
| Position(s) with Trust | | Trustee and Chair |
| Term of office1 and length of time served2 | | Since 1992 (Chair of the Board since 2013) |
| Principal occupation(s) during past five years | | Babson Distinguished Professor of Finance, Babson College (since 1992) |
| Number of funds in fund complex overseen by Trustee | | 55 |
| Other board memberships held by Trustee during past five years | | None |
| |
| Susan M. Heilbron | | |
| Year of birth | | 1945 |
| Position(s) with Trust | | Trustee |
| Term of office1 and length of time served2 | | Since 1994 |
| Principal occupation(s) during past five years | | Retired; formerly, President, Lacey & Heilbron (communications consulting) (1990 to 2002); formerly, General Counsel and Executive Vice President, The Trump Organization (1986 to 1990); formerly, Senior Vice President, New York State Urban Development Corporation (1984 to 1986); formerly, Associate, Cravath, Swaine & Moore (1980 to 1984) and (1977 to 1979) |
| Number of funds in fund complex overseen by Trustee | | 55 |
| Other board memberships held by Trustee during past five years | | Formerly, Director, Lincoln Savings Bank, FSB (1991 to 1994); formerly, Director, Trump Shuttle, Inc. (air transportation) (1989 to 1990); formerly, Director, Alexander’s Inc. (department store) (1987 to 1990) |
| | |
| Western Asset Variable High Income Portfolio | | 53 |
Additional information (unaudited) (cont’d)
Information about Trustees and Officers
| | |
| Independent Trustees cont’d | | |
| Susan B. Kerley | | |
| Year of birth | | 1951 |
| Position(s) with Trust | | Trustee |
| Term of office1 and length of time served2 | | Since 1992 |
| Principal occupation(s) during past five years | | Investment Consulting Partner, Strategic Management Advisors, LLC (investment consulting) (since 1990) |
| Number of funds in fund complex overseen by Trustee | | 55 |
| Other board memberships held by Trustee during past five years | | Director and Trustee (since 1990) and formerly, Chairman (2005 to 2012) of various series of MainStay Family of Funds (66 funds); Investment Company Institute (ICI) Board of Governors (since 2006); ICI Executive Committee (since 2011); Chairman of the Independent Directors Council (since 2012) |
| |
| Alan G. Merten | | |
| Year of birth | | 1941 |
| Position(s) with Trust | | Trustee |
| Term of office1 and length of time served2 | | Since 1990 |
| Principal occupation(s) during past five years | | President Emeritus (since 2012) and formerly, President, George Mason University (1996 to 2012) |
| Number of funds in fund complex overseen by Trustee | | 55 |
| Other board memberships held by Trustee during past five years | | Director Emeritus (since 2012) and formerly, Director, Cardinal Financial Corporation (2006 to 2012); Trustee, First Potomac Realty Trust (since 2005); Director, DeVry Inc. (educational services) (since 2012); formerly, Director, Xybernaut Corporation (information technology) (2004 to 2006); formerly, Director, Digital Net Holdings, Inc. (2003 to 2004); formerly, Director, Comshare, Inc. (information technology) (1985 to 2003) |
| |
| R. Richardson Pettit | | |
| Year of birth | | 1942 |
| Position(s) with Trust | | Trustee |
| Term of office1 and length of time served2 | | Since 1990 |
| Principal occupation(s) during past five years | | Retired; formerly, Duncan Professor of Finance, University of Houston (1977 to 2006); previous academic or management positions include: University of Washington, University of Pennsylvania and Purdue University |
| Number of funds in fund complex overseen by Trustee | | 55 |
| Other board memberships held by Trustee during past five years | | None |
| | |
| 54 | | Western Asset Variable High Income Portfolio |
| | |
| Interested Trustee and Officer: |
| Kenneth D. Fuller3 | | |
| Year of birth | | 1958 |
| Position(s) with Trust | | Trustee, President, and Chief Executive Officer |
| Term of office1 and length of time served2 | | Since 2013 |
| Principal occupation(s) during past five years | | Managing Director of Legg Mason & Co., LLC (“Legg Mason & Co.”) (since 2013); Officer and/or Trustee/Director of 157 funds associated with Legg Mason Fund Advisor, LLC (“LMPFA”) or its affiliates (since 2013); President and Chief Executive Officer of LMPFA (since 2013); President and Chief Executive Officer of LM Asset Services, LLC (“LMAS”) and Legg Mason Fund Asset Management Inc. (“LMFAM”) (formerly registered investment advisers) (since 2013); formerly, Senior Vice President of LMPFA (2012 to 2013); formerly, Director of Legg Mason & Co. (2012 to 2013); formerly, Vice President of Legg Mason & Co. (2009 to 2012); formerly, Vice President – Equity Division of T. Rowe Price Associates (1993 to 2009), as well as Investment Analyst and Portfolio Manager for certain asset allocation accounts (2004 to 2009). |
| Number of funds in fund complex overseen by Trustee | | 147 |
| Other board memberships held by Trustee during past five years | | None |
| | |
| Additional Officers: |
Ted P. Becker Legg Mason 620 Eighth Avenue, 49th Floor, New York, NY 10018 | | |
| Year of birth | | 1951 |
| Position(s) with Trust | | Chief Compliance Officer |
| Term of office1 and length of time served2 | | Since 2007 |
| Principal occupation(s) during past five years | | Director of Global Compliance at Legg Mason (since 2006); Chief Compliance Officer of LMPFA (since 2006); Managing Director of Compliance of Legg Mason & Co. (since 2005); Chief Compliance Officer of certain mutual funds associated with Legg Mason & Co. or its affiliates (since 2006) |
| | |
| Western Asset Variable High Income Portfolio | | 55 |
Additional information (unaudited) (cont’d)
Information about Trustees and Officers
| | |
| Additional Officers cont’d |
Susan Kerr
Legg Mason 620 Eighth Avenue, 49th Floor, New York, NY 10018 | | |
| Year of birth | | 1949 |
| Position(s) with Trust | | Chief Anti-Money Laundering Compliance Officer |
| Term of office1 and length of time served2 | | Since 2013 |
| Principal occupation(s) during past five years | | Assistant Vice President of Legg Mason & Co. and Legg Mason Investor Services, LLC (“LMIS”) (since 2010); Chief Anti-Money Laundering Compliance Officer of certain mutual funds associated with Legg Mason & Co. or its affiliates (since 2013) and Anti-Money Laundering Compliance Officer of LMIS (since 2012); Senior Compliance Officer of LMIS (since 2011); formerly, AML Consultant, DTCC (2010); formerly, AML Consultant, Rabobank Netherlands, (2009); formerly, First Vice President, Director of Marketing & Advertising Compliance and Manager of Communications Review Group at Citigroup Inc. (1996 to 2008) |
| |
Vanessa A. Williams
Legg Mason 100 First Stamford Place, 6th Floor, Stamford, CT 06902 | | |
| Year of birth | | 1979 |
| Position(s) with Trust | | Identity Theft Prevention Officer |
| Term of office1 and length of time served2 | | Since 2011 |
| Principal occupation(s) during past five years | | Vice President of Legg Mason & Co. (since 2012); Identity Theft Prevention Officer of certain mutual funds associated with Legg Mason & Co. or its affiliates (since 2011); formerly, Chief Anti-Money Laundering Compliance Officer of certain mutual funds associated with Legg Mason & Co. or its affiliates (2011 to 2013); formerly, Senior Compliance Officer of Legg Mason & Co. (2008 to 2011); formerly, Compliance Analyst of Legg Mason & Co. (2006 to 2008) and Legg Mason & Co. predecessors (prior to 2006) |
|
Robert I. Frenkel
Legg Mason 100 First Stamford Place, 6th Floor, Stamford, CT 06902 |
| Year of birth | | 1954 |
| Position(s) with Trust | | Secretary and Chief Legal Officer |
| Term of office1 and length of time served2 | | Since 2007 |
| Principal occupation(s) during past five years | | Vice President and Deputy General Counsel of Legg Mason (since 2006); Managing Director and General Counsel of Global Mutual Funds for Legg Mason & Co. (since 2006) and Legg Mason & Co. predecessors (since 1994); Secretary and Chief Legal Officer of certain mutual funds associated with Legg Mason & Co. or its affiliates (since 2006) and Legg Mason & Co. predecessors (prior to 2006) |
| | |
| 56 | | Western Asset Variable High Income Portfolio |
| | |
| Additional Officers cont’d |
Thomas C. Mandia
Legg Mason 100 First Stamford Place, 6th Floor, Stamford, CT 06902 | | |
| Year of birth | | 1962 |
| Position(s) with Trust | | Assistant Secretary |
| Term of office1 and length of time served2 | | Since 2007 |
| Principal occupation(s) during past five years | | Managing Director and Deputy General Counsel of Legg Mason & Co. (since 2005) and Legg Mason & Co. predecessors (prior to 2005); Secretary of LMPFA (since 2006); Assistant Secretary of certain mutual funds associated with Legg Mason & Co. or its affiliates (since 2006) and Legg Mason & Co. predecessors (prior to 2006); Secretary to LMAS (since 2002) and LMFAM (since 2013) |
| |
Richard F. Sennett
Legg Mason 100 International Drive, 7th Floor, Baltimore, MD 21202 | | |
| Year of birth | | 1970 |
| Position(s) with Trust | | Principal Financial Officer |
| Term of office1 and length of time served2 | | Since 2011 |
| Principal occupation(s) during past five years | | Principal Financial Officer and Treasurer of certain mutual funds associated with Legg Mason & Co. or its affiliates (since 2011 and since 2013); Managing Director of Legg Mason & Co. and Senior Manager of the Treasury Policy group for Legg Mason & Co.’s Global Fiduciary Platform (since 2011); formerly, Chief Accountant within the SEC’s Division of Investment Management (2007 to 2011); formerly, Assistant Chief Accountant within the SEC’s Division of Investment Management (2002 to 2007) |
| |
Steve Frank
Legg Mason 620 Eighth Avenue, 49th Floor, New York, NY 10018 | | |
| Year of birth | | 1967 |
| Position(s) with Trust | | Treasurer |
| Term of office1 and length of time served2 | | Since 2014 |
| Principal occupation(s) during past five years | | Vice President of Legg Mason & Co. and Legg Mason & Co. predecessors (since 2002); Treasurer of certain mutual funds associated with Legg Mason & Co. or its affiliates (since 2010); formerly, Controller of certain mutual funds associated with Legg Mason & Co. or its affiliates (prior to 2010); formerly, Assistant Controller of certain mutual funds associated with Legg Mason & Co. predecessors (prior to 2005) |
| | |
| Western Asset Variable High Income Portfolio | | 57 |
Additional information (unaudited) (cont’d)
Information about Trustees and Officers
| | |
| Additional Officers cont’d |
Jeanne M. Kelly
Legg Mason 620 Eighth Avenue, 49th Floor, New York, NY 10018 | | |
| Year of birth | | 1951 |
| Position(s) with Trust | | Senior Vice President |
| Term of office1 and length of time served2 | | Since 2007 |
| Principal occupation(s) during past five years | | Senior Vice President of certain mutual funds associated with Legg Mason & Co. or its affiliates (since 2007); Senior Vice President of LMPFA (since 2006) and LMFAM (since 2013); Managing Director of Legg Mason & Co. (since 2005) and Legg Mason & Co. predecessors (prior to 2005) |
| † | Trustees who are not “interested persons” of the Portfolio within the meaning of section 2(a)(19) of the 1940 Act. |
| 1 | Each Trustee and officer serves until his or her respective successor has been duly elected and qualified or until his or her earlier death, resignation, retirement or removal. |
| 2 | Indicates the earliest year in which the Trustee became a board member for a fund in the Legg Mason fund complex or the officer took such office. |
| 3 | Mr. Fuller is an “interested person” of the Portfolio, as defined in the 1940 Act, because of his position with LMPFA and/or certain of its affiliates. |
| | |
| 58 | | Western Asset Variable High Income Portfolio |
Important tax information (unaudited)
The following information is provided with respect to the distributions paid during the taxable year ended December 31, 2014:
| | | | | | | | |
| Record date: | | | 6/11/2014 | | | | 12/17/2014 | |
| Payable date: | | | 6/12/2014 | | | | 12/18/2014 | |
Dividends qualifying for the dividends | | | | | | | | |
received deduction for corporations | | | 0.82 | % | | | 1.04 | % |
Please retain this information for your records.
| | |
| Western Asset Variable High Income Portfolio | | 59 |
Western Asset
Variable High Income Portfolio
Trustees
Elliott J. Berv
Jane F. Dasher
Mark T. Finn
Kenneth D. Fuller
President
Stephen R. Gross
Richard E. Hanson, Jr.
Diana R. Harrington
Chair
Susan M. Heilbron
Susan B. Kerley
Alan G. Merten
R. Richardson Pettit
Investment manager
Legg Mason Partners Fund Advisor, LLC
Subadvisers
Western Asset Management Company
Western Asset Management Company Limited
Distributor
Legg Mason Investor Services, LLC
Custodian
State Street Bank and Trust Company
Transfer agent
BNY Mellon Investment Servicing (US) Inc.
4400 Computer Drive
Westborough, MA 01581
Independent registered public accounting firm
KPMG LLP 345 Park Avenue New York, NY 10154
Western Asset Variable High Income Portfolio
The Portfolio is a separate investment series of Legg Mason Partners Variable Income Trust, a Maryland statutory trust.
Western Asset Variable High Income Portfolio
Legg Mason Funds
620 Eighth Avenue, 49th Floor
New York, NY 10018
The Portfolio files its complete schedule of portfolio holdings with the Securities and Exchange Commission (“SEC”) for the first and third quarters of each fiscal year on Form N-Q. The Portfolio’s Forms N-Q are available on the SEC’s website at www.sec.gov. The Portfolio’s Forms N-Q may be reviewed and copied at the SEC’s Public Reference Room in Washington, D.C., and information on the operation of the Public Reference Room may be obtained by calling 1-800-SEC-0330. To obtain information on Form N-Q, shareholders can call the Portfolio at 1-887-721-1926.
Information on how the Portfolio voted proxies relating to portfolio securities during the prior 12-month period ended June 30th of each year and a description of the policies and procedures that the Portfolio uses to determine how to vote proxies related to portfolio transactions are available (1) without charge, upon request, by calling the Portfolio at 1-887-721-1926, (2) on the Portfolio’s website at www.leggmason.com/individualinvestors and (3) on the SEC’s website at www.sec.gov.
This report is submitted for the general information of the shareholders of Western Asset Variable High Income Portfolio. This report is not authorized for distribution to prospective investors in the Portfolio unless preceded or accompanied by a current prospectus.
Investors should consider the Portfolio’s investment objectives, risks, charges and expenses carefully before investing. The prospectus contains this and other important information about the Portfolio. Please read the prospectus carefully before investing.
www.leggmason.com/individualinvestors
© 2015 Legg Mason Investor Services, LLC
Member FINRA, SIPC
Legg Mason Funds Privacy and Security Notice
Your Privacy and the Security of Your Personal Information is Very Important to the Legg Mason Funds
This Privacy and Security Notice (the “Privacy Notice”) addresses the Legg Mason Funds’ privacy and data protection practices with respect to nonpublic personal information the Funds receive. The Legg Mason Funds include any funds sold by the Funds’ distributor, Legg Mason Investor Services, LLC, as well as Legg Mason-sponsored closed-end funds and certain closed-end funds managed or sub-advised by Legg Mason or its affiliates. The provisions of this Privacy Notice apply to your information both while you are a shareholder and after you are no longer invested with the Funds.
The Type of Nonpublic Personal Information the Funds Collect About You
The Funds collect and maintain nonpublic personal information about you in connection with your shareholder account. Such information may include, but is not limited to:
| Ÿ | | Personal information included on applications or other forms; |
| Ÿ | | Account balances, transactions, and mutual fund holdings and positions; |
| Ÿ | | Online account access user IDs, passwords, security challenge question responses; and |
| Ÿ | | Information received from consumer reporting agencies regarding credit history and creditworthiness (such as the amount of an individual’s total debt, payment history, etc.). |
How the Funds Use Nonpublic Personal Information About You
The Funds do not sell or share your nonpublic personal information with third parties or with affiliates for their marketing purposes, or with other financial institutions or affiliates for joint marketing purposes, unless you have authorized the Funds to do so. The Funds do not disclose any nonpublic personal information about you except as may be required to perform transactions or services you have authorized or as permitted or required by law. The Funds may disclose information about you to:
| Ÿ | | Employees, agents, and affiliates on a “need to know” basis to enable the Funds to conduct ordinary business or comply with obligations to government regulators; |
| Ÿ | | Service providers, including the Funds’ affiliates, who assist the Funds as part of the ordinary course of business (such as printing, mailing services, or processing or servicing your account with us) or otherwise perform services on the Funds’ behalf, including companies that may perform marketing services solely for the Funds; |
| Ÿ | | The Funds’ representatives such as legal counsel, accountants and auditors; and |
| Ÿ | | Fiduciaries or representatives acting on your behalf, such as an IRA custodian or trustee of a grantor trust. |
|
| NOT PART OF THE ANNUAL REPORT |
Legg Mason Funds Privacy and Security Notice (cont’d)
Except as otherwise permitted by applicable law, companies acting on the Funds’ behalf are contractually obligated to keep nonpublic personal information the Funds provide to them confidential and to use the information the Funds share only to provide the services the Funds ask them to perform.
The Funds may disclose nonpublic personal information about you when necessary to enforce their rights or protect against fraud, or as permitted or required by applicable law, such as in connection with a law enforcement or regulatory request, subpoena, or similar legal process. In the event of a corporate action or in the event a Fund service provider changes, the Funds may be required to disclose your nonpublic personal information to third parties. While it is the Funds’ practice to obtain protections for disclosed information in these types of transactions, the Funds cannot guarantee their privacy policy will remain unchanged.
Keeping You Informed of the Funds’ Privacy and Security Practices
The Funds will notify you annually of their privacy policy as required by federal law. While the Funds reserve the right to modify this policy at any time they will notify you promptly if this privacy policy changes.
The Funds’ Security Practices
The Funds maintain appropriate physical, electronic and procedural safeguards designed to guard your nonpublic personal information. The Funds’ internal data security policies restrict access to your nonpublic personal information to authorized employees, who may use your nonpublic personal information for Fund business purposes only.
Although the Funds strive to protect your nonpublic personal information, they cannot ensure or warrant the security of any information you provide or transmit to them, and you do so at your own risk. In the event of a breach of the confidentiality or security of your nonpublic personal information, the Funds will attempt to notify you as necessary so you can take appropriate protective steps. If you have consented to the Funds using electronic communications or electronic delivery of statements, they may notify you under such circumstances using the most current email address you have on record with them.
In order for the Funds to provide effective service to you, keeping your account information accurate is very important. If you believe that your account information is incomplete, not accurate or not current, or if you have questions about the Funds’ privacy practices, write the Funds using the contact information on your account statements, email the Funds by clicking on the Contact Us section of the Funds’ website at www.leggmason.com, or contact the Fund at 1-877-721-1926.
Revised April 2011
|
| NOT PART OF THE ANNUAL REPORT |
www.leggmason.com/individualinvestors
© 2015 Legg Mason Investor Services, LLC Member FINRA, SIPC
FDXX010544 2/15 SR15-2413
The registrant has adopted a code of ethics that applies to the registrant’s principal executive officer, principal financial officer, principal accounting officer or controller.
| ITEM 3. | AUDIT COMMITTEE FINANCIAL EXPERT. |
The Board of Trustees of the registrant has determined that Stephen R. Gross and Jane F. Dasher possess the technical attributes identified in Instruction 2(b) of Item 3 to Form N-CSR to qualify as “audit committee financial experts,” and have designated Mr. Gross and Ms. Dasher as the Audit Committee’s financial experts. Mr. Gross and Ms. Dasher are “independent” Trustees pursuant to paragraph (a) (2) of Item 3 to Form N-CSR.
| ITEM 4. | PRINCIPAL ACCOUNTANT FEES AND SERVICES. |
a) Audit Fees. The aggregate fees billed in the last two fiscal years ending December 31, 2013 and December 31, 2014 (the “Reporting Periods”) for professional services rendered by the Registrant’s principal accountant (the “Auditor”) for the audit of the Registrant’s annual financial statements, or services that are normally provided by the Auditor in connection with the statutory and regulatory filings or engagements for the Reporting Periods, were $111,486 in December 31, 2013 and $160,401 in December 31, 2014.
b) Audit-Related Fees. The aggregate fees billed in the Reporting Period for assurance and related services by the Auditor that are reasonably related to the performance of the Registrant’s financial statements were $0 in December 31, 2013 and
$0 in December 31, 2014.
(c) Tax Fees. The aggregate fees billed in the Reporting Periods for professional services rendered by the Auditor for tax compliance, tax advice and tax planning (“Tax Services”) were $12,100 in December 31, 2013 and $15,200 in December 31, 2014. These services consisted of (i) review or preparation of U.S. federal, state, local and excise tax returns; (ii) U.S. federal, state and local tax planning, advice and assistance regarding statutory, regulatory or administrative developments, and (iii) tax advice regarding tax qualification matters and/or treatment of various financial instruments held or proposed to be acquired or held.
There were no fees billed for tax services by the Auditors to service affiliates during the Reporting Periods that required pre-approval by the Audit Committee.
d) All Other Fees. There were no other fees billed in the Reporting Periods for products and services provided by the Auditor, other than the services reported in paragraphs (a) through (c) of this Item for the Legg Mason Partners Variable Income Trust.
All Other Fees. There were no other non-audit services rendered by the Auditor to Legg Mason Partners Fund Advisors, LLC (“LMPFA”), and any entity controlling, controlled by or under common control with LMPFA that provided ongoing services to Legg Mason Partners Variable Income Trust requiring pre-approval by the Audit Committee in the Reporting Period.
(e) Audit Committee’s pre–approval policies and procedures described in paragraph (c) (7) of Rule 2-01 of Regulation S-X.
(1) The Charter for the Audit Committee (the “Committee”) of the Board of each registered investment company (the “Fund”) advised by LMPFA or one of their affiliates (each, an “Adviser”) requires that the Committee shall approve (a) all audit and permissible non-audit services to be provided to the Fund and (b) all permissible non-audit services to be provided by the Fund’s independent auditors to the Adviser and any Covered Service Providers if the engagement relates directly to the operations and financial reporting of the Fund. The Committee may implement policies and procedures by which such services are approved other than by the full Committee.
The Committee shall not approve non-audit services that the Committee believes may impair the independence of the auditors. As of the date of the approval of this Audit Committee Charter, permissible non-audit services include any professional services (including tax services), that are not prohibited services as described below, provided to the Fund by the independent auditors, other than those provided to the Fund in connection with an audit or a review of the financial statements of the Fund. Permissible non-audit services may not include: (i) bookkeeping or other services related to the accounting records or financial statements of the Fund; (ii) financial information systems design and implementation; (iii) appraisal or valuation services, fairness opinions or contribution-in-kind reports; (iv) actuarial services; (v) internal audit outsourcing services; (vi) management functions or human resources; (vii) broker or dealer, investment adviser or investment banking services; (viii) legal services and expert services unrelated to the audit; and (ix) any other service the Public Company Accounting Oversight Board determines, by regulation, is impermissible.
Pre-approval by the Committee of any permissible non-audit services is not required so long as: (i) the aggregate amount of all such permissible non-audit services provided to the Fund, the Adviser and any service providers controlling, controlled by or under common control with the Adviser that provide ongoing services to the Fund (“Covered Service Providers”) constitutes not more than 5% of the total amount of revenues paid to the independent auditors during the fiscal year in which the permissible non-audit services are provided to (a) the Fund, (b) the Adviser and (c) any entity controlling, controlled by or under common control with the Adviser that provides ongoing services to the Fund during the fiscal year in which the services are provided that would have to be approved by the Committee; (ii) the permissible non-audit services were not recognized by the Fund at the time of the engagement to be non-audit services; and (iii) such services are promptly brought to the attention of the Committee and approved by the Committee (or its delegate(s)) prior to the completion of the audit.
(2) For the Legg Mason Partners Variable Income Trust, the percentage of fees that were approved by the audit committee, with respect to: Audit-Related Fees were 100% and 100% for December 31, 2013 and December 31, 2014; Tax Fees were 100% and 100% for December 31, 2013 and December 31, 2014; and Other Fees were 100% and 100% for December 31, 2013 and December 31, 2014.
(f) N/A
(g) Non-audit fees billed by the Auditor for services rendered to Legg Mason Partners Variable Income Trust, LMPFA and any entity controlling, controlled by, or under common control with LMPFA that provides ongoing services to Legg Mason Partners Variable Income Trust during the reporting period were $0 in December 31, 2014.
(h) Yes. Legg Mason Partners Variable Income Trust’s Audit Committee has considered whether the provision of non-audit services that were rendered to Service Affiliates, which were not pre-approved (not requiring pre-approval), is compatible with maintaining the Accountant’s independence. All services provided by the Auditor to the Legg Mason Partners Variable Income Trust or to Service Affiliates, which were required to be pre-approved, were pre-approved as required.
| ITEM 5. | AUDIT COMMITTEE OF LISTED REGISTRANTS. |
| | a) | The independent board members are acting as the registrant’s audit committee as specified in Section 3(a)(58)(B) of the Exchange Act. The Audit Committee consists of the following Board members: |
Elliott J. Berv
Jane F. Dasher
Mark T. Finn
Stephen R. Gross
Richard E. Hanson, Jr.
Diana R. Harrington
Susan M. Heilbron
Susan B. Kerley
Alan G. Merten
R. Richardson Pettit
| ITEM 6. | SCHEDULE OF INVESTMENTS. |
Included herein under Item 1.
| ITEM 7. | DISCLOSURE OF PROXY VOTING POLICIES AND PROCEDURES FOR CLOSED-END MANAGEMENT INVESTMENT COMPANIES. |
Not applicable.
| ITEM 8. | PORTFOLIO MANAGERS OF CLOSED-END MANAGEMENT INVESTMENT COMPANIES. |
Not applicable.
| ITEM 9. | PURCHASES OF EQUITY SECURITIES BY CLOSED-END MANAGEMENT INVESTMENT COMPANY AND AFFILIATED PURCHASERS. |
Not applicable.
| ITEM 10. | SUBMISSION OF MATTERS TO A VOTE OF SECURITY HOLDERS. |
Not applicable.
| ITEM 11. | CONTROLS AND PROCEDURES. |
| | (a) | The registrant’s principal executive officer and principal financial officer have concluded that the registrant’s disclosure controls and procedures (as defined in Rule 30a- 3(c) under the Investment Company Act of 1940, as amended (the “1940 Act”)) are effective as of a date within 90 days of the filing date of this report that includes the disclosure required by this paragraph, based on their evaluation of the disclosure controls and procedures required by Rule 30a-3(b) under the 1940 Act and 15d-15(b) under the Securities Exchange Act of 1934. |
| | (b) | There were no changes in the registrant’s internal control over financial reporting (as defined in Rule 30a-3(d) under the 1940 Act) that occurred during the second fiscal quarter of the period covered by this report that have materially affected, or are likely to materially affect the registrant’s internal control over financial reporting. |
(a) (1) Code of Ethics attached hereto.
Exhibit 99.CODE ETH
(a) (2) Certifications pursuant to section 302 of the Sarbanes-Oxley Act of 2002 attached hereto.
Exhibit 99.CERT
(b) Certifications pursuant to Section 906 of the Sarbanes-Oxley Act of 2002 attached hereto.
Exhibit 99.906CERT
SIGNATURES
Pursuant to the requirements of the Securities Exchange Act of 1934 and the Investment Company Act of 1940, the registrant has duly caused this Report to be signed on its behalf by the undersigned, there unto duly authorized.
Legg Mason Partners Variable Income Trust
| | |
| By: | | /s/ Kenneth D. Fuller |
| | Kenneth D. Fuller |
| | Chief Executive Officer |
| |
| Date: | | February 25, 2015 |
Pursuant to the requirements of the Securities Exchange Act of 1934 and the Investment Company Act of 1940, this report has been signed below by the following persons on behalf of the registrant and in the capacities and on the dates indicated.
| | |
| By: | | /s/ Kenneth D. Fuller |
| | Kenneth D. Fuller |
| | Chief Executive Officer |
| |
| Date: | | February 25, 2015 |
| |
| By: | | /s/ Richard F. Sennett |
| | Richard F. Sennett |
| | Principal Financial Officer |
| |
| Date: | | February 25, 2015 |