UNITED STATES
SECURITIES AND EXCHANGE COMMISSION
Washington, D.C. 20549
FORM N-CSR
CERTIFIED SHAREHOLDER REPORT OF REGISTERED
MANAGEMENT INVESTMENT COMPANIES
Investment Company Act file number 811-06310
Legg Mason Partners Variable Income Trust
(Exact name of registrant as specified in charter)
620 Eighth Avenue, 49th Floor, New York, NY 10018
(Address of principal executive offices) (Zip code)
Robert I. Frenkel, Esq.
Legg Mason & Co., LLC
100 First Stamford Place
Stamford, CT 06902
(Name and address of agent for service)
Registrant’s telephone number, including area code: 1-877-721-1926
Funds Investor Services
Date of fiscal year end: December 31
Date of reporting period: June 30, 2014
| ITEM 1. | REPORT TO STOCKHOLDERS. |
The Semi-Annual Report to Stockholders is filed herewith.

| | |
| Semi-Annual Report | | June 30, 2014 |
WESTERN ASSET
VARIABLE HIGH INCOME PORTFOLIO

|
| INVESTMENT PRODUCTS: NOT FDIC INSURED • NO BANK GUARANTEE • MAY LOSE VALUE |
Portfolio objectives
The Portfolio seeks to provide high current income as its primary objective. Its secondary objective is capital appreciation.
Letter from the president

Dear Shareholder,
We are pleased to provide the semi-annual report of Western Asset Variable High Income Portfolio for the six-month reporting period ended June 30, 2014. Please read on for Portfolio performance information and a detailed look at prevailing economic and market conditions during the Portfolio’s reporting period.
As always, we remain committed to providing you with excellent service and a full spectrum of investment choices. We also remain committed to supplementing the support you receive from your financial advisor. One way we accomplish this is through our website, www.leggmason.com/individualinvestors. Here you can gain immediate access to market and investment information, including:
| Ÿ | | Market insights and commentaries from our portfolio managers and |
| Ÿ | | A host of educational resources. |
We look forward to helping you meet your financial goals.
Sincerely,

Kenneth D. Fuller
President and Chief Executive Officer
July 31, 2014
| | |
| II | | Western Asset Variable High Income Portfolio |
Investment commentary
Economic review
Since the end of the Great Recession, the U.S. economy has expanded at a slower than usual pace, compared to recent history. U.S. gross domestic product (“GDP”)i growth, as reported by the U.S. Department of Commerce’s revised figures, was 4.5% during the third quarter of 2013, its best reading since the fourth quarter of 2011. At the beginning of the six months ended June 30, 2014 (the “reporting period”), the severe winter weather of January and February played a key role in a sharp reversal in the economy, a 2.1% contraction during the first quarter of 2014. This was the first negative GDP report in three years. Negative contributions were widespread: private inventory investment, exports, state and local government spending, nonresidential and residential fixed investment. Thankfully, this setback was very brief, as the initial reading for second quarter GDP growth, released after the reporting period ended, was 4.0%, suggesting the recovery has some resilience and continues to recover from the severe consequences of the Great Recession. The second quarter rebound in GDP growth was driven by several factors, including increased private inventory investment and exports, as well as an acceleration in personal consumption expenditures and an upturn in state and local government spending.
The U.S. manufacturing sector continued to support the economy during the reporting period. Based on figures for the Institute for Supply Management’s Purchasing Managers’ Index (“PMI”)ii, U.S. manufacturing expanded during all six months of the reporting period (a reading below 50 indicates a contraction, whereas a reading above 50 indicates an expansion). After a reading of 56.5 in December 2013, the PMI fell to 51.3 in January 2014, its weakest reading since May 2013. However, the PMI moved up the next four months and was 55.4 in May 2014, and slipped to 55.3 in June, with fifteen of the eighteen industries within the PMI expanding.
The U.S. job market improved during the reporting period. When the period began, unemployment, as reported by the U.S. Department of Labor, was 6.6%. Unemployment then ticked up to 6.7% in February and held steady in March 2014. Unemployment then fell to 6.3% in April and was unchanged in May. The labor market then gathered additional momentum in June, as the unemployment rate fell to 6.1%, the lowest level since September 2008. However, falling unemployment during the period was partially due to a decline in the workforce participation rate, which was 62.8% from May through June 2014, matching the lowest level since 1978. The number of longer-term unemployed, however, declined, as 32.8% of the 9.5 million Americans looking for work in June 2014 had been out of work for more than six months. In contrast, 37.7% of the 10.4 million Americans looking for work in December 2013 had been out of work for more than six months.
Growth outside the U.S. generally improved in developed countries. In its April 2014 World Economic Outlook Update, released after the reporting period ended, the International Monetary Fund (“IMF”) stated that “Global activity has broadly strengthened and is expected to improve further in 2014–15, with much of the impetus coming from advanced economies.” From a regional perspective, the IMF anticipates 2014 growth will be 1.2% in the Eurozone, versus -0.5% in 2013. Economic activity in Japan is expected to be relatively stable, with growth of 1.4% in 2014, compared to 1.5% in 2013. After moderating in 2013, the IMF projects that overall growth in emerging market countries will improve somewhat in 2014, with growth of 4.9% versus 4.7% in 2013.
| | |
| Western Asset Variable High Income Portfolio | | III |
Investment commentary (cont’d)
Market review
Q. How did the Federal Reserve Board (“Fed”)iii respond to the economic environment?
A. The Fed took a number of actions as it sought to meet its dual mandate of fostering maximum employment and price stability. As has been the case since December 2008, the Fed kept the federal funds rateiv at a historically low range between zero and 0.25%. At its meeting in December 2012, prior to the beginning of the reporting period, the Fed announced that it would continue purchasing $40 billion per month of agency mortgage-backed securities (“MBS”), as well as initially purchasing $45 billion per month of longer-term Treasuries. Following the meeting that concluded on December 18, 2013, the Fed announced that it would begin tapering its monthly asset purchases, saying “Beginning in January 2014, the Committee will add to its holdings of agency MBS at a pace of $35 billion per month rather than $40 billion per month, and will add to its holdings of longer-term Treasury securities at a pace of $40 billion per month rather than $45 billion per month.”
At each of the Fed’s next four meetings (January, March, April and June 2014), it announced further $10 billion tapering of its asset purchases. Finally, at its meeting that ended on July 30, 2014, after the reporting period ended, the Fed again cut its monthly asset purchases. Beginning in August, it will buy a total of $25 billion per month ($10 billion per month of agency MBS and $15 billion per month of longer-term Treasuries).
Q. Did Treasury yields trend higher or lower during the six months ended June 30, 2014?
A. Short-term Treasury yields moved higher, whereas long-term Treasury yields declined during the reporting period. When the reporting period began, the yield on the two-year Treasury was 0.38%. It fell as low as 0.30% in early February 2014, and was as high as 0.51% on June 17, 2014, before ending the period at 0.47%. The yield on the ten-year Treasury began the period at 3.04%, its peak for the period. The ten-year Treasury fell as low as 2.44% on May 28, 2014 and ended the period at 2.53%.
Q. What factors impacted the spread sectors (non-Treasuries) during the reporting period?
A. The spread sectors generated positive results during the reporting period, rallying in January and February 2014, as investor demand was solid overall. The majority of spread sectors then modestly declined in March as interest rates moved higher. However, the reporting period ended on an upbeat note as the spread sectors generated positive results from April through June. The overall bond market, as measured by the Barclays U.S. Aggregate Indexv, gained 3.93% during the six months ended June 30, 2014.
Q. How did the high-yield bond market perform over the six months ended June 30, 2014?
A. The U.S. high-yield bond market was among the best performing spread sectors during the reporting period, gaining 5.46% for the six months ended June 30, 2014. The asset class, as measured by the Barclays U.S. Corporate High Yield — 2% Issuer Cap Indexvi, posted positive returns during all six
| | |
| IV | | Western Asset Variable High Income Portfolio |
months covered by the reporting period. Supporting the high yield market was generally solid investor demand and low defaults.
Q. How did the emerging markets debt asset class perform over the reporting period?
A. The asset class was volatile but generated extremely strong results during the six months ended June 30, 2014. The asset class weakened in January 2014, given renewed concerns about China’s economy and depreciating emerging market currencies. However, the asset class rallied sharply from February through June 2014 as investor demand was generally robust. Overall, the JPMorgan Emerging Markets Bond Index Global (“EMBI Global”)vii gained 9.10% during the six months ended June 30, 2014.
Performance review
For the six months ended June 30, 2014, Western Asset Variable High Income Portfolio1 returned 5.40%. The Portfolio’s unmanaged benchmark, the Barclays U.S. Corporate High Yield — 2% Issuer Cap Index, returned 5.46% for the same period. The Lipper Variable High Yield Funds Category Average2 returned 4.72% over the same time frame.
| | | | |
Performance Snapshot as of June 30, 2014
(unaudited) | | | |
| | | 6 months | |
| Western Asset Variable High Income Portfolio1 | | | 5.40 | % |
| Barclays U.S. Corporate High Yield — 2% Issuer Cap Index | | | 5.46 | % |
Lipper Variable High Yield Funds
Category Average2 | | | 4.72 | % |
The performance shown represents past performance. Past performance is no guarantee of future results and current performance may be higher or lower than the performance shown above. Principal value, investment returns and yields will fluctuate and investors’ shares, when redeemed, may be worth more or less than their original cost.
Portfolio return assumes the reinvestment of all distributions, including returns of capital, if any, at net asset value and the deduction of all Portfolio expenses. Performance figures for periods shorter than one year represent cumulative figures and are not annualized.
The 30-Day SEC Yield for the period ended June 30, 2014 was 5.80%. The 30-Day SEC Yield is subject to change and is based on the yield to maturity of the Portfolio’s investments over a 30-day period and not on the dividends paid by the Portfolio, which may differ.
|
| Total Annual Operating Expenses (unaudited) |
As of the Portfolio’s current prospectus dated May 1, 2014, the gross total annual operating expense ratio for the Portfolio was 0.74%.
| 1 | The Portfolio is an underlying investment option of various variable annuity and variable life insurance products. The Portfolio’s performance returns do not reflect the deduction of expenses imposed in connection with investing in variable annuity or variable life insurance contracts, such as administrative fees, account charges and surrender charges, which, if reflected, would reduce the performance of the Portfolio. Past performance is no guarantee of future results. |
| 2 | Lipper, Inc., a wholly-owned subsidiary of Reuters, provides independent insight on global collective investments. Returns are based on the six-month period ended June 30, 2014, including the reinvestment of all distributions, including returns of capital, if any, calculated among the 112 funds in the Portfolio’s Lipper category. |
| | |
| Western Asset Variable High Income Portfolio | | V |
Investment commentary (cont’d)
Actual expenses may be higher. For example, expenses may be higher than those shown if average net assets decrease. Net assets are more likely to decrease and Portfolio expense ratios are more likely to increase when markets are volatile.
As always, thank you for your confidence in our stewardship of your assets.
Sincerely,
Kenneth D. Fuller
President and Chief Executive Officer
July 31, 2014
RISKS: As interest rates rise, bond prices fall, reducing the value of the Portfolio’s share price. High-yield bonds are rated below investment grade and carry more risk than higher-rated securities. Also, the Portfolio is subject to fluctuations in share price as interest rates rise and fall and is subject to certain risks of overseas investing, including currency fluctuations, differing securities regulations and periods of illiquidity, which could result in significant market fluctuations. These risks are magnified in emerging markets. The Portfolio may use derivatives, such as options and futures, which can be illiquid, may disproportionately increase losses, and have a potentially large impact on Portfolio performance. Please see the Portfolio’s prospectus for a more complete discussion of these and other risks, and the Portfolio’s investment strategies.
All investments are subject to risk including the possible loss of principal. Past performance is no guarantee of future results. All index performance reflects no deduction for fees, expenses or taxes. Please note that an investor cannot invest directly in an index.
The information provided is not intended to be a forecast of future events, a guarantee of future results or investment advice. Views expressed may differ from those of the firm as a whole. Forecasts and predictions are inherently limited and should not be relied upon as an indication of actual or future performance.
| i | Gross domestic product (“GDP”) is the market value of all final goods and services produced within a country in a given period of time. |
| ii | The Institute for Supply Management’s PMI is based on a survey of purchasing executives who buy the raw materials for manufacturing at more than 350 companies. It offers an early reading on the health of the U.S. manufacturing sector. |
| iii | The Federal Reserve Board (“Fed”) is responsible for the formulation of policies designed to promote economic growth, full employment, stable prices and a sustainable pattern of international trade and payments. |
| iv | The federal funds rate is the rate charged by one depository institution on an overnight sale of immediately available funds (balances at the Federal Reserve) to another depository institution; the rate may vary from depository institution to depository institution and from day to day. |
| v | The Barclays U.S. Aggregate Index is a broad-based bond index comprised of government, corporate, mortgage- and asset-backed issues, rated investment grade or higher, and having at least one year to maturity. |
| vi | The Barclays U.S. Corporate High Yield — 2% Issuer Cap Index is an index of the 2% Issuer Cap component of the Barclays U.S. Corporate High Yield Index, which covers the U.S. dollar-denominated, non-investment grade, fixed-rate, taxable corporate bond market. |
| vii | The JPMorgan Emerging Markets Bond Index Global (“EMBI Global”) tracks total returns for U.S. dollar-denominated debt instruments issued by emerging market sovereign and quasi-sovereign entities: Brady bonds, loans, Eurobonds and local market instruments. |
| | |
| VI | | Western Asset Variable High Income Portfolio |
Portfolio at a glance† (unaudited)
Investment breakdown (%) as a percent of total investments
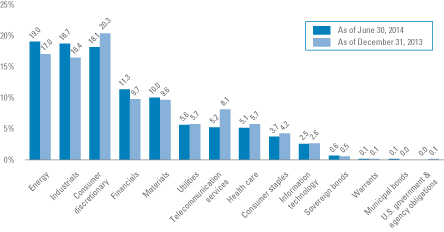
| † | The bar graph above represents the composition of the Portfolio’s investments as of June 30, 2014 and December 31, 2013 and does not include derivatives, such as swap contracts and forward foreign currency contracts. The Portfolio is actively managed. As a result, the composition of the Portfolio’s investments is subject to change at any time. |
| | |
| Western Asset Variable High Income Portfolio 2014 Semi-Annual Report | | 1 |
Portfolio expenses (unaudited)
Example
As a shareholder of the Portfolio, you may incur two types of costs: (1) transaction costs and (2) ongoing costs, including management fees and other Portfolio expenses. This example is intended to help you understand your ongoing costs (in dollars) of investing in the Portfolio and to compare these costs with the ongoing costs of investing in other mutual funds.
This example is based on an investment of $1,000 invested on January 1, 2014 and held for the six months ended June 30, 2014.
Actual expenses
The table below titled “Based on Actual Total Return” provides information about actual account values and actual expenses. You may use the information provided in this table, together with the amount you invested, to estimate the expenses that you paid over the period. To estimate the expenses you paid on your account, divide your ending account value by $1,000 (for example, an $8,600 ending account value divided by $1,000 = 8.6), then multiply the result by the number under the heading entitled “Expenses Paid During the Period”.
Hypothetical example for comparison purposes
The table below titled “Based on Hypothetical Total Return” provides information about hypothetical account values and hypothetical expenses based on the actual expense ratio and an assumed rate of return of 5.00% per year before expenses, which is not the Portfolio’s actual return. The hypothetical account values and expenses may not be used to estimate the actual ending account balance or expenses you paid for the period. You may use the information provided in this table to compare the ongoing costs of investing in the Portfolio and other funds. To do so, compare the 5.00% hypothetical example relating to the Portfolio with the 5.00% hypothetical examples that appear in the shareholder reports of the other funds.
Please note that the expenses shown in the table below are meant to highlight your ongoing costs only and do not reflect any transactional costs. Therefore, the table is useful in comparing ongoing costs only, and will not help you determine the relative total costs of owning different funds. In addition, if these transaction costs were included, your costs would have been higher.
| | | | | | | | | | | | | | | | | | | | | | | | | | | | | | | | | | | | | | | | | | | | | | | | | | |
| Based on actual total return1 | | | | Based on hypothetical total return1 |
Actual
Total
Return2 | | Beginning
Account
Value | | Ending
Account
Value | | Annualized
Expense
Ratio | | Expenses
Paid During
the Period3 | | | | Hypothetical
Annualized
Total Return | | Beginning
Account
Value | | Ending
Account
Value | | Annualized
Expense
Ratio | | Expenses
Paid During
the Period3 |
| | | 5.40% | | | | $ | 1,000.00 | | | | $ | 1,054.00 | | | | | 0.75 | % | | | $ | 3.82 | | | | | | | 5.00 | % | | | | $1,000.00 | | | | $ | 1,021.08 | | | | | 0.75 | % | | | $ | 3.76 | |
| 1 | For the six months ended June 30, 2014. |
| 2 | Assumes the reinvestment of all distributions, including returns of capital, if any, at net asset value. Total return is not annualized, as it may not be representative of the total return for the year. Total return does not reflect expenses associated with separate accounts such as administrative fee, account charges and surrender charges, which, if reflected, would reduce the total return. Performance figures may reflect compensating balance arrangements, fee waivers and/or expense reimbursements. In the absence of compensating balance arrangements, fee waivers and/or expense reimbursements, the total return would have been lower. Past performance is no guarantee of future results. |
| 3 | Expenses (net of compensating balance arrangements, fee waivers and/or expense reimbursements) are equal to each class’ annualized expense ratio multiplied by the average account value over the period, multiplied by the number of days in the most recent fiscal half-year (181), then divided by 365. |
| | |
| 2 | | Western Asset Variable High Income Portfolio 2014 Semi-Annual Report |
Spread duration (unaudited)
Economic exposure — June 30, 2014
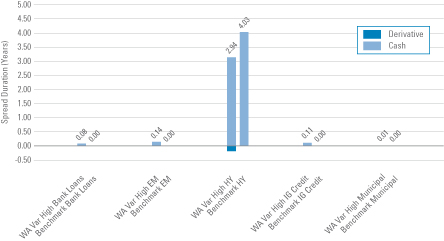
Spread duration measures the sensitivity to changes in spreads. The spread over Treasuries is the annual risk-premium demanded by investors to hold non-Treasury securities. Spread duration is quantified as the % change in price resulting from a 100 basis points change in spreads. For a security with positive spread duration, an increase in spreads would result in a price decline and a decline in spreads would result in a price increase. This chart highlights the market sector exposure of the Portfolio’s sectors relative to the selected benchmark sectors as of the end of the reporting period.
| | |
| Benchmark | | — Barclays U.S. Corporate High Yield — 2% Issuer Cap Index |
| EM | | — Emerging Markets |
| HY | | — High Yield |
| IG Credit | | — Investment Grade Credit |
| WA Var High | | — Western Asset Variable High Income Portfolio |
| | |
| Western Asset Variable High Income Portfolio 2014 Semi-Annual Report | | 3 |
Effective duration (unaudited)
Interest rate exposure — June 30, 2014
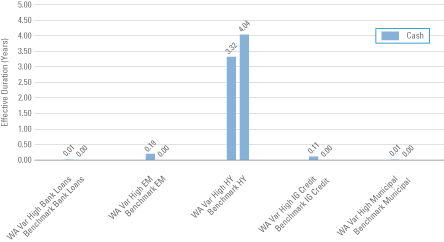
Effective duration measures the sensitivity to changes in relevant interest rates. Effective duration is quantified as the % change in price resulting from a 100 basis points change in interest rates. For a security with positive effective duration, an increase in interest rates would result in a price decline and a decline in interest rates would result in a price increase. This chart highlights the interest rate exposure of the Portfolio’s sectors relative to the selected benchmark sectors as of the end of the reporting period.
| | |
| Benchmark | | — Barclays U.S. Corporate High Yield — 2% Issuer Cap Index |
| EM | | — Emerging Markets |
| HY | | — High Yield |
| IG Credit | | — Investment Grade Credit |
| WA Var High | | — Western Asset Variable High Income Portfolio |
| | |
| 4 | | Western Asset Variable High Income Portfolio 2014 Semi-Annual Report |
Schedule of investments (unaudited)
June 30, 2014
Western Asset Variable High Income Portfolio
| | | | | | | | | | | | | | | | |
| Security | | Rate | | | Maturity
Date | | | Face
Amount† | | | Value | |
| Corporate Bonds & Notes — 88.6% | | | | | | | | | | | | | | | | |
| Consumer Discretionary — 16.6% | | | | | | | | | | | | | | | | |
Auto Components — 0.3% | | | | | | | | | | | | | | | | |
American Axle & Manufacturing Inc., Senior Notes | | | 7.750 | % | | | 11/15/19 | | | | 130,000 | | | $ | 150,475 | |
American Axle & Manufacturing Inc., Senior Notes | | | 6.625 | % | | | 10/15/22 | | | | 80,000 | | | | 88,000 | |
Total Auto Components | | | | | | | | | | | | | | | 238,475 | |
Automobiles — 0.2% | | | | | | | | | | | | | | | | |
Chrysler Group LLC/CG Co.-Issuer Inc., Secured Notes | | | 8.250 | % | | | 6/15/21 | | | | 200,000 | | | | 227,000 | |
Distributors — 0.2% | | | | | | | | | | | | | | | | |
LKQ Corp., Senior Notes | | | 4.750 | % | | | 5/15/23 | | | | 240,000 | | | | 237,840 | |
Diversified Consumer Services — 0.4% | | | | | | | | | | | | | | | | |
Service Corp. International, Senior Notes | | | 7.500 | % | | | 4/1/27 | | | | 210,000 | | | | 233,100 | |
StoneMor Partners LP/Cornerstone Family Services of WV, Senior Notes | | | 7.875 | % | | | 6/1/21 | | | | 200,000 | | | | 211,000 | (a) |
Total Diversified Consumer Services | | | | | | | | | | | | | | | 444,100 | |
Hotels, Restaurants & Leisure — 5.0% | | | | | | | | | | | | | | | | |
24 Hour Holdings III LLC, Senior Notes | | | 8.000 | % | | | 6/1/22 | | | | 130,000 | | | | 130,000 | (a) |
Bossier Casino Venture Holdco Inc. | | | 11.000 | % | | | 2/9/18 | | | | 51,147 | | | | 51,311 | (b) |
Bossier Casino Venture Holdco Inc., Senior Secured Bonds | | | 14.000 | % | | | 2/9/18 | | | | 387,264 | | | | 382,888 | (a)(b)(c)(d) |
Burger King Capital Holdings LLC/Burger King Capital Finance Inc., Senior Notes, Step Bond | | | 0.000 | % | | | 4/15/19 | | | | 110,000 | | | | 102,300 | (a) |
Caesars Entertainment Operating Co. Inc., Senior Secured Notes | | | 11.250 | % | | | 6/1/17 | | | | 160,000 | | | | 147,200 | |
Caesars Entertainment Operating Co. Inc., Senior Secured Notes | | | 9.000 | % | | | 2/15/20 | | | | 190,000 | | | | 159,837 | |
Caesars Entertainment Operating Co. Inc., Senior Secured Notes | | | 9.000 | % | | | 2/15/20 | | | | 20,000 | | | | 16,750 | |
Caesars Entertainment Resort Properties LLC, Secured Notes | | | 11.000 | % | | | 10/1/21 | | | | 370,000 | | | | 399,600 | (a) |
Carrols Restaurant Group Inc., Senior Secured Notes | | | 11.250 | % | | | 5/15/18 | | | | 200,000 | | | | 226,250 | |
CEC Entertainment Inc., Senior Notes | | | 8.000 | % | | | 2/15/22 | | | | 140,000 | | | | 145,600 | (a) |
Downstream Development Quapaw, Senior Secured Notes | | | 10.500 | % | | | 7/1/19 | | | | 220,000 | | | | 238,150 | (a) |
Greektown Holdings LLC/Greektown Mothership Corp., Senior Secured Notes | | | 8.875 | % | | | 3/15/19 | | | | 160,000 | | | | 164,000 | (a) |
Hilton Worldwide Finance LLC/Hilton Worldwide Finance Corp., Senior Notes | | | 5.625 | % | | | 10/15/21 | | | | 370,000 | | | | 393,819 | (a) |
Hoa Restaurant Group LLC/Hoa Finance Corp., Senior Secured Notes | | | 11.250 | % | | | 4/1/17 | | | | 360,000 | | | | 381,600 | (a) |
Landry’s Holdings II Inc., Senior Notes | | | 10.250 | % | | | 1/1/18 | | | | 360,000 | | | | 383,400 | (a) |
Landry’s Inc., Senior Notes | | | 9.375 | % | | | 5/1/20 | | | | 613,000 | | | | 677,365 | (a) |
MCE Finance Ltd., Senior Notes | | | 5.000 | % | | | 2/15/21 | | | | 270,000 | | | | 274,050 | (a) |
Mohegan Tribal Gaming Authority, Senior Notes | | | 9.750 | % | | | 9/1/21 | | | | 210,000 | | | | 234,150 | |
See Notes to Financial Statements.
| | |
| Western Asset Variable High Income Portfolio 2014 Semi-Annual Report | | 5 |
Schedule of investments (unaudited) (cont’d)
June 30, 2014
Western Asset Variable High Income Portfolio
| | | | | | | | | | | | | | | | |
| Security | | | Rate | | |
| Maturity
Date |
| |
| Face
Amount† |
| | | Value | |
Hotels, Restaurants & Leisure — continued | | | | | | | | | | | | | | | | |
Paris Las Vegas Holding LLC/Harrah’s Las Vegas LLC/Flamingo Las Vegas Holding LLC, Senior Secured Notes | | | 8.000 | % | | | 10/1/20 | | | | 140,000 | | | $ | 147,000 | (a) |
Seven Seas Cruises S de RL LLC, Senior Secured Notes | | | 9.125 | % | | | 5/15/19 | | | | 480,000 | | | | 526,200 | |
Total Hotels, Restaurants & Leisure | | | | | | | | | | | | | | | 5,181,470 | |
Household Durables — 1.0% | | | | | | | | | | | | | | | | |
Century Intermediate Holding Co. 2, Senior Notes | | | 9.750 | % | | | 2/15/19 | | | | 340,000 | | | | 364,225 | (a)(c) |
William Lyon Homes Inc., Senior Notes | | | 8.500 | % | | | 11/15/20 | | | | 260,000 | | | | 292,175 | |
Woodside Homes Co. LLC/Woodside Homes Finance Inc., Senior Notes | | | 6.750 | % | | | 12/15/21 | | | | 340,000 | | | | 348,500 | (a) |
Total Household Durables | | | | | | | | | | | | | | | 1,004,900 | |
Media — 6.4% | | | | | | | | | | | | | | | | |
Altice SA, Senior Secured Notes | | | 7.750 | % | | | 5/15/22 | | | | 470,000 | | | | 502,900 | (a) |
Carmike Cinemas Inc., Secured Notes | | | 7.375 | % | | | 5/15/19 | | | | 120,000 | | | | 131,100 | |
CCO Holdings LLC/CCO Holdings Capital Corp., Senior Notes | | | 8.125 | % | | | 4/30/20 | | | | 200,000 | | | | 217,000 | |
Clear Channel Communications Inc., Senior Notes | | | 10.000 | % | | | 1/15/18 | | | | 210,000 | | | | 204,225 | (a) |
Clear Channel Worldwide Holdings Inc., Senior Notes | | | 6.500 | % | | | 11/15/22 | | | | 100,000 | | | | 107,250 | |
Clear Channel Worldwide Holdings Inc., Senior Subordinated Notes | | | 7.625 | % | | | 3/15/20 | | | | 80,000 | | | | 86,000 | |
CSC Holdings LLC, Senior Notes | | | 6.750 | % | | | 11/15/21 | | | | 330,000 | | | | 364,237 | |
DISH DBS Corp., Senior Notes | | | 6.625 | % | | | 10/1/14 | | | | 40,000 | | | | 40,550 | |
DISH DBS Corp., Senior Notes | | | 7.875 | % | | | 9/1/19 | | | | 480,000 | | | | 571,200 | |
DISH DBS Corp., Senior Notes | | | 5.875 | % | | | 7/15/22 | | | | 200,000 | | | | 217,500 | |
Gibson Brands Escrow Corp., Senior Secured Notes | | | 8.875 | % | | | 8/1/18 | | | | 80,000 | | | | 82,700 | (a) |
Gibson Brands Inc., Senior Secured Notes | | | 8.875 | % | | | 8/1/18 | | | | 190,000 | | | | 196,413 | (a) |
MDC Partners Inc., Senior Notes | | | 6.750 | % | | | 4/1/20 | | | | 280,000 | | | | 296,800 | (a) |
MediaNews Group Inc. | | | 12.000 | % | | | 12/31/18 | | | | 200,000 | | | | 200,000 | (b) |
New Cotai LLC/New Cotai Capital Corp., Senior Secured Notes | | | 10.625 | % | | | 5/1/19 | | | | 528,199 | | | | 612,711 | (a)(c) |
Numericable Group SA, Senior Secured Bonds | | | 6.000 | % | | | 5/15/22 | | | | 400,000 | | | | 416,500 | (a) |
Ono Finance II PLC, Senior Bonds | | | 10.875 | % | | | 7/15/19 | | | | 270,000 | | | | 296,325 | (a) |
Regal Entertainment Group, Senior Notes | | | 5.750 | % | | | 3/15/22 | | | | 170,000 | | | | 177,225 | |
Sinclair Television Group Inc., Senior Notes | | | 5.375 | % | | | 4/1/21 | | | | 150,000 | | | | 151,688 | |
Univision Communications Inc., Senior Notes | | | 8.500 | % | | | 5/15/21 | | | | 280,000 | | | | 311,850 | (a) |
Univision Communications Inc., Senior Secured Notes | | | 7.875 | % | | | 11/1/20 | | | | 330,000 | | | | 364,650 | (a) |
Univision Communications Inc., Senior Secured Notes | | | 6.750 | % | | | 9/15/22 | | | | 145,000 | | | | 161,131 | (a) |
Virgin Media Finance PLC, Senior Notes | | | 6.375 | % | | | 4/15/23 | | | | 360,000 | | | | 392,400 | (a) |
Virgin Media Secured Finance PLC, Senior Secured Bonds | | | 5.500 | % | | | 1/15/25 | | | | 200,000 | | | | 207,750 | (a) |
WMG Acquisition Corp., Senior Notes | | | 6.750 | % | | | 4/15/22 | | | | 310,000 | | | | 311,550 | (a) |
Total Media | | | | | | | | | | | | | | | 6,621,655 | |
See Notes to Financial Statements.
| | |
| 6 | | Western Asset Variable High Income Portfolio 2014 Semi-Annual Report |
Western Asset Variable High Income Portfolio
| | | | | | | | | | | | | | | | |
| Security | | | Rate | | |
| Maturity
Date |
| |
| Face
Amount† |
| | | Value | |
Multiline Retail — 0.5% | | | | | | | | | | | | | | | | |
Neiman Marcus Group Ltd. LLC, Senior Notes | | | 8.750 | % | | | 10/15/21 | | | | 450,000 | | | $ | 492,750 | (a)(c) |
Specialty Retail — 2.2% | | | | | | | | | | | | | | | | |
American Greetings Corp., Senior Notes | | | 7.375 | % | | | 12/1/21 | | | | 100,000 | | | | 106,625 | |
CST Brands Inc., Senior Notes | | | 5.000 | % | | | 5/1/23 | | | | 360,000 | | | | 361,800 | |
Edcon Pty Ltd., Senior Secured Notes | | | 9.500 | % | | | 3/1/18 | | | | 400,000 | | | | 408,000 | (a) |
Guitar Center Inc., Senior Bonds | | | 9.625 | % | | | 4/15/20 | | | | 560,000 | | | | 526,400 | (a) |
Men’s Wearhouse Inc., Senior Notes | | | 7.000 | % | | | 7/1/22 | | | | 110,000 | | | | 114,400 | (a) |
New Academy Finance Co. LLC/New Academy Finance Corp., Senior Notes | | | 8.000 | % | | | 6/15/18 | | | | 30,000 | | | | 30,712 | (a)(c) |
Spencer Spirit Holdings Inc., Senior Notes | | | 9.000 | % | | | 5/1/18 | | | | 430,000 | | | | 441,653 | (a)(c) |
Spencer Spirit Holdings Inc./Spencer Gifts LLC/Spirit Halloween Superstores, Senior Notes | | | 11.000 | % | | | 5/1/17 | | | | 280,000 | | | | 297,850 | (a) |
Total Specialty Retail | | | | | | | | | | | | | | | 2,287,440 | |
Textiles, Apparel & Luxury Goods — 0.4% | | | | | | | | | | | | | | | | |
Empire Today LLC/Empire Today Finance Corp., Senior Secured Notes | | | 11.375 | % | | | 2/1/17 | | | | 210,000 | | | | 218,400 | (a) |
William Carter Co., Senior Notes | | | 5.250 | % | | | 8/15/21 | | | | 160,000 | | | | 167,600 | (a) |
Total Textiles, Apparel & Luxury Goods | | | | | | | | | | | | | | | 386,000 | |
Total Consumer Discretionary | | | | | | | | | | | | | | | 17,121,630 | |
| Consumer Staples — 3.5% | | | | | | | | | | | | | | | | |
Beverages — 0.6% | | | | | | | | | | | | | | | | |
Carolina Beverage Group LLC/Carolina Beverage Group Finance Inc., Secured Notes | | | 10.625 | % | | | 8/1/18 | | | | 160,000 | | | | 173,200 | (a) |
Constellation Brands Inc., Senior Notes | | | 4.250 | % | | | 5/1/23 | | | | 160,000 | | | | 161,000 | |
Crestview DS Merger Subordinated II Inc., Senior Secured Notes | | | 10.000 | % | | | 9/1/21 | | | | 250,000 | | | | 280,625 | (a) |
Total Beverages | | | | | | | | | | | | | | | 614,825 | |
Food & Staples Retailing — 0.3% | | | | | | | | | | | | | | | | |
Beverages & More Inc., Senior Secured Notes | | | 10.000 | % | | | 11/15/18 | | | | 330,000 | | | | 324,638 | (a) |
Food Products — 2.0% | | | | | | | | | | | | | | | | |
Dole Food Co. Inc., Senior Secured Notes | | | 7.250 | % | | | 5/1/19 | | | | 270,000 | | | | 273,712 | (a) |
H.J. Heinz Co., Secured Notes | | | 4.250 | % | | | 10/15/20 | | | | 220,000 | | | | 221,650 | |
Hearthside Group Holdings LLC/Hearthside Finance Co., Senior Notes | | | 6.500 | % | | | 5/1/22 | | | | 280,000 | | | | 280,700 | (a) |
Land O’Lakes Capital Trust I, Junior Subordinated Bonds | | | 7.450 | % | | | 3/15/28 | | | | 220,000 | | | | 222,750 | (a) |
Simmons Foods Inc., Senior Secured Notes | | | 10.500 | % | | | 11/1/17 | | | | 520,000 | | | | 559,650 | (a) |
Sun Merger Sub Inc., Senior Notes | | | 5.875 | % | | | 8/1/21 | | | | 320,000 | | | | 339,200 | (a) |
Wells Enterprises Inc., Senior Secured Notes | | | 6.750 | % | | | 2/1/20 | | | | 172,000 | | | | 181,245 | (a) |
Total Food Products | | | | | | | | | | | | | | | 2,078,907 | |
See Notes to Financial Statements.
| | |
| Western Asset Variable High Income Portfolio 2014 Semi-Annual Report | | 7 |
Schedule of investments (unaudited) (cont’d)
June 30, 2014
Western Asset Variable High Income Portfolio
| | | | | | | | | | | | | | | | |
| Security | | | Rate | | |
| Maturity
Date |
| |
| Face
Amount† |
| | | Value | |
Household Products — 0.2% | | | | | | | | | | | | | | | | |
Spectrum Brands Inc., Senior Notes | | | 6.375 | % | | | 11/15/20 | | | | 80,000 | | | $ | 86,400 | |
Spectrum Brands Inc., Senior Notes | | | 6.625 | % | | | 11/15/22 | | | | 150,000 | | | | 162,938 | |
Total Household Products | | | | | | | | | | | | | | | 249,338 | |
Media — 0.1% | | | | | | | | | | | | | | | | |
SiTV LLC/SiTV Finance Inc., Senior Secured Notes | | | 10.375 | % | | | 7/1/19 | | | | 60,000 | | | | 61,800 | (a) |
Tobacco — 0.3% | | | | | | | | | | | | | | | | |
Alliance One International Inc., Secured Notes | | | 9.875 | % | | | 7/15/21 | | | | 280,000 | | | | 287,000 | |
Total Consumer Staples | | | | | | | | | | | | | | | 3,616,508 | |
| Energy — 17.9% | | | | | | | | | | | | | | | | |
Energy Equipment & Services — 2.8% | | | | | | | | | | | | | | | | |
Atwood Oceanics Inc., Senior Notes | | | 6.500 | % | | | 2/1/20 | | | | 290,000 | | | | 310,662 | |
CGG, Senior Notes | | | 6.500 | % | | | 6/1/21 | | | | 280,000 | | | | 279,300 | |
Exterran Partners LP/EXLP Finance Corp., Senior Notes | | | 6.000 | % | | | 10/1/22 | | | | 90,000 | | | | 91,800 | (a) |
FTS International Inc., Senior Secured Notes | | | 6.250 | % | | | 5/1/22 | | | | 270,000 | | | | 277,425 | (a) |
Hercules Offshore Inc., Senior Notes | | | 10.250 | % | | | 4/1/19 | | | | 100,000 | | | | 110,250 | (a) |
Hercules Offshore Inc., Senior Notes | | | 7.500 | % | | | 10/1/21 | | | | 700,000 | | | | 698,250 | (a) |
Hercules Offshore Inc., Senior Notes | | | 6.750 | % | | | 4/1/22 | | | | 30,000 | | | | 28,613 | (a) |
KCA Deutag UK Finance PLC, Senior Secured Notes | | | 7.250 | % | | | 5/15/21 | | | | 210,000 | | | | 218,400 | (a) |
Key Energy Services Inc., Senior Notes | | | 6.750 | % | | | 3/1/21 | | | | 220,000 | | | | 229,900 | |
Pacific Drilling SA, Senior Secured Notes | | | 5.375 | % | | | 6/1/20 | | | | 260,000 | | | | 256,100 | (a) |
Parker Drilling Co., Senior Notes | | | 6.750 | % | | | 7/15/22 | | | | 230,000 | | | | 240,350 | (a) |
Petroleum Geo-Services ASA, Senior Notes | | | 7.375 | % | | | 12/15/18 | | | | 200,000 | | | | 214,500 | (a) |
Total Energy Equipment & Services | | | | | | | | | | | | | | | 2,955,550 | |
Oil, Gas & Consumable Fuels — 15.1% | | | | | | | | | | | | | | | | |
Access Midstream Partners LP/ACMP Finance Corp., Senior Notes | | | 5.875 | % | | | 4/15/21 | | | | 420,000 | | | | 451,500 | |
Access Midstream Partners LP/ACMP Finance Corp., Senior Notes | | | 6.125 | % | | | 7/15/22 | | | | 180,000 | | | | 199,800 | |
Antero Resources Finance Corp., Senior Notes | | | 5.375 | % | | | 11/1/21 | | | | 100,000 | | | | 104,125 | |
Arch Coal Inc., Senior Notes | | | 7.000 | % | | | 6/15/19 | | | | 340,000 | | | | 259,250 | |
Arch Coal Inc., Senior Notes | | | 9.875 | % | | | 6/15/19 | | | | 270,000 | | | | 231,525 | |
Atlas Pipeline Partners LP/Atlas Pipeline Finance Corp., Senior Notes | | | 4.750 | % | | | 11/15/21 | | | | 150,000 | | | | 147,750 | |
Atlas Pipeline Partners LP/Atlas Pipeline Finance Corp., Senior Notes | | | 5.875 | % | | | 8/1/23 | | | | 250,000 | | | | 255,625 | |
Berry Petroleum Co., Senior Notes | | | 6.375 | % | | | 9/15/22 | | | | 190,000 | | | | 203,300 | |
Calumet Specialty Products Partners LP/Calumet Finance Corp., Senior Notes | | | 6.500 | % | | | 4/15/21 | | | | 190,000 | | | | 194,750 | (a) |
See Notes to Financial Statements.
| | |
| 8 | | Western Asset Variable High Income Portfolio 2014 Semi-Annual Report |
Western Asset Variable High Income Portfolio
| | | | | | | | | | | | | | | | |
| Security | | | Rate | | |
| Maturity
Date |
| |
| Face
Amount† |
| | | Value | |
Oil, Gas & Consumable Fuels — continued | | | | | | | | | | | | | | | | |
Calumet Specialty Products Partners LP/Calumet Finance Corp., Senior Notes | | | 7.625 | % | | | 1/15/22 | | | | 150,000 | | | $ | 162,000 | |
Carrizo Oil & Gas Inc., Senior Notes | | | 7.500 | % | | | 9/15/20 | | | | 90,000 | | | | 99,225 | |
Chesapeake Energy Corp., Senior Notes | | | 6.875 | % | | | 11/15/20 | | | | 80,000 | | | | 93,200 | |
Chesapeake Energy Corp., Senior Notes | | | 6.125 | % | | | 2/15/21 | | | | 280,000 | | | | 315,000 | |
Cloud Peak Energy Resources LLC/Cloud Peak Energy Finance Corp., Senior Notes | | | 6.375 | % | | | 3/15/24 | | | | 150,000 | | | | 157,500 | |
Comstock Resources Inc., Senior Notes | | | 9.500 | % | | | 6/15/20 | | | | 280,000 | | | | 320,600 | |
Corral Petroleum Holdings AB, Senior Notes | | | 15.000 | % | | | 12/31/17 | | | | 629,313 | | | | 610,434 | (a)(c) |
Crestwood Midstream Partners LP, Senior Notes | | | 6.125 | % | | | 3/1/22 | | | | 240,000 | | | | 253,800 | (a) |
CVR Refining LLC/Coffeyville Finance Inc., Secured Notes | | | 6.500 | % | | | 11/1/22 | | | | 240,000 | | | | 254,400 | |
Ecopetrol SA, Senior Notes | | | 5.875 | % | | | 9/18/23 | | | | 130,000 | | | | 146,250 | |
El Paso Corp., Medium-Term Notes | | | 7.750 | % | | | 1/15/32 | | | | 150,000 | | | | 165,000 | |
El Paso LLC, Senior Secured Notes | | | 6.500 | % | | | 9/15/20 | | | | 90,000 | | | | 100,125 | |
EXCO Resources Inc., Senior Notes | | | 8.500 | % | | | 4/15/22 | | | | 190,000 | | | | 205,675 | |
Globe Luxembourg SCA, Senior Secured Notes | | | 9.625 | % | | | 5/1/18 | | | | 390,000 | | | | 434,889 | (a) |
Halcon Resources Corp., Senior Notes | | | 9.750 | % | | | 7/15/20 | | | | 90,000 | | | | 98,663 | |
Halcon Resources Corp., Senior Notes | | | 8.875 | % | | | 5/15/21 | | | | 580,000 | | | | 626,400 | |
Hiland Partners LP/Hiland Partners Finance Corp., Senior Notes | | | 7.250 | % | | | 10/1/20 | | | | 350,000 | | | | 383,250 | (a) |
Hiland Partners LP/Hiland Partners Finance Corp., Senior Notes | | | 5.500 | % | | | 5/15/22 | | | | 180,000 | | | | 182,700 | (a) |
Kinder Morgan Inc., Senior Secured Notes | | | 5.625 | % | | | 11/15/23 | | | | 120,000 | | | | 123,900 | (a) |
Kodiak Oil & Gas Corp., Senior Notes | | | 8.125 | % | | | 12/1/19 | | | | 240,000 | | | | 267,000 | |
Lonestar Resources America Inc., Senior Notes | | | 8.750 | % | | | 4/15/19 | | | | 90,000 | | | | 91,350 | (a) |
Magnum Hunter Resources Corp., Senior Notes | | | 9.750 | % | | | 5/15/20 | | | | 470,000 | | | | 521,700 | |
MarkWest Energy Partners LP/MarkWest Energy Finance Corp., Senior Notes | | | 6.500 | % | | | 8/15/21 | | | | 254,000 | | | | 275,590 | |
MEG Energy Corp., Senior Notes | | | 6.500 | % | | | 3/15/21 | | | | 200,000 | | | | 213,000 | (a) |
MEG Energy Corp., Senior Notes | | | 6.375 | % | | | 1/30/23 | | | | 90,000 | | | | 96,075 | (a) |
MEG Energy Corp., Senior Notes | | | 7.000 | % | | | 3/31/24 | | | | 180,000 | | | | 198,900 | (a) |
Milagro Oil & Gas Inc., Secured Notes | | | 10.500 | % | | | 5/15/16 | | | | 450,000 | | | | 357,750 | (e) |
Murphy Oil USA Inc., Senior Notes | | | 6.000 | % | | | 8/15/23 | | | | 220,000 | | | | 233,200 | |
Natural Resource Partners LP/Natural Resource Partners Finance Corp., Senior Notes | | | 9.125 | % | | | 10/1/18 | | | | 190,000 | | | | 200,450 | |
New Gulf Resources LLC/NGR Finance Corp., Senior Secured Notes | | | 11.750 | % | | | 5/15/19 | | | | 280,000 | | | | 282,800 | |
NGL Energy Partners LP/NGL Energy Finance Corp., Senior Notes | | | 5.125 | % | | | 7/15/19 | | | | 380,000 | | | | 382,850 | (a) |
Parsley Energy LLC/Parsley Finance Corp., Senior Notes | | | 7.500 | % | | | 2/15/22 | | | | 310,000 | | | | 332,475 | (a) |
Peabody Energy Corp., Senior Notes | | | 7.875 | % | | | 11/1/26 | | | | 240,000 | | | | 252,600 | |
See Notes to Financial Statements.
| | |
| Western Asset Variable High Income Portfolio 2014 Semi-Annual Report | | 9 |
Schedule of investments (unaudited) (cont’d)
June 30, 2014
Western Asset Variable High Income Portfolio
| | | | | | | | | | | | | | | | |
| Security | | | Rate | | |
| Maturity
Date |
| |
| Face
Amount† |
| | | Value | |
Oil, Gas & Consumable Fuels — continued | | | | | | | | | | | | | | | | |
Petrobras Global Finance BV, Senior Notes | | | 4.375 | % | | | 5/20/23 | | | | 350,000 | | | $ | 337,942 | |
PT Adaro Indonesia, Senior Notes | | | 7.625 | % | | | 10/22/19 | | | | 140,000 | | | | 147,525 | (a) |
Puma International Financing SA, Senior Bonds | | | 6.750 | % | | | 2/1/21 | | | | 520,000 | | | | 538,252 | (a) |
PVR Partners LP/Penn Virginia Resource Finance Corp. II, Senior Notes | | | 6.500 | % | | | 5/15/21 | | | | 90,000 | | | | 98,550 | |
QEP Resources Inc., Senior Notes | | | 6.875 | % | | | 3/1/21 | | | | 40,000 | | | | 45,100 | |
QEP Resources Inc., Senior Notes | | | 5.375 | % | | | 10/1/22 | | | | 260,000 | | | | 269,100 | |
QEP Resources Inc., Senior Notes | | | 5.250 | % | | | 5/1/23 | | | | 150,000 | | | | 154,125 | |
Quicksilver Resources Inc., Senior Notes | | | 11.000 | % | | | 7/1/21 | | | | 260,000 | | | | 264,550 | |
Regency Energy Partners LP/Regency Energy Finance Corp., Senior Notes | | | 4.500 | % | | | 11/1/23 | | | | 220,000 | | | | 218,900 | |
Rice Energy Inc., Senior Notes | | | 6.250 | % | | | 5/1/22 | | | | 250,000 | | | | 256,562 | (a) |
Rose Rock Midstream LP/Rose Rock Finance Corp., Senior Notes | | | 5.625 | % | | | 7/15/22 | | | | 190,000 | | | | 192,850 | (a) |
Samson Investment Co., Senior Notes | | | 10.750 | % | | | 2/15/20 | | | | 540,000 | | | | 571,725 | (a) |
Sanchez Energy Corp., Senior Notes | | | 7.750 | % | | | 6/15/21 | | | | 350,000 | | | | 381,500 | (a) |
Sanchez Energy Corp., Senior Notes | | | 6.125 | % | | | 1/15/23 | | | | 260,000 | | | | 269,100 | (a) |
Shelf Drilling Holdings Ltd., Senior Secured Notes | | | 8.625 | % | | | 11/1/18 | | | | 220,000 | | | | 236,500 | (a) |
Sidewinder Drilling Inc., Senior Notes | | | 9.750 | % | | | 11/15/19 | | | | 210,000 | | | | 214,200 | (a) |
Summit Midstream Holdings LLC/Summit Midstream Finance Corp., Senior Notes | | | 7.500 | % | | | 7/1/21 | | | | 150,000 | | | | 164,250 | |
Targa Resources Partners LP/Targa Resources Partners Finance Corp., Senior Notes | | | 6.375 | % | | | 8/1/22 | | | | 233,000 | | | | 254,552 | |
Ultra Petroleum Corp., Senior Notes | | | 5.750 | % | | | 12/15/18 | | | | 300,000 | | | | 315,750 | (a) |
Westmoreland Coal Co./Westmoreland Partners, Senior Secured Notes | | | 10.750 | % | | | 2/1/18 | | | | 170,000 | | | | 182,963 | (a) |
Total Oil, Gas & Consumable Fuels | | | | | | | | | | | | | | | 15,600,372 | |
Total Energy | | | | | | | | | | | | | | | 18,555,922 | |
| Financials — 8.6% | | | | | | | | | | | | | | | | |
Banks — 4.8% | | | | | | | | | | | | | | | | |
Bank of America Corp., Junior Subordinated Notes | | | 5.200 | % | | | 6/1/23 | | | | 260,000 | | | | 250,250 | (f)(g) |
Barclays Bank PLC, Subordinated Notes | | | 10.179 | % | | | 6/12/21 | | | | 450,000 | | | | 624,908 | (a) |
Barclays Bank PLC, Subordinated Notes | | | 7.625 | % | | | 11/21/22 | | | | 200,000 | | | | 228,800 | |
CIT Group Inc., Senior Notes | | | 5.500 | % | | | 2/15/19 | | | | 270,000 | | | | 293,456 | (a) |
CIT Group Inc., Senior Notes | | | 5.375 | % | | | 5/15/20 | | | | 290,000 | | | | 312,384 | |
CIT Group Inc., Senior Notes | | | 5.000 | % | | | 8/1/23 | | | | 340,000 | | | | 348,925 | |
Citigroup Inc., Junior Subordinated Bonds | | | 6.300 | % | | | 5/15/24 | | | | 150,000 | | | | 153,467 | (f)(g) |
Cooperatieve Centrale Raiffeisen-Boerenleenbank BA, Junior Subordinated Notes | | | 11.000 | % | | | 6/30/19 | | | | 155,000 | | | | 208,505 | (a)(f)(g) |
See Notes to Financial Statements.
| | |
| 10 | | Western Asset Variable High Income Portfolio 2014 Semi-Annual Report |
Western Asset Variable High Income Portfolio
| | | | | | | | | | | | | | | | |
| Security | | | Rate | | |
| Maturity
Date |
| |
| Face
Amount† |
| | | Value | |
Banks — continued | | | | | | | | | | | | | | | | |
Credit Agricole SA, Subordinated Notes | | | 8.375 | % | | | 10/13/19 | | | | 300,000 | | | $ | 355,875 | (a)(f)(g) |
JPMorgan Chase & Co., Junior Subordinated Bonds | | | 5.150 | % | | | 5/1/23 | | | | 130,000 | | | | 125,288 | (f)(g) |
M&T Bank Corp., Junior Subordinated Bonds | | | 6.875 | % | | | 6/15/16 | | | | 300,000 | | | | 305,006 | (g) |
Royal Bank of Scotland Group PLC, Junior Subordinated Bonds | | | 7.648 | % | | | 9/30/31 | | | | 450,000 | | | | 546,750 | (f)(g) |
Royal Bank of Scotland Group PLC, Subordinated Notes | | | 6.000 | % | | | 12/19/23 | | | | 100,000 | | | | 108,514 | |
Royal Bank of Scotland NV, Subordinated Notes | | | 7.750 | % | | | 5/15/23 | | | | 100,000 | | | | 114,923 | |
Royal Bank of Scotland PLC, Subordinated Notes | | | 13.125 | % | | | 3/19/22 | | | | 500,000 | AUD | | | 567,448 | (a)(f) |
Wells Fargo & Co., Junior Subordinated Bonds | | | 5.900 | % | | | 6/15/24 | | | | 350,000 | | | | 372,313 | (f)(g) |
Total Banks | | | | | | | | | | | | | | | 4,916,812 | |
Consumer Finance — 1.2% | | | | | | | | | | | | | | | | |
First Cash Financial Services Inc., Senior Notes | | | 6.750 | % | | | 4/1/21 | | | | 110,000 | | | | 117,425 | (a) |
GMAC International Finance BV, Senior Bonds | | | 7.500 | % | | | 4/21/15 | | | | 270,000 | EUR | | | 388,470 | (k) |
SLM Corp., Medium-Term Notes, Senior Notes | | | 8.450 | % | | | 6/15/18 | | | | 10,000 | | | | 11,844 | |
SLM Corp., Medium-Term Notes, Senior Notes | | | 8.000 | % | | | 3/25/20 | | | | 140,000 | | | | 162,225 | |
SLM Corp., Senior Notes | | | 6.125 | % | | | 3/25/24 | | | | 250,000 | | | | 254,062 | |
Stearns Holdings Inc., Senior Secured Notes | | | 9.375 | % | | | 8/15/20 | | | | 130,000 | | | | 136,825 | (a) |
TMX Finance LLC/TitleMax Finance Corp., Senior Secured Notes | | | 8.500 | % | | | 9/15/18 | | | | 180,000 | | | | 191,700 | (a) |
Total Consumer Finance | | | | | | | | | | | | | | | 1,262,551 | |
Diversified Financial Services — 1.5% | | | | | | | | | | | | | | | | |
AerCap Ireland Capital Ltd./AerCap Global Aviation Trust, Senior Notes | | | 4.500 | % | | | 5/15/21 | | | | 250,000 | | | | 254,688 | (a) |
Carlson Travel Holdings Inc., Senior Notes | | | 7.500 | % | | | 8/15/19 | | | | 200,000 | | | | 204,500 | (a) |
Hexion U.S. Finance Corp./Hexion Nova Scotia Finance ULC, Senior Secured Notes | | | 8.875 | % | | | 2/1/18 | | | | 210,000 | | | | 218,925 | |
International Lease Finance Corp., Senior Notes | | | 8.250 | % | | | 12/15/20 | | | | 280,000 | | | | 346,500 | |
ZFS Finance USA Trust II, Bonds | | | 6.450 | % | | | 12/15/65 | | | | 500,000 | | | | 541,250 | (a)(f) |
Total Diversified Financial Services | | | | | | | | | | | | | | | 1,565,863 | |
Insurance — 0.4% | | | | | | | | | | | | | | | | |
Fidelity & Guaranty Life Holdings Inc., Senior Notes | | | 6.375 | % | | | 4/1/21 | | | | 150,000 | | | | 161,625 | (a) |
Liberty Mutual Group Inc., Junior Subordinated Bonds | | | 7.800 | % | | | 3/15/37 | | | | 210,000 | | | | 248,850 | (a) |
Total Insurance | | | | | | | | | | | | | | | 410,475 | |
Real Estate Investment Trusts (REITs) — 0.2% | | | | | | | | | | | | | | | | |
CTR Partnership LP/CareTrust Capital Corp., Senior Notes | | | 5.875 | % | | | 6/1/21 | | | | 210,000 | | | | 212,625 | (a) |
Real Estate Management & Development — 0.5% | | | | | | | | | | | | | | | | |
Howard Hughes Corp., Senior Notes | | | 6.875 | % | | | 10/1/21 | | | | 440,000 | | | | 473,000 | (a) |
Total Financials | | | | | | | | | | | | | | | 8,841,326 | |
See Notes to Financial Statements.
| | |
| Western Asset Variable High Income Portfolio 2014 Semi-Annual Report | | 11 |
Schedule of investments (unaudited) (cont’d)
June 30, 2014
Western Asset Variable High Income Portfolio
| | | | | | | | | | | | | | | | |
| Security | | | Rate | | |
| Maturity
Date |
| |
| Face
Amount† |
| | | Value | |
| Health Care — 4.0% | | | | | | | | | | | | | | | | |
Biotechnology — 0.2% | | | | | | | | | | | | | | | | |
Grifols Worldwide Operations Ltd., Senior Notes | | | 5.250 | % | | | 4/1/22 | | | | 200,000 | | | $ | 208,000 | (a) |
Health Care Equipment & Supplies — 0.9% | | | | | | | | | | | | | | | | |
Alere Inc., Senior Subordinated Notes | | | 6.500 | % | | | 6/15/20 | | | | 280,000 | | | | 295,400 | |
Lantheus Medical Imaging Inc., Senior Notes | | | 9.750 | % | | | 5/15/17 | | | | 480,000 | | | | 500,400 | |
Teleflex Inc., Senior Notes | | | 5.250 | % | | | 6/15/24 | | | | 170,000 | | | | 172,125 | (a) |
Total Health Care Equipment & Supplies | | | | | | | | | | | | | | | 967,925 | |
Health Care Providers & Services — 2.4% | | | | | | | | | | | | | | | | |
Acadia Healthcare Co. Inc., Senior Notes | | | 12.875 | % | | | 11/1/18 | | | | 208,000 | | | | 249,600 | |
Acadia Healthcare Co. Inc., Senior Notes | | | 6.125 | % | | | 3/15/21 | | | | 110,000 | | | | 116,050 | |
Acadia Healthcare Co. Inc., Senior Notes | | | 5.125 | % | | | 7/1/22 | | | | 190,000 | | | | 191,425 | (a) |
Catamaran Corp., Senior Bonds | | | 4.750 | % | | | 3/15/21 | | | | 240,000 | | | | 243,000 | |
DJO Finance LLC/DJO Finance Corp., Senior Notes | | | 9.875 | % | | | 4/15/18 | | | | 240,000 | | | | 260,400 | |
DJO Finance LLC/DJO Finance Corp., Senior Subordinated Notes | | | 9.750 | % | | | 10/15/17 | | | | 80,000 | | | | 84,200 | |
ExamWorks Group Inc., Senior Notes | | | 9.000 | % | | | 7/15/19 | | | | 400,000 | | | | 442,000 | |
Fresenius Medical Care U.S. Finance II Inc., Senior Notes | | | 5.875 | % | | | 1/31/22 | | | | 240,000 | | | | 266,400 | (a) |
HCA Inc., Senior Notes | | | 7.500 | % | | | 2/15/22 | | | | 90,000 | | | | 104,063 | |
IASIS Healthcare LLC/IASIS Capital Corp., Senior Notes | | | 8.375 | % | | | 5/15/19 | | | | 530,000 | | | | 566,437 | |
Total Health Care Providers & Services | | | | | | | | | | | | | | | 2,523,575 | |
Pharmaceuticals — 0.5% | | | | | | | | | | | | | | | | |
JLL/Delta Dutch Newco BV, Senior Notes | | | 7.500 | % | | | 2/1/22 | | | | 290,000 | | | | 301,237 | (a) |
Salix Pharmaceuticals Ltd., Senior Notes | | | 6.000 | % | | | 1/15/21 | | | | 160,000 | | | | 172,000 | (a) |
Total Pharmaceuticals | | | | | | | | | | | | | | | 473,237 | |
Total Health Care | | | | | | | | | | | | | | | 4,172,737 | |
| Industrials — 16.7% | | | | | | | | | | | | | | | | |
Aerospace & Defense — 2.3% | | | | | | | | | | | | | | | | |
Alliant Techsystems Inc., Senior Notes | | | 5.250 | % | | | 10/1/21 | | | | 250,000 | | | | 259,375 | (a) |
CBC Ammo LLC/CBC FinCo Inc., Senior Notes | | | 7.250 | % | | | 11/15/21 | | | | 460,000 | | | | 477,250 | (a) |
Ducommun Inc., Senior Notes | | | 9.750 | % | | | 7/15/18 | | | | 380,000 | | | | 424,768 | |
Erickson Inc., Secured Notes | | | 8.250 | % | | | 5/1/20 | | | | 444,000 | | | | 458,430 | |
GenCorp Inc., Secured Notes | | | 7.125 | % | | | 3/15/21 | | | | 170,000 | | | | 186,575 | |
LMI Aerospace Inc., Secured Notes | | | 7.375 | % | | | 7/15/19 | | | | 130,000 | | | | 133,575 | (a) |
TransDigm Inc., Senior Subordinated Notes | | | 6.000 | % | | | 7/15/22 | | | | 330,000 | | | | 339,487 | (a) |
Triumph Group Inc., Senior Notes | | | 5.250 | % | | | 6/1/22 | | | | 130,000 | | | | 130,813 | (a) |
Total Aerospace & Defense | | | | | | | | | | | | | | | 2,410,273 | |
See Notes to Financial Statements.
| | |
| 12 | | Western Asset Variable High Income Portfolio 2014 Semi-Annual Report |
Western Asset Variable High Income Portfolio
| | | | | | | | | | | | | | | | |
| Security | | | Rate | | |
| Maturity
Date |
| |
| Face
Amount† |
| | | Value | |
Airlines — 2.7% | | | | | | | | | | | | | | | | |
Air Canada, Pass-Through Trust, Secured Notes | | | 6.625 | % | | | 5/15/18 | | | | 120,000 | | | $ | 124,824 | (a) |
America West Airlines, Pass-Through Certificates, Secured Notes | | | 7.100 | % | | | 4/2/21 | | | | 104,323 | | | | 115,798 | |
American Airlines, Pass-Through Trust, Secured Notes | | | 7.000 | % | | | 1/31/18 | | | | 202,568 | | | | 220,799 | (a) |
American Airlines, Pass-Through Trust, Secured Notes | | | 6.125 | % | | | 7/15/18 | | | | 220,000 | | | | 234,300 | (a) |
American Airlines, Pass-Through Trust, Secured Notes | | | 5.625 | % | | | 1/15/21 | | | | 194,142 | | | | 200,937 | (a) |
American Airlines, Pass-Through Trust, Senior Secured Notes | | | 5.600 | % | | | 7/15/20 | | | | 282,589 | | | | 296,718 | (a) |
Delta Air Lines Inc., Pass-Through Certificates | | | 8.954 | % | | | 8/10/14 | | | | 56,013 | | | | 56,433 | |
Delta Air Lines Inc., Pass-Through Certificates, Subordinated Secured Notes | | | 9.750 | % | | | 12/17/16 | | | | 105,118 | | | | 122,463 | |
Delta Air Lines Inc., Pass-Through Trust, Secured Notes | | | 6.875 | % | | | 5/7/19 | | | | 188,376 | | | | 210,039 | (a) |
Delta Air Lines Inc., Secured Notes | | | 6.375 | % | | | 1/2/16 | | | | 190,000 | | | | 203,300 | (a) |
Hawaiian Airlines, Pass-Through Certificates, Senior Secured Bonds | | | 4.950 | % | | | 1/15/22 | | | | 270,000 | | | | 269,676 | |
United Airlines Inc., Pass Through Trust, Secured Notes | | | 4.750 | % | | | 4/11/22 | | | | 350,000 | | | | 357,875 | |
United Airlines Inc., Pass-Through Certificates, Secured Bond | | | 5.375 | % | | | 8/15/21 | | | | 160,000 | | | | 166,400 | |
US Airways, Pass-Through Trust, Secured Bonds | | | 6.750 | % | | | 6/3/21 | | | | 105,534 | | | | 115,296 | |
US Airways, Pass-Through Trust, Senior Secured Bonds | | | 5.375 | % | | | 11/15/21 | | | | 120,000 | | | | 124,200 | |
Total Airlines | | | | | | | | | | | | | | | 2,819,058 | |
Building Products — 0.7% | | | | | | | | | | | | | | | | |
Ashton Woods USA LLC/Ashton Woods Finance Co., Senior Notes | | | 6.875 | % | | | 2/15/21 | | | | 230,000 | | | | 230,575 | (a) |
Griffon Corp., Senior Notes | | | 5.250 | % | | | 3/1/22 | | | | 400,000 | | | | 399,000 | |
Reliance Intermediate Holdings LP, Senior Secured Notes | | | 9.500 | % | | | 12/15/19 | | | | 100,000 | | | | 108,500 | (a) |
Total Building Products | | | | | | | | | | | | | | | 738,075 | |
Commercial Services & Supplies — 2.2% | | | | | | | | | | | | | | | | |
Garda World Security Corp., Senior Notes | | | 7.250 | % | | | 11/15/21 | | | | 80,000 | | | | 84,500 | (a) |
JM Huber Corp., Senior Notes | | | 9.875 | % | | | 11/1/19 | | | | 230,000 | | | | 263,062 | (a) |
Monitronics International Inc., Senior Notes | | | 9.125 | % | | | 4/1/20 | | | | 340,000 | | | | 364,650 | |
RSC Equipment Rental Inc./RSC Holdings III LLC, Senior Notes | | | 8.250 | % | | | 2/1/21 | | | | 120,000 | | | | 134,100 | |
Taylor Morrison Communities Inc./Monarch Communities Inc., Senior Notes | | | 7.750 | % | | | 4/15/20 | | | | 346,000 | | | | 379,735 | (a) |
Taylor Morrison Communities Inc./Monarch Communities Inc., Senior Notes | | | 7.750 | % | | | 4/15/20 | | | | 65,000 | | | | 71,338 | (a) |
United Rentals North America Inc., Senior Notes | | | 5.750 | % | | | 11/15/24 | | | | 400,000 | | | | 416,500 | |
West Corp., Senior Notes | | | 5.375 | % | | | 7/15/22 | | | | 550,000 | | | | 545,875 | (a) |
Total Commercial Services & Supplies | | | | | | | | | | | | | | | 2,259,760 | |
See Notes to Financial Statements.
| | |
| Western Asset Variable High Income Portfolio 2014 Semi-Annual Report | | 13 |
Schedule of investments (unaudited) (cont’d)
June 30, 2014
Western Asset Variable High Income Portfolio
| | | | | | | | | | | | | | | | |
| Security | | | Rate | | |
| Maturity
Date |
| |
| Face
Amount† |
| | | Value | |
Construction & Engineering — 1.4% | | | | | | | | | | | | | | | | |
Ausdrill Finance Pty Ltd., Senior Notes | | | 6.875 | % | | | 11/1/19 | | | | 350,000 | | | $ | 328,125 | (a) |
Michael Baker Holdings LLC/Micahel Baker Finance Corp., Senior Notes | | | 8.875 | % | | | 4/15/19 | | | | 420,000 | | | | 422,100 | (a)(c) |
Michael Baker International LLC/CDL Acquisition Co. Inc., Senior Secured Notes | | | 8.250 | % | | | 10/15/18 | | | | 370,000 | | | | 395,900 | (a) |
Modular Space Corp., Secured Notes | | | 10.250 | % | | | 1/31/19 | | | | 290,000 | | | | 305,950 | (a) |
Total Construction & Engineering | | | | | | | | | | | | | | | 1,452,075 | |
Electrical Equipment — 0.7% | | | | | | | | | | | | | | | | |
International Wire Group Holdings Inc., Senior Secured Notes | | | 8.500 | % | | | 10/15/17 | | | | 240,000 | | | | 261,600 | (a) |
NES Rentals Holdings Inc., Senior Secured Notes | | | 7.875 | % | | | 5/1/18 | | | | 210,000 | | | | 224,700 | (a) |
Wesco Distribution Inc., Senior Notes | | | 5.375 | % | | | 12/15/21 | | | | 190,000 | | | | 194,750 | (a) |
Total Electrical Equipment | | | | | | | | | | | | | | | 681,050 | |
Machinery — 1.3% | | | | | | | | | | | | | | | | |
CTP Transportation Products LLC/CTP Finance Inc., Senior Secured Notes | | | 8.250 | % | | | 12/15/19 | | | | 170,000 | | | | 183,600 | (a) |
Dematic SA/DH Services Luxembourg Sarl, Senior Notes | | | 7.750 | % | | | 12/15/20 | | | | 540,000 | | | | 581,850 | (a) |
Global Brass and Copper Inc., Senior Secured Notes | | | 9.500 | % | | | 6/1/19 | | | | 300,000 | | | | 343,500 | |
SPL Logistics Escrow LLC/SPL Logistics Finance Corp., Senior Secured Notes | | | 8.875 | % | | | 8/1/20 | | | | 130,000 | | | | 146,250 | (a) |
Vander Intermediate Holding II Corp., Senior Notes | | | 9.750 | % | | | 2/1/19 | | | | 60,000 | | | | 64,050 | (a)(c) |
Total Machinery | | | | | | | | | | | | | | | 1,319,250 | |
Marine — 1.2% | | | | | | | | | | | | | | | | |
Horizon Lines LLC, Secured Notes | | | 13.000 | % | | | 10/15/16 | | | | 331,471 | | | | 309,926 | (c) |
Horizon Lines LLC, Senior Secured Notes | | | 11.000 | % | | | 10/15/16 | | | | 285,000 | | | | 286,781 | |
Navios Maritime Acquisition Corp./Navios Acquisition Finance U.S. Inc., Senior Secured Notes | | | 8.125 | % | | | 11/15/21 | | | | 300,000 | | | | 315,000 | (a) |
Ultrapetrol Bahamas Ltd., Senior Secured Notes | | | 8.875 | % | | | 6/15/21 | | | | 250,000 | | | | 271,875 | |
Total Marine | | | | | | | | | | | | | | | 1,183,582 | |
Professional Services — 0.2% | | | | | | | | | | | | | | | | |
Ceridian LLC/Comdata Inc., Senior Notes | | | 8.125 | % | | | 11/15/17 | | | | 220,000 | | | | 222,750 | (a) |
Road & Rail — 1.5% | | | | | | | | | | | | | | | | |
Flexi-Van Leasing Inc., Senior Notes | | | 7.875 | % | | | 8/15/18 | | | | 270,000 | | | | 292,950 | (a) |
Florida East Coast Holdings Corp., Senior Notes | | | 9.750 | % | | | 5/1/20 | | | | 100,000 | | | | 106,125 | (a) |
Florida East Coast Holdings Corp., Senior Secured Notes | | | 6.750 | % | | | 5/1/19 | | | | 190,000 | | | | 201,163 | (a) |
Jack Cooper Holdings Corp., Senior Secured Notes | | | 9.250 | % | | | 6/1/20 | | | | 450,000 | | | | 496,687 | (a) |
Jurassic Holdings III Inc., Secured Notes | | | 6.875 | % | | | 2/15/21 | | | | 170,000 | | | | 173,825 | (a) |
Quality Distribution LLC/QD Capital Corp., Secured Notes | | | 9.875 | % | | | 11/1/18 | | | | 248,000 | | | | 266,600 | |
Total Road & Rail | | | | | | | | | | | | | | | 1,537,350 | |
See Notes to Financial Statements.
| | |
| 14 | | Western Asset Variable High Income Portfolio 2014 Semi-Annual Report |
Western Asset Variable High Income Portfolio
| | | | | | | | | | | | | | | | |
| Security | | | Rate | | |
| Maturity
Date |
| |
| Face
Amount† |
| | | Value | |
Trading Companies & Distributors — 1.0% | | | | | | | | | | | | | | | | |
Ashtead Capital Inc., Senior Secured Notes | | | 6.500 | % | | | 7/15/22 | | | | 290,000 | | | $ | 318,275 | (a) |
Emeco Pty Ltd., Senior Secured Notes | | | 9.875 | % | | | 3/15/19 | | | | 200,000 | | | | 206,250 | (a) |
H&E Equipment Services Inc., Senior Notes | | | 7.000 | % | | | 9/1/22 | | | | 300,000 | | | | 333,000 | |
Rexel SA, Senior Notes | | | 5.250 | % | | | 6/15/20 | | | | 210,000 | | | | 219,450 | (a) |
Total Trading Companies & Distributors | | | | | | | | | | | | | | | 1,076,975 | |
Transportation — 1.3% | | | | | | | | | | | | | | | | |
Hapag-Lloyd AG, Senior Notes | | | 9.750 | % | | | 10/15/17 | | | | 290,000 | | | | 312,475 | (a) |
Neovia Logistics Intermediate Holdings LLC/Logistics Intermediate Finance Corp., Senior Notes | | | 10.000 | % | | | 2/15/18 | | | | 390,000 | | | | 405,600 | (a)(c) |
Syncreon Group BV/Syncreon Global Finance US Inc., Senior Notes | | | 8.625 | % | | | 11/1/21 | | | | 360,000 | | | | 367,200 | (a) |
Watco Cos., LLC/Watco Finance Corp., Senior Notes | | | 6.375 | % | | | 4/1/23 | | | | 280,000 | | | | 287,000 | (a) |
Total Transportation | | | | | | | | | | | | | | | 1,372,275 | |
Transportation Infrastructure — 0.2% | | | | | | | | | | | | | | | | |
Global Ship Lease Inc., Senior Secured Notes | | | 10.000 | % | | | 4/1/19 | | | | 200,000 | | | | 216,000 | (a) |
Total Industrials | | | | | | | | | | | | | | | 17,288,473 | |
| Information Technology — 2.5% | | | | | | | | | | | | | | | | |
Electronic Equipment, Instruments & Components — 0.2% | | | | | | | | | | | | | | | | |
KEMET Corp., Senior Secured Notes | | | 10.500 | % | | | 5/1/18 | | | | 50,000 | | | | 53,125 | |
Sanmina Corp., Senior Secured Notes | | | 4.375 | % | | | 6/1/19 | | | | 190,000 | | | | 190,238 | (a) |
Total Electronic Equipment, Instruments & Components | | | | | | | | | | | | 243,363 | |
Internet Software & Services — 0.3% | | | | | | | | | | | | | | | | |
Ancestry.com Inc., Senior Notes | | | 9.625 | % | | | 10/15/18 | | | | 110,000 | | | | 114,262 | (a)(c) |
Ancestry.com Inc., Senior Notes | | | 11.000 | % | | | 12/15/20 | | | | 150,000 | | | | 176,625 | |
Bankrate Inc., Senior Notes | | | 6.125 | % | | | 8/15/18 | | | | 40,000 | | | | 42,650 | (a) |
Total Internet Software & Services | | | | | | | | | | | | | | | 333,537 | |
IT Services — 1.4% | | | | | | | | | | | | | | | | |
Compiler Finance Subordinated Inc., Senior Notes | | | 7.000 | % | | | 5/1/21 | | | | 250,000 | | | | 255,000 | (a) |
First Data Corp., Secured Notes | | | 8.750 | % | | | 1/15/22 | | | | 180,000 | | | | 199,575 | (a)(c) |
First Data Corp., Senior Notes | | | 12.625 | % | | | 1/15/21 | | | | 450,000 | | | | 555,187 | |
First Data Corp., Senior Subordinated Notes | | | 11.750 | % | | | 8/15/21 | | | | 202,000 | | | | 240,633 | |
Interactive Data Corp., Senior Notes | | | 5.875 | % | | | 4/15/19 | | | | 160,000 | | | | 163,200 | (a) |
Total IT Services | | | | | | | | | | | | | | | 1,413,595 | |
Software — 0.6% | | | | | | | | | | | | | | | | |
Activision Blizzard Inc., Senior Notes | | | 5.625 | % | | | 9/15/21 | | | | 160,000 | | | | 172,800 | (a) |
Audatex North America Inc., Senior Notes | | | 6.000 | % | | | 6/15/21 | | | | 50,000 | | | | 53,625 | (a) |
Audatex North America Inc., Senior Notes | | | 6.125 | % | | | 11/1/23 | | | | 90,000 | | | | 96,525 | (a) |
See Notes to Financial Statements.
| | |
| Western Asset Variable High Income Portfolio 2014 Semi-Annual Report | | 15 |
Schedule of investments (unaudited) (cont’d)
June 30, 2014
Western Asset Variable High Income Portfolio
| | | | | | | | | | | | | | | | |
| Security | | | Rate | | |
| Maturity
Date |
| |
| Face
Amount† |
| | | Value | |
Software — continued | | | | | | | | | | | | | | | | |
Interface Security Systems Holdings Inc./Interface Security Systems LLC, Senior Secured Notes | | | 9.250 | % | | | 1/15/18 | | | | 230,000 | | | $ | 237,475 | (a) |
Total Software | | | | | | | | | | | | | | | 560,425 | |
Total Information Technology | | | | | | | | | | | | | | | 2,550,920 | |
| Materials — 9.4% | | | | | | | | | | | | | | | | |
Chemicals — 1.4% | | | | | | | | | | | | | | | | |
Axiall Corp., Senior Notes | | | 4.875 | % | | | 5/15/23 | | | | 150,000 | | | | 149,812 | |
Eagle Spinco Inc., Senior Subordinated Notes | | | 4.625 | % | | | 2/15/21 | | | | 100,000 | | | | 100,250 | |
Hexion US Finance Corp., Senior Secured Notes | | | 6.625 | % | | | 4/15/20 | | | | 210,000 | | | | 223,650 | |
HIG BBC Intermediate Holdings LLC/HIG BBC Holdings Corp., Senior Notes | | | 10.500 | % | | | 9/15/18 | | | | 150,000 | | | | 154,500 | (a)(c) |
Kerling PLC, Senior Secured Notes | | | 10.625 | % | | | 2/1/17 | | | | 189,000 | EUR | | | 275,079 | (a) |
KP Germany Erste GmbH, Senior Secured Notes | | | 11.625 | % | | | 7/15/17 | | | | 110,000 | EUR | | | 170,204 | (a) |
KP Germany Erste GmbH, Senior Secured Notes | | | 11.625 | % | | | 7/15/17 | | | | 100,000 | EUR | | | 154,731 | (k) |
Momentive Performance Materials Inc., Senior Secured Notes | | | 8.875 | % | | | 10/15/20 | | | | 60,000 | | | | 64,350 | |
Styrolution Group GmbH, Senior Secured Notes | | | 7.625 | % | | | 5/15/16 | | | | 132,000 | EUR | | | 187,417 | (k) |
Total Chemicals | | | | | | | | | | | | | | | 1,479,993 | |
Construction Materials — 0.4% | | | | | | | | | | | | | | | | |
American Builders & Contractors Supply Co. Inc., Senior Notes | | | 5.625 | % | | | 4/15/21 | | | | 380,000 | | | | 394,250 | (a) |
Containers & Packaging — 2.6% | | | | | | | | | | | | | | | | |
Ardagh Finance Holdings SA, Senior Notes | | | 8.625 | % | | | 6/15/19 | | | | 230,000 | | | | 238,050 | (a)(c) |
Ardagh Packaging Finance PLC, Senior Secured Notes | | | 7.375 | % | | | 10/15/17 | | | | 200,000 | EUR | | | 288,923 | (a) |
Ardagh Packaging Finance PLC/Ardagh MP Holdings USA Inc., Senior Notes | | | 9.125 | % | | | 10/15/20 | | | | 460,000 | | | | 509,450 | (a) |
Ardagh Packaging Finance PLC/Ardagh MP Holdings USA Inc., Senior Notes | | | 7.000 | % | | | 11/15/20 | | | | 49,412 | | | | 51,388 | (a) |
Ardagh Packaging Finance PLC/Ardagh MP Holdings USA Inc., Senior Notes | | | 6.000 | % | | | 6/30/21 | | | | 200,000 | | | | 200,750 | (a) |
Ardagh Packaging Finance PLC/Ardagh MP Holdings USA Inc., Senior Secured Notes | | | 3.231 | % | | | 12/15/19 | | | | 310,000 | | | | 310,775 | (a)(f) |
Exopack Holdings SA, Senior Notes | | | 7.875 | % | | | 11/1/19 | | | | 200,000 | | | | 215,000 | (a) |
Pactiv LLC, Senior Bonds | | | 8.375 | % | | | 4/15/27 | | | | 190,000 | | | | 207,100 | |
Pactiv LLC, Senior Notes | | | 7.950 | % | | | 12/15/25 | | | | 10,000 | | | | 10,750 | |
Reynolds Group Issuer Inc./Reynolds Group Issuer LLC/Reynolds Group Issuer (Luxembourg) SA, Senior Notes | | | 9.875 | % | | | 8/15/19 | | | | 400,000 | | | | 445,000 | |
Reynolds Group Issuer Inc./Reynolds Group Issuer LLC/Reynolds Group Issuer (Luxembourg) SA, Senior Secured Notes | | | 5.750 | % | | | 10/15/20 | | | | 170,000 | | | | 180,200 | |
Total Containers & Packaging | | | | | | | | | | | | | | | 2,657,386 | |
See Notes to Financial Statements.
| | |
| 16 | | Western Asset Variable High Income Portfolio 2014 Semi-Annual Report |
Western Asset Variable High Income Portfolio
| | | | | | | | | | | | | | | | |
| Security | | | Rate | | |
| Maturity
Date |
| |
| Face
Amount† |
| | | Value | |
Metals & Mining — 3.5% | | | | | | | | | | | | | | | | |
AuRico Gold Inc., Secured Notes | | | 7.750 | % | | | 4/1/20 | | | | 190,000 | | | $ | 189,050 | (a) |
Barminco Finance Pty Ltd., Senior Notes | | | 9.000 | % | | | 6/1/18 | | | | 250,000 | | | | 246,875 | (a) |
Coeur Mining Inc., Senior Notes | | | 7.875 | % | | | 2/1/21 | | | | 310,000 | | | | 313,100 | |
Essar Steel Minnesota LLC, Senior Secured Notes | | | 11.500 | % | | | 5/15/20 | | | | 260,000 | | | | 263,900 | (a) |
FMG Resources (August 2006) Pty Ltd., Senior Notes | | | 6.875 | % | | | 2/1/18 | | | | 180,000 | | | | 189,450 | (a) |
FMG Resources (August 2006) Pty Ltd., Senior Notes | | | 8.250 | % | | | 11/1/19 | | | | 80,000 | | | | 87,400 | (a) |
FMG Resources (August 2006) Pty Ltd., Senior Notes | | | 6.875 | % | | | 4/1/22 | | | | 380,000 | | | | 408,975 | (a) |
Midwest Vanadium Pty Ltd., Senior Secured Notes | | | 11.500 | % | | | 2/15/18 | | | | 320,000 | | | | 140,800 | (a)(d)(e) |
Mirabela Nickel Ltd., Senior Notes | | | 8.750 | % | | | 4/15/18 | | | | 230,000 | | | | 55,200 | (a)(e) |
Molycorp Inc., Senior Secured Notes | | | 10.000 | % | | | 6/1/20 | | | | 170,000 | | | | 157,250 | |
Prince Mineral Holding Corp., Senior Secured Notes | | | 12.000 | % | | | 12/15/19 | | | | 120,000 | | | | 135,900 | (a) |
Rain CII Carbon LLC/CII Carbon Corp., Senior Secured Notes | | | 8.250 | % | | | 1/15/21 | | | | 250,000 | | | | 263,750 | (a) |
Ryerson Inc./Joseph T. Ryerson & Son Inc., Senior Secured Notes | | | 9.000 | % | | | 10/15/17 | | | | 260,000 | | | | 278,850 | |
Schaeffler Holding Finance BV, Senior Secured Notes | | | 6.875 | % | | | 8/15/18 | | | | 290,000 | EUR | | | 418,937 | (a)(c) |
St. Barbara Ltd., Senior Secured Notes | | | 8.875 | % | | | 4/15/18 | | | | 300,000 | | | | 249,750 | (a) |
Thompson Creek Metals Co. Inc., Senior Notes | | | 12.500 | % | | | 5/1/19 | | | | 200,000 | | | | 227,000 | |
Total Metals & Mining | | | | | | | | | | | | | | | 3,626,187 | |
Paper & Forest Products — 1.5% | | | | | | | | | | | | | | | | |
Appvion Inc., Secured Notes | | | 9.000 | % | | | 6/1/20 | | | | 650,000 | | | | 649,188 | (a) |
Resolute Forest Products Inc., Senior Notes | | | 5.875 | % | | | 5/15/23 | | | | 430,000 | | | | 425,700 | |
Verso Paper Holdings LLC/Verso Paper Inc., Senior Secured Notes | | | 11.750 | % | | | 1/15/19 | | | | 430,000 | | | | 454,725 | |
Total Paper & Forest Products | | | | | | | | | | | | | | | 1,529,613 | |
Total Materials | | | | | | | | | | | | | | | 9,687,429 | |
| Telecommunication Services — 5.1% | | | | | | | | | | | | | | | | |
Diversified Telecommunication Services — 3.2% | | | | | | | | | | | | | | | | |
CenturyLink Inc., Senior Notes | | | 6.450 | % | | | 6/15/21 | | | | 220,000 | | | | 239,800 | |
CenturyLink Inc., Senior Notes | | | 5.800 | % | | | 3/15/22 | | | | 40,000 | | | | 41,850 | |
Cincinnati Bell Telephone Co., Senior Debentures | | | 6.300 | % | | | 12/1/28 | | | | 70,000 | | | | 67,900 | |
Cogent Communications Holdings Inc., Senior Secured Notes | | | 8.375 | % | | | 2/15/18 | | | | 520,000 | | | | 557,700 | (a) |
Intelsat Jackson Holdings SA, Senior Bonds | | | 5.500 | % | | | 8/1/23 | | | | 400,000 | | | | 399,500 | |
Intelsat Jackson Holdings SA, Senior Notes | | | 7.500 | % | | | 4/1/21 | | | | 120,000 | | | | 131,850 | |
Level 3 Financing Inc., Senior Notes | | | 8.625 | % | | | 7/15/20 | | | | 520,000 | | | | 585,000 | |
TW Telecom Holdings Inc., Senior Notes | | | 5.375 | % | | | 10/1/22 | | | | 200,000 | | | | 219,500 | |
TW Telecom Holdings Inc., Senior Notes | | | 6.375 | % | | | 9/1/23 | | | | 360,000 | | | | 410,400 | |
Windstream Corp., Senior Notes | | | 7.750 | % | | | 10/1/21 | | | | 110,000 | | | | 120,725 | |
See Notes to Financial Statements.
| | |
| Western Asset Variable High Income Portfolio 2014 Semi-Annual Report | | 17 |
Schedule of investments (unaudited) (cont’d)
June 30, 2014
Western Asset Variable High Income Portfolio
| | | | | | | | | | | | | | | | |
| Security | | | Rate | | |
| Maturity
Date |
| |
| Face
Amount† |
| | | Value | |
Diversified Telecommunication Services — continued | | | | | | | | | | | | | | | | |
Windstream Corp., Senior Notes | | | 7.500 | % | | | 4/1/23 | | | | 460,000 | | | $ | 500,250 | |
Windstream Corp., Senior Notes | | | 6.375 | % | | | 8/1/23 | | | | 90,000 | | | | 91,575 | |
Total Diversified Telecommunication Services | | | | | | | | | | | | | | | 3,366,050 | |
Wireless Telecommunication Services — 1.9% | | | | | | | | | | | | | | | | |
Sprint Capital Corp., Senior Notes | | | 8.750 | % | | | 3/15/32 | | | | 730,000 | | | | 846,800 | |
Sprint Corp., Senior Notes | | | 7.875 | % | | | 9/15/23 | | | | 590,000 | | | | 657,850 | (a) |
Sprint Corp., Senior Notes | | | 7.125 | % | | | 6/15/24 | | | | 30,000 | | | | 31,875 | (a) |
VimpelCom Holdings BV, Senior Notes | | | 5.950 | % | | | 2/13/23 | | | | 410,000 | | | | 407,437 | (a) |
Total Wireless Telecommunication Services | | | | | | | | | | | | | | | 1,943,962 | |
Total Telecommunication Services | | | | | | | | | | | | | | | 5,310,012 | |
| Utilities — 4.3% | | | | | | | | | | | | | | | | |
Electric Utilities — 1.5% | | | | | | | | | | | | | | | | |
AES Red Oak LLC, Secured Notes | | | 9.200 | % | | | 11/30/29 | | | | 530,000 | | | | 590,950 | |
GenOn REMA LLC, Pass-Through Certificates | | | 9.237 | % | | | 7/2/17 | | | | 569,991 | | | | 601,341 | |
GenOn REMA LLC, Pass-Through Certificates | | | 9.681 | % | | | 7/2/26 | | | | 210,000 | | | | 228,375 | |
Midwest Generation LLC, Pass-Through Certificates | | | 8.560 | % | | | 1/2/16 | | | | 167,216 | | | | 171,814 | (e) |
Total Electric Utilities | | | | | | | | | | | | | | | 1,592,480 | |
Gas Utilities — 0.6% | | | | | | | | | | | | | | | | |
Southern Natural Gas Co., Senior Notes | | | 8.000 | % | | | 3/1/32 | | | | 130,000 | | | | 178,286 | |
Suburban Propane Partners LP/Suburban Energy Finance Corp., Senior Notes | | | 5.500 | % | | | 6/1/24 | | | | 460,000 | | | | 466,900 | |
Total Gas Utilities | | | | | | | | | | | | | | | 645,186 | |
Independent Power and Renewable Electricity Producers — 2.2% | | | | | | | | | | | | | |
AES Corp., Senior Notes | | | 4.875 | % | | | 5/15/23 | | | | 300,000 | | | | 298,500 | |
AES Corp., Senior Notes | | | 5.500 | % | | | 3/15/24 | | | | 60,000 | | | | 61,650 | |
Atlantic Power Corp., Senior Notes | | | 9.000 | % | | | 11/15/18 | | | | 30,000 | | | | 31,575 | |
Calpine Corp., Senior Secured Notes | | | 7.500 | % | | | 2/15/21 | | | | 456,000 | | | | 495,330 | (a) |
Dynegy Roseton LLC/Dynegy Danskammer LLC Pass-Through Trust, Secured Bonds | | | 7.670 | % | | | 8/11/16 | | | | 140,000 | | | | 0 | (b)(d)(h) |
First Wind Holdings Inc., Senior Secured Notes | | | 10.250 | % | | | 6/1/18 | | | | 610,000 | | | | 654,225 | (a) |
Foresight Energy LLC/Foresight Energy Corp., Senior Notes | | | 7.875 | % | | | 8/15/21 | | | | 360,000 | | | | 387,000 | (a) |
Mirant Mid Atlantic LLC, Pass-Through Certificates | | | 10.060 | % | | | 12/30/28 | | | | 282,545 | | | | 318,570 | |
Total Independent Power and Renewable Electricity Producers | | | | | | | | | | | | 2,246,850 | |
Total Utilities | | | | | | | | | | | | | | | 4,484,516 | |
Total Corporate Bonds & Notes (Cost — $87,258,906) | | | | | | | | | | | | | | | 91,629,473 | |
See Notes to Financial Statements.
| | |
| 18 | | Western Asset Variable High Income Portfolio 2014 Semi-Annual Report |
Western Asset Variable High Income Portfolio
| | | | | | | | | | | | | | | | |
| Security | | | Rate | | |
| Maturity
Date |
| |
| Face
Amount† |
| | | Value | |
| Convertible Bonds & Notes — 0.3% | | | | | | | | | | | | | | | | |
| Materials — 0.3% | | | | | | | | | | | | | | | | |
Metals & Mining — 0.3% | | | | | | | | | | | | | | | | |
Mirabela Nickel Ltd., Senior Secured Bonds (Cost — $260,000) | | | 9.500 | % | | | 6/20/19 | | | | 260,000 | | | $ | 260,000 | (a)(b) |
| Municipal Bonds — 0.1% | | | | | | | | | | | | | | | | |
Puerto Rico — 0.1% | | | | | | | | | | | | | | | | |
Puerto Rico Commonwealth, GO (Cost — $130,248) | | | 8.000 | % | | | 7/1/35 | | | | 140,000 | | | | 123,332 | |
| Senior Loans — 3.9% | | | | | | | | | | | | | | | | |
| Consumer Discretionary — 1.1% | | | | | | | | | | | | | | | | |
Hotels, Restaurants & Leisure — 0.6% | | | | | | | | | | | | | | | | |
Equinox Holdings Inc., Second Lien Term Loan | | | 9.750 | % | | | 7/31/20 | | | | 290,000 | | | | 295,075 | (i)(j) |
Stockbridge SBE Holdings LLC, Term Loan B | | | 13.000 | % | | | 5/2/17 | | | | 330,000 | | | | 367,950 | (i)(j) |
Total Hotels, Restaurants & Leisure | | | | | | | | | | | | | | | 663,025 | |
Specialty Retail — 0.5% | | | | | | | | | | | | | | | | |
Camping World Inc., Term Loan | | | 5.750 | % | | | 2/20/20 | | | | 335,750 | | | | 339,107 | (i)(j) |
Gymboree Corp., Initial Term Loan | | | 5.000 | % | | | 2/23/18 | | | | 140,000 | | | | 120,517 | (i)(j) |
Total Specialty Retail | | | | | | | | | | | | | | | 459,624 | |
Total Consumer Discretionary | | | | | | | | | | | | | | | 1,122,649 | |
| Consumer Staples — 0.1% | | | | | | | | | | | | | | | | |
Food Products — 0.1% | | | | | | | | | | | | | | | | |
AdvancePierre Foods Inc., Second Lien Term Loan | | | 9.500 | % | | | 10/10/17 | | | | 120,000 | | | | 116,550 | (i)(j) |
| Health Care — 0.9% | | | | | | | | | | | | | | | | |
Health Care Equipment & Supplies — 0.2% | | | | | | | | | | | | | | | | |
Immucor Inc., REFI Term Loan B2 | | | 5.000 | % | | | 8/17/18 | | | | 175,090 | | | | 176,349 | (i)(j) |
Health Care Providers & Services — 0.7% | | | | | | | | | | | | | | | | |
CRC Health Corp., Second Lien Term Loan | | | 9.000 | % | | | 9/28/21 | | | | 200,000 | | | | 202,125 | (i)(j) |
Physiotherapy Associates Holdings Inc., Exit Term Loan | | | 10.000 | % | | | 10/10/16 | | | | 240,000 | | | | 238,800 | (d)(i)(j) |
Radnet Management Inc., Second Lien Term Loan | | | 8.000 | % | | | 3/25/21 | | | | 260,000 | | | | 261,625 | (i)(j) |
Total Health Care Providers & Services | | | | | | | | | | | | | | | 702,550 | |
Total Health Care | | | | | | | | | | | | | | | 878,899 | |
| Industrials — 0.5% | | | | | | | | | | | | | | | | |
Machinery — 0.5% | | | | | | | | | | | | | | | | |
Intelligrated Inc., Second Lien Term Loan | | | 10.500 | % | | | 1/30/20 | | | | 520,000 | | | | 528,450 | (i)(j) |
| Materials — 0.2% | | | | | | | | | | | | | | | | |
Chemicals — 0.2% | | | | | | | | | | | | | | | | |
Kronos Inc., Second Lien Term Loan | | | 9.750 | % | | | 4/30/20 | | | | 230,000 | | | | 238,433 | (i)(j) |
See Notes to Financial Statements.
| | |
| Western Asset Variable High Income Portfolio 2014 Semi-Annual Report | | 19 |
Schedule of investments (unaudited) (cont’d)
June 30, 2014
Western Asset Variable High Income Portfolio
| | | | | | | | | | | | | | | | |
| Security | | | Rate | | |
| Maturity
Date |
| |
| Face
Amount† |
| | | Value | |
| Utilities — 1.1% | | | | | | | | | | | | | | | | |
Independent Power and Renewable Electricity Producers — 1.1% | | | | | | | | | | | | | |
Energy Future Intermediate Holding Co. LLC, DIP Term Loan | | | 4.250 | % | | | 6/10/16 | | | | 1,176,974 | | | $ | 1,186,243 | (i)(j) |
Total Senior Loans (Cost — $3,971,873) | | | | | | | | | | | | | | | 4,071,224 | |
| Sovereign Bonds — 0.6% | | | | | | | | | | | | | | | | |
Mexico — 0.6% | | | | | | | | | | | | | | | | |
United Mexican States, Bonds (Cost — $593,502) | | | 6.500 | % | | | 6/9/22 | | | | 7,188,000 | MXN | | | 590,279 | |
| | | | |
| | | | | | | | | Shares | | | | |
| Common Stocks — 3.1% | | | | | | | | | | | | | | | | |
| Consumer Discretionary — 0.2% | | | | | | | | | | | | | | | | |
Automobiles — 0.2% | | | | | | | | | | | | | | | | |
Ford Motor Co. | | | | | | | | | | | 11,570 | | | | 199,467 | |
Hotels, Restaurants & Leisure — 0.0% | | | | | | | | | | | | | | | | |
Bossier Casino Venture Holdco Inc. | | | | | | | | | | | 22,038 | | | | 44,076 | *(b)(d) |
Media — 0.0% | | | | | | | | | | | | | | | | |
New Cotai LLC/New Cotai Capital Corp., Class B Shares | | | | | | | | | | | 1 | | | | 0 | *(b)(d)(h) |
Total Consumer Discretionary | | | | | | | | | | | | | | | 243,543 | |
| Energy — 0.9% | | | | | | | | | | | | | | | | |
Energy Equipment & Services — 0.9% | | | | | | | | | | | | | | | | |
KCAD Holdings I Ltd. | | | | | | | | | | | 108,106,087 | | | | 892,956 | *(b)(d) |
| Financials — 0.7% | | | | | | | | | | | | | | | | |
Banks — 0.6% | | | | | | | | | | | | | | | | |
Citigroup Inc. | | | | | | | | | | | 6,981 | | | | 328,805 | |
JPMorgan Chase & Co. | | | | | | | | | | | 4,380 | | | | 252,375 | |
Total Banks | | | | | | | | | | | | | | | 581,180 | |
Real Estate Management & Development — 0.1% | | | | | | | | | | | | | | | | |
Realogy Holdings Corp. | | | | | | | | | | | 2,825 | | | | 106,531 | * |
Total Financials | | | | | | | | | | | | | | | 687,711 | |
| Health Care — 0.1% | | | | | | | | | | | | | | | | |
Health Care Providers & Services — 0.1% | | | | | | | | | | | | | | | | |
Physiotherapy Associates Holdings Inc. | | | | | | | | | | | 3,500 | | | | 168,000 | *(b)(d) |
| Industrials — 1.2% | | | | | | | | | | | | | | | | |
Marine — 1.2% | | | | | | | | | | | | | | | | |
DeepOcean Group Holding AS | | | | | | | | | | | 33,669 | | | | 1,155,722 | *(b)(d) |
Horizon Lines Inc., Class A Shares | | | | | | | | | | | 223,758 | | | | 89,481 | * |
Total Industrials | | | | | | | | | | | | | | | 1,245,203 | |
See Notes to Financial Statements.
| | |
| 20 | | Western Asset Variable High Income Portfolio 2014 Semi-Annual Report |
Western Asset Variable High Income Portfolio
| | | | | | | | | | | | | | |
| Security | | | Rate | | | | | | Shares | | | | Value | |
| Materials — 0.0% | | | | | | | | | | | | | | |
Metals & Mining — 0.0% | | | | | | | | | | | | | | |
Mirabela Nickel Ltd. | | | | | | | | | 137,518 | | | $ | 4,126 | * |
Total Common Stocks (Cost — $3,594,781) | | | | | | | | | | | | | 3,241,539 | |
| Convertible Preferred Stocks — 0.1% | | | | | | | | | | | | | | |
| Materials — 0.1% | | | | | | | | | | | | | | |
Metals & Mining — 0.1% | | | | | | | | | | | | | | |
ArcelorMittal (Cost — $60,000) | | | 6.000 | % | | | | | 2,400 | | | | 53,976 | |
| Preferred Stocks — 1.9% | | | | | | | | | | | | | | |
| Financials — 1.9% | | | | | | | | | | | | | | |
Banks — 0.2% | | | | | | | | | | | | | | |
Santander Finance Preferred SA Unipersonal | | | 10.500 | % | | | | | 260 | | | | 274,544 | (f) |
Consumer Finance — 1.0% | | | | | | | | | | | | | | |
GMAC Capital Trust I | | | 8.125 | % | | | | | 36,969 | | | | 1,009,254 | (f) |
Diversified Financial Services — 0.7% | | | | | | | | | | | | | | |
Citigroup Capital XIII | | | 7.875 | % | | | | | 25,825 | | | | 715,352 | (f) |
Total Preferred Stocks (Cost — $1,847,736) | | | | | | | | | | | | | 1,999,150 | |
| | | | |
| | | Expiration
Date | | | | | Warrants | | | | |
| Warrants — 0.1% | | | | | | | | | | | | | | |
Jack Cooper Holdings Corp. | | | 12/15/17 | | | | | | 668 | | | | 103,540 | *(a) |
Jack Cooper Holdings Corp. | | | 5/6/18 | | | | | | 297 | | | | 46,035 | *(a) |
Total Warrants (Cost — $16,238) | | | | | | | | | | 149,575 | |
Total Investments — 98.7% (Cost — $97,733,284#) | | | | | | | | | | 102,118,548 | |
Other Assets in Excess of Liabilities — 1.3% | | | | | | | | | | 1,294,405 | |
Total Net Assets — 100.0% | | | | | | | | | $ | 103,412,953 | |
| † | Face amount denominated in U.S. dollars, unless otherwise noted. |
| * | Non-income producing security. |
| (a) | Security is exempt from registration under Rule 144A of the Securities Act of 1933. This security may be resold in transactions that are exempt from registration, normally to qualified institutional buyers. This security has been deemed liquid pursuant to guidelines approved by the Board of Trustees, unless otherwise noted. |
| (b) | Security is valued in good faith in accordance with procedures approved by the Board of Trustees (See Note 1). |
| (c) | Payment-in-kind security for which the issuer has the option at each interest payment date of making interest payments in cash or additional debt securities. |
| (e) | The coupon payment on these securities is currently in default as of June 30, 2014. |
| (f) | Variable rate security. Interest rate disclosed is as of the most recent information available. |
| (g) | Security has no maturity date. The date shown represents the next call date. |
| (h) | Value is less than $1. |
See Notes to Financial Statements.
| | |
| Western Asset Variable High Income Portfolio 2014 Semi-Annual Report | | 21 |
Schedule of investments (unaudited) (cont’d)
June 30, 2014
Western Asset Variable High Income Portfolio
| (i) | Senior loans may be considered restricted in that the Fund ordinarily is contractually obligated to receive approval from the agent bank and/or borrower prior to the disposition of a senior loan. |
| (j) | Interest rates disclosed represent the effective rates on senior loans. Ranges in interest rates are attributable to multiple contracts under the same loan. |
| (k) | Security is exempt from registration under Regulation S of the Securities Act of 1933. Regulation S applies to securities offerings that are made outside of the United States and do not involve direct selling efforts in the United States. This security has been deemed liquid pursuant to guidelines approved by the Board of Trustees, unless otherwise noted. |
| # | Aggregate cost for federal income tax purposes is substantially the same. |
| | |
Abbreviations used in this schedule: |
| AUD | | —Australian Dollar |
| EUR | | —Euro |
| GO | | —General Obligation |
| MXN | | —Mexican Peso |
See Notes to Financial Statements.
| | |
| 22 | | Western Asset Variable High Income Portfolio 2014 Semi-Annual Report |
Statement of assets and liabilities (unaudited)
June 30, 2014
| | | | |
| |
| Assets: | | | | |
Investments, at value (Cost — $97,733,284) | | $ | 102,118,548 | |
Foreign currency, at value (Cost — $21,494) | | | 21,590 | |
Cash | | | 1,408,234 | |
Interest and dividends receivable | | | 1,740,131 | |
Receivable for securities sold | | | 583,813 | |
Deposits with brokers for centrally cleared swap contracts | | | 212,019 | |
Unrealized appreciation on forward foreign currency contracts | | | 29,373 | |
Receivable from broker — variation margin on centrally cleared swaps | | | 4,451 | |
Prepaid expenses | | | 541 | |
Other assets | | | 3,695 | |
Total Assets | | | 106,122,395 | |
| |
| Liabilities: | | | | |
Payable for securities purchased | | | 2,489,502 | |
Payable for Portfolio shares repurchased | | | 103,254 | |
Investment management fee payable | | | 50,961 | |
Trustees’ fees payable | | | 101 | |
Accrued expenses | | | 65,624 | |
Total Liabilities | | | 2,709,442 | |
| Total Net Assets | | $ | 103,412,953 | |
| |
| Net Assets: | | | | |
Par value (Note 5) | | $ | 162 | |
Paid-in capital in excess of par value | | | 127,144,608 | |
Undistributed net investment income | | | 3,178,985 | |
Accumulated net realized loss on investments, swap contracts and foreign currency transactions | | | (31,266,377) | |
Net unrealized appreciation on investments, swap contracts and foreign currencies | | | 4,355,575 | |
| Total Net Assets | | $ | 103,412,953 | |
| |
| Shares Outstanding | | | 16,169,695 | |
| |
| Net Asset Value | | | $6.40 | |
See Notes to Financial Statements.
| | |
| Western Asset Variable High Income Portfolio 2014 Semi-Annual Report | | 23 |
Statement of operations (unaudited)
For the Six Months Ended June 30, 2014
| | | | |
| |
| Investment Income: | | | | |
Interest | | $ | 3,779,487 | |
Dividends | | | 80,004 | |
Less: Foreign taxes withheld | | | (98) | |
Total Investment Income | | | 3,859,393 | |
| |
| Expenses: | | | | |
Investment management fee (Note 2) | | | 314,279 | |
Shareholder reports | | | 28,509 | |
Audit and tax | | | 21,189 | |
Legal fees | | | 12,860 | |
Fund accounting fees | | | 5,438 | |
Transfer agent fees | | | 3,127 | |
Custody fees | | | 2,224 | |
Insurance | | | 1,577 | |
Trustees’ fees | | | 927 | |
Miscellaneous expenses | | | 1,444 | |
Total Expenses | | | 391,574 | |
| Net Investment Income | | | 3,467,819 | |
| |
| Realized and Unrealized Gain (Loss) on Investments, Swap Contracts and Foreign Currency Transactions (Notes 1, 3 and 4): | | | | |
Net Realized Gain (Loss) From: | | | | |
Investment transactions | | | 1,588,439 | |
Swap contracts | | | (123,224) | |
Foreign currency transactions | | | (55,559) | |
Net Realized Gain | | | 1,409,656 | |
Change in Net Unrealized Appreciation (Depreciation) From: | | | | |
Investments | | | 697,019 | |
Swap contracts | | | 33,839 | |
Foreign currencies | | | 65,596 | |
Change in Net Unrealized Appreciation (Depreciation) | | | 796,454 | |
| Net Gain on Investments, Swap Contracts and Foreign Currency Transactions | | | 2,206,110 | |
| Increase in Net Assets From Operations | | $ | 5,673,929 | |
See Notes to Financial Statements.
| | |
| 24 | | Western Asset Variable High Income Portfolio 2014 Semi-Annual Report |
Statements of changes in net assets
| | | | | | | | |
For the Six Months Ended June 30, 2014 (unaudited)
and the Year Ended December 31, 2013 | | 2014 | | | 2013 | |
| | |
| Operations: | | | | | | | | |
Net investment income | | $ | 3,467,819 | | | $ | 7,998,148 | |
Net realized gain | | | 1,409,656 | | | | 2,859,564 | |
Change in net unrealized appreciation (depreciation) | | | 796,454 | | | | (742,594) | |
Increase in Net Assets from Operations | | | 5,673,929 | | | | 10,115,118 | |
| | |
| Distributions to Shareholders From (Note 1): | | | | | | | | |
Net investment income | | | (300,005) | | | | (7,850,013) | |
Decrease in Net Assets from Distributions to Shareholders | | | (300,005) | | | | (7,850,013) | |
| | |
| Portfolio Share Transactions (Note 5): | | | | | | | | |
Net proceeds from sale of shares | | | 481,857 | | | | 1,767,220 | |
Reinvestment of distributions | | | 300,005 | | | | 7,850,013 | |
Cost of shares repurchased | | | (10,988,290) | | | | (23,743,448) | |
Decrease in Net Assets from Portfolio Share Transactions | | | (10,206,428) | | | | (14,126,215) | |
Decrease in Net Assets | | | (4,832,504) | | | | (11,861,110) | |
| | |
| Net Assets: | | | | | | | | |
Beginning of period | | | 108,245,457 | | | | 120,106,567 | |
End of period* | | $ | 103,412,953 | | | $ | 108,245,457 | |
*Includesundistributed net investment income of: | | | $3,178,985 | | | | $11,171 | |
See Notes to Financial Statements.
| | |
| Western Asset Variable High Income Portfolio 2014 Semi-Annual Report | | 25 |
Financial highlights
| | | | | | | | | | | | | | | | | | | | | | | | | | | | |
For a share of beneficial interest outstanding throughout each year ended December 31,
unless otherwise noted: | | | | |
| | | 20141,2 | | | 20131 | | | 20121 | | | 2011 | | | 2010 | | | 20093 | | | 20094 | |
| | | | | | | |
| Net asset value, beginning of period | | | $6.08 | | | | $6.00 | | | | $5.54 | | | | $5.95 | | | | $5.63 | | | | $5.97 | | | | $4.91 | |
| | | | | | | |
| Income (loss) from operations: | | | | | | | | | | | | | | | | | | | | | | | | | | | | |
Net investment income | | | 0.20 | | | | 0.44 | | | | 0.47 | | | | 0.55 | | | | 0.61 | | | | 0.13 | | | | 0.65 | |
Net realized and unrealized gain (loss) | | | 0.14 | | | | 0.11 | | | | 0.52 | | | | (0.41) | | | | 0.32 | | | | 0.15 | | | | 1.12 | |
Total income from operations | | | 0.34 | | | | 0.55 | | | | 0.99 | | | | 0.14 | | | | 0.93 | | | | 0.28 | | | | 1.77 | |
| | | | | | | |
| Less distributions from: | | | | | | | | | | | | | | | | | | | | | | | | | | | | |
Net investment income | | | (0.02) | | | | (0.47) | | | | (0.53) | | | | (0.55) | | | | (0.61) | | | | (0.62) | | | | (0.71) | |
Total distributions | | | (0.02) | | | | (0.47) | | | | (0.53) | | | | (0.55) | | | | (0.61) | | | | (0.62) | | | | (0.71) | |
| | | | | | | |
| Net asset value, end of period | | | $6.40 | | | | $6.08 | | | | $6.00 | | | | $5.54 | | | | $5.95 | | | | $5.63 | | | | $5.97 | |
Total return5 | | | 5.40 | % | | | 9.21 | % | | | 17.88 | % | | | 2.40 | % | | | 16.63 | % | | | 4.75 | % | | | 45.22 | % |
| | | | | | | |
| Net assets, end of period (millions) | | | $103 | | | | $108 | | | | $120 | | | | $126 | | | | $158 | | | | $164 | | | | $161 | |
| | | | | | | |
| Ratios to average net assets: | | | | | | | | | | | | | | | | | | | | | | | | | | | | |
Gross expenses | | | 0.75 | %6 | | | 0.74 | % | | | 0.72 | % | | | 0.68 | % | | | 0.68 | % | | | 0.77 | %6 | | | 0.75 | % |
Net expenses7,8 | | | 0.75 | 6 | | | 0.74 | | | | 0.72 | | | | 0.68 | | | | 0.68 | | | | 0.77 | 6 | | | 0.75 | |
Net investment income | | | 6.62 | 6 | | | 6.97 | | | | 7.86 | | | | 8.01 | | | | 9.15 | | | | 11.80 | 6 | | | 12.46 | |
| | | | | | | |
| Portfolio turnover rate | | | 38 | % | | | 75 | % | | | 76 | % | | | 68 | % | | | 97 | % | | | 13 | % | | | 67 | % |
| 1 | Per share amounts have been calculated using the average shares method. |
| 2 | For the six months ended June 30, 2014 (unaudited). |
| 3 | For the period November 1, 2009 through December 31, 2009. |
| 4 | For the year ended October 31. |
| 5 | Performance figures may reflect compensating balance arrangements, fee waivers and/or expense reimbursements. In the absence of compensating balance arrangements, fee waivers and/or expense reimbursements, the total return would have been lower. Total returns do not reflect expenses associated with separate accounts such as administrative fees, account charges and surrender charges which, if reflected, would reduce the total return for all periods shown. Past performance is no guarantee of future results. Total returns for periods of less than one year are not annualized. |
| 7 | The impact of compensating balance arrangements, if any, was less than 0.01%. |
| 8 | As a result of an expense limitation arrangement, the ratio of expenses, other than brokerage, interest, taxes, extraordinary expenses and acquired fund fees and expenses, to average net assets of shares did not exceed 1.00%. This expense limitation arrangement cannot be terminated prior to December 31, 2015 without the Board of Trustees’ consent. |
See Notes to Financial Statements.
| | |
| 26 | | Western Asset Variable High Income Portfolio 2014 Semi-Annual Report |
Notes to financial statements (unaudited)
1. Organization and significant accounting policies
Western Asset Variable High Income Portfolio (the “Portfolio”) is a separate diversified investment series of Legg Mason Partners Variable Income Trust (the “Trust”). The Trust, a Maryland statutory trust, is registered under the Investment Company Act of 1940, as amended (the “1940 Act”), as an open-end management investment company.
Shares of the Portfolio may only be purchased or redeemed through variable annuity contracts and variable life insurance policies offered by the separate accounts of participating insurance companies or through eligible pension or other qualified plans.
The following are significant accounting policies consistently followed by the Portfolio and are in conformity with U.S. generally accepted accounting principles (“GAAP”). Estimates and assumptions are required to be made regarding assets, liabilities and changes in net assets resulting from operations when financial statements are prepared. Changes in the economic environment, financial markets and any other parameters used in determining these estimates could cause actual results to differ. Subsequent events have been evaluated through the date the financial statements were issued.
(a) Investment valuation. The valuations for fixed income securities (which may include, but are not limited to, corporate, government, municipal, mortgage-backed, collateralized mortgage obligations and asset-backed securities) and certain derivative instruments are typically the prices supplied by independent third party pricing services, which may use market prices or broker/dealer quotations or a variety of valuation techniques and methodologies. The independent third party pricing services use inputs that are observable such as issuer details, interest rates, yield curves, prepayment speeds, credit risks/spreads, default rates and quoted prices for similar securities. Short-term fixed income securities that will mature in 60 days or less are valued at amortized cost, unless it is determined that using this method would not reflect an investment’s fair value. Equity securities for which market quotations are available are valued at the last reported sales price or official closing price on the primary market or exchange on which they trade. When the Portfolio holds securities or other assets that are denominated in a foreign currency, the Portfolio will normally use the currency exchange rates as of 4:00 p.m. (Eastern Time). If independent third party pricing services are unable to supply prices for a portfolio investment, or if the prices supplied are deemed by the manager to be unreliable, the market price may be determined by the manager using quotations from one or more broker/dealers or at the transaction price if the security has recently been purchased and no value has yet been obtained from a pricing service or pricing broker. When reliable prices are not readily available, such as when the value of a security has been significantly affected by events after the close of the exchange or market on which the security is principally traded, but before the Portfolio calculates its net asset value, the Portfolio values these securities as determined in accordance with procedures approved by the Portfolio’s Board of Trustees.
The Board of Trustees is responsible for the valuation process and has delegated the supervision of the daily valuation process to the Legg Mason North American Fund Valuation Committee (the “Valuation Committee”). The Valuation Committee, pursuant to the policies
| | |
| Western Asset Variable High Income Portfolio 2014 Semi-Annual Report | | 27 |
Notes to financial statements (cont’d) (unaudited)
adopted by the Board of Trustees, is responsible for making fair value determinations, evaluating the effectiveness of the Portfolio’s pricing policies, and reporting to the Board of Trustees. When determining the reliability of third party pricing information for investments owned by the Portfolio, the Valuation Committee, among other things, conducts due diligence reviews of pricing vendors, monitors the daily change in prices and reviews transactions among market participants.
The Valuation Committee will consider pricing methodologies it deems relevant and appropriate when making fair value determinations. Examples of possible methodologies include, but are not limited to, multiple of earnings; discount from market of a similar freely traded security; discounted cash-flow analysis; book value or a multiple thereof; risk premium/yield analysis; yield to maturity; and/or fundamental investment analysis. The Valuation Committee will also consider factors it deems relevant and appropriate in light of the facts and circumstances. Examples of possible factors include, but are not limited to, the type of security; the issuer’s financial statements; the purchase price of the security; the discount from market value of unrestricted securities of the same class at the time of purchase; analysts’ research and observations from financial institutions; information regarding any transactions or offers with respect to the security; the existence of merger proposals or tender offers affecting the security; the price and extent of public trading in similar securities of the issuer or comparable companies; and the existence of a shelf registration for restricted securities.
For each portfolio security that has been fair valued pursuant to the policies adopted by the Board of Trustees, the fair value price is compared against the last available and next available market quotations. The Valuation Committee reviews the results of such back testing monthly and fair valuation occurrences are reported to the Board of Trustees quarterly.
The Portfolio uses valuation techniques to measure fair value that are consistent with the market approach and/or income approach, depending on the type of security and the particular circumstance. The market approach uses prices and other relevant information generated by market transactions involving identical or comparable securities. The income approach uses valuation techniques to discount estimated future cash flows to present value.
GAAP establishes a disclosure hierarchy that categorizes the inputs to valuation techniques used to value assets and liabilities at measurement date. These inputs are summarized in the three broad levels listed below:
| Ÿ | | Level 1 — quoted prices in active markets for identical investments |
| Ÿ | | Level 2 — other significant observable inputs (including quoted prices for similar investments, interest rates, prepayment speeds, credit risk, etc.) |
| Ÿ | | Level 3 — significant unobservable inputs (including the Portfolio’s own assumptions in determining the fair value of investments) |
| | |
| 28 | | Western Asset Variable High Income Portfolio 2014 Semi-Annual Report |
The inputs or methodologies used to value securities are not necessarily an indication of the risk associated with investing in those securities.
The following is a summary of the inputs used in valuing the Portfolio’s assets and liabilities carried at fair value:
| | | | | | | | | | | | | | | | |
| ASSETS | |
| Description | | Quoted Prices (Level 1) | | | Other Significant Observable Inputs (Level 2) | | | Significant Unobservable Inputs (Level 3) | | | Total | |
| Long-term investments†: | | | | | | | | | | | | | | | | |
Corporate bonds & notes: | | | | | | | | | | | | | | | | |
Consumer discretionary | | | — | | | $ | 16,487,431 | | | $ | 634,199 | | | $ | 17,121,630 | |
Utilities | | | — | | | | 4,484,516 | | | | 0 | * | | | 4,484,516 | |
Other corporate bonds & notes | | | — | | | | 70,023,327 | | | | — | | | | 70,023,327 | |
Convertible bonds & notes | | | — | | | | — | | | | 260,000 | | | | 260,000 | |
Municipal bonds | | | — | | | | 123,332 | | | | — | | | | 123,332 | |
Senior loans | | | — | | | | 4,071,224 | | | | — | | | | 4,071,224 | |
Sovereign bonds | | | — | | | | 590,279 | | | | — | | | | 590,279 | |
Common stocks: | | | | | | | | | | | | | | | | |
Consumer discretionary | | $ | 199,467 | | | | — | | | | 44,076 | | | | 243,543 | |
Energy | | | — | | | | — | | | | 892,956 | | | | 892,956 | |
Health care | | | — | | | | — | | | | 168,000 | | | | 168,000 | |
Industrials | | | 89,481 | | | | — | | | | 1,155,722 | | | | 1,245,203 | |
Other common stocks | | | 691,837 | | | | — | | | | — | | | | 691,837 | |
Convertible preferred stocks | | | 53,976 | | | | — | | | | — | | | | 53,976 | |
Preferred stocks | | | 1,724,606 | | | | 274,544 | | | | — | | | | 1,999,150 | |
Warrants | | | — | | | | 149,575 | | | | — | | | | 149,575 | |
| Total investments | | $ | 2,759,367 | | | $ | 96,204,228 | | | $ | 3,154,953 | | | $ | 102,118,548 | |
| Other financial instruments: | | | | | | | | | | | | | | | | |
Forward foreign currency contracts | | | — | | | $ | 29,373 | | | | — | | | $ | 29,373 | |
| Total | | $ | 2,759,367 | | | $ | 96,233,601 | | | $ | 3,154,953 | | | $ | 102,147,921 | |
|
| LIABILITIES | |
| Description | | Quoted Prices (Level 1) | | | Other Significant Observable Inputs (Level 2) | | | Significant Unobservable Inputs (Level 3) | | | Total | |
| Other financial instruments: | | | | | | | | | | | | | | | | |
Centrally cleared credit default swaps on credit indices — buy protection | | | — | | | $ | 59,311 | | | | — | | | $ | 59,311 | |
| † | See Schedule of Investments for additional detailed categorizations. |
| | |
| Western Asset Variable High Income Portfolio 2014 Semi-Annual Report | | 29 |
Notes to financial statements (cont’d) (unaudited)
The following is a reconciliation of investments in which significant unobservable inputs (Level 3) were used in determining fair value:
| | | | | | | | | | | | | | | | | | | | | | | | |
| | | CORPORATE BONDS & NOTES | | | | | | | |
Investments in Securities | | Consumer
Discretionary | | | Energy | | | Materials | | | Utilities | | | Convertible
Bonds &
Notes | | | Total | |
| Balance as of December 31, 2013 | | $ | 562,130 | | | $ | 581,017 | | | $ | 40,000 | | | $ | 0 | * | | $ | 0 | * | | $ | 1,183,147 | |
| Accrued premiums/discounts | | | 3,025 | | | | 1,336 | | | | — | | | | — | | | | — | | | | 4,361 | |
| Realized gain (loss)1 | | | — | | | | — | | | | 19,999 | | | | — | | | | — | | | | 19,999 | |
| Change in unrealized appreciation (depreciation)2 | | | 4,802 | | | | (15,825) | | | | — | | | | — | | | | — | | | | (11,023) | |
| Purchases | | | 64,242 | | | | 43,905 | | | | 20,001 | | | | — | | | | 260,000 | | | | 388,148 | |
| Sales | | | — | | | | — | | | | (80,000) | | | | — | | | | — | | | | (80,000) | |
| Transfers into Level 3 | | | — | | | | — | | | | — | | | | — | | | | — | | | | — | |
| Transfers out of Level 33 | | | — | | | | (610,433) | | | | — | | | | — | | | | — | | | | (610,433) | |
| Balance as of June 30, 2014 | | $ | 634,199 | | | | — | | | | — | | | $ | 0 | * | | $ | 260,000 | | | $ | 894,199 | |
| Net change in unrealized appreciation (depreciation) for investments in securities still held at June 30, 20142 | | $ | 4,802 | | | | — | | | | — | | | | — | | | | — | | | $ | 4,802 | |
| | | | | | | | | | | | | | | | | | | | |
| | | COMMON STOCKS | |
Investments in Securities | | Consumer Discretionary | | | Energy | | | Healthcare | | | Industrials | | | Total | |
| Balance as of December 31, 2013 | | $ | 44,076 | | | $ | 921,712 | | | | — | | | $ | 1,109,579 | | | $ | 2,075,367 | |
| Accrued premiums/discounts | | | — | | | | — | | | | — | | | | — | | | | — | |
| Realized gain (loss)1 | | | — | | | | — | | | | — | | | | — | | | | — | |
| Change in unrealized appreciation (depreciation)2 | | | — | | | | (28,756) | | | $ | (111,021) | | | | 46,143 | | | | (93,634) | |
| Purchases | | | — | | | | — | | | | 279,021 | | | | — | | | | 279,021 | |
| Sales | | | — | | | | — | | | | — | | | | — | | | | — | |
| Transfers into Level 3 | | | — | | | | — | | | | — | | | | — | | | | — | |
| Transfers out of Level 33 | | | — | | | | — | | | | — | | | | — | | | | — | |
| Balance as of June 30, 2014 | | $ | 44,076 | | | $ | 892,956 | | | $ | 168,000 | | | $ | 1,155,722 | | | $ | 2,260,754 | |
| Net change in unrealized appreciation (depreciation) for investments in securities still held at June 30, 20142 | | | — | | | $ | (28,756) | | | $ | (111,021) | | | $ | 46,143 | | | $ | (93,634) | |
The Fund’s policy is to recognize transfers between levels as of the end of the reporting period.
| 1 | This amount is included in net realized gain (loss) from investment transactions in the accompanying Statement of Operations. |
| 2 | This amount is included in the change in net unrealized appreciation (depreciation) in the accompanying Statement of Operations. Change in unrealized appreciation (depreciation) includes net unrealized appreciation (depreciation) resulting from changes in investment values during the reporting period and the reversal of previously recorded unrealized appreciation (depreciation) when gains or losses are realized. |
| 3 | Transferred out of Level 3 as a result of the availability of a quoted price in an active market for an identical investment or the availability of other significant observable inputs. |
| | |
| 30 | | Western Asset Variable High Income Portfolio 2014 Semi-Annual Report |
The following table summarizes the valuation techniques used and unobservable inputs approved by the Valuation Committee to determine the fair value of certain, material Level 3 investments. The table does not include Level 3 investments with values derived utilizing prices from prior transactions or third party pricing information without adjustment (e.g., broker quotes, pricing services, net asset values).
| | | | | | | | | | | | | | | | | | | | |
| | | Fair Value at
6/30/14 (000’s) | | | Valuation
Technique(s) | | | Unobservable Input(s) | | | Range/Weighted
Average | | | Impact to Valuation
from an Increase in
Input* | |
| Common Stock | | $ | 1,156 | | |
| Market
Approach |
| | | EBITDA Multiple | | | | 7.77x | | | | Increase | |
| * | This column represents the directional change in the fair value of the Level 3 investments that would result in an increase from the corresponding unobservable input. A decrease to the unobservable input would have the opposite effect. Significant increases and decreases in these unobservable inputs in isolation could result in significantly higher or lower fair value measurements. |
(b) Repurchase agreements. The Portfolio may enter into repurchase agreements with institutions that its investment adviser has determined are creditworthy. Each repurchase agreement is recorded at cost. Under the terms of a typical repurchase agreement, the Portfolio acquires a debt security subject to an obligation of the seller to repurchase, and of the Portfolio to resell, the security at an agreed-upon price and time, thereby determining the yield during the Portfolio’s holding period. When entering into repurchase agreements, it is the Portfolio’s policy that its custodian or a third party custodian, acting on the Portfolio’s behalf, take possession of the underlying collateral securities, the market value of which, at all times, at least equals the principal amount of the repurchase transaction, including accrued interest. To the extent that any repurchase transaction maturity exceeds one business day, the value of the collateral is marked-to-market and measured against the value of the agreement in an effort to ensure the adequacy of the collateral. If the counterparty defaults, the Portfolio generally has the right to use the collateral to satisfy the terms of the repurchase transaction. However, if the market value of the collateral declines during the period in which the Portfolio seeks to assert its rights or if bankruptcy proceedings are commenced with respect to the seller of the security, realization of the collateral by the Portfolio may be delayed or limited.
(c) Foreign currency translation. Investment securities and other assets and liabilities denominated in foreign currencies are translated into U.S. dollar amounts based upon prevailing exchange rates on the date of valuation. Purchases and sales of investment securities and income and expense items denominated in foreign currencies are translated into U.S. dollar amounts based upon prevailing exchange rates on the respective dates of such transactions.
The Portfolio does not isolate that portion of the results of operations resulting from fluctuations in foreign exchange rates on investments from the fluctuations arising from changes in market prices of securities held. Such fluctuations are included with the net realized and unrealized gain or loss on investments.
| | |
| Western Asset Variable High Income Portfolio 2014 Semi-Annual Report | | 31 |
Notes to financial statements (cont’d) (unaudited)
Net realized foreign exchange gains or losses arise from sales of foreign currencies, including gains and losses on forward foreign currency contracts, currency gains or losses realized between the trade and settlement dates on securities transactions, and the difference between the amounts of dividends, interest, and foreign withholding taxes recorded on the Portfolio’s books and the U.S. dollar equivalent of the amounts actually received or paid. Net unrealized foreign exchange gains and losses arise from changes in the values of assets and liabilities, other than investments in securities, on the date of valuation, resulting from changes in exchange rates.
Foreign security and currency transactions may involve certain considerations and risks not typically associated with those of U.S. dollar denominated transactions as a result of, among other factors, the possibility of lower levels of governmental supervision and regulation of foreign securities markets and the possibility of political or economic instability.
(d) Forward foreign currency contracts. The Portfolio enters into a forward foreign currency contract to hedge against foreign currency exchange rate risk on its non-U.S. dollar denominated securities or to facilitate settlement of a foreign currency denominated portfolio transaction. A forward foreign currency contract is an agreement between two parties to buy and sell a currency at a set price with delivery and settlement at a future date. The contract is marked-to-market daily and the change in value is recorded by the Portfolio as an unrealized gain or loss. When a forward foreign currency contract is closed, through either delivery or offset by entering into another forward foreign currency contract, the Portfolio recognizes a realized gain or loss equal to the difference between the value of the contract at the time it was opened and the value of the contract at the time it is closed.
Forward foreign currency contracts involve elements of market risk in excess of the amounts reflected on the Statement of Assets and Liabilities. The Portfolio bears the risk of an unfavorable change in the foreign exchange rate underlying the forward foreign currency contract. Risks may also arise upon entering into these contracts from the potential inability of the counterparties to meet the terms of their contracts.
(e) Swap agreements. The Portfolio invests in swaps for the purpose of managing its exposure to interest rate, credit or market risk, or for other purposes. The use of swaps involves risks that are different from those associated with other portfolio transactions. Swap agreements are privately negotiated in the over-the-counter market (“OTC Swaps”) or may be executed on a registered exchange (“Centrally Cleared Swaps”). Unlike Centrally Cleared Swaps, the Portfolio has credit exposure to the counterparties of OTC Swaps.
Swap contracts are marked-to-market daily and changes in value are recorded as unrealized appreciation (depreciation). The daily change in valuation of Centrally Cleared Swaps, if any, is recorded as a receivable or payable for variation margin on the Statement of Assets and Liabilities. Gains or losses are realized upon termination of the swap agreement. Collateral, in the form of restricted cash or securities, may be required to be held in segregated accounts with the Portfolio’s custodian in compliance with the terms of the swap contracts. Securities posted as collateral for swap contracts are identified in the Schedule
| | |
| 32 | | Western Asset Variable High Income Portfolio 2014 Semi-Annual Report |
of Investments and restricted cash, if any, is identified on the Statement of Assets and Liabilities. Risks may exceed amounts recorded in the Statement of Assets and Liabilities. These risks include changes in the returns of the underlying instruments, failure of the counterparties to perform under the contracts’ terms, and the possible lack of liquidity with respect to the swap agreements.
OTC swap payments received or made at the beginning of the measurement period are reflected as a premium or deposit, respectively, on the Statement of Assets and Liabilities. These upfront payments are amortized over the life of the swap and are recognized as realized gain or loss in the Statement of Operations. Net periodic payments received or paid by the Portfolio are recognized as a realized gain or loss in the Statement of Operations.
The Portfolio’s maximum exposure in the event of a defined credit event on a credit default swap to sell protection is the notional amount. As of June 30, 2014, the Portfolio did not hold any credit default swaps to sell protection.
For average notional amounts of swaps held during the six months ended June 30, 2014, see Note 4.
Credit default swaps
The Portfolio enters into credit default swap (“CDS”) contracts for investment purposes, to manage its credit risk or to add leverage. CDS agreements involve one party making a stream of payments to another party in exchange for the right to receive a specified return in the event of a default by a third party, typically corporate or sovereign issuers, on a specified obligation, or in the event of a write-down, principal shortfall, interest shortfall or default of all or part of the referenced entities comprising a credit index. The Portfolio may use a CDS to provide protection against defaults of the issuers (i.e., to reduce risk where the Portfolio has exposure to an issuer) or to take an active long or short position with respect to the likelihood of a particular issuer’s default. As a seller of protection, the Portfolio generally receives an upfront payment or a stream of payments throughout the term of the swap provided that there is no credit event. If the Portfolio is a seller of protection and a credit event occurs, as defined under the terms of that particular swap agreement, the maximum potential amount of future payments (undiscounted) that the Portfolio could be required to make under a credit default swap agreement would be an amount equal to the notional amount of the agreement. These amounts of potential payments will be partially offset by any recovery of values from the respective referenced obligations. As a seller of protection, the Portfolio effectively adds leverage to its portfolio because, in addition to its total net assets, the Portfolio is subject to investment exposure on the notional amount of the swap. As a buyer of protection, the Portfolio generally receives an amount up to the notional value of the swap if a credit event occurs.
Implied spreads are the theoretical prices a lender receives for credit default protection. When spreads rise, market perceived credit risk rises and when spreads fall, market perceived credit risk falls. The implied credit spread of a particular referenced entity reflects the cost of buying/selling protection and may include upfront payments required to enter
into the agreement. Wider credit spreads and decreasing market values, when compared to
| | |
| Western Asset Variable High Income Portfolio 2014 Semi-Annual Report | | 33 |
Notes to financial statements (cont’d) (unaudited)
the notional amount of the swap, represent a deterioration of the referenced entity’s credit soundness and a greater likelihood or risk of default or other credit event occurring as defined under the terms of the agreement. Credit spreads utilized in determining the period end market value of credit default swap agreements on corporate or sovereign issues are disclosed in the Notes to Financial Statements and serve as an indicator of the current status of the payment/performance risk and represent the likelihood or risk of default for credit derivatives. For credit default swap agreements on asset-backed securities and credit indices, the quoted market prices and resulting values, particularly in relation to the notional amount of the contract as well as the annual payment rate, serve as an indication of the current status of the payment/performance risk.
The Portfolio’s maximum risk of loss from counterparty risk, as the protection buyer, is the fair value of the contract (this risk is mitigated by the posting of collateral by the counterparty to the Portfolio to cover the Portfolio’s exposure to the counterparty). As the protection seller, the Portfolio’s maximum risk is the notional amount of the contract. Credit default swaps are considered to have credit risk-related contingent features since they require payment by the protection seller to the protection buyer upon the occurrence of a defined credit event.
Entering into a CDS agreement involves, to varying degrees, elements of credit, market and documentation risk in excess of the related amounts recognized on the Statement of Assets and Liabilities. Such risks involve the possibility that there will be no liquid market for these agreements, that the counterparty to the agreement may default on its obligation to perform or disagree as to the meaning of the contractual terms in the agreement, and that there will be unfavorable changes in net interest rates.
(f) Loan participations. The Portfolio may invest in loans arranged through private negotiation between one or more financial institutions. The Portfolio’s investment in any such loan may be in the form of a participation in or an assignment of the loan. In connection with purchasing participations, the Portfolio generally will have no right to enforce compliance by the borrower with the terms of the loan agreement related to the loan, or any rights of off-set against the borrower and the Portfolio may not benefit directly from any collateral supporting the loan in which it has purchased the participation.
The Portfolio assumes the credit risk of the borrower, the lender that is selling the participation and any other persons interpositioned between the Portfolio and the borrower. In the event of the insolvency of the lender selling the participation, the Portfolio may be treated as a general creditor of the lender and may not benefit from any off-set between the lender and the borrower.
(g) Unfunded loan commitments. The Portfolio may enter into certain credit agreements where all or a portion of which may be unfunded. The Portfolio is obligated to fund these commitments at the borrower’s discretion. The commitments are disclosed in the accompanying Schedule of Investments. As of June 30, 2014, the Portfolio had no unfunded loan commitments outstanding.
| | |
| 34 | | Western Asset Variable High Income Portfolio 2014 Semi-Annual Report |
(h) Credit and market risk. The Portfolio invests in high-yield and emerging market instruments that are subject to certain credit and market risks. The yields of high-yield and emerging market debt obligations reflect, among other things, perceived credit and market risks. The Portfolio’s investments in securities rated below investment grade typically involve risks not associated with higher rated securities including, among others, greater risk related to timely and ultimate payment of interest and principal, greater market price volatility and less liquid secondary market trading. The consequences of political, social, economic or diplomatic changes may have disruptive effects on the market prices of investments held by the Portfolio. The Portfolio’s investments in non-U.S. dollar denominated securities may also result in foreign currency losses caused by devaluations and exchange rate fluctuations.
(i) Foreign investment risks. The Portfolio’s investments in foreign securities may involve risks not present in domestic investments. Since securities may be denominated in foreign currencies, may require settlement in foreign currencies or pay interest or dividends in foreign currencies, changes in the relationship of these foreign currencies to the U.S. dollar can significantly affect the value of the investments and earnings of the Portfolio. Foreign investments may also subject the Portfolio to foreign government exchange restrictions, expropriation, taxation or other political, social or economic developments, all of which affect the market and/or credit risk of the investments.
(j) Counterparty risk and credit-risk-related contingent features of derivative instruments. The Portfolio may invest in certain securities or engage in other transactions, where the Portfolio is exposed to counterparty credit risk in addition to broader market risks. The Portfolio may invest in securities of issuers, which may also be considered counterparties as trading partners in other transactions. This may increase the risk of loss in the event of default or bankruptcy by the counterparty or if the counterparty otherwise fails to meet its contractual obligations. The Portfolio’s investment manager attempts to mitigate counterparty risk by (i) periodically assessing the creditworthiness of its trading partners, (ii) monitoring and/or limiting the amount of its net exposure to each individual counterparty based on its assessment and (iii) requiring collateral from the counterparty for certain transactions. Market events and changes in overall economic conditions may impact the assessment of such counterparty risk by the investment manager. In addition, declines in the values of underlying collateral received may expose the Portfolio to increased risk of loss.
The Portfolio has entered into master agreements with certain of its derivative counterparties that provide for general obligations, representations, agreements, collateral, events of default or termination and credit related contingent features. The credit related contingent features include, but are not limited to, a percentage decrease in the Portfolio’s net assets or NAV over a specified period of time. If these credit related contingent features were triggered, the derivatives counterparty could terminate the positions and demand payment or require additional collateral.
| | |
| Western Asset Variable High Income Portfolio 2014 Semi-Annual Report | | 35 |
Notes to financial statements (cont’d) (unaudited)
Collateral requirements differ by type of derivative. Collateral or margin requirements are set by the broker or exchange clearing house for exchange traded derivatives while collateral terms are contract specific for over-the-counter traded derivatives. Cash collateral that has been pledged to cover obligations of the Portfolio under derivative contracts, if any, will be reported separately in the Statement of Assets and Liabilities. Securities pledged as collateral, if any, for the same purpose are noted in the Schedule of Investments.
Absent an event of default by the counterparty or a termination of the agreement, the terms of the master agreements do not result in an offset of reported amounts of financial assets and financial liabilities in the Statement of Assets and Liabilities across transactions between the Portfolio and the applicable counterparty. The enforceability of the right to offset may vary by jurisdiction.
As of June 30, 2014, the Portfolio did not have any open derivative transactions with credit related contingent features in a net liability position.
(k) Security transactions and investment income. Security transactions are accounted for on a trade date basis. Interest income, adjusted for amortization of premium and accretion of discount, is recorded on the accrual basis. Dividend income is recorded on the ex-dividend date. Foreign dividend income is recorded on the ex-dividend date or as soon as practicable after the Portfolio determines the existence of a dividend declaration after exercising reasonable due diligence. The cost of investments sold is determined by use of the specific identification method. To the extent any issuer defaults or a credit event occurs that impacts the issuer, the Portfolio may halt any additional interest income accruals and consider the realizability of interest accrued up to the date of default or credit event.
(l) Distributions to shareholders. Distributions from net investment income and distributions of net realized gains, if any, are declared at least annually. Distributions to shareholders of the Portfolio are recorded on the ex-dividend date and are determined in accordance with income tax regulations, which may differ from GAAP.
(m) Compensating balance arrangements. The Portfolio has an arrangement with its custodian bank whereby a portion of the custodian’s fees is paid indirectly by credits earned on the Portfolio’s cash on deposit with the bank.
(n) Federal and other taxes. It is the Portfolio’s policy to comply with the federal income and excise tax requirements of the Internal Revenue Code of 1986 (the “Code”), as amended, applicable to regulated investment companies. Accordingly, the Portfolio intends to distribute its taxable income and net realized gains, if any, to shareholders in accordance with timing requirements imposed by the Code. Therefore, no federal or state income tax provision is required in the Portfolio’s financial statements.
Management has analyzed the Portfolio’s tax positions taken on income tax returns for all open tax years and has concluded that as of June 30, 2014, no provision for income tax is required in the Portfolio’s financial statements. The Portfolio’s federal and state income and
| | |
| 36 | | Western Asset Variable High Income Portfolio 2014 Semi-Annual Report |
federal excise tax returns for tax years for which the applicable statutes of limitations have not expired are subject to examination by the Internal Revenue Service and state departments of revenue.
Under the applicable foreign tax laws, a withholding tax may be imposed on interest, dividends and capital gains at various rates.
(o) Reclassification. GAAP requires that certain components of net assets be reclassified to reflect permanent differences between financial and tax reporting. These reclassifications have no effect on net assets or net asset value per share.
2. Investment management agreement and other transactions with affiliates
Legg Mason Partners Fund Advisor, LLC (“LMPFA”) is the Portfolio’s investment manager. Western Asset Management Company (“Western Asset”) and Western Asset Management Company Limited (“Western Asset Limited”) are the Portfolio’s subadvisers. LMPFA, Western Asset and Western Asset Limited are wholly-owned subsidiaries of Legg Mason, Inc. (“Legg Mason”).
Under the investment management agreement, the Portfolio pays an investment management fee, calculated daily and paid monthly, at an annual rate of 0.60% of the Portfolio’s average daily net assets.
LMPFA provides administrative and certain oversight services to the Portfolio. LMPFA delegates to the subadviser the day-to-day portfolio management of the Portfolio. Western Asset Limited provides certain subadvisory services related to currency transactions and investments in non-U.S. dollar-denominated securities and related foreign currency instruments. For its services, LMPFA pays Western Asset 70% of the net management fee it receives from the Portfolio. In turn, Western Asset pays Western Asset Limited a subadvisory fee of 0.30% on the assets managed by Western Asset Limited.
As a result of an expense limitation arrangement between the Portfolio and LMPFA, the ratio of expenses other than brokerage, interest, taxes, extraordinary expenses and acquired fund fees and expenses, to average net assets of the Portfolio did not exceed 1.00%. This expense limitation arrangement cannot be terminated prior to December 31, 2015 without the Board of Trustees’ consent.
The investment manager is permitted to recapture amounts waived or reimbursed to a class during the same fiscal year if the class’ total annual operating expenses have fallen to a level below the expense limitation (“expense cap”) in effect at the time the fees were earned or the expenses incurred. In no case will the investment manager recapture any amount that would result, on any particular business day of the Portfolio, in the class’ total annual operating expenses exceeding the expense cap or any other lower limit then in effect.
Legg Mason Investor Services, LLC, a wholly-owned broker-dealer subsidiary of Legg Mason, serves as the Portfolio’s sole and exclusive distributor.
| | |
| Western Asset Variable High Income Portfolio 2014 Semi-Annual Report | | 37 |
Notes to financial statements (cont’d) (unaudited)
All officers and one Trustee of the Trust are employees of Legg Mason or its affiliates and do not receive compensation from the Trust.
3. Investments
During the six months ended June 30, 2014, the aggregate cost of purchases and proceeds from sales of investments (excluding short-term investments) and U.S. Government & Agency Obligations were as follows:
| | | | | | | | |
| | | Investments | | | U.S. Government & Agency Obligations | |
| Purchases | | $ | 40,035,824 | | | | — | |
| Sales | | | 46,294,818 | | | $ | 68,750 | |
At June 30, 2014, the aggregate gross unrealized appreciation and depreciation of investments for federal income tax purposes were substantially as follows:
| | | | |
| Gross unrealized appreciation | | $ | 6,131,474 | |
| Gross unrealized depreciation | | | (1,746,210) | |
| Net unrealized appreciation | | $ | 4,385,264 | |
At June 30, 2014, the Portfolio had the following open forward foreign currency contracts:
| | | | | | | | | | | | | | | | | | | | |
| Foreign Currency | | Counterparty | | | Local Currency | | | Market Value | | | Settlement Date | | | Unrealized Appreciation | |
| Contracts to Sell: | | | | | | | | | | | | | | | | | | | | |
| Euro | | | Royal Bank of Scotland PLC | | | | 1,304,000 | | | $ | 1,785,857 | | | | 8/14/14 | | | $ | 29,373 | |
At June 30, 2014, the Portfolio had the following open swap contract:
| | | | | | | | | | | | | | | | | | | | | | |
| CENTRALLY CLEARED CREDIT DEFAULT SWAPS ON CREDIT INDICES — BUY PROTECTION1 | |
Swap Counterparty (Reference Entity) | | Notional Amount2 | | | Termination Date | | | Periodic Payments Made by
the Portfolio† | | Market Value3 | | | Upfront Premiums Paid (Received) | | | Unrealized Depreciation | |
Credit Suisse (Markit CDX.NA.HY.22 Index) | | $ | 4,059,000 | | | | 6/20/19 | | | 5.000% quarterly | | $ | (352,838) | | | $ | (293,527) | | | $ | (59,311) | |
| 1 | If the Portfolio is a buyer of protection and a credit event occurs, as defined under the terms of that particular swap agreement, the Portfolio will either (i) receive from the seller of protection an amount equal to the notional amount of the swap and deliver the referenced obligation or the underlying securities comprising the referenced index or (ii) receive a net settlement amount in the form of cash or securities equal to the notional amount of the swap less the recovery value of the referenced obligation or the underlying securities comprising the referenced index. |
| 2 | The maximum potential amount the Portfolio could be required to pay as a seller of credit protection or receive as a buyer of credit protection if a credit event occurs as defined under the terms of that particular swap agreement. |
| 3 | The quoted market prices and resulting values for credit default swap agreements on asset-backed securities and credit indices serve as an indicator of the current status of the payment/performance risk and represent the likelihood of an expected liability (or profit) for the credit derivative should the notional amount of the swap agreement be closed/sold as of the period end. Decreasing market values (sell protection) or increasing market values (buy protection) when compared to the notional amount of the swap, represent a deterioration of the referenced entity’s credit soundness and a greater likelihood or risk of default or other credit event occurring as defined under the terms of the agreement. |
| † | Percentage shown is an annual percentage rate. |
| | |
| 38 | | Western Asset Variable High Income Portfolio 2014 Semi-Annual Report |
4. Derivative instruments and hedging activities
GAAP requires enhanced disclosure about an entity’s derivative and hedging activities.
Below is a table, grouped by derivative type, that provides information about the fair value and the location of derivatives within the Statement of Assets and Liabilities at June 30, 2014.
| | | | |
| ASSET DERIVATIVES1 | |
| | | Foreign Exchange Risk | |
| Forward foreign currency contracts | | $ | 29,373 | |
| | | | |
| LIABILITY DERIVATIVES1 | |
| | | Credit Risk | |
| Centrally cleared swap contracts2 | | $ | 59,311 | |
| 1 | Generally, the balance sheet location for asset derivatives is receivables/net unrealized appreciation (depreciation) and for liability derivatives is payables/net unrealized appreciation (depreciation). |
| 2 | Includes cumulative appreciation (depreciation) of centrally cleared swap contracts as reported in the footnotes. Only variation margin is reported within the receivables and/or payables on the Statement of Assets and Liabilities. |
The following tables provide information about the effect of derivatives and hedging activities on the Portfolio’s Statement of Operations for the six months ended June 30, 2014. The first table provides additional detail about the amounts and sources of gains (losses) realized on derivatives during the period. The second table provides additional information about the change in unrealized appreciation (depreciation) resulting from the Portfolio’s derivatives and hedging activities during the period.
| | | | | | | | | | | | |
| AMOUNT OF REALIZED GAIN (LOSS) ON DERIVATIVES RECOGNIZED | |
| | | Foreign Exchange Risk | | | Credit Risk | | | Total | |
| Swap contracts | | | — | | | $ | (123,224) | | | $ | (123,224) | |
| Forward foreign currency contracts1 | | $ | (58,941) | | | | — | | | | (58,941) | |
| Total | | $ | (58,941) | | | $ | (123,224) | | | $ | (182,165) | |
| 1 | Net realized gain (loss) from forward foreign currency contracts is reported in net realized gain (loss) from foreign currency transactions in the Statement of Operations. |
| | | | | | | | | | | | |
| CHANGE IN UNREALIZED APPRECIATION (DEPRECIATION) ON DERIVATIVES RECOGNIZED | |
| | | Foreign Exchange Risk | | | Credit Risk | | | Total | |
| Swap contracts | | | — | | | $ | 33,839 | | | $ | 33,839 | |
| Forward foreign currency contracts1 | | $ | 66,528 | | | | — | | | | 66,528 | |
| Total | | $ | 66,528 | | | $ | 33,839 | | | $ | 100,367 | |
| 1 | The change in unrealized appreciation (depreciation) from forward foreign currency contracts is reported in the change in net unrealized appreciation (depreciation) from foreign currencies in the Statement of Operations. |
| | |
| Western Asset Variable High Income Portfolio 2014 Semi-Annual Report | | 39 |
Notes to financial statements (cont’d) (unaudited)
During the six months ended June 30, 2014, the volume of derivative activity for the Portfolio was as follows:
| | | | |
| | | Average
Market Value | |
| Forward foreign currency contracts (to buy)1 | | $ | 88,737 | |
| Forward foreign currency contracts (to sell) | | | 1,877,484 | |
| |
| | | Average
Notional Balance | |
| Credit default swap contracts (to buy protection) | | $ | 4,088,286 | |
| 1 | At June 30, 2014, there were no open positions held in this derivative. |
The following table presents by financial instrument, the Portfolio’s derivative assets net of the related collateral received by the Portfolio at June 30, 2014:
| | | | | | | | | | | | |
| | | Gross Amount of Derivative Assets in the Statement of Assets and Liabilities1 | | | Collateral Received | | | Net Amount | |
| Forward foreign currency contracts | | $ | 29,373 | | | | — | | | $ | 29,373 | |
| Centrally cleared swap contracts2 | | | 4,451 | | | | — | | | | 4,451 | |
| Total | | $ | 33,824 | | | | — | | | $ | 33,824 | |
| 1 | Absent an event of default or early termination, derivative assets and liabilities are presented gross and not offset in the Statement of Assets and Liabilities. |
| 2 | Amount represents the current day’s variation margin as reported in the Statement of Assets and Liabilities. It differs from the cumulative appreciation (depreciation) presented in the previous table. |
5. Shares of beneficial interest
At June 30, 2014, the Trust had an unlimited number of shares of beneficial interest authorized with a par value of $0.00001 per share.
Transactions in shares of the Portfolio were as follows:
| | | | | | | | |
| | | Six Months Ended
June 30, 2014 | | | Year Ended
December 31, 2013 | |
| Shares sold | | | 76,729 | | | | 277,241 | |
| Shares issued on reinvestment | | | 47,245 | | | | 1,294,276 | |
| Shares repurchased | | | (1,761,573) | | | | (3,772,828) | |
| Net decrease | | | (1,637,599) | | | | (2,201,311) | |
6. Capital loss carryforward
As of December 31, 2013, the Portfolio had the following net capital loss carryforwards remaining:
| | | | |
| Year of Expiration | | Amount | |
| 12/31/2015 | | $ | (8,961,078) | |
| 12/31/2016 | | | (20,466,624) | |
| 12/31/2018 | | | (3,098,143) | |
| | | $ | (32,525,845) | |
These amounts will be available to offset any future taxable capital gains.
| | |
| 40 | | Western Asset Variable High Income Portfolio 2014 Semi-Annual Report |
Western Asset
Variable High Income Portfolio
Trustees
Elliott J. Berv
Jane F. Dasher
Mark T. Finn
Kenneth D. Fuller
President
Stephen R. Gross
Richard E. Hanson, Jr.
Diana R. Harrington
Chair
Susan M. Heilbron
Susan B. Kerley
Alan G. Merten
R. Richardson Pettit
Investment manager
Legg Mason Partners Fund Advisor, LLC
Subadvisers
Western Asset Management Company
Western Asset Management Company Limited
Distributor
Legg Mason Investor Services, LLC
Custodian
State Street Bank and Trust Company
Transfer agent*
Boston Financial Data Services, Inc. 2000 Crown Colony Drive Quincy, MA 02169
Independent registered public accounting firm
KPMG LLP 345 Park Avenue New York, NY 10154
| * | Effective on or about September 8, 2014, BNY Mellon Investment Servicing (US) Inc. will serve as the Portfolio’s transfer agent. |
Western Asset Variable High Income Portfolio
The Portfolio is a separate investment series of Legg Mason Partners Variable Income Trust, a Maryland statutory trust.
Western Asset Variable High Income Portfolio
Legg Mason Funds
620 Eighth Avenue, 49th Floor
New York, NY 10018
The Portfolio files its complete schedule of portfolio holdings with the Securities and Exchange Commission (“SEC”) for the first and third quarters of each fiscal year on Form N-Q. The Portfolio’s Forms N-Q are available on the SEC’s website at www.sec.gov. The Portfolio’s Forms N-Q may be reviewed and copied at the SEC’s Public Reference Room in Washington, D.C., and information on the operation of the Public Reference Room may be obtained by calling 1-800-SEC-0330. To obtain information on Form N-Q, shareholders can call the Portfolio at 1-887-721-1926.
Information on how the Portfolio voted proxies relating to portfolio securities during the prior 12-month period ended June 30th of each year and a description of the policies and procedures that the Portfolio uses to determine how to vote proxies related to portfolio transactions are available (1) without charge, upon request, by calling the Portfolio at 1-887-721-1926, (2) on the Portfolio’s website at www.leggmason.com/individualinvestors and (3) on the SEC’s website at www.sec.gov.
This report is submitted for the general information of the shareholders of Western Asset Variable High Income Portfolio. This report is not authorized for distribution to prospective investors in the Portfolio unless preceded or accompanied by a current prospectus.
Investors should consider the Portfolio’s investment objectives, risks, charges and expenses carefully before investing. The prospectus contains this and other important information about the Portfolio. Please read the prospectus carefully before investing.
www.leggmason.com/individualinvestors
©2014 Legg Mason Investor Services, LLC
Member FINRA, SIPC
Legg Mason Funds Privacy and Security Notice
Your Privacy and the Security of Your Personal Information is Very Important to the Legg Mason Funds
This Privacy and Security Notice (the “Privacy Notice”) addresses the Legg Mason Funds’ privacy and data protection practices with respect to nonpublic personal information the Funds receive. The Legg Mason Funds include any funds sold by the Funds’ distributor, Legg Mason Investor Services, LLC, as well as Legg Mason-sponsored closed-end funds and certain closed-end funds managed or sub-advised by Legg Mason or its affiliates. The provisions of this Privacy Notice apply to your information both while you are a shareholder and after you are no longer invested with the Funds.
The Type of Nonpublic Personal Information the Funds Collect About You
The Funds collect and maintain nonpublic personal information about you in connection with your shareholder account. Such information may include, but is not limited to:
| Ÿ | | Personal information included on applications or other forms; |
| Ÿ | | Account balances, transactions, and mutual fund holdings and positions; |
| Ÿ | | Online account access user IDs, passwords, security challenge question responses; and |
| Ÿ | | Information received from consumer reporting agencies regarding credit history and creditworthiness (such as the amount of an individual’s total debt, payment history, etc.). |
How the Funds Use Nonpublic Personal Information About You
The Funds do not sell or share your nonpublic personal information with third parties or with affiliates for their marketing purposes, or with other financial institutions or affiliates for joint marketing purposes, unless you have authorized the Funds to do so. The Funds do not disclose any nonpublic personal information about you except as may be required to perform transactions or services you have authorized or as permitted or required by law. The Funds may disclose information about you to:
| Ÿ | | Employees, agents, and affiliates on a “need to know” basis to enable the Funds to conduct ordinary business or comply with obligations to government regulators; |
| Ÿ | | Service providers, including the Funds’ affiliates, who assist the Funds as part of the ordinary course of business (such as printing, mailing services, or processing or servicing your account with us) or otherwise perform services on the Funds’ behalf, including companies that may perform marketing services solely for the Funds; |
| Ÿ | | The Funds’ representatives such as legal counsel, accountants and auditors; and |
| Ÿ | | Fiduciaries or representatives acting on your behalf, such as an IRA custodian or trustee of a grantor trust. |
|
| NOT PART OF THE SEMI-ANNUAL REPORT |
Legg Mason Funds Privacy and Security Notice (cont’d)
Except as otherwise permitted by applicable law, companies acting on the Funds’ behalf are contractually obligated to keep nonpublic personal information the Funds provide to them confidential and to use the information the Funds share only to provide the services the Funds ask them to perform.
The Funds may disclose nonpublic personal information about you when necessary to enforce their rights or protect against fraud, or as permitted or required by applicable law, such as in connection with a law enforcement or regulatory request, subpoena, or similar legal process. In the event of a corporate action or in the event a Fund service provider changes, the Funds may be required to disclose your nonpublic personal information to third parties. While it is the Funds’ practice to obtain protections for disclosed information in these types of transactions, the Funds cannot guarantee their privacy policy will remain unchanged.
Keeping You Informed of the Funds’ Privacy and Security Practices
The Funds will notify you annually of their privacy policy as required by federal law. While the Funds reserve the right to modify this policy at any time they will notify you promptly if this privacy policy changes.
The Funds’ Security Practices
The Funds maintain appropriate physical, electronic and procedural safeguards designed to guard your nonpublic personal information. The Funds’ internal data security policies restrict access to your nonpublic personal information to authorized employees, who may use your nonpublic personal information for Fund business purposes only.
Although the Funds strive to protect your nonpublic personal information, they cannot ensure or warrant the security of any information you provide or transmit to them, and you do so at your own risk. In the event of a breach of the confidentiality or security of your nonpublic personal information, the Funds will attempt to notify you as necessary so you can take appropriate protective steps. If you have consented to the Funds using electronic communications or electronic delivery of statements, they may notify you under such circumstances using the most current email address you have on record with them.
In order for the Funds to provide effective service to you, keeping your account information accurate is very important. If you believe that your account information is incomplete, not accurate or not current, or if you have questions about the Funds’ privacy practices, write the Funds using the contact information on your account statements, email the Funds by clicking on the Contact Us section of the Funds’ website at www.leggmason.com, or contact the Fund at 1-877-721-1926.
Revised April 2011
|
| NOT PART OF THE SEMI-ANNUAL REPORT |
www.leggmason.com/individualinvestors
©2014 Legg Mason Investor Services, LLC Member FINRA, SIPC
FD04231 8/14 SR14-2268
| | |
| ITEM 2. | | CODE OF ETHICS. |
| |
| | Not applicable. |
| |
| ITEM 3. | | AUDIT COMMITTEE FINANCIAL EXPERT. |
| |
| | Not applicable. |
| |
| ITEM 4. | | PRINCIPAL ACCOUNTANT FEES AND SERVICES. |
| |
| | Not applicable. |
| |
| ITEM 5. | | AUDIT COMMITTEE OF LISTED REGISTRANTS. |
| |
| | Not applicable. |
| |
| ITEM 6. | | SCHEDULE OF INVESTMENTS. |
| |
| | Included herein under Item 1. |
| |
| ITEM 7. | | DISCLOSURE OF PROXY VOTING POLICIES AND PROCEDURES FOR CLOSED-END MANAGEMENT INVESTMENT COMPANIES. |
| |
| | Not applicable. |
| |
| ITEM 8. | | PORTFOLIO MANAGERS OF CLOSED-END MANAGEMENT INVESTMENT COMPANIES. |
| |
| | Not applicable. |
| |
| ITEM 9. | | PURCHASES OF EQUITY SECURITIES BY CLOSED-END MANAGEMENT INVESTMENT COMPANY AND AFFILIATED PURCHASERS. |
| |
| | Not applicable. |
| |
| ITEM 10. | | SUBMISSION OF MATTERS TO A VOTE OF SECURITY HOLDERS. |
| |
| | Not applicable. |
| |
| ITEM 11. | | CONTROLS AND PROCEDURES. |
| |
| | (a) The registrant’s principal executive officer and principal financial officer have concluded that the registrant’s disclosure controls and procedures (as defined in Rule 30a- 3(c) under the Investment Company Act of 1940, as amended (the “1940 Act”)) are effective as of a date within 90 days of the filing date of this report that includes the disclosure required by this paragraph, based on their evaluation of the disclosure controls and procedures required by Rule 30a-3(b) under the 1940 Act and 15d-15(b) under the Securities Exchange Act of 1934. |
| |
| | (b) There were no changes in the registrant’s internal control over financial reporting (as defined in Rule 30a-3(d) under the 1940 Act) that occurred during the second fiscal quarter of the period covered by this report that have materially affected, or are likely to materially affect the registrant’s internal control over financial reporting |
| | |
| ITEM 12. | | EXHIBITS. |
| |
| | (a) (1) Not applicable. |
| | Exhibit 99.CODE ETH |
| |
| | (a) (2) Certifications pursuant to section 302 of the Sarbanes-Oxley Act of 2002 attached hereto. Exhibit 99.CERT |
| |
| | (b) Certifications pursuant to Section 906 of the Sarbanes-Oxley Act of 2002 attached hereto. Exhibit 99.906CERT |
SIGNATURES
Pursuant to the requirements of the Securities Exchange Act of 1934 and the Investment Company Act of 1940, the registrant has duly caused this Report to be signed on its behalf by the undersigned, there unto duly authorized.
Legg Mason Partners Variable Income Trust
| | |
| By: | | /s/ Kenneth D. Fuller |
| | Kenneth D. Fuller |
| | Chief Executive Officer |
| |
| Date: | | August 21, 2014 |
Pursuant to the requirements of the Securities Exchange Act of 1934 and the Investment Company Act of 1940, this report has been signed below by the following persons on behalf of the registrant and in the capacities and on the dates indicated.
| | |
| By: | | /s/ Kenneth D. Fuller |
| | Kenneth D. Fuller |
| | Chief Executive Officer |
| |
| Date: | | August 21, 2014 |
| | |
| By: | | /s/ Richard F. Sennett |
| | Richard F. Sennett |
| | Principal Financial Officer |
| |
| Date: | | August 21, 2014 |