UNITED STATES
SECURITIES AND EXCHANGE COMMISSION
Washington, D.C. 20549
FORM N-CSR
CERTIFIED SHAREHOLDER REPORT OF REGISTERED
MANAGEMENT INVESTMENT COMPANIES
Investment Company Act file number 811-06310
Legg Mason Partners Variable Income Trust
(Exact name of registrant as specified in charter)
620 Eighth Avenue, 49th Floor, New York, NY 10018
(Address of principal executive offices) (Zip code)
Robert I. Frenkel, Esq.
Legg Mason & Co., LLC
100 First Stamford Place
Stamford, CT 06902
(Name and address of agent for service)
Registrant’s telephone number, including area code: 1-877-721-1926
Date of fiscal year end: December 31
Date of reporting period: June 30, 2015
| ITEM 1. | REPORT TO STOCKHOLDERS. |
The Semi-Annual Report to Stockholders is filed herewith.

| | |
| Semi-Annual Report | | June 30, 2015 |
WESTERN ASSET
CORE PLUS VIT PORTFOLIO

|
| INVESTMENT PRODUCTS: NOT FDIC INSURED • NO BANK GUARANTEE • MAY LOSE VALUE |
Portfolio objective
The Portfolio seeks to maximize total return, consistent with prudent investment management and liquidity needs, by investing to obtain a dollar-weighted average effective duration that is normally within 30% of the average duration of the domestic bond market as a whole.
Letter from the president

Dear Shareholder,
We are pleased to provide the semi-annual report of Western Asset Core Plus VIT Portfolio for the six-month reporting period ended June 30, 2015. Please read on for Portfolio performance information and a detailed look at prevailing economic and market conditions during the Portfolio’s reporting period.
I am pleased to introduce myself as the new President and Chief Executive Officer of the Portfolio, succeeding Kenneth D. Fuller. I am honored to have been appointed to my new role. During my 27 year career with Legg Mason, I have seen the investment management industry evolve and expand. Throughout these changes, maintaining an unwavering focus on our shareholders and their needs has remained paramount.
Special shareholder notice:
Effective April 15, 2015, the Portfolio’s name, investment objective, 80% investment policy, principal investment strategies, management fee, benchmark and portfolio management team were changed. In addition, two affiliates of the Portfolio’s subadviser were made additional subadvisers. Please see the Portfolio’s prospectus dated May 1, 2015 for additional information.
As always, we remain committed to providing you with excellent service and a full spectrum of investment choices. We also remain committed to supplementing the support you receive from your financial advisor. One way we accomplish this is through our website, www.leggmason.com/individualinvestors. Here you can gain immediate access to market and investment information, including:
| • | | Market insights and commentaries from our portfolio managers and |
| • | | A host of educational resources. |
| | |
| II | | Western Asset Core Plus VIT Portfolio |
We look forward to helping you meet your financial goals.
Sincerely,

Jane Trust, CFA
President and Chief Executive Officer
July 31, 2015
| | |
| Western Asset Core Plus VIT Portfolio | | III |
Investment commentary
Economic review
After a tepid start, the pace of U.S. economic activity improved during the six months ended June 30, 2015 (the “reporting period”). Looking back, the U.S. Department of Commerce’s revised figures showed that fourth quarter 2014 U.S. gross domestic product (“GDP”)i growth was 2.1%. First quarter 2015 GDP growth then moderated to 0.6%. This was attributed to a number of factors, including a deceleration in personal consumption expenditures (“PCE”), along with negative contributions from exports, nonresidential fixed investment, and state and local government spending. However, the economy then gained some traction, as the U.S. Department of Commerce’s initial estimate for second quarter 2015 GDP growth — released after the reporting period ended — was 2.3%. The upturn was driven by an increase in exports, an acceleration in PCE, a deceleration in imports and increased state and local government spending.
Activity in the U.S. manufacturing sector initially moderated and then strengthened during the reporting period. Based on the Institute for Supply Management’s Purchasing Managers’ Index (“PMI”)ii, U.S. manufacturing expanded during all six months of the reporting period (a reading below 50 indicates a contraction, whereas a reading above 50 indicates an expansion).
The labor market was a tailwind for the economy during the reporting period. When the period began, unemployment was 5.7%, as reported by the U.S. Department of Labor. By June 2015, unemployment was 5.3%, its lowest level since April 2008.
Turning to the global economy, in its July 2015 World Economic Outlook Update, released after the reporting period ended, the International Monetary Fund (“IMF”) said “A setback to activity in the first quarter of 2015, mostly in North America, has resulted in a small downward revision to global growth for 2015 relative to the April 2015 World Economic Outlook Update. Nevertheless, the underlying drivers for a gradual acceleration in economic activity in advanced economies — easy financial conditions, more neutral fiscal policy in the euro area, lower fuel prices, and improving confidence and labor market conditions —remain intact.” From a regional perspective, the IMF projects that 2015 growth in the Eurozone will be 1.5%, versus 0.8% in 2014. Japan’s economy is expected to expand 0.8% in 2015, compared to -0.1% in 2014. Elsewhere, the IMF said that overall growth in emerging market countries will decelerate in 2015, with growth of 4.2% versus 4.6% in 2014.
| | |
| IV | | Western Asset Core Plus VIT Portfolio |
Market review
Q. How did the Federal Reserve Board (“Fed”)iii respond to the economic environment?
A. The Fed took a number of actions as it sought to meet its dual mandate of fostering maximum employment and price stability. As it has since December 2008, the Fed maintained the federal funds rateiv at a historically low range between zero and 0.25%. However, in October 2014 the Fed ended its asset purchase program that was announced in December 2012. In December 2014, the Fed said that “it can be patient in beginning to normalize the stance of monetary policy.” At its meeting that ended on April 29, 2015, the Fed said, “…economic growth slowed during the winter months, in part reflecting transitory factors.” Finally, at its meeting that ended on July 29, 2015, after the reporting period ended, the Fed said, “The Committee currently anticipates that, even after employment and inflation are near mandate-consistent levels, economic conditions may, for some time, warrant keeping the target federal funds rate below levels the Committee views as normal in the longer run.”
Q. Did Treasury yields trend higher or lower during the six months ended June 30, 2015?
A. Short-term Treasury yields edged lower, whereas long-term Treasury yields increased during the reporting period. When the reporting period began, the yield on the two-year Treasury note was 0.67%. It peaked at 0.75% on June 10, 2015, and fell as low as 0.44% on January 15, 2015, before ending the period at 0.64%. The yield on the ten-year Treasury note began the period at 2.17% and its peak of 2.50% occurred on June 10, 2015. The yield on the ten-year Treasury note was as low as 1.68% in late January/early February 2015 and concluded the reporting period at 2.35%.
Q. What factors impacted the spread sectors (non-Treasuries) during the reporting period?
A. The spread sectors generally posted positive, albeit small gains, during the reporting period. Performance fluctuated with investor sentiment given the uncertainties regarding future Fed monetary policy, along with concerns over global growth and geopolitical issues. The broad U.S. bond market, as measured by the Barclays U.S. Aggregate Indexv, declined 0.10% during the six months ended June 30, 2015.
Q. How did the high-yield bond market perform over the six months ended June 30, 2015?
A. The U.S. high-yield bond market, as measured by the Barclays U.S. Corporate High Yield — 2% Issuer Cap Indexvi, returned 2.53% for the six months ended June 30, 2015. High yield bonds were volatile during the reporting period. While the underlying fundamentals in the high-yield market remained generally solid and default rates were well below their long-term average, the asset class posted negative returns in March and June 2015 when investor risk aversion increased.
Q. How did the emerging markets debt asset class perform over the reporting period?
A. The JPMorgan Emerging Markets Bond Index Global (“EMBI Global”)vii returned 1.76% during the six months ended June 30, 2015. The asset class rose during the first four months of the reporting period, but those gains were partially offset by weakness in May and June 2015. These setbacks
| | |
| Western Asset Core Plus VIT Portfolio | | V |
Investment commentary (cont’d)
were triggered by a number of factors, including expectations for future Fed rate hikes and geopolitical issues.
Performance review
For the six months ended June 30, 2015, Class I shares of Western Asset Core Plus VIT Portfolio1 returned 1.54% (the Portfolio’s outstanding class of shares, which was previously unnamed, are now known as Class I shares). The Portfolio’s new unmanaged benchmark, the Barclays U.S. Aggregate Index and the former unmanaged benchmark, the Barclays U.S. Corporate High Yield — 2% Issuer Cap Index, returned -0.10% and 2.53%, respectively, for the same period. The Lipper Variable Core Plus Bond Funds Category Average2 returned 0.22% over the same time frame.
| | | | |
Performance Snapshot as of June 30, 2015
(unaudited) | |
| | | 6 months | |
| Western Asset Core Plus VIT Portfolio1: | | | | |
Class I | | | 1.54 | %* |
| Barclays U.S. Aggregate Index | | | -0.10 | % |
Barclays U.S. Corporate High Yield — 2% Issuer Cap Index | | | 2.53 | % |
Lipper Variable Core Plus Bond Funds Category Average2 | | | 0.22 | % |
The performance shown represents past performance. Past performance is no guarantee of future results and current performance may be higher or lower than the performance shown above. Principal value, investment returns and yields will fluctuate and investors’ shares, when redeemed, may be worth more or less than their original cost.
Portfolio return assumes the reinvestment of all distributions, including returns of capital, if any, at net asset value and the deduction of all Portfolio expenses. Performance figures for periods shorter than one year represent cumulative figures and are not annualized.
Portfolio performance figures reflect fee waivers and/or expense reimbursements, without which the performance would have been lower.
The 30-Day SEC Yield for the period ended June 30, 2015 for Class I shares was 2.54%. Absent fee waivers and/or expense reimbursements, the 30-Day SEC Yield for Class I would have been 2.18%. The 30-Day SEC Yield is subject to change and is based on the yield to maturity of the Portfolio’s investments over a 30-day period and not on the dividends paid by the Portfolio, which may differ.
Performance of Class II shares for the six-month period is not shown because the inception date for this share class was May 1, 2015.
Prior to April 15, 2015, the Portfolio was named Western Asset Variable High Income Portfolio, had a different investment objective, used different investment strategies and had a different benchmark index.
| 1 | The Portfolio is an underlying investment option of various variable annuity and variable life insurance products. The Portfolio’s performance returns do not reflect the deduction of expenses imposed in connection with investing in variable annuity or variable life insurance contracts, such as administrative fees, account charges and surrender charges, which, if reflected, would reduce the performance of the Portfolio. Past performance is no guarantee of future results. |
| 2 | Lipper, Inc., a wholly-owned subsidiary of Reuters, provides independent insight on global collective investments. Returns are based on the six-month period ended June 30, 2015, including the reinvestment of all distributions, including returns of capital, if any, calculated among the 34 funds in the Portfolio’s Lipper category. |
| * | The total return includes gains from payment by an affiliate. Without these gains, the total return for Class I shares would have been 1.36%. |
| | |
| VI | | Western Asset Core Plus VIT Portfolio |
| | | | |
| Total Annual Operating Expenses (unaudited) |
As of the Portfolio’s current prospectus dated May 1, 2015, the gross total annual operating expense ratio for Class I shares was 0.65%.
Actual expenses may be higher. For example, expenses may be higher than those shown if average net assets decrease. Net assets are more likely to decrease and Portfolio expense ratios are more likely to increase when markets are volatile.
As a result of expense limitation arrangements, effective April 1, 2015, the ratio of expenses, other than interest, brokerage, taxes, extraordinary expenses and acquired fund fees and expenses, to average net assets is not expected to exceed 0.54% for Class I shares. This expense limitation arrangement cannot be terminated prior to December 31, 2016 without the Board of Trustees’ consent. Prior to April 15, 2015, as a result of an expense limitation arrangement, the ratio of expenses, other than interest, brokerage, taxes, extraordinary expenses and acquired fund fees and expenses, to average net assets of Class I shares did not exceed 1.00%.
The manager is permitted to recapture amounts waived and/or reimbursed to the class during the same fiscal year if the class’ total annual operating expenses have fallen to a level below the expense limitation (“expense cap”) in effect at the time the fees were earned or the expenses incurred. In no case will the manager recapture any amount that would result, on any particular business day of the Portfolio, in the class’ total annual operating expenses exceeding the expense cap or any other lower limit then in effect.
As always, thank you for your confidence in our stewardship of your assets.
Sincerely,
Jane Trust, CFA
President and Chief Executive Officer
July 31, 2015
RISKS: Investments in fixed income securities involve interest rate, credit, inflation and reinvestment risks. As interest rates rise, bond prices fall, reducing the value of the Portfolio’s share price. High-yield bonds, commonly known as “junk bonds,” are rated below investment grade and carry more risk than higher-rated securities. International investments are subject to special risks including currency fluctuations, social, economic and political uncertainties, which could increase volatility. These risks are magnified in emerging markets. Asset-backed, mortgaged-backed or mortgage-related securities are subject to prepayment and extension risks. The Portfolio may use derivatives, such as options and futures, which can be illiquid, may disproportionately increase losses, and have a potentially large impact on Portfolio performance. The use of leverage may increase volatility and possibility of loss. Please see the Portfolio’s prospectuses for a more complete discussion of these and other risks, and the Portfolio’s investment strategies.
All investments are subject to risk including the possible loss of principal. Past performance is no guarantee of future results. All index performance reflects no deduction for fees, expenses or taxes. Please note that an investor cannot invest directly in an index.
| | |
| Western Asset Core Plus VIT Portfolio | | VII |
Investment commentary (cont’d)
The information provided is not intended to be a forecast of future events, a guarantee of future results or investment advice. Views expressed may differ from those of the firm as a whole. Forecasts and predictions are inherently limited and should not be relied upon as an indication of actual or future performance.
| i | Gross domestic product (“GDP”) is the market value of all final goods and services produced within a country in a given period of time. |
| ii | The Institute for Supply Management’s PMI is based on a survey of purchasing executives who buy the raw materials for manufacturing at more than 350 companies. It offers an early reading on the health of the U.S. manufacturing sector. |
| iii | The Federal Reserve Board (“Fed”) is responsible for the formulation of policies designed to promote economic growth, full employment, stable prices and a sustainable pattern of international trade and payments. |
| iv | The federal funds rate is the rate charged by one depository institution on an overnight sale of immediately available funds (balances at the Federal Reserve) to another |
| depository institution; the rate may vary from depository institution to depository institution and from day to day. |
| v | The Barclays U.S. Aggregate Index is a broad-based bond index comprised of government, corporate, mortgage- and asset-backed issues, rated investment grade or higher, and having at least one year to maturity. |
| vi | The Barclays U.S. Corporate High Yield — 2% Issuer Cap Index is an index of the 2% Issuer Cap component of the Barclays U.S. Corporate High Yield Index, which covers the U.S. dollar-denominated, non-investment grade, fixed-rate, taxable corporate bond market. |
| vii | The JPMorgan Emerging Markets Bond Index Global (“EMBI Global”) tracks total returns for U.S. dollar-denominated debt instruments issued by emerging market sovereign and quasi-sovereign entities: Brady bonds, loans, Eurobonds and local market instruments. |
| | |
| VIII | | Western Asset Core Plus VIT Portfolio |
Portfolio at a glance† (unaudited)
Investment breakdown (%) as a percent of total investments
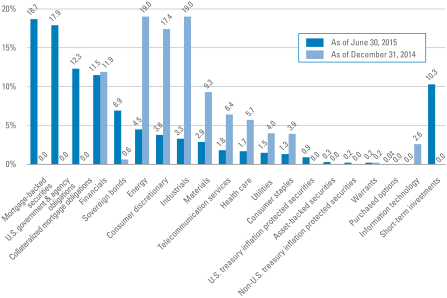
| † | The bar graph above represents the composition of the Portfolio’s investments as of June 30, 2015 and December 31, 2014 and does not include derivatives such as swap contracts, forward foreign currency contracts, futures contracts and written options. The Portfolio is actively managed. As a result, the composition of the Portfolio’s investments is subject to change at any time. |
| ‡ | Represents less than 0.1%. |
| | |
| Western Asset Core Plus VIT Portfolio 2015 Semi-Annual Report | | 1 |
Portfolio expenses (unaudited)
Example
As a shareholder of the Portfolio, you may incur two types of costs: (1) transaction costs and (2) ongoing costs, including management fees; distribution and/or service (12b-1) fees; and other Portfolio expenses. This example is intended to help you understand your ongoing costs (in dollars) of investing in the Portfolio and to compare these costs with the ongoing costs of investing in other mutual funds.
This example is based on an investment of $1,000 invested on January 1, 2015 and held for the six months ended June 30, 2015, unless otherwise noted.
Actual expenses
The table below titled “Based on Actual Total Return” provides information about actual account values and actual expenses. You may use the information provided in this table, together with the amount you invested, to estimate the expenses that you paid over the period. To estimate the expenses you paid on your account, divide your ending account value by $1,000 (for example, an $8,600 ending account value divided by $1,000 = 8.6), then multiply the result by the number under the heading entitled “Expenses Paid During the Period”.
Hypothetical example for comparison purposes
The table below titled “Based on Hypothetical Total Return” provides information about hypothetical account values and hypothetical expenses based on the actual expense ratio and an assumed rate of return of 5.00% per year before expenses, which is not the Portfolio’s actual return. The hypothetical account values and expenses may not be used to estimate the actual ending account balance or expenses you paid for the period. You may use the information provided in this table to compare the ongoing costs of investing in the Portfolio and other funds. To do so, compare the 5.00% hypothetical example relating to the Portfolio with the 5.00% hypothetical examples that appear in the shareholder reports of the other funds.
Please note that the expenses shown in the table below are meant to highlight your ongoing costs only and do not reflect any transactional costs. Therefore, the table is useful in comparing ongoing costs only, and will not help you determine the relative total costs of owning different funds. In addition, if these transaction costs were included, your costs would have been higher.
| | | | | | | | | | | | | | | | | | | | | | | | | | | | | | | | | | | | | | | | | | | | |
| Based on actual total return1 | | | | | Based on hypothetical total return1 | |
| | | Actual
Total
Return2,3 | | | Beginning
Account
Value | | | Ending
Account
Value | | | Annualized
Expense
Ratio | | | Expenses
Paid
During
the
Period | | | | | | | Hypothetical
Annualized
Total Return | | | Beginning
Account
Value | | | Ending
Account
Value | | | Annualized
Expense
Ratio | | | Expenses
Paid
During
the
Period4 | |
| Class I | | | 1.54 | % | | $ | 1,000.00 | | | $ | 1,015.40 | | | | 0.66 | % | | $ | 3.30 | 4 | | | | Class I | | | 5.00 | % | | $ | 1,000.00 | | | $ | 1,021.52 | | | | 0.66 | % | | $ | 3.31 | |
| Class II5 | | | -1.45 | | | | 1,000.00 | | | | 985.50 | | | | 0.76 | | | | 1.20 | 6 | | | | Class II | | | 5.00 | | | | 1,000.00 | | | | 1,021.03 | | | | 0.76 | | | | 3.81 | |
| 1 | For the six months ended June 30, 2015, unless otherwise noted. |
| 2 | Assumes the reinvestment of all distributions, including returns of capital, if any, at net asset value. Total return is not annualized, as it may not be representative of the total return for the year. Total return does not reflect expenses associated with separate accounts such as administrative fees, account charges and surrender charges, which, if reflected would reduce the total return. Performance figures may reflect compensating balance arrangements, fee waivers and/or expense reimbursements. In the absence of compensating balance arrangements, fee waivers and/or expense reimbursements, the total return would have been lower. Past performance is no guarantee of future results. |
| 3 | Total return includes gains from payments by an affiliate. Without these gains, the total return would have been lower. |
| 4 | Expenses (net of compensating balance arrangements, fee waivers and/or expense reimbursements) are equal to each class’ annualized expense ratio multiplied by the average account value over the period, multiplied by the number of days in the most recent fiscal half-year (181), then divided by 365. |
| 5 | For the period May 1, 2015 (inception date) to June 30, 2015. |
| 6 | Expenses (net of compensating balance arrangements, fee waivers and/or expense reimbursements) are equal to the class’ annualized expense ratio multiplied by the average account value over the period, multiplied by the number of days in the most recent fiscal period (58), then divided by 365. |
| | |
| 2 | | Western Asset Core Plus VIT Portfolio 2015 Semi-Annual Report |
Spread duration (unaudited)
Economic exposure — June 30, 2015
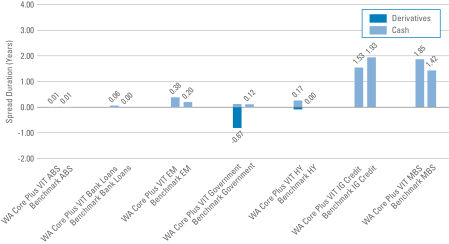
Spread duration measures the sensitivity to changes in spreads. The spread over Treasuries is the annual risk-premium demanded by investors to hold non-Treasury securities. Spread duration is quantified as the % change in price resulting from a 100 basis points change in spreads. For a security with positive spread duration, an increase in spreads would result in a price decline and a decline in spreads would result in a price increase. This chart highlights the market sector exposure of the Portfolio’s sectors relative to the selected benchmark sectors as of the end of the reporting period.
| | |
| Benchmark | | — Barclays U.S. Aggregate Index |
| ABS | | — Asset-Backed Securities |
| EM | | — Emerging Markets |
| HY | | — High Yield |
| IG Credit | | — Investment Grade Credit |
| MBS | | — Mortgage-Backed Securities |
| WA Core Plus VIT | | — Western Asset Core Plus VIT Portfolio |
| | |
| Western Asset Core Plus VIT Portfolio 2015 Semi-Annual Report | | 3 |
Effective duration (unaudited)
Interest rate exposure — June 30, 2015
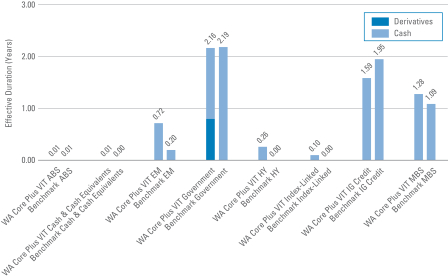
Effective duration measures the sensitivity to changes in relevant interest rates. Effective duration is quantified as the % change in price resulting from a 100 basis points change in interest rates. For a security with positive effective duration, an increase in interest rates would result in a price decline and a decline in interest rates would result in a price increase. This chart highlights the interest rate exposure of the Portfolio’s sectors relative to the selected benchmark sectors as of the end of the reporting period.
| | |
| Benchmark | | — Barclays U.S. Aggregate Index |
| ABS | | — Asset-Backed Securities |
| EM | | — Emerging Markets |
| HY | | — High Yield |
| IG Credit | | — Investment Grade Credit |
| MBS | | — Mortgage-Backed Securities |
| WA Core Plus VIT | | — Western Asset Core Plus VIT Portfolio |
| | |
| 4 | | Western Asset Core Plus VIT Portfolio 2015 Semi-Annual Report |
Schedule of investments (unaudited)
June 30, 2015
Western Asset Core Plus VIT Portfolio
| | | | | | | | | | | | | | | | |
| Security | | Rate | | | Maturity
Date | | | Face
Amount† | | | Value | |
| Corporate Bonds & Notes — 27.3% | | | | | | | | | | | | | | | | |
| Consumer Discretionary — 2.8% | | | | | | | | | | | | | | | | |
Automobiles — 0.7% | | | | | | | | | | | | | | | | |
Ford Motor Co., Senior Notes | | | 4.750 | % | | | 1/15/43 | | | | 150,000 | | | $ | 145,990 | |
General Motors Co., Senior Notes | | | 5.200 | % | | | 4/1/45 | | | | 60,000 | | | | 59,650 | |
General Motors Financial Co. Inc., Senior Notes | | | 4.375 | % | | | 9/25/21 | | | | 390,000 | | | | 405,881 | |
Total Automobiles | | | | | | | | | | | | | | | 611,521 | |
Hotels, Restaurants & Leisure — 0.4% | | | | | | | | | | | | | | | | |
Bossier Casino Venture Holdco Inc., Senior Secured Bonds | | | 14.000 | % | | | 2/9/18 | | | | 433,226 | | | | 406,453 | (a)(b)(c)(d) |
Household Durables — 0.5% | | | | | | | | | | | | | | | | |
Toll Brothers Finance Corp., Senior Notes | | | 6.750 | % | | | 11/1/19 | | | | 50,000 | | | | 55,750 | |
Woodside Homes Co., LLC/Woodside Homes Finance Inc., Senior Notes | | | 6.750 | % | | | 12/15/21 | | | | 380,000 | | | | 361,000 | (a) |
Total Household Durables | | | | | | | | | | | | | | | 416,750 | |
Media — 1.0% | | | | | | | | | | | | | | | | |
Comcast Corp., Senior Notes | | | 3.375 | % | | | 8/15/25 | | | | 70,000 | | | | 69,164 | |
Comcast Corp., Senior Notes | | | 6.950 | % | | | 8/15/37 | | | | 200,000 | | | | 260,514 | |
MediaNews Group Inc. | | | 12.000 | % | | | 12/31/18 | | | | 155,000 | | | | 155,000 | (d) |
New Cotai LLC/New Cotai Capital Corp., Senior Secured Notes | | | 10.625 | % | | | 5/1/19 | | | | 29,551 | | | | 25,709 | (a)(b) |
Time Warner Cable Inc., Debentures | | | 7.300 | % | | | 7/1/38 | | | | 30,000 | | | | 33,901 | |
Time Warner Cable Inc., Senior Notes | | | 5.875 | % | | | 11/15/40 | | | | 200,000 | | | | 194,253 | |
Time Warner Inc., Senior Debentures | | | 7.700 | % | | | 5/1/32 | | | | 100,000 | | | | 131,704 | |
Total Media | | | | | | | | | | | | | | | 870,245 | |
Textiles, Apparel & Luxury Goods — 0.2% | | | | | | | | | | | | | | | | |
Empire Today LLC/Empire Today Finance Corp., Senior Secured Notes | | | 11.375 | % | | | 2/1/17 | | | | 210,000 | | | | 168,000 | (a) |
Total Consumer Discretionary | | | | | | | | | | | | | | | 2,472,969 | |
| Consumer Staples — 1.4% | | | | | | | | | | | | | | | | |
Beverages — 0.6% | | | | | | | | | | | | | | | | |
Anheuser-Busch InBev Worldwide Inc., Senior Notes | | | 2.500 | % | | | 7/15/22 | | | | 200,000 | | | | 192,519 | |
Carolina Beverage Group LLC/Carolina Beverage Group Finance Inc., Secured Notes | | | 10.625 | % | | | 8/1/18 | | | | 200,000 | | | | 197,000 | (a) |
Pernod-Ricard SA, Senior Notes | | | 5.500 | % | | | 1/15/42 | | | | 150,000 | | | | 160,068 | (a) |
Total Beverages | | | | | | | | | | | | | | | 549,587 | |
Food & Staples Retailing — 0.2% | | | | | | | | | | | | | | | | |
CVS Health Corp., Senior Notes | | | 2.750 | % | | | 12/1/22 | | | | 200,000 | | | | 193,125 | |
Food Products — 0.1% | | | | | | | | | | | | | | | | |
Kraft Heinz Foods Co., Senior Notes | | | 3.950 | % | | | 7/15/25 | | | | 70,000 | | | | 70,530 | (a) |
Kraft Heinz Foods Co., Senior Notes | | | 5.000 | % | | | 7/15/35 | | | | 40,000 | | | | 40,607 | (a) |
Total Food Products | | | | | | | | | | | | | | | 111,137 | |
See Notes to Financial Statements.
| | |
| Western Asset Core Plus VIT Portfolio 2015 Semi-Annual Report | | 5 |
Schedule of investments (unaudited) (cont’d)
June 30, 2015
Western Asset Core Plus VIT Portfolio
| | | | | | | | | | | | | | | | |
| Security | | Rate | | | Maturity
Date | | | Face
Amount† | | | Value | |
Tobacco — 0.5% | | | | | | | | | | | | | | | | |
Altria Group Inc., Senior Notes | | | 9.950 | % | | | 11/10/38 | | | | 150,000 | | | $ | 242,248 | |
Reynolds American Inc., Senior Notes | | | 3.250 | % | | | 6/12/20 | | | | 40,000 | | | | 40,562 | |
Reynolds American Inc., Senior Notes | | | 5.850 | % | | | 8/15/45 | | | | 110,000 | | | | 115,793 | |
Total Tobacco | | | | | | | | | | | | | | | 398,603 | |
Total Consumer Staples | | | | | | | | | | | | | | | 1,252,452 | |
| Energy — 3.2% | | | | | | | | | | | | | | | | |
Energy Equipment & Services — 0.2% | | | | | | | | | | | | | | | | |
Pacific Drilling SA, Senior Secured Notes | | | 5.375 | % | | | 6/1/20 | | | | 260,000 | | | | 198,250 | (a) |
Oil, Gas & Consumable Fuels — 3.0% | | | | | | | | | | | | | | | | |
Apache Corp., Senior Notes | | | 5.100 | % | | | 9/1/40 | | | | 100,000 | | | | 96,983 | |
BP Capital Markets PLC, Senior Bonds | | | 3.506 | % | | | 3/17/25 | | | | 150,000 | | | | 148,105 | |
Calumet Specialty Products Partners LP/Calumet Finance Corp., Senior Notes | | | 6.500 | % | | | 4/15/21 | | | | 190,000 | | | | 188,100 | |
CNOOC Finance 2015 USA LLC, Senior Notes | | | 3.500 | % | | | 5/5/25 | | | | 200,000 | | | | 192,775 | |
Devon Financing Corp. LLC, Debentures | | | 7.875 | % | | | 9/30/31 | | | | 100,000 | | | | 129,223 | |
Ecopetrol SA, Senior Notes | | | 5.375 | % | | | 6/26/26 | | | | 150,000 | | | | 148,688 | |
Kerr-McGee Corp., Notes | | | 6.950 | % | | | 7/1/24 | | | | 150,000 | | | | 181,155 | |
Kinder Morgan Inc., Medium-Term Notes | | | 7.750 | % | | | 1/15/32 | | | | 150,000 | | | | 172,749 | |
Milagro Oil & Gas Inc., Secured Notes | | | 10.500 | % | | | 5/15/16 | | | | 450,000 | | | | 112,500 | (c)(e) |
Petrobras Global Finance BV, Senior Notes | | | 5.375 | % | | | 1/27/21 | | | | 190,000 | | | | 183,217 | |
Petrobras Global Finance BV, Senior Notes | | | 4.375 | % | | | 5/20/23 | | | | 300,000 | | | | 262,113 | |
Petrobras Global Finance BV, Senior Notes | | | 6.850 | % | | | 6/5/2115 | | | | 90,000 | | | | 74,057 | |
Petroleos Mexicanos, Senior Bonds | | | 6.625 | % | | | 6/15/35 | | | | 300,000 | | | | 321,750 | |
Quicksilver Resources Inc., Senior Notes | | | 11.000 | % | | | 7/1/21 | | | | 40,000 | | | | 5,600 | (e) |
Rockies Express Pipeline LLC, Senior Notes | | | 6.875 | % | | | 4/15/40 | | | | 200,000 | | | | 211,000 | (a) |
Shell International Finance BV, Senior Notes | | | 4.125 | % | | | 5/11/35 | | | | 40,000 | | | | 39,288 | |
Shell International Finance BV, Senior Notes | | | 4.375 | % | | | 5/11/45 | | | | 140,000 | | | | 138,761 | |
Total Oil, Gas & Consumable Fuels | | | | | | | | | | | | | | | 2,606,064 | |
Total Energy | | | | | | | | | | | | | | | 2,804,314 | |
| Financials — 10.2% | | | | | | | | | | | | | | | | |
Banks — 7.5% | | | | | | | | | | | | | | | | |
Bank of America Corp., Junior Subordinated Notes | | | 5.200 | % | | | 6/1/23 | | | | 260,000 | | | | 248,950 | (f)(g) |
Bank of America Corp., Senior Notes | | | 5.625 | % | | | 7/1/20 | | | | 300,000 | | | | 338,489 | |
Bank of America Corp., Senior Notes | | | 5.000 | % | | | 1/21/44 | | | | 20,000 | | | | 20,846 | |
Bank of America Corp., Senior Notes | | | 4.875 | % | | | 4/1/44 | | | | 250,000 | | | | 254,917 | |
Bank of America Corp., Subordinated Notes | | | 4.000 | % | | | 1/22/25 | | | | 350,000 | | | | 341,672 | |
Barclays Bank PLC, Subordinated Notes | | | 7.625 | % | | | 11/21/22 | | | | 200,000 | | | | 228,135 | |
Barclays PLC, Junior Subordinated Bonds | | | 8.250 | % | | | 12/15/18 | | | | 200,000 | | | | 211,592 | (f)(g) |
See Notes to Financial Statements.
| | |
| 6 | | Western Asset Core Plus VIT Portfolio 2015 Semi-Annual Report |
Western Asset Core Plus VIT Portfolio
| | | | | | | | | | | | | | | | |
| Security | | Rate | | | Maturity
Date | | | Face
Amount† | | | Value | |
Banks — continued | | | | | | | | | | | | | | | | |
Citigroup Inc., Junior Subordinated Bonds | | | 6.300 | % | | | 5/15/24 | | | | 150,000 | | | $ | 146,625 | (f)(g) |
Citigroup Inc., Junior Subordinated Bonds | | | 5.950 | % | | | 5/15/25 | | | | 170,000 | | | | 164,296 | (f)(g) |
Citigroup Inc., Subordinated Bonds | | | 4.400 | % | | | 6/10/25 | | | | 110,000 | | | | 109,809 | |
Citigroup Inc., Subordinated Notes | | | 4.300 | % | | | 11/20/26 | | | | 230,000 | | | | 225,399 | |
Citigroup Inc., Subordinated Notes | | | 5.300 | % | | | 5/6/44 | | | | 100,000 | | | | 102,181 | |
Cooperatieve Centrale Raiffeisen-Boerenleenbank BA of Netherlands, Junior Subordinated Notes | | | 11.000 | % | | | 6/30/19 | | | | 155,000 | | | | 197,044 | (a)(f)(g) |
Cooperatieve Centrale Raiffeisen-Boerenleenbank BA of Netherlands, Subordinated Notes | | | 4.625 | % | | | 12/1/23 | | | | 250,000 | | | | 258,375 | |
Credit Agricole SA, Junior Subordinated Notes | | | 8.375 | % | | | 10/13/19 | | | | 300,000 | | | | 349,500 | (a)(f)(g) |
HSBC Holdings PLC, Junior Subordinated Bonds | | | 6.375 | % | | | 9/17/24 | | | | 230,000 | | | | 230,862 | (f)(g) |
HSBC Holdings PLC, Subordinated Notes | | | 5.250 | % | | | 3/14/44 | | | | 250,000 | | | | 260,292 | |
JPMorgan Chase & Co., Junior Subordinated Bonds | | | 5.150 | % | | | 5/1/23 | | | | 130,000 | | | | 124,033 | (f)(g) |
JPMorgan Chase & Co., Senior Notes | | | 4.250 | % | | | 10/15/20 | | | | 300,000 | | | | 321,007 | |
JPMorgan Chase & Co., Subordinated Notes | | | 4.125 | % | | | 12/15/26 | | | | 250,000 | | | | 246,374 | |
JPMorgan Chase & Co., Subordinated Notes | | | 4.950 | % | | | 6/1/45 | | | | 90,000 | | | | 87,822 | |
M&T Bank Corp., Junior Subordinated Bonds | | | 6.875 | % | | | 6/15/16 | | | | 300,000 | | | | 306,750 | (g) |
Novo Banco SA, Senior Notes | | | 5.875 | % | | | 11/9/15 | | | | 100,000 | EUR | | | 111,764 | (h) |
Royal Bank of Scotland Group PLC, Junior Subordinated Bonds | | | 7.648 | % | | | 9/30/31 | | | | 200,000 | | | | 250,000 | (f)(g) |
Royal Bank of Scotland Group PLC, Subordinated Notes | | | 6.000 | % | | | 12/19/23 | | | | 100,000 | | | | 106,069 | |
Royal Bank of Scotland NV, Subordinated Bonds | | | 7.750 | % | | | 5/15/23 | | | | 100,000 | | | | 117,181 | |
Royal Bank of Scotland PLC, Subordinated Notes | | | 13.125 | % | | | 3/19/22 | | | | 500,000 | AUD | | | 441,618 | (f)(h) |
Standard Chartered PLC, Subordinated Notes | | | 5.700 | % | | | 3/26/44 | | | | 200,000 | | | | 208,200 | (a) |
Wells Fargo & Co., Junior Subordinated Bonds | | | 5.900 | % | | | 6/15/24 | | | | 110,000 | | | | 110,550 | (f)(g) |
Wells Fargo & Co., Subordinated Notes | | | 4.100 | % | | | 6/3/26 | | | | 200,000 | | | | 201,106 | |
Wells Fargo & Co., Subordinated Notes | | | 4.650 | % | | | 11/4/44 | | | | 200,000 | | | | 192,148 | |
Total Banks | | | | | | | | | | | | | | | 6,513,606 | |
Capital Markets — 0.9% | | | | | | | | | | | | | | | | |
Goldman Sachs Group Inc., Senior Notes | | | 2.600 | % | | | 4/23/20 | | | | 200,000 | | | | 199,132 | |
Goldman Sachs Group Inc., Senior Notes | | | 3.500 | % | | | 1/23/25 | | | | 150,000 | | | | 145,644 | |
Goldman Sachs Group Inc., Senior Notes | | | 6.250 | % | | | 2/1/41 | | | | 100,000 | | | | 118,599 | |
Goldman Sachs Group Inc., Subordinated Notes | | | 6.750 | % | | | 10/1/37 | | | | 200,000 | | | | 235,311 | |
Goldman Sachs Group Inc., Subordinated Notes | | | 5.150 | % | | | 5/22/45 | | | | 20,000 | | | | 19,367 | |
KKR Group Finance Co. II LLC, Senior Notes | | | 5.500 | % | | | 2/1/43 | | | | 10,000 | | | | 10,143 | (a) |
Total Capital Markets | | | | | | | | | | | | | | | 728,196 | |
Consumer Finance — 0.1% | | | | | | | | | | | | | | | | |
Synchrony Financial, Senior Notes | | | 4.250 | % | | | 8/15/24 | | | | 100,000 | | | | 100,613 | |
See Notes to Financial Statements.
| | |
| Western Asset Core Plus VIT Portfolio 2015 Semi-Annual Report | | 7 |
Schedule of investments (unaudited) (cont’d)
June 30, 2015
Western Asset Core Plus VIT Portfolio
| | | | | | | | | | | | | | | | |
| Security | | Rate | | | Maturity
Date | | | Face
Amount† | | | Value | |
Diversified Financial Services — 0.7% | | | | | | | | | | | | | | | | |
General Electric Capital Corp., Senior Notes | | | 4.650 | % | | | 10/17/21 | | | | 250,000 | | | $ | 274,139 | |
General Electric Capital Corp., Senior Notes | | | 6.875 | % | | | 1/10/39 | | | | 210,000 | | | | 282,522 | |
General Electric Capital Corp., Subordinated Notes | | | 5.300 | % | | | 2/11/21 | | | | 50,000 | | | | 56,263 | |
Total Diversified Financial Services | | | | | | | | | | | | | | | 612,924 | |
Insurance — 0.5% | | | | | | | | | | | | | | | | |
Liberty Mutual Group Inc., Junior Subordinated Bonds | | | 7.800 | % | | | 3/15/37 | | | | 210,000 | | | | 249,375 | (a) |
Teachers Insurance & Annuity Association of America, Subordinated Notes | | | 4.900 | % | | | 9/15/44 | | | | 180,000 | | | | 183,987 | (a) |
Total Insurance | | | | | | | | | | | | | | | 433,362 | |
Real Estate Investment Trusts (REITs) — 0.5% | | | | | | | | | | | | | | | | |
CB Richard Ellis Services Inc., Senior Notes | | | 5.250 | % | | | 3/15/25 | | | | 440,000 | | | | 456,500 | |
Total Financials | | | | | | | | | | | | | | | 8,845,201 | |
| Health Care — 1.3% | | | | | | | | | | | | | | | | |
Biotechnology — 0.3% | | | | | | | | | | | | | | | | |
Amgen Inc., Senior Notes | | | 5.375 | % | | | 5/15/43 | | | | 100,000 | | | | 106,507 | |
Gilead Sciences Inc., Senior Notes | | | 3.500 | % | | | 2/1/25 | | | | 150,000 | | | | 150,396 | |
Total Biotechnology | | | | | | | | | | | | | | | 256,903 | |
Health Care Equipment & Supplies — 0.3% | | | | | | | | | | | | | | | | |
Becton, Dickinson & Co., Senior Notes | | | 3.734 | % | | | 12/15/24 | | | | 40,000 | | | | 39,944 | |
Becton, Dickinson & Co., Senior Notes | | | 4.685 | % | | | 12/15/44 | | | | 20,000 | | | | 19,429 | |
Medtronic Inc., Senior Notes | | | 3.500 | % | | | 3/15/25 | | | | 200,000 | | | | 199,561 | (a) |
Total Health Care Equipment & Supplies | | | | | | | | | | | | | | | 258,934 | |
Health Care Providers & Services — 0.0% | | | | | | | | | | | | | | | | |
Omnicare Inc., Senior Notes | | | 4.750 | % | | | 12/1/22 | | | | 10,000 | | | | 10,650 | |
Pharmaceuticals — 0.7% | | | | | | | | | | | | | | | | |
AbbVie Inc., Senior Subordinated Notes | | | 3.600 | % | | | 5/14/25 | | | | 90,000 | | | | 89,139 | |
Actavis Funding SCS, Senior Notes | | | 3.800 | % | | | 3/15/25 | | | | 300,000 | | | | 295,288 | |
Baxalta Inc., Senior Notes | | | 5.250 | % | | | 6/23/45 | | | | 40,000 | | | | 40,309 | (a) |
Wyeth, Notes | | | 5.950 | % | | | 4/1/37 | | | | 150,000 | | | | 179,285 | |
Total Pharmaceuticals | | | | | | | | | | | | | | | 604,021 | |
Total Health Care | | | | | | | | | | | | | | | 1,130,508 | |
| Industrials — 3.0% | | | | | | | | | | | | | | | | |
Airlines — 1.6% | | | | | | | | | | | | | | | | |
American Airlines, Pass-Through Trust, Secured Notes | | | 7.000 | % | | | 1/31/18 | | | | 183,694 | | | | 196,093 | (a) |
Delta Air Lines Inc., Pass-Through Certificates, Secured Notes | | | 6.375 | % | | | 1/2/16 | | | | 190,000 | | | | 194,275 | (a) |
Delta Air Lines Inc., Pass-Through Certificates, Subordinated Secured Notes | | | 9.750 | % | | | 12/17/16 | | | | 95,538 | | | | 104,137 | |
See Notes to Financial Statements.
| | |
| 8 | | Western Asset Core Plus VIT Portfolio 2015 Semi-Annual Report |
Western Asset Core Plus VIT Portfolio
| | | | | | | | | | | | | | | | |
| Security | | Rate | | | Maturity
Date | | | Face
Amount† | | | Value | |
Airlines — continued | | | | | | | | | | | | | | | | |
Delta Air Lines Inc., Pass-Through Trust, Secured Notes | | | 6.875 | % | | | 5/7/19 | | | | 154,307 | | | $ | 167,423 | (a) |
United Airlines Inc., Pass-Through Certificates, Secured Bonds | | | 5.375 | % | | | 8/15/21 | | | | 191,145 | | | | 200,225 | |
United Airlines Inc., Pass-Through Certificates, Secured Notes | | | 4.750 | % | | | 4/11/22 | | | | 350,000 | | | | 356,125 | |
United Airlines Inc., Pass-Through Certificates, Secured Notes | | | 4.625 | % | | | 9/3/22 | | | | 180,000 | | | | 183,600 | |
Total Airlines | | | | | | | | | | | | | | | 1,401,878 | |
Construction & Engineering — 0.4% | | | | | | | | | | | | | | | | |
Michael Baker Holdings LLC/Michael Baker Finance Corp., Senior Notes | | | 8.875 | % | | | 4/15/19 | | | | 420,000 | | | | 386,400 | (a)(b) |
Electrical Equipment — 0.3% | | | | | | | | | | | | | | | | |
NES Rentals Holdings Inc., Senior Secured Notes | | | 7.875 | % | | | 5/1/18 | | | | 210,000 | | | | 213,150 | (a) |
Machinery — 0.2% | | | | | | | | | | | | | | | | |
CTP Transportation Products LLC/CTP Finance Inc., Senior Secured Notes | | | 8.250 | % | | | 12/15/19 | | | | 170,000 | | | | 176,800 | (a) |
Road & Rail — 0.2% | | | | | | | | | | | | | | | | |
Jurassic Holdings III Inc., Secured Notes | | | 6.875 | % | | | 2/15/21 | | | | 200,000 | | | | 157,000 | (a) |
Transportation — 0.3% | | | | | | | | | | | | | | | | |
Hapag-Lloyd AG, Senior Notes | | | 9.750 | % | | | 10/15/17 | | | | 290,000 | | | | 297,250 | (a) |
Total Industrials | | | | | | | | | | | | | | | 2,632,478 | |
| Materials — 2.7% | | | | | | | | | | | | | | | | |
Chemicals — 0.8% | | | | | | | | | | | | | | | | |
Eco Services Operations LLC/Eco Finance Corp., Senior Notes | | | 8.500 | % | | | 11/1/22 | | | | 130,000 | | | | 131,300 | (a) |
HIG BBC Intermediate Holdings LLC/HIG BBC Holdings Corp., Senior Notes | | | 10.500 | % | | | 9/15/18 | | | | 150,000 | | | | 149,063 | (a)(b) |
Kerling PLC, Senior Secured Notes | | | 10.625 | % | | | 2/1/17 | | | | 189,000 | EUR | | | 216,227 | (a) |
KP Germany Erste GmbH, Senior Secured Notes | | | 11.625 | % | | | 7/15/17 | | | | 110,000 | EUR | | | 131,341 | (a) |
KP Germany Erste GmbH, Senior Secured Notes | | | 11.625 | % | | | 7/15/17 | | | | 100,000 | EUR | | | 119,400 | (h) |
Total Chemicals | | | | | | | | | | | | | | | 747,331 | |
Metals & Mining — 1.8% | | | | | | | | | | | | | | | | |
Barrick Gold Corp., Senior Notes | | | 4.100 | % | | | 5/1/23 | | | | 200,000 | | | | 195,197 | |
Freeport-McMoRan Inc., Senior Notes | | | 4.000 | % | | | 11/14/21 | | | | 150,000 | | | | 147,501 | |
Glencore Funding LLC, Senior Notes | | | 2.875 | % | | | 4/16/20 | | | | 350,000 | | | | 343,439 | (a) |
Midwest Vanadium Pty Ltd., Senior Secured Notes | | | 11.500 | % | | | 2/15/18 | | | | 320,000 | | | | 16,000 | (a)(c)(e) |
Mirabela Nickel Ltd., Subordinated Notes | | | 1.000 | % | | | 9/10/44 | | | | 2,911 | | | | 0 | (a)(c)(d)(i) |
Prince Mineral Holding Corp., Senior Secured Notes | | | 11.500 | % | | | 12/15/19 | | | | 140,000 | | | | 129,500 | (a) |
Schaeffler Holding Finance BV, Senior Secured Notes | | | 6.875 | % | | | 8/15/18 | | | | 290,000 | EUR | | | 335,964 | (a)(b) |
Southern Copper Corp., Senior Notes | | | 5.250 | % | | | 11/8/42 | | | | 140,000 | | | | 122,197 | |
Vale Overseas Ltd., Senior Notes | | | 4.375 | % | | | 1/11/22 | | | | 150,000 | | | | 146,918 | |
Vale Overseas Ltd., Senior Notes | | | 6.875 | % | | | 11/21/36 | | | | 100,000 | | | | 97,181 | |
Total Metals & Mining | | | | | | | | | | | | | | | 1,533,897 | |
See Notes to Financial Statements.
| | |
| Western Asset Core Plus VIT Portfolio 2015 Semi-Annual Report | | 9 |
Schedule of investments (unaudited) (cont’d)
June 30, 2015
Western Asset Core Plus VIT Portfolio
| | | | | | | | | | | | | | | | |
| Security | | Rate | | | Maturity
Date | | | Face
Amount† | | | Value | |
Paper & Forest Products — 0.1% | | | | | | | | | | | | | | | | |
Celulosa Arauco y Constitucion SA, Senior Notes | | | 4.750 | % | | | 1/11/22 | | | | 50,000 | | | $ | 52,260 | |
Total Materials | | | | | | | | | | | | | | | 2,333,488 | |
| Telecommunication Services — 2.0% | | | | | | | | | | | | | | | | |
Diversified Telecommunication Services — 1.7% | | | | | | | | | | | | | |
AT&T Inc., Senior Notes | | | 3.400 | % | | | 5/15/25 | | | | 550,000 | | | | 525,623 | |
Verizon Communications Inc., Senior Notes | | | 5.150 | % | | | 9/15/23 | | | | 290,000 | | | | 318,039 | |
Verizon Communications Inc., Senior Notes | | | 6.550 | % | | | 9/15/43 | | | | 500,000 | | | | 586,914 | |
Total Diversified Telecommunication Services | | | | | | | | | | | | | | | 1,430,576 | |
Wireless Telecommunication Services — 0.3% | | | | | | | | | | | | | | | | |
America Movil SAB de CV, Senior Notes | | | 5.625 | % | | | 11/15/17 | | | | 80,000 | | | | 87,792 | |
Bharti Airtel Ltd., Senior Notes | | | 4.375 | % | | | 6/10/25 | | | | 200,000 | | | | 197,436 | (a) |
Total Wireless Telecommunication Services | | | | | | | | | | | | | | | 285,228 | |
Total Telecommunication Services | | | | | | | | | | | | | | | 1,715,804 | |
| Utilities — 0.7% | | | | | | | | | | | | | | | | |
Electric Utilities — 0.5% | | | | | | | | | | | | | | | | |
FirstEnergy Corp., Notes | | | 7.375 | % | | | 11/15/31 | | | | 250,000 | | | | 305,374 | |
Pacific Gas & Electric Co., First Mortgage Bonds | | | 6.050 | % | | | 3/1/34 | | | | 150,000 | | | | 180,867 | |
Total Electric Utilities | | | | | | | | | | | | | | | 486,241 | |
Gas Utilities — 0.2% | | | | | | | | | | | | | | | | |
Southern Natural Gas Co., Senior Notes | | | 8.000 | % | | | 3/1/32 | | | | 130,000 | | | | 154,700 | |
Total Utilities | | | | | | | | | | | | | | | 640,941 | |
Total Corporate Bonds & Notes (Cost — $25,386,913) | | | | 23,828,155 | |
| Asset-Backed Securities — 0.3% | | | | | | | | | | | | | | | | |
Conseco Financial Corp., 1997-7 M1
(Cost — $281,277) | | | 7.030 | % | | | 7/15/28 | | | | 293,453 | | | | 283,012 | |
| Collateralized Mortgage Obligations — 13.6% | | | | | | | | | | | | | |
Banc of America Funding Corp., 2015-R4 6A1 | | | 0.314 | % | | | 8/27/36 | | | | 653,287 | | | | 620,960 | (a)(f) |
Banc of America Funding Corp., 2015-R4 6A2 | | | 0.327 | % | | | 8/27/36 | | | | 780,000 | | | | 655,613 | (a)(f) |
Bayview Commercial Asset Trust, 2007-6A IO, IO | | | 4.521 | % | | | 12/25/37 | | | | 35,599,276 | | | | 622,987 | (a) |
BCAP LLC Trust, 2015-RR6 1A2 | | | 3.500 | % | | | 5/26/37 | | | | 360,000 | | | | 324,900 | (a)(d)(f) |
CFCRE Commercial Mortgage Trust, 2011-C2 B | | | 5.760 | % | | | 12/15/47 | | | | 120,000 | | | | 137,178 | (a)(f) |
Chevy Chase Mortgage Funding Corp., 2004-2A B1 | | | 0.667 | % | | | 5/25/35 | | | | 347,078 | | | | 269,678 | (a)(f) |
CSAIL Commercial Mortgage Trust, 2015-C2 AS | | | 3.849 | % | | | 6/15/57 | | | | 420,000 | | | | 427,686 | |
CSAIL Commercial Mortgage Trust, 2015-C2 C | | | 4.354 | % | | | 6/15/57 | | | | 436,000 | | | | 428,531 | (f) |
Federal Home Loan Mortgage Corp. (FHLMC), Pass-Through Certificates, K717 A2 | | | 2.991 | % | | | 9/25/21 | | | | 90,000 | | | | 93,593 | |
First Horizon Mortgage Pass-Through Trust, 2005-AR1 B1 | | | 2.602 | % | | | 4/25/35 | | | | 356,717 | | | | 247,178 | (f) |
Government National Mortgage Association (GNMA), 2012-034 SA, IO | | | 5.863 | % | | | 3/20/42 | | | | 215,337 | | | | 47,611 | (f) |
See Notes to Financial Statements.
| | |
| 10 | | Western Asset Core Plus VIT Portfolio 2015 Semi-Annual Report |
Western Asset Core Plus VIT Portfolio
| | | | | | | | | | | | | | | | |
| Security | | Rate | | | Maturity
Date | | | Face
Amount† | | | Value | |
| Collateralized Mortgage Obligations — continued | | | | | | | | | | | | | |
Government National Mortgage Association (GNMA), 2012-43 SN, IO | | | 6.415 | % | | | 4/16/42 | | | | 456,599 | | | $ | 112,528 | (f) |
Government National Mortgage Association (GNMA), 2014-186 IO, IO | | | 0.869 | % | | | 8/16/54 | | | | 3,375,684 | | | | 234,470 | (f) |
Government National Mortgage Association (GNMA), 2015-67 A | | | 2.500 | % | | | 3/16/50 | | | | 179,740 | | | | 181,335 | |
GS Mortgage Securities Trust, 2012-GC6 AS | | | 4.948 | % | | | 1/10/45 | | | | 380,000 | | | | 425,465 | (a) |
GS Mortgage Securities Trust, 2015-GC30 AS | | | 3.777 | % | | | 5/10/50 | | | | 400,000 | | | | 402,426 | |
GS Mortgage Securities Trust, 2015-GC30 D | | | 3.384 | % | | | 5/10/50 | | | | 300,000 | | | | 235,586 | |
Homestar Mortgage Acceptance Corp., 2004-5 M2 | | | 0.857 | % | | | 10/25/34 | | | | 728,414 | | | | 676,370 | (f) |
Indymac IMSC Mortgage Loan Trust, 2007-HOA1 A22 | | | 0.367 | % | | | 7/25/47 | | | | 555,761 | | | | 370,476 | (f) |
JPMorgan Chase Commercial Mortgage Securities Trust, 2015-FL7 D | | | 3.934 | % | | | 5/15/28 | | | | 200,000 | | | | 195,759 | (a)(f) |
JPMorgan Reremic, 2015-2 1A1 | | | 0.929 | % | | | 8/26/36 | | | | 394,650 | | | | 373,827 | (a)(f) |
LSTAR Commercial Mortgage Trust, 2015-3 A2 | | | 2.729 | % | | | 4/20/48 | | | | 230,000 | | | | 231,187 | (a)(f) |
Morgan Stanley Capital I Trust, 2007-IQ13 AJ | | | 5.438 | % | | | 3/15/44 | | | | 250,000 | | | | 252,733 | |
Morgan Stanley Reremic Trust, 2015-R3 7A1 | | | 0.906 | % | | | 4/26/47 | | | | 650,000 | | | | 630,500 | (a)(f) |
Morgan Stanley Reremic Trust, 2015-R3 7A2 | | | 0.906 | % | | | 4/26/47 | | | | 730,000 | | | | 635,100 | (a)(f) |
Morgan Stanley Reremic Trust, 2015-R3 9A1 | | | 0.441 | % | | | 4/26/47 | | | | 571,443 | | | | 545,385 | (a)(f) |
Morgan Stanley Reremic Trust, 2015-R3 9A2 | | | 0.441 | % | | | 4/26/47 | | | | 520,000 | | | | 433,524 | (a)(f) |
MSCG Trust, 2015-ALDR A2 | | | 3.577 | % | | | 6/7/35 | | | | 210,000 | | | | 210,848 | (a)(f) |
Nomura Resecuritization Trust | | | 0.375 | % | | | 5/26/46 | | | | 260,000 | | | | 247,000 | (a)(f) |
Nomura Resecuritization Trust, 2015-5R 4A1 | | | 0.321 | % | | | 7/26/37 | | | | 679,379 | | | | 645,002 | (a)(f) |
Structured Agency Credit Risk Debt Notes, 2013-DN2 M2 | | | 4.437 | % | | | 11/25/23 | | | | 640,000 | | | | 653,443 | (f) |
Wells Fargo Commercial Mortgage Trust, 2015-C28 AS | | | 3.872 | % | | | 5/15/48 | | | | 320,000 | | | | 324,397 | |
Total Collateralized Mortgage Obligations (Cost — $11,835,125) | | | | 11,893,276 | |
| Convertible Bonds & Notes — 0.3% | | | | | | | | | | | | | | | | |
| Materials — 0.3% | | | | | | | | | | | | | | | | |
Chemicals — 0.1% | | | | | | | | | | | | | | | | |
Hercules Inc., Junior Subordinated Bonds | | | 6.500 | % | | | 6/30/29 | | | | 80,000 | | | | 72,750 | |
Metals & Mining — 0.2% | | | | | | | | | | | | | | | | |
Mirabela Nickel Ltd., Senior Secured Bonds | | | 9.500 | % | | | 6/24/19 | | | | 285,287 | | | | 209,686 | (a)(b)(c) |
Total Convertible Bonds & Notes (Cost — $358,924) | | | | 282,436 | |
| Mortgage-Backed Securities — 20.7% | | | | | | | | | | | | | | | | |
FHLMC — 2.4% | | | | | | | | | | | | | | | | |
Federal Home Loan Mortgage Corp. (FHLMC), Gold | | | 3.000 | % | | | 7/14/45 | | | | 400,000 | | | | 397,641 | (j) |
Federal Home Loan Mortgage Corp. (FHLMC), Gold | | | 3.500 | % | | | 3/1/45 | | | | 1,287,348 | | | | 1,329,287 | |
Federal Home Loan Mortgage Corp. (FHLMC), Gold | | | 3.500 | % | | | 8/13/45 | | | | 400,000 | | | | 410,461 | (j) |
Total FHLMC | | | | | | | | | | | | | | | 2,137,389 | |
See Notes to Financial Statements.
| | |
| Western Asset Core Plus VIT Portfolio 2015 Semi-Annual Report | | 11 |
Schedule of investments (unaudited) (cont’d)
June 30, 2015
Western Asset Core Plus VIT Portfolio
| | | | | | | | | | | | | | | | |
| Security | | Rate | | | Maturity
Date | | | Face
Amount† | | | Value | |
FNMA — 14.1% | | | | | | | | | | | | | | | | |
Federal National Mortgage Association (FNMA) | | | 2.500 | % | | | 7/16/30 | | | | 400,000 | | | $ | 404,877 | (j) |
Federal National Mortgage Association (FNMA) | | | 3.500 | % | | | 7/16/30-8/13/45 | | | | 2,900,000 | | | | 3,005,184 | (j) |
Federal National Mortgage Association (FNMA) | | | 4.500 | % | | | 7/14/45 | | | | 2,500,000 | | | | 2,703,125 | (j) |
Federal National Mortgage Association (FNMA) | | | 5.000 | % | | | 7/14/45 | | | | 1,300,000 | | | | 1,436,297 | (j) |
Federal National Mortgage Association (FNMA) | | | 2.810 | % | | | 4/1/25 | | | | 40,000 | | | | 39,301 | |
Federal National Mortgage Association (FNMA) | | | 3.000 | % | | | 8/18/30 | | | | 1,600,000 | | | | 1,654,300 | (j) |
Federal National Mortgage Association (FNMA) | | | 4.000 | % | | | 8/13/45 | | | | 2,900,000 | | | | 3,065,923 | (j) |
Total FNMA | | | | | | | | | | | | | | | 12,309,007 | |
GNMA — 4.2% | | | | | | | | | | | | | | | | |
Government National Mortgage Association (GNMA) | | | 4.500 | % | | | 7/20/45 | | | | 200,000 | | | | 217,187 | (j) |
Government National Mortgage Association (GNMA) II | | | 4.000 | % | | | 7/20/45 | | | | 700,000 | | | | 741,877 | (j) |
Government National Mortgage Association (GNMA) II | | | 3.500 | % | | | 7/20/45 | | | | 900,000 | | | | 934,137 | (j) |
Government National Mortgage Association (GNMA) II | | | 3.000 | % | | | 8/20/45 | | | | 800,000 | | | | 805,594 | (j) |
Government National Mortgage Association (GNMA) II | | | 4.500 | % | | | 8/20/45 | | | | 900,000 | | | | 969,223 | (j) |
Total GNMA | | | | | | | | | | | | | | | 3,668,018 | |
Total Mortgage-Backed Securities (Cost — $18,156,169) | | | | 18,114,414 | |
| Senior Loans — 3.2% | | | | | | | | | | | | | | | | |
| Consumer Discretionary — 1.1% | | | | | | | | | | | | | | | | |
Media — 0.2% | | | | | | | | | | | | | | | | |
Univision Communications Inc., Term Loan C3 | | | — | | | | 3/1/20 | | | | 69,815 | | | | 69,520 | (k) |
Univision Communications Inc., Term Loan C4 | | | — | | | | 3/1/20 | | | | 89,764 | | | | 89,302 | (k) |
Ziggo Financing Partnership, USD Term Loan B1 | | | — | | | | 1/15/22 | | | | 22,187 | | | | 21,967 | (k) |
Ziggo Financing Partnership, USD Term Loan B2A | | | — | | | | 1/15/22 | | | | 14,298 | | | | 14,156 | (k) |
Ziggo Financing Partnership, USD Term Loan B3 | | | — | | | | 1/15/22 | | | | 23,515 | | | | 23,281 | (k) |
Total Media | | | | | | | | | | | | | | | 218,226 | |
Specialty Retail — 0.7% | | | | | | | | | | | | | | | | |
CWGS Group LLC, Term Loan | | | 5.250 | % | | | 2/20/20 | | | | 323,000 | | | | 325,221 | (l)(m) |
Gymboree Corp., Initial Term Loan | | | 5.000 | % | | | 2/23/18 | | | | 140,000 | | | | 101,010 | (l)(m) |
Party City Holdings Inc., Term Loan | | | — | | | | 7/27/19 | | | | 69,823 | | | | 69,828 | (k) |
PetSmart Inc., Term Loan B | | | — | | | | 3/11/22 | | | | 80,000 | | | | 80,014 | (k) |
Total Specialty Retail | | | | | | | | | | | | | | | 576,073 | |
Textiles, Apparel & Luxury Goods — 0.2% | | | | | | | | | | | | | | | | |
TOMS Shoes LLC, Term Loan B | | | 6.500 | % | | | 10/28/20 | | | | 149,625 | | | | 138,590 | (l)(m) |
Total Consumer Discretionary | | | | | | | | | | | | | | | 932,889 | |
| Energy — 0.4% | | | | | | | | | | | | | | | | |
Oil, Gas & Consumable Fuels — 0.4% | | | | | | | | | | | | | | | | |
Murray Energy Corp., Term Loan B2 | | | 7.500 | % | | | 3/19/21 | | | | 160,000 | | | | 148,600 | (l)(m) |
See Notes to Financial Statements.
| | |
| 12 | | Western Asset Core Plus VIT Portfolio 2015 Semi-Annual Report |
Western Asset Core Plus VIT Portfolio
| | | | | | | | | | | | | | | | |
| Security | | Rate | | | Maturity
Date | | | Face
Amount† | | | Value | |
Oil, Gas & Consumable Fuels — continued | | | | | | | | | | | | | | | | |
Westmoreland Coal Co., Term Loan B | | | 7.500 | % | | | 12/16/20 | | | | 189,050 | | | $ | 184,324 | (l)(m) |
Total Energy | | | | | | | | | | | | | | | 332,924 | |
| Health Care — 0.3% | | | | | | | | | | | | | | | | |
Health Care Equipment & Supplies — 0.2% | | | | | | | | | | | | | | | | |
Immucor Inc., REFI Term Loan B2 | | | 5.000 | % | | | 8/17/18 | | | | 173,313 | | | | 174,179 | (l)(m) |
Health Care Providers & Services — 0.1% | | | | | | | | | | | | | | | | |
Air Medical Group Holdings Inc., Term Loan B | | | 4.500 | % | | | 4/6/22 | | | | 30,000 | | | | 29,850 | (l)(m) |
MPH Acquisition Holdings LLC, Term Loan | | | — | | | | 3/31/21 | | | | 77,895 | | | | 77,615 | (k) |
Total Health Care Providers & Services | | | | | | | | | | | | | | | 107,465 | |
Total Health Care | | | | | | | | | | | | | | | 281,644 | |
| Industrials — 0.3% | | | | | | | | | | | | | | | | |
Machinery — 0.3% | | | | | | | | | | | | | | | | |
Intelligrated Inc., First Lien Term Loan | | | 4.750-5.750 | % | | | 7/30/18 | | | | 267,264 | | | | 267,096 | (l)(m) |
| Materials — 0.2% | | | | | | | | | | | | | | | | |
Metals & Mining — 0.2% | | | | | | | | | | | | | | | | |
Essar Steel Algoma Inc., Term Loan | | | 7.500 | % | | | 8/9/19 | | | | 99,250 | | | | 90,897 | (l)(m) |
FMG Resources (August 2006) Pty Ltd., New Term Loan B | | | — | | | | 6/30/19 | | | | 79,595 | | | | 70,864 | (k) |
Total Materials | | | | | | | | | | | | | | | 161,761 | |
| Utilities — 0.9% | | | | | | | | | | | | | | | | |
Electric Utilities — 0.2% | | | | | | | | | | | | | | | | |
Panda Temple Power LLC, 2015 Term Loan B | | | 7.250 | % | | | 3/4/22 | | | | 219,450 | | | | 217,255 | (l)(m) |
Independent Power and Renewable Electricity Producers — 0.7% | | | | | | | | | | | | | |
Energy Future Intermediate Holding Co., LLC, DIP Term Loan | | | 4.250 | % | | | 6/19/16 | | | | 426,974 | | | | 428,042 | (l)(m) |
TPF II Power LLC, Term Loan B | | | 5.500-6.750 | % | | | 10/2/21 | | | | 169,150 | | | | 170,778 | (l)(m) |
Total Independent Power and Renewable Electricity Producers | | | | | | | | | | | | | | | 598,820 | |
Total Utilities | | | | | | | | | | | | | | | 816,075 | |
Total Senior Loans (Cost — $2,825,722) | | | | | | | | | | | | | | | 2,792,389 | |
| Sovereign Bonds — 7.7% | | | | | | | | | | | | | | | | |
Brazil — 0.4% | | | | | | | | | | | | | | | | |
Federative Republic of Brazil, Senior Notes | | | 10.000 | % | | | 1/1/17 | | | | 1,125,000 | BRL | | | 344,692 | |
Colombia — 0.2% | | | | | | | | | | | | | | | | |
Republic of Colombia, Senior Bonds | | | 5.625 | % | | | 2/26/44 | | | | 200,000 | | | | 203,500 | |
Indonesia — 0.2% | | | | | | | | | | | | | | | | |
Republic of Indonesia, Notes | | | 3.750 | % | | | 4/25/22 | | | | 200,000 | | | | 197,500 | (h) |
Italy — 1.7% | | | | | | | | | | | | | | | | |
Italy Buoni Poliennali Del Tesoro, Senior Bonds | | | 3.750 | % | | | 9/1/24 | | | | 1,170,000 | EUR | | | 1,461,998 | |
See Notes to Financial Statements.
| | |
| Western Asset Core Plus VIT Portfolio 2015 Semi-Annual Report | | 13 |
Schedule of investments (unaudited) (cont’d)
June 30, 2015
Western Asset Core Plus VIT Portfolio
| | | | | | | | | | | | | | | | |
| Security | | Rate | | | Maturity
Date | | | Face
Amount† | | | Value | |
Mexico — 2.6% | | | | | | | | | | | | | | | | |
United Mexican States, Bonds | | | 7.750 | % | | | 11/13/42 | | | | 12,250,000 | MXN | | $ | 870,683 | |
United Mexican States, Senior Bonds | | | 6.500 | % | | | 6/9/22 | | | | 12,688,000 | MXN | | | 838,320 | |
United Mexican States, Senior Bonds | | | 10.000 | % | | | 12/5/24 | | | | 2,000,000 | MXN | | | 163,251 | |
United Mexican States, Senior Notes | | | 5.550 | % | | | 1/21/45 | | | | 340,000 | | | | 362,950 | |
Total Mexico | | | | | | | | | | | | | | | 2,235,204 | |
Poland — 1.7% | | | | | | | | | | | | | | | | |
Republic of Poland, Bonds | | | 3.250 | % | | | 7/25/25 | | | | 4,730,000 | PLN | | | 1,256,567 | |
Republic of Poland, Senior Notes | | | 4.000 | % | | | 1/22/24 | | | | 210,000 | | | | 220,763 | |
Total Poland | | | | | | | | | | | | | | | 1,477,330 | |
Russia — 0.2% | | | | | | | | | | | | | | | | |
Russian Foreign Bond — Eurobond, Senior Notes | | | 4.500 | % | | | 4/4/22 | | | | 200,000 | | | | 196,750 | (h) |
South Africa — 0.3% | | | | | | | | | | | | | | | | |
Republic of South Africa, Senior Notes | | | 5.875 | % | | | 9/16/25 | | | | 200,000 | | | | 222,169 | |
Turkey — 0.4% | | | | | | | | | | | | | | | | |
Republic of Turkey, Senior Bonds | | | 5.750 | % | | | 3/22/24 | | | | 320,000 | | | | 348,000 | |
Total Sovereign Bonds (Cost — $7,114,356) | | | | | | | | | | | | 6,687,143 | |
| U.S. Government & Agency Obligations — 19.9% | | | | | | | | | | | | | |
U.S. Government Obligations — 19.9% | | | | | | | | | | | | | | | | |
U.S. Treasury Bonds | | | 2.500 | % | | | 2/15/45 | | | | 1,740,000 | | | | 1,531,705 | |
U.S. Treasury Bonds | | | 3.000 | % | | | 5/15/45 | | | | 840,000 | | | | 823,331 | |
U.S. Treasury Notes | | | 0.500 | % | | | 4/30/17 | | | | 4,900,000 | | | | 4,892,346 | |
U.S. Treasury Notes | | | 1.375 | % | | | 4/30/20 | | | | 8,910,000 | | | | 8,813,246 | |
U.S. Treasury Notes | | | 2.125 | % | | | 6/30/22 | | | | 1,260,000 | | | | 1,265,414 | |
U.S. Treasury Notes | | | 2.250 | % | | | 11/15/24 | | | | 40,000 | | | | 39,760 | |
Total U.S. Government & Agency Obligations (Cost — $17,395,442) | | | | | | | | 17,365,802 | |
| U.S. Treasury Inflation Protected Securities — 1.0% | | | | | | | | | |
U.S. Treasury Notes, Inflation Indexed (Cost — $907,893) | | | 0.250 | % | | | 1/15/25 | | | | 898,974 | | | | 883,172 | |
| Non-U.S. Treasury Inflation Protected Securities — 0.2% | | | | | | | | | |
Brazil — 0.2% | | | | | | | | | | | | | | | | |
Federative Republic of Brazil, Notes (Cost — $182,312) | | | 6.000 | % | | | 8/15/50 | | | | 531,849 | BRL | | | 172,661 | |
| | | | |
| | | | | | | | | Shares | | | | |
| Common Stocks — 3.1% | | | | | | | | | | | | | | | | |
| Consumer Discretionary — 0.3% | | | | | | | | | | | | | | | | |
Automobiles — 0.3% | | | | | | | | | | | | | | | | |
Ford Motor Co. | | | | | | | | | | | 16,174 | | | | 242,772 | |
Hotels, Restaurants & Leisure — 0.0% | | | | | | | | | | | | | | | | |
Bossier Casino Venture Holdco Inc. | | | | | | | | | | | 22,038 | | | | 0 | *(c)(d)(i) |
See Notes to Financial Statements.
| | |
| 14 | | Western Asset Core Plus VIT Portfolio 2015 Semi-Annual Report |
Western Asset Core Plus VIT Portfolio
| | | | | | | | | | | | | | | | |
| Security | | | | | | | | Shares | | | Value | |
Media — 0.0% | | | | | | | | | | | | | | | | |
New Cotai LLC/New Cotai Capital Corp., Class B Shares | | | | | | | | | | | 1 | | | $ | 33,764 | *(c) |
Total Consumer Discretionary | | | | | | | | | | | | | | | 276,536 | |
| Energy — 1.3% | | | | | | | | | | | | | | | | |
Energy Equipment & Services — 1.3% | | | | | | | | | | | | | | | | |
KCAD Holdings I Ltd. | | | | | | | | | | | 108,106,087 | | | | 1,113,385 | *(c)(d) |
| Financials — 0.8% | | | | | | | | | | | | | | | | |
Banks — 0.8% | | | | | | | | | | | | | | | | |
Citigroup Inc. | | | | | | | | | | | 6,981 | | | | 385,630 | |
JPMorgan Chase & Co. | | | | | | | | | | | 4,380 | | | | 296,789 | |
Total Financials | | | | | | | | | | | | | | | 682,419 | |
| Health Care — 0.3% | | | | | | | | | | | | | | | | |
Health Care Providers & Services — 0.3% | | | | | | | | | | | | | | | | |
Physiotherapy Associates Holdings Inc. | | | | | | | | | | | 3,500 | | | | 290,500 | *(c)(d) |
| Industrials — 0.3% | | | | | | | | | | | | | | | | |
Marine — 0.3% | | | | | | | | | | | | | | | | |
DeepOcean Group Holding AS | | | | | | | | | | | 33,669 | | | | 257,379 | *(c)(d) |
| Materials — 0.1% | | | | | | | | | | | | | | | | |
Metals & Mining — 0.1% | | | | | | | | | | | | | | | | |
Mirabela Nickel Ltd. | | | | | | | | | | | 638,674 | | | | 56,668 | * |
Total Common Stocks (Cost — $2,754,055) | | | | | | | | | | | | | | | 2,676,887 | |
| | | | |
| | | Rate | | | | | | | | | | |
| Convertible Preferred Stocks — 0.1% | | | | | | | | | | | | | | | | |
| Energy — 0.1% | | | | | | | | | | | | | | | | |
Oil, Gas & Consumable Fuels — 0.1% | | | | | | | | | | | | | | | | |
Rex Energy Corp. (Cost — $151,750) | | | 6.000 | % | | | | | | | 1,700 | | | | 82,769 | |
| Preferred Stocks — 1.9% | | | | | | | | | | | | | | | | |
| Financials — 1.9% | | | | | | | | | | | | | | | | |
Consumer Finance — 1.1% | | | | | | | | | | | | | | | | |
GMAC Capital Trust I | | | 8.125 | % | | | | | | | 36,969 | | | | 960,455 | (f) |
Diversified Financial Services — 0.8% | | | | | | | | | | | | | | | | |
Citigroup Capital XIII | | | 7.875 | % | | | | | | | 25,825 | | | | 670,417 | (f) |
Total Preferred Stocks (Cost — $1,547,408) | | | | | | | | | | | | | | | 1,630,872 | |
| | | | |
| | | | | | Expiration
Date | | | Contracts | | | | |
| Purchased Options — 0.0% | | | | | | | | | | | | | | | | |
U.S. Treasury 10-Year Notes Futures, Put @ $123.50 | | | | | | | 8/21/15 | | | | 4 | | | | 1,250 | |
See Notes to Financial Statements.
| | |
| Western Asset Core Plus VIT Portfolio 2015 Semi-Annual Report | | 15 |
Schedule of investments (unaudited) (cont’d)
June 30, 2015
Western Asset Core Plus VIT Portfolio
| | | | | | | | | | | | | | | | |
| Security | | | | | Expiration
Date | | | Contracts | | | Value | |
| Purchased Options — continued | | | | | | | | | | | | | | | | |
U.S. Treasury Long Bond, Put @ $143.00 | | | | | | | 7/2/15 | | | | 7 | | | $ | 109 | |
U.S. Treasury Long Bond, Put @ $147.00 | | | | | | | 7/2/15 | | | | 7 | | | | 547 | |
Total Purchased Options (Cost — $3,543) | | | | | | | | | | | | | | | 1,906 | |
| | | | |
| | | | | | | | | Warrants | | | | |
| Warrants — 0.2% | | | | | | | | | | | | | | | | |
Jack Cooper Holdings Corp. | | | | | | | 12/15/17 | | | | 668 | | | | 113,560 | *(a) |
Jack Cooper Holdings Corp. | | | | | | | 5/6/18 | | | | 297 | | | | 50,490 | *(a) |
Total Warrants (Cost — $16,238) | | | | | | | | | | | | | | | 164,050 | |
Total Investments Before Short-Term Investments (Cost — $88,917,127) | | | | 86,858,944 | |
| | | | |
| | | Rate | | | Maturity
Date | | | Face
Amount† | | | | |
| Short-Term Investments — 11.5% | | | | | | | | | | | | | | | | |
Repurchase Agreements — 9.8% | | | | | | | | | | | | | | | | |
Deutsche Bank Securities Inc. repurchase agreement dated 6/30/15; Proceeds at maturity — $8,500,024; (Fully collateralized by U.S. government obligations, 0.750% due 2/15/45; Market value — $8,670,000) (Cost — $8,500,000) | | | 0.100 | % | | | 7/1/15 | | | | 8,500,000 | | | | 8,500,000 | |
U.S. Treasury Bills — 1.7% | | | | | | | | | | | | | | | | |
U.S. Treasury Bills (Cost — $1,499,825) | | | 0.035 | % | | | 10/29/15 | | | | 1,500,000 | | | | 1,499,963 | (n) |
Total Short-Term Investments (Cost — $9,999,825) | | | | | | | | | | | | | | | 9,999,963 | |
Total Investments — 111.0% (Cost — $98,916,952#) | | | | | | | | | | | | | | | 96,858,907 | |
Liabilities in Excess of Other Assets — (11.0)% | | | | | | | | | | | | | | | (9,608,453 | ) |
Total Net Assets — 100.0% | | | | | | | | | | | | | | $ | 87,250,454 | |
| † | Face amount denominated in U.S. dollars, unless otherwise noted. |
| * | Non-income producing security. |
| (a) | Security is exempt from registration under Rule 144A of the Securities Act of 1933. This security may be resold in transactions that are exempt from registration, normally to qualified institutional buyers. This security has been deemed liquid pursuant to guidelines approved by the Board of Trustees, unless otherwise noted. |
| (b) | Payment-in-kind security for which the issuer has the option at each interest payment date of making interest payments in cash or additional debt securities. |
| (d) | Security is valued in good faith in accordance with procedures approved by the Board of Trustees (See Note 1). |
| (e) | The coupon payment on these securities is currently in default as of June 30, 2015. |
| (f) | Variable rate security. Interest rate disclosed is as of the most recent information available. |
| (g) | Security has no maturity date. The date shown represents the next call date. |
| (h) | Security is exempt from registration under Regulation S of the Securities Act of 1933. Regulation S applies to securities offerings that are made outside of the United States and do not involve direct selling efforts in the United States. This security has been deemed liquid pursuant to guidelines approved by the Board of Trustees, unless otherwise noted. |
See Notes to Financial Statements.
| | |
| 16 | | Western Asset Core Plus VIT Portfolio 2015 Semi-Annual Report |
Western Asset Core Plus VIT Portfolio
| (i) | Value is less than $1. |
| (j) | This security is traded on a to-be-announced (“TBA”) basis. At June 30, 2015, the Portfolio held TBA securities with a total cost of $16,768,093 (See Note 1). |
| (k) | All or a portion of this loan is unfunded as of June 30, 2015. The interest rate for fully unfunded term loans is to be determined. |
| (l) | Senior loans may be considered restricted in that the Portfolio ordinarily is contractually obligated to receive approval from the agent bank and/or borrower prior to the disposition of a senior loan. |
| (m) | Interest rates disclosed represent the effective rates on senior loans. Ranges in interest rates are attributable to multiple contracts under the same loan. |
| (n) | Rate shown represents yield-to-maturity. |
| # | Aggregate cost for federal income tax purposes is substantially the same. |
| | |
Abbreviations used in this schedule: |
| AUD | | — Australian Dollar |
| BRL | | — Brazilian Real |
| DIP | | — Debtor-in-Possession |
| EUR | | — Euro |
| IO | | — Interest Only |
| MXN | | — Mexican Peso |
| PLN | | — Polish Zloty |
| REFI | | — Refinancing |
| | | | | | | | | | | | | | | | |
| Schedule of Written Options | | | | | | | | | | | | |
| Security | | Expiration
Date | | | Strike
Price | | | Contracts/
Notional
Amount | | | Value | |
| Euro Bund, Call | | | 7/24/15 | | | $ | 156.00 | | | | 3 | | | $ | 836 | |
| Euro Bund, Put | | | 7/24/15 | | | | 144.00 | | | | 3 | | | | 100 | |
| U.S. Dollar/Eurodollar, Put | | | 9/2/15 | | | | 1.06 | | | | 780,000 | | | | 5,167 | |
| U.S. Treasury 10-Year Notes Futures, Call | | | 7/24/15 | | | | 129.50 | | | | 8 | | | | 875 | |
| U.S. Treasury 10-Year Notes Futures, Call | | | 8/21/15 | | | | 130.00 | | | | 10 | | | | 2,188 | |
| U.S. Treasury 10-Year Notes Futures, Call | | | 8/21/15 | | | | 129.00 | | | | 6 | | | | 2,062 | |
| U.S. Treasury 10-Year Notes Futures, Call | | | 8/21/15 | | | | 129.50 | | | | 3 | | | | 797 | |
| U.S. Treasury 10-Year Notes Futures, Put | | | 7/24/15 | | | | 122.00 | | | | 4 | | | | 188 | |
| U.S. Treasury 10-Year Notes Futures, Put | | | 7/24/15 | | | | 123.50 | | | | 3 | | | | 328 | |
| U.S. Treasury 30-Year Bonds Futures, Call | | | 7/24/15 | | | | 155.00 | | | | 15 | | | | 12,422 | |
| U.S. Treasury 30-Year Bonds Futures, Call | | | 8/21/15 | | | | 159.00 | | | | 3 | | | | 1,959 | |
| U.S. Treasury 30-Year Bonds Futures, Put | | | 7/24/15 | | | | 145.00 | | | | 7 | | | | 2,953 | |
| U.S. Treasury Long Bond Futures, Call | | | 7/24/15 | | | | 156.00 | | | | 10 | | | | 6,406 | |
| U.S. Treasury Long Bond Futures, Call | | | 8/21/15 | | | | 160.00 | | | | 3 | | | | 1,922 | |
| U.S. Treasury Long Bond Futures, Put | | | 7/24/15 | | | | 144.00 | | | | 8 | | | | 2,500 | |
| U.S. Treasury Long Bond, Put | | | 7/2/15 | | | | 145.00 | | | | 14 | | | | 219 | |
| Total Written Options (Premiums received — $43,629) | | | | | | | | | | | $ | 40,922 | |
See Notes to Financial Statements.
| | |
| Western Asset Core Plus VIT Portfolio 2015 Semi-Annual Report | | 17 |
Statement of assets and liabilities (unaudited)
June 30, 2015
| | | | |
| |
| Assets: | | | | |
Investments, at value (Cost — $98,916,952) | | $ | 96,858,907 | |
Foreign currency, at value (Cost — $150,067) | | | 141,536 | |
Cash | | | 6,501,882 | |
Receivable for securities sold | | | 12,667,613 | |
Interest receivable | | | 720,011 | |
Deposits with brokers for open futures contracts | | | 368,421 | |
Deposits with brokers for centrally cleared swap contracts | | | 150,019 | |
Unrealized appreciation on forward foreign currency contracts | | | 53,756 | |
Deposits with brokers for open written options | | | 40,374 | |
Foreign currency collateral for open futures contracts, at value (Cost — $17,037) | | | 17,289 | |
Receivable for Portfolio shares sold | | | 15,357 | |
Receivable from broker — variation margin on open futures contracts | | | 13,062 | |
Principal paydown receivable | | | 4,430 | |
Deposits with brokers for open purchased options | | | 2,210 | |
Prepaid expenses | | | 441 | |
Total Assets | | | 117,555,308 | |
| |
| Liabilities: | | | | |
Payable for securities purchased | | | 30,067,436 | |
Payable to broker — variation margin on centrally cleared swaps | | | 59,898 | |
Investment management fee payable | | | 56,448 | |
Written options, at value (premiums received — $43,629) | | | 40,922 | |
Unrealized depreciation on forward foreign currency contracts | | | 20,783 | |
Payable for Portfolio shares repurchased | | | 745 | |
Service and/or distribution fees payable | | | 547 | |
Trustees’ fees payable | | | 237 | |
Accrued expenses | | | 57,838 | |
Total Liabilities | | | 30,304,854 | |
| Total Net Assets | | $ | 87,250,454 | |
| |
| Net Assets: | | | | |
Par value (Note 7) | | $ | 154 | |
Paid-in capital in excess of par value | | | 121,927,449 | |
Undistributed net investment income | | | 1,926,031 | |
Accumulated net realized loss on investments, futures contracts, written options,
swap contracts and foreign currency transactions | | | (34,368,206) | |
Net unrealized depreciation on investments, futures contracts, written options,
swap contracts and foreign currencies | | | (2,234,974) | |
| Total Net Assets | | $ | 87,250,454 | |
| |
| Shares Outstanding: | | | | |
Class I | | | 14,682,377 | |
Class II | | | 717,697 | |
| |
| Net Asset Value: | | | | |
Class I | | | $5.67 | |
Class II | | | $5.67 | |
See Notes to Financial Statements.
| | |
| 18 | | Western Asset Core Plus VIT Portfolio 2015 Semi-Annual Report |
Statement of operations (unaudited)
For the Six Months Ended June 30, 2015
| | | | |
| |
| Investment Income: | | | | |
Interest | | $ | 2,467,912 | |
Dividends | | | 77,939 | |
Less: Foreign taxes withheld | | | (7,406) | |
Total Investment Income | | | 2,538,445 | |
| |
| Expenses: | | | | |
Investment management fee (Note 2) | | | 235,681 | |
Legal fees | | | 35,370 | |
Audit and tax fees | | | 22,023 | |
Shareholder reports | | | 19,753 | |
Fund accounting fees | | | 4,594 | |
Custody fees | | | 1,872 | |
Insurance | | | 1,285 | |
Trustees’ fees | | | 667 | |
Service and/or distribution fees (Notes 2 and 5) | | | 638 | |
Transfer agent fees (Note 5) | | | 469 | |
Miscellaneous expenses | | | 1,252 | |
Total Expenses | | | 323,604 | |
Less: Fee waivers and/or expense reimbursements (Notes 2 and 5) | | | (32,673) | |
Net Expenses | | | 290,931 | |
| Net Investment Income | | | 2,247,514 | |
| |
Realized and Unrealized Gain (Loss) on Investments, Futures Contracts,
Written Options, Swap Contracts and Foreign Currency Transactions (Notes 1, 3 and 4): | | | | |
Net Realized Gain (Loss) From: | | | | |
Investment transactions | | | (2,401,620) | |
Futures contracts | | | (521,105) | |
Written options | | | 19,750 | |
Swap contracts | | | 43,783 | |
Foreign currency transactions | | | 147,618 | |
Net Realized Loss | | | (2,711,574) | |
Change in Net Unrealized Appreciation (Depreciation) From: | | | | |
Investments | | | 2,001,176 | |
Futures contracts | | | (251,484) | |
Written options | | | 2,707 | |
Swap contracts | | | 48,241 | |
Foreign currencies | | | (13,494) | |
Change in Net Unrealized Appreciation (Depreciation) | | | 1,787,146 | |
Increase from Payment by Affiliate (Note 2) | | | 78,761 | |
Net Loss on Investments, Futures Contracts, Written Options, Swap Contracts
and Foreign Currency Transactions | | | (845,667) | |
| Increase in Net Assets from Operations | | | $1,401,847 | |
See Notes to Financial Statements.
| | |
| Western Asset Core Plus VIT Portfolio 2015 Semi-Annual Report | | 19 |
Statements of changes in net assets
| | | | | | | | |
For the Six Months Ended June 30, 2015 (unaudited)
and the Year Ended December 31, 2014 | | 2015 | | | 2014 | |
| | |
| Operations: | | | | | | | | |
Net investment income | | $ | 2,247,514 | | | $ | 6,616,413 | |
Net realized gain (loss) | | | (2,711,574) | | | | 1,131,592 | |
Change in net unrealized appreciation (depreciation) | | | 1,787,146 | | | | (7,581,241) | |
Increase from payment by affiliate | | | 78,761 | | | | | |
Increase in Net Assets from Operations | | | 1,401,847 | | | | 166,764 | |
| | |
| Distributions to Shareholders From (Notes 1 and 6): | | | | | | | | |
Net investment income | | | (250,006) | | | | (6,890,013) | |
Decrease in Net Assets from Distributions to Shareholders | | | (250,006) | | | | (6,890,013) | |
| | |
| Portfolio Share Transactions (Note 7): | | | | | | | | |
Net proceeds from sale of shares | | | 4,452,637 | | | | 1,366,469 | |
Reinvestment of distributions | | | 250,006 | | | | 6,890,013 | |
Cost of shares repurchased | | | (9,007,374) | | | | (19,375,346) | |
Decrease in Net Assets from Portfolio Share Transactions | | | (4,304,731) | | | | (11,118,864) | |
Decrease in Net Assets | | | (3,152,890) | | | | (17,842,113) | |
| | |
| Net Assets: | | | | | | | | |
Beginning of period | | | 90,403,344 | | | | 108,245,457 | |
End of period* | | $ | 87,250,454 | | | $ | 90,403,344 | |
*Includesundistributed (overdistributed) net investment income, respectively, of: | | | $1,926,031 | | | | $(71,477) | |
See Notes to Financial Statements.
| | |
| 20 | | Western Asset Core Plus VIT Portfolio 2015 Semi-Annual Report |
Financial highlights
| | | | | | | | | | | | | | | | | | | | | | | | |
For a share of each class of beneficial interest outstanding throughout each year ended December 31,
unless otherwise noted: | |
| Class I Shares† | | 20151,2 | | | 20141 | | | 20131 | | | 20121 | | | 2011 | | | 2010 | |
| | | | | | |
| Net asset value, beginning of period | | | $5.60 | | | | $6.08 | | | | $6.00 | | | | $5.54 | | | | $5.95 | | | | $5.63 | |
| | | | | | |
| Income (loss) from operations: | | | | | | | | | | | | | | | | | | | | | | | | |
Net investment income | | | 0.15 | | | | 0.41 | | | | 0.44 | | | | 0.47 | | | | 0.55 | | | | 0.61 | |
Net realized and unrealized gain (loss) | | | (0.06) | | | | (0.43) | | | | 0.11 | | | | 0.52 | | | | (0.41) | | | | 0.32 | |
Total income (loss) from operations | | | 0.09 | | | | (0.02) | | | | 0.55 | | | | 0.99 | | | | 0.14 | | | | 0.93 | |
| | | | | | |
| Less distributions from: | | | | | | | | | | | | | | | | | | | | | | | | |
Net investment income | | | (0.02) | | | | (0.46) | | | | (0.47) | | | | (0.53) | | | | (0.55) | | | | (0.61) | |
Total distributions | | | (0.02) | | | | (0.46) | | | | (0.47) | | | | (0.53) | | | | (0.55) | | | | (0.61) | |
| | | | | | |
| Net asset value, end of period | | | $5.67 | | | | $5.60 | | | | $6.08 | | | | $6.00 | | | | $5.54 | | | | $5.95 | |
Total return3 | | | 1.54 | %4 | | | (0.33) | % | | | 9.21 | % | | | 17.88 | % | | | 2.40 | % | | | 16.63 | % |
| | | | | | |
| Net assets, end of period (millions) | | | $83 | | | | $90 | | | | $108 | | | | $120 | | | | $126 | | | | $158 | |
| | | | | | |
| Ratios to average net assets: | | | | | | | | | | | | | | | | | | | | | | | | |
Gross expenses | | | 0.73 | %5 | | | 0.75 | % | | | 0.74 | % | | | 0.72 | % | | | 0.68 | % | | | 0.68 | % |
Net expenses6 | | | 0.66 | 5,7 | | | 0.75 | | | | 0.74 | | | | 0.72 | | | | 0.68 | | | | 0.68 | |
Net investment income | | | 5.14 | 5 | | | 6.54 | | | | 6.97 | | | | 7.86 | | | | 8.01 | | | | 9.15 | |
| | | | | | |
| Portfolio turnover rate | | | 109 | %8 | | | 68 | % | | | 75 | % | | | 76 | % | | | 68 | % | | | 97 | % |
| † | In April 2015, the Portfolio’s outstanding class of shares, which was previously unnamed, became known as Class I shares. |
| 1 | Per share amounts have been calculated using the average shares method. |
| 2 | For the six months ended June 30, 2015 (unaudited). |
| 3 | Performance figures may reflect compensating balance arrangements, fee waivers and/or expense reimbursements. In the absence of compensating balance arrangements, fee waivers and/or expense reimbursements, the total return would have been lower. Total returns do not reflect expenses associated with separate accounts such as administrative fees, account charges and surrender charges which, if reflected, would reduce the total return for all periods shown. Past performance is no guarantee of future results. Total returns for periods of less than one year are not annualized. |
| 4 | The total return includes gains from payment by an affiliate. Without these gains, the total return would have been 1.36% for the six months ended June 30, 2015. |
| 6 | As a result of an expense limitation arrangement, effective April 15, 2015, the ratio of expenses, other than interest, brokerage, taxes, extraordinary expenses and acquired fund fees and expenses, to average net assets of Class I shares did not exceed 0.54%. This expense limitation arrangement cannot be terminated prior to December 31, 2016 without the Board of Trustees’ consent. Prior to April 15, 2015, as a result of the expense limitation arrangement, the ratio of expenses, other than interest, brokerage, taxes, extraordinary expenses and acquired fund fees and expenses, to average net assets of Class I shares did not exceed 1.00%. |
| 7 | Reflects fee waivers and/or expense reimbursements. |
| 8 | Excluding mortgage dollar roll transactions. If mortgage dollar roll transactions had been included, the portfolio turnover rate would have been 181% for the six months ended June 30, 2015. |
See Notes to Financial Statements.
| | |
| Western Asset Core Plus VIT Portfolio 2015 Semi-Annual Report | | 21 |
Financial highlights (cont’d)
| | | | |
For a share of each class of beneficial interest outstanding throughout each year ended December 31,
unless otherwise noted: | |
| Class II Shares1 | | 20152 | |
| |
| Net asset value, beginning of period | | | $5.77 | |
| |
| Income (loss) from operations: | | | | |
Net investment income | | | 0.02 | |
Net realized and unrealized loss | | | (0.10) | |
Total loss from operations | | | (0.08) | |
| |
| Less distributions from: | | | | |
Net investment income | | | (0.02) | |
Total distributions | | | (0.02) | |
| |
| Net asset value, end of period | | | $5.67 | |
Total return3 | | | (1.45) | %4 |
| |
| Net assets, end of period (millions) | | | $4 | |
| |
| Ratios to average net assets: | | | | |
Gross expenses5 | | | 1.21 | % |
Net expenses5,6,7 | | | 0.76 | |
Net investment income5 | | | 2.09 | |
| |
| Portfolio turnover rate8 | | | 109 | %9 |
| 1 | Per share amounts have been calculated using the average shares method. |
| 2 | For the period May 1, 2015 (inception date) to June 30, 2015. |
| 3 | Performance figures may reflect compensating balance arrangements, fee waivers and/or expense reimbursements. In the absence of compensating balance arrangements, fee waivers and/or expense reimbursements, the total return would have been lower. Total returns do not reflect expenses associated with separate accounts such as administrative fees, account charges and surrender charges which, if reflected, would reduce the total return for all periods shown. Past performance is no guarantee of future results. Total returns for periods of less than one year are not annualized. |
| 4 | The total return includes gains from payment by an affiliate. Without these gains, the total return would not have changed for the period ended June 30, 2015. |
| 6 | As a result of an expense limitation arrangement, the ratio of expenses, other than interest, brokerage, taxes, extraordinary expenses and acquired fund fees and expenses, to average net assets of Class II shares did not exceed 0.79%. This expense limitation arrangement cannot be terminated prior to December 31, 2016 without the Board of Trustees’ consent. |
| 7 | Reflects fee waivers and/or expense reimbursements. |
| 8 | For the six months ended June 30, 2015 (unaudited). |
| 9 | Excluding mortgage dollar roll transactions. If mortgage dollar roll transactions had been included, the portfolio turnover rate would have been 181% for the six months ended June 30, 2015. |
See Notes to Financial Statements.
| | |
| 22 | | Western Asset Core Plus VIT Portfolio 2015 Semi-Annual Report |
Notes to financial statements (unaudited)
1. Organization and significant accounting policies
Western Asset Core Plus VIT Portfolio (formerly Western Asset Variable High Income Portfolio) (the “Portfolio”) is a separate diversified investment series of Legg Mason Partners Variable Income Trust (the “Trust”). The Trust, a Maryland statutory trust, is registered under the Investment Company Act of 1940, as amended (the “1940 Act”), as an open-end management investment company.
Shares of the Portfolio may only be purchased or redeemed through variable annuity contracts and variable life insurance policies offered by the separate accounts of participating insurance companies or through eligible pension or other qualified plans.
Effective April 15, 2015, the Portfolio’s name, investment objective, 80% investment policy, principal investment strategies, management fee, benchmark and portfolio management team were changed. In addition, two affiliates of the Portfolio’s subadviser were made additional subadvisers.
The following are significant accounting policies consistently followed by the Portfolio and are in conformity with U.S. generally accepted accounting principles (“GAAP”). Estimates and assumptions are required to be made regarding assets, liabilities and changes in net assets resulting from operations when financial statements are prepared. Changes in the economic environment, financial markets and any other parameters used in determining these estimates could cause actual results to differ. Subsequent events have been evaluated through the date the financial statements were issued.
(a) Investment valuation. The valuations for fixed income securities (which may include, but are not limited to, corporate, government, municipal, mortgage-backed, collateralized mortgage obligations and asset-backed securities) and certain derivative instruments are typically the prices supplied by independent third party pricing services, which may use market prices or broker/dealer quotations or a variety of valuation techniques and methodologies. The independent third party pricing services use inputs that are observable such as issuer details, interest rates, yield curves, prepayment speeds, credit risks/spreads, default rates and quoted prices for similar securities. Short-term fixed income securities that will mature in 60 days or less are valued at amortized cost, unless it is determined that using this method would not reflect an investment’s fair value. Futures contracts are valued daily at the settlement price established by the board of trade or exchange on which they are traded. Equity securities for which market quotations are available are valued at the last reported sales price or official closing price on the primary market or exchange on which they trade. When the Portfolio holds securities or other assets that are denominated in a foreign currency, the Portfolio will normally use the currency exchange rates as of 4:00 p.m. (Eastern Time). If independent third party pricing services are unable to supply prices for a portfolio investment, or if the prices supplied are deemed by the manager to be unreliable, the market price may be determined by the manager using quotations from one or more broker/dealers or at the transaction price if the security has recently been purchased and no value has yet been obtained from a pricing service or pricing broker. When reliable prices are not readily available, such as when the value of a security has been significantly affected by events after the close of the exchange or market on which the security is principally traded, but before the Portfolio calculates its net asset value, the Portfolio values these securities as determined in accordance with procedures approved by the Portfolio’s Board of Trustees.
| | |
| Western Asset Core Plus VIT Portfolio 2015 Semi-Annual Report | | 23 |
Notes to financial statements (unaudited) (cont’d)
The Board of Trustees is responsible for the valuation process and has delegated the supervision of the daily valuation process to the Legg Mason North Atlantic Fund Valuation Committee (formerly, Legg Mason North American Fund Valuation Committee) (the “Valuation Committee”). The Valuation Committee, pursuant to the policies adopted by the Board of Trustees, is responsible for making fair value determinations, evaluating the effectiveness of the Portfolio’s pricing policies, and reporting to the Board of Trustees. When determining the reliability of third party pricing information for investments owned by the Portfolio, the Valuation Committee, among other things, conducts due diligence reviews of pricing vendors, monitors the daily change in prices and reviews transactions among market participants.
The Valuation Committee will consider pricing methodologies it deems relevant and appropriate when making fair value determinations. Examples of possible methodologies include, but are not limited to, multiple of earnings; discount from market of a similar freely traded security; discounted cash-flow analysis; book value or a multiple thereof; risk premium/yield analysis; yield to maturity; and/or fundamental investment analysis. The Valuation Committee will also consider factors it deems relevant and appropriate in light of the facts and circumstances. Examples of possible factors include, but are not limited to, the type of security; the issuer’s financial statements; the purchase price of the security; the discount from market value of unrestricted securities of the same class at the time of purchase; analysts’ research and observations from financial institutions; information regarding any transactions or offers with respect to the security; the existence of merger proposals or tender offers affecting the security; the price and extent of public trading in similar securities of the issuer or comparable companies; and the existence of a shelf registration for restricted securities.
For each portfolio security that has been fair valued pursuant to the policies adopted by the Board of Trustees, the fair value price is compared against the last available and next available market quotations. The Valuation Committee reviews the results of such back testing monthly and fair valuation occurrences are reported to the Board of Trustees quarterly.
The Portfolio uses valuation techniques to measure fair value that are consistent with the market approach and/or income approach, depending on the type of security and the particular circumstance. The market approach uses prices and other relevant information generated by market transactions involving identical or comparable securities. The income approach uses valuation techniques to discount estimated future cash flows to present value.
GAAP establishes a disclosure hierarchy that categorizes the inputs to valuation techniques used to value assets and liabilities at measurement date. These inputs are summarized in the three broad levels listed below:
| • | | Level 1 — quoted prices in active markets for identical investments |
| • | | Level 2 — other significant observable inputs (including quoted prices for similar investments, interest rates, prepayment speeds, credit risk, etc.) |
| • | | Level 3 — significant unobservable inputs (including the Portfolio’s own assumptions in determining the fair value of investments) |
The inputs or methodologies used to value securities are not necessarily an indication of the risk associated with investing in those securities.
| | |
| 24 | | Western Asset Core Plus VIT Portfolio 2015 Semi-Annual Report |
The following is a summary of the inputs used in valuing the Portfolio’s assets and liabilities carried at fair value:
| | | | | | | | | | | | | | | | |
| ASSETS | |
| Description | | Quoted Prices
(Level 1) | | | Other Significant
Observable Inputs
(Level 2) | | | Significant
Unobservable
Inputs
(Level 3) | | | Total | |
| Long-term investments†: | | | | | | | | | | | | | | | | |
Corporate bonds & notes: | | | | | | | | | | | | | | | | |
Consumer discretionary | | | — | | | $ | 1,911,516 | | | $ | 561,453 | | | $ | 2,472,969 | |
Industrials | | | — | | | | 2,465,055 | | | | 167,423 | | | | 2,632,478 | |
Materials | | | — | | | | 2,333,488 | | | | 0 | * | | | 2,333,488 | |
Other corporate bonds & notes | | | — | | | | 16,389,220 | | | | — | | | | 16,389,220 | |
Asset-backed securities | | | — | | | | 283,012 | | | | — | | | | 283,012 | |
Collateralized mortgage obligations | | | — | | | | 8,431,865 | | | | 3,461,411 | | | | 11,893,276 | |
Convertible bonds & notes | | | — | | | | 282,436 | | | | — | | | | 282,436 | |
Mortgage-backed securities | | | — | | | | 18,114,414 | | | | — | | | | 18,114,414 | |
Senior loans: | | | | | | | | | | | | | | | | |
Energy | | | — | | | | 148,600 | | | | 184,324 | | | | 332,924 | |
Other senior loans | | | — | | | | 2,459,465 | | | | | | | | 2,459,465 | |
Sovereign bonds | | | — | | | | 6,687,143 | | | | — | | | | 6,687,143 | |
U.S. government & agency obligations | | | — | | | | 17,365,802 | | | | — | | | | 17,365,802 | |
U.S. treasury inflation protected securities | | | — | | | | 883,172 | | | | — | | | | 883,172 | |
Non-U.S. treasury inflation protected securities | | | — | | | | 172,661 | | | | — | | | | 172,661 | |
Common stocks: | | | | | | | | | | | | | | | | |
Consumer discretionary | | $ | 242,772 | | | | — | | | | 33,764 | | | | 276,536 | |
Energy | | | — | | | | — | | | | 1,113,385 | | | | 1,113,385 | |
Health care | | | — | | | | — | | | | 290,500 | | | | 290,500 | |
Industrials | | | — | | | | — | | | | 257,379 | | | | 257,379 | |
Other common stocks | | | 739,087 | | | | — | | | | — | | | | 739,087 | |
Convertible preferred stocks | | | — | | | | 82,769 | | | | — | | | | 82,769 | |
Preferred stocks | | | 1,630,872 | | | | — | | | | — | | | | 1,630,872 | |
Purchased options | | | 1,906 | | | | — | | | | — | | | | 1,906 | |
Warrants | | | — | | | | 164,050 | | | | — | | | | 164,050 | |
| Total long-term investments | | $ | 2,614,637 | | | $ | 78,174,668 | | | $ | 6,069,639 | | | $ | 86,858,944 | |
| Short-term investments† | | | — | | | | 9,999,963 | | | | — | | | | 9,999,963 | |
| Total investments | | $ | 2,614,637 | | | $ | 88,174,631 | | | $ | 6,069,639 | | | $ | 96,858,907 | |
| Other financial instruments: | | | | | | | | | | | | | | | | |
Forward foreign currency contracts | | | — | | | $ | 53,756 | | | | — | | | $ | 53,756 | |
Centrally cleared interest rate swaps | | | — | | | | 52,208 | | | | — | | | | 52,208 | |
Centrally cleared credit default swaps on credit indices — buy protection | | | — | | | | 15,036 | | | | — | | | | 15,036 | |
Futures contracts | | $ | 98,573 | | | | — | | | | — | | | | 98,573 | |
| Total other financial instruments | | $ | 98,573 | | | $ | 121,000 | | | | — | | | $ | 219,573 | |
| Total | | $ | 2,713,210 | | | $ | 88,295,631 | | | $ | 6,069,639 | | | $ | 97,078,480 | |
| | |
| Western Asset Core Plus VIT Portfolio 2015 Semi-Annual Report | | 25 |
Notes to financial statements (unaudited) (cont’d)
| | | | | | | | | | | | | | | | |
| LIABILITIES | |
| Description | | Quoted Prices
(Level 1) | | | Other Significant
Observable Inputs
(Level 2) | | | Significant
Unobservable
Inputs
(Level 3) | | | Total | |
| Other financial instruments: | | | | | | | | | | | | | | | | |
Written options | | $ | 35,755 | | | $ | 5,167 | | | | — | | | $ | 40,922 | |
Forward foreign currency contracts | | | — | | | | 20,783 | | | | — | | | | 20,783 | |
Centrally cleared credit default swaps on credit indices — buy protection | | | — | | | | 19,003 | | | | — | | | | 19,003 | |
Futures contracts | | | 350,057 | | | | — | | | | — | | | | 350,057 | |
| Total | | $ | 385,812 | | | $ | 44,953 | | | | — | | | $ | 430,765 | |
| † | See Schedule of Investments for additional detailed categorizations. |
| * | Amount represents less than $1. |
The following is a reconciliation of investments in which significant unobservable inputs (Level 3) were used in determining fair value:
| | | | | | | | | | | | | | | | | | | | | | | | |
| | | Corporate Bonds & Notes | | | | | | | |
| Investments in Securities | | Consumer
Discretionary | | | Industrials | | | Materials | | | Utilities | | | Collateralized
Mortgage
Obligations | | | Senior
Loans | |
| Balance as of December 31, 2014 | | $ | 617,016 | | | | — | | | $ | 0 | * | | $ | 0 | * | | | — | | | | — | |
| Accrued premiums/discounts | | | 3,594 | | | | — | | | | — | | | | — | | | $ | 1,028 | | | | — | |
| Realized gain (loss)1 | | | 4 | | | | — | | | | — | | | | (76,916) | | | | 876 | | | | — | |
| Change in unrealized appreciation (depreciation)2 | | | 35,052 | | | | — | | | | — | | | | 77,720 | | | | (2,321) | | | | — | |
| Purchases | | | 16,167 | | | | — | | | | — | | | | — | | | | 3,481,006 | | | | — | |
| Sales | | | (110,380) | | | | — | | | | — | | | | (804) | | | | (19,178) | | | | — | |
| Transfers into Level 33 | | | — | | | $ | 167,423 | | | | — | | | | — | | | | — | | | $ | 184,324 | |
| Transfers out of Level 3 | | | — | | | | — | | | | — | | | | — | | | | — | | | | — | |
Balance as of
June 30, 2015 | | $ | 561,453 | | | $ | 167,423 | | | $ | 0 | * | | | — | | | $ | 3,461,411 | | | $ | 184,324 | |
| Net change in unrealized appreciation (depreciation) for investments in securities still held at June 30, 20152 | | $ | 33,772 | | | | — | | | | — | | | | — | | | $ | (2,321) | | | | — | |
| | |
| 26 | | Western Asset Core Plus VIT Portfolio 2015 Semi-Annual Report |
| | | | | | | | | | | | | | | | | | | | | | | | |
| | | Common Stocks | | | | |
| Investments in Securities (cont’d) | | Consumer
Discretionary | | | Energy | | | Health
Care | | | Industrials | | | Materials | | | Total | |
| Balance as of December 31, 2014 | | $ | 0 | * | | $ | 222,807 | | | $ | 290,500 | | | $ | 824,507 | | | $ | 15,025 | | | $ | 1,969,855 | |
| Accrued premiums/discounts | | | — | | | | — | | | | — | | | | — | | | | — | | | | 4,622 | |
| Realized gain (loss) | | | — | | | | — | | | | — | | | | — | | | | — | | | | (76,036) | |
| Change in unrealized appreciation (depreciation)2 | | | — | | | | 890,578 | | | | — | | | | (567,128) | | | | 41,643 | | | | 475,544 | |
| Purchases | | | — | | | | — | | | | — | | | | — | | | | — | | | | 3,497,173 | |
| Sales | | | — | | | | — | | | | — | | | | — | | | | — | | | | (130,362) | |
| Transfers into Level 33 | | | 33,764 | | | | — | | | | — | | | | — | | | | — | | | | 385,511 | |
| Transfers out of Level 34 | | | — | | | | — | | | | — | | | | — | | | | (56,668) | | | | (56,668) | |
| Balance as of June 30, 2015 | | $ | 33,764 | | | $ | 1,113,385 | | | $ | 290,500 | | | $ | 257,379 | | | | — | | | $ | 6,069,639 | |
| Net change in unrealized appreciation (depreciation) for investments in securities still held at June 30, 20152 | | | — | | | $ | 890,578 | | | | — | | | $ | (567,128) | | | $ | 41,643 | | | $ | 396,544 | |
The Portfolio’s policy is to recognize transfers between levels as of the end of the reporting period.
| * | Amount represents less than $1. |
| 1 | This amount is included in net realized gain (loss) from investment transactions in the accompanying Statement of Operations. |
| 2 | This amount is included in the change in net unrealized appreciation (depreciation) in the accompanying Statement of Operations. Change in unrealized appreciation (depreciation) includes net unrealized appreciation (depreciation) resulting from changes in investment values during the reporting period and the reversal of previously recorded unrealized appreciation (depreciation) when gains or losses are realized. |
| 3 | Transferred into Level 3 as a result of the unavailability of a quoted price in an active market for an identical investment or the unavailability of other significant observable inputs. |
| 4 | Transferred out of Level 3 as a result of the availability of a quoted price in an active market for an identical investment or the availability of other significant observable inputs. |
The following table summarizes the valuation techniques used and unobservable inputs approved by the Valuation Committee to determine the fair value of certain, material Level 3 investments. The table does not include Level 3 investments with values derived utilizing prices from prior transactions or third party pricing information without adjustment (e.g., broker quotes, pricing services, net asset values).
| | | | | | | | | | | | | | | | | | | | |
| | | Fair Value
at 6/30/15
(000’s) | | | Valuation
Technique(s) | | | Unobservable Input(s) | | | Range/ Weighted
Average | | | Impact to Valuation
from an Increase in
Input* | |
| Common Stock | | $ | 1,113 | | | | Market Approach | | | | EBITDA Multiple | | | | 6.98x | | | | Increase | |
| | | | | | | | | | | | Liquidity Discount | | | | 5.50 | % | | | Decrease | |
| * | This column represents the directional change in the fair value of the Level 3 investments that would result in an increase from the corresponding unobservable input. A decrease to the unobservable input would have the opposite effect. Significant increases and decreases in these unobservable inputs in isolation could result in significantly higher or lower fair value measurements. |
(b) Repurchase agreements. The Portfolio may enter into repurchase agreements with institutions that its investment adviser has determined are creditworthy. Each repurchase agreement is recorded at cost. Under the terms of a typical repurchase agreement, the Portfolio acquires a debt security subject to an obligation of the seller to repurchase, and of the
| | |
| Western Asset Core Plus VIT Portfolio 2015 Semi-Annual Report | | 27 |
Notes to financial statements (unaudited) (cont’d)
Portfolio to resell, the security at an agreed-upon price and time, thereby determining the yield during the Portfolio’s holding period. When entering into repurchase agreements, it is the Portfolio’s policy that its custodian or a third party custodian, acting on the Portfolio’s behalf, take possession of the underlying collateral securities, the market value of which, at all times, at least equals the principal amount of the repurchase transaction, including accrued interest. To the extent that any repurchase transaction maturity exceeds one business day, the value of the collateral is marked-to-market and measured against the value of the agreement in an effort to ensure the adequacy of the collateral. If the counterparty defaults, the Portfolio generally has the right to use the collateral to satisfy the terms of the repurchase transaction. However, if the market value of the collateral declines during the period in which the Portfolio seeks to assert its rights or if bankruptcy proceedings are commenced with respect to the seller of the security, realization of the collateral by the Portfolio may be delayed or limited.
(c) Securities traded on a to-be-announced basis. The Portfolio may trade securities on a to-be-announced (“TBA”) basis. In a TBA transaction, the Portfolio commits to purchasing or selling securities which have not yet been issued by the issuer and for which specific information, such as the face amount, maturity date and underlying pool of investments in U.S. government agency mortgage pass-through securities, is not announced. Securities purchased on a TBA basis are not settled until they are delivered to the Portfolio. Beginning on the date the Portfolio enters into a TBA transaction, cash, U.S. government securities or other liquid high-grade debt obligations are segregated in an amount equal in value to the purchase price of the TBA security. These securities are subject to market fluctuations and their current value is determined in the same manner as for other securities.
(d) Mortgage dollar rolls. The Portfolio may enter into mortgage dollar rolls in which the Portfolio sells mortgage-backed securities for delivery in the current month, realizing a gain or loss, and simultaneously contracts to repurchase substantially similar (same type, coupon and maturity) securities to settle on a specified future date.
The Portfolio executes its mortgage dollar rolls entirely in TBA market, whereby the Portfolio makes a forward commitment to purchase a security and, instead of accepting delivery, the position is offset by a sale of the security with a simultaneous agreement to repurchase at a future date. The Portfolio accounts for mortgage dollar rolls as purchases and sales.
The risk of entering into mortgage dollar rolls is that the market value of the securities the Portfolio is obligated to repurchase under the agreement may decline below the repurchase price. In the event the buyer of securities under a mortgage dollar roll files for bankruptcy or becomes insolvent, the Portfolio’s use of the proceeds of the mortgage dollar roll may be restricted pending a determination by the counterparty, or its trustee or receiver, whether to enforce the Portfolio’s obligation to repurchase the securities.
(e) Inflation-indexed bonds. Inflation-indexed bonds are fixed-income securities whose principal value or interest rate is periodically adjusted according to the rate of inflation. As the index measuring inflation changes, the principal value or interest rate of inflation-indexed
| | |
| 28 | | Western Asset Core Plus VIT Portfolio 2015 Semi-Annual Report |
bonds will be adjusted accordingly. Inflation adjustments to the principal amount of inflation-indexed bonds are reflected as an increase or decrease to investment income on the Statement of Operations. Repayment of the original bond principal upon maturity (as adjusted for inflation) is guaranteed in the case of U.S. Treasury inflation-indexed bonds. For bonds that do not provide a similar guarantee, the adjusted principal value of the bond repaid at maturity may be less than the original principal.
(f) Foreign currency translation. Investment securities and other assets and liabilities denominated in foreign currencies are translated into U.S. dollar amounts based upon prevailing exchange rates on the date of valuation. Purchases and sales of investment securities and income and expense items denominated in foreign currencies are translated into U.S. dollar amounts based upon prevailing exchange rates on the respective dates of such transactions.
The Portfolio does not isolate that portion of the results of operations resulting from fluctuations in foreign exchange rates on investments from the fluctuations arising from changes in market prices of securities held. Such fluctuations are included with the net realized and unrealized gain or loss on investments.
Net realized foreign exchange gains or losses arise from sales of foreign currencies, including gains and losses on forward foreign currency contracts, currency gains or losses realized between the trade and settlement dates on securities transactions, and the difference between the amounts of dividends, interest, and foreign withholding taxes recorded on the Portfolio’s books and the U.S. dollar equivalent of the amounts actually received or paid. Net unrealized foreign exchange gains and losses arise from changes in the values of assets and liabilities, other than investments in securities, on the date of valuation, resulting from changes in exchange rates.
Foreign security and currency transactions may involve certain considerations and risks not typically associated with those of U.S. dollar denominated transactions as a result of, among other factors, the possibility of lower levels of governmental supervision and regulation of foreign securities markets and the possibility of political or economic instability.
(g) Forward foreign currency contracts. The Portfolio enters into a forward foreign currency contract to hedge against foreign currency exchange rate risk on its non-U.S. dollar denominated securities or to facilitate settlement of a foreign currency denominated portfolio transaction. A forward foreign currency contract is an agreement between two parties to buy and sell a currency at a set price with delivery and settlement at a future date. The contract is marked-to-market daily and the change in value is recorded by the Portfolio as an unrealized gain or loss. When a forward foreign currency contract is closed, through either delivery or offset by entering into another forward foreign currency contract, the Portfolio recognizes a realized gain or loss equal to the difference between the value of the contract at the time it was opened and the value of the contract at the time it is closed.
Forward foreign currency contracts involve elements of market risk in excess of the amounts reflected on the Statement of Assets and Liabilities. The Portfolio bears the risk of an
| | |
| Western Asset Core Plus VIT Portfolio 2015 Semi-Annual Report | | 29 |
Notes to financial statements (unaudited) (cont’d)
unfavorable change in the foreign exchange rate underlying the forward foreign currency contract. Risks may also arise upon entering into these contracts from the potential inability of the counterparties to meet the terms of their contracts.
(h) Swap agreements. The Portfolio invests in swaps for the purpose of managing its exposure to interest rate, credit or market risk, or for other purposes. The use of swaps involves risks that are different from those associated with other portfolio transactions. Swap agreements are privately negotiated in the over-the-counter market (“OTC Swaps”) or may be executed on a registered exchange (“Centrally Cleared Swaps”). Unlike Centrally Cleared Swaps, the Portfolio has credit exposure to the counterparties of OTC Swaps.
Swap contracts are marked-to-market daily and changes in value are recorded as unrealized appreciation (depreciation). The daily change in valuation of Centrally Cleared Swaps, if any, is recorded as a receivable or payable for variation margin on the Statement of Assets and Liabilities. Gains or losses are realized upon termination of the swap agreement. Collateral, in the form of restricted cash or securities, may be required to be held in segregated accounts with the Portfolio’s custodian in compliance with the terms of the swap contracts. Securities posted as collateral for swap contracts are identified in the Schedule of Investments and restricted cash, if any, is identified on the Statement of Assets and Liabilities. Risks may exceed amounts recorded in the Statement of Assets and Liabilities. These risks include changes in the returns of the underlying instruments, failure of the counterparties to perform under the contracts’ terms, and the possible lack of liquidity with respect to the swap agreements.
OTC swap payments received or made at the beginning of the measurement period are reflected as a premium or deposit, respectively, on the Statement of Assets and Liabilities. These upfront payments are amortized over the life of the swap and are recognized as realized gain or loss in the Statement of Operations. Net periodic payments received or paid by the Portfolio are recognized as a realized gain or loss in the Statement of Operations.
The Portfolio’s maximum exposure in the event of a defined credit event on a credit default swap to sell protection is the notional amount. As of June 30, 2015, the Portfolio did not hold any credit default swaps to sell protection.
For average notional amounts of swaps held during the six months ended June 30, 2015, see Note 4.
Credit default swaps
The Portfolio enters into credit default swap (“CDS”) contracts for investment purposes, to manage its credit risk or to add leverage. CDS agreements involve one party making a stream of payments to another party in exchange for the right to receive a specified return in the event of a default by a third party, typically corporate or sovereign issuers, on a specified obligation, or in the event of a write-down, principal shortfall, interest shortfall or default of all or part of the referenced entities comprising a credit index. The Portfolio may use a CDS to provide protection against defaults of the issuers (i.e., to reduce risk where the Portfolio has exposure to an issuer) or to take an active long or short position with
| | |
| 30 | | Western Asset Core Plus VIT Portfolio 2015 Semi-Annual Report |
respect to the likelihood of a particular issuer’s default. As a seller of protection, the Portfolio generally receives an upfront payment or a stream of payments throughout the term of the swap provided that there is no credit event. If the Portfolio is a seller of protection and a credit event occurs, as defined under the terms of that particular swap agreement, the maximum potential amount of future payments (undiscounted) that the Portfolio could be required to make under a credit default swap agreement would be an amount equal to the notional amount of the agreement. These amounts of potential payments will be partially offset by any recovery of values from the respective referenced obligations. As a seller of protection, the Portfolio effectively adds leverage to its portfolio because, in addition to its total net assets, the Portfolio is subject to investment exposure on the notional amount of the swap. As a buyer of protection, the Portfolio generally receives an amount up to the notional value of the swap if a credit event occurs.
Implied spreads are the theoretical prices a lender receives for credit default protection. When spreads rise, market perceived credit risk rises and when spreads fall, market perceived credit risk falls. The implied credit spread of a particular referenced entity reflects the cost of buying/selling protection and may include upfront payments required to enter into the agreement. Wider credit spreads and decreasing market values, when compared to the notional amount of the swap, represent a deterioration of the referenced entity’s credit soundness and a greater likelihood or risk of default or other credit event occurring as defined under the terms of the agreement. Credit spreads utilized in determining the period end market value of credit default swap agreements on corporate or sovereign issues are disclosed in the Notes to Financial Statements and serve as an indicator of the current status of the payment/performance risk and represent the likelihood or risk of default for credit derivatives. For credit default swap agreements on asset-backed securities and credit indices, the quoted market prices and resulting values, particularly in relation to the notional amount of the contract as well as the annual payment rate, serve as an indication of the current status of the payment/performance risk.
The Portfolio’s maximum risk of loss from counterparty risk, as the protection buyer, is the fair value of the contract (this risk is mitigated by the posting of collateral by the counterparty to the Portfolio to cover the Portfolio’s exposure to the counterparty). As the protection seller, the Portfolio’s maximum risk is the notional amount of the contract. Credit default swaps are considered to have credit risk-related contingent features since they require payment by the protection seller to the protection buyer upon the occurrence of a defined credit event.
Entering into a CDS agreement involves, to varying degrees, elements of credit, market and documentation risk in excess of the related amounts recognized on the Statement of Assets and Liabilities. Such risks involve the possibility that there will be no liquid market for these agreements, that the counterparty to the agreement may default on its obligation to perform or disagree as to the meaning of the contractual terms in the agreement, and that there will be unfavorable changes in net interest rates.
| | |
| Western Asset Core Plus VIT Portfolio 2015 Semi-Annual Report | | 31 |
Notes to financial statements (unaudited) (cont’d)
Interest rate swaps
The Portfolio enters into interest rate swap contracts to manage its exposure to interest rate risk. Interest rate swaps are agreements between two parties to exchange cash flows based on a notional principal amount. The Portfolio may elect to pay a fixed rate and receive a floating rate, or receive a fixed rate and pay a floating rate, on a notional principal amount. Interest rate swaps are marked-to-market daily based upon quotations from market makers and the change, if any, is recorded as an unrealized gain or loss in the Statement of Operations. When a swap contract is terminated early, the Portfolio records a realized gain or loss equal to the difference between the original cost and the settlement amount of the closing transaction.
The risks of interest rate swaps include changes in market conditions that will affect the value of the contract or changes in the present value of the future cash flow streams and the possible inability of the counterparty to fulfill its obligations under the agreement. The Portfolio’s maximum risk of loss from counterparty credit risk is the discounted net value of the cash flows to be received from the counterparty over the contract’s remaining life, to the extent that that amount is positive. This risk is mitigated by the posting of collateral by the counterparty to the Portfolio to cover the Portfolio’s exposure to the counterparty.
(i) Purchased options. When the Portfolio purchases an option, an amount equal to the premium paid by the Portfolio is recorded as an investment on the Statement of Assets and Liabilities, the value of which is marked-to-market to reflect the current market value of the option purchased. If the purchased option expires, the Portfolio realizes a loss equal to the amount of premium paid. When an instrument is purchased or sold through the exercise of an option, the related premium paid is added to the basis of the instrument acquired or deducted from the proceeds of the instrument sold. The risk associated with purchasing put and call options is limited to the premium paid.
(j) Written options. When the Portfolio writes an option, an amount equal to the premium received by the Portfolio is recorded as a liability, the value of which is marked-to-market daily to reflect the current market value of the option written. If the option expires, the premium received is recorded as a realized gain. When a written call option is exercised, the difference between the premium received plus the option exercise price and the Portfolio’s basis in the underlying security (in the case of a covered written call option), or the cost to purchase the underlying security (in the case of an uncovered written call option), including brokerage commission, is recognized as a realized gain or loss. When a written put option is exercised, the amount of the premium received is subtracted from the cost of the security purchased by the Portfolio from the exercise of the written put option to form the Portfolio’s basis in the underlying security purchased. The writer or buyer of an option traded on an exchange can liquidate the position before the exercise of the option by entering into a closing transaction. The cost of a closing transaction is deducted from the original premium received resulting in a realized gain or loss to the Portfolio.
The risk in writing a covered call option is that the Portfolio may forego the opportunity of profit if the market price of the underlying security increases and the option is exercised.
| | |
| 32 | | Western Asset Core Plus VIT Portfolio 2015 Semi-Annual Report |
The risk in writing a put option is that the Portfolio may incur a loss if the market price of the underlying security decreases and the option is exercised. The risk in writing an uncovered call option is that the Portfolio is exposed to the risk of loss if the market price of the underlying security increases. In addition, there is the risk that the Portfolio may not be able to enter into a closing transaction because of an illiquid secondary market.
(k) Futures contracts. The Portfolio uses futures contracts generally to gain exposure to, or hedge against, changes in interest rates or gain exposure to, or hedge against, changes in certain asset classes. A futures contract represents a commitment for the future purchase or sale of an asset at a specified price on a specified date.
Upon entering into a futures contract, the Portfolio is required to deposit cash or cash equivalents with a broker in an amount equal to a certain percentage of the contract amount. This is known as the ‘‘initial margin’’ and subsequent payments (‘‘variation margin’’) are made or received by the Portfolio each day, depending on the daily fluctuation in the value of the contract. For certain futures, including foreign denominated futures, variation margin is not settled daily, but is recorded as a net variation margin payable or receivable. The daily changes in contract value are recorded as unrealized gains or losses in the Consolidated Statement of Operations and the Portfolio recognizes a realized gain or loss when the contract is closed.
Futures contracts involve, to varying degrees, risk of loss in excess of the amounts reflected in the financial statements. In addition, there is the risk that the Portfolio may not be able to enter into a closing transaction because of an illiquid secondary market.
(l) Options on futures contracts. An option on a futures contract gives the purchaser the right, in return for the premium paid, to assume a position in the underlying futures contract at the specified option exercise price at any time prior to the expiration date of the option. Upon exercise of an option, the delivery of the futures position by the writer of the option to the holder of the option will be accompanied by delivery of the accumulated balance in the writer’s futures margin account that represents the amount by which the market price of the futures contract exceeds (in the case of a call) or is less than (in the case of a put) the exercise price of the option on the futures contract. The potential for loss related to the purchase of an option on a futures contract is limited to the premium paid for the option plus transaction costs. Because the value of the option is fixed at the point of purchase, there are no daily cash payments by the purchaser to reflect changes in the value of the underlying contract; however, the value of the option changes daily and that change would be reflected in the net asset value of the Portfolio. The potential for loss related to writing call options is unlimited. The potential for loss related to writing put options is limited only by the aggregate strike price of the put option less the premium received.
(m) Stripped securities. The Portfolio may invest in ‘‘Stripped Securities,’’ a term used collectively for components, or strips, of fixed income securities. Stripped securities can be principal only securities (“PO”), which are debt obligations that have been stripped of unmatured interest coupons, or interest only securities (“IO”), which are unmatured interest
| | |
| Western Asset Core Plus VIT Portfolio 2015 Semi-Annual Report | | 33 |
Notes to financial statements (unaudited) (cont’d)
coupons that have been stripped from debt obligations. The market value of Stripped Securities will fluctuate in response to changes in economic conditions, rates of pre-payment, interest rates and the market’s perception of the securities. However, fluctuations in response to interest rates may be greater in Stripped Securities than for debt obligations of comparable maturities that pay interest currently. The amount of fluctuation may increase with a longer period of maturity.
The yield to maturity on IO’s is sensitive to the rate of principal repayments (including prepayments) on the related underlying debt obligation and principal payments may have a material effect on yield to maturity. If the underlying debt obligation experiences greater than anticipated prepayments of principal, the Portfolio may not fully recoup its initial investment in IO’s.
(n) Loan participations. The Portfolio may invest in loans arranged through private negotiation between one or more financial institutions. The Portfolio’s investment in any such loan may be in the form of a participation in or an assignment of the loan. In connection with purchasing participations, the Portfolio generally will have no right to enforce compliance by the borrower with the terms of the loan agreement related to the loan, or any rights of off-set against the borrower and the Portfolio may not benefit directly from any collateral supporting the loan in which it has purchased the participation.
The Portfolio assumes the credit risk of the borrower, the lender that is selling the participation and any other persons interpositioned between the Portfolio and the borrower. In the event of the insolvency of the lender selling the participation, the Portfolio may be treated as a general creditor of the lender and may not benefit from any off-set between the lender and the borrower.
(o) Unfunded loan commitments. The Portfolio may enter into certain credit agreements where all or a portion of which may be unfunded. The Portfolio is obligated to fund these commitments at the borrower’s discretion. The commitments are disclosed in the accompanying Schedule of Investments. At June 30, 2015, the Portfolio had sufficient cash and/or securities to cover these commitments.
(p) Credit and market risk. The Portfolio invests in high-yield and emerging market instruments that are subject to certain credit and market risks. The yields of high-yield and emerging market debt obligations reflect, among other things, perceived credit and market risks. The Portfolio’s investments in securities rated below investment grade typically involve risks not associated with higher rated securities including, among others, greater risk related to timely and ultimate payment of interest and principal, greater market price volatility and less liquid secondary market trading. The consequences of political, social, economic or diplomatic changes may have disruptive effects on the market prices of investments held by the Portfolio. The Portfolio’s investments in non-U.S. dollar denominated securities may also result in foreign currency losses caused by devaluations and exchange rate fluctuations.
| | |
| 34 | | Western Asset Core Plus VIT Portfolio 2015 Semi-Annual Report |
Investments in securities that are collateralized by residential real estate mortgages are subject to certain credit and liquidity risks. When market conditions result in an increase in default rates of the underlying mortgages and the foreclosure values of underlying real estate properties are materially below the outstanding amount of these underlying mortgages, collection of the full amount of accrued interest and principal on these investments may be doubtful. Such market conditions may significantly impair the value and liquidity of these investments and may result in a lack of correlation between their credit ratings and values.
(q) Foreign investment risks. The Portfolio’s investments in foreign securities may involve risks not present in domestic investments. Since securities may be denominated in foreign currencies, may require settlement in foreign currencies or pay interest or dividends in foreign currencies, changes in the relationship of these foreign currencies to the U.S. dollar can significantly affect the value of the investments and earnings of the Portfolio. Foreign investments may also subject the Portfolio to foreign government exchange restrictions, expropriation, taxation or other political, social or economic developments, all of which affect the market and/or credit risk of the investments.
(r) Counterparty risk and credit-risk-related contingent features of derivative instruments. The Portfolio may invest in certain securities or engage in other transactions, where the Portfolio is exposed to counterparty credit risk in addition to broader market risks. The Portfolio may invest in securities of issuers, which may also be considered counterparties as trading partners in other transactions. This may increase the risk of loss in the event of default or bankruptcy by the counterparty or if the counterparty otherwise fails to meet its contractual obligations. The Portfolio’s investment manager attempts to mitigate counterparty risk by (i) periodically assessing the creditworthiness of its trading partners, (ii) monitoring and/or limiting the amount of its net exposure to each individual counterparty based on its assessment and (iii) requiring collateral from the counterparty for certain transactions. Market events and changes in overall economic conditions may impact the assessment of such counterparty risk by the investment manager. In addition, declines in the values of underlying collateral received may expose the Portfolio to increased risk of loss.
The Portfolio has entered into master agreements with certain of its derivative counterparties that provide for general obligations, representations, agreements, collateral, events of default or termination and credit related contingent features. The credit related contingent features include, but are not limited to, a percentage decrease in the Portfolio’s net assets or NAV over a specified period of time. If these credit related contingent features were triggered, the derivatives counterparty could terminate the positions and demand payment or require additional collateral.
Collateral requirements differ by type of derivative. Collateral or margin requirements are set by the broker or exchange clearinghouse for exchange traded derivatives while collateral terms are contract specific for over-the-counter traded derivatives. Cash collateral that has been pledged to cover obligations of the Portfolio under derivative contracts, if any,
| | |
| Western Asset Core Plus VIT Portfolio 2015 Semi-Annual Report | | 35 |
Notes to financial statements (unaudited) (cont’d)
will be reported separately in the Statement of Assets and Liabilities. Securities pledged as collateral, if any, for the same purpose are noted in the Schedule of Investments.
Absent an event of default by the counterparty or a termination of the agreement, the terms of the master agreements do not result in an offset of reported amounts of financial assets and financial liabilities in the Statement of Assets and Liabilities across transactions between the Portfolio and the applicable counterparty. The enforceability of the right to offset may vary by jurisdiction.
As of June 30, 2015, the Portfolio held written options and forward foreign currency contracts with credit related contingent features which had a liability position of $61,705. If a contingent feature in the master agreements would have been triggered, the Portfolio would have been required to pay this amount to its derivatives counterparties. As of June 30, 2015, the Portfolio had posted with its counterparties cash and/or securities as collateral to cover the net liability of these derivatives amounting to $40,374, which could be used to reduce the required payment.
(s) Security transactions and investment income. Security transactions are accounted for on a trade date basis. Interest income, adjusted for amortization of premium and accretion of discount, is recorded on the accrual basis. Paydown gains and losses on mortgage- and asset-backed securities are recorded as adjustments to interest income. Dividend income is recorded on the ex-dividend date. Foreign dividend income is recorded on the ex-dividend date or as soon as practicable after the Portfolio determines the existence of a dividend declaration after exercising reasonable due diligence. The cost of investments sold is determined by use of the specific identification method. To the extent any issuer defaults or a credit event occurs that impacts the issuer, the Portfolio may halt any additional interest income accruals and consider the realizability of interest accrued up to the date of default or credit event.
(t) Distributions to shareholders. Distributions from net investment income and distributions of net realized gains, if any, are declared at least annually. Distributions to shareholders of the Portfolio are recorded on the ex-dividend date and are determined in accordance with income tax regulations, which may differ from GAAP.
(u) Share class accounting. Investment income, common expenses and realized/unrealized gains (losses) on investments are allocated to the various classes of the Portfolio on the basis of daily net assets of each class. Fees relating to a specific class are charged directly to that share class.
(v) Compensating balance arrangements. The Portfolio has an arrangement with its custodian bank whereby a portion of the custodian’s fees is paid indirectly by credits earned on the Portfolio’s cash on deposit with the bank.
(w) Federal and other taxes. It is the Portfolio’s policy to comply with the federal income and excise tax requirements of the Internal Revenue Code of 1986 (the “Code”), as amended, applicable to regulated investment companies. Accordingly, the Portfolio intends
| | |
| 36 | | Western Asset Core Plus VIT Portfolio 2015 Semi-Annual Report |
to distribute its taxable income and net realized gains, if any, to shareholders in accordance with timing requirements imposed by the Code. Therefore, no federal or state income tax provision is required in the Portfolio’s financial statements.
Management has analyzed the Portfolio’s tax positions taken on income tax returns for all open tax years and has concluded that as of June 30, 2015, no provision for income tax is required in the Portfolio’s financial statements. The Portfolio’s federal and state income and federal excise tax returns for tax years for which the applicable statutes of limitations have not expired are subject to examination by the Internal Revenue Service and state departments of revenue.
Under the applicable foreign tax laws, a withholding tax may be imposed on interest, dividends and capital gains at various rates.
(x) Reclassification. GAAP requires that certain components of net assets be reclassified to reflect permanent differences between financial and tax reporting. These reclassifications have no effect on net assets or net asset value per share.
2. Investment management agreement and other transactions with affiliates
Legg Mason Partners Fund Advisor, LLC (“LMPFA”) is the Portfolio’s investment manager. Western Asset Management Company (“Western Asset”) and Western Asset Management Company Limited (“Western Asset Limited”) are the Portfolio’s subadvisers. Effective April 15, 2015, Western Asset Management Company Pte. Ltd. in Singapore (“Western Singapore”) and Western Asset Management Company Ltd. in Japan (“Western Japan”) serve as additional subadvisers to the Portfolio, under additional subadvisory agreements with Western Asset. LMPFA, Western Asset, Western Asset Limited, Western Singapore and Western Japan are wholly-owned subsidiaries of Legg Mason, Inc. (“Legg Mason”).
Under the investment management agreement, as of April 15, 2015, the Portfolio pays a management fee at an annual rate of 0.45% of the first $500 million, 0.425% of the next $500 million and 0.40% of assets over $1 billion of its average daily net assets. Prior to that date, the Portfolio paid a management fee at an annual rate of 0.60% of its average daily net assets.
LMPFA provides administrative and certain oversight services to the Portfolio. LMPFA delegates to the subadvisers the day-to-day portfolio management of the Portfolio. Western Asset Limited, Western Asset Japan and Western Asset Singapore provides certain subadvisory services related to currency transactions and investments in non-U.S. dollar-denominated securities and related foreign currency instruments. For its services, LMPFA pays Western Asset 70% of the net management fee it receives from the Portfolio. In turn, Western Asset pays Western Asset Limited, Western Singapore and Western Japan a subadvisory fee of 0.30% on the assets managed by Western Asset Limited, Western Singapore and Western Japan.
As a result of expense limitation arrangements effective April 15, 2015, between the Portfolio and LMPFA, the ratio of expenses other than interest, brokerage, taxes, extraordinary expenses and acquired fund fees and expenses, to average net assets of Class I
| | |
| Western Asset Core Plus VIT Portfolio 2015 Semi-Annual Report | | 37 |
Notes to financial statements (unaudited) (cont’d)
and Class II shares did not exceed 0.54% and 0.79%, respectively. These expense limitation arrangements cannot be terminated prior to December 31, 2016 without the Board of Trustees’ consent. Prior to April 15, 2015, as a result of the expense limitation arrangement, the ratio of expenses, other than interest, brokerage, taxes, extraordinary expenses and acquired fund fees and expenses, to average net assets of Class I did not exceed 1.00%.
During the six months ended June 30, 2015, fees waived and/or reimbursed amounted to $32,673.
During the six months ended June 30, 2015, LMPFA reimbursed the Portfolio $78,761 for transaction costs related to the change in investment strategy.
The investment manager is permitted to recapture amounts waived and/or reimbursed to a class during the same fiscal year if the class’ total annual operating expenses have fallen to a level below the expense limitation (“expense cap”) in effect at the time the fees were earned or the expenses incurred. In no case will the investment manager recapture any amount that would result, on any particular business day of the Portfolio, in the class’ total annual operating expenses exceeding the expense cap or any other lower limit then in effect.
Legg Mason Investor Services, LLC, a wholly-owned broker-dealer subsidiary of Legg Mason, serves as the Portfolio’s sole and exclusive distributor.
All officers and one Trustee of the Trust are employees of Legg Mason or its affiliates and do not receive compensation from the Trust.
3. Investments
During the six months ended June 30, 2015, the aggregate cost of purchases and proceeds from sales of investments (excluding short-term investments) and U.S Government & Agency Obligations were as follows:
| | | | | | | | |
| | | Investments | | | U.S. Government &
Agency Obligations | |
| Purchases | | $ | 52,931,302 | | | $ | 107,229,412 | |
| Sales | | | 90,229,780 | | | | 70,561,375 | |
At June 30, 2015, the aggregate gross unrealized appreciation and depreciation of investments for federal income tax purposes were substantially as follows:
| | | | |
| Gross unrealized appreciation | | $ | 1,363,085 | |
| Gross unrealized depreciation | | | (3,421,130) | |
| Net unrealized depreciation | | $ | (2,058,045) | |
At June 30, 2015, the Portfolio had the following open futures contracts:
| | | | | | | | | | | | | | | | | | | | |
| | | Number of
Contracts | | | Expiration
Date | | | Basis
Value | | | Market
Value | | | Unrealized
Appreciation
(Depreciation) | |
| Contracts to Buy: | | | | | | | | | | | | | | | | | | | | |
| U.S. Treasury 2-Year Notes | | | 80 | | | | 9/15 | | | $ | 17,493,963 | | | $ | 17,515,000 | | | $ | 21,037 | |
| U.S. Treasury 10-Year Notes | | | 6 | | | | 9/15 | | | | 759,019 | | | | 757,031 | | | | (1,988) | |
| U.S. Treasury Ultra Long-Term Bonds | | | 99 | | | | 9/15 | | | | 15,531,251 | | | | 15,252,187 | | | | (279,064) | |
| | | | | | | | | | | | | | | | | | | | (260,015) | |
| | |
| 38 | | Western Asset Core Plus VIT Portfolio 2015 Semi-Annual Report |
| | | | | | | | | | | | | | | | | | | | |
| | | Number of
Contracts | | | Expiration
Date | | | Basis
Value | | | Market
Value | | | Unrealized
Appreciation
(Depreciation) | |
| Contracts to Sell: | | | | | | | | | | | | | | | | | | | | |
| 90-Day Eurodollar | | | 114 | | | | 9/15 | | | $ | 28,387,467 | | | $ | 28,395,975 | | | $ | (8,508) | |
| 90-Day Eurodollar | | | 23 | | | | 12/15 | | | | 5,713,100 | | | | 5,719,237 | | | | (6,137) | |
| 90-Day Eurodollar | | | 86 | | | | 3/16 | | | | 21,332,583 | | | | 21,345,200 | | | | (12,617) | |
| 90-Day Eurodollar | | | 19 | | | | 12/16 | | | | 4,681,664 | | | | 4,684,925 | | | | (3,261) | |
| Euro-Bund | | | 5 | | | | 9/15 | | | | 862,093 | | | | 847,286 | | | | 14,807 | |
| U.S. Treasury 5-Year Notes | | | 76 | | | | 9/15 | | | | 9,025,112 | | | | 9,063,594 | | | | (38,482) | |
| U.S. Treasury Long-Term Bonds | | | 40 | | | | 9/15 | | | | 6,096,479 | | | | 6,033,750 | | | | 62,729 | |
| | | | | | | | | | | | | | | | | | | | 8,531 | |
| Net unrealized depreciation on open futures contracts | | | | | | | | | | | $ | (251,484) | |
During the six months ended June 30, 2015, written option transactions for the Portfolio were as follows:
| | | | | | | | |
| | | Number of Contracts/
Notional Amount | | | Premiums | |
| Written options, outstanding as of December 31, 2014 | | | — | | | | — | |
| Options written | | | 780,216 | | | $ | 78,290 | |
| Options closed | | | (58) | | | | (17,433) | |
| Options exercised | | | — | | | | — | |
| Options expired | | | (58) | | | | (17,228) | |
| Written options, outstanding as of June 30, 2015 | | | 780,100 | | | $ | 43,629 | |
At June 30, 2015, the Portfolio had the following open forward foreign currency contracts:
| | | | | | | | | | | | | | | | | | | | |
Currency
Purchased | | | Currency
Sold | | | Counterparty | | Settlement
Date | | | Unrealized
Appreciation
(Depreciation) | |
| USD | | | 291,532 | | | EUR | | | 260,000 | | | Bank of America N.A. | | | 7/16/15 | | | $ | 1,617 | |
| GBP | | | 560,000 | | | USD | | | 868,823 | | | Citibank N.A. | | | 7/16/15 | | | | 10,991 | |
| USD | | | 869,659 | | | EUR | | | 760,000 | | | Citibank N.A. | | | 7/16/15 | | | | 22,215 | |
| USD | | | 230,735 | | | EUR | | | 210,000 | | | Citibank N.A. | | | 7/16/15 | | | | (3,427) | |
| USD | | | 230,378 | | | EUR | | | 210,000 | | | Citibank N.A. | | | 7/16/15 | | | | (3,784) | |
| USD | | | 306,124 | | | EUR | | | 280,000 | | | Citibank N.A. | | | 7/16/15 | | | | (6,092) | |
| USD | | | 783,003 | | | EUR | | | 700,000 | | | Citibank N.A. | | | 7/16/15 | | | | 2,462 | |
| USD | | | 872,334 | | | GBP | | | 560,000 | | | Citibank N.A. | | | 7/16/15 | | | | (7,480) | |
| USD | | | 795,209 | | | EUR | | | 709,278 | | | Royal Bank of Scotland PLC | | | 8/13/15 | | | | 4,029 | |
| USD | | | 1,574,104 | | | EUR | | | 1,400,000 | | | Royal Bank of Scotland PLC | | | 8/13/15 | | | | 12,442 | |
| Total | | | $ | 32,973 | |
| | |
Abbreviations used in this table: |
| EUR | | — Euro |
| GBP | | — British Pound |
| USD | | — United States Dollar |
| | |
| Western Asset Core Plus VIT Portfolio 2015 Semi-Annual Report | | 39 |
Notes to financial statements (unaudited) (cont’d)
At June 30, 2015, the Portfolio had the following open swap contracts:
| | | | | | | | | | | | | | | | | | | | |
| CENTRALLY CLEARED INTEREST RATE SWAPS | |
| Swap Counterparty | | Notional
Amount | | | Termination
Date | | | Payments
Made by
the Portfolio† | | Payments
Received by
the Portfolio† | | Upfront
Premiums
Paid
(Received) | | | Unrealized
Appreciation | |
| Barclays Capital Inc | | $ | 548,000 | | | | 2/15/41 | | | 2.392% semi-annually | | 3-month LIBOR | | | — | | | $ | 52,208 | |
| | | | | | | | | | | | | | | | | | | | | | |
| CENTRALLY CLEARED CREDIT DEFAULT SWAPS ON CREDIT INDICES — BUY PROTECTION1 | |
Swap Counterparty
(Reference Entity) | | Notional
Amount2 | | | Termination
Date | | | Periodic
Payments
Made by
the Portfolio† | | Market
Value3 | | | Upfront
Premiums
Paid
(Received) | | | Unrealized
Appreciation
(Depreciation) | |
Goldman Sachs Group Inc.
(Markit CDX.NA.HY.23 Index) | | $ | 548,800 | | | | 12/20/19 | | | 5.000% quarterly | | $ | (41,867) | | | $ | (56,903) | | | $ | 15,036 | |
Credit Suisse First Boston Inc.
(Markit CDX.NA.HY.23 Index) | | | 1,168,100 | | | | 12/20/19 | | | 5.000% quarterly | | | (89,113) | | | | (70,110) | | | | (19,003) | |
| Total | | $ | 1,716,900 | | | | | | | | | $ | (130,980) | | | $ | (127,013) | | | $ | (3,967) | |
| 1 | If the Portfolio is a buyer of protection and a credit event occurs, as defined under the terms of that particular swap agreement, the Portfolio will either (i) receive from the seller of protection an amount equal to the notional amount of the swap and deliver the referenced obligation or the underlying securities comprising the referenced index or (ii) receive a net settlement amount in the form of cash or securities equal to the notional amount of the swap less the recovery value of the referenced obligation or the underlying securities comprising the referenced index. |
| 2 | The maximum potential amount the Portfolio could be required to pay as a seller of credit protection or receive as a buyer of credit protection if a credit event occurs as defined under the terms of that particular swap agreement. |
| 3 | The quoted market prices and resulting values for credit default swap agreements on asset-backed securities and credit indices serve as an indicator of the current status of the payment/performance risk and represent the likelihood of an expected liability (or profit) for the credit derivative should the notional amount of the swap agreement be closed/sold as of the period end. Decreasing market values (sell protection) or increasing market values (buy protection) when compared to the notional amount of the swap, represent a deterioration of the referenced entity’s credit soundness and a greater likelihood or risk of default or other credit event occurring as defined under the terms of the agreement. |
| † | Percentage shown is an annual percentage rate. |
4. Derivative instruments and hedging activities
Below is a table, grouped by derivative type, that provides information about the fair value and the location of derivatives within the Statement of Assets and Liabilities at June 30, 2015.
| | | | | | | | | | | | | | | | |
| ASSET DERIVATIVES1 | |
| | | Interest
Rate Risk | | | Foreign
Exchange Risk | | | Credit
Risk | | | Total | |
| Purchased options2 | | $ | 1,906 | | | | — | | | | — | | | $ | 1,906 | |
| Futures contracts3 | | | 98,573 | | | | — | | | | — | | | | 98,573 | |
| Centrally cleared swap contracts4 | | | 52,208 | | | | — | | | $ | 15,036 | | | | 67,244 | |
| Forward foreign currency contracts | | | — | | | $ | 53,756 | | | | — | | | | 53,756 | |
| Total | | $ | 152,687 | | | $ | 53,756 | | | $ | 15,036 | | | $ | 221,479 | |
| | |
| 40 | | Western Asset Core Plus VIT Portfolio 2015 Semi-Annual Report |
| | | | | | | | | | | | | | | | |
| LIABILITY DERIVATIVES1 | |
| | | Interest
Rate Risk | | | Foreign
Exchange Risk | | | Credit
Risk | | | Total | |
| Written options | | $ | 35,755 | | | $ | 5,167 | | | | — | | | $ | 40,922 | |
| Futures contracts3 | | | 350,057 | | | | — | | | | — | | | | 350,057 | |
| Centrally cleared swap contracts4 | | | — | | | | — | | | $ | 19,003 | | | | 19,003 | |
| Forward foreign currency contracts | | | — | | | | 20,783 | | | | — | | | | 20,783 | |
| Total | | $ | 385,812 | | | $ | 25,950 | | | $ | 19,003 | | | $ | 430,765 | |
| 1 | Generally, the balance sheet location for asset derivatives is receivables/net unrealized appreciation (depreciation) and for liability derivatives is payables/net unrealized appreciation (depreciation). |
| 2 | Market value of purchased options is reported in Investments at value in the Statement of Assets and Liabilities. |
| 3 | Includes cumulative appreciation (depreciation) of futures contracts as reported in the footnotes. Only variation margin is reported within the receivables and/or payables on the Statement of Assets and Liabilities. |
| 4 | Includes cumulative appreciation (depreciation) of centrally cleared swap contracts as reported in the footnotes. Only variation margin is reported within the receivables and/or payables on the Statement of Assets and Liabilities. |
The following tables provide information about the effect of derivatives and hedging activities on the Portfolio’s Statement of Operations for the six months ended June 30, 2015. The first table provides additional detail about the amounts and sources of gains (losses) realized on derivatives during the period. The second table provides additional information about the change in unrealized appreciation (depreciation) resulting from the Portfolio’s derivatives and hedging activities during the period.
| | | | | | | | | | | | | | | | |
| AMOUNT OF REALIZED GAIN (LOSS) ON DERIVATIVES RECOGNIZED | |
| | | Interest
Rate Risk | | | Foreign
Exchange Risk | | | Credit
Risk | | | Total | |
| Purchased options1 | | $ | (10,624) | | | | — | | | | — | | | $ | (10,624) | |
| Written options | | | 19,750 | | | | — | | | | — | | | | 19,750 | |
| Futures contracts | | | (521,105) | | | | — | | | | — | | | | (521,105) | |
| Swap contracts | | | 43,311 | | | | — | | | $ | 472 | | | | 43,783 | |
| Forward foreign currency contracts2 | | | — | | | $ | 162,925 | | | | — | | | | 162,925 | |
| Total | | $ | (468,668) | | | $ | 162,925 | | | $ | 472 | | | $ | (305,271) | |
| 1 | Net realized gain (loss) from purchased options is reported in net realized gain (loss) from investment transactions in the Statement of Operations. |
| 2 | Net realized gain (loss) from forward foreign currency contracts is reported in net realized gain (loss) from foreign currency transactions in the Statement of Operations. |
| | | | | | | | | | | | | | | | |
| CHANGE IN UNREALIZED APPRECIATION (DEPRECIATION) ON DERIVATIVES RECOGNIZED | |
| | | Interest
Rate Risk | | | Foreign
Exchange Risk | | | Credit
Risk | | | Total | |
| Purchased options1 | | $ | (1,637) | | | | — | | | | — | | | $ | (1,637) | |
| Written options | | | 1,645 | | | $ | 1,062 | | | | — | | | | 2,707 | |
| Futures contracts | | | (251,484) | | | | — | | | | — | | | | (251,484) | |
| Swap contracts | | | 52,208 | | | | — | | | $ | (3,967) | | | | 48,241 | |
| Forward foreign currency contracts2 | | | — | | | | (14,545) | | | | — | | | | (14,545) | |
| Total | | $ | (199,268) | | | $ | (13,483) | | | $ | (3,967) | | | $ | (216,718) | |
| | |
| Western Asset Core Plus VIT Portfolio 2015 Semi-Annual Report | | 41 |
Notes to financial statements (unaudited) (cont’d)
| 1 | The change in unrealized appreciation (depreciation) from purchased options is reported in the change in net unrealized from investments in the Statement of Operations. |
| 2 | The change in unrealized appreciation (depreciation) from forward foreign currency contracts is reported in the change in net unrealized appreciation (depreciation) from foreign currencies in the Statement of Operations. |
During the six months ended June 30, 2015, the volume of derivative activity for the Portfolio was as follows:
| | | | |
| | | Average Market
Value | |
| Purchased options | | $ | 567 | |
| Written options | | | 11,291 | |
| Futures contracts (to buy) | | | 13,406,333 | |
| Futures contracts (to sell) | | | 19,005,198 | |
| Forward foreign currency contracts (to buy) | | | 365,944 | |
| Forward foreign currency contracts (to sell) | | | 2,421,150 | |
| |
| | | Average Notional
Balance | |
| Interest rate swap contracts | | $ | 391,429 | |
| Credit default swap contracts (to buy protection) | | | 988,671 | |
The following table presents by financial instrument, the Portfolio’s derivative assets net of the related collateral received by the Portfolio at June 30, 2015:
| | | | | | | | | | | | |
| | | Gross Amount of Derivative
Assets in the Statement of
Assets and Liabilities1 | | | Collateral
Received | | | Net
Amount | |
| Purchased options2 | | $ | 1,906 | | | | — | | | $ | 1,906 | |
| Futures contracts3 | | | 13,062 | | | | — | | | | 13,062 | |
| Forward foreign currency contracts | | | 53,756 | | | | — | | | | 53,756 | |
| Total | | $ | 68,724 | | | | — | | | $ | 68,724 | |
The following table presents by financial instrument, the Portfolio’s derivative liabilities net of the related collateral pledged by the Portfolio at June 30, 2015:
| | | | | | | | | | | | |
| | | Gross Amount of Derivative
Liabilities in the Statement
of Assets and Liabilities1 | | | Collateral
Pledged4,5 | | | Net
Amount | |
| Written options | | $ | 40,922 | | | $ | (40,374) | | | $ | 548 | |
| Centrally cleared swap contracts | | | 59,898 | | | | (59,898) | | | | — | |
| Forward foreign currency contracts | | | 20,783 | | | | — | | | | 20,783 | |
| Total | | $ | 121,603 | | | $ | (100,272) | | | $ | 21,331 | |
| 1 | Absent an event of default or early termination, derivative assets and liabilities are presented gross and not offset in the Statement of Assets and Liabilities. |
| 2 | Market value of purchased options is shown in Investments at value in the Statement of Assets and Liabilities. |
| 3 | Amount represents the current day’s variation margin as reported in the Statement of Assets and Liabilities. It differs from the cumulative appreciation (depreciation) presented in the previous table. |
| 4 | Gross amounts are not offset in the Statement of Assets and Liabilities. |
| 5 | In some instances, the actual collateral received and/or pledged may be more than the amount shown here due to overcollateralization. |
| | |
| 42 | | Western Asset Core Plus VIT Portfolio 2015 Semi-Annual Report |
5. Class specific expenses, waivers and/or expense reimbursements
The Portfolio has adopted a Rule 12b-1 shareholder services and distribution plan and under that plan the Portfolio pays service and/or distribution fees with respect to its Class II shares calculated at the annual rate of 0.25% of the average daily net assets of the Class II shares. Service and distribution fees are accrued daily and paid monthly.
For the six months ended June 30, 2015, class specific expenses were as follows:
| | | | | | | | |
| | | Service and/or
Distribution Fees | | | Transfer Agent
Fees | |
| Class I1 | | | — | | | $ | 467 | |
| Class II2 | | $ | 638 | | | | 2 | |
| Total | | $ | 638 | | | $ | 469 | |
| 1 | In April 2015, the Portfolio’s outstanding class of shares, which was previously unnamed, became known as Class I shares. |
| 2 | For the period May 1, 2015 (inception date) to June 30, 2015. |
For the six months ended June 30, 2015, waivers and/or expense reimbursements by class were as follows:
| | | | |
| | | Waivers/Expense
Reimbursements | |
| Class I1 | | $ | 31,529 | |
| Class II2 | | | 1,144 | |
| Total | | $ | 32,673 | |
| 1 | In April 2015, the Portfolio’s outstanding class of shares, which was previously unnamed, became known as Class I shares. |
| 2 | For the period May 1, 2015 (inception date) to June 30, 2015. |
6. Distributions to shareholders by class
| | | | | | | | |
| | | Six Months Ended
June 30, 2015 | | | Year Ended
December 31, 2014 | |
| Net Investment Income: | | | | | | | | |
| Class I1 | | $ | 240,154 | | | $ | 6,890,013 | |
| Class II2 | | | 9,852 | | | | — | |
| Total | | $ | 250,006 | | | $ | 6,890,013 | |
| 1 | In April 2015, the Portfolio’s outstanding class of shares, which was previously unnamed, became known as Class I shares. |
| 2 | For the period May 1, 2015 (inception date) to June 30, 2015. |
7. Shares of beneficial interest
At June 30, 2015, the Trust had an unlimited number of shares of beneficial interest authorized with a par value of $0.00001 per share. The Portfolio has the ability to issue multiple classes of shares. Each class of shares represents an identical interest and has the same rights, except that each class bears certain direct expenses, including those specifically related to the distribution of its shares.
| | |
| Western Asset Core Plus VIT Portfolio 2015 Semi-Annual Report | | 43 |
Notes to financial statements (unaudited) (cont’d)
Transactions in shares of each class were as follows:
| | | | | | | | | | | | | | | | |
| | | Six Months Ended
June 30, 2015 | | | Year Ended
December 31, 2014 | |
| | | Shares | | | Amount | | | Shares | | | Amount | |
| Class I1 | | | | | | | | | | | | | | | | |
| Shares sold | | | 50,157 | | | $ | 284,758 | | | | 223,153 | | | $ | 1,366,469 | |
| Shares issued on reinvestment | | | 42,280 | | | | 240,154 | | | | 1,232,498 | | | | 6,890,013 | |
| Shares repurchased | | | (1,567,395) | | | | (8,938,983) | | | | (3,105,610) | | | | (19,375,346) | |
| Net decrease | | | (1,474,958) | | | $ | (8,414,071) | | | | (1,649,959) | | | $ | (11,118,864) | |
| | | | |
| Class II2 | | | | | | | | | | | | | | | | |
| Shares sold | | | 727,789 | | | $ | 4,167,879 | | | | — | | | | — | |
| Shares issued on reinvestment | | | 1,735 | | | | 9,852 | | | | — | | | | — | |
| Shares repurchased | | | (11,827) | | | | (68,391) | | | | — | | | | — | |
| Net increase | | | 717,697 | | | $ | 4,109,340 | | | | — | | | | — | |
| 1 | In April 2015, the Portfolio’s outstanding class of shares, which was previously unnamed, became known as Class I shares. |
| 2 | For the period May 1, 2015 (inception date) to June 30, 2015. |
8. Capital loss carryforward
As of December 31, 2014, the Portfolio had the following net capital loss carryforwards remaining:
| | | | |
| Year of Expiration | | Amount | |
| 12/31/2015 | | $ | (7,903,237) | |
| 12/31/2016 | | | (20,466,624) | |
| 12/31/2018 | | | (3,098,143) | |
| | | $ | (31,468,004) | |
These amounts will be available to offset any future taxable capital gains, except that under applicable tax rules, deferred capital losses of $85,229, which have no expiration date, must be used first to offset any such gains.
| | |
| 44 | | Western Asset Core Plus VIT Portfolio 2015 Semi-Annual Report |
Western Asset
Core Plus VIT Portfolio
Trustees
Elliott J. Berv
Jane F. Dasher
Mark T. Finn
Stephen R. Gross
Richard E. Hanson, Jr.
Diana R. Harrington
Chair
Susan M. Heilbron
Susan B. Kerley
Alan G. Merten
R. Richardson Pettit
Jane Trust*
President
| * | Effective June 1, 2015, Ms. Trust became a Trustee, President and Chief Executive Officer. |
Investment manager
Legg Mason Partners Fund Advisor, LLC
Subadvisers
Western Asset Management Company
Western Asset Management Company Limited
Western Asset Management Company Pte. Ltd.
Western Asset Management Company Ltd.
Distributor
Legg Mason Investor Services, LLC
Custodian
State Street Bank and Trust Company
Transfer agent
BNY Mellon Investment Servicing (US) Inc.
4400 Computer Drive
Westborough, MA 01581
Independent registered public accounting firm
KPMG LLP 345 Park Avenue New York, NY 10154
Western Asset Core Plus VIT Portfolio
The Portfolio is a separate investment series of Legg Mason Partners Variable Income Trust, a Maryland statutory trust.
Western Asset Core Plus VIT Portfolio
Legg Mason Funds
620 Eighth Avenue, 49th Floor
New York, NY 10018
The Portfolio files its complete schedule of portfolio holdings with the Securities and Exchange Commission (“SEC”) for the first and third quarters of each fiscal year on Form N-Q. The Portfolio’s Forms N-Q are available on the SEC’s website at www.sec.gov. The Portfolio’s Forms N-Q may be reviewed and copied at the SEC’s Public Reference Room in Washington, D.C., and information on the operation of the Public Reference Room may be obtained by calling 1-800-SEC-0330. To obtain information on Form N-Q, shareholders can call the Portfolio at 1-887-721-1926.
Information on how the Portfolio voted proxies relating to portfolio securities during the prior 12-month period ended June 30th of each year and a description of the policies and procedures that the Portfolio uses to determine how to vote proxies related to portfolio transactions are available (1) without charge, upon request, by calling the Portfolio at 1-887-721-1926, (2) on the Portfolio’s website at www.leggmason.com/individualinvestors and (3) on the SEC’s website at www.sec.gov.
This report is submitted for the general information of the shareholders of Western Asset Core Plus VIT Portfolio. This report is not authorized for distribution to prospective investors in the Portfolio unless preceded or accompanied by a current prospectus.
Investors should consider the Portfolio’s investment objectives, risks, charges and expenses carefully before investing. The prospectus contains this and other important information about the Portfolio. Please read the prospectus carefully before investing.
www.leggmason.com/individualinvestors
© 2015 Legg Mason Investor Services, LLC
Member FINRA, SIPC
Legg Mason Funds Privacy and Security Notice
Your Privacy and the Security of Your Personal Information is Very Important to the Legg Mason Funds
This Privacy and Security Notice (the “Privacy Notice”) addresses the Legg Mason Funds’ privacy and data protection practices with respect to nonpublic personal information the Funds receive. The Legg Mason Funds include any funds sold by the Funds’ distributor, Legg Mason Investor Services, LLC, as well as Legg Mason-sponsored closed-end funds and certain closed-end funds managed or sub-advised by Legg Mason or its affiliates. The provisions of this Privacy Notice apply to your information both while you are a shareholder and after you are no longer invested with the Funds.
The Type of Nonpublic Personal Information the Funds Collect About You
The Funds collect and maintain nonpublic personal information about you in connection with your shareholder account. Such information may include, but is not limited to:
| • | | Personal information included on applications or other forms; |
| • | | Account balances, transactions, and mutual fund holdings and positions; |
| • | | Online account access user IDs, passwords, security challenge question responses; and |
| • | | Information received from consumer reporting agencies regarding credit history and creditworthiness (such as the amount of an individual’s total debt, payment history, etc.). |
How the Funds Use Nonpublic Personal Information About You
The Funds do not sell or share your nonpublic personal information with third parties or with affiliates for their marketing purposes, or with other financial institutions or affiliates for joint marketing purposes, unless you have authorized the Funds to do so. The Funds do not disclose any nonpublic personal information about you except as may be required to perform transactions or services you have authorized or as permitted or required by law. The Funds may disclose information about you to:
| • | | Employees, agents, and affiliates on a “need to know” basis to enable the Funds to conduct ordinary business or comply with obligations to government regulators; |
| • | | Service providers, including the Funds’ affiliates, who assist the Funds as part of the ordinary course of business (such as printing, mailing services, or processing or servicing your account with us) or otherwise perform services on the Funds’ behalf, including companies that may perform marketing services solely for the Funds; |
| • | | The Funds’ representatives such as legal counsel, accountants and auditors; and |
| • | | Fiduciaries or representatives acting on your behalf, such as an IRA custodian or trustee of a grantor trust. |
|
| NOT PART OF THE SEMI-ANNUAL REPORT |
Legg Mason Funds Privacy and Security Notice (cont’d)
Except as otherwise permitted by applicable law, companies acting on the Funds’ behalf are contractually obligated to keep nonpublic personal information the Funds provide to them confidential and to use the information the Funds share only to provide the services the Funds ask them to perform.
The Funds may disclose nonpublic personal information about you when necessary to enforce their rights or protect against fraud, or as permitted or required by applicable law, such as in connection with a law enforcement or regulatory request, subpoena, or similar legal process. In the event of a corporate action or in the event a Fund service provider changes, the Funds may be required to disclose your nonpublic personal information to third parties. While it is the Funds’ practice to obtain protections for disclosed information in these types of transactions, the Funds cannot guarantee their privacy policy will remain unchanged.
Keeping You Informed of the Funds’ Privacy and Security Practices
The Funds will notify you annually of their privacy policy as required by federal law. While the Funds reserve the right to modify this policy at any time they will notify you promptly if this privacy policy changes.
The Funds’ Security Practices
The Funds maintain appropriate physical, electronic and procedural safeguards designed to guard your nonpublic personal information. The Funds’ internal data security policies restrict access to your nonpublic personal information to authorized employees, who may use your nonpublic personal information for Fund business purposes only.
Although the Funds strive to protect your nonpublic personal information, they cannot ensure or warrant the security of any information you provide or transmit to them, and you do so at your own risk. In the event of a breach of the confidentiality or security of your nonpublic personal information, the Funds will attempt to notify you as necessary so you can take appropriate protective steps. If you have consented to the Funds using electronic communications or electronic delivery of statements, they may notify you under such circumstances using the most current email address you have on record with them.
In order for the Funds to provide effective service to you, keeping your account information accurate is very important. If you believe that your account information is incomplete, not accurate or not current, or if you have questions about the Funds’ privacy practices, write the Funds using the contact information on your account statements, email the Funds by clicking on the Contact Us section of the Funds’ website at www.leggmason.com, or contact the Fund at 1-877-721-1926.
|
| NOT PART OF THE SEMI-ANNUAL REPORT |
www.leggmason.com/individualinvestors
© 2015 Legg Mason Investor Services, LLC Member FINRA, SIPC
FD04231 8/15 SR15-2551
Not applicable.
| ITEM 3. | AUDIT COMMITTEE FINANCIAL EXPERT. |
Not applicable.
| ITEM 4. | PRINCIPAL ACCOUNTANT FEES AND SERVICES. |
Not applicable.
| ITEM 5. | AUDIT COMMITTEE OF LISTED REGISTRANTS. |
Not applicable.
| ITEM 6. | SCHEDULE OF INVESTMENTS. |
Included herein under Item 1.
| ITEM 7. | DISCLOSURE OF PROXY VOTING POLICIES AND PROCEDURES FOR CLOSED-END MANAGEMENT INVESTMENT COMPANIES. |
Not applicable.
| ITEM 8. | PORTFOLIO MANAGERS OF CLOSED-END MANAGEMENT INVESTMENT COMPANIES. |
Not applicable.
| ITEM 9. | PURCHASES OF EQUITY SECURITIES BY CLOSED-END MANAGEMENT INVESTMENT COMPANY AND AFFILIATED PURCHASERS. |
Not applicable.
| ITEM 10. | SUBMISSION OF MATTERS TO A VOTE OF SECURITY HOLDERS. |
Not applicable.
| ITEM 11. | CONTROLS AND PROCEDURES. |
| | (a) | The registrant’s principal executive officer and principal financial officer have concluded that the registrant’s disclosure controls and procedures (as defined in Rule 30a- 3(c) under the Investment Company Act of 1940, as amended (the “1940 Act”)) are effective as of a date within 90 days of the filing date of this report that includes the disclosure required by this paragraph, based on their evaluation of the disclosure controls and procedures required by Rule 30a-3(b) under the 1940 Act and 15d-15(b) under the Securities Exchange Act of 1934. |
| | (b) | There were no changes in the registrant’s internal control over financial reporting (as defined in Rule 30a-3(d) under the 1940 Act) that occurred during the second fiscal quarter of the period covered by this report that have materially affected, or are likely to materially affect the registrant’s internal control over financial reporting |
(a) (1) Not applicable.
Exhibit 99.CODE ETH
(a) (2) Certifications pursuant to section 302 of the Sarbanes-Oxley Act of 2002 attached hereto.
Exhibit 99.CERT
(b) Certifications pursuant to Section 906 of the Sarbanes-Oxley Act of 2002 attached hereto.
Exhibit 99.906CERT
SIGNATURES
Pursuant to the requirements of the Securities Exchange Act of 1934 and the Investment Company Act of 1940, the registrant has duly caused this Report to be signed on its behalf by the undersigned, there unto duly authorized.
Legg Mason Partners Variable Income Trust
| | |
| By: | | /s/ Jane Trust |
| | Jane Trust |
| | Chief Executive Officer |
| |
| Date: | | August 21, 2015 |
Pursuant to the requirements of the Securities Exchange Act of 1934 and the Investment Company Act of 1940, this report has been signed below by the following persons on behalf of the registrant and in the capacities and on the dates indicated.
| | |
| By: | | /s/ Jane Trust |
| | Jane Trust |
| | Chief Executive Officer |
| |
| Date: | | August 21, 2015 |
| |
| By: | | /s/ Richard F. Sennett |
| | Richard F. Sennett |
| | Principal Financial Officer |
| |
| Date: | | August 21, 2015 |