UNITED STATES SECURITIES AND EXCHANGE COMMISSION
Washington, D.C. 20549
FORM N-CSR
CERTIFIED SHAREHOLDER REPORT OF REGISTERED MANAGEMENT INVESTMENT COMPANIES
Investment Company Act file number: 811-06324
Exact name of registrant as specified in charter:
Delaware Group® Global & International Funds
Address of principal executive offices:
2005 Market Street
Philadelphia, PA 19103
Name and address of agent for service:
David F. Connor, Esq.
2005 Market Street
Philadelphia, PA 19103
Registrant’s telephone number, including area code: (800) 523-1918
Date of fiscal year end: November 30
Date of reporting period: November 30, 2009
Item 1. Reports to Stockholders

Annual report Delaware International Value Equity Fund Delaware Emerging Markets Fund Delaware Global Value Fund November 30, 2009 International equity mutual funds |
This annual report is for the information of Delaware International Value Equity Fund, Delaware Emerging Markets Fund, and Delaware Global Value Fund shareholders, but it may be used with prospective investors when preceded or accompanied by a current prospectus for Delaware International Value Equity Fund, Delaware Emerging Markets Fund, and Delaware Global Value Fund. The figures in the annual report for Delaware International Value Equity Fund, Delaware Emerging Markets Fund, and Delaware Global Value Fund represent past results, which are not a guarantee of future results. The return and principal value of an investment in the Fund will fluctuate so that shares, when redeemed, may be worth more or less than their original cost. Current performance may be higher or lower than the performance data quoted. You should consider the investment objectives, risks, charges, and expenses of the Fund carefully before investing. The Delaware International Value Equity Fund, Delaware Emerging Markets Fund, and Delaware Global Value Fund prospectus contains this and other important information about the Fund. Prospectuses for all open-end funds in the Delaware Investments® Family of Funds are available from your financial advisor, online at www.delawareinvestments.com, or by phone at 800 523-1918. Please read the prospectus carefully before you invest or send money. |
You can obtain shareholder reports and prospectuses online instead of in the mail.
Visit www.delawareinvestments.com/edelivery. |
Experience Delaware Investments
Delaware Investments is committed to the pursuit of consistently superior asset management and unparalleled client service. We believe in our investment processes, which seek to deliver consistent results, and in convenient services that help add value for our clients.
If you are interested in learning more about creating an investment plan, contact your financial advisor.
You can learn more about Delaware Investments or obtain a prospectus for Delaware International Funds at www.delawareinvestments.com.
| Manage your investments online |
- 24-hour access to your account information
- Obtain share prices
- Check your account balance and recent transactions
- Request statements or literature
- Make purchases and redemptions
|
On January 4, 2010, Delaware Management Holdings, Inc. and its subsidiaries (collectively known by the marketing name of Delaware Investments) were sold by a subsidiary of Lincoln National Corporation to Macquarie Group Limited, a global provider of banking, financial, advisory, investment and funds management services. Please see your Fund’s prospectus and any supplements thereto for more complete information.
Investments in Delaware International Value Equity Fund, Delaware Emerging Markets Fund, and Delaware Global Value Fund are not and will not be deposits with or liabilities of Macquarie Bank Limited ABN 46 008 583 542 and its holding companies, including subsidiaries or related companies, and are subject to investment risk, including possible delays in repayment and loss of income and capital invested. No Macquarie Group company guarantees or will guarantee the performance of the Funds, the repayment of capital from the Funds, or any particular rate of return.
| Table of contents | |
| Portfolio management review | 1 |
| Performance summaries | 12 |
| Disclosure of Fund expenses | 22 |
| Country and sector allocations | 27 |
| Statements of net assets | 33 |
| Statements of operations | 54 |
| Statements of changes in net assets | 56 |
| Financial highlights | 62 |
| Notes to financial statements | 90 |
| Report of independent registered | |
| public accounting firm | 107 |
| Other Fund information | 108 |
| Board of trustees/directors and | |
| officers addendum | 116 |
| About the organization | 122 |
Views expressed herein are current as of November 30, 2009, and are subject to change.
Funds are not FDIC insured and are not guaranteed. It is possible to lose the principal amount invested.
Mutual fund advisory services provided by Delaware Management Company, a series of Delaware Management Business Trust, which is a registered investment advisor. Delaware Investments is the marketing name of Delaware Management Holdings, Inc. and its subsidiaries. Macquarie Group refers to Macquarie Group Limited and its subsidiaries and affiliates worldwide.
© 2010 Delaware Management Holdings, Inc.
All third-party trademarks cited are the property of their respective owners.
| Portfolio management review |
| Delaware International Value Equity Fund | Dec. 8, 2009 |
| Performance review (for the period ended Nov. 30, 2009) |
| Delaware International Value Equity Fund (Class A shares) | 1-year return | | +44.76% |
| MSCI EAFE Index (net) (benchmark) | 1-year return | | +37.72% |
| MSCI EAFE Index (gross) | 1-year return | | +38.43% |
Past performance does not guarantee future results.
For complete, annualized performance for Delaware International Value Equity Fund, please see the table on page 12.
The performance of Class A shares excludes the applicable sales charge and reflects the reinvestment of all distributions.
Index performance returns do not reflect any management fees, transaction costs, or expenses. Indices are unmanaged and one cannot invest directly in an index. |
When the Fund’s fiscal year began in December 2008, global financial markets were already in the midst of a protracted downturn. Investors have experienced weak economic cycles and significant market declines before, but this situation, accompanied by a global credit crisis, was worse than anything many had seen in decades:
- With diminished confidence in the capital markets, and uncertainty about their own futures, financial institutions seemed largely unwilling to lend to corporations and individuals.
- A difficult global stock market environment became a dismal one, leading to some very prominent business casualties.
- In December 2008, the environment was still shaped by effects from the most notable of these casualties, including the September 2008 bankruptcy of Wall Street investment bank Lehman Brothers, and the bailout of U.S. insurance giant American International Group (AIG), which received tens of billions of dollars in guaranteed federal loans.
Both the global economy and investor sentiment in general seemed to reach low points during the winter months, eventually setting the stage for the start of a recovery. Given the crisis atmosphere and investors’ tremendous risk aversion, international equities were trading at relatively cheap prices by early March 2009. Additionally, dramatic steps had been taken by the central banks and fiscal authorities around the world (including the U.S. Treasury Department) to boost global economic growth. It took some time before it seemed that investors’ outlooks were gradually improving, but in the weeks following March 9, 2009 stock prices started to rise. It became apparent during subsequent months that the economy’s decline was easing and possibly even starting to reverse.
Over time, investors seemed to conclude that the worst-case scenario of a market collapse was unlikely, despite continued economic weakness. Stock market performance was very strong in the second quarter of 2009 with the subsequent “snap-back” rally led overwhelmingly by the market’s most volatile stocks, as buyers took advantage of their extremely low valuations. In fact, many of the best performers during this time were, in our view, highly speculative companies with weak business fundamentals, many of which were hit the hardest in the market decline.
By the third calendar quarter of 2009 and continuing into the fourth quarter, the stock market rally became broader, as the deepest stock-price discounts vanished. By autumn, investors appeared to favor individual companies with more solid business
1
Portfolio management review
Delaware International Value Equity Fund
fundamentals and the prospect of sustainable earnings growth many of which had more reasonable valuations. We felt that this was a promising development for the Fund, as these are the types of stocks we regularly favor for the portfolio.
Fund performance
For the fiscal year, Delaware International Value Equity Fund returned +44.76% at net asset value and +36.41% at maximum offer price (both figures are for Class A shares with all distributions reinvested). The Fund’s benchmark index, the MSCI EAFE Index, returned +37.72% for the same period. For the Fund’s complete, annualized performance information, please see the table on page 12. Strong stock selection was the primary driver of the Fund’s relative outperformance for the fiscal year.
A beneficial defensive stance
Some months before the start of the Fund’s fiscal year, we positioned the portfolio relatively defensively. While, like most investors, we failed to anticipate the depths of the market’s collapse, we did conclude that economic conditions were rapidly deteriorating. This led us to take a number of proactive steps:
- We substantially reduced the Fund’s allocation to the more highly economically sensitive financial stocks, moving from an underweighted exposure relative to our MSCI EAFE benchmark to an even more underweighted one.
- We increasingly avoided companies with significant debt levels, which we believed would suffer if capital became less readily available.
- When we did invest in these and other cyclical (more economically sensitive) sectors, we favored individual securities that we believed offered less volatility and other relatively conservative characteristics.
Given the gathering economic risks, we felt this defensive approach was prudent. In retrospect, it turned out to be very helpful for performance in the very challenging market environment of December 2008 through the first quarter of 2009 — a span in which the Fund significantly outpaced its benchmark. Although being defensively positioned was not generally helpful during the fiscal year’s second quarter, when riskier securities fared the best, it drove strong relative performance for the fiscal first half overall.
Stocks held
The Fund’s relative performance benefited from its underweighting to Japanese stocks, which trailed the market’s performance during the past year.
Relative performance was strong in a number of sectors, including consumer staples, consumer discretionary, and information technology. In consumer staples, Parmalat, an Italian food and dairy company, continued its impressive rebound from a serious accounting fraud scandal of several years ago. Diversified German retailer Metro also contributed to Fund performance, as diminishing concerns about the global economy helped the stock.
In the consumer discretionary sector, Hong Kong-based Techtronic Industries was a standout. This maker of power tools, vacuum cleaners and other household appliances had fallen during the downturn because investors were concerned about the company’s ability to refinance its debt. After thorough research we became satisfied that Techtronic’s financial condition was better than the market believed — a conclusion, it seems, that the market subsequently came to share, as the stock price appreciated favorably.
2
Other strong performers for the Fund in the consumer discretionary sector included German automaker BMW and French retail and luxury goods company PPR, both of which rose off of previously depressed valuations.
South Korea’s Samsung Electronics led the way for the Fund in the technology sector. This maker of electronic products lost significant value because of investors’ concerns about a diminished market for semiconductors and personal computers — two market segments to which the company was significantly exposed. As those markets showed signs of recovery, so did Samsung, which realized healthy gains. We sold our shares for a profit after the stock reached our target price.
Weakness in financials, telecommunications
Although the Fund was helped overall by our decision to be underweighted in the financials sector, we owned a handful of weak-performing individual holdings that hampered results. One of these was Mitsubishi UFJ Financial Group, a large Japanese diversified financial company. In our view, this company’s underperformance stemmed from persistent weakness in the Japanese economy, rather than any fundamental business problem. Also lagging was Dutch bank ING Groep, which we sold early in 2009, due to concerns regarding its balance sheet risk.
The telecommunication services sector was the other negative area — both because of unfavorable stock selection and the Fund’s overexposure to this sector, which failed to gain as much as the overall market. Two noteworthy detractors in this group were France Telecom and Chunghwa Telecom, the leading communications service providers in France and Taiwan, respectively. Both stocks’ returns lagged the benchmark, as investors apparently preferred companies that offered more growth potential during the market’s climb.
Portfolio shifts
We maintained the portfolio’s defensive stance through roughly the end of the second quarter of 2009. During the third quarter, we preserved our basic defensive positioning of the Fund’s holdings but sought to adapt to changing conditions. For example, as evidence mounted that the market’s progress might be sustainable and that the economy was slowly improving, we felt more comfortable adding to the Fund’s beta — its risk exposure relative to the benchmark. For example, we added to our position in Lafarge, a French producer of building materials. We became increasingly positive about LaFarge, as we felt that a healthier credit market and improving economy had expanded the company’s financial prospects. At period end, the Fund’s beta was similar to that of the MSCI EAFE Index.
As the period came to a close, we were encouraged that investors once again were favoring stocks with what we believe are solid business fundamentals, sustainable earnings and reasonable valuations. We believe this constitutes a more normalized investment environment than the speculative atmosphere of the second quarter, when it seemed that the riskier and more volatile the stock, the better it was performing. By the end of November 2009, the market appeared to be assessing stocks on a company-by-company basis, and because of our regular emphasis on careful individual stock research, we felt this was a favorable backdrop for our style of value investing.
3
| Portfolio management review |
| Delaware Emerging Markets Fund | Dec. 8, 2009 |
| Performance review (for the period ended Nov. 30, 2009) |
| Delaware Emerging Markets Fund (Class A shares) | 1-year return | | +79.84% |
| MSCI Emerging Markets Index (net) (benchmark) | 1-year return | | +85.12% |
| MSCI Emerging Markets Index (gross) | 1-year return | | +85.68% |
Past performance does not guarantee future results.
For complete, annualized performance for Delaware Emerging Markets Fund, please see the table on page 15.
The performance of Class A shares excludes the applicable sales charge and reflects the reinvestment of all distributions.
Index performance returns do not reflect any management fees, transaction costs, or expenses. Indices are unmanaged and one cannot invest directly in an index. |
For the fiscal year, Delaware Emerging Markets Fund advanced by 79.84% at net asset value and by 69.41% at maximum offer price (both figures are for Class A shares with all distributions reinvested). The Fund’s benchmark index, the MSCI Emerging Markets Index, advanced by 85.12% for the same period. For the Fund’s complete, annualized performance information, please see the table on page 15.
Market overview
The first few months of 2009 proved challenging for emerging market equities as risk aversion mounted throughout global financial markets. In hindsight, March was the market bottom; emerging markets equities staged a significant rally, finishing up more than 85% for the Fund’s fiscal year and outperforming established international markets, as measured by the MSCI EAFE Index — by more than 45% during the period.
Regional market perspective
The fiscal year saw some unusual returns. Indonesia was the strongest performing market in our investment universe, rising over 166% for the fiscal year. Elsewhere in Asia, positive investor sentiment after favorable election results in mid-May helped send the Indian market up over 114% for the period. China was up more than 75%, though it ended the Fund’s fiscal year trailing the broader MSCI Emerging Asia Index. (All country returns based on MSCI country indices).
In Latin America, Brazilian stocks posted significant gains. One of the last countries to be hit by the global downturn, Brazil experienced one of the most impressive rallies in our investment universe, gaining more than 125% during the period. With such an advance, Brazil ended the period as the strongest performer among major emerging markets.
Markets in the Europe, Middle East, and Africa (EMEA) region posted strong gains. Russia and Hungry were the best-performing markets in the region, up over 80% in the period. Turkey and South Africa advanced by more than 70%.
Market rally
Since it bottomed in early March 2009, the MSCI Emerging Markets Index climbed over 100% through the end of the Fund’s fiscal period.
In addition to reduced risk aversion, several other factors contributed to the rally in emerging markets this year. For instance, a moderately weak U.S. dollar has provided a backdrop for rapidly expanding liquidity, which in turn has contributed to increased credit availability in emerging markets. We believe that a weaker U.S. dollar has been a key contributor to the relative outperformance of emerging markets this year. Additionally,
4
important stimulus measures enacted in several major emerging countries has contributed to improved liquidity and credit conditions locally. Finally, increasing commodity prices, in part due to the weaker U.S. dollar, has also provided a strong underpinning for the rally.
Many of the same performance trends that began in March for emerging market companies continued late into the fiscal period. These included the general outperformance of financially leveraged companies over those with stronger balance sheets; cyclical companies strongly outperforming noncyclicals; and small-capitalization companies lending larger-capitalization companies.
Within the Fund
Prior to discussing specific performance drivers, we would like to highlight that our country and sector allocations are primarily the result of our bottom-up stock selection process.
That said, Fund positioning on a country basis in India, as well as our holdings in South Korea, China, and Brazil notably detracted from fund performance, while holdings in Indonesia and Russia contributed positively to performance throughout the period.
With the Indian market up over 114% for the period, our underweight in India was a significant detractor from Fund performance. This underweight has primarily been the result of the high valuations we saw for many Indian stocks. Additionally, Fund holding in participation notes in two Indian companies was a large detractor from performance in the period. These participation notes were underwritten by Lehman Brothers, and used as a tool to gain access to the Indian market prior to our approval as a qualified investor by Indian regulatory authorities when originally purchased. With the 2008 bankruptcy of Lehman, we have had to substantially write down these participation notes to cents on the dollar. We do not expect any further material impact from the participation notes.
Our holdings in South Korea also detracted from performance. Despite the fact that the Korean market outperformed the benchmark index during the period, our overweight in this market is primarily the result of large positions in several defensive names in the Korean telecom and utilities sectors. Both telecom and utilities have underperformed throughout the market rally as investors shifted away from traditionally defensive sectors. Examples of such positions include SK Telecom and KT Corporation, both telecom players, as well as Korea Electric Power (KEPCO), an integrated utility company. We continue to see these shares trading at discounts to our intrinsic value estimates.
Our holdings in China also detracted from performance. The most significant detractor from performance was our position in China Unicom, a Chinese mobile carrier. Competitive intensity increased after the mobile sector went through restructuring last year, putting pressure on the shares of the resulting three mobile carriers. We took the opportunity to average down our position in China Unicom and purchased shares of China Mobile at what we believe were attractive prices. China Mobile was a top contributor to Fund performance for the period. We continue to see upside in the shares of both companies, as we believe investor concern over competitive pressure is overdone.
Within Brazil, our overweight in several names that outperformed the market, such as Petrobras, Vale, and Fibria Celulose
5
Portfolio management review
Delaware Emerging Markets Fund
contributed to Fund performance. However, Eletrobras Participacoes, Brazil’s largest utility, returned 48% in the period, significantly underperforming the broader Brazilian market. As one of our most substantial overweights in the Fund, Eletrobras was one of the largest detractors from relative Fund performance for the period despite the gain by the stock. In addition to the general underperformance of more traditionally defensive sectors such as utilities through the market rally, Eletrobras also suffered from poor investor sentiment that resulted from concern over corporate governance practices. Nevertheless, we continued to believe that the company’s asset base is undervalued and view the shares as attractive on a risk-reward basis. We believe our patience has begun to produce results, as we have seen constructive news concerning restructuring that we think could potentially benefit Eletrobras — at both the company level and in politics.
Our holdings in Indonesia and Russia contributed to Fund performance for the fiscal year. Gudang Garam, an Indonesian tobacco producer, returned over 400% in the period. Our investment thesis was predicated on the belief that that the market had been significantly undervaluing the company’s franchise and turnaround potential. The company has recently restructured its distribution system, improving its competitiveness in the process. In addition, British American Tobacco purchased its fourth largest competitor at a premium valuation in June, suggesting to investors a potentially much higher private market valuation for Gudang Garam.
In Russia, our holding in Sberbank contributed to performance during the period. We believe the market unduly punished the stock as investors moved away from riskier assets, such as Russian equities in general , at the beginning of the fiscal year. We added to our holding as we believed the market was not recognizing Sberbank’s position as the de facto flight-to-safety bank in Russia.
Investment opportunities
We added several new names to the Fund in the period. In South Korea, a new investment was made in Lotte Chilsung Beverage. As the country’s largest beverage manufacturer, the company operates in a mature but stable market. We saw the company trading at a large discount to its core business and non-core assets, including its stakes in two other Lotte businesses and its land holdings.
We also initiated new holdings in South Africa, including Vodacom Group, a provider of mobile telecommunications services in sub-Saharan Africa. The company is a spin-off from state-controlled Telkom South Africa and we believe its business has better growth potential than Telkom’s traditional land-line telephone business. In our opinion, shares were trading at a discount to intrinsic value and we continued to add to our position throughout the period.
6
Outlook
We reiterate our standing conviction in the long-term fundamentals of emerging markets. We believe continued growth over time should be led by several key factors, including: rising domestic consumption; strong national balance sheets; greater political transparency; rising global trade; and accommodative monetary and fiscal policy. These factors serve to create an environment in which developing countries can develop their competitive advantages and achieve sustainable economic development. We believe that, for investors committed to emerging market over the long term, attractive investment opportunities can arise out of this process.
As always, we look to remain disciplined in making investment decisions for the Fund. Our process remains focused on seeking to maintain an attractive balance between risk and reward, as we continue to invest in companies we believe are trading at discounts to our own estimated intrinsic value.
7
| Portfolio management review |
| Delaware Global Value Fund | Dec. 8, 2009 |
| Performance review (for the period ended Nov. 30, 2009) | | | |
| Delaware Global Value Fund (Class A shares) | 1-year return | | +42.14% |
| MSCI World Index (net) (benchmark) | 1-year return | | +31.79% |
Past performance does not guarantee future results.
For complete, annualized performance for Delaware Global Value Fund please see the table on page 18.
The performance of Class A shares excludes the applicable sales charge and reflects the reinvestment of all distributions.
Index performance returns do not reflect any management fees, transaction costs, or expenses. Indices are unmanaged and one cannot invest directly in an index. |
When the Fund’s fiscal year began in December 2008, global financial markets were already in the midst of a protracted downturn. Investors have experienced weak economic cycles and significant market declines before, but this situation, accompanied by a global credit crisis, was worse than anything many had seen in decades:
- With diminished confidence in the capital markets, and uncertainty about their own futures, financial institutions, seemed largely unwilling to lend to corporations and individuals.
- A difficult global stock market environment became a dismal one, leading to some very prominent business casualties.
- In December 2008, the environment was still shaped by effects from the most notable of these casualties, including the September 2008 bankruptcy of Wall Street investment bank Lehman Brothers, and the bailout of U.S. insurance giant American International Group (AIG), which received tens of billions of dollars in guaranteed federal loans.
Both the U.S. economy and investor sentiment in general seemed to reach low points during the winter months, eventually setting the stage for the start of a recovery. Given the crisis atmosphere and investors’ tremendous risk aversion, global equities were trading at relatively cheap prices by early March 2009. Additionally, dramatic steps had been taken by the central banks and fiscal authorities around the world, (including the U.S. Treasury Department), to boost global economic growth. It took some time before it seemed that investors’ outlooks were gradually improving, but in the weeks following March 9, 2009 stock prices started to rise. It became apparent during subsequent months that the economy’s decline was easing and possibly even starting to reverse.
Over time, investors seemed to conclude that the worst-case scenario of a market collapse was unlikely, despite continued economic weakness. Stock market performance was very strong in the second quarter of 2009 with the subsequent “snap-back” rally led overwhelmingly by the market’s most volatile stocks, as buyers took advantage of their extremely low valuations. In fact, many of the best performers during this time were, in our view, highly speculative companies with weak business fundamentals, many of which were hit the hardest in the market decline.
By the third calendar quarter of 2009 and continuing into the fourth quarter, the stock market rally became broader, as the deepest stock-price discounts vanished. By autumn, investors appeared to favor individual companies with more solid business fundamentals and the prospect of sustainable earnings growth, many of which had more reasonable valuations. We felt that this was a promising development for the Fund, as these are the types of stocks we regularly favor for the portfolio.
8
Fund performance
For the fiscal year, Delaware Global Value Fund returned +42.14% at net asset value and +33.86% at maximum offer price (both figures are for Class A shares with all distributions reinvested). The Fund’s benchmark index, the MSCI World Index, returned +31.79% for the same period. For the Fund’s complete, annualized performance information, please see the table on page 18. Strong stock selection was the primary driver of the Fund’s relative outperformance for the fiscal year.
A beneficial defensive stance
Some months before the start of the Fund’s fiscal year, we positioned the portfolio relatively defensively. While, like most investors, we failed to anticipate the depths of the market’s collapse, we did conclude that economic conditions were rapidly deteriorating. This led us to take a number of proactive steps:
- We substantially reduced the Fund’s allocation to the more economically sensitive financial stocks, moving from an underweighted exposure relative to our MSCI World Index benchmark to an even more underweighted one.
- We increasingly avoided companies with significant debt levels, which we believed would suffer if capital became less readily available.
- When we did invest in these and other cyclical (more economically sensitive) sectors, we favored individual securities that we believed offered low volatility and other relatively conservative characteristics.
Given the gathering economic risks, we felt this defensive approach was prudent. In retrospect, it turned out to be very helpful for performance in the challenging market environment of December 2008 through the first quarter of 2009. Although being defensively positioned was not generally helpful during the fiscal year’s second quarter, when riskier securities fared the best, it drove strong relative performance for the fiscal first half overall.
Global allocation
The allocation between U.S. and non-U.S. stocks in Delaware Global Value Fund is overwhelmingly a function of our bottom-up stock selection process. We look for the same attributes in domestic and international holdings — that is, good valuations combined with strong fundamentals, a competitive position, and encouraging prospects for operating performance relative to a company’s own history and the overall global market. We seek to identify stock valuations that are discounted to the overall market.
We do not make explicit top-down allocation decisions based on factors such as U.S. dollar expectations versus non-U.S. currencies, or prospects for U.S. economic growth versus other parts of the world. Although we do incorporate a close examination of individual companies’ exposures to those factors as part of our bottom-up stock research, such considerations are not part of an overall policy decision that drives stock selection.
The Fund’s exposure to U.S. equities throughout the period was significantly underweight in comparison to that portion of the MSCI World Index. For the overall fiscal
9
Portfolio management review
Delaware Global Value Fund
period, we were approximately 10 percentage points below the index weighting in U.S. stocks, at about 38% versus 48% for the index. This ratio shifted somewhat during the course of the year, but the overall underweighting to the U.S. was generally a contributor to relative performance.
Stocks held
The Fund’s relative performance benefited from its significant underweighting in Japanese stocks, which trailed the market’s performance during the past year.
Relative performance for the Fund was positive in all but one of the industry sectors — including consumer staples, consumer discretionary, and information technology. In consumer staples, Parmalat, an Italian food and dairy company, continued its impressive rebound from a serious accounting fraud scandal of several years ago. Diversified German retailer Metro also performed well, as diminishing concerns about the global economy helped the stock.
In the consumer discretionary sector, strong performers included German automaker BMW and French retail and luxury goods company PPR, both of which rose off of previously depressed valuations.
South Korea’s Samsung Electronics led the way for the Fund in the information technology sector. This manufacturer of electronic products lost significant value because of investors’ concerns about a diminished market for semiconductors and personal computers — two market segments to which the company was significantly exposed. As those markets showed signs of recovery, so did Samsung, which realized healthy gains. We sold our shares after the stock reached our target price.
Weakness in technology
Technology was the Fund’s sole underperforming sector. The tech industry was still experiencing a significant cyclical downturn in August when we established a position in computer manufacturer Dell. A combination of industry-specific factors and broader macroeconomic issues severely impacted the volumes that we saw in Dell’s and other computer manufacturers’ operating performance. What gave us the confidence to invest in Dell even before the cycle turned was the company’s solid balance sheet — especially in terms of its cash position — and what we felt was a solid level of profitability.
Xerox, a U.S. technology holding, was a notable detractor for the Fund. The company clearly had cyclical exposure that was in line with its industry, but we believe it lacked the same kind of competitively distinctive position that would later prompt us to buy into Dell. We felt there were better opportunities elsewhere and sold our Xerox position in April.
Two noteworthy detractors in telecom were France Telecom and Chunghwa Telecom, the leading communications service providers in France and Taiwan, respectively. Both stocks’ returns lagged the benchmark, as investors apparently preferred companies that offered more growth potential during the market’s climb.
10
Portfolio shifts
We maintained the portfolio’s defensive stance through roughly the end of the second quarter of 2009. During the third quarter, we preserved our basic defensive positioning of the Fund’s holdings but sought to adapt to changing conditions. For example, as evidence mounted that the market’s progress might be sustainable and that the economy was slowly improving, we felt more comfortable adding to the Fund’s beta — its risk exposure relative to the benchmark. For example, we added to our position in Lafarge, a French producer of building materials. We became increasingly positive about Lafarge, as we felt that a healthier credit market and improving economy had expanded the company’s financial prospects.
The largest shift among domestic sectors was in financials. We started the year without any holdings of financial companies in the U.S. market; by the end of the period we held four financial stocks. Among these, American Express was by far the largest contributor to Fund performance. At the date of its initial purchase in June 2009, the stock was beaten down due to a combination of exposure to credit risk in its asset portfolio and the prospect of deleveraging by American consumers. We felt that these risks were adequately discounted in the stock price, while the company’s solid brand value, the high credit quality of its customers, and its more stable business model offered substantial room for revaluation.
As the period came to a close, we were encouraged that investors once again were favoring stocks that we believe have solid business fundamentals, sustainable earnings and reasonable valuations. We believe this constituted a more normalized investment environment than the speculative atmosphere of the 2009’s second quarter, when it often seemed that the riskier and more volatile the stock, the better it was performing. By the end of November 2009, the market appeared to be assessing stocks on a company-by-company basis, and because of our regular emphasis on careful individual stock research, we felt this was a favorable backdrop for our style of value investing.
11
| Performance summaries |
| Delaware International Value Equity Fund | Nov. 30, 2009 |
The performance data quoted represent past performance; past performance does not guarantee future results. Investment return and principal value will fluctuate so your shares, when redeemed, may be worth more or less than their original cost. Please obtain the performance data for the most recent month end by calling 800 523-1918 or visiting our Web site at www.delawareinvestments.com/performance. Current performance may be lower or higher than the performance data quoted.
You should consider the investment objectives, risks, charges, and expenses of the Fund carefully before investing. The Delaware International Value Equity Fund prospectus contains this and other important information about the Fund. Please request a prospectus through your financial advisor by calling 800 523-1918 or visiting our Web site at www.delawareinvestments.com. Read the prospectus carefully before you invest or send money.
| Fund performance | Average annual total returns from Nov. 30, 1999, through Nov. 30, 2009 |
| 1 year | | 5 years | | 10 years | | Lifetime |
| Class A (Est. Oct. 31, 1991) |
| Excluding sales charge | | +44.76% | | | | +2.94% | | | | +4.45 | % | | | | +6.70% | |
| Including sales charge | | +36.41% | | | | +1.72% | | | | +3.83 | % | | | | +6.35% | |
| Class B (Est. Sept. 6, 1994) |
| Excluding sales charge | | +43.65% | | | | +2.20% | | | | +3.85 | % | | | | +5.29% | |
| Including sales charge | | +39.65% | | | | +1.92% | | | | +3.85 | % | | | | +5.29% | |
| Class C (Est. Nov. 29, 1995) |
| Excluding sales charge | | +43.71% | | | | +2.23% | | | | +3.72 | % | | | | +5.38% | |
| Including sales charge | | +42.71% | | | | +2.23% | | | | +3.72 | % | | | | +5.38% | |
| Class R (Est. June 2, 2003) |
| Excluding sales charge | | +44.55% | | | | +2.74% | | | | n/a | | | | | +7.94% | |
| Including sales charge | | +44.55% | | | | +2.74% | | | | n/a | | | | | +7.94% | |
| Institutional Class (Est. Nov. 9, 1992) |
| Excluding sales charge | | +45.13% | | | | +3.24% | | | | +4.75 | % | | | | +6.99% | |
| Including sales charge | | +45.13% | | | | +3.24% | | | | +4.75 | % | | | | +6.99% | |
Returns reflect the reinvestment of all distributions and any applicable sales charges as noted in the following paragraphs.
Performance for Class B and C shares, excluding sales charges, assumes either that contingent deferred sales charges did not apply or that the investment was not redeemed.
Expense limitations were in effect for all classes during the periods shown in the Fund performance chart and in the Performance of a $10,000 Investment chart. The current expenses for each class are listed on the “Fund expenses” chart. (Note that all charts and graphs referred to in the “Performance summary” section of this report are found on pages 12 through 14.) Performance would have been lower had the expense limitation not been in effect.
The Fund offers Class A, B, C, R, and Institutional Class shares.
12
Class A shares are sold with a maximum front-end sales charge of up to 5.75%, and have an annual distribution and service fee of up to 0.30% of average daily net assets.
Class B shares may only be purchased through dividend reinvestment and certain permitted exchanges as described in the prospectus. Please see the prospectus for additional information on Class B purchase and sales charges. Class B shares have a contingent deferred sales charge that declines from 4.00% to zero depending on the period of time the shares are held.
Class B shares will automatically convert to Class A shares on a quarterly basis approximately eight years after purchase. They are also subject to an annual distribution and service fee of up to 1.00% of average daily net assets.
Ten-year and lifetime performance figures for Class B shares reflect conversion to Class A shares after eight years.
Class C shares are sold with a contingent deferred sales charge of 1.00% if redeemed during the first 12 months. They are also subject to an annual distribution and service fee of 1.00% of average daily net assets.
Class R shares are available only for certain retirement plan products. They are sold without a sales charge and have an annual distribution and service fee of up to 0.60% of average daily net assets, which has been limited contractually to 0.50% through March 31, 2010.
Institutional Class shares are available without sales or asset-based distribution charges only to certain eligible institutional accounts.
International investments are subject to risks not ordinarily associated with U.S. investments including capital loss from unfavorable fluctuation in currency values, differences in generally accepted accounting principles, or economic or political instability in other nations.
Instances of high double-digit returns are unusual, cannot be sustained, and were achieved primarily during favorable market conditions.
The Fund’s expense ratios, as described in the most recent prospectus, are disclosed in the following “Fund expense ratios” table. Delaware Investments has agreed to (1) voluntarily waive all or a portion of its investment advisory fees and/or reimburse certain expenses (excluding certain expenses) to prevent total annual fund operating expenses from exceeding 1.35% of the Fund’s average daily net assets from Sept. 11, 2009, until the voluntary cap is discontinued; and (2) contractually limit the Class R shares distribution and service fees from April 1, 2009, through March 31, 2010, to 0.50%. Please see the most recent prospectus for additional information on these fee waivers and/or reimbursements.
| Fund expense ratios | Class A | | Class B | | Class C | | Class R | | Institutional Class |
| Total annual operating expense | 1.49% | | 2.19% | | 2.19% | | 1.79% | | 1.19% |
| (without fee waivers) | | | | | | | | | |
| Net expense ratio | 1.49% | | 2.19% | | 2.19% | | 1.69% | | 1.19% |
| (including fee waivers, if any)* | | | | | | | | | |
| Type of waiver | Voluntary | | Voluntary | | Voluntary | | Contractual | | Voluntary |
| | | | | | | and voluntary | | |
13
Performance summaries
Delaware International Value Equity Fund
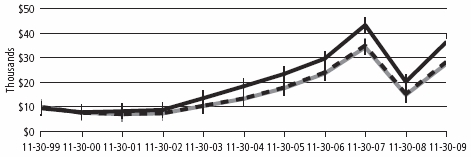
Performance of a $10,000 investment
Average annual total returns from Nov. 30, 1999, through Nov. 30, 2009
| For period beginning Nov. 30, 1999, through Nov. 30, 2009 | Starting value | | Ending value |
| | Delaware International Value Equity Fund — | | | |
| | | Class A Shares | $9,425 | | $14,560 |
| | MSCI EAFE Index (gross) | $10,000 | | $12,557 |
| | MSCI EAFE Index (net) | $10,000 | | $12,071 |
The chart assumes $10,000 invested in the Fund on Nov. 30, 1999, and includes the effect of a 5.75% front-end sales charge and the reinvestment of all distributions. Please note additional details on these fees in the “Performance summary” section of this report, which includes pages 12 through 14.
The chart also assumes $10,000 invested in the MSCI EAFE Index as of Nov. 30, 1999.
The MSCI EAFE Index measures equity market performance across developed market countries in Europe, Australasia, and the Far East. Index “net” return approximates the minimum possible dividend reinvestment, after deduction of withholding tax at the highest possible rate. Index “gross” return reflects the maximum possible dividend reinvestment.
An index is unmanaged and does not reflect the costs of operating a mutual fund, such as the costs of buying, selling, and holding securities. You cannot invest directly in an index. Past performance is not a guarantee of future results.
The “Fund performance” table and the “Performance of a $10,000 investment” graph do not reflect the deduction of taxes the shareholder would pay on Fund distributions or redemptions of Fund shares. Performance of other Fund classes will vary due to different charges and expenses.
| | Nasdaq symbols | | CUSIPs | |
| Class A | | | DEGIX | | | 245914106 | |
| Class B | | | DEIEX | | | 245914700 | |
| Class C | | | DEGCX | | | 245914858 | |
| Class R | | | DIVRX | | | 245914577 | |
| Institutional Class | | | DEQIX | | | 245914403 | |
14
| Delaware Emerging Markets Fund | Nov. 30, 2009 |
The performance data quoted represent past performance; past performance does not guarantee future results. Investment return and principal value will fluctuate so your shares, when redeemed, may be worth more or less than their original cost. Please obtain the performance data for the most recent month end by calling 800 523-1918 or visiting our Web site at www.delawareinvestments.com/performance. Current performance may be lower or higher than the performance data quoted.
You should consider the investment objectives, risks, charges, and expenses of the Fund carefully before investing. The Delaware Emerging Markets Fund prospectus contains this and other important information about the Fund. Please request a prospectus through your financial advisor by calling 800 523-1918 or visiting our Web site at www.delawareinvestments.com. Read the prospectus carefully before you invest or send money.
| Fund performance | Average annual total returns from Nov. 30, 1999, through Nov. 30, 2009 |
| 1 year | | 5 years | | 10 years | | Lifetime |
| Class A (Est. June 10, 1996) |
| Excluding sales charge | | +79.84 | % | | | | +14.63 | % | | | | +14.48 | % | | | | +9.48% | |
| Including sales charge | | +69.41 | % | | | | +13.28 | % | | | | +13.80 | % | | | | +9.00% | |
| Class B (Est. June 10, 1996) |
| Excluding sales charge | | +78.59 | % | | | | +13.78 | % | | | | +13.80 | % | | | | +9.01% | |
| Including sales charge | | +74.59 | % | | | | +13.55 | % | | | | +13.80 | % | | | | +9.01% | |
| Class C (Est. June 10, 1996) |
| Excluding sales charge | | +78.68 | % | | | | +13.79 | % | | | | +13.64 | % | | | | +8.69% | |
| Including sales charge | | +77.68 | % | | | | +13.79 | % | | | | +13.64 | % | | | | +8.69% | |
| Class R (Est. Aug. 31, 2009) |
| Excluding sales charge | | n/a | | | | | n/a | | | | | n/a | | | | | +12.93% | |
| Including sales charge | | n/a | | | | | n/a | | | | | n/a | | | | | +12.93% | |
| Institutional Class (Est. June 10, 1996) |
| Excluding sales charge | | +80.39 | % | | | | +14.91 | % | | | | +14.77 | % | | | | +9.78% | |
| Including sales charge | | +80.39 | % | | | | +14.91 | % | | | | +14.77 | % | | | | +9.78% | |
Returns reflect the reinvestment of all distributions and any applicable sales charges as noted in the following paragraphs.
Performance for Class B and C shares, excluding sales charges, assumes either that contingent deferred sales charges did not apply or that the investment was not redeemed.
Expense limitations were in effect for all classes during the periods shown in the Fund performance chart and in the Performance of a $10,000 Investment chart. The current expenses for each class are listed on the “Fund expenses” chart. (Note that all charts and graphs referred to in the “Performance summary” section of this report are found on pages 15 through 17.) Performance would have been lower had the expense limitation not been in effect.
The Fund offers Class A, B, C, R, and Institutional Class shares.
15
Performance summaries
Delaware Emerging Markets Fund
Class A shares are sold with a maximum front-end sales charge of up to 5.75%, and have an annual distribution and service fee of up to 0.30% of average daily net assets. This fee has been contractually limited to 0.25% of average daily net assets from April 1, 2009, through March 31, 2010.
Class B shares may only be purchased through dividend reinvestment and certain permitted exchanges as described in the prospectus. Please see the prospectus for additional information on Class B purchase and sales charges. Class B shares have a contingent deferred sales charge that declines from 4.00% to zero depending on the period of time the shares are held.
Class B shares will automatically convert to Class A shares on a quarterly basis approximately eight years after purchase. They are also subject to an annual distribution and service fee of up to 1.00% of average daily net assets.
Ten-year and lifetime performance figures for Class B shares reflect conversion to Class A shares after eight years.
Class C shares are sold with a contingent deferred sales charge of 1.00% if redeemed during the first 12 months. They are also subject to an annual distribution and service fee of 1.00% of average daily net assets.
Class R shares are available only for certain retirement plan products. They are sold without a sales charge and have an annual distribution and service fee of up to 0.60% of average daily net assets, which has been limited contractually to 0.50% from April 1, 2009, through March 31, 2010.
Institutional Class shares are available without sales or asset-based distribution charges only to certain eligible institutional accounts.
International investments entail risks not ordinarily associated with U.S. investments including fluctuation in currency values, differences in accounting principles, or economic or political instability in other nations. Investing in emerging markets can be riskier than investing in established foreign markets due to increased volatility and lower trading volume.
Instances of high double-digit returns are unusual, cannot be sustained, and were achieved primarily during favorable market conditions.
The Fund’s expense ratios, as described in the most recent prospectus, are disclosed in the following “Fund expense ratios” table. Delaware Investments has agreed to (1) voluntarily waive all or a portion of its investment advisory fees and/or reimburse certain expenses (excluding certain expenses) to prevent total annual fund operating expenses from exceeding 1.75% of the Fund’s average daily net assets from April 1, 2009, until the voluntary cap is discontinued; and (2) contractually limit the Class A and Class R shares distribution and service fees from April 1, 2009, through March 31, 2010, to 0.25% and 0.50%, respectively. Please see the most recent prospectus for additional information on these fee waivers and/or reimbursements.
| Fund expense ratios | Class A | | Class B | | Class C | | Class R | | Institutional Class |
| Total annual operating expense | 1.88% | | 2.58% | | 2.58% | | 2.18% | | 1.58% |
| (without fee waivers) | | | | | | | | | |
| Net expense ratio | 1.83% | | 2.58% | | 2.58% | | 2.08% | | 1.58% |
| (including fee waivers, if any)* | | | | | | | | | |
| Type of waiver | Contractual | | Voluntary | | Voluntary | | Contractual | | Voluntary |
| and voluntary | | | | | | and voluntary | | |
16
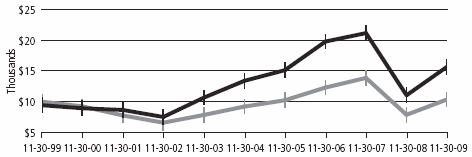
Performance of a $10,000 investment
Average annual total returns from Nov. 30, 1999, through Nov. 30, 2009
| For period beginning Nov. 30, 1999, through Nov. 30, 2009 | Starting value | | Ending value |
| | Delaware Emerging Markets Fund — Class A Shares | $9,425 | | $36,435 |
| | MSCI Emerging Markets Index (gross) | $10,000 | | $28,376 |
| | MSCI Emerging Markets Index (net) | $10,000 | | $27,581 |
The chart assumes $10,000 invested in the Fund on Nov. 30, 1999, and includes the effect of a 5.75% front-end sales charge and the reinvestment of all distributions. Please note additional details on these fees in the “Performance summary” section of this report, which includes pages 15 through 17.
The chart also assumes $10,000 invested in the MSCI Emerging Markets Index as of Nov. 30, 1999. The MSCI Emerging Markets Index measures equity market performance across emerging market countries world-wide. Index “net” return approximates the minimum possible dividend reinvestment, after deduction of withholding tax at the highest possible rate. Index “gross” return reflects the maximum possible dividend reinvestment.
An index is unmanaged and does not reflect the costs of operating a mutual fund, such as the costs of buying, selling, and holding securities. You cannot invest directly in an index. Past performance is not a guarantee of future results.
The “Fund performance” table and the “Performance of a $10,000 investment” graph do not reflect the deduction of taxes the shareholder would pay on Fund distributions or redemptions of Fund shares.
Performance of other Fund classes will vary due to different charges and expenses.
| | Nasdaq symbols | | CUSIPs | |
| Class A | | | DEMAX | | | 245914841 | |
| Class B | | | DEMBX | | | 245914833 | |
| Class C | | | DEMCX | | | 245914825 | |
| Class R | | | DEMRX | | | 245914569 | |
| Institutional Class | | | DEMIX | | | 245914817 | |
17
| Performance summaries |
| Delaware Global Value Fund | Nov. 30, 2009 |
The performance data quoted represent past performance; past performance does not guarantee future results. Investment return and principal value will fluctuate so your shares, when redeemed, may be worth more or less than their original cost. Please obtain the performance data current for the most recent month end by calling 800 523-1918 or visiting our Web site at www.delawareinvestments.com/performance. Current performance may be lower or higher than the performance data quoted.
You should consider the investment objectives, risks, charges, and expenses of the Fund carefully before investing. The Delaware Global Value Fund prospectus contains this and other important information about the Fund. Please request a prospectus through your financial advisor or by calling 800 523-1918 or visiting our Web site at www.delawareinvestments.com. Read the prospectus carefully before you invest or send money.
| Fund performance | Average annual total returns through Nov. 30, 2009 |
| 1 year | | 5 years | | 10 years | | Lifetime |
| Class A (Est. Dec. 19, 1997) |
| Excluding sales charge | | +42.14% | | | | +3.21% | | | | +5.23 | % | | | | +6.67% | |
| Including sales charge | | +33.86% | | | | +2.00% | | | | +4.61 | % | | | | +6.14% | |
| Class B (Est. Sept. 28, 2001) |
| Excluding sales charge | | +41.36% | | | | +2.48% | | | | n/a | | | | | +7.69% | |
| Including sales charge | | +37.36% | | | | +2.18% | | | | n/a | | | | | +7.69% | |
| Class C (Est. Sept. 28, 2001) |
| Excluding sales charge | | +41.12% | | | | +2.46% | | | | n/a | | | | | +7.68% | |
| Including sales charge | | +40.12% | | | | +2.46% | | | | n/a | | | | | +7.68% | |
| Institutional Class (Est. Dec. 19, 1997) |
| Excluding sales charge | | +42.46% | | | | +3.48% | | | | +5.45 | % | | | | +6.86% | |
| Including sales charge | | +42.46% | | | | +3.48% | | | | +5.45 | % | | | | +6.86% | |
Class R shares had not commenced operations as of Nov. 30, 2009.
Returns reflect the reinvestment of all distributions and any applicable sales charges as noted in the following paragraphs.
Performance for Class B and C shares, excluding sales charges, assumes either that contingent deferred sales charges did not apply or that the investment was not redeemed.
Expense limitations were in effect for certain classes during the periods shown in the Fund performance chart and in the “Performance of a $10,000 investment” chart. The current expenses for each class are listed on the “Fund expenses” chart. (Note that all charts and graphs referred to in the “Performance summary” section of this report are found on pages 18 through 20.) Performance would have been lower had the expense limitations not been in effect.
The Fund offers Class A, B, C, and Institutional Class shares.
Class A shares are sold with a maximum front-end sales charge of up to 5.75%, and have an annual distribution and service fee of up to 0.30% of average daily net assets. This fee has
18
been contractually limited to 0.25% of average daily net assets through March 31, 2010.
Class B shares may only be purchased through dividend reinvestment and certain permitted exchanges as described in the prospectus. Please see the prospectus for additional information on Class B purchase and sales charges. Class B shares have a contingent deferred sales charge that declines from 4.00% to zero depending on the period of time the shares are held.
Class B shares will automatically convert to Class A shares on a quarterly basis approximately eight years after purchase. They are also subject to an annual distribution and service fee of up to 1.00% of average daily net assets.
Ten-year and lifetime performance figures for Class B shares reflect conversion to Class A shares after approximately eight years.
Class C shares are sold with a contingent deferred sales charge of 1.00% if redeemed during the first 12 months. They are also subject to an annual distribution and service fee of 1.00% of average daily net assets.
Institutional Class shares are available without sales or asset-based distribution charges only to certain eligible institutional accounts. Institutional Class performance prior to Oct. 28, 2002, is based on Class A performance and was adjusted to eliminate the sales charges, but not the asset-based distribution charge of Class A shares.
The “Fund performance” table and the “Performance of a $10,000 investment” graph do not reflect the deduction of taxes the shareholder would pay on Fund distributions or redemptions of Fund shares.
International investments are subject to risks not ordinarily associated with U.S. investments including capital loss from unfavorable fluctuation in currency values, differences in generally accepted accounting principles, or economic or political instability in other nations. Investing in emerging markets can be riskier than investing in established foreign markets due to increased volatility and lower trading volume.
Instances of high double-digit returns are unusual, cannot be sustained, and were achieved primarily during favorable market conditions.
19
Performance summaries
Delaware Global Value Fund
The Fund’s expense ratios, as described in the most recent prospectus, are disclosed in the following ”Fund expense ratios” table. Delaware Investments has agreed to (1) voluntarily waive all or a portion of its investment advisory fees and/or reimburse certain expenses (excluding certain expenses) to prevent total annual fund operating expenses from exceeding 1.30% of the Fund’s average daily net assets from April 1, 2009, until the voluntary cap is discontinued; and (2) contractually limit the Class A distribution and service fees from April 1, 2009, through March 31, 2010, to 0.25% . Please see the most recent prospectus for additional information on these fee waivers and/or reimbursements.
| Fund expense ratios | Class A | | Class B | | Class C | | Class R | | Institutional Class |
| Total annual operating expense | 1.76% | | 2.46% | | 2.46% | | 2.06% | | 1.46% |
| (without fee waivers) | | | | | | | | | |
| Net expenses | 1.71% | | 2.46% | | 2.46% | | 1.96% | | 1.46% |
| (including fee waivers, if any)* | | | | | | | | | |
| Type of waiver | Contractual | | Voluntary | | Voluntary | | Contractual | | Voluntary |
| and voluntary | | | | | | and voluntary | | |
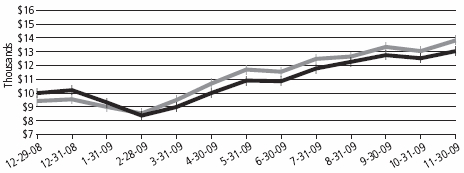
Performance of a $10,000 investment
Average annual total returns from Nov. 30, 1999, through Nov. 30, 2009
| For period beginning Nov. 30, 1999, through Nov. 30, 2009 | Starting value | | Ending value |
| | Delaware Global Value Equity Fund — Class A Shares | $9,425 | | $15,691 |
| | MSCI World Index (net) | $10,000 | | $10,364 |
20
The chart assumes $10,000 invested in the Fund on Nov. 30, 1999, and includes the effect of a 5.75% front-end sales charge and the reinvestment of all distributions. Please note additional details on these fees in the “Performance summary” section of this report, which includes pages 18 through 21.
The chart also assumes $10,000 invested in the MSCI World Index as of Nov. 30, 1999. The MSCI World Index is a free float-adjusted market capitalization weighted index designed to measure equity market performance across developed markets world-wide. Index “net” return reflects minimum possible dividend reinvestment, after deduction of withholding tax at the highest possible rate.
An index is unmanaged and does not reflect the costs of operating a mutual fund, such as the costs of buying, selling, and holding securities. You cannot invest directly in an index. Past performance is not a guarantee of future results.
Performance of other Fund classes will vary due to different charges and expenses.
The “Fund performance” chart and the “Performance of a $10,000 investment” graph do not reflect the deduction of taxes the shareholders would pay on Fund distributions or redemptions of Fund shares.
Performance of other Fund classes will vary due to different charges and expenses.
| Stock symbols and CUSIP numbers |
| | Nasdaq symbols | | CUSIPs | |
| Class A | | | DABAX | | | 245914718 | |
| Class B | | | DABBX | | | 245914692 | |
| Class C | | | DABCX | | | 245914684 | |
| Institutional Class | | | DABIX | | | 245914676 | |
21
Disclosure of Fund expenses
For the period June 1, 2009 to November 30, 2009
As a shareholder of a Fund, you incur two types of costs: (1) transaction costs, including sales charges (loads) on purchase payments, reinvested dividends, or other distributions; redemption fees; and exchange fees; and (2) ongoing costs, including management fees; distribution and/or service (12b-1) fees; and other Fund expenses. These following examples are intended to help you understand your ongoing costs (in dollars) of investing in a Fund and to compare these costs with the ongoing costs of investing in other mutual funds.
The examples are based on an investment of $1,000 invested at the beginning of the period and held for the entire period June 1, 2009 to November 30, 2009.
Actual expenses
The first section of the tables shown, “Actual Fund Return,” provides information about actual account values and actual expenses. You may use the information in this section of the table, together with the amount you invested, to estimate the expenses that you paid over the period. Simply divide your account value by $1,000 (for example, an $8,600 account value divided by $1,000 = 8.6), then multiply the result by the number in the first section under the heading entitled “Expenses Paid During Period” to estimate the expenses you paid on your account during this period.
Hypothetical example for comparison purposes
The second section of the tables shown, “Hypothetical 5% Return,” provides information about hypothetical account values and hypothetical expenses based on the Funds’ actual expense ratios and an assumed rate of return of 5% per year before expenses, which is not the Funds’ actual return. The hypothetical account values and expenses may not be used to estimate the actual ending account balance or expenses you paid for the period. You may use this information to compare the ongoing costs of investing in the Funds and other funds. To do so, compare this 5% hypothetical example with the 5% hypothetical examples that appear in the shareholder reports of the other funds.
Please note that the expenses shown in the tables are meant to highlight your ongoing costs only and do not reflect any transactional costs, such as sales charges (loads), redemption fees, or exchange fees. Therefore, the second section of each table is useful in comparing ongoing costs only, and will not help you determine the relative total costs of owning different funds. In addition, if these transactional costs were included, your costs would have been higher. The Funds’ expenses shown in the tables reflect fee waivers in effect. The expenses shown in each table assume reinvestment of all dividends and distributions.
22
Delaware International Value Equity Fund
Expense analysis of an investment of $1,000
| | Beginning | | Ending | | | | Expenses |
| | Account Value | | Account Value | | Annualized | | Paid During Period |
| | 6/1/09 | | 11/30/09 | | Expense Ratio | | 6/1/09 to 11/30/09* |
| Actual Fund return | | | | | | | | | | | | |
| Class A | | $1,000.00 | | | $1,215.40 | | | 1.59% | | $ | 8.83 | |
| Class B | | 1,000.00 | | | 1,210.10 | | | 2.29% | | | 12.69 | |
| Class C | | 1,000.00 | | | 1,211.70 | | | 2.29% | | | 12.70 | |
| Class R | | 1,000.00 | | | 1,213.70 | | | 1.79% | | | 9.93 | |
| Institutional Class | | 1,000.00 | | | 1,216.80 | | | 1.29% | | | 7.17 | |
| Hypothetical 5% return (5% return before expenses) | | | | | | | |
| Class A | | $1,000.00 | | | $1,017.10 | | | 1.59% | | $ | 8.04 | |
| Class B | | 1,000.00 | | | 1,013.59 | | | 2.29% | | | 11.56 | |
| Class C | | 1,000.00 | | | 1,013.59 | | | 2.29% | | | 11.56 | |
| Class R | | 1,000.00 | | | 1,016.09 | | | 1.79% | | | 9.05 | |
| Institutional Class | | 1,000.00 | | | 1,018.60 | | | 1.29% | | | 6.53 | |
Delaware Emerging Markets Fund
Expense analysis of an investment of $1,000
| | | Beginning | | Ending | | | | Expenses |
| | Account Value | | Account Value | | Annualized | | Paid During Period |
| | 6/1/09 | | 11/30/09** | | Expense Ratio | | 6/1/09 to 11/30/09* |
| Actual Fund return | | | | | | | | | | | | |
| Class A | | $1,000.00 | | | $1,251.70 | | | 1.81% | | $ | 10.22 | |
| Class B | | 1,000.00 | | | 1,247.50 | | | 2.56% | | | 14.42 | |
| Class C | | 1,000.00 | | | 1,247.00 | | | 2.56% | | | 14.42 | |
| Class R** | | 1,000.00 | | | 1,129.30 | | | 2.11% | | | 5.66 | |
| Institutional Class | | 1,000.00 | | | 1,253.10 | | | 1.56% | | | 8.81 | |
| Hypothetical 5% return (5% return before expenses) | | | | | | | |
| Class A | | $1,000.00 | | | $1,015.99 | | | 1.81% | | $ | 9.15 | |
| Class B | | 1,000.00 | | | 1,012.23 | | | 2.56% | | | 12.91 | |
| Class C | | 1,000.00 | | | 1,012.23 | | | 2.56% | | | 12.91 | |
| Class R | | 1,000.00 | | | 1,014.49 | | | 2.11% | | | 10.66 | |
| Institutional Class | | 1,000.00 | | | 1,017.25 | | | 1.56% | | | 7.89 | |
23
Disclosure of Fund expenses
Delaware Global Value Fund
Expense analysis of an investment of $1,000
| | Beginning | | Ending | | | | Expenses |
| | Account Value | | Account Value | | Annualized | | Paid During Period |
| | 6/1/09 | | 11/30/09 | | Expense Ratio | | 6/1/09 to 11/30/09* |
| Actual Fund return | | | | | | | | | | | | |
| Class A | | $1,000.00 | | | $1,242.30 | | | 1.61% | | $ | 9.05 | |
| Class B | | 1,000.00 | | | 1,238.70 | | | 2.36% | | | 13.24 | |
| Class C | | 1,000.00 | | | 1,238.70 | | | 2.36% | | | 13.24 | |
| Institutional Class | | 1,000.00 | | | 1,245.00 | | | 1.36% | | | 7.65 | |
| Hypothetical 5% return (5% return before expenses) | | | | | | | |
| Class A | | $1,000.00 | | | $1,017.00 | | | 1.61% | | $ | 8.14 | |
| Class B | | 1,000.00 | | | 1,013.24 | | | 2.36% | | | 11.91 | |
| Class C | | 1,000.00 | | | 1,013.24 | | | 2.36% | | | 11.91 | |
| Institutional Class | | 1,000.00 | | | 1,018.25 | | | 1.36% | | | 6.88 | |
| * | “Expenses Paid During Period” are equal to the Funds’ annualized expense ratio, multiplied by the average account value over the period, multiplied by 183/365 (to reflect the one-half year period). For Delaware Emerging Markets Fund Class R, the “Expenses Paid During Period” for the Actual Fund return are equal to the Fund’s annualized expense ratio multiplied by the average account value over the period, multiplied by 92/365 (to reflect actual since inception). |
| ** | Delaware Emerging Markets Fund Class R shares commenced operations on August 31, 2009. The Ending Account Value for Actual Fund return uses the performance since inception and is not annualized. |
DMC has voluntarily agreed to waive all or a portion of its management fee and reimburse expenses (excluding any 12b-1 plan expenses, taxes, interest, inverse floater program expenses, brokerage fees, short sale and dividend interest expenses, certain insurance costs, and nonroutine expenses or costs including, but not limited to, those relating to reorganizations, litigation, conducting shareholder meetings, and liquidations (collectively, “non-routine expenses”)) in order to prevent total annual fund operating expenses from exceeding, in an aggregate amount, the specified percentages of average daily net assets from September 11, 2009 until such time as the voluntary expense caps are discontinued. These fee waivers and expense reimbursements apply only to expenses paid directly by the Funds, and may be discontinued at any time because they are voluntary. Prior to September 11, 2009, DMC had voluntarily and contractually agreed to waive that portion, if any, of its management fees and reimburse the Funds to the extent necessary to ensure that total annual operating expenses (excluding any 12b-1 plan expenses, taxes, interest, inverse floater program expenses, brokerage fees, certain insurance costs, and nonroutine expenses (as defined above), did not exceed the specified percentages of average daily net assets of the Funds.
24
| | Delaware International | | Delaware Emerging | | Delaware Global |
| Value Equity Fund | | Markets Fund | | Value Fund |
| Voluntary operating Expense | | | | | | |
| limitation as a percentage of | | | | | | |
| average net assets effective as of | | | | | | |
| September 11, 2009 | 1.35% | | 1.75% | | | 1.30% |
| April 1, 2009 to September 11, 2009 | | | | | | |
| voluntary operating expense | | | | | | |
| limitation as a percentage of | | | | | | |
| average daily net assets | 1.24% | | 1.61% | | | 1.39% |
| Prior to April 1, 2009 contractual/ | | | | | | |
| voluntary operating expense | | | | | | |
| limitation as a percentage of | | | | | | |
| average daily net assets | 1.10% voluntary | | — | | | 1.20% contractual |
If the current voluntary waivers were in effect for the entire period, the Expense analysis for the Funds would be as follows:
Delaware International Value Equity Fund
Expense analysis of an investment of $1,000
| | Beginning | | Ending | | | | Expenses |
| | Account Value | | Account Value | | Annualized | | Paid During Period |
| | 6/1/09 | | 11/30/09 | | Expense Ratio | | 6/1/09 to 11/30/09* |
| Actual Fund return | | | | | | | | | | | | |
| Class A | | $1,000.00 | | | $1,215.40 | | | 1.65% | | $ | 9.16 | |
| Class B | | 1,000.00 | | | 1,210.10 | | | 2.35% | | | 13.02 | |
| Class C | | 1,000.00 | | | 1,211.70 | | | 2.35% | | | 13.03 | |
| Class R | | 1,000.00 | | | 1,213.70 | | | 1.85% | | | 10.27 | |
| Institutional Class | | 1,000.00 | | | 1,216.80 | | | 1.35% | | | 7.50 | |
| Hypothetical 5% return (5% return before expenses) | | | | | | | |
| Class A | | $1,000.00 | | | $1,016.80 | | | 1.65% | | $ | 8.34 | |
| Class B | | 1,000.00 | | | 1,013.29 | | | 2.35% | | | 11.86 | |
| Class C | | 1,000.00 | | | 1,013.29 | | | 2.35% | | | 11.86 | |
| Class R | | 1,000.00 | | | 1,015.79 | | | 1.85% | | | 9.35 | |
| Institutional Class | | 1,000.00 | | | 1,018.30 | | | 1.35% | | | 6.83 | |
25
Disclosure of Fund expenses
Delaware Emerging Markets Fund
Expense analysis of an investment of $1,000
| | Beginning | | Ending | | | | Expenses |
| | Account Value | | Account Value | | Annualized | | Paid During Period |
| | 6/1/09 | | 11/30/09 | | Expense Ratio | | 6/1/09 to 11/30/09* |
| Actual Fund return | | | | | | | | | | | | |
| Class A | | $1,000.00 | | | $1,251.70 | | | 2.00% | | $ | 11.29 | |
| Class B | | 1,000.00 | | | 1,247.50 | | | 2.75% | | | 15.49 | |
| Class C | | 1,000.00 | | | 1,247.00 | | | 2.75% | | | 15.49 | |
| Class R** | | 1,000.00 | | | 1,129.30 | | | 2.25% | | | 6.04 | |
| Institutional Class | | 1,000.00 | | | 1,253.10 | | | 1.75% | | | 9.88 | |
| Hypothetical 5% return (5% return before expenses) | | | | | | | |
| Class A | | $1,000.00 | | | $1,015.04 | | | 2.00% | | $ | 10.10 | |
| Class B | | 1,000.00 | | | 1,011.28 | | | 2.75% | | | 13.87 | |
| Class C | | 1,000.00 | | | 1,011.28 | | | 2.75% | | | 13.87 | |
| Class R | | 1,000.00 | | | 1,013.79 | | | 2.25% | | | 11.36 | |
| Institutional Class | | 1,000.00 | | | 1,016.29 | | | 1.75% | | | 8.85 | |
Delaware Global Value Fund
Expense analysis of an investment of $1,000
| | Beginning | | Ending | | | | Expenses |
| | Account Value | | Account Value | | Annualized | | Paid During Period |
| | 6/1/09 | | 11/30/09 | | Expense Ratio | | 6/1/09 to 11/30/09* |
| Actual Fund return | | | | | | | | | | | | |
| Class A | | $1,000.00 | | | $1,242.30 | | | 1.55% | | $ | 8.71 | |
| Class B | | 1,000.00 | | | 1,238.70 | | | 2.30% | | | 12.91 | |
| Class C | | 1,000.00 | | | 1,238.70 | | | 2.30% | | | 12.91 | |
| Institutional Class | | 1,000.00 | | | 1,245.00 | | | 1.30% | | | 7.32 | |
| Hypothetical 5% return (5% return before expenses) | | | | | | | |
| Class A | | $1,000.00 | | | $1,017.30 | | | 1.55% | | $ | 7.84 | |
| Class B | | 1,000.00 | | | 1,013.54 | | | 2.30% | | | 11.61 | |
| Class C | | 1,000.00 | | | 1,013.54 | | | 2.30% | | | 11.61 | |
| Institutional Class | | 1,000.00 | | | 1,018.55 | | | 1.30% | | | 6.58 | |
26
| Country and sector allocations | |
| Delaware International Value Equity Fund | As of November 30, 2009 |
Sector designations may be different than the sector designations presented in other Fund materials. The sector designations may represent the investment manager’s internal sector classifications, which may result in the sector designations for one fund being different than another fund’s sector designations.
| Country | Percentage of net assets |
| Common Stock | 100.96 | % |
| Australia | 3.23 | % |
| Brazil | 3.44 | % |
| Canada | 8.56 | % |
| Denmark | 1.54 | % |
| Finland | 1.79 | % |
| France | 18.67 | % |
| Germany | 8.96 | % |
| Hong Kong | 7.40 | % |
| Italy | 6.23 | % |
| Japan | 10.19 | % |
| Luxembourg | 1.08 | % |
| Netherlands | 2.48 | % |
| Singapore | 1.96 | % |
| Spain | 2.26 | % |
| Sweden | 4.52 | % |
| Switzerland | 3.92 | % |
| Taiwan | 1.69 | % |
| United Kingdom | 13.04 | % |
| Securities Lending Collateral | 19.35 | % |
| Total Value of Securities | 120.31 | % |
| Obligation to Return Securities Lending Collateral | (19.81 | %) |
| Liabilities Net of Receivables and Other Assets | (0.50 | %) |
| Total Net Assets | 100.00 | % |
27
Country and sector allocations
Delaware International Value Equity Fund
| Sector | Percentage of net assets |
| Consumer Discretionary | 21.68 | % |
| Consumer Staples | 8.40 | % |
| Energy | 9.14 | % |
| Financials | 12.26 | % |
| Health Care | 7.54 | % |
| Industrials | 18.45 | % |
| Information Technology | 6.05 | % |
| Materials | 8.61 | % |
| Telecommunication Services | 6.70 | % |
| Utilities | 2.13 | % |
| Total | 100.96 | % |
28
| Delaware Emerging Markets Fund | As of November 30, 2009 |
Sector designations may be different than the sector designations presented in other Fund materials. The sector designations may represent the investment manager’s internal sector classifications which may result in the sector designations for one fund being different than another fund’s sector designations.
| Composition of Portfolio | Percentage of net assets |
| Common Stock by Country | 93.33 | % |
| Argentina | 2.54 | % |
| Australia | 0.36 | % |
| Brazil | 12.45 | % |
| Canada | 0.47 | % |
| China | 10.65 | % |
| France | 0.41 | % |
| Hong Kong | 6.41 | % |
| Hungary | 0.41 | % |
| India | 1.69 | % |
| Indonesia | 2.24 | % |
| Israel | 1.26 | % |
| Kazakhstan | 0.04 | % |
| Luxembourg | 0.50 | % |
| Malaysia | 2.23 | % |
| Mexico | 5.12 | % |
| Pakistan | 0.22 | % |
| Peru | 0.85 | % |
| Philippines | 0.52 | % |
| Poland | 1.02 | % |
| Republic of Korea | 12.13 | % |
| Russia | 7.88 | % |
| South Africa | 8.82 | % |
| Taiwan | 5.08 | % |
| Thailand | 2.81 | % |
| Turkey | 3.51 | % |
| United Kingdom | 1.46 | % |
| United States | 2.25 | % |
| Preferred Stock by Country | 6.39 | % |
| Brazil | 3.83 | % |
| Malaysia | 0.06 | % |
| Republic of Korea | 1.96 | % |
| Russia | 0.54 | % |
29
Country and sector allocations
Delaware Emerging Markets Fund
| Composition of Portfolio | Percentage of net assets |
| Participation Notes | 0.06 | % |
| Discount Note | 0.28 | % |
| Securities Lending Collateral | 2.63 | % |
| Total Value of Securities | 102.69 | % |
| Obligation to Return Securities Lending Collateral | (2.69 | %) |
| Liabilities Net of Receivables and Other Assets | 0.00 | % |
| Total Net Assets | 100.00 | % |
| |
| Commons Stock, Preferred Stock and Participation Notes by Sector | Percentage of net assets |
| Consumer Discretionary | 5.24 | % |
| Consumer Staples | 7.78 | % |
| Energy | 16.26 | % |
| Financials | 12.93 | % |
| Industrials | 7.19 | % |
| Information Technology | 11.14 | % |
| Materials | 16.23 | % |
| Telecommunication Services | 15.00 | % |
| Utilities | 8.01 | % |
| Total | 99.78 | % |
30
| Delaware Global Value Fund | As of November 30, 2009 |
Sector designations may be different than the sector designations presented in other Fund materials. The sector designations may represent the investment manager’s internal sector classifications which may result in the sector designations for one fund being different than another fund’s sector designations.
| Country | Percentage of net assets |
| Common Stock | 100.39 | % |
| Australia | 1.47 | % |
| Brazil | 2.24 | % |
| Canada | 4.98 | % |
| Denmark | 0.91 | % |
| Finland | 0.81 | % |
| France | 11.63 | % |
| Germany | 5.01 | % |
| Hong Kong | 4.09 | % |
| Italy | 4.09 | % |
| Japan | 6.28 | % |
| Luxembourg | 0.75 | % |
| Netherlands | 1.14 | % |
| Singapore | 1.33 | % |
| Spain | 1.46 | % |
| Sweden | 3.46 | % |
| Switzerland | 2.11 | % |
| Taiwan | 1.06 | % |
| United Kingdom | 7.36 | % |
| United States | 40.21 | % |
| Discount Note | 0.09 | % |
| Securities Lending Collateral | 14.03 | % |
| Total Value of Securities | 114.51 | % |
| Obligation to Return Securities Lending Collateral | (14.44 | %) |
| Liabilities Net of Receivables and Other Assets | (0.07 | %) |
| Total Net Assets | 100.00 | % |
31
Country and sector allocations
Delaware Global Value Fund
| Sector | Percentage of net assets |
| Consumer Discretionary | 17.95 | % |
| Consumer Staples | 8.72 | % |
| Energy | 8.38 | % |
| Financials | 13.91 | % |
| Health Care | 7.55 | % |
| Industrials | 18.19 | % |
| Information Technology | 10.52 | % |
| Materials | 7.39 | % |
| Telecommunication Services | 6.52 | % |
| Utilities | 1.26 | % |
| Total | 100.39 | % |
32
| Statements of net assets | |
| Delaware International Value Equity Fund | November 30, 2009 |
| | | Number of shares | | Value (U.S. $) |
| Common Stock – 100.96%D |
| Australia – 3.23% | | | | |
| | Coca-Cola Amatil | 838,247 | | $ | 8,135,934 |
| Telstra | 1,151,266 | | | 3,594,674 |
| | | | | 11,730,608 |
| Brazil – 3.44% | | | | |
| Petroleo Brasileiro ADR | 192,200 | | | 8,660,532 |
| * | Vale ADR | 134,400 | | | 3,853,248 |
| | | | | 12,513,780 |
| Canada – 8.56% | | | | |
| Agrium | 141,800 | | | 7,920,948 |
| † | CGI Group Class A | 1,253,914 | | | 15,502,418 |
| TELUS | 237,499 | | | 7,695,008 |
| | | | | 31,118,374 |
| Denmark – 1.54% | | | | |
| Novo Nordisk Class B | 83,191 | | | 5,580,416 |
| | | | | 5,580,416 |
| Finland – 1.79% | | | | |
| Nokia | 492,936 | | | 6,490,193 |
| | | | | 6,490,193 |
| France – 18.67% | | | | |
| * | AXA | 272,881 | | | 6,501,562 |
| * | Cie de Saint-Gobain | 163,754 | | | 8,905,694 |
| Lafarge | 86,428 | | | 7,101,456 |
| * | PPR | 59,510 | | | 7,200,994 |
| * | Publicis Groupe | 165,022 | | | 6,352,247 |
| Sanofi-Aventis | 49,219 | | | 3,718,270 |
| Teleperformance | 258,353 | | | 8,571,824 |
| * | Total | 86,907 | | | 5,376,812 |
| Vallourec | 29,166 | | | 4,877,862 |
| Vivendi | 321,325 | | | 9,257,357 |
| | | | | 67,864,078 |
| Germany – 8.96% | | | | |
| * | Bayerische Motoren Werke | 175,924 | | | 8,324,895 |
| Deutsche Post | 418,940 | | | 7,843,064 |
| Linde | 69,144 | | | 8,486,131 |
| Metro | 126,206 | | | 7,929,448 |
| | | | | 32,583,538 |
33
Statements of net assets
Delaware International Value Equity Fund
| | | Number of shares | | Value (U.S. $) |
| Common Stock (continued) |
| Hong Kong – 7.40%n | | | | |
| | CNOOC | 5,104,000 | | $ | 7,863,605 |
| * | Esprit Holdings | 1,082,321 | | | 7,276,131 |
| * | Techtronic Industries | 7,925,500 | | | 6,350,749 |
| Yue Yuen Industrial Holdings | 1,920,500 | | | 5,414,676 |
| | | | | 26,905,161 |
| Italy – 6.23% | | | | |
| Finmeccanica | 443,855 | | | 7,349,945 |
| Parmalat | 2,889,717 | | | 8,407,688 |
| UniCredit | 2,014,816 | | | 6,881,518 |
| | | | | 22,639,151 |
| Japan – 10.19% | | | | |
| Asahi Glass | 775,900 | | | 6,776,223 |
| Astellas Pharma | 178,000 | | | 6,568,190 |
| * | Don Quijote | 263,700 | | | 6,664,945 |
| * | Mitsubishi UFJ Financial Group | 1,497,757 | | | 8,350,710 |
| * | Round One | 447,422 | | | 2,639,505 |
| Toyota Motor | 152,400 | | | 6,064,268 |
| | | | | 37,063,841 |
| Luxembourg – 1.08% | | | | |
| * | ArcelorMittal | 100,833 | | | 3,928,326 |
| | | | | 3,928,326 |
| Netherlands – 2.48% | | | | |
| * | Koninklijke Philips Electronics | 329,731 | | | 9,016,883 |
| | | | | 9,016,883 |
| Singapore – 1.96% | | | | |
| Singapore Airlines | 742,873 | | | 7,138,881 |
| | | | | 7,138,881 |
| Spain – 2.26% | | | | |
| Banco Santander | 480,550 | | | 8,231,741 |
| | | | | 8,231,741 |
| Sweden – 4.52% | | | | |
| Autoliv | 226,500 | | | 9,198,165 |
| * | Nordea Bank | 697,956 | | | 7,237,632 |
| | | | | 16,435,797 |
34
| | | | Number of shares | | Value (U.S. $) | |
| Common Stock (continued) | | | | | | |
| Switzerland – 3.92% | | | | | | |
| Novartis | | 153,164 | | $ | 8,499,794 | |
| † | Transocean | | 67,500 | | | 5,763,825 | |
| | | | | | 14,263,619 | |
| Taiwan – 1.69% | | | | | | |
| Chunghwa Telecom ADR | | 345,075 | | | 6,138,884 | |
| | | | | | 6,138,884 | |
| United Kingdom – 13.04% | | | | | | |
| AstraZeneca | | 68,269 | | | 3,051,913 | |
| BP | | 588,099 | | | 5,560,916 | |
| @ | Greggs | | 852,882 | | | 6,089,165 | |
| National Grid | | 712,201 | | | 7,738,460 | |
| Standard Chartered | | 301,781 | | | 7,367,241 | |
| Tomkins | | 2,329,639 | | | 6,584,016 | |
| † | Vodafone Group | | 3,075,562 | | | 6,936,511 | |
| WPP Group | | 436,664 | | | 4,083,729 | |
| | | | | | 47,411,951 | |
| Total Common Stock (cost $370,967,610) | | | | | 367,055,222 | |
| | | | | | | |
| Total Value of Securities Before Securities | | | | | | |
| Lending Collateral – 100.96% (cost $370,967,610) | | | | | 367,055,222 | |
| | | | | | | |
| Securities Lending Collateral** – 19.35% | | | | | | |
| Investment Companies | | | | | | |
| Mellon GSL DBT II Collateral Fund | | 51,479,185 | | | 51,479,185 | |
| BNY Mellon SL DBT II Liquidating Fund | | 18,989,854 | | | 18,782,865 | |
| @†Mellon GSL Reinvestment Trust II | | 1,554,050 | | | 66,047 | |
| Total Securities Lending Collateral (cost $72,023,089) | | | | | 70,328,097 | |
| | | | | | | |
| Total Value of Securities – 120.31% | | | | | | |
| (cost $442,990,699) | | | | | 437,383,319 | © |
| Obligation to Return Securities Lending | | | | | | |
| Collateral** – (19.81%) | | | | | (72,023,089 | ) |
| Liabilities Net of Receivables and | | | | | | |
| Other Assets – (0.50%) | | | | | (1,799,213 | ) |
| Net Assets Applicable to 31,926,911 | | | | | | |
| Shares Outstanding – 100.00% | | | | $ | 363,561,017 | |
35
Statements of net assets
Delaware International Value Equity Fund
| | | | | | | |
| Net Asset Value – Delaware International Value Equity Fund | | | | | |
| Class A ($154,721,224 / 13,572,494 Shares) | | | | $11.40 | |
| Net Asset Value – Delaware International Value Equity Fund | | | | | |
| Class B ($10,796,090 / 960,963 Shares) | | | | $11.23 | |
| Net Asset Value – Delaware International Value Equity Fund | | | | | |
| Class C ($54,235,109 / 4,835,064 Shares) | | | | $11.22 | |
| Net Asset Value – Delaware International Value Equity Fund | | | | | |
| Class R ($2,984,359 / 262,690 Shares) | | | | $11.36 | |
| Net Asset Value – Delaware International Value Equity Fund | | | | | |
| Institutional Class ($140,824,235 / 12,295,700 Shares) | | | | $11.45 | |
| | | | | | |
| Components of Net Assets at November 30, 2009: | | | | | |
| Shares of beneficial interest (unlimited authorization – no par) | | $ | 575,133,862 | |
| Undistributed net investment income | | | 7,190,693 | |
| Accumulated net realized loss on investments | | | (213,167,048 | ) |
| Net unrealized depreciation of investments and foreign currencies | | | (5,596,490 | ) |
| Total net assets | | $ | 363,561,017 | |
| D | Securities have been classified by country of origin. Classification by type of business has been presented on page 26 in “Country and sector allocations.” |
| n | Securities listed and traded on the Hong Kong Stock Exchange. These securities have significant business operations in China. |
| † | Non income producing security. |
| * | Fully or partially on loan. |
| ** | See Note 9 in “Notes to financial statements.” |
| © | Includes $67,324,748 of securities loaned. |
| @ | Illiquid security. At November 30, 2009, the aggregate amount of illiquid securities was $6,155,212, which represented 1.69% of the Fund’s net assets. See Note 10 in “Notes to financial statements.” |
ADR — American Depositary Receipts
36
| |
| Net Asset Value and Offering Price Per Share – | | |
| Delaware International Value Equity Fund | | |
| Net asset value Class A (A) | | $11.40 |
| Sales charge (5.75% of offering price) (B) | | 0.70 |
| Offering price | | $12.10 |
| (A) | Net asset value per share, as illustrated, is the amount which would be paid upon redemption or repurchase of shares. |
| (B) | See the current prospectus for purchases of $50,000 or more. |
See accompanying notes
37
| Statements of net assets | |
| Delaware Emerging Markets Fund | November 30, 2009 |
| | | | Number of shares | | Value (U.S. $) |
| Common Stock – 93.33%D | | | | | |
| Argentina – 2.54% | | | | | |
| @ | Cresud ADR | | 936,870 | | $ | 13,125,549 |
| †# | Grupo Clarin Class B GDR 144A | | 353,200 | | | 1,372,465 |
| *@ | IRSA Inversiones y Representaciones GDR | | 358,400 | | | 2,949,632 |
| *† | Pampa Energia ADR | | 95,300 | | | 1,006,368 |
| | | | | | 18,454,014 |
| Australia – 0.36% | | | | | |
| † | Alara Resources | | 200,832 | | | 34,939 |
| * | Alumina ADR | | 292,200 | | | 1,636,320 |
| † | Strike Resources | | 1,398,730 | | | 922,138 |
| | | | | | 2,593,397 |
| Brazil – 12.45% | | | | | |
| AES Tiete | | 597,480 | | | 6,211,342 |
| † | Banco Santander Brasil ADR | | 500,300 | | | 6,829,095 |
| *† | Brasil Foods ADR | | 84,000 | | | 4,074,000 |
| *† | Braskem ADR | | 99,300 | | | 1,310,760 |
| † | Centrais Eletricas Brasileiras | | 1,579,671 | | | 26,095,391 |
| Cyrela Brazil Realty | | 165,097 | | | 2,322,926 |
| *† | Fibria Celulose ADR | | 313,729 | | | 5,496,532 |
| Itau Unibanco Holding ADR | | 220,000 | | | 4,895,000 |
| Petroleo Brasileiro ADR | | 635,000 | | | 28,613,099 |
| * | Tim Participacoes ADR | | 155,000 | | | 4,185,000 |
| † | Triunfo Participacoes e Investmentos | | 109,600 | | | 342,754 |
| | | | | | 90,375,899 |
| Canada – 0.47% | | | | | |
| Potash Corporation of Saskatchewan | | 30,000 | | | 3,372,600 |
| | | | | | 3,372,600 |
| China – 10.65%o | | | | | |
| † | 51job ADR | | 118,300 | | | 2,168,439 |
| China Life Insurance ADR | | 100,000 | | | 7,566,000 |
| * | China Petroleum & Chemical ADR | | 45,000 | | | 3,765,600 |
| * | China Telecom | | 8,633,078 | | | 3,820,907 |
| * | First Pacific | | 5,044,800 | | | 2,922,786 |
| † | Focus Media Holding ADR | | 413,115 | | | 5,188,724 |
| † | Foxconn International Holdings | | 1,931,000 | | | 1,666,921 |
| *† | Hollysys Automation Technologies | | 188,400 | | | 2,383,260 |
| Huaneng Power International | | 5,000,000 | | | 3,122,641 |
| * | Huaneng Power International ADR | | 169,000 | | | 4,248,660 |
38
| | | | Number of shares | | Value (U.S. $) |
| Common Stock (continued) | | | | | |
| China (continued) | | | | | |
| *† | Metallurgical | | 2,167,000 | | $ | 1,417,665 |
| PetroChina | | 4,242,000 | | | 5,254,708 |
| * | PetroChina ADR | | 50,000 | | | 6,245,000 |
| *† | Shanda Games ADR | | 472,300 | | | 4,836,352 |
| *† | Shanda Interactive Entertainment ADR | | 180,000 | | | 8,971,200 |
| *† | Sina | | 125,500 | | | 5,680,130 |
| Sinotrans | | 7,561,000 | | | 1,961,020 |
| *† | Sohu.com | | 8,800 | | | 490,688 |
| *† | Spreadtrum Communications ADR | | 213,900 | | | 1,005,330 |
| Travelsky Technology | | 4,849,400 | | | 4,555,396 |
| | | | | | 77,271,427 |
| France – 0.41% | | | | | |
| † | Vallourec | | 17,646 | | | 2,951,202 |
| | | | | | 2,951,202 |
| Hong Kong – 6.41%n | | | | | |
| China Mobile ADR | | 440,000 | | | 20,622,800 |
| China Unicom | | 6,734,979 | | | 9,055,463 |
| * | China Unicom ADR | | 400,000 | | | 5,380,000 |
| CNOOC ADR | | 17,000 | | | 2,633,980 |
| Franshion Properties China | | 12,008,000 | | | 4,152,524 |
| †@ | Tom Group | | 47,824,000 | | | 4,689,928 |
| | | | | | 46,534,695 |
| Hungary – 0.41% | | | | | |
| OTP Bank | | 99,702 | | | 2,976,587 |
| | | | | | 2,976,587 |
| India – 1.69% | | | | | |
| Hindustan Construction | | 525,300 | | | 1,567,815 |
| †@ | Indiabulls Real Estate GDR | | 102,022 | | | 451,957 |
| † | Oil India | | 26,650 | | | 729,655 |
| *# | Reliance Industries GDR 144A | | 201,224 | | | 9,195,937 |
| *† | Sify Technologies ADR | | 179,300 | | | 346,049 |
| | | | | | 12,291,413 |
| Indonesia – 2.24% | | | | | |
| Gudang Garam | | 6,656,224 | | | 12,143,825 |
| Tambang Batubara Bukit Asam | | 2,379,335 | | | 4,139,615 |
| | | | | | 16,283,440 |
39
Statements of net assets
Delaware Emerging Markets Fund
| | | | Number of shares | | Value (U.S. $) |
| Common Stock (continued) | | | | | |
| Israel – 1.26% | | | | | |
| † | Bank Hapoalim | | 420,000 | | $ | 1,628,311 |
| † | Bank Leumi Le - Israel | | 600,000 | | | 2,495,708 |
| Israel Chemicals | | 391,980 | | | 5,051,796 |
| | | | | | 9,175,815 |
| Kazakhstan – 0.04% | | | | | |
| † | KazMunaiGas Exploration Production GDR | | 12,918 | | | 311,324 |
| | | | | | 311,324 |
| Luxembourg – 0.50% | | | | | |
| * | Tenaris ADR | | 91,900 | | | 3,626,374 |
| | | | | | 3,626,374 |
| Malaysia – 2.23% | | | | | |
| † | Eastern & Oriental | | 3,251,700 | | | 895,073 |
| Hong Leong Bank | | 2,097,983 | | | 4,922,624 |
| KLCC Property Holdings | | 3,244,600 | | | 3,152,184 |
| Media Prima | | 2,218,400 | | | 1,116,792 |
| Oriental Holdings | | 2,064,900 | | | 3,446,819 |
| † | UEM Land Holdings | | 6,004,250 | | | 2,633,792 |
| | | | | | 16,167,284 |
| Mexico – 5.12% | | | | | |
| America Movil Series L ADR | | 170,000 | | | 8,224,600 |
| Cemex ADR | | 1,100,001 | | | 12,419,011 |
| † | Empresas ICA | | 1,533,989 | | | 3,698,787 |
| Fomento Economico Mexicano ADR | | 125,000 | | | 5,688,750 |
| * | Grupo Televisa ADR | | 345,200 | | | 7,100,764 |
| | | | | | 37,131,912 |
| Pakistan – 0.22% | | | | | |
| @ | Oil & Gas Development GDR | | 126,418 | | | 1,610,439 |
| | | | | | 1,610,439 |
| Peru – 0.85% | | | | | |
| Cia de Minas Buenaventura ADR | | 153,100 | | | 6,146,965 |
| | | | | | 6,146,965 |
| Philippines – 0.52% | | | | | |
| Philippine Long Distance Telephone ADR | | 67,800 | | | 3,745,272 |
| | | | | | 3,745,272 |
40
| | | | Number of shares | | Value (U.S. $) |
| Common Stock (continued) | | | | | |
| Poland – 1.02% | | | | | |
| † | Polska Grupa Energetyczna | | 210,021 | | $ | 1,887,735 |
| Polski Koncern Naftowy Orlen | | 411,252 | | | 4,618,724 |
| Telekomunikacja Polska | | 150,000 | | | 873,192 |
| | | | | | 7,379,651 |
| Republic of Korea – 12.13% | | | | | |
| CJ | | 80,144 | | | 3,596,646 |
| Hyundai Elevator | | 40,821 | | | 1,975,549 |
| *† | KB Financial Group ADR | | 209,393 | | | 10,545,031 |
| † | Korea Electric Power | | 220,420 | | | 6,033,463 |
| † | Korea Electric Power ADR | | 689,300 | | | 9,457,196 |
| KT | | 213,064 | | | 7,038,754 |
| * | KT ADR | | 80,280 | | | 1,333,451 |
| * | LG Display ADR | | 302,400 | | | 4,233,600 |
| Lotte Chilsung Beverage | | 5,009 | | | 3,545,928 |
| Lotte Confectionery | | 4,610 | | | 4,932,787 |
| * | POSCO ADR | | 40,000 | | | 4,768,000 |
| Samsung Electronics | | 21,558 | | | 13,318,826 |
| † | SK Communications | | 171,609 | | | 1,110,290 |
| SK Energy | | 63,751 | | | 5,962,639 |
| SK Holdings | | 16,519 | | | 1,193,496 |
| SK Telecom | | 21,731 | | | 3,160,635 |
| SK Telecom ADR | | 353,700 | | | 5,860,809 |
| | | | | | 88,067,100 |
| Russia – 7.88% | | | | | |
| † | Chelyabinsk Zink Plant GDR | | 143,300 | | | 429,900 |
| †=@ | Enel OGK-5 ADR | | 21,159 | | | 80,000 |
| † | Gazprom ADR | | 714,300 | | | 16,316,899 |
| † | LUKOIL ADR | | 101,920 | | | 5,916,456 |
| † | LUKOIL ADR (London International Exchange) | | 90,000 | | | 5,198,580 |
| † | MMC Norilsk Nickel ADR | | 159,893 | | | 2,182,603 |
| Mobile TeleSystems ADR | | 99,900 | | | 5,002,992 |
| Sberbank | | 5,583,136 | | | 13,237,615 |
| Surgutneftegaz ADR | | 400,000 | | | 3,564,000 |
| †= | TGK-5 GDR | | 8,772 | | | 13,446 |
| † | VTB Bank GDR | | 1,232,482 | | | 5,284,636 |
| | | | | | 57,227,127 |
41
Statements of net assets
Delaware Emerging Markets Fund
| | | | Number of shares | | Value (U.S. $) |
| Common Stock (continued) | | | | | |
| South Africa – 8.82% | | | | | |
| † | Anglo Platinum | | 40,000 | | $ | 4,116,138 |
| ArcelorMittal Steel South Africa | | 232,656 | | | 3,226,708 |
| † | Blue Label Telecoms | | 635,328 | | | 471,884 |
| Gold Fields ADR | | 431,300 | | | 6,374,614 |
| Impala Platinum Holdings | | 196,836 | | | 4,565,372 |
| JD Group | | 723,137 | | | 4,296,830 |
| Sasol | | 272,003 | | | 10,681,766 |
| Standard Bank Group | | 610,460 | | | 7,897,643 |
| Sun International | | 290,543 | | | 3,622,665 |
| Telkom | | 153,106 | | | 771,629 |
| Tongaat Hulett | | 328,651 | | | 4,104,920 |
| Vodacom Group | | 1,804,681 | | | 13,891,536 |
| | | | | | 64,021,705 |
| Taiwan – 5.08% | | | | | |
| Chunghwa Telecom ADR | | 412,500 | | | 7,338,375 |
| † | Evergreen Marine | | 6,140,000 | | | 3,152,381 |
| Formosa Chemicals & Fibre | | 3,007,003 | | | 6,194,043 |
| President Chain Store | | 1,407,372 | | | 3,296,312 |
| † | Taiwan Semiconductor Manufacturing | | 3,494,632 | | | 6,623,919 |
| † | United Microelectronics | | 13,595,356 | | | 6,663,770 |
| Walsin Lihwa | | 10,711,756 | | | 3,638,707 |
| | | | | | 36,907,507 |
| Thailand – 2.81% | | | | | |
| Bangkok Bank-Foreign | | 1,015,349 | | | 3,435,908 |
| @ | PTT Exploration & Production-Foreign | | 1,131,800 | | | 4,442,770 |
| Siam Cement NVDR | | 1,843,843 | | | 12,534,472 |
| | | | | | 20,413,150 |
| Turkey – 3.51% | | | | | |
| † | Alarko Gayrimenkul Yatirim Ortakligi | | 97,776 | | | 831,701 |
| Alarko Holding | | 1,970,440 | | | 4,486,770 |
| Turk Sise ve Cam Fabrikalari | | 3,893,779 | | | 3,872,632 |
| Turkcell Iletisim Hizmet | | 715,275 | | | 4,352,586 |
| Turkcell Iletisim Hizmet ADR | | 183,900 | | | 2,824,704 |
| Turkiye Is Bankasi Class C | | 1,220,931 | | | 4,154,186 |
| Yazicilar Holding Class A | | 832,584 | | | 4,984,718 |
| | | | | | 25,507,297 |
42
| | | | Number of shares | | Value (U.S. $) |
| Common Stock (continued) | | | | | |
| United Kingdom – 1.46% | | | | | |
| † | Anglo American | | 132,917 | | $ | 5,693,780 |
| † | Anglo American ADR | | 118,000 | | | 2,520,338 |
| †@ | Griffin Mining | | 3,056,187 | | | 2,186,997 |
| † | Mwana Africa | | 781,129 | | | 179,899 |
| | | | | | 10,581,014 |
| United States – 2.25% | | | | | |
| * | Bunge | | 90,000 | | | 5,571,000 |
| † | Google Class A | | 9,000 | | | 5,247,000 |
| † | MEMC Electronic Materials | | 460,000 | | | 5,538,400 |
| | | | | | 16,356,400 |
| Total Common Stock (cost $679,084,157) | | | | | 677,481,010 |
| | | | | | |
| Preferred Stock – 6.39%D | | | | | |
| Brazil – 3.83% | | | | | |
| † | Braskem Class A | | 541,994 | | | 3,556,691 |
| Jereissati Participacoes 3.52% | | 2,895,405 | | | 1,286,480 |
| Vale Class A 2.38% | | 950,000 | | | 22,928,794 |
| | | | | | 27,771,965 |
| Malaysia – 0.06% | | | | | |
| =† | Eastern & Oriental | | 1,625,850 | | | 447,537 |
| | | | | | 447,537 |
| Republic of Korea – 1.96% | | | | | |
| Hyundai Motor 2.33% | | 41,547 | | | 1,443,842 |
| Samsung Electronics 1.05% | | 31,362 | | | 12,782,693 |
| | | | | | 14,226,535 |
| Russia – 0.54% | | | | | |
| @ | AK Transneft 0.91% | | 5,498 | | | 3,958,560 |
| | | | | | 3,958,560 |
| Total Preferred Stock (cost $33,443,214) | | | | | 46,404,597 |
43
Statements of net assets
Delaware Emerging Markets Fund
| | | | Number of shares | | Value (U.S. $) | |
| Participation Notes – 0.06% | | | | | | |
| †@#= | Lehman Indian Oil CW 12 LEPO 144A | | 172,132 | | $ | 64,295 | |
| †#= | Lehman Oil & Natural Gas CW 12 LEPO 144A | | 254,590 | | | 394,504 | |
| Total Participation Notes (cost $8,559,056) | | | | | 458,799 | |
| | | | | | | |
| | | Principal | | | | |
| | | amount (U.S. $) | | | | |
| ¹Discount Note – 0.28% | | | | | | |
| Federal Home Loan Bank 0.02% 12/1/09 | | $2,014,003 | | | 2,014,003 | |
| Total Discount Note (cost $2,014,003) | | | | | 2,014,003 | |
| | | | | | | |
| Total Value of Securities Before Securities | | | | | | |
| Lending Collateral – 100.06% (cost $723,100,430) | | | | | 726,358,409 | |
| | | | | | | |
| | | Number of shares | | | | |
| Securities Lending Collateral** – 2.63% | | | | | | |
| Investment Companies | | | | | | |
| Mellon GSL DBT II Collateral Fund | | 12,790,702 | | | 12,790,702 | |
| BNY Mellon SL DBT II Liquidating Fund | | 6,325,379 | | | 6,256,432 | |
| @†Mellon GSL Reinvestment Trust II | | 396,304 | | | 16,843 | |
| Total Securities Lending Collateral (cost $19,512,385) | | | | | 19,063,977 | |
| | | | | | | |
| Total Value of Securities – 102.69% | | | | | | |
| (cost $742,612,815) | | | | | 745,422,386 | © |
| Obligation to Return Securities | | | | | | |
| Lending Collateral** – (2.69%) | | | | | (19,512,385 | ) |
| Liabilities Net of Receivables | | | | | | |
| and Other Assets – (0.00%) | | | | | (2,874 | ) |
| Net Assets Applicable to 56,944,191 | | | | | | |
| Shares Outstanding – 100.00% | | | | $ | 725,907,127 | |
44
| | | | | |
| Net Asset Value – Delaware Emerging Markets Fund | | | | |
| | Class A ($399,839,557 / 31,031,570 Shares) | | | $12.88 | |
| Net Asset Value – Delaware Emerging Markets Fund | | | | |
| Class B ($20,021,687 / 1,628,132 Shares) | | | $12.30 | |
| Net Asset Value – Delaware Emerging Markets Fund | | | | |
| Class C ($157,383,353 / 12,827,195 Shares) | | | $12.27 | |
| Net Asset Value – Delaware Emerging Markets Fund | | | | |
| Class R ($183 / 14.07 Shares) | | | $13.01 | |
| Net Asset Value – Delaware Emerging Markets Fund | | | | |
| Institutional Class ($148,662,347 / 11,457,280 Shares) | | | $12.98 | |
| | | | | |
| Components of Net Assets at November 30, 2009: | | | | |
| Shares of beneficial interest (unlimited authorization – no par) | | $742,744,418 | |
| Undistributed net investment income | | 210,988 | |
| Accumulated net realized loss on investments | | (19,783,678 | ) |
| Net unrealized appreciation of investments and foreign currencies | | 2,735,399 | |
| Total net assets | | $725,907,127 | |
| D | Securities have been classified by country of origin. Classification by type of business has been presented on page 28 in “Country and sector allocations.” |
| † | Non income producing security. |
| = | Security is being fair valued in accordance with the Fund’s fair valuation policy. At November 30, 2009, the aggregate amount of fair valued securities was $999,782, which represented 0.14% of the Fund’s net assets. See Note 1 in “Notes to financial statements.” |
| o | Securities listed and traded on the Hong Kong Stock Exchange. |
| n | Securities listed and traded on the Hong Kong Stock Exchange. These securities have significant business operations in China. |
| ¹ | The rate shown is the effective yield at the time of purchase. |
| # | Security exempt from registration under Rule 144A of the Securities Act of 1933, as amended. At November 30, 2009, the aggregate amount of Rule 144A securities was $11,027,201, which represented 1.52% of the Fund’s net assets. See Note 10 in “Notes to financial statements.” |
| * | Fully or partially on loan. |
| ** | See Note 9 in “Notes to financial statements.” |
45
Statements of net assets
Delaware Emerging Markets Fund
| |
| © | Includes $18,908,148 of securities loaned. |
| @ | Illiquid security. At November 30, 2009, the aggregate amount of illiquid securities was $33,576,970, which represented 4.63% of the Fund’s net assets. See Note 10 in “Notes to financial statements.” |
Summary of abbreviations:
ADR — American Depositary Receipts
GDR — Global Depositary Receipts
LEPO — Low Exercise Price Option
NVDR — Non-Voting Depositary Receipts
| Net Asset Value and Offering Price Per Share – | | |
| Delaware Emerging Markets Fund | | |
| Net asset value Class A (A) | | $12.88 |
| Sales charge (5.75% of offering price) (B) | | 0.79 |
| Offering price | | $13.67 |
| (A) | Net asset value per share, as illustrated, is the amount which would be paid upon redemption or repurchase of shares. |
| (B) | See the current prospectus for purchases of $50,000 or more. |
See accompanying notes
46
| Delaware Global Value Fund | November 30, 2009 |
| | | Number of shares | | Value (U.S. $) |
| Common Stock – 100.39%D | | | | |
| Australia – 1.47% | | | | |
| Coca-Cola Amatil | 62,499 | | $ | 606,608 |
| | | | | 606,608 |
| Brazil – 2.24% | | | | |
| Petroleo Brasileiro ADR | 13,800 | | | 621,828 |
| * | Vale ADR | 10,600 | | | 303,902 |
| | | | | 925,730 |
| Canada – 4.98% | | | | |
| Agrium | 9,900 | | | 553,014 |
| † | CGI Group Class A | 72,778 | | | 899,771 |
| TELUS | 18,698 | | | 605,818 |
| | | | | 2,058,603 |
| Denmark – 0.91% | | | | |
| Novo Nordisk Class B | 5,620 | | | 376,987 |
| | | | | 376,987 |
| Finland – 0.81% | | | | |
| * | Nokia | 25,350 | | | 333,768 |
| | | | | 333,768 |
| France – 11.63% | | | | |
| * | AXA | 16,096 | | | 383,497 |
| * | Cie de Saint-Gobain | 11,614 | | | 631,623 |
| * | Lafarge | 7,461 | | | 613,042 |
| PPR | 4,221 | | | 510,761 |
| * | Publicis Groupe | 9,200 | | | 354,139 |
| Sanofi-Aventis | 4,098 | | | 309,585 |
| Teleperformance | 15,778 | | | 523,494 |
| Total | 6,185 | | | 382,657 |
| Vallourec | 2,217 | | | 370,782 |
| * | Vivendi | 25,195 | | | 725,866 |
| | | | | 4,805,446 |
| Germany – 5.01% | | | | |
| * | Bayerische Motoren Werke | 9,476 | | | 448,414 |
| Deutsche Post | 29,711 | | | 556,226 |
| Linde | 5,237 | | | 642,744 |
| Metro | 6,727 | | | 422,653 |
| | | | | 2,070,037 |
47
Statements of net assets
Delaware Global Value Fund
| | | Number of shares | | Value (U.S. $) |
| Common Stock (continued) | | | | |
| Hong Kong – 4.09%n | | | | |
| CNOOC | 402,000 | | $ | 619,351 |
| | Esprit Holdings | 77,348 | | | 519,991 |
| Techtronic Industries | 186,500 | | | 149,444 |
| Yue Yuen Industrial Holdings | 142,000 | | | 400,356 |
| | | | | 1,689,142 |
| Italy – 4.09% | | | | |
| Finmeccanica | 31,578 | | | 522,911 |
| Parmalat | 215,456 | | | 626,873 |
| UniCredit | 157,405 | | | 537,610 |
| | | | | 1,687,394 |
| Japan – 6.28% | | | | |
| Asahi Glass | 59,500 | | | 519,636 |
| Astellas Pharma | 12,700 | | | 468,629 |
| * | Don Quijote | 20,600 | | | 520,659 |
| * | Mitsubishi UFJ Financial Group | 93,254 | | | 519,936 |
| * | Round One | 28,129 | | | 165,943 |
| Toyota Motor | 10,050 | | | 399,907 |
| | | | | 2,594,710 |
| Luxembourg – 0.75% | | | | |
| ArcelorMittal | 7,924 | | | 308,709 |
| | | | | 308,709 |
| Netherlands – 1.14% | | | | |
| * | Koninklijke Philips Electronics | 17,152 | | | 469,042 |
| | | | | 469,042 |
| Singapore – 1.33% | | | | |
| Singapore Airlines | 57,067 | | | 548,404 |
| | | | | 548,404 |
| Spain – 1.46% | | | | |
| Banco Santander | 35,216 | | | 603,244 |
| | | | | 603,244 |
| Sweden – 3.46% | | | | |
| Autoliv | 21,900 | | | 889,359 |
| Nordea Bank FDR | 52,059 | | | 539,278 |
| | | | | 1,428,637 |
48
| | | Number of shares | | Value (U.S. $) |
| Common Stock (continued) | | | | |
| Switzerland – 2.11% | | | | |
| Novartis | 8,483 | | $ | 470,762 |
| † | Transocean | 4,700 | | | 401,333 |
| | | | | 872,095 |
| Taiwan – 1.06% | | | | |
| Chunghwa Telecom ADR | 24,704 | | | 439,484 |
| | | | | 439,484 |
| United Kingdom – 7.36% | | | | |
| AstraZeneca | 5,685 | | | 254,144 |
| BP | 41,859 | | | 395,808 |
| @ | Greggs | 53,592 | | | 382,621 |
| National Grid | 47,995 | | | 521,493 |
| Standard Chartered | 17,017 | | | 415,428 |
| Tomkins | 144,352 | | | 407,967 |
| † | Vodafone Group | 178,032 | | | 401,527 |
| WPP Group | 27,970 | | | 261,578 |
| | | | | 3,040,566 |
| United States – 40.21% | | | | |
| * | Abercrombie & Fitch Class A | 11,000 | | | 439,230 |
| † | AGCO | 12,300 | | | 372,813 |
| | American Express | 23,500 | | | 983,006 |
| Archer-Daniels-Midland | 23,000 | | | 708,630 |
| AT&T | 21,900 | | | 589,986 |
| Ball | 12,800 | | | 632,448 |
| Black & Decker | 6,500 | | | 394,485 |
| † | Carnival | 18,800 | | | 602,164 |
| Caterpillar | 10,100 | | | 589,739 |
| CenturyTel | 18,400 | | | 654,856 |
| Chesapeake Energy | 16,400 | | | 392,288 |
| Chevron | 8,300 | | | 647,732 |
| † | Convergys | 52,400 | | | 585,832 |
| Cooper Industries Class A | 15,200 | | | 648,888 |
| † | Dell | 38,800 | | | 547,856 |
| Discover Financial Services | 42,100 | | | 650,866 |
| FedEx | 8,600 | | | 726,270 |
| * | Imation | 24,400 | | | 213,988 |
| Intel | 29,000 | | | 556,800 |
| International Business Machines | 4,200 | | | 530,670 |
49
Statements of net assets
Delaware Global Value Fund
| | | Number of shares | | Value (U.S. $) | |
| Common Stock (continued) | | | | | |
| United States (continued) | | | | | |
| JPMorgan Chase | 12,200 | | $ | 518,378 | |
| Lockheed Martin | 8,100 | | | 625,563 | |
| | Lowe’s | 29,000 | | | 632,490 | |
| Microsoft | 23,000 | | | 676,430 | |
| *† | Mylan | 39,600 | | | 707,652 | |
| Pfizer | 29,200 | | | 530,564 | |
| Travelers | 11,400 | | | 597,246 | |
| Walgreen | 22,000 | | | 855,580 | |
| | | | | 16,612,450 | |
| Total Common Stock (cost $40,296,267) | | | | 41,471,056 | |
| | | | | | |
| | Principal | | | | |
| | amount (U.S. $) | | | | |
| ¹Discount Note – 0.09% | | | | | |
| Federal Home Loan Bank 0.02% 12/1/09 | $38,000 | | | 38,000 | |
| Total Discount Note (cost $38,000) | | | | 38,000 | |
| | | | | | |
| Total Value of Securities Before Securities | | | | | |
| Lending Collateral – 100.48% (cost $40,334,267) | | | | 41,509,056 | |
| | | | | | |
| | Number of shares | | | | |
| Securities Lending Collateral** – 14.03% | | | | | |
| Investment Companies | | | | | |
| Mellon GSL DBT II Collateral Fund | 3,432,336 | | | 3,432,336 | |
| BNY Mellon SL DBT II Liquidating Fund | 2,384,528 | | | 2,358,537 | |
| | @†Mellon GSL Reinvestment Trust II | 149,675 | | | 6,361 | |
| Total Securities Lending Collateral (cost $5,966,539) | | | | 5,797,234 | |
| | | | | | |
| Total Value of Securities – 114.51% | | | | | |
| (cost $46,300,806) | | | | 47,306,290 | © |
| Obligation to Return Securities | | | | | |
| Lending Collateral** – (14.44%) | | | | (5,966,539 | ) |
| Liabilities Net of Receivables | | | | | |
| and Other Assets – (0.07%) | | | | (26,852 | ) |
| Net Assets Applicable to 5,159,559 | | | | | |
| Shares Outstanding – 100.00% | | | $ | 41,312,899 | |
50
| | | | | | |
| Net Asset Value – Delaware Global Value Fund | | | | |
| Class A ($24,822,699 / 3,084,486 Shares) | | | | $8.05 | |
| Net Asset Value – Delaware Global Value Fund | | | | |
| Class B ($4,254,660 / 536,189 Shares) | | | | $7.94 | |
| Net Asset Value – Delaware Global Value Fund | | | | |
| Class C ($10,845,331 / 1,366,764 Shares) | | | | $7.94 | |
| Net Asset Value – Delaware Global Value Fund | | | | |
| Institutional Class ($1,390,209 / 172,120 Shares) | | | | $8.08 | |
| | | | | |
| Components of Net Assets at November 30, 2009: | | | | |
| Shares of beneficial interest (unlimited authorization – no par) | | $ | 70,211,914 | |
| Undistributed net investment income | | | 435,168 | |
| Accumulated net realized loss on investments | | | (30,340,614 | ) |
| Net unrealized appreciation of investments and foreign currencies | | | 1,006,431 | |
| Total net assets | | $ | 41,312,899 | |
| D | Securities have been classified by country of origin. Classification by type of business has been presented on page 30 in “Country and sector allocations.” |
| ¹ | The rate shown is the effective yield at the time of purchase. |
| † | Non income producing security. |
| * | Fully or partially on loan. |
| ** | See Note 9 in “Notes to financial statements.” |
| @ | Illiquid security. At November 30, 2009, the aggregate amount of illiquid securities was $388,982, which represented 0.94% of the Fund’s net assets. See Note 10 in “Notes to financial statements.” |
| n | Securities listed and traded on the Hong Kong Stock Exchange. These securities have significant business operations in China. |
| © | Includes $5,751,614 of securities loaned. |
Summary of abbreviations:
ADR — American Depositary Receipts
FDR — Fiduciary Depositary Receipts
51
Statements of net assets
Delaware Global Value Fund
| | | | |
| Net Asset Value and Offering Price Per Share – | | |
| Delaware Global Value Fund | | |
| Net asset value Class A (A) | $ | 8.05 |
| Sales charge (5.75% of offering price) (B) | | 0.49 |
| Offering price | $ | 8.54 |
| (A) | | Net asset value per share, as illustrated, is the amount which would be paid upon redemption or repurchase of shares. |
| (B) | | See the current prospectus for purchases of $50,000 or more. |
See accompanying notes
52
Statements of operations
Delaware International Funds | Year Ended November 30, 2009 |
| | Delaware | | Delaware | | Delaware |
| | International | | Emerging | | Global |
| | Value Equity | | Markets | | Value |
| | Fund | | Fund | | Fund |
| Investment Income: | | | | | | | | | | |
| Dividends | | $ | 13,971,244 | | | $ | 12,340,494 | | | $ | 1,206,159 | |
| Interest | | | 2,296 | | | | 25,134 | | | | 417 | |
| Securities lending income | | | 1,010,893 | | | | 240,865 | | | | 69,603 | |
| Foreign tax withheld | | | (1,225,066 | ) | | | (1,112,785 | ) | | | (80,969 | ) |
| | | 13,759,367 | | | | 11,493,708 | | | | 1,195,210 | |
| | | | | | | | | | | | | |
| Expenses: | | | | | | | | | | | | |
| Management fees | | | 3,034,620 | | | | 6,083,388 | | | | 315,545 | |
| Distribution expenses – Class A | | | 479,184 | | | | 831,588 | | | | 65,126 | |
| Distribution expenses – Class B | | | 104,534 | | | | 164,195 | | | | 38,272 | |
| Distribution expenses – Class C | | | 498,988 | | | | 1,081,471 | | | | 103,409 | |
| Distribution expenses – Class R | | | 11,722 | | | | — | | | | — | |
| Dividend disbursing and transfer agent | | | | | | | | | | | | |
| fees and expenses | | | 1,642,972 | | | | 1,337,110 | | | | 202,118 | |
| Accounting and administration expenses | | | 142,806 | | | | 195,527 | | | | 14,849 | |
| Custodian fees | | | 139,875 | | | | 215,610 | | | | 29,428 | |
| Reports and statements to shareholders | | | 122,543 | | | | 145,536 | | | | 8,477 | |
| Registration fees | | | 64,385 | | | | 79,563 | | | | 61,240 | |
| Legal fees | | | 55,245 | | | | 77,263 | | | | 5,767 | |
| Audit and tax fees | | | 30,421 | | | | 20,760 | | | | 14,330 | |
| Trustees’ fees | | | 22,183 | | | | 28,545 | | | | 2,176 | |
| Insurance fees | | | 10,585 | | | | 10,463 | | | | 1,041 | |
| Pricing fees | | | 5,974 | | | | 8,903 | | | | 5,530 | |
| Consulting fees | | | 5,423 | | | | 5,874 | | | | 535 | |
| Dues and services | | | 4,806 | | | | 4,247 | | | | 1,080 | |
| Trustees’ expenses | | | 1,868 | | | | 2,089 | | | | 194 | |
| | | 6,378,134 | | | | 10,292,132 | | | | 869,117 | |
| Less fees waived | | | (930,174 | ) | | | (92,474 | ) | | | (177,058 | ) |
| Less waived distribution expenses – Class A | | | — | | | | (138,598 | ) | | | (10,854 | ) |
| Less waived distribution expenses – Class R | | | (1,954 | ) | | | — | | | | — | |
| Total operating expenses | | | 5,446,006 | | | | 10,061,060 | | | | 681,205 | |
| Net Investment Income | | | 8,313,361 | | | | 1,432,648 | | | | 514,005 | |
54
| | Delaware | | Delaware | | Delaware |
| | International | | Emerging | | Global |
| | Value Equity | | Markets | | Value |
| | Fund | | Fund | | Fund |
| Net Realized and Unrealized Loss on | | | | | | | | | | | | |
| Investments and Foreign Currencies: | | | | | | | | | | | | |
| Net realized loss on: | | | | | | | | | | | | |
| Investments | | $ | (114,973,633 | ) | | $ | (18,143,568 | ) | | $ | (12,459,671 | ) |
| Foreign currencies | | | (1,103,620 | ) | | | (762,280 | ) | | | (71,618 | ) |
| Net realized loss | | | (116,077,253 | ) | | | (18,905,848 | ) | | | (12,531,289 | ) |
| Net change in unrealized appreciation/ | | | | | | | | | | | | |
| depreciation of investments | | | | | | | | | | | | |
| and foreign currencies | | | 236,758,415 | | | | 297,426,411 | | | | 25,250,293 | |
| Net Realized and Unrealized Gain on | | | | | | | | | | | | |
| Investments and Foreign Currencies | | | 120,681,162 | | | | 278,520,563 | | | | 12,719,004 | |
| | | | | | | | | | | | | |
| Net Increase in Net Assets Resulting | | | | | | | | | | | | |
| from Operations | | $ | 128,994,523 | | | $ | 279,953,211 | | | $ | 13,233,009 | |
See accompanying notes
55
Statements of changes in net assets
Delaware International Value Equity Fund
| | Year Ended |
| | 11/30/09 | | 11/30/08 |
| Increase (Decrease) in Net Assets from Operations: | | | | | | | | |
| Net investment income | | $ | 8,313,361 | | | $ | 17,069,564 | |
| Net realized loss on investments | | | | | | | | |
| and foreign currencies | | | (116,077,253 | ) | | | (100,619,180 | ) |
| Net change in unrealized appreciation/depreciation | | | | | | | | |
| of investments and foreign currencies | | | 236,758,415 | | | | (346,654,297 | ) |
| Net increase (decrease) in net assets resulting | | | | | | | | |
| from operations | | | 128,994,523 | | | | (430,203,913 | ) |
| | | | | | | | | |
| Dividends and Distributions to Shareholders from: | | | | | | | | |
| Net investment income: | | | | | | | | |
| Class A | | | (6,521,227 | ) | | | (5,733,859 | ) |
| Class B | | | (300,650 | ) | | | (186,281 | ) |
| Class C | | | (1,386,689 | ) | | | (799,282 | ) |
| Class R | | | (43,071 | ) | | | (31,370 | ) |
| Institutional Class | | | (5,973,195 | ) | | | (6,021,409 | ) |
| | | | | | | | | |
| Net realized gain on investments: | | | | | | | | |
| Class A | | | — | | | | (20,209,040 | ) |
| Class B | | | — | | | | (1,455,826 | ) |
| Class C | | | — | | | | (6,246,566 | ) |
| Class R | | | — | | | | (131,133 | ) |
| Institutional Class | | | — | | | | (17,044,855 | ) |
| | | | (14,224,832 | ) | | | (57,859,621 | ) |
| | | | | | | | | |
| Capital Share Transactions: | | | | | | | | |
| Proceeds from shares sold: | | | | | | | | |
| Class A | | | 18,572,918 | | | | 54,669,434 | |
| Class B | | | 200,347 | | | | 472,785 | |
| Class C | | | 3,618,349 | | | | 7,600,984 | |
| Class R | | | 1,584,095 | | | | 970,751 | |
| Institutional Class | | | 11,650,494 | | | | 71,947,147 | |
56
| | Year Ended |
| | 11/30/09 | | 11/30/08 |
| Capital Share Transactions (continued): | | | | | | | | |
| Net asset value of shares issued upon reinvestment | | | | | | | | |
| of dividends and distributions: | | | | | | | | |
| Class A | | $ | 6,085,510 | | | $ | 24,490,131 | |
| Class B | | | 284,879 | | | | 1,553,479 | |
| Class C | | | 1,323,779 | | | | 6,784,142 | |
| Class R | | | 43,071 | | | | 162,502 | |
| Institutional Class | | | 5,951,192 | | | | 23,006,594 | |
| | | 49,314,634 | | | | 191,657,949 | |
| Cost of shares repurchased: | | | | | | | | |
| Class A | | | (98,071,991 | ) | | | (151,646,856 | ) |
| Class B | | | (4,365,200 | ) | | | (10,536,262 | ) |
| Class C | | | (18,772,886 | ) | | | (41,786,464 | ) |
| Class R | | | (609,984 | ) | | | (1,553,490 | ) |
| Institutional Class | | | (66,873,100 | ) | | | (163,150,080 | ) |
| | | (188,693,161 | ) | | | (368,673,152 | ) |
| Decrease in net assets derived from | | | | | | | | |
| capital share transactions | | | (139,378,527 | ) | | | (177,015,203 | ) |
| Net Decrease in Net Assets | | | (24,608,836 | ) | | | (665,078,737 | ) |
| | | | | | | | | |
| Net Assets: | | | | | | | | |
| Beginning of year | | | 388,169,853 | | | | 1,053,248,590 | |
| End of year | | $ | 363,561,017 | | | $ | 388,169,853 | |
| | | | | | | | | |
| Undistributed net investment income | | $ | 7,190,693 | | | $ | 14,205,784 | |
See accompanying notes
57
Statements of changes in net assets
Delaware Emerging Markets Fund
| | Year Ended |
| | 11/30/09 | | 11/30/08 |
| Increase (Decrease) in Net Assets from Operations: | | | | | | | | |
| Net investment income | | $ | 1,432,648 | | | $ | 6,220,515 | |
| Net realized gain (loss) on investments | | | | | | | | |
| and foreign currencies | | | (18,905,848 | ) | | | 57,965,073 | |
| Net change in unrealized appreciation/depreciation | | | | | | | | |
| of investments and foreign currencies | | | 297,426,411 | | | | (550,842,194 | ) |
| Net increase (decrease) in net assets resulting | | | | | | | | |
| from operations | | | 279,953,211 | | | | (486,656,606 | ) |
| | | | | | | | | |
| Dividends and Distributions to Shareholders from:* | | | | | | | | |
| Net investment income: | | | | | | | | |
| Class A | | | (415,388 | ) | | | (6,928,794 | ) |
| Class B | | | — | | | | (186,103 | ) |
| Class C | | | — | | | | (1,007,368 | ) |
| Class R | | | — | | | | — | |
| Institutional Class | | | (284,008 | ) | | | (1,311,904 | ) |
| | | | | | | | | |
| Net realized gain on investments: | | | | | | | | |
| Class A | | | (21,325,001 | ) | | | (162,293,675 | ) |
| Class B | | | (1,505,363 | ) | | | (10,968,084 | ) |
| Class C | | | (8,646,856 | ) | | | (59,369,696 | ) |
| Class R | | | — | | | | — | |
| Institutional Class | | | (4,583,103 | ) | | | (25,408,291 | ) |
| | | (36,759,719 | ) | | | (267,473,915 | ) |
| | | | | | | | | |
| Capital Share Transactions: | | | | | | | | |
| Proceeds from shares sold: | | | | | | | | |
| Class A | | | 132,947,076 | | | | 132,602,172 | |
| Class B | | | 574,995 | | | | 1,673,924 | |
| Class C | | | 41,236,063 | | | | 29,518,228 | |
| Class R | | | 181 | | | | — | |
| Institutional Class | | | 70,955,580 | | | | 32,335,792 | |
58
| | Year Ended |
| | 11/30/09 | | 11/30/08 |
| Capital Share Transactions (continued): | | | | | | | | |
| Net asset value of shares issued upon reinvestment | | | | | | | | |
| of dividends and distributions: | | | | | | | | |
| Class A | | $ | 20,094,969 | | | $ | 150,625,631 | |
| Class B | | | 1,361,700 | | | | 10,122,855 | |
| Class C | | | 8,062,548 | | | | 55,804,659 | |
| Class R | | | — | | | | — | |
| Institutional Class | | | 4,749,439 | | | | 25,764,773 | |
| | | 279,982,551 | | | | 438,448,034 | |
| Cost of shares repurchased: | | | | | | | | |
| Class A | | | (103,792,285 | ) | | | (278,598,809 | ) |
| Class B | | | (4,455,109 | ) | | | (12,287,151 | ) |
| Class C | | | (28,667,770 | ) | | | (64,222,452 | ) |
| Class R | | | (1 | ) | | | — | |
| Institutional Class | | | (18,688,221 | ) | | | (38,321,112 | ) |
| | | (155,603,386 | ) | | | (393,429,524 | ) |
| Increase in net assets derived from | | | | | | | | |
| capital share transactions | | | 124,379,165 | | | | 45,018,510 | |
| Net Increase (Decrease) in Net Assets | | | 367,572,657 | | | | (709,112,011 | ) |
| | | | | | | | | |
| Net Assets: | | | | | | | | |
| Beginning of year | | | 358,334,470 | | | | 1,067,446,481 | |
| End of year | | $ | 725,907,127 | | | $ | 358,334,470 | |
| | | | | | | | | |
| Undistributed net investment income | | $ | 210,988 | | | $ | 514,269 | |
*Class R commenced operations on August 31, 2009.
See accompanying notes
59
Statements of changes in net assets
Delaware Global Value Fund
| | Year Ended |
| | 11/30/09 | | 11/30/08 |
| Increase (Decrease) in Net Assets from Operations: | | | | | | | | |
| Net investment income | | $ | 514,005 | | | $ | 1,230,685 | |
| Net realized loss on investments | | | | | | | | |
| and foreign currencies | | | (12,531,289 | ) | | | (18,164,469 | ) |
| Net change in unrealized appreciation/depreciation | | | | | | | | |
| of investments and foreign currencies | | | 25,250,293 | | | | (26,952,252 | ) |
| Net increase (decrease) in net assets resulting | | | | | | | | |
| from operations | | | 13,233,009 | | | | (43,886,036 | ) |
| |
| Dividends and Distributions to Shareholders from: | | | | | | | | |
| Net investment income: | | | | | | | | |
| Class A | | | (609,676 | ) | | | (768,522 | ) |
| Class B | | | (65,574 | ) | | | (45,880 | ) |
| Class C | | | (183,443 | ) | | | (163,328 | ) |
| Institutional Class | | | (34,178 | ) | | | (34,770 | ) |
| |
| Net realized gain on investments: | | | | | | | | |
| Class A | | | — | | | | (3,007,262 | ) |
| Class B | | | — | | | | (495,500 | ) |
| Class C | | | — | | | | (1,763,938 | ) |
| Institutional Class | | | — | | | | (111,761 | ) |
| | | (892,871 | ) | | | (6,390,961 | ) |
| |
| Capital Share Transactions: | | | | | | | | |
| Proceeds from shares sold: | | | | | | | | |
| Class A | | | 3,258,853 | | | | 9,813,016 | |
| Class B | | | 135,860 | | | | 979,766 | |
| Class C | | | 875,982 | | | | 3,506,026 | |
| Institutional Class | | | 190,696 | | | | 847,401 | |
60
| | Year Ended |
| | 11/30/09 | | 11/30/08 |
| Capital Share Transactions (continued): | | | | | | | | |
| Net asset value of shares issued upon reinvestment | | | | | | | | |
| of dividends and distributions: | | | | | | | | |
| Class A | | $ | 548,142 | | | $ | 3,353,184 | |
| Class B | | | 55,280 | | | | 465,056 | |
| Class C | | | 163,582 | | | | 1,771,570 | |
| Institutional Class | | | 33,393 | | | | 133,664 | |
| | | 5,261,788 | | | | 20,869,683 | |
| Cost of shares repurchased: | | | | | | | | |
| Class A | | | (8,234,329 | ) | | | (28,821,804 | ) |
| Class B | | | (1,313,679 | ) | | | (3,120,086 | ) |
| Class C | | | (4,856,945 | ) | | | (17,832,203 | ) |
| Institutional Class | | | (368,924 | ) | | | (1,111,337 | ) |
| | | (14,773,877 | ) | | | (50,885,430 | ) |
| Decrease in net assets derived from | | | | | | | | |
| capital share transactions | | | (9,512,089 | ) | | | (30,015,747 | ) |
| Net Increase (Decrease) in Net Assets | | | 2,828,049 | | | | (80,292,744 | ) |
| |
| Net Assets: | | | | | | | | |
| Beginning of year | | | 38,484,850 | | | | 118,777,594 | |
| End of year | | $ | 41,312,899 | | | $ | 38,484,850 | |
| |
| Undistributed net investment income | | $ | 435,168 | | | $ | 885,652 | |
See accompanying notes
61
Financial highlights
Delaware International Value Equity Fund Class A
Selected data for each share of the Fund outstanding throughout each period were as follows:
| Net asset value, beginning of period |
| |
| Income (loss) from investment operations: |
| Net investment income1 |
| Net realized and unrealized gain (loss) on investments and foreign currencies |
| Total from investment operations |
| |
| Less dividends and distributions from: |
| Net investment income |
| Net realized gain on investments |
| Total dividends and distributions |
| |
| Net asset value, end of period |
| |
| Total return2 |
| |
| Ratios and supplemental data: |
| Net assets, end of period (000 omitted) |
| Ratio of expenses to average net assets |
| Ratio of expenses to average net assets |
| prior to fees waived and expense paid indirectly |
| Ratio of net investment income to average net assets |
| Ratio of net investment income to average net assets |
| prior to fees waived and expense paid indirectly |
| Portfolio turnover |
1 The average shares outstanding method has been applied for per share information. |
2 Total investment return is based on the change in net asset value of a share during the period and assumes reinvestment of dividends and distributions at net asset value and does not reflect the impact of a sales charge. Total investment return during some of the periods shown reflects a waiver by the manager. Performance would have been lower had the waiver not been in effect. |
See accompanying notes
62
| Year Ended | |
| 11/30/09 | | 11/30/08 | | 11/30/07 | | 11/30/06 | | 11/30/05 | |
| $8.120 | | | $16.750 | | | $16.010 | | | $18.130 | | | $16.340 | | |
| | | |
| | | |
| 0.212 | | | 0.288 | | | 0.205 | | | 0.339 | | | 0.388 | | |
| 3.375 | | | (7.995 | ) | | 1.504 | | | 3.220 | | | 1.610 | | |
| 3.587 | | | (7.707 | ) | | 1.709 | | | 3.559 | | | 1.998 | | |
| | | |
| | | |
| (0.307 | ) | | (0.204 | ) | | (0.174 | ) | | (0.412 | ) | | (0.063 | ) | |
| — | | | (0.719 | ) | | (0.795 | ) | | (5.267 | ) | | (0.145 | ) | |
| (0.307 | ) | | (0.923 | ) | | (0.969 | ) | | (5.679 | ) | | (0.208 | ) | |
| | | |
| $11.400 | | | $8.120 | | | $16.750 | | | $16.010 | | | $18.130 | | |
| | | |
| 44.76% | | | (48.60% | ) | | 11.24% | | | 23.57% | | | 12.35% | | |
| | | |
| | | |
| $154,721 | | | $178,072 | | | $472,533 | | | $472,803 | | | $468,217 | | |
| 1.52% | | | 1.40% | | | 1.40% | | | 1.41% | | | 1.48% | | |
| | | |
| 1.78% | | | 1.49% | | | 1.40% | | | 1.43% | | | 1.48% | | |
| 2.33% | | | 2.19% | | | 1.25% | | | 2.05% | | | 2.24% | | |
| | | |
| 2.07% | | | 2.10% | | | 1.25% | | | 2.03% | | | 2.24% | | |
| 35% | | | 32% | | | 26% | | | 127% | | | 14% | | |
63
Financial highlights
Delaware International Value Equity Fund Class B
Selected data for each share of the Fund outstanding throughout each period were as follows:
| Net asset value, beginning of period |
| |
| Income (loss) from investment operations: |
| Net investment income1 |
| Net realized and unrealized gain (loss) on investments and foreign currencies |
| Total from investment operations |
| |
| Less dividends and distributions from: |
| Net investment income |
| Net realized gain on investments |
| Total dividends and distributions |
| |
| Net asset value, end of period |
| |
| Total return2 |
| |
| Ratios and supplemental data: |
| Net assets, end of period (000 omitted) |
| Ratio of expenses to average net assets |
| Ratio of expenses to average net assets |
| prior to fees waived and expense paid indirectly |
| Ratio of net investment income to average net assets |
| Ratio of net investment income to average net assets |
| prior to fees waived and expense paid indirectly |
| Portfolio turnover |
1 The average shares outstanding method has been applied for per share information. |
2 Total investment return is based on the change in net asset value of a share during the period and assumes reinvestment of dividends and distributions at net asset value and does not reflect the impact of a sales charge. Total investment return during some of the periods shown reflects a waiver by the manager. Performance would have been lower had the waiver not been in effect. |
See accompanying notes
64
| Year Ended | |
| 11/30/09 | | 11/30/08 | | 11/30/07 | | 11/30/06 | | 11/30/05 | |
| $7.980 | | | $16.470 | | | $15.750 | | | $17.910 | | | $16.200 | | |
| | | |
| | | |
| 0.149 | | | 0.197 | | | 0.092 | | | 0.226 | | | 0.269 | | |
| 3.322 | | | (7.876 | ) | | 1.484 | | | 3.173 | | | 1.586 | | |
| 3.471 | | | (7.679 | ) | | 1.576 | | | 3.399 | | | 1.855 | | |
| | | |
| | | |
| (0.221 | ) | | (0.092 | ) | | (0.061 | ) | | (0.292 | ) | | — | | |
| — | | | (0.719 | ) | | (0.795 | ) | | (5.267 | ) | | (0.145 | ) | |
| (0.221 | ) | | (0.811 | ) | | (0.856 | ) | | (5.559 | ) | | (0.145 | ) | |
| | | |
| $11.230 | | | $7.980 | | | $16.470 | | | $15.750 | | | $17.910 | | |
| | | |
| 43.65% | | | (48.95% | ) | | 10.48% | | | 22.70% | | | 11.53% | | |
| | | |
| | | |
| $10,796 | | | $11,227 | | | $34,520 | | | $39,834 | | | $38,284 | | |
| 2.22% | | | 2.10% | | | 2.10% | | | 2.11% | | | 2.18% | | |
| | | |
| 2.48% | | | 2.19% | | | 2.10% | | | 2.13% | | | 2.18% | | |
| 1.63% | | | 1.49% | | | 0.55% | | | 1.35% | | | 1.54% | | |
| | | |
| 1.37% | | | 1.40% | | | 0.55% | | | 1.33% | | | 1.54% | | |
| 35% | | | 32% | | | 26% | | | 127% | | | 14% | | |
65
Financial highlights
Delaware International Value Equity Fund Class C
Selected data for each share of the Fund outstanding throughout each period were as follows:
| Net asset value, beginning of period |
| |
| Income (loss) from investment operations: |
| Net investment income1 |
| Net realized and unrealized gain (loss) on investments and foreign currencies |
| Total from investment operations |
| |
| Less dividends and distributions from: |
| Net investment income |
| Net realized gain on investments |
| Total dividends and distributions |
| |
| Net asset value, end of period |
| |
| Total return2 |
| |
| Ratios and supplemental data: |
| Net assets, end of period (000 omitted) |
| Ratio of expenses to average net assets |
| Ratio of expenses to average net assets |
| prior to fees waived and expense paid indirectly |
| Ratio of net investment income to average net assets |
| Ratio of net investment income to average net assets |
| prior to fees waived and expense paid indirectly |
| Portfolio turnover |
1 The average shares outstanding method has been applied for per share information. |
2 Total investment return is based on the change in net asset value of a share during the period and assumes reinvestment of dividends and distributions at net asset value and does not reflect the impact of a sales charge. Total investment return during some of the periods shown reflects a waiver by the manager. Performance would have been lower had the waiver not been in effect. |
See accompanying notes
66
| Year Ended | |
| 11/30/09 | | 11/30/08 | | 11/30/07 | | 11/30/06 | | 11/30/05 | |
| $7.960 | | | $16.450 | | | $15.730 | | | $17.890 | | | $16.180 | | |
| | | |
| | | |
| 0.149 | | | 0.197 | | | 0.092 | | | 0.226 | | | 0.269 | | |
| 3.332 | | | (7.876 | ) | | 1.484 | | | 3.173 | | | 1.586 | | |
| 3.481 | | | (7.679 | ) | | 1.576 | | | 3.399 | | | 1.855 | | |
| | | |
| | | |
| (0.221 | ) | | (0.092 | ) | | (0.061 | ) | | (0.292 | ) | | — | | |
| — | | | (0.719 | ) | | (0.795 | ) | | (5.267 | ) | | (0.145 | ) | |
| (0.221 | ) | | (0.811 | ) | | (0.856 | ) | | (5.559 | ) | | (0.145 | ) | |
| | | |
| $11.220 | | | $7.960 | | | $16.450 | | | $15.730 | | | $17.890 | | |
| | | |
| 43.71% | | | (49.01% | ) | | 10.50% | | | 22.73% | | | 11.55% | | |
| | | |
| | | |
| $54,235 | | | $51,420 | | | $144,106 | | | $144,298 | | | $124,931 | | |
| 2.22% | | | 2.10% | | | 2.10% | | | 2.11% | | | 2.18% | | |
| | | |
| 2.48% | | | 2.19% | | | 2.10% | | | 2.13% | | | 2.18% | | |
| 1.63% | | | 1.49% | | | 0.55% | | | 1.35% | | | 1.54% | | |
| | | |
| 1.37% | | | 1.40% | | | 0.55% | | | 1.33% | | | 1.54% | | |
| 35% | | | 32% | | | 26% | | | 127% | | | 14% | | |
67
Financial highlights
Delaware International Value Equity Fund Class R
Selected data for each share of the Fund outstanding throughout each period were as follows:
| Net asset value, beginning of period |
| |
| Income (loss) from investment operations: |
| Net investment income1 |
| Net realized and unrealized gain (loss) on investments and foreign currencies |
| Total from investment operations |
| |
| Less dividends and distributions from: |
| Net investment income |
| Net realized gain on investments |
| Total dividends and distributions |
| |
| Net asset value, end of period |
| |
| Total return2 |
| |
| Ratios and supplemental data: |
| Net assets, end of period (000 omitted) |
| Ratio of expenses to average net assets |
| Ratio of expenses to average net assets |
| prior to fees waived and expense paid indirectly |
| Ratio of net investment income to average net assets |
| Ratio of net investment income to average net assets |
| prior to fees waived and expense paid indirectly |
| Portfolio turnover |
1 The average shares outstanding method has been applied for per share information. |
2 Total investment return is based on the change in net asset value of a share during the period and assumes reinvestment of distributions at net asset value. Total investment return during some of the periods shown reflects waivers by the manager and distributor. Performance would have been lower had the waivers not been in effect. |
See accompanying notes
68
| Year Ended | |
| 11/30/09 | | 11/30/08 | | 11/30/07 | | 11/30/06 | | 11/30/05 | |
| $8.080 | | | $16.670 | | | $15.930 | | | $18.050 | | | $16.270 | | |
| | | |
| | | |
| 0.192 | | | 0.261 | | | 0.173 | | | 0.308 | | | 0.343 | | |
| 3.370 | | | (7.960 | ) | | 1.504 | | | 3.207 | | | 1.600 | | |
| 3.562 | | | (7.699 | ) | | 1.677 | | | 3.515 | | | 1.943 | | |
| | | |
| | | |
| (0.282 | ) | | (0.172 | ) | | (0.142 | ) | | (0.368 | ) | | (0.018 | ) | |
| — | | | (0.719 | ) | | (0.795 | ) | | (5.267 | ) | | (0.145 | ) | |
| (0.282 | ) | | (0.891 | ) | | (0.937 | ) | | (5.635 | ) | | (0.163 | ) | |
| | | |
| $11.360 | | | $8.080 | | | $16.670 | | | $15.930 | | | $18.050 | | |
| | | |
| 44.55% | | | (48.70% | ) | | 11.07% | | | 23.33% | | | 12.04% | | |
| | | |
| | | |
| $2,985 | | | $1,259 | | | $3,076 | | | $4,575 | | | $3,097 | | |
| 1.72% | | | 1.60% | | | 1.60% | | | 1.61% | | | 1.74% | | |
| | | |
| 2.08% | | | 1.79% | | | 1.70% | | | 1.73% | | | 1.78% | | |
| 2.13% | | | 1.99% | | | 1.05% | | | 1.85% | | | 1.98% | | |
| | | |
| 1.77% | | | 1.80% | | | 0.95% | | | 1.73% | | | 1.94% | | |
| 35% | | | 32% | | | 26% | | | 127% | | | 14% | | |
69
Financial highlights
Delaware International Value Equity Fund Institutional Class
Selected data for each share of the Fund outstanding throughout each period were as follows:
| Net asset value, beginning of period |
| |
| Income (loss) from investment operations: |
| Net investment income1 |
| Net realized and unrealized gain (loss) on investments and foreign currencies |
| Total from investment operations |
| |
| Less dividends and distributions from: |
| Net investment income |
| Net realized gain on investments |
| Total dividends and distributions |
| |
| Net asset value, end of period |
| |
| Total return2 |
| |
| Ratios and supplemental data: |
| Net assets, end of period (000 omitted) |
| Ratio of expenses to average net assets |
| Ratio of expenses to average net assets |
| prior to fees waived and expense paid indirectly |
| Ratio of net investment income to average net assets |
| Ratio of net investment income to average net assets |
| prior to fees waived and expense paid indirectly |
| Portfolio turnover |
1 The average shares outstanding method has been applied for per share information. |
2 Total investment return is based on the change in net asset value of a share during the period and assumes reinvestment of dividends and distributions at net asset value. Total investment return during some of the periods shown reflects a waiver by the manager. Performance would have been lower had the waiver not been in effect. |
See accompanying notes
70
| Year Ended | |
| 11/30/09 | | 11/30/08 | | 11/30/07 | | 11/30/06 | | 11/30/05 | |
| $8.170 | | | $16.850 | | | $16.100 | | | $18.210 | | | $16.410 | | |
| | | |
| | | |
| 0.239 | | | 0.327 | | | 0.255 | | | 0.389 | | | 0.439 | | |
| 3.385 | | | (8.034 | ) | | 1.513 | | | 3.233 | | | 1.614 | | |
| 3.624 | | | (7.707 | ) | | 1.768 | | | 3.622 | | | 2.053 | | |
| | | |
| | | |
| (0.344 | ) | | (0.254 | ) | | (0.223 | ) | | (0.465 | ) | | (0.108 | ) | |
| — | | | (0.719 | ) | | (0.795 | ) | | (5.267 | ) | | (0.145 | ) | |
| (0.344 | ) | | (0.973 | ) | | (1.018 | ) | | (5.732 | ) | | (0.253 | ) | |
| | | |
| $11.450 | | | $8.170 | | | $16.850 | | | $16.100 | | | $18.210 | | |
| | | |
| 45.13% | | | (48.44% | ) | | 11.59% | | | 23.93% | | | 12.67% | | |
| | | |
| | | |
| $140,824 | | | $146,192 | | | $399,014 | | | $355,347 | | | $276,499 | | |
| 1.22% | | | 1.10% | | | 1.10% | | | 1.11% | | | 1.18% | | |
| | | |
| 1.48% | | | 1.19% | | | 1.10% | | | 1.13% | | | 1.18% | | |
| 2.63% | | | 2.49% | | | 1.55% | | | 2.35% | | | 2.54% | | |
| | | |
| 2.37% | | | 2.40% | | | 1.55% | | | 2.33% | | | 2.54% | | |
| 35% | | | 32% | | | 26% | | | 127% | | | 14% | | |
71
Financial highlights
Delaware Emerging Markets Fund Class A
Selected data for each share of the Fund outstanding throughout each period were as follows:
| Net asset value, beginning of period |
| |
| Income (loss) from investment operations: |
| Net investment income1 |
| Net realized and unrealized gain (loss) on investments and foreign currencies |
| Total from investment operations |
| |
| Less dividends and distributions from: |
| Net investment income |
| Net realized gain on investments |
| Total dividends and distributions |
| |
| Net asset value, end of period |
| |
| Total return2 |
| |
| Ratios and supplemental data: |
| Net assets, end of period (000 omitted) |
| Ratio of expenses to average net assets |
| Ratio of expenses to average net assets |
| prior to fees waived and expense paid indirectly |
| Ratio of net investment income to average net assets |
| Ratio of net investment income to average net assets |
| prior to fees waived and expense paid indirectly |
| Portfolio turnover |
1 The average shares outstanding method has been applied for per share information. |
2 Total investment return is based on the change in net asset value of a share during the period and assumes reinvestment of dividends and distributions at net asset value and does not reflect the impact of a sales charge. Total investment return during some of the periods shown reflects waivers by the manager and distributor. Performance would have been lower had the waivers not been in effect. |
See accompanying notes
72
| Year Ended | |
| 11/30/09 | | | 11/30/08 | | | 11/30/07 | | | 11/30/06 | | | 11/30/05 | | |
| $7.940 | | | $22.760 | | | $21.280 | | | $17.950 | | | $14.550 | | |
| | | | | | | | | | | | | | | | |
| | | | | | | | | | | | | | | | |
| 0.043 | | | 0.137 | | | 0.184 | | | 0.419 | | | 0.309 | | |
| 5.736 | | | (9.242 | ) | | 7.117 | | | 4.080 | | | 3.567 | | |
| 5.779 | | | (9.105 | ) | | 7.301 | | | 4.499 | | | 3.876 | | |
| | | | | | | | | | | | | | | | |
| | | | | | | | | | | | | | | | |
| (0.016 | ) | | (0.234 | ) | | (0.523 | ) | | (0.269 | ) | | (0.092 | ) | |
| (0.823 | ) | | (5.481 | ) | | (5.298 | ) | | (0.900 | ) | | (0.384 | ) | |
| (0.839 | ) | | (5.715 | ) | | (5.821 | ) | | (1.169 | ) | | (0.476 | ) | |
| | | | | | | | | | | | | | | | |
| $12.880 | | | $7.940 | | | $22.760 | | | $21.280 | | | $17.950 | | |
| | | | | | | | | | | | | | | | |
| 79.84% | | | (53.37% | ) | | 46.11% | | | 26.52% | | | 27.42% | | |
| | | | | | | | | | | | | | | | |
| | | | | | | | | | | | | | | | |
| $399,840 | | | $213,581 | | | $673,309 | | | $533,042 | | | $724,417 | | |
| 1.91% | | | 1.83% | | | 1.97% | | | 1.94% | | | 1.97% | | |
| | | | | | | | | | | | | | | | |
| 1.98% | | | 1.88% | | | 2.02% | | | 1.99% | | | 2.02% | | |
| 0.45% | | | 0.94% | | | 0.97% | | | 2.23% | | | 1.90% | | |
| | | | | | | | | | | | | | | | |
| 0.38% | | | 0.89% | | | 0.92% | | | 2.18% | | | 1.85% | | |
| 37% | | | 37% | | | 108% | | | 46% | | | 25% | | |
73
Financial highlights
Delaware Emerging Markets Fund Class B
Selected data for each share of the Fund outstanding throughout each period were as follows:
| Net asset value, beginning of period |
| |
| Income (loss) from investment operations: |
| Net investment income (loss)1 |
| Net realized and unrealized gain (loss) on investments and foreign currencies |
| Total from investment operations |
| |
| Less dividends and distributions from: |
| Net investment income |
| Net realized gain on investments |
| Total dividends and distributions |
| |
| Net asset value, end of period |
| |
| Total return2 |
| |
| Ratios and supplemental data: |
| Net assets, end of period (000 omitted) |
| Ratio of expenses to average net assets |
| Ratio of expenses to average net assets |
| prior to fees waived and expense paid indirectly |
| Ratio of net investment income (loss) to average net assets |
| Ratio of net investment income (loss) to average net assets |
| prior to fees waived and expense paid indirectly |
| Portfolio turnover |
1 The average shares outstanding method has been applied for per share information. |
2 Total investment return is based on the change in net asset value of a share during the period and assumes reinvestment of dividends and distributions at net asset value and does not reflect the impact of a sales charge. Total investment return during some of the periods shown reflects a waiver by the manager. Performance would have been lower had the waiver not been in effect. |
See accompanying notes
74
| Year Ended | |
| 11/30/09 | | | 11/30/08 | | | 11/30/07 | | | 11/30/06 | | | 11/30/05 | | |
| $7.640 | | | $22.120 | | | $20.830 | | | $17.600 | | | $14.290 | | |
| | | | | | | | | | | | | | | | |
| | | | | | | | | | | | | | | | |
| (0.025 | ) | | 0.030 | | | 0.045 | | | 0.280 | | | 0.191 | | |
| 5.508 | | | (8.936 | ) | | 6.926 | | | 3.998 | | | 3.503 | | |
| | 5.483 | | | (8.906 | ) | | 6.971 | | | 4.278 | | | 3.694 | | |
| | | | | | | | | | | | | | | | |
| | | | | | | | | | | | | | | | |
| — | | | (0.093 | ) | | (0.383 | ) | | (0.148 | ) | | — | | |
| (0.823 | ) | | (5.481 | ) | | (5.298 | ) | | (0.900 | ) | | (0.384 | ) | |
| (0.823 | ) | | (5.574 | ) | | (5.681 | ) | | (1.048 | ) | | (0.384 | ) | |
| | | | | | | | | | | | | | | | |
| $12.300 | | | $7.640 | | | $22.120 | | | $20.830 | | | $17.600 | | |
| | | | | | | | | | | | | | | | |
| 78.59% | | | (53.76% | ) | | 44.97% | | | 25.59% | | | 26.47% | | |
| | | | | | | | | | | | | | | | |
| | | | | | | | | | | | | | | | |
| | $20,022 | | | $14,620 | | | $45,978 | | | $37,944 | | | $36,399 | | |
| 2.66% | | | 2.58% | | | 2.72% | | | 2.69% | | | 2.72% | | |
| | | | | | | | | | | | | | | | |
| 2.68% | | | 2.58% | | | 2.72% | | | 2.69% | | | 2.72% | | |
| (0.30% | ) | | 0.19% | | | 0.22% | | | 1.48% | | | 1.15% | | |
| | | | | | | | | | | | | | | | |
| (0.32% | ) | | 0.19% | | | 0.22% | | | 1.48% | | | 1.15% | | |
| 37% | | | 37% | | | 108% | | | 46% | | | 25% | | |
75
Financial highlights
Delaware Emerging Markets Fund Class C
Selected data for each share of the Fund outstanding throughout each period were as follows:
| Net asset value, beginning of period |
| |
| Income (loss) from investment operations: |
| Net investment income (loss)1 |
| Net realized and unrealized gain (loss) on investments and foreign currencies |
| Total from investment operations |
| |
| Less dividends and distributions from: |
| Net investment income |
| Net realized gain on investments |
| Total dividends and distributions |
| |
| Net asset value, end of period |
| |
| Total return2 |
| |
| Ratios and supplemental data: |
| Net assets, end of period (000 omitted) |
| Ratio of expenses to average net assets |
| Ratio of expenses to average net assets |
| prior to fees waived and expense paid indirectly |
| Ratio of net investment income (loss) to average net assets |
| Ratio of net investment income (loss) to average net assets |
| prior to fees waived and expense paid indirectly |
| Portfolio turnover |
1 The average shares outstanding method has been applied for per share information. |
2 Total investment return is based on the change in net asset value of a share during the period and assumes reinvestment of dividends and distributions at net asset value and does not reflect the impact of a sales charge. Total investment return during some of the periods shown reflects a waiver by the manager. Performance would have been lower had the waiver not been in effect. |
See accompanying notes
76
| Year Ended | |
| 11/30/09 | | | 11/30/08 | | | 11/30/07 | | | 11/30/06 | | | 11/30/05 | | |
| $7.630 | | | $22.090 | | | $20.800 | | | $17.580 | | | $14.270 | | |
| | | | | | | | | | | | | | | | |
| | | | | | | | | | | | | | | | |
| (0.026 | ) | | 0.031 | | | 0.045 | | | 0.280 | | | 0.191 | | |
| 5.489 | | | (8.917 | ) | | 6.926 | | | 3.988 | | | 3.503 | | |
| 5.463 | | | (8.886 | ) | | 6.971 | | | 4.268 | | | 3.694 | | |
| | | | | | | | | | | | | | | | |
| | | | | | | | | | | | | | | | |
| — | | | (0.093 | ) | | (0.383 | ) | | (0.148 | ) | | — | | |
| (0.823 | ) | | (5.481 | ) | | (5.298 | ) | | (0.900 | ) | | (0.384 | ) | |
| (0.823 | ) | | (5.574 | ) | | (5.681 | ) | | (1.048 | ) | | (0.384 | ) | |
| | | | | | | | | | | | | | | | |
| $12.270 | | | $7.630 | | | $22.090 | | | $20.800 | | | $17.580 | | |
| | | | | | | | | | | | | | | | |
| 78.68% | | | (53.75% | ) | | 45.03% | | | 25.56% | | | 26.51% | | |
| | | | | | | | | | | | | | | | |
| | | | | | | | | | | | | | | | |
| $157,383 | | | $84,436 | | | $237,832 | | | $183,562 | | | $211,896 | | |
| 2.66% | | | 2.58% | | | 2.72% | | | 2.69% | | | 2.72% | | |
| | | | | | | | | | | | | | | | |
| 2.68% | | | 2.58% | | | 2.72% | | | 2.69% | | | 2.72% | | |
| (0.30% | ) | | 0.19% | | | 0.22% | | | 1.48% | | | 1.15% | | |
| | | | | | | | | | | | | | | | |
| (0.32% | ) | | 0.19% | | | 0.22% | | | 1.48% | | | 1.15% | | |
| 37% | | | 37% | | | 108% | | | 46% | | | 25% | | |
77
Financial highlights
Delaware Emerging Markets Fund Class R
Selected data for each share of the Fund outstanding throughout the period was as follows:
| | 8/31/091 | |
| | to | |
| | 11/30/09 | |
| Net asset value, beginning of period | | $11.52 | |
| | | | |
| Income (loss) from investment operations: | | | |
| Net investment loss2 | | (0.030 | ) |
| Net realized and unrealized gain on investments | | | |
| and foreign currencies | | 1.520 | |
| Total from investment operations | | 1.490 | |
| | | | |
| Net asset value, end of period | | $13.010 | |
| | | | |
| Total return3 | | 12.93% | |
| | | | |
| Ratios and supplemental data: | | | |
| Net assets, end of period (000 omitted) | | $— | |
| Ratio of expenses to average net assets | | 2.11% | |
| Ratio of expenses to average net assets | | | |
| prior to fees waived and expense paid indirectly | | 2.22% | |
| Ratio of net investment loss to average net assets | | (0.88% | ) |
| Ratio of net investment loss to average net assets | | | |
| prior to fees waived and expense paid indirectly | | (0.99% | ) |
| Portfolio turnover | | 37% | 4 |
1 Date of commencement of operations; ratios have been annualized and total return has not been annualized. |
2 The average shares outstanding method has been applied for per share information. |
3 Total investment return is based on the change in net asset value of a share during the period and assumes reinvestment of distributions at net asset value. Total investment return during some of the periods shown reflects waivers by the manager and distributor. Performance would have been lower had the waivers not been in effect. |
4 Portfolio turnover is representative of the Fund for the entire year. |
See accompanying notes
78
Financial highlights
Delaware Emerging Markets Fund Institutional Class
Selected data for each share of the Fund outstanding throughout each period were as follows:
| Net asset value, beginning of period |
| |
| Income (loss) from investment operations: |
| Net investment income1 |
| Net realized and unrealized gain (loss) on investments and foreign currencies |
| Total from investment operations |
| |
| Less dividends and distributions from: |
| Net investment income |
| Net realized gain on investments |
| Total dividends and distributions |
| |
| Net asset value, end of period |
| |
| Total return2 |
| |
| Ratios and supplemental data: |
| Net assets, end of period (000 omitted) |
| Ratio of expenses to average net assets |
| Ratio of expenses to average net assets |
| prior to fees waived and expense paid indirectly |
| Ratio of net investment income to average net assets |
| Ratio of net investment income to average net assets |
| prior to fees waived and expense paid indirectly |
| Portfolio turnover |
1 The average shares outstanding method has been applied for per share information. |
2 Total investment return is based on the change in net asset value of a share during the period and assumes reinvestment of dividends and distributions at net asset value. Total investment return during some of the periods shown reflects a waiver by the manager. Performance would have been lower had the waiver not been in effect. |
See accompanying notes
80
| Year Ended | |
| 11/30/09 | | | 11/30/08 | | | 11/30/07 | | | 11/30/06 | | | 11/30/05 | | |
| $8.000 | | | $22.910 | | | $21.390 | | | $18.030 | | | $14.610 | | |
| | | | | | | | | | | | | | | | |
| | | | | | | | | | | | | | | | |
| 0.068 | | | 0.175 | | | 0.232 | | | 0.466 | | | 0.349 | | |
| 5.786 | | | (9.321 | ) | | 7.157 | | | 4.104 | | | 3.579 | | |
| 5.854 | | | (9.146 | ) | | 7.389 | | | 4.570 | | | 3.928 | | |
| | | | | | | | | | | | | | | | |
| | | | | | | | | | | | | | | | |
| (0.051 | ) | | (0.283 | ) | | (0.571 | ) | | (0.310 | ) | | (0.124 | ) | |
| (0.823 | ) | | (5.481 | ) | | (5.298 | ) | | (0.900 | ) | | (0.384 | ) | |
| (0.874 | ) | | (5.764 | ) | | (5.869 | ) | | (1.210 | ) | | (0.508 | ) | |
| | | | | | | | | | | | | | | | |
| $12.980 | | | $8.000 | | | $22.910 | | | $21.390 | | | $18.030 | | |
| | | | | | | | | | | | | | | | |
| 80.39% | | | (53.30% | ) | | 46.49% | | | 26.87% | | | 27.73% | | |
| | | | | | | | | | | | | | | | |
| | | | | | | | | | | | | | | | |
| $148,662 | | | $45,697 | | | $110,327 | | | $112,964 | | | $255,608 | | |
| 1.66% | | | 1.58% | | | 1.72% | | | 1.69% | | | 1.72% | | |
| | | | | | | | | | | | | | | | |
| 1.68% | | | 1.58% | | | 1.72% | | | 1.69% | | | 1.72% | | |
| 0.70% | | | 1.19% | | | 1.22% | | | 2.48% | | | 2.15% | | |
| | | | | | | | | | | | | | | | |
| 0.68% | | | 1.19% | | | 1.22% | | | 2.48% | | | 2.15% | | |
| 37% | | | 37% | | | 108% | | | 46% | | | 25% | | |
81
Financial highlights
Delaware Global Value Fund Class A
Selected data for each share of the Fund outstanding throughout each period were as follows:
| Net asset value, beginning of period |
| |
| Income (loss) from investment operations: |
| Net investment income1 |
| Net realized and unrealized gain (loss) on investments and foreign currencies |
| Total from investment operations |
| |
| Less dividends and distributions from: |
| Net investment income |
| Net realized gain on investments |
| Total dividends and distributions |
| |
| Net asset value, end of period |
| |
| Total return2 |
| |
| Ratios and supplemental data: |
| Net assets, end of period (000 omitted) |
| Ratio of expenses to average net assets |
| Ratio of expenses to average net assets |
| prior to fees waived and expense paid indirectly |
| Ratio of net investment income to average net assets |
| Ratio of net investment income to average net assets |
| prior to fees waived and expense paid indirectly |
| Portfolio turnover |
1 The average shares outstanding method has been applied for per share information. |
2 Total investment return is based on the change in net asset value of a share during the period and assumes reinvestment of dividends and distributions at net asset value and does not reflect the impact of a sales charge. Total investment return during all of the periods shown reflects waivers by the manager and distributor. Performance would have been lower had the waivers not been in effect. |
See accompanying notes
82
| Year Ended | |
| 11/30/09 | | | 11/30/08 | | | 11/30/07 | | | 11/30/06 | | | 11/30/05 | | |
| $5.790 | | | $11.850 | | | $13.260 | | | $11.660 | | | $10.810 | | |
| | | | | | | | | | | | | | | | |
| | | | | | | | | | | | | | | | |
| 0.106 | | | 0.172 | | | 0.145 | | | 0.111 | | | 0.120 | | |
| 2.315 | | | (5.554 | ) | | 0.663 | | | 3.084 | | | 1.231 | | |
| 2.421 | | | (5.382 | ) | | 0.808 | | | 3.195 | | | 1.351 | | |
| | | | | | | | | | | | | | | | |
| | | | | | | | | | | | | | | | |
| (0.161 | ) | | (0.138 | ) | | (0.066 | ) | | (0.238 | ) | | (0.016 | ) | |
| — | | | (0.540 | ) | | (2.152 | ) | | (1.357 | ) | | (0.485 | ) | |
| (0.161 | ) | | (0.678 | ) | | (2.218 | ) | | (1.595 | ) | | (0.501 | ) | |
| | | | | | | | | | | | | | | | |
| $8.050 | | | $5.790 | | | $11.850 | | | $13.260 | | | $11.660 | | |
| | | | | | | | | | | | | | | | |
| 42.14% | | | (48.12% | ) | | 6.96% | | | 30.83% | | | 12.97% | | |
| | | | | | | | | | | | | | | | |
| | | | | | | | | | | | | | | | |
| $24,823 | | | $22,034 | | | $66,024 | | | $36,416 | | | $20,613 | | |
| 1.56% | | | 1.45% | | | 1.45% | | | 1.59% | | | 1.89% | | |
| | | | | | | | | | | | | | | | |
| 2.09% | | | 1.76% | | | 1.57% | | | 1.88% | | | 2.13% | | |
| 1.66% | | | 1.84% | | | 1.22% | | | 0.93% | | | 1.06% | | |
| | | | | | | | | | | | | | | | |
| 1.13% | | | 1.53% | | | 1.10% | | | 0.64% | | | 0.82% | | |
| 47% | | | 78% | | | 31% | | | 124% | | | 51% | | |
83
Financial highlights
Delaware Global Value Fund Class B
Selected data for each share of the Fund outstanding throughout each period were as follows:
| Net asset value, beginning of period |
| |
| Income (loss) from investment operations: |
| Net investment income1 |
| Net realized and unrealized gain (loss) on investments and foreign currencies |
| Total from investment operations |
| |
| Less dividends and distributions from: |
| Net investment income |
| Net realized gain on investments |
| Total dividends and distributions |
| |
| Net asset value, end of period |
| |
| Total return2 |
| |
| Ratios and supplemental data: |
| Net assets, end of period (000 omitted) |
| Ratio of expenses to average net assets |
| Ratio of expenses to average net assets |
| prior to fees waived and expense paid indirectly |
| Ratio of net investment income to average net assets |
| Ratio of net investment income (loss) to average net assets |
| prior to fees waived and expense paid indirectly |
| Portfolio turnover |
1 The average shares outstanding method has been applied for per share information. |
2 Total investment return is based on the change in net asset value of a share during the period and assumes reinvestment of dividends and distributions at net asset value and does not reflect the impact of a sales charge. Total investment return during all of the periods shown reflects a waiver by the manager. Performance would have been lower had the waiver not been in effect. |
See accompanying notes
84
| | Year Ended | |
| | 11/30/09 | | | 11/30/08 | | | 11/30/07 | | | 11/30/06 | | | 11/30/05 | | |
| | $5.680 | | | $11.640 | | | $13.070 | | | $11.510 | | | $10.740 | | |
| | | | | | | | | | | | | | | | |
| | | | | | | | | | | | | | | | |
| | 0.059 | | | 0.104 | | | 0.057 | | | 0.022 | | | 0.037 | | |
| | 2.297 | | | (5.474 | ) | | 0.665 | | | 3.050 | | | 1.218 | | |
| | 2.356 | | | (5.370 | ) | | 0.722 | | | 3.072 | | | 1.255 | | |
| | | | | | | | | | | | | | | | |
| | | | | | | | | | | | | | | | |
| | (0.096 | ) | | (0.050 | ) | | — | | | (0.155 | ) | | — | | |
| | — | | | (0.540 | ) | | (2.152 | ) | | (1.357 | ) | | (0.485 | ) | |
| | (0.096 | ) | | (0.590 | ) | | (2.152 | ) | | (1.512 | ) | | (0.485 | ) | |
| | | | | | | | | | | | | | | | |
| | $7.940 | | | $5.680 | | | $11.640 | | | $13.070 | | | $11.510 | | |
| | | | | | | | | | | | | | | | |
| | 41.36% | | | (48.51% | ) | | 6.08% | | | 29.95% | | | 12.11% | | |
| | | | | | | | | | | | | | | | |
| | | | | | | | | | | | | | | | |
| | $4,255 | | | $4,103 | | | $10,893 | | | $7,453 | | | $3,483 | | |
| | 2.31% | | | 2.20% | | | 2.20% | | | 2.34% | | | 2.64% | | |
| | | | | | | | | | | | | | | | |
| | 2.79% | | | 2.46% | | | 2.27% | | | 2.58% | | | 2.83% | | |
| | 0.91% | | | 1.09% | | | 0.47% | | | 0.18% | | | 0.31% | | |
| | | | | | | | | | | | | | | | |
| | 0.43% | | | 0.83% | | | 0.40% | | | (0.06% | ) | | 0.12% | | |
| | 47% | | | 78% | | | 31% | | | 124% | | | 51% | | |
85
Financial highlights
Delaware Global Value Fund Class C
Selected data for each share of the Fund outstanding throughout each period were as follows:
| Net asset value, beginning of period | |
| |
| Income (loss) from investment operations: | |
| Net investment income1 | |
| Net realized and unrealized gain (loss) on investments and foreign currencies | |
| Total from investment operations | |
| |
| Less dividends and distributions from: | |
| Net investment income | |
| Net realized gain on investments | |
| Total dividends and distributions | |
| |
| Net asset value, end of period | |
| |
| Total return2 | |
| |
| Ratios and supplemental data: | |
| Net assets, end of period (000 omitted) | |
| Ratio of expenses to average net assets | |
Ratio of expenses to average net assets
prior to fees waived and expense paid indirectly | |
| Ratio of net investment income to average net assets | |
Ratio of net investment income (loss) to average net assets
prior to fees waived and expense paid indirectly | |
| Portfolio turnover | |
1 The average shares outstanding method has been applied for per share information. |
2 Total investment return is based on the change in net asset value of a share during the period and assumes reinvestment of dividends and distributions at net asset value and does not reflect the impact of a sales charge. Total investment return during all of the periods shown reflects a waiver by the manager. Performance would have been lower had the waiver not been in effect. |
See accompanying notes
86
| | Year Ended | |
| | 11/30/09 | | 11/30/08 | | 11/30/07 | | 11/30/06 | | 11/30/05 | |
| | $5.690 | | | $11.650 | | | $13.090 | | | $11.520 | | | $10.750 | | |
| | | | | | | | | | | | | | | | |
| | | | | | | | | | | | | | | | |
| | 0.059 | | | 0.102 | | | 0.057 | | | 0.022 | | | 0.037 | | |
| | 2.287 | | | (5.472 | ) | | 0.655 | | | 3.060 | | | 1.218 | | |
| | 2.346 | | | (5.370 | ) | | 0.712 | | | 3.082 | | | 1.255 | | |
| | | | | | | | | | | | | | | | |
| | | | | | | | | | | | | | | | |
| | (0.096 | ) | | (0.050 | ) | | — | | | (0.155 | ) | | — | | |
| | — | | | (0.540 | ) | | (2.152 | ) | | (1.357 | ) | | (0.485 | ) | |
| | (0.096 | ) | | (0.590 | ) | | (2.152 | ) | | (1.512 | ) | | (0.485 | ) | |
| | | | | | | | | | | | | | | | |
| | $7.940 | | | $5.690 | | | $11.650 | | | $13.090 | | | $11.520 | | |
| | | | | | | | | | | | | | | | |
| | 41.12% | | | (48.51% | ) | | 6.17% | | | 29.92% | | | 12.10% | | |
| | | | | | | | | | | | | | | | |
| | | | | | | | | | | | | | | | |
| | $10,845 | | | $11,260 | | | $39,463 | | | $17,545 | | | $6,380 | | |
| | 2.31% | | | 2.20% | | | 2.20% | | | 2.34% | | | 2.64% | | |
| | | | | | | | | | | | | | | | |
| | 2.79% | | | 2.46% | | | 2.27% | | | 2.58% | | | 2.83% | | |
| | 0.91% | | | 1.09% | | | 0.47% | | | 0.18% | | | 0.31% | | |
| | | | | | | | | | | | | | | | |
| | 0.43% | | | 0.83% | | | 0.40% | | | (0.06% | ) | | 0.12% | | |
| | 47% | | | 78% | | | 31% | | | 124% | | | 51% | | |
87
Financial highlights
Delaware Global Value Fund Institutional Class
Selected data for each share of the Fund outstanding throughout each period were as follows:
| Net asset value, beginning of period | |
| |
| Income (loss) from investment operations: | |
| Net investment income1 | |
| Net realized and unrealized gain (loss) on investments and foreign currencies | |
| Total from investment operations | |
| |
| Less dividends and distributions from: | |
| Net investment income | |
| Net realized gain on investments | |
| Total dividends and distributions | |
| |
| Net asset value, end of period | |
| |
| Total return2 | |
| |
| Ratios and supplemental data: | |
| Net assets, end of period (000 omitted) | |
| Ratio of expenses to average net assets | |
Ratio of expenses to average net assets
prior to fees waived and expense paid indirectly | |
| Ratio of net investment income to average net assets | |
Ratio of net investment income to average net assets
prior to fees waived and expense paid indirectly | |
| Portfolio turnover | |
1 The average shares outstanding method has been applied for per share information. |
2 Total investment return is based on the change in net asset value of a share during the period and assumes reinvestment of dividends and distributions at net asset value. Total investment return during all of the periods shown reflects a waiver by the manager. Performance would have been lower had the waiver not been in effect. |
See accompanying notes
88
| | Year Ended | |
| | 11/30/09 | | 11/30/08 | | 11/30/07 | | 11/30/06 | | 11/30/05 | |
| | $5.810 | | | $11.910 | | | $13.310 | | | $11.700 | | | $10.840 | | |
| | | | | | | | | | | | | | | | |
| | | | | | | | | | | | | | | | |
| | 0.123 | | | 0.195 | | | 0.176 | | | 0.141 | | | 0.148 | | |
| | 2.330 | | | (5.587 | ) | | 0.673 | | | 3.092 | | | 1.237 | | |
| | 2.453 | | | (5.392 | ) | | 0.849 | | | 3.233 | | | 1.385 | | |
| | | | | | | | | | | | | | | | |
| | | | | | | | | | | | | | | | |
| | (0.183 | ) | | (0.168 | ) | | (0.097 | ) | | (0.266 | ) | | (0.040 | ) | |
| | — | | | (0.540 | ) | | (2.152 | ) | | (1.357 | ) | | (0.485 | ) | |
| | (0.183 | ) | | (0.708 | ) | | (2.249 | ) | | (1.623 | ) | | (0.525 | ) | |
| | | | | | | | | | | | | | | | |
| | $8.080 | | | $5.810 | | | $11.910 | | | $13.310 | | | $11.700 | | |
| | | | | | | | | | | | | | | | |
| | 42.46% | | | (48.03% | ) | | 7.12% | | | 31.24% | | | 13.28% | | |
| | | | | | | | | | | | | | | | |
| | | | | | | | | | | | | | | | |
| | $1,390 | | | $1,088 | | | $2,398 | | | $5,193 | | | $4,576 | | |
| | 1.31% | | | 1.20% | | | 1.20% | | | 1.34% | | | 1.64% | | |
| | | | | | | | | | | | | | | | |
| | 1.79% | | | 1.46% | | | 1.27% | | | 1.58% | | | 1.83% | | |
| | 1.91% | | | 2.09% | | | 1.47% | | | 1.18% | | | 1.31% | | |
| | | | | | | | | | | | | | | | |
| | 1.43% | | | 1.83% | | | 1.40% | | | 0.94% | | | 1.12% | | |
| | 47% | | | 78% | | | 31% | | | 124% | | | 51% | | |
89
| Notes to financial statements | |
| Delaware International Funds | November 30, 2009 |
Delaware Group® Global & International Funds (Trust) is organized as a Delaware statutory trust and offers four series: Delaware International Value Equity Fund, Delaware Emerging Markets Fund, Delaware Global Value Fund and Delaware Focus Global Growth Fund. These financial statements and the related notes pertain to Delaware International Value Equity Fund, Delaware Emerging Markets Fund and Delaware Global Value Fund (each, a Fund or collectively, as the Funds). The Trust is an open-end investment company. Each Fund is considered diversified under the Investment Company Act of 1940, as amended, and offers Class A, Class B, Class C, Class R and Institutional Class shares. Class A shares are sold with a maximum front-end sales charge of up to 5.75%. Class A share purchases of $1,000,000 or more will incur a contingent deferred sales charge (CDSC) of 1% if redeemed during the first year and 0.50% during the second year, provided that Delaware Distributors, L.P. (DDLP) paid a financial advisor a commission on the purchase of those shares. Class B shares may be purchased only through dividend reinvestment and certain permitted exchanges. Prior to June 1, 2007, Class B shares were sold with a CDSC that declined from 4% to zero depending upon the period of time the shares were held. Class B shares will automatically convert to Class A shares on a quarterly basis approximately eight years after purchase. Class C shares are sold with a CDSC of 1%, if redeemed during the first twelve months. Class R and Institutional Class shares are not subject to a sales charge and are offered for sale exclusively to certain eligible investors. As of November 30, 2009, Delaware Global Value Fund has not commenced operations of the Class R shares. On August 31, 2009, Delaware Emerging Markets Fund commenced operations of its Class R shares.
The investment objective of Delaware International Value Equity Fund is to seek long-term growth without undue risk to principal.
The investment objective of Delaware Emerging Markets Fund and Delaware Global Value Fund is to seek long-term capital appreciation.
1. Significant Accounting Policies
The following accounting policies are in accordance with U.S. generally accepted accounting principles (GAAP) and are consistently followed by the Funds.
Security Valuation — Equity securities, except those traded on the Nasdaq Stock Market, Inc. (Nasdaq), are valued at the last quoted sales price as of the time of the regular close of the New York Stock Exchange (NYSE) on the valuation date. Securities traded on the Nasdaq are valued in accordance with the Nasdaq Official Closing Price, which may not be the last sales price. If on a particular day an equity security does not trade, then the mean between the bid and ask prices will be used. Securities listed on a foreign exchange are valued at the last quoted sales price on the valuation date. Short-term debt securities are valued at market value. Investment companies are valued at net asset value per share. Foreign currency exchange contracts are valued at the mean between the bid and ask prices. Interpolated values are derived when the settlement date of the contract is an interim date for which quotations are not available. Generally, other securities and assets for which market quotations are not readily available are valued at fair value as determined
90
in good faith under the direction of the Funds’ Board of Trustees (Board). In determining whether market quotations are readily available or fair valuation will be used, various factors will be taken into consideration, such as market closures or suspension of trading in a security. The Funds may use fair value pricing more frequently for securities traded primarily in non-U.S. markets because, among other things, most foreign markets close well before the Funds value their securities at 4:00 p.m. Eastern time. The earlier close of these foreign markets gives rise to the possibility that significant events, including broad market moves, government actions or pronouncements, aftermarket trading, or news events may have occurred in the interim. To account for this, the Funds may frequently value foreign securities using fair value prices based on third-party vendor modeling tools (international fair value pricing).
Federal Income Taxes — No provision for federal income taxes has been made as each Fund intends to continue to qualify for federal income tax purposes as a regulated investment company under Subchapter M of the Internal Revenue Code of 1986, as amended, and make the requisite distributions to shareholders. The Funds evaluate tax positions taken or expected to be taken in the course of preparing the Funds’ tax returns to determine whether the tax positions are “more-likely-than-not” of being sustained by the applicable tax authority. Tax positions not deemed to meet the more-likely-than-not threshold are recorded as a tax benefit or expense in the current year. Management has analyzed the Funds’ tax positions taken on federal income tax returns for all open tax years (tax years ended November 30, 2006 – November 30, 2009), and has concluded that no provision for federal income tax is required in the Funds’ financial statements.
Class Accounting — Investment income, common expenses and realized and unrealized gain (loss) on investments are allocated to the various classes of the Funds on the basis of daily net assets of each class. Distribution expenses relating to a specific class are charged directly to that class.
Repurchase Agreements — Each Fund may invest in a pooled cash account along with other members of the Delaware Investments® Family of Funds pursuant to an exemptive order issued by the Securities and Exchange Commission. The aggregate daily balance of the pooled cash account is invested in repurchase agreements secured by obligations of the U.S. government. The respective collateral is held by the Funds’ custodian bank until the maturity of the respective repurchase agreements. Each repurchase agreement is at least 102% collateralized. However, in the event of default or bankruptcy by the counterparty to the agreement, realization of the collateral may be subject to legal proceedings. At November 30, 2009, the Funds held no investments in repurchase agreements.
Foreign Currency Transactions — Transactions denominated in foreign currencies are recorded at the prevailing exchange rates on the valuation date. The value of all assets and liabilities denominated in foreign currencies is translated into U.S. dollars at the exchange rate of such currencies against the U.S. dollar daily. Transaction gains or losses resulting from changes in exchange rates during the reporting period or upon settlement of the foreign currency transaction
91
Notes to financial statements
Delaware International Funds
1. Significant Accounting Policies (continued)
are reported in operations for the current period. The Funds do not isolate that portion of realized gains and losses on investments which is due to changes in the foreign exchange rates from that which are due to changes in market prices. The Funds report certain foreign currency related transactions as components of realized gains (losses) for financial reporting purposes, whereas such components are treated as ordinary income (loss) for federal income tax purposes.
Use of Estimates — The preparation of financial statements in conformity with U.S. GAAP requires management to make estimates and assumptions that affect the reported amounts of assets and liabilities at the date of the financial statements and the reported amounts of revenues and expenses during the reporting period. Actual results could differ from those estimates.
Other — Expenses directly attributable to the Funds are charged directly to the Funds. Other expenses common to various funds within the Delaware Investments® Family of Funds are generally allocated amongst such funds on the basis of average net assets. Management fees and some other expenses are paid monthly. Security transactions are recorded on the date the securities are purchased or sold (trade date) for the financial reporting purposes. Costs used in calculating realized gains and losses on the sale of investment securities are those of the specific securities sold. Dividend income is recorded on the ex-dividend date and interest income is recorded on the accrual basis. Taxable non-cash dividends are recorded as dividend income. Foreign dividends are also recorded on the ex-dividend date or as soon after the ex-dividend date that the Funds are aware of such dividends, net of all non-rebatable tax withholdings. Withholding taxes on foreign dividends have been recorded in accordance with each Fund’s understanding of the applicable country’s tax rules and rates. Each Fund declares and pays dividends from net investment income and distributions from net realized gain on investments, if any, annually.
The Funds may receive earnings credits from their custodian when positive cash balances are maintained, which are used to offset custody fees. There were no earnings credits for the year ended November 30, 2009.
On July 1, 2009, the Financial Accounting Standards Board (FASB) issued the FASB Accounting Standards Codification (Codification). The Codification became the single source of authoritative nongovernmental U.S. GAAP, superseding existing literature of the FASB, American Institute of Certified Public Accountants, Emerging Issues Task Force and other sources. The Codification is effective for interim and annual periods ending after September 15, 2009. The Funds adopted the Codification for the year ended November 30, 2009. There was no impact to financial statements as the Codification requirements are disclosure-only in nature.
Management has evaluated whether any events or transactions occurred subsequent to November 30, 2009 through January 21, 2010, the date of issuance of the Funds’ financial statements, and determined that there were no material events or transactions that would require recognition or disclosure in the Funds’ financial statements.
92
2. Investment Management, Administration Agreements and Other Transactions with Affiliates
In accordance with the terms of its respective Investment Management Agreement, each Fund pays Delaware Management Company (DMC), a series of Delaware Management Business Trust and the investment manager, an annual fee based on each Fund’s average daily net assets as follows:
| | Delaware International | | Delaware Emerging | | Delaware Global |
| | Value Equity Fund | | Markets Fund | | Value Fund |
| On the first $500 million | | 0.85% | | 1.25% | | 0.85% |
| On the next $500 million | | 0.80% | | 1.20% | | 0.80% |
| On the next $1.5 billion | | 0.75% | | 1.15% | | 0.75% |
| In excess of $2.5 billion | | 0.70% | | 1.10% | | 0.70% |
DMC has voluntarily agreed to waive all or a portion of its management fee and reimburse expenses (excluding any 12b-1 plan expenses, taxes, interest, inverse floater program expenses, brokerage fees, short sale and dividend interest expenses, certain insurance costs, and nonroutine expenses or costs including, but not limited to, those relating to reorganizations, litigation, conducting shareholder meetings, and liquidations (collectively, “non-routine expenses”)) in order to prevent total annual fund operating expenses from exceeding, in an aggregate amount, the specified percentages of average daily net assets from September 11, 2009 until such time as the voluntary expense caps are discontinued. These fee waivers and expense reimbursements apply only to expenses paid directly by the Funds, and may be discontinued at any time because they are voluntary. Prior to September 11, 2009, DMC had voluntarily and contractually agreed to waive that portion, if any, of its management fees and reimburse the Funds to the extent necessary to ensure that total annual operating expenses (excluding any 12b-1 plan expenses, taxes, interest, inverse floater program expenses, brokerage fees, certain insurance costs, and non-routine expenses (as defined above), did not exceed the specified percentages of average daily net assets of the Funds.
| | Delaware International | | Delaware Emerging | | Delaware Global |
| | Value Equity Fund | | Markets Fund | | Value Fund |
| Voluntary operating Expense | | | | | | |
| limitation as a percentage of | | | | | | |
| average net assets effective as of | | | | | | |
| September 11, 2009 | | 1.35% | | 1.75% | | 1.30% |
| April 1, 2009 to September 11, 2009 | | | | | | |
| voluntary operating expense | | | | | | |
| limitation as a percentage of | | | | | | |
| average daily net assets | | 1.24% | | 1.61% | | 1.39% |
| Prior to April 1, 2009 contractual/ | | | | | | |
| voluntary operating expense | | | | | | |
| limitation as a percentage of | | | | | | |
| average daily net assets | | 1.10% voluntary | | — | | 1.20% contractual |
93
Notes to financial statements
Delaware International Funds
2. Investment Management, Administration Agreements and Other Transactions with Affiliates (continued)
Delaware Service Company, Inc. (DSC), an affiliate of DMC, provides fund accounting and financial administration oversight services to the Funds. For these services, the Funds pay DSC fees based on the aggregate daily net assets of the Delaware Investments® Family of Funds at the following annual rate: 0.0050% of the first $30 billion; 0.0045% of the next $10 billion; 0.0040% of the next $10 billion; and 0.0025% of aggregate average daily net assets in excess of $50 billion. The fees payable to DSC under the service agreement described above are allocated among all Funds in the Delaware Investments Family of Funds on a relative net asset value basis. For the year ended November 30, 2009, each Fund was charged for these services as follows:
| Delaware International | | Delaware Emerging | | Delaware Global |
| Value Equity Fund | | Markets Fund | | Value Fund |
| $17,851 | | $24,441 | | $1,856 |
DSC also provides dividend disbursing and transfer agency services. The Funds pay DSC a monthly fee based on the number of shareholder accounts for dividend disbursing and transfer agent services.
Pursuant to a distribution agreement and distribution plan, each Fund pays DDLP, the distributor and an affiliate of DMC, an annual distribution and service fee not to exceed 0.30% of the average daily net assets of the Class A shares, 1.00% of the average daily net assets of the Class B and C shares, and 0.60% of the average daily net assets of the Class R shares. Institutional Class shares pay no distribution and service expenses. DDLP has contracted to waive Delaware International Value Equity Fund’s Class R shares’ 12b-1 fee through March 31, 2010 to no more than 0.50% of average daily net assets of the Fund. For Delaware Emerging Markets Fund and Delaware Global Value Fund, DDLP has contracted to limit the Class A shares’ and Class R shares’ 12b-1 fees through March 31, 2010 to no more than 0.25% and 0.50%, respectively, of average daily net assets of each Fund.
At November 30, 2009, the Funds had liabilities payable to affiliates as follows:
| Delaware International | | Delaware Emerging | | Delaware Global |
| Value Equity Fund | | Markets Fund | | Value Fund |
| Investment management fee | | | | | | | | | | | |
| payable to DMC | | $280,632 | | | | $727,243 | | | | $18,863 | |
| Dividend disbursing, transfer | | | | | | | | | | | |
| agent, and fund accounting | | | | | | | | | | | |
| oversight fees and other | | | | | | | | | | | |
| expenses payable to DSC | | 147,248 | | | | 77,521 | | | | 11,798 | |
| Distribution fees payable to DDLP | | 94,375 | | | | 225,318 | | | | 17,590 | |
| Other expenses payable to DMC | | | | | | | | | | | |
| and affiliates* | | 7,022 | | | | 13,451 | | | | 781 | |
*DMC, as part of its administrative services, pays operating expenses on behalf of the Funds and is reimbursed on a periodic basis. Such expenses include items such as printing of shareholder reports, fees for audit, legal and tax services, registration fees and trustees’ fees.
94
As provided in the investment management agreement, the Funds bear the cost of certain legal and tax services, including internal legal and tax services provided to the Funds by DMC and/or its affiliates’ employees. For the year ended November 30, 2009, the Funds were charged for internal legal and tax services provided by DMC and/or its affiliates’ employees as follows:
| Delaware International | | Delaware Emerging | | Delaware Global |
| Value Equity Fund | | Markets Fund | | Value Fund |
| $30,276 | | $40,389 | | $3,123 |
For the year ended November 30, 2009, DDLP earned commissions on sales of Class A shares for each Fund as follows:
| Delaware International | | Delaware Emerging | | Delaware Global |
| Value Equity Fund | | Markets Fund | | Value Fund |
| $11,138 | | $74,759 | | $7,241 |
For the year ended November 30, 2009, DDLP received gross CDSC commissions on redemption of each Fund’s Class A, Class B and Class C shares, respectively, and these commissions were entirely used to offset up-front commissions previously paid by DDLP to broker/dealers on sales of those shares. The amounts received were as follows:
| | Delaware International | | Delaware Emerging | | Delaware Global |
| | Value Equity Fund | | Markets Fund | | Value Fund |
| Class A | | | $ | — | | | | $ | — | | | | $ | — | |
| Class B | | | | 16,349 | | | | | 20,254 | | | | | 7,600 | |
| Class C | | | | 1,858 | | | | | 8,873 | | | | | 1,167 | |
Trustees’ fees include expenses accrued by the Funds for each Trustee’s retainer and meeting fees. Certain officers of DMC, DSC and DDLP are officers and/or Trustees of the Trust. These officers and Trustees are paid no compensation by the Funds.
3. Investments
For year ended November 30, 2009, the Funds made purchases and sales of investment securities other than short-term investments as follows:
| | Delaware International | | Delaware Emerging | | Delaware Global |
| | Value Equity Fund | | Markets Fund | | Value Fund |
| Purchases | | | $122,887,712 | | | | $262,499,607 | | | | $17,452,183 | |
| Sales | | | 259,971,606 | | | | 179,198,852 | | | | 27,000,847 | |
95
Notes to financial statements
Delaware International Funds
3. Investments (continued)
At November 30, 2009, the cost of investments for federal income tax purposes and unrealized appreciation (depreciation) for each Fund were as follows:
| | Delaware International | | Delaware Emerging | | Delaware Global |
| | Value Equity Fund | | Markets Fund | | Value Fund |
| Cost of investments | | | $ | 449,186,321 | | | | | $ | 745,499,649 | | | | | $ | 47,437,531 | | |
| Aggregate unrealized | | | | | | | | | | | | | | | | | | |
| appreciation | | | $ | 41,670,691 | | | | | $ | 122,396,090 | | | | | $ | 4,647,364 | | |
| Aggregate unrealized | | | | | | | | | | | | | | | | | | |
| depreciation | | | | (53,473,693 | ) | | | | | (122,473,353 | ) | | | | | (4,778,606 | ) | |
| Net unrealized depreciation | | | $ | (11,803,002 | ) | | | | $ | (77,263 | ) | | | | $ | (131,242 | ) | |
The Funds apply the provisions, as amended to date, of Accounting Standards Codification 820 (ASC 820), Fair Value Measurements and Disclosures. ASC 820 defines fair value as the price that each Fund would receive to sell an asset or pay to transfer a liability in an orderly transaction between market participants at the measurement date under current market conditions. ASC 820 also establishes a framework for measuring fair value and a three level hierarchy for fair value measurements based upon the transparency of inputs to the valuation of an asset or liability. Inputs may be observable or unobservable and refer broadly to the assumptions that market participants would use in pricing the asset or liability. Observable inputs reflect the assumptions market participants would use in pricing the asset or liability based on market data obtained from sources independent of the reporting entity. Unobservable inputs reflect the reporting entity’s own assumptions about the assumptions that market participants would use in pricing the asset or liability developed based on the best information available under the circumstances. Each Fund’s investment in its entirety is assigned a level based upon the observability of the inputs which are significant to the overall valuation. The three-tier hierarchy of inputs is summarized below.
Level 1 – inputs are quoted prices in active markets
Level 2 – inputs are observable, directly or indirectly
Level 3 – inputs are unobservable and reflect assumptions on the part of the reporting entity
The following table summarizes the valuation of each Fund’s investments by the ASC 820 fair value hierarchy levels as of November 30, 2009:
| | Delaware International Value Equity Fund |
| | Level 1 | | Level 2 | | Level 3 | | Total |
| Common Stock | | $ | 367,055,222 | | $ | — | | $ | — | | $ | 367,055,222 |
| Securities Lending Collateral | | | 51,479,185 | | | 18,782,865 | | | 66,047 | | | 70,328,097 |
| Total | | $ | 418,534,407 | | $ | 18,782,865 | | $ | 66,047 | | $ | 437,383,319 |
| | | | | | | | | | | | |
96
The following is a reconciliation of investments in which significant unobservable inputs (Level 3) were used in determining fair value:
| Securities |
| Lending |
| Collateral |
| Balance as of 11/30/08 | $ | 127,432 | |
| Net change in unrealized appreciation/depreciation | | (61,385 | ) |
| Balance as of 11/30/09 | $ | 66,047 | |
| | | | |
| Net change in unrealized appreciation/depreciation from | | | |
| investments still held as of 11/30/09 | $ | (61,385 | ) |
| | Delaware Emerging Markets Fund |
| | Level 1 | | Level 2 | | Level 3 | | Total |
| Common Stock | | $ | 671,897,767 | | $ | 5,503,242 | | $ | 80,000 | | $ | 677,481,009 |
| Short-Term | | | — | | | 2,014,003 | | | — | | | 2,014,003 |
| Securities Lending Collateral | | | 12,790,702 | | | 6,256,432 | | | 16,843 | | | 19,063,977 |
| Other | | | 45,957,061 | | | — | | | 906,336 | | | 46,863,397 |
| Total | | $ | 730,645,530 | | $ | 13,773,677 | | $ | 1,003,179 | | $ | 745,422,386 |
The following is a reconciliation of investments in which significant unobservable inputs (Level 3) were used in determining fair value:
| | | | Securities | | | | | | | | |
| | Common | | Lending | | | | | | | | |
| | Stock | | Collateral | | Other | | Total |
| Balance as of 11/30/08 | | $ | 55,384 | | | $ | 32,497 | | | $ | 3,327,433 | | | $ | 3,415,314 | |
| Net purchases, sales and settlements | | | — | | | | — | | | | 634,279 | | | | 634,279 | |
| Net transfers in and/or out | | | | | | | | | | | | | | | | |
| of Level 3 | | | (105,246 | ) | | | — | | | | — | | | | (105,246 | ) |
| Net change in unrealized | | | | | | | | | | | | | | | | |
| appreciation/depreciation | | | 129,862 | | | | (15,654 | ) | | | (3,055,376 | ) | | | (2,941,168 | ) |
| Balance as of 11/30/09 | | $ | 80,000 | | | $ | 16,843 | | | $ | 906,336 | | | $ | 1,003,179 | |
| | | | | | | | | | | | | | | | | |
| Net change in unrealized | | | | | | | | | | | | | | | | |
| appreciation/depreciation | | | | | | | | | | | | | | | | |
| from investments still held | | | | | | | | | | | | | | | | |
| as of 11/30/09 | | $ | 129,862 | | | $ | (15,654 | ) | | $ | (3,055,376 | ) | | $ | (2,941,168 | ) |
97
Notes to financial statements
Delaware International Funds
3. Investments (continued)
| | Delaware Global Value Fund |
| | Level 1 | | Level 2 | | Level 3 | | Total |
| Common Stock | | $ | 41,471,056 | | $ | — | | $ | — | | $ | 41,471,056 |
| Short-Term | | | — | | | 38,000 | | | — | | | 38,000 |
| Securities Lending Collateral | | | 3,432,336 | | | 2,358,537 | | | 6,361 | | | 5,797,234 |
| Total | | $ | 44,903,392 | | $ | 2,396,537 | | $ | 6,361 | | $ | 47,306,290 |
The following is a reconciliation of investments in which significant unobservable inputs (Level 3) were used in determining fair value:
| Securities Lending |
| Collateral |
| Balance as of 11/30/08 | | $ | 12,273 | | |
| Net change in unrealized appreciation/depreciation | | | (5,912 | ) | |
| Balance as of 11/30/09 | | $ | 6,361 | | |
| | | | | | |
| Net change in unrealized appreciation/depreciation from | | | | | |
| investments still held as of 11/30/09 | | $ | (5,912 | ) | |
4. Dividend and Distribution Information
Income and long-term capital gain distributions are determined in accordance with federal income tax regulations, which may differ from U.S. GAAP. Additionally, distributions from net gains on foreign currency transactions and net short-term gains on sale of investment securities are treated as ordinary income for federal income tax purposes. The tax character of dividends and distributions paid during the years ended November 30, 2009 and 2008 was as follows:
| | Delaware International | | Delaware Emerging | | Delaware Global |
| | Value Equity Fund | | Markets Fund | | Value Fund |
| Year Ended November 30, 2009: | | | | | | | | | | | |
| Ordinary Income | | | $ | 14,224,832 | | | $ | 5,769,101 | | $ | 892,871 |
| Long-Term Capital Gain | | | | — | | | | 30,990,618 | | | — |
| Total | | | $ | 14,224,832 | | | $ | 36,759,719 | | $ | 892,871 |
| | | | | | | | | | | | |
| Year Ended November 30, 2008: | | | | | | | | | | | |
| Ordinary Income | | | $ | 26,770,568 | | | $ | 137,065,213 | | $ | 2,618,032 |
| Long-Term Capital Gain | | | | 31,089,053 | | | | 130,408,702 | | | 3,772,929 |
| Total | | | $ | 57,859,621 | | | $ | 267,473,915 | | $ | 6,390,961 |
98
5. Components of Net Assets on a Tax Basis
As of November 30, 2009, the components of net assets on a tax basis were as follows:
| Delaware International | | Delaware Emerging | | Delaware Global |
| Value Equity Fund | | Markets Fund | | Value Fund |
| Shares of beneficial interest | | $ | 575,133,862 | | | | $ | 742,744,418 | | | $ | 70,211,914 | |
| Undistributed ordinary income | | | 7,190,693 | | | | | 568,412 | | | | 435,168 | |
| Capital loss carryforwards | | | (206,971,426 | ) | | | | (17,254,268 | ) | | | (29,203,889 | ) |
| Unrealized depreciation of | | | | | | | | | | | | | |
| investments and foreign | | | | | | | | | | | | | |
| currencies | | | (11,792,112 | ) | | | | (151,435 | ) | | | (130,294 | ) |
| Net assets | | $ | 363,561,017 | | | | $ | 725,907,127 | | | $ | 41,312,899 | |
The differences between book basis and tax basis components of net assets are primarily attributable to tax deferral of losses on wash sales, tax treatment of Brazilian foreign taxes and tax treatment of unrealized gain on investments in passive foreign investment companies.
For financial reporting purposes, capital accounts are adjusted to reflect the tax character of permanent book/tax differences. Reclassifications are primarily due to tax treatment of dividends and distributions, gain (loss) on foreign currency transactions, tax treatment of Brazilian and Indian foreign taxes and passive foreign investment companies. Results of operations and net assets were not affected by these reclassifications. For the year ended November 30, 2009, the Funds recorded the following reclassifications:
| Delaware International | | Delaware Emerging | | Delaware Global |
| Value Equity Fund | | Markets Fund | | Value Fund |
| Undistributed net investment income | | $ | (1,103,620 | ) | | | | $ | (1,036,533 | ) | | | | $ | (71,618 | ) | |
| Accumulated net realized loss | | | 1,103,620 | | | | | | 1,036,533 | | | | | | 71,618 | | |
For federal income tax purposes, capital loss carryforwards may be carried forward and applied against future capital gains. Capital loss carryforwards remaining at November 30, 2009, will expire as follows:
| | Delaware International | | Delaware Emerging | | Delaware Global |
| Year of Expiration | | | Value Equity Fund | | Markets Fund | | Value Fund |
| 2016 | | | $ | 93,681,845 | | | | $ | — | | | $ | 16,661,212 |
| 2017 | | | | 113,289,581 | | | | | 17,254,268 | | | | 12,542,677 |
| Total | | | $ | 206,971,426 | | | | $ | 17,254,268 | | | $ | 29,203,889 |
99
Notes to financial statements
Delaware International Funds
6. Capital Shares
Transactions in capital shares were as follows:
| Delaware International | | Delaware Emerging |
| Value Equity Fund | | Markets Fund |
| Year Ended | | Year Ended |
| 11/30/09 | | 11/30/08 | | 11/30/09* | | 11/30/08 |
| Shares sold: | | | | | | | | | | | |
| Class A | 2,197,709 | | | 4,081,000 | | | 12,840,246 | | | 8,851,089 | |
| Class B | 21,758 | | | 34,786 | | | 55,355 | | | 109,987 | |
| Class C | 401,473 | | | 585,093 | | | 4,051,146 | | | 1,979,325 | |
| Class R | 166,581 | | | 75,442 | | | 14 | | | — | |
| Institutional Class | 1,262,813 | | | 5,418,047 | | | 7,136,694 | | | 2,163,823 | |
| | | | | | | | | | | |
| Shares issued upon reinvestment | | | | | | | | | | |
| of dividends and distributions: | | | | | | | | | | |
| Class A | 742,073 | | | 1,606,965 | | | 2,668,520 | | | 8,849,919 | |
| Class B | 35,040 | | | 103,084 | | | 188,080 | | | 613,135 | |
| Class C | 163,027 | | | 451,073 | | | 1,116,696 | | | 3,386,206 | |
| Class R | 5,392 | | | 10,705 | | | — | | | — | |
| Institutional Class | 724,871 | | | 1,505,667 | | | 627,402 | | | 1,504,952 | |
| 5,720,737 | | | 13,871,862 | | | 28,684,153 | | | 27,458,436 | |
| | | | | | | | | | | | |
| Shares repurchased: | | | | | | | | | | | |
| Class A | (11,299,318 | ) | | (11,959,599 | ) | | (11,392,369 | ) | | (20,366,726 | ) |
| Class B | (503,125 | ) | | (826,244 | ) | | (527,776 | ) | | (888,869 | ) |
| Class C | (2,185,490 | ) | | (3,341,698 | ) | | (3,407,744 | ) | | (5,064,594 | ) |
| Class R | (65,226 | ) | | (114,760 | ) | | — | | | — | |
| Institutional Class | (7,590,522 | ) | | (12,701,921 | ) | | (2,018,088 | ) | | (2,773,642 | ) |
| (21,643,681 | ) | | (28,944,222 | ) | | (17,345,977 | ) | | (29,093,831 | ) |
| Net increase (decrease) | (15,922,944 | ) | | (15,072,360 | ) | | 11,338,176 | | | (1,635,395 | ) |
*Delaware Emerging Markets Fund commenced operations of its Class R shares on August 31, 2009.
100
| Delaware Global |
| Value Fund |
| Year Ended |
| 11/30/09 | | 11/30/08 |
| Shares sold: | | | | | |
| Class A | 523,493 | | | 1,010,773 | |
| Class B | 19,784 | | | 101,606 | |
| Class C | 142,949 | | | 367,542 | |
| Institutional Class | 31,791 | | | 92,645 | |
| | | | | |
| Shares issued upon reinvestment | | | | |
| of dividends and distributions: | | | | |
| Class A | 94,020 | | | 308,197 | |
| Class B | 9,567 | | | 43,261 | |
| Class C | 28,301 | | | 164,644 | |
| Institutional Class | 5,727 | | | 12,263 | |
| 855,632 | | | 2,100,931 | |
| | | | | | |
| Shares repurchased: | | | | | |
| Class A | (1,341,180 | ) | | (3,081,696 | ) |
| Class B | (215,484 | ) | | (358,507 | ) |
| Class C | (784,752 | ) | | (1,938,648 | ) |
| Institutional Class | (52,473 | ) | | (119,135 | ) |
| (2,393,889 | ) | | (5,497,986 | ) |
| Net decrease | (1,538,257 | ) | | (3,397,055 | ) |
101
Notes to financial statements
Delaware International Funds
6. Capital Shares (continued)
For the years ended November 30, 2009 and 2008, the following shares and values were converted from Class B shares to Class A shares. The respective amounts are included in Class B redemptions and Class A subscriptions in the table on page 98 thru 99, and the statements of changes in net assets.
| | Year Ended | | Year Ended |
| | 11/30/09 | | 11/30/08 |
| | Class B | | Class A | | | | Class B | | Class A | | |
| | Shares | | Shares | | Value | | Shares | | Shares | | Value |
| Delaware International | | | | | | | | | | | | | |
| Value Equity Fund | | 129,987 | | 128,348 | | $ | 1,156,672 | | 198,385 | | 195,458 | | $ | 2,702,641 |
| Delaware Emerging | | | | | | | | | | | | | | |
| Markets Fund | | 94,572 | | 90,733 | | | 830,970 | | 155,263 | | 150,394 | | | 2,613,941 |
| Delaware Global | | | | | | | | | | | | | | |
| Value Fund | | 52,510 | | 51,739 | | | 322,575 | | 79,339 | | 78,121 | | | 755,853 |
7. Line of Credit
Each Fund, along with certain other funds in the Delaware Investments® Family of Funds (Participants), participates in a $35,000,000 revolving line of credit with The Bank of New York Mellon (BNY Mellon) to be used for temporary or emergency purposes as an additional source of liquidity to fund redemptions of investor shares. Under the agreement, the Participants are charged an annual commitment fee, which is allocated across the Participants on the basis of each Participant’s allocation of the entire facility. The Participants may borrow up to a maximum of one third of their net assets under the agreement. The agreement expires on November 16, 2010. The Funds had no amounts outstanding as of November 30, 2009 or at any time during the year then ended.
8. Foreign Currency Exchange Contracts
The Funds may enter into foreign currency exchange contracts as a way of managing foreign exchange rate risk. Each Fund may enter into these contracts to fix the U.S. dollar value of a security that it has agreed to buy or sell for the period between the date the trade was entered into and the date the security is delivered and paid for. Each Fund may also use these contracts to hedge the U.S. dollar value of securities it already owns that are denominated in foreign currencies. The change in value is recorded as an unrealized gain or loss. When the contract is closed, a realized gain or loss is recorded equal to the difference between the value of the contract at the time it was opened and the value at the time it was closed.
The use of foreign currency exchange contracts does not eliminate fluctuations in the underlying prices of the securities, but does establish a rate of exchange that can be achieved in the future. Although foreign currency exchange contracts limit the risk of loss due to a decline in the value of the hedged currency, they also limit any potential gain that might result should the value of the currency increase. In addition, the Funds could be exposed to risks if the counterparties to the contracts are unable to meet the terms of their contracts. Each Fund’s maximum risk of loss from counterparty
102
credit risk is the value of its currency exchanged with the counterparty. The risk is generally mitigated by having a netting arrangement between a Fund and the counterparty and by the posting of collateral by the counterparty to a Fund to cover a Fund’s exposure to the counterparty.
9. Securities Lending
The Funds, along with other funds in the Delaware Investments® Family of Funds, may lend their securities pursuant to a security lending agreement (Lending Agreement) with BNY Mellon. With respect to each loan, if the aggregate market value of securities collateral held plus cash collateral received on any business day is less than the aggregate market value of the securities which are the subject of such loan, the borrower will be notified to provide additional collateral not less than the applicable collateral requirements. Cash collateral received is generally invested in the Mellon GSL DBT II Collateral Fund (Collective Trust) established by BNY Mellon for the purpose of investment on behalf of clients participating in its securities lending programs. The Collective Trust may invest in fixed income securities, with a weighted average maturity not to exceed 90 days, rated in one of the top three tiers by Standard & Poor’s Ratings Group or Moody’s Investors Service, Inc. or repurchase agreements collateralized by such securities. The Collective Trust seeks to maintain a net asset value per unit of $1.00, but there can be no assurance that it will always be able to do so. At November 30, 2009, the Collective Trust held only cash and assets with a maturity of one business day or less (Cash/Overnight Assets). The Funds may incur investment losses as a result of investing securities lending collateral in the Collective Trust. This could occur if an investment in the Collective Trust defaulted or if it were necessary to liquidate assets in the Collective Trust to meet returns on outstanding security loans at a time when the Collective Trust’s net asset value per unit was less than $1.00. Under those circumstances, the Funds may not receive an amount from the Collective Trust that is equal in amount to the collateral the Funds would be required to return to the borrower of the securities and the Funds would be required to make up for this shortfall. Effective April 20, 2009, BNY Mellon transferred the assets of the Collective Trust other than the Cash/Overnight Assets to the BNY Mellon SL DBT II Liquidating Fund (Liquidating Fund), effectively bifurcating the collateral investment pool. The Funds’ exposure to the Liquidating Fund is expected to decrease as the Liquidating Fund’s assets mature or are sold. In October 2008, BNY Mellon transferred certain distressed securities from the Collective Trust into the Mellon GSL Reinvestment Trust II. The Funds can also accept U.S. government securities and letters of credit (non-cash collateral) in connection with securities loans. In the event of default or bankruptcy by the lending agent, realization and/or retention of the collateral may be subject to legal proceedings. In the event the borrower fails to return loaned securities and the collateral received is insufficient to cover the value of the loaned securities and provided such collateral shortfall is not the result of investment losses, the lending agent has agreed to pay the amount of the shortfall to the Funds, or at the discretion of the lending agent, replace the loaned securities. The Funds continue to record dividends or interest, as applicable, on the securities loaned and are subject to change in value of the securities loaned that may occur during the term of the loan. The Funds have the right under the Lending Agreement to recover the securities from the borrower on demand. With respect to
103
Notes to financial statements
Delaware International Funds
9. Securities Lending (continued)
security loans collateralized by non-cash collateral, the Funds receive loan premiums paid by the borrower. With respect to security loans collateralized by cash collateral, the earnings from the collateral investments are shared among the Funds, the security lending agent and the borrower. The Funds record security lending income net of allocations to the security lending agent and the borrower.
At November 30, 2009, the value of securities on loan for which cash collateral was received and invested in accordance with the Lending Agreement was as follows:
| Delaware International | | Delaware Emerging | | Delaware Global |
| Value Equity Fund | | Markets Fund | | Value Fund |
| | | $ | 67,324,748 | | | | $ | 18,908,148 | | | | $ | 5,751,614 | |
At November 30, 2009, the value of invested collateral for each Fund was as follows:
| Delaware International | | Delaware Emerging | | Delaware Global |
| Value Equity Fund | | Markets Fund | | Value Fund |
| | $ | 70,328,097 | | | | $ | 19,063,977 | | | | $ | 5,797,234 | |
Such investments are presented on the statements of net assets under the caption “Securities Lending Collateral.”
10. Credit and Market Risk
Some countries in which the Funds may invest require governmental approval for the repatriation of investment income, capital or the proceeds of sales of securities by foreign investors. In addition, if there is deterioration in a country’s balance of payments or for other reasons, a country may impose temporary restrictions on foreign capital remittances abroad.
The securities exchanges of certain foreign markets are substantially smaller, less liquid and more volatile than the major securities markets in the United States. Consequently, acquisition and disposition of securities by the Funds may be inhibited. In addition, a significant proportion of the aggregate market value of equity securities listed on the major securities exchanges in emerging markets are held by a smaller number of investors. This may limit the number of shares available for acquisition or disposition by the Funds.
Each Fund may invest up to 15% of its net assets in illiquid securities, which may include securities with contractual restrictions on resale, securities exempt from registration under Rule 144A of the Securities Act of 1933, as amended, and other securities which may not be readily marketable. The relative illiquidity of these securities may impair each Fund from disposing of them in a timely
104
manner and at a fair price when it is necessary or desirable to do so. While maintaining oversight, the Funds’ Board has delegated to DMC the day-to-day functions of determining whether individual securities are liquid for purposes of the Funds’ limitation on investments in illiquid assets. Securities eligible for resale pursuant to Rule 144A, which are determined to be liquid, are not subject to the Funds’ limitation on investments in illiquid assets. Rule 144A and illiquid securities have been identified on the statements of net assets.
11. Contractual Obligations
The Funds enter into contracts in the normal course of business that contain a variety of indemnifications. The Funds’ maximum exposure under these arrangements is unknown. However, the Funds have not had prior claims or losses pursuant to these contracts. Management has reviewed the Funds’ existing contracts and expects the risk of loss to be remote.
12. Sale of Delaware Investments to Macquarie Group
On August 18, 2009, Lincoln National Corporation (parent company of Delaware Investments) and Macquarie Group (Macquarie) entered into an agreement pursuant to which Delaware Investments, including DMC, DDLP and DSC, would be acquired by Macquarie, an Australia-based global provider of banking, financial, advisory, investment and funds management services (Transaction). The Transaction was completed on January 4, 2010. DMC, DDLP and DSC are now wholly owned subsidiaries of Macquarie.
The Transaction resulted in a change of control of DMC which, in turn, caused the termination of the investment advisory agreement between DMC and the Fund. On January 4, 2010, the new investment advisory agreement between DMC and the Fund that was approved by the shareholders became effective for Delaware International Value Equity Fund and Delaware Global Value Fund.
For Delaware Emerging Markets Fund, a Special Meeting of Shareholders (Meeting) of the Fund was called for the purpose of asking shareholders to approve a new investment advisory agreement between DMC and the Fund (New Agreement). The proxy solicitation with respect to the Fund is still in progress. As noted in the proxy materials relating to the Meeting, DMC will continue to serve as investment adviser to the Fund under an interim advisory agreement pending the conclusion of the Meeting.
13. Tax Information (Unaudited)
The information set forth below is for each Fund’s fiscal year as required by federal income tax laws. Shareholders, however, must report distributions on a calendar year basis for income tax purposes, which may include distributions for portions of two fiscal years of a fund. Accordingly, the information needed by shareholders for income tax purposes will be sent to them in January of each year. Please consult your tax advisor for proper treatment of this information.
105
Notes to financial statements
Delaware International Funds
13. Tax Information (Unaudited) (continued)
For the fiscal year ended November 30, 2009, each Fund designates distributions paid during the year as follows:
| (A) | | (B) | | | | | | | | |
| Long-Term | | Ordinary | | | | | | | | |
| Capital Gains | | Income | | Total | | (C) |
| Distributions | | Distributions* | | Distributions | | Qualifying |
| (Tax Basis) | | (Tax Basis) | | (Tax Basis) | | Dividends1 |
| Delaware International Value | | | | | | | | | | | | | | | |
| Equity Fund | | — | | | 100.00 | % | | 100.00 | % | | | — | |
| Delaware Emerging Markets Fund | | 84.31 | % | | | 15.69 | % | | 100.00 | % | | | 2.33 | % | |
| Delaware Global Value Fund | | — | | | 100.00 | % | | 100.00 | % | | | 4.39 | % | |
(A) and (B) are based on a percentage of each Fund’s total distributions.
(C) is based on a percentage of each Fund’s ordinary income distributions.
1Qualifying dividends represent dividends which qualify for the corporate dividends received deduction.
*For the fiscal year ended November 30, 2009, certain dividends paid by the Funds may be subject to a maximum tax rate of 15%, as provided for by the Jobs and Growth Tax Relief Reconciliation Act of 2003. The Funds intend to designate the following amounts to be taxed at a maximum rate of 15%. Complete information will be computed and reported in conjunction with your 2009 Form 1099-DIV. The amounts paid for the year ended November 30, 2009 were as follows:
| Delaware International | | Delaware Emerging | | Delaware Global |
| Value Equity Fund | | Markets Fund | | Value Fund |
| | $ | 7,010,504 | | | | $ | 5,769,101 | | | | $ | 669,419 | |
Delaware International Value Equity Fund, Delaware Emerging Markets Fund, and Delaware Global Value Fund intend to pass through foreign tax credits in the maximum amount of $605,269, $545,864, and $40,813 respectively. The gross foreign source income earned during the fiscal year 2009 by the Delaware International Value Equity Fund, Delaware Emerging Markets Fund, and Delaware Global Value Fund was $13,131,228, $12,171,248, and $818,348. Complete information will be computed and reported in conjunction with your 2009 Form 1099-DIV.
For the fiscal year ended November 30, 2009, certain dividends paid by the Funds have been determined to be Interest related dividends and may be subject to relief from U.S. withholding for foreign shareholders, as provided by the American Jobs Creation Act of 2004. For the fiscal year ended November 30, 2009, the Funds have designated maximum Qualified Interest Income distributions as follows:
| Delaware International | | Delaware Emerging | | Delaware Global |
| Value Equity Fund | | Markets Fund | | Value Fund |
| Qualified Interest Income | | $ | 1,353 | | | | $ | 2,181 | | | | $ | 173 | |
106
Report of independent
registered public accounting firm
To the Shareholders and Board of Trustees
Delaware Group Global & International Funds
We have audited the accompanying statement of net assets of Delaware Group Global & International Funds (comprising the Delaware International Value Equity Fund, Delaware Emerging Markets Fund, and Delaware Global Value Fund) (“the Funds”) as of November 30, 2009, and the related statements of operations for the year then ended, the statements of changes in net assets for each of the two years in the period then ended, and the financial highlights for each of the five years in the period then ended. These financial statements and financial highlights are the responsibility of the Funds’ management. Our responsibility is to express an opinion on these financial statements and financial highlights based on our audits.
We conducted our audits in accordance with the standards of the Public Company Accounting Oversight Board (United States). Those standards require that we plan and perform the audit to obtain reasonable assurance about whether the financial statements and financial highlights are free of material misstatement. We were not engaged to perform an audit of the Funds’ internal control over financial reporting. Our audits included consideration of internal control over financial reporting as a basis for designing audit procedures that are appropriate in the circumstances, but not for the purpose of expressing an opinion on the effectiveness of the Funds’ internal control over financial reporting. Accordingly, we express no such opinion. An audit also includes examining, on a test basis, evidence supporting the amounts and disclosures in the financial statements and financial highlights, assessing the accounting principles used and significant estimates made by management, and evaluating the overall financial statement presentation. Our procedures included confirmation of securities owned as of November 30, 2009 by correspondence with the custodian and brokers or by other appropriate auditing procedures where replies from brokers were not received. We believe that our audits provide a reasonable basis for our opinion.
In our opinion, the financial statements and financial highlights referred to above present fairly, in all material respects, the financial position of each of the respective funds constituting the Delaware Group Global & International Funds at November 30, 2009, the results of their operations for the year then ended, the changes in their net assets for each of the two years in the period then ended, and their financial highlights for each of the five years in the period then ended, in conformity with U.S. generally accepted accounting principles.
Philadelphia, Pennsylvania
January 21, 2010
107
Other Fund information
(Unaudited)
Delaware International Funds
Board Consideration of New Investment Advisory Agreement
At a meeting held on September 3, 2009 (the “Meeting”), the Board of Trustees of the Delaware Investments Family of Funds (the “Board”), including a majority of independent Trustees, approved a new investment advisory agreement between each registrant on behalf of each series (each, a “Fund” and together, the “Funds”) and Delaware Management Company (“DMC”) in connection with the sale of Delaware Investments’ advisory business to Macquarie Bank Limited (the “Macquarie Group”) (the “Transaction”). In making its decision, the Board considered information furnished specifically in connection with the approval of the new investment advisory agreements with DMC (the “New Investment Advisory Agreements”) which included extensive materials about the Transaction and matters related to the proposed approvals. To assist the Board in considering the New Investment Advisory Agreements, Macquarie Group provided materials and information about Macquarie Group, including detailed written responses to the questions posed by the independent Trustees. DMC also provided materials and information about the Transaction, including detailed written responses to the questions posed by the independent Trustees.
At the Meeting, the Trustees discussed the Transaction with DMC management and with key Macquarie Group representatives. The Meeting included discussions of the strategic rationale for the Transaction and Macquarie Group’s general plans and intentions regarding the Funds and DMC. The Board members also inquired about the plans for, and anticipated roles and responsibilities of, key employees and officers of Delaware Management Holdings Inc. and DMC in connection with the Transaction.
In connection with the Trustees’ review of the New Investment Advisory Agreements for the Funds, DMC and/or Macquarie Group emphasized that:
- They expected that there would be no adverse changes as a result of the Transaction, in the nature, quality, or extent of services currently provided to the Funds and their shareholders, including investment management, distribution, or other shareholder services.
- No material changes in personnel or operations were contemplated in the operation of DMC under Macquarie Group as a result of the Transaction and no material changes were currently contemplated in connection with third party service providers to the Funds.
- Macquarie Group had no intention to cause DMC to alter the voluntary expense waivers and reimbursements currently in effect for the Funds.
- Under the agreement between Macquarie Group and Lincoln National Corporation (“LNC”) (the “Transaction Agreement”), Macquarie Group has agreed to conduct, and to cause its affiliates to conduct, their respective businesses in compliance with the conditions of Section 15(f) of the Investment Company Act of 1940 (the “1940 Act”) with respect to the Funds, to the extent within its control, including maintaining Board composition of at least 75% of the Board members qualifying as independent Trustees and not imposing any “unfair burden” on the Funds for at least two years from the closing of the Transaction (the “Closing”).
108
In addition to the information provided by DMC and Macquarie Group as described above, the Trustees also considered all other factors they believed to be relevant to evaluating the New Investment Advisory Agreements, including the specific matters discussed below. In their deliberations, the Trustees did not identify any particular information that was controlling, and different Trustees may have attributed different weights to the various factors. However, for each Fund, the Trustees determined that the overall arrangements between the Fund and DMC, as provided in the respective New Investment Advisory Agreement, including the proposed advisory fee and the related administration arrangements between the Fund and DMC, were fair and reasonable in light of the services to be performed, expenses incurred, and such other matters as the Trustees considered relevant. Factors evaluated included:
- The potential for expanding distribution of Fund shares through access to Macquarie Group’s existing distribution channels;
- Delaware Investments’ acquisition of an exclusive wholesaling sales force from a subsidiary of LNC;
- The reputation, financial strength, and resources of Macquarie Group as well as its historic and ongoing commitment to the asset management business in Australia as well as other parts of the world;
- The terms and conditions of the New Investment Advisory Agreements, including that each Fund’s total contractual fee rate under the New Investment Advisory Agreement will remain the same;
- The Board’s full annual review (or initial approval) of the current investment advisory agreements at their in-person meeting in May 2009 as required by the 1940 Act and its determination that (i) DMC had the capabilities, resources, and personnel necessary to provide the satisfactory advisory and administrative services currently provided to each Fund and (ii) the advisory and/or management fees paid by each Fund, taking into account any applicable fee waivers and breakpoints, represented reasonable compensation to DMC in light of the services provided, the costs to DMC of providing those services, economies of scale, and the fees and other expenses paid by similar funds and such other matters that the Board considered relevant in the exercise of its reasonable judgment;
- The portfolio management teams for the Funds are not currently expected to change as a result of the Transaction;
- LNC and Macquarie Group were expected to execute a reimbursement agreement pursuant to which LNC and Macquarie Group would agree to pay (or reimburse) all reasonable out-of-pocket costs and expenses of the Funds in connection with the Board’s consideration of the Transaction, the New Investment Advisory Agreements and related agreements, and all costs related to the proxy solicitation (the “Expense Agreement”);
109
Other Fund information
(Unaudited)
Delaware International Funds
Board Consideration of New Investment Advisory Agreement (continued)
- The likelihood that Macquarie Group would invest additional amounts in Delaware Investments, including DMC, which could result in increased assets under management, which in turn would allow some Funds the potential opportunity to achieve economies of scale and lower fees payable by Fund shareholders; and
- The compliance and regulatory history of Macquarie Group and its affiliates.
In making their decision relating to the approval of each Fund’s New Investment Advisory Agreement, the independent Trustees gave attention to all information furnished. The following discussion, however, identifies the primary factors taken into account by the Trustees and the conclusions reached in approving the New Investment Advisory Agreements.
Nature, Extent, and Quality of Service. The Trustees considered the services historically provided by DMC to the Funds and their shareholders. In reviewing the nature, extent, and quality of services, the Board considered that the New Investment Advisory Agreements would be substantially similar to the current investment advisory agreements between the Funds and DMC (the “Current Investment Advisory Agreements”), and therefore, considered the many reports furnished to them throughout 2008 and 2009 at regular Board meetings covering matters such as the relative performance of the Funds; compliance of portfolio managers with the investment policies, strategies, and restrictions for the Funds; the compliance of management personnel with the code of ethics adopted throughout the Delaware Investments Family of Funds complex; and the adherence to fair value pricing procedures as established by the Board. The Trustees were pleased with the current staffing of DMC and the emphasis placed on research and risk management in the investment process. Favorable consideration was given to DMC’s efforts to maintain expenditures and, in some instances, increase financial and human resources committed to Fund matters.
The Board also considered the transfer agent and shareholder services that would continue to be provided to Fund shareholders by DMC’s affiliate, Delaware Service Company, Inc. (“DSC”). The Trustees noted, in particular, DSC’s commitment to maintain a high level of service as well as DMC’s expenditures to improve the delivery of shareholder services. The Board was assured that shareholders would continue to receive the benefits provided to Fund shareholders by being part of the Delaware Investments Family of Funds, including each shareholder’s ability to exchange an investment in one Delaware Investments Fund for the same class of shares in another Delaware Investments Fund without a sales charge, to reinvest Fund dividends into additional shares of any of the Funds, and the privilege to combine holdings in other Funds to obtain a reduced sales charge.
Based on the information provided by DMC and Macquarie Group, including that Macquarie Group and DMC currently expected no material changes as a result of the Transaction in (i) personnel or operations of DMC or (ii) third party service providers to the Funds, the Board concluded that the satisfactory nature, extent, and quality of services currently provided to the Funds and their shareholders were very likely to continue under the New Investment Advisory
110
Agreements. Moreover, the Board concluded that the Funds would probably benefit from the expanded distribution resources that would become available to Delaware Investments following the Transaction. The Board also concluded that it was very unlikely that any “unfair burden” would be imposed on any of the Funds for the first two years following the Closing as a result of the Transaction. Consequently, the Board concluded that it did not expect the Transaction to result in any adverse changes in the nature, quality, or extent of services (including investment management, distribution or other shareholder services) currently provided to the Funds and their shareholders.
Investment Performance. The Board considered the overall investment performance of DMC and the Funds. The Trustees placed significant emphasis on the investment performance of the Funds in view of its importance to shareholders. Although the Trustees gave appropriate consideration to performance reports and discussions with portfolio managers at Board meetings throughout the year, the Trustees gave particular weight to their review of investment performance in connection with the approval of the Current Investment Advisory Agreements at the Board meeting held in May 2009. At that meeting, the Trustees reviewed reports prepared by Lipper, Inc., an independent statistical compilation organization (“Lipper”), which showed each Fund’s investment performance as of December 31, 2008 in comparison to a group of funds selected by Lipper as being similar to the Fund (the “Performance Universe”). During the May 2009 agreement review process, the Trustees observed the significant improvements to relative investment performance of the Funds compared to the Funds’ performance as of December 31, 2007.
At their meeting on September 3, 2009, the Trustees, including the independent Trustees in consultation with their independent counsel, reviewed the investment performance of each Fund. The Trustees compared the performance of each Fund relative to that of its respective Performance Universe for the 1-, 3-, 5-, and 10-year periods ended June 30, 2009 and compared its relative investment performance against the corresponding relative investment performance of each Fund for such time periods ended December 31, 2008, to the extent applicable. As of June 30, 2009, 30 of the Funds had investment performance relative to that of the respective Performance Universe that was better than the corresponding relative investment performance at December 31, 2008 for all applicable time periods. At June 30, 2009, an additional 6 Funds had investment performance relative to that of their respective Performance Universe that was better than the corresponding relative investment performance at December 31, 2008 for a majority of the applicable time periods. At June 30, 2009, 15 additional Funds had investment performance relative to that of their respective Performance Universe that was better than the corresponding relative performance at December 31, 2008 and only 29 Funds had poorer relative investment performance at June 30, 2009 compared to that at December 31, 2008.
The Board therefore concluded that the investment performance of the Funds, on an aggregate basis, had continued to improve relative to their respective Performance Universe since the data reviewed at the May 2009 meeting. Based on information provided by DMC and Macquarie Group, the Board concluded that neither the Transaction nor the New Investment Advisory
111
Other Fund information
(Unaudited)
Delaware International Funds
Board Consideration of New Investment Advisory Agreement (continued)
Agreement would likely have an adverse effect on the investment performance of any Fund because (i) DMC and Macquarie Group did not currently expect the Transaction to cause any material change to the Funds’ portfolio management teams responsible for investment performance, which the Board found to be satisfactory and improving; and (ii) as discussed in more detail below, the Funds’ expenses were not expected to increase as a result of the Transaction.
Comparative Expenses. The Trustees also considered expense comparison data for the Funds previously provided in May 2009. At that meeting, DMC had provided the Board with information on pricing levels and fee structures for the Funds and comparative funds. The Trustees focused on the comparative analysis of the effective management fees and total expense ratios of each Fund versus the effective management fees and expense ratios of a group of funds selected by Lipper as being similar to each Fund (the “Expense Group”). In reviewing comparative costs, each Fund’s contractual management fee and the actual management fee incurred by the Fund were compared with the contractual management fees (assuming all funds in the Expense Group were similar in size to the Fund) and actual management fees (as reported by each fund) of other funds within the Expense Group, taking into account any applicable breakpoints and fee limitations. Each Fund’s total expenses were also compared with those of its Expense Group. The Trustees also considered fees paid to Delaware Investments for nonmanagement services. At the September 3, 2009 meeting, DMC advised the Board that the more recent comparative expenses for the Funds remained consistent with the previous review in May 2009 and, consequently, the Trustees concluded that expenses of the Funds were satisfactory.
The Board also considered the Expense Agreement under negotiation in evaluating Fund expenses. The Trustees expected that the Expense Agreement would provide that LNC and Macquarie Group would pay or reimburse the Trusts for all reasonable out-of-pocket costs and expenses in connection with the Transaction and the consideration of the New Investment Advisory Agreements (subject to certain limited exceptions).
Based on information provided by DMC and Macquarie Group, the Board concluded that neither the Transaction nor the New Investment Advisory Agreements likely would have an adverse effect on the Funds’ expenses because (i) each Fund’s contractual fee rates under the New Investment Advisory Agreement would remain the same; (ii) under the Expense Agreement, the Funds would be reimbursed for all reasonable out-of-pocket costs and expenses in connection with the Transaction and the related proxy solicitation (subject to certain limited exceptions); and (iii) the expense ratios of certain Funds might decline as a result of the possible increased investment in Delaware Investments by Macquarie Group, as discussed below under “Economies of Scale.”
Management Profitability. At their meeting on September 3, 2009, the Board evaluated DMC’s profitability in connection with the operation of the Funds. The Board had previously considered DMC’s profitability in connection with the operation of the Funds at its May 2009 meeting. At that meeting, the Board reviewed an analysis that addressed the overall profitability of
112
Delaware Investments’ business in providing management and other services to each of the Funds and the Delaware Investments Family of Funds as a whole. Specific attention was given to the methodology followed in allocating costs for the purpose of determining profitability.
At the May 2009 meeting, representatives of DMC had stated that the level of profits of DMC, to a certain extent, reflect operational cost savings and efficiencies initiated by Delaware Investments (including DMC and its affiliates that provide services to the Funds). The Board considered Delaware Investments’ efforts to improve services provided to Fund shareholders and to meet additional regulatory and compliance requirements resulting from recent industry-wide U.S. Securities and Exchange Commission initiatives. At that meeting, the Board found that the management fees were reasonable in light of the services rendered and the level of profitability of DMC. At the September 3, 2009 meeting, DMC advised the Board that DMC did not expect the Transaction to affect materially the profitability of Delaware Investments compared to the level of profitability considered during the May 2009 review. Moreover, the Trustees reviewed pro forma balance sheets of certain key companies in Delaware Investments as of June 30, 2009 (which were provided by Macquarie Group and DMC in response to the Trustees’ requests) and evaluated the projections of Delaware Investments’ capitalization following the Transaction for purposes of evaluating the financial ability of Delaware Investments to continue to provide the nature, extent, and quality of services as it had under the Current Investment Advisory Agreement.
Based on information provided by DMC and Macquarie Group, the Board concluded that DMC and Delaware Investments would be sufficiently capitalized following the Transaction to continue the same level and quality of services to the Funds under the New Investment Advisory Agreements as was the case under the Current Investment Advisory Agreements. The Board also concluded that Macquarie Group had sufficient financial strength and resources, as well as an ongoing commitment to a global asset management business, to continue investing in Delaware Investments, including DMC, to the extent that Macquarie Group determined it was appropriate. Finally, because services and costs were expected to be substantially the same (and DMC had represented that, correspondingly, profitability would be about the same), under the New Investment Advisory Agreements as under the Current Investment Advisory Agreements, the Trustees concluded that the profitability of Delaware Investments would not result in an inequitable charge on the Funds or their shareholders. Accordingly, the Board concluded that the fees charged under the New Investment Advisory Agreements would be reasonable in light of the services to be provided and the expected profitability of DMC.
Economies of Scale. The Trustees considered whether economies of scale would be realized by Delaware Investments as each Fund’s assets increase and the extent to which any economies of scale would be reflected in the management fees charged. The Trustees took into account DMC’s practice of maintaining the competitive nature of management fees based on its analysis of fees charged by comparable funds. DMC management believed, and the Board agreed, that the Funds were priced with breakpoints and relatively low management fees to reflect potential economies of scale to Fund shareholders.
113
Other Fund information
(Unaudited)
Delaware International Funds
Board Consideration of New Investment Advisory Agreement (continued)
The Board also acknowledged Macquarie Group’s statement that the Transaction would not by itself immediately provide additional economies of scale given Macquarie Group’s limited presence in the U.S. mutual fund market. Nonetheless, the Trustees concluded that additional economies of scale could potentially be achieved in the future if DMC were owned by Macquarie Group as a result of Macquarie Group’s willingness to invest further in Delaware Investments if appropriate opportunities arise. The Board further concluded that potential economies of scale could be achieved as a result of Delaware Investments’ expanded distribution capabilities arising from the Transaction, as well as opportunities that might arise from Macquarie Group’s global asset management business.
Fall-Out Benefits. The Board acknowledged that DMC would continue to benefit from soft dollar arrangements using portfolio brokerage of each Fund that invests in equity securities and that DMC’s profitability would likely be somewhat lower without the benefit of practices with respect to allocating Fund portfolio brokerage for brokerage and research services. The Board also considered that Macquarie Group and Delaware Investments may derive reputational, strategic, and other benefits from their association with the Delaware Investments Family of Funds, including service relationships with DMC, DSC, and Delaware Distributors, L.P., and evaluated the extent to which Delaware Investments might derive ancillary benefits from Fund operations, including the potential for procuring additional business as a result of the prestige and visibility associated with its role as service provider to the Delaware Investments Family of Funds and the benefits from allocation of Fund brokerage to improve trading efficiencies. However, the Board concluded that (i) any such benefits under the New Investment Advisory Agreements would not be dissimilar from those existing under the Current Investment Advisory Agreements; (ii) such benefits did not impose a cost or burden on the Funds or their shareholders; and (iii) such benefits would probably have an indirectly beneficial effect on the Funds and their shareholders because of the added importance that DMC and Macquarie Group might attach to the Funds as a result of the fall-out benefits that the Funds conveyed.
Board Review of Macquarie Group. The Trustees reviewed detailed information supplied by Macquarie Group about its operations as well as other information regarding Macquarie Group provided by independent legal counsel to the independent Trustees. Based on this review, the Trustees concluded that Delaware Investments would continue to have the financial ability to maintain the high quality of services required by the Funds. The Trustees noted that there would be a limited transition period during which some services previously provided by LNC to Delaware Investments would continue to be provided by LNC after the Closing, and concluded that this arrangement would help minimize disruption in Delaware Investments’ provision of services to the Funds following the Transaction.
114
The Board considered Macquarie Group’s support for Delaware Investments’ plans for Fund distribution by transferring wholesalers from Lincoln Financial Distributors, Inc., LNC’s retail distributor, to Delaware Investments, and Macquarie Group’s current intention to leave the Funds’ other service providers in place. The Board also considered Macquarie Group’s current strategic plans to increase its asset management activities, one of its core businesses, particularly in North America, and its statement that its acquisition of DMC is an important component of this strategic growth and the establishment of a significant presence in the United States. Based in part on the information provided by DMC and Macquarie Group, the Board concluded that Macquarie Group’s acquisition of Delaware Investments could potentially enhance the nature, quality, and extent of services provided to the Funds and their shareholders.
Conclusion. The Board concluded that the advisory fee rate under each New Investment Advisory Agreement was reasonable in relation to the services provided and that execution of the New Investment Advisory Agreement would be in the best interests of the shareholders. For each Fund, the Trustees noted that they had concluded in their most recent advisory agreement continuance considerations in May 2009 that the management fees and total expense ratios were at acceptable levels in light of the quality of services provided to the Funds and in comparison to those of the Funds’ respective peer groups; that the advisory fee schedule would not be increased and would stay the same for all of the Funds; that the total expense ratio had not changed materially since that determination; and that DMC had represented that the overall expenses for each Fund were not expected to be adversely affected by the Transaction. The Trustees also noted, with respect to the Funds that currently had the benefit of voluntary fee limitations, that Macquarie Group had no present intention to cause DMC to alter any voluntary expense limitations or reimbursements currently in effect. On that basis, the Trustees concluded that the total expense ratios and proposed advisory fees for the Funds anticipated to result from the Transaction were acceptable. In approving each New Investment Advisory Agreement, the Board stated that it anticipated reviewing the continuance of the New Investment Advisory Agreement in advance of the expiration of the initial two-year period.
115
Board of trustees/directors and officers addendum
Delaware Investments® Family of Funds
A mutual fund is governed by a Board of Trustees/Directors (“Trustees”), which has oversight responsibility for the management of a fund’s business affairs. Trustees establish procedures and oversee and review the performance of the investment manager, the distributor, and others who perform services for the fund. The independent fund trustees, in particular, are advocates
| Name, Address, | | Position(s) | | Length of |
| and Birth Date | | Held with Fund(s) | | Time Served |
| Interested Trustees | | | | |
| |
| Patrick P. Coyne1 | | Chairman, President, | | Chairman and Trustee |
| 2005 Market Street | | Chief Executive Officer, | | since August 16, 2006 |
| Philadelphia, PA 19103 | | and Trustee | | |
| April 1963 | | | | President and |
| | | | Chief Executive Officer |
| | | | since August 1, 2006 |
| | | | | |
| Independent Trustees | | | | |
| |
| Thomas L. Bennett | | Trustee | | Since March 2005 |
| 2005 Market Street | | | | |
| Philadelphia, PA 19103 | | | | |
| October 1947 | | | | |
| |
| |
| |
| John A. Fry | | Trustee | | Since January 2001 |
| 2005 Market Street | | | | |
| Philadelphia, PA 19103 | | | | |
| May 1960 | | | | |
| |
| |
| |
| |
| Anthony D. Knerr | | Trustee | | Since April 1990 |
| 2005 Market Street | | | | |
| Philadelphia, PA 19103 | | | | |
| December 1938 | | | | |
| |
| |
| Lucinda S. Landreth | | Trustee | | Since March 2005 |
| 2005 Market Street | | | | |
| Philadelphia, PA 19103 | | | | |
| June 1947 | | | | |
| | | | | |
1 Patrick P. Coyne is considered to be an “Interested Trustee” because he is an executive officer of the Fund’s(s’) investment advisor.
116
for shareholder interests. Each trustee has served in that capacity since he or she was elected to or appointed to the Board of Trustees, and will continue to serve until his or her retirement or the election of a new trustee in his or her place. The following is a list of the Trustees and Officers with certain background and related information.
| |
| | Number of Portfolios in | | |
| Principal Occupation(s) | | Fund Complex Overseen | | Other Directorships |
| During Past 5 Years | | by Trustee or Officer | | Held by Trustee or Officer |
| |
| |
| Patrick P. Coyne has served in | | 80 | | Director |
| various executive capacities | | | | Kaydon Corp. |
| at different times at | | | | |
| Delaware Investments.2 | | | | |
| |
| |
| |
| |
| |
| Private Investor | | 80 | | Director |
| (March 2004–Present) | | | | Bryn Mawr Bank Corp. (BMTC) |
| | | | (April 2007–Present) |
| Investment Manager | | | | |
| Morgan Stanley & Co. | | | | |
| (January 1984–March 2004) | | | | |
| |
| President | | 80 | | Director |
| Franklin & Marshall College | | | | Community Health Systems |
| (June 2002–Present) | | | | |
| |
| Executive Vice President | | | | |
| University of Pennsylvania | | | | |
| (April 1995–June 2002) | | | | |
| |
| Founder and | | 80 | | None |
| Managing Director | | | | |
| Anthony Knerr & Associates | | | | |
| (Strategic Consulting) | | | | |
| (1990–Present) | | | | |
| |
| Chief Investment Officer | | 80 | | None |
| Assurant, Inc. (Insurance) | | | | |
| (2002–2004) | | | | |
| | | | | |
| | | | | |
2 Delaware Investments is the marketing name for Delaware Management Holdings, Inc. and its subsidiaries, including the Fund’s(s’) investment advisor, principal underwriter, and its transfer agent.
117
Board of trustees/directors and officers addendum
Delaware Investments® Family of Funds
| Name, Address, | | Position(s) | | Length of |
| and Birth Date | | Held with Fund(s) | | Time Served |
| Independent Trustees (continued) | | | | |
| |
| Ann R. Leven | | Trustee | | Since October 1989 |
| 2005 Market Street | | | | |
| Philadelphia, PA 19103 | | | | |
| November 1940 | | | | |
| |
| Thomas F. Madison | | Trustee | | Since May 19973 |
| 2005 Market Street | | | | |
| Philadelphia, PA 19103 | | | | |
| February 1936 | | | | |
| | | | | |
| | | | | |
| | | | | |
| | | | | |
| | | | | |
| | | | | |
| | | | | |
| | | | | |
| | | | | |
| | | | | |
| | | | | |
| | | | | |
| | | | | |
| | | | | |
| | | | | |
| | | | | |
| | | | | |
| | | | | |
| | | | | |
| | | | | |
| | | | | |
| | | | | |
| | | | | |
3 In 1997, several funds managed by Voyageur Fund Managers, Inc. (the “Voyageur Funds”) were incorporated into the Delaware Investments Family of Funds. Mr. Madison served as a director of the Voyageur Funds from 1993 until 1997.
118
| | Number of Portfolios in | | |
| Principal Occupation(s) | | Fund Complex Overseen | | Other Directorships |
| During Past 5 Years | | by Trustee or Officer | | Held by Trustee or Officer |
| |
| |
| Consultant | | 80 | | None |
| ARL Associates | | | | |
| (Financial Planning) | | | | |
| (1983–Present) | | | | |
| |
| President and | | 80 | | Director and Chair of |
| Chief Executive Officer | | | | Compensation Committee, |
| MLM Partners, Inc. | | | | Governance Committee |
| (Small Business Investing | | | | Member |
| and Consulting) | | | | CenterPoint Energy |
| (January 1993–Present) | | | | |
| | | | Lead Director and Chair of |
| | | | Audit and Governance |
| | | | Committees, Member of |
| | | | Compensation Committee |
| | | | Digital River, Inc. |
| |
| | | | Director and Chair of |
| | | | Governance Committee, |
| | | | Audit Committee |
| | | | Member |
| | | | Rimage Corporation |
| |
| | | | Director and Chair of |
| | | | Compensation Committee |
| | | | Spanlink Communications |
| |
| | | | Lead Director and Member of |
| | | | Compensation and |
| | | | Governance Committees |
| | | | Valmont Industries, Inc. |
| |
119
Board of trustees/directors and officers addendum
Delaware Investments® Family of Funds
| Name, Address, | | Position(s) | | Length of |
| and Birth Date | | Held with Fund(s) | | Time Served |
| Independent Trustees (continued) | | | | |
| |
| Janet L. Yeomans | | Trustee | | Since April 1999 |
| 2005 Market Street | | | | |
| Philadelphia, PA 19103 | | | | |
| July 1948 | | | | |
| |
| |
| |
| |
| J. Richard Zecher | | Trustee | | Since March 2005 |
| 2005 Market Street | | | | |
| Philadelphia, PA 19103 | | | | |
| July 1940 | | | | |
| |
| |
| |
| |
| |
| |
| Officers | | | | |
| |
| David F. Connor | | Vice President, | | Vice President since |
| 2005 Market Street | | Deputy General | | September 2000 |
| Philadelphia, PA 19103 | | Counsel, and Secretary | | and Secretary since |
| December 1963 | | | | October 2005 |
| |
| |
| Daniel V. Geatens | | Vice President | | Treasurer |
| 2005 Market Street | | and Treasurer | | since October 25, 2007 |
| Philadelphia, PA 19103 | | | | |
| October 1972 | | | | |
| |
| David P. O’Connor | | Senior Vice President, | | Senior Vice President, |
| 2005 Market Street | | General Counsel, | | General Counsel, and |
| Philadelphia, PA 19103 | | and Chief Legal Officer | | Chief Legal Officer |
| February 1966 | | | | since October 2005 |
| |
| Richard Salus | | Senior Vice President | | Chief Financial Officer |
| 2005 Market Street | | and Chief Financial Officer | | since November 2006 |
| Philadelphia, PA 19103 | | | | |
| October 1963 | | | | |
| | | | | |
4 David F. Connor, Daniel V. Geatens, David P. O’Connor, and Richard Salus serve in similar capacities for the six portfolios of the Optimum Fund Trust, which have the same investment advisor, principal underwriter, and transfer agent as the registrant.
120
| | Number of Portfolios in | | |
| Principal Occupation(s) | | Fund Complex Overseen | | Other Directorships |
| During Past 5 Years | | by Trustee or Officer | | Held by Trustee or Officer |
| |
| |
| Vice President and Treasurer | | 80 | | None |
| (January 2006–Present) | | | | |
| Vice President — Mergers & Acquisitions | | | | |
| (January 2003–January 2006), and | | | | |
| Vice President | | | | |
| (July 1995–January 2003) | | | | |
| 3M Corporation | | | | |
| |
| Founder | | 80 | | Director and Audit |
| Investor Analytics | | | | Committee Member |
| (Risk Management) | | | | Investor Analytics |
| (May 1999–Present) | | | | |
| |
| Founder | | | | |
| Sutton Asset Management | | | | |
| (Hedge Fund) | | | | |
| (September 1996–Present) | | | | |
| |
| |
| |
| David F. Connor has served as | | 80 | | None4 |
| Vice President and Deputy | | | | |
| General Counsel of | | | | |
| Delaware Investments | | | | |
| since 2000. | | | | |
| |
| Daniel V. Geatens has served | | 80 | | None4 |
| in various capacities at | | | | |
| different times at | | | | |
| Delaware Investments. | | | | |
| |
| David P. O’Connor has served in | | 80 | | None4 |
| various executive and legal | | | | |
| capacities at different times | | | | |
| at Delaware Investments. | | | | |
| |
| Richard Salus has served in | | 80 | | None4 |
| various executive capacities | | | | |
| at different times at | | | | |
| Delaware Investments. | | | | |
| | | | | |
The Statement of Additional Information for the Fund(s) includes additional information about the Trustees and Officers and is available, without charge, upon request by calling 800 523-1918.
121
About the organization
| Board of trustees |
| | | | |
Patrick P. Coyne
Chairman, President, and
Chief Executive Officer Delaware Investments® Family of Funds
Philadelphia, PA Thomas L. Bennett
Private Investor
Rosemont, PA John A. Fry
President
Franklin & Marshall
College
Lancaster, PA | Anthony D. Knerr
Founder and Managing
Director
Anthony Knerr &
Associates
New York, NY Lucinda S. Landreth
Former Chief Investment
Officer
Assurant, Inc.
Philadelphia, PA | Ann R. Leven
Consultant
ARL Associates
New York, NY Thomas F. Madison
President and
Chief Executive Officer
MLM Partners, Inc.
Minneapolis, MN | Janet L. Yeomans
Vice President and
Treasurer
3M Corporation
St. Paul, MN J. Richard Zecher
Founder
Investor Analytics
Scottsdale, AZ |
| | | | |
| Affiliated officers |
| | | | |
David F. Connor
Vice President, Deputy
General Counsel, and
Secretary
Delaware Investments
Family of Funds
Philadelphia, PA | Daniel V. Geatens
Vice President and
Treasurer
Delaware Investments
Family of Funds
Philadelphia, PA | David P. O’Connor
Senior Vice President,
General Counsel,
and Chief Legal Officer
Delaware Investments
Family of Funds
Philadelphia, PA | Richard Salus
Senior Vice President and
Chief Financial Officer
Delaware Investments
Family of Funds
Philadelphia, PA |
This annual report is for the information of Delaware International Value Equity Fund, Delaware Emerging Markets Fund, and Delaware Global Value Fund shareholders, but it may be used with prospective investors when preceded or accompanied by a current prospectus for Delaware International Value Equity Fund, Delaware Emerging Markets Fund, and Delaware Global Value Fund and the Delaware Investments Fund profile for the most recently completed calendar quarter. These documents are available at www.delawareinvestments.com. The prospectus sets forth details about charges, expenses, investment objectives, and operating policies of the investment company. You should read the prospectus carefully before you invest. The figures in this report represent past results that are not a guarantee of future results. The return and principal value of an investment in the investment company will fluctuate so that shares, when redeemed, may be worth more or less than their original cost. |
Delaware Investments is the marketing name of Delaware Management Holdings, Inc. and its subsidiaries. Each Fund files its complete schedule of portfolio holdings with the Securities and Exchange Commission for the first and third quarters of each fiscal year on Form N-Q. Each Fund’s Forms N-Q, as well as a description of the policies and procedures that each Fund uses to determine how to vote proxies (if any) relating to portfolio securities are available without charge (i) upon request, by calling 800 523-1918; and (ii) on the Commission’s Web site at www.sec.gov. In addition, a description of the policies and procedures that each Fund uses to determine how to vote proxies (if any) relating to portfolio securities and each Fund’s Schedule of Investments are available without charge on each Fund’s Web site at www.delawareinvestments.com. Each Fund’s Forms N-Q may be reviewed and copied at the Commission’s Public Reference Room in Washington, D.C.; information on the operation of the Public Reference Room may be obtained by calling 800 SEC-0330. Information (if any) regarding how each Fund voted proxies relating to portfolio securities during the most recently disclosed 12-month period ended June 30 is available without charge (i) through each Fund’s Web site at www.delawareinvestments.com; and (ii) on the Commission’s Web site at www.sec.gov. |
122
Annual report Delaware Focus Global Growth Fund November 30, 2009 Value equity mutual fund |
This annual report is for the information of Delaware Focus Global Growth Fund shareholders, but it may be used with prospective investors when preceded or accompanied by a current prospectus for Delaware Focus Global Growth Fund. The figures in the annual report for Delaware Focus Global Growth Fund represent past results, which are not a guarantee of future results. The return and principal value of an investment in the Fund will fluctuate so that shares, when redeemed, may be worth more or less than their original cost. Current performance may be higher or lower than the performance data quoted. You should consider the investment objectives, risks, charges, and expenses of the Fund carefully before investing. The Delaware Focus Global Growth Fund prospectus contains this and other important information about the Fund. Prospectuses for all open-end funds in the Delaware Investments® Family of Funds are available from your financial advisor, online at www.delawareinvestments.com, or by phone at 800 523-1918. Please read the prospectus carefully before you invest or send money. |
You can obtain shareholder reports and prospectuses online instead of in the mail.
Visit www.delawareinvestments.com/edelivery. |
Experience Delaware Investments
Delaware Investments is committed to the pursuit of consistently superior asset management and unparalleled client service. We believe in our investment processes, which seek to deliver consistent results, and in convenient services that help add value for our clients.
If you are interested in learning more about creating an investment plan, contact your financial advisor.
You can learn more about Delaware Investments or obtain a prospectus for Delaware Focus Global Growth Fund at www.delawareinvestments.com.
| Manage your investments online |
- 24-hour access to your account information
- Obtain share prices
- Check your account balance and recent transactions
- Request statements or literature
- Make purchases and redemptions
|
On January 4, 2010, Delaware Management Holdings, Inc. and its subsidiaries (collectively known by the marketing name of Delaware Investments) were sold by a subsidiary of Lincoln National Corporation to Macquarie Group Limited, a global provider of banking, financial, advisory, investment and funds management services. Please see your Fund’s prospectus and any supplements thereto for more complete information.
Investments in Delaware Focus Global Growth Fund are not and will not be deposits with or liabilities of Macquarie Bank Limited ABN 46 008 583 542 and its holding companies, including subsidiaries or related companies, and are subject to investment risk, including possible delays in repayment and loss of income and capital invested. No Macquarie Group company guarantees or will guarantee the performance of the Fund, the repayment of capital from the Fund, or any particular rate of return.
| Table of contents | |
| Portfolio management review | 1 |
| Performance summary | 4 |
| Disclosure of Fund expenses | 8 |
| Country and sector allocations | 10 |
| Statement of net assets | 11 |
| Statement of operations | 14 |
| Statements of changes in net assets | 16 |
| Financial highlights | 17 |
| Notes to financial statements | 18 |
| Report of independent registered public accounting firm | 27 |
| Other Fund information | 28 |
| Board of trustees/directors and officers addendum | 36 |
| About the organization | 42 |
Views expressed herein are current as of Nov. 30, 2009, and are subject to change.
Funds are not FDIC insured and are not guaranteed. It is possible to lose the principal amount invested.
Mutual fund advisory services provided by Delaware Management Company, a series of Delaware Management Business Trust, which is a registered investment advisor. Delaware Investments is the marketing name of Delaware Management Holdings, Inc. and its subsidiaries. Macquarie Group refers to Macquarie Group Limited and its subsidiaries and affiliates worldwide.
© 2010 Delaware Management Holdings, Inc.
All third-party trademarks cited are the property of their respective owners.
| Portfolio management review | |
| Delaware Focus Global Growth Fund | Dec. 8, 2009 |
| Performance preview (for the period ended Nov. 30, 2009) |
| Delaware Focus Global Growth Fund (Class A shares) | return since Dec. 29, 2008 (inception) | | +46.71 | % |
| MSCI World Index (net) benchmark | return since Dec. 29, 2008 | | +38.25 | % |
Past performance does not guarantee future results.
For complete, annualized performance for Delaware Focus Global Growth Fund, please see the table on page 4.
The performance of Class A shares excludes the applicable sales charge and reflects the reinvestment of all distributions.
Index performance returns do not reflect any management fees, transaction costs, or expenses. Indices are unmanaged and one cannot invest directly in an index. |
From a historic low, a market rally
When the Fund commenced operations at the end of December 2008, global financial markets were already in the midst of a protracted downturn. Investors have experienced weak economic cycles and significant market declines before, but this situation, which included a global credit crisis and severe recession, was worse than anything many had seen in decades:
- With diminished confidence in the capital markets and uncertain about their own futures, financial institutions seemed largely unwilling to lend to corporations and individuals.
- A difficult global stock market environment became a dismal one, leading to some very prominent business casualties.
- The most notable of these casualties included storied Wall Street investment bank Lehman Brothers, which went bankrupt in September 2008, and U.S. insurance giant American International Group (AIG), which would have gone bankrupt several weeks later if not for tens of billions of dollars in guaranteed federal loans.
The stage for the markets’ rebound was set in early March 2009, following dramatic steps to boost economic growth taken by the Federal Reserve and other central banks around the world, as well as by the U.S. Treasury Department. Given the crisis atmosphere and investors’ tremendous risk aversion, global equities were trading at depressed prices when they began to rise after March 9. The market recovery started slowly, but gradually, it appeared evident to investors that the economy’s decline was easing and possibly even starting to reverse.
Over time, investors seemed to conclude that the worst-case scenario of economic collapse was unlikely, despite continued weakness. This led to strong stock market performance in the second quarter of 2009. The subsequent “snap-back” rally was led overwhelmingly by the market’s most volatile stocks, as buyers took advantage of extremely low valuations. In fact, many of the strongest performers during this time were, in our view, highly speculative companies with weak business fundamentals, many of which were hit the hardest in the market decline. By the third calendar quarter of 2009 and continuing into the fourth, the market rally became broader, as the deepest stock-price discounts vanished.
Throughout the fiscal year we stayed true to our stock selection philosophy seeking only higher-quality companies with business models that we believed could withstand
Data for this portfolio management review were provided by Bloomberg unless otherwise noted.
1
Portfolio management review
Delaware Focus Global Growth Fund
the type of adverse market cycles we have experienced of late. This was in keeping with our goal of aiming to own stocks over a three- to five-year horizon, and our consideration of each company’s competitive position in both strong and adverse market conditions.
We believe that “cash flow is king,” and thus looked for companies (and management teams) that could generate real cash economic returns to their shareholders, regardless of whether that comes in the form of dividends, share buybacks, or reinvestment. We believe our approach to valuation was generally beneficial in an environment where many companies had great difficulties raising cash through the equity or capital (debt) markets.
Strong performers
BM&F BOVESPA SA was the Fund’s top contributor for the fiscal year. This company was created by the merger of Brazil’s Stock Exchange (BOVESPA), with its futures and commodities exchange (BM&F) in 2008. As the sole exchange in Brazil, the company has benefited from the country’s rapidly developing capital markets, which have meant increased trading activity and increased business listings on the exchange.
Tandberg ASA was also a contributor for the fiscal year. This video conference technology provider benefited from strong fundamentals and from takeover rumors (Cisco Systems announced its intended acquisition of Tandberg on October 1, 2009).
Apple overcame a period of lackluster consumer activity by continuing to produce and market stellar products. iPhone sales have exceeded expectations and the device remains highly profitable as a stand-alone product. However, the Apple story does not end there, because the iPhone’s success has driven more consumers to the company’s Mac and iPod lines.
Detractors
The global gaming company Nintendo was our largest detractor for the period. The stock tumbled because of economic and competitive forces. In the difficult economic environment, consumers were reluctant to spend on consumer discretionary items such as Nintendo’s Wii and DS gaming systems. Improvements in competing systems, particularly PlayStation and Xbox, and aggressive price-cutting by Nintendo’s competitors also affected Wii system sales. Sales of Wii and DS systems continue to lead their respective categories in terms of units sold.
Despite a slightly positive performance, Accor, an operator of hotel chains and payment services, significantly trailed the benchmark in the consumer discretionary sector. The stock underperformed primarily because of the decline in business and leisure spending during the economic downturn. The company’s business strategy, which includes moving to a franchising and fee-oriented model from one of owning physical assets, suffered due to the combination of difficult travel industry conditions and lack of available credit to potential hotel buyers. We continue to own the company because we believe its focus on brand and fees, rather than the management of physical assets, is the right strategy to drive shareholder value. We also believe the impending separation of its hotel and services businesses is the correct strategy as well.
2
Finally, UnitedHealth Group detracted from performance in the healthcare sector. We believe UnitedHealth’s relative weakness was more a function of negative investor sentiment than it was fundamental. We believe the sentiment centered on the sometimes aggressive political rhetoric around anticipated healthcare reform. While some of the debate has already softened, healthcare legislation continued to be on the front burner at the time of this writing. We believe that any final healthcare bill is likely to include compromises requiring the expertise available from large-scale solution providers like UnitedHealth in order to achieve a desired balance of cost containment and quality healthcare for consumers. Furthermore, we still believe that the company should benefit significantly by relatively small improvements in management execution, including a repricing and refining of its product lines to drive profitability.
A meaningful recovery?
We believe that the extension of the market rally toward the end of the fiscal year was as much (or more) about decreased risk aversion as about market fundamentals. While these fundamentals currently appear to be directionally positive coming off of a low base, in our opinion they don’t account for the magnitude and duration of the rally. We are concerned that investors may be extrapolating a stronger recovery period than is currently warranted.
We believe the massive deleveraging of businesses and consumers over the near-to-intermediate term may continue to threaten a meaningful market recovery. Regardless of the specific macroeconomic outcome, we remain consistent in our long-term investment philosophy: We seek to hold securities of strong secular-growth companies with solid business models and competitive positions that we feel have the potential to grow market share and deliver shareholder value in a variety of market environments.
3
| Performance summary | |
| Delaware Focus Global Growth Fund | December 8, 2009 |
The performance data quoted represent past performance; past performance does not guarantee future results. Investment return and principal value will fluctuate so your shares, when redeemed, may be worth more or less than their original cost. Please obtain the performance data current for the most recent month end by calling 800 523-1918 or visiting our Web site at www.delawareinvestments.com/performance. Current performance may be lower or higher than the performance data quoted.
You should consider the investment objectives, risks, charges, and expenses of the Fund carefully before investing. The Delaware Focus Global Growth Fund prospectus contains this and other important information about the Fund. Please request a prospectus through your financial advisor or by calling 800 523-1918 or visiting our Web site at www.delawareinvestments.com. Read the prospectus carefully before you invest or send money.
| Fund performance | Average annual total returns through Nov. 30, 2009 |
| | Lifetime |
| Class A (Est. Dec. 29, 2008) | | | | |
| Excluding sales charge | | | +46.71% | |
| Including sales charge | | | +38.25% | |
| Institutional Class (Est. Dec. 29, 2008) | | | | |
| Excluding sales charge | | | +46.71% | |
| Including sales charge | | | +46.71% | |
Class C and R shares had not commenced operations as of Nov. 30, 2009.
Returns reflect the reinvestment of all distributions and any applicable sales charges as noted in the following paragraphs.
Expense limitations were in effect for all classes during the periods shown in the Fund performance chart and in the “Performance of a $10,000 investment” chart. The current expenses for each class are listed on the “Fund expense ratios” chart. (Note that all charts and graphs referred to in the “Performance summary” section of this report are found on pages 4 through 5.) Performance would have been lower had the expense limitations not been in effect.
The Fund offers Class A and Institutional Class shares.
Class A shares are sold with a maximum front-end sales charge of up to 5.75%, and have an annual distribution and service fee of up to 0.30% of average daily net assets.
Class C and R shares are available only for certain retirement plan products. They are sold without a sales charge and have an annual distribution and service fee of up to 1.00% and 0.60%, respectively, of average daily net assets, but such fees are currently subject to a voluntary waiver, which may be terminated or modified at any time. No Class C or R shares were available during the periods shown.
Delaware Investments has agreed to voluntarily waive all distribution and service fees at this time. These expense waivers and reimbursements may be discontinued at any time because they are voluntary.
4
Institutional Class shares are available without sales or asset-based distribution charges only to certain eligible institutional accounts.
The “Fund performance” table and the “Performance of a $10,000 investment” graph do not reflect the deduction of taxes the shareholder would pay on Fund distributions or redemptions of Fund shares.
The Fund’s expense ratios, as described in the most recent prospectus, are disclosed in the following “Fund expense ratios” table. Delaware Investments has agreed to voluntarily waive all or a portion of its investment advisory fees and/or reimburse certain expenses (excluding certain expenses) to prevent total annual fund operating expenses from exceeding 1.20% of the Fund’s average daily net assets until the voluntary cap is discontinued. Please see the most recent prospectus for additional information on these fee waivers and/or reimbursements.
| Fund expense ratios | Class A | | Institutional Class |
| Total annual operating expenses | | | |
| (without fee waivers) | 4.05% | | 3.75% |
| Net expenses | | | |
| (including fee waivers, if any) | 1.20% | | 1.20% |
| Type of waivers | Voluntary | | Voluntary |
Funds that invest in small and/or medium-sized company stocks typically involve greater risk, particularly in the short term, than those investing in larger, more established companies.
International investments are subject to risks not ordinarily associated with U.S. investments including capital loss from unfavorable fluctuation in currency values, differences in generally accepted accounting principles, or economic or political instability in other nations.
Instances of high double-digit returns are unusual, cannot be sustained, and were achieved primarily during favorable market conditions.
5
Performance summary
Performance of a $10,000 investment
Dec. 29, 2008 through Nov. 30, 2009
| For period beginning Dec 29, 2008, through Nov. 30, 2009 | Starting value | Ending value |
| | Delaware Focus Global Growth Fund — Class A shares | $9,425 | $13,825 |
| | MSCI World Index (net) | $10,000 | $13,043 |
The chart assumes $10,000 invested in the Fund on Dec. 29, 2008, and includes the effect of a 5.75% front-end sales charge and the reinvestment of all distributions. Please note additional details on these fees in the “Performance summary” section of this report, which includes pages 4 through 6.
The chart also assumes $10,000 invested in the MSCI World Index as of Dec. 29, 2008.
The MSCI World Index is a free float-adjusted market capitalization weighted index designed to measure equity market performance across developed markets world-wide. Index “net” return reflects minimum possible dividend reinvestment, after deduction of withholding tax at the highest possible rate.
An index is unmanaged and does not reflect the costs of operating a mutual fund, such as the costs of buying, selling, and holding securities. You cannot invest directly in an index. Past performance is not a guarantee of future results.
Performance of other Fund classes will vary due to different charges and expenses.
The “Fund performance” chart and the “Performance of a $10,000 investment” graph do not reflect the deduction of taxes the shareholders would pay on Fund distributions or redemptions of Fund shares.
| | Nasdaq symbols | | CUSIPs | |
| Class A | | DGGAX | | 246118541 | |
| Institutional Class | | DGGIX | | 246118517 | |
6
Disclosure of Fund expenses
For the period December 1, 2006 to November 30, 2009
As a shareholder of the Fund, you incur two types of costs: (1) transaction costs, including sales charges (loads) on purchase payments, reinvested dividends, or other distributions; redemption fees; and exchange fees; and (2) ongoing costs, including management fees; distribution and/or service (12b-1) fees; and other Fund expenses. This example is intended to help you understand your ongoing costs (in dollars) of investing in the Fund and to compare these costs with the ongoing costs of investing in other mutual funds.
The example is based on an investment of $1,000 invested at the beginning of the period and held for the entire period January 1, 2004 to July 31, 2004.
Actual expenses
The first section of the table shown, “Actual Fund return,” provides information about actual account values and actual expenses. You may use the information in this section of the table, together with the amount you invested, to estimate the expenses that you paid over the period. Simply divide your account value by $1,000 (for example, an $8,600 account value divided by $1,000 = 8.6), then multiply the result by the number in the first section under the heading entitled “Expenses Paid During Period” to estimate the expenses you paid on your account during this period.
Hypothetical example for comparison purposes
The second section of the table shown, “Hypothetical 5% return,” provides information about hypothetical account values and hypothetical expenses based on the Fund’s actual expense ratio and an assumed rate of return of 5% per year before expenses, which is not the Fund’s actual return. The hypothetical account values and expenses may not be used to estimate the actual ending account balance or expenses you paid for the period. You may use this information to compare the ongoing costs of investing in the Fund and other funds. To do so, compare this 5% hypothetical example with the 5% hypothetical examples that appear in the shareholder reports of the other funds.
Please note that the expenses shown in the table are meant to highlight your ongoing costs only and do not reflect any transactional costs, such as sales charges (loads), redemption fees, or exchange fees. Therefore, the second section of the table is useful in comparing ongoing costs only, and will not help you determine the relative total costs of owning different funds. In addition, if these transactional costs were included, your costs would have been higher. The Fund’s expenses shown in the table reflect fee waivers in effect. The expenses shown in the table assume reinvestment of all dividends and distributions.
8
Delaware Focus Global Growth Fund
Expense analysis of an investment of $1,000
| | Beginning | | Ending | | | | Expenses |
| | Account | | Account Value | | Annualized | | Paid During Period |
| | 6/1/09 | | 11/30/09 | | Expense Ratio | | 6/1/09 to 11/30/09* |
| Actual Fund return | | | | | | | | | | | |
| Class A | | $1,000.00 | | | $1,180.90 | | | 1.20% | | $6.56 | |
| Institutional Class | | 1,000.00 | | | 1,180.90 | | | 1.20% | | 6.56 | |
| Hypothetical 5% return (5% return before expenses) | | | | | | |
| Class A | | $1,000.00 | | | $1,019.05 | | | 1.20% | | $6.07 | |
| Institutional Class | | 1,000.00 | | | 1,019.05 | | | 1.20% | | 6.07 | |
*“Expenses Paid During Period” are equal to the Fund’s annualized expense ratio, multiplied by the average account value over the period, multiplied by 183/365 (to reflect the one-half year period).
9
| Country and sector allocations | |
| Delaware Focus Global Growth Fund | As of November 30, 2009 |
Sector designations may be different than the sector designations presented in other Fund materials. The sector designations may represent the investment manager’s internal sector classifications, which may result in the sector designations for one fund being different than another fund’s sector designations.
| Composition of Portfolio | Percentage of Net Assets |
| Common Stock by Country | 99.65 | % |
| Australia | 3.16 | % |
| Brazil | 7.58 | % |
| Canada | 1.53 | % |
| Denmark | 3.42 | % |
| France | 3.07 | % |
| India | 2.69 | % |
| Japan | 1.52 | % |
| Mexico | 2.55 | % |
| Netherlands | 2.77 | % |
| Singapore | 2.29 | % |
| Switzerland | 13.48 | % |
| Taiwan | 2.58 | % |
| United Kingdom | 1.77 | % |
| United States | 51.24 | % |
| Discount Note | 0.48 | % |
| Total Value of Securities | 100.13 | % |
| Liabilities Net of Receivables and Other Assets | (0.13 | %) |
| Total Net Assets | 100.00 | % |
| |
| Common Stock by Sector | | |
| Consumer Discretionary | 17.23 | % |
| Consumer Staples | 2.37 | % |
| Energy | 2.77 | % |
| Financials | 20.01 | % |
| Health Care | 13.62 | % |
| Industrials | 9.46 | % |
| Information Technology | 24.85 | % |
| Materials | 6.15 | % |
| Telecommunication Services | 3.19 | % |
| Total | 99.65 | % |
10
| Statement of net assets | |
| Delaware Focus Global Growth Fund | November 30, 2009 |
| | Number of shares | | Value (U.S.$) |
| Common Stock – 99.65% Δ | | | | | | |
| Australia – 3.16% | | | | | | |
| | BHP Billiton ADR | | 2,025 | | | $ | 152,483 |
| | | | | | | 152,483 |
| Brazil – 7.58% | | | | | | |
| BM&F Bovespa | | 17,700 | | | | 118,975 |
| Natura Cosmeticos | | 6,000 | | | | 114,668 |
| Redecard | | 8,700 | | | | 132,817 |
| | | | | | | 366,460 |
| Canada – 1.53% | | | | | | |
| † | Research in Motion | | 1,275 | | | | 73,810 |
| | | | | | | 73,810 |
| Denmark – 3.42% | | | | | | |
| Novo Nordisk Class B | | 2,460 | | | | 165,016 |
| | | | | | | 165,016 |
| France – 3.07% | | | | | | |
| Accor | | 2,775 | | | | 148,480 |
| | | | | | | 148,480 |
| India – 2.69% | | | | | | |
| Infosys Technologies ADR | | 2,550 | | | | 129,974 |
| | | | | | | 129,974 |
| Japan – 1.52% | | | | | | |
| Nintendo | | 300 | | | | 73,603 |
| | | | | | | 73,603 |
| Mexico – 2.55% | | | | | | |
| Grupo Televisa ADR | | 6,000 | | | | 123,420 |
| | | | | | | 123,420 |
| Netherlands – 2.77% | | | | | | |
| Core Laboratories | | 1,260 | | | | 133,875 |
| | | | | | | 133,875 |
| Singapore – 2.29% | | | | | | |
| Singapore Exchange | | 19,500 | | | | 110,744 |
| | | | | | | 110,744 |
11
Statement of net assets
Delaware Focus Global Growth Fund
| | Number of shares | | Value (U.S. $) |
| Common Stock (continued) | | | | | | |
| Switzerland – 13.48% | | | | | | |
| | Julius Baer Group | | 3,000 | | | $ | 98,995 |
| Kuehne & Nagel International | | 1,440 | | | | 139,040 |
| Roche Holding | | 750 | | | | 122,661 |
| SGS | | 114 | | | | 146,159 |
| Syngenta ADR | | 2,700 | | | | 144,477 |
| | | | | | | 651,332 |
| Taiwan – 2.58% | | | | | | |
| Taiwan Semiconductor Manufacturing ADR | | 12,000 | | | | 124,680 |
| | | | | | | 124,680 |
| United Kingdom – 1.77% | | | | | | |
| Intertek Group | | 4,470 | | | | 85,667 |
| | | | | | | 85,667 |
| United States – 51.24% | | | | | | |
| Allergan | | 2,550 | | | | 148,232 |
| † | Apple | | 660 | | | | 131,941 |
| Bank of New York Mellon | | 4,050 | | | | 107,892 |
| † | Crown Castle International | | 4,200 | | | | 154,097 |
| Expeditors International Washington | | 2,700 | | | | 86,211 |
| † | Gilead Sciences | | 2,775 | | | | 127,789 |
| † | Google Class A | | 240 | | | | 139,920 |
| † | IntercontinentalExchange | | 1,425 | | | | 152,175 |
| † | Intuit | | 5,100 | | | | 148,971 |
| MasterCard Class A | | 600 | | | | 144,516 |
| NIKE Class B | | 2,250 | | | | 146,003 |
| optionsXpress Holdings | | 6,600 | | | | 100,980 |
| † | priceline.com | | 825 | | | | 176,648 |
| QUALCOMM | | 2,400 | | | | 108,000 |
| Staples | | 4,500 | | | | 104,940 |
| † | Teradata | | 4,050 | | | | 118,665 |
| Thomson Reuters | | 4,200 | | | | 132,898 |
| UnitedHealth Group | | 3,300 | | | | 94,611 |
| † | Verisign | | 6,750 | | | | 151,470 |
| | | | | | | 2,475,959 |
| Total Common Stock (cost $3,581,438) | | | | | | 4,815,503 |
12
| | Principal amount (U.S.$) | | Value (U.S. $) | |
| ≠Discount Note – 0.48% | | | | | | | | |
| Federal Home Loan Bank | | | | | | | | |
| | 0.02% 12/1/09 | | $ | 23,000 | | | $ | 23,000 | |
| Total Discount Note (cost $23,000) | | | | | | | 23,000 | |
| |
| Total Value of Securities – 100.13% | | | | | | | | |
| (cost $3,604,438) | | | | | | | 4,838,503 | |
| Liabilities Net of Receivables | | | | | | | | |
| and Other Assets – (0.13%) | | | | | | | (6,176 | ) |
| Net Assets Applicable to 387,625 | | | | | | | | |
| Shares Outstanding – 100.00% | | | | | | $ | 4,832,327 | |
| | | | | | | | | |
| Net Asset Value – Delaware Focus Global Growth Fund | | | | | | | | |
| Class A ($2,497,922 / 200,366 Shares) | | | | | | | $12.47 | |
| Net Asset Value – Delaware Focus Global Growth Fund | | | | | | | | |
| Institutional Class ($2,334,405 / 187,259 Shares) | | | | | | | $12.47 | |
| |
| Components of Net Assets at November 30, 2009: | | | | | |
| Shares of beneficial interest | | | | | | | | |
| (unlimited authorization - no par) | | | | | | $ | 3,134,114 | |
| Undistributed net investment income | | | | | | | 10,353 | |
| Accumulated net realized gain on investments | | | | | | | 453,393 | |
| Net unrealized appreciation of investments and foreign currencies | | | | 1,234,467 | |
| Total net assets | | | | | | $ | 4,832,327 | |
| Δ | Securities have been classified by country of origin. Classification by type of business has been presented on page 10 in “Country and sector allocations.” |
| † | Non income producing security. |
| ≠ | The rate shown is the effective yield at the time of purchase. |
ADR – American Depositary Receipts
| Net Asset Value and Offering Price Per Share – | | |
| Delaware Focus Global Growth Fund | | |
| Net asset value Class A (A) | $ | 12.47 |
| Sales charge (5.75% of offering price) (B) | | 0.76 |
| Offering price | $ | 13.23 |
| (A) | Net asset value per share, as illustrated, is the amount which would be paid upon redemption or repurchase of shares. |
| (B) | See the current prospectus for purchases of $50,000 or more. |
See accompanying notes
13
| Statement of operations | |
| Delaware Focus Global Growth Fund | December 29, 2008* to November 30, 2009 |
| Investment Income: | | | | | | | |
| Dividends | $ | 73,739 | | | | | |
| Interest | | 317 | | | | | |
| Foreign tax withheld | | (5,256 | ) | | $ | 68,800 | |
| |
| Expenses: | | | | | | | |
| Management fees | | 33,961 | | | | | |
| Legal fees | | 21,716 | | | | | |
| Audit and tax | | 11,012 | | | | | |
| Custodian fees | | 8,524 | | | | | |
| Distribution expenses-Class A | | 5,530 | | | | | |
| Pricing fees | | 4,757 | | | | | |
| Dividend disbursing and transfer agent fees and expenses | | 3,501 | | | | | |
| Registration fees | | 2,009 | | | | | |
| Accounting and administration expenses | | 1,598 | | | | | |
| Reports and statements to shareholders | | 1,235 | | | | | |
| Dues and services | | 659 | | | | | |
| Trustees’ fees | | 250 | | | | | |
| Insurance fees | | 101 | | | | | |
| Consulting fees | | 42 | | | | | |
| Trustees’ expenses | | 17 | | | | 94,912 | |
| Less fees waived | | | | | | (41,514 | ) |
| Less waived distribution expenses-Class A | | | | | | (5,530 | ) |
| Total operating expenses | | | | | | 47,868 | |
| Net Investment Income | | | | | | 20,932 | |
| |
| Net Realized and Unrealized Gain (Loss) on Investments and Foreign Currencies: | |
| Net realized gain (loss) on: | | | | | | | |
| Investments | | | | | | 453,393 | |
| Foreign currencies | | | | | | (10,579 | ) |
| Net realized gain | | | | | | 442,814 | |
| Unrealized appreciation/depreciation of investments and foreign currencies | | | | 1,234,467 | |
| Net Realized and Unrealized Gain on | | | | | | | |
| Investments and Foreign Currencies | | | | | | 1,677,281 | |
| |
| Net Increase in Net Assets Resulting from Operations | | | | | $ | 1,698,213 | |
*Date of commencement of operations.
See accompanying notes
14
Statement of changes in net assets
Delaware Focus Global Growth Fund
| 12/29/08* |
| to |
| 11/30/09 |
| Increase in Net Assets from Operations: | | | |
| Net investment income | $ | 20,932 | |
| Net realized gain on investments and foreign currencies | | 442,814 | |
| Unrealized appreciation/depreciation of investments and foreign currencies | | 1,234,467 | |
| Net increase in net assets resulting from operations | | 1,698,213 | |
| |
| Capital Share Transactions: | | | |
| Proceeds from shares sold: | | | |
| Class A | | 1,734,088 | |
| Institutional Class | | 2,000,026 | |
| | 3,734,114 | |
| Cost of shares repurchased: | | | |
| Institutional Class | | (600,000 | ) |
| | (600,000 | ) |
| Increase in net assets derived from capital share transactions | | 3,134,114 | |
| Net Increase in Net Assets | | 4,832,327 | |
| |
| Net Assets: | | | |
| Beginning of period | | — | |
| End of period (including undistributed net investment income of $10,353) | $ | 4,832,327 | |
*Date of commencement of operations.
See accompanying notes
16
Financial highlights
Delaware Focus Global Growth Fund
Selected data for each share of the Fund outstanding throughout the period were as follows:
| | Class A | | Institutional Class |
| | 12/29/081 | | 12/29/081 |
| | to | | to |
| | 11/30/09 | | 11/30/09 |
| Net asset value, beginning of period | | $8.500 | | | $8.500 | |
| |
| Income from investment operations: | | | | | | |
| Net investment income2 | | 0.050 | | | 0.050 | |
| Net realized and unrealized gain on investments | | | | | | |
| and foreign currencies | | 3.920 | | | 3.920 | |
| Total from investment operations | | 3.970 | | | 3.970 | |
| |
| Net asset value, end of period | | $12.470 | | | $12.470 | |
| |
| Total return3 | | 46.71% | | | 46.71% | |
| |
| Ratios and supplemental data: | | | | | | |
| Net assets, end of period (000 omitted) | | $2,498 | | | $2,334 | |
| Ratio of expenses to average net assets | | 1.20% | | | 1.20% | |
| Ratio of expenses to average net assets | | | | | | |
| prior to fees waived | | 2.54% | | | 2.24% | |
| Ratio of net investment income to average net assets | | 0.52% | | | 0.52% | |
| Ratio of net investment loss to average net assets | | | | | | |
| prior to fees waived | | (0.82% | ) | | (0.52% | ) |
| Portfolio turnover | | 45% | | | 45% | |
1 Date of commencement of operations; ratios and portfolio turnover have been annualized and total return has not been annualized. |
2 The average shares outstanding method has been applied for per share information. |
3 Total investment return is based on the change in net asset value of a share during the period and assumes reinvestment of dividends and distributions at net asset value and does not reflect the impact of a sales charge. Total investment return reflects voluntary waivers by the manager and distributor, as applicable. Performance would have been lower had the voluntary waivers not been in effect. |
See accompanying notes
17
| Notes to financial statements | |
| Delaware Focus Global Growth Fund | November 30, 2009 |
Delaware Group® Global & International Funds (Trust) is organized as a Delaware statutory trust and offers four series: Delaware Focus Global Growth Fund, Delaware International Value Equity Fund, Delaware Emerging Markets Fund and Delaware Global Value Fund. These financial statements and the related notes pertain to the Delaware Focus Global Growth Fund (Fund). The Trust is an open-end investment company. The Fund is considered diversified under the Investment Company Act of 1940, as amended, and offers Class A, Class C, Class R and Institutional Class shares. Class A shares are sold with a maximum front-end sales charge of up to 5.75%. Class A share purchases of $1,000,000 or more will incur a contingent deferred sales charge (CDSC) if redeemed during the first two years, provided that Delaware Distributors, L.P. (DDLP) paid a financial advisor a commission on the purchase of those shares. Class C shares are sold with a CDSC of 1%, if redeemed during the first twelve months. Class R and Institutional Class shares are not subject to a sales charge and are offered for sale exclusively to certain eligible investors. As of November 30, 2009, Class C and Class R shares had not commenced operations.
The investment objective of the Fund is to seek long-term capital appreciation.
1. Significant Accounting Policies
The following accounting policies are in accordance with U.S. generally accepted accounting principles (GAAP) and are consistently followed by the Fund.
Security Valuation — Equity securities, except those traded on the Nasdaq Stock Market, Inc. (Nasdaq), are valued at the last quoted sales price as of the time of the regular close of the New York Stock Exchange (NYSE) on the valuation date. Securities traded on the Nasdaq are valued in accordance with the Nasdaq Official Closing Price, which may not be the last sales price. If on a particular day an equity security does not trade, then the mean between the bid and ask prices will be used. Securities listed on a foreign exchange are valued at the last quoted sales price on the valuation date. Short-term debt securities are valued at market value. Foreign currency exchange contracts are valued at the mean between the bid and ask prices. Interpolated values are derived when the settlement date of the contract is an interim date for which quotations are not available. Generally, other securities and assets for which market quotations are not readily available are valued at fair value as determined in good faith under the direction of the Fund’s Board of Trustees (Board). In determining whether market quotations are readily available or fair valuation will be used, various factors will be taken into consideration, such as market closures, or suspension of trading in a security. The Fund may use fair value pricing more frequently for securities traded primarily in non-U.S. markets because, among other things, most foreign markets close well before the Fund values its securities at 4:00 p.m. Eastern time. The earlier close of these foreign markets gives rise to the possibility that significant events, including broad market moves, government actions or pronouncements, aftermarket trading, or news events may have occurred in the interim. To account for this, the Fund may frequently value foreign securities using fair value prices based on third-party vendor modeling tools (international fair value pricing).
Federal Income Taxes — No provision for federal income taxes has been made as the Fund intends to qualify for federal income tax purposes as a regulated investment company under Subchapter M of
18
the Internal Revenue Code of 1986, as amended, and make the requisite distributions to shareholders. The Fund evaluates tax positions taken or expected to be taken in the course of preparing the Fund’s tax returns to determine whether the tax positions are “more-likely-than-not” of being sustained by the applicable tax authority. Tax positions not deemed to meet the more-likely-than-not threshold are recorded as a tax benefit or expense in the current year. Management has analyzed the Fund’s tax positions for the open tax year ended November 30, 2009, and has concluded that no provision for federal income tax is required in the Fund’s financial statements.
Class Accounting — Investment income, common expenses and realized and unrealized gain (loss) on investments are allocated to the various classes of the Fund on the basis of daily net assets of each class. Distribution expenses relating to a specific class are charged directly to that class.
Repurchase Agreements — The Fund may invest in a pooled cash account along with members of the Delaware Investments® Family of Funds pursuant to an exemptive order issued by the Securities and Exchange Commission. The aggregate daily balance of the pooled cash account is invested in repurchase agreements secured by obligations of the U.S government. The respective collateral is held by the Fund’s custodian bank until the maturity of the respective repurchase agreements. Each repurchase agreement is at least 102% collateralized. However, in the event of default or bankruptcy by the counterparty to the agreement, realization of the collateral may be subject to legal proceedings. At November 30, 2009, the Fund held no investments in repurchase agreements.
Foreign Currency Transactions — Transactions denominated in foreign currencies are recorded at the prevailing exchange rates on the valuation date. The value of all assets and liabilities denominated in foreign currencies is translated into U.S. dollars at the exchange rate of such currencies against the U.S. dollar daily. Transaction gains or losses resulting from changes in exchange rates during the reporting period or upon settlement of the foreign currency transaction are reported in operations for the current period. The Fund does not isolate that portion of realized gains and losses on investments which are due to changes in foreign exchange rates from that which are due to changes in market prices. The Fund reports certain foreign currency related transactions as components of realized gains (losses) for financial reporting purposes, whereas such components are treated as ordinary income (loss) for federal income tax purposes.
Use of Estimates — The preparation of financial statements in conformity with U.S. GAAP requires management to make estimates and assumptions that affect the reported amounts of assets and liabilities at the date of the financial statements and the reported amounts of revenues and expenses during the reporting period. Actual results could differ from those estimates.
Other — Expenses directly attributable to the Fund are charged directly to the Fund. Other expenses common to various funds within the Delaware Investments® Family of Funds are generally allocated amongst such funds on the basis of average net assets. Management fees and some other expenses are paid monthly. Security transactions are recorded on the date the securities are purchased or sold (trade date) for financial reporting purposes. Costs used in calculating realized gains and losses on the sale of investment securities are those of the specific securities sold. Dividend income is recorded on the ex-dividend date and interest income is recorded on the accrual basis. Foreign dividends are
19
Notes to financial statements
Delaware Focus Global Growth Fund
also recorded on the ex-dividend date or as soon after the ex-dividend date that the Fund is aware of such dividends, net of all non-rebatable tax withholdings. Withholding taxes on foreign dividends have been recorded in accordance with the Fund’s understanding of the applicable country’s tax rules and rates. The Fund declares and pays dividends from net investment income and distributions from net realized gain on investments, if any, annually.
The Fund receives earnings credits from its custodian when positive cash balances are maintained, which are used to offset custody fees. There were no earnings credits during the period December 29, 2008 through November 30, 2009.
On July 1, 2009, the Financial Accounting Standards Boards (FASB) issued the FASB Accounting Standards Codification (Codification). The Codification became the single source of authoritative nongovernmental U.S. GAAP, superseding existing literature of the FASB, American Institute of Certified Public Accountants, Emerging Issues Task Force and other sources. The Codification is effective for interim and annual periods ending after September 15, 2009. The Fund adopted the Codification during the period December 29, 2008 through November 30, 2009. There was no impact to financial statements as the Codification requirements are disclosure-only in nature.
Management has evaluated whether any events or transactions occurred subsequent to November 30, 2009 through January 21, 2010, the date of issuance of the Fund’s financial statements, and determined that there were no material events or transactions that would require recognition or disclosure in the Fund’s financial statements.
2. Investment Management, Administration Agreements and Other Transactions with Affiliates
In accordance with the terms of its investment management agreement, the Fund pays Delaware Management Company (DMC), a series of Delaware Management Business Trust and the investment manager, an annual fee which is calculated daily at the rate of 0.85% on the first $500 million of average daily net assets of the Fund, 0.80% on the next $500 million, 0.75% on the next $1.5 billion, and 0.70% on average daily net assets in excess of $2.5 billion.
DMC has voluntarily agreed to waive that portion, if any, of its management fee and reimburse the Fund to the extent necessary to ensure that total annual operating expenses (excluding any 12b-1 plan expenses, taxes, interest, inverse floater program expenses, brokerage fees, certain insurance costs, and nonroutine expenses or costs, including, but not limited to, those relating to reorganizations, litigation, conducting shareholder meetings, and liquidations (collectively, nonroutine expenses)) do not exceed 1.20% of average daily net assets of the Fund until such time as the waiver is discontinued. For purposes of this waiver and reimbursement, nonroutine expenses may also include such additional costs and expenses, as may be agreed upon from time to time by the Fund’s Board and DMC. This expense waiver may be discontinued at any time because it is voluntary, and applies only to expenses paid directly by the Fund.
Delaware Service Company, Inc. (DSC), an affiliate of DMC, provides fund accounting and financial administration oversight services to the Fund. For these services, the Fund pays DSC fees based on the
20
aggregate daily net assets of the Delaware Investments® Family of Funds at the following annual rate: 0.0050% of the first $30 billion; 0.0045% of the next $10 billion; 0.0040% of the next $10 billion; and 0.0025% of aggregate average daily net assets in excess of $50 billion. The fees payable to DSC under the service agreement described above are allocated among all Funds in the Delaware Investments® Family of Funds on a relative net asset value basis. For the period December 29, 2008 through November 30, 2009, the Fund was charged $200 for these services.
DSC also provides dividend disbursing and transfer agency services. The Fund pays DSC a monthly fee based on the number of shareholder accounts for dividend disbursing and transfer agent services.
Pursuant to a distribution agreement and distribution plan, the Fund pays DDLP, the distributor and an affiliate of DMC, an annual distribution and service fee not to exceed 0.30% of the average daily net assets of the Class A shares, 1.00% of the average daily net assets of the Class C shares and 0.60% of the average daily net assets of Class R shares. Institutional Class shares pay no distribution and service expenses. DDLP has voluntarily agreed to waive all distribution and service fees at this time. This expense waiver may be discontinued at any time because it is voluntary, and applies only to expenses paid directly by the Fund.
At November 30, 2009, the Fund had receivables due from or liabilities payable to affiliates as follows:
| Receivable from DMC under expense limitation agreement | $ | 1,386 | |
| Dividend disbursing, transfer agent and fund accounting | | | |
| oversight fees and other expenses payable to DSC | | (475 | ) |
| Other expenses payable to DMC and affiliates* | | (93 | ) |
*DMC, as part of its administrative services, pays operating expenses on behalf of the Fund and is reimbursed on a periodic basis. Such expenses include items such as printing of shareholder reports, fees for audit, legal and tax services, registration fees and trustees’ fees.
As provided in the investment management agreement, the Fund bears the cost of certain legal and tax services, including internal legal and tax services provided to the Fund by DMC and/or its affiliates’ employees. For the period December 29, 2008 through November 30, 2009, the Fund was charged $341 for internal legal and tax services provided by DMC and/or its affiliates’ employees.
Trustees’ fees include expenses accrued by the Fund for each Trustee’s retainer and meeting fees. Certain officers of DMC, DSC and DDLP are officers and/or Trustees of the Trust. These officers and Trustees are paid no compensation by the Fund.
3. Investments
For the period December 29, 2008 through November 30, 2009, the Fund made purchases of $4,821,786 and sales of $1,693,734 of investment securities other than short-term investments.
At November 30, 2009, the cost of investments for federal income tax purposes was $3,604,554. At November 30, 2009, net unrealized appreciation was $1,233,949, of which $1,298,022 related to unrealized appreciation of investments and $64,073 related to unrealized depreciation of investments.
21
Notes to financial statements
Delaware Focus Global Growth Fund
The Fund applies the provisions, as amended to date, of Accounting Standards Codification 820 (ASC 820), Fair Value Measurements and Disclosures. ASC 820 defines fair value as the price that the Fund would receive to sell an asset or pay to transfer a liability in an orderly transaction between market participants at the measurement date under current market conditions. ASC 820 also establishes a framework for measuring fair value, and a three level hierarchy for fair value measurements based upon the transparency of inputs to the valuation of an asset or liability. Inputs may be observable or unobservable and refer broadly to the assumptions that market participants would use in pricing the asset or liability. Observable inputs reflect the assumptions market participants would use in pricing the asset or liability based on market data obtained from sources independent of the reporting entity. Unobservable inputs reflect the reporting entity’s own assumptions about the assumptions that market participants would use in pricing the asset or liability developed based on the best information available under the circumstances. The Fund’s investment in its entirety is assigned a level based upon the observability of the inputs which are significant to the overall valuation. The three-tier hierarchy of inputs is summarized below.
Level 1 – Inputs are quoted prices in active markets
Level 2 – Inputs are observable, directly or indirectly
Level 3 – Inputs are unobservable and reflect assumptions on the part of the reporting entity
The following table summarizes the valuation of the Fund’s investments by the ASC 820 fair value hierarchy levels as of November 30, 2009:
| | Level 1 | | Level 2 | | Total |
| Common stock | | $ | 4,815,503 | | $ | — | | $ | 4,815,503 |
| Short-Term | | | — | | | 23,000 | | | 23,000 |
| Total | | $ | 4,815,503 | | $ | 23,000 | | $ | 4,838,503 |
There were no Level 3 securities at the end of the period.
4. Dividend and Distribution Information
Income and long-term capital gain distributions are determined in accordance with federal income tax regulations, which may differ from U.S. GAAP. Additionally, distributions from net gains on foreign currency transactions and net short-term gains on sales of investment securities are treated as ordinary income for federal income tax purposes. There were no dividends and distributions paid during the period December 29, 2008 through November 30, 2009.
5. Components of Net Assets on a Tax Basis
As of November 30, 2009, the components of net assets on a tax basis were as follows:
| Shares of beneficial interest | $ | 3,134,114 |
| Undistributed ordinary income | | 463,862 |
| Unrealized appreciation of investments and foreign currencies | | 1,234,351 |
| Net assets | $ | 4,832,327 |
22
The difference between book basis and tax basis components of net assets are primary attributable to tax defferal of losses on wash sales.
For financial reporting purposes, capital accounts are adjusted to reflect the tax character of permanent book/tax differences. Reclassifications are primarily due to tax treatment of gain (loss) on foreign currency transactions. Results of operations and net assets were not affected by these reclassifications. For the period December 29, 2008 through November 30, 2009, the Fund recorded the following reclassifications.
| Undistributed net investment income | $ | (10,579 | ) |
| Accumulated net realized gain | | 10,579 | |
6. Capital Shares
Transactions in capital shares were as follows:
| 12/29/08* to 11/30/09 |
| Shares sold: | | | |
| Class A | | 200,366 | |
| Institutional Class | | 235,297 | |
| | | 435,663 | |
| |
| Shares repurchased: | | | |
| Institutional Class | | (48,038 | ) |
| | | (48,038 | ) |
| Net increase | | 387,625 | |
| | | | |
| *Date of commencement of operations. |
7. Line of Credit
The Fund, along with certain other funds in the Delaware Investments® Family of Funds (Participants), participates in a $35,000,000 revolving line of credit with The Bank of New York Mellon (BNY Mellon) to be used for temporary or emergency purposes as an additional source of liquidity to fund redemptions of investor shares. Under the agreement, the Participants are charged an annual commitment fee, which is allocated across the Participants on the basis of each Participant’s allocation of the entire facility. The Participants may borrow up to a maximum of one third of their net assets under the agreement. The agreement expires on November 16, 2010. The Fund had no amounts outstanding as of November 30, 2009, or at any time during the period then ended.
8. Foreign Currency Exchange Contracts
The Fund may enter into foreign currency exchange contracts as a way of managing foreign exchange rate risk. The Fund may enter into these contracts to fix the U.S. dollar value of a security that it has agreed to buy or sell for the period between the date the trade was entered into and the date the security is delivered and paid for. The Fund may also use these contracts to hedge the U.S. dollar value of securities it already owns that are denominated in foreign currencies. The change in value is recorded as an unrealized gain or loss. When the contract is closed, a realized gain or loss is recorded equal to the difference between the value of the contract at the time it was opened and the value at the time it was closed.
23
Notes to financial statements
Delaware Focus Global Growth Fund
The use of foreign currency exchange contracts does not eliminate fluctuations in the underlying prices of the securities, but does establish a rate of exchange that can be achieved in the future. Although foreign currency exchange contracts limit the risk of loss due to a decline in the value of the hedged currency, they also limit any potential gain that might result should the value of the currency increase. In addition, the Fund could be exposed to risks if the counterparties to the contracts are unable to meet the terms of their contracts. The Fund’s maximum risk of loss from counterparty credit risk is the value of its currency exchanged with the counterparty. The risk is generally mitigated by having a netting arrangement between the Fund and the counterparty and by the posting of collateral by the counterparty to the Fund to cover the Fund’s exposure to the counterparty. There were no foreign currency exchange contracts outstanding at November 30, 2009.
9. Credit and Market Risk
Some countries in which the Fund may invest require governmental approval for the repatriation of investment income, capital or the proceeds of sales of securities by foreign investors. In addition, if there is deterioration in a country’s balance of payments or for other reasons, a country may impose temporary restrictions on foreign capital remittances abroad.
The securities exchanges of certain foreign markets are substantially smaller, less liquid, and more volatile than the major securities markets in the United States. Consequently, acquisition and disposition of securities by the Fund may be inhibited. In addition, a significant portion of the aggregate market value of equity securities listed on the major securities exchanges in emerging markets are held by a smaller number of investors. This may limit the number of shares available for acquisition or disposition by the Fund.
The Fund may invest up to 15% of its net assets in illiquid securities, which may include securities with contractual restrictions on resale, securities exempt from registration under Rule 144A of the Securities Act of 1933, as amended, and other securities which may not be readily marketable. The relative illiquidity of these securities may impair the Fund from disposing of them in a timely manner and at a fair price when it is necessary or desirable to do so. While maintaining oversight, the Fund’s Board has delegated to DMC the day-to-day functions of determining whether individual securities are liquid for purposes of the Fund’s limitation on investments in illiquid assets. Securities eligible for resale pursuant to Rule 144A, which are determined to be liquid, are not subject to the Fund’s 15% limit on investments in illiquid securities. As of November 30, 2009, there were no Rule 144A securities and no securities have been determined to be illiquid under the Fund’s Liquidity Procedures.
10. Contractual Obligations
The Fund enters into contracts in the normal course of business that contain a variety of indemnifications. The Fund’s maximum exposure under these arrangements is unknown. However, the Fund has not had prior claims or losses pursuant to these contracts. Management has reviewed the Fund’s existing contracts and expects the risk of loss to be remote.
24
11. Sale of Delaware Investments to Macquarie Group
On August 18, 2009, Lincoln National Corporation (parent company of Delaware Investments) and Macquarie Group (Macquarie) entered into an agreement pursuant to which Delaware Investments, including DMC, DDLP and DSC, would be acquired by Macquarie, an Australia-based global provider of banking, financial, advisory, investment and funds management services (Transaction). The Transaction was completed on January 4, 2010. DMC, DDLP and DSC are now wholly owned subsidiaries of Macquarie.
The Transaction resulted in a change of control of DMC which, in turn, caused the termination of the investment advisory agreement between DMC and the Fund. On January 4, 2010, the new investment advisory agreement between DMC and the Fund that was approved by the shareholders became effective.
25
Report of independent
registered public accounting firm
To the Shareholders and Board of Trustees
Delaware Group Global & International Funds – Delaware Focus Global Growth Fund
We have audited the accompanying statement of net assets of Delaware Focus Global Growth Fund of Delaware Group Global & International Funds (the “Fund”) as of November 30, 2009, and the related statement of operations, the statements of changes in net assets, and the financial highlights for the period December 29, 2008 (commencement of operations) to November 30, 2009. These financial statements and financial highlights are the responsibility of the Fund’s management. Our responsibility is to express an opinion on these financial statements and financial highlights based on our audits.
We conducted our audits in accordance with the standards of the Public Company Accounting Oversight Board (United States). Those standards require that we plan and perform the audit to obtain reasonable assurance about whether the financial statements and financial highlights are free of material misstatement. We were not engaged to perform an audit of the Fund’s internal control over financial reporting. Our audits included consideration of internal control over financial reporting as a basis for designing audit procedures that are appropriate in the circumstances, but not for the purpose of expressing an opinion on the effectiveness of the Fund’s internal control over financial reporting. Accordingly, we express no such opinion. An audit also includes examining, on a test basis, evidence supporting the amounts and disclosures in the financial statements and financial highlights, assessing the accounting principles used and significant estimates made by management, and evaluating the overall financial statement presentation. Our procedures included confirmation of securities owned as of November 30, 2009 by correspondence with the custodian and brokers or by other appropriate auditing procedures when replies from brokers were not received. We believe that our audits provide a reasonable basis for our opinion.
In our opinion, the financial statements and financial highlights referred to above present fairly, in all material respects, the financial position of Delaware Focus Global Growth Fund of Delaware Group Global & International Funds at November 30, 2009, the results of its operations, the changes in its net assets, and its financial highlights for the period December 29, 2008 (commencement of operations) to November 30, 2009, in conformity with U.S. generally accepted accounting principles.
Philadelphia, Pennsylvania
January 21, 201027
Other Fund information
(Unaudited)
Delaware Focus Global Growth Fund
Board Consideration of New Investment Advisory Agreement
At a meeting held on September 3, 2009 (the “Meeting”), the Board of Trustees of the Delaware Investments Family of Funds (the “Board”), including a majority of independent Trustees, approved a new investment advisory agreement between each registrant on behalf of each series (each, a “Fund” and together, the “Funds”) and Delaware Management Company (“DMC”) in connection with the sale of Delaware Investments’ advisory business to Macquarie Bank Limited (the “Macquarie Group”) (the “Transaction”). In making its decision, the Board considered information furnished specifically in connection with the approval of the new investment advisory agreements with DMC (the “New Investment Advisory Agreements”) which included extensive materials about the Transaction and matters related to the proposed approvals. To assist the Board in considering the New Investment Advisory Agreements, Macquarie Group provided materials and information about Macquarie Group, including detailed written responses to the questions posed by the independent Trustees. DMC also provided materials and information about the Transaction, including detailed written responses to the questions posed by the independent Trustees.
At the Meeting, the Trustees discussed the Transaction with DMC management and with key Macquarie Group representatives. The Meeting included discussions of the strategic rationale for the Transaction and Macquarie Group’s general plans and intentions regarding the Funds and DMC. The Board members also inquired about the plans for, and anticipated roles and responsibilities of, key employees and officers of Delaware Management Holdings Inc. and DMC in connection with the Transaction.
In connection with the Trustees’ review of the New Investment Advisory Agreements for the Funds, DMC and/or Macquarie Group emphasized that:
- They expected that there would be no adverse changes were a result of the Transaction, in the nature, quality, or extent of services currently provided to the Funds and their shareholders, including investment management, distribution, or other shareholder services.
- No material changes in personnel or operations were contemplated in the operation of DMC under Macquarie Group as a result of the Transaction and no material changes were currently contemplated in connection with third party service providers to the Funds.
- Macquarie Group had no intention to cause DMC to alter the voluntary expense waivers and reimbursements currently in effect for the Funds.
- Under the agreement between Macquarie Group and Lincoln National Corporation (“LNC”) (the “Transaction Agreement”), Macquarie Group has agreed to conduct, and to cause its affiliates to conduct, their respective businesses in compliance with the conditions of Section 15(f) of the Investment Company Act of 1940 (the “1940 Act”) with respect to the Funds, to the extent within its control, including maintaining Board composition of at least 75% of the Board members qualifying as independent Trustees and not imposing any “unfair burden” on the Funds for at least two years from the closing of the Transaction (the “Closing”).
28
In addition to the information provided by DMC and Macquarie Group as described above, the Trustees also considered all other factors they believed to be relevant to evaluating the New Investment Advisory Agreements, including the specific matters discussed below. In their deliberations, the Trustees did not identify any particular information that was controlling, and different Trustees may have attributed different weights to the various factors. However, for each Fund, the Trustees determined that the overall arrangements between the Fund and DMC, as provided in the respective New Investment Advisory Agreement, including the proposed advisory fee and the related administration arrangements between the Fund and DMC, were fair and reasonable in light of the services to be performed, expenses incurred, and such other matters as the Trustees considered relevant. Factors evaluated included:
- The potential for expanding distribution of Fund shares through access to Macquarie Group’s existing distribution channels;
- Delaware Investments’ acquisition of an exclusive wholesaling sales force from a subsidiary of LNC;
- The reputation, financial strength, and resources of Macquarie Group as well as its historic and ongoing commitment to the asset management business in Australia as well as other parts of the world;
- The terms and conditions of the New Investment Advisory Agreements, including that each Fund’s total contractual fee rate under the New Investment Advisory Agreement will remain the same;
- The Board’s full annual review (or initial approval) of the current investment advisory agreements at their in-person meeting in May 2009 as required by the 1940 Act and its determination that (i) DMC had the capabilities, resources, and personnel necessary to provide the satisfactory advisory and administrative services currently provided to each Fund and (ii) the advisory and/or management fees paid by each Fund, taking into account any applicable fee waivers and breakpoints, represented reasonable compensation to DMC in light of the services provided, the costs to DMC of providing those services, economies of scale, and the fees and other expenses paid by similar funds and such other matters that the Board considered relevant in the exercise of its reasonable judgment;
- The portfolio management teams for the Funds are not currently expected to change as a result of the Transaction;
- LNC and Macquarie Group were expected to execute a reimbursement agreement pursuant to which LNC and Macquarie Group would agree to pay (or reimburse) all reasonable out-of-pocket costs and expenses of the Funds in connection with the Board’s consideration of the Transaction, the New Investment Advisory Agreements and related agreements, and all costs related to the proxy solicitation (the “Expense Agreement”);
- The likelihood that Macquarie Group would invest additional amounts in Delaware Investments, including DMC, which could result in increased assets under management, which in turn would allow some Funds the potential opportunity to achieve economies of scale and lower fees payable by Fund shareholders; and
29
Other Fund information
(Unaudited)
Delaware Focus Global Growth Fund
- The compliance and regulatory history of Macquarie Group and its affiliates.
- In making their decision relating to the approval of each Fund’s New Investment Advisory Agreement, the independent Trustees gave attention to all information furnished. The following discussion, however, identifies the primary factors taken into account by the Trustees and the conclusions reached in approving the New Investment Advisory Agreements.
Nature, Extent, and Quality of Service. The Trustees considered the services historically provided by DMC to the Funds and their shareholders. In reviewing the nature, extent, and quality of services, the Board considered that the New Investment Advisory Agreements would be substantially similar to the current investment advisory agreements between the Funds and DMC (the “Current Investment Advisory Agreements”), and therefore, considered the many reports furnished to them throughout 2008 and 2009 at regular Board meetings covering matters such as the relative performance of the Funds; compliance of portfolio managers with the investment policies, strategies, and restrictions for the Funds; the compliance of management personnel with the code of ethics adopted throughout the Delaware Investments Family of Funds complex; and the adherence to fair value pricing procedures as established by the Board. The Trustees were pleased with the current staffing of DMC and the emphasis placed on research and risk management in the investment process. Favorable consideration was given to DMC’s efforts to maintain expenditures and, in some instances, increase financial and human resources committed to Fund matters.
The Board also considered the transfer agent and shareholder services that would continue to be provided to Fund shareholders by DMC’s affiliate, Delaware Service Company, Inc. (“DSC”). The Trustees noted, in particular, DSC’s commitment to maintain a high level of service as well as DMC’s expenditures to improve the delivery of shareholder services. The Board was assured that shareholders would continue to receive the benefits provided to Fund shareholders by being part of the Delaware Investments Family of Funds, including each shareholder’s ability to exchange an investment in one Delaware Investments Fund for the same class of shares in another Delaware Investments Fund without a sales charge, to reinvest Fund dividends into additional shares of any of the Funds, and the privilege to combine holdings in other Funds to obtain a reduced sales charge.
Based on the information provided by DMC and Macquarie Group, including that Macquarie Group and DMC currently expected no material changes as a result of the Transaction in (i) personnel or operations of DMC or (ii) third party service providers to the Funds, the Board concluded that the satisfactory nature, extent, and quality of services currently provided to the Funds and their shareholders were very likely to continue under the New Investment Advisory Agreements. Moreover, the Board concluded that the Funds would probably benefit from the expanded distribution resources that would become available to Delaware Investments following the Transaction. The Board also concluded that it was very unlikely that any “unfair burden” would be imposed on any of the Funds for the first two years following the Closing as a result of the Transaction. Consequently, the Board concluded that it did not expect the Transaction to result in any adverse changes in the nature, quality, or extent of services (including investment management, distribution or other shareholder services) currently provided to the Funds and their shareholders.
30
Investment Performance. The Board considered the overall investment performance of DMC and the Funds. The Trustees placed significant emphasis on the investment performance of the Funds in view of its importance to shareholders. Although the Trustees gave appropriate consideration to performance reports and discussions with portfolio managers at Board meetings throughout the year, the Trustees gave particular weight to their review of investment performance in connection with the approval of the Current Investment Advisory Agreements at the Board meeting held in May 2009. At that meeting, the Trustees reviewed reports prepared by Lipper, Inc., an independent statistical compilation organization (“Lipper”), which showed each Fund’s investment performance as of December 31, 2008 in comparison to a group of funds selected by Lipper as being similar to the Fund (the “Performance Universe”). During the May 2009 agreement review process, the Trustees observed the significant improvements to relative investment performance of the Funds compared to the Funds’ performance as of December 31, 2007.
At their meeting on September 3, 2009, the Trustees, including the independent Trustees in consultation with their independent counsel, reviewed the investment performance of each Fund. The Trustees compared the performance of each Fund relative to that of its respective Performance Universe for the 1-, 3 , 5-, and 10-year periods ended June 30, 2009 and compared its relative investment performance against the corresponding relative investment performance of each Fund for such time periods ended December 31, 2008, to the extent applicable. As of June 30, 2009, 30 of the Funds had investment performance relative to that of the respective Performance Universe that was better than the corresponding relative investment performance at December 31, 2008 for all applicable time periods. At June 30, 2009, an additional 6 Funds had investment performance relative to that of their respective Performance Universe that was better than the corresponding relative investment performance at December 31, 2008 for a majority of the applicable time periods. At June 30, 2009, 15 additional Funds had investment performance relative to that of their respective Performance Universe that was better than the corresponding relative performance at December 31, 2008 and only 29 Funds had poorer relative investment performance at June 30, 2009 compared to that at December 31, 2008.
The Board therefore concluded that the investment performance of the Funds, on an aggregate basis, had continued to improve relative to their respective Performance Universe since the data reviewed at the May 2009 meeting. Based on information provided by DMC and Macquarie Group, the Board concluded that neither the Transaction nor the New Investment Advisory Agreement would likely have an adverse effect on the investment performance of any Fund because (i) DMC and Macquarie Group did not currently expect the Transaction to cause any material change to the Funds’ portfolio management teams responsible for investment performance, which the Board found to be satisfactory and improving; and (ii) as discussed in more detail below, the Funds’ expenses were not expected to increase as a result of the Transaction.
Comparative Expenses. The Trustees also considered expense comparison data for the Funds previously provided in May 2009. At that meeting, DMC had provided the Board with information on pricing levels and fee structures for the Funds and comparative funds. The Trustees focused on the comparative analysis of the effective management fees and total expense ratios of each Fund versus the effective management fees and expense ratios of a group of funds selected by Lipper as being
31
Other Fund information
(Unaudited)
Delaware Focus Global Growth Fund
similar to each Fund (the “Expense Group”). In reviewing comparative costs, each Fund’s contractual management fee and the actual management fee incurred by the Fund were compared with the contractual management fees (assuming all funds in the Expense Group were similar in size to the Fund) and actual management fees (as reported by each fund) of other funds within the Expense Group, taking into account any applicable breakpoints and fee limitations. Each Fund’s total expenses were also compared with those of its Expense Group. The Trustees also considered fees paid to Delaware Investments for nonmanagement services. At the September 3, 2009 meeting, DMC advised the Board that the more recent comparative expenses for the Funds remained consistent with the previous review in May 2009 and, consequently, the Trustees concluded that expenses of the Funds were satisfactory.
The Board also considered the Expense Agreement under negotiation in evaluating Fund expenses. The Trustees expected that the Expense Agreement would provide that LNC and Macquarie Group would pay or reimburse the Trusts for all reasonable out-of-pocket costs and expenses in connection with the Transaction and the consideration of the New Investment Advisory Agreements (subject to certain limited exceptions).
Based on information provided by DMC and Macquarie Group, the Board concluded that neither the Transaction nor the New Investment Advisory Agreements likely would have an adverse effect on the Funds’ expenses because (i) each Fund’s contractual fee rates under the New Investment Advisory Agreement would remain the same; (ii) under the Expense Agreement, the Funds would be reimbursed for all reasonable out-of-pocket costs and expenses in connection with the Transaction and the related proxy solicitation (subject to certain limited exceptions); and (iii) the expense ratios of certain Funds might decline as a result of the possible increased investment in Delaware Investments by Macquarie Group, as discussed below under “Economies of Scale.”
Management Profitability. At their meeting on September 3, 2009, the Board evaluated DMC’s profitability in connection with the operation of the Funds. The Board had previously considered DMC’s profitability in connection with the operation of the Funds at its May 2009 meeting. At that meeting, the Board reviewed an analysis that addressed the overall profitability of Delaware Investments’ business in providing management and other services to each of the Funds and the Delaware Investments Family of Funds as a whole. Specific attention was given to the methodology followed in allocating costs for the purpose of determining profitability.
At the May 2009 meeting, representatives of DMC had stated that the level of profits of DMC, to a certain extent, reflect operational cost savings and efficiencies initiated by Delaware Investments (including DMC and its affiliates that provide services to the Funds). The Board considered Delaware Investments’ efforts to improve services provided to Fund shareholders and to meet additional regulatory and compliance requirements resulting from recent industry-wide U.S. Securities and Exchange Commission initiatives. At that meeting, the Board found that the management fees were reasonable in light of the services rendered and the level of profitability of DMC. At the September 3, 2009 meeting, DMC advised the Board that DMC did not expect the Transaction to affect materially the profitability of Delaware Investments compared to the level of profitability considered during the
32
May 2009 review. Moreover, the Trustees reviewed pro forma balance sheets of certain key companies in Delaware Investments as of June 30, 2009 (which were provided by Macquarie Group and DMC in response to the Trustees’ requests) and evaluated the projections of Delaware Investments’ capitalization following the Transaction for purposes of evaluating the financial ability of Delaware Investments to continue to provide the nature, extent, and quality of services as it had under the Current Investment Advisory Agreement.
Based on information provided by DMC and Macquarie Group, the Board concluded that DMC and Delaware Investments would be sufficiently capitalized following the Transaction to continue the same level and quality of services to the Funds under the New Investment Advisory Agreements as was the case under the Current Investment Advisory Agreements. The Board also concluded that Macquarie Group had sufficient financial strength and resources, as well as an ongoing commitment to a global asset management business, to continue investing in Delaware Investments, including DMC, to the extent that Macquarie Group determined it was appropriate. Finally, because services and costs were expected to be substantially the same (and DMC had represented that, correspondingly, profitability would be about the same), under the New Investment Advisory Agreements as under the Current Investment Advisory Agreements, the Trustees concluded that the profitability of Delaware Investments would not result in an inequitable charge on the Funds or their shareholders. Accordingly, the Board concluded that the fees charged under the New Investment Advisory Agreements would be reasonable in light of the services to be provided and the expected profitability of DMC.
Economies of Scale. The Trustees considered whether economies of scale would be realized by Delaware Investments as each Fund’s assets increase and the extent to which any economies of scale would be reflected in the management fees charged. The Trustees took into account DMC’s practice of maintaining the competitive nature of management fees based on its analysis of fees charged by comparable funds. DMC management believed, and the Board agreed, that the Funds were priced with breakpoints and relatively low management fees to reflect potential economies of scale to Fund shareholders.
The Board also acknowledged Macquarie Group’s statement that the Transaction would not by itself immediately provide additional economies of scale given Macquarie Group’s limited presence in the U.S. mutual fund market. Nonetheless, the Trustees concluded that additional economies of scale could potentially be achieved in the future if DMC were owned by Macquarie Group as a result of Macquarie Group’s willingness to invest further in Delaware Investments if appropriate opportunities arise. The Board further concluded that potential economies of scale could be achieved as a result of Delaware Investments’ expanded distribution capabilities arising from the Transaction, as well as opportunities that might arise from Macquarie Group’s global asset management business.
Fall-Out Benefits. The Board acknowledged that DMC would continue to benefit from soft dollar arrangements using portfolio brokerage of each Fund that invests in equity securities and that DMC’s profitability would likely be somewhat lower without the benefit of practices with respect to allocating Fund portfolio brokerage for brokerage and research services. The Board also considered that Macquarie Group and Delaware Investments may derive reputational, strategic, and other benefits from their association with the Delaware Investments Family of Funds, including service
33
Other Fund information
(Unaudited)
Delaware Focus Global Growth Fund
relationships with DMC, DSC, and Delaware Distributors, L.P., and evaluated the extent to which Delaware Investments might derive ancillary benefits from Fund operations, including the potential for procuring additional business as a result of the prestige and visibility associated with its role as service provider to the Delaware Investments Family of Funds and the benefits from allocation of Fund brokerage to improve trading efficiencies. However, the Board concluded that (i) any such benefits under the New Investment Advisory Agreements would not be dissimilar from those existing under the Current Investment Advisory Agreements; (ii) such benefits did not impose a cost or burden on the Funds or their shareholders; and (iii) such benefits would probably have an indirectly beneficial effect on the Funds and their shareholders because of the added importance that DMC and Macquarie Group might attach to the Funds as a result of the fall-out benefits that the Funds conveyed.
Board Review of Macquarie Group. The Trustees reviewed detailed information supplied by Macquarie Group about its operations as well as other information regarding Macquarie Group provided by independent legal counsel to the independent Trustees. Based on this review, the Trustees concluded that Delaware Investments would continue to have the financial ability to maintain the high quality of services required by the Funds. The Trustees noted that there would be a limited transition period during which some services previously provided by LNC to Delaware Investments would continue to be provided by LNC after the Closing, and concluded that this arrangement would help minimize disruption in Delaware Investments’ provision of services to the Funds following the Transaction.
The Board considered Macquarie Group’s support for Delaware Investments’ plans for Fund distribution by transferring wholesalers from Lincoln Financial Distributors, Inc., LNC’s retail distributor, to Delaware Investments, and Macquarie Group’s current intention to leave the Funds’ other service providers in place. The Board also considered Macquarie Group’s current strategic plans to increase its asset management activities, one of its core businesses, particularly in North America, and its statement that its acquisition of DMC is an important component of this strategic growth and the establishment of a significant presence in the United States. Based in part on the information provided by DMC and Macquarie Group, the Board concluded that Macquarie Group’s acquisition of Delaware Investments could potentially enhance the nature, quality, and extent of services provided to the Funds and their shareholders.
Conclusion. The Board concluded that the advisory fee rate under each New Investment Advisory Agreement was reasonable in relation to the services provided and that execution of the New Investment Advisory Agreement would be in the best interests of the shareholders. For each Fund, the Trustees noted that they had concluded in their most recent advisory agreement continuance considerations in May 2009 that the management fees and total expense ratios were at acceptable levels in light of the quality of services provided to the Funds and in comparison to those of the Funds’ respective peer groups; that the advisory fee schedule would not be increased and would stay the same for all of the Funds; that the total expense ratio had not changed materially since that determination; and that DMC had represented that the overall expenses for each Fund were not expected to be adversely affected by the Transaction. The Trustees also noted, with respect to the Funds that
34
currently had the benefit of voluntary fee limitations, that Macquarie Group had no present intention to cause DMC to alter any voluntary expense limitations or reimbursements currently in effect. On that basis, the Trustees concluded that the total expense ratios and proposed advisory fees for the Funds anticipated to result from the Transaction were acceptable. In approving each New Investment Advisory Agreement, the Board stated that it anticipated reviewing the continuance of the New Investment Advisory Agreement in advance of the expiration of the initial two-year period.
35
Board of trustees/directors and officers addendum
Delaware Investments® Family of Funds
A mutual fund is governed by a Board of Trustees/Directors (“Trustees”), which has oversight responsibility for the management of a fund’s business affairs. Trustees establish procedures and oversee and review the performance of the investment manager, the distributor, and others who perform services for the fund. The independent fund trustees, in particular, are advocates
| Name, Address, | | Position(s) | | Length of |
| and Birth Date | | Held with Fund(s) | | Time Served |
| Interested Trustees | | | | |
| |
| Patrick P. Coyne1 | | Chairman, President, | | Chairman and Trustee |
| 2005 Market Street | | Chief Executive Officer, | | since August 16, 2006 |
| Philadelphia, PA 19103 | | and Trustee | | |
| April 1963 | | | | President and |
| | | | Chief Executive Officer |
| | | | since August 1, 2006 |
| | | | | |
| Independent Trustees | | | | |
| |
| Thomas L. Bennett | | Trustee | | Since March 2005 |
| 2005 Market Street | | | | |
| Philadelphia, PA 19103 | | | | |
| October 1947 | | | | |
| |
| |
| |
| John A. Fry | | Trustee | | Since January 2001 |
| 2005 Market Street | | | | |
| Philadelphia, PA 19103 | | | | |
| May 1960 | | | | |
| |
| |
| |
| |
| Anthony D. Knerr | | Trustee | | Since April 1990 |
| 2005 Market Street | | | | |
| Philadelphia, PA 19103 | | | | |
| December 1938 | | | | |
| |
| |
| Lucinda S. Landreth | | Trustee | | Since March 2005 |
| 2005 Market Street | | | | |
| Philadelphia, PA 19103 | | | | |
| June 1947 | | | | |
| | | | | |
1 Patrick P. Coyne is considered to be an “Interested Trustee” because he is an executive officer of the Fund’s(s’) investment advisor.
36
for shareholder interests. Each trustee has served in that capacity since he or she was elected to or appointed to the Board of Trustees, and will continue to serve until his or her retirement or the election of a new trustee in his or her place. The following is a list of the Trustees and Officers with certain background and related information.
| |
| | Number of Portfolios in | | |
| Principal Occupation(s) | | Fund Complex Overseen | | Other Directorships |
| During Past 5 Years | | by Trustee or Officer | | Held by Trustee or Officer |
| |
| |
| Patrick P. Coyne has served in | | 80 | | Director |
| various executive capacities | | | | Kaydon Corp. |
| at different times at | | | | |
| Delaware Investments.2 | | | | |
| |
| |
| |
| |
| |
| Private Investor | | 80 | | Director |
| (March 2004–Present) | | | | Bryn Mawr Bank Corp. (BMTC) |
| | | | (April 2007–Present) |
| Investment Manager | | | | |
| Morgan Stanley & Co. | | | | |
| (January 1984–March 2004) | | | | |
| |
| President | | 80 | | Director |
| Franklin & Marshall College | | | | Community Health Systems |
| (June 2002–Present) | | | | |
| |
| Executive Vice President | | | | |
| University of Pennsylvania | | | | |
| (April 1995–June 2002) | | | | |
| |
| Founder and | | 80 | | None |
| Managing Director | | | | |
| Anthony Knerr & Associates | | | | |
| (Strategic Consulting) | | | | |
| (1990–Present) | | | | |
| |
| Chief Investment Officer | | 80 | | None |
| Assurant, Inc. (Insurance) | | | | |
| (2002–2004) | | | | |
| | | | | |
| | | | | |
2 Delaware Investments is the marketing name for Delaware Management Holdings, Inc. and its subsidiaries, including the Fund’s(s’) investment advisor, principal underwriter, and its transfer agent.
37
Board of trustees/directors and officers addendum
Delaware Investments® Family of Funds
| Name, Address, | | Position(s) | | Length of |
| and Birth Date | | Held with Fund(s) | | Time Served |
| Independent Trustees (continued) | | | | |
| |
| Ann R. Leven | | Trustee | | Since October 1989 |
| 2005 Market Street | | | | |
| Philadelphia, PA 19103 | | | | |
| November 1940 | | | | |
| |
| Thomas F. Madison | | Trustee | | Since May 19973 |
| 2005 Market Street | | | | |
| Philadelphia, PA 19103 | | | | |
| February 1936 | | | | |
| | | | | |
| | | | | |
| | | | | |
| | | | | |
| | | | | |
| | | | | |
| | | | | |
| | | | | |
| | | | | |
| | | | | |
| | | | | |
| | | | | |
| | | | | |
| | | | | |
| | | | | |
| | | | | |
| | | | | |
| | | | | |
| | | | | |
| | | | | |
| | | | | |
| | | | | |
| | | | | |
3 In 1997, several funds managed by Voyageur Fund Managers, Inc. (the “Voyageur Funds”) were incorporated into the Delaware Investments Family of Funds. Mr. Madison served as a director of the Voyageur Funds from 1993 until 1997.
38
| | Number of Portfolios in | | |
| Principal Occupation(s) | | Fund Complex Overseen | | Other Directorships |
| During Past 5 Years | | by Trustee or Officer | | Held by Trustee or Officer |
| |
| |
| Consultant | | 80 | | None |
| ARL Associates | | | | |
| (Financial Planning) | | | | |
| (1983–Present) | | | | |
| | | | | |
| |
| President and | | 80 | | Director and Chair of |
| Chief Executive Officer | | | | Compensation Committee, |
| MLM Partners, Inc. | | | | Governance Committee |
| (Small Business Investing | | | | Member |
| and Consulting) | | | | CenterPoint Energy |
| (January 1993–Present) | | | | |
| | | | Lead Director and Chair of |
| | | | Audit and Governance |
| | | | Committees, Member of |
| | | | Compensation Committee |
| | | | Digital River, Inc. |
| |
| | | | Director and Chair of |
| | | | Governance Committee, |
| | | | Audit Committee |
| | | | Member |
| | | | Rimage Corporation |
| |
| | | | Director and Chair of |
| | | | Compensation Committee |
| | | | Spanlink Communications |
| |
| | | | Lead Director and Member of |
| | | | Compensation and |
| | | | Governance Committees |
| | | | Valmont Industries, Inc. |
| |
39
Board of trustees/directors and officers addendum
Delaware Investments® Family of Funds
| Name, Address, | | Position(s) | | Length of |
| and Birth Date | | Held with Fund(s) | | Time Served |
| Independent Trustees (continued) | | | | |
| |
| Janet L. Yeomans | | Trustee | | Since April 1999 |
| 2005 Market Street | | | | |
| Philadelphia, PA 19103 | | | | |
| July 1948 | | | | |
| |
| |
| |
| |
| J. Richard Zecher | | Trustee | | Since March 2005 |
| 2005 Market Street | | | | |
| Philadelphia, PA 19103 | | | | |
| July 1940 | | | | |
| |
| |
| |
| |
| |
| |
| Officers | | | | |
| |
| David F. Connor | | Vice President, | | Vice President since |
| 2005 Market Street | | Deputy General | | September 2000 |
| Philadelphia, PA 19103 | | Counsel, and Secretary | | and Secretary since |
| December 1963 | | | | October 2005 |
| |
| |
| Daniel V. Geatens | | Vice President | | Treasurer |
| 2005 Market Street | | and Treasurer | | since October 25, 2007 |
| Philadelphia, PA 19103 | | | | |
| October 1972 | | | | |
| |
| David P. O’Connor | | Senior Vice President, | | Senior Vice President, |
| 2005 Market Street | | General Counsel, | | General Counsel, and |
| Philadelphia, PA 19103 | | and Chief Legal Officer | | Chief Legal Officer |
| February 1966 | | | | since October 2005 |
| |
| Richard Salus | | Senior Vice President | | Chief Financial Officer |
| 2005 Market Street | | and Chief Financial Officer | | since November 2006 |
| Philadelphia, PA 19103 | | | | |
| October 1963 | | | | |
| | | | | |
4 David F. Connor, Daniel V. Geatens, David P. O’Connor, and Richard Salus serve in similar capacities for the six portfolios of the Optimum Fund Trust, which have the same investment advisor, principal underwriter, and transfer agent as the registrant.
40
| | Number of Portfolios in | | |
| Principal Occupation(s) | | Fund Complex Overseen | | Other Directorships |
| During Past 5 Years | | by Trustee or Officer | | Held by Trustee or Officer |
| |
| |
| Vice President and Treasurer | | 80 | | None |
| (January 2006–Present) | | | | |
| Vice President — Mergers & Acquisitions | | | | |
| (January 2003–January 2006), and | | | | |
| Vice President | | | | |
| (July 1995–January 2003) | | | | |
| 3M Corporation | | | | |
| |
| Founder | | 80 | | Director and Audit |
| Investor Analytics | | | | Committee Member |
| (Risk Management) | | | | Investor Analytics |
| (May 1999–Present) | | | | |
| |
| Founder | | | | |
| Sutton Asset Management | | | | |
| (Hedge Fund) | | | | |
| (September 1996–Present) | | | | |
| |
| |
| |
| David F. Connor has served as | | 80 | | None4 |
| Vice President and Deputy | | | | |
| General Counsel of | | | | |
| Delaware Investments | | | | |
| since 2000. | | | | |
| |
| Daniel V. Geatens has served | | 80 | | None4 |
| in various capacities at | | | | |
| different times at | | | | |
| Delaware Investments. | | | | |
| |
| David P. O’Connor has served in | | 80 | | None4 |
| various executive and legal | | | | |
| capacities at different times | | | | |
| at Delaware Investments. | | | | |
| |
| Richard Salus has served in | | 80 | | None4 |
| various executive capacities | | | | |
| at different times at | | | | |
| Delaware Investments. | | | | |
| | | | | |
The Statement of Additional Information for the Fund(s) includes additional information about the Trustees and Officers and is available, without charge, upon request by calling 800 523-1918.
41
About the organization
| Board of trustees |
| | | | |
Patrick P. Coyne
Chairman, President, and
Chief Executive Officer
Delaware Investments®
Family of Funds
Philadelphia, PA Thomas L. Bennett
Private Investor
Rosemont, PA John A. Fry
President
Franklin & Marshall
College
Lancaster, PA | Anthony D. Knerr
Founder and Managing
Director
Anthony Knerr &
Associates
New York, NY Lucinda S. Landreth
Former Chief Investment
Officer
Assurant, Inc.
Philadelphia, PA | Ann R. Leven
Consultant
ARL Associates
New York, NY Thomas F. Madison
President and
Chief Executive Officer
MLM Partners, Inc.
Minneapolis, MN | Janet L. Yeomans
Vice President and
Treasurer
3M Corporation
St. Paul, MN J. Richard Zecher
Founder
Investor Analytics
Scottsdale, AZ |
| | | | |
| Affiliated officers |
| | | | |
David F. Connor
Vice President, Deputy
General Counsel, and
Secretary
Delaware Investments
Family of Funds
Philadelphia, PA | Daniel V. Geatens
Vice President and
Treasurer
Delaware Investments
Family of Funds
Philadelphia, PA | David P. O’Connor
Senior Vice President,
General Counsel,
and Chief Legal Officer
Delaware Investments
Family of Funds
Philadelphia, PA | Richard Salus
Senior Vice President and
Chief Financial Officer
Delaware Investments
Family of Funds
Philadelphia, PA |
This annual report is for the information of Delaware Focus Global Growth Fund shareholders, but it may be used with prospective investors when preceded or accompanied by a current prospectus for Delaware Focus Global Growth Fund and the Delaware Investments Fund profile for the most recently completed calendar quarter. These documents are available at www.delawareinvestments.com. The prospectus sets forth details about charges, expenses, investment objectives, and operating policies of the investment company. You should read the prospectus carefully before you invest. The figures in this report represent past results that are not a guarantee of future results. The return and principal value of an investment in the investment company will fluctuate so that shares, when redeemed, may be worth more or less than their original cost. |
Delaware Investments is the marketing name of Delaware Management Holdings, Inc. and its subsidiaries. The Fund files its complete schedule of portfolio holdings with the Securities and Exchange Commission for the first and third quarters of each fiscal year on Form N-Q. The Fund’s Forms N-Q, as well as a description of the policies and procedures that the Fund uses to determine how to vote proxies (if any) relating to portfolio securities are available without charge (i) upon request, by calling 800 523-1918; and (ii) on the Commission’s Web site at www.sec.gov. In addition, a description of the policies and procedures that the Fund uses to determine how to vote proxies (if any) relating to portfolio securities and the Fund’s Schedule of Investments are available without charge on the Fund’s Web site at www.delawareinvestments.com. The Fund’s Forms N-Q may be reviewed and copied at the Commission’s Public Reference Room in Washington, D.C.; information on the operation of the Public Reference Room may be obtained by calling 800 SEC-0330. Information (if any) regarding how the Fund voted proxies relating to portfolio securities during the most recently disclosed 12-month period ended June 30 is available without charge (i) through the Fund’s Web site at www.delawareinvestments.com; and (ii) on the Commission’s Web site at www.sec.gov. |
42
Item 2. Code of Ethics
The registrant has adopted a code of ethics that applies to the registrant’s principal executive officer, principal financial officer, principal accounting officer or controller, or persons performing similar functions, regardless of whether these individuals are employed by the registrant or a third party. A copy of the registrant’s Code of Business Ethics has been posted on the Delaware Investments Internet Web site at www.delawareinvestments.com. Any amendments to the Code of Business Ethics, and information on any waiver from its provisions granted by the registrant, will also be posted on this Web site within five business days of such amendment or waiver and will remain on the Web site for at least 12 months.
Item 3. Audit Committee Financial Expert
The registrant’s Board of Trustees/Directors has determined that each member of the registrant’s Audit Committee is an audit committee financial expert, as defined below. For purposes of this item, an “audit committee financial expert” is a person who has the following attributes:
a. An understanding of generally accepted accounting principles and financial statements;
b. The ability to assess the general application of such principles in connection with the accounting for estimates, accruals, and reserves;
c. Experience preparing, auditing, analyzing, or evaluating financial statements that present a breadth and level of complexity of accounting issues that are generally comparable to the breadth and complexity of issues that can reasonably be expected to be raised by the registrant’s financial statements, or experience actively supervising one or more persons engaged in such activities;
d. An understanding of internal controls and procedures for financial reporting; and
e. An understanding of audit committee functions.
An “audit committee financial expert” shall have acquired such attributes through:
a. Education and experience as a principal financial officer, principal accounting officer, controller, public accountant, or auditor or experience in one or more positions that involve the performance of similar functions;
b. Experience actively supervising a principal financial officer, principal accounting officer, controller, public accountant, auditor, or person performing similar functions;
c. Experience overseeing or assessing the performance of companies or public accountants with respect to the preparation, auditing, or evaluation of financial statements; or
d. Other relevant experience.
The registrant’s Board of Trustees/Directors has also determined that each member of the registrant’s Audit Committee is independent. In order to be “independent” for purposes of this item, the Audit Committee member may not: (i) other than in his or her capacity as a member of the Board of Trustees/Directors or any committee thereof, accept directly or indirectly any consulting, advisory or other compensatory fee from the issuer; or (ii) be an “interested person” of the registrant as defined in Section 2(a)(19) of the Investment Company Act of 1940.
The names of the audit committee financial experts on the registrant’s Audit Committee are set forth below:
Thomas L. Bennett 1
John A. Fry
Thomas F. Madison
J. Richard Zecher
Item 4. Principal Accountant Fees and Services
(a) Audit fees.
The aggregate fees billed for services provided to the registrant by its independent auditors for the audit of the registrant’s annual financial statements and for services normally provided by the independent auditors in connection with statutory and regulatory filings or engagements were $85,414 for the fiscal year ended November 30, 2009.
_______________________
1 The instructions to Form N-CSR require disclosure on the relevant experience of persons who qualify as audit committee financial experts based on “other relevant experience.” The Board of Trustees/Directors has determined that Mr. Bennett qualifies as an audit committee financial expert by virtue of his education, Chartered Financial Analyst designation, and his experience as a credit analyst, portfolio manager and the manager of other credit analysts and portfolio managers.
The aggregate fees billed for services provided to the registrant by its independent auditors for the audit of the registrant’s annual financial statements and for services normally provided by the independent auditors in connection with statutory and regulatory filings or engagements were $94,100 for the fiscal year ended November 30, 2008.
(b) Audit-related fees.
The aggregate fees billed by the registrant’s independent auditors for services relating to the performance of the audit of the registrant’s financial statements and not reported under paragraph (a) of this Item were $0 for the fiscal year ended November 30, 2009.
The aggregate fees billed by the registrant’s independent auditors for services relating to the performance of the audit of the financial statements of the registrant’s investment adviser and other service providers under common control with the adviser and that relate directly to the operations or financial reporting of the registrant were $19,074 for the registrant’s fiscal year ended November 30, 2009. The percentage of these fees relating to services approved by the registrant’s Audit Committee pursuant to the de minimis exception from the pre-approval requirement in Rule 2-01(c)(7)(i)(C) of Regulation S-X was 0%. These audit-related services were as follows: issuance of report concerning transfer agent's system of internal accounting control pursuant to Rule 17Ad-13 of the Securities Exchange Act.
The aggregate fees billed by the registrant’s independent auditors for services relating to the performance of the audit of the registrant’s financial statements and not reported under paragraph (a) of this Item were $0 for the fiscal year ended November 30, 2008.
The aggregate fees billed by the registrant’s independent auditors for services relating to the performance of the audit of the financial statements of the registrant’s investment adviser and other service providers under common control with the adviser and that relate directly to the operations or financial reporting of the registrant were $19,074 for the registrant’s fiscal year ended November 30, 2008. The percentage of these fees relating to services approved by the registrant’s Audit Committee pursuant to the de minimis exception from the pre-approval requirement in Rule 2-01(c)(7)(i)(C) of Regulation S-X was 0%. These audit-related services were as follows: issuance of report concerning transfer agent's system of internal accounting control pursuant to Rule 17Ad-13 of the Securities Exchange Act.
(c) Tax fees.
The aggregate fees billed by the registrant’s independent auditors for tax-related services provided to the registrant were $38,572 for the fiscal year ended November 30, 2009. The percentage of these fees relating to services approved by the registrant’s Audit Committee pursuant to the de minimis exception from the pre-approval requirement in Rule 2-01(c)(7)(i)(C) of Regulation S-X was 0%. These tax-related services were as follows: review of income tax returns and review of annual excise distribution calculations.
The aggregate fees billed by the registrant’s independent auditors for tax-related services provided to the registrant’s investment adviser and other service providers under common control with the adviser and that relate directly to the operations or financial reporting of the registrant were $0 for the registrant’s fiscal year ended November 30, 2009.
The aggregate fees billed by the registrant’s independent auditors for tax-related services provided to the registrant were $44,490 for the fiscal year ended November 30, 2008. The percentage of these fees relating to services approved by the registrant’s Audit Committee pursuant to the de minimis exception from the pre-approval requirement in Rule 2-01(c)(7)(i)(C) of Regulation S-X was 0%. These tax-related services were as follows: review of income tax returns and review of annual excise distribution calculations.
The aggregate fees billed by the registrant’s independent auditors for tax-related services provided to the registrant’s adviser and other service providers under common control with the adviser and that relate directly to the operations or financial reporting of the registrant were $0 for the registrant’s fiscal year ended November 30, 2008.
(d) All other fees.
The aggregate fees billed for all services provided by the independent auditors to the registrant other than those set forth in paragraphs (a), (b) and (c) of this Item were $0 for the fiscal year ended November 30, 2009.
The aggregate fees billed for all services other than those set forth in paragraphs (b) and (c) of this Item provided by the registrant’s independent auditors to the registrant’s adviser and other service providers under common control with the adviser and that relate directly to the operations or financial reporting of the registrant were $0 for the registrant’s fiscal year ended November 30, 2009.
The aggregate fees billed for all services provided by the independent auditors to the registrant other than those set forth in paragraphs (a), (b) and (c) of this Item were $0 for the fiscal year ended November 30, 2008.
The aggregate fees billed for all services other than those set forth in paragraphs (b) and (c) of this Item provided by the registrant’s independent auditors to the registrant’s adviser and other service providers under common control with the adviser and that relate directly to the operations or financial reporting of the registrant were $0 for the registrant’s fiscal year ended November 30, 2008.
(e) The registrant’s Audit Committee has established pre-approval policies and procedures as permitted by Rule 2-01(c)(7)(i)(B) of Regulation S-X (the “Pre-Approval Policy”) with respect to services provided by the registrant’s independent auditors. Pursuant to the Pre-Approval Policy, the Audit Committee has pre-approved the services set forth in the table below with respect to the registrant up to the specified fee limits. Certain fee limits are based on aggregate fees to the registrant and other registrants within the Delaware Investments Family of Funds.
| Service | Range of Fees |
| Audit Services | |
| Statutory audits or financial audits for new Funds | up to $25,000 per Fund |
| Services associated with SEC registration statements (e.g., Form N-1A, Form N-14, etc.), periodic reports and other documents filed with the SEC or other documents issued in connection with securities offerings (e.g., comfort letters for closed-end Fund offerings, consents), and assistance in responding to SEC comment letters | up to $10,000 per Fund |
| Consultations by Fund management as to the accounting or disclosure treatment of transactions or events and/or the actual or potential impact of final or proposed rules, standards or interpretations by the SEC, FASB, or other regulatory or standard-setting bodies (Note: Under SEC rules, some consultations may be considered “audit-related services” rather than “audit services”) | up to $25,000 in the aggregate |
| Audit-Related Services | |
| Consultations by Fund management as to the accounting or disclosure treatment of transactions or events and /or the actual or potential impact of final or proposed rules, standards or interpretations by the SEC, FASB, or other regulatory or standard-setting bodies (Note: Under SEC rules, some consultations may be considered “audit services” rather than “audit-related services”) | up to $25,000 in the aggregate |
| Tax Services | |
| U.S. federal, state and local and international tax planning and advice (e.g., consulting on statutory, regulatory or administrative developments, evaluation of Funds’ tax compliance function, etc.) | up to $25,000 in the aggregate |
| U.S. federal, state and local tax compliance (e.g., excise distribution reviews, etc.) | up to $5,000 per Fund |
| Review of federal, state, local and international income, franchise and other tax returns | up to $5,000 per Fund |
Under the Pre-Approval Policy, the Audit Committee has also pre-approved the services set forth in the table below with respect to the registrant’s investment adviser and other entities controlling, controlled by or under common control with the investment adviser that provide ongoing services to the registrant (the “Control Affiliates”) up to the specified fee limit. This fee limit is based on aggregate fees to the investment adviser and its Control Affiliates.
| Service | Range of Fees |
| Non-Audit Services | |
| Services associated with periodic reports and other documents filed with the SEC and assistance in responding to SEC comment letters | up to $10,000 in the aggregate |
The Pre-Approval Policy requires the registrant’s independent auditors to report to the Audit Committee at each of its regular meetings regarding all services initiated since the last such report was rendered, including those services authorized by the Pre-Approval Policy.
(f) Not applicable.
(g) The aggregate non-audit fees billed by the registrant’s independent auditors for services rendered to the registrant and to its investment adviser and other service providers under common control with the adviser were $238,286 and $298,492 for the registrant’s fiscal years ended November 30, 2009 and November 30, 2008, respectively.
(h) In connection with its selection of the independent auditors, the registrant’s Audit Committee has considered the independent auditors’ provision of non-audit services to the registrant’s investment adviser and other service providers under common control with the adviser that were not required to be pre-approved pursuant to Rule 2-01(c)(7)(ii) of Regulation S-X. The Audit Committee has determined that the independent auditors’ provision of these services is compatible with maintaining the auditors’ independence.
Item 5. Audit Committee of Listed Registrants
Not applicable.
Item 6. Investments
(a) Included as part of report to shareholders filed under Item 1 of this Form N-CSR.
(b) Divestment of securities in accordance with Section 13(c) of the Investment Company Act of 1940.
Not applicable.
Item 7. Disclosure of Proxy Voting Policies and Procedures for Closed-End Management Investment Companies
Not applicable.
Item 8. Portfolio Managers of Closed-End Management Investment Companies
Not applicable.
Item 9. Purchases of Equity Securities by Closed-End Management Investment Company and Affiliated Purchasers
Not applicable.
Item 10. Submission of Matters to a Vote of Security Holders
Not applicable.
Item 11. Controls and Procedures
The registrant’s principal executive officer and principal financial officer have evaluated the registrant’s disclosure controls and procedures within 90 days of the filing of this report and have concluded that they are effective in providing reasonable assurance that the information required to be disclosed by the registrant in its reports or statements filed under the Securities Exchange Act of 1934 is recorded, processed, summarized and reported within the time periods specified in the rules and forms of the Securities and Exchange Commission.
There were no significant changes in the registrant’s internal control over financial reporting that occurred during the second fiscal quarter of the period covered by the report to stockholders included herein (i.e., the registrant’s fourth fiscal quarter) that have materially affected, or are reasonably likely to materially affect, the registrant’s internal control over financial reporting.
Item 12. Exhibits
| (a) | (1) Code of Ethics |
| |
| Not applicable. |
| |
| (2) Certifications of Principal Executive Officer and Principal Financial Officer pursuant to Rule 30a-2 under the Investment Company Act of 1940 are attached hereto as Exhibit 99.CERT. |
| |
| (3) Written solicitations to purchase securities pursuant to Rule 23c-1 under the Securities Exchange Act of 1934. |
| |
| Not applicable. |
| | |
| (b) | Certifications pursuant to Section 906 of the Sarbanes-Oxley Act of 2002 are furnished herewith as Exhibit 99.906CERT. |
SIGNATURES
Pursuant to the requirements of the Securities Exchange Act of 1934 and the Investment Company Act of 1940, the registrant has duly caused this report to be signed on its behalf, by the undersigned, thereunto duly authorized.
Name of Registrant: Delaware Group® Global & International Funds
| PATRICK P. COYNE |
| By: | Patrick P. Coyne |
| Title: | Chief Executive Officer |
| Date: | February 3, 2010 |
Pursuant to the requirements of the Securities Exchange Act of 1934 and the Investment Company Act of 1940, this report has been signed below by the following persons on behalf of the registrant and in the capacities and on the dates indicated.
| PATRICK P. COYNE |
| By: | Patrick P. Coyne |
| Title: | Chief Executive Officer |
| Date: | February 3, 2010 |
| RICHARD SALUS |
| By: | Richard Salus |
| Title: | Chief Financial Officer |
| Date: | February 3, 2010 |